UNITED STATES
SECURITIES AND EXCHANGE COMMISSION
Washington, D.C. 20549
FORM N-CSR
CERTIFIED SHAREHOLDER REPORT OF REGISTERED MANAGEMENT
INVESTMENT COMPANIES
Investment Company Act file number 811-08104
Touchstone Funds Group Trust
(Exact name of registrant as specified in charter)
303 Broadway, Suite 1100
Cincinnati, Ohio 45202-4203
(Address of principal executive offices) (Zip code)
Jill T. McGruder
303 Broadway, Suite 1100
Cincinnati, Ohio 45202-4203
(Name and address of agent for service)
Registrant's telephone number, including area code: 800-638-8194
Date of fiscal year end: September 30
Date of reporting period: September 30, 2018
Form N-CSR is to be used by management investment companies to file reports with the Commission not later than 10 days after the transmission to stockholders of any report that is required to be transmitted to stockholders under Rule 30e-1 under the Investment Company Act of 1940 (17 CFR 270.30e-1). The Commission may use the information provided on Form N-CSR in its regulatory, disclosure review, inspection, and policymaking roles.
A registrant is required to disclose the information specified by Form N-CSR, and the Commission will make this information public. A registrant is not required to respond to the collection of information contained in Form N-CSR unless the Form displays a currently valid Office of Management and Budget ("OMB") control number. Please direct comments concerning the accuracy of the information collection burden estimate and any suggestions for reducing the burden to Secretary, Securities and Exchange Commission, 450 Fifth Street, NW, Washington, DC 20549-0609. The OMB has reviewed this collection of information under the clearance requirements of 44 U.S.C. § 3507.
Item 1. Reports to Stockholders.
The Report to Shareholders is attached herewith.
September 30, 2018
Annual Report
Touchstone Funds Group Trust
Touchstone Active Bond Fund
Touchstone Arbitrage Fund
Touchstone Emerging Markets Small Cap Fund
Touchstone High Yield Fund
Touchstone Impact Bond Fund (formerly known as Touchstone Total Return Bond Fund)
Touchstone Merger Arbitrage Fund
Touchstone Mid Cap Fund
Touchstone Mid Cap Value Fund
Touchstone Premium Yield Equity Fund
Touchstone Sands Capital Select Growth Fund
Touchstone Small Cap Fund
Touchstone Small Cap Value Fund
Touchstone Ultra Short Duration Fixed Income Fund
IMPORTANT NOTE: Beginning on January 1, 2021, as permitted by regulations adopted by the Securities and Exchange Commission, paper copies of the Touchstone Funds’ annual and semi-annual shareholder reports will no longer be sent by mail, unless you specifically request paper copies of the shareholder reports from Touchstone Funds or from your financial intermediary, such as a broker-dealer or bank. Instead, annual and semi-annual shareholder reports will be available on the Touchstone Funds’ website (TouchstoneInvestments.com/Resources), and you will be notified by mail each time a report is posted and provided with a website link to access the report.
Beginning on January 1, 2019, you may elect to receive all future annual and semi-annual shareholder reports in paper, free of charge. If you already elected to receive shareholder reports electronically, you will not be affected by this change and you need not take any action. To elect to receive paper copies of shareholder reports through the mail or otherwise change your delivery method, contact your financial intermediary or, if you hold your shares directly through Touchstone Funds, visit TouchstoneInvestments.com/Resources/Edelivery or call Touchstone Funds toll-free at 1.800.543.0407. Your election to receive shareholder reports in paper will apply to all Touchstone Funds that you hold through the financial intermediary, or directly with Touchstone.

Table of Contents
This report identifies the Funds' investments on September 30, 2018. These holdings are subject to change. Not all investments in each Fund performed the same, nor is there any guarantee that these investments will perform as well in the future. Market forecasts provided in this report may not occur.
| 2 |
Dear Shareholder:
We are pleased to provide you with the Touchstone Funds Group Trust Annual Report. It includes key financial information, as well as manager commentaries for the Funds, for the 12 months ended September 30, 2018.
The global economic recovery, now in its 10th year following the 2008 Credit Crisis, gained momentum in 2017 as the U.S., Japan, the European Union (EU) and China all reported solid economic growth through much of the 12 months. Notably, U.S. Gross Domestic Product growth is on track to report its first 3+ percent growth rate in over a decade. Despite the overall solid economic fundamentals, much of the period saw an increase in market volatility as tariffs and trade tensions raised the specter of an escalating global trade war. The “synchronized global expansion” showed signs of unraveling because of these growing trade tensions. Yet, the latter portion of the fiscal year saw some resolution on trade tensions as the U.S. reached preliminary trade deals with Canada, Mexico and South Korea, as well as a tariff truce with the EU. Throughout the period, monetary policies across the major central banks continued their divergent paths as the Bank of Japan and the European Central Bank maintained accommodative stances, while the U.S. Federal Reserve Board (Fed) continued toward its goal of monetary policy normalization by raising rates four times in the fiscal year. Additionally, the Fed began executing on a plan to reduce the size of its balance sheet by selling securities it had acquired during its post-Crisis Quantitative Easing programs.
A strengthening U.S. dollar, diverging economic data and widening trade disputes in the fiscal year’s second half affected performance results overseas. Global equities posted dramatically different results with U.S. equity markets posting double-digit returns compared to low single-digit returns from developed markets. The aforementioned strong U.S. dollar and trade tensions weighed on emerging markets equities as they posted slightly negative returns. Within the U.S. equity markets, growth-oriented stocks outpaced their value-oriented counterparts, while large-capitalization stocks outperformed mid- and small-capitalization stocks.
The Fed’s four rate hikes during the period drove short-term rates higher, while longer-term rates also moved higher but at a slower pace, resulting in a flattening of the yield curve. This increase in rates resulted in negative returns for investment grade bonds. However, non-investment grade bonds generated positive returns because they were less sensitive to interest rate changes and more correlated to economic activity.
With 2019 right around the corner, the post-Crisis bull market is approaching its 10-year anniversary. While it has certainly contained periods of volatility, the length and strength of this market environment only reinforces our view that investing is a long-term endeavor. A disciplined approach and appropriate time horizon can deter short-term thinking and reactive decision making. Your financial advisor can help you by identifying a risk-return profile and developing an investment plan that will help address your long-term financial goals.
We greatly appreciate your continued support. Thank you for including Touchstone as part of your investment plan.
Sincerely,

Jill T. McGruder
President
Touchstone Funds Group Trust
| 3 |
Management's Discussion of Fund Performance (Unaudited)
Touchstone Active Bond Fund
Sub-Advised by Fort Washington Investment Advisors, Inc.
Investment Philosophy
The Touchstone Active Bond Fund seeks to provide as high a level of current income as is consistent with the preservation of capital. Capital appreciation is a secondary goal. In deciding what securities to buy and sell for the Fund, the overall investment opportunities and risks in different sectors of the debt securities market are analyzed by focusing on maximizing total return and reducing volatility of the Fund’s portfolio. A disciplined sector allocation process is followed in order to build a broadly diversified portfolio of bonds.
Fund Performance
The Touchstone Active Bond Fund (Class A Shares) underperformed its benchmark, the Bloomberg Barclays U.S. Aggregate Bond Index, for the 12-month period ended September 30, 2018. The Fund’s total return was -1.87 percent (calculated excluding the maximum sales charge) while the total return of the benchmark was -1.22 percent.
Market Environment
The return of volatility during the period reflected concerns about inflation and rising interest rates, as well as uncertainty surrounding global trade. As the 12-month period came to an end, markets waited anxiously for a resolution between the U.S. and its global trading partners as tensions continued to mount.
Within the index, Investment Grade Corporate Bonds, Mortgage-Backed Securities (MBS), Asset-Backed Securities (ABS) and Commercial Mortgage-Backed Securities (CMBS) all outperformed U.S. Treasuries during the period. However, High Yield Bonds also outperformed all fixed income sectors during the period.
During the 12-month period, the yield curve flattened as external forces depressed the long end of the curve while the U.S. Federal Reserve Board (Fed) increased the federal funds rate a total of four times. In general, yields moved rather significantly. In fact, yields on both the 10-year and 2-year U.S. Treasuries ended the period notably higher and tighter. The relationship between the two yields, commonly referenced as a market indicator on investor sentiment, began to concern many investors as it tightened to levels that many felt would invert, which is a strong signal for an impending recession.
Market expectations of additional Fed rate hikes also increased which was a reaction to strong underlying fundamentals. Underlying growth of the U.S. economy remained solidly above trend with third quarter growth projected to be approximately 3 percent. The strength of the economy was broad-based given the tailwinds from strong labor markets and fiscal policy; consensus expectations suggested a continuation of current growth rates. Labor markets consistently added over 150,000 jobs per month and remained tight. Wage growth was also strong and began to show signs of acceleration. Core inflation readings remained in line with the Fed’s 2 percent target.
Broad financial conditions were generally supportive of risk assets and economic growth, yet by the end of the period they were near the long-term average. At these levels, financial conditions no longer provided a tailwind for growth but instead were neutral. Driving financial conditions were the higher federal funds rate and a stronger U.S. dollar. And, while global central bank policy was generally accommodative, it began moving toward a more neutral level, as led by the Fed.
Portfolio Review
An overweight to Investment Grade Corporate Bond exposure was the main detractor of performance over the 12-month period.
| 4 |
Management's Discussion of Fund Performance (Unaudited) (Continued)
The Funds allocation to U.S. dollar-denominated Emerging Markets debt was additive over the period, while security selection was strong within Securitized Assets, particularly within ABS and Non-Agency MBS. The Fund’s allocation to Treasury Inflation-Protected Securities (TIPS) was also positive, particularly at the end of 2017 as the Fund took advantage of sharp increases in inflation expectations on the back of rising commodity prices and strong economic data.
The Fund benefited from a rotation out of High Yield in favor of Securitized Assets in early October 2017 as spreads tightened significantly. Throughout the 12-month period, High Yield spreads continued to grind tighter. We believed Securitized Assets offered a more attractive risk/reward profile, particularly within the ABS and Non-Agency MBS sectors. We like these sectors as they closely relate to the health of the U.S. consumer, which we believe to be strong.
We made a modest allocation to U.S. dollar-denominated Emerging Markets debt. Valuations in this asset class were at attractive levels as spreads relative to domestic Investment Grade Corporates and High Yield reached pre-crisis highs. Combined with global growth conditions and supportive fundamentals, we believe the sector offered good opportunity.
Outlook
Going forward, we believe the greatest potential is the Fund’s risk assets, driven by U.S. economic growth, steady inflation and accommodative central bank policy. While financial conditions are no longer accommodative to growth, we believe they are not a hindrance either. Valuations have adjusted to reflect uncertainty around trade issues and how it will impact growth, and we believe the potential upside for price appreciation is limited. We have been taking advantage of opportunities among securitized assets when possible, where we believe attractive risk/reward profiles can be found in the ABS and Non-Agency MBS sectors. We like these sectors’ close connections to consumer spending, which continues to be healthy.
We believe global central banks need to maintain accommodative policies in order to support expansion abroad. Rate hikes by the Fed will further tighten financial conditions as the year progresses, which may become a headwind for the Fund’s overweight position to risk assets. Further escalation of trade disputes, specifically between the U.S. and China, may also impact risk assets.
We believe interest rates are generally fair, and currently reflect the positive economic outlook. As a result, in the near-term, the Fund is positioned with a long duration and neutral curve relative to the benchmark, and we will look to opportunistically take advantage of dislocations in the market as they arise.
| 5 |
Management's Discussion of Fund Performance (Unaudited) (Continued)
Comparison of the Change in Value of a $10,000 Investment in the
Touchstone Active Bond Fund - Class A*and the
Bloomberg Barclays U.S. Aggregate Bond Index
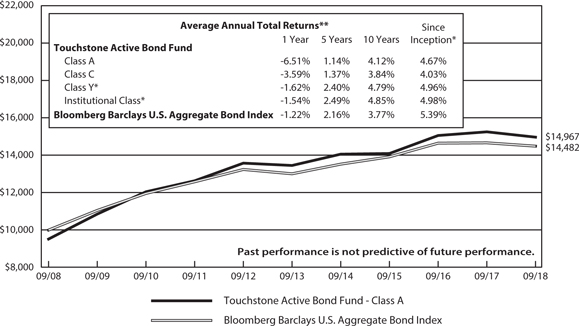
| * | The chart above represents performance of Class A shares only, which will vary from the performance of Class C shares, Class Y shares and Institutional Class shares based on the differences in sales loads and fees paid by shareholders in the different classes. The inception date of Class A shares, Class C shares, Class Y shares and Institutional Class shares was October 3, 1994, October 3, 1994, April 12, 2012, and April 12, 2012, respectively. Class Y shares' and Institutional Class shares' performance was calculated using the historical performance of Class A shares for the periods prior to April 12, 2012. The returns have been restated for sales loads and fees applicable to Class Y and Institutional Class shares. The returns of the index listed above are based on the inception date of the Fund. |
| ** | The average annual total returns shown above are adjusted for maximum sales loads and fees, if applicable. Effective August 17, 2018, the maximum offering price per share of Class A shares is equal to the net asset value (“NAV”) per share plus a sales load equal to 2.04% of the NAV (or 2.00% of the offering price). Prior to August 17, 2018, the maximum offering price per share of Class A shares was equal to the NAV per share plus a sales load equal to 4.99% of the NAV (or 4.75% of the offering price). Class C shares are subject to a contingent deferred sales charge (“CDSC”) of 1.00%. The CDSC will be assessed on an amount equal to the lesser of (1) the NAV at the time of purchase of the shares being redeemed or (2) the NAV of such shares being redeemed, if redeemed within a one-year period from the date of purchase. Class Y shares and Institutional Class shares are not subject to sales charges. |
The performance of the above Fund does not reflect the deduction of taxes that a shareholder would pay on Fund distributions or the redemption of Fund shares.
Note to Chart
Bloomberg Barclays U.S. Aggregate Bond Index is an unmanaged index comprised of U.S. investment grade, fixed rate bond market securities, including government, government agency, corporate and mortgage-backed securities between one and ten years.
| 6 |
Management's Discussion of Fund Performance (Unaudited)
Touchstone Arbitrage Fund
Sub-Advised by Longfellow Investment Management Co., LLC
Investment Philosophy
The Touchstone Arbitrage Fund seeks to achieve positive absolute returns over the long term regardless of market conditions by investing primarily in securities of companies that are involved in publicly announced mergers, takeovers, tender offers, debt restructurings, minority purchases, leveraged buyouts, spin-offs, liquidations and other corporate reorganizations.
Fund Performance
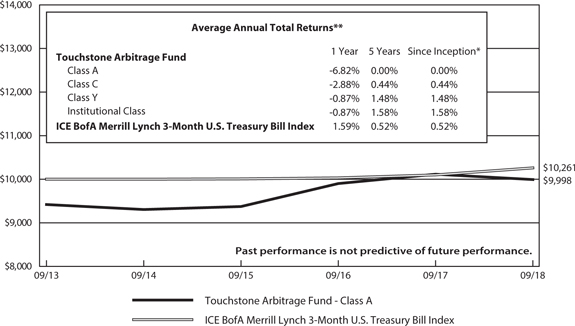
The Touchstone Arbitrage Fund (Class A shares) underperformed its benchmark, the ICE BofA Merrill Lynch 3-Month U.S. Treasury Bill Index, for the 12-month period ended September 30, 2018. The Fund’s total return was -1.18 percent (calculated excluding the maximum sales charge) while the benchmark’s total return was 1.59 percent.
Market Environment
During the 12-month period ended September 30, 2018, risk assets continued to generate strong returns, however volatility increased. Earnings growth remained strong and U.S. corporations have begun to benefit from the lower corporate tax rate as part of the 2017 corporate tax reform.
The U.S. Federal Reserve Board (Fed) was firmly committed to a schedule for rate increases, with 25 basis point increases in each of the last four quarters. While rates remained low relative to historical averages and access to capital markets to facilitate acquisitions was abundant, there was implied risk that the Fed moved too quickly and disrupted what has been a slow and steady recovery in the economy since the depths of the Financial Crisis ten years ago.
Deal spread levels remained below what was anticipated given the increase in short rates. In terms of deal activity, Information Technology and Health Care were the busiest industries in the Fund’s investable universe. While the market sentiment for deal-making appears to be robust, there seems to be an impact from both geopolitical trade pressures and general uncertainty as it relates to tariffs and the emerging trade war issues between the United States and China.
Portfolio Review
While the Fund’s positioning frequently changed due to companies with new deals being added and completed deals being removed, there were no significant changes to its overall positioning. During the period, the Fund’s holdings had 71 deals close and the Fund invested in 80 new companies with pending transactions.
The Fund benefited from the outcome of the Broadcom Ltd./Brocade Communications Systems, Inc. deal. Broadcom and Brocade announced a definitive agreement for Broadcom to acquire Brocade for $12.75 per share in cash. The deal closing was subject to regulatory approvals in various jurisdictions, customary closing conditions, as well as the approval of Brocade’s stockholders. One of the regulatory requirements needed was from the Committee on Foreign Investment in the United States (CFIUS). The companies ran into issues getting this approval. Only after an agreement from Broadcom to move its headquarters back to the United States was the deal allowed to close.
Another deal that contributed to Fund performance was the Discovery Communications Inc./Scripps Networks Interactive Inc. deal. Discovery and Scripps announced a definitive agreement for Discovery to acquire Scripps. Shareholders received $90.00 per share under the terms of the agreement, comprised of $63.00 per share in cash and $27.00 per share in Class C common shares of Discovery stock. The deal had been stalled in an
| 7 |
Management's Discussion of Fund Performance (Unaudited) (Continued)
extended regulatory review in which the Department of Justice (DOJ) had asked the companies for more information. The companies supplied the DOJ with what was requested and were then given the approval needed to close the merger.
The Fund’s performance was hurt by its exposure to Akorn Inc., Tribune Media Company and NXP Semiconductors N.V. The Fund continues to hold these companies because of our belief in their future prospects and/or the stock’s valuation dislocations.
Fresenius SE & Co. KGaA announced a definitive agreement to acquire Akorn Inc. for $34.00 a share. The agreement and transaction have been approved by the boards of both companies and recommended by Akorn’s board to its shareholders. Akorn dropped materially following the announcement that their acquirer, Fresenius, terminated the merger agreement on the back of an investigation into Akorn’s data integrity requirements. Akorn filed suit in Delaware court in order to enforce the merger agreement. A Delaware judge ruled that Fresenius had the right to terminate the merger agreement. This ruling is the first in a Delaware court in which a material adverse event had been proven to have occurred during a merger.
Qualcomm Inc. and NXP Semiconductors N.V. announced a definitive agreement for Qualcomm to acquire NXP for $110.00 per share in cash through a tender offer. NXP was trading with a significant discount to the new Qualcomm offer due to the ongoing trade war between China and the United States. The lone remaining regulatory approval by the Ministry of Commerce, People’s Republic of China (MOFCOM) was elusive due to the ongoing trade war. The deal was terminated.
Sinclair Broadcast Group, Inc. and Tribune Media Company announced a definitive agreement under which Sinclair would acquire Tribune for $35.00 in cash and 0.23 shares of Sinclair Class A common stock for each share of Tribune Class A common stock and Class B common stock. The transaction was subject to approval by Tribune’s stockholders, as well as customary closing conditions, including approval by the Federal Communications Commission (FCC) and antitrust clearance. The deal was terminated by Tribune when the FCC stated that it was against the divestiture package put forth by Sinclair.
Outlook
The main entity driving the environment remains CFIUS. With potential new measures being adopted by the U.S. to broaden the purview of CFIUS, we remain highly selective and disciplined in our analysis of any cross-border transaction. Our investment process includes a strong emphasis on buyer due diligence and focus on cross-border buyers that could run afoul of U.S. regulatory bodies. We believe prevailing deal spreads will increase but lag the past four interest rate hikes.
The market continues to differentiate between the riskier and the more straightforward deals. Deals with a greater amount of perceived risk are being assigned a significantly wider spread than transactions with fewer hurdles. This is in contrast to much of recent history when spreads were not necessarily compensating investors appropriately for the amount of risk taken.
We think access to capital, slow global growth, and strong corporate balance sheets will drive incremental strategic Mergers & Acquisitions. We also think that historically low funding costs should provide a tailwind for financial buyers. On balance, we see a backdrop that remains supportive for continued deal activity.
We believe the Fund is well positioned with a strong focus on liquidity management and mitigating downside risk. We are optimistic at the tailwinds for deal activity and potential for wider spreads based on our outlook.
| 8 |
Management's Discussion of Fund Performance (Unaudited) (Continued)
Comparison of the Change in Value of a $10,000 Investment in the
Touchstone Arbitrage Fund - Class A* and the
ICE BofA Merrill Lynch 3-Month U.S. Treasury Bill Index
| * | The chart above represents performance of Class A shares only, which will vary from the performance of Class C shares, Class Y shares and Institutional Class shares based on the differences in sales loads and fees paid by shareholders in the different classes. The inception date of the Fund was September 30, 2013. The returns of the index listed above are based on the inception date of the Fund. |
| ** | The average annual total returns shown above are adjusted for maximum sales loads and fees, if applicable. Effective August 17, 2018, the maximum offering price per share of Class A shares is equal to the net assets value (“NAV”) per share plus a sales load equal to 5.26% of the NAV (or 5.00% of the offering price). Prior to August 17, 2018, the maximum offering price per share of Class A shares was equal to the NAV per share plus a sales load equal to 6.10% of the NAV (or 5.75% of the offering price). Class C shares are subject to a contingent deferred sales charge (“CDSC”) of 1.00%. The CDSC will be assessed on an amount equal to the lesser of (1) the NAV at the time of purchase of the shares being redeemed or (2) the NAV of such shares being redeemed, if redeemed within a one-year period from the date of purchase. Class Y shares and Institutional Class shares are not subject to sales charges. |
The performance of the above Fund does not reflect the deduction of taxes that a shareholder would pay on Fund distributions or the redemption of Fund shares.
Note To Chart
ICE BofA Merrill Lynch 3-Month U.S. Treasury Bill Index is an unmanaged index of Treasury securities maturing in 90 days that assumes reinvestment of all income.
| 9 |
Management's Discussion of Fund Performance (Unaudited)
Touchstone Emerging Markets Small Cap Fund
Sub-Advised by Copper Rock Capital Partners LLC
Investment Philosophy
The Touchstone Emerging Markets Small Cap Fund seeks capital appreciation by primarily investing in equity securities of emerging markets small-cap companies diversified across sectors and industries. The Fund’s investment process seeks to add value through bottom-up stock selection and in-depth fundamental research.
Fund Performance
The Touchstone Emerging Markets Small Cap Fund (Class A shares) underperformed its benchmark, the MSCI Emerging Markets Small Cap Index for the 12-month period ended September 30, 2018. The Fund’s total return was -11.66 percent (calculated excluding the maximum sales charge) while the total return of the benchmark was -4.20 percent.
Market Environment
During the final quarter of 2017, the asset class comprising small market capitalization equities in emerging markets climbed higher, driven by outperforming stocks in the Health Care and Information Technology sectors, a strong consumer and a broad rally in commodities. Market volatility crept higher during the remainder of the 12-month period as investors’ concerns surfaced over slowing global growth and hawkish commentary from the U.S. Federal Reserve Board (Fed). Specifically, from the second quarter of 2018 to the end of the period, stocks of small capitalization companies in emerging markets were broadly pressured and moved into negative territory. In general, the asset class as a whole was negatively impacted by a stronger U.S. dollar, tensions surrounding trade disputes and tariffs and higher U.S. interest rates.
From a sector perspective within the small capitalization emerging markets asset class, only the Health Care and Consumer Staple sectors produced positive returns while the Communications Services, Utilities and Industrials sectors were the largest decliners. In terms of style, growth stocks underperformed their value counterparts.
Portfolio Review
Over the 12-month period, the Fund faced significant headwinds due to market volatility and the impending impact over a protracted trade war. In particular, the Fund’s holdings in most sectors of the Chinese market detracted from performance, as did a lack of exposure to Korean pharmaceutical and biotechnology stocks, which rallied during the period. Stock selection in India also detracted from relative returns. Stock selection in Thailand, combined with an overweight allocation to the country, was additive. Thailand benefited from being one of the most progressive countries in reforming its balance sheet, and from being more insulated than others from concerns over rising U.S. interest rates.
From a sector perspective, the Fund benefited from positive stock selection in the Consumer Staples, Materials, Energy and Financials sectors, while selection in the Health Care, Consumer Discretionary and Real Estate sectors detracted the most.
Among the individual stocks that contributed to Fund performance were KrungThai Card Public Co. Ltd. (Financials sector), TCI Co. Ltd. (Consumer Staples sector), Douzone Bizon Co. Ltd. (Information Technology sector), China Resources Cement Holdings Ltd. (Materials sector) and Muangthai Capital Public Co. Ltd. (Financials sector).
KrungThai is a credit card issuer in Thailand offering both VISA and Mastercard branded cards. The company’s smaller and more nimble size in the market has allowed it to manage the Bank of Thailand’s push to curb countrywide household debt much better than its competitors. The company also reported higher net profits
| 10 |
Management's Discussion of Fund Performance (Unaudited) (Continued)
during the period versus both its competitors and street expectations. While credit card usage has slowed in Thailand, KrungThai’s growth still outpaced the broad industry.
TCI Co. is a Taiwan-based innovative health foods company that develops and produces supplements and nutritional products. The company also makes facial masks which are sold to global consumer retailers like Sephora & Co., among other clients. During the first quarter of 2018, the company announced earnings that beat market expectations, and management guided for strong growth driven by new product innovation over the next five years. Rising wages in China, along with an aging demographic that was more inclined and able to spend on beauty and health care products, were also important growth catalysts for TCI. In addition, the company has production facilities in Taiwan which Chinese customers perceive to be higher quality. Going forward, we expect the company’s sales will benefit from greater demand for health products and nutritional supplements in China and across Asia. We also believe the market is just beginning to appreciate TCI’s strong growth profile and overseas opportunities.
Douzone Bizon is a South Korea-based provider of enterprise risk platforms and accounting software for small to mid-sized enterprises (SME). Similar to other software companies, Douzone Bizon has begun to migrate desktop users to the cloud which results in both higher fees and lower maintenance costs. In 2018, the company started to experience strong SME customer growth through its web-based accounting platform, as well as growth from its new web-based modules. Importantly, the company also won new business from a large conglomerate in Korea.
China Resources Cement is a producer of cement in southeastern China. The company recently benefited from the closure of highly polluting cement plants across China and from price coordination among larger cement companies. In addition, the Greater Bay Area initiative in China – a plan to link nine cities in Guangdong province plus Hong Kong and Macau to form an integrated business hub – has led to government-led infrastructure growth and cement demand. During the quarter, the stock outperformed due to strong first quarter results and continued price increases. As a result of this outperformance, and the company’s increased market cap, we exited the position.
Muangthai Capital is a commercial lending company based in Thailand that provides individual and SME loans targeted to car titles and agricultural vehicle and land titles. Investor concerns over regulatory tightening in the commercial lending space eased during the period and, as final regulations were released, Muangthai was within the guidelines across all categories. This news positively impacted the stock as did reports of strong company fundamentals that were announced in the firm’s latest quarterly update.
Among the individual stocks that detracted from Fund performance were Qualicorp Consultoria e Corretora de Seguros SA (Health Care sector), Sansiri Public Co. Ltd. (Real Estate sector), China Yongda Automobiles Services Holdings Ltd. (Consumer Discretionary sector), L&T Finance Holdings (Financials sector) and AirTAC International Group (Industrials sector).
Qualicorp is a private health insurance distributor in Brazil which offers direct sales to affinity groups and individual customers. While Qualicorp was a long-term contributor to Fund performance, the company recently came under pressure despite delivering strong cash flow and maintaining a favorable balance sheet. Weakness was primarily driven by continued price increases in Brazil’s overall medical costs. Though company management executed a plan to protect its operational key performance indicators, the increased costs began to impact membership in the affinity plans supported by Qualicorp. As a result, we exited the Fund’s position.
Sansiri is a developer of higher end residential properties in Thailand. The company’s third quarter 2017 results showed weaker performance compared to the prior quarter, which raised concerns that the company would not meet its 2017 guidance. In addition, the company guided for slower growth in 2018. While the company
| 11 |
Management's Discussion of Fund Performance (Unaudited) (Continued)
reported solid pre-sales in November 2017, which led to a mild recovery through December, the company did not recover from its previous highs. We exited the Fund’s position as a result.
China Yongda Automobile Services is a retailer of premium international automobile brands in China including BMW, Audi and Porsche. A major portion of our growth thesis for Yongda was the fact that BMW has five new model rollouts through 2019. Unfortunately, several of the model rollouts were significantly delayed in 2018. At the same time, broad auto sales in China have been under significant pressure driven by the USA/China trade dispute. As the fundamental support for the company has also eroded, we decide to liquidate the Fund’s position.
L&T Finance is a non-banking financial company (NBFC) in India with focus on rural, housing and wholesale lending, plus an asset management and wealth management business. All NBFCs in India have been under pressure recently – including L&T Finance – due to pressure on the currency that has resulted in a squeeze on short term liquidity. India’s central bank is addressing some of the liquidity issues for NBFCs and we believe this is having a positive impact. Furthermore, we see a strong growth path ahead for L&T Finance and continue to see it as high quality and buffered from direct impact of the liquidity squeeze. We continue to hold the stock as we believe there is potential opportunity.
AirTAC International Group manufactures pneumatic components and is a key component supplier into the factory automation supply chain. AirTAC has a high quality, focused management team that has shown strict adherence to product development and pricing that drives profitability. A key thesis for our investment in AirTAC was that we expect the growth in factory automation to continue – especially within China – for the next several years. Unfortunately, capital expenditure decisions – especially on spending on factory automation – have broadly been put on hold due to concerns surrounding the USA/China trade dispute. As such, we have decided to exit the Fund’s investment in AirTAC.
At the end of the quarter, the Fund was overweight to the Financials, Consumer Discretionary, Information Technology, Energy and Health Care sectors. It was underweight to the Consumer Staples, Materials, Communication Services, Real Estate, Utilities and Industrials sectors. On a country basis, the Fund was overweight to China, Thailand, India, Korea, Hungary, Greece and Brazil, while the largest underweight allocations were to Chile, Taiwan and Indonesia.
Outlook
Many market strategists are now setting the trade war between the U.S. and China as their base case assumption going forward. This has clearly had a notable impact on investor sentiment for emerging markets equities over the past two quarters, and also extends a broader impact in the emerging markets space beyond just China. Also, India – which seemed to have a longer-term focus driving its broad growth – began to experience some negative impact on its currency and short-term liquidity.
Nonetheless, there were positive factors during the most recent quarter of the 12-month period that were encouraging. Thailand has cleaned up its public balance sheet over the past decade and now stands out economically from the crowd in terms of stability and defensiveness within emerging markets. Mexico has moved past a major election and, after re-establishing the trade agreement with the U.S. and Canada, has shown opportunities for improving growth and company fundamentals. Brazil will be finished with its elections soon which we believe has started to create a stabilizing effect on that market, thereby strengthening the impact of positive fundamentals.
Given this background, we continue to approach the investment opportunities within the emerging markets small cap space by focusing on stocks with strong, well-explained and visible earnings growth supported by valuation levels and management teams that deliver the key drivers of sustainable earnings growth. We do this
| 12 |
Management's Discussion of Fund Performance (Unaudited) (Continued)
within a framework and awareness that recognizes the headwinds and tailwinds associated with the country dynamics that are present today in emerging markets.
Comparison of the Change in Value of a $10,000 Investment in the
Touchstone Emerging Markets Small Cap Fund - Class A* and the
MSCI Emerging Markets Small Cap Index

| * | The chart above represents performance of Class A shares only, which will vary from the performance of Class C shares, Class Y shares and Institutional Class shares based on the differences in sales loads and fees paid by shareholders in the different classes. The inception date of the Fund was September 30, 2009. The returns of the index listed above are based on the inception date of the Fund. |
| ** | The average annual total returns shown above are adjusted for maximum sales loads and fees, if applicable. Effective August 17, 2018, the maximum offering price per share of Class A shares is equal to the net assets value (“NAV”) per share plus a sales load equal to 5.26% of the NAV (or 5.00% of the offering price). Prior to August 17, 2018, the maximum offering price per share of Class A shares was equal to the NAV per share plus a sales load equal to 6.10% of the NAV (or 5.75% of the offering price). Class C shares are subject to a contingent deferred sales charge (“CDSC”) of 1.00%. The CDSC will be assessed on an amount equal to the lesser of (1) the NAV at the time of purchase of the shares being redeemed or (2) the NAV of such shares being redeemed, if redeemed within a one-year period from the date of purchase. Class Y shares and Institutional Class shares are not subject to sales charges. |
The performance of the above Fund does not reflect the deduction of taxes that a shareholder would pay on Fund distributions or the redemption of Fund shares.
Notes to Chart
MSCI Emerging Markets Small Cap Index is a free float-adjusted market capitalization index that is designed to measure equity market performance of small companies from emerging markets.
MSCI makes no express or implied warranties or representations and shall have no liability whatsoever with respect to any MSCI data contained herein. The MSCI data may not be further redistributed or used to create indices or financial products. This report is not approved or produced by MSCI.
| 13 |
Management's Discussion of Fund Performance (Unaudited)
Touchstone High Yield Fund
Sub-Advised by Fort Washington Investment Advisors, Inc.
Investment Philosophy
The Touchstone High Yield Fund seeks a high level of income. Capital appreciation is a secondary consideration. The Fund primarily invests in non-investment-grade securities.
Fund Performance
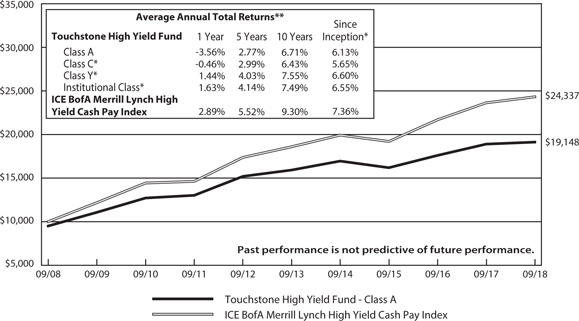
The Touchstone High Yield Fund (Class A shares) underperformed its benchmark, ICE BofA Merrill Lynch High Yield Cash Pay Index, for the 12-month period ended September 30, 2018. The Fund’s total return was 1.24 percent (calculated excluding the maximum sales charge) while the benchmark’s total return was 2.89 percent.
Market Environment
Over the 12-month period, the High Yield market was driven by a handful of larger economic movements that significantly affected the asset class and returns. In part, news was dominated by economic volatility surrounding political rhetoric, tax policy, sanctions and trade tariffs out of Washington, D.C. When taken as a whole, the combination of tax stimulus and fiscal stimulus positively impacted the economy. In particular, it resulted in a rally in risk assets, along with a notable change in interest rates, due to an increase in growth expectations while inflation expectations remained subdued. The market also saw increased volatility from trade rhetoric and the resulting subsequent implementation.
Yields on 2-year and 10-year U.S. Treasuries rose meaningfully and was a significant headwind for fixed income assets. Investment grade corporate securities with long durations and low spreads were affected the most. Below-investment grade securities were able to absorb the headwinds more effectively. Their typically shorter duration were less prone to the intermediate-to-longer-term U.S. Treasury yield increases and outperformed.
During the 12-month period, the top performing sectors were Supermarkets, Pharmaceuticals, Energy and Aerospace/Defense. The common theme among these sectors was that returns were all dominated by low-rated, predominately CCC-rated bonds, which was a headwind to the Fund’s higher quality portfolio and detracted from performance. For example, crude oil prices steadily increased during the period, thus providing a backdrop for high-yielding, lower-quality Energy bonds to continue their recovery from the lows seen in 2015 and 2016. As a result, Independent Energy and Oil Field Services were two of the strongest returning segments in the benchmark. The weakest performing sectors were Auto Parts, Housewares and Apparel.
Portfolio Review
Overall, sector allocation detracted from Fund performance for the 12-month period. The Fund’s overweight positions to Supermarkets and Wirelines contributed to Fund returns, as did underweight positions to Packaging and Wireless. The Fund’s overweight position to Food & Beverage detracted from performance but credit selection within the sector more than offset this allocation effect. The Fund’s underweight to Pharmaceuticals, which was dominated by the returns of CCC-rated Valeant Pharmaceuticals International Inc. and Endo International PLC, negatively impacted performance. These two bonds were a headwind which was difficult to offset. As previously noted, credit quality and duration were the two most significant macroeconomic factors affecting performance for the period.
Security selection detracted from performance and was driven by two main factors: underweight positions in CCC-rated bonds and overweight positions in Diebold Nixdorf Inc. and Ultra Petroleum Corp. Diebold Nixdorf is a financial and retail technology company that specializes in the production of ATMs. The holding was the largest detractor as the company struggled to integrate a large acquisition. Ultra Petroleum, an exploration and
| 14 |
Management's Discussion of Fund Performance (Unaudited) (Continued)
production company, also detracted as the company struggled with commodity pricing, the implementation of a new strategy, and speculation surrounding the management of its balance sheet. GenOn Energy, an energy company and bankruptcy entity rebounded and positively affected performance. Additionally, overweight positions to a Telecommunications company, Frontier Communications Corp. and a Midstream company, NGL Energy Partners LP, also contributed to returns.
The largest overweight sectors within the Fund were Food & Beverage, Consumer Products and Midstream, while the largest underweights were Information Technology, Independent Energy and Wireless Communications.
Fund duration was slightly longer than that of the benchmark as the portfolio is underweight the shortest-to-maturity segment of the market and overweight mid-durations bonds. In general, the Fund does not seek to take an explicit position on duration, preferring instead to let security selection decisions drive relative performance.
Outlook
We believe the greatest opportunities may be a continuation of the current environment of low growth mixed with relatively easy monetary policy, or a meaningful sell-off in the High Yield market. The combination of solid Gross Domestic Product growth, strong employment gains, positive financial conditions and a resetting of interest rates provides an environment in which we believe the High Yield market has potential. This scenario presumes that the ongoing trade talks do not evolve into a market-altering event and that economic activity, which has accelerated domestically, maintains its current pace of expansion.
In light of High Yield’s relatively low spread and yield levels, the Fund is positioned toward the lower portion of its risk range. Yield is below that of the benchmark due to a significant underweight to CCC-rated bonds. We believe that the BB- and B-rated segments of the market are fairly valued. As the business cycle has recovered from the slowdown in 2015 and 2016, and because of the risk asset sell-off, we have reduced the Fund’s CCC-rated exposure. More recently, purchase activity has been tilted towards BB-rated issuers. We believe the Fund’s defensive stance positions it well in a market in which CCC-rated bonds are priced with little room for error and economic activity is currently high.
The Fund’s positioning emphasizes security selection over sector allocation as we believe there are a limited number of sector allocation opportunities in the current environment. Where there are sector opportunities, we express our views through quality (BB versus B) and not necessarily through a large underweight or overweight to a sector.
| 15 |
Management's Discussion of Fund Performance (Unaudited) (Continued)
Comparison of the Change in Value of a $10,000 Investment in the
Touchstone High Yield Fund - Class A*and the ICE BofA Merrill Lynch High Yield Cash Pay
Index
| * | The chart above represents performance of Class A shares only, which will vary from the performance of Class C shares, Class Y shares and Institutional Class shares based on the differences in sales loads and fees paid by shareholders in the different classes. The inception date of Class A shares, Class C shares, Class Y shares and Institutional Class shares was May 1, 2000, May 23, 2000, February 1, 2007, and January 27, 2012, respectively. Class C shares', Class Y shares' and Institutional Class shares' performance was calculated using the historical performance of Class A shares for the periods prior to May 23, 2000, February 1, 2007 and January 27, 2012, respectively. The returns have been restated for sales loads and fees applicable to Class C, Class Y and Institutional Class shares. The returns of the index listed above are based on the inception date of the Fund. |
| ** | The average annual total returns shown above are adjusted for maximum sales loads and fees, if applicable. Effective August 17, 2018, the maximum offering price per share of Class A shares is equal to the net asset value (“NAV”) per share plus a sales load equal to 2.04% of the NAV (or 2.00% of the offering price). Prior to August 17, 2018, the maximum offering price per share of Class A shares was equal to the NAV per share plus a sales load equal to 4.99% of the NAV (or 4.75% of the offering price). Class C shares are subject to a contingent deferred sales charge (“CDSC”) of 1.00%. The CDSC will be assessed on an amount equal to the lesser of (1) the NAV at the time of purchase of the shares being redeemed or (2) the NAV of such shares being redeemed, if redeemed within a one-year period from the date of purchase. Class Y shares and Institutional Class shares are not subject to sales charges. |
The performance of the above Fund does not reflect the deduction of taxes that a shareholder would pay on Fund distributions or the redemption of Fund shares.
Note to Chart
ICE BofA Merrill Lynch High Yield Cash Pay Index is an unmanaged index used as a general measure of market performance consisting of fixed-rate, coupon-bearing bonds with an outstanding par which is greater than or equal to $50 million, a maturity range greater than or equal to one year and must be less than BBB/Baa3 rated but not in default.
| 16 |
Management's Discussion of Fund Performance (Unaudited)
Touchstone Impact Bond Fund*
Sub-Advised by EARNEST Partners LLC
Investment Philosophy
The Touchstone Impact Bond Fund seeks current income. Capital appreciation is a secondary goal. The Fund invests primarily in fixed income securities or sectors that are considered undervalued for their risk characteristics.
Fund Performance
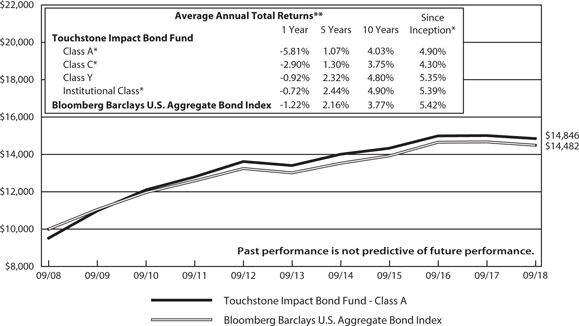
The Touchstone Impact Bond Fund (Class A shares) outperformed its benchmark, the Bloomberg Barclays U.S. Aggregate Bond Index for the 12-month period ended September 30, 2018. The Fund’s total return was -1.07 percent (calculated excluding the maximum sales charge) while the benchmark’s total return was -1.22 percent.
Market Environment
U.S. economic data was positive for the 12-month period ended September 30, 2018 in a relatively stable and consistent pattern. Gross domestic product (GDP) reported real gains during all four quarters of the period. The unemployment rate also improved in a somewhat steady fashion and ended the period with the lowest unemployment rate in decades. Meanwhile, labor force participation was steady and wage growth improved as the number of job openings was on par with the number of job seekers. Many companies reported that their single largest challenge was finding employees to fill job openings. While the employment picture improved, inflation remained reasonably stable and well anchored. This was due in part to the U.S. Federal Reserve Board’s (Fed) monetary policy. The Fed raised interest rates once each quarter for the 12-month period, which was done in large part to stem increasing inflation as the economy continued to build momentum.
During the 12-month period, the Bloomberg Barclays U.S. Aggregate Bond Index outperformed relative to similar duration U.S. Treasuries. Lower quality bonds were in particularly high demand during the period as BBB-rated securities delivered the strongest levels of outperformance, whereas high-quality AAA-rated securities were the weakest performers.
Interest rates rose notably during the period, and these increases occurred across the yield curve with the largest moves taking place in the shorter parts of the curve. This was due to a confluence of factors including but not limited to: 1) an increase in U.S. Treasury Bill supply to fund the fiscal deficit, 2) increases in the federal funds rate, 3) reduced demand for U.S. Treasuries from international investors and 4) low inflation expectations by market participants. The rising interest rate environment was especially difficult for U.S. Treasuries, as these securities are inherently exposed to interest rate risk without any of the additional yield spread that bonds can generate. As a result, U.S. Treasuries declined during the period.
During the 12-month period, the stock market’s outperformance and the bond market’s higher yields helped attract assets from U.S. pensions into fixed income assets as funding gaps were narrowed. With these drivers, nearly all spread sectors within the U.S. fixed income market delivered positive relative returns during the quarter. U.S. Credit led the way, with U.S. Corporate Bonds driving much of the performance due to increased earning potential which buoyed optimism for the sector. This sentiment particularly favored issuers from the Industrials sector, as that sector significantly outperformed U.S. Treasuries with similar durations.
Credit-sensitive securities such as Asset-Backed Securities (ABS) and Commercial Mortgage-Backed Securities (CMBS) also posted strong relative returns during the period. Agency Single-Family Mortgage-Backed Securities (MBS) performed well, but to a lesser degree, due to spurts of market volatility. Agency Multi-Family MBS,
| 17 |
Management's Discussion of Fund Performance (Unaudited) (Continued)
which are structured in a way that leaves them less prone to changes in volatility, also outperformed. U.S. Agency bonds also produced positive relative returns for the fiscal year.
Portfolio Review
The Fund’s overweight position in Agency Multi-Family MBS provided a tailwind as the sector outperformed its sister, Agency Single-Family MBS, during the period. The Fund’s overweight to U.S. Agencies provided another tailwind. The Fund’s underweight to CMBS was a headwind as the sector also performed well. This was largely offset by the market’s preference for more cyclical and sensitive portions of the U.S. Corporate Bond sector. More consistent industries such as Utilities generated modest relative returns compared to that of more cyclical industries within the Industrials sector.
Individual issues created a mixture of tailwinds and headwinds during the period. Security selection within U.S. Agencies contributed to performance. Security selection within ABS, in particular the Fund’s rate reduction bonds, outperformed their broader sector. Conversely, positions within U.S. Corporate Bonds detracted. General Electric Co. surprised the majority of the investment community with previously undisclosed impairments and losses. The company is now in the midst of a fundamental transition. We have completely sold the Fund’s position in the company. Alternatively, we have retained the Fund’s investment in South Carolina Electric and Gas Co. despite the headwinds faced by the company and its recent drag on performance. The debt held is secured in nature and we believe, regardless of the pressures faced by the company, the assets backing this mortgage are critical and essential in nature to the local economy it supports.
The Fund does not make any active interest rate bets and, accordingly, the Fund’s effective duration was approximately matched to that of the benchmark at the end of the quarter. By approximately matching the benchmark’s duration, the Fund’s interest rate risk is effectively equal to that of the benchmark over time. Furthermore, while changes in interest rates can impact total return, the Fund attempts to remain relatively neutral. With this approach, we believe changes in interest rates should not have much impact on the relative performance of the Fund.
Outlook
Looking ahead, we believe there are many events and developments taking place that could provide opportunities. As we have previously described, the Fed’s normalization of its balance sheet could provide a tailwind for the Fund as the portfolio is underweight in both U.S. Treasuries and Single-Family MBS. If the Fed, the single largest buyer of these securities, begins to step away from the purchasing table, these sectors could experience relative underperformance. Thus far, the pace of the Fed’s balance sheet tapering has been modest at approximately $150 billion in aggregate, and the run rate is scheduled to reach upwards of $50 billion a month by the end of the year. The divergent monetary policies that have been pursued by the Fed versus the rest of the world has increased currency hedging costs. This, along with trade disputes, has reduced demand for U.S. Treasuries from foreign buyers. Going forward, as these two large sources of demand pull back from the U.S. Treasury market, supply is expected to increase due to budget deficits and expansionary fiscal policy. As a result, the underweight positions to U.S. Treasuries and Single-Family MBS have the potential to benefit the Fund.
Furthermore, unexpected volatility within the financial markets could be fueled by increased levels of leverage, tense trade rhetoric with China, concerns surrounding emerging markets, and potential liquidity implications resulting from central bank actions. However, we believe the Fund’s emphasis on less economically sensitive sectors and higher quality could act to mitigate these impacts. As such, we believe the Fund is positioned well and maintains a discipline that balances risk and return objectives.
*Formerly Touchstone Total Return Bond Fund.
| 18 |
Management's Discussion of Fund Performance (Unaudited) (Continued)
Comparison of the Change in Value of a $10,000 Investment in the
Touchstone Impact Bond Fund - Class A* and the
Bloomberg Barclays U.S. Aggregate Bond Index
| * | The chart above represents performance of Class A shares only, which will vary from the performance of Class C shares, Class Y shares and Institutional Class shares based on the differences in sales loads and fees paid by shareholders in the different classes. The inception date of Class A shares, Class C shares, Class Y shares and Institutional Class shares was August 16, 2010, August 1, 2011, November 15, 1991 and August 1, 2011, respectively. Class A shares', Class C shares' and Institutional Class shares' performance was calculated using the historical performance of Class Y shares for the periods prior to August 16, 2010, August 1, 2011 and August 1, 2011, respectively. The returns have been restated for sales loads and fees applicable to Class A, Class C and Institutional Class shares. The returns of the index listed above are based on the inception date of the Fund. |
| ** | The average annual total returns shown above are adjusted for maximum sales loads and fees, if applicable. Effective August 17, 2018, the maximum offering price per share of Class A shares is equal to the net asset value (“NAV”) per share plus a sales load equal to 2.04% of the NAV (or 2.00% of the offering price). Prior to August 17, 2018, the maximum offering price per share of Class A shares was equal to the NAV per share plus a sales load equal to 4.99% of the NAV (or 4.75% of the offering price). Class C shares are subject to a contingent deferred sales charge (“CDSC”) of 1.00%. The CDSC will be assessed on an amount equal to the lesser of (1) the NAV at the time of purchase of the shares being redeemed or (2) the NAV of such shares being redeemed, if redeemed within a one-year period from the date of purchase. Class Y shares and Institutional Class shares are not subject to sales charges. |
The performance of the above Fund does not reflect the deduction of taxes that a shareholder would pay on Fund distributions or the redemption of Fund shares.
Note to Chart
Bloomberg Barclays U.S. Aggregate Bond Index is an unmanaged index comprised of U.S. investment grade, fixed rate bond market securities, including government, government agency, corporate and mortgage-backed securities between one and ten years.
| 19 |
Management's Discussion of Fund Performance (Unaudited)
Touchstone Merger Arbitrage Fund
Sub-Advised by Longfellow Investment Management Co., LLC
Investment Philosophy
The Touchstone Merger Arbitrage Fund seeks to achieve positive absolute returns regardless of market conditions over the long term by investing primarily in securities of companies that are involved in publicly announced mergers and other corporate reorganizations. Merger arbitrage is an investment strategy that seeks to capture the “arbitrage spread” represented by the difference between the market price of the securities of the company being purchased and the value that is offered for these securities by the acquiring company. The Fund selects securities based on proposed financing terms, the size of the transaction, anti-trust concerns, regulatory approvals and shareholder voting requirements.
Fund Performance
The Touchstone Merger Arbitrage Fund (Class A shares) underperformed its benchmark, the ICE BofA Merrill Lynch 3-Month U.S. Treasury Bill Index, for the 12-month period ended September 30, 2018. The Fund’s total return was -0.96 percent (calculated excluding the maximum sales charge) while the benchmark’s total return was 1.59 percent.
Market Environment
During the 12-month period ended September 30, 2018, risk assets continued to generate strong returns, however volatility increased. Earnings growth remained strong and U.S. corporations have begun to benefit from the lower corporate tax rate as part of the 2017 corporate tax reform.
The U.S. Federal Reserve Board (Fed) was firmly committed to a schedule for rate increases, with 25 basis point increases in each of the last four quarters. While rates remained low relative to historical averages and access to capital markets to facilitate acquisitions was abundant, there was implied risk that the Fed moved too quickly and disrupted what has been a slow and steady recovery in the economy since the depths of the Financial Crisis ten years ago.
Deal spread levels remained below what was anticipated given the increase in short-term interest rates. In terms of deal activity, Information Technology and Health Care were the busiest industries in the Fund’s investable universe. While the market sentiment for deal-making appears to be robust, there seems to be an impact from both geopolitical trade pressures and general uncertainty as it relates to tariffs and the emerging trade war issues between the United States and China.
Portfolio Review
While the Fund’s positioning frequently changed due to companies with new deals being added and completed deals being removed, there were no significant changes to its overall positioning. During the period, the Fund’s holdings had 73 deals close and the Fund invested in 83 new transactions.
The Fund benefited from the outcome of the Broadcom Ltd./Brocade Communications Systems Inc. deal. Broadcom and Brocade announced a definitive agreement for Broadcom to acquire Brocade for $12.75 per share in cash. The deal closing was subject to regulatory approvals in various jurisdictions, customary closing conditions, as well as the approval of Brocade’s stockholders. One of the regulatory requirements needed was from the Committee on Foreign Investment in the United States (CFIUS). The companies ran into issues getting this approval. Only after an agreement from Broadcom to move its headquarters back to the United States was the deal allowed to close.
| 20 |
Management's Discussion of Fund Performance (Unaudited) (Continued)
Another deal that contributed to Fund performance was the Discovery Communications Inc./Scripps Networks Interactive Inc. deal. Discovery and Scripps announced a definitive agreement for Discovery to acquire Scripps. Shareholders received $90.00 per share under the terms of the agreement, comprised of $63.00 per share in cash and $27.00 per share in Class C common shares of Discovery stock. The deal had been stalled in an extended regulatory review in which the Department of Justice (DOJ) had asked the companies for more information. The companies supplied the DOJ with what was requested and were then given the approval needed to close the merger.
The Fund’s performance was hurt by its exposure to Akorn Inc., Tribune Media Company, NXP Semiconductors N.V. and Sparton Corp. The Fund continues to hold these companies because of our belief in their future prospects and/or the stock’s valuation dislocations.
Fresenius SE & Co. KGaA announced a definitive agreement to acquire Akorn Inc. for $34.00 a share. The agreement and transaction have been approved by the boards of both companies and recommended by Akorn’s board to its shareholders. Akorn dropped materially following the announcement that their acquirer, Fresenius, terminated the merger agreement on the back of an investigation into Akorn’s data integrity requirements. Akorn filed suit in Delaware court in order to enforce the merger agreement. A Delaware judge ruled that Fresenius had the right to terminate the merger agreement. This ruling is the first in a Delaware court in which a material adverse event had been proven to have occurred during a merger.
Qualcomm Inc. and NXP Semiconductors N.V. announced a definitive agreement for Qualcomm to acquire NXP for $110.00 per share in cash through a tender offer. NXP was trading with a significant discount to the new Qualcomm offer due to the ongoing trade war between China and the United States. The lone remaining regulatory approval by the Ministry of Commerce, People’s Republic of China (MOFCOM) was elusive due to the ongoing trade war. The deal was terminated.
Sinclair Broadcast Group Inc. and Tribune Media Company announced a definitive agreement under which Sinclair would acquire Tribune for $35.00 in cash and 0.23 shares of Sinclair Class A common stock for each share of Tribune Class A common stock and Class B common stock. The transaction was subject to approval by Tribune’s stockholders, as well as customary closing conditions, including approval by the Federal Communications Commission (FCC) and antitrust clearance. The deal was terminated by Tribune when the FCC stated that it was against the divestiture package put forth by Sinclair.
Sparton Corporation’s planned merger with Ultra Electronics Holdings PLC was blocked by the U.S. Department of Defense. Sparton immediately announced that it was restarting its sales process as prior to this announced deal several other parties expressed interested in acquiring either the entire company, its Manufacturing & Design Services segment or its Defense & Security Systems segment.
Outlook
The main entity driving the environment remains CFIUS. With potential new measures being adopted by the U.S. to broaden the purview of CFIUS, we remain highly selective and disciplined in our analysis of any cross-border transaction. Our investment process includes a strong emphasis on buyer due diligence and focus on cross-border buyers that could run afoul of U.S. regulatory bodies. We believe prevailing deal spreads will increase but lag the past four interest rate hikes.
The market continues to differentiate between the riskier and the more straightforward deals. Deals with a greater amount of perceived risk are being assigned a significantly wider spread than transactions with fewer hurdles. This is in contrast to much of recent history when spreads were not necessarily compensating investors appropriately for the amount of risk taken.
| 21 |
Management's Discussion of Fund Performance (Unaudited) (Continued)
We think access to capital, slow global growth, and strong corporate balance sheets will drive incremental strategic Mergers & Acquisitions. We also think that historically low funding costs should provide a tailwind for financial buyers. On balance, we see a backdrop that remains supportive for continued deal activity.
We believe the Fund is well positioned with a strong focus on liquidity management and mitigating downside risk. We are optimistic at the tailwinds for deal activity and potential for wider spreads based on our outlook.
| 22 |
Management's Discussion of Fund Performance (Unaudited) (Continued)
Comparison of the Change in Value of a $10,000 Investment in the
Touchstone Merger Arbitrage Fund - Class A* and the
ICE BofA Merrill Lynch 3-Month U.S. Treasury Bill Index
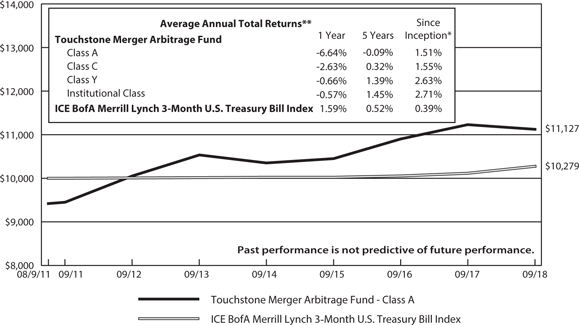
| * | The chart above represents performance of Class A shares only, which will vary from the performance of Class C shares, Class Y shares and Institutional Class shares based on the differences in sales loads and fees paid by shareholders in the different classes. The inception date of the Fund was August 9, 2011. The returns of the index listed above are based on the inception date of the Fund. |
| ** | The average annual total returns shown above are adjusted for maximum sales loads and fees, if applicable. Effective August 17, 2018, the maximum offering price per share of Class A shares is equal to the net assets value (“NAV”) per share plus a sales load equal to 5.26% of the NAV (or 5.00% of the offering price). Prior to August 17, 2018, the maximum offering price per share of Class A shares was equal to the NAV per share plus a sales load equal to 6.10% of the NAV (or 5.75% of the offering price). Class C shares are subject to a contingent deferred sales charge (“CDSC”) of 1.00%. The CDSC will be assessed on an amount equal to the lesser of (1) the NAV at the time of purchase of the shares being redeemed or (2) the NAV of such shares being redeemed, if redeemed within a one-year period from the date of purchase. Class Y shares and Institutional Class shares are not subject to sales charges. |
The performance of the above Fund does not reflect the deduction of taxes that a shareholder would pay on Fund distributions or the redemption of Fund shares.
Note to Chart
ICE BofA Merrill Lynch 3-Month U.S. Treasury Bill Index is an unmanaged index of Treasury securities maturing in 90 days that assumes reinvestment of all income.
| 23 |
Management's Discussion of Fund Performance (Unaudited)
Touchstone Mid Cap Fund
Sub-Advised by The London Company
Investment Philosophy
The Touchstone Mid Cap Fund seeks long-term capital growth by investing primarily in common stocks of mid-cap U.S.-listed companies. The Fund utilizes a bottom-up security selection process that screens potential investments against a proprietary quantitative model for return on capital, earnings-to-enterprise value ratio, and free cash flow yield. Its goal is to purchase financially stable companies that are believed to consistently generate high returns on unleveraged operating capital, are run by shareholder-oriented managements and are trading at a discount to their respective intrinsic values.
Fund Performance
The Touchstone Mid Cap Fund (Class A shares) outperformed its benchmark, the Russell Midcap® Index, for the 12-month period ended September 30, 2018. The Fund’s total return was 15.83 percent (calculated excluding the maximum sales charge) while the benchmark’s total return was 13.98 percent.
Market Environment
U.S. stocks posted positive results driven by strong economic news, solid corporate earnings, and the benefit of individual and corporate tax reductions that took effect at the beginning of 2018. The markets experienced greater volatility and the pace of inflation picked up, but there were few signs of significant pricing pressures. The U.S. Federal Reserve Board (Fed) increased the federal funds rate by 25 basis points four times during the period. Expectations for firming inflation and higher growth, along with balance sheet normalization from the Fed, contributed to higher longer-term rates.
While economic data was mostly positive, there were areas of potential concern, including housing and the impact of tariffs. Housing construction was limited by both supply and demand constraints. While housing starts and existing home sales were relatively stable, growth was limited. The lack of housing supply and rising input costs had a negative impact on the supply side while higher interest rates caused limited demand.
Portfolio Review
During the 12-month period, the Fund benefited from strong stock selection but sector allocation was a headwind for performance. The Information Technology and Health Care sectors were the best performing, however, the Fund’s underweight to both sectors detracted. Stock selection in the Information Technology sector was also a drag on performance. On the other hand, stock selection within the Industrials and Financials sectors was strong enough to offset the underperformance of those sectors and contributed to returns. Overall, the more traditional growth sectors outperformed the more defensive sectors during the period.
Among the individual stocks that contributed to Fund performance were Cintas Corp., Old Dominion Freight Line Inc., Copart Inc. (all three from the Industrials sector), Progressive Corp. (Financials sector) and Deckers Outdoor Corp. (Consumer Discretionary sector). Cintas, a provider of specialized services to businesses, moved higher due to a favorable environment of low unemployment and strong business confidence. The company’s acquisition of G&K Services Inc. exceeded expectations as Cintas has de-levered quickly to its pre-acquisition leverage targets. Old Dominion Freight Line, a national less-than-truckload motor carrier, continued to benefit from tight capacity throughout the industry and strong economic growth, as both volume and pricing improved across the industry. Further, the implementation of electronic logging devices and driver shortages have limited capacity growth, which we believe should be a positive for pricing in the future. Copart, a provider of online vehicle auction services, ended the period significantly higher despite a downward slide earlier in the year. Overall, its business was on solid footing and its operations in Europe showed good potential. We believe the drivers
| 24 |
Management's Discussion of Fund Performance (Unaudited) (Continued)
of Copart’s success remain intact and its operating leverage has improved with greater volume. Progressive, an insurance provider, outperformed as the company continued to post premium growth along with profitable underwriting results, and its combined expense ratio came in lower than expected. The company also posted improved top-line growth in both its auto and home insurance policies, and both of its digital and agency platforms increased market share. Deckers Outdoor, a footwear designer and distributor, increased meaningfully due to improving sales from its UGG brand and progress on margin initiatives. The improved sentiment has reversed the company’s low valuation and low expectations seen earlier in the year.
Among the individual stocks that detracted from performance were Whirlpool Corp. (Consumer Discretionary sector), Edgewell Personal Care Co. (Consumer Staples sector), NewMarket Corp. (Materials sector), Symantec Corp. (Information Technology sector) and CarMax Inc. (Consumer Discretionary sector). Whirlpool, an appliance manufacturer, posted a string of disappointing quarters due to a variety of factors, including rising raw material costs and continued difficulties in its EMEA (Europe, the Middle East and Africa) segment. Further, the company lowered its full-year guidance in July in conjunction with second-quarter earnings. In our view, the negative sentiment was somewhat overdone, as Whirlpool has strong cash flow, leading market share and exposure to the ongoing recovery in the U.S. housing market. Edgewell Personal Care, a consumer products company, moved notably lower as greater competition in the wet shave business negatively impacted sales and pricing. Earlier in the year, the company announced a system-wide restructuring effort to help better position the company for the future. We were skeptical of the plan and elected to exit the position. NewMarket, a petroleum additives company, fell during the period as higher raw material costs and lower pricing were headwinds to performance. We remain attracted to the company’s stable revenue outlook in the fuel additives and lubricants market, pricing power in a consolidated industry, and excellent history of capital allocation. Symantec, a cybersecurity company, declined dramatically during the summer amid accounting concerns. The company’s uncertainty around the issue raised doubts, and we exited the stock on the news. CarMax, a used-car retailer, moved lower as higher interest rates, negative auto sentiment due to trade tariffs, and new competition weighed on the stock. We remain attracted to the company’s business model and the market share opportunities that we believe lie ahead.
The Fund initiated new positions in STORE Capital Corp. (Real Estate sector), Sensata Technologies Holding PLC (Industrials sector), Axalta Coating Systems Ltd. (Materials sector), Entegris Inc. and Skyworks Solutions Inc. (both from the Information Technology sector). STORE Capital operates as an internally managed net-lease real estate investment trust (REIT). The company fills a niche in the middle market sale-leaseback space, providing lessees (without credit ratings) customer-centric solutions to free up capital. By originating the majority of investments directly, STORE Capital has been able to execute long-term lease rates at a significant spread to the market and, combined with annual lease escalations and high occupancy, provide high visibility. The company also benefits from a high-quality management team with many years of experience in the space. Sensata is an industrial technology company with long-cycle contracts, visible cash flows and high switching costs. It is also a world leader in mission-critical sensors and electrical protection. The business has high barriers to entry with original equipment manufacturers (OEMs) due to performance, importance and quality of product. The company also generates a significant amount of predictable free cash flow and its capital expenditures are minimal. Axalta Coating Systems is a worldwide coatings company that has strayed away from being a commoditized paint supplier and remained focused on becoming a specialized service business. There are high barriers to entry within this industry due to capital expenditures needed for plants, business relationships and high brand loyalty. The auto refinishing and OEM coating businesses are oligopolistic in nature with high switching costs, which has also attracted other long-term investors due to strong cash generation and high return on invested capital (ROIC). Entegris is a specialty chemical company with the majority of revenue coming from the semiconductor space. The company’s revenue is more recurring in nature and less cyclical than its OEM or capital equipment peers. Its products are considered leading edge and address highly specialized niches in the electronic materials space. The industry has high barriers to entry, few competitors and high switching costs. Entegris also benefits from a high margin, high ROIC business that is managed by a seasoned, transparent management team. Looking
| 25 |
Management's Discussion of Fund Performance (Unaudited) (Continued)
ahead, Entegris is expected to benefit from an improvement in its operating leverage as well as additional innovative products. Skyworks Solutions is a semiconductor company focused on the integrated solutions for radio frequency (RF) chips used in mobile phones. The company enjoys strong margins due to industry consolidation and a lack of competitors. The consolidation of mobile device manufacturers has not impacted profitability because Skyworks’ products are critical to functionality and are not commoditized.
The Fund sold its positions in Pulte Group Inc. (Consumer Discretionary sector), Voya Financial Inc. (Financials sector), Symantec Corp. (Information Technology sector) and Edgewell Personal Care Co. (Consumer Staples sector). The Fund trimmed its positions in Progressive Corp. (Financials sector), Cintas Corp. (Consumer Discretionary sector) and Old Dominion Freight Line Inc. (Industrials sector).
Outlook
The combination of solid economic growth, low inflation and relatively low interest rates usually creates a positive environment for stocks. We believe this holds true today, but there are risks. In our opinion, we believe potential risks include relatively high valuations for stocks using traditional metrics, rising inflation, the impact of increasing tariffs, or the Fed taking a more aggressive stance. We believe the risks and rewards are somewhat balanced as they relate to stocks overall, but we remain cautious and focused on limiting the downside.
Going forward, we believe the attractive candidates we are vetting today are a result of what the market is providing, and is consistent with our general outlook. Specifically, we believe downside risk can be mitigated by remaining focused on those companies with pricing power, copious cash generation and prudent capital allocation. We seek companies with strong return on capital and sustainable competitive advantages. We remain attracted to the capital metric because it speaks to the ability of the company to generate cash, which is ultimately what lowers risk. We also tend to be attracted to businesses that are overcapitalized and under-levered. We believe an under-levered company has more options available to it if the economy falls into a recession, including changing its capital structure to lower its overall cost of capital.
We believe the Fund is positioned well based on the strength of the companies we own and the overall valuation of the Fund’s portfolio. While the market is not considered cheap and we could certainly see a pullback and/or greater volatility in the near future, it is difficult to predict when we will experience the next downturn.
| 26 |
Management's Discussion of Fund Performance (Unaudited) (Continued)
Comparison of the Change in Value of a $10,000 Investment in the Touchstone
Mid Cap Fund - Class A* and the Russell Midcap® Index
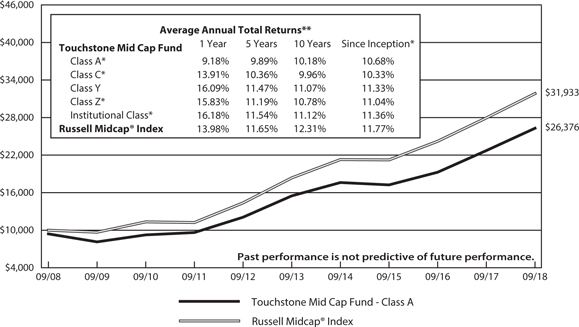
| * | The chart above represents performance of Class A shares only, which will vary from the performance of Class C shares, Class Y shares, Class Z shares and Institutional Class shares based on the differences in sales loads and fees paid by shareholders in the different classes. The inception date of Class A shares, Class C shares, Class Y shares, Class Z shares and Institutional Class shares was May 14, 2007, May 14, 2007, January 2, 2003, April 24, 2006 and January 27, 2012, respectively. Class A shares', Class C shares', Class Z shares' and Institutional Class shares' performance was calculated using the historical performance of Class Y shares for the periods prior to May 14, 2007, May 14, 2007, April 24, 2006 and January 27, 2012, respectively. The returns have been restated for sales loads and fees applicable to Class A, Class C, Class Z and Institutional Class shares. The returns of the index listed above are based on the inception date of the Fund. |
| ** | The average annual total returns shown above are adjusted for maximum sales loads and fees, if applicable. Effective August 17, 2018, the maximum offering price per share of Class A shares is equal to the net assets value (“NAV”) per share plus a sales load equal to 5.26% of the NAV (or 5.00% of the offering price). Prior to August 17, 2018, the maximum offering price per share of Class A shares was equal to the NAV per share plus a sales load equal to 6.10% of the NAV (or 5.75% of the offering price). Class C shares are subject to a contingent deferred sales charge (“CDSC”) of 1.00%. The CDSC will be assessed on an amount equal to the lesser of (1) the NAV at the time of purchase of the shares being redeemed or (2) the NAV of such shares being redeemed, if redeemed within a one-year period from the date of purchase. Class Y shares, Class Z shares and Institutional Class shares are not subject to sales charges. |
The performance of the above Fund does not reflect the deduction of taxes that a shareholder would pay on Fund distributions or the redemption of Fund shares.
Notes to Chart
Russell Midcap® Index measures the performance of the 800 smallest companies in the Russell 1000® Index.
The Frank Russell Company (FRC) is the source and owner of the Index data contained or reflected in this material and all trademarks and copyrights related thereto. The material may contain confidential information and unauthorized use, disclosure, copying, dissemination or redistribution is strictly prohibited. This is a Touchstone Investments presentation of the data, and FRC is not responsible for the formatting or configuration of this material or for any inaccuracy in the presentation thereof.
| 27 |
Management's Discussion of Fund Performance (Unaudited)
Touchstone Mid Cap Value Fund
Sub-Advised by LMCG Investments, LLC
Investment Philosophy
The Touchstone Mid Cap Value Fund seeks capital appreciation by investing primarily in common stocks of medium capitalization companies. The Fund seeks to identify companies believed to be selling at a discount to their intrinsic value.
Fund Performance
The Touchstone Mid Cap Value Fund (Class A shares) underperformed its benchmark, the Russell Midcap® Value Index, for the 12-month period ended September 30, 2018. The Fund’s total return was 2.80 percent (calculated excluding the maximum sales charge) while the benchmark’s total return was 8.81 percent.
Market Environment
Within U.S. mid-capitalization stocks, growth stocks continued to outpace value stocks. Additionally, the market environment favored companies with lower leverage, higher foreign sales, lower price-to-earnings ratios, higher yield and higher sales growth. Within the benchmark, the top performing sectors were Communication Services, Energy and Information Technology, while the Real Estate, Consumer Staples and Consumer Discretionary sectors detracted the most.
Portfolio Review
During the 12-month period, the Fund’s strongest contributors were the Industrials, Financials and Real Estate sectors. Primary detractors were the Energy, Consumer Discretionary and Health Care sectors. Stock selection was the primary driver of underperformance for the period. The market environment negatively impacted the Fund as momentum characteristics and higher valuations were headwinds.
The Energy sector detracted, led by holdings EQT Corp. and Cimarex Energy Co., as stocks related to gas underperformed during the period. EQT is a petroleum and natural gas exploration and pipeline transport company. EQT was negatively impacted by delays in the spin-off of its master limited partnership (MLP) assets and Mountain Valley natural gas pipeline buildout, along with a slowdown in production growth. Cimarex is an exploration and production company with operations in the Permian Basin. Recently, companies with exposure to the Permian Basin, including Cimarex, have struggled due to concerns around congestion in the area. We believe the overcrowding will be a short-term problem and should subside once additional pipelines are developed.
Within the Consumer Discretionary sector, underperformance was driven by LKQ Corp., BorgWarner Inc. and The Michael Companies Inc. LKQ is a provider of alternative and specialty parts to repair and accessorize vehicles. The stock sold off following reports of a lackluster margin, as the market punished the company on the perception that management was more interested in growth and acquisitions than operational excellence. We believe that the margin deficit will be short term and that company management understood the importance of margin and operations after the market’s reactions. BorgWarner, a components supplier, moved lower as investors grew concerned about global trade wars and weakness in foreign exchange rates. Conversely, we added to the Fund’s position in Michaels Cos. Inc., an arts and crafts retailer, based on the stock’s recent underperformance, as we were attracted to the quality and growth of the company and its lower valuation.
Underperformance in the Health Care sector was mainly concentrated in Fund holdings Patterson Companies Inc. and Dentsply Sirona Inc. Patterson is a provider of services and technologies to the dental and animal health markets. The company reduced guidance while in the final stages of significant improvements to its operations and distribution. We believe that once these transitory issues have been resolved, Patterson will
| 28 |
Management's Discussion of Fund Performance (Unaudited) (Continued)
emerge with cutting-edge operations and a more efficient and productive sales force. Dentsply Sirona, a dental equipment and consumables producer, traded lower on reduced forward guidance, management turnover, and management’s announcement that it is working on developing a comprehensive restructuring program. However, we continue to be attracted to the company’s long-term outlook based on expected revenue growth, additional cost reductions, a strong competitive position and current valuation relative to its history.
The Fund’s overweight to the Information Technology sector and positive stock selection in the software industry helped offset underperformance from MACOM Technology Solutions Holdings Inc. and Diebold Nixdorf Inc. MACOM is a developer and producer of radio, microwave and millimeter-wave semiconductor devices and components. The company reported results in line with guidance but slightly underperformed its semiconductor peers. We believe the demand trends should continue to modulate until China’s inventory correction is complete because management continued to release positive forward guidance and demand commentary. We added to the position based on the stock’s recent underperformance. Diebold Nixdorf is a financial and retail technology company that specializes in the production of ATMs. We exited the Fund’s position as balance sheet concerns increased following a reduction in the company’s earnings guidance.
The Fund’s holdings within the Industrials sector contributed to performance, including KAR Auction Services Inc. and Clean Harbors Inc. KAR Auction Services continued to exhibit solid execution in all three segments of its business: used car auctions, auto salvage and financing to used car dealers. Clean Harbors is a provider of environmental, energy and industrial services. The company experienced a strong rebound in demand for its industrial services and benefited from operational improvements in its oil re-refining business.
The Financials sector contributed to Fund returns during the period, as stock selection in banks and capital markets was particularly strong, including SVB Financial Group, TCF Financial Corp. and E*TRADE Financial Corp. SVB Financial Group moved higher after a strong first quarter report, and we trimmed the Fund’s position on the stock’s strength. TCF Financial and E*TRADE also contributed to performance and we exited both Fund positions in favor of new opportunities. Further, the Fund’s underweight to real estate investment trusts (REITs) also benefited the Fund during the period.
On a sector basis, the Fund maintained overweight positions to the Materials and Consumer Staples sectors, and underweight positions to the Real Estate, Communication Services and Financials sectors.
Outlook
Looking ahead, our greatest concern is that the market environment will continue to reward growth and visibility, irrespective of valuation and quality. However, we will not deviate from our process of buying high-quality companies that are temporarily out of favor, and we believe that buying stocks, irrespective of valuation, is a risky strategy. We will continue to seek attractively valued investment opportunities with favorable risk-reward profiles.
The Fund utilizes a classic value-driven philosophy based on the belief that leading businesses selling at a discount to fair value have the potential to generate excess returns. The Fund’s strategy focuses on stocks that are temporarily out of favor in the market, specifically companies with higher returns on capital, free cash flow and strong balance sheets. Emphasis is placed on those companies having the cash flow characteristics as well as the balance sheet strength necessary to buffer the company from any prolonged weakness. While the companies we select often dominate a particular industry niche and generally have significant barriers to entry, we believe they are able to perpetuate a higher return on capital over time. The Fund’s overall investment process utilizes fundamental bottom-up security selection, while we believe risk-control measures ensure security and sector diversification.
| 29 |
Management's Discussion of Fund Performance (Unaudited) (Continued)
Comparison of the Change in Value of a $10,000 Investment in the
Touchstone Mid Cap Value Fund - Class A* and the Russell Midcap® Value Index

| * | The chart above represents performance of Class A shares only, which will vary from the performance of Class C shares, Class Y shares and Institutional Class shares based on the differences in sales loads and fees paid by shareholders in the different classes. The inception date of the Fund was September 30, 2009. The returns of the index listed above are based on the inception date of the Fund. |
| ** | The average annual total returns shown above are adjusted for maximum sales loads and fees, if applicable. Effective August 17, 2018, the maximum offering price per share of Class A shares is equal to the net assets value (“NAV”) per share plus a sales load equal to 5.26% of the NAV (or 5.00% of the offering price). Prior to August 17, 2018, the maximum offering price per share of Class A shares was equal to the NAV per share plus a sales load equal to 6.10% of the NAV (or 5.75% of the offering price). Class C shares are subject to a contingent deferred sales charge (“CDSC”) of 1.00%. The CDSC will be assessed on an amount equal to the lesser of (1) the NAV at the time of purchase of the shares being redeemed or (2) the NAV of such shares being redeemed, if redeemed within a one-year period from the date of purchase. Class Y shares and Institutional Class shares are not subject to sales charges. |
The performance of the above Fund does not reflect the deduction of taxes that a shareholder would pay on Fund distributions or the redemption of Fund shares.
Notes to Chart
Russell Midcap® Value Index measures the performance of those Russell Midcap companies with lower price-to-book ratios and lower forecasted growth values.
The Frank Russell Company (FRC) is the source and owner of the data contained or reflected in this material and all trademarks and copyrights related thereto. The material may contain confidential information and unauthorized use, disclosure, copying, dissemination or redistribution is strictly prohibited. This is a Touchstone Investments presentation of the data, and FRC is not responsible for the formatting or configuration of this material or for any inaccuracy in the presentation thereof.
| 30 |
Management's Discussion of Fund Performance (Unaudited)
Touchstone Premium Yield Equity Fund
Sub-Advised by Miller/Howard Investments, Inc.
Investment Philosophy
The Touchstone Premium Yield Equity Fund seeks long-term growth of capital and high current income by focusing on dividend-paying equity securities of U.S. and foreign companies believed to possess attractive long-term return potential primarily due to lower than average valuations and improving business outlooks.
Fund Performance
The Touchstone Premium Yield Equity Fund (Class A shares) underperformed the Russell 3000® Value Index and the Dow Jones U.S. Select Dividend Index for the 12-month period ended September 30, 2018. The Fund’s total return was 6.41 percent (calculated excluding the maximum sales charge) while the returns of its benchmarks were 9.46 percent and 10.59 percent, respectively.
Market Environment
The U.S. economy continued to grow, as gross domestic product (GDP) reported real gains during all four quarters of the period and ended the fiscal year higher than the previous fiscal year. The U.S. unemployment rate steadily improved and the labor force participation rate was essentially the same for the 12-month period. The spread between the unemployment rate and those unemployed, including marginally attached and part-time workers, continued to narrow which helped push wage growth higher. However, despite the growth in wages, consumer sentiment and inflation remained subdued. Capacity utilization was stubbornly low and uncertainty surrounding threats of a trade war also continued to be a concern. The U.S. Federal Reserve Board (Fed) raised the federal funds rate by 25 basis points in September, after previously raising it by the same amount in March and June, as well as in December 2017.
During the 12-month period, stocks continued to grow into their valuations, as evidenced by companies that beat earnings expectations and increased their earnings per share (EPS). While some of the strength was attributed to lower tax rates, much of it was also a reflection of strong business trends. Companies within the Information Technology sector, many of which paid high taxes and held significant cash offshore, were clear beneficiaries due to reduced rates on profits and repatriation. The Energy sector also performed well, as stock valuations were reasonable relative to the broader market. The sector also benefited from firmer crude oil prices and improving investor sentiment. At the end of June, OPEC agreed to raise output but not enough to fully meet projected demand growth and potential geopolitical supply disruptions.
During the period, the historically traditional dividend sectors lagged the Russell 3000® Value Index, including Consumer Staples, Real Estate and Utilities.
Portfolio Review
During the period, the Fund’s underweight position to the Health Care sector detracted from performance. The Fund maintained a significant overweight to the Information Technology sector which contributed to returns, however, security selection within the sector posted mixed results.
Among the individual stocks that contributed to performance were Sysco Corp. (Consumer Staples sector), Pfizer Inc. (Health Care sector) and Target Corp. (Consumer Discretionary sector). Sysco Corp., a food distributor, operates in a congenial competitive environment, as one of two end-to-end restaurant suppliers with a fully national footprint. The stock outperformed after the company reported strong performance, along with higher than expected EPS and revenues. Investors also reacted favorably to management’s guidance for its three-year plan. The stock was sold as it became overvalued compared to its peers. Pfizer, a pharmaceutical company, reported better than expected EPS and revenues. The company also guided higher its EPS for 2018 and announced
| 31 |
Management's Discussion of Fund Performance (Unaudited) (Continued)
encouraging results for several of its pipeline drugs. Target, a general merchandise retailer, reported better than expected EPS and revenues. Same-store sales also exceeded expectations, as in-store traffic growth was stronger than it had been in a decade, and management raised its fiscal-year guidance for 2019. Target also had a strong holiday season in 2017, which contributed to its outperformance. The Fund trimmed its position in Target due to the stock’s valuation.
Among the individual stocks that detracted from performance were Enbridge Inc., Williams Cos. Inc. (both from the Energy sector) and Pitney Bowes Inc. (Information Technology sector). Enbridge, a Canada-based midstream pipeline company, declined following a negative preliminary judicial decision on one of its major pipeline projects. Ongoing legal issues and protests weighed on the stock’s performance, thus making this holding too controversial for the Fund’s conservative strategy. Therefore we exited the Fund’s position. Williams Cos., a midstream energy company, declined following the Federal Energy Regulatory Commission’s (FERC’s) ruling on the income tax allowance at master limited partnerships (MLPs). In August 2018, Williams Cos. acquired Williams Partners, an MLP, to simplify its corporate structure. Williams Partners was believed to be one of the partnerships most exposed to FERC-regulated pipes, which negatively impacted the stock. Pitney Bowes, a business solutions and global technology company, reported its second consecutive quarter of disappointing earnings and guidance at the end of 2017, which indicated the company’s turnaround was taking longer than anticipated. We believed that more capital-intensive solutions seem likely and, while warranted, could jeopardize the company’s dividend. Therefore we exited the Fund’s position.
The following stocks were added to the Fund during the 12-month period. Citigroup Inc. (Financials sector) is an investment bank and financial services company. Citigroup passed this year’s bank stress test and significantly increased its dividend. We believe the company has solid loan and deposit growth, ample capital, improved cost position and stable credit metrics. Broadcom Inc. (Information Technology sector) is an analog and digital semiconductor technology company. Broadcom has benefited from outsized sales and cash flow growth prospects, a solid balance sheet and coverage ratios, low valuation, and management’s commitment to its dividend. Carnival Corp. (Consumer Discretionary sector) is a large cruise ship company spanning multiple brands. Carnival increased its dividend over the past year. Earnings are also expected to grow. Carnival has plans for operational improvements by working to share best practices across its brands and combining operations, where appropriate. Further, we believe Carnival should benefit from lower unemployment and improving consumer finances. Six Flags Entertainment Corp. (Consumer Discretionary sector) is a regional theme park operator. The company has reinvented itself with a more consistent business model and a stronger balance sheet. We believe the key to its dividend has been the company’s growing push toward selling annual passes, which recently accounted for two-thirds of ticket revenues, thereby insulating Six Flags from consequences of weather and summer gasoline prices. We believe Six Flags should benefit from lower unemployment and improving consumer finances.
International Paper Co. (Materials sector) a U.S. packaging company, continued to benefit from growth in ecommerce and the economy in general, and it has driven solid demand for container board. The industry in North America has consolidated, positioning International Paper to gain from improved pricing. The Fund exited the stock last year following investor concerns surrounding a large acquisition, and reestablished the position after the company announced it would not pursue the deal. Nokia Oyj (Information Technology sector) has a strong market position in providing both fixed and wireless 5G equipment to service providers. Nokia has no net debt and should be an advantaged vendor in Western markets where privacy concerns are heightened. We also believe there are savings that Nokia can further achieve from its acquisition of Alcatel-Lucent SA and benefit from its growing licensing business. Occidental Petroleum Corp. (Energy sector) is a global integrated energy company. Oil production significantly increased in the Permian Basin, and Occidental owns some of the most attractive acreage in the area. The Permian Basin has proven so prolific that industry production has overwhelmed pipeline capacity. Occidental has further benefited from owning both wells and a pipeline system. Umpqua Holdings Corp. (Financials sector) is a midsized regional bank. The company has benefited from
| 32 |
Management's Discussion of Fund Performance (Unaudited) (Continued)
healthy economic growth in the Pacific Northwest. Like many other banks, Umpqua is streamlining its branch network to lower costs in the digital age. The AES Corp. (Utilities sector) is an electric power distribution company. The stock was added due to its attractive valuation, visible growth profile and free cash flow growth. The company also has an improving balance sheet, and an increasing focus on renewables and energy storage. Huntington Bancshares Inc. (Financials sector) is a regional bank with a leading market share across Ohio and Michigan. We believe that Huntington should benefit from rising interest rates, lower regulation and lower taxes. Further, its upper Midwest footprint should benefit from increased capital expenditure, while lower tax rates should be additive to the company’s EPS. Aegon NV (Financials sector) is a provider of life insurance and retirement products. The company’s U.S. unit, Transamerica, generates over half of Aegon’s net income and is expected to benefit from the reduction in U.S. corporate tax rates. We believe Aegon should also benefit from rising long-term interest rates. KLA-Tencor Corp. (Information Technology sector) is a leading producer of process control equipment for semiconductor manufacturing. Demand for equipment is robust, as manufacturers gear up to produce an increasingly wide range of semiconductors, including those for artificial intelligence, Internet of Things (IoT), cloud computing and autonomous vehicles, as well as those in established markets such as personal computers and mobile phones. Fidelity National Financial Inc. (Financials sector) is one of the largest providers of title insurance. Title insurance is a consolidated industry with stable pricing, and Fidelity has a cash-rich balance sheet and low valuation. CenterPoint Energy Inc. (Utilities sector) is an electric and natural gas utility. The company has a visible backlog of high return projects. We believe it should also benefit from economic growth in the Houston, Texas area.
HSBC Holdings PLC (Financials sector) is a global bank with operations in over 60 countries and a dominant presence in Asia. While regulatory reform in the U.S. has been a tailwind for banks, HSBC has benefited from its offshore presence and the acceleration in global economic activity. Sabre Corp. (Information Technology sector) is a travel software company. We believe the company will benefit as its multi-year capital program quickly winds down, thus freeing up cash. Airline traffic is set to increase in the coming years and, as one of only three software platforms behind all global airline bookings, we believe Sabre should benefit from favorable industry dynamics. Total SA (Energy sector) is a French multinational integrated oil and gas company. Total has global diversification, significant connection to the global liquified natural gas trade, cost-advantaged petrochemical facilities, and long-lived, high cash-flowing production fields. Texas Instruments Inc. (Information Technology sector) is a semiconductor design and manufacturing company. We believe the company will benefit from tax reform and key technology drivers, including Big Data, the IoT and machine learning.
The following stocks were sold from the Fund during the 12-month period for a variety of reasons including valuation, declining fundamentals, lower earnings guidance and concerns over dividends: Vodafone Group PLC (Communication Services Sector); United Parcel Service Inc. (Industrials sector); Bank of Montreal Canada (Financials sector); Merck & Co. Inc. (Health Care sector); AbbVie Inc.’s (Health Care sector); Hanesbrands Inc. (Consumer Discretionary sector); Cracker Barrel Old Country Store Inc. (Consumer Discretionary sector); Welltower Inc. (Real Estate sector); Ventas Inc. (Real Estate sector); International Business Machines Corp. (Information Technology sector); Tupperware Brands Corp. (Consumer Discretionary sector); Covanta Holding Corp. (Industrials sector); Hospitality Properties Trust (Real Estate sector); Weyerhaeuser Co. (Real Estate sector); PacWest Bancorp (Financials sector); National Grid PLC (Utilities sector); AT&T Inc. (Communication Services sector); L Brands Inc. (Consumer Discretionary sector); Microchip Technology Inc. (Information Technology sector); Abbott Laboratories (Health Care sector); GlaxoSmithKline PLC (Health Care sector); Johnson & Johnson (Health Care sector); Pitney Bowes (Industrials sector); and Enbridge (Energy sector).
Outlook
Looking ahead, we believe mature technology companies offer excellent prospects for dividend growth. Fluctuating demand for personal computers and mobile phones formerly made this a highly cyclical sector. The industry
| 33 |
Management's Discussion of Fund Performance (Unaudited) (Continued)
has now diversified dramatically. Semiconductors and software are literally everywhere, from factory floors to autos to video doorbells at home.
In our opinion, banks and insurance companies also have the potential for dividend growth. Lower interest rates have depressed what financial firms can earn on loans and other assets. Given recent commentary from the Fed, short-term interest rates are likely to continue rising. Additionally, the tightening labor market, faster economic growth and some hints of inflation point to rising long-term rates. We believe higher interest rates should boost earnings for financial companies.
Going forward, we believe the Fund is positioned well. Earnings and dividend growth are robust, and while we believe Fund holdings will participate, we are still concerned about risk. We continue to marginally favor high dividend growth over high dividend yield, both because consistent high-yielding stocks have become more difficult to find and because we believe dividend growth should help counter the effect of rising rates. As we look out over the next decade, we see an increased use of semiconductors in all aspects of life. We believe the Financials sector will continue to expand and innovate alongside a growing economy. Naturally, some companies are better suited than others to deliver growing dividends. We will continue to seek attractive opportunities.
| 34 |
Management's Discussion of Fund Performance (Unaudited) (Continued)
Comparison of the Change in Value of a $10,000 Investment in the
Touchstone Premium Yield Equity Fund - Class A*, the Russell 3000® Value Index and the
Dow Jones U.S. Select Dividend Index
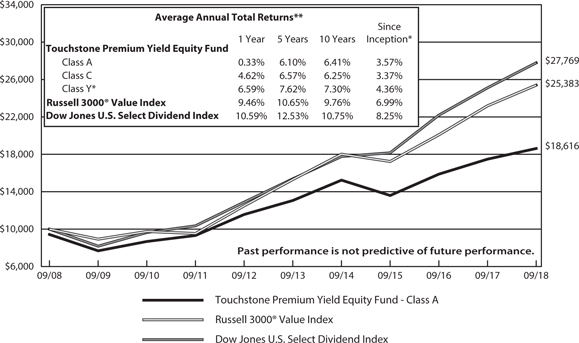
| * | The chart above represents performance of Class A shares only, which will vary from the performance of Class C shares and Class Y shares based on the differences in sales loads and fees paid by shareholders in the different classes. The inception date of Class A shares, Class C shares and Class Y shares was December 3, 2007, December 3, 2007 and August 12, 2008, respectively. Class Y shares' performance was calculated using the historical performance of Class A shares for the periods prior to August 12, 2008. The returns have been restated for sales loads and fees applicable to Class Y shares. The returns of the indexes listed above are based on the inception date of the Fund. |
| ** | The average annual total returns shown above are adjusted for maximum sales loads and fees, if applicable. Effective August 17, 2018, the maximum offering price per share of Class A shares is equal to the net asset value (“NAV”) per share plus a sales load equal to 5.26% of the NAV (or 5.00% of the offering price). Prior to August 17, 2018, the maximum offering price per share of Class A shares was equal to the NAV per share plus a sales load equal to 6.10% of the NAV (or 5.75% of the offering price). Class C shares are subject to a contingent deferred sales charge (“CDSC”) of 1.00%. The CDSC will be assessed on an amount equal to the lesser of (1) the NAV at the time of purchase of the shares being redeemed or (2) the NAV of such shares being redeemed, if redeemed within a one-year period from the date of purchase. Class Y shares are not subject to sales charges. |
The performance of the above Fund does not reflect the deduction of taxes that a shareholder would pay on Fund distributions or the redemption of Fund shares.
Notes to Chart
Russell 3000® Value Index measures the performance of those Russell 3000 companies with lower price-to-book ratios and lower forecasted growth values.
Dow Jones U.S. Select Dividend Index measures 100 leading U.S. dividend-paying companies.
Frank Russell Company (FRC) is the source and owner of the Russell 3000® Value Index data contained or reflected in this material and all trademarks and copyrights related thereto. The material may contain confidential information and unauthorized use, disclosure, copying, dissemination or redistribution is strictly prohibited. This is a Touchstone Investments presentation of the data, and FRC is not responsible for the formatting or configuration of this material or for any inaccuracy in the presentation thereof.
| 35 |
Management's Discussion of Fund Performance (Unaudited)
Touchstone Sands Capital Select Growth Fund
Sub-Advised by Sands Capital Management, LLC
Investment Philosophy
The Touchstone Sands Capital Select Growth Fund seeks long-term capital appreciation by primarily invests in common stocks of large capitalization U.S. companies that are believed to have above-average potential for revenue or earnings growth. The Fund typically invests in 25 to 35 companies. Sands Capital generally seeks stocks with sustainable above-average earnings growth and capital appreciation potential. In addition, Sands Capital looks for companies that have a significant competitive advantage, a leadership position or proprietary niche, a clear mission in an understandable business, financial strength and are valued rationally in relation to comparable companies, the market and the business prospects for that particular company.
Fund Performance
The Touchstone Sands Capital Select Growth Fund (Class A shares) outperformed its benchmark the Russell 1000® Growth Index for the 12-month period ended September 30, 2018. The Fund’s total return was 33.03 percent (calculated excluding the maximum sales charge) while the total return of the benchmark was 26.30 percent.
Market Environment
Record U.S. profit growth, accelerating economic growth, increasing business confidence, and record low unemployment have combined to propel the Russell 1000® Growth Index’s rise over the latest fiscal year. Strength was broad based as all sectors contributed to the benchmark’s return. Strength particularly came from the Information Technology and Consumer Discretionary sectors, as software-as-a-service and internet-based businesses reported strong corporate profit growth and strengthening business fundamentals. Some question the sustainability of the growth environment and its support for elevated valuations.
Portfolio Review
Among the top contributors for the 12-month period were Netflix Inc. (Communications Services sector), Salesforce.com Inc. (Information Technology sector), Amazon.com Inc. (Consumer Discretionary sector), ServiceNow Inc. (Information Technology sector) and Adobe Systems Inc. (Information Technology sector). Netflix continued to demonstrate the strength of its customer-content flywheel—the virtuous cycle created as more subscribers increase subscription revenue, which funds content creation, and in turn attracts more subscribers. This has led to remarkable scale, with Netflix spending more on content development than almost any non-sport entertainment buyer in the world. We believe that Netflix’s customer-content flywheel will benefit from more than $80 billion in content investment over the next five years, which we expect will further extend the company’s competitive moat, and will continue to generate strong subscriber growth. With this level of investment, combined with an affordable price point, we believe that Netflix could become a must-have entertainment utility for many of the world’s broadband households.
Among the top detractors for the period were Incyte Corp. and Regeneron Pharmaceuticals Inc. (both from the Health Care sector), Floor & Décor Holdings Inc. and Under Armour Inc. (both from the Consumer Discretionary sector), and Lending Club Corp. (Financials sector). We sold Incyte after the company announced that epacadostat failed to produce the required results in its Phase 3 trials for treatment of melanoma, one of the drugs in development. In addition to this pipeline setback, Incyte had a suboptimal U.S. regulatory decision when its rheumatoid arthritis drug baricitinib was approved, but with restrictions. These negative outcomes followed the 2016 failure of Jakafi to meet the FDA Phase 3 trial requirements in solid tumors. Despite these setbacks, we continue to view Incyte as one of the leading global biotech businesses with a growing oncology franchise and a broad pipeline of molecules. We continue to have conviction in the business’s longer-term
| 36 |
Management's Discussion of Fund Performance (Unaudited) (Continued)
prospects, but its potential over our investment horizon has diminished. Given a highly concentrated portfolio, we concluded that Incyte’s fit with our criteria weakened relative to our opportunity set, so we exited the Fund’s position.
During the period, we purchased Loxo Oncology Inc. and Align Technology Inc. (both from the Health Care sector), Workday Inc. (Information Technology sector) Floor & Décor Holdings Inc. (Consumer Discretionary sector), and Sarepta Therapeutics Inc. (Health Care sector) for the Fund’s portfolio. Over the same period, we sold Under Armour Inc. and Snap Inc. (both from the Consumer Discretionary sector), Lending Club Inc. (Financials sector), Chipotle Mexican Grill Inc. (Consumer Discretionary sector), Biogen Inc. (Health Care sector), Incyte Inc. (Health Care sector), Baidu Inc. (Communications Services sector), and Starbucks Corp. (Consumer Discretionary sector).
Loxo Oncology (Loxo) Inc. is an emerging leader in genetically targeted cancer therapy development. We believe Loxo has a compelling overall R&D strategy, focused on developing highly selective therapies for genetically defined cancer subgroups. As opposed to broader cancer treatments, which address greater disease heterogeneity and face more competition, targeted therapies often provide dramatic patient benefits with higher probabilities of clinical success. The highlight of the company’s late-stage pipeline is the drug larotrectinib, which treats cancer patients with tropomyosin receptor kinase (TRK) mutations. Loxo partnered with Bayer to globally commercialize and develop larotrectinib along with a follow-on TRK therapy. In our view, the partnership validates the TRK opportunity, introduces an existing experienced oncology sales force, and provides Loxo the funds to invest in its pipeline. The Bayer partnership should also enable Loxo to shift focus toward its earlier-stage development efforts beyond TRK mutations, which we believe the market underappreciates, including a drug for cancers driven by REarranged during Transfection (RET) mutations. Over the long term, we expect above-average earnings growth as Loxo commercializes drugs and continues to execute on its focused R&D strategy.
Align Technology Inc. is the market leader for clear aligners, which are alternatives to traditional dental braces. Through its Invisalign System, Align is the clear aligner pioneer and global leader, with over 80 percent market share. Currently, traditional braces are used to treat over 90 percent of the 10 million annual cases of malocclusion, or misaligned teeth, worldwide. Over the next few decades, we expect clear aligners to become the treatment standard globally, as they are aesthetically superior, less painful, more hygienic, and faster than traditional braces, while being less time-consuming for clinicians. We also expect the overall malocclusion treatment market to expand, as more adults that didn’t previously want visible braces adopt invisible clear aligners, and as Align improves access through international expansion and direct-to-consumer (DTC) channels. In addition to expanding the market, DTC should allow Align to control more of the economics, driving higher margins over time. Beyond Align’s leadership in the secular shift to aligners, we expect the business to benefit from a number of competitive advantages. These include widespread brand recognition, the most comprehensive product offerings, patent protection, and the largest clear aligner data repository, which helps direct future innovation.
Workday Inc. is a leading provider of enterprise software-as-a-service (SaaS) applications for human capital management, financial management systems, and analytics. Over the next decade, we expect enterprises to adopt SaaS-based enterprise resource planning solutions. We see Workday as both a driver and key beneficiary of this trend. The cloud-based nature of the company’s products allows for the delivery of more frequent updates with greater ease, less down time, and a lower total cost of ownership relative to traditional on-premise software. Workday’s leadership in human capital management is already well-established, but its growth is still in the early innings, in our view. We think that combining this foothold with advanced analytics capabilities should enable Workday to succeed in financial management, broaden its addressable opportunity, extend the duration of the company’s growth, and position Workday as a key strategic vendor to its customers.
Floor & Decor Holdings Inc. is an emerging leader in the hard surface flooring industry. We believe the company is disrupting the space by offering best-in-class product assortment, the deepest in-stock inventory, and lower
| 37 |
Management's Discussion of Fund Performance (Unaudited) (Continued)
pricing—all of which are key factors for customers. The average square feet per store is more than triple the size of specialty tile flooring companies, and nearly 15 times larger than the space dedicated to hard surface flooring at large home improvement centers. Additionally, the number of in-stock SKUs per store is unmatched, with more than four times the inventory of the next highest competitor. On pricing, our research indicates that Floor & Decor’s products are approximately 10 to 15 percent and 30 to 40 percent cheaper than those of large home improvement chains and mom-and-pop stores, respectively. With a target of more than tripling its store count to 300 over the next few years, the company is still in the early phase of its growth. Impressively, new stores have demonstrated compelling economics, generating 18 to 20 percent cash-on-cash returns in their first year of operations. In our view, store growth and store economics should be supported by the growth of the hard surface flooring market, which we estimate at $18 billion and growing two to three times faster than carpet. Additionally, we believe the hard surface flooring market is largely protected from pure online competition, given that customers generally prefer to see and feel products before making large purchases, and the heavy weight of the products makes shipping expensive. Moreover, favorable long-term trends—such as rising home values, aging housing stock, and millennials entering the housing market—serve as possible tailwinds to the company’s long-term growth. We believe the combination of its value proposition, significant store growth opportunity, new store economics, and favorable housing trends, positions Floor & Decor to deliver above-average growth over the long term.
Sarepta Therapeutics Inc. is a U.S. biotechnology company that develops therapies for rare neuromuscular diseases, with a particular focus on Duchenne muscular dystrophy (DMD). DMD is a deadly genetic disorder characterized by progressive and debilitating muscular weakness in boys, eventually leading to early adulthood death. Existing therapies only provide a marginal benefit in certain groups of patients, and we believe the huge amount of unmet need supports a multi-billion dollar addressable market for more effective treatments. Sarepta has a variety of DMD therapies in development, and the most compelling of these assets, in our view, is its lead microdystrophin gene therapy. While the company already offers an approved drug for a small subset of DMD patients, we believe this newer gene-therapy approach will offer dramatically better efficacy and address significantly more patients. This view is based on proof-of-concept data that we find highly compelling. Beyond this single microdystrophin development program, Sarepta’s pipeline also includes a number of other drugs, with additional opportunities in DMD from RNA-targeting (or “exon-skipping”) treatments—supported by close to 10 years of proprietary exon-skipping research—and earlier-stage gene-therapy programs for other rare genetic diseases beyond DMD. The breadth of Sarepta’s gene-therapy development efforts and its encouraging progress in this area thus far have been enabled by management’s highly proactive and prolific partnering strategy, which we believe has attracted some of the top scientific minds from this emerging field. We suspect that many more diseases will be successfully addressed by gene therapy longer term, and believe that Sarepta is well positioned to benefit through its early innovation and large team of scientific leaders.
We sold Under Armour Inc. as both industry and company-specific factors negatively affected the share price over the past 12 months. We believe Under Armour will fix many of its issues over time, and will retain its status as a leading sports apparel brand. However, we believe execution on the company’s strategic initiatives could be challenging, and may take longer to materialize than we initially thought. Given these execution challenges, we decided it was prudent to exit.
We sold Snap Inc. after losing conviction in its ability to meaningfully grow its user base, which was the key swing factor for our investment case. A pending user application redesign, along with stronger competition from the Facebook ecosystem, present significant challenges to user growth in our opinion, and we are not confident in Snap’s ability to successfully navigate these hurdles. We initially expected the intimate nature of Snap’s application to be a key differentiator, but we underestimated the effectiveness of Facebook’s Instagram Stories at copying some of Snap’s features and driving user engagement, thereby limiting Snap’s ability to expand beyond its core young millennial user base. Our small weight in Snap reflected this competitive risk from Facebook,
| 38 |
Management's Discussion of Fund Performance (Unaudited) (Continued)
as well as the operational risks associated with a young company early in its growth cycle. We continue to view Snap as a strategic social asset with a highly engaged user base—and will continue to monitor the company’s progress—but we no longer believe Snap meets our criteria as a leading growth business.
While we believe Lending Club Inc. is still a decent business with a novel method of distributing credit, it is no longer a strong fit with our six investment criteria. Over the past several quarters, the company has worked to heal itself from the control violations in May of 2016. However, loan growth recovery is slower than we expected, and we do not foresee revenue and earnings returning to the hyper-growth rates that we anticipated. Additionally, management turnover lowered our conviction in the company’s leadership. It appears to us that the new management team is less willing to be innovative, and therefore will be unable to accelerate growth in a meaningful way.
We sold Chipotle Mexican Grill Inc., which no longer fits our six investment criteria. While new initiatives may improve business results in the short term, we no longer view Chipotle as a leading growth franchise with a large competitive moat. Specifically, we lost conviction in its competitive advantage and industry leadership, and believe its current valuation is too high relative to its business risks and dwindling competitive advantages. Chipotle’s brand power diminished following its food safety issues over the past few years, and we believe that there is a high likelihood of another brand-tarnishing event. The company’s food manufacturing line allows Chipotle to serve fresh food on a large scale, but the company has struggled to regain customer affinity following brand-damaging incidents, rendering this manufacturing advantage much less relevant. Additionally, Chipotle’s leadership is limited to a very specific category of restaurants, and we do not expect meaningful share gains in the broader restaurant industry. We had originally expected the company to be successful with multiple formats over time, but those alternative formats are no longer likely to be material over our investment horizon. Finally, we believe the company’s current valuation, at a significant premium to other restaurants, does not reflect its business risks and weakened potential.
While we continue to view Biogen Inc. as a leading innovator in neurology drug innovation, the business has become more mature relative to other businesses in our opportunity set. We still believe the company’s developments in Alzheimer’s disease and other areas of neurology should add value over time. However, its large and slow-growing multiple sclerosis franchise dilutes the impact of future pipeline success, in our opinion. With an unconstrained mandate to own what we think are the 20 to 30 best growth businesses in the U.S., we believe our shareholders are better served by our investing in businesses that we view as stronger fits with our investment criteria.
We sold Baidu Inc. following the resignation announcement of the company’s chief operating officer, Qi Lu. We believe Baidu is losing the key employee who orchestrated the positive strategy, product, and execution changes over the past 18 months, so its longer-term trajectory is now more uncertain, especially in the burgeoning field of artificial intelligence. We expect the company to deliver solid results in the near term, building on the momentum from Qi’s improvements, and given that internet search is a highly defensible business model. Longer term, however, we are concerned that artificial intelligence initiatives—such as autonomous vehicles and voice—will fall short due to lack of talent. Additionally, the company may need to implement a broad-based wage increase to mitigate employee turnover, which would pressure margins. Given the uncertain longer-term prospects, and the high bar for ADR ownership in the Fund’s portfolio, we decided to sell the business.
Our thesis for owning Starbucks was based on continued U.S. same-store-sales growth (SSSG), driven by digital marketing initiatives, and a long store-growth runway in China, where the opportunity is largely untapped. We believe the company has made significant progress in both countries, but is currently facing challenges that may hinder its ability to generate industry-leading growth. In the U.S., the company’s sluggish afternoon sales have weighed on SSSG, and management reduced store-growth guidance. In China, heavy competitor discounting pressured comparable sales. We believe this promotional environment is unsustainable, and that Starbucks should continue to benefit from rising coffee consumption in China over the longer term. Overall,
| 39 |
Management's Discussion of Fund Performance (Unaudited) (Continued)
we continue to view Starbucks as a leading global business. However, given our highly concentrated approach to invest in what we believe are the best businesses positioned for long-term, above-average growth, we decided it was prudent to sell Starbucks and reinvest into younger growth businesses.
The rationale behind the sale of Incyte is described at the beginning of the Portfolio Review section.
Outlook
We view secular trends, innovation, and company-specific competitive advantages as key to driving growth through a variety of economic environments. For a business to possess the above-average earnings growth potential we require, it is often a key innovator or vital facilitator within an attractive industry that is benefiting from positive secular change. Secular trends are distinct from short-term economic factors as they tend to persist through market cycles and can provide powerful structural tailwinds that enhance the sustainability of a business’s growth for many years. We believe our long-term investment horizon allows us to capture the benefit of these characteristics and realize the ultimate earnings power of a company, while weathering volatility over shorter periods. Furthermore, our approach—active, concentrated, and benchmark-agnostic—enables us to have outsized exposure to companies within this sphere that we believe are the best fits with our six investment criteria.
We believe the majority of businesses in the Fund’s portfolio benefit from one or more secular trends. However, we have identified four broad trends that together comprise a majority of the Fund’s portfolio:
Retail Revolution: E-Commerce
E-Commerce is the fastest growing segment of retail sales, but only accounts for about seven percent of the total worldwide retail market. As a proportion of total retail sales, ecommerce is expected to nearly double by 2019. Brands now have the ability to directly interact with consumers through novel mediums, such as social media and lifestyle apps, and become embedded in their daily routines. Tools such as Amazon Prime and Visa Checkout reduce the friction associated with online payment. Portfolio beneficiaries include Alibaba Group Holding Ltd., Amazon.com Inc., Booking Holdings Inc., and Visa Inc..
Union of Healthcare and Technology
Major areas of unmet need continue to exist in the treatment of disease. However, improved understanding of disease biology and new approaches to treatment are enabling more productive drug development. Additionally, we expect genomic sequencing and health care information systems to facilitate precision medicine, enabling physicians to provide more targeted care. We are also witnessing the rise of minimally invasive surgical technologies, which have quality of life advantages for the patient and efficiency benefits for providers, leading them to increasingly become the standard of care. Portfolio beneficiaries include Alexion Pharmaceuticals Inc., BioMarin Pharmaceutical Inc., Edwards Lifesciences Corp., Illumina Inc., Regeneron Pharmaceuticals Inc., and Sarepta Therapeutics.
Software-as-a-Service (SaaS)
In our view, information technology spending is shifting toward innovations that make enterprises more agile and efficient. Cloud-based software is a key facilitator of this shift. Fast deployment, scalability, easy and frequent updates, and lower total cost of ownership create a compelling customer value proposition. SaaS businesses tend to benefit from revenue visibility, “sticky” clientele, margin leverage opportunities, and low customer acquisition costs. Portfolio beneficiaries include Adobe Systems Inc., Amazon.com Inc., Palo Alto Networks Inc., Salesforce.com Inc., ServiceNow Inc., and Splunk Inc.
Data-Driven Decision Making
We believe companies with large, proprietary pools of consumer data and tools that use this data to create unique content have sizable monetization opportunities. Advertising is already well on its way toward transformation, as access to consumer data is enabling companies to create targeted, more effective ads. At the micro level,
| 40 |
Management's Discussion of Fund Performance (Unaudited) (Continued)
companies are beginning to use predictive analytics to generate insights from their own pools of data. Portfolio beneficiaries include Alphabet Inc., Facebook Inc., Netflix Inc., Splunk Inc., and Workday Inc..
In a volatile market, stock prices tend to move together as a group, which can result in a disconnection between valuations and long-term growth prospects. When volatility is driven by fear, investors’ time horizons tend to shorten, and fast-growing, disruptive companies that are investing in their growth, and therefore unlikely to realize their full potential for years (i.e., the kinds of businesses we seek to own), often suffer from outsized pressure. During these periods, some investors appear inclined to trade a potentially larger long-term total return for the near-term surety of stable cash flows, dividends, and/or lower, more secure growth. Drug pipelines, potential new products, and other types of future optionality are often ignored. A company that is under-earning its full potential today in order to become larger tomorrow can suddenly be viewed as less valuable than one that is growing more slowly, further along the maturity curve, and not investing in its own growth.
We believe the Fund owns companies that are positioned to deliver strong business results and earnings growth over our five- to ten-year investment horizon. Our focus on the sustainability of a business’s future earnings growth typically steers us toward companies we believe are benefiting from secular trends that should provide powerful growth tailwinds throughout economic cycles. We have high conviction in the long-term growth estimates for the Fund portfolio’s companies and believe they can deliver the growth necessary to support above average relative and absolute returns over the next several years.
The Fund’s sector allocations are a byproduct of our bottom-up, fundamental approach. Our six investment criteria typically lead us to innovative businesses that are creating new or disrupting existing markets, and/or benefiting from powerful secular tailwinds. Our approach to investment research, portfolio construction, and risk management results in a portfolio that we believe is naturally diversified across industries and businesses at different stages of their respective growth lifecycles. We expect to continue to have higher weights in key growth sectors, including consumer, life sciences, and technology, and lower weights in highly-cyclical sectors such as energy, industrials, and financials.
| 41 |
Management's Discussion of Fund Performance (Unaudited) (Continued)
Comparison of the Change in Value of a $10,000 Investment in the
Touchstone Sands Capital Select Growth Fund - Class A* and the Russell 1000® Growth Index
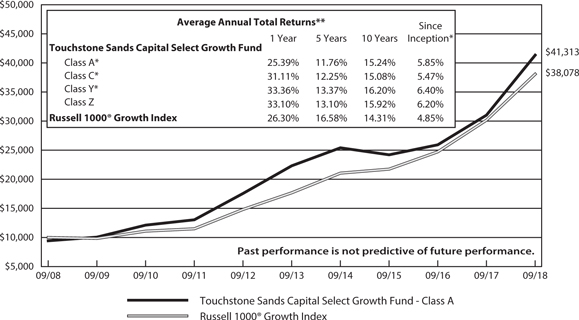
| * | The chart above represents performance of Class A shares only, which will vary from the performance of Class C shares, Class Y shares and Class Z shares based on the differences in sales loads and fees paid by shareholders in the different classes. The inception date of Class A shares, Class C shares, Class Y shares and Class Z shares was November 15, 2010, November 15, 2010, August 27, 2004 and August 11, 2000, respectively. Class A shares', Class C shares' and Class Y shares' performance was calculated using the historical performance of Class Z shares for the periods prior to November 15, 2010, November 15, 2010 and August 27, 2004, respectively. The returns have been restated for sales loads and fees applicable to Class A, Class C and Class Y shares. The returns of the index listed above are based on the inception date of the Fund. |
| ** | The average annual total returns shown above are adjusted for maximum sales loads and fees, if applicable. Effective August 17, 2018, the maximum offering price per share of Class A shares is equal to the net asset value (“NAV”) per share plus a sales load equal to 5.26% of the NAV (or 5.00% of the offering price). Prior to August 17, 2018, the maximum offering price per share of Class A shares was equal to the NAV per share plus a sales load equal to 6.10% of the NAV (or 5.75% of the offering price). Class C shares are subject to a contingent deferred sales charge (“CDSC”) of 1.00%. The CDSC will be assessed on an amount equal to the lesser of (1) the NAV at the time of purchase of the shares being redeemed or (2) the NAV of such shares being redeemed, if redeemed within a one-year period from the date of purchase. Class Y shares and Class Z shares are not subject to sales charges. |
The performance of the above Fund does not reflect the deduction of taxes that a shareholder would pay on Fund distributions or the redemption of Fund shares.
Notes to Chart
Russell 1000® Growth Index measures the performance of those Russell 1000 companies with higher price-to-book ratios and higher forecasted growth values.
The Frank Russell Company (FRC) is the source and owner of the data contained or reflected in this material and all trademarks and copyrights related thereto. The material may contain confidential information and unauthorized use, disclosure, copying, dissemination or redistribution is strictly prohibited. This is a Touchstone Investments presentation of the data, and FRC is not responsible for the formatting or configuration of this material or for any inaccuracy in the presentation thereof.
| 42 |
Management's Discussion of Fund Performance (Unaudited)
Touchstone Small Cap Fund
Sub-Advised by The London Company
Investment Philosophy
The Touchstone Small Cap Fund seeks capital appreciation by investing primarily in common stocks of U.S. companies with small market capitalizations. The Fund utilizes a bottom-up security selection process that screens potential investments against a proprietary quantitative model for return on capital, earnings-to-enterprise value ratio, and free cash flow yield.
Fund Performance
The Touchstone Small Cap Fund (Class A shares) underperformed its benchmark, the Russell 2000® Index, for the 12-month period ended September 30, 2018. The Fund’s total return was 12.14 percent (calculated excluding the maximum sales charge) while the benchmark’s total return was 15.24 percent.
Market Environment
U.S. stocks posted positive results driven by strong economic news, solid corporate earnings, and the benefit of individual and corporate tax reductions that took effect at the beginning of 2018. The markets experienced greater volatility and the pace of inflation picked up, but there were few signs of significant pricing pressures. The U.S. Federal Reserve Board (Fed) increased the federal funds rate by 25 basis points four times during the period. Expectations for firming inflation and higher growth, along with balance sheet normalization from the Fed, contributed to higher longer-term rates.
While economic data was mostly positive, there were areas of potential concern, including housing and the impact of tariffs. Housing construction was limited by both supply and demand constraints. While housing starts and existing home sales were relatively stable, growth was limited. The lack of housing supply and rising input costs had a negative impact on the supply side while higher interest rates caused limited demand.
Portfolio Review
The Fund’s stock selection positively impacted relative performance, while sector allocation detracted from returns. At the sector level, an underweight to the Health Care and Information Technology sectors, and an overweight to the Materials sector, were headwinds to performance. Conversely, an overweight to the Consumer Discretionary sector and an underweight to the Financials sector were slight positives for returns during the period.
Among the individual stocks that contributed to Fund performance were DST Systems Inc. (Information Technology sector), Ingevity Corp. (Materials sector), GATX Corp., USG Corp. and Armstrong World Industries Inc. (all three from the Industrials sector). DST Systems is a provider of software for the financial services industry. The stock rallied after SS&C Technologies Inc. announced plans to acquire the company in an all-cash transaction. Ingevity, a manufacturer of specialty chemicals and carbon materials, outperformed as a result of strong quarterly results during the period. Within the company’s Performance Chemical segment, the acquisition of Georgia-Pacific LLC and related crude tall oil supply commitments allowed for solid margin expansion. The company’s Performance Material segment continued to benefit from increased regulations around the world requiring their patent-protected carbon filter products. GATX, a railcar leasing company, was strong due to improved Industrial activity and signs of a slowly improving railcar leasing market. Additionally, the North American rail industry showed favorable trends, including increased railroad car loadings and relatively slower railroad velocity year over year. Despite the oversupply of railcars during this cycle, GATX was successful with renewals and long-term contracts. The company was also successful at managing risk during this cycle. USG is a manufacturer of construction materials, most notably drywall and joint compound. The stock outperformed due to a buyout offer made by Germany-based
| 43 |
Management's Discussion of Fund Performance (Unaudited) (Continued)
Knauf KG in an all-cash transaction. The deal is expected to close in early 2019. Armstrong World Industries, a manufacturer of walls and ceilings, continued to execute well as a result of steady commercial activity and strong pricing power. Recently, hurricane damage in the U.S. led to increased demand. The company also sold its lower margin international business which should benefit margins in the future.
Among the individual stocks that detracted from performance were Alexander & Baldwin Inc. (Real Estate sector), GCP Applied Technologies Inc., NewMarket Corp. (both from the Materials sector), PriceSmart Inc. (Consumer Staples sector) and Cooper Tire & Rubber Co. (Consumer Discretionary sector). Alexander & Baldwin owns and operates real estate properties in Hawaii. The stock declined due to the company’s recent conversion to a real estate investment trust (REIT) and the impact of rising rates on the sector. The company’s Grace Pacific Corp. division posted weaker than expected results which also impacted the stock. However, we remain attracted to the company’s land holdings and its competitive positioning in the Hawaiian market. GCP Applied Technologies is a provider of specialty construction chemicals, building materials and packaging technologies. The stock declined as higher raw material inflation weighed on gross margins and cash flows. While inflation may weigh on earnings in the short term, GCP recently announced price increases and decided to exit underperforming markets, which should benefit the company in the long term. Further, we are encouraged by the company’s relatively clean balance sheet, recently restructured debt and market-leading positions in specialty concrete chemicals and building materials. NewMarket, a petroleum additives company, declined during the period as higher raw material costs and lower pricing were headwinds to performance. We remain attracted to the company’s stable revenue outlook, pricing power in a consolidated industry and excellent history of capital allocation. PriceSmart, a membership warehouse club, was volatile during the year, with weakness concentrated in its fiscal third quarter. The company’s lower than expected earnings were driven by higher costs related to its acquisition of Aeropost Inc. The stock was also negatively impacted by downward estimate revisions reflecting expectations of higher expenses as the company invests in its omni-channel approach. We remain attracted to the company’s differentiated store format, stability of income from membership fees, and solid balance sheet. Cooper Tire & Rubber, a tire manufacturer, was weak early in the year as pricing pressures in the industry negatively impacted profitability. As such, we exited the stock.
The Fund initiated new positions in MSG Networks Inc. (Communication Services sector), Versum Materials Inc. (Information Technology sector), GCP Applied Technologies Inc. (Materials sector), Union Bankshares Corp. (Financials sector), Masonite International Corp. (Industrials sector), LCI Industries Inc. and Adient PLC (both from the Consumer Discretionary sector). MSG Networks owns multiple regional sports networks with long-term contracts covering the major sports teams in the New York City area. Specifically, the company has the rights to broadcast the Knicks (NBA), Rangers (NHL), Islanders (NHL), Devils (NHL) and Liberty (WNBA) games. MSG Networks generates high returns on capital and operating margins with minimal capital spending needs, resulting in significant cash flow. Versum is an electronics materials company in an industry with high barriers to entry, few competitors, and high switching costs. The company’s operating margins have increased substantially and its cash generation remains strong. Versum has also de-levered, which provides opportunities to allocate capital back to shareholders or engage in value additive deals. GCP Applied Technologies provides products and technology solutions for customers in the specialty construction chemicals and building materials industries. A majority of company sales comes from its Specialty Construction Chemicals segment, which is one of the leading producers of cement additives and concrete admixtures. This business is expected to grow beyond the forecasted global construction outlook as emerging market penetration for ready-mix concrete increases. The remaining sales are generated from its Specialty Building Materials segment, which is a collection of specialty niche products including building envelope products that are used in commercial construction to prevent water, vapor and air from infiltrating the building. This segment has benefited from increased urbanization and increased construction sophistication and codes in emerging markets. Union Bankshares, a large regional bank headquartered in Virginia, was added because of the company’s conservative underwriting culture and low-cost deposit base. Return on equity has improved in recent years and we believe returns could continue to improve, especially if
| 44 |
Management's Discussion of Fund Performance (Unaudited) (Continued)
rates increase, which should lead to higher net interest margin. Masonite International is a leading manufacturer of interior and exterior doors with a sizable market share. While the market has consolidated in recent years to two major players, we believe this bodes well for Masonite’s future pricing and returns. LCI Industries is a well-managed company with leading market share in the recreational vehicle (RV) manufacturing industry. LCI’s high market share allows the company to achieve industry-leading margins and a high return on invested capital. The company also has a strong balance sheet, and we believe it is a good candidate for balance sheet optimization. Adient is a supplier of auto seating, with an attractive global market share. The business operates in an oligopoly with two main competitors.
The Fund sold its positions in CooperTire & Rubber Co. and Deckers Outdoor Corp. (both from the Consumer Discretionary sector), and received cash for its position in Orbital ATK Inc. (Industrials sector) after the company was acquired by Northrup Grumman Corp. The Fund trimmed its positions in Olin Corp. (Materials sector) and Service Corp. International (Consumer Discretionary sector).
Outlook
The combination of solid economic growth, low inflation and relatively low interest rates usually creates a positive environment for stocks. We believe this holds true today, but there are risks. In our opinion, we believe potential risks include relatively high valuations for stocks using traditional metrics, rising inflation, the impact of increasing tariffs, or the Fed taking a more aggressive stance. We believe the risks and rewards are somewhat balanced as they relate to stocks overall, but we remain cautious and focused on limiting the downside.
Going forward, we believe the attractive candidates we are vetting today are a result of what the market is providing, and is consistent with our general outlook. Specifically, we believe downside risk can be mitigated by remaining focused on those companies with pricing power, copious cash generation and prudent capital allocation. We seek companies with strong return on capital and sustainable competitive advantages. We remain attracted to the capital metric because it speaks to the ability of the company to generate cash, which is ultimately what lowers risk. We also tend to be attracted to businesses that are overcapitalized and under-levered. We believe an under-levered company has more options available to it if the economy falls into a recession, including changing its capital structure to lower its overall cost of capital.
We believe the Fund is positioned well based on the strength of the companies we own and the overall valuation of the Fund’s portfolio. While the market is not considered cheap and we could certainly see a pullback and/or greater volatility in the near future, it is difficult to predict when we will experience the next downturn.
| 45 |
Management's Discussion of Fund Performance (Unaudited) (Continued)
Comparison of the Change in Value of a $10,000 Investment in the
Touchstone Small Cap Fund - Class A* and the
Russell 2000® Index

| * | The chart above represents performance of Class A shares only, which will vary from the performance of Class C shares, Class Y shares and Institutional Class shares based on the differences in sales loads and fees paid by shareholders in the different classes. The inception date of the Fund was September 30, 2009. The returns of the index listed above are based on the inception date of the Fund. |
| ** | The average annual total returns shown above are adjusted for maximum sales loads and fees, if applicable. Effective August 17, 2018, the maximum offering price per share of Class A shares is equal to the net assets value (“NAV”) per share plus a sales load equal to 5.26% of the NAV (or 5.00% of the offering price). Prior to August 17, 2018, the maximum offering price per share of Class A shares was equal to the NAV per share plus a sales load equal to 6.10% of the NAV (or 5.75% of the offering price). Class C shares are subject to a contingent deferred sales charge (“CDSC”) of 1.00%. The CDSC will be assessed on an amount equal to the lesser of (1) the NAV at the time of purchase of the shares being redeemed or (2) the NAV of such shares being redeemed, if redeemed within a one-year period from the date of purchase. Class Y shares and Institutional Class shares are not subject to sales charges. |
The performance of the above Fund does not reflect the deduction of taxes that a shareholder would pay on Fund distributions or the redemption of Fund shares.
Notes to Chart
Russell 2000® Index measures the performance of the small-cap segment of the U.S. equity universe.
The Frank Russell Company (FRC) is the source and owner of the data contained or reflected in this material and all trademarks and copyrights related thereto. The material may contain confidential information and unauthorized use, disclosure, copying, dissemination or redistribution is strictly prohibited. This is a Touchstone Investments presentation of the data, and FRC is not responsible for the formatting or configuration of this material or for any inaccuracy in the presentation thereof.
| 46 |
Management's Discussion of Fund Performance (Unaudited)
Touchstone Small Cap Value Fund
Sub-Advised by LMCG Investments, LLC
Investment Philosophy
The Touchstone Small Cap Value Fund seeks long-term capital growth by investing primarily in common stocks of small capitalization companies. The Fund seeks to identify companies believed to be selling at a discount to their intrinsic value.
Fund Performance
The Touchstone Small Cap Value Fund (Class A shares) underperformed its benchmark, the Russell 2000® Value Index, for the 12-month period ended September 30, 2018. The Fund’s total return was 7.12 percent (calculated excluding the maximum sales charge) while the benchmark’s total return was 9.33 percent.
Market Environment
Within U.S. small-capitalization stocks, growth stocks outperformed value stocks. Additionally, the market environment favored stocks with higher earnings growth, lower sales growth and higher beta1. The Financials and Industrials sectors were the top contributors to benchmark performance during the quarter, while the Consumer Staples sector detracted the most.
Portfolio Review
During the 12-month period, the Fund’s strongest contributors by sector were Industrials, Financials, Real Estate and Communication Services. The primary detractors by sector were Consumer Staples and Consumer Discretionary. Stock selection was the primary driver of underperformance for the period. From a factor perspective, the market environment negatively impacted the Fund as momentum characteristics and higher valuations were headwinds.
The Fund was negatively impacted by an overweight position and stock selection in the Consumer Staples sector, particularly in food products companies. The Hain Celestial Group Inc., TreeHouse Foods Inc. and Hostess Brands Inc. were notable detractors during the period. Poor volumes recently have hampered the food and personal products space, and many Consumer Staples companies have continued to face headwinds from freight and other material costs.
Within the Consumer Discretionary sector, stock-specific issues surrounding Horizon Global Corp., Del Frisco’s Restaurant Group and The Michael Companies, Inc. weighed on Fund performance. Horizon Global is a producer of towing, trailering cargo management and accessory products related to the automotive markets. The stock declined as core profitability fell short of expectations. In particular, customers reduced inventories, and operational difficulties surrounding a transition to a new distribution facility surfaced. A change in CEO and a push from an activist investor refocused management’s decision making and operating execution, which we believe should bode well for the company going forward. Michaels Cos., an arts and craft retailer, declined after management chose to reinvest a portion of the company’s tax savings back into the business instead of passing it through to the bottom line. Del Frisco, a steakhouse restaurant chain, stumbled upon the acquisition of the Barteca Restaurant Group, the owner of the Barcelona Wine Bar and Bartaco concepts, which sent the stock lower. Looking ahead, we believe all of these issues surrounding the aforementioned stocks are transitory and the Fund continues to hold these positions.
Within the Health Care sector, the Fund’s strength in the healthcare providers segment was offset by stock selection in the pharmaceuticals segment. This, combined with a lack of exposure to health care equipment and biotechnology companies, detracted from Fund performance. Patterson Cos. Inc., a provider of services
| 47 |
Management's Discussion of Fund Performance (Unaudited) (Continued)
and technologies to the dental and animal health markets detracted from performance during the period. The company reduced guidance while in the final stages of significant improvements to its operations and distribution. We believe that once these transitory issues are resolved, Patterson will emerge with cutting-edge operations and a more efficient and productive sales force.
During the period, stock selection in the Energy sector detracted from relative returns as did an underweight to that sector. Within the Materials sector, stock selection and an overweight to the chemicals industry detracted from performance.
Stock selection, along with an overweight position within the Industrials sector contributed to performance. Team Inc., an engineering services company, moved higher following better than expected results, strong bookings and a potential inflection in refinery spending due to higher oil prices. The company’s restructuring and cost reduction plan seemed to be on track as well. Korn/Ferry International, an executive recruiter and consultant, contributed due to solid execution and market share gains with a positive environmental backdrop.
Within the Financials sector, stock selection in the insurance segment was strong and was led by National General Holdings Corp., TCF Financial Corp., Validus Holdings Ltd. and The Hanover Insurance Group Inc. The Fund’s lack of exposure to thrifts and an underweight to real estate investment trusts (REITs) also benefited Fund performance. Stock selection in the Communications Services sector, particularly in media companies, benefited returns.
The Fund maintained an overweight to the Industrials, Materials, and Consumer Staples sectors, and an underweight to the Real Estate, Financials and Energy sectors.
Outlook
Looking ahead, our greatest concern is that the market environment will continue to reward growth and visibility, irrespective of valuation and quality. However, we will not deviate from our process of buying high-quality companies that are temporarily out of favor, and we believe that buying stocks, irrespective of valuation, is a risky strategy. We will continue to seek attractively valued investment opportunities with favorable risk-reward profiles.
The Fund utilizes a classic value-driven philosophy based on the belief that leading businesses selling at a discount to fair value have the potential to generate excess returns. The Fund’s strategy focuses on stocks that are temporarily out of favor in the market, specifically companies with higher returns on capital, free cash flow and strong balance sheets. Emphasis is placed on those companies having the cash flow characteristics as well as the balance sheet strength necessary to buffer the company from any prolonged weakness. While the companies we select often dominate a particular industry niche and generally have significant barriers to entry, we believe they are able to perpetuate a higher return on capital over time. The Fund’s overall investment process utilizes fundamental bottom-up security selection, while we believe risk-control measures ensure security and sector diversification.
1Beta is a measure of the volatility of a fund relative to its benchmark. The Beta of a benchmark is 1.00.
| 48 |
Management's Discussion of Fund Performance (Unaudited) (Continued)
Comparison of the Change in Value of a $10,000 Investment in the
Touchstone Small Cap Value Fund - Class A* and the
Russell 2000® Value Index
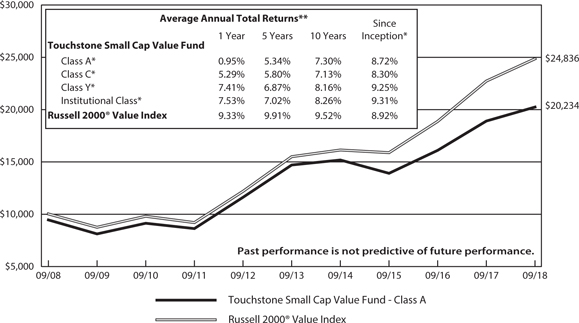
| * | The chart above represents performance of Class A shares only, which will vary from the performance of Class C shares, Class Y shares and Institutional Class shares based on the differences in sales loads and fees paid by shareholders in the different classes. The inception date of Class A shares, Class C shares, Class Y shares, Class Z shares and Institutional Class shares was March 1, 2011, March 1, 2011, March 1, 2011, March 4, 2002 and March 1, 2011, respectively. On June 10, 2011, Class Z shares were converted to Class A shares. Class A shares', Class C shares', Class Y shares' and Institutional Class shares' performance was calculated using the historical performance of Class Z shares for the periods prior to March 1, 2011. The returns have been restated for sales loads and fees applicable to Class A, Class C, Class Y and Institutional Class shares. The returns of the index listed above are based on the inception date of the Fund. |
| ** | The average annual total returns shown above are adjusted for maximum sales loads and fees, if applicable. Effective August 17, 2018, the maximum offering price per share of Class A shares is equal to the net assets value (“NAV”) per share plus a sales load equal to 5.26% of the NAV (or 5.00% of the offering price). Prior to August 17, 2018, the maximum offering price per share of Class A shares was equal to the NAV per share plus a sales load equal to 6.10% of the NAV (or 5.75% of the offering price). Class C shares are subject to a contingent deferred sales charge (“CDSC”) of 1.00%. The CDSC will be assessed on an amount equal to the lesser of (1) the NAV at the time of purchase of the shares being redeemed or (2) the NAV of such shares being redeemed, if redeemed within a one-year period from the date of purchase. Class Y shares and Institutional Class shares are not subject to sales charges. |
The performance of the above Fund does not reflect the deduction of taxes that a shareholder would pay on Fund distributions or the redemption of Fund shares.
Notes to Chart
Russell 2000® Value Index measures the performance of those Russell 2000 companies with lower price-to-book ratios and lower forecasted growth values.
The Frank Russell Company (FRC) is the source and owner of the data contained or reflected in this material and all trademarks and copyrights related thereto. The material may contain confidential information and unauthorized use, disclosure, copying, dissemination or redistribution is strictly prohibited. This is a Touchstone Investments presentation of the data, and FRC is not responsible for the formatting or configuration of this material or for any inaccuracy in the presentation thereof.
| 49 |
Management's Discussion of Fund Performance (Unaudited)
Touchstone Ultra Short Duration Fixed Income Fund
Sub-Advised by Fort Washington Investment Advisors, Inc.
Investment Philosophy
The Touchstone Ultra Short Duration Fixed Income Fund seeks maximum total return consistent with the preservation of capital by primarily investing in a diversified portfolio of fixed income securities of different maturities, including U.S. Treasury securities, U.S. government agency and U.S. government-sponsored enterprise securities, corporate bonds, mortgage-backed securities, commercial mortgage-backed securities, asset-backed securities, municipal bonds and cash equivalent securities including repurchase agreements and commercial paper. While the Fund may invest in securities of any maturity or duration, interest rate risk is managed by seeking to maintain an effective duration of one year or less under normal market conditions.
Fund Performance
The Touchstone Ultra Short Duration Fixed Income Fund (Class A shares) underperformed its first benchmark, the ICE BofA Merrill Lynch 3-Month U.S. Treasury Bill Index, but outperformed its second benchmark, the ICE BofA Merrill Lynch 1-Year U.S. Treasury Note Index, for the 12-month period ended September 30, 2018. The Fund’s total return was 1.50 percent (calculated excluding the maximum sales charge) while the total returns of its benchmarks were 1.59 percent and 1.08 percent, respectively.
Market Environment
The Fund’s fiscal year began with the passage of the Tax Cuts and Jobs Act of 2017 which reduced taxes for businesses and individuals, giving a boost to the U.S. economy that had been relatively stagnant for almost a decade. The new corporate tax rate buoyed business confidence, and incented wage growth and capital expenditures. This, combined with a synchronized global expansion, propelled equities to an all-time high in the fourth quarter of 2017.
Early in 2018, the January employment report showed an acceleration in wage growth. However, trade tensions escalated as the Trump administration placed duties on steel and aluminum, and tariffs on $50 billion worth of Chinese imports. The markets, fearing inflation, pushed interest rates higher and risk premiums wider. As such, during the first half of the Fund’s fiscal year, short-term interest rates moved higher and credit spreads widened. The S&P 500® Index also gave back virtually all of the increases it achieved as a result of the tax cuts.
These themes of strong domestic growth and trade tensions carried through the second half of the fiscal year. However, a byproduct of these themes – a strong U.S. dollar and weaker Chinese yuan – brought inflationary pressures to several Emerging Markets economies including Turkey, Brazil and Argentina. This resulted in broad-based weakness in Emerging Markets in general. Further, the eurozone, China and Japan all softened on trade-related concerns.
Against this backdrop, the U.S. economy continued to post strong results with an increase in gross domestic product (GDP) growth. Consumer and business confidence remained near cycle highs, unemployment was close to historic lows, and underlying consumer and business fundamentals remained strong. Interest rates continued to rise, while credit spreads reversed course and retraced most of their widening from earlier in the year.
Interest rates were a significant headwind during the fiscal year as short-term rates moved higher. Longer-term rates increased as well, but to a lesser degree. Risk assets, with the exception of Emerging Markets, generally performed well during the 12-month period. Equities posted solid outperformance, and credit spreads in most sectors were near the lower end of recent ranges. The U.S. Federal Reserve Board (Fed) raised the federal funds
| 50 |
Management's Discussion of Fund Performance (Unaudited) (Continued)
rate four times during the year, and signaled that it remains constructive on the outlook for the U.S. economy and is committed to additional rate hikes over the coming year.
Portfolio Review
Returns were primarily driven by the Fund’s favorable sector exposures. Consistent with its investment discipline and historical positioning, the Fund had limited exposure to government securities and maintained an emphasis on structured securities, such as Commercial Mortgage-Backed Securities (CMBS), Asset-Backed Securities (ABS) and Agency Mortgage-Backed Securities (MBS). This positioning benefited Fund performance, which was further bolstered by positive security selection. Given the substantive increase in interest rates the Fund also benefited from its overweight to higher spread assets combined with a short option adjusted duration, as well as an increased allocation to floating-rate securities.
The Fund’s sector allocations saw few meaningful changes during the fiscal year. Corporate Bond exposure increased earlier in the year due to technical weakness in the sector, then moderated to more normalized levels. The Fund maintained a significant allocation to ABS, as we believed the sector offered the most compelling combination of liquidity and spread. We increased the Fund’s CMBS exposure opportunistically midway through the year, as the sector’s high-quality, high-return assets were difficult to source. The Fund’s exposure to Agency MBS was historically low given the lack of value in that market, and we increased the Fund’s cash and equivalents during the period.
The Fund’s portfolio duration was near the lower end of the historical operating range and largely unchanged throughout most of the year. Duration positioning likely had little impact on Fund performance during the period. In our view, a relatively flat yield curve means there is little advantage to owning longer duration securities, particularly given their greater risk exposure in the event of increased inflation expectations or a steepening yield curve.
Outlook
In our view, the investment environment continues to favor an overweight to risk assets, supported by sound economic underpinnings: strong corporate profitability, a solid labor market, accommodative global central bank policies and neutral financial conditions. In addition, consumer credit fundamentals remain favorable and support the Fund’s exposure to structured products, many of which are backed by consumer receivables. Despite the favorable backdrop, we continue to closely monitor trade policy, inflation, and weakness in Emerging Markets and the eurozone. Trade policy has dominated headlines in recent months and is having a material impact on global growth expectations and currencies. Significant tariffs have already been levied by the U.S., with China responding in kind. And, with political relations continuing to deteriorate, both rhetoric and actions are expected to escalate into year-end. The effect on markets, particularly Emerging Markets, has caused market participants to question the potential for contagion. Inflation also remains a risk given the increasing strength of U.S. labor markets. In our view, credit spreads adequately reflect these risks.
It is difficult to predict changes in the level of interest rates, but the groundwork has been laid by the Fed to continue to raise short-term rates. We think there is still downside if inflation expectations increase and the market begins to believe that the Fed will aggressively raise interest rates to keep inflation in check. Consistent with market expectations, we believe the yield curve will continue to flatten and volatility will increase as well.
We believe the Fund is positioned well for this scenario. Duration is currently at the short end of its historical range, and credit quality is at the middle of its operating range. The Fund maintains an overweight to higher quality, non-government securities, as well as historically high exposure to floating-rate securities and continued low spread duration. This positioning reflects our constructive outlook for the U.S. economy, concern surrounding higher short-term rates, and our expectations for increased market volatility going forward.
| 51 |
Management's Discussion of Fund Performance (Unaudited) (Continued)
We remain most comfortable adding exposure to securities higher in the capital structure, (i.e., higher credit quality), but in less liquid parts of the market where additional yield can be found without taking on additional fundamental credit risk. Valuations in most sectors have returned to the full side of fair value and we believe they are likely to remain so in the near term.
| 52 |
Management's Discussion of Fund Performance (Unaudited) (Continued)
Comparison of the Change in Value of a $10,000 Investment in the
Touchstone Ultra Short Duration Fixed Income Fund - Class A*,
the ICE BofA Merrill Lynch 3-Month U.S. Treasury Bill Index
and the ICE BofA Merrill Lynch 1-Year U.S. Treasury Note Index
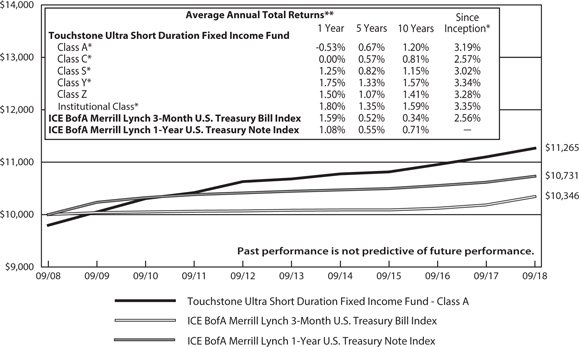
| * | The chart above represents performance of Class A shares only, which will vary from the performance of Class C shares, Class S shares, Class Y shares, Institutional Class shares and Class Z shares based on the differences in sales loads and fees paid by shareholders in the different classes. The inception date of Class A shares, Class C shares, Class S shares, Class Y shares, Class Z shares and Institutional Class shares was April 12, 2012, April 12, 2012, October 27, 2017, April 12, 2012, March 1, 1994 and April 12, 2012, respectively. Class A shares', Class C shares', Class S shares', Class Y shares' and Institutional Class shares' performance was calculated using the historical performance of Class Z shares for the periods prior to April 12, 2012, April 12, 2012, October 27, 2017, April 12, 2012 and April 12, 2012, respectively. The returns have been restated for sales loads and fees applicable to Class A, Class C, Class S, Class Y and Institutional Class shares. The returns of the indexes listed above are based on the inception date of the Fund. The launch date of the BofA Merrill Lynch 1-Year U.S Treasury Note Index was after the inception date of the Fund, therefore there is no return for inception. |
| ** | The average annual total returns shown above are adjusted for maximum sales loads and fees, if applicable. The maximum offering price per share of Class A shares is equal to the net asset value (“NAV”) per share plus a sales load equal to 2.04% of the NAV (or 2.00% of the offering price). Class C shares are subject to a contingent deferred sales charge (“CDSC”) of 1.00%. The CDSC will be assessed on an amount equal to the lesser of (1) the NAV at the time of purchase of the shares being redeemed or (2) the NAV of such shares being redeemed, if redeemed within a one-year period from the date of purchase. Class S shares, Class Y shares, Class Z shares and Institutional Class shares are not subject to sales charges. |
The performance of the above Fund does not reflect the deduction of taxes that a shareholder would pay on Fund distributions or the redemption of Fund shares.
Notes to Chart
ICE BofA Merrill Lynch 3-Month U.S. Treasury Bill Index is an unmanaged index of Treasury securities maturing in 90 days that assumes reinvestment of all income.
ICE BofA Merrill Lynch 1-Year U.S. Treasury Note Index is an unmanaged index comprised of a single issue purchased at the beginning of the month and held for a full month. The issue selected at each month-end rebalancing is the outstanding two-year Treasury Note Bill that matures closest to, but, not beyond one year from the rebalancing date.
| 53 |
Tabular Presentation of Portfolios of Investments (Unaudited)
September 30, 2018
The tables below provide each Fund’s geographic allocation, sector allocation and/or credit quality. We hope it will be useful to shareholders as it summarizes key information about each Fund’s investments.
| Touchstone Active Bond Fund | ||||
| Credit Quality* | (% of Investment Securities) | |||
| AAA/Aaa | 44.9 | % | ||
| AA/Aa | 4.7 | |||
| A/A | 13.9 | |||
| BBB/Baa | 27.6 | |||
| BB/Ba | 1.8 | |||
| B/B | 1.9 | |||
| CCC | 0.1 | |||
| Not Rated | 3.2 | |||
| Cash Equivalents | 1.9 | |||
| Total | 100.0 | % | ||
| Touchstone Arbitrage Fund | ||||
| Sector Allocation** | (% of Net Assets) | |||
| Long Positions | ||||
| Common Stocks | ||||
| Financials | 52.9 | % | ||
| Consumer Discretionary | 9.9 | |||
| Information Technology | 8.6 | |||
| Health Care | 8.0 | |||
| Energy | 6.6 | |||
| Real Estate | 6.4 | |||
| Industrials | 3.7 | |||
| Materials | 2.9 | |||
| Utilities | 2.2 | |||
| Corporate Bonds | 4.1 | |||
| Warrants | 1.6 | |||
| Exchange-Traded Funds | 0.2 | |||
| Rights | 0.1 | |||
| Purchased Call Options | 0.0 | |||
| Purchased Put Options | 0.0 | |||
| Short-Term Investment Funds | 0.2 | |||
| Cash Deposits held at Prime Broker for Securities Sold Short and Written Options | 8.7 | |||
| Other Assets/Liabilities (Net) | (0.7 | ) | ||
| 115.4 | ||||
| Short Positions | ||||
| Common Stocks | ||||
| Energy | (3.5 | ) | ||
| Consumer Discretionary | (3.3 | ) | ||
| Health Care | (2.0 | ) | ||
| Industrials | (1.2 | ) | ||
| Information Technology | (0.4 | ) | ||
| Exchange-Traded Funds | (5.0 | ) | ||
| Written Put Options | (0.0 | ) | ||
| (15.4 | ) | |||
| Total | 100.0 | % | ||
| * | Credit quality ratings are from Standard & Poor's (“S&P”) and Moody's Investors Service (“Moody's”). If agency ratings differ, the higher rating will be used. Where no rating has been assigned, it may be for reasons unrelated to the creditworthiness of the issuer. |
| ** | Sector Classifications are based upon the Global Industry Classification Standard (GICS®). |
| 54 |
Tabular Presentation of Portfolios of Investments (Unaudited) (Continued)
| Touchstone Emerging Markets Small Cap Fund | ||||
| Geographic Allocation | (% of Net Assets) | |||
| Common Stocks | ||||
| South Korea | 21.6 | % | ||
| Taiwan | 17.9 | |||
| India | 15.5 | |||
| China | 14.7 | |||
| Thailand | 8.3 | |||
| Brazil | 5.0 | |||
| South Africa | 4.9 | |||
| Mexico | 3.3 | |||
| Malaysia | 2.5 | |||
| Greece | 1.2 | |||
| Poland | 1.0 | |||
| Hong Kong | 0.9 | |||
| Hungary | 0.9 | |||
| Cyprus | 0.9 | |||
| Short-Term Investment Fund | 0.5 | |||
| Other Assets/Liabilities (Net) | 0.9 | |||
| Total | 100.0 | % | ||
| Touchstone High Yield Fund | ||||
| Credit Quality* (% of Investment Securities) | ||||
| BBB/Baa | 7.2 | % | ||
| BB/Ba | 55.0 | |||
| B/B | 35.0 | |||
| CCC | 2.4 | |||
| Cash equivalents | 0.4 | |||
| Total | 100.0 | % | ||
| Touchstone Impact Bond Fund | ||||
| Credit Quality* (% of Investment Securities) | ||||
| AAA/Aaa | 60.8 | % | ||
| AA/Aa | 7.3 | |||
| A/A | 11.8 | |||
| BBB/Baa | 12.6 | |||
| BB/Ba | 1.9 | |||
| CCC | 1.0 | |||
| Cash Equivalents | 4.6 | |||
| Total | 100.0 | % | ||
| * | Credit quality ratings are from Standard & Poor's (“S&P”) and Moody's Investors Service (“Moody's”). If agency ratings differ, the higher rating will be used. Where no rating has been assigned, it may be for reasons unrelated to the creditworthiness of the issuer. |
| 55 |
Tabular Presentation of Portfolios of Investments (Unaudited) (Continued)
| Touchstone Merger Arbitrage Fund | ||||
| Sector Allocation* | (% of Net Assets) | |||
| Long Positions | ||||
| Common Stocks | ||||
| Financials | 57.3 | % | ||
| Consumer Discretionary | 8.7 | |||
| Information Technology | 7.2 | |||
| Health Care | 7.1 | |||
| Energy | 5.9 | |||
| Real Estate | 4.6 | |||
| Industrials | 3.8 | |||
| Materials | 2.4 | |||
| Utilities | 1.7 | |||
| Corporate Bonds | 5.0 | |||
| Warrants | 1.7 | |||
| Exchange-Traded Funds | 0.2 | |||
| Rights | 0.1 | |||
| Purchased Call Options | 0.0 | |||
| Purchased Put Options | 0.0 | |||
| Short-Term Investment Funds | 13.3 | |||
| Other Assets/Liabilities (Net) | (5.1 | ) | ||
| 113.9 | ||||
| Short Positions | ||||
| Common Stocks | ||||
| Consumer Discretionary | (2.7 | ) | ||
| Energy | (2.5 | ) | ||
| Health Care | (1.4 | ) | ||
| Industrials | (0.8 | ) | ||
| Information Technology | (0.2 | ) | ||
| Exchange-Traded Funds | (6.3 | ) | ||
| Written Put Options | (0.0 | ) | ||
| (13.9 | ) | |||
| Total | 100.0 | % | ||
| Touchstone Mid Cap Fund | ||||
| Sector Allocation* | (% of Net Assets) | |||
| Consumer Discretionary | 21.2 | % | ||
| Industrials | 17.8 | |||
| Information Technology | 17.5 | |||
| Financials | 13.9 | |||
| Materials | 13.7 | |||
| Consumer Staples | 10.5 | |||
| Real Estate | 3.1 | |||
| Short-Term Investment Fund | 2.8 | |||
| Other Assets/Liabilities (Net) | (0.5 | ) | ||
| Total | 100.0 | % | ||
| Touchstone Mid Cap Value Fund | ||||
| Sector Allocation* | (% of Net Assets) | |||
| Financials | 15.4 | % | ||
| Industrials | 13.9 | |||
| Materials | 12.0 | |||
| Information Technology | 10.6 | |||
| Consumer Discretionary | 9.1 | |||
| Utilities | 8.5 | |||
| Real Estate | 8.0 | |||
| Energy | 7.5 | |||
| Consumer Staples | 7.2 | |||
| Health Care | 5.2 | |||
| Exchange-Traded Fund | 1.0 | |||
| Short-Term Investment Funds | 3.9 | |||
| Other Assets/Liabilities (Net) | (2.3 | ) | ||
| Total | 100.0 | % | ||
| * | Sector Classifications are based upon the Global Industry Classification Standard (GICS®). |
| 56 |
Tabular Presentation of Portfolios of Investments (Unaudited) (Continued)
| Touchstone Premium Yield Equity Fund | ||||
| Sector Allocation* | (% of Net Assets) | |||
| Financials | 23.4 | % | ||
| Information Technology | 23.1 | |||
| Energy | 12.2 | |||
| Consumer Discretionary | 6.7 | |||
| Real Estate | 6.2 | |||
| Materials | 5.6 | |||
| Utilities | 4.6 | |||
| Health Care | 3.7 | |||
| Telecommunication Services | 3.3 | |||
| Industrials | 3.0 | |||
| Exchange-Traded Fund | 4.9 | |||
| Short-Term Investment Funds | 0.8 | |||
| Other Assets/Liabilities (Net) | 2.5 | |||
| Total | 100.0 | % | ||
| Touchstone Small Cap Fund | ||||
| Sector Allocation* | (% of Net Assets) | |||
| Industrials | 30.4 | % | ||
| Consumer Discretionary | 18.1 | |||
| Materials | 15.5 | |||
| Financials | 10.3 | |||
| Real Estate | 8.3 | |||
| Consumer Staples | 7.1 | |||
| Information Technology | 3.9 | |||
| Energy | 2.2 | �� | ||
| Health Care | 1.6 | |||
| Short-Term Investment Funds | 5.3 | |||
| Other Assets/Liabilities (Net) | (2.7 | ) | ||
| Total | 100.0 | % | ||
| Touchstone Sands Capital Select Growth Fund | ||||
| Sector Allocation* | (% of Net Assets) | |||
| Information Technology | 50.0 | % | ||
| Consumer Discretionary | 20.3 | |||
| Health Care | 19.5 | |||
| Consumer Staples | 3.3 | |||
| Industrials | 2.7 | |||
| Financials | 2.4 | |||
| Short-Term Investment Fund | 2.0 | |||
| Other Assets/Liabilities (Net) | (0.2 | ) | ||
| Total | 100.0 | % | ||
| Touchstone Small Cap Value Fund | ||||
| Sector Allocation* | (% of Net Assets) | |||
| Industrials | 22.3 | % | ||
| Financials | 20.7 | |||
| Materials | 10.2 | |||
| Consumer Discretionary | 9.7 | |||
| Information Technology | 8.3 | |||
| Consumer Staples | 8.1 | |||
| Health Care | 4.7 | |||
| Utilities | 3.9 | |||
| Real Estate | 3.5 | |||
| Energy | 3.3 | |||
| Telecommunication Services | 0.8 | |||
| Exchange-Traded Fund | 1.2 | |||
| Short-Term Investment Funds | 8.0 | |||
| Other Assets/Liabilities (Net) | (4.7 | ) | ||
| Total | 100.0 | % | ||
| * | Sector Classifications are based upon the Global Industry Classification Standard (GICS®). |
| 57 |
Tabular Presentation of Portfolios of Investments (Unaudited) (Continued)
| Touchstone Ultra Short Duration Fixed Income Fund | ||||
| Credit Quality* (% of Investment Securities) | ||||
| AAA/Aaa | 35.8 | % | ||
| AA/Aa | 12.0 | |||
| A/A | 15.2 | |||
| BBB/Baa | 18.7 | |||
| CCC | 0.1 | |||
| Not Rated | 9.7 | |||
| Cash Equivalents | 8.5 | |||
| Total | 100.0 | % | ||
| * | Credit quality ratings are from Standard & Poor's (“S&P”) and Moody's Investors Service (“Moody's”). If agency ratings differ, the higher rating will be used. Where no rating has been assigned, it may be for reasons unrelated to the creditworthiness of the issuer. |
| 58 |
This page intentionally left blank.
Touchstone Active Bond Fund – September 30, 2018
| Principal | Market | |||||||
| Amount | Value | |||||||
| Corporate Bonds — 40.2% | ||||||||
| Financials — 11.5% | ||||||||
| $ | 1,388,000 | American Express Co., | ||||||
| 3.000%, 10/30/24 | $ | 1,325,822 | ||||||
| 1,094,000 | Bank of America Corp., | |||||||
| 3.705%, 4/24/28 | 1,053,066 | |||||||
| 1,660,000 | Bank of America Corp. MTN, | |||||||
| 4.000%, 1/22/25 | 1,638,191 | |||||||
| 1,470,000 | Bank of Montreal (Canada), | |||||||
| 3.803%, 12/15/32 | 1,373,480 | |||||||
| 1,498,000 | Bank of New York Mellon Corp. (The) | |||||||
| MTN, 2.950%, 1/29/23 | 1,461,284 | |||||||
| 535,000 | Bank of Nova Scotia (The), (Canada), | |||||||
| (3M LIBOR +0.620%), | ||||||||
| 2.959%, 9/19/22(A) | 538,008 | |||||||
| 1,315,000 | Barclays PLC (United Kingdom), | |||||||
| 3.250%, 1/12/21 | 1,297,275 | |||||||
| 1,466,000 | BB&T Corp. MTN, 2.850%, 10/26/24 | 1,402,793 | ||||||
| 710,000 | Chubb INA Holdings, Inc., | |||||||
| 4.350%, 11/3/45 | 725,081 | |||||||
| 1,015,000 | Citigroup, Inc., 3.300%, 4/27/25 | 974,908 | ||||||
| 617,000 | Citigroup, Inc., 4.750%, 5/18/46 | 601,839 | ||||||
| 865,000 | Credit Suisse AG (Switzerland) MTN, | |||||||
| 3.625%, 9/9/24 | 852,527 | |||||||
| 1,065,000 | Fifth Third Bancorp, 2.875%, 7/27/20 | 1,058,227 | ||||||
| 1,351,000 | GE Capital International Funding Co. | |||||||
| Unlimited Co. (Ireland), | ||||||||
| 4.418%, 11/15/35 | 1,271,500 | |||||||
| 1,200,000 | General Motors Financial Co., Inc., | |||||||
| 3.200%, 7/13/20 | 1,196,535 | |||||||
| 925,000 | General Motors Financial Co., Inc., | |||||||
| 3.200%, 7/6/21 | 913,433 | |||||||
| 1,600,000 | Goldman Sachs Group, Inc. (The), (3M | |||||||
| LIBOR +1.000%), 3.342%, 7/24/23(A) | 1,616,961 | |||||||
| 790,000 | Goldman Sachs Group, Inc. (The), | |||||||
| 3.691%, 6/5/28 | 751,891 | |||||||
| 1,040,000 | Goldman Sachs Group, Inc. (The), | |||||||
| 5.250%, 7/27/21 | 1,088,877 | |||||||
| 1,080,000 | HSBC Holdings PLC (United Kingdom), | |||||||
| 3.900%, 5/25/26 | 1,047,349 | |||||||
| 1,400,000 | Huntington Bancshares, Inc., | |||||||
| 4.000%, 5/15/25 | 1,397,617 | |||||||
| 950,000 | Huntington National Bank (The), | |||||||
| 2.200%, 11/6/18 | 949,716 | |||||||
| 1,230,000 | JPMorgan Chase & Co., (3M LIBOR | |||||||
| +0.730%), 3.077%, 4/23/24(A) | 1,224,456 | |||||||
| 805,000 | JPMorgan Chase & Co., | |||||||
| 3.250%, 9/23/22 | 797,882 | |||||||
| 1,575,000 | JPMorgan Chase & Co., | |||||||
| 3.509%, 1/23/29 | 1,491,831 | |||||||
| 1,534,000 | Lloyds Banking Group PLC (United | |||||||
| Kingdom), 3.574%, 11/7/28 | 1,405,140 | |||||||
| 1,350,000 | Morgan Stanley, 3.737%, 4/24/24 | 1,338,534 | ||||||
| 1,455,000 | Morgan Stanley, 3.950%, 4/23/27 | 1,396,527 | ||||||
| 1,100,000 | Northwestern Mutual Life Insurance | |||||||
| Co. (The), 144a, 3.850%, 9/30/47 | 1,008,134 | |||||||
| 1,130,000 | PNC Bank NA, 2.700%, 11/1/22 | 1,088,595 | ||||||
| 1,223,000 | Prudential Financial, Inc., | |||||||
| 5.625%, 6/15/43 | 1,274,978 | |||||||
| 1,552,000 | Royal Bank of Canada (Canada) MTN, | |||||||
| 3.200%, 4/30/21 | 1,549,141 | |||||||
| 1,380,000 | SL Green Operating Partnership LP, | |||||||
| 3.250%, 10/15/22 | 1,338,317 | |||||||
| 1,460,000 | SunTrust Banks, Inc., 4.000%, 5/1/25 | 1,463,646 | ||||||
| 800,000 | Wells Fargo & Co., 2.100%, 7/26/21 | 770,371 | ||||||
| 785,000 | Wells Fargo & Co., 4.125%, 8/15/23 | 794,585 | ||||||
| 41,478,517 | ||||||||
| Energy — 5.4% | ||||||||
| 882,000 | Boardwalk Pipelines LP, | |||||||
| 4.450%, 7/15/27 | 847,211 | |||||||
| 993,000 | Cenovus Energy, Inc. (Canada), | |||||||
| 4.250%, 4/15/27 | 959,884 | |||||||
| 1,280,000 | Cheniere Corpus Christi Holdings LLC, | |||||||
| 7.000%, 6/30/24 | 1,401,600 | |||||||
| 200,000 | CNOOC Finance 2011 Ltd. (British | |||||||
| Virgin Islands), 144a, | ||||||||
| 4.250%, 1/26/21 | 202,387 | |||||||
| 350,000 | CNOOC Nexen Finance 2014 ULC | |||||||
| (Canada), 4.250%, 4/30/24 | 353,058 | |||||||
| 1,046,000 | Columbia Pipeline Group, Inc., | |||||||
| 4.500%, 6/1/25 | 1,057,500 | |||||||
| 150,000 | Ecopetrol SA (Colombia), | |||||||
| 5.875%, 9/18/23 | 159,825 | |||||||
| 1,494,000 | Enbridge, Inc. (Canada), (3M LIBOR | |||||||
| +0.700%), 3.034%, 6/15/20(A) | 1,499,453 | |||||||
| 841,000 | Energy Transfer Partners LP, | |||||||
| 4.950%, 6/15/28 | 856,224 | |||||||
| 795,000 | EOG Resources, Inc., 3.900%, 4/1/35 | 776,012 | ||||||
| 200,000 | Harvest Operations Corp. (Canada), | |||||||
| 144a, 4.200%, 6/1/23 | 202,716 | |||||||
| 500,000 | KazMunayGas National Co. JSC | |||||||
| (Kazakhstan), 144a, 4.750%, 4/19/27 | 500,940 | |||||||
| 400,000 | KazMunayGas National Co. JSC | |||||||
| (Kazakhstan), 144a, 5.750%, 4/19/47 | 394,000 | |||||||
| 1,600,000 | Kinder Morgan Energy Partners LP, | |||||||
| 3.500%, 9/1/23 | 1,564,443 | |||||||
| 1,292,000 | Midcontinent Express Pipeline LLC, | |||||||
| 144a, 6.700%, 9/15/19 | 1,321,051 | |||||||
| 1,045,000 | NGPL PipeCo LLC, 144a, | |||||||
| 7.768%, 12/15/37 | 1,280,125 | |||||||
| 200,000 | Pertamina Persero PT, 144a, | |||||||
| 6.450%, 5/30/44 | 217,218 | |||||||
| 200,000 | Petrobras Global Finance BV | |||||||
| (Netherlands), 5.299%, 1/27/25 | 186,800 | |||||||
| 550,000 | Petrobras Global Finance BV | |||||||
| (Netherlands), 7.375%, 1/17/27 | 556,958 | |||||||
| 200,000 | Petroleos del Peru SA (Peru), 144a, | |||||||
| 4.750%, 6/19/32 | 193,840 | |||||||
| 200,000 | Petroleos del Peru SA (Peru), 144a, | |||||||
| 5.625%, 6/19/47 | 198,752 | |||||||
| 60 |
Touchstone Active Bond Fund (Continued)
| Principal | Market | |||||||
| Amount | Value | |||||||
| Corporate Bonds — 40.2% (Continued) | ||||||||
| Energy — (Continued) | ||||||||
| $ | 1,130,000 | Petroleos Mexicanos (Mexico), | ||||||
| 4.500%, 1/23/26 | $ | 1,056,550 | ||||||
| 200,000 | Petroleos Mexicanos (Mexico), | |||||||
| 4.875%, 1/18/24 | 199,200 | |||||||
| 250,000 | Petroleos Mexicanos (Mexico), | |||||||
| 5.500%, 1/21/21 | 257,978 | |||||||
| 200,000 | Petroleos Mexicanos (Mexico), | |||||||
| 6.375%, 1/23/45 | 185,200 | |||||||
| 265,000 | Petroleos Mexicanos (Mexico), 144a, | |||||||
| 6.350%, 2/12/48 | 242,740 | |||||||
| 2,338 | Transocean Phoenix 2 Ltd. (Cayman | |||||||
| Islands), 144a, 7.750%, 10/15/24 | 2,460 | |||||||
| 1,038,000 | Valero Energy Corp., 4.350%, 6/1/28 | 1,045,555 | ||||||
| 1,301,000 | Williams Cos., Inc. (The), | |||||||
| 3.700%, 1/15/23 | 1,287,457 | |||||||
| 350,000 | YPF SA (Argentina), 144a, | |||||||
| 6.950%, 7/21/27 | 306,145 | |||||||
| 19,313,282 | ||||||||
| Health Care — 3.6% | ||||||||
| 715,000 | Abbott Laboratories, | |||||||
| 3.750%, 11/30/26 | 712,994 | |||||||
| 1,162,000 | AbbVie, Inc., 4.450%, 5/14/46 | 1,068,181 | ||||||
| 795,000 | Allergan Funding SCS (Luxembourg), | |||||||
| 3.800%, 3/15/25 | 778,499 | |||||||
| 1,030,000 | Allergan Sales LLC, 144a, | |||||||
| 5.000%, 12/15/21 | 1,068,200 | |||||||
| 380,000 | Catholic Health Initiatives, | |||||||
| 4.200%, 8/1/23 | 382,655 | |||||||
| 952,000 | Celgene Corp., 5.000%, 8/15/45 | 946,062 | ||||||
| 1,630,000 | CVS Health Corp., 4.300%, 3/25/28 | 1,617,219 | ||||||
| 735,000 | CVS Health Corp., 5.125%, 7/20/45 | 755,606 | ||||||
| 1,016,000 | Express Scripts Holding Co., | |||||||
| 3.300%, 2/25/21 | 1,010,799 | |||||||
| 1,078,000 | Halfmoon Parent, Inc., 144a, | |||||||
| 4.375%, 10/15/28 | 1,074,860 | |||||||
| 426,000 | Shire Acquisitions Investments Ireland | |||||||
| DAC (Ireland), 2.400%, 9/23/21 | 411,468 | |||||||
| 966,000 | Thermo Fisher Scientific, Inc., | |||||||
| 3.600%, 8/15/21 | 969,175 | |||||||
| 1,584,000 | UnitedHealth Group, Inc., | |||||||
| 2.375%, 10/15/22 | 1,519,090 | |||||||
| 860,000 | Zimmer Biomet Holdings, Inc., | |||||||
| 3.150%, 4/1/22 | 842,382 | |||||||
| 13,157,190 | ||||||||
| Consumer Discretionary — 3.6% | ||||||||
| 1,391,000 | Anheuser-Busch InBev Finance, Inc., | |||||||
| 4.900%, 2/1/46 | 1,406,747 | |||||||
| 1,286,000 | Aptiv PLC (Jersey), 3.150%, 11/19/20 | 1,274,348 | ||||||
| 1,110,000 | AutoNation, Inc., 5.500%, 2/1/20 | 1,138,527 | ||||||
| 2,358,000 | BMW US Capital LLC, 144a, | |||||||
| 3.100%, 4/12/21 | 2,342,564 | |||||||
| 1,554,000 | Dollar Tree, Inc., (3M LIBOR +0.700%), | |||||||
| 3.036%, 4/17/20(A) | 1,556,362 | |||||||
| 711,000 | Ford Motor Co., 4.750%, 1/15/43 | 592,032 | ||||||
| 1,550,000 | Ford Motor Credit Co. LLC, | |||||||
| 4.140%, 2/15/23 | 1,524,677 | |||||||
| 555,000 | General Motors Financial Co., Inc., | |||||||
| 4.350%, 4/9/25 | 544,613 | |||||||
| 960,000 | Home Depot, Inc. (The), | |||||||
| 5.950%, 4/1/41 | 1,195,147 | |||||||
| 1,550,000 | Toyota Motor Credit Corp. MTN, | |||||||
| 2.950%, 4/13/21 | 1,542,896 | |||||||
| 13,117,913 | ||||||||
| Telecommunication Services — 3.3% | ||||||||
| 460,000 | AT&T, Inc., 3.950%, 1/15/25 | 452,913 | ||||||
| 275,000 | AT&T, Inc., 4.350%, 6/15/45 | 236,905 | ||||||
| 865,000 | AT&T, Inc., 4.500%, 5/15/35 | 808,139 | ||||||
| 1,516,000 | Booking Holdings, Inc., 3.600%, 6/1/26 | 1,470,738 | ||||||
| 1,159,000 | Charter Communications Operating | |||||||
| LLC / Charter Communications | ||||||||
| Operating Capital, | ||||||||
| 6.484%, 10/23/45 | 1,245,906 | |||||||
| 1,137,000 | Comcast Corp., 2.850%, 1/15/23 | 1,102,884 | ||||||
| 814,000 | Comcast Corp., 4.000%, 3/1/48 | 730,587 | ||||||
| 912,000 | Interpublic Group of Cos., Inc. (The), | |||||||
| 3.750%, 10/1/21 | 913,807 | |||||||
| 744,000 | Qwest Corp., 6.750%, 12/1/21 | 794,031 | ||||||
| 1,479,000 | Telecom Italia SpA/Milano (Italy), | |||||||
| 144a, 5.303%, 5/30/24 | 1,440,176 | |||||||
| 550,000 | Verizon Communications, Inc., | |||||||
| 4.672%, 3/15/55 | 517,062 | |||||||
| 886,000 | Verizon Communications, Inc., | |||||||
| 5.012%, 4/15/49 | 904,824 | |||||||
| 1,303,000 | Warner Media LLC, 3.800%, 2/15/27 | 1,246,397 | ||||||
| 11,864,369 | ||||||||
| Real Estate — 2.5% | ||||||||
| 1,540,000 | Boston Properties LP REIT, | |||||||
| 3.200%, 1/15/25 | 1,473,466 | |||||||
| 1,296,000 | Crown Castle International Corp., | |||||||
| 3.650%, 9/1/27 | 1,217,643 | |||||||
| 740,000 | Kimco Realty Corp. REIT, | |||||||
| 3.125%, 6/1/23 | 712,737 | |||||||
| 853,000 | Mid-America Apartments LP, | |||||||
| 3.750%, 6/15/24 | 835,880 | |||||||
| 1,410,000 | Sabra Health Care LP REIT, | |||||||
| 5.125%, 8/15/26 | 1,380,336 | |||||||
| 821,000 | Spirit Realty LP REIT, 4.450%, 9/15/26 | 787,039 | ||||||
| 1,666,000 | VEREIT Operating Partnership LP REIT, | |||||||
| 4.600%, 2/6/24 | 1,671,516 | |||||||
| 985,000 | Welltower, Inc. REIT, 4.250%, 4/1/26 | 981,892 | ||||||
| 9,060,509 | ||||||||
| Industrials — 2.5% | ||||||||
| 1,290,000 | Burlington Northern Santa Fe LLC, | |||||||
| 5.750%, 5/1/40 | 1,543,947 | |||||||
| 1,350,000 | CRH America Finance, Inc., 144a, | |||||||
| 4.500%, 4/4/48 | 1,238,571 | |||||||
| 1,420,000 | Eagle Materials, Inc., 4.500%, 8/1/26 | 1,417,065 | ||||||
| 61 |
Touchstone Active Bond Fund (Continued)
| Principal | Market | |||||||
| Amount | Value | |||||||
| Corporate Bonds — 40.2% (Continued) | ||||||||
| Industrials — (Continued) | ||||||||
| $ | 587,000 | Embraer Netherlands Finance BV | ||||||
| (Netherlands), 5.050%, 6/15/25 | $ | 589,207 | ||||||
| 789,000 | Embraer Netherlands Finance BV | |||||||
| (Netherlands), 5.400%, 2/1/27 | 804,780 | |||||||
| 930,000 | FedEx Corp., 5.100%, 1/15/44 | 968,663 | ||||||
| 334,000 | SBA Tower Trust, 144a, | |||||||
| 2.898%, 10/15/19 | 333,329 | |||||||
| 375,000 | Transnet SOC Ltd. (South Africa), 144a, | |||||||
| 4.000%, 7/26/22 | 351,562 | |||||||
| 280,000 | Vulcan Materials Co., 4.500%, 4/1/25 | 280,695 | ||||||
| 1,400,000 | Wabtec Corp., 4.700%, 9/15/28 | 1,377,817 | ||||||
| 8,905,636 | ||||||||
| Information Technology — 2.3% | ||||||||
| 1,750,000 | Apple, Inc., 2.750%, 1/13/25 | 1,676,591 | ||||||
| 1,303,000 | Apple, Inc., 4.650%, 2/23/46 | 1,407,681 | ||||||
| 1,327,000 | Dell International LLC / EMC Corp., | |||||||
| 144a, 6.020%, 6/15/26 | 1,418,341 | |||||||
| 650,000 | Microsoft Corp., 3.500%, 2/12/35 | 626,999 | ||||||
| 1,073,000 | Oracle Corp., 2.650%, 7/15/26 | 995,881 | ||||||
| 1,400,000 | QUALCOMM, Inc., 3.450%, 5/20/25 | 1,358,166 | ||||||
| 935,000 | Visa, Inc., 4.150%, 12/14/35 | 965,357 | ||||||
| 8,449,016 | ||||||||
| Consumer Staples — 2.3% | ||||||||
| 1,570,000 | Cargill, Inc., 144a, 3.050%, 4/19/21 | 1,558,777 | ||||||
| 1,340,000 | Grupo Bimbo SAB de CV (Mexico), | |||||||
| 144a, 4.500%, 1/25/22 | 1,370,990 | |||||||
| 1,525,000 | Imperial Brands Finance PLC (United | |||||||
| Kingdom), 144a, 4.250%, 7/21/25 | 1,512,616 | |||||||
| 200,000 | JBS USA LUX SA / JBS USA Finance, | |||||||
| Inc., 144a, 6.750%, 2/15/28 | 198,750 | |||||||
| 810,000 | Kraft Heinz Foods Co., 6.875%, 1/26/39 | 946,422 | ||||||
| 435,000 | Kroger Co. (The), 5.000%, 4/15/42 | 430,674 | ||||||
| 591,000 | Moody's Corp., 2.750%, 12/15/21 | 578,020 | ||||||
| 1,114,000 | Reynolds American, Inc., | |||||||
| 4.450%, 6/12/25 | 1,122,210 | |||||||
| 678,000 | Tyson Foods, Inc., 3.900%, 9/28/23 | 680,667 | ||||||
| 8,399,126 | ||||||||
| Utilities — 1.9% | ||||||||
| 1,342,000 | DTE Energy Co., 3.700%, 8/1/23 | 1,339,747 | ||||||
| 700,000 | Duke Energy Progress LLC, | |||||||
| 4.150%, 12/1/44 | 683,478 | |||||||
| 1,004,000 | Fortis, Inc., (Canada), 3.055%, 10/4/26 | 921,267 | ||||||
| 894,000 | NextEra Energy Capital Holdings, Inc., | |||||||
| 2.800%, 1/15/23 | 864,288 | |||||||
| 945,000 | Oncor Electric Delivery Co. LLC, | |||||||
| 3.800%, 9/30/47 | 893,619 | |||||||
| 439,000 | Pacific Gas & Electric Co., 144a, | |||||||
| 4.650%, 8/1/28 | 442,136 | |||||||
| 1,422,000 | PacifiCorp., 5.750%, 4/1/37 | 1,690,651 | ||||||
| 6,835,186 | ||||||||
| Materials — 1.3% | ||||||||
| 785,000 | Braskem America Finance Co., 144a, | |||||||
| 7.125%, 7/22/41 | 905,969 | |||||||
| 200,000 | Braskem Netherlands Finance BV | |||||||
| (Netherlands), 144a, | ||||||||
| 4.500%, 1/10/28 | 190,740 | |||||||
| 300,000 | Cemex SAB de CV (Mexico), 144a, | |||||||
| 7.750%, 4/16/26 | 327,000 | |||||||
| 450,000 | Corp. Nacional del Cobre de Chile | |||||||
| (Chile), 144a, 4.500%, 9/16/25 | 456,818 | |||||||
| 225,000 | Newcrest Finance Pty Ltd. (Australia), | |||||||
| 144a, 4.200%, 10/1/22 | 225,718 | |||||||
| 416,000 | Newcrest Finance Pty Ltd. (Australia), | |||||||
| 144a, 4.450%, 11/15/21 | 421,664 | |||||||
| 535,000 | Petroleos Mexicanos (Mexico), 144a, | |||||||
| 5.350%, 2/12/28 | 504,238 | |||||||
| 1,481,000 | Suzano Austria GmbH (Austria), 144a, | |||||||
| 5.750%, 7/14/26 | 1,493,959 | |||||||
| 200,000 | Suzano Austria GmbH (Austria), 144a, | |||||||
| 7.000%, 3/16/47 | 208,556 | |||||||
| 4,734,662 | ||||||||
| Total Corporate Bonds | $ | 145,315,406 | ||||||
| U.S. Government Mortgage-Backed | ||||||||
| Obligations — 23.3% | ||||||||
| 105,837 | FHLMC, Pool #1H1348, (1 Year CMT | |||||||
| Rate +2.140%), 4.186%, 10/1/36(A) | 110,947 | |||||||
| 263,530 | FHLMC, Pool #1Q0339, (12M LIBOR | |||||||
| +1.917%), 3.879%, 4/1/37(A) | 277,551 | |||||||
| 18,680 | FHLMC, Pool #A12886, 5.000%, 8/1/33 | 19,822 | ||||||
| 58,202 | FHLMC, Pool #A13842, 6.000%, 9/1/33 | 63,232 | ||||||
| 11,304 | FHLMC, Pool #A21415, 5.000%, 5/1/34 | 11,952 | ||||||
| 26,092 | FHLMC, Pool #A35682, 5.000%, 7/1/35 | 27,616 | ||||||
| 14,306 | FHLMC, Pool #A36523, 5.000%, 8/1/35 | 15,141 | ||||||
| 65,638 | FHLMC, Pool #A46590, 5.000%, 8/1/35 | 68,923 | ||||||
| 19,711 | FHLMC, Pool #A56988, 5.500%, 2/1/37 | 21,236 | ||||||
| 6,687 | FHLMC, Pool #A64971, 5.500%, 8/1/37 | 7,241 | ||||||
| 3,707,474 | FHLMC, Pool #A89148, | |||||||
| 4.000%, 10/1/39 | 3,773,825 | |||||||
| 126,758 | FHLMC, Pool #A96485, 4.500%, 1/1/41 | 132,250 | ||||||
| 652,106 | FHLMC, Pool #A97897, 4.500%, 4/1/41 | 681,056 | ||||||
| 19,116 | FHLMC, Pool #C62740, 7.000%, 1/1/32 | 20,579 | ||||||
| 21,632 | FHLMC, Pool #C72254, 6.500%, 7/1/32 | 23,931 | ||||||
| 73,800 | FHLMC, Pool #C90986, 7.000%, 6/1/26 | 77,621 | ||||||
| 21,476 | FHLMC, Pool #G02184, 5.000%, 4/1/36 | 22,798 | ||||||
| 3,066,394 | FHLMC, Pool #G05483, 4.500%, 6/1/39 | 3,185,803 | ||||||
| 3,623,183 | FHLMC, Pool #G05624, 4.500%, 9/1/39 | 3,770,160 | ||||||
| 349,636 | FHLMC, Pool #G05733, | |||||||
| 5.000%, 11/1/39 | 371,424 | |||||||
| 187,218 | FHLMC, Pool #J13584, | |||||||
| 3.500%, 11/1/25 | 188,317 | |||||||
| 2,638,782 | FHLMC, Pool #Q29056, | |||||||
| 4.000%, 10/1/44 | 2,672,431 | |||||||
| 5,808,360 | FHLMC, Pool #Q32917, 3.000%, 4/1/45 | 5,589,454 | ||||||
| 5,895,741 | FHLMC, Pool #Q33006, 3.500%, 4/1/45 | 5,819,030 | ||||||
| 69,028 | FNMA, Pool #255628, 5.500%, 2/1/25 | 73,650 | ||||||
| 62 |
Touchstone Active Bond Fund (Continued)
| Principal | Market | |||||||
| Amount | Value | |||||||
| U.S. Government Mortgage-Backed | ||||||||
| Obligations — 23.3% (Continued) | ||||||||
| $ | 14,257 | FNMA, Pool #426830, 8.000%, 11/1/24 | $ | 14,373 | ||||
| 653 | FNMA, Pool #432269, 6.500%, 8/1/28 | 716 | ||||||
| 9,109 | FNMA, Pool #540040, 7.500%, 6/1/28 | 9,118 | ||||||
| 17,296 | FNMA, Pool #561741, 7.500%, 1/1/31 | 19,106 | ||||||
| 34,006 | FNMA, Pool #640291, 7.000%, 8/1/32 | 34,494 | ||||||
| 31,087 | FNMA, Pool #653301, 6.500%, 7/1/32 | 34,082 | ||||||
| 63,567 | FNMA, Pool #653502, 6.500%, 7/1/32 | 69,691 | ||||||
| 33,705 | FNMA, Pool #670402, 6.500%, 6/1/32 | 37,150 | ||||||
| 5,106 | FNMA, Pool #725906, (12M LIBOR | |||||||
| +1.617%), 4.367%, 8/1/34(A) | 5,353 | |||||||
| 109,099 | FNMA, Pool #738887, 5.500%, 10/1/33 | 116,403 | ||||||
| 184,904 | FNMA, Pool #745257, 6.000%, 1/1/36 | 203,638 | ||||||
| 1,679 | FNMA, Pool #745974, (12M LIBOR | |||||||
| +1.862%), 3.783%, 10/1/36(A) | 1,768 | |||||||
| 90,280 | FNMA, Pool #748895, 6.000%, 12/1/33 | 94,649 | ||||||
| 64,918 | FNMA, Pool #758564, 6.000%, 9/1/24 | 70,078 | ||||||
| 82,161 | FNMA, Pool #810049, 5.500%, 3/1/35 | 87,661 | ||||||
| 127,539 | FNMA, Pool #819297, 6.000%, 9/1/35 | 140,337 | ||||||
| 816,516 | FNMA, Pool #881279, 5.000%, 11/1/36 | 865,185 | ||||||
| 39,775 | FNMA, Pool #889060, 6.000%, 1/1/38 | 43,745 | ||||||
| 89,013 | FNMA, Pool #889061, 6.000%, 1/1/38 | 98,736 | ||||||
| 2,789,327 | FNMA, Pool #890310, 4.500%, 12/1/40 | 2,902,960 | ||||||
| 11,988 | FNMA, Pool #895657, 6.500%, 8/1/36 | 12,843 | ||||||
| 167,181 | FNMA, Pool #905049, 5.500%, 11/1/36 | 178,374 | ||||||
| 86,643 | FNMA, Pool #908944, 5.500%, 1/1/37 | 92,443 | ||||||
| 524,976 | FNMA, Pool #928553, 5.500%, 8/1/37 | 576,918 | ||||||
| 1,319,906 | FNMA, Pool #931535, 5.500%, 7/1/39 | 1,404,214 | ||||||
| 250,630 | FNMA, Pool #AA3467, 4.500%, 4/1/39 | 261,037 | ||||||
| 398,541 | FNMA, Pool #AA4584, 4.500%, 4/1/39 | 415,105 | ||||||
| 94,800 | FNMA, Pool #AB1800, 4.000%, 11/1/40 | 96,501 | ||||||
| 288,557 | FNMA, Pool #AB2452, 4.000%, 3/1/26 | 294,615 | ||||||
| 3,467,608 | FNMA, Pool #AB7845, 3.000%, 2/1/43 | 3,348,518 | ||||||
| 91,739 | FNMA, Pool #AD3775, 4.500%, 3/1/25 | 95,112 | ||||||
| 113,480 | FNMA, Pool #AD6193, 5.000%, 6/1/40 | 120,266 | ||||||
| 4,686,941 | FNMA, Pool #AD9193, 5.000%, 9/1/40 | 4,986,765 | ||||||
| 3,561,733 | FNMA, Pool #AE0215, 4.000%, 12/1/39 | 3,623,231 | ||||||
| 328,701 | FNMA, Pool #AE0996, 4.000%, 2/1/41 | 334,553 | ||||||
| 182,647 | FNMA, Pool #AE1568, 4.000%, 9/1/40 | 185,806 | ||||||
| 581,337 | FNMA, Pool #AE2497, 4.500%, 9/1/40 | 606,823 | ||||||
| 82,803 | FNMA, Pool #AE5441, 5.000%, 10/1/40 | 88,101 | ||||||
| 303,712 | FNMA, Pool #AH1135, 5.000%, 1/1/41 | 323,144 | ||||||
| 415,212 | FNMA, Pool #AH3483, 3.500%, 2/1/26 | 418,321 | ||||||
| 168,430 | FNMA, Pool #AH3671, 4.000%, 2/1/26 | 172,589 | ||||||
| 512,051 | FNMA, Pool #AH6622, 4.000%, 3/1/41 | 523,078 | ||||||
| 666,453 | FNMA, Pool #AL0150, 4.000%, 2/1/41 | 678,198 | ||||||
| 139,819 | FNMA, Pool #AL0211, 5.000%, 4/1/41 | 148,771 | ||||||
| 3,887,425 | FNMA, Pool #AL2860, 3.000%, 12/1/42 | 3,755,447 | ||||||
| 5,415,772 | FNMA, Pool #AL5718, 3.500%, 9/1/44 | 5,353,906 | ||||||
| 2,647,957 | FNMA, Pool #AS0779, 4.000%, 10/1/43 | 2,701,720 | ||||||
| 68,520 | FNMA, Pool #AS7813, 4.000%, 8/1/46 | 69,261 | ||||||
| 4,171,977 | FNMA, Pool #AS8703, 2.500%, 2/1/32 | 4,028,703 | ||||||
| 1,019,184 | FNMA, Pool #AS8855, 3.500%, 2/1/37 | 1,018,412 | ||||||
| 8,654,622 | FNMA, Pool #BC1809, 3.500%, 5/1/46 | 8,550,131 | ||||||
| 1,043,674 | FNMA, Pool #BH6180, 4.000%, 7/1/47 | 1,054,500 | ||||||
| 1,730,816 | GNMA, Pool #4424, 5.000%, 4/20/39 | 1,845,508 | ||||||
| 29,804 | GNMA, Pool #5305, 4.000%, 2/20/42 | 30,588 | ||||||
| 2,750,000 | GNMA, Ser 2010-169, Class AW, | |||||||
| 4.500%, 12/20/40 | 2,855,475 | |||||||
| 7,968,299 | GNMA, Ser 2012-147, Class IO, | |||||||
| 0.563%, 4/16/54(A)(B)(C) | 276,161 | |||||||
| 4,392,048 | GNMA, Ser 2016-113, Class IO, | |||||||
| 1.192%, 2/16/58(A)(B)(C) | 399,598 | |||||||
| 17,283,216 | GNMA, Ser 2016-140, Class IO, | |||||||
| 0.935%, 5/16/58(A)(B)(C) | 1,253,985 | |||||||
| 94,050 | GNMA, Ser 2017-120, Class UZ, | |||||||
| 4.000%, 8/20/47 | 83,721 | |||||||
| Total U.S. Government | ||||||||
| Mortgage-Backed Obligations | $ | 84,137,675 | ||||||
| U.S. Treasury Obligations — 16.5% | ||||||||
| 27,862,000 | U.S. Treasury Bond, 3.000%, 8/15/48 | 26,813,910 | ||||||
| 12,460,000 | U.S. Treasury Note, 2.500%, 5/31/20 | 12,400,620 | ||||||
| 12,270,000 | U.S. Treasury Note, 2.500%, 3/31/23 | 12,042,334 | ||||||
| 8,380,000 | U.S. Treasury Note, 2.875%, 8/15/28 | 8,251,027 | ||||||
| Total U.S. Treasury Obligations | $ | 59,507,891 | ||||||
| Sovereign Government Obligations — 5.1% | ||||||||
| 575,000 | Angolan Government International | |||||||
| Bond, 144a, 8.250%, 5/9/28 | 593,952 | |||||||
| 250,000 | Argentine Republic Government | |||||||
| International Bond, 7.125%, 6/28/17 | 194,375 | |||||||
| 400,000 | Colombia Government International | |||||||
| Bond, 4.000%, 2/26/24 | 400,000 | |||||||
| 844,000 | Colombia Government International | |||||||
| Bond, 5.000%, 6/15/45 | 843,156 | |||||||
| 250,000 | Colombia Government International | |||||||
| Bond, 6.125%, 1/18/41 | 283,125 | |||||||
| 200,000 | Costa Rica Government International | |||||||
| Bond, 144a, 4.375%, 4/30/25 | 172,674 | |||||||
| 200,000 | Costa Rica Government International | |||||||
| Bond, 144a, 5.625%, 4/30/43 | 154,000 | |||||||
| 300,000 | Croatia Government International | |||||||
| Bond, 144a, 5.500%, 4/4/23 | 317,202 | |||||||
| 200,000 | Dominican Republic International | |||||||
| Bond, 144a, 5.875%, 4/18/24 | 205,908 | |||||||
| 150,000 | Dominican Republic International | |||||||
| Bond, 144a, 5.950%, 1/25/27 | 152,775 | |||||||
| 100,000 | Dominican Republic International | |||||||
| Bond, 144a, 6.850%, 1/27/45 | 101,250 | |||||||
| 300,000 | Ecuador Government International | |||||||
| Bond, 144a, 10.500%, 3/24/20 | 311,610 | |||||||
| 350,000 | Egypt Government International | |||||||
| Bond, 144a, 6.125%, 1/31/22 | 350,133 | |||||||
| 200,000 | Egypt Government International | |||||||
| Bond, 144a, 7.500%, 1/31/27 | 203,513 | |||||||
| 200,000 | Egypt Government International | |||||||
| Bond, 144a, 8.500%, 1/31/47 | 200,432 | |||||||
| 200,000 | El Salvador Government International | |||||||
| Bond, 144a, 6.375%, 1/18/27 | 187,250 | |||||||
| 750,000 | Hungary Government International | |||||||
| Bond, 5.375%, 3/25/24 | 803,130 | |||||||
| 63 |
Touchstone Active Bond Fund (Continued)
| Principal | Market | |||||||
| Amount | Value | |||||||
| Sovereign Government Obligations — 5.1% | ||||||||
| (Continued) | ||||||||
| $ | 300,000 | Indonesia Government International | ||||||
| Bond, 144a, 3.850%, 7/18/27 | $ | 285,897 | ||||||
| 200,000 | Ivory Coast Government International | |||||||
| Bond, 144a, 6.375%, 3/3/28 | 193,000 | |||||||
| 150,000 | Jamaica Government International | |||||||
| Bond, 8.000%, 3/15/39 | 172,332 | |||||||
| 200,000 | Kenya Government International | |||||||
| Bond, 144a, 7.250%, 2/28/28 | 194,500 | |||||||
| 200,000 | Mexico Government International | |||||||
| Bond, 4.125%, 1/21/26 | 198,210 | |||||||
| 1,310,000 | Mexico Government International | |||||||
| Bond, 4.350%, 1/15/47 | 1,187,528 | |||||||
| 200,000 | Mongolia Government International | |||||||
| Bond, 144a, 5.625%, 5/1/23 | 193,989 | |||||||
| 200,000 | Nigeria Government International | |||||||
| Bond, 5.625%, 6/27/22 | 200,300 | |||||||
| 200,000 | Nigeria Government International | |||||||
| Bond, 144a, 6.375%, 7/12/23 | 202,700 | |||||||
| 400,000 | Nigeria Government International | |||||||
| Bond, 144a, 7.875%, 2/16/32 | 408,600 | |||||||
| 250,000 | Oman Government International | |||||||
| Bond, 144a, 4.125%, 1/17/23 | 243,605 | |||||||
| 200,000 | Oman Government International | |||||||
| Bond, 144a, 5.375%, 3/8/27 | 194,056 | |||||||
| 300,000 | Pakistan Government International | |||||||
| Bond, 6.750%, 3/12/19 | 301,185 | |||||||
| 300,000 | Pakistan Government International | |||||||
| Bond, 144a, 7.875%, 3/31/36 | 281,346 | |||||||
| 200,000 | Panama Government International | |||||||
| Bond, 3.750%, 3/16/25 | 199,102 | |||||||
| 200,000 | Panama Government International | |||||||
| Bond, 4.500%, 4/16/50 | 198,302 | |||||||
| 200,000 | Papua New Guinea Government | |||||||
| International Bond, 144a, 8.375%, | ||||||||
| 10/4/28 | 202,500 | |||||||
| 200,000 | Paraguay Government International | |||||||
| Bond, 144a, 4.625%, 1/25/23 | 201,750 | |||||||
| 300,000 | Perusahaan Penerbit SBSN Indonesia | |||||||
| III, 144a, 4.350%, 9/10/24 | 300,000 | |||||||
| 432,000 | Portugal Government International | |||||||
| Bond, 144a, 5.125%, 10/15/24 | 451,699 | |||||||
| 1,135,000 | Province of Alberta Canada, 2.200%, | |||||||
| 7/26/22 | 1,092,278 | |||||||
| 1,333,000 | Province of Ontario Canada, 1.875%, | |||||||
| 5/21/20 | 1,308,579 | |||||||
| 300,000 | Province of Santa Fe, 144a, 7.000%, | |||||||
| 3/23/23 | 265,503 | |||||||
| 200,000 | Republic of Armenia International | |||||||
| Bond, 144a, 6.000%, 9/30/20 | 203,440 | |||||||
| 500,000 | Republic of Azerbaijan International | |||||||
| Bond, 144a, 4.750%, 3/18/24 | 507,166 | |||||||
| 200,000 | Republic of Belarus International | |||||||
| Bond, 144a, 6.875%, 2/28/23 | 209,648 | |||||||
| 200,000 | Republic of Poland Government | |||||||
| International Bond, 4.000%, 1/22/24 | 203,915 | |||||||
| 300,000 | Republic of South Africa Government | |||||||
| International Bond, 4.850%, 9/27/27 | 282,217 | |||||||
| 250,000 | Romanian Government International | |||||||
| Bond, 144a, 4.875%, 1/22/24 | 258,071 | |||||||
| 375,000 | Sri Lanka Government International | |||||||
| Bond, 144a, 6.125%, 6/3/25 | 357,236 | |||||||
| 350,000 | Turkey Government International | |||||||
| Bond, 4.875%, 4/16/43 | 255,080 | |||||||
| 400,000 | Turkey Government International | |||||||
| Bond, 5.125%, 3/25/22 | 379,793 | |||||||
| 100,000 | Ukraine Government International | |||||||
| Bond, 7.750%, 1/19/26 | 93,875 | |||||||
| 200,000 | Ukraine Government International | |||||||
| Bond, 144a, 7.375%, 9/25/32 | 173,660 | |||||||
| 375,000 | Ukraine Government International | |||||||
| Bond, 144a, 7.750%, 9/1/21 | 377,812 | |||||||
| 1,206,000 | Uruguay Government International | |||||||
| Bond, 4.975%, 4/20/55 | 1,206,000 | |||||||
| Total Sovereign Government | ||||||||
| Obligations | $ | 18,459,359 | ||||||
| Non-Agency Collateralized Mortgage | ||||||||
| Obligations — 4.0% | ||||||||
| 3,255 | Adjustable Rate Mortgage Trust, Ser | |||||||
| 2004-4, Class 3A1, | ||||||||
| 3.851%, 3/25/35(A)(C) | 3,266 | |||||||
| 2,152,801 | Agate Bay Mortgage Trust, Ser 2015-7, | |||||||
| Class B1, 144a, | ||||||||
| 3.764%, 10/25/45(A)(C) | 2,123,175 | |||||||
| 126,307 | Alternative Loan Trust, Ser 2004-30CB, | |||||||
| Class 3A1, 5.000%, 2/25/20 | 124,273 | |||||||
| 6,577 | Alternative Loan Trust, Ser 2005-J3, | |||||||
| Class 3A1, 6.500%, 9/25/34 | 6,514 | |||||||
| 32,519 | CSFB Mortgage-Backed Trust, Ser | |||||||
| 2004-7, Class 6A1, 5.250%, 10/25/19 | 32,687 | |||||||
| 2,152,776 | CSMC Trust, Ser 2015-1, Class B3, 144a, | |||||||
| 3.940%, 1/25/45(A)(C) | 2,059,445 | |||||||
| 2,189,646 | CSMC Trust, Ser 2015-WIN1, Class B3, | |||||||
| 144a, 3.868%, 12/25/44(A)(C) | 2,135,920 | |||||||
| 1,542,015 | CSMC Trust 2013-7, Ser 2013-7, Class | |||||||
| B3, 144a, 3.574%, 8/25/43(A)(C) | 1,494,134 | |||||||
| 74,936 | JP Morgan Mortgage Trust, Ser | |||||||
| 2005-A1, Class 2A1, | ||||||||
| 3.837%, 2/25/35(A)(C) | 76,351 | |||||||
| 201,132 | JP Morgan Mortgage Trust, Ser | |||||||
| 2005-A2, Class 7CB1, | ||||||||
| 3.953%, 4/25/35(A)(C) | 203,635 | |||||||
| 46,025 | JP Morgan Mortgage Trust, Ser | |||||||
| 2006-A4, Class 2A2, | ||||||||
| 3.901%, 6/25/36(A)(C) | 43,425 | |||||||
| 33,221 | MASTR Alternative Loans Trust, Ser | |||||||
| 2004-7, Class 10A1, 6.000%, 6/25/34 | 33,401 | |||||||
| 2,124,563 | PMT Loan Trust, Ser 2013-J1, Class A11, | |||||||
| 144a, 3.500%, 9/25/43(A)(C) | 2,068,112 | |||||||
| 64 |
Touchstone Active Bond Fund (Continued)
| Principal | Market | |||||||
| Amount | Value | |||||||
| Non-Agency Collateralized Mortgage | ||||||||
| Obligations — 4.0% (Continued) | ||||||||
| $ | 179,673 | Residential Asset Securitization Trust, | ||||||
| Ser 2006-A1, Class 1A3, | ||||||||
| 6.000%, 4/25/36 | $ | 136,781 | ||||||
| 313,444 | Sequoia Mortgage Trust, Ser 2013-1, | |||||||
| Class B1, 3.646%, 2/25/43(A)(C) | 309,736 | |||||||
| 367,513 | Sequoia Mortgage Trust, Ser 2013-1, | |||||||
| Class B2, 3.646%, 2/25/43(A)(C) | 364,741 | |||||||
| 568,807 | Sequoia Mortgage Trust, Ser 2013-10, | |||||||
| Class B2, 144a, 3.561%, 8/25/43(A)(C) | 556,780 | |||||||
| 555,781 | Sequoia Mortgage Trust, Ser 2013-5, | |||||||
| Class B1, 144a, 3.513%, 5/25/43(A)(C) | 547,757 | |||||||
| 1,142,429 | Sequoia Mortgage Trust, Ser 2014-2, | |||||||
| Class B2, 144a, 4.080%, 7/25/44(A)(C) | 1,139,478 | |||||||
| 333 | Structured Asset Securities Corp. | |||||||
| Mortgage Pass-Through | ||||||||
| Certificates, Ser 2004-21XS, Class | ||||||||
| 2A6B, 5.650%, 12/25/34(D) | 331 | |||||||
| 109,598 | Structured Asset Securities Corp. Trust, | |||||||
| Ser 2005-17, Class 5A1, | ||||||||
| 5.500%, 10/25/35 | 86,940 | |||||||
| 700,000 | Towd Point Mortgage Trust, Ser | |||||||
| 2015-3, Class A2, 144a, | ||||||||
| 4.000%, 3/25/54(A)(C) | 704,793 | |||||||
| 99,525 | Washington Mutual Alternative | |||||||
| Mortgage Pass-Through | ||||||||
| Certificates, Ser 2005-9, Class 2A4, | ||||||||
| 5.500%, 11/25/35 | 92,296 | |||||||
| 91,613 | Wells Fargo Mortgage Backed | |||||||
| Securities Trust, Ser 2003-G, Class | ||||||||
| A1, 4.466%, 6/25/33(A)(C) | 92,757 | |||||||
| Total Non-Agency Collateralized | ||||||||
| Mortgage Obligations | $ | 14,436,728 | ||||||
| Asset-Backed Securities — 3.7% | ||||||||
| 475,000 | Ascentium Equipment Receivables | |||||||
| Trust, Ser 2016-1A, Class B, 144a, | ||||||||
| 2.850%, 7/10/20 | 474,669 | |||||||
| 3,044 | CIT Home Equity Loan Trust, Ser | |||||||
| 2002-1, Class AF5, | ||||||||
| 7.210%, 2/25/33(D) | 3,124 | |||||||
| 360,208 | CWHEQ Home Equity Loan Trust, Ser | |||||||
| 2007-S1, Class A5, | ||||||||
| 6.018%, 11/25/36(A)(C) | 357,097 | |||||||
| 431,024 | Elara HGV Timeshare Issuer LLC, Ser | |||||||
| 2017-A, Class A, 144a, | ||||||||
| 2.690%, 3/25/30 | 420,202 | |||||||
| 242,709 | FFMLT Trust, Ser 2005-FFA, Class M3, | |||||||
| 6.017%, 3/25/25(D) | 254,322 | |||||||
| 1,100,000 | Hertz Vehicle Financing II LP, Ser | |||||||
| 2015-1A, Class B, 144a, | ||||||||
| 3.520%, 3/25/21 | 1,093,189 | |||||||
| 3,350,000 | Hertz Vehicle Financing II LP, Ser | |||||||
| 2016-4A, Class A, 144a, | ||||||||
| 2.650%, 7/25/22 | 3,253,506 | |||||||
| 1,697,850 | Jimmy Johns Funding LLC, Ser | |||||||
| 2017-1A, Class A2I, 144a, | ||||||||
| 3.610%, 7/30/47 | 1,676,050 | |||||||
| 1,279,922 | Mid-State Capital Corp. Trust, Ser | |||||||
| 2005-1, Class M2, 7.079%, 1/15/40 | 1,427,290 | |||||||
| 281,908 | Orange Lake Timeshare Trust, Ser | |||||||
| 2016-A, Class A, 144a, | ||||||||
| 2.610%, 3/8/29 | 274,732 | |||||||
| 1,087 | RASC Trust, Ser 2001-KS3, Class AI6, | |||||||
| 5.960%, 9/25/31(A)(C) | 1,131 | |||||||
| 296,142 | Sonic Capital LLC, Ser 2016-1A, Class | |||||||
| A2, 144a, 4.472%, 5/20/46 | 295,239 | |||||||
| 258,410 | SpringCastle America Funding LLC, | |||||||
| Ser 2016-AA, Class A, 144a, | ||||||||
| 3.050%, 4/25/29 | 257,276 | |||||||
| 600,000 | Voya CLO Ltd. (Cayman Islands), Ser | |||||||
| 2017-4A, Class A1, 144a, (3M LIBOR | ||||||||
| +1.130%), 3.469%, 10/15/30(A) | 600,115 | |||||||
| 3,300,063 | Wendys Funding LLC, Ser 2018-1A, | |||||||
| Class A2I, 144a, 3.573%, 3/15/48 | 3,175,320 | |||||||
| Total Asset-Backed Securities | $ | 13,563,262 | ||||||
| Agency Collateralized Mortgage | ||||||||
| Obligations — 2.4% | ||||||||
| 5,199,287 | FHLMC REMIC, Ser 3331 Class PE, | |||||||
| 6.000%, 6/15/37 | 5,565,787 | |||||||
| 1,485,210 | FHLMC REMIC, Ser 3859 Class JB, | |||||||
| 5.000%, 5/15/41 | 1,558,605 | |||||||
| 178,520 | FHLMC Structured Pass Through | |||||||
| Securities, Ser T-20, Class A5, | ||||||||
| 7.870%, 12/25/29(D) | 201,385 | |||||||
| 284,704 | FNMA REMIC, Ser 2003-32, Class BZ, | |||||||
| 6.000%, 11/25/32 | 307,982 | |||||||
| 2,094,723 | FNMA REMIC, Ser 2012-47, Class AI, | |||||||
| 3.000%, 5/25/22(B) | 85,290 | |||||||
| 90,297 | FNMA REMIC, Ser 2015-51, Class KC, | |||||||
| 3.000%, 6/25/45 | 87,306 | |||||||
| 935,933 | FNMA REMIC, Ser 2017-90, Class KA, | |||||||
| 3.000%, 11/25/47 | 921,874 | |||||||
| 31,405 | FNMA REMIC Trust, Ser 2001-W2, Class | |||||||
| AF6, 6.589%, 10/25/31(D) | 33,183 | |||||||
| 105,571 | FNMA Trust, Ser 2004-W15, Class 2AF, | |||||||
| (1M LIBOR +0.250%), | ||||||||
| 2.466%, 8/25/44(A) | 104,907 | |||||||
| Total Agency Collateralized | ||||||||
| Mortgage Obligations | $ | 8,866,319 | ||||||
| Commercial Mortgage-Backed Securities — 2.1% | ||||||||
| 34,626,503 | Core Industrial Trust, Ser 2015-CALW, | |||||||
| Class XA, 144a, | ||||||||
| 0.939%, 2/10/34(A)(B)(C) | 808,473 | |||||||
| 580,000 | DBUBS Mortgage Trust, Ser | |||||||
| 2017-BRBK, Class B, 144a, | ||||||||
| 3.648%, 10/10/34(A)(C) | 568,670 | |||||||
| 550,000 | Eleven Madison Trust Mortgage Trust, | |||||||
| Ser 2015-11MD, Class C, 144a, | ||||||||
| 3.673%, 9/10/35(A)(C) | 529,498 | |||||||
| 65 |
Touchstone Active Bond Fund (Continued)
| Principal | Market | |||||||
| Amount | Value | |||||||
| Commercial Mortgage-Backed Securities — 2.1% | ||||||||
| (Continued) | ||||||||
| $ | 595,000 | GS Mortgage Securities Corp. II, Ser | ||||||
| 2017-SLP, Class B, 144a, | ||||||||
| 3.772%, 10/10/32 | $ | 591,191 | ||||||
| 3,400,000 | GS Mortgage Securities Trust, Ser | |||||||
| 2017-FARM, Class B, 144a, | ||||||||
| 3.659%, 1/10/43(A)(C) | 3,249,113 | |||||||
| 528,000 | J.P. Morgan Chase Commercial | |||||||
| Mortgage Securities Trust, Ser | ||||||||
| 2016-NINE, Class B, 144a, | ||||||||
| 2.949%, 10/6/38(A)(C) | 481,944 | |||||||
| 1,250,000 | STWD 2018-URB Mortgage Trust, Ser | |||||||
| 2018-URB, Class C, 144a, (1M LIBOR | ||||||||
| +1.550%), 3.613%, 5/15/35(A) | 1,249,999 | |||||||
| Total Commercial | ||||||||
| Mortgage-Backed Securities | $ | 7,478,888 | ||||||
| Shares | ||||||||
| Preferred Stock — 0.4% | ||||||||
| Utilities — 0.4% | ||||||||
| 55,359 | Integrys Holding, Inc., 6.000%, 8/1/73 | $ | 1,436,566 | |||||
| Short-Term Investment Fund — 2.0% | ||||||||
| 7,292,324 | Dreyfus Government Cash | |||||||
| Management, Institutional Shares, | ||||||||
| 1.95%∞Ω | $ | 7,292,324 | ||||||
| Total Investment Securities — 99.7% | ||||||||
| (Cost $368,092,917) | $ | 360,494,418 | ||||||
| Other Assets in | ||||||||
| Excess of Liabilities — 0.3% | 1,047,579 | |||||||
| Net Assets — 100.0% | $ | 361,541,997 | ||||||
| (A) | Variable rate security - Rate reflected is the rate in effect as of September 30, 2018. |
| (B) | Interest only security - This type of security represents the right to receive the monthly interest payments on an underlying pool of mortgages. Payments of principal on the pool reduce the value of the “interest only” holding. |
| (C) | Certain variable rate securities are not based on a published reference rate and spread but are determined by the issuer or agent and are based on current market conditions. These securities do not indicate a reference rate and spread in their description. |
| (D) | Step Bond - A bond that pays an initial interest rate for the first period and then a higher interest rate for the following periods until maturity. The interest rate shown reflects the rate in effect as of September 30, 2018. |
| ∞ | Open-End Fund. |
| Ω | Represents the 7-day SEC yield as of September 30, 2018. |
Portfolio Abbreviations:
CMT - Constant Maturity Treasury
DAC - Designated Activity Company
FHLMC - Federal Home Loan Mortgage Corporation
FNMA - Federal National Mortgage Association
GNMA - Government National Mortgage Association
LIBOR - London Inter Bank Offered Rate
LLC - Limited Liability Company
LP - Limited Partnership
MTN - Medium Term Note
PLC - Public Limited Company
REIT - Real Estate Investment Trust
REMIC - Real Estate Mortgage Investment Conduit
144a - This is a restricted security that was sold in a transaction qualifying for the exemption under Rule 144a of the Securities Act of 1933. This security may be sold in transactions exempt from registration, normally to qualified institutional buyers. At September 30, 2018, these securities were valued at $65,641,699 or 18.2% of net assets. These securities were deemed liquid pursuant to procedures approved by the Board of Trustees.
Other Information:
The inputs or methodology used for valuing securities may not be an indication of the risk associated with investing in those securities. For more information on valuation inputs, and their aggregation into the levels used in the table below, please refer to the security valuation section in the accompanying Notes to Financial Statements.
| 66 |
Touchstone Active Bond Fund (Continued)
| Valuation inputs at Reporting Date: | ||||||||||||||||
| Description | Level 1 | Level 2 | Level 3 | Total | ||||||||||||
| Assets: | ||||||||||||||||
| Corporate Bonds | $ | — | $ | 145,315,406 | $ | — | $ | 145,315,406 | ||||||||
| U.S. Government Mortgage-Backed Obligations | — | 84,137,675 | — | 84,137,675 | ||||||||||||
| U.S. Treasury Obligations | — | 59,507,891 | — | 59,507,891 | ||||||||||||
| Sovereign Government Obligations | — | 18,459,359 | — | 18,459,359 | ||||||||||||
| Non-Agency Collateralized Mortgage Obligations | — | 14,436,728 | — | 14,436,728 | ||||||||||||
| Asset-Backed Securities | — | 13,563,262 | — | 13,563,262 | ||||||||||||
| Agency Collateralized Mortgage Obligations | — | 8,866,319 | — | 8,866,319 | ||||||||||||
| Commercial Mortgage-Backed Securities | — | 7,478,888 | — | 7,478,888 | ||||||||||||
| Preferred Stock | 1,436,566 | — | — | 1,436,566 | ||||||||||||
| Short-Term Investment Fund | 7,292,324 | — | — | 7,292,324 | ||||||||||||
| Total Assets | $ | 8,728,890 | $ | 351,765,528 | $ | — | $ | 360,494,418 | ||||||||
See accompanying Notes to Financial Statements.
| 67 |
Touchstone Arbitrage Fund – September 30, 2018
| Market | ||||||||
| Shares | Value | |||||||
| Common Stocks — 101.2% | ||||||||
| Financials — 52.9% | ||||||||
| Capitol Investment Corp. IV* | 246,435 | $ | 2,553,067 | |||||
| Capitol Investment Corp. IV - Class A* | 133,177 | 1,318,452 | ||||||
| Churchill Capital Corp.* | 360,000 | 3,654,000 | ||||||
| DFB Healthcare Acquisitions Corp.* | 117,500 | 1,198,500 | ||||||
| Far Point Acquisition Corp.* | 401,491 | 4,127,327 | ||||||
| Federal Street Acquisition Corp. - Class A* | 401,450 | 4,042,601 | ||||||
| Forum Merger II Corp.* | 200,384 | 2,023,878 | ||||||
| GigCapital, Inc.* | 146,056 | 1,568,641 | ||||||
| Gores Holdings II, Inc. - Class A* | 264,522 | 2,809,224 | ||||||
| Gores Holdings III, Inc.* | 407,500 | 4,164,650 | ||||||
| GS Acquisition Holdings Corp. - Class A* | 180,857 | 1,763,356 | ||||||
| GS Acquisition Holdings Corp.* | 123,028 | 1,267,189 | ||||||
| GTY Technology Holdings, Inc.* | 3,800 | 41,116 | ||||||
| GTY Technology Holdings, Inc. - Class A*† | 310,768 | 3,151,188 | ||||||
| Haymaker Acquisition Corp.* | 438,386 | 4,502,224 | ||||||
| Hennessy Capital Acquisition Corp. III* | 61,035 | 621,947 | ||||||
| Kayne Anderson Acquisition Corp. - Class A* | 289,259 | 2,927,301 | ||||||
| Landcadia Holdings, Inc.*† | 323,021 | 3,501,548 | ||||||
| Legacy Acquisition Corp.* | 456,491 | 4,624,254 | ||||||
| Leisure Acquisition Corp.* | 217,312 | 2,205,717 | ||||||
| Leo Holdings Corp. (United Kingdom)* | 182,732 | 1,873,003 | ||||||
| Mosaic Acquisition Corp.* | 577,263 | 5,876,537 | ||||||
| Mudrick Capital Acquisition Corp.* | 159,558 | 1,624,300 | ||||||
| Nebula Acquisition Corp.* | 190,000 | 1,919,000 | ||||||
| New Frontier Corp. (Hong Kong)* | 106,615 | 1,087,473 | ||||||
| One Madison Corp.* | 311,495 | 3,223,973 | ||||||
| Pensare Acquisition Corp.* | 423,360 | 4,216,666 | ||||||
| Platinum Eagle Acquisition Corp.* | 268,997 | 2,711,490 | ||||||
| Platinum Eagle Acquisition Corp.* | 16,832 | 164,785 | ||||||
| Pure Acquisition Corp.* | 467,916 | 4,824,214 | ||||||
| Regalwood Global Energy Ltd.* | 162,178 | 1,667,190 | ||||||
| Saban Capital Acquisition Corp. - Class A* | 261,329 | 2,626,356 | ||||||
| Sentinel Energy Services, Inc.* | 222,420 | 2,266,460 | ||||||
| Social Capital Hedosophia Holdings Corp.* | 266,607 | 2,719,391 | ||||||
| Spartan Energy Acquisition Corp.* | 484,089 | 4,918,344 | ||||||
| Thunder Bridge Acquisition Ltd. - Class A* | 67,198 | 645,101 | ||||||
| Tiberius Acquisition Corp.* | 47,406 | 478,801 | ||||||
| TKK Symphony Acquisition Corp. (Hong Kong)* | 246,260 | 2,487,226 | ||||||
| TPG Pace Holdings Corp. - Class A* | 466,462 | 4,697,272 | ||||||
| Trinity Merger Corp.* | 122,454 | 1,249,031 | ||||||
| Twelve Seas Investment Co. (United Kingdom)* | 161,503 | 1,647,331 | ||||||
| Vantage Energy Acquisition Corp. - Class A*† | 473,844 | 4,714,748 | ||||||
| 109,704,872 | ||||||||
| Consumer Discretionary — 9.9% | ||||||||
| AV Homes, Inc.* | 97,462 | 1,949,240 | ||||||
| Lennar Corp. - Class A | 32,500 | 1,517,425 | ||||||
| Lennar Corp. - Class B†† | 16,071 | 618,734 | ||||||
| Tribune Media Co. - Class A†† | 183,460 | 7,050,368 | ||||||
| Twenty-First Century Fox, Inc. - Class B†† | 203,760 | 9,336,283 | ||||||
| 20,472,050 | ||||||||
| Information Technology — 8.6% | ||||||||
| CA, Inc.†† | 98,850 | 4,364,228 | ||||||
| Mitel Networks Corp. (Canada)* | 314,300 | 3,463,586 | ||||||
| NXP Semiconductors NV (Netherlands) | 92,900 | 7,942,950 | ||||||
| Xcerra Corp.* | 149,660 | 2,135,648 | ||||||
| 17,906,412 | ||||||||
| Health Care — 8.0% | ||||||||
| Aetna, Inc. | 32,300 | 6,552,055 | ||||||
| Akorn, Inc.*†† | 230,295 | 2,989,229 | ||||||
| Envision Healthcare Corp.* | 72,780 | 3,328,229 | ||||||
| Express Scripts Holding Co.* | 40,000 | 3,800,400 | ||||||
| 16,669,913 | ||||||||
| Energy — 6.6% | ||||||||
| Alta Mesa Resources, Inc.*†† | 313,900 | 1,312,102 | ||||||
| Andeavor | 53,170 | 8,161,595 | ||||||
| Energy XXI Gulf Coast, Inc.* | 165,200 | 1,381,072 | ||||||
| KLX Energy Services Holdings, Inc.* | 13,080 | 418,691 | ||||||
| Magnolia Oil & Gas Corp.* | 160,929 | 2,415,544 | ||||||
| 13,689,004 | ||||||||
| Real Estate — 6.4% | ||||||||
| Forest City Realty Trust, Inc. - Class A REIT†† | 287,100 | 7,203,339 | ||||||
| Gramercy Property Trust REIT†† | 151,371 | 4,153,620 | ||||||
| LaSalle Hotel Properties REIT | 56,095 | 1,940,326 | ||||||
| 13,297,285 | ||||||||
| Industrials — 3.7% | ||||||||
| Rockwell Collins, Inc. | 46,860 | 6,582,424 | ||||||
| USG Corp. | 24,940 | 1,080,151 | ||||||
| 7,662,575 | ||||||||
| Materials — 2.9% | ||||||||
| KapStone Paper and Packaging Corp. | 178,450 | 6,051,240 | ||||||
| Utilities — 2.2% | ||||||||
| Avista Corp. | 91,699 | 4,636,301 | ||||||
| Total Common Stocks | $ | 210,089,652 | ||||||
| 68 |
Touchstone Arbitrage Fund (Continued)
| Principal | Market | |||||||
| Amount | Value | |||||||
| Corporate Bonds — 4.1% | ||||||||
| Energy — 1.9% | ||||||||
| $ | 1,050,000 | Alta Mesa Holdings LP / Alta Mesa | ||||||
| Finance Services Corp., | ||||||||
| 7.875%, 12/15/24 | $ | 997,500 | ||||||
| 3,000,000 | Magnolia Oil & Gas Operating LLC / | |||||||
| Magnolia Oil & Gas Finance Corp., | ||||||||
| 144a, 6.000%, 8/1/26 | 2,992,500 | |||||||
| 3,990,000 | ||||||||
| Consumer Discretionary — 1.4% | ||||||||
| 1,750,000 | Williams Scotsman International, Inc., | |||||||
| 144a, 6.875%, 8/15/23 | 1,736,875 | |||||||
| 1,100,000 | Williams Scotsman International, Inc., | |||||||
| 144a, 7.875%, 12/15/22 | 1,133,000 | |||||||
| 2,869,875 | ||||||||
| Financials — 0.4% | ||||||||
| 500,000 | Corestates Capital III, 144a, (3M LIBOR | |||||||
| +0.570%), 2.884%, 2/15/27(A) | 465,000 | |||||||
| 500,000 | JPMorgan Chase & Co., (3M LIBOR | |||||||
| +0.950%), 3.336%, 9/30/34(A) | 450,000 | |||||||
| 915,000 | ||||||||
| Industrials — 0.4% | ||||||||
| 750,000 | USG Corp., 144a, 4.875%, 6/1/27 | 758,258 | ||||||
| Total Corporate Bonds | $ | 8,533,133 | ||||||
| Shares | ||||||||
| Warrants — 1.6% | ||||||||
| Financials — 1.3% | ||||||||
| Avista Healthcare Public - Class A, | ||||||||
| Exp 12/2/21, Price $11.50* | 520,742 | 104,148 | ||||||
| Black Ridge Acquisition Corp., | ||||||||
| Exp 10/25/22, Price $11.50* | 139,049 | 59,791 | ||||||
| Constellation Alpha Capital Corp. - Class | ||||||||
| R, Exp 3/23/24, Price $11.50* | 397,102 | 87,362 | ||||||
| Federal Street Acquisition Corp. - | ||||||||
| Class A, Exp 7/24/22, Price $11.50* | 240,373 | 336,522 | ||||||
| Gores Holdings II, Inc. - Class A, | ||||||||
| Exp 3/6/22, Price $11.50* | 48,125 | 103,469 | ||||||
| GTY Technology Holdings, Inc. - | ||||||||
| Class A, Exp 11/14/21, | ||||||||
| Price $11.50* | 132,546 | 165,683 | ||||||
| Hennessy Capital Acquisition Corp. III, | ||||||||
| Exp 6/15/24, Price $11.50* | 90,000 | 135,000 | ||||||
| Industrea Acquisition Corp. - Class A, | ||||||||
| Exp 8/1/24, Price $11.50* | 78,492 | 77,707 | ||||||
| Kayne Anderson Acquisition Corp. - | ||||||||
| Class A, Exp 6/30/22, Price $11.50* | 235,290 | 294,112 | ||||||
| Landcadia Holdings, Inc., | ||||||||
| Exp 6/1/23, Price $11.50* | 147,548 | 175,582 | ||||||
| Legacy Acquisition Corp. - Class A, | ||||||||
| Exp 11/30/22, Price $5.75* | 170,800 | 70,028 | ||||||
| Matlin and Partners Acquisition Corp. - | ||||||||
| Class A, Exp 5/28/21 Price $5.75* | 85,970 | 64,478 | ||||||
| Pensare Acquisition Corp., Exp 8/8/22, | ||||||||
| Price $11.50* | 149,180 | 68,623 | ||||||
| Platinum Eagle Acquisition Corp., | ||||||||
| Exp 3/5/25, Price $11.50* | 10,746 | 14,507 | ||||||
| Saban Capital Acquisition Corp. - | ||||||||
| Class A, Exp 9/21/21, Price $11.50* | 155,740 | 171,314 | ||||||
| Social Capital Hedosophia Holdings | ||||||||
| Corp., Exp 9/25/22, Price $11.50* | 163,908 | 175,382 | ||||||
| Thunder Bridge Acquisition Ltd. - | ||||||||
| Class A, Exp 7/17/22, Price $11.50* | 161,000 | 72,450 | ||||||
| TPG Pace Holdings Corp. - Class A, Exp | ||||||||
| 8/18/22, Price $11.50* | 169,462 | 296,559 | ||||||
| Vantage Energy Acquisition Corp. - | ||||||||
| Class A, Exp 4/12/24, Price $11.50* | 110,250 | 165,375 | ||||||
| VectoIQ Acquisition Corp., | ||||||||
| Exp 6/11/23, Price $11.50* | 130,960 | 77,266 | ||||||
| 2,715,358 | ||||||||
| Energy — 0.2% | ||||||||
| Alta Mesa Resources, Inc., | ||||||||
| Exp 2/9/23, Price $11.50* | 182,631 | 91,297 | ||||||
| Magnolia Oil & Gas Corp., Exp 7/31/23, | ||||||||
| Price $11.50* | 76,233 | 358,295 | ||||||
| 449,592 | ||||||||
| Industrials — 0.1% | ||||||||
| Willscot Corp., Exp 9/10/22, | ||||||||
| Price $11.50* | 17,061 | 50,842 | ||||||
| Total Warrants | $ | 3,215,792 | ||||||
| Exchange-Traded Funds — 0.2% | ||||||||
| Consumer Discretionary Select Sector | ||||||||
| SPDR Fund | 594 | 69,629 | ||||||
| Health Care Select Sector SPDR Fund | 598 | 56,900 | ||||||
| Industrial Select Sector SPDR Fund | 221 | 17,326 | ||||||
| Real Estate Select Sector SPDR Fund | 1,574 | 51,328 | ||||||
| Technology Select Sector SPDR Fund | 2,748 | 207,007 | ||||||
| Total Exchange-Traded Funds | $ | 402,190 | ||||||
| Number | ||||||||
| of | ||||||||
| Rights | ||||||||
| Rights — 0.1% | ||||||||
| Black Ridge Acquisition Corp. | ||||||||
| Exp 7/1/19, Strike Price $11.50* | 87,549 | 28,182 | ||||||
| Pensare Acquisition Corp. Exp 2/1/19, | ||||||||
| Strike Price $11.50* | 298,360 | 134,262 | ||||||
| Media General, Inc. Exp 12/31/23, | ||||||||
| Strike Price $10.00(B)* | 180,000 | 18,000 | ||||||
| Total Rights | $ | 180,444 | ||||||
| 69 |
Touchstone Arbitrage Fund (Continued)
| Number | ||||||||||||
| of | Notional | Market | ||||||||||
| Contracts | Amount | Value | ||||||||||
| Purchased Options — 0.0% | ||||||||||||
| Purchased Call Options — 0.0% | ||||||||||||
| Sinclair Broadcast Group | ||||||||||||
| Inc., Strike @30.00, | ||||||||||||
| Exp 10/18†† | 300 | $ | 652,200 | $ | 7,500 | |||||||
| Purchased Put Options — 0.0% | ||||||||||||
| SPDR S&P 500 ETF Trust., | ||||||||||||
| Strike @290.00, | ||||||||||||
| Exp 10/18†† | 110 | 3,197,920 | 28,710 | |||||||||
| Total Purchased Options | $ | 36,210 | ||||||||||
| Shares | ||||||||
| Short-Term Investment Funds — 0.2% | ||||||||
| Dreyfus Government Cash | ||||||||
| Management, Institutional Shares, | ||||||||
| 1.95%∞Ω | 245,084 | 245,084 | ||||||
| Invesco Government & Agency | ||||||||
| Portfolio, Institutional Class, | ||||||||
| 1.97%**∞Ω | 111,711 | 111,711 | ||||||
| Total Short-Term Investment Funds | $ | 356,795 | ||||||
| Total Long Positions | ||||||||
| (Cost $225,937,837) | $ | 222,814,216 | ||||||
| Securities Sold Short — (15.4%) | ||||||||
| Common Stocks — (10.4%) | ||||||||
| Energy — (3.5%) | ||||||||
| KLX Energy Services Holdings, Inc.* | (13,080 | ) | (418,691 | ) | ||||
| Marathon Petroleum Corp. | (84,513 | ) | (6,758,505 | ) | ||||
| (7,177,196 | ) | |||||||
| Consumer Discretionary — (3.3%) | ||||||||
| Lennar Corp. - Class A | (32,500 | ) | (1,517,425 | ) | ||||
| Lennar Corp. - Class B | (771 | ) | (29,683 | ) | ||||
| Sinclair Broadcast Group, Inc. - Class A | (30,000 | ) | (850,500 | ) | ||||
| Walt Disney Co. (The) | (38,066 | ) | (4,451,438 | ) | ||||
| (6,849,046 | ) | |||||||
| Health Care — (2.0%) | ||||||||
| Cigna Corp. | (9,736 | ) | (2,027,522 | ) | ||||
| CVS Health Corp. | (27,060 | ) | (2,130,163 | ) | ||||
| (4,157,685 | ) | |||||||
| Industrials — (1.2%) | ||||||||
| United Technologies Corp. | (17,584 | ) | (2,458,419 | ) | ||||
| Information Technology — (0.4%) | ||||||||
| Cohu, Inc. | (31,562 | ) | (792,206 | ) | ||||
| Total Common Stocks | $ | (21,434,552 | ) | |||||
| Exchange-Traded Funds — (5.0%) | ||||||||
| Consumer Staples Select Sector SPDR | ||||||||
| Fund | (315 | ) | $ | (16,988 | ) | |||
| Energy Select Sector SPDR Fund | (2,786 | ) | (211,012 | ) | ||||
| Financial Select Sector SPDR Fund | (329 | ) | (9,074 | ) | ||||
| iShares US Telecommunications ETF | (2,560 | ) | (76,134 | ) | ||||
| Materials Select Sector SPDR Fund | (513 | ) | (29,718 | ) | ||||
| SPDR S&P 500 ETF Trust | (27,000 | ) | (7,849,440 | ) | ||||
| SPDR S&P Oil & Gas Exploration & | ||||||||
| Production ETF | (50,000 | ) | (2,164,500 | ) | ||||
| Utilities Select Sector SPDR Fund | (763 | ) | (40,172 | ) | ||||
| Total Exchange-Traded Funds | $ | (10,397,038 | ) | |||||
| Total Securities Sold Short | ||||||||
| (Proceeds $30,108,218) | $ | (31,831,590 | ) | |||||
| Number | ||||||||||||
| of | Notional | |||||||||||
| Contracts | Amount | |||||||||||
| Written Options — (0.0%) | ||||||||||||
| Written Put Options — (0.0%) | ||||||||||||
| Sinclair Broadcast Group | ||||||||||||
| Inc., Strike @28.00, | ||||||||||||
| Exp 10/18 | (300 | ) | $ | (652,200 | ) | (25,500 | ) | |||||
| SPDR S&P 500 ETF Trust., | ||||||||||||
| Strike @285.00, | ||||||||||||
| Exp 10/18 | (160 | ) | (4,651,520 | ) | (13,280 | ) | ||||||
| SPDR S&P 500 ETF Trust., | ||||||||||||
| Strike @285.00, | ||||||||||||
| Exp 10/18 | (220 | ) | (6,395,840 | ) | (33,220 | ) | ||||||
| Total Written Options | ||||||||||||
| (Premiums received $65,365) | $ | (72,000 | ) | |||||||||
| Total — 92.0% | $ | 190,910,626 | ||||||||||
| Cash Deposits held at | ||||||||||||
| Prime Broker for Securities | ||||||||||||
| Sold Short and Written Options — 8.7% | 18,044,871 | |||||||||||
| Liabilities in Excess of Other Assets — (0.7%) | (1,458,051 | ) | ||||||||||
| Net Assets — 100.0% | $ | 207,497,446 | ||||||||||
| (A) | Variable rate security - Rate reflected is the rate in effect as of September 30, 2018. |
| (B) | Level 3-For more information on valuation inputs, and their aggregation into the levels used in the table below, please refer to the security valuation section in the accompanying Notes to Financial Statements. |
| * | Non-income producing security. |
| ** | Represents collateral for securities loaned. |
| 70 |
Touchstone Arbitrage Fund (Continued)
| † | All or a portion of the security is on loan. The total market value of the securities on loan as of September 30, 2018 was $44,495. |
| †† | All or a portion of these securities are pledged as collateral for securities sold short and written options. The total value of the securities pledged as collateral as of September 30, 2018 was $35,601,103. |
| ∞ | Open-End Fund. |
| Ω | Represents the 7-day SEC yield as of September 30, 2018. |
Portfolio Abbreviations:
ETF - Exchange-Traded Fund
LIBOR - London Inter Bank Offered Rate
LLC - Limited Liability Company
LP - Limited Partnership
REIT - Real Estate Investment Trusts
SPDR - Standard & Poor's Depositary Receipt
144a - This is a restricted security that was sold in a transaction qualifying for the exemption under Rule 144a of the Securities Act of 1933. This security may be sold in transactions exempt from registration, normally to qualified institutional buyers. At September 30, 2018, these securities were valued at $7,085,633 or 3.4% of net assets. These securities were deemed liquid pursuant to procedures approved by the Board of Trustees.
Other Information:
The inputs or methodology used for valuing securities may not be an indication of the risk associated with investing in those securities. For more information on valuation inputs, and their aggregation into the levels used in the table below, please refer to the security valuation section in the accompanying Notes to Financial Statements.
| Valuation inputs at Reporting Date: | ||||||||||||||||
| Description | Level 1 | Level 2 | Level 3 | Total | ||||||||||||
| Assets: | ||||||||||||||||
| Common Stocks | $ | 210,089,652 | $ | — | $ | — | $ | 210,089,652 | ||||||||
| Corporate Bonds | — | 8,533,133 | — | 8,533,133 | ||||||||||||
| Warrants | 3,215,792 | — | — | 3,215,792 | ||||||||||||
| Exchange-Traded Funds | 402,190 | — | — | 402,190 | ||||||||||||
| Rights | 162,444 | — | 18,000 | 180,444 | ||||||||||||
| Purchased Options Equity Contracts | 36,210 | — | — | 36,210 | ||||||||||||
| Short-Term Investment Funds | 356,795 | — | — | 356,795 | ||||||||||||
| Total Assets | $ | 214,263,083 | $ | 8,533,133 | $ | 18,000 | $ | 222,814,216 | ||||||||
| Liabilities: | ||||||||||||||||
| Securities Sold Short | ||||||||||||||||
| Common Stocks | $ | (21,434,552 | ) | $ | — | $ | — | $ | (21,434,552 | ) | ||||||
| Exchange-Traded Funds | (10,397,038 | ) | — | — | (10,397,038 | ) | ||||||||||
| Other Financial Instruments | ||||||||||||||||
| Written Options Equity Contracts | (72,000 | ) | — | — | (72,000 | ) | ||||||||||
| Total Liabilities | $ | (31,903,590 | ) | $ | — | $ | — | $ | (31,903,590 | ) | ||||||
| Total | $ | 182,359,493 | $ | 8,533,133 | $ | 18,000 | $ | 190,910,626 | ||||||||
| Measurements Using Unobservable Inputs (Level 3) | ||||
| Assets | Rights | |||
| Beginning balance September 30, 2017 | $ | 18,000 | ||
| Net change in unrealized appreciation/depreciation | — | |||
| Realized gain from distributions received | — | |||
| Ending balance September 30, 2018 | $ | 18,000 | ||
| Net Change in Unrealized Appreciation/Depreciation for Investments in Securities still held at September 30, 2018 | $ | — | ||
| Valuation | Unobservable | |||||||
| Rights | Fair Value | Technique | Input | |||||
| Media General, Inc. Exp 12/31/23, Strike Price $10.00 | $ | 18,000 | Issuer Guidance | New Issue | ||||
See accompanying Notes to Financial Statements.
| 71 |
Touchstone Emerging Markets Small Cap Fund – September 30, 2018
| Market | ||||||||
| Shares | Value | |||||||
| Common Stocks — 98.6% | ||||||||
| South Korea — 21.6% | ||||||||
| Consumer Discretionary — 6.6% | ||||||||
| F&F Co. Ltd. | 972 | $ | 73,866 | |||||
| Fila Korea Ltd. | 4,614 | 186,658 | ||||||
| LOTTE Himart Co. Ltd. | 1,950 | 117,270 | ||||||
| Modetour Network, Inc. | 5,250 | 119,031 | ||||||
| Shinsegae International, Inc. | 370 | 76,042 | ||||||
| Consumer Staples — 1.0% | ||||||||
| Orion Corp. | 940 | 89,403 | ||||||
| Financials — 1.7% | ||||||||
| KIWOOM Securities Co. Ltd. | 1,719 | 151,048 | ||||||
| Health Care — 2.1% | ||||||||
| Medy-Tox, Inc. | 112 | 62,516 | ||||||
| Value Added Technology Co. Ltd. | 4,084 | 116,314 | ||||||
| Information Technology — 8.2% | ||||||||
| Com2uSCorp. | 775 | 102,384 | ||||||
| Douzone Bizon Co. Ltd. | 2,653 | 146,100 | ||||||
| HyVision System, Inc. | 8,901 | 123,569 | ||||||
| Kginicis Co. Ltd. | 5,550 | 91,766 | ||||||
| Koh Young Technology, Inc. | 1,524 | 149,927 | ||||||
| Silicon Works Co. Ltd. | 2,703 | 98,830 | ||||||
| Materials — 2.0% | ||||||||
| Korea Petrochemical Ind Co. Ltd. | 638 | 106,101 | ||||||
| Soulbrain Co. Ltd. | 1,303 | 70,590 | ||||||
| Total South Korea | 1,881,415 | |||||||
| Taiwan — 17.9% | ||||||||
| Consumer Discretionary — 1.1% | ||||||||
| Eclat Textile Co. Ltd. | 8,000 | 99,040 | ||||||
| Consumer Staples — 2.2% | ||||||||
| Grape King Bio Ltd. | 16,000 | 112,406 | ||||||
| TCI Co. Ltd. | 5,045 | 81,105 | ||||||
| Financials — 1.4% | ||||||||
| Chailease Holding Co. Ltd. | 34,000 | 118,999 | ||||||
| Health Care — 2.5% | ||||||||
| Bioteque Corp. | 33,000 | 104,834 | ||||||
| TaiDoc Technology Corp. | 24,000 | 109,919 | ||||||
| Industrials — 1.9% | ||||||||
| Sunny Friend Environmental | ||||||||
| Technology Co. Ltd. | 15,000 | 109,517 | ||||||
| Sunonwealth Electric Machine | ||||||||
| Industry Co. Ltd. | 36,000 | 51,454 | ||||||
| Information Technology — 5.0% | ||||||||
| E Ink Holdings, Inc. | 84,000 | 86,283 | ||||||
| Inventec Corp. | 134,000 | 120,234 | ||||||
| Micro-Star International Co. Ltd. | 40,000 | 108,197 | ||||||
| Powertech Technology, Inc. | 45,000 | 122,605 | ||||||
| Materials — 2.5% | ||||||||
| Asia Cement Corp. | 92,000 | 125,020 | ||||||
| China General Plastics Corp. | 113,827 | 95,019 | ||||||
| Real Estate — 1.3% | ||||||||
| Hung Sheng Construction Ltd. | 113,800 | 112,894 | ||||||
| Total Taiwan | 1,557,526 | |||||||
| India — 15.5% | ||||||||
| Consumer Discretionary — 3.4% | ||||||||
| Bajaj Electricals Ltd. | 12,106 | 83,935 | ||||||
| Bata India Ltd. | 7,002 | 93,750 | ||||||
| Jubilant Foodworks Ltd. | 6,854 | 116,337 | ||||||
| Consumer Staples — 1.1% | ||||||||
| Radico Khaitan Ltd. | 19,300 | 92,411 | ||||||
| Financials — 2.8% | ||||||||
| Cholamandalam Investment and | ||||||||
| Finance Co. Ltd. | 5,261 | 84,753 | ||||||
| L&T Finance Holdings Ltd. | 41,105 | 73,510 | ||||||
| RBL Bank Ltd., 144a | 12,530 | 88,536 | ||||||
| Health Care — 1.6% | ||||||||
| Jubilant Life Sciences Ltd. | 14,003 | 141,594 | ||||||
| Industrials — 1.3% | ||||||||
| HEG Ltd. | 2,431 | 112,240 | ||||||
| Information Technology — 2.8% | ||||||||
| Mphasis Ltd. | 8,874 | 143,664 | ||||||
| NIIT Technologies Ltd. | 6,679 | 101,130 | ||||||
| Materials — 1.7% | ||||||||
| National Aluminium Co. Ltd. | 121,224 | 101,410 | ||||||
| Phillips Carbon Black Ltd. | 16,289 | 46,091 | ||||||
| Utilities — 0.8% | ||||||||
| Indraprastha Gas Ltd. | 22,294 | 74,755 | ||||||
| Total India | 1,354,116 | |||||||
| China — 14.7% | ||||||||
| Consumer Discretionary — 2.4% | ||||||||
| Fu Shou Yuan International | ||||||||
| Group Ltd. | 86,000 | 67,155 | ||||||
| Tianneng Power International Ltd. | 90,000 | 79,562 | ||||||
| Xiabuxiabu Catering Management | ||||||||
| China Holdings Co. Ltd., 144a | 44,000 | 65,070 | ||||||
| Energy — 1.2% | ||||||||
| Anton Oilfield Services Group/Hong | ||||||||
| Kong* | 604,000 | 100,434 | ||||||
| Health Care — 0.9% | ||||||||
| YiChang HEC ChangJiang | ||||||||
| Pharmaceutical Co. Ltd., 144a | 18,600 | 77,265 | ||||||
| 72 |
Touchstone Emerging Markets Small Cap Fund (Continued)
| Market | ||||||||
| Shares | Value | |||||||
| Common Stocks — 98.6% (Continued) | ||||||||
| China — (Continued) | ||||||||
| Industrials — 1.2% | ||||||||
| Lonking Holdings Ltd. | 326,000 | $ | 104,957 | |||||
| Information Technology — 3.6% | ||||||||
| Baozun, Inc. ADR* | 1,810 | 87,930 | ||||||
| Chinasoft International Ltd. | 128,000 | 85,284 | ||||||
| Hollysys Automation Technologies | ||||||||
| Ltd. | 6,546 | 139,888 | ||||||
| Materials — 3.1% | ||||||||
| Maanshan Iron & Steel Co. Ltd. - | ||||||||
| Class H | 296,000 | 158,715 | ||||||
| West China Cement Ltd. | 584,000 | 109,620 | ||||||
| Real Estate — 2.3% | ||||||||
| Guangzhou R&F Properties Co. Ltd. - | ||||||||
| Class H | 62,800 | 115,218 | ||||||
| Yuzhou Properties Co. Ltd. | 216,000 | 87,598 | ||||||
| Total China | 1,278,696 | |||||||
| Thailand — 8.3% | ||||||||
| Energy — 1.5% | ||||||||
| Star Petroleum Refining PCL | 276,700 | 127,513 | ||||||
| Financials — 4.0% | ||||||||
| Krungthai Card PCL | 145,700 | 162,338 | ||||||
| Muangthai Capital PCL | 126,000 | 188,096 | ||||||
| Health Care — 1.4% | ||||||||
| Mega Lifesciences PCL | 105,700 | 121,824 | ||||||
| Real Estate — 1.4% | ||||||||
| Quality Houses PCL | 1,170,800 | 125,210 | ||||||
| Total Thailand | 724,981 | |||||||
| Brazil — 5.0% | ||||||||
| Consumer Discretionary — 1.6% | ||||||||
| Magazine Luiza SA | 1,700 | 51,776 | ||||||
| MRV Engenharia e Participacoes SA | 28,100 | 84,956 | ||||||
| Financials — 1.8% | ||||||||
| IRB Brasil Resseguros SA | 9,500 | 155,607 | ||||||
| Health Care — 0.8% | ||||||||
| Fleury SA | 14,000 | 74,393 | ||||||
| Industrials — 0.8% | ||||||||
| Iochpe Maxion SA | 15,600 | 73,393 | ||||||
| Total Brazil | 440,125 | |||||||
| South Africa — 4.9% | ||||||||
| Consumer Discretionary — 0.8% | ||||||||
| Truworths International Ltd. | 11,619 | 68,530 | ||||||
| Consumer Staples — 1.6% | ||||||||
| AVI Ltd. | 8,734 | 65,647 | ||||||
| Pick n Pay Stores Ltd. | 14,664 | 71,323 | ||||||
| Materials — 2.5% | ||||||||
| African Rainbow Minerals Ltd. | 9,474 | 86,149 | ||||||
| Sappi Ltd. | 21,395 | 134,274 | ||||||
| Total South Africa | 425,923 | |||||||
| Mexico — 3.3% | ||||||||
| Consumer Discretionary — 1.0% | ||||||||
| Alsea SAB de CV | 27,000 | 91,702 | ||||||
| Financials — 0.8% | ||||||||
| Banco del Bajio SA, 144a | 28,500 | 70,359 | ||||||
| Industrials — 1.5% | ||||||||
| Grupo Aeroportuario del Centro | ||||||||
| Norte SAB de CV | 17,800 | 127,218 | ||||||
| Total Mexico | 289,279 | |||||||
| Malaysia — 2.5% | ||||||||
| Industrials — 2.5% | ||||||||
| AirAsia Group Bhd | 132,000 | 100,759 | ||||||
| Malaysia Airports Holdings Bhd | 53,400 | 114,839 | ||||||
| Total Malaysia | 215,598 | |||||||
| Greece — 1.2% | ||||||||
| Consumer Discretionary — 1.2% | ||||||||
| JUMBO SA | 7,080 | 105,219 | ||||||
| Poland — 1.0% | ||||||||
| Consumer Staples — 1.0% | ||||||||
| Dino Polska SA, 144a* | 3,100 | 83,706 | ||||||
| Hong Kong — 0.9% | ||||||||
| Health Care — 0.9% | ||||||||
| SSY Group Ltd. | 82,000 | 79,390 | ||||||
| Hungary — 0.9% | ||||||||
| Health Care — 0.9% | ||||||||
| Richter Gedeon Nyrt | 4,206 | 78,660 | ||||||
| Cyprus — 0.9% | ||||||||
| Financials — 0.9% | ||||||||
| TCS Group Holding PLC GDR | 4,218 | 78,033 | ||||||
| Total Common Stocks | $ | 8,592,667 | ||||||
| 73 |
Touchstone Emerging Markets Small Cap Fund (Continued)
| Market | ||||||||
| Shares | Value | |||||||
| Short-Term Investment Fund — 0.5% | ||||||||
| Dreyfus Government Cash | ||||||||
| Management, Institutional Shares, | ||||||||
| 1.95%∞Ω | 40,369 | $ | 40,369 | |||||
| Total Investment Securities — 99.1% | ||||||||
| (Cost $9,132,294) | $ | 8,633,036 | ||||||
| Other Assets in Excess of Liabilities — 0.9% | 79,102 | |||||||
| Net Assets — 100.0% | $ | 8,712,138 | ||||||
| * | Non-income producing security. |
| ∞ | Open-End Fund. |
| Ω | Represents the 7-day SEC yield as of September 30, 2018. |
Portfolio Abbreviations:
ADR - American Depositary Receipt
GDR - Global Depositary Receipt
PCL - Public Company Limited
PLC - Public Limited Company
144a - This is a restricted security that was sold in a transaction qualifying for the exemption under Rule 144a of the Securities Act of 1933. This security may be sold in transactions exempt from registration, normally to qualified institutional buyers. At September 30, 2018, these securities were valued at $384,936 or 4.4% of net assets. These securities were deemed liquid pursuant to procedures approved by the Board of Trustees.
Other Information:
The inputs or methodology used for valuing securities may not be an indication of the risk associated with investing in those securities. For more information on valuation inputs, and their aggregation into the levels used in the table below, please refer to the security valuation section in the accompanying Notes to Financial Statements.
| Valuation inputs at Reporting Date: | ||||||||||||||||
| Description | Level 1 | Level 2 | Level 3 | Total | ||||||||||||
| Common Stocks | ||||||||||||||||
| South Korea | $ | 89,403 | $ | 1,792,012 | $ | — | $ | 1,881,415 | ||||||||
| Taiwan | 99,040 | 1,458,486 | — | 1,557,526 | ||||||||||||
| India | — | 1,354,116 | — | 1,354,116 | ||||||||||||
| China | 227,818 | 1,050,878 | — | 1,278,696 | ||||||||||||
| Thailand | — | 724,981 | — | 724,981 | ||||||||||||
| Brazil | 440,125 | — | — | 440,125 | ||||||||||||
| South Africa | 357,393 | 68,530 | — | 425,923 | ||||||||||||
| Mexico | 289,279 | — | — | 289,279 | ||||||||||||
| Malaysia | 114,839 | 100,759 | — | 215,598 | ||||||||||||
| Greece | 105,219 | — | — | 105,219 | ||||||||||||
| Poland | — | 83,706 | — | 83,706 | ||||||||||||
| Hong Kong | — | 79,390 | — | 79,390 | ||||||||||||
| Hungary | — | 78,660 | — | 78,660 | ||||||||||||
| Cyprus | 78,033 | — | — | 78,033 | ||||||||||||
| Short-Term Investment Fund | 40,369 | — | — | 40,369 | ||||||||||||
| Total | $ | 1,841,518 | $ | 6,791,518 | $ | — | $ | 8,633,036 | ||||||||
See accompanying Notes to Financial Statements.
| 74 |
Touchstone High Yield Fund – September 30, 2018
| Principal | Market | |||||||
| Amount | Value | |||||||
| Corporate Bonds — 98.6% | ||||||||
| Consumer Discretionary — 22.4% | ||||||||
| $ | 263,000 | 1011778 BC ULC / New Red Finance, | ||||||
| Inc. (Canada), 144a, 4.250%, 5/15/24 | $ | 249,192 | ||||||
| 700,000 | 1011778 BC ULC / New Red Finance, | |||||||
| Inc. (Canada), 144a, | ||||||||
| 5.000%, 10/15/25 | 670,257 | |||||||
| 761,000 | ACCO Brands Corp., 144a, | |||||||
| 5.250%, 12/15/24 | 755,293 | |||||||
| 1,499,000 | Altice Financing SA (Luxembourg), | |||||||
| 144a, 6.625%, 2/15/23 | 1,510,243 | |||||||
| 463,000 | Altice Financing SA (Luxembourg), | |||||||
| 144a, 7.500%, 5/15/26 | 451,425 | |||||||
| 824,000 | Altice France SA (France), 144a, | |||||||
| 6.250%, 5/15/24 | 811,640 | |||||||
| 334,000 | Altice France SA (France), 144a, | |||||||
| 7.375%, 5/1/26 | 334,000 | |||||||
| 635,000 | Altice France SA (France), 144a, | |||||||
| 8.125%, 2/1/27 | 654,050 | |||||||
| 400,000 | Altice US Finance I Corp., 144a, | |||||||
| 5.375%, 7/15/23 | 404,500 | |||||||
| 561,000 | Altice US Finance I Corp., 144a, | |||||||
| 5.500%, 5/15/26 | 560,299 | |||||||
| 265,000 | AMC Networks, Inc., 4.750%, 8/1/25 | 253,406 | ||||||
| 292,000 | AMC Networks, Inc., 5.000%, 4/1/24 | 287,620 | ||||||
| 245,000 | Aramark Services, Inc., 144a, | |||||||
| 5.000%, 2/1/28 | 240,406 | |||||||
| 446,000 | Avis Budget Car Rental LLC / Avis | |||||||
| Budget Finance, Inc., | ||||||||
| 5.500%, 4/1/23 | 443,632 | |||||||
| 798,000 | Avis Budget Car Rental LLC / Avis | |||||||
| Budget Finance, Inc., 144a, | ||||||||
| 5.125%, 6/1/22 | 819,047 | |||||||
| 1,173,000 | Avon Products, Inc., 6.600%, 3/15/20(A) | 1,178,865 | ||||||
| 985,000 | Belo Corp., 7.250%, 9/15/27 | 1,019,475 | ||||||
| 339,000 | Block Communications, Inc., 144a, | |||||||
| 6.875%, 2/15/25 | 347,475 | |||||||
| 861,000 | Booz Allen Hamilton, Inc., 144a, | |||||||
| 5.125%, 5/1/25 | 845,932 | |||||||
| 555,000 | Brinker International, Inc., | |||||||
| 3.875%, 5/15/23 | 523,088 | |||||||
| 534,000 | Brinker International, Inc., 144a, | |||||||
| 5.000%, 10/1/24 | 504,630 | |||||||
| 249,000 | Brookfield Residential Properties, Inc. | |||||||
| (Canada), 144a, 6.375%, 5/15/25 | 244,020 | |||||||
| 247,000 | Brookfield Residential Properties, Inc. / | |||||||
| Brookfield Residential US Corp. | ||||||||
| (Canada), 144a, 6.125%, 7/1/22 | 247,000 | |||||||
| 769,000 | Cablevision Systems Corp., | |||||||
| 5.875%, 9/15/22 | 783,899 | |||||||
| 825,000 | Cardtronics, Inc., 5.125%, 8/1/22 | 811,965 | ||||||
| 225,000 | Cardtronics, Inc. / Cardtronics USA | |||||||
| Inc., 144a, 5.500%, 5/1/25 | 214,875 | |||||||
| 271,000 | CCO Holdings LLC / CCO Holdings | |||||||
| Capital Corp., 5.750%, 1/15/24 | 275,404 | |||||||
| 797,000 | CCO Holdings LLC / CCO Holdings | |||||||
| Capital Corp., 144a, 5.125%, 5/1/27 | 755,158 | |||||||
| 957,000 | CCO Holdings LLC / CCO Holdings | |||||||
| Capital Corp., 144a, 5.375%, 5/1/25 | 949,822 | |||||||
| 1,325,000 | CCO Holdings LLC / CCO Holdings | |||||||
| Capital Corp., 144a, 5.750%, 2/15/26 | 1,328,312 | |||||||
| 190,000 | CCO Holdings LLC / CCO Holdings | |||||||
| Capital Corp., 144a, 5.875%, 4/1/24 | 193,088 | |||||||
| 231,000 | Cedar Fair LP / Canada’s Wonderland | |||||||
| Co. / Magnum Management Corp., | ||||||||
| 5.375%, 6/1/24 | 229,845 | |||||||
| 653,000 | Central Garden & Pet Co., | |||||||
| 5.125%, 2/1/28 | 620,350 | |||||||
| 735,000 | Churchill Downs, Inc., 144a, | |||||||
| 4.750%, 1/15/28 | 687,225 | |||||||
| 395,000 | Downstream Development Authority | |||||||
| of the Quapaw Tribe of Oklahoma, | ||||||||
| 144a, 10.500%, 2/15/23 | 403,888 | |||||||
| 447,000 | GLP Capital LP / GLP Financing II, Inc., | |||||||
| 5.250%, 6/1/25 | 454,241 | |||||||
| 243,000 | GLP Capital LP / GLP Financing II, Inc., | |||||||
| 5.375%, 11/1/23 | 251,126 | |||||||
| 1,025,000 | GLP Capital LP / GLP Financing II, Inc., | |||||||
| 5.375%, 4/15/26 | 1,040,898 | |||||||
| 432,000 | GLP Capital LP / GLP Financing II, Inc., | |||||||
| 5.750%, 6/1/28 | 444,420 | |||||||
| 1,015,000 | Group 1 Automotive, Inc., 144a, | |||||||
| 5.250%, 12/15/23 | 999,775 | |||||||
| 581,000 | Hanesbrands, Inc., 144a, | |||||||
| 4.625%, 5/15/24 | 564,659 | |||||||
| 474,000 | Hertz Corp. (The), 5.875%, 10/15/20 | 471,630 | ||||||
| 540,000 | Hertz Corp. (The), 144a, | |||||||
| 7.625%, 6/1/22 | 533,250 | |||||||
| 627,000 | Hilton Domestic Operating Co., Inc., | |||||||
| 144a, 5.125%, 5/1/26 | 623,865 | |||||||
| 1,051,000 | International Game Technology PLC | |||||||
| (United Kingdom), 144a, | ||||||||
| 6.250%, 2/15/22 | 1,089,099 | |||||||
| 445,000 | International Game Technology PLC | |||||||
| (United Kingdom), 144a, | ||||||||
| 6.250%, 1/15/27 | 450,518 | |||||||
| 638,000 | KFC Holding Co./Pizza Hut Holdings | |||||||
| LLC/Taco Bell of America LLC, 144a, | ||||||||
| 5.000%, 6/1/24 | 632,819 | |||||||
| 270,000 | Lennar Corp., 4.125%, 1/15/22 | 267,300 | ||||||
| 388,000 | Lennar Corp., 4.500%, 4/30/24 | 379,930 | ||||||
| 402,000 | Lennar Corp., 4.750%, 5/30/25 | 391,950 | ||||||
| 437,000 | Lennar Corp., 4.750%, 11/29/27 | 419,520 | ||||||
| 398,000 | Lennar Corp., 4.875%, 12/15/23 | 400,985 | ||||||
| 620,000 | Lennar Corp., 5.375%, 10/1/22 | 636,275 | ||||||
| 168,000 | Lennar Corp., 5.875%, 11/15/24 | 174,930 | ||||||
| 305,000 | Live Nation Entertainment, Inc., 144a, | |||||||
| 4.875%, 11/1/24 | 298,900 | |||||||
| 191,000 | Live Nation Entertainment, Inc., 144a, | |||||||
| 5.625%, 3/15/26 | 192,910 | |||||||
| 356,000 | LSC Communications, Inc., 144a, | |||||||
| 8.750%, 10/15/23 | 359,560 | |||||||
| 998,000 | Mattel, Inc., 144a, 6.750%, 12/31/25 | 978,040 | ||||||
| 75 |
Touchstone High Yield Fund (Continued)
| Principal | Market | |||||||
| Amount | Value | |||||||
| Corporate Bonds — 98.6% (Continued) | ||||||||
| Consumer Discretionary — (Continued) | ||||||||
| $ | 474,000 | MDC Partners, Inc. (Canada), 144a, | ||||||
| 6.500%, 5/1/24 | $ | 419,490 | ||||||
| 1,047,000 | MGM Resorts International, | |||||||
| 6.000%, 3/15/23 | 1,082,336 | |||||||
| 546,000 | New Home Co., Inc. (The), | |||||||
| 7.250%, 4/1/22 | 556,920 | |||||||
| 582,000 | Party City Holdings, Inc., 144a, | |||||||
| 6.625%, 8/1/26 | 589,275 | |||||||
| 343,000 | Penske Automotive Group, Inc., | |||||||
| 5.375%, 12/1/24 | 336,140 | |||||||
| 300,000 | PulteGroup, Inc., 5.500%, 3/1/26 | 298,500 | ||||||
| 810,000 | Quad/Graphics, Inc., 7.000%, 5/1/22 | 820,125 | ||||||
| 700,000 | Quebecor Media, Inc. (Canada), | |||||||
| 5.750%, 1/15/23 | 720,125 | |||||||
| 200,000 | QVC, Inc., 5.125%, 7/2/22 | 202,611 | ||||||
| 246,000 | Sabre GLBL, Inc., 144a, | |||||||
| 5.250%, 11/15/23 | 246,000 | |||||||
| 343,000 | Sabre GLBL, Inc., 144a, | |||||||
| 5.375%, 4/15/23 | 345,120 | |||||||
| 276,000 | Scotts Miracle-Gro Co. (The), | |||||||
| 5.250%, 12/15/26 | 264,960 | |||||||
| 253,000 | Service Corp. International, | |||||||
| 5.375%, 5/15/24 | 257,159 | |||||||
| 896,000 | ServiceMaster Co. LLC (The), 144a, | |||||||
| 5.125%, 11/15/24 | 882,560 | |||||||
| 440,000 | Sirius XM Radio, Inc., 144a, | |||||||
| 5.375%, 4/15/25 | 441,650 | |||||||
| 248,000 | Sirius XM Radio, Inc., 144a, | |||||||
| 5.375%, 7/15/26 | 246,140 | |||||||
| 243,000 | Sonic Automotive, Inc., | |||||||
| 5.000%, 5/15/23 | 229,028 | |||||||
| 212,000 | Sonic Automotive, Inc., | |||||||
| 6.125%, 3/15/27 | 198,220 | |||||||
| 1,003,000 | Taylor Morrison Communities, Inc. / | |||||||
| Taylor Morrison Holdings II Inc., | ||||||||
| 144a, 5.625%, 3/1/24 | 987,955 | |||||||
| 353,000 | United Rentals North America, Inc., | |||||||
| 4.625%, 10/15/25 | 342,410 | |||||||
| 1,067,000 | United Rentals North America, Inc., | |||||||
| 5.875%, 9/15/26 | 1,095,009 | |||||||
| 490,000 | William Lyon Homes, Inc., | |||||||
| 5.875%, 1/31/25 | 455,088 | |||||||
| 632,000 | Wyndham Hotels & Resorts, Inc., 144a, | |||||||
| 5.375%, 4/15/26 | 626,470 | |||||||
| 44,309,217 | ||||||||
| Energy — 15.4% | ||||||||
| 789,000 | Ascent Resources Utica Holdings LLC / | |||||||
| ARU Finance Corp., 144a, | ||||||||
| 7.000%, 11/1/26 | 786,041 | |||||||
| 584,000 | Blue Racer Midstream LLC / Blue Racer | |||||||
| Finance Corp., 144a, | ||||||||
| 6.125%, 11/15/22 | 599,330 | |||||||
| 1,176,000 | Blue Racer Midstream LLC / Blue Racer | |||||||
| Finance Corp., 144a, | ||||||||
| 6.625%, 7/15/26 | 1,198,050 | |||||||
| 510,000 | Carrizo Oil & Gas, Inc., | |||||||
| 6.250%, 4/15/23† | 520,838 | |||||||
| 200,000 | Cheniere Corpus Christi Holdings LLC, | |||||||
| 5.125%, 6/30/27 | 200,750 | |||||||
| 638,000 | Cheniere Corpus Christi Holdings LLC, | |||||||
| 5.875%, 3/31/25 | 670,698 | |||||||
| 982,000 | Cheniere Corpus Christi Holdings LLC, | |||||||
| 7.000%, 6/30/24 | 1,075,290 | |||||||
| 725,000 | Delek Logistics Partners LP / Delek | |||||||
| Logistics Finance Corp., | ||||||||
| 6.750%, 5/15/25 | 730,438 | |||||||
| 499,000 | Endeavor Energy Resources LP / EER | |||||||
| Finance, Inc., 144a, 5.750%, 1/30/28 | 499,000 | |||||||
| 524,000 | Energy Transfer Equity LP, | |||||||
| 5.500%, 6/1/27 | 543,807 | |||||||
| 823,000 | Ensco PLC (United Kingdom), | |||||||
| 7.750%, 2/1/26 | 816,828 | |||||||
| 204,000 | Exterran Energy Solutions LP / EES | |||||||
| Finance Corp., 8.125%, 5/1/25 | 213,180 | |||||||
| 895,000 | Extraction Oil & Gas, Inc., 144a, | |||||||
| 5.625%, 2/1/26 | 792,075 | |||||||
| 251,000 | Genesis Energy LP / Genesis Energy | |||||||
| Finance Corp., 6.000%, 5/15/23 | 247,549 | |||||||
| 506,000 | Genesis Energy LP / Genesis Energy | |||||||
| Finance Corp., 6.250%, 5/15/26 | 481,965 | |||||||
| 581,000 | Genesis Energy LP / Genesis Energy | |||||||
| Finance Corp., 6.750%, 8/1/22 | 592,620 | |||||||
| 1,493,000 | Gulfport Energy Corp., | |||||||
| 6.375%, 5/15/25 | 1,463,140 | |||||||
| 345,000 | Hilcorp Energy I LP / Hilcorp Finance | |||||||
| Co., 144a, 5.750%, 10/1/25 | 346,294 | |||||||
| 327,000 | Jagged Peak Energy LLC, 144a, | |||||||
| 5.875%, 5/1/26 | 325,365 | |||||||
| 487,000 | Magnolia Oil & Gas Operating LLC / | |||||||
| Magnolia Oil & Gas Finance Corp., | ||||||||
| 144a, 6.000%, 8/1/26 | 485,782 | |||||||
| 1,076,000 | Murphy Oil USA, Inc., 5.625%, 5/1/27 | 1,067,930 | ||||||
| 646,000 | NGPL PipeCo LLC, 144a, | |||||||
| 7.768%, 12/15/37 | 791,350 | |||||||
| 1,206,000 | Parkland Fuel Corp. (Canada), 144a, | |||||||
| 6.000%, 4/1/26 | 1,209,015 | |||||||
| 421,000 | PDC Energy, Inc., 5.750%, 5/15/26 | 399,950 | ||||||
| 1,012,000 | PDC Energy, Inc., 6.125%, 9/15/24 | 995,555 | ||||||
| 574,000 | Peabody Energy Corp., 144a, | |||||||
| 6.000%, 3/31/22 | 584,045 | |||||||
| 477,000 | Precision Drilling Corp. (Canada), | |||||||
| 7.750%, 12/15/23 | 506,216 | |||||||
| 320,000 | Precision Drilling Corp. (Canada), 144a, | |||||||
| 7.125%, 1/15/26 | 328,800 | |||||||
| 276,000 | QEP Resources, Inc., 5.375%, 10/1/22 | 277,035 | ||||||
| 193,000 | QEP Resources, Inc., 5.625%, 3/1/26 | 184,556 | ||||||
| 598,000 | QEP Resources, Inc., 6.800%, 3/1/20 | 623,415 | ||||||
| 627,000 | Range Resources Corp., | |||||||
| 5.000%, 8/15/22 | 619,946 | |||||||
| 174,000 | Range Resources Corp., | |||||||
| 5.000%, 3/15/23 | 170,520 | |||||||
| 76 |
Touchstone High Yield Fund (Continued)
| Principal | Market | |||||||
| Amount | Value | |||||||
| Corporate Bonds — 98.6% (Continued) | ||||||||
| Energy — (Continued) | ||||||||
| $ | 15,000 | Range Resources Corp., | ||||||
| 5.750%, 6/1/21 | $ | 15,431 | ||||||
| 581,000 | SemGroup Corp. / Rose Rock Finance | |||||||
| Corp., 5.625%, 11/15/23 | 565,022 | |||||||
| 1,379,000 | Shelf Drilling Holdings Ltd. (Cayman | |||||||
| Islands), 144a, 8.250%, 2/15/25 | 1,422,094 | |||||||
| 982,000 | Southwestern Energy Co., | |||||||
| 6.200%, 1/23/25(A)† | 974,635 | |||||||
| 896,000 | Southwestern Energy Co., | |||||||
| 7.500%, 4/1/26† | 938,560 | |||||||
| 784,000 | Tallgrass Energy Partners LP / Tallgrass | |||||||
| Energy Finance Corp., 144a, | ||||||||
| 4.750%, 10/1/23 | 783,765 | |||||||
| 1,080,000 | Tallgrass Energy Partners LP / Tallgrass | |||||||
| Energy Finance Corp., 144a, | ||||||||
| 5.500%, 9/15/24 | 1,100,250 | |||||||
| 453,000 | Tallgrass Energy Partners LP / Tallgrass | |||||||
| Energy Finance Corp., 144a, | ||||||||
| 5.500%, 1/15/28 | 456,964 | |||||||
| 313,000 | TerraForm Power Operating LLC, 144a, | |||||||
| 4.250%, 1/31/23 | 305,958 | |||||||
| 313,000 | TerraForm Power Operating LLC, 144a, | |||||||
| 5.000%, 1/31/28 | 291,090 | |||||||
| 104,000 | Transocean Guardian Ltd. (Cayman | |||||||
| Islands), 144a, 5.875%, 1/15/24 | 104,910 | |||||||
| 693,600 | Transocean Phoenix 2 Ltd. (Cayman | |||||||
| Islands), 144a, 7.750%, 10/15/24 | 730,014 | |||||||
| 102,000 | Transocean Pontus Ltd. (Cayman | |||||||
| Islands), 144a, 6.125%, 8/1/25 | 103,656 | |||||||
| 554,000 | Tullow Oil PLC (United Kingdom), | |||||||
| 144a, 7.000%, 3/1/25 | 540,150 | |||||||
| 353,000 | Ultra Resources, Inc., 144a, | |||||||
| 6.875%, 4/15/22 | 167,675 | |||||||
| 475,000 | Ultra Resources, Inc., 144a, | |||||||
| 7.125%, 4/15/25 | 192,375 | |||||||
| 1,484,000 | Unit Corp., 6.625%, 5/15/21 | 1,484,000 | ||||||
| 30,523,922 | ||||||||
| Telecommunication Services — 11.9% | ||||||||
| 580,000 | CenturyLink, Inc., 5.625%, 4/1/25† | 567,124 | ||||||
| 584,000 | CenturyLink, Inc., 5.800%, 3/15/22 | 594,220 | ||||||
| 436,000 | CenturyLink, Inc., 6.450%, 6/15/21 | 452,350 | ||||||
| 300,000 | CenturyLink, Inc., 6.750%, 12/1/23† | 311,625 | ||||||
| 564,000 | CenturyLink, Inc., 6.875%, 1/15/28 | 541,496 | ||||||
| 741,000 | CommScope Technologies LLC, 144a, | |||||||
| 5.000%, 3/15/27 | 713,212 | |||||||
| 703,000 | CommScope Technologies LLC, 144a, | |||||||
| 5.500%, 6/15/24 | 708,272 | |||||||
| 1,139,000 | CSC Holdings LLC, 5.250%, 6/1/24 | 1,113,372 | ||||||
| 190,000 | CSC Holdings LLC, 144a, | |||||||
| 6.625%, 10/15/25 | 200,212 | |||||||
| 2,123,000 | DISH DBS Corp., 5.875%, 7/15/22 | 2,072,175 | ||||||
| 2,027,000 | DISH DBS Corp., 6.750%, 6/1/21 | 2,070,074 | ||||||
| 489,000 | EW Scripps Co. (The), 144a, | |||||||
| 5.125%, 5/15/25 | 470,051 | |||||||
| 290,000 | Frontier Communications Corp., | |||||||
| 8.500%, 4/15/20† | 292,900 | |||||||
| 1,541,000 | Frontier Communications Corp., | |||||||
| 10.500%, 9/15/22 | 1,371,490 | |||||||
| 298,000 | Frontier Communications Corp., 144a, | |||||||
| 8.500%, 4/1/26 | 281,610 | |||||||
| 549,000 | Gray Television, Inc., 144a, | |||||||
| 5.125%, 10/15/24 | 530,471 | |||||||
| 416,000 | Intelsat Jackson Holdings SA | |||||||
| (Luxembourg), 5.500%, 8/1/23 | 383,240 | |||||||
| 49,000 | Intelsat Jackson Holdings SA | |||||||
| (Luxembourg), 7.500%, 4/1/21 | 49,612 | |||||||
| 421,000 | Level 3 Financing, Inc., 5.625%, 2/1/23 | 425,778 | ||||||
| 507,000 | Meredith Corp., 144a, 6.875%, 2/1/26 | 519,675 | ||||||
| 113,000 | Nexstar Broadcasting, Inc., 144a, | |||||||
| 5.625%, 8/1/24 | 110,599 | |||||||
| 362,000 | Nokia OYJ (Finland), 4.375%, 6/12/27 | 348,425 | ||||||
| 652,000 | Qualitytech LP/QTS Finance Corp., | |||||||
| 144a, 4.750%, 11/15/25 | 624,414 | |||||||
| 505,000 | Sprint Capital Corp., 6.875%, 11/15/28 | 507,525 | ||||||
| 2,599,000 | Sprint Corp., 7.125%, 6/15/24 | 2,696,462 | ||||||
| 223,000 | Sprint Corp., 7.625%, 2/15/25 | 236,492 | ||||||
| 293,000 | Sprint Corp., 7.625%, 3/1/26 | 310,214 | ||||||
| 353,000 | Telecom Italia Capital SA | |||||||
| (Luxembourg), 6.000%, 9/30/34 | 336,232 | |||||||
| 865,000 | Telecom Italia Capital SA | |||||||
| (Luxembourg), 6.375%, 11/15/33 | 847,700 | |||||||
| 1,196,000 | T-Mobile USA, Inc., 6.000%, 4/15/24 | 1,239,355 | ||||||
| 480,000 | T-Mobile USA, Inc., 6.500%, 1/15/26 | 502,896 | ||||||
| 222,000 | Univision Communications, Inc., 144a, | |||||||
| 5.125%, 5/15/23 | 212,010 | |||||||
| 263,000 | Univision Communications, Inc., 144a, | |||||||
| 5.125%, 2/15/25 | 245,905 | |||||||
| 374,000 | UPCB Finance IV Ltd. (Cayman Islands), | |||||||
| 144a, 5.375%, 1/15/25 | 373,532 | |||||||
| 636,000 | ViaSat, Inc., 144a, 5.625%, 9/15/25 | 601,211 | ||||||
| 575,000 | Zayo Group LLC / Zayo Capital, Inc., | |||||||
| 144a, 5.750%, 1/15/27 | 575,000 | |||||||
| 23,436,931 | ||||||||
| Health Care — 8.8% | ||||||||
| 637,000 | Acadia Healthcare Co., Inc., | |||||||
| 5.625%, 2/15/23 | 640,185 | |||||||
| 475,000 | Acadia Healthcare Co., Inc., | |||||||
| 6.500%, 3/1/24 | 491,031 | |||||||
| 492,000 | Bausch Health Cos, Inc. (Canada), | |||||||
| 144a, 6.125%, 4/15/25 | 467,400 | |||||||
| 613,000 | Centene Corp., 4.750%, 1/15/25 | 611,468 | ||||||
| 216,000 | Centene Corp., 144a, 5.375%, 6/1/26 | 221,152 | ||||||
| 544,000 | CHS/Community Health Systems, Inc., | |||||||
| 6.250%, 3/31/23 | 516,637 | |||||||
| 694,000 | DaVita, Inc., 5.125%, 7/15/24 | 669,710 | ||||||
| 1,050,000 | Encompass Health Corp., | |||||||
| 5.750%, 11/1/24 | 1,057,875 | |||||||
| 488,000 | Envision Healthcare Corp., | |||||||
| 5.625%, 7/15/22 | 501,762 | |||||||
| 77 |
Touchstone High Yield Fund (Continued)
| Principal | Market | |||||||
| Amount | Value | |||||||
| Corporate Bonds — 98.6% (Continued) | ||||||||
| Health Care — (Continued) | ||||||||
| $ | 156,000 | Envision Healthcare Corp., 144a, | ||||||
| 5.125%, 7/1/22 | $ | 159,822 | ||||||
| 90,000 | Envision Healthcare Corp., 144a, | |||||||
| 6.250%, 12/1/24 | 96,750 | |||||||
| 1,662,000 | HCA, Inc., 5.375%, 2/1/25 | 1,695,240 | ||||||
| 325,000 | HCA, Inc., 5.375%, 9/1/26 | 328,250 | ||||||
| 371,000 | HCA, Inc., 5.875%, 5/1/23 | 391,405 | ||||||
| 1,602,000 | HCA, Inc., 5.875%, 2/15/26 | 1,668,082 | ||||||
| 591,000 | HLF Financing Sarl LLC / Herbalife | |||||||
| International, Inc., 144a, | ||||||||
| 7.250%, 8/15/26 | 600,604 | |||||||
| 410,000 | Mallinckrodt International Finance SA | |||||||
| / Mallinckrodt CB LLC | ||||||||
| (Luxembourg), 144a, | ||||||||
| 4.875%, 4/15/20 | 405,900 | |||||||
| 687,000 | Mallinckrodt International Finance SA | |||||||
| / Mallinckrodt CB LLC | ||||||||
| (Luxembourg), 144a, | ||||||||
| 5.750%, 8/1/22 | 633,758 | |||||||
| 338,000 | MEDNAX, Inc., 144a, 5.250%, 12/1/23 | 338,422 | ||||||
| 684,000 | Select Medical Corp., 6.375%, 6/1/21 | 691,695 | ||||||
| 562,000 | Teleflex, Inc., 4.875%, 6/1/26 | 556,380 | ||||||
| 223,000 | Tenet Healthcare Corp., | |||||||
| 4.500%, 4/1/21 | 221,885 | |||||||
| 705,000 | Tenet Healthcare Corp., | |||||||
| 5.125%, 5/1/25 | 694,425 | |||||||
| 637,000 | Tenet Healthcare Corp., | |||||||
| 6.000%, 10/1/20 | 657,925 | |||||||
| 320,000 | Tenet Healthcare Corp., 144a, | |||||||
| 7.500%, 1/1/22 | 334,000 | |||||||
| 50,000 | Teva Pharmaceutical Finance | |||||||
| Netherlands III BV (Netherlands), | ||||||||
| 6.000%, 4/15/24 | 50,772 | |||||||
| 1,389,000 | Teva Pharmaceutical Finance | |||||||
| Netherlands III BV (Netherlands), | ||||||||
| 6.750%, 3/1/28 | 1,465,208 | |||||||
| 997,000 | Universal Hospital Services, Inc., | |||||||
| 7.625%, 8/15/20 | 998,246 | |||||||
| 225,000 | WellCare Health Plans, Inc., 144a, | |||||||
| 5.375%, 8/15/26 | 228,938 | |||||||
| 17,394,927 | ||||||||
| Consumer Staples — 8.3% | ||||||||
| 1,123,000 | Albertsons Cos. LLC / Safeway, Inc. / | |||||||
| New Albertson’s Inc. / Albertson’s | ||||||||
| LLC, 5.750%, 3/15/25 | 1,010,700 | |||||||
| 870,000 | American Builders & Contractors | |||||||
| Supply Co., Inc., 144a, | ||||||||
| 5.875%, 5/15/26 | 872,175 | |||||||
| 303,000 | �� | American Woodmark Corp., 144a, | ||||||
| 4.875%, 3/15/26 | 289,365 | |||||||
| 1,020,000 | B&G Foods, Inc., 5.250%, 4/1/25† | 974,100 | ||||||
| 521,000 | Beacon Roofing Supply, Inc., 144a, | |||||||
| 4.875%, 11/1/25 | 479,971 | |||||||
| 788,000 | Carriage Services, Inc., 144a, | |||||||
| 6.625%, 6/1/26 | 805,730 | |||||||
| 644,000 | Cimpress NV. (Netherlands), 144a, | |||||||
| 7.000%, 6/15/26 | 654,388 | |||||||
| 818,000 | Cott Holdings, Inc., 144a, | |||||||
| 5.500%, 4/1/25 | 798,572 | |||||||
| 374,000 | Cumberland Farms, Inc., 144a, | |||||||
| 6.750%, 5/1/25 | 383,350 | |||||||
| 748,000 | First Quality Finance Co., Inc., 144a, | |||||||
| 5.000%, 7/1/25 | 699,380 | |||||||
| 477,000 | Graham Holdings Co., 144a, | |||||||
| 5.750%, 6/1/26 | 488,329 | |||||||
| 455,000 | H&E Equipment Services, Inc., | |||||||
| 5.625%, 9/1/25 | 453,862 | |||||||
| 949,000 | Ingles Markets, Inc., 5.750%, 6/15/23 | 960,862 | ||||||
| 234,000 | JBS USA LUX SA / JBS USA Finance, | |||||||
| Inc., 144a, 5.875%, 7/15/24 | 230,490 | |||||||
| 478,000 | JBS USA LUX SA / JBS USA Finance, | |||||||
| Inc., 144a, 6.750%, 2/15/28 | 475,012 | |||||||
| 298,000 | JBS USA LUX SA / JBS USA Finance, | |||||||
| Inc., 144a, 7.250%, 6/1/21 | 302,470 | |||||||
| 160,000 | JBS USA LUX SA / JBS USA Finance, | |||||||
| Inc., 144a, 7.250%, 6/1/21 | 162,400 | |||||||
| 497,000 | Lamb Weston Holdings, Inc., 144a, | |||||||
| 4.625%, 11/1/24 | 485,818 | |||||||
| 760,000 | Performance Food Group, Inc., 144a, | |||||||
| 5.500%, 6/1/24 | 752,400 | |||||||
| 631,000 | Pilgrim’s Pride Corp., 144a, | |||||||
| 5.750%, 3/15/25 | 607,338 | |||||||
| 816,000 | Post Holdings, Inc., 144a, | |||||||
| 5.000%, 8/15/26 | 771,569 | |||||||
| 502,000 | Post Holdings, Inc., 144a, | |||||||
| 5.625%, 1/15/28 | 483,175 | |||||||
| 1,917,000 | Rite Aid Corp., 144a, 6.125%, 4/1/23 | 1,718,111 | ||||||
| 125,000 | Service Corp. International/US, | |||||||
| 7.500%, 4/1/27 | 140,548 | |||||||
| 1,402,000 | Staples, Inc., 144a, 8.500%, 9/15/25 | 1,321,385 | ||||||
| 16,321,500 | ||||||||
| Industrials — 8.0% | ||||||||
| 502,000 | Adient Global Holdings Ltd. (Jersey), | |||||||
| 144a, 4.875%, 8/15/26 | 446,153 | |||||||
| 520,000 | AECOM Global II LLC / URS Fox US LP, | |||||||
| 5.000%, 4/1/22(A) | 525,668 | |||||||
| 651,763 | American Airlines 2013-2 Class B Pass | |||||||
| Through Trust, 144a, | ||||||||
| 5.600%, 7/15/20 | 663,169 | |||||||
| 774,000 | Amsted Industries, Inc., 144a, | |||||||
| 5.375%, 9/15/24 | 766,260 | |||||||
| 510,000 | Ardagh Packaging Finance PLC / | |||||||
| Ardagh Holdings USA, Inc. (Ireland), | ||||||||
| 144a, 6.000%, 2/15/25 | 499,163 | |||||||
| 315,000 | Ball Corp., 4.875%, 3/15/26 | 314,058 | ||||||
| 655,000 | BBA US Holdings, Inc., 144a, | |||||||
| 5.375%, 5/1/26 | 655,819 | |||||||
| 591,000 | Bombardier, Inc. (Canada), 144a, | |||||||
| 6.000%, 10/15/22 | 592,501 | |||||||
| 367,000 | BWX Technologies, Inc., 144a, | |||||||
| 5.375%, 7/15/26 | 368,376 | |||||||
| 78 |
Touchstone High Yield Fund (Continued)
| Principal | Market | |||||||
| Amount | Value | |||||||
| Corporate Bonds — 98.6% (Continued) | ||||||||
| Industrials — (Continued) | ||||||||
| $ | 622,000 | Crown Americas LLC / Crown | ||||||
| Americas Capital Corp. VI, 144a, | ||||||||
| 4.750%, 2/1/26 | $ | 594,010 | ||||||
| 107,000 | Energizer Gamma Acquisition, Inc., | |||||||
| 144a, 6.375%, 7/15/26 | 110,611 | |||||||
| 166,000 | Energizer Holdings, Inc., 144a, | |||||||
| 5.500%, 6/15/25 | 165,170 | |||||||
| 984,000 | Goodyear Tire & Rubber Co. (The), | |||||||
| 5.125%, 11/15/23† | 984,000 | |||||||
| 287,000 | James Hardie International Finance | |||||||
| DAC (Ireland), 144a, | ||||||||
| 4.750%, 1/15/25 | 277,730 | |||||||
| 612,000 | JB Poindexter & Co., Inc., 144a, | |||||||
| 7.125%, 4/15/26 | 634,950 | |||||||
| 400,000 | Louisiana-Pacific Corp., | |||||||
| 4.875%, 9/15/24 | 399,000 | |||||||
| 804,000 | Multi-Color Corp., 144a, | |||||||
| 4.875%, 11/1/25 | 751,740 | |||||||
| 436,000 | Multi-Color Corp., 144a, | |||||||
| 6.125%, 12/1/22 | 445,810 | |||||||
| 701,000 | New Enterprise Stone & Lime Co., Inc., | |||||||
| 144a, 6.250%, 3/15/26 | 706,258 | |||||||
| 764,000 | Novelis Corp., 144a, 5.875%, 9/30/26 | 746,428 | ||||||
| 191,000 | Novelis Corp., 144a, 6.250%, 8/15/24 | 195,536 | ||||||
| 256,000 | Owens-Brockway Glass Container, Inc., | |||||||
| 144a, 5.875%, 8/15/23 | 263,360 | |||||||
| 1,036,000 | Plastipak Holdings, Inc., 144a, | |||||||
| 6.250%, 10/15/25 | 945,350 | |||||||
| 267,000 | Silgan Holdings, Inc., 4.750%, 3/15/25 | 255,986 | ||||||
| 989,000 | Standard Industries, Inc./NJ, 144a, | |||||||
| 5.375%, 11/15/24 | 987,764 | |||||||
| 549,000 | Standard Industries, Inc./NJ, 144a, | |||||||
| 6.000%, 10/15/25 | 561,352 | |||||||
| 406,000 | Tenneco, Inc., 5.000%, 7/15/26 | 360,832 | ||||||
| 391,000 | TransDigm, Inc., 5.500%, 10/15/20 | 391,489 | ||||||
| 439,000 | Triumph Group, Inc., 4.875%, 4/1/21 | 423,635 | ||||||
| 570,000 | Triumph Group, Inc., 5.250%, 6/1/22 | 537,225 | ||||||
| 155,217 | United Airlines 2014-2 Class B Pass | |||||||
| Through Trust, 4.625%, 9/3/22 | 155,807 | |||||||
| 15,725,210 | ||||||||
| Financials — 6.7% | ||||||||
| 489,000 | Aircastle Ltd. (Bermuda), | |||||||
| 5.500%, 2/15/22 | 508,275 | |||||||
| 180,000 | Ally Financial, Inc., 5.750%, 11/20/25 | 185,850 | ||||||
| 926,000 | Ally Financial, Inc., 8.000%, 11/1/31 | 1,121,618 | ||||||
| 791,000 | Bank of America Corp., 6.100%(B) | 828,573 | ||||||
| 314,000 | CIT Group, Inc., 6.125%, 3/9/28 | 328,130 | ||||||
| 616,000 | Cooke Omega Investments, Inc. / | |||||||
| Alpha VesselCo Holdings Inc. | ||||||||
| (Canada), 144a, 8.500%, 12/15/22 | 614,460 | |||||||
| 263,000 | Credit Acceptance Corp., | |||||||
| 6.125%, 2/15/21 | 265,301 | |||||||
| 651,000 | Credit Acceptance Corp., | |||||||
| 7.375%, 3/15/23 | 681,922 | |||||||
| 322,000 | Goldman Sachs Group, Inc. (The)., | |||||||
| Ser P, 5.000%(B) | 303,873 | |||||||
| 844,000 | MetLife, Inc., Ser C, 5.250%(B) | 854,972 | ||||||
| 642,000 | MGIC Investment Corp., | |||||||
| 5.750%, 8/15/23 | 670,890 | |||||||
| 197,000 | Navient Corp., 5.000%, 10/26/20 | 199,425 | ||||||
| 455,000 | Navient Corp., 5.875%, 10/25/24 | 445,900 | ||||||
| 459,000 | Navient Corp., 6.500%, 6/15/22 | 477,007 | ||||||
| 956,000 | Navient Corp. MTN, 7.250%, 1/25/22 | 1,008,580 | ||||||
| 932,000 | Quicken Loans, Inc., 144a, | |||||||
| 5.250%, 1/15/28 | 865,595 | |||||||
| 386,000 | Quicken Loans, Inc., 144a, | |||||||
| 5.750%, 5/1/25 | 385,518 | |||||||
| 430,000 | Radian Group, Inc., 4.500%, 10/1/24 | 422,475 | ||||||
| 1,372,000 | Royal Bank of Scotland Group PLC | |||||||
| (United Kingdom), | ||||||||
| 6.125%, 12/15/22 | 1,434,556 | |||||||
| 641,000 | Springleaf Finance Corp., | |||||||
| 5.625%, 3/15/23 | 638,596 | |||||||
| 382,000 | Springleaf Finance Corp., | |||||||
| 6.875%, 3/15/25 | 381,045 | |||||||
| 328,000 | Springleaf Finance Corp., | |||||||
| 7.125%, 3/15/26 | 326,360 | |||||||
| 200,000 | Travelport Corporate Finance PLC | |||||||
| (United Kingdom), 144a, | ||||||||
| 6.000%, 3/15/26 | 203,134 | |||||||
| 13,152,055 | ||||||||
| Materials — 5.9% | ||||||||
| 200,000 | Alcoa Nederland Holding BV | |||||||
| (Netherlands), 144a, | ||||||||
| 6.125%, 5/15/28 | 205,500 | |||||||
| 1,076,000 | Alcoa Nederland Holding BV | |||||||
| (Netherlands), 144a, | ||||||||
| 7.000%, 9/30/26 | 1,155,355 | |||||||
| 178,000 | Blue Cube Spinco LLC, | |||||||
| 9.750%, 10/15/23 | 201,363 | |||||||
| 523,000 | Cascades, Inc. (Canada), 144a, | |||||||
| 5.500%, 7/15/22 | 526,922 | |||||||
| 441,000 | Cascades, Inc. (Canada), 144a, | |||||||
| 5.750%, 7/15/23 | 441,000 | |||||||
| 300,000 | Commercial Metals Co., | |||||||
| 4.875%, 5/15/23 | 297,480 | |||||||
| 968,000 | Commercial Metals Co., 144a, | |||||||
| 5.750%, 4/15/26 | 938,960 | |||||||
| 761,000 | CVR Partners LP / CVR Nitrogen | |||||||
| Finance Corp., 144a, | ||||||||
| 9.250%, 6/15/23 | 806,660 | |||||||
| 1,163,000 | Freeport-McMoRan, Inc., | |||||||
| 3.550%, 3/1/22 | 1,125,202 | |||||||
| 112,000 | Freeport-McMoRan, Inc., | |||||||
| 6.875%, 2/15/23 | 119,280 | |||||||
| 579,000 | Hudbay Minerals, Inc. (Canada), 144a, | |||||||
| 7.625%, 1/15/25 | 597,818 | |||||||
| 111,000 | Kaiser Aluminum Corp., | |||||||
| 5.875%, 5/15/24 | 113,464 | |||||||
| 79 |
Touchstone High Yield Fund (Continued)
| Principal | Market | |||||||
| Amount | Value | |||||||
| Corporate Bonds — 98.6% (Continued) | ||||||||
| Materials — (Continued) | ||||||||
| $ | 1,060,000 | Kinross Gold Corp. (Canada), | ||||||
| 4.500%, 7/15/27 | $ | 947,428 | ||||||
| 565,000 | NOVA Chemicals Corp. (Canada), 144a, | |||||||
| 4.875%, 6/1/24 | 543,954 | |||||||
| 373,000 | NOVA Chemicals Corp. (Canada), 144a, | |||||||
| 5.250%, 8/1/23 | 370,902 | |||||||
| 889,000 | Nufarm Australia Ltd. / Nufarm | |||||||
| Americas, Inc. (Australia), 144a, | ||||||||
| 5.750%, 4/30/26 | 838,994 | |||||||
| 284,000 | Olin Corp., 5.000%, 2/1/30 | 264,830 | ||||||
| 394,000 | Steel Dynamics, Inc., 4.125%, 9/15/25 | 375,285 | ||||||
| 376,000 | Steel Dynamics, Inc., 5.000%, 12/15/26 | 374,120 | ||||||
| 588,000 | Teck Resources Ltd. (Canada), | |||||||
| 6.250%, 7/15/41 | 617,400 | |||||||
| 906,000 | Tronox, Inc., 144a, 6.500%, 4/15/26 | 872,025 | ||||||
| 11,733,942 | ||||||||
| Information Technology — 4.8% | ||||||||
| 671,000 | CDK Global, Inc., 4.875%, 6/1/27 | 654,225 | ||||||
| 469,000 | CDW LLC / CDW Finance Corp., | |||||||
| 5.500%, 12/1/24 | 485,415 | |||||||
| 148,000 | Dell International LLC / EMC Corp., | |||||||
| 144a, 5.875%, 6/15/21 | 152,437 | |||||||
| 1,067,000 | Dell International LLC / EMC Corp., | |||||||
| 144a, 7.125%, 6/15/24 | 1,144,571 | |||||||
| 1,670,000 | Diebold Nixdorf, Inc., 8.500%, 4/15/24 | 1,194,050 | ||||||
| 711,000 | EMC Corp., 3.375%, 6/1/23 | 673,114 | ||||||
| 896,000 | First Data Corp., 144a, 5.000%, 1/15/24 | 901,600 | ||||||
| 503,000 | First Data Corp., 144a, 5.375%, 8/15/23 | 510,671 | ||||||
| 34,000 | Harland Clarke Holdings Corp., 144a, | |||||||
| 8.375%, 8/15/22 | 32,598 | |||||||
| 425,000 | IQVIA, Inc., 144a, 5.000%, 10/15/26 | 417,562 | ||||||
| 211,000 | j2 Cloud Services LLC / j2 Global | |||||||
| Co.-Obligor, Inc., 144a, | ||||||||
| 6.000%, 7/15/25 | 216,802 | |||||||
| 181,000 | Match Group, Inc., 144a, | |||||||
| 5.000%, 12/15/27 | 180,113 | |||||||
| 600,000 | NCR Corp., 4.625%, 2/15/21 | 594,000 | ||||||
| 652,000 | Netflix, Inc., 144a, 4.875%, 4/15/28 | 612,880 | ||||||
| 776,000 | Open Text Corp. (Canada), 144a, | |||||||
| 5.875%, 6/1/26 | 798,795 | |||||||
| 954,000 | VeriSign, Inc., 4.750%, 7/15/27 | 929,864 | ||||||
| 9,498,697 | ||||||||
| Real Estate — 3.3% | ||||||||
| 323,000 | CoreCivic, Inc. REIT, 4.625%, 5/1/23 | 310,080 | ||||||
| 549,000 | CoreCivic, Inc. REIT, 4.750%, 10/15/27 | 485,865 | ||||||
| 225,000 | CoreCivic, Inc. REIT, 5.000%, 10/15/22 | 222,188 | ||||||
| 506,000 | CyrusOne LP / CyrusOne Finance | |||||||
| Corp., REIT, 5.000%, 3/15/24 | 515,488 | |||||||
| 277,000 | CyrusOne LP / CyrusOne Finance | |||||||
| Corp., REIT, 5.375%, 3/15/27 | 283,232 | |||||||
| 263,000 | Equinix, Inc. REIT, 5.375%, 5/15/27 | 263,000 | ||||||
| 504,000 | ESH Hospitality, Inc. REIT, 144a, | |||||||
| 5.250%, 5/1/25 | 487,620 | |||||||
| 997,000 | Iron Mountain, Inc. REIT, | |||||||
| 5.750%, 8/15/24 | 987,030 | |||||||
| 946,000 | MGM Growth Properties Operating | |||||||
| Partnership LP / MGP Finance | ||||||||
| Co.-Issuer, Inc. REIT, 5.625%, 5/1/24 | 969,650 | |||||||
| 496,000 | MPT Operating Partnership LP / MPT | |||||||
| Finance Corp., REIT, 5.250%, 8/1/26 | 492,900 | |||||||
| 202,000 | MPT Operating Partnership LP / MPT | |||||||
| Finance Corp., REIT, 5.500%, 5/1/24 | 203,010 | |||||||
| 1,362,000 | Sabra Health Care LP REIT, | |||||||
| 5.125%, 8/15/26 | 1,333,346 | |||||||
| 6,553,409 | ||||||||
| Utilities — 3.1% | ||||||||
| 554,000 | AES Corp./VA, 4.875%, 5/15/23 | 558,848 | ||||||
| 328,000 | Clearway Energy Operating LLC, 144a, | |||||||
| 5.750%, 10/15/25 | 330,886 | |||||||
| 215,000 | DPL, Inc., 7.250%, 10/15/21 | 232,469 | ||||||
| 462,000 | NGL Energy Partners LP / NGL Energy | |||||||
| Finance Corp., 6.125%, 3/1/25 | 433,125 | |||||||
| 163,000 | NGL Energy Partners LP / NGL Energy | |||||||
| Finance Corp., 6.875%, 10/15/21 | 166,048 | |||||||
| 869,000 | NGL Energy Partners LP / NGL Energy | |||||||
| Finance Corp., 7.500%, 11/1/23 | 869,000 | |||||||
| 1,415,000 | NRG Energy, Inc., 6.625%, 1/15/27 | 1,485,750 | ||||||
| 446,000 | NRG Energy, Inc., 7.250%, 5/15/26 | 483,910 | ||||||
| 198,000 | NRG Energy, Inc., 144a, | |||||||
| 5.750%, 1/15/28 | 199,980 | |||||||
| 400,000 | Rockpoint Gas Storage Canada Ltd. | |||||||
| (Canada), 144a, 7.000%, 3/31/23 | 406,000 | |||||||
| 302,000 | Vistra Energy Corp., 5.875%, 6/1/23 | 310,682 | ||||||
| 731,000 | Vistra Operations Co. LLC, 144a, | |||||||
| 5.500%, 9/1/26 | 739,224 | |||||||
| 6,215,922 | ||||||||
| Total Corporate Bonds | $ | 194,865,732 | ||||||
| Shares | ||||||||
| Short-Term Investment Funds — 3.1% | ||||||||
| 760,307 | Dreyfus Government Cash | |||||||
| Management, Institutional Shares, | ||||||||
| 1.95%∞Ω | 760,307 | |||||||
| 5,324,784 | Invesco Government & Agency | |||||||
| Portfolio, Institutional Class, | ||||||||
| 1.97%**∞Ω | 5,324,784 | |||||||
| Total Short-Term Investment Funds | $ | 6,085,091 | ||||||
| Total Investment Securities — 101.7% | ||||||||
| (Cost $204,070,386) | $ | 200,950,823 | ||||||
| Liabilities in Excess of Other Assets — (1.7%) | (3,362,622 | ) | ||||||
| Net Assets — 100.0% | $ | 197,588,201 | ||||||
| 80 |
Touchstone High Yield Fund (Continued)
| (A) | Step Bond - A bond that pays an initial interest rate for the first period and then a higher interest rate for the following periods until maturity. The interest rate shown reflects the rate in effect as of September 30, 2018. |
| (B) | Perpetual Bond - A bond with no definite maturity date. ** Represents collateral for securities loaned. |
| † | All or a portion of the security is on loan. The total market value of the securities on loan as of September 30, 2018 was $4,722,101. |
| ∞ | Open-End Fund. |
| Ω | Represents the 7-day SEC yield as of September 30, 2018. |
Portfolio Abbreviations:
DAC - Designated Activity Company
LLC - Limited Liability Company
LP - Limited Partnership
MTN - Medium Term Note
PLC - Public Limited Company
REIT - Real Estate Investment Trust
144a - This is a restricted security that was sold in a transaction qualifying for the exemption under Rule 144a of the Securities Act of 1933. This security may be sold in transactions exempt from registration, normally to qualified institutional buyers. At September 30, 2018, these securities were valued at $90,144,274 or 45.6% of net assets. These securities were deemed liquid pursuant to procedures approved by the Board of Trustees.
Other Information:
The inputs or methodology used for valuing securities may not be an indication of the risk associated with investing in those securities. For more information on valuation inputs, and their aggregation into the levels used in the table below, please refer to the security valuation section in the accompanying Notes to Financial Statements.
| Valuation inputs at Reporting Date: | ||||||||||||||||
| Description | Level 1 | Level 2 | Level 3 | Total | ||||||||||||
| Corporate Bonds | $ | — | $ | 194,865,732 | $ | — | $ | 194,865,732 | ||||||||
| Short-Term Investment Funds | 6,085,091 | — | — | 6,085,091 | ||||||||||||
| Total | $ | 6,085,091 | $ | 194,865,732 | $ | — | $ | 200,950,823 | ||||||||
See accompanying Notes to Financial Statements.
| 81 |
Touchstone Impact Bond Fund – September 30, 2018
| Principal | Market | |||||||
| Amount | Value | |||||||
| Corporate Bonds — 31.8% | ||||||||
| Industrials — 10.6% | ||||||||
| $ | 2,905,541 | American Airlines 2016-3 Class AA | ||||||
| Pass Through Trust, | ||||||||
| 3.000%, 10/15/28 | $ | 2,707,770 | ||||||
| 35,434 | Burlington Northern and Santa Fe | |||||||
| Railway Co. 2004-1 Pass Through | ||||||||
| Trust, 4.575%, 1/15/21 | 35,776 | |||||||
| 218,639 | Burlington Northern and Santa Fe | |||||||
| Railway Co. 2005-3 Pass Through | ||||||||
| Trust, 4.830%, 1/15/23 | 223,556 | |||||||
| 1,071,159 | Burlington Northern and Santa Fe | |||||||
| Railway Co. 2005-4 Pass Through | ||||||||
| Trust, 4.967%, 4/1/23 | 1,100,396 | |||||||
| 696,261 | Continental Airlines 2000-2 Class A-1 | |||||||
| Pass Through Trust, 7.707%, 4/2/21 | 734,973 | |||||||
| 1,033,096 | Continental Airlines 2007-1 Class A | |||||||
| Pass Through Trust, 5.983%, 4/19/22 | 1,087,829 | |||||||
| 665,942 | Continental Airlines 2012-2 Class A | |||||||
| Pass Through Trust, | ||||||||
| 4.000%, 10/29/24 | 665,942 | |||||||
| 1,428,692 | CSX Transportation, Inc., | |||||||
| 6.251%, 1/15/23 | 1,541,009 | |||||||
| 597,640 | Delta Air Lines 2007-1 Class B Pass | |||||||
| Through Trust, 8.021%, 8/10/22 | 656,567 | |||||||
| 930,768 | Delta Air Lines 2010-2 Class A Pass | |||||||
| Through Trust, 4.950%, 5/23/19 | 936,586 | |||||||
| 389,181 | Federal Express Corp. 1998 Pass | |||||||
| Through Trust, 6.845%, 1/15/19 | 393,559 | |||||||
| 762,644 | Federal Express Corp. 1999 Pass | |||||||
| Through Trust, 7.650%, 1/15/23 | 817,936 | |||||||
| 2,583,000 | GATX Corp., 3.250%, 3/30/25 | 2,416,896 | ||||||
| 1,180,000 | Kansas City Southern, 3.000%, 5/15/23 | 1,134,888 | ||||||
| 1,475,000 | Kansas City Southern, 3.125%, 6/1/26 | 1,356,561 | ||||||
| 1,941,000 | Norfolk Southern Corp., | |||||||
| 2.903%, 2/15/23 | 1,892,856 | |||||||
| 1,408,000 | Republic Services, Inc., | |||||||
| 5.250%, 11/15/21 | 1,481,550 | |||||||
| 1,330,000 | SBA Tower Trust, 144a, | |||||||
| 3.168%, 4/11/22 | 1,304,142 | |||||||
| 1,275,753 | Southwest Airlines Co. 2007-1 Pass | |||||||
| Through Trust, 6.150%, 8/1/22 | 1,344,082 | |||||||
| 23,121 | Union Pacific Railroad Co. 2001 Pass | |||||||
| Through Trust, 6.630%, 1/27/22 | 25,028 | |||||||
| 1,149,454 | Union Pacific Railroad Co. 2003 Pass | |||||||
| Through Trust, 4.698%, 1/2/24 | 1,170,197 | |||||||
| 512,673 | Union Pacific Railroad Co. 2006 Pass | |||||||
| Through Trust, 5.866%, 7/2/30 | 551,343 | |||||||
| 1,644,000 | United Rentals North America, Inc., | |||||||
| 5.750%, 11/15/24 | 1,691,347 | |||||||
| 1,616,000 | Waste Management, Inc., | |||||||
| 2.400%, 5/15/23 | 1,541,003 | |||||||
| 26,811,792 | ||||||||
| Financials — 8.3% | ||||||||
| 2,444,000 | Aflac, Inc., 3.250%, 3/17/25 | 2,360,885 | ||||||
| 2,443,000 | American Express Co., | |||||||
| 2.650%, 12/2/22 | 2,352,505 | |||||||
| 2,803,000 | Delphi Financial Group, Inc., | |||||||
| 7.875%, 1/31/20 | 2,959,806 | |||||||
| 1,848,802 | Fishers Lane Associates LLC, 144a, | |||||||
| 3.666%, 8/5/30 | 1,808,308 | |||||||
| 2,347,000 | Ford Motor Credit Co. LLC, | |||||||
| 4.375%, 8/6/23 | 2,320,368 | |||||||
| 2,106,000 | National Rural Utilities Cooperative | |||||||
| Finance Corp., 3.400%, 11/15/23 | 2,092,935 | |||||||
| 900,000 | Nationwide Financial Services, Inc., | |||||||
| 144a, 5.375%, 3/25/21 | 931,086 | |||||||
| 708,000 | Nationwide Mutual Insurance Co., | |||||||
| 144a, 9.375%, 8/15/39 | 1,094,166 | |||||||
| 1,398,000 | Torchmark Corp., 3.800%, 9/15/22 | 1,390,941 | ||||||
| 2,000,000 | USB Capital IX, 3.500%(A) | 1,787,500 | ||||||
| 2,000,000 | Wachovia Capital Trust III, 5.570%(A) | 1,981,000 | ||||||
| 21,079,500 | ||||||||
| Utilities — 6.7% | ||||||||
| 1,314,409 | Bruce Mansfield Unit 1 2007 Pass | |||||||
| Through Trust, 6/1/34(B) | 957,875 | |||||||
| 610,000 | California Water Service Co., | |||||||
| 5.500%, 12/1/40 | 693,844 | |||||||
| 1,598,000 | Commonwealth Edison Co., | |||||||
| 5.900%, 3/15/36 | 1,903,170 | |||||||
| 1,780,000 | Dominion Energy, Inc., (3M LIBOR | |||||||
| +2.300%), 4.686%, 9/30/66(C) | 1,717,700 | |||||||
| 275,000 | Duke Energy Progress LLC, | |||||||
| 6.300%, 4/1/38 | 343,744 | |||||||
| 1,904,000 | Entergy Louisiana LLC, | |||||||
| 4.440%, 1/15/26 | 1,955,411 | |||||||
| 1,642,000 | Georgia Power Co., 4.750%, 9/1/40 | 1,652,904 | ||||||
| 400,001 | Kiowa Power Partners LLC, 144a, | |||||||
| 5.737%, 3/30/21 | 402,042 | |||||||
| 2,000,000 | NextEra Energy Capital Holdings, Inc., | |||||||
| (3M LIBOR +2.068%), | ||||||||
| 4.464%, 10/1/66(C) | 1,930,000 | |||||||
| 2,926,000 | PacifiCorp., 8.050%, 9/1/22 | 3,364,419 | ||||||
| 1,983,000 | South Carolina Electric & Gas Co., | |||||||
| 4.600%, 6/15/43 | 1,968,326 | |||||||
| 16,889,435 | ||||||||
| Energy — 2.7% | ||||||||
| 786,000 | Apache Corp., 3.250%, 4/15/22 | 773,716 | ||||||
| 1,253,000 | Chesapeake Energy Corp., | |||||||
| 6.625%, 8/15/20 | 1,309,385 | |||||||
| 1,530,000 | Newfield Exploration Co., | |||||||
| 5.750%, 1/30/22 | 1,600,762 | |||||||
| 400,000 | Spectra Energy Partners LP, | |||||||
| 3.500%, 3/15/25 | 385,396 | |||||||
| 1,914,000 | Tennessee Valley Authority, | |||||||
| 4.650%, 6/15/35 | 2,152,125 | |||||||
| 500,000 | Texas Eastern Transmission LP, | |||||||
| 7.000%, 7/15/32 | 603,200 | |||||||
| 6,824,584 | ||||||||
| 82 |
Touchstone Impact Bond Fund (Continued)
| Principal | Market | |||||||
| Amount | Value | |||||||
| Corporate Bonds — 31.8% (Continued) | ||||||||
| Health Care — 1.8% | ||||||||
| $ | 2,663,278 | CVS Pass-Through Trust, | ||||||
| 6.036%, 12/10/28 | $ | 2,840,373 | ||||||
| 1,650,000 | HCA, Inc., 4.250%, 10/15/19 | 1,662,375 | ||||||
| 4,502,748 | ||||||||
| Consumer Discretionary — 1.1% | ||||||||
| 990,000 | PulteGroup, Inc., 7.875%, 6/15/32 | 1,065,487 | ||||||
| 1,300,000 | Royal Caribbean Cruises Ltd. (Liberia), | |||||||
| 5.250%, 11/15/22 | 1,368,307 | |||||||
| 466,000 | Service Corp. International, | |||||||
| 5.375%, 5/15/24 | 473,661 | |||||||
| 2,907,455 | ||||||||
| Consumer Staples — 0.6% | ||||||||
| 1,500,000 | Kroger Co. (The), 3.850%, 8/1/23 | 1,503,998 | ||||||
| Total Corporate Bonds | $ | 80,519,512 | ||||||
| U.S. Government Agency Obligations — 24.5% | ||||||||
| 13,242 | Astro Offshore Corp., (Bahamas), | |||||||
| 6.000%, 12/20/19 | 13,413 | |||||||
| 1,293,000 | Canal Barge Co., Inc., 4.500%, 11/12/34 | 1,338,977 | ||||||
| 1,527,082 | Helios Leasing I LLC, 1.734%, 7/24/24 | 1,463,896 | ||||||
| 1,280,000 | Matson Navigation Co., Inc., | |||||||
| 5.337%, 9/4/28 | 1,361,394 | |||||||
| 1,204,500 | Petroleos Mexicanos (Mexico), | |||||||
| 2.290%, 2/15/24 | 1,175,262 | |||||||
| 1,874,211 | Reliance Industries Ltd. (India), | |||||||
| 1.870%, 1/15/26 | 1,782,536 | |||||||
| 75,881 | Small Business Administration | |||||||
| Participation Certificates, Ser | ||||||||
| 2002-20H, Class 1, 5.310%, 8/1/22 | 77,255 | |||||||
| 62,360 | Small Business Administration | |||||||
| Participation Certificates, Ser | ||||||||
| 2003-20B, Class 1, 4.840%, 2/1/23 | 63,793 | |||||||
| 25,947 | Small Business Administration | |||||||
| Participation Certificates, Ser | ||||||||
| 2003-20D, Class 1, 4.760%, 4/1/23 | 26,495 | |||||||
| 21,584 | Small Business Administration | |||||||
| Participation Certificates, Ser | ||||||||
| 2004-20D, Class 1, 4.770%, 4/1/24 | 21,996 | |||||||
| 188,220 | Small Business Administration | |||||||
| Participation Certificates, Ser | ||||||||
| 2004-20K, Class 1, 4.880%, 11/1/24 | 192,252 | |||||||
| 102,563 | Small Business Administration | |||||||
| Participation Certificates, Ser | ||||||||
| 2005-20B, Class 1, 4.625%, 2/1/25 | 104,300 | |||||||
| 75,162 | Small Business Administration | |||||||
| Participation Certificates, Ser | ||||||||
| 2005-20H, Class 1, 5.110%, 8/1/25 | 76,846 | |||||||
| 573,057 | Small Business Administration | |||||||
| Participation Certificates, Ser | ||||||||
| 2006-20B, Class 1, 5.350%, 2/1/26 | 588,988 | |||||||
| 262,246 | Small Business Administration | |||||||
| Participation Certificates, Ser | ||||||||
| 2006-20H, Class 1, 5.700%, 8/1/26 | 271,144 | |||||||
| 377,487 | Small Business Administration | |||||||
| Participation Certificates, Ser | ||||||||
| 2006-20K, Class 1, 5.360%, 11/1/26 | 387,291 | |||||||
| 495,590 | Small Business Administration | |||||||
| Participation Certificates, Ser | ||||||||
| 2006-20L, Class 1, 5.120%, 12/1/26 | 506,346 | |||||||
| 425,235 | Small Business Administration | |||||||
| Participation Certificates, Ser | ||||||||
| 2007-20A, Class 1, 5.320%, 1/1/27 | 435,421 | |||||||
| 606,993 | Small Business Administration | |||||||
| Participation Certificates, Ser | ||||||||
| 2007-20E, Class 1, 5.310%, 5/1/27 | 626,342 | |||||||
| 179,968 | Small Business Administration | |||||||
| Participation Certificates, Ser | ||||||||
| 2007-20F, Class 1, 5.710%, 6/1/27 | 185,997 | |||||||
| 496,769 | Small Business Administration | |||||||
| Participation Certificates, Ser | ||||||||
| 2007-20L, Class 1, 5.290%, 12/1/27 | 506,828 | |||||||
| 309,131 | Small Business Administration | |||||||
| Participation Certificates, Ser | ||||||||
| 2008-20A, Class 1, 5.170%, 1/1/28 | 319,863 | |||||||
| 871,374 | Small Business Administration | |||||||
| Participation Certificates, Ser | ||||||||
| 2008-20K, Class 1, 6.770%, 11/1/28 | 930,673 | |||||||
| 898,841 | Small Business Administration | |||||||
| Participation Certificates, Ser | ||||||||
| 2009-20B, Class 1, 4.760%, 2/1/29 | 934,455 | |||||||
| 1,308,210 | Small Business Administration | |||||||
| Participation Certificates, Ser | ||||||||
| 2009-20C, Class 1, 4.660%, 3/1/29 | 1,356,233 | |||||||
| 441,555 | Small Business Administration | |||||||
| Participation Certificates, Ser | ||||||||
| 2009-20D, Class 1, 4.310%, 4/1/29 | 453,177 | |||||||
| 869,305 | Small Business Administration | |||||||
| Participation Certificates, Ser | ||||||||
| 2009-20E, Class 1, 4.430%, 5/1/29 | 889,010 | |||||||
| 486,133 | Small Business Administration | |||||||
| Participation Certificates, Ser | ||||||||
| 2009-20F, Class 1, 4.950%, 6/1/29 | 507,952 | |||||||
| 786,238 | Small Business Administration | |||||||
| Participation Certificates, Ser | ||||||||
| 2009-20J, Class 1, 3.920%, 10/1/29 | 798,031 | |||||||
| 1,449,314 | Small Business Administration | |||||||
| Participation Certificates, Ser | ||||||||
| 2010-20F, Class 1, 3.880%, 6/1/30 | 1,470,004 | |||||||
| 1,298,249 | Small Business Administration | |||||||
| Participation Certificates, Ser | ||||||||
| 2010-20I, Class 1, 3.210%, 9/1/30 | 1,290,313 | |||||||
| 652,563 | Small Business Administration | |||||||
| Participation Certificates, Ser | ||||||||
| 2012-10C, Class 1, 1.240%, 5/1/22 | 637,126 | |||||||
| 3,408,962 | Small Business Administration | |||||||
| Participation Certificates, Ser | ||||||||
| 2013-20C, Class 1, 2.220%, 3/1/33 | �� | 3,229,484 | ||||||
| 83 |
Touchstone Impact Bond Fund (Continued)
| Principal | Market | |||||||
| Amount | Value | |||||||
| U.S. Government Agency Obligations — 24.5% | ||||||||
| (Continued) | ||||||||
| $ | 2,771,006 | Small Business Administration | ||||||
| Participation Certificates, Ser | ||||||||
| 2013-20E, Class 1, 2.070%, 5/1/33 | $ | 2,631,365 | ||||||
| 2,427,292 | Small Business Administration | |||||||
| Participation Certificates, Ser | ||||||||
| 2013-20G, Class 1, 3.150%, 7/1/33 | 2,418,451 | |||||||
| 2,040,558 | Small Business Administration | |||||||
| Participation Certificates, Ser | ||||||||
| 2014-20H, Class 1, 2.880%, 8/1/34 | 1,997,564 | |||||||
| 1,665,298 | Small Business Administration | |||||||
| Participation Certificates, Ser | ||||||||
| 2014-20K, Class 1, 2.800%, 11/1/34 | 1,626,741 | |||||||
| 2,685,943 | Small Business Administration | |||||||
| Participation Certificates, Ser | ||||||||
| 2015-20I, Class 1, 2.820%, 9/1/35 | 2,619,391 | |||||||
| 3,714,890 | Small Business Administration | |||||||
| Participation Certificates, Ser | ||||||||
| 2016-20A, Class 1, 2.780%, 1/1/36 | 3,603,974 | |||||||
| 2,129,998 | Small Business Administration | |||||||
| Participation Certificates, Ser | ||||||||
| 2017-10A, Class 1, 2.845%, 3/10/27 | 2,070,583 | |||||||
| 2,710,280 | Small Business Administration | |||||||
| Participation Certificates, Ser | ||||||||
| 2017-10B, Class 1, 2.518%, 9/10/27 | 2,595,009 | |||||||
| 3,312,294 | Small Business Administration | |||||||
| Participation Certificates, Ser | ||||||||
| 2017-20E, Class 1, 2.880%, 5/1/37 | 3,185,625 | |||||||
| 3,120,288 | Small Business Administration | |||||||
| Participation Certificates, Ser | ||||||||
| 2017-20F, Class 1, 2.810%, 6/1/37 | 2,985,636 | |||||||
| 3,236,618 | Small Business Administration | |||||||
| Participation Certificates, Ser | ||||||||
| 2017-20K, Class 1, 2.790%, 11/1/37 | 3,092,166 | |||||||
| 2,940,731 | Small Business Administration | |||||||
| Participation Certificates, Ser | ||||||||
| 2017-20L, Class 1, 2.780%, 12/1/37 | 2,805,928 | |||||||
| 2,834,406 | Small Business Administration | |||||||
| Participation Certificates, Ser | ||||||||
| 2018-20C, Class 1, 3.200%, 3/1/38 | 2,754,088 | |||||||
| 41,161 | Sterling Equipment, 6.125%, 9/28/19 | 42,024 | ||||||
| 1,121,848 | Tagua Leasing LLC, 1.581%, 11/16/24 | 1,066,984 | ||||||
| 878,000 | Totem Ocean Trailer Express, Inc., | |||||||
| 6.365%, 4/15/28 | 974,040 | |||||||
| 1,284,000 | Vessel Management Services, Inc., | |||||||
| 5.125%, 4/16/35 | 1,375,572 | |||||||
| Total U.S. Government Agency | ||||||||
| Obligations | $ | 61,868,234 | ||||||
| Agency Collateralized Mortgage | ||||||||
| Obligations — 15.9% | ||||||||
| 2,902,396 | FHLMC Multifamily Structured Pass | |||||||
| Through Certificates, Ser KW03 | ||||||||
| Class A1, 2.617%, 12/25/26 | 2,795,720 | |||||||
| 1,020,037 | FREMF Mortgage Trust, Ser 2012-K19, | |||||||
| Class B, 144a, 4.168%, 5/25/45(C)(D) | 1,032,169 | |||||||
| 925,000 | FREMF Mortgage Trust, Ser 2012-K706, | |||||||
| Class B, 144a, 4.172%, 11/25/44(C)(D) | 923,659 | |||||||
| 1,200,000 | FREMF Mortgage Trust, Ser 2012-K710, | |||||||
| Class B, 144a, 3.941%, 6/25/47(C)(D) | 1,204,133 | |||||||
| 750,000 | FREMF Mortgage Trust, Ser 2013-K30, | |||||||
| Class B, 144a, 3.669%, 6/25/45(C)(D) | 743,670 | |||||||
| 1,528,000 | FREMF Mortgage Trust, Ser 2014-K716, | |||||||
| Class B, 144a, 4.081%, 8/25/47(C)(D) | 1,541,203 | |||||||
| 2,156,434 | FRESB Mortgage Trust, Ser 2015-SB9, | |||||||
| Class A5, (1M LIBOR +0.700%), | ||||||||
| 2.535%, 11/25/35(C) | 2,126,825 | |||||||
| 1,340,612 | FRESB Mortgage Trust, Ser 2016-SB17, | |||||||
| Class A5H, 2.160%, 5/25/36(C)(D) | 1,307,044 | |||||||
| 2,294,711 | FRESB Mortgage Trust, Ser 2017-SB27, | |||||||
| Class A10F, 3.090%, 1/25/27(C)(D) | 2,230,186 | |||||||
| 2,413,069 | FRESB Mortgage Trust, Ser 2018-SB46, | |||||||
| Class A10F, 3.300%, 12/25/27(C)(D) | 2,351,668 | |||||||
| 2,600,000 | GNMA, Ser 2011-142, Class B, | |||||||
| 3.485%, 2/16/44(C)(D) | 2,565,527 | |||||||
| 2,794,469 | GNMA, Ser 2012-1, Class C, | |||||||
| 3.310%, 11/16/49 | 2,760,629 | |||||||
| 2,975,000 | GNMA, Ser 2012-46, Class C, | |||||||
| 3.176%, 5/16/50(C)(D) | 2,879,615 | |||||||
| 1,619,507 | GNMA, Ser 2012-53, Class AC, | |||||||
| 2.381%, 12/16/43 | 1,559,261 | |||||||
| 1,029,297 | GNMA, Ser 2013-40, Class AC, | |||||||
| 1.584%, 1/16/46 | 983,826 | |||||||
| 2,540,000 | GNMA, Ser 2015-32, Class HG, | |||||||
| 3.000%, 9/16/49(C)(D) | 2,164,034 | |||||||
| 3,622,053 | GNMA, Ser 2015-37, Class AD, | |||||||
| 2.600%, 11/16/55 | 3,475,272 | |||||||
| 3,512,000 | GNMA, Ser 2015-73, Class B, | |||||||
| 2.700%, 10/16/55(C)(D) | 3,175,690 | |||||||
| 2,602,173 | GNMA, Ser 2017-46, Class AB, | |||||||
| 2.600%, 1/16/52 | 2,464,797 | |||||||
| 1,925,060 | GNMA, Ser 2017-H11, Class FV, (1M | |||||||
| LIBOR +0.500%), 2.580%, 5/20/67(C) | 1,933,723 | |||||||
| Total Agency Collateralized | ||||||||
| Mortgage Obligations | $ | 40,218,651 | ||||||
| U.S. Government Mortgage-Backed | ||||||||
| Obligations — 10.0% | ||||||||
| 1,658,503 | FHLMC, Pool #W30008, | |||||||
| 7.645%, 5/1/25 | 1,830,103 | |||||||
| 200,496 | FNMA, Pool #465711, 4.680%, 8/1/28 | 208,706 | ||||||
| 1,488,219 | FNMA, Pool #469616, 3.500%, 11/1/21 | 1,498,794 | ||||||
| 105,571 | FNMA, Pool #874210, 5.260%, 1/1/25 | 108,331 | ||||||
| 275,176 | FNMA, Pool #888829, 5.900%, 6/1/37 | 289,363 | ||||||
| 269,018 | FNMA, Pool #958736, 4.940%, 5/1/19 | 271,292 | ||||||
| 273,322 | FNMA, Pool #AD0166, 4.783%, 8/1/19 | 277,000 | ||||||
| 571,843 | FNMA, Pool #AD0342, 4.647%, 10/1/19 | 579,174 | ||||||
| 603,159 | FNMA, Pool #AD0786, 4.501%, 1/1/20 | 611,601 | ||||||
| 391,037 | FNMA, Pool #AD0910, 4.596%, 4/1/20 | 396,547 | ||||||
| 30,871 | FNMA, Pool #AE0209, 4.380%, 6/1/20 | 31,358 | ||||||
| 84 |
Touchstone Impact Bond Fund (Continued)
| Principal | Market | |||||||
| Amount | Value | |||||||
| U.S. Government Mortgage-Backed | ||||||||
| Obligations — 10.0% (Continued) | ||||||||
| $ | 468,954 | FNMA, Pool #AE0446, 4.041%, 9/1/20 | $ | 474,775 | ||||
| 1,632,828 | FNMA, Pool #AH8854, 4.500%, 4/1/41 | 1,698,856 | ||||||
| 1,720,891 | FNMA, Pool #AM0157, 2.680%, 2/1/22 | 1,688,207 | ||||||
| 1,792,945 | FNMA, Pool #AM0566, 1.940%, 9/1/19 | 1,789,656 | ||||||
| 3,359,000 | FNMA, Pool #AN3613, 2.680%, 12/1/26 | 3,154,537 | ||||||
| 2,127,170 | FNMA, Pool #AP7488, 3.500%, 9/1/42 | 2,109,945 | ||||||
| 1,011,966 | FNMA, Pool #AT0924, 2.000%, 3/1/28 | 941,284 | ||||||
| 2,729,900 | FNMA, Pool #AX7699, 3.500%, 2/1/45 | 2,698,070 | ||||||
| 1,906,903 | FNMA, Pool #BC0153, 4.000%, 1/1/46 | 1,928,061 | ||||||
| 1,902,557 | FNMA, Pool #BH5752, 3.500%, 11/1/47 | 1,873,299 | ||||||
| 625,760 | GNMA, Pool #5276, 3.000%, 1/20/27 | 621,261 | ||||||
| 65,752 | GNMA, Pool #757327, | |||||||
| 4.221%, 7/20/61(C)(D) | 66,015 | |||||||
| Total U.S. Government | ||||||||
| Mortgage-Backed Obligations | $ | 25,146,235 | ||||||
| Municipal Bonds — 6.7% | ||||||||
| California — 1.8% | ||||||||
| 756,061 | California HFA Residential Mortgage | |||||||
| Revenue, Ser A, 2.900%, 2/1/42 | 733,674 | |||||||
| 1,225,000 | City of San Francisco Public Utilities | |||||||
| Commission Water Revenue, Build | ||||||||
| America Bonds, 6.950%, 11/1/50 | 1,732,677 | |||||||
| 1,710,000 | East Bay Municipal Utility District | |||||||
| Water System Revenue, Build | ||||||||
| America Bonds Sub, 5.874%, 6/1/40 | 2,124,966 | |||||||
| 4,591,317 | ||||||||
| Florida — 0.4% | ||||||||
| 1,112,558 | Florida State HFC Revenue, | |||||||
| Homeownership Mortgage Special | ||||||||
| Project, 2.800%, 7/1/41 | 1,048,130 | |||||||
| Louisiana — 0.7% | ||||||||
| 1,787,006 | Louisiana State Housing Corp., | |||||||
| Revenue, 2.875%, 11/1/38 | 1,703,071 | |||||||
| Missouri — 0.3% | ||||||||
| 700,000 | Missouri State Housing Development | |||||||
| Commission, Special | ||||||||
| Homeownership Loan Program, Ser | ||||||||
| C, 2.650%, 11/1/40 | 661,990 | |||||||
| New York — 0.6% | ||||||||
| 1,400,000 | Port Authority of New York and New | |||||||
| Jersey, Cons One Hundred | ||||||||
| Sixty-Eight, 4.926%, 10/1/51 | 1,560,328 | |||||||
| Ohio — 0.6% | ||||||||
| 1,675,000 | Ohio State HFA, Revenue, Ser 1, | |||||||
| 2.650%, 11/1/41 | 1,585,052 | |||||||
| Texas — 1.2% | ||||||||
| 1,770,000 | Dallas Area Rapid Transit, Revenue, | |||||||
| Build America Bonds, Ser B, | ||||||||
| 5.999%, 12/1/44 | 2,284,061 | |||||||
| 640,000 | Texas State Department of Housing & | |||||||
| Community Affairs, Revenue, Ser A, | ||||||||
| 2.800%, 3/1/36 | 603,846 | |||||||
| 2,887,907 | ||||||||
| Virginia — 0.4% | ||||||||
| 1,020,778 | Virginia State Housing Development | |||||||
| Authority, Pass Thru Ser B, | ||||||||
| 2.750%, 4/25/42 | 963,206 | |||||||
| Washington — 0.7% | ||||||||
| 1,515,000 | State of Washington, Build America | |||||||
| Bonds, Ser D, UTGO, 5.481%, 8/1/39 | 1,808,016 | |||||||
| Total Municipal Bonds | $ | 16,809,017 | ||||||
| U.S. Treasury Obligations — 3.5% | ||||||||
| 3,695,000 | U.S. Treasury Strip, Principal, | |||||||
| 0.000%, 5/15/40(E) | 1,873,074 | |||||||
| 10,429,000 | U.S. Treasury Strip, Principal, | |||||||
| 0.000%, 5/15/43(E) | 4,762,602 | |||||||
| 5,379,000 | U.S. Treasury Strip, Principal, | |||||||
| 0.000%, 5/15/45(E) | 2,306,749 | |||||||
| Total U.S. Treasury Obligations | $ | 8,942,425 | ||||||
| Asset-Backed Securities — 2.1% | ||||||||
| 1,331,995 | 321 Henderson Receivables I LLC, Ser | |||||||
| 2012-1A, Class A, 144a, | ||||||||
| 4.210%, 2/16/65 | 1,356,880 | |||||||
| 1,198,972 | 321 Henderson Receivables I LLC, Ser | |||||||
| 2012-2A, Class A, 144a, | ||||||||
| 3.840%, 10/15/59 | 1,196,771 | |||||||
| 1,491,087 | 321 Henderson Receivables I LLC, Ser | |||||||
| 2015-2A, Class A, 144a, | ||||||||
| 3.870%, 3/15/58 | 1,485,446 | |||||||
| 148,098 | FPL Recovery Funding LLC, Ser | |||||||
| 2007-A, Class A4, 5.256%, 8/1/21 | 149,538 | |||||||
| 1,166,366 | JCP&L Transition Funding LLC, Ser | |||||||
| 2006-A, Class A4, 5.610%, 6/5/23 | 1,206,995 | |||||||
| Total Asset-Backed Securities | $ | 5,395,630 | ||||||
| Commercial Mortgage-Backed Security — 0.1% | ||||||||
| 472,066 | CD Commercial Mortgage Trust, Ser | |||||||
| 2006-CD3, Class AJ, | ||||||||
| 5.688%, 10/15/48 | $ | 236,106 | ||||||
| 85 |
Touchstone Impact Bond Fund (Continued)
| Market | ||||||||
| Shares | Value | |||||||
| Short-Term Investment Fund — 4.5% | ||||||||
| 11,431,590 | Dreyfus Government Cash | |||||||
| Management, Institutional Shares, | ||||||||
| 1.95%∞Ω | $ | 11,431,590 | ||||||
| Total Investment Securities — 99.1% | ||||||||
| (Cost $258,333,813) | $ | 250,567,400 | ||||||
| Other Assets in Excess of Liabilities — 0.9% | 2,334,779 | |||||||
| Net Assets — 100.0% | $ | 252,902,179 | ||||||
| (A) | Perpetual Bond - A bond with no definite maturity date. |
| (B) | The issuer is in default of certain debt covenants. Income is not being accrued. The total value of such securities as of September 30, 2018 was $957,875 or 0.4% of net assets. |
| (C) | Variable rate security - Rate reflected is the rate in effect as of September 30, 2018. |
| (D) | Certain variable rate securities are not based on a published reference rate and spread but are determined by the issuer or agent and are based on current market conditions. These securities do not indicate a reference rate and spread in their description. |
| (E) | Strip Security - Separate trading of Registered Interest and Principal. Holders of a principal strip security are entitled to the portion of the payment representing principal only. |
| ∞ | Open-End Fund. |
| Ω | Represents the 7-day SEC yield as of September 30, 2018. |
Portfolio Abbreviations:
FHLMC - Federal Home Loan Mortgage Corporation
FNMA - Federal National Mortgage Association
FREMF - Finnish Real Estate Management Federation
FRESB - Freddie Mac Multifamily Securitization Small Balance Loan
GNMA - Government National Mortgage Association
HFA - Housing Finance Authority/Agency
HFC - Housing Finance Corporation
LIBOR - London Interbank Offered Rate
LLC - Limited Liability Company
LP - Limited Partnership
UTGO - Unlimited Tax General Obligation
144a - This is a restricted security that was sold in a transaction qualifying for the exemption under Rule 144a of the Securities Act of 1933. This security may be sold in transactions exempt from registration, normally to qualified institutional buyers. At September 30, 2018, these securities were valued at $15,023,675 or 5.9% of net assets. These securities were deemed liquid pursuant to procedures approved by the Board of Trustees.
Other Information:
The inputs or methodology used for valuing securities may not be an indication of the risk associated with investing in those securities. For more information on valuation inputs, and their aggregation into the levels used in the table below, please refer to the security valuation section in the accompanying Notes to Financial Statements.
| Valuation inputs at Reporting Date: | ||||||||||||||||
| Description | Level 1 | Level 2 | Level 3 | Total | ||||||||||||
| Corporate Bonds | $ | — | $ | 80,519,512 | $ | — | $ | 80,519,512 | ||||||||
| U.S. Government Agency Obligations | — | 61,868,234 | — | 61,868,234 | ||||||||||||
| Agency Collateralized Mortgage Obligations | — | 40,218,651 | — | 40,218,651 | ||||||||||||
| U.S. Government Mortgage-Backed Obligations | — | 25,146,235 | — | 25,146,235 | ||||||||||||
| Municipal Bonds | — | 16,809,017 | — | 16,809,017 | ||||||||||||
| U.S. Treasury Obligations | — | 8,942,425 | — | 8,942,425 | ||||||||||||
| Asset-Backed Securities | — | 5,395,630 | — | 5,395,630 | ||||||||||||
| Commercial Mortgage-Backed Security | — | 236,106 | — | 236,106 | ||||||||||||
| Short-Term Investment Fund | 11,431,590 | — | — | 11,431,590 | ||||||||||||
| Total | $ | 11,431,590 | $ | 239,135,810 | $ | — | $ | 250,567,400 | ||||||||
See accompanying Notes to Financial Statements.
| 86 |
Touchstone Merger Arbitrage Fund – September 30, 2018
| Market | ||||||||
| Shares | Value | |||||||
| Common Stocks — 98.7% | ||||||||
| Financials — 57.3% | ||||||||
| Allegro Merger Corp.* | 102,500 | $ | 1,035,250 | |||||
| Big Rock Partners Acquisition Corp.* | 77,654 | 776,540 | ||||||
| Capitol Investment Corp. IV* | 150,718 | 1,561,438 | ||||||
| Capitol Investment Corp. IV - Class A* | 83,715 | 828,779 | ||||||
| Churchill Capital Corp.*† | 290,600 | 2,949,590 | ||||||
| Constellation Alpha Capital Corp.* | 180,707 | 72,283 | ||||||
| Constellation Alpha Capital Corp. - Class R* | 134,302 | 1,359,136 | ||||||
| DFB Healthcare Acquisitions Corp.* | 82,695 | 843,489 | ||||||
| Draper Oakwood Technology Acquisition, Inc.* | 72,988 | 780,972 | ||||||
| Far Point Acquisition Corp.* | 258,041 | 2,652,661 | ||||||
| Federal Street Acquisition Corp. - Class A* | 257,886 | 2,596,912 | ||||||
| Forum Merger II Corp.* | 98,150 | 991,315 | ||||||
| GigCapital, Inc.* | 103,030 | 1,106,542 | ||||||
| Gores Holdings II, Inc. - Class A* | 179,418 | 1,905,419 | ||||||
| Gores Holdings III, Inc.* | 325,000 | 3,321,500 | ||||||
| GS Acquisition Holdings Corp.* | 90,714 | 934,354 | ||||||
| GS Acquisition Holdings Corp. - Class A* | 65,622 | 639,814 | ||||||
| GTY Technology Holdings, Inc. - Class A*†† | 197,253 | 2,000,145 | ||||||
| Haymaker Acquisition Corp.* | 327,648 | 3,364,945 | ||||||
| Hennessy Capital Acquisition Corp. III* | 74,143 | 755,517 | ||||||
| HL Acquisitions Corp.* | 82,201 | 838,450 | ||||||
| Kayne Anderson Acquisition Corp. - Class A* | 203,358 | 2,057,983 | ||||||
| Landcadia Holdings, Inc.*†† | 214,415 | 2,324,259 | ||||||
| Legacy Acquisition Corp.* | 321,241 | 3,254,171 | ||||||
| Leisure Acquisition Corp.* | 136,139 | 1,381,811 | ||||||
| Leo Holdings Corp. (United Kingdom)* | 125,411 | 1,285,463 | ||||||
| Modern Media Acquisition Corp.* | 81,915 | 860,108 | ||||||
| Mosaic Acquisition Corp.* | 409,200 | 4,165,656 | ||||||
| Mudrick Capital Acquisition Corp.* | 113,492 | 1,155,349 | ||||||
| Nebula Acquisition Corp.* | 155,577 | 1,571,328 | ||||||
| New Frontier Corp. (Hong Kong)*† | 60,713 | 619,273 | ||||||
| One Madison Corp.* | 236,188 | 2,444,546 | ||||||
| Pensare Acquisition Corp.* | 299,131 | 2,979,345 | ||||||
| Platinum Eagle Acquisition Corp.* | 159,039 | 1,603,113 | ||||||
| Platinum Eagle Acquisition Corp.* | 3,449 | 33,766 | ||||||
| Pure Acquisition Corp.* | 304,358 | 3,137,931 | ||||||
| Regalwood Global Energy Ltd.* | 111,423 | 1,145,428 | ||||||
| Saban Capital Acquisition Corp. - Class A* | 175,505 | 1,763,825 | ||||||
| Sentinel Energy Services, Inc.* | 142,989 | 1,457,058 | ||||||
| Social Capital Hedosophia Holdings Corp.* | 192,344 | 1,961,909 | ||||||
| Spartan Energy Acquisition Corp.* | 320,000 | 3,251,200 | ||||||
| Tiberius Acquisition Corp.*† | 28,528 | 288,133 | ||||||
| TKK Symphony Acquisition Corp. (Hong Kong)* | 163,684 | 1,653,208 | ||||||
| TPG Pace Holdings Corp. - Class A* | 308,226 | 3,103,836 | ||||||
| Trinity Merger Corp.* | 74,079 | 755,606 | ||||||
| Twelve Seas Investment Co. (United Kingdom)* | 121,591 | 1,240,228 | ||||||
| Vantage Energy Acquisition Corp. - Class A* | 319,275 | 3,176,786 | ||||||
| 79,986,370 | ||||||||
| Consumer Discretionary — 8.7% | ||||||||
| AV Homes, Inc.* | 64,228 | 1,284,560 | ||||||
| Lennar Corp. - Class A | 22,400 | 1,045,856 | ||||||
| Lennar Corp. - Class B†† | 10,107 | 389,120 | ||||||
| Tribune Media Co. - Class A†† | 124,510 | 4,784,919 | ||||||
| Twenty-First Century Fox, Inc. - Class B†† | 101,895 | 4,668,829 | ||||||
| 12,173,284 | ||||||||
| Information Technology — 7.2% | ||||||||
| CA, Inc. | 65,740 | 2,902,421 | ||||||
| Mitel Networks Corp. (Canada)*†† | 146,100 | 1,610,022 | ||||||
| NXP Semiconductors NV (Netherlands)†† | 55,413 | 4,737,812 | ||||||
| Xcerra Corp.* | 50,350 | 718,494 | ||||||
| 9,968,749 | ||||||||
| Health Care — 7.1% | ||||||||
| Aetna, Inc.†† | 13,600 | 2,758,760 | ||||||
| Akorn, Inc.*†† | 126,138 | 1,637,271 | ||||||
| Envision Healthcare Corp.* | 32,100 | 1,467,933 | ||||||
| Express Scripts Holding Co.*†† | 22,000 | 2,090,220 | ||||||
| Invuity, Inc.* | 260,987 | 1,931,304 | ||||||
| 9,885,488 | ||||||||
| Energy — 5.9% | ||||||||
| Alta Mesa Resources, Inc.*†† | 242,859 | 1,015,151 | ||||||
| Andeavor | 25,490 | 3,912,715 | ||||||
| Energy XXI Gulf Coast, Inc.*†† | 193,750 | 1,619,750 | ||||||
| KLX Energy Services Holdings, Inc.* | 5,440 | 174,134 | ||||||
| Magnolia Oil & Gas Corp.* | 101,616 | 1,525,256 | ||||||
| 8,247,006 | ||||||||
| Real Estate — 4.6% | ||||||||
| Forest City Realty Trust, Inc. - Class A REIT†† | 126,610 | 3,176,645 | ||||||
| Gramercy Property Trust REIT†† | 84,010 | 2,305,234 | ||||||
| LaSalle Hotel Properties REIT†† | 27,827 | 962,536 | ||||||
| 6,444,415 | ||||||||
| Industrials — 3.8% | ||||||||
| Rockwell Collins, Inc.†† | 21,090 | 2,962,512 | ||||||
| Sparton Corp.*†† | 130,000 | 1,875,900 | ||||||
| USG Corp.†† | 11,990 | 519,287 | ||||||
| 5,357,699 | ||||||||
| Materials — 2.4% | ||||||||
| KapStone Paper and Packaging Corp.†† | 97,980 | 3,322,502 | ||||||
| Utilities — 1.7% | ||||||||
| Avista Corp.†† | 46,713 | 2,361,809 | ||||||
| Total Common Stocks | $ | 137,747,322 | ||||||
| 87 |
Touchstone Merger Arbitrage Fund (Continued)
| Principal | Market | |||||||
| Amount | Value | |||||||
| Corporate Bonds — 5.0% | ||||||||
| Energy — 2.1% | ||||||||
| $ | 950,000 | Alta Mesa Holdings LP / Alta Mesa | ||||||
| Finance Services Corp., | ||||||||
| 7.875%, 12/15/24 | $ | 902,500 | ||||||
| 2,000,000 | Magnolia Oil & Gas Operating LLC / | |||||||
| Magnolia Oil & Gas Finance Corp., | ||||||||
| 144a, 6.000%, 8/1/26 | 1,995,000 | |||||||
| 2,897,500 | ||||||||
| Consumer Discretionary — 1.5% | ||||||||
| 1,250,000 | Williams Scotsman International, Inc., | |||||||
| 144a, 6.875%, 8/15/23 | 1,240,625 | |||||||
| 900,000 | Williams Scotsman International, Inc., | |||||||
| 144a, 7.875%, 12/15/22 | 927,000 | |||||||
| 2,167,625 | ||||||||
| Financials — 0.7% | ||||||||
| 500,000 | Corestates Capital III, 144a, (3M LIBOR | |||||||
| +0.570%), 2.884%, 2/15/27(A) | 465,000 | |||||||
| 500,000 | JPMorgan Chase & Co., (3M LIBOR | |||||||
| +0.950%), 3.336%, 9/30/34(A) | 450,000 | |||||||
| 915,000 | ||||||||
| Industrials — 0.5% | ||||||||
| 648,000 | USG Corp., 144a, 4.875%, 6/1/27 | 655,135 | ||||||
| Health Care — 0.2% | ||||||||
| 329,000 | Universal Hospital Services, Inc., | |||||||
| 7.625%, 8/15/20 | 329,411 | |||||||
| Total Corporate Bonds | $ | 6,964,671 | ||||||
| Shares | ||||||||
| Warrants — 1.7% | ||||||||
| Financials — 1.5% | ||||||||
| Avista Healthcare Public - Class A, | ||||||||
| Exp 12/2/21, Price $11.50* | 304,682 | 60,936 | ||||||
| Big Rock Partners Acquisition Corp., | ||||||||
| Exp 12/01/22, Price $11.50* | 45,200 | 14,053 | ||||||
| Black Ridge Acquisition Corp., | ||||||||
| Exp 10/25/22, Price $11.50* | 109,420 | 47,051 | ||||||
| Constellation Alpha Capital Corp. - | ||||||||
| Class R, Exp 3/23/24, Price $11.50* | 399,207 | 87,826 | ||||||
| Federal Street Acquisition Corp. - | ||||||||
| Class A, Exp 7/24/22, Price $11.50* | 159,507 | 223,310 | ||||||
| Gores Holdings II, Inc. - Class A, | ||||||||
| Exp 3/6/22, Price $11.50* | 42,226 | 90,786 | ||||||
| GTY Technology Holdings, Inc. - | ||||||||
| Class A, Exp 11/14/21, | ||||||||
| Price $11.50* | 92,755 | 115,944 | ||||||
| Hennessy Capital Acquisition Corp. III, | ||||||||
| Exp 6/15/24, Price $11.50* | 137,222 | 205,833 | ||||||
| Industrea Acquisition Corp. - Class A, | ||||||||
| Exp 8/1/24, Price $11.50* | 54,508 | 53,963 | ||||||
| Kayne Anderson Acquisition Corp. - | ||||||||
| Class A, Exp 6/30/22, Price $11.50* | 157,486 | 196,857 | ||||||
| Landcadia Holdings, Inc., | ||||||||
| Exp 6/1/23, Price $11.50* | 100,566 | 119,673 | ||||||
| Legacy Acquisition Corp. - Class A, | ||||||||
| Exp 11/30/22, Price $5.75* | 117,936 | 48,354 | ||||||
| Matlin and Partners Acquisition Corp. | ||||||||
| - Class A, Exp 5/28/21 Price $5.75* | 58,188 | 43,641 | ||||||
| Pensare Acquisition Corp., Exp 8/8/22, | ||||||||
| Price $11.50* | 107,893 | 49,631 | ||||||
| Platinum Eagle Acquisition Corp., | ||||||||
| Exp 3/5/25, Price $11.50* | 8,037 | 10,850 | ||||||
| Saban Capital Acquisition Corp. - | ||||||||
| Class A, Exp 9/21/21, Price $11.50* | 104,594 | 115,053 | ||||||
| Social Capital Hedosophia Holdings | ||||||||
| Corp., Exp 9/25/22, Price $11.50* | 109,903 | 117,596 | ||||||
| Thunder Bridge Acquisition Ltd. - | ||||||||
| Class A, Exp 7/17/22, Price $11.50* | 116,000 | 52,200 | ||||||
| TPG Pace Holdings Corp. - Class A, | ||||||||
| Exp 8/18/22, Price $11.50* | 128,175 | 224,306 | ||||||
| Vantage Energy Acquisition Corp. - | ||||||||
| Class A, Exp 4/12/24, Price $11.50* | 85,539 | 128,308 | ||||||
| VectoIQ Acquisition Corp., | ||||||||
| Exp 6/11/23, Price $11.50* | 99,739 | 58,846 | ||||||
| 2,065,017 | ||||||||
| Energy — 0.2% | ||||||||
| Alta Mesa Resources, Inc., | ||||||||
| Exp 2/9/23, Price $11.50* | 164,499 | 82,233 | ||||||
| Magnolia Oil & Gas Corp., Exp | ||||||||
| 7/31/23, Price $11.50* | 48,373 | 227,353 | ||||||
| 309,586 | ||||||||
| Industrials — 0.0% | ||||||||
| Willscot Corp., Exp 9/10/22, | ||||||||
| Price $11.50* | 12,570 | 37,459 | ||||||
| Total Warrants | $ | 2,412,062 | ||||||
| Exchange-Traded Funds — 0.2% | ||||||||
| Consumer Discretionary Select Sector | ||||||||
| SPDR Fund | 420 | 49,232 | ||||||
| Health Care Select Sector SPDR Fund | 423 | 40,249 | ||||||
| Industrial Select Sector SPDR Fund | 156 | 12,230 | ||||||
| Real Estate Select Sector SPDR Fund | 1,115 | 36,360 | ||||||
| Technology Select Sector SPDR Fund | 1,947 | 146,668 | ||||||
| Total Exchange-Traded Funds | $ | 284,739 | ||||||
| Number | ||||||||
| of | ||||||||
| Rights | ||||||||
| Rights — 0.1% | ||||||||
| Big Rock Partners Acquisition Corp. | ||||||||
| Exp 11/23/18, Strike Price $11.50* | 90,400 | 37,064 | ||||||
| Black Ridge Acquisition Corp. | ||||||||
| Exp 7/1/19, Strike Price $11.50* | 68,895 | 22,177 | ||||||
| Pensare Acquisition Corp. Exp 2/1/19, | ||||||||
| Strike Price $11.50* | 215,786 | 97,104 | ||||||
| 88 |
Touchstone Merger Arbitrage Fund (Continued)
| Number | ||||||||
| of | Market | |||||||
| Rights | Value | |||||||
| Rights — 0.1% (Continued) | ||||||||
| Media General, Inc. Exp 12/31/23, | ||||||||
| Strike Price $10.00(B)* | 208,090 | $ | 20,809 | |||||
| Total Rights | $ | 177,154 | ||||||
| Number | ||||||||||||
| of | Notional | |||||||||||
| Contracts | Amount | |||||||||||
| Purchased Options — 0.0% | ||||||||||||
| Purchased Call Option — 0.0% | ||||||||||||
| Sinclair Broadcast | ||||||||||||
| Group Inc., Strike | ||||||||||||
| @30.00, | ||||||||||||
| Exp 10/18†† | 206 | $ | 447,844 | 5,150 | ||||||||
| Purchased Put Option — 0.0% | ||||||||||||
| SPDR S&P 500 ETF | ||||||||||||
| Trust., Strike | ||||||||||||
| @290.00, | ||||||||||||
| Exp 10/18†† | 90 | 2,616,480 | 23,490 | |||||||||
| Total Purchased Options | $ | 28,640 | ||||||||||
| Shares | ||||||||
| Short-Term Investment Funds — 13.3% | ||||||||
| Dreyfus Government Cash | ||||||||
| Management, Institutional Shares, | ||||||||
| 1.95%∞Ω | 17,882,753 | 17,882,753 | ||||||
| Invesco Government & Agency | ||||||||
| Portfolio, Institutional Class, | ||||||||
| 1.97%**∞Ω | 658,866 | 658,866 | ||||||
| Total Short-Term Investment Funds | $ | 18,541,619 | ||||||
| Total Long Positions | ||||||||
| (Cost $168,986,651) | $ | 166,156,207 | ||||||
| Securities Sold Short — (13.9%) | ||||||||
| Common Stocks — (7.6%) | ||||||||
| Consumer Discretionary — (2.7%) | ||||||||
| Lennar Corp. - Class A | (22,400 | ) | (1,045,856 | ) | ||||
| Lennar Corp. - Class B | (607 | ) | (23,370 | ) | ||||
| Sinclair Broadcast Group, Inc. - Class A | (20,600 | ) | (584,010 | ) | ||||
| Walt Disney Co. (The) | (18,280 | ) | (2,137,663 | ) | ||||
| (3,790,899 | ) | |||||||
| Energy — (2.5%) | ||||||||
| KLX Energy Services Holdings, Inc.* | (5,440 | ) | (174,134 | ) | ||||
| Marathon Petroleum Corp. | (40,519 | ) | (3,240,304 | ) | ||||
| (3,414,438 | ) | |||||||
| Health Care — (1.4%) | ||||||||
| Cigna Corp. | (5,355 | ) | (1,115,179 | ) | ||||
| CVS Health Corp. | (11,396 | ) | (897,093 | ) | ||||
| (2,012,272 | ) | |||||||
| Industrials — (0.8%) | ||||||||
| United Technologies Corp. | (7,869 | ) | $ | (1,100,165 | ) | |||
| Information Technology — (0.2%) | ||||||||
| Cohu, Inc. | (10,621 | ) | (266,587 | ) | ||||
| Total Common Stocks | $ | (10,584,361 | ) | |||||
| Exchange-Traded Funds — (6.3%) | ||||||||
| Consumer Staples Select Sector SPDR | ||||||||
| Fund | (223 | ) | $ | (12,026 | ) | |||
| Energy Select Sector SPDR Fund | (1,974 | ) | (149,511 | ) | ||||
| Financial Select Sector SPDR Fund | (233 | ) | (6,426 | ) | ||||
| iShares US Telecommunications ETF | (1,813 | ) | (53,919 | ) | ||||
| Materials Select Sector SPDR Fund | (364 | ) | (21,087 | ) | ||||
| SPDR S&P 500 ETF Trust | (23,000 | ) | (6,686,560 | ) | ||||
| SPDR S&P Oil & Gas Exploration & | ||||||||
| Production ETF | (42,000 | ) | (1,818,180 | ) | ||||
| Utilities Select Sector SPDR Fund | (540 | ) | (28,431 | ) | ||||
| Total Exchange-Traded Funds | $ | (8,776,140 | ) | |||||
| Total Securities Sold Short | ||||||||
| (Proceeds $18,236,106) | $ | (19,360,501 | ) | |||||
| Number | ||||||||||||
| of | Notional | |||||||||||
| Contracts | Amount | |||||||||||
| Written Options — 0.0% | ||||||||||||
| Written Put Options — (0.0%) | ||||||||||||
| Sinclair Broadcast | ||||||||||||
| Group Inc., Strike | ||||||||||||
| @28.00, | ||||||||||||
| Exp 10/18 | (206 | ) | $ | (447,844 | ) | (17,510 | ) | |||||
| SPDR S&P 500 ETF | ||||||||||||
| Trust., Strike | ||||||||||||
| @285.00, | ||||||||||||
| Exp 10/18 | (140 | ) | (4,070,080 | ) | (11,620 | ) | ||||||
| SPDR S&P 500 ETF | ||||||||||||
| Trust., Strike | ||||||||||||
| @285.00, | ||||||||||||
| Exp 10/18 | (180 | ) | (5,232,960 | ) | (27,180 | ) | ||||||
| $ | (56,310 | ) | ||||||||||
| Total Written Options | ||||||||||||
| (Premiums received $51,465) | $ | (56,310 | ) | |||||||||
| Total — 105.1% | $ | 146,739,396 | ||||||||||
| Liabilities in Excess of Other Assets — (5.1%) | (7,146,366 | ) | ||||||||||
| Net Assets — 100.0% | $ | 139,593,030 | ||||||||||
| (A) | Variable rate security - Rate reflected is the rate in effect as of September 30, 2018. |
| 89 |
Touchstone Merger Arbitrage Fund (Continued)
| (B) | Level 3-For more information on valuation inputs, and their aggregation into the levels used in the table below, please refer to the security valuation section in the accompanying Notes to Financial Statements. |
| * | Non-income producing security. |
| ** | Represents collateral for securities loaned. |
| † | All or a portion of the security is on loan. The total market value of the securities on loan as of September 30, 2018 was $591,845. |
| †† | All or a portion of these securities are pledged as collateral for securities sold short and written options. The total value of the securities pledged as collateral as of September 30, 2018 was $46,032,305. |
| ∞ | Open-End Fund. |
| Ω | Represents the 7-day SEC yield as of September 30, 2018. |
Portfolio Abbreviations:
ETF - Exchange-Traded Fund
LIBOR - London Interbank Offered Rate
LLC - Limited Liability Company
LP - Limited Partnership
REIT - Real Estate Investment Trusts
SPDR - Standard & Poor’s Depositary Receipt
144a - This is a restricted security that was sold in a transaction qualifying for the exemption under Rule 144a of the Securities Act of 1933. This security may be sold in transactions exempt from registration, normally to qualified institutional buyers. At September 30, 2018, these securities were valued at $5,282,760 or 3.8% of net assets. These securities were deemed liquid pursuant to procedures approved by the Board of Trustees.
Other Information:
The inputs or methodology used for valuing securities may not be an indication of the risk associated with investing in those securities. For more information on valuation inputs, and their aggregation into the levels used in the table below, please refer to the security valuation section in the accompanying Notes to Financial Statements.
| Valuation inputs at Reporting Date: | ||||||||||||||||
| Description | Level 1 | Level 2 | Level 3 | Total | ||||||||||||
| Assets: | ||||||||||||||||
| Common Stocks | $ | 137,747,322 | $ | — | $ | — | $ | 137,747,322 | ||||||||
| Corporate Bonds | — | 6,964,671 | — | 6,964,671 | ||||||||||||
| Warrants | 2,412,062 | — | — | 2,412,062 | ||||||||||||
| Exchange-Traded Funds | 284,739 | — | — | 284,739 | ||||||||||||
| Rights | 156,345 | — | 20,809 | 177,154 | ||||||||||||
| Purchased Options Equity Contracts | 28,640 | — | — | 28,640 | ||||||||||||
| Short-Term Investment Funds | 18,541,619 | — | — | 18,541,619 | ||||||||||||
| Total Assets | $ | 159,170,727 | $ | 6,964,671 | $ | 20,809 | $ | 166,156,207 | ||||||||
| Liabilities: | ||||||||||||||||
| Securities Sold Short | ||||||||||||||||
| Common Stocks | $ | (10,584,361 | ) | $ | — | $ | — | $ | (10,584,361 | ) | ||||||
| Exchange-Traded Funds | (8,776,140 | ) | — | — | (8,776,140 | ) | ||||||||||
| Other Financial Instruments | ||||||||||||||||
| Written Options Equity Contracts | (56,310 | ) | — | — | (56,310 | ) | ||||||||||
| Total Liabilities | $ | (19,416,811 | ) | $ | — | $ | — | $ | (19,416,811 | ) | ||||||
| Total | $ | 139,753,916 | $ | 6,964,671 | $ | 20,809 | $ | 146,739,396 | ||||||||
| Measurements Using Unobservable Inputs (Level 3) | ||||
| Assets | Rights | |||
| Beginning balance September 30, 2017 | $ | 20,809 | ||
| Net change in unrealized appreciation/depreciation | — | |||
| Realized gain from distributions received | — | |||
| Ending balance September 30, 2018 | $ | 20,809 | ||
| Net Change in Unrealized Appreciation/Depreciation for Investments in Securities still held at September 30, 2018 | $ | — | ||
| Valuation | �� | Unobservable | ||||||
| Rights | Fair Value | Technique | Input | |||||
| Media General, Inc. Exp 12/31/23, Strike Price $10.00 | $ | 20,809 | Issuer Guidance | New Issue | ||||
See accompanying Notes to Financial Statements.
| 90 |
Touchstone Mid Cap Fund – September 30, 2018
| Market | ||||||||
| Shares | Value | |||||||
| Common Stocks — 97.7% | ||||||||
| Consumer Discretionary — 21.2% | ||||||||
| CarMax, Inc.* | 460,580 | $ | 34,391,508 | |||||
| Deckers Outdoor Corp.* | 203,200 | 24,095,456 | ||||||
| Dollar Tree, Inc.* | 407,210 | 33,207,975 | ||||||
| Hasbro, Inc. | 296,000 | 31,115,520 | ||||||
| Penske Automotive Group, Inc. | 517,634 | 24,530,675 | ||||||
| Tiffany & Co. | 307,480 | 39,655,696 | ||||||
| Whirlpool Corp. | 132,910 | 15,783,062 | ||||||
| 202,779,892 | ||||||||
| Industrials — 17.8% | ||||||||
| Armstrong World Industries, Inc.* | 524,780 | 36,524,688 | ||||||
| Cintas Corp. | 174,980 | 34,612,794 | ||||||
| Copart, Inc.* | 713,768 | 36,780,465 | ||||||
| Old Dominion Freight Line, Inc. | 228,190 | 36,797,919 | ||||||
| Sensata Technologies Holding PLC* | 517,460 | 25,640,143 | ||||||
| 170,356,009 | ||||||||
| Information Technology — 17.5% | ||||||||
| Amphenol Corp. - Class A | 430,380 | 40,464,328 | ||||||
| Citrix Systems, Inc.* | 325,880 | 36,224,821 | ||||||
| Entegris, Inc. | 1,010,600 | 29,256,870 | ||||||
| Paychex, Inc. | 532,500 | 39,218,625 | ||||||
| Skyworks Solutions, Inc. | 238,842 | 21,665,358 | ||||||
| 166,830,002 | ||||||||
| Financials — 13.9% | ||||||||
| Alleghany Corp. | 60,930 | 39,758,653 | ||||||
| M&T Bank Corp. | 216,310 | 35,591,647 | ||||||
| Progressive Corp. (The) | 307,840 | 21,868,954 | ||||||
| T Rowe Price Group, Inc. | 320,620 | 35,005,292 | ||||||
| 132,224,546 | ||||||||
| Materials — 13.7% | ||||||||
| AXAlta Coating Systems Ltd.* | 869,020 | 25,340,623 | ||||||
| Ball Corp. | 842,120 | 37,044,859 | ||||||
| NewMarket Corp. | 78,180 | 31,702,772 | ||||||
| Vulcan Materials Co. | 328,200 | 36,495,840 | ||||||
| 130,584,094 | ||||||||
| Consumer Staples — 10.5% | ||||||||
| Brown-Forman Corp. - Class B | 555,210 | 28,065,865 | ||||||
| Energizer Holdings, Inc. | 365,381 | 21,429,596 | ||||||
| Post Holdings, Inc.* | 521,727 | 51,150,115 | ||||||
| 100,645,576 | ||||||||
| Real Estate — 3.1% | ||||||||
| STORE Capital Corp. REIT | 1,065,640 | 29,614,136 | ||||||
| Total Common Stocks | $ | 933,034,255 | ||||||
| Short-Term Investment Fund — 2.8% | ||||||||
| Dreyfus Government Cash | ||||||||
| Management, Institutional Shares, | ||||||||
| 1.95%∞Ω | 27,174,233 | 27,174,233 | ||||||
| Total Investment Securities — 100.5% | ||||||||
| (Cost $777,364,028) | $ | 960,208,488 | ||||||
| Liabilities in Excess of Other Assets — (0.5%) | (4,783,003 | ) | ||||||
| Net Assets — 100.0% | $ | 955,425,485 | ||||||
| * | Non-income producing security. |
| ∞ | Open-End Fund. |
| Ω | Represents the 7-day SEC yield as of September 30, 2018. |
Portfolio Abbreviations:
PLC - Public Limited Company
REIT - Real Estate Investment Trust
Other Information:
The inputs or methodology used for valuing securities may not be an indication of the risk associated with investing in those securities. For more information on valuation inputs, and their aggregation into the levels used in the table below, please refer to the security valuation section in the accompanying Notes to Financial Statements.
Valuation inputs at Reporting Date:
| Description | Level 1 | Level 2 | Level 3 | Total | ||||||||||||
| Common | ||||||||||||||||
| Stocks | $ | 933,034,255 | $ | — | $ | — | $ | 933,034,255 | ||||||||
| Short-Term | ||||||||||||||||
| Investment | ||||||||||||||||
| Fund | 27,174,233 | — | 27,174,233 | |||||||||||||
| Total | $ | 960,208,488 | $ | — | $ | — | $ | 960,208,488 | ||||||||
See accompanying Notes to Financial Statements.
| 91 |
Touchstone Mid Cap Value Fund – September 30, 2018
| Market | ||||||||
| Shares | Value | |||||||
| Common Stocks — 97.4% | ||||||||
| Financials — 15.4% | ||||||||
| Allstate Corp. (The) | 133,469 | $ | 13,173,390 | |||||
| Ameriprise Financial, Inc. | 85,094 | 12,564,980 | ||||||
| Bank OZK | 141,116 | 5,356,763 | ||||||
| Blackstone Mortgage Trust, Inc. | ||||||||
| - Class A, REIT | 372,285 | 12,475,270 | ||||||
| Hartford Financial Services | ||||||||
| Group, Inc. (The) | 203,992 | 10,191,440 | ||||||
| M&T Bank Corp. | 46,481 | 7,647,984 | ||||||
| PacWest Bancorp | 238,233 | 11,351,802 | ||||||
| Pinnacle Financial Partners, Inc. | 158,385 | 9,526,858 | ||||||
| Reinsurance Group of America, Inc. | 85,385 | 12,343,256 | ||||||
| Signature Bank | 88,299 | 10,140,257 | ||||||
| Sterling Bancorp. | 622,589 | 13,696,958 | ||||||
| SVB Financial Group* | 12,262 | 3,811,397 | ||||||
| 122,280,355 | ||||||||
| Industrials — 13.9% | ||||||||
| Aercap Holdings N.V. (Ireland)* | 279,468 | 16,074,999 | ||||||
| Clean Harbors, Inc.* | 177,618 | 12,713,896 | ||||||
| Dover Corp. | 138,714 | 12,280,350 | ||||||
| Fluor Corp. | 144,980 | 8,423,338 | ||||||
| KAR Auction Services, Inc. | 261,983 | 15,637,765 | ||||||
| Parker-Hannifin Corp. | 41,964 | 7,718,439 | ||||||
| Regal-Beloit Corp. | 156,491 | 12,902,683 | ||||||
| Snap-on, Inc. | 84,656 | 15,542,842 | ||||||
| Stericycle, Inc.* | 159,696 | 9,370,961 | ||||||
| 110,665,273 | ||||||||
| Materials — 12.0% | ||||||||
| Allegheny Technologies, Inc.* | 353,488 | 10,445,570 | ||||||
| Bemis Co., Inc. | 157,642 | 7,661,401 | ||||||
| Berry Global Group, Inc.* | 267,656 | 12,951,874 | ||||||
| FMC Corp. | 160,862 | 14,023,949 | ||||||
| Olin Corp. | 345,183 | 8,864,299 | ||||||
| RPM International, Inc. | 168,293 | 10,928,947 | ||||||
| Scotts Miracle-Gro Co. (The) | 138,277 | 10,886,548 | ||||||
| Sonoco Products Co. | 139,734 | 7,755,237 | ||||||
| Valvoline, Inc. | 544,949 | 11,721,853 | ||||||
| 95,239,678 | ||||||||
| Information Technology — 10.6% | ||||||||
| Fidelity National Information | ||||||||
| Services, Inc. | 134,780 | 14,700,455 | ||||||
| Leidos Holdings, Inc. | 194,243 | 13,433,846 | ||||||
| MACOM Technology Solutions | ||||||||
| Holdings, Inc.*† | 885,760 | 18,246,656 | ||||||
| PTC, Inc.* | 120,293 | 12,773,914 | ||||||
| Qorvo, Inc.* | 128,515 | 9,881,518 | ||||||
| Synopsys, Inc.* | 154,742 | 15,259,109 | ||||||
| 84,295,498 | ||||||||
| Consumer Discretionary — 9.1% | ||||||||
| Aramark | 197,872 | 8,512,453 | ||||||
| BorgWarner, Inc. | 213,463 | 9,131,947 | ||||||
| Carter's, Inc. | 102,296 | 10,086,386 | ||||||
| Dollar General Corp. | 43,567 | 4,761,873 | ||||||
| Dollar Tree, Inc.* | 133,469 | 10,884,397 | ||||||
| LKQ Corp.* | 532,855 | 16,875,518 | ||||||
| Michaels Cos., Inc. (The)* | 375,828 | 6,099,688 | ||||||
| Newell Brands, Inc. | 286,462 | 5,815,179 | ||||||
| 72,167,441 | ||||||||
| Utilities — 8.5% | ||||||||
| DTE Energy Co. | 120,355 | 13,134,341 | ||||||
| Edison International | 129,826 | 8,786,624 | ||||||
| Evergy, Inc. | 327,698 | 17,997,174 | ||||||
| NiSource, Inc. | 316,412 | 7,884,987 | ||||||
| Pinnacle West Capital Corp. | 159,842 | 12,656,290 | ||||||
| PPL Corp. | 235,610 | 6,893,949 | ||||||
| 67,353,365 | ||||||||
| Real Estate — 8.0% | ||||||||
| Alexandria Real Estate Equities, Inc., REIT | 105,347 | 13,251,599 | ||||||
| American Campus | ||||||||
| Communities, Inc., REIT | 278,011 | 11,442,933 | ||||||
| Brixmor Property Group, Inc., REIT | 529,358 | 9,269,059 | ||||||
| Equinix, Inc., REIT | 21,711 | 9,398,475 | ||||||
| Host Hotels & Resorts, Inc., REIT | 490,017 | 10,339,359 | ||||||
| Mid-America Apartment Communities, | ||||||||
| Inc., REIT | 94,710 | 9,488,048 | ||||||
| 63,189,473 | ||||||||
| Energy — 7.5% | ||||||||
| Anadarko Petroleum Corp. | 208,654 | 14,065,366 | ||||||
| Apergy Corp.* | 69,357 | 3,021,191 | ||||||
| Cimarex Energy Co. | 123,269 | 11,456,621 | ||||||
| EQT Corp. | 206,323 | 9,125,666 | ||||||
| Newfield Exploration Co.* | 327,698 | 9,447,533 | ||||||
| Noble Energy, Inc. | 397,784 | 12,406,883 | ||||||
| 59,523,260 | ||||||||
| Consumer Staples — 7.2% | ||||||||
| Darling Ingredients, Inc.* | 651,456 | 12,586,130 | ||||||
| Hain Celestial Group, Inc. (The)* | 266,938 | 7,239,359 | ||||||
| Ingredion, Inc. | 79,309 | 8,324,273 | ||||||
| Kroger Co. (The) | 381,238 | 11,097,838 | ||||||
| Pinnacle Foods, Inc. | 95,293 | 6,175,939 | ||||||
| TreeHouse Foods, Inc.* | 250,910 | 12,006,044 | ||||||
| 57,429,583 | ||||||||
| Health Care — 5.2% | ||||||||
| AmerisourceBergen Corp. | 63,966 | 5,898,945 | ||||||
| Charles River Laboratories | ||||||||
| International, Inc.* | 98,790 | 13,291,207 | ||||||
| DENTSPLY SIRONA, Inc. | 242,896 | 9,166,895 | ||||||
| Envision Healthcare Corp.* | 133,393 | 6,100,062 | ||||||
| Patterson Cos., Inc. | 270,580 | 6,615,681 | ||||||
| 41,072,790 | ||||||||
| Total Common Stocks | $ | 773,216,716 | ||||||
| 92 |
Touchstone Mid Cap Value Fund (Continued)
| Market | ||||||||
| Shares | Value | |||||||
| Exchange-Traded Fund — 1.0% | ||||||||
| iShares Russell Mid-Cap Value ETF | 87,794 | $ | 7,924,286 | |||||
| Short-Term Investment Funds — 3.9% | ||||||||
| Dreyfus Government Cash | ||||||||
| Management, Institutional Shares, | ||||||||
| 1.95%∞Ω | 15,356,496 | 15,356,496 | ||||||
| Invesco Government & Agency | ||||||||
| Portfolio, Institutional Class, | ||||||||
| 1.97%**∞Ω | 15,772,381 | 15,772,381 | ||||||
| Total Short-Term Investment Funds | $ | 31,128,877 | ||||||
| Total Investment Securities — 102.3% | ||||||||
| (Cost $729,581,816) | $ | 812,269,879 | ||||||
| Liabilities in Excess of Other Assets — (2.3%) | (18,639,017 | ) | ||||||
| Net Assets — 100.0% | $ | 793,630,862 | ||||||
| * | Non-income producing security. |
| ** | Represents collateral for securities loaned. |
| † | All or a portion of the security is on loan. The total market value of the securities on loan as of September 30, 2018 was $16,044,990. |
| ∞ | Open-End Fund. |
| Ω | Represents the 7-day SEC yield as of September 30, 2018. |
Portfolio Abbreviations:
ETF - Exchange-Traded Fund
REIT - Real Estate Investment Trust
Other Information:
The inputs or methodology used for valuing securities may not be an indication of the risk associated with investing in those securities. For more information on valuation inputs, and their aggregation into the levels used in the table below, please refer to the security valuation section in the accompanying Notes to Financial Statements.
Valuation inputs at Reporting Date:
| Description | Level 1 | Level 2 | Level 3 | Total | ||||||||||||
| Common | ||||||||||||||||
| Stocks | $ | 773,216,716 | $ | — | $ | — | $ | 773,216,716 | ||||||||
| Exchange-Traded | ||||||||||||||||
| Fund | 7,924,286 | — | — | 7,924,286 | ||||||||||||
| Short-Term | ||||||||||||||||
| Investment | ||||||||||||||||
| Funds | 31,128,877 | — | — | 31,128,877 | ||||||||||||
| Total | $ | 812,269,879 | $ | — | $ | — | $ | 812,269,879 | ||||||||
See accompanying Notes to Financial Statements.
| 93 |
Touchstone Premium Yield Equity Fund – September 30, 2018
| Market | ||||||||
| Shares | Value | |||||||
| Common Stocks — 91.8% | ||||||||
| Financials — 23.4% | ||||||||
| Aegon NV (Netherlands)† | 267,784 | $ | 1,721,851 | |||||
| BB&T Corp. | 69,243 | 3,361,055 | ||||||
| Citigroup, Inc. | 25,035 | 1,796,011 | ||||||
| CME Group, Inc. | 13,151 | 2,238,432 | ||||||
| Fidelity National Financial, Inc. | 45,634 | 1,795,698 | ||||||
| HSBC Holdings PLC (United Kingdom), | ||||||||
| ADR† | 43,733 | 1,923,815 | ||||||
| Huntington Bancshares, Inc. | 166,850 | 2,489,402 | ||||||
| Old Republic International Corp. | 69,877 | 1,563,847 | ||||||
| Toronto-Dominion Bank (The) (Canada) | 46,109 | 2,803,427 | ||||||
| Umpqua Holdings Corp. | 37,236 | 774,509 | ||||||
| 20,468,047 | ||||||||
| Information Technology — 23.1% | ||||||||
| Broadcom, Inc. | 9,516 | 2,347,883 | ||||||
| Cisco Systems, Inc. | 38,662 | 1,880,906 | ||||||
| Cypress Semiconductor Corp. | 152,906 | 2,215,608 | ||||||
| HP, Inc. | 35,744 | 921,123 | ||||||
| KLA-Tencor Corp. | 25,669 | 2,610,794 | ||||||
| Nokia OYJ (Finland), ADR | 289,456 | 1,615,164 | ||||||
| QUALCOMM, Inc. | 29,314 | 2,111,487 | ||||||
| Sabre Corp. | 90,634 | 2,363,735 | ||||||
| Taiwan Semiconductor Manufacturing | ||||||||
| Co. Ltd. (Taiwan), ADR | 51,021 | 2,253,087 | ||||||
| Texas Instruments, Inc. | 18,222 | 1,955,038 | ||||||
| 20,274,825 | ||||||||
| Energy — 12.2% | ||||||||
| Occidental Petroleum Corp. | 33,739 | 2,772,334 | ||||||
| ONEOK, Inc. | 35,969 | 2,438,339 | ||||||
| Pembina Pipeline Corp. (Canada) | 22,183 | 754,000 | ||||||
| TOTAL SA (France), ADR | 38,504 | 2,479,273 | ||||||
| Williams Cos., Inc. (The) | 81,761 | 2,223,082 | ||||||
| 10,667,028 | ||||||||
| Consumer Discretionary — 6.7% | ||||||||
| Carnival Corp. | 26,620 | 1,697,557 | ||||||
| Six Flags Entertainment Corp. | 28,204 | 1,969,203 | ||||||
| Target Corp. | 24,718 | 2,180,375 | ||||||
| 5,847,135 | ||||||||
| Real Estate — 6.2% | ||||||||
| Crown Castle International Corp., REIT | 19,014 | 2,116,829 | ||||||
| Digital Realty Trust, Inc., REIT | 8,873 | 998,035 | ||||||
| Lamar Advertising Co. - Class A, REIT | 29,155 | 2,268,259 | ||||||
| 5,383,123 | ||||||||
| Materials — 5.6% | ||||||||
| International Paper Co. | 32,334 | 1,589,216 | ||||||
| LyondellBasell Industries NV - Class A | 32,641 | 3,346,029 | ||||||
| 4,935,245 | ||||||||
| Utilities — 4.6% | ||||||||
| AES Corp. | 120,265 | 1,683,710 | ||||||
| CenterPoint Energy, Inc. | 84,296 | 2,330,784 | ||||||
| 4,014,494 | ||||||||
| Health Care — 3.7% | ||||||||
| Pfizer, Inc. | 74,155 | 3,268,011 | ||||||
| Telecommunication Services — 3.3% | ||||||||
| Verizon Communications, Inc. | 53,874 | 2,876,333 | ||||||
| Industrials — 3.0% | ||||||||
| Eaton Corp. PLC | 30,740 | 2,666,080 | ||||||
| Total Common Stocks | $ | 80,400,321 | ||||||
| Exchange-Traded Fund — 4.9% | ||||||||
| iShares Select Dividend ETF | 42,952 | $ | 4,284,892 | |||||
| Short-Term Investment Funds — 0.8% | ||||||||
| Dreyfus Government Cash | ||||||||
| Management, Institutional Shares, | ||||||||
| 1.95%∞Ω | 158,648 | 158,648 | ||||||
| Invesco Government & Agency | ||||||||
| Portfolio, Institutional Class, | ||||||||
| 1.97%**∞Ω | 585,420 | 585,420 | ||||||
| Total Short-Term Investment Funds | $ | 744,068 | ||||||
| Total Investment Securities — 97.5% | ||||||||
| (Cost $72,846,490) | $ | 85,429,281 | ||||||
| Other Assets in Excess of Liabilities — 2.5% | 2,194,989 | |||||||
| Net Assets — 100.0% | $ | 87,624,270 | ||||||
| ** | Represents collateral for securities loaned. |
| † | All or a portion of the security is on loan. The total market value of the securities on loan as of September 30, 2018 was $562,203. |
| ∞ | Open-End Fund. |
| Ω | Represents the 7-day SEC yield as of September 30, 2018. |
Portfolio Abbreviations:
ADR - American Depositary Receipt
ETF - Exchange-Traded Fund
PLC - Public Limited Company
REIT - Real Estate Investment Trust
| 94 |
Touchstone Premium Yield Equity Fund (Continued)
Other Information:
The inputs or methodology used for valuing securities may not be an indication of the risk associated with investing in those securities. For more information on valuation inputs, and their aggregation into the levels used in the table below, please refer to the security valuation section in the accompanying Notes to Financial Statements.
Valuation inputs at Reporting Date:
| Description | Level 1 | Level 2 | Level 3 | Total | ||||||||||||
| Common | ||||||||||||||||
| Stocks | $ | 80,400,321 | $ | — | $ | — | $ | 80,400,321 | ||||||||
| Exchange-Traded | ||||||||||||||||
| Fund | 4,284,892 | — | — | 4,284,892 | ||||||||||||
| Short-Term | ||||||||||||||||
| Investment | ||||||||||||||||
| Funds | 744,068 | — | — | 744,068 | ||||||||||||
| Total | $ | 85,429,281 | $ | — | $ | — | $ | 85,429,281 | ||||||||
See accompanying Notes to Financial Statements.
| 95 |
Touchstone Sands Capital Select Growth Fund – September 30, 2018
| Market | ||||||||
| Shares | Value | |||||||
| Common Stocks — 98.2% | ||||||||
| Information Technology — 50.0% | ||||||||
| Activision Blizzard, Inc. | 715,339 | $ | 59,509,051 | |||||
| Adobe Systems, Inc.* | 420,492 | 113,511,815 | ||||||
| Alibaba Group Holding Ltd. (China) | ||||||||
| ADR* | 955,844 | 157,484,857 | ||||||
| Alphabet, Inc. - Class A* | 107,212 | 129,413,461 | ||||||
| Alphabet, Inc. - Class C* | 7,269 | 8,675,333 | ||||||
| Facebook, Inc. - Class A* | 539,480 | 88,722,881 | ||||||
| Palo Alto Networks, Inc.* | 358,931 | 80,852,797 | ||||||
| salesforce.com, Inc.* | 809,085 | 128,668,788 | ||||||
| ServiceNow, Inc.* | 703,736 | 137,671,874 | ||||||
| Splunk, Inc.* | 555,504 | 67,165,989 | ||||||
| Visa, Inc. - Class A | 1,110,989 | 166,748,339 | ||||||
| Workday, Inc. - Class A* | 240,567 | 35,117,971 | ||||||
| 1,173,543,156 | ||||||||
| Consumer Discretionary — 20.3% | ||||||||
| Amazon.com, Inc.* | 108,132 | 216,588,396 | ||||||
| Booking Holdings, Inc.* | 45,003 | 89,285,952 | ||||||
| Floor & Decor Holdings, Inc. - Class A* | 740,790 | 22,349,634 | ||||||
| Netflix, Inc.* | 393,797 | 147,331,272 | ||||||
| 475,555,254 | ||||||||
| Health Care — 19.5% | ||||||||
| Alexion Pharmaceuticals, Inc.* | 337,950 | 46,978,430 | ||||||
| Align Technology, Inc.* | 210,673 | 82,419,491 | ||||||
| BioMarin Pharmaceutical, Inc.* | 428,345 | 41,536,615 | ||||||
| Edwards Lifesciences Corp.* | 480,785 | 83,704,669 | ||||||
| Illumina, Inc.* | 257,916 | 94,670,647 | ||||||
| Loxo Oncology, Inc.* | 208,729 | 35,657,175 | ||||||
| Regeneron Pharmaceuticals, Inc.* | 129,265 | 52,228,231 | ||||||
| Sarepta Therapeutics, Inc.* | 117,000 | 18,896,670 | ||||||
| 456,091,928 | ||||||||
| Consumer Staples — 3.3% | ||||||||
| Monster Beverage Corp.* | 1,313,348 | 76,541,921 | ||||||
| Industrials — 2.7% | ||||||||
| CoStar Group, Inc.* | 152,897 | 64,345,173 | ||||||
| Financials — 2.4% | ||||||||
| Charles Schwab Corp. (The) | 1,166,009 | 57,309,342 | ||||||
| Total Common Stocks | $ | 2,303,386,774 | ||||||
| Short-Term Investment Fund — 2.0% | ||||||||
| Dreyfus Government Cash | ||||||||
| Management, Institutional Shares, | ||||||||
| 1.95%∞Ω | 45,752,055 | 45,752,055 | ||||||
| Total Investment Securities — 100.2% | ||||||||
| (Cost $914,112,202) | $ | 2,349,138,829 | ||||||
| Liabilities in Excess of Other Assets — (0.2%) | (3,716,895 | ) | ||||||
| Net Assets — 100.0% | $ | 2,345,421,934 | ||||||
| * | Non-income producing security. |
| ∞ | Open-End Fund. |
| Ω | Represents the 7-day SEC yield as of September 30, 2018. |
Portfolio Abbreviation:
ADR - American Depositary Receipt
Other Information:
The inputs or methodology used for valuing securities may not be an indication of the risk associated with investing in those securities. For more information on valuation inputs, and their aggregation into the levels used in the table below, please refer to the security valuation section in the accompanying Notes to Financial Statements.
Valuation inputs at Reporting Date:
| Description | Level 1 | Level 2 | Level 3 | Total | ||||||||||||
| Common | ||||||||||||||||
| Stocks | $ | 2,303,386,774 | $ | — | $ | — | $ | 2,303,386,774 | ||||||||
| Short-Term | ||||||||||||||||
| Investment | ||||||||||||||||
| Fund | 45,752,055 | — | — | 45,752,055 | ||||||||||||
| Total | $ | 2,349,138,829 | $ | — | $ | — | $ | 2,349,138,829 | ||||||||
See accompanying Notes to Financial Statements.
| 96 |
Touchstone Small Cap Fund – September 30, 2018
| Market | ||||||||
| Shares | Value | |||||||
| Common Stocks — 97.4% | ||||||||
| Industrials — 30.4% | ||||||||
| Armstrong World Industries, Inc.* | 94,386 | $ | 6,569,266 | |||||
| GATX Corp. | 108,872 | 9,427,226 | ||||||
| Kaman Corp. | 99,991 | 6,677,399 | ||||||
| Landstar System, Inc. | 79,479 | 9,696,438 | ||||||
| Masonite International Corp.* | 69,023 | 4,424,374 | ||||||
| Matson, Inc. | 95,031 | 3,767,029 | ||||||
| USG Corp. | 180,320 | 7,809,659 | ||||||
| 48,371,391 | ||||||||
| Consumer Discretionary — 18.1% | ||||||||
| Adient PLC | 63,721 | 2,504,873 | ||||||
| LCI Industries | 33,967 | 2,812,468 | ||||||
| MSG Networks, Inc., Class A* | 207,674 | 5,357,989 | ||||||
| Penske Automotive Group, Inc. | 126,128 | 5,977,206 | ||||||
| Service Corp. International | 99,287 | 4,388,485 | ||||||
| Sturm Ruger & Co., Inc. | 70,864 | 4,893,159 | ||||||
| Tempur Sealy International, Inc.*† | 54,020 | 2,857,658 | ||||||
| 28,791,838 | ||||||||
| Materials — 15.5% | ||||||||
| GCP Applied Technologies, Inc.* | 200,800 | 5,331,240 | ||||||
| Ingevity Corp.* | 78,279 | 7,975,064 | ||||||
| NewMarket Corp. | 20,382 | 8,265,105 | ||||||
| Olin Corp. | 49,716 | 1,276,707 | ||||||
| Tredegar Corp. | 85,036 | 1,841,029 | ||||||
| 24,689,145 | ||||||||
| Financials — 10.3% | ||||||||
| Eaton Vance Corp. | 72,278 | 3,798,932 | ||||||
| MBIA, Inc.*† | 286,310 | 3,060,654 | ||||||
| Union Bankshares Corp. | 120,795 | 4,654,231 | ||||||
| White Mountains Insurance Group Ltd.* | 5,301 | 4,961,047 | ||||||
| 16,474,864 | ||||||||
| Real Estate — 8.3% | ||||||||
| Alexander & Baldwin, Inc. REIT | 247,987 | 5,626,825 | ||||||
| First Industrial Realty Trust, Inc. REIT | 193,639 | 6,080,265 | ||||||
| Tejon Ranch Co.* | 65,651 | 1,425,283 | ||||||
| 13,132,373 | ||||||||
| Consumer Staples — 7.1% | ||||||||
| Energizer Holdings, Inc. | 111,537 | 6,541,645 | ||||||
| PriceSmart, Inc. | 59,276 | 4,798,392 | ||||||
| 11,340,037 | ||||||||
| Information Technology — 3.9% | ||||||||
| Versum Materials, Inc. | 171,714 | 6,183,421 | ||||||
| Energy — 2.2% | ||||||||
| Dril-Quip, Inc.* | 67,523 | 3,528,077 | ||||||
| Health Care — 1.6% | ||||||||
| Bruker Corp. | 77,428 | 2,589,967 | ||||||
| Total Common Stocks | $ | 155,101,113 | ||||||
| Short-Term Investment Funds — 5.3% | ||||||||
| Dreyfus Government Cash | ||||||||
| Management, Institutional Shares, | ||||||||
| 1.95%∞Ω | 4,536,461 | 4,536,461 | ||||||
| Invesco Government & Agency | ||||||||
| Portfolio, Institutional Class, | ||||||||
| 1.97%**∞Ω | 3,968,011 | 3,968,011 | ||||||
| Total Short-Term Investment Funds | $ | 8,504,472 | ||||||
| Total Investment Securities — 102.7% | ||||||||
| (Cost $110,512,989) | $ | 163,605,585 | ||||||
| Liabilities in Excess of Other Assets — (2.7%) | (4,310,954 | ) | ||||||
| Net Assets — 100.0% | $ | 159,294,631 | ||||||
| * | Non-income producing security. |
| ** | Represents collateral for securities loaned. |
| † | All or a portion of the security is on loan. The total market value of the securities on loan as of September 30, 2018 was $3,827,604. |
| ∞ | Open-End Fund. |
| Ω | Represents the 7-day SEC yield as of September 30, 2018. |
Portfolio Abbreviation:
PLC - Public Limited Company
REIT - Real Estate Investment Trust
Other Information:
The inputs or methodology used for valuing securities may not be an indication of the risk associated with investing in those securities. For more information on valuation inputs, and their aggregation into the levels used in the table below, please refer to the security valuation section in the accompanying Notes to Financial Statements.
Valuation inputs at Reporting Date:
| Description | Level 1 | Level 2 | Level 3 | Total | ||||||||||||
| Common | ||||||||||||||||
| Stocks | $ | 155,101,113 | $ | — | $ | — | $ | 155,101,113 | ||||||||
| Short-Term | ||||||||||||||||
| Investment | ||||||||||||||||
| Funds | 8,504,472 | — | — | 8,504,472 | ||||||||||||
| Total | $ | 163,605,585 | $ | — | $ | — | $ | 163,605,585 | ||||||||
See accompanying Notes to Financial Statements.
| 97 |
Touchstone Small Cap Value Fund – September 30, 2018
| Market | ||||||||
| Shares | Value | |||||||
| Common Stocks — 95.5% | ||||||||
| Industrials — 22.3% | ||||||||
| Actuant Corp. - Class A | 44,404 | $ | 1,238,872 | |||||
| Altra Industrial Motion Corp.† | 23,729 | 980,008 | ||||||
| CIRCOR International, Inc. | 19,933 | 946,817 | ||||||
| Clean Harbors, Inc.* | 26,242 | 1,878,402 | ||||||
| EMCOR Group, Inc. | 16,506 | 1,239,766 | ||||||
| EnPro Industries, Inc. | 24,101 | 1,757,686 | ||||||
| Generac Holdings, Inc.* | 32,138 | 1,812,905 | ||||||
| Hexcel Corp. | 26,561 | 1,780,915 | ||||||
| Huron Consulting Group, Inc.* | 38,017 | 1,878,040 | ||||||
| ITT, Inc. | 37,522 | 2,298,598 | ||||||
| Kelly Services, Inc. - Class A | 41,057 | 986,600 | ||||||
| Korn/Ferry International | 40,314 | 1,985,061 | ||||||
| Masonite International Corp.* | 15,896 | 1,018,934 | ||||||
| Matthews International Corp. - Class A | 27,043 | 1,356,206 | ||||||
| Milacron Holdings Corp.* | 119,471 | 2,419,288 | ||||||
| Regal Beloit Corp. | 21,493 | 1,772,098 | ||||||
| SPX FLOW, Inc.* | 17,099 | 889,148 | ||||||
| Standex International Corp. | 22,468 | 2,342,289 | ||||||
| Team, Inc.*† | 120,856 | 2,719,260 | ||||||
| Tetra Tech, Inc. | 10,371 | 708,339 | ||||||
| TriMas Corp.* | 62,387 | 1,896,565 | ||||||
| Triumph Group, Inc. | 30,332 | 706,736 | ||||||
| 34,612,533 | ||||||||
| Financials — 20.7% | ||||||||
| Banc of California, Inc. | 58,976 | 1,114,646 | ||||||
| Bank of N.T. Butterfield & Son Ltd. (The) | ||||||||
| (Bermuda) | 50,770 | 2,632,932 | ||||||
| BankUnited, Inc. | 68,116 | 2,411,306 | ||||||
| Blackstone Mortgage Trust, Inc. | ||||||||
| - Class A REIT | 83,188 | 2,787,630 | ||||||
| Chemical Financial Corp. | 35,387 | 1,889,666 | ||||||
| Eagle Bancorp, Inc.* | 27,089 | 1,370,703 | ||||||
| Federated Investors, Inc. - Class B | 19,491 | 470,123 | ||||||
| First Horizon National Corp. | 117,567 | 2,029,206 | ||||||
| FNB Corp. | 212,007 | 2,696,729 | ||||||
| Hanover Insurance Group, Inc. (The) | 6,839 | 843,727 | ||||||
| IBERIABANK Corp. | 38,053 | 3,095,612 | ||||||
| MB Financial, Inc. | 47,235 | 2,178,006 | ||||||
| National General Holdings Corp. | 110,605 | 2,968,638 | ||||||
| Sterling Bancorp. | 157,240 | 3,459,280 | ||||||
| TCF Financial Corp. | 19,340 | 460,485 | ||||||
| Univest Corp. of Pennsylvania | 68,289 | 1,806,244 | ||||||
| 32,214,933 | ||||||||
| Materials — 10.2% | ||||||||
| Allegheny Technologies, Inc.* | 68,239 | 2,016,462 | ||||||
| Ferroglobe Representation & Warranty | ||||||||
| Insurance Trust(A)* | 173,700 | — | ||||||
| HB Fuller Co. | 25,661 | 1,325,904 | ||||||
| Ingevity Corp.* | 11,969 | 1,219,402 | ||||||
| Olin Corp. | 69,874 | 1,794,364 | ||||||
| Owens-Illinois, Inc.* | 111,590 | 2,096,776 | ||||||
| Sensient Technologies Corp. | 13,414 | 1,026,305 | ||||||
| Silgan Holdings, Inc. | 39,648 | 1,102,214 | ||||||
| Sonoco Products Co. | 20,933 | 1,161,781 | ||||||
| Valvoline, Inc. | 104,181 | 2,240,933 | ||||||
| WR Grace & Co. | 26,752 | 1,911,698 | ||||||
| 15,895,839 | ||||||||
| Consumer Discretionary — 9.7% | ||||||||
| Callaway Golf Co. | 35,839 | 870,529 | ||||||
| Carter's, Inc. | 16,281 | 1,605,307 | ||||||
| Del Frisco's Restaurant Group, Inc.* | 96,174 | 798,244 | ||||||
| Express, Inc.* | 28,013 | 309,824 | ||||||
| Horizon Global Corp.*† | 102,674 | 732,066 | ||||||
| Michaels Cos., Inc. (The)* | 61,920 | 1,004,962 | ||||||
| Murphy USA, Inc.* | 26,262 | 2,244,351 | ||||||
| Nexstar Media Group, Inc. - Class A | 33,377 | 2,716,888 | ||||||
| Oxford Industries, Inc. | 9,073 | 818,385 | ||||||
| Steven Madden Ltd. | 11,567 | 611,894 | ||||||
| Tailored Brands, Inc. | 28,970 | 729,754 | ||||||
| Tribune Media Co. - Class A | 35,992 | 1,383,173 | ||||||
| Vista Outdoor, Inc.* | 69,420 | 1,241,924 | ||||||
| 15,067,301 | ||||||||
| Information Technology — 8.3% | ||||||||
| Belden, Inc. | 20,692 | 1,477,616 | ||||||
| CACI International, Inc. - Class A* | 9,223 | 1,698,415 | ||||||
| Conduent, Inc.* | 74,550 | 1,678,866 | ||||||
| MACOM Technology Solutions | ||||||||
| Holdings, Inc.*† | 191,127 | 3,937,216 | ||||||
| Semtech Corp.* | 25,930 | 1,441,708 | ||||||
| Viavi Solutions, Inc.* | 231,833 | 2,628,986 | ||||||
| 12,862,807 | ||||||||
| Consumer Staples — 8.1% | ||||||||
| B&G Foods, Inc.† | 38,806 | 1,065,225 | ||||||
| Darling Ingredients, Inc.* | 129,446 | 2,500,897 | ||||||
| Hain Celestial Group, Inc. (The)* | 50,582 | 1,371,784 | ||||||
| Hostess Brands, Inc.* | 99,355 | 1,099,860 | ||||||
| Performance Food Group Co.* | 48,984 | 1,631,167 | ||||||
| Sanderson Farms, Inc. | 9,334 | 964,856 | ||||||
| Spectrum Brands Holdings, Inc. | 19,825 | 1,481,324 | ||||||
| TreeHouse Foods, Inc.* | 50,112 | 2,397,859 | ||||||
| 12,512,972 | ||||||||
| Health Care — 4.7% | ||||||||
| Charles River Laboratories | ||||||||
| International, Inc.* | 13,007 | 1,749,962 | ||||||
| Encompass Health Corp. | 14,311 | 1,115,542 | ||||||
| Envision Healthcare Corp.* | 20,825 | 952,327 | ||||||
| Patterson Cos., Inc. | 47,341 | 1,157,487 | ||||||
| Prestige Consumer Healthcare, Inc.* | 62,222 | 2,357,592 | ||||||
| 7,332,910 | ||||||||
| Utilities — 3.9% | ||||||||
| Black Hills Corp. | 18,360 | 1,066,532 | ||||||
| Hawaiian Electric Industries, Inc. | 31,123 | 1,107,668 | ||||||
| IDACORP, Inc. | 15,195 | 1,507,800 | ||||||
| Portland General Electric Co. | 51,245 | 2,337,284 | ||||||
| 6,019,284 | ||||||||
| 98 |
Touchstone Small Cap Value Fund (Continued)
| Market | ||||||||
| Shares | Value | |||||||
| Common Stocks — 95.5% (Continued) | ||||||||
| Real Estate — 3.5% | ||||||||
| Americold Realty Trust REIT | 32,164 | $ | 804,743 | |||||
| Columbia Property Trust, Inc. REIT | 82,715 | 1,955,383 | ||||||
| Corporate Office Properties Trust REIT | 61,646 | 1,838,900 | ||||||
| Lexington Realty Trust REIT | 102,782 | 853,091 | ||||||
| 5,452,117 | ||||||||
| Energy — 3.3% | ||||||||
| Callon Petroleum Co.* | 107,676 | 1,291,035 | ||||||
| Carrizo Oil & Gas, Inc.* | 70,960 | 1,788,192 | ||||||
| Select Energy Services, Inc. - Class A* | 61,144 | 723,945 | ||||||
| SRC Energy, Inc.* | 147,248 | 1,309,035 | ||||||
| 5,112,207 | ||||||||
| Telecommunication Services — 0.8% | ||||||||
| Cogent Communications Holdings, Inc. | 21,815 | 1,217,277 | ||||||
| Total Common Stocks | $ | 148,300,180 | ||||||
| Exchange-Traded Fund — 1.2% | ||||||||
| iShares Russell 2000 Value ETF | 14,454 | $ | 1,922,382 | |||||
| Short-Term Investment Funds — 8.0% | ||||||||
| Dreyfus Government Cash | ||||||||
| Management, Institutional Shares, | ||||||||
| 1.95%∞Ω | 7,983,735 | 7,983,735 | ||||||
| Invesco Government & Agency | ||||||||
| Portfolio, Institutional Class, | ||||||||
| 1.97%**∞Ω | 4,353,965 | 4,353,965 | ||||||
| Total Short-Term Investment Funds | $ | 12,337,700 | ||||||
| Total Investment Securities — 104.7% | ||||||||
| (Cost $154,730,663) | $ | 162,560,262 | ||||||
| Liabilities in Excess of Other Assets — (4.7%) | (7,344,713 | ) | ||||||
| Net Assets — 100.0% | $ | 155,215,549 | ||||||
| (A) | Level 3 - For more information on valuation inputs, and their aggregation into the levels used in the table below, please refer to the security valuation section in the accompanying Notes to Financial Statements. |
| * | Non-income producing security. |
| ** | Represents collateral for securities loaned. |
| † | All or a portion of the security is on loan. The total market value of the securities on loan as of September 30, 2018 was $4,297,000. |
| ∞ | Open-End Fund. |
| Ω | Represents the 7-day SEC yield as of September 30, 2018. |
Portfolio Abbreviation:
ETF - Exchange-Traded Fund
REIT - Real Estate Investment Trust
Other Information:
The inputs or methodology used for valuing securities may not be an indication of the risk associated with investing in those securities. For more information on valuation inputs, and their aggregation into the levels used in the table below, please refer to the security valuation section in the accompanying Notes to Financial Statements.
Valuation inputs at Reporting Date:
| Description | Level 1 | Level 2 | Level 3 | Total | ||||||||||||
| Common | ||||||||||||||||
| Stocks | $ | 148,300,180 | $ | — | $ | — | $ | 148,300,180 | ||||||||
| Exchange-Traded | ||||||||||||||||
| Fund | 1,922,382 | — | — | 1,922,382 | ||||||||||||
| Short-Term | ||||||||||||||||
| Investment | ||||||||||||||||
| Funds | 12,337,700 | — | — | 12,337,700 | ||||||||||||
| Total | $ | 162,560,262 | $ | — | $ | — | $ | 162,560,262 | ||||||||
See accompanying Notes to Financial Statements.
| 99 |
Touchstone Ultra Short Duration Fixed Income Fund – September 30, 2018
| Principal | Market | |||||||
| Amount | Value | |||||||
| Asset-Backed Securities — 36.8% | ||||||||
| $ | 6,581,616 | ACE Securities Corp. Home Equity | ||||||
| Loan Trust, Ser 2005-HE6, Class A2D, | ||||||||
| (1M LIBOR +0.360%), | ||||||||
| 2.576%, 10/25/35(A) | $ | 6,584,837 | ||||||
| 2,500,000 | Ally Auto Receivables Trust, Ser | |||||||
| 2015-1, Class C, 2.260%, 10/15/20 | 2,496,239 | |||||||
| 1,570,000 | American Credit Acceptance | |||||||
| Receivables Trust, Ser 2015-2, Class | ||||||||
| D, 144a, 5.380%, 3/14/22 | 1,574,515 | |||||||
| 755,163 | American Credit Acceptance | |||||||
| Receivables Trust, Ser 2016-3, Class | ||||||||
| B, 144a, 2.870%, 8/12/22 | 755,551 | |||||||
| 717,572 | American Credit Acceptance | |||||||
| Receivables Trust, Ser 2016-4, Class | ||||||||
| B, 144a, 2.110%, 2/12/21 | 717,346 | |||||||
| 5,675,363 | American Credit Acceptance | |||||||
| Receivables Trust, Ser 2017-2, Class | ||||||||
| B, 144a, 2.460%, 4/12/21 | 5,671,904 | |||||||
| 3,830,000 | American Credit Acceptance | |||||||
| Receivables Trust, Ser 2017-3, Class | ||||||||
| B, 144a, 2.250%, 1/11/21 | 3,825,450 | |||||||
| 2,779,569 | American Credit Acceptance | |||||||
| Receivables Trust, Ser 2017-4, Class | ||||||||
| A, 144a, 2.000%, 7/10/20 | 2,775,432 | |||||||
| 5,970,000 | AmeriCredit Automobile Receivables | |||||||
| Trust, Ser 2014-2, Class D, | ||||||||
| 2.570%, 7/8/20 | 5,968,912 | |||||||
| 3,179,000 | AmeriCredit Automobile Receivables | |||||||
| Trust, Ser 2015-2, Class D, | ||||||||
| 3.000%, 6/8/21 | 3,178,802 | |||||||
| 2,294,000 | Ascentium Equipment Receivables | |||||||
| LLC, Ser 2015-2A, Class D, 144a, | ||||||||
| 3.440%, 10/12/21 | 2,295,246 | |||||||
| 1,106,797 | Ascentium Equipment Receivables | |||||||
| Trust, Ser 2017-1A, Class A2, 144a, | ||||||||
| 1.870%, 7/10/19 | 1,105,418 | |||||||
| 3,356,822 | Ascentium Equipment Receivables | |||||||
| Trust, Ser 2017-2A, Class A2, 144a, | ||||||||
| 2.000%, 5/11/20 | 3,339,535 | |||||||
| 5,000,000 | Avery Point VII CLO Ltd. (Cayman | |||||||
| Islands), Ser 2015-7A, Class A1, | ||||||||
| 144a, (3M LIBOR +1.500%), | ||||||||
| 3.839%, 1/15/28(A) | 5,004,430 | |||||||
| 3,541,667 | Avis Budget Rental Car Funding | |||||||
| AESOP LLC, Ser 2013-2A, Class B, | ||||||||
| 144a, 3.660%, 2/20/20 | 3,545,305 | |||||||
| 8,485,000 | Avis Budget Rental Car Funding | |||||||
| AESOP LLC, Ser 2014-1A, Class A, | ||||||||
| 144a, 2.460%, 7/20/20 | 8,462,690 | |||||||
| 8,960,000 | Avis Budget Rental Car Funding | |||||||
| AESOP LLC, Ser 2014-2A, Class B, | ||||||||
| 144a, 3.290%, 2/20/21 | 8,917,343 | |||||||
| 3,687,394 | Bear Stearns Asset Backed Securities | |||||||
| Trust, Ser 2005-SD2, Class 1M1, (1M | ||||||||
| LIBOR +0.650%), 2.866%, 3/25/35(A) | 3,666,270 | |||||||
| 979,410 | BlueVirgo Trust, Ser 2015-1A, 144a, | |||||||
| 3.000%, 12/15/22 | 979,410 | |||||||
| 10,000,000 | BSPRT Issuer Ltd. (Cayman Islands), Ser | |||||||
| 2018-FL4, Class A, 144a, (1M LIBOR | ||||||||
| +1.050%), 3.333%, 9/15/35(A) | 10,006,236 | |||||||
| 5,710,000 | Capital Auto Receivables Asset Trust, | |||||||
| Ser 2014-3, Class E, 3.940%, 4/20/23 | 5,713,480 | |||||||
| 5,250,000 | Capital Auto Receivables Asset Trust, | |||||||
| Ser 2015-2, Class E, 4.500%, 1/22/24 | 5,290,388 | |||||||
| 150,389 | CarFinance Capital Auto Trust, Ser | |||||||
| 2013-2A, Class D, 144a, | ||||||||
| 5.930%, 8/15/19 | 150,417 | |||||||
| 7,720,000 | CarFinance Capital Auto Trust, Ser | |||||||
| 2013-2A, Class E, 144a, | ||||||||
| 7.860%, 10/15/20 | 7,722,280 | |||||||
| 44,532 | CarFinance Capital Auto Trust, Ser | |||||||
| 2015-1A, Class A, 144a, | ||||||||
| 1.750%, 6/15/21 | 44,500 | |||||||
| 1,542,779 | Carnow Auto Receivables Trust, Ser | |||||||
| 2017-1A, Class A, 144a, | ||||||||
| 2.920%, 9/15/22 | 1,535,618 | |||||||
| 269,318 | Cazenovia Creek Funding I LLC, Ser | |||||||
| 2015-1A, Class A, 144a, | ||||||||
| 2.000%, 12/10/23 | 267,774 | |||||||
| 3,406,558 | CCG Receivables Trust, Ser 2017-1, | |||||||
| Class A2, 144a, 1.840%, 11/14/23 | 3,379,317 | |||||||
| 4,945,000 | Chrysler Capital Auto Receivables | |||||||
| Trust, Ser 2015-BA, Class C, 144a, | ||||||||
| 3.260%, 4/15/21 | 4,951,128 | |||||||
| 1,057,836 | Conn's Receivables Funding, Ser | |||||||
| 2017-B, Class A, 144a, | ||||||||
| 2.730%, 7/15/20 | 1,057,695 | |||||||
| 4,968,140 | Conn's Receivables Funding, Ser | |||||||
| 2018-A, Class A, 144a, | ||||||||
| 3.250%, 1/15/23 | 4,968,048 | |||||||
| 2,775,000 | Dell Equipment Finance Trust, Ser | |||||||
| 2016-1, Class B, 144a, | ||||||||
| 2.030%, 7/22/21 | 2,771,622 | |||||||
| 1,425,000 | Dell Equipment Finance Trust, Ser | |||||||
| 2016-1, Class C, 144a, | ||||||||
| 2.530%, 7/22/21 | 1,423,553 | |||||||
| 1,800,000 | Dell Equipment Finance Trust, Ser | |||||||
| 2016-1, Class D, 144a, | ||||||||
| 3.240%, 7/22/22 | 1,801,651 | |||||||
| 2,625,000 | Dell Equipment Finance Trust, Ser | |||||||
| 2017-1, Class A3, 144a, | ||||||||
| 2.140%, 4/22/22 | 2,616,023 | |||||||
| 1,950,573 | Drive Auto Receivables Trust, Ser | |||||||
| 2017-2, Class B, 2.250%, 6/15/21 | 1,949,331 | |||||||
| 616,003 | Drive Auto Receivables Trust, Ser | |||||||
| 2017-3, Class A3, 1.850%, 4/15/20 | 615,597 | |||||||
| 4,400,000 | Drive Auto Receivables Trust, Ser | |||||||
| 2017-3, Class B, 2.300%, 5/17/21 | 4,393,289 | |||||||
| 5,585,921 | DT Auto Owner Trust, Ser 2014-3A, | |||||||
| Class D, 144a, 4.470%, 11/15/21 | 5,598,143 | |||||||
| 100 |
Touchstone Ultra Short Duration Fixed Income Fund (Continued)
| Principal | Market | |||||||
| Amount | Value | |||||||
| Asset-Backed Securities — 36.8% (Continued) | ||||||||
| $ | 7,123,607 | DT Auto Owner Trust, Ser 2015-2A, | ||||||
| Class D, 144a, 4.250%, 2/15/22 | $ | 7,164,829 | ||||||
| 528,047 | Elara HGV Timeshare Issuer LLC, Ser | |||||||
| 2014-A, Class A, 144a, | ||||||||
| 2.530%, 2/25/27 | 516,526 | |||||||
| 4,422,044 | Exeter Automobile Receivables Trust, | |||||||
| Ser 2014-3A, Class C, 144a, | ||||||||
| 4.170%, 6/15/20 | 4,444,626 | |||||||
| 1,522,295 | Exeter Automobile Receivables Trust, | |||||||
| Ser 2016-1A, Class B, 144a, | ||||||||
| 3.850%, 5/17/21 | 1,527,701 | |||||||
| 615,608 | Exeter Automobile Receivables Trust, | |||||||
| Ser 2017-3A, Class A, 144a, | ||||||||
| 2.050%, 12/15/21 | 612,689 | |||||||
| 5,410,000 | First Investors Auto Owner Trust, Ser | |||||||
| 2014-2A, Class D, 144a, | ||||||||
| 3.470%, 2/15/21 | 5,418,201 | |||||||
| 128,431 | First Investors Auto Owner Trust, Ser | |||||||
| 2016-2A, Class A1, 144a, | ||||||||
| 1.530%, 11/16/20 | 128,338 | |||||||
| 1,630,000 | Flagship Credit Auto Trust, Ser 2016-3, | |||||||
| Class B, 144a, 2.430%, 6/15/21 | 1,622,407 | |||||||
| 3,850,151 | GLS Auto Receivables Trust, Ser | |||||||
| 2016-1A, Class B, 144a, | ||||||||
| 4.390%, 1/15/21 | 3,866,112 | |||||||
| 5,213,197 | GLS Auto Receivables Trust, Ser | |||||||
| 2017-1A, Class A2, 144a, | ||||||||
| 2.670%, 4/15/21 | 5,201,585 | |||||||
| 6,523,813 | GLS Auto Receivables Trust, Ser | |||||||
| 2018-1A, Class A, 144a, | ||||||||
| 2.820%, 7/15/22 | 6,497,712 | |||||||
| 8,035,854 | GLS Auto Receivables Trust, Ser | |||||||
| 2018-2A, Class A, 144a, | ||||||||
| 3.250%, 4/18/22 | 8,032,368 | |||||||
| 4,950,000 | Hertz Vehicle Financing II LP, Ser | |||||||
| 2015-1A, Class B, 144a, | ||||||||
| 3.520%, 3/25/21 | 4,919,351 | |||||||
| 2,900,000 | Hertz Vehicle Financing II LP, Ser | |||||||
| 2015-3A, Class B, 144a, | ||||||||
| 3.710%, 9/25/21 | 2,881,248 | |||||||
| 7,450,000 | Hertz Vehicle Financing II LP, Ser | |||||||
| 2016-1A, Class A, 144a, | ||||||||
| 2.320%, 3/25/20 | 7,429,247 | |||||||
| 1,450,000 | Hertz Vehicle Financing II LP, Ser | |||||||
| 2016-3A, Class C, 144a, | ||||||||
| 4.430%, 7/25/20 | 1,454,057 | |||||||
| 4,593,600 | Jimmy Johns Funding LLC, Ser | |||||||
| 2017-1A, Class A2I, 144a, | ||||||||
| 3.610%, 7/30/47 | 4,534,618 | |||||||
| 11,661,000 | Kabbage Asset Securitization LLC, Ser | |||||||
| 2017-1, Class A, 144a, | ||||||||
| 4.571%, 3/15/22 | 11,743,762 | |||||||
| 71,435 | MMAF Equipment Finance LLC, Ser | |||||||
| 2012-AA, Class A5, 144a, | ||||||||
| 1.980%, 6/10/32 | 71,414 | |||||||
| 935,375 | Morgan Stanley ABS Capital I, Inc. | |||||||
| Trust, Ser 2006-NC1, Class A4, (1M | ||||||||
| LIBOR +0.300%), | ||||||||
| 2.516%, 12/25/35(A) | 936,719 | |||||||
| 2,626,861 | Navitas Equipment Receivables LLC, | |||||||
| Ser 2016-1, Class A2, 144a, | ||||||||
| 2.200%, 6/15/21 | 2,619,430 | |||||||
| 3,321,321 | New Century Home Equity Loan Trust, | |||||||
| Ser 2005-B, Class A2D, (1M LIBOR | ||||||||
| +0.400%), 2.616%, 10/25/35(A) | 3,328,805 | |||||||
| 10,070,000 | OCP CLO Ltd. (Cayman Islands), Ser | |||||||
| 2016-12A, Class A1, 144a, (3M | ||||||||
| LIBOR +1.570%), | ||||||||
| 3.903%, 10/18/28(A) | 10,069,990 | |||||||
| 575,222 | Orange Lake Timeshare Trust, Ser | |||||||
| 2014-AA, Class A, 144a, | ||||||||
| 2.290%, 7/9/29 | 564,199 | |||||||
| 4,725,000 | Palmer Square Loan Funding Ltd., Ser | |||||||
| 2018-4A, Class A1, 144a, (3M LIBOR | ||||||||
| +0.900%), 3.150%, 11/15/26(A) | 4,725,000 | |||||||
| 3,000,000 | Prestige Auto Receivables Trust, Ser | |||||||
| 2018-1A, Class A1, 144a, | ||||||||
| 2.528%, 10/15/19 | 3,000,000 | |||||||
| 2,571,000 | RAAC Trust, Ser 2006-SP4, Class M1, | |||||||
| (1M LIBOR +0.340%), | ||||||||
| 2.556%, 11/25/36(A) | 2,559,660 | |||||||
| 15,322,000 | Rockwall CDO II Ltd., Ser 2007-1A, | |||||||
| Class A3L, 144a, (3M LIBOR | ||||||||
| +1.000%), 3.343%, 8/1/24(A) | 15,270,733 | |||||||
| 6,500,000 | Santander Drive Auto Receivables | |||||||
| Trust, Ser 2014-3, Class E, 144a, | ||||||||
| 3.490%, 9/15/21 | 6,510,150 | |||||||
| 700,000 | Santander Drive Auto Receivables | |||||||
| Trust, Ser 2015-2, Class D, | ||||||||
| 3.020%, 4/15/21 | 700,142 | |||||||
| 451,386 | Santander Drive Auto Receivables | |||||||
| Trust, Ser 2015-3, Class C, | ||||||||
| 2.740%, 1/15/21 | 451,494 | |||||||
| 9,072,007 | Santander Drive Auto Receivables | |||||||
| Trust, Ser 2015-4, Class C, | ||||||||
| 2.970%, 3/15/21 | 9,080,317 | |||||||
| 958,000 | SBA Tower Trust, 144a, | |||||||
| 2.898%, 10/15/19(B) | 956,076 | |||||||
| 6,010,000 | Securitized Equipment Receivables | |||||||
| Trust, Ser 2017-1A, Class A, | ||||||||
| 2.980%, 4/11/24 | 5,947,633 | |||||||
| 12,840,000 | Securitized Equipment Receivables | |||||||
| Trust, Ser 2017-1A, Class A, 144a, | ||||||||
| 2.760%, 12/13/22 | 12,717,219 | |||||||
| 1,685,681 | Sierra Timeshare Receivables Funding | |||||||
| LLC, Ser 2014-2A, Class A, 144a, | ||||||||
| 2.050%, 6/20/31(A)(C) | 1,681,785 | |||||||
| 101 |
Touchstone Ultra Short Duration Fixed Income Fund (Continued)
| Principal | Market | |||||||
| Amount | Value | |||||||
| Asset-Backed Securities — 36.8% (Continued) | ||||||||
| $ | 879,504 | Sierra Timeshare Receivables Funding | ||||||
| LLC, Ser 2014-3A, Class A, 144a, | ||||||||
| 2.300%, 10/20/31 | $ | 871,730 | ||||||
| 806,376 | Sierra Timeshare Receivables Funding | |||||||
| LLC, Ser 2015-1A, Class A, 144a, | ||||||||
| 2.400%, 3/22/32 | 800,733 | |||||||
| 13,450,000 | TCI-Flatiron CLO Ltd. (Cayman Islands), | |||||||
| Ser 2016-1A, Class A, 144a, (3M | ||||||||
| LIBOR +1.550%), 3.886%, 7/17/28(A) | 13,483,544 | |||||||
| 3,985,460 | TLF National Tax Lien Trust, Ser | |||||||
| 2017-1A, Class A, 144a, | ||||||||
| 3.090%, 12/15/29 | 3,974,955 | |||||||
| 8,181,515 | Towd Point Mortgage Trust, Ser | |||||||
| 2017-5, Class A1, 144a, (1M LIBOR | ||||||||
| +0.600%), 2.816%, 2/25/57(A) | 8,188,848 | |||||||
| 3,410,000 | United Auto Credit Securitization | |||||||
| Trust, Ser 2017-1, Class C, 144a, | ||||||||
| 2.710%, 1/10/22 | 3,406,582 | |||||||
| 2,770,000 | Volvo Financial Equipment LLC, Ser | |||||||
| 2015-1A, Class C, 144a, | ||||||||
| 2.420%, 11/15/22 | 2,767,706 | |||||||
| 1,682,507 | Welk Resorts LLC, Ser 2013-AA, Class | |||||||
| A, 144a, 3.100%, 3/15/29 | 1,667,489 | |||||||
| 3,518,484 | Westgate Resorts LLC, Ser 2016-1A, | |||||||
| Class A, 144a, 3.500%, 12/20/28 | 3,501,469 | |||||||
| 5,715,000 | Westlake Automobile Receivables | |||||||
| Trust, Ser 2015-2A, Class E, 144a, | ||||||||
| 5.050%, 3/15/22 | 5,720,118 | |||||||
| Total Asset-Backed Securities | $ | 340,690,042 | ||||||
| Corporate Bonds — 30.5% | ||||||||
| Financials — 13.0% | ||||||||
| 10,000,000 | Ares Capital Corp., 4.875%, 11/30/18 | 10,031,000 | ||||||
| 3,000,000 | Bank of America Corp., | |||||||
| 6.875%, 11/15/18 | 3,015,932 | |||||||
| 700,000 | Bank One Corp., 8.530%, 3/1/19(B) | 715,840 | ||||||
| 7,000,000 | BB&T Corp. MTN, 2.150%, 2/1/21 | 6,832,117 | ||||||
| 6,050,000 | Citibank NA, (3M LIBOR +0.340%), | |||||||
| 2.678%, 3/20/19(A) | 6,057,423 | |||||||
| 5,000,000 | Credit Agricole SA (France), 144a, | |||||||
| 2.750%, 6/10/20 | 4,943,715 | |||||||
| 300,000 | Credit Suisse Group Funding | |||||||
| Guernsey Ltd. (Guernsey), 144a, | ||||||||
| 3.125%, 12/10/20 | 297,576 | |||||||
| 15,615,000 | Discover Bank, 2.600%, 11/13/18 | 15,613,888 | ||||||
| 8,199,000 | Huntington Bancshares, Inc., | |||||||
| 7.000%, 12/15/20 | 8,783,387 | |||||||
| 15,000,000 | JPMorgan Chase & Co., | |||||||
| 1.850%, 3/22/19 | 14,945,114 | |||||||
| 4,730,000 | KeyCorp. MTN, 2.300%, 12/13/18 | 4,728,391 | ||||||
| 7,350,000 | Mountain Agency, Inc. (The), | |||||||
| 2.570%, 12/1/23(A)(C) | 7,350,000 | |||||||
| 2,340,000 | National City Corp., 6.875%, 5/15/19 | 2,400,270 | ||||||
| 250,000 | PNC Bank NA, 2.200%, 1/28/19 | 249,723 | ||||||
| 2,500,000 | Principal Life Global Funding II, 144a, | |||||||
| 1.500%, 4/18/19 | 2,484,235 | |||||||
| 8,900,000 | Regions Bank/Birmingham AL, | |||||||
| 3.374%, 8/13/21 | 8,873,338 | |||||||
| 10,000,000 | Royal Bank of Canada MTN, (3M LIBOR | |||||||
| +0.300%), 2.635%, 7/22/20(A) | 10,026,680 | |||||||
| 5,500,000 | Wells Fargo Bank NA, (SOFR +0.480%), | |||||||
| 2.680%, 3/25/20(A) | 5,500,776 | |||||||
| 2,600,000 | XLIT Ltd. (Cayman Islands), | |||||||
| 2.300%, 12/15/18 | 2,598,259 | |||||||
| 4,550,000 | Zions Bancorp NA, 3.500%, 8/27/21 | 4,523,709 | ||||||
| 119,971,373 | ||||||||
| Industrials — 3.9% | ||||||||
| 9,700,000 | Eaton Electric Holdings LLC, | |||||||
| 3.875%, 12/15/20 | 9,794,304 | |||||||
| 1,500,000 | GATX Corp., 2.500%, 3/15/19 | 1,497,921 | ||||||
| 6,875,000 | Martin Marietta Materials, Inc., (3M | |||||||
| LIBOR +0.650%), 2.960%, 5/22/20(A) | 6,897,963 | |||||||
| 2,000,000 | Molex Electronic Technologies LLC, | |||||||
| 144a, 2.878%, 4/15/20 | 1,978,109 | |||||||
| 4,405,000 | Tyco Electronics Group SA, | |||||||
| 2.375%, 12/17/18 | 4,402,535 | |||||||
| 7,500,000 | Vulcan Materials Co., (3M LIBOR | |||||||
| +0.650%), 2.971%, 3/1/21(A) | 7,527,641 | |||||||
| 4,200,000 | Wabtec Corp., (3M LIBOR +1.050%), | |||||||
| 3.382%, 9/15/21(A) | 4,208,564 | |||||||
| 36,307,037 | ||||||||
| Utilities — 3.2% | ||||||||
| 3,000,000 | Dominion Energy, Inc., 2.579%, 7/1/20 | 2,959,664 | ||||||
| 360,000 | Dominion Energy, Inc., 144a, | |||||||
| 1.875%, 12/15/18 | 359,402 | |||||||
| 3,125,000 | Duke Energy Florida LLC, | |||||||
| 2.100%, 12/15/19 | 3,106,174 | |||||||
| 7,692,000 | Electricite de France SA (France), 144a, | |||||||
| 2.150%, 1/22/19 | 7,679,225 | |||||||
| 5,000,000 | Georgia Power Co., 2.000%, 3/30/20 | 4,907,104 | ||||||
| 700,000 | ITC Holdings Corp., 144a, | |||||||
| 5.500%, 1/15/20 | 715,742 | |||||||
| 1,200,000 | Pacific Gas & Electric Co., (3M LIBOR | |||||||
| +0.230%), 2.541%, 11/28/18(A) | 1,199,047 | |||||||
| 2,700,000 | Public Service Co. of New Hampshire, | |||||||
| 4.050%, 6/1/21 | 2,729,913 | |||||||
| 5,300,000 | Sempra Energy, (3M LIBOR +0.250%), | |||||||
| 2.589%, 7/15/19(A) | 5,302,407 | |||||||
| 451,000 | Southern Electric Generating Co., | |||||||
| 144a, 2.200%, 12/1/18 | 450,540 | |||||||
| 29,409,218 | ||||||||
| Consumer Staples — 2.3% | ||||||||
| 1,239,000 | Constellation Brands, Inc., | |||||||
| 3.875%, 11/15/19 | 1,249,217 | |||||||
| 6,800,000 | Kraft Heinz Foods Co., (3M LIBOR | |||||||
| +0.570%), 2.911%, 2/10/21(A) | 6,806,899 | |||||||
| 4,793,000 | Mondelez International, Inc., | |||||||
| 5.375%, 2/10/20 | 4,923,360 | |||||||
| 102 |
Touchstone Ultra Short Duration Fixed Income Fund (Continued)
| Principal | Market | |||||||
| Amount | Value | |||||||
| Corporate Bonds — 30.5% (Continued) | ||||||||
| Consumer Staples — (Continued) | ||||||||
| $ | 1,540,000 | Reckitt Benckiser Treasury Services | ||||||
| PLC (United Kingdom), 144a, (3M | ||||||||
| LIBOR +0.560%), 2.926%, 6/24/22(A) | $ | 1,539,174 | ||||||
| 3,200,000 | Tyson Foods, Inc., (3M LIBOR | |||||||
| +0.550%), 2.871%, 6/2/20(A) | 3,209,516 | |||||||
| 3,200,000 | Woolworths Group Ltd. (Australia), | |||||||
| 144a, 4.000%, 9/22/20 | 3,214,182 | |||||||
| 20,942,348 | ||||||||
| Information Technology — 1.7% | ||||||||
| 6,200,000 | Dell International LLC / EMC Corp., | |||||||
| 144a, 3.480%, 6/1/19 | 6,215,666 | |||||||
| 600,000 | Fidelity National Information Services, | |||||||
| Inc., 3.625%, 10/15/20 | 603,340 | |||||||
| 9,300,000 | Hewlett Packard Enterprise Co., 144a, | |||||||
| 2.100%, 10/4/19 | 9,209,373 | |||||||
| 16,028,379 | ||||||||
| Health Care — 1.6% | ||||||||
| 2,100,000 | Amgen, Inc., 1.900%, 5/10/19 | 2,089,020 | ||||||
| 2,100,000 | Amgen, Inc., 2.200%, 5/11/20 | 2,070,029 | ||||||
| 1,800,000 | Bayer US Finance II LLC, 144a, | |||||||
| 1.850%, 11/15/18 | 1,798,102 | |||||||
| 7,700,000 | Dignity Health, 2.637%, 11/1/19 | 7,652,025 | ||||||
| 1,000,000 | Edwards Lifesciences Corp., | |||||||
| 2.875%, 10/15/18 | 1,000,094 | |||||||
| 14,609,270 | ||||||||
| Consumer Discretionary — 1.5% | ||||||||
| 1,600,000 | Ford Motor Credit Co. LLC, | |||||||
| 5.875%, 8/2/21 | 1,673,333 | |||||||
| 6,300,000 | General Motors Co., (3M LIBOR | |||||||
| +0.800%), 3.143%, 8/7/20(A) | 6,321,154 | |||||||
| 650,000 | Hyundai Capital America, 144a, | |||||||
| 2.500%, 3/18/19 | 648,551 | |||||||
| 900,000 | Hyundai Capital America, 144a, | |||||||
| 3.000%, 10/30/20 | 886,007 | |||||||
| 200,000 | Hyundai Capital Services, Inc., 144a, | |||||||
| 1.625%, 8/30/19 | 197,046 | |||||||
| 3,808,000 | Lear Corp., 5.375%, 3/15/24 | 3,915,066 | ||||||
| 13,641,157 | ||||||||
| Telecommunication Services — 1.4% | ||||||||
| 2,040,000 | Crown Castle Towers LLC, 144a, | |||||||
| 3.222%, 5/15/22 | 1,995,610 | |||||||
| 4,595,000 | Discovery Communications LLC, | |||||||
| 2.200%, 9/20/19 | 4,559,027 | |||||||
| 3,000,000 | Interpublic Group of Cos., Inc. (The), | |||||||
| 3.500%, 10/1/20 | 3,000,267 | |||||||
| 2,420,000 | Orange SA (France), 5.375%, 7/8/19 | 2,466,020 | ||||||
| 1,405,000 | Sky PLC (United Kingdom), 144a, | |||||||
| 2.625%, 9/16/19 | 1,398,190 | |||||||
| 13,419,114 | ||||||||
| Real Estate — 0.8% | ||||||||
| 2,250,000 | Equity Commonwealth, REIT, | |||||||
| 5.875%, 9/15/20 | 2,313,635 | |||||||
| 5,300,000 | SL Green Operating Partnership LP, | |||||||
| (3M LIBOR +0.980%), | ||||||||
| 3.345%, 8/16/21(A) | 5,306,400 | |||||||
| 7,620,035 | ||||||||
| Energy — 0.8% | ||||||||
| 686,000 | Florida Gas Transmission Co. LLC, | |||||||
| 144a, 7.900%, 5/15/19 | 706,421 | |||||||
| 1,000,000 | ONEOK Partners LP, 8.625%, 3/1/19 | 1,022,595 | ||||||
| 3,650,000 | Phillips 66, 144a, (3M LIBOR +0.650%), | |||||||
| 2.989%, 4/15/19(A) | 3,651,424 | |||||||
| 1,500,000 | Ras Laffan Liquefied Natural Gas Co. | |||||||
| (Qatar), 6.750%, 9/30/19 | 1,548,750 | |||||||
| 246,240 | Ras Laffan Liquefied Natural Gas Co. | |||||||
| Ltd. II (Qatar), 144a, 5.298%, 9/30/20 | 251,534 | |||||||
| 7,180,724 | ||||||||
| Materials — 0.3% | ||||||||
| 2,700,000 | EI du Pont de Nemours & Co., | |||||||
| 2.200%, 5/1/20 | 2,664,555 | |||||||
| Total Corporate Bonds | $ | 281,793,210 | ||||||
| Commercial Mortgage-Backed Securities — 12.2% | ||||||||
| 4,466,577 | A10 Term Asset Financing LLC, Ser | |||||||
| 2017-1A, Class A1FL, 144a, (1M | ||||||||
| LIBOR +0.850%), 3.008%, 3/15/36(A) | 4,466,571 | |||||||
| 8,673,681 | AREIT Trust, Ser 2018-CRE1, Class A, | |||||||
| 144a, (1M LIBOR +0.850%), | ||||||||
| 2.984%, 2/14/35(A) | 8,678,103 | |||||||
| 1,661,896 | BSPRT Issuer Ltd. (Cayman Islands), Ser | |||||||
| 2017-FL1, Class A, 144a, (1M LIBOR | ||||||||
| +1.350%), 3.508%, 6/15/27(A) | 1,665,008 | |||||||
| 2,414,028 | BSPRT Issuer Ltd. (Cayman Islands), Ser | |||||||
| 2017-FL2, Class A, 144a, (1M LIBOR | ||||||||
| +0.820%), 2.978%, 10/15/34(A) | 2,412,513 | |||||||
| 3,219,000 | BSPRT Issuer Ltd. (Cayman Islands), Ser | |||||||
| 2017-FL2, Class AS, 144a, (1M LIBOR | ||||||||
| +1.100%), 3.258%, 10/15/34(A) | 3,217,952 | |||||||
| 4,170,000 | BX Trust, Ser 2017-IMC, Class A, 144a, | |||||||
| (1M LIBOR +1.050%), | ||||||||
| 3.208%, 10/15/32(A) | 4,173,977 | |||||||
| 3,423,319 | CD Mortgage Trust, Ser 2006-CD3, | |||||||
| Class AM, 5.648%, 10/15/48 | 3,523,058 | |||||||
| 2,530,000 | Citigroup Commercial Mortgage Trust, | |||||||
| Ser 2015-SHP2, Class A, 144a, (1M | ||||||||
| LIBOR +1.280%), 3.438%, 7/15/27(A) | 2,529,945 | |||||||
| 311,633 | COMM Mortgage Trust, Ser | |||||||
| 2013-CR10, Class A2, | ||||||||
| 2.972%, 8/10/46 | 306,944 | |||||||
| 103 |
Touchstone Ultra Short Duration Fixed Income Fund (Continued)
| Principal | Market | |||||||
| Amount | Value | |||||||
| Commercial Mortgage-Backed Securities — 12.2% | ||||||||
| (Continued) | ||||||||
| $ | 44,316,719 | COMM Mortgage Trust, Ser | ||||||
| 2014-UBS3, Class XA, | ||||||||
| 1.440%, 6/10/47(A)(C)(D) | $ | 1,958,684 | ||||||
| 3,943,034 | COMM Mortgage Trust, Ser | |||||||
| 2016-SAVA, Class A, 144a, (1M | ||||||||
| LIBOR +1.720%), | ||||||||
| 3.878%, 10/15/34(A) | 3,943,035 | |||||||
| 648,973 | DBUBS Mortgage Trust, Ser | |||||||
| 2011-LC2A, Class A1FL, 144a, (1M | ||||||||
| LIBOR +1.350%), 3.489%, 7/12/44(A) | 655,971 | |||||||
| 2,859,525 | GS Mortgage Securities Corp. II, Ser | |||||||
| 2015-GC30, Class A1, | ||||||||
| 1.439%, 5/10/50 | 2,828,068 | |||||||
| 118,906,000 | GS Mortgage Securities Corp. II, Ser | |||||||
| 2017-SLP, Class XA, 144a, | ||||||||
| 1.325%, 10/10/32(A)(C)(D) | 5,077,108 | |||||||
| 143,822,000 | GS Mortgage Securities Corp. Trust, | |||||||
| Ser 2017-GPTX, Class XCP, 144a, | ||||||||
| 0.911%, 5/10/34(A)(C)(D) | 1,840,691 | |||||||
| 8,320,000 | Hospitality Mortgage Trust, Ser | |||||||
| 2017-HIT, Class B, 144a, (1M LIBOR | ||||||||
| +1.180%), 3.313%, 5/8/30(A) | 8,325,170 | |||||||
| 7,737,335 | J.P. Morgan Chase Commercial | |||||||
| Mortgage Securities Trust, Ser | ||||||||
| 2017-FL11, Class A, 144a, (1M LIBOR | ||||||||
| +0.850%), 3.008%, 10/15/32(A) | 7,740,100 | |||||||
| 7,525,000 | JP Morgan Chase Commercial | |||||||
| Mortgage Securities Corp., Ser | ||||||||
| 2017-FL10, Class A, 144a, (1M LIBOR | ||||||||
| +0.800%), 2.958%, 6/15/32(A) | 7,529,596 | |||||||
| 1,883,000 | Merrill Lynch Mortgage Investors | |||||||
| Trust, Ser 1998-C1, Class E, | ||||||||
| 6.750%, 11/15/26(A)(C) | 1,938,436 | |||||||
| 1,613,442 | Morgan Stanley Bank of America | |||||||
| Merrill Lynch Trust, Ser 2015-C20, | ||||||||
| Class A1, 1.405%, 2/15/48 | 1,605,060 | |||||||
| 7,725,000 | Morgan Stanley Capital I Trust, Ser | |||||||
| 2018-BOP, Class A, 144a, (1M LIBOR | ||||||||
| +0.850%), 3.008%, 8/15/33(A) | 7,729,827 | |||||||
| 2,777,257 | RAIT Trust, Ser 2017-FL7, Class A, 144a, | |||||||
| (1M LIBOR +0.950%), | ||||||||
| 3.108%, 6/15/37(A) | 2,778,097 | |||||||
| 8,125,000 | STWD Mortgage Trust, Ser 2018-URB, | |||||||
| Class B, 144a, (1M LIBOR +1.350%), | ||||||||
| 3.413%, 5/15/35(A) | 8,125,055 | |||||||
| 7,592,019 | Tharaldson Hotel Portfolio Trust, Ser | |||||||
| 2018-THL, Class B, 144a, (1M LIBOR | ||||||||
| +1.100%), 3.221%, 11/11/34(A) | 7,591,907 | |||||||
| 6,280,000 | TPG Real Estate Finance Issuer Ltd. | |||||||
| (Cayman Islands), Ser 2018-FL1, | ||||||||
| Class AS, 144a, (1M LIBOR +0.950%), | ||||||||
| 3.108%, 2/15/35(A) | 6,281,919 | |||||||
| 12,969,279 | UBS-Citigroup Commercial Mortgage | |||||||
| Trust, Ser 2011-C1, Class XA, 144a, | ||||||||
| 2.390%, 1/10/45(A)(C)(D) | 678,162 | |||||||
| 2,440,000 | Waldorf Astoria Boca Raton Trust, Ser | |||||||
| 2016-BOCA, Class A, 144a, (1M | ||||||||
| LIBOR +1.350%), 3.508%, 6/15/29(A) | 2,441,525 | |||||||
| 2,577,073 | WFRBS Commercial Mortgage Trust, | |||||||
| Ser 2014-C24, Class A2, | ||||||||
| 2.863%, 11/15/47 | 2,574,105 | |||||||
| Total Commercial | ||||||||
| Mortgage-Backed Securities | $ | 112,616,587 | ||||||
| Municipal Bonds — 3.5% | ||||||||
| California — 0.4% | ||||||||
| 2,010,000 | CA St Enterprise Dev Authority, Txbl | |||||||
| Variable J Harris Indl Wt, (LOC: City | ||||||||
| National Bank), 144a, 2.460%, | ||||||||
| 9/1/41(A)(C) | 2,010,000 | |||||||
| 1,885,000 | CA St Infrastructure & Economic Dev | |||||||
| Bank, Variable Canyon Plastics Inc | ||||||||
| Project, (LOC: Bank of The West), | ||||||||
| 1.710%, 12/1/39(A)(C) | 1,885,000 | |||||||
| 3,895,000 | ||||||||
| Florida — 0.5% | ||||||||
| 5,000,000 | State Brd of Admin Fin Corp., Txbl Ser | |||||||
| A, 2.163%, 7/1/19 | 4,983,000 | |||||||
| Hawaii — 0.1% | ||||||||
| 1,000,000 | State of Hawaii, Txbl Ser FU, UTGO, | |||||||
| 2.200%, 1/1/19 | 999,030 | |||||||
| Illinois — 0.5% | ||||||||
| 4,200,000 | Regional Transportation Authority, | |||||||
| Txbl Ser A, 3.013%, 5/29/20 | 4,189,920 | |||||||
| New Mexico — 0.0% | ||||||||
| 30,000 | New Mexico Educational Assistance | |||||||
| Foundation, Ser A-2, 2.971%, | ||||||||
| 12/1/28(A)(C) | 29,995 | |||||||
| New York — 0.3% | ||||||||
| 3,000,000 | Brookhaven NY IDA, Variable | |||||||
| Intercounty Asso, (LOC: Capital One | ||||||||
| NA), 2.390%, 1/1/25(A)(C) | 3,000,000 | |||||||
| Other Territory — 1.7% | ||||||||
| 2,000,000 | Rib Floater Trust, Txbl Muni Floaters | |||||||
| Trust Ser 201, (LOC: Barclays Bank | ||||||||
| PLC), 144a, 2.590%, 7/1/22(A)(C) | 2,000,000 | |||||||
| 13,400,000 | Taxable Municipal Funding Trust, Txbl | |||||||
| Mun Fltg Rt Nts Ser 2018, (LOC: | ||||||||
| Barclays Bank PLC), 144a, 2.590%, | ||||||||
| 7/31/28(A)(C) | 13,400,000 | |||||||
| 15,400,000 | ||||||||
| 104 |
Touchstone Ultra Short Duration Fixed Income Fund (Continued)
| Principal | Market | |||||||
| Amount | Value | |||||||
| Municipal Bonds — 3.5% (Continued) | ||||||||
| South Carolina — 0.0% | ||||||||
| $ | 280,000 | Spartanburg SC Wtrwks Rev, Txbl Sys | ||||||
| Ser B, 1.785%, 12/1/18 | $ | 279,661 | ||||||
| Total Municipal Bonds | $ | 32,776,606 | ||||||
| Agency Collateralized Mortgage | ||||||||
| Obligations — 3.0% | ||||||||
| 115,806,481 | FHLMC Multifamily Structured Pass | |||||||
| Through Certificates, Ser K504 Class | ||||||||
| X1, 0.269%, 9/25/20(A)(C)(D) | 206,634 | |||||||
| 127,972,880 | FHLMC Multifamily Structured Pass | |||||||
| Through Certificates, Ser KAIV Class | ||||||||
| X1, 1.278%, 6/25/21(A)(C)(D) | 3,295,046 | |||||||
| 18,565 | FHLMC REMIC, Ser 2510 Class TA, | |||||||
| 4.000%, 6/15/32 | 18,489 | |||||||
| 316,756 | FHLMC REMIC, Ser 2770 Class FH, (1M | |||||||
| LIBOR +0.400%), 2.558%, 3/15/34(A) | 316,567 | |||||||
| 9,587 | FHLMC REMIC, Ser 3414 Class MB, | |||||||
| 4.250%, 12/15/19 | 9,594 | |||||||
| 1,078,635 | FHLMC REMIC, Ser 3874 Class BD, | |||||||
| 3.000%, 6/15/21 | 1,075,158 | |||||||
| 3,064,077 | FHLMC REMIC, Ser 4238 Class TL, | |||||||
| 1.250%, 8/15/27 | 2,792,021 | |||||||
| 175,653 | FNMA REMIC, Ser 2003-119, Class PU, | |||||||
| 4.000%, 11/25/33 | 176,835 | |||||||
| 64,264 | FNMA REMIC, Ser 2003-33, Class AM, | |||||||
| 4.250%, 5/25/33 | 64,956 | |||||||
| 55,246 | FNMA REMIC, Ser 2003-42, Class CA, | |||||||
| 4.000%, 5/25/33 | 56,179 | |||||||
| 259,544 | FNMA REMIC, Ser 2003-81, Class FE, | |||||||
| (1M LIBOR +0.500%), | ||||||||
| 2.716%, 9/25/33(A) | 260,520 | |||||||
| 520,937 | FNMA REMIC, Ser 2009-32, Class BH, | |||||||
| 5.250%, 5/25/39 | 532,958 | |||||||
| 16,163 | FNMA REMIC, Ser 2010-13, Class WD, | |||||||
| 4.250%, 3/25/25 | 16,232 | |||||||
| 4,412,374 | FNMA REMIC, Ser 2010-64, Class AD, | |||||||
| 3.000%, 12/25/20 | 4,404,950 | |||||||
| 1,775,056 | FNMA REMIC, Ser 2011-15, Class HC, | |||||||
| 2.500%, 3/25/26 | 1,762,361 | |||||||
| 1,018,462 | FNMA REMIC, Ser 2011-67, Class DA, | |||||||
| 4.500%, 7/25/21 | 1,021,935 | |||||||
| 228,413 | FNMA REMIC, Ser 2012 102 Class NA, | |||||||
| 1.500%, 9/25/27 | 216,028 | |||||||
| 2,217,942 | FNMA REMIC, Ser 2012-47, Class AI, | |||||||
| 3.000%, 5/25/22(D) | 90,307 | |||||||
| 142,031 | FNMA REMIC Trust, Ser 2001-W4, Class | |||||||
| AF5, 6.114%, 2/25/32(B) | 155,450 | |||||||
| 107,177 | GNMA, Ser 2002-72, Class AB, | |||||||
| 4.500%, 10/20/32 | 109,356 | |||||||
| 75,402 | GNMA, Ser 2011-57, Class BA, | |||||||
| 3.000%, 5/20/40 | 75,070 | |||||||
| 170,539 | GNMA, Ser 2012-27, Class A, | |||||||
| 1.614%, 7/16/39 | 164,969 | |||||||
| 6,006,390 | GNMA, Ser 2016-40, Class F, (1M LIBOR | |||||||
| +0.400%), 2.558%, 7/16/57(A) | 5,943,655 | |||||||
| 4,900,339 | GNMA, Ser 2016-95, Class F, (1M LIBOR | |||||||
| +0.450%), 2.608%, 1/16/58(A) | 4,856,172 | |||||||
| Total Agency Collateralized | ||||||||
| Mortgage Obligations | $ | 27,621,442 | ||||||
| Non-Agency Collateralized Mortgage | ||||||||
| Obligations — 2.7% | ||||||||
| 2,111,276 | Bear Stearns ARM Trust, Ser 2003-1, | |||||||
| Class 5A1, 3.983%, 4/25/33(A)(C)†† | 2,143,393 | |||||||
| 248,390 | Bear Stearns ARM Trust, Ser 2004-1, | |||||||
| Class 13A3, 3.890%, 4/25/34(A)(C)†† | 249,528 | |||||||
| 190,936 | Bear Stearns Asset Backed Securities | |||||||
| Trust, Ser 2003-AC7, Class A2, | ||||||||
| 5.750%, 1/25/34(B)†† | 192,106 | |||||||
| 53,119 | Community Program Loan Trust, Ser | |||||||
| 1987-A, Class A5, 4.500%, 4/1/29 | 52,971 | |||||||
| 88,914 | CSMC Trust, Ser 2012-CIM1, Class A1, | |||||||
| 144a, 3.380%, 2/25/42(A)(C) | 88,828 | |||||||
| 1,735,769 | CSMC Trust, Ser 2014-WIN1, Class 2A5, | |||||||
| 144a, 3.000%, 9/25/44(A)(C) | 1,745,138 | |||||||
| 4,485,028 | CSMC Trust, Ser 2014-WIN2, Class A5, | |||||||
| 144a, 3.000%, 10/25/44(A)(C) | 4,471,705 | |||||||
| 45,517 | FDIC Sale Guaranteed Notes Trust, Ser | |||||||
| 2010-S3, Class A, 144a, | ||||||||
| 2.740%, 12/3/20 | 44,792 | |||||||
| 3,486,054 | GSR Mortgage Loan Trust, Ser | |||||||
| 2003-13, Class 1A1, | ||||||||
| 4.255%, 10/25/33(A)(C) | 3,585,996 | |||||||
| 144,978 | JP Morgan Mortgage Trust, Ser | |||||||
| 2006-A4, Class 2A2, | ||||||||
| 3.901%, 6/25/36(A)(C) | 136,789 | |||||||
| 20,507 | Merrill Lynch Mortgage Investors | |||||||
| Trust, Ser 2003-A1, Class 2A, (12M | ||||||||
| LIBOR +1.625%), | ||||||||
| 4.467%, 12/25/32(A) | 20,573 | |||||||
| 148,084 | Merrill Lynch Mortgage Investors | |||||||
| Trust, Ser 2004-1, Class 1A, | ||||||||
| 4.127%, 12/25/34(A)(C) | 147,465 | |||||||
| 8,807,756 | Opteum Mortgage Acceptance Corp. | |||||||
| Asset Backed Pass-Through | ||||||||
| Certificates, Ser 2005-3, Class A1C, | ||||||||
| (1M LIBOR +0.370%), | ||||||||
| 2.586%, 7/25/35(A) | 8,848,543 | |||||||
| 591,754 | RFMSI Trust, Ser 2007-SA1, Class 1A1, | |||||||
| 3.492%, 2/25/37(A)(C) | 510,320 | |||||||
| 2,019,610 | Towd Point Mortgage Trust, Ser | |||||||
| 2015-4, Class A1B, 144a, | ||||||||
| 2.750%, 4/25/55(A)(C) | 1,989,839 | |||||||
| 140,855 | Wells Fargo Mortgage Backed | |||||||
| Securities Trust, Ser 2003-G, Class | ||||||||
| A1, 4.466%, 6/25/33(A)(C) | 142,614 | |||||||
| 343,225 | Wells Fargo Mortgage Backed | |||||||
| Securities Trust, Ser 2003-M, Class | ||||||||
| A1, 3.788%, 12/25/33(A)(C) | 352,175 | |||||||
| Total Non-Agency Collateralized | ||||||||
| Mortgage Obligations | $ | 24,722,775 | ||||||
| 105 |
Touchstone Ultra Short Duration Fixed Income Fund (Continued)
| Principal | Market | |||||||
| Amount | Value | |||||||
| U.S. Government Mortgage-Backed | ||||||||
| Obligations — 2.2% | ||||||||
| $ | 51,446 | FHLMC, Pool #1B1580, (12M LIBOR | ||||||
| +1.961%), 4.086%, 3/1/34(A) | $ | 54,372 | ||||||
| 118,869 | FHLMC, Pool #1B2629, (12M LIBOR | |||||||
| +1.750%), 3.500%, 11/1/34(A) | 124,531 | |||||||
| 274,899 | FHLMC, Pool #1B7189, (12M LIBOR | |||||||
| +2.470%), 4.688%, 3/1/36(A) | 294,558 | |||||||
| 74,560 | FHLMC, Pool #1G1471, (12M LIBOR | |||||||
| +1.663%), 3.567%, 1/1/37(A) | 77,807 | |||||||
| 519,403 | FHLMC, Pool #1H1354, (1 Year CMT | |||||||
| Rate +2.250%), 3.849%, 11/1/36(A) | 547,229 | |||||||
| 47,527 | FHLMC, Pool #1H2524, (1 Year CMT | |||||||
| Rate +2.250%), 4.026%, 8/1/35(A) | 49,941 | |||||||
| 155,562 | FHLMC, Pool #1J1813, (12M LIBOR | |||||||
| +1.925%), 4.675%, 8/1/37(A) | 162,875 | |||||||
| 175,772 | FHLMC, Pool #1K1238, (1 Year CMT | |||||||
| Rate +2.250%), 4.334%, 7/1/36(A) | 185,292 | |||||||
| 102,800 | FHLMC, Pool #1L0087, (1 Year CMT | |||||||
| Rate +2.250%), 4.350%, 6/1/35(A) | 108,014 | |||||||
| 234,648 | FHLMC, Pool #1L0147, (1 Year CMT | |||||||
| Rate +2.290%), 4.540%, 7/1/35(A) | 247,076 | |||||||
| 159,579 | FHLMC, Pool #1L1288, (1 Year CMT | |||||||
| Rate +2.250%), 4.062%, 5/1/36(A) | 168,324 | |||||||
| 139,367 | FHLMC, Pool #1Q0080, (12M LIBOR | |||||||
| +1.681%), 4.099%, 1/1/36(A) | 145,786 | |||||||
| 344,288 | FHLMC, Pool #1Q0119, (12M LIBOR | |||||||
| +1.844%), 4.507%, 9/1/36(A) | 362,717 | |||||||
| 356,168 | FHLMC, Pool #1Q0187, (12M LIBOR | |||||||
| +1.796%), 3.659%, 12/1/36(A) | 373,020 | |||||||
| 236,455 | FHLMC, Pool #1Q0339, (12M LIBOR | |||||||
| +1.921%), 3.879%, 4/1/37(A) | 249,035 | |||||||
| 92,037 | FHLMC, Pool #1Q0669, (12M LIBOR | |||||||
| +1.725%), 3.844%, 11/1/37(A) | 96,276 | |||||||
| 392,208 | FHLMC, Pool #1Q1303, (1 Year CMT | |||||||
| Rate +2.250%), 3.854%, 11/1/36(A) | 413,623 | |||||||
| 437,960 | FHLMC, Pool #781515, (1 Year CMT | |||||||
| Rate +2.250%), 4.117%, 4/1/34(A) | 459,479 | |||||||
| 220,347 | FHLMC, Pool #782760, (1 Year CMT | |||||||
| Rate +2.250%), 4.058%, 11/1/36(A) | 231,872 | |||||||
| 196,993 | FHLMC, Pool #847795, (1 Year CMT | |||||||
| Rate +2.272%), 3.779%, 4/1/35(A) | 207,584 | |||||||
| 106,149 | FHLMC, Pool #848088, (1 Year CMT | |||||||
| Rate +2.245%), 3.842%, 4/1/35(A) | 111,680 | |||||||
| 412,866 | FHLMC, Pool #848539, (1 Year CMT | |||||||
| Rate +2.265%), 3.955%, 4/1/37(A) | 435,173 | |||||||
| 911,504 | FHLMC, Pool #848583, (1 Year CMT | |||||||
| Rate +2.305%), 3.974%, 1/1/36(A) | 958,967 | |||||||
| 12,427 | FHLMC, Pool #A92646, 5.500%, 6/1/40 | 13,541 | ||||||
| 14,455 | FHLMC, Pool #C03505, 5.500%, 6/1/40 | 15,428 | ||||||
| 66,193 | FHLMC, Pool #C66916, 7.000%, 5/1/32 | 72,282 | ||||||
| 3,714 | FHLMC, Pool #D94598, 6.500%, 4/1/21 | 3,743 | ||||||
| 1,629 | FHLMC, Pool #G00100, 8.000%, 2/1/23 | 1,724 | ||||||
| 41,180 | FHLMC, Pool #G01840, 5.000%, 7/1/35 | 43,688 | ||||||
| 209,097 | FHLMC, Pool #G11769, | |||||||
| 5.000%, 10/1/20 | 212,718 | |||||||
| 136,166 | FHLMC, Pool #G11773, | |||||||
| 5.000%, 10/1/20 | 138,361 | |||||||
| 22,714 | FHLMC, Pool #J05907, 6.000%, 8/1/19 | 22,772 | ||||||
| 43,919 | FHLMC, Pool #J10895, | |||||||
| 4.000%, 10/1/19 | 44,839 | |||||||
| 45,165 | FNMA, Pool #175123, 7.450%, 8/1/22 | 45,850 | ||||||
| 4,102 | FNMA, Pool #207530, 8.250%, 4/1/22 | 4,108 | ||||||
| 130,578 | FNMA, Pool #254868, 5.000%, 9/1/33 | 138,638 | ||||||
| 62,627 | FNMA, Pool #256272, 5.500%, 6/1/26 | 66,820 | ||||||
| 106,346 | FNMA, Pool #256852, 6.000%, 8/1/27 | 114,845 | ||||||
| 24,174 | FNMA, Pool #323832, 7.500%, 7/1/29 | 27,209 | ||||||
| 1,868 | FNMA, Pool #334593, 7.000%, 5/1/24 | 1,969 | ||||||
| 74,268 | FNMA, Pool #555380, (12M LIBOR | |||||||
| +1.578%), 3.678%, 4/1/33(A) | 78,288 | |||||||
| 49,016 | FNMA, Pool #665773, 7.500%, 6/1/31 | 49,932 | ||||||
| 103,732 | FNMA, Pool #679742, (1 Year CMT Rate | |||||||
| +2.581%), 4.014%, 1/1/40(A) | 105,944 | |||||||
| 45,463 | FNMA, Pool #681842, (1 Year CMT Rate | |||||||
| +2.125%), 3.702%, 2/1/33(A) | 47,346 | |||||||
| 110,135 | FNMA, Pool #681898, (1 Year CMT Rate | |||||||
| +2.125%), 3.907%, 4/1/33(A) | 115,104 | |||||||
| 144,888 | FNMA, Pool #725245, (1 Year CMT Rate | |||||||
| +2.135%), 3.815%, 2/1/34(A) | 152,297 | |||||||
| 102 | FNMA, Pool #725284, 7.000%, 11/1/18 | 102 | ||||||
| 148,399 | FNMA, Pool #725424, 5.500%, 4/1/34 | 160,291 | ||||||
| 807,248 | FNMA, Pool #725490, (12M LIBOR | |||||||
| +1.621%), 3.991%, 4/1/34(A) | 842,443 | |||||||
| 7,318 | FNMA, Pool #735439, 6.000%, 9/1/19 | 7,358 | ||||||
| 25,628 | FNMA, Pool #735484, 5.000%, 5/1/35 | 27,208 | ||||||
| 100,794 | FNMA, Pool #735539, (1 Year CMT Rate | |||||||
| +2.201%), 3.879%, 4/1/35(A) | 105,805 | |||||||
| 41,572 | FNMA, Pool #743207, (12M LIBOR | |||||||
| +1.516%), 3.410%, 10/1/33(A) | 42,971 | |||||||
| 45,697 | FNMA, Pool #745467, (12M LIBOR | |||||||
| +1.947%), 3.734%, 4/1/36(A) | 47,809 | |||||||
| 27,572 | FNMA, Pool #745790, (1 Year CMT Rate | |||||||
| +2.127%), 3.947%, 8/1/36(A) | 28,657 | |||||||
| 56,955 | FNMA, Pool #761411, 4.500%, 5/1/19 | 57,683 | ||||||
| 70,252 | FNMA, Pool #784365, (6M LIBOR | |||||||
| +1.550%), 3.913%, 5/1/34(A) | 72,653 | |||||||
| 107,382 | FNMA, Pool #791978, (6M LIBOR | |||||||
| +1.518%), 3.691%, 9/1/34(A) | 110,251 | |||||||
| 38,012 | FNMA, Pool #804001, (1 Year CMT Rate | |||||||
| +2.185%), 3.435%, 10/1/34(A) | 39,828 | |||||||
| 31,924 | FNMA, Pool #809897, (12M LIBOR | |||||||
| +1.702%), 3.851%, 3/1/35(A) | 33,591 | |||||||
| 142,723 | FNMA, Pool #813170, (12M LIBOR | |||||||
| +1.575%), 3.524%, 1/1/35(A) | 148,663 | |||||||
| 687,680 | FNMA, Pool #815323, (6M LIBOR | |||||||
| +1.534%), 4.007%, 1/1/35(A) | 710,619 | |||||||
| 149,747 | FNMA, Pool #820364, (12M LIBOR | |||||||
| +0.900%), 3.275%, 4/1/35(A) | 153,556 | |||||||
| 314,518 | FNMA, Pool #827787, (6M LIBOR | |||||||
| +1.550%), 3.901%, 5/1/35(A) | 325,523 | |||||||
| 36,894 | FNMA, Pool #828480, (12M LIBOR | |||||||
| +1.730%), 4.465%, 6/1/35(A) | 38,695 | |||||||
| 106 |
Touchstone Ultra Short Duration Fixed Income Fund (Continued)
| Principal | Market | |||||||
| Amount | Value | |||||||
| U.S. Government Mortgage-Backed | ||||||||
| Obligations — 2.2% (Continued) | ||||||||
| $ | 117,407 | FNMA, Pool #839239, (12M LIBOR | ||||||
| +1.760%), 4.280%, 9/1/35(A) | $ | 124,093 | ||||||
| 76,116 | FNMA, Pool #888179, (12M LIBOR | |||||||
| +1.829%), 3.636%, 2/1/37(A) | 80,181 | |||||||
| 43,261 | FNMA, Pool #888548, (1 Year CMT Rate | |||||||
| +2.252%), 3.782%, 5/1/35(A) | 45,384 | |||||||
| 79,549 | FNMA, Pool #889060, 6.000%, 1/1/38 | 87,489 | ||||||
| 78,974 | FNMA, Pool #889061, 6.000%, 1/1/38 | 87,601 | ||||||
| 5,124 | FNMA, Pool #889382, 5.500%, 4/1/38 | 5,568 | ||||||
| 287,053 | FNMA, Pool #922674, (12M LIBOR | |||||||
| +1.905%), 3.930%, 4/1/36(A) | 302,938 | |||||||
| 5,170 | FNMA, Pool #931676, 5.500%, 1/1/19 | 5,170 | ||||||
| 119,539 | FNMA, Pool #950385, (6M LIBOR | |||||||
| +0.959%), 3.458%, 8/1/37(A) | 121,175 | |||||||
| 39,395 | FNMA, Pool #960376, 5.500%, 12/1/37 | 42,329 | ||||||
| 145,129 | FNMA, Pool #985670, 6.500%, 10/1/21 | 147,955 | ||||||
| 8 | FNMA, Pool #995284, 5.500%, 3/1/20 | 8 | ||||||
| 193,448 | FNMA, Pool #AA1150, 4.000%, 4/1/23 | 197,431 | ||||||
| 8,929 | FNMA, Pool #AD0941, 5.500%, 4/1/40 | 9,776 | ||||||
| 66,899 | FNMA, Pool #AE0363, 5.000%, 7/1/37 | 71,025 | ||||||
| 41,006 | FNMA, Pool #AE0727, 4.000%, 10/1/20 | 41,850 | ||||||
| 82,803 | FNMA, Pool #AE5441, 5.000%, 10/1/40 | 88,101 | ||||||
| 145,191 | FNMA, Pool #AI6588, 4.000%, 7/1/26 | 148,328 | ||||||
| 157,970 | FNMA, Pool #AI8506, 4.000%, 8/1/26 | 161,403 | ||||||
| 139,819 | FNMA, Pool #AL0211, 5.000%, 4/1/41 | 148,771 | ||||||
| 19,898 | FNMA, Pool #AL0302, 5.000%, 4/1/24 | 20,637 | ||||||
| 876,407 | FNMA, Pool #AL0478, (12M LIBOR | |||||||
| +1.797%), 3.768%, 4/1/36(A) | 919,898 | |||||||
| 258,228 | FNMA, Pool #AL0543, 5.000%, 7/1/41 | 274,694 | ||||||
| 138,072 | FNMA, Pool #AL1105, 4.500%, 12/1/40 | 143,607 | ||||||
| 33,314 | FNMA, Pool #AL2591, 5.500%, 5/1/38 | 34,219 | ||||||
| 450,947 | FNMA, Pool #AL5275, (6M LIBOR | |||||||
| +1.511%), 3.872%, 9/1/37(A) | 466,325 | |||||||
| 2,329,697 | FNMA, Pool #AL7396, (6M LIBOR | |||||||
| +1.535%), 3.882%, 2/1/37(A) | 2,403,892 | |||||||
| 6,838 | GNMA, Pool #344233, 8.000%, 2/15/23 | 7,155 | ||||||
| 31,755 | GNMA, Pool #345123, | |||||||
| 8.000%, 12/15/23 | 33,299 | |||||||
| 3,861 | GNMA, Pool #569337, 6.500%, 4/15/22 | 3,983 | ||||||
| 13,289 | GNMA, Pool #628440, 7.000%, 4/15/24 | 13,334 | ||||||
| 7,302 | GNMA, Pool #780322, | |||||||
| 8.000%, 11/15/22 | 7,645 | |||||||
| 433,710 | GNMA, Pool #80826, (1 Year CMT Rate | |||||||
| +1.500%), 3.375%, 2/20/34(A) | 449,236 | |||||||
| 183,730 | GNMA, Pool #80889, (1 Year CMT Rate | |||||||
| +1.500%), 3.625%, 4/20/34(A) | 190,280 | |||||||
| 338,412 | GNMA, Pool #81016, (1 Year CMT Rate | |||||||
| +1.500%), 2.750%, 8/20/34(A) | 350,338 | |||||||
| 619,756 | GNMA, Pool #82760, (1 Year CMT Rate | |||||||
| +1.500%), 3.375%, 3/20/41(A) | 639,606 | |||||||
| 365,544 | GNMA, Pool #MA2392, (1 Year CMT | |||||||
| Rate +1.500%), 3.000%, 11/20/44(A) | 378,893 | |||||||
| 1,594,186 | GNMA, Pool #MA2466, (1 Year CMT | |||||||
| Rate +1.500%), 3.000%, 12/20/44(A) | 1,653,735 | |||||||
| Total U.S. Government | ||||||||
| Mortgage-Backed Obligations | $ | 20,443,735 | ||||||
| U.S. Government Agency Obligations — 0.8% | ||||||||
| 5,000,000 | Overseas Private Investment Corp., | |||||||
| (3M Treasury Bill + 0.000%), | ||||||||
| 2.200%, 7/20/22(A) | 5,000,000 | |||||||
| 2,100,000 | Overseas Private Investment Corp., | |||||||
| (3M Treasury Bill + 0.000%), | ||||||||
| 2.210%, 10/15/39(A) | 2,100,000 | |||||||
| 13,216 | Small Business Administration | |||||||
| Participation Certificates, Ser | ||||||||
| 2002-20A, Class 1, 6.140%, 1/1/22 | 13,611 | |||||||
| 21,660 | Small Business Administration | |||||||
| Participation Certificates, Ser | ||||||||
| 2003-20E, Class 1, 4.640%, 5/1/23 | 22,107 | |||||||
| 94,845 | Small Business Administration Pools, | |||||||
| (Prime Rate -2.500%), | ||||||||
| 2.500%, 4/25/28(A) | 94,347 | |||||||
| 135,312 | Small Business Administration Pools, | |||||||
| (Prime Rate -2.600%), | ||||||||
| 2.400%, 1/25/26(A) | 134,259 | |||||||
| Total U.S. Government Agency | ||||||||
| Obligations | $ | 7,364,324 | ||||||
| Commercial Paper — 10.2% | ||||||||
| 15,000,000 | AT&T, Inc., 2.837%, 12/06/2018(E) | 14,925,681 | ||||||
| 15,000,000 | Avery Dennison Corp., 2.330%, | |||||||
| 10/01/2018(E) | 14,997,087 | |||||||
| 11,850,000 | Cabot Corp., 2.320%, 10/01/2018(E) | 11,847,685 | ||||||
| 6,600,000 | Catholic Health Initiatives, Ser A, | |||||||
| 2.662%, 10/10/2018(E) | 6,595,175 | |||||||
| 12,300,000 | Comcast Corp., 2.402%, 10/09/2018(E) | 12,290,886 | ||||||
| 15,000,000 | Entergy Corp., 2.445%, 11/19/2018(E) | 14,942,324 | ||||||
| 1,500,000 | General Motors Financial Co., Inc., | |||||||
| 2.548%, 10/04/2018(E) | 1,499,329 | |||||||
| 17,000,000 | Louisville Gas and Electric Co., 2.301%, | |||||||
| 10/02/2018(E) | 16,995,502 | |||||||
| 600,000 | Questar Gas Co., 2.249%, | |||||||
| 10/23/2018(E) | 598,901 | |||||||
| Total Commercial Paper | $ | 94,692,570 | ||||||
| Shares | ||||||||
| Short-Term Investment Fund — 0.0% | ||||||||
| 99,880 | Dreyfus Government Cash | |||||||
| Management, Institutional Shares, | ||||||||
| 1.95%∞Ω | $ | 99,880 | ||||||
| Total Investment Securities —101.9% | ||||||||
| (Cost $945,407,168) | $ | 942,821,171 | ||||||
| Liabilities in Excess of | ||||||||
| Other Assets — (1.9%) | (17,766,197 | ) | ||||||
| Net Assets — 100.0% | $ | 925,054,974 | ||||||
| (A) | Variable rate security - Rate reflected is the rate in effect as of September 30, 2018. |
| 107 |
Touchstone Ultra Short Duration Fixed Income Fund (Continued)
| (B) | Step Bond - A bond that pays an initial interest rate for the first period and then a higher interest rate for the following periods until maturity. The interest rate shown reflects the rate in effect as of September 30, 2018. |
| (C) | Certain variable rate securities are not based on a published reference rate and spread but are determined by the issuer or agent and are based on current market conditions. These securities do not indicate a reference rate and spread in their description. |
| (D) | Interest only security - This type of security represents the right to receive the monthly interest payments on an underlying pool of mortgages. Payments of principal on the pool reduce the value of the “interest only” holding. |
| (E) | Rate reflects yield at the time of purchase. |
| †† | The issuers and/or sponsors of certain mortgage-backed securities may no longer exist; however, the securities held by the Fund are separate legal entities organized as trusts and publicly traded. The Fund receives principal and interest payments directly from these trusts. |
| ∞ | Open-End Fund. |
| Ω | Represents the 7-day SEC yield as of September 30, 2018. |
Portfolio Abbreviations:
ARM - Adjustable Rate Mortgage
CDO - Collateralized Debt Obligations
CLO - Collateralized Loan Obligations
CMT - Constant Maturity Treasury
FDIC - Federal Deposit Insurance Corporation
FHLMC - Federal Home Loan Mortgage Corporation
FNMA - Federal National Mortgage Association
GNMA - Government National Mortgage Association
IDA - Industrial Development Agency
LIBOR - London Interbank Offered Rate
LLC - Limited Liability Company
LOC - Letter of Credit
LP - Limited Partnership
MTN - Medium Term Note
PLC - Public Limited Company
REIT - Real Estate Investment Trust
REMIC - Real Estate Mortgage Investment Conduit
SOFR - Secured Overnight Financing Rate
UTGO - Unlimited Tax General Obligation
144a - This is a restricted security that was sold in a transaction qualifying for the exemption under Rule 144a of the Securities Act of 1933. This security may be sold in transactions exempt from registration, normally to qualified institutional buyers. At September 30, 2018, these securities were valued at $452,080,485 or 48.9% of net assets. These securities were deemed liquid pursuant to procedures approved by the Board of Trustees.
| 108 |
Touchstone Ultra Short Duration Fixed Income Fund (Continued)
Other Information:
The inputs or methodology used for valuing securities may not be an indication of the risk associated with investing in those securities. For more information on valuation inputs, and their aggregation into the levels used in the table below, please refer to the security valuation section in the accompanying Notes to Financial Statements.
| Valuation inputs at Reporting Date: | ||||||||||||||||
| Description | Level 1 | Level 2 | Level 3 | Total | ||||||||||||
| Asset-Backed Securities | $ | — | $ | 340,690,042 | $ | — | $ | 340,690,042 | ||||||||
| Corporate Bonds | — | 281,793,210 | — | 281,793,210 | ||||||||||||
| Commercial Mortgage-Backed Securities | — | 112,616,587 | — | 112,616,587 | ||||||||||||
| Municipal Bonds | — | 32,776,606 | — | 32,776,606 | ||||||||||||
| Agency Collateralized Mortgage Obligations | — | 27,621,442 | — | 27,621,442 | ||||||||||||
| Non-Agency Collateralized Mortgage Obligations | — | 24,722,775 | — | 24,722,775 | ||||||||||||
| U.S. Government Mortgage-Backed Obligations | — | 20,443,735 | — | 20,443,735 | ||||||||||||
| U.S. Government Agency Obligations | — | 7,364,324 | — | 7,364,324 | ||||||||||||
| Commercial Paper | — | 94,692,570 | — | 94,692,570 | ||||||||||||
| Short-Term Investment Fund | 99,880 | — | — | 99,880 | ||||||||||||
| Total | $ | 99,880 | $ | 942,721,291 | $ | — | $ | 942,821,171 | ||||||||
See accompanying Notes to Financial Statements.
| 109 |
Statements of Assets and Liabilities
September 30, 2018
| Touchstone | ||||||||||||||||
| Touchstone | Touchstone | Emerging | Touchstone | |||||||||||||
| Active Bond | Arbitrage | Markets Small | High Yield | |||||||||||||
| Fund | Fund | Cap Fund | Fund | |||||||||||||
| Assets | ||||||||||||||||
| Investments, at cost | $ | 368,092,917 | $ | 225,937,837 | $ | 9,132,294 | $ | 204,070,386 | ||||||||
| Investments, at market value (A) | $ | 360,494,418 | $ | 222,814,216 | $ | 8,633,036 | $ | 200,950,823 | ||||||||
| Cash | 649 | 8,119 | — | — | ||||||||||||
| Foreign currency (B) | — | — | 119,562 | — | ||||||||||||
| Cash deposits held at prime broker (C) | — | 18,044,871 | — | — | ||||||||||||
| Dividends and interest receivable | 2,703,101 | 250,055 | 15,645 | 3,207,613 | ||||||||||||
| Receivable for capital shares sold | 412,443 | 216,172 | — | 286,773 | ||||||||||||
| Loan receivable from affiliates (D) | — | — | — | — | ||||||||||||
| Receivable for investments sold | 338,440 | 694,299 | 79,056 | 591,503 | ||||||||||||
| Receivable for securities lending income | 375 | 2,060 | 35 | 4,535 | ||||||||||||
| Receivable from Investment Advisor | — | — | 13,405 | — | ||||||||||||
| Tax reclaim receivable | — | — | 140 | — | ||||||||||||
| Other assets | 36,290 | 22,610 | 18,506 | 23,035 | ||||||||||||
| Total Assets | 363,985,716 | 242,052,402 | 8,879,385 | 205,064,282 | ||||||||||||
| Liabilities | ||||||||||||||||
| Bank overdrafts | — | — | — | 246,347 | ||||||||||||
| Due to prime broker | — | — | — | — | ||||||||||||
| Written options, at market value(E) | — | 72,000 | — | — | ||||||||||||
| Securities sold short(F) | — | 31,831,590 | — | — | ||||||||||||
| Dividend and interest payable on securities sold short | — | 44,337 | — | — | ||||||||||||
| Payable for return of collateral for securities on loan | — | 111,711 | — | 5,324,784 | ||||||||||||
| Payable for capital shares redeemed | 1,483,273 | 2,158,597 | 8,668 | 139,242 | ||||||||||||
| Payable for investments purchased | 510,848 | — | 64,407 | 1,541,399 | ||||||||||||
| Payable to Investment Advisor | 124,568 | 182,472 | — | 82,834 | ||||||||||||
| Payable to other affiliates | 118,513 | 28,766 | 235 | 28,108 | ||||||||||||
| Payable to Trustees | 7,124 | 7,124 | 7,124 | 7,124 | ||||||||||||
| Payable for professional services | 35,275 | 32,041 | 46,337 | 28,965 | ||||||||||||
| Payable to Transfer Agent | 120,672 | 57,491 | 3,627 | 38,531 | ||||||||||||
| Payable for reports to shareholders | 12,096 | 13,100 | 6,858 | 8,287 | ||||||||||||
| Payable for pricing services | 23,856 | 5,468 | 17,493 | 25,905 | ||||||||||||
| Other accrued expenses and liabilities | 7,494 | 10,259 | 12,498 | 4,555 | ||||||||||||
| Total Liabilities | 2,443,719 | 34,554,956 | 167,247 | 7,476,081 | ||||||||||||
| Net Assets | $ | 361,541,997 | $ | 207,497,446 | $ | 8,712,138 | $ | 197,588,201 | ||||||||
| Net assets consist of: | ||||||||||||||||
| Par value | $ | 363,327 | $ | 211,449 | $ | 8,949 | $ | 237,432 | ||||||||
| Paid-in capital | 463,396,660 | 215,458,151 | 106,275,013 | 215,138,972 | ||||||||||||
| Distributable earnings (deficit) | (102,217,990 | ) | (8,172,154 | ) | (97,571,824 | ) | (17,788,203 | ) | ||||||||
| Net Assets | $ | 361,541,997 | $ | 207,497,446 | $ | 8,712,138 | $ | 197,588,201 | ||||||||
| (A) Includes market value of securities on loan of: | $ | — | $ | 44,495 | $ | — | $ | 4,722,101 | ||||||||
| (B) Cost of foreign currency: | $ | — | $ | — | $ | 119,310 | $ | — | ||||||||
| (C) Represents segregated cash for securities sold short and written options. | ||||||||||||||||
| (D) See Note 5 in Notes to Financial Statements. | ||||||||||||||||
| (E) Premiums received from written options: | $ | — | $ | 65,365 | $ | — | $ | — | ||||||||
| (F) Proceeds received for securities sold short: | $ | — | $ | 30,108,218 | $ | — | $ | — | ||||||||
See accompanying Notes to Financial Statements.
| 110 |
Statements of Assets and Liabilities (Continued)
| Touchstone | Touchstone | Touchstone | Touchstone | Touchstone | ||||||||||||||||||
| Touchstone | Merger | Mid | Mid Cap | Premium | Sands Capital | |||||||||||||||||
| Impact Bond | Arbitrage | Cap | Value | Yield Equity | Select Growth | |||||||||||||||||
| Fund | Fund | Fund | Fund | Fund | Fund | |||||||||||||||||
| $ | 258,333,813 | $ | 168,986,651 | $ | 777,364,028 | $ | 729,581,816 | $ | 72,846,490 | $ | 914,112,202 | |||||||||||
| $ | 250,567,400 | $ | 166,156,207 | $ | 960,208,488 | $ | 812,269,879 | $ | 85,429,281 | $ | 2,349,138,829 | |||||||||||
| — | 5,379 | — | — | — | — | |||||||||||||||||
| — | — | — | — | — | — | |||||||||||||||||
| — | — | — | — | — | — | |||||||||||||||||
| 1,760,133 | 161,528 | 836,999 | 1,176,559 | 264,612 | — | |||||||||||||||||
| 893,789 | 36,216 | 3,986,341 | 2,008,430 | 127,795 | 2,846,567 | |||||||||||||||||
| — | — | — | — | — | 3,265,298 | |||||||||||||||||
| — | 451,679 | — | — | 3,542,733 | — | |||||||||||||||||
| — | 2,376 | — | 5,519 | 1,204 | — | |||||||||||||||||
| — | — | — | — | — | — | |||||||||||||||||
| — | — | — | — | 23,630 | — | |||||||||||||||||
| 33,307 | 21,574 | 46,927 | 25,426 | 14,464 | 26,551 | |||||||||||||||||
| 253,254,629 | 166,834,959 | 965,078,755 | 815,485,813 | 89,403,719 | 2,355,277,245 | |||||||||||||||||
| 396 | — | 998 | — | 85,348 | — | |||||||||||||||||
| — | 5,559,655 | — | — | — | — | |||||||||||||||||
| — | 56,310 | — | — | — | — | |||||||||||||||||
| — | 19,360,501 | — | — | — | — | |||||||||||||||||
| — | 62,465 | — | — | — | — | |||||||||||||||||
| — | 658,866 | — | 15,772,381 | 585,420 | — | |||||||||||||||||
| 152,554 | 1,298,244 | 1,111,338 | 1,309,784 | 125,466 | 4,664,969 | |||||||||||||||||
| — | — | 7,482,698 | 3,952,980 | 844,042 | 1,722,835 | |||||||||||||||||
| 67,105 | 120,699 | 584,798 | 517,806 | 49,651 | 1,853,004 | |||||||||||||||||
| 21,518 | 23,695 | 158,436 | 50,411 | 25,655 | 789,777 | |||||||||||||||||
| 7,124 | 7,124 | 7,124 | 7,124 | 7,124 | 7,124 | |||||||||||||||||
| 29,755 | 31,771 | 38,296 | 34,758 | 23,102 | 62,367 | |||||||||||||||||
| 44,758 | 35,795 | 218,741 | 155,590 | 20,504 | 650,588 | |||||||||||||||||
| 7,961 | 9,283 | 42,249 | 44,863 | 8,636 | 71,241 | |||||||||||||||||
| 16,511 | 5,887 | 726 | 1,849 | 1,115 | 715 | |||||||||||||||||
| 4,768 | 11,634 | 7,866 | 7,405 | 3,386 | 32,691 | |||||||||||||||||
| 352,450 | 27,241,929 | 9,653,270 | 21,854,951 | 1,779,449 | 9,855,311 | |||||||||||||||||
| $ | 252,902,179 | $ | 139,593,030 | $ | 955,425,485 | $ | 793,630,862 | $ | 87,624,270 | $ | 2,345,421,934 | |||||||||||
| $ | 258,719 | $ | 133,457 | $ | 271,715 | $ | 421,273 | $ | 91,653 | $ | 1,279,863 | |||||||||||
| 265,921,857 | 145,147,607 | 749,309,883 | 689,208,525 | 67,994,297 | 562,644,254 | |||||||||||||||||
| (13,278,397 | ) | (5,688,034 | ) | 205,843,887 | 104,001,064 | 19,538,320 | 1,781,497,817 | |||||||||||||||
| $ | 252,902,179 | $ | 139,593,030 | $ | 955,425,485 | $ | 793,630,862 | $ | 87,624,270 | $ | 2,345,421,934 | |||||||||||
| $ | — | $ | 591,845 | $ | — | $ | 16,044,990 | $ | 562,203 | $ | — | |||||||||||
| $ | — | $ | — | $ | — | $ | — | $ | — | $ | — | |||||||||||
| $ | — | $ | 51,465 | $ | — | $ | — | $ | — | $ | — | |||||||||||
| $ | — | $ | 18,236,106 | $ | — | $ | — | $ | — | $ | — | |||||||||||
| 111 |
Statements of Assets and Liabilities (Continued)
| Touchstone | ||||||||||||||||
| Touchstone | Emerging | |||||||||||||||
| Active | Touchstone | Markets | Touchstone | |||||||||||||
| Bond | Arbitrage | Small Cap | High Yield | |||||||||||||
| Fund | Fund | Fund | Fund | |||||||||||||
| Pricing of Class A Shares | ||||||||||||||||
| Net assets applicable to Class A shares | $ | 133,082,810 | $ | 3,844,092 | $ | 1,328,867 | $ | 12,456,618 | ||||||||
| Shares of beneficial interest outstanding | ||||||||||||||||
| (unlimited number of shares authorized, $0.01 par value) | 13,295,694 | 397,289 | 136,637 | 1,534,349 | ||||||||||||
| Net asset value price per share* | $ | 10.01 | $ | 9.68 | $ | 9.73 | $ | 8.12 | ||||||||
| Maximum sales charge - Class A shares | 2.00 | % | 5.00 | % | 5.00 | % | 2.00 | % | ||||||||
| Maximum offering price per share | ||||||||||||||||
| (100%/(100%-maximum sales charge) of net asset value adjusted to the nearest cent) - Class A shares | $ | 10.21 | $ | 10.19 | $ | 10.24 | $ | 8.29 | ||||||||
| Pricing of Class C Shares | ||||||||||||||||
| Net assets applicable to Class C shares | $ | 23,807,313 | $ | 4,821,653 | $ | 748,500 | $ | 9,444,052 | ||||||||
| Shares of beneficial interest outstanding | ||||||||||||||||
| (unlimited number of shares authorized, $0.01 par value) | 2,578,214 | 517,186 | 79,325 | 1,166,333 | ||||||||||||
| Net asset value and offering price per share** | $ | 9.23 | $ | 9.32 | $ | 9.44 | $ | 8.10 | ||||||||
| Pricing of Class Y Shares | ||||||||||||||||
| Net assets applicable to Class Y shares | $ | 165,936,681 | $ | 164,945,660 | $ | 6,447,877 | $ | 63,982,673 | ||||||||
| Shares of beneficial interest outstanding | ||||||||||||||||
| (unlimited number of shares authorized, $0.01 par value) | 16,588,454 | 16,797,579 | 659,673 | 7,660,347 | ||||||||||||
| Net asset value, offering price and redemption price per share | $ | 10.00 | $ | 9.82 | $ | 9.77 | $ | 8.35 | ||||||||
| Pricing of Class Z Shares | ||||||||||||||||
| Net assets applicable to Class Z shares | $ | — | $ | — | $ | — | $ | — | ||||||||
| Shares of beneficial interest outstanding | ||||||||||||||||
| (unlimited number of shares authorized, $0.01 par value) | — | — | — | — | ||||||||||||
| Net asset value, offering price and redemption price per share | $ | — | $ | — | $ | — | $ | — | ||||||||
| Pricing of Institutional Class Shares | ||||||||||||||||
| Net assets applicable to Institutional Class shares | $ | 38,715,193 | $ | 33,886,041 | $ | 186,894 | $ | 111,704,858 | ||||||||
| Shares of beneficial interest outstanding | ||||||||||||||||
| (unlimited number of shares authorized, $0.01 par value) | 3,870,302 | 3,432,866 | 19,262 | 13,382,160 | ||||||||||||
| Net asset value, offering price and redemption price per share | $ | 10.00 | $ | 9.87 | $ | 9.70 | $ | 8.35 | ||||||||
* There is no sales load on subscriptions of $1 million or more for all funds except for Active Bond Fund, High Yield Fund and Impact Bond Fund. There is no sales load on subscriptions of $500,000 or more for Active Bond Fund, High Yield Fund and Impact Bond Fund. Redemptions that were part of a $500,000 or $1 million or more subscription, as applicable, may be subject to a contingent deferred sales load if redeemed within a one-year period from the date of purchase.
** Redemption price per share varies by length of time shares are held due to the terms of the contingent deferred sales charge.
See accompanying Notes to Financial Statements.
| 112 |
Statements of Assets and Liabilities (Continued)
| Touchstone | Touchstone | Touchstone | Touchstone | Touchstone | ||||||||||||||||||
| Touchstone | Merger | Mid | Mid Cap | Premium | Sands Capital | |||||||||||||||||
| Impact Bond | Arbitrage | Cap | Value | Yield Equity | Select | |||||||||||||||||
| Fund | Fund | Fund | Fund | Fund | Growth Fund | |||||||||||||||||
| $ | 5,696,822 | $ | 8,946,474 | $ | 36,824,237 | $ | 17,216,930 | $ | 11,983,902 | $ | 97,582,808 | |||||||||||
| 583,379 | 867,662 | 1,052,561 | 920,397 | 1,251,107 | 5,502,836 | |||||||||||||||||
| $ | 9.77 | $ | 10.31 | $ | 34.99 | $ | 18.71 | $ | 9.58 | $ | 17.73 | |||||||||||
| 2.00 | % | 5.00 | % | 5.00 | % | 5.00 | % | 5.00 | % | 5.00 | % | |||||||||||
| $ | 9.97 | $ | 10.85 | $ | 36.83 | $ | 19.69 | $ | 10.08 | $ | 18.66 | |||||||||||
| $ | 1,086,721 | $ | 7,695,659 | $ | 56,274,053 | $ | 7,754,924 | $ | 19,454,912 | $ | 80,444,215 | |||||||||||
| 111,415 | 789,923 | 1,704,626 | 426,094 | 2,033,844 | 4,967,139 | |||||||||||||||||
| $ | 9.75 | $ | 9.74 | $ | 33.01 | $ | 18.20 | $ | 9.57 | $ | 16.20 | |||||||||||
| $ | 54,894,677 | $ | 83,211,383 | $ | 712,578,427 | $ | 337,246,982 | $ | 56,185,456 | $ | 1,556,324,072 | |||||||||||
| 5,614,749 | 7,926,285 | 20,171,324 | 17,944,251 | 5,880,332 | 83,090,627 | |||||||||||||||||
| $ | 9.78 | $ | 10.50 | $ | 35.33 | $ | 18.79 | $ | 9.55 | $ | 18.73 | |||||||||||
| $ | — | $ | — | $ | 20,464,469 | $ | — | $ | — | $ | 611,070,839 | |||||||||||
| — | — | 588,478 | — | — | 34,425,747 | |||||||||||||||||
| $ | — | $ | — | $ | 34.78 | $ | — | $ | — | $ | 17.75 | |||||||||||
| $ | 191,223,959 | $ | 39,739,514 | $ | 129,284,299 | $ | 431,412,026 | $ | — | $ | — | |||||||||||
| 19,562,399 | 3,761,796 | 3,654,514 | 22,836,594 | — | — | |||||||||||||||||
| $ | 9.78 | $ | 10.56 | $ | 35.38 | $ | 18.89 | $ | — | $ | — | |||||||||||
| 113 |
Statements of Assets and Liabilities (Continued)
| Touchstone | Touchstone | Touchstone | ||||||||||
| Small | Small | Ultra Short | ||||||||||
| Cap | Cap Value | Duration Fixed | ||||||||||
| Fund | Fund | Income Fund | ||||||||||
| Assets | ||||||||||||
| Investments, at cost | $ | 110,512,989 | $ | 154,730,663 | $ | 945,407,168 | ||||||
| Investments, at market value (A) | $ | 163,605,585 | $ | 162,560,262 | $ | 942,821,171 | ||||||
| Cash | — | 15,781 | 7,713,089 | |||||||||
| Dividends and interest receivable | 156,171 | 197,674 | 3,650,491 | |||||||||
| Receivable for capital shares sold | 36,880 | 93,053 | 4,396,242 | |||||||||
| Receivable for investments sold | — | 16,109,471 | 1,070,311 | |||||||||
| Receivable from securities lending income | 5,220 | 3,685 | — | |||||||||
| Other assets | 17,502 | 15,028 | 49,633 | |||||||||
| Total Assets | 163,821,358 | 178,994,954 | 959,700,937 | |||||||||
| Liabilities | ||||||||||||
| Distributions payable | — | — | 210,415 | |||||||||
| Payable for return of collateral for securities on loan | 3,968,011 | 4,353,965 | — | |||||||||
| Payable for capital shares redeemed | 342,139 | 199,764 | 3,487,712 | |||||||||
| Payable for investments purchased | — | 18,940,359 | 30,238,289 | |||||||||
| Payable to Investment Advisor | 114,190 | 87,011 | 174,185 | |||||||||
| Payable to other affiliates | 23,663 | 5,182 | 236,729 | |||||||||
| Payable to Trustees | 7,124 | 7,124 | 7,124 | |||||||||
| Payable for professional services | 23,605 | 25,350 | 45,247 | |||||||||
| Payable for pricing services | 761 | 2,386 | 46,542 | |||||||||
| Payable to Transfer Agent | 32,768 | 100,968 | 168,358 | |||||||||
| Payable for reports to shareholders | 10,064 | 9,651 | 19,249 | |||||||||
| Other accrued expenses and liabilities | 4,402 | 47,645 | 12,113 | |||||||||
| Total Liabilities | 4,526,727 | 23,779,405 | 34,645,963 | |||||||||
| Net Assets | $ | 159,294,631 | $ | 155,215,549 | $ | 925,054,974 | ||||||
| Net assets consist of: | ||||||||||||
| Par value | $ | 97,325 | $ | 55,586 | $ | 1,000,521 | ||||||
| Paid-in capital | 84,589,158 | 139,682,103 | 1,024,959,679 | |||||||||
| Distributable earnings (deficit) | 74,608,148 | 15,477,860 | (100,905,226 | ) | ||||||||
| Net Assets | $ | 159,294,631 | $ | 155,215,549 | $ | 925,054,974 | ||||||
| (A) Includes market value of securities on loan of: | $ | 3,827,604 | $ | 4,297,000 | $ | — | ||||||
See accompanying Notes to Financial Statements.
| 114 |
Statements of Assets and Liabilities (Continued)
| Touchstone | Touchstone | Touchstone | ||||||||||
| Small | Small | Ultra Short | ||||||||||
| Cap | Cap Value | Duration Fixed | ||||||||||
| Fund | Fund | Income Fund | ||||||||||
| Pricing of Class A Shares | ||||||||||||
| Net assets applicable to Class A shares | $ | 8,141,994 | $ | 83,139,270 | $ | 76,622,554 | ||||||
| Shares of beneficial interest outstanding | ||||||||||||
| (unlimited number of shares authorized, $0.01 par value) | 501,322 | 2,978,534 | 8,287,342 | |||||||||
| Net asset value price per share* | $ | 16.24 | $ | 27.91 | $ | 9.25 | ||||||
| Maximum sales charge - Class A shares | 5.00 | % | 5.00 | % | 2.00 | % | ||||||
| Maximum offering price per share | ||||||||||||
| (100%/(100%-maximum sales charge) of net asset value adjusted to the nearest cent) - Class A shares | $ | 17.09 | $ | 29.38 | $ | 9.44 | ||||||
| Pricing of Class C Shares | ||||||||||||
| Net assets applicable to Class C shares | $ | 6,298,703 | $ | 1,432,799 | $ | 4,491,863 | ||||||
| Shares of beneficial interest outstanding | ||||||||||||
| (unlimited number of shares authorized, $0.01 par value) | 409,007 | 52,643 | 485,831 | |||||||||
| Net asset value and offering price per share** | $ | 15.40 | $ | 27.22 | $ | 9.25 | ||||||
| Pricing of Class S Shares | ||||||||||||
| Net assets applicable to Class S shares | $ | — | $ | — | $ | 141,916,557 | ||||||
| Shares of beneficial interest outstanding | ||||||||||||
| (unlimited number of shares authorized, $0.01 par value) | — | — | 15,349,410 | |||||||||
| Net asset value, offering price and redemption price per share | $ | — | $ | — | $ | 9.25 | ||||||
| Pricing of Class Y Shares | ||||||||||||
| Net assets applicable to Class Y shares | $ | 51,217,550 | $ | 41,364,793 | $ | 262,568,487 | ||||||
| Shares of beneficial interest outstanding | ||||||||||||
| (unlimited number of shares authorized, $0.01 par value) | 3,113,222 | 1,479,434 | 28,398,881 | |||||||||
| Net asset value, offering price and redemption price per share | $ | 16.45 | $ | 27.96 | $ | 9.25 | ||||||
| Pricing of Class Z Shares | ||||||||||||
| Net assets applicable to Class Z shares | $ | — | $ | — | $ | 163,896,507 | ||||||
| Shares of beneficial interest outstanding | ||||||||||||
| (unlimited number of shares authorized, $0.01 par value) | — | — | 17,726,718 | |||||||||
| Net asset value, offering price and redemption price per share | $ | — | $ | — | $ | 9.25 | ||||||
| Pricing of Institutional Class Shares | ||||||||||||
| Net assets applicable to Institutional Class shares | $ | 93,636,384 | $ | 29,278,687 | $ | 275,559,006 | ||||||
| Shares of beneficial interest outstanding | ||||||||||||
| (unlimited number of shares authorized, $0.01 par value) | 5,708,953 | 1,048,030 | 29,803,910 | |||||||||
| Net asset value, offering price and redemption price per share | $ | 16.40 | $ | 27.94 | $ | 9.25 | ||||||
* There is no sales load on subscriptions of $1 million or more for all funds except for Ultra Short Duration Fixed Income Fund. There is no sales load on subscriptions of $500,000 or more for Ultra Short Duration Fixed Income Fund. Redemptions that were part of a $500,000 or $1 million or more subscription, as applicable, may be subject to a contingent deferred sales load if redeemed within a one-year period from the date of purchase.
** Redemption price per share varies by length of time shares are held due to the terms of the contingent deferred sales charge.
See accompanying Notes to Financial Statements.
| 115 |
For the Year Ended September 30, 2018
| Touchstone | ||||||||||||
| Touchstone | Touchstone | Emerging | ||||||||||
| Active Bond | Arbitrage | Markets Small | ||||||||||
| Fund | Fund | Cap Fund | ||||||||||
| Investment Income | ||||||||||||
| Dividends (A) | $ | 1,019,289 | $ | 3,565,051 | $ | 277,722 | ||||||
| Interest | 11,013,412 | 706,491 | — | |||||||||
| Income from securities loaned | 4,392 | 69,261 | 5,222 | |||||||||
| Total Investment Income | 12,037,093 | 4,340,803 | 282,944 | |||||||||
| Expenses | ||||||||||||
| Investment advisory fees | 1,444,201 | 2,469,226 | 126,906 | |||||||||
| Administration fees | 538,982 | 340,988 | 17,525 | |||||||||
| Compliance fees and expenses | 1,355 | 1,355 | 1,355 | |||||||||
| Custody fees | 43,517 | 67,376 | 71,753 | |||||||||
| Professional fees | 43,666 | 35,084 | 54,651 | |||||||||
| Transfer Agent fees, Class A | 137,364 | 6,366 | 4,672 | |||||||||
| Transfer Agent fees, Class C | 27,842 | 4,624 | 1,852 | |||||||||
| Transfer Agent fees, Class Y | 143,468 | 131,085 | 3,938 | |||||||||
| Transfer Agent fees, Class Z | — | — | — | |||||||||
| Transfer Agent fees, Institutional Class | 1,275 | 4,588 | 626 | |||||||||
| Pricing expense | 50,477 | 9,551 | 26,763 | |||||||||
| Registration Fees, Class A | 16,040 | 16,295 | 15,826 | |||||||||
| Registration Fees, Class C | 14,208 | 12,763 | 10,929 | |||||||||
| Registration Fees, Class Y | 15,589 | 24,324 | 15,238 | |||||||||
| Registration Fees, Class Z | — | — | — | |||||||||
| Registration Fees, Institutional Class | 12,577 | 12,773 | 12,682 | |||||||||
| Dividend expense on securities sold short | — | 518,223 | — | |||||||||
| Interest expense on securities sold short | — | 49,216 | — | |||||||||
| Reports to Shareholders, Class A | 14,063 | 6,371 | 5,232 | |||||||||
| Reports to Shareholders, Class C | 8,177 | 6,458 | 4,845 | |||||||||
| Reports to Shareholders, Class Y | 15,140 | 20,022 | 5,072 | |||||||||
| Reports to Shareholders, Class Z | — | — | — | |||||||||
| Reports to Shareholders, Institutional Class | 4,999 | 6,775 | 4,815 | |||||||||
| Shareholder servicing fees, Class Z | — | — | — | |||||||||
| Distribution expenses, Class A | 352,259 | 14,462 | 5,443 | |||||||||
| Distribution and shareholder servicing expenses, Class C | 261,320 | 67,025 | 9,542 | |||||||||
| Trustee fees | 14,317 | 14,317 | 14,317 | |||||||||
| Other expenses | 79,983 | 24,830 | 9,890 | |||||||||
| Total Expenses | 3,240,819 | 3,864,097 | 423,872 | |||||||||
| Fees waived and/or reimbursed by the Advisor and/or Affiliates(B) | (234,301 | ) | (44,366 | ) | (236,210 | ) | ||||||
| Fees recouped by the Advisor(B) | — | — | — | |||||||||
| Net Expenses | 3,006,518 | 3,819,731 | 187,662 | |||||||||
| Net Investment Income (Loss) | 9,030,575 | 521,072 | 95,282 | |||||||||
| Realized and Unrealized Gains (Losses) on Investments | ||||||||||||
| Net realized gains (losses) on investments(C)(D) | (1,721,851 | ) | 2,597,068 | 572,505 | ||||||||
| Net realized gains on forward foreign currency contracts | — | 359,223 | — | |||||||||
| Net realized gains (losses) on foreign currency transactions | — | 83,909 | (17,316 | ) | ||||||||
| Net realized losses on futures contracts | (678,340 | ) | — | — | ||||||||
| Net realized gains on written options | — | 1,286,604 | — | |||||||||
| Net realized losses on securities sold short | — | (5,354,052 | ) | — | ||||||||
| Net change in unrealized appreciation (depreciation) on investments(E)(F) | (13,483,953 | ) | (2,035,845 | ) | (1,743,392 | ) | ||||||
| Net change in unrealized appreciation (depreciation) on forward foreign currency contracts | — | (18,521 | ) | — | ||||||||
| Net change in unrealized appreciation (depreciation) on foreign currency transactions | (212 | ) | 4,246 | 394 | ||||||||
| Net change in unrealized appreciation (depreciation) on written options | — | (34,296 | ) | — | ||||||||
| Net change in unrealized appreciation (depreciation) on securities sold short | — | 309,631 | — | |||||||||
| Net Realized and Unrealized Gains (Losses) on Investments | (15,884,356 | ) | (2,802,033 | ) | (1,187,809 | ) | ||||||
| Change in Net Assets Resulting from Operations | $ | (6,853,781 | ) | $ | (2,280,961 | ) | $ | (1,092,527 | ) | |||
| (A) Net of foreign tax withholding of: | $ | — | $ | 4,380 | $ | 31,774 | ||||||
| (B) See Note 4 in Notes to Financial Statements. | ||||||||||||
| (C) Net of foreign capital gains tax withheld of: | $ | — | $ | — | $ | 31,624 | ||||||
| (D) For the year ended September 30, 2018, the Sands Capital Select Growth Fund had redemptions-in-kind of securities in the amount of $129,984,251. Net realized gains (losses) on investments includes the realized gains on the transactions of $85,612,040 which will not be realized by the Fund for tax purposes. | ||||||||||||
| (E) Includes change in deferred foreign capital gains tax of: | $ | — | $ | — | $ | 43,056 | ||||||
| (F) Change in unrealized appreciation (depreciation) does not include net appreciation of $3,902,071 for the Touchstone Active Bond Fund in connection with the Fund's merger. See Note 9 in the Notes to Financial Statements. | ||||||||||||
See accompanying Notes to Financial Statements.
| 116 |
Statements of Operations (Continued)
| Touchstone | Touchstone | Touchstone | Touchstone | Touchstone | ||||||||||||||||||||||
| Touchstone | Touchstone | Merger | Mid | Mid Cap | Premium | Sands Capital | ||||||||||||||||||||
| High Yield | Impact Bond | Arbitrage | Cap | Value | Yield Equity | Select Growth | ||||||||||||||||||||
| Fund | Fund | Fund | Fund | Fund | Fund | Fund | ||||||||||||||||||||
| $ | 11,382 | $ | 104,330 | $ | 2,283,898 | $ | 11,046,633 | $ | 11,900,805 | $ | 3,661,259 | $ | 3,343,605 | |||||||||||||
| 11,537,439 | 8,613,171 | 702,912 | — | — | — | 6,076 | ||||||||||||||||||||
| 40,221 | 5,768 | 4,100 | 3,230 | 78,172 | 39,299 | 213,505 | ||||||||||||||||||||
| 11,589,042 | 8,723,269 | 2,990,910 | 11,049,863 | 11,978,977 | 3,700,558 | 3,563,186 | ||||||||||||||||||||
| 1,047,243 | 985,962 | 1,901,279 | 6,729,457 | 5,863,438 | 763,921 | 22,629,654 | ||||||||||||||||||||
| 289,200 | 408,470 | 262,558 | 1,252,695 | 1,101,420 | 159,552 | 3,577,883 | ||||||||||||||||||||
| 1,355 | 1,355 | 1,355 | 1,355 | 1,355 | 1,355 | 1,355 | ||||||||||||||||||||
| 17,126 | 13,295 | 54,117 | 17,021 | 25,589 | 8,995 | 37,551 | ||||||||||||||||||||
| 31,588 | 33,808 | 34,322 | 49,858 | 46,395 | 25,253 | 97,249 | ||||||||||||||||||||
| 21,804 | 8,814 | 9,879 | 32,061 | 27,659 | 22,689 | 62,234 | ||||||||||||||||||||
| 10,288 | 1,646 | 6,519 | 49,339 | 8,233 | 12,809 | 53,372 | ||||||||||||||||||||
| 61,544 | 40,349 | 90,872 | 548,599 | 284,181 | 30,685 | 1,390,832 | ||||||||||||||||||||
| — | — | — | 20,078 | — | — | 823,504 | ||||||||||||||||||||
| 7,053 | 102,367 | 11,210 | 20,549 | 149,443 | — | — | ||||||||||||||||||||
| 49,644 | 32,334 | 10,260 | 1,219 | 3,170 | 1,933 | 1,251 | ||||||||||||||||||||
| 15,781 | 15,114 | 18,030 | 16,438 | 17,431 | 17,009 | 17,739 | ||||||||||||||||||||
| 13,194 | 10,423 | 15,468 | 16,901 | 16,385 | 15,427 | 16,215 | ||||||||||||||||||||
| 17,936 | 16,743 | 19,383 | 38,326 | 32,339 | 18,693 | 48,306 | ||||||||||||||||||||
| — | — | — | 15,038 | — | — | 22,373 | ||||||||||||||||||||
| 12,968 | 41,406 | 21,041 | 12,462 | 26,880 | — | — | ||||||||||||||||||||
| — | — | 336,787 | — | — | — | — | ||||||||||||||||||||
| — | — | 359,262 | — | — | — | — | ||||||||||||||||||||
| 5,838 | 5,085 | 5,765 | 9,752 | 12,711 | 6,049 | 11,129 | ||||||||||||||||||||
| 5,557 | 4,982 | 5,712 | 12,286 | 11,082 | 5,876 | 11,031 | ||||||||||||||||||||
| 6,596 | 6,203 | 10,680 | 90,399 | 80,487 | 11,723 | 124,145 | ||||||||||||||||||||
| — | — | — | 8,946 | — | — | 39,529 | ||||||||||||||||||||
| 5,044 | 7,733 | 5,105 | 8,165 | 39,843 | — | — | ||||||||||||||||||||
| — | — | — | 50,999 | — | — | 1,394,019 | ||||||||||||||||||||
| 36,288 | 14,157 | 28,419 | 89,486 | 49,065 | 44,621 | 233,087 | ||||||||||||||||||||
| 110,663 | 13,723 | 95,361 | 575,949 | 95,870 | 208,177 | 762,412 | ||||||||||||||||||||
| 14,317 | 14,317 | 14,317 | 14,317 | 14,317 | 14,317 | 14,317 | ||||||||||||||||||||
| 28,336 | 18,301 | 18,067 | 45,449 | 48,758 | 16,889 | 368,867 | ||||||||||||||||||||
| 1,809,363 | 1,796,587 | 3,335,768 | 9,727,144 | 7,956,051 | 1,385,973 | 31,738,054 | ||||||||||||||||||||
| (155,255 | ) | (305,888 | ) | (57,165 | ) | (540,341 | ) | (747,720 | ) | (87,222 | ) | (343,929 | ) | |||||||||||||
| — | — | — | — | 48,669 | — | 68,840 | ||||||||||||||||||||
| 1,654,108 | 1,490,699 | 3,278,603 | 9,186,803 | 7,257,000 | 1,298,751 | 31,462,965 | ||||||||||||||||||||
| 9,934,934 | 7,232,570 | (287,693 | ) | 1,863,060 | 4,721,977 | 2,401,807 | (27,899,779 | ) | ||||||||||||||||||
| 1,133,608 | (962,215 | ) | 3,647,608 | 100,593,876 | 30,401,221 | 9,382,625 | 546,189,592 | |||||||||||||||||||
| — | — | 171,990 | — | — | — | — | ||||||||||||||||||||
| — | — | 46,182 | — | — | — | — | ||||||||||||||||||||
| — | — | — | — | — | — | — | ||||||||||||||||||||
| — | — | 1,092,277 | — | — | — | — | ||||||||||||||||||||
| — | — | (5,288,189 | ) | — | — | — | — | |||||||||||||||||||
| (8,165,563 | ) | (8,630,367 | ) | (2,170,269 | ) | 22,111,241 | (12,687,339 | ) | (4,923,095 | ) | 192,041,727 | |||||||||||||||
| — | — | (10,865 | ) | — | — | — | — | |||||||||||||||||||
| — | — | 1,976 | — | — | — | — | ||||||||||||||||||||
| — | — | (29,087 | ) | — | — | — | — | |||||||||||||||||||
| — | — | 1,374,780 | — | — | — | — | ||||||||||||||||||||
| (7,031,955 | ) | (9,592,582 | ) | (1,163,597 | ) | 122,705,117 | 17,713,882 | 4,459,530 | 738,231,319 | |||||||||||||||||
| $ | 2,902,979 | $ | (2,360,012 | ) | $ | (1,451,290 | ) | $ | 124,568,177 | $ | 22,435,859 | $ | 6,861,337 | $ | 710,331,540 | |||||||||||
| $ | — | $ | — | $ | 2,576 | $ | — | $ | — | $ | 134,180 | $ | 30,027 | |||||||||||||
| $ | — | $ | — | $ | — | $ | — | $ | — | $ | — | $ | — | |||||||||||||
| $ | — | $ | — | $ | — | $ | — | $ | — | $ | — | $ | — | |||||||||||||
| 117 |
Statements of Operations (Continued)
| Touchstone | ||||||||||||
| Touchstone | Ultra Short | |||||||||||
| Touchstone | Small Cap | Duration | ||||||||||
| Small Cap | Value | Fixed Income | ||||||||||
| Fund | Fund | Fund | ||||||||||
| Investment Income | ||||||||||||
| Dividends | $ | 5,832,755 | $ | 1,409,564 | $ | 42,266 | ||||||
| Interest | — | — | 23,869,666 | |||||||||
| Income from securities loaned | 303,338 | 44,963 | — | |||||||||
| Total Investment Income | 6,136,093 | 1,454,527 | 23,911,932 | |||||||||
| Expenses | ||||||||||||
| Investment advisory fees | 1,542,900 | 889,486 | 2,328,072 | |||||||||
| Administration fees | 263,201 | 143,615 | 1,350,271 | |||||||||
| Compliance fees and expenses | 1,355 | 1,355 | 1,355 | |||||||||
| Custody fees | 9,717 | 11,907 | 42,937 | |||||||||
| Professional fees | 26,892 | 26,840 | 62,093 | |||||||||
| Transfer Agent fees, Class A | 15,301 | 217,012 | 70,778 | |||||||||
| Transfer Agent fees, Class C | 7,781 | 1,707 | 3,963 | |||||||||
| Transfer Agent fees, Class S | — | — | 67,223 | |||||||||
| Transfer Agent fees, Class Y | 55,920 | 3,688 | 169,263 | |||||||||
| Transfer Agent fees, Class Z | — | — | 160,054 | |||||||||
| Transfer Agent fees, Institutional Class | 36,957 | 2,856 | 58,680 | |||||||||
| Pricing expense | 1,286 | 4,033 | 84,969 | |||||||||
| Registration Fees, Class A | 16,340 | 17,684 | 23,576 | |||||||||
| Registration Fees, Class C | 13,681 | 9,921 | 16,564 | |||||||||
| Registration Fees, Class S | — | — | 6,840 | |||||||||
| Registration Fees, Class Y | 19,111 | 10,865 | 24,903 | |||||||||
| Registration Fees, Class Z | — | — | 17,517 | |||||||||
| Registration Fees, Institutional Class | 15,880 | 7,419 | 19,744 | |||||||||
| Reports to Shareholders, Class A | 6,192 | 11,406 | 10,261 | |||||||||
| Reports to Shareholders, Class C | 5,491 | 5,327 | 5,348 | |||||||||
| Reports to Shareholders, Class S | — | — | 19,267 | |||||||||
| Reports to Shareholders, Class Y | 3,798 | 5,447 | 13,212 | |||||||||
| Reports to Shareholders, Class Z | — | — | 9,452 | |||||||||
| Reports to Shareholders, Institutional Class | 6,136 | 5,087 | 5,374 | |||||||||
| Shareholder servicing fees, Class Z | — | — | 463,099 | |||||||||
| Distribution expenses, Class A | 26,519 | 193,100 | 199,520 | |||||||||
| Distribution and shareholder servicing expenses, Class C | 75,359 | 11,437 | 38,821 | |||||||||
| Distribution and shareholder servicing expenses, Class S | — | — | 738,319 | |||||||||
| Trustee fees | 14,317 | 14,317 | 14,317 | |||||||||
| Other expenses | 36,407 | 77,261 | 70,544 | |||||||||
| Total Expenses | 2,200,541 | 1,671,770 | 6,096,336 | |||||||||
| Fees waived and/or reimbursed by the Advisor and/or Affiliates(A) | (109,412 | ) | (373,199 | ) | (677,631 | ) | ||||||
| Net Expenses | 2,091,129 | 1,298,571 | 5,418,705 | |||||||||
| Net Investment Income | 4,044,964 | 155,956 | 18,493,227 | |||||||||
| Realized and Unrealized Gains (Losses) on Investments | ||||||||||||
| Net realized gains on investments(B) | 41,366,895 | 10,452,409 | 598,202 | |||||||||
| Net change in unrealized appreciation (depreciation) on investments(C) | (23,925,456 | ) | (4,802,433 | ) | (4,248,211 | ) | ||||||
| Net Realized and Unrealized Gains (Losses) on Investments | 17,441,439 | 5,649,976 | (3,650,009 | ) | ||||||||
| Change in Net Assets Resulting from Operations | $ | 21,486,403 | $ | 5,805,932 | $ | 14,843,218 | ||||||
(A) See Note 4 in Notes to Financial Statements.
(B) For the year ended September 30, 2018, the Small Cap Fund had redemptions-in-kind of securities in the amount of $6,287,326. Net realized gains (losses) on investments includes the realized gain on the transaction of $2,633,832, which will not be recognized as a realized gain by the Fund for tax purposes. For the year ended September 30, 2018, the Small Cap Value Fund had redemptions-in-kind of securities in the amount of $375,935. Net realized gains (losses) on investments includes the realized gain on the transaction of $188,915, which will not be recognized as a realized gain by the Fund for tax purposes.
(C) Change in unrealized appreciation (depreciation) does not include net appreciation of $7,807,725 for the Touchstone Small Cap Value Fund and $1,842,713 for the Touchstone Ultra Short Duration Fixed Income Fund in connection with the Funds' mergers. See Note 9 in the Notes to Financial Statements.
See accompanying Notes to Financial Statements.
| 118 |
This page intentionally left blank.
Statements of Changes in Net Assets
| Touchstone | Touchstone | |||||||||||||||
| Active Bond | Arbitrage | |||||||||||||||
| Fund | Fund | |||||||||||||||
| For the | For the | For the | For the | |||||||||||||
| Year Ended | Year Ended | Year Ended | Year Ended | |||||||||||||
| September 30, | September 30, | September 30, | September 30, | |||||||||||||
| 2018 | 2017 | 2018 | 2017 | |||||||||||||
| From Operations | ||||||||||||||||
| Net investment income (loss) | $ | 9,030,575 | $ | 2,803,969 | $ | 521,072 | $ | (1,865,799 | ) | |||||||
| Net realized gains (losses) on investments, forward foreign currency contracts, foreign currency transactions, futures contracts, written options and securities sold short | (2,400,191 | ) | 272,649 | (1,027,248 | ) | 8,649,280 | ||||||||||
| Net change in unrealized appreciation (depreciation) on investments, forward foreign currency contracts, foreign currency transactions, written options and securities sold short | (13,484,165 | ) | (1,681,396 | ) | (1,774,785 | ) | (2,212,948 | ) | ||||||||
| Change in Net Assets from Operations | (6,853,781 | ) | 1,395,222 | (2,280,961 | ) | 4,570,533 | ||||||||||
| Distributions to Shareholders from(A): | ||||||||||||||||
| Distributed earnings, Class A | (3,641,000 | ) | — | (294,311 | ) | — | ||||||||||
| Distributed earnings, Class C | (542,157 | ) | — | (371,498 | ) | — | ||||||||||
| Distributed earnings, Class Y | (5,004,643 | ) | — | (7,406,684 | ) | — | ||||||||||
| Distributed earnings, Institutional Class | (861,132 | ) | — | (1,334,179 | ) | — | ||||||||||
| Net investment income, Class A | — | (567,055 | ) | — | — | |||||||||||
| Net investment income, Class C | — | (101,877 | ) | — | — | |||||||||||
| Net investment income, Class Y | — | (1,896,650 | ) | — | — | |||||||||||
| Net investment income, Institutional Class | — | (319,492 | ) | — | — | |||||||||||
| Net realized gains, Class A | — | — | — | (267,450 | ) | |||||||||||
| Net realized gains, Class C | — | — | — | (260,994 | ) | |||||||||||
| Net realized gains, Class Y | — | — | — | (3,766,286 | ) | |||||||||||
| Net realized gains, Institutional Class | — | — | — | (393,447 | ) | |||||||||||
| Total Distributions | (10,048,932 | ) | (2,885,074 | ) | (9,406,672 | ) | (4,688,177 | ) | ||||||||
| — | ||||||||||||||||
| Net Increase (Decrease) from Share Transactions(B) | 251,238,639 | 13,473,288 | (22,146,627 | ) | 87,940,770 | |||||||||||
| — | ||||||||||||||||
| Total Increase (Decrease) in Net Assets | 234,335,926 | 11,983,436 | (33,834,260 | ) | 87,823,126 | |||||||||||
| — | ||||||||||||||||
| Net Assets | ||||||||||||||||
| Beginning of period | 127,206,071 | 115,222,635 | 241,331,706 | 153,508,580 | ||||||||||||
| End of period | $ | 361,541,997 | $ | 127,206,071 | $ | 207,497,446 | $ | 241,331,706 | ||||||||
| Undistributed (Distributions in excess of) Net Investment Income(A) | N/A | $ | 100,863 | N/A | $ | (249,346 | ) | |||||||||
(A) The presentation of Distributions to Shareholders and Undistributed (Distributions in excess of) Net Investment Income have been updated to reflect the changes prescribed in amendments to Regulation S-X, effective November 5, 2018. The September 30, 2017 presentation was not impacted.
(B) For details on share transactions by class, see Statements of Changes in Net Assets - Capital Stock Activity in pages 126-128.
See accompanying Notes to Financial Statements.
| 120 |
Statements of Changes in Net Assets (Continued)
| Touchstone | Touchstone | Touchstone | ||||||||||||||||||||
| Emerging Markets | High Yield | Impact Bond | ||||||||||||||||||||
| Small Cap Fund | Fund | Fund | ||||||||||||||||||||
| For the | For the | For the | For the | For the | For the | |||||||||||||||||
| Year Ended | Year Ended | Year Ended | Year Ended | Year Ended | Year Ended | |||||||||||||||||
| September 30, | September 30, | September 30, | September 30, | September 30, | September 30, | |||||||||||||||||
| 2018 | 2017 | 2018 | 2017 | 2018 | 2017 | |||||||||||||||||
| $ | 95,282 | $ | 165,389 | $ | 9,934,934 | $ | 11,322,599 | $ | 7,232,570 | $ | 5,372,324 | |||||||||||
| 555,189 | 1,620,183 | 1,133,608 | 5,678,503 | (962,215 | ) | (148,821 | ) | |||||||||||||||
| (1,742,998 | ) | 480,130 | (8,165,563 | ) | 863,209 | (8,630,367 | ) | (4,095,482 | ) | |||||||||||||
| (1,092,527 | ) | 2,265,702 | 2,902,979 | 17,864,311 | (2,360,012 | ) | 1,128,021 | |||||||||||||||
| (16,502 | ) | — | (701,103 | ) | — | (143,763 | ) | — | ||||||||||||||
| (731 | ) | — | (457,871 | ) | — | (23,628 | ) | — | ||||||||||||||
| (75,393 | ) | — | (3,234,209 | ) | — | (1,332,999 | ) | — | ||||||||||||||
| (11,410 | ) | — | (5,852,513 | ) | — | (6,579,253 | ) | — | ||||||||||||||
| — | — | — | (875,914 | ) | — | (181,518 | ) | |||||||||||||||
| — | — | — | (552,993 | ) | — | (40,739 | ) | |||||||||||||||
| — | — | — | (4,073,517 | ) | — | (1,072,822 | ) | |||||||||||||||
| — | — | — | (5,613,771 | ) | — | (5,520,397 | ) | |||||||||||||||
| — | — | — | — | — | — | |||||||||||||||||
| — | — | — | — | — | — | |||||||||||||||||
| — | — | — | — | — | — | |||||||||||||||||
| — | — | — | — | — | — | |||||||||||||||||
| (104,036 | ) | — | (10,245,696 | ) | (11,116,195 | ) | (8,079,643 | ) | (6,815,476 | ) | ||||||||||||
| (3,695,396 | ) | 2,586,750 | (12,957,752 | ) | (5,232,555 | ) | (2,917,352 | ) | 45,002,768 | |||||||||||||
| (4,891,959 | ) | 4,852,452 | (20,300,469 | ) | 1,515,561 | (13,357,007 | ) | 39,315,313 | ||||||||||||||
| 13,604,097 | 8,751,645 | 217,888,670 | 216,373,109 | 266,259,186 | 226,943,873 | |||||||||||||||||
| $ | 8,712,138 | $ | 13,604,097 | $ | 197,588,201 | $ | 217,888,670 | $ | 252,902,179 | $ | 266,259,186 | |||||||||||
| N/A | $ | 38,936 | N/A | $ | 484,289 | N/A | $ | 74,296 | ||||||||||||||
| 121 |
Statements of Changes in Net Assets (Continued)
| Touchstone | Touchstone | |||||||||||||||
| Merger Arbitrage | Mid Cap | |||||||||||||||
| Fund | Fund | |||||||||||||||
| For the | For the | For the | For the | |||||||||||||
| Year Ended | Year Ended | Year Ended | Year Ended | |||||||||||||
| September 30, | September 30, | September 30, | September 30, | |||||||||||||
| 2018 | 2017 | 2018 | 2017 | |||||||||||||
| From Operations | ||||||||||||||||
| Net investment income (loss) | $ | (287,693 | ) | $ | (1,613,506 | ) | $ | 1,863,060 | $ | 519,789 | ||||||
| Net realized gains (losses) on investments, forward foreign currency contracts, foreign currency transactions, written options and securities sold short | (330,132 | ) | 10,283,869 | 100,593,876 | 28,922,903 | |||||||||||
| Net change in unrealized appreciation (depreciation) on investments, forward foreign currency contracts, foreign currency transactions, written options and securities sold short | (833,465 | ) | (2,312,301 | ) | 22,111,241 | 92,701,133 | ||||||||||
| Change in Net Assets from Operations | (1,451,290 | ) | 6,358,062 | 124,568,177 | 122,143,825 | |||||||||||
| Distributions to Shareholders from(A): | ||||||||||||||||
| Distributed earnings, Class A | (683,179 | ) | — | (332,156 | ) | — | ||||||||||
| Distributed earnings, Class C | (605,164 | ) | — | (594,785 | ) | — | ||||||||||
| Distributed earnings, Class Y | (4,909,189 | ) | — | (6,566,737 | ) | — | ||||||||||
| Distributed earnings, Class Z | — | — | (194,569 | ) | — | |||||||||||
| Distributed earnings, Institutional Class | (3,416,906 | ) | — | (1,395,718 | ) | — | ||||||||||
| Net investment income, Class A | — | — | — | (156,233 | ) | |||||||||||
| Net investment income, Class C | — | — | — | — | ||||||||||||
| Net investment income, Class Y | — | — | — | (2,919,041 | ) | |||||||||||
| Net investment income, Class Z | — | — | — | (49,552 | ) | |||||||||||
| Net investment income, Institutional Class | — | — | — | (569,047 | ) | |||||||||||
| Net realized gains, Class A | — | (431,396 | ) | — | — | |||||||||||
| Net realized gains, Class C | — | (416,865 | ) | — | — | |||||||||||
| Net realized gains, Class Y | — | (2,373,169 | ) | — | — | |||||||||||
| Net realized gains, Class Z | — | — | — | — | ||||||||||||
| Net realized gains, Institutional Class | — | (2,024,092 | ) | — | — | |||||||||||
| Total Distributions | (9,614,438 | ) | (5,245,522 | ) | (9,083,965 | ) | (3,693,873 | ) | ||||||||
| Net Increase (Decrease) from Share Transactions(B) | (64,021,165 | ) | 20,805,545 | 62,983,199 | (27,506,901 | ) | ||||||||||
| Total Increase (Decrease) in Net Assets | (75,086,893 | ) | 21,918,085 | 178,467,411 | 90,943,051 | |||||||||||
| Net Assets | ||||||||||||||||
| Beginning of period | 214,679,923 | 192,761,838 | 776,958,074 | 686,015,023 | ||||||||||||
| End of period | $ | 139,593,030 | $ | 214,679,923 | $ | 955,425,485 | $ | 776,958,074 | ||||||||
| Undistributed (Distributions in excess of) Net Investment Income(A) | N/A | $ | (297,174 | ) | N/A | $ | 477,776 | |||||||||
(A) The presentation of Distributions to Shareholders and Undistributed (Distributions in excess of) Net Investment Income have been updated to reflect the changes prescribed in amendments to Regulation S-X, effective November 5, 2018. The September 30, 2017 presentation was not impacted.
(B) For details on share transactions by class, see Statements of Changes in Net Assets - Capital Stock Activity on pages 128-130.
See accompanying Notes to Financial Statements.
| 122 |
Statements of Changes in Net Assets (Continued)
| Touchstone | ||||||||||||||||||||||
| Touchstone | Touchstone | Sands Capital | ||||||||||||||||||||
| Mid Cap | Premium Yield | Select Growth | ||||||||||||||||||||
| Value Fund | Equity Fund | Fund | ||||||||||||||||||||
| For the | For the | For the | For the | For the | For the | |||||||||||||||||
| Year Ended | Year Ended | Year Ended | Year Ended | Year Ended | Year Ended | |||||||||||||||||
| September 30, | September 30, | September 30, | September 30, | September 30, | September 30, | |||||||||||||||||
| 2018 | 2017 | 2018 | 2017 | 2018 | 2017 | |||||||||||||||||
| $ | 4,721,977 | $ | 2,845,547 | $ | 2,401,807 | $ | 3,684,198 | $ | (27,899,779 | ) | $ | (20,690,299 | ) | |||||||||
| 30,401,221 | 39,280,159 | 9,382,625 | 5,512,271 | 546,189,592 | 603,132,169 | |||||||||||||||||
| (12,687,339 | ) | 39,673,618 | (4,923,095 | ) | 3,897,864 | 192,041,727 | (168,487,741 | ) | ||||||||||||||
| 22,435,859 | 81,799,324 | 6,861,337 | 13,094,333 | 710,331,540 | 413,954,129 | |||||||||||||||||
| (1,229,816 | ) | — | (908,417 | ) | — | (17,654,139 | ) | — | ||||||||||||||
| (661,135 | ) | — | (758,918 | ) | — | (15,225,601 | ) | — | ||||||||||||||
| (21,528,565 | ) | — | (3,370,481 | ) | — | (335,076,764 | ) | — | ||||||||||||||
| — | — | — | — | (108,517,175 | ) | — | ||||||||||||||||
| (23,445,172 | ) | — | — | — | — | — | ||||||||||||||||
| — | (31,801 | ) | — | (642,807 | ) | — | — | |||||||||||||||
| — | — | — | (462,088 | ) | — | — | ||||||||||||||||
| — | (1,318,968 | ) | — | (2,593,310 | ) | — | — | |||||||||||||||
| — | — | — | — | — | — | |||||||||||||||||
| — | (1,494,495 | ) | — | — | — | — | ||||||||||||||||
| — | (721,984 | ) | — | — | — | (15,772,640 | ) | |||||||||||||||
| — | (214,768 | ) | — | — | — | (13,604,302 | ) | |||||||||||||||
| — | (10,153,339 | ) | — | — | — | (243,534,116 | ) | |||||||||||||||
| — | — | — | — | — | (93,415,838 | ) | ||||||||||||||||
| — | (7,439,636 | ) | — | — | — | — | ||||||||||||||||
| (46,864,688 | ) | (21,374,991 | ) | (5,037,816 | ) | (3,698,205 | ) | (476,473,679 | ) | (366,326,896 | ) | |||||||||||
| 129,238,910 | 123,474,421 | (35,011,447 | ) | (41,225,090 | ) | (384,217,440 | ) | (789,883,325 | ) | |||||||||||||
| 104,810,081 | 183,898,754 | (33,187,926 | ) | (31,828,962 | ) | (150,359,579 | ) | (742,256,092 | ) | |||||||||||||
| 688,820,781 | 504,922,027 | 120,812,196 | 152,641,158 | 2,495,781,513 | 3,238,037,605 | |||||||||||||||||
| $ | 793,630,862 | $ | 688,820,781 | $ | 87,624,270 | $ | 120,812,196 | $ | 2,345,421,934 | $ | 2,495,781,513 | |||||||||||
| N/A | $ | 186,621 | N/A | $ | 282,429 | N/A | $ | (12,169,854 | ) | |||||||||||||
| 123 |
Statements of Changes in Net Assets (Continued)
| Touchstone | Touchstone | |||||||||||||||
| Small Cap | Small Cap | |||||||||||||||
| Fund | Value Fund | |||||||||||||||
| For the | For the | For the | For the | |||||||||||||
| Year Ended | Year Ended | Year Ended | Year Ended | |||||||||||||
| September 30, | September 30, | September 30, | September 30, | |||||||||||||
| 2018 | 2017 | 2018 | 2017 | |||||||||||||
| From Operations | ||||||||||||||||
| Net investment income | $ | 4,044,964 | $ | 1,214,590 | $ | 155,956 | $ | 118,428 | ||||||||
| Net realized gains (losses) on investments | 41,366,895 | 95,404,969 | 10,452,409 | 20,198,408 | ||||||||||||
| Net change in unrealized appreciation (depreciation) on investments | (23,925,456 | ) | (58,514,550 | ) | (4,802,433 | ) | 2,881,276 | |||||||||
| Change in Net Assets from Operations | 21,486,403 | 38,105,009 | 5,805,932 | 23,198,112 | ||||||||||||
| Distributions to Shareholders from(A): | ||||||||||||||||
| Distributed earnings, Class A | (2,203,403 | ) | — | (10,217 | ) | — | ||||||||||
| Distributed earnings, Class C | (1,605,340 | ) | — | — | — | |||||||||||
| Distributed earnings, Class S | — | — | — | — | ||||||||||||
| Distributed earnings, Class Y | (15,359,459 | ) | — | (35,142 | ) | — | ||||||||||
| Distributed earnings, Class Z | — | — | — | — | ||||||||||||
| Distributed earnings, Institutional Class | (20,034,179 | ) | — | (113,089 | ) | — | ||||||||||
| Net investment income, Class A | — | — | — | (125,781 | ) | |||||||||||
| Net investment income, Class C | — | — | — | — | ||||||||||||
| Net investment income, Class Y | — | (856,969 | ) | — | (6,170 | ) | ||||||||||
| Net investment income, Class Z | — | — | — | — | ||||||||||||
| Net investment income, Institutional Class | — | (996,101 | ) | — | (5,476 | ) | ||||||||||
| Total Distributions | (39,202,381 | ) | (1,853,070 | ) | (158,448 | ) | (137,427 | ) | ||||||||
| Net Increase (Decrease) from Share Transactions(B) | (52,546,314 | ) | (410,214,463 | ) | 60,933,338 | (112,703,097 | ) | |||||||||
| Total Increase (Decrease) in Net Assets | (70,262,292 | ) | (373,962,524 | ) | 66,580,822 | (89,642,412 | ) | |||||||||
| Net Assets | ||||||||||||||||
| Beginning of period | 229,556,923 | 603,519,447 | 88,634,727 | 178,277,139 | ||||||||||||
| End of period | $ | 159,294,631 | $ | 229,556,923 | $ | 155,215,549 | $ | 88,634,727 | ||||||||
| Undistributed (Distributions in excess of) Net Investment Income(A) | N/A | $ | 929,602 | N/A | $ | 18,138 | ||||||||||
(A) The presentation of Distributions to Shareholders and Undistributed (Distributions in excess of) Net Investment Income have been updated to reflect the changes prescribed in amendments to Regulation S-X, effective November 5, 2018. The September 30, 2017 presentation was not impacted.
(B) For details on share transactions by class, see Statements of Changes in Net Assets - Capital Stock Activity on page 131-132.
See accompanying Notes to Financial Statements.
| 124 |
Statements of Changes in Net Assets (Continued)
Touchstone Ultra Short Duration Fixed Income Fund | ||||||
| For the | For the | |||||
| Year Ended | Year Ended | |||||
| September 30, | September 30, | |||||
| 2018 | 2017 | |||||
| $ | 18,493,227 | $ | 10,092,521 | |||
| 598,202 | (1,954,477 | ) | ||||
| (4,248,211 | ) | 1,285,240 | ||||
| 14,843,218 | 9,423,284 | |||||
| (1,623,641 | ) | — | ||||
| (78,654 | ) | — | ||||
| (2,657,024 | ) | — | ||||
| (6,109,491 | ) | — | ||||
| (3,730,711 | ) | — | ||||
| (5,699,048 | ) | — | ||||
| — | (214,947 | ) | ||||
| — | (66,973 | ) | ||||
| — | (3,880,242 | ) | ||||
| — | (3,248,560 | ) | ||||
| — | (3,471,689 | ) | ||||
| (19,898,569 | ) | (10,882,411 | ) | |||
| 179,921,654 | 132,263,146 | |||||
| 174,866,303 | 130,804,019 | |||||
| 750,188,671 | 619,384,652 | |||||
| $ | 925,054,974 | $ | 750,188,671 | |||
| N/A | $ | 326,573 | ||||
| 125 |
Statements of Changes in Net Assets - Capital Stock Activity
| Touchstone Active Bond Fund | Touchstone Arbitrage Fund | |||||||||||||||||||||||||||||||
| For the Year | For the Year | For the Year | For the Year | |||||||||||||||||||||||||||||
| Ended | Ended | Ended | Ended | |||||||||||||||||||||||||||||
| September 30, 2018 | September 30, 2017 | September 30, 2018 | September 30, 2017 | |||||||||||||||||||||||||||||
| Shares | Dollars | Shares | Dollars | Shares | Dollars | Shares | Dollars | |||||||||||||||||||||||||
| Class A | ||||||||||||||||||||||||||||||||
| Proceeds from Shares issued | 1,141,735 | $ | 11,686,476 | 114,125 | $ | 1,187,727 | 157,263 | $ | 1,535,486 | 422,923 | $ | 4,310,951 | ||||||||||||||||||||
| Proceeds from Shares issued in connection with merger(A) | 15,009,511 | 156,501,270 | — | — | — | — | — | — | ||||||||||||||||||||||||
| Reinvestment of distributions | 293,114 | 2,978,894 | 47,971 | 498,530 | 29,857 | 289,907 | 26,086 | 264,509 | ||||||||||||||||||||||||
| Cost of Shares redeemed | (5,261,939 | ) | (53,817,258 | ) | (439,482 | ) | (4,579,262 | ) | (589,593 | ) | (5,789,139 | ) | (619,127 | ) | (6,319,297 | ) | ||||||||||||||||
| Change from Class A Share Transactions | 11,182,421 | 117,349,382 | (277,386 | ) | (2,893,005 | ) | (402,473 | ) | (3,963,746 | ) | (170,118 | ) | (1,743,837 | ) | ||||||||||||||||||
| Class C | ||||||||||||||||||||||||||||||||
| Proceeds from Shares issued | 100,130 | 955,908 | 9,487 | 91,456 | 76,397 | 730,119 | 334,745 | 3,344,957 | ||||||||||||||||||||||||
| Proceeds from Shares issued in connection with merger(A) | 2,962,276 | 28,556,721 | — | — | — | — | — | — | ||||||||||||||||||||||||
| Reinvestment of distributions | 50,602 | 474,990 | 7,547 | 72,561 | 38,807 | 365,175 | 25,833 | 256,269 | ||||||||||||||||||||||||
| Cost of Shares redeemed | (1,014,425 | ) | (9,561,928 | ) | (200,983 | ) | (1,934,055 | ) | (478,267 | ) | (4,505,024 | ) | (264,616 | ) | (2,633,313 | ) | ||||||||||||||||
| Change from Class C Share Transactions | 2,098,583 | 20,425,691 | (183,949 | ) | (1,770,038 | ) | (363,063 | ) | (3,409,730 | ) | 95,962 | 967,913 | ||||||||||||||||||||
| Class Y | ||||||||||||||||||||||||||||||||
| Proceeds from Shares issued | 6,143,950 | 62,689,353 | 3,351,078 | 34,955,912 | 6,079,845 | 60,092,915 | 9,308,258 | 95,788,312 | ||||||||||||||||||||||||
| Proceeds from Shares issued in connection with merger(A) | 12,700,690 | 132,356,634 | — | — | — | — | — | — | ||||||||||||||||||||||||
| Reinvestment of distributions | 412,120 | 4,187,060 | 107,675 | 1,119,483 | 752,994 | 7,401,931 | 367,566 | 3,760,202 | ||||||||||||||||||||||||
| Cost of Shares redeemed | (10,282,417 | ) | (105,020,575 | ) | (3,074,005 | ) | (31,929,928 | ) | (7,337,226 | ) | (72,711,339 | ) | (4,089,565 | ) | (42,024,784 | ) | ||||||||||||||||
| Change from Class Y Share Transactions | 8,974,343 | 94,212,472 | 384,748 | 4,145,467 | (504,387 | ) | (5,216,493 | ) | 5,586,259 | 57,523,730 | ||||||||||||||||||||||
| Institutional Class | ||||||||||||||||||||||||||||||||
| Proceeds from Shares issued | 3,666,094 | 37,270,158 | 1,735,083 | 18,084,313 | 4,504,279 | 44,710,464 | 3,879,650 | 39,938,927 | ||||||||||||||||||||||||
| Reinvestment of distributions | 38,079 | 385,395 | 5,878 | 61,316 | 128,112 | 1,265,742 | 35,266 | 361,834 | ||||||||||||||||||||||||
| Cost of Shares redeemed | (1,822,867 | ) | (18,404,459 | ) | (398,424 | ) | (4,154,765 | ) | (5,553,238 | ) | (55,532,864 | ) | (882,899 | ) | (9,107,797 | ) | ||||||||||||||||
| Change from Institutional Class Share Transactions | 1,881,306 | 19,251,094 | 1,342,537 | 13,990,864 | (920,847 | ) | (9,556,658 | ) | 3,032,017 | 31,192,964 | ||||||||||||||||||||||
| Change from Share Transactions | 24,136,653 | $ | 251,238,639 | 1,265,950 | $ | 13,473,288 | (2,190,770 | ) | $ | (22,146,627 | ) | 8,544,120 | $ | 87,940,770 | ||||||||||||||||||
(A) See Note 9 in the Notes to Financial Statements.
See accompanying Notes to Financial Statements.
| 126 |
Statements of Changes in Net Assets - Capital Stock Activity (Continued)
| Touchstone Emerging Markets Small Cap Fund | Touchstone High Yield Fund | |||||||||||||||||||||||||||||
| For the Year | For the Year | For the Year | For the Year | |||||||||||||||||||||||||||
| Ended | Ended | Ended | Ended | |||||||||||||||||||||||||||
| September 30, 2018 | September 30, 2017 | September 30, 2018 | September 30, 2017 | |||||||||||||||||||||||||||
| Shares | Dollars | Shares | Dollars | Shares | Dollars | Shares | Dollars | |||||||||||||||||||||||
| 55,963 | $ | 645,240 | 215,767 | $ | 2,024,110 | 826,207 | $ | 6,792,726 | 1,151,664 | $ | 9,567,953 | |||||||||||||||||||
| — | — | — | — | — | — | — | — | |||||||||||||||||||||||
| 1,419 | 16,444 | — | — | 74,913 | 614,938 | 85,856 | 710,212 | |||||||||||||||||||||||
| (187,079 | ) | (2,141,124 | ) | (205,112 | ) | (2,064,155 | ) | (1,375,365 | ) | (11,296,162 | ) | (1,786,930 | ) | (14,793,029 | ) | |||||||||||||||
| (129,697 | ) | (1,479,440 | ) | 10,655 | (40,045 | ) | (474,245 | ) | (3,888,498 | ) | (549,410 | ) | (4,514,864 | ) | ||||||||||||||||
| 14,453 | 162,887 | 12,887 | 124,473 | 75,920 | 625,636 | 145,109 | 1,182,888 | |||||||||||||||||||||||
| — | — | — | — | — | — | — | — | |||||||||||||||||||||||
| 64 | 731 | — | — | 47,178 | 386,396 | 55,043 | 454,327 | |||||||||||||||||||||||
| (17,965 | ) | (195,933 | ) | (30,291 | ) | (285,757 | ) | (506,081 | ) | (4,154,816 | ) | (649,501 | ) | (5,352,223 | ) | |||||||||||||||
| (3,448 | ) | (32,315 | ) | (17,404 | ) | (161,284 | ) | (382,983 | ) | (3,142,784 | ) | (449,349 | ) | (3,715,008 | ) | |||||||||||||||
| 144,644 | 1,615,406 | 512,686 | 4,967,925 | 2,362,661 | 19,915,704 | 3,105,249 | 26,380,378 | |||||||||||||||||||||||
| — | — | — | — | — | — | — | — | |||||||||||||||||||||||
| 6,488 | 75,393 | — | — | 350,079 | 2,953,500 | 293,819 | 2,502,707 | |||||||||||||||||||||||
| (293,259 | ) | (3,269,953 | ) | (225,475 | ) | (2,208,327 | ) | (3,757,037 | ) | (32,063,659 | ) | (4,853,969 | ) | (41,432,077 | ) | |||||||||||||||
| (142,127 | ) | (1,579,154 | ) | 287,211 | 2,759,598 | (1,044,297 | ) | (9,194,455 | ) | (1,454,901 | ) | (12,548,992 | ) | |||||||||||||||||
| 22,986 | 260,905 | 6,693 | 64,871 | 1,507,908 | 12,770,100 | 6,630,700 | 55,508,953 | |||||||||||||||||||||||
| 990 | 11,410 | — | — | 690,916 | 5,825,042 | 628,998 | 5,351,427 | |||||||||||||||||||||||
| (79,851 | ) | (876,802 | ) | (3,766 | ) | (36,390 | ) | (1,806,857 | ) | (15,327,157 | ) | (5,329,230 | ) | (45,314,071 | ) | |||||||||||||||
| (55,875 | ) | (604,487 | ) | 2,927 | 28,481 | 391,967 | 3,267,985 | 1,930,468 | 15,546,309 | |||||||||||||||||||||
| (331,147 | ) | $ | (3,695,396 | ) | 283,389 | $ | 2,586,750 | (1,509,558 | ) | $ | (12,957,752 | ) | (523,192 | ) | $ | (5,232,555 | ) | |||||||||||||
| 127 |
Statements of Changes in Net Assets - Capital Stock Activity (Continued)
| Touchstone Impact Bond Fund | Touchstone Merger Arbitrage Fund | |||||||||||||||||||||||||||||||
| For the Year | For the Year | For the Year | For the Year | |||||||||||||||||||||||||||||
| Ended | Ended | Ended | Ended | |||||||||||||||||||||||||||||
| September 30, 2018 | September 30, 2017 | September 30, 2018 | September 30, 2017 | |||||||||||||||||||||||||||||
| Shares | Dollars | Shares | Dollars | Shares | Dollars | Shares | Dollars | |||||||||||||||||||||||||
| Class A | ||||||||||||||||||||||||||||||||
| Proceeds from Shares issued | 246,995 | $ | 2,465,673 | 142,982 | $ | 1,446,473 | 173,769 | $ | 1,835,421 | 663,943 | $ | 7,189,677 | ||||||||||||||||||||
| Reinvestment of distributions | 11,860 | 117,638 | 10,803 | 109,086 | 59,992 | 620,923 | 35,099 | 378,369 | ||||||||||||||||||||||||
| Cost of Shares redeemed | (182,335 | ) | (1,810,911 | ) | (479,501 | ) | (4,837,636 | ) | (651,678 | ) | (6,848,992 | ) | (841,352 | ) | (9,106,640 | ) | ||||||||||||||||
| Change from Class A Share Transactions | 76,520 | 772,400 | (325,716 | ) | (3,282,077 | ) | (417,917 | ) | (4,392,648 | ) | (142,310 | ) | (1,538,594 | ) | ||||||||||||||||||
| Class C | ||||||||||||||||||||||||||||||||
| Proceeds from Shares issued | 12,328 | 121,899 | 21,651 | 218,960 | 64,682 | 641,014 | 28,884 | 302,799 | ||||||||||||||||||||||||
| Reinvestment of distributions | 1,609 | 15,969 | 2,929 | 29,526 | 61,563 | 605,164 | 40,213 | 416,206 | ||||||||||||||||||||||||
| Cost of Shares redeemed | (87,921 | ) | (875,805 | ) | (110,674 | ) | (1,113,559 | ) | (390,334 | ) | (3,836,510 | ) | (364,713 | ) | (3,810,386 | ) | ||||||||||||||||
| Change from Class C Share Transactions | (73,984 | ) | (737,937 | ) | (86,094 | ) | (865,073 | ) | (264,089 | ) | (2,590,332 | ) | (295,616 | ) | (3,091,381 | ) | ||||||||||||||||
| Class Y | ||||||||||||||||||||||||||||||||
| Proceeds from Shares issued | 2,902,795 | 28,899,416 | 1,523,187 | 15,441,533 | 4,426,954 | 46,912,456 | 3,101,270 | 34,159,735 | ||||||||||||||||||||||||
| Reinvestment of distributions | 127,091 | 1,260,431 | 86,872 | 878,381 | 464,113 | 4,877,823 | 216,908 | 2,364,301 | ||||||||||||||||||||||||
| Cost of Shares redeemed | (1,084,626 | ) | (10,748,769 | ) | (2,703,076 | ) | (27,107,007 | ) | (5,138,273 | ) | (54,204,048 | ) | (2,860,614 | ) | (31,743,547 | ) | ||||||||||||||||
| Change from Class Y Share Transactions | 1,945,260 | 19,411,078 | (1,093,017 | ) | (10,787,093 | ) | (247,206 | ) | (2,413,769 | ) | 457,564 | 4,780,489 | ||||||||||||||||||||
| Class Z | ||||||||||||||||||||||||||||||||
| Proceeds from Shares issued | — | — | — | — | — | — | — | — | ||||||||||||||||||||||||
| Reinvestment of distributions | — | — | — | — | — | — | — | — | ||||||||||||||||||||||||
| Cost of Shares redeemed | — | — | — | — | — | — | — | — | ||||||||||||||||||||||||
| Change from Class Z Share Transactions | — | — | — | — | — | — | — | — | ||||||||||||||||||||||||
| Institutional Class | ||||||||||||||||||||||||||||||||
| Proceeds from Shares issued | 7,061,877 | 70,368,762 | 10,005,361 | 101,401,166 | 1,385,667 | 14,782,971 | 4,238,661 | 46,907,941 | ||||||||||||||||||||||||
| Reinvestment of distributions | 554,957 | 5,517,228 | 501,136 | 5,066,898 | 299,282 | 3,163,412 | 164,732 | 1,803,811 | ||||||||||||||||||||||||
| Cost of Shares redeemed | (9,938,463 | ) | (98,248,883 | ) | (4,601,840 | ) | (46,531,053 | ) | (6,683,286 | ) | (72,570,799 | ) | (2,532,066 | ) | (28,056,721 | ) | ||||||||||||||||
| Change from Institutional Class Share Transactions | (2,321,629 | ) | (22,362,893 | ) | 5,904,657 | 59,937,011 | (4,998,337 | ) | (54,624,416 | ) | 1,871,327 | 20,655,031 | ||||||||||||||||||||
| Change from Share Transactions | (373,833 | ) | $ | (2,917,352 | ) | 4,399,830 | $ | 45,002,768 | (5,927,549 | ) | $ | (64,021,165 | ) | 1,890,965 | $ | 20,805,545 | ||||||||||||||||
See accompanying Notes to Financial Statements.
| 128 |
Statements of Changes in Net Assets - Capital Stock Activity (Continued)
| Touchstone Mid Cap Fund | Touchstone Mid Cap Value Fund | |||||||||||||||||||||||||||||
| For the Year | For the Year | For the Year | For the Year | |||||||||||||||||||||||||||
| Ended | Ended | Ended | Ended | |||||||||||||||||||||||||||
| September 30, 2018 | September 30, 2017 | September 30, 2018 | September 30, 2017 | |||||||||||||||||||||||||||
| Shares | Dollars | Shares | Dollars | Shares | Dollars | Shares | Dollars | |||||||||||||||||||||||
| 311,131 | $ | 10,462,160 | 310,383 | $ | 8,581,092 | 405,525 | $ | 7,739,321 | 701,153 | $ | 12,828,822 | |||||||||||||||||||
| 9,770 | 312,443 | 5,217 | 141,962 | 54,126 | 1,018,503 | 36,952 | 668,472 | |||||||||||||||||||||||
| (407,887 | ) | (13,602,980 | ) | (1,223,230 | ) | (33,868,799 | ) | (623,953 | ) | (11,796,723 | ) | (903,403 | ) | (16,632,912 | ) | |||||||||||||||
| (86,986 | ) | (2,828,377 | ) | (907,630 | ) | (25,145,745 | ) | (164,302 | ) | (3,038,899 | ) | (165,298 | ) | (3,135,618 | ) | |||||||||||||||
| 170,742 | 5,332,083 | 295,609 | 7,797,366 | 87,904 | 1,638,187 | 412,284 | 7,373,904 | |||||||||||||||||||||||
| 16,395 | 497,757 | — | — | 34,727 | 637,944 | 11,309 | 200,962 | |||||||||||||||||||||||
| (454,687 | ) | (14,201,427 | ) | (724,111 | ) | (19,243,359 | ) | (264,446 | ) | (4,826,498 | ) | (92,951 | ) | (1,692,148 | ) | |||||||||||||||
| (267,550 | ) | (8,371,587 | ) | (428,502 | ) | (11,445,993 | ) | (141,815 | ) | (2,550,367 | ) | 330,642 | 5,882,718 | |||||||||||||||||
| 7,134,097 | 240,495,397 | 6,812,111 | 193,127,657 | 5,764,255 | 109,669,627 | 8,004,954 | 148,753,892 | |||||||||||||||||||||||
| 177,867 | 5,749,414 | 75,256 | 2,062,953 | 1,094,842 | 20,691,929 | 615,344 | 11,210,752 | |||||||||||||||||||||||
| (5,074,801 | ) | (169,103,500 | ) | (7,194,091 | ) | (204,292,667 | ) | (5,521,058 | ) | (104,822,459 | ) | (8,685,917 | ) | (161,204,179 | ) | |||||||||||||||
| 2,237,163 | 77,141,311 | (306,724 | ) | (9,102,057 | ) | 1,338,039 | 25,539,097 | (65,619 | ) | (1,239,535 | ) | |||||||||||||||||||
| 123,533 | 4,065,438 | 248,309 | 6,933,230 | — | — | — | — | |||||||||||||||||||||||
| 6,115 | 194,402 | 1,828 | 49,486 | — | — | — | — | |||||||||||||||||||||||
| (178,047 | ) | (5,879,353 | ) | (348,521 | ) | (9,827,195 | ) | — | — | — | — | |||||||||||||||||||
| (48,399 | ) | (1,619,513 | ) | (98,384 | ) | (2,844,479 | ) | — | — | — | — | |||||||||||||||||||
| 609,808 | 20,603,298 | 1,881,647 | 53,915,231 | 10,029,485 | 190,380,045 | 10,402,481 | 194,155,853 | |||||||||||||||||||||||
| 23,603 | 764,136 | 11,814 | 324,185 | 953,577 | 18,105,162 | 322,849 | 5,927,128 | |||||||||||||||||||||||
| (674,827 | ) | (22,706,069 | ) | (1,168,557 | ) | (33,208,043 | ) | (5,241,757 | ) | (99,196,128 | ) | (4,173,196 | ) | (78,116,125 | ) | |||||||||||||||
| (41,416 | ) | (1,338,635 | ) | 724,904 | 21,031,373 | 5,741,305 | 109,289,079 | 6,552,134 | 121,966,856 | |||||||||||||||||||||
| 1,792,812 | $ | 62,983,199 | (1,016,336 | ) | $ | (27,506,901 | ) | 6,773,227 | $ | 129,238,910 | 6,651,859 | $ | 123,474,421 | |||||||||||||||||
| 129 |
Statements of Changes in Net Assets - Capital Stock Activity (Continued)
| Touchstone Premium Yield Equity Fund | Touchstone Sands Capital Select Growth Fund | |||||||||||||||||||||||||||||||
| For the Year | For the Year | For the Year | For the Year | |||||||||||||||||||||||||||||
| Ended | Ended | Ended | Ended | |||||||||||||||||||||||||||||
| September 30, 2018 | September 30, 2017 | September 30, 2018 | September 30, 2017 | |||||||||||||||||||||||||||||
| Shares | Dollars | Shares | Dollars | Shares | Dollars | Shares | Dollars | |||||||||||||||||||||||||
| Class A | �� | |||||||||||||||||||||||||||||||
| Proceeds from Shares issued | 446,195 | $ | 4,243,034 | 642,872 | $ | 5,805,412 | 1,530,095 | $ | 23,879,960 | 1,212,081 | $ | 17,814,655 | ||||||||||||||||||||
| Proceeds from Shares issued in connection with merger(A) | — | — | — | — | — | — | — | — | ||||||||||||||||||||||||
| Reinvestment of distributions | 83,641 | 791,031 | 51,326 | 458,763 | 901,203 | 12,454,611 | 917,286 | 12,007,271 | ||||||||||||||||||||||||
| Cost of Shares redeemed | (1,696,141 | ) | (16,147,858 | ) | (1,346,365 | ) | (12,078,014 | ) | (2,349,795 | ) | (37,622,638 | ) | (5,277,157 | ) | (77,763,400 | ) | ||||||||||||||||
| Change from Class A Share Transactions | (1,166,305 | ) | (11,113,793 | ) | (652,167 | ) | (5,813,839 | ) | 81,503 | (1,288,067 | ) | (3,147,790 | ) | (47,941,474 | ) | |||||||||||||||||
| Class C | ||||||||||||||||||||||||||||||||
| Proceeds from Shares issued | 54,166 | 514,218 | 141,970 | 1,264,192 | 410,822 | 5,810,983 | 361,269 | 4,654,639 | ||||||||||||||||||||||||
| Proceeds from Shares issued in connection with merger(A) | — | — | — | — | — | — | — | — | ||||||||||||||||||||||||
| Reinvestment of distributions | 73,917 | 697,634 | 46,771 | 417,141 | 1,021,594 | 12,974,235 | 848,904 | 10,466,987 | ||||||||||||||||||||||||
| Cost of Shares redeemed | (471,966 | ) | (4,499,368 | ) | (755,879 | ) | (6,756,321 | ) | (1,203,769 | ) | (17,702,423 | ) | (3,762,317 | ) | (52,025,885 | ) | ||||||||||||||||
| Change from Class C Share Transactions | (343,883 | ) | (3,287,516 | ) | (567,138 | ) | (5,074,988 | ) | 228,647 | 1,082,795 | (2,552,144 | ) | (36,904,259 | ) | ||||||||||||||||||
| Class Y | ||||||||||||||||||||||||||||||||
| Proceeds from Shares issued | 2,264,419 | 21,475,734 | 4,322,451 | 38,621,210 | 26,383,564 | 444,886,154 | 26,578,930 | 413,169,218 | ||||||||||||||||||||||||
| Proceeds from Shares issued in connection with merger(A) | — | — | — | — | — | — | — | — | ||||||||||||||||||||||||
| Reinvestment of distributions | 332,905 | 3,141,078 | 273,255 | 2,434,528 | 18,105,846 | 263,802,146 | 13,712,898 | 186,906,606 | ||||||||||||||||||||||||
| Cost of Shares redeemed | (4,795,212 | ) | (45,226,950 | ) | (7,945,883 | ) | (71,392,001 | ) | (64,116,112 | ) | (1,091,150,314 | ) | (69,920,725 | ) | (1,075,067,986 | ) | ||||||||||||||||
| Change from Class Y Share Transactions | (2,197,888 | ) | (20,610,138 | ) | (3,350,177 | ) | (30,336,263 | ) | (19,626,702 | ) | (382,462,014 | ) | (29,628,897 | ) | (474,992,162 | ) | ||||||||||||||||
| Class Z | ||||||||||||||||||||||||||||||||
| Proceeds from Shares issued | — | — | — | — | 4,730,701 | 77,342,660 | 2,878,806 | 42,519,038 | ||||||||||||||||||||||||
| Reinvestment of distributions | — | — | — | — | 7,798,859 | 107,858,220 | 7,085,965 | 92,826,102 | ||||||||||||||||||||||||
| Cost of Shares redeemed | — | — | — | — | (11,670,837 | ) | (186,751,034 | ) | (24,567,869 | ) | (365,390,570 | ) | ||||||||||||||||||||
| Change from Class Z Share Transactions | — | — | — | — | 858,723 | (1,550,154 | ) | (14,603,098 | ) | (230,045,430 | ) | |||||||||||||||||||||
| Institutional Class | ||||||||||||||||||||||||||||||||
| Proceeds from Shares issued | — | — | — | — | — | — | — | — | ||||||||||||||||||||||||
| Proceeds from Shares issued in connection with merger(A) | — | — | — | — | — | — | — | — | ||||||||||||||||||||||||
| Reinvestment of distributions | — | — | — | — | — | — | — | — | ||||||||||||||||||||||||
| Cost of Shares redeemed | — | — | — | — | — | — | — | — | ||||||||||||||||||||||||
| Change from Institutional Class Share Transactions | — | — | — | — | — | — | — | — | ||||||||||||||||||||||||
| Change from Share Transactions | (3,708,076 | ) | $ | (35,011,447 | ) | (4,569,482 | ) | $ | (41,225,090 | ) | (18,457,829 | ) | $ | (384,217,440 | ) | (49,931,929 | ) | $ | (789,883,325 | ) | ||||||||||||
(A)See Note 9 in the Notes to Financial Statements.
See accompanying Notes to Financial Statements.
| 130 |
Statements of Changes in Net Assets - Capital Stock Activity (Continued)
| Touchstone Small Cap Fund | Touchstone Small Cap Value Fund | |||||||||||||||||||||||||||||
| For the Year | For the Year | For the Year | For the Year | |||||||||||||||||||||||||||
| Ended | Ended | Ended | Ended | |||||||||||||||||||||||||||
| September 30, 2018 | September 30, 2017 | September 30, 2018 | September 30, 2017 | |||||||||||||||||||||||||||
| Shares | Dollars | Shares | Dollars | Shares | Dollars | Shares | Dollars | |||||||||||||||||||||||
| 91,315 | $ | 1,437,365 | 139,684 | $ | 2,397,730 | 430,771 | $ | 11,885,292 | 6,181,616 | $ | 151,720,611 | |||||||||||||||||||
| — | — | — | — | 72,932 | 2,071,440 | — | — | |||||||||||||||||||||||
| 136,257 | 2,061,771 | — | — | 353 | 9,467 | 4,698 | 117,711 | |||||||||||||||||||||||
| (429,220 | ) | (6,846,836 | ) | (1,773,199 | ) | (30,587,056 | ) | (475,661 | ) | (12,759,285 | ) | (9,997,487 | ) | (247,642,110 | ) | |||||||||||||||
| (201,648 | ) | (3,347,700 | ) | (1,633,515 | ) | (28,189,326 | ) | 28,395 | 1,206,914 | (3,811,173 | ) | (95,803,788 | ) | |||||||||||||||||
| 22,731 | 339,583 | 7,490 | 124,311 | 8,628 | 220,673 | 5,318 | 130,606 | |||||||||||||||||||||||
| — | — | — | — | 16,657 | 461,382 | — | — | |||||||||||||||||||||||
| 99,622 | 1,426,382 | — | — | — | — | — | — | |||||||||||||||||||||||
| (260,388 | ) | (3,947,706 | ) | (417,241 | ) | (6,781,423 | ) | (20,402 | ) | (544,363 | ) | (20,255 | ) | (492,379 | ) | |||||||||||||||
| (138,035 | ) | (2,181,741 | ) | (409,751 | ) | (6,657,112 | ) | 4,883 | 137,692 | (14,937 | ) | (361,773 | ) | |||||||||||||||||
| 743,774 | 12,307,802 | 1,799,187 | 30,786,320 | 36,388 | 973,923 | 38,975 | 970,075 | |||||||||||||||||||||||
| — | — | — | — | 1,429,509 | 40,693,020 | — | — | |||||||||||||||||||||||
| 924,185 | 14,180,457 | 46,428 | 813,579 | 1,058 | 28,836 | 168 | 4,219 | |||||||||||||||||||||||
| (3,290,472 | ) | (52,302,281 | ) | (15,062,183 | ) | (258,695,632 | ) | (95,731 | ) | (2,628,800 | ) | (69,439 | ) | (1,736,564 | ) | |||||||||||||||
| (1,622,513 | ) | (25,814,022 | ) | (13,216,568 | ) | (227,095,733 | ) | 1,371,224 | 39,066,979 | (30,296 | ) | (762,270 | ) | |||||||||||||||||
| — | — | — | — | — | — | — | — | |||||||||||||||||||||||
| — | — | — | — | — | — | — | — | |||||||||||||||||||||||
| — | — | — | — | — | — | — | — | |||||||||||||||||||||||
| — | — | — | — | — | — | — | — | |||||||||||||||||||||||
| 1,864,321 | 29,368,228 | 2,359,283 | 40,385,355 | 805,744 | 21,884,585 | 225,874 | 5,617,330 | |||||||||||||||||||||||
| — | — | — | — | 127,709 | 3,632,489 | — | — | |||||||||||||||||||||||
| 937,971 | 14,378,877 | 21,057 | 368,294 | 1,186 | 31,335 | 218 | 5,475 | |||||||||||||||||||||||
| (3,946,506 | ) | (64,949,956 | ) | (11,069,857 | ) | (189,025,941 | ) | (181,101 | ) | (5,026,656 | ) | (999,989 | ) | (21,398,071 | ) | |||||||||||||||
| (1,144,214 | ) | (21,202,851 | ) | (8,689,517 | ) | (148,272,292 | ) | 753,538 | 20,521,753 | (773,897 | ) | (15,775,266 | ) | |||||||||||||||||
| (3,106,410 | ) | $ | (52,546,314 | ) | (23,949,351 | ) | $ | (410,214,463 | ) | 2,158,040 | $ | 60,933,338 | (4,630,303 | ) | $ | (112,703,097 | ) | |||||||||||||
| 131 |
Statements of Changes in Net Assets - Capital Stock Activity (Continued)
| Touchstone Ultra Short Duration Fixed Income Fund | ||||||||||||||||
| For the Year | For the Year | |||||||||||||||
| Ended | Ended | |||||||||||||||
| September 30, 2018 | September 30, 2017 | |||||||||||||||
| Shares | Dollars | Shares | Dollars | |||||||||||||
| Class A | ||||||||||||||||
| Proceeds from Shares issued | 2,186,773 | $ | 20,262,081 | 1,661,765 | $ | 15,471,923 | ||||||||||
| Proceeds from Shares issued in connection with merger(A) | 8,852,517 | 82,262,174 | — | — | ||||||||||||
| Reinvestment of distributions | 157,558 | 1,458,905 | 20,548 | 191,248 | ||||||||||||
| Cost of Shares redeemed | (4,424,320 | ) | (40,986,668 | ) | (1,986,378 | ) | (18,488,192 | ) | ||||||||
| Change from Class A Share Transactions | 6,772,528 | 62,996,492 | (304,065 | ) | (2,825,021 | ) | ||||||||||
| Class C | ||||||||||||||||
| Proceeds from Shares issued | 140,726 | 1,304,964 | 218,081 | 2,030,199 | ||||||||||||
| Reinvestment of distributions | 6,609 | 61,233 | 5,052 | 47,032 | ||||||||||||
| Cost of Shares redeemed | (275,175 | ) | (2,550,464 | ) | (463,934 | ) | (4,319,053 | ) | ||||||||
| Change from Class C Share Transactions | (127,840 | ) | (1,184,267 | ) | (240,801 | ) | (2,241,822 | ) | ||||||||
| Class S | ||||||||||||||||
| Proceeds from Shares issued | 3,243,115 | 30,015,459 | — | — | ||||||||||||
| Proceeds from Shares issued in connection with merger(A) | 18,778,658 | 174,475,987 | — | — | ||||||||||||
| Reinvestment of distributions | 278,023 | 2,573,997 | — | — | ||||||||||||
| Cost of Shares redeemed | (6,950,386 | ) | (64,347,591 | ) | — | — | ||||||||||
| Change from Class S Share Transactions | 15,349,410 | 142,717,852 | — | — | ||||||||||||
| Class Y | ||||||||||||||||
| Proceeds from Shares issued | 15,184,845 | 140,672,822 | 16,443,475 | 153,020,422 | ||||||||||||
| Proceeds from Shares issued in connection with merger(A) | 1,675,485 | 15,567,307 | — | — | ||||||||||||
| Reinvestment of distributions | 467,260 | 4,327,179 | 239,815 | 2,231,627 | ||||||||||||
| Cost of Shares redeemed | (16,990,466 | ) | (157,357,424 | ) | (10,766,225 | ) | (100,223,831 | ) | ||||||||
| Change from Class Y Share Transactions | 337,124 | 3,209,884 | 5,917,065 | 55,028,218 | ||||||||||||
| Class Z | ||||||||||||||||
| Proceeds from Shares issued | 6,536,969 | 60,562,276 | 8,854,432 | 82,424,899 | ||||||||||||
| Reinvestment of distributions | 388,685 | 3,600,301 | 340,928 | 3,172,968 | ||||||||||||
| Cost of Shares redeemed | (11,985,438 | ) | (111,031,474 | ) | (12,733,081 | ) | (118,534,540 | ) | ||||||||
| Change from Class Z Share Transactions | (5,059,784 | ) | (46,868,897 | ) | (3,537,721 | ) | (32,936,673 | ) | ||||||||
| Institutional Class | ||||||||||||||||
| Proceeds from Shares issued | 18,337,840 | 169,704,983 | 26,763,928 | 248,905,046 | ||||||||||||
| Reinvestment of distributions | 565,948 | 5,237,944 | 311,948 | 2,900,582 | ||||||||||||
| Cost of Shares redeemed | (16,833,220 | ) | (155,892,337 | ) | (14,682,093 | ) | (136,567,184 | ) | ||||||||
| Change from Institutional Class Share Transactions | 2,070,568 | 19,050,590 | 12,393,783 | 115,238,444 | ||||||||||||
| Change from Share Transactions | 19,342,006 | $ | 179,921,654 | 14,228,261 | $ | 132,263,146 | ||||||||||
(A)See Note 9 in the Notes to Financial Statements.
See accompanying Notes to Financial Statements.
| 132 |
| Touchstone Active Bond Fund—Class A |
| Selected Data for a Share Outstanding Throughout Each Period |
| Year Ended September 30, | ||||||||||||||||||||
| 2018 | 2017 | 2016 | 2015 | 2014 | ||||||||||||||||
| Net asset value at beginning of period | $ | 10.47 | $ | 10.59 | $ | 10.20 | $ | 10.45 | $ | 10.33 | ||||||||||
| Income (loss) from investment operations: | ||||||||||||||||||||
| Net investment income | 0.23 | 0.24 | 0.26 | 0.26 | 0.32 | |||||||||||||||
| Net realized and unrealized gains (losses) on investments | (0.43 | ) | (0.11 | ) | 0.43 | (0.23 | ) | 0.13 | ||||||||||||
| Total from investment operations | (0.20 | ) | 0.13 | 0.69 | 0.03 | 0.45 | ||||||||||||||
| Distributions from: | ||||||||||||||||||||
| Net investment income | (0.26 | ) | (0.25 | ) | (0.30 | ) | (0.28 | ) | (0.33 | ) | ||||||||||
| Realized capital gains | — | (A) | — | — | — | — | ||||||||||||||
| Total distributions | (0.26 | ) | (0.25 | ) | (0.30 | ) | (0.28 | ) | (0.33 | ) | ||||||||||
| Net asset value at end of period | $ | 10.01 | $ | 10.47 | $ | 10.59 | $ | 10.20 | $ | 10.45 | ||||||||||
| Total return(B) | (1.87 | %) | 1.26 | % | 6.90 | % | 0.24 | % | 4.41 | % | ||||||||||
| Ratios and supplemental data: | ||||||||||||||||||||
| Net assets at end of period (000's) | $ | 133,083 | $ | 22,117 | $ | 25,324 | $ | 29,135 | $ | 28,920 | ||||||||||
| Ratio to average net assets: | ||||||||||||||||||||
| Net expenses | 0.90 | % | 0.90 | % | 0.90 | % | 0.90 | % | 0.86 | % | ||||||||||
| Gross expenses | 0.97 | % | 1.18 | % | 1.19 | % | 1.19 | % | 1.28 | % | ||||||||||
| Net investment income | 2.34 | % | 2.33 | % | 2.52 | % | 2.50 | % | 2.99 | % | ||||||||||
| Portfolio turnover rate | 448 | %(C) | 496 | % | 590 | % | 349 | % | 281 | % | ||||||||||
| Touchstone Active Bond Fund—Class C |
| Selected Data for a Share Outstanding Throughout Each Period |
| Year Ended September 30, | ||||||||||||||||||||
| 2018 | 2017 | 2016 | 2015 | 2014 | ||||||||||||||||
| Net asset value at beginning of period | $ | 9.68 | $ | 9.82 | $ | 9.48 | $ | 9.73 | $ | 9.64 | ||||||||||
| Income (loss) from investment operations: | ||||||||||||||||||||
| Net investment income | 0.20 | 0.14 | 0.16 | 0.17 | 0.21 | |||||||||||||||
| Net realized and unrealized gains (losses) on investments | (0.46 | ) | (0.10 | ) | 0.41 | (0.21 | ) | 0.14 | ||||||||||||
| Total from investment operations | (0.26 | ) | 0.04 | 0.57 | (0.04 | ) | 0.35 | |||||||||||||
| Distributions from: | ||||||||||||||||||||
| Net investment income | (0.19 | ) | (0.18 | ) | (0.23 | ) | (0.21 | ) | (0.26 | ) | ||||||||||
| Realized capital gains | — | (A) | — | — | — | — | ||||||||||||||
| Total distributions | (0.19 | ) | (0.18 | ) | (0.23 | ) | (0.21 | ) | (0.26 | ) | ||||||||||
| Net asset value at end of period | $ | 9.23 | $ | 9.68 | $ | 9.82 | $ | 9.48 | $ | 9.73 | ||||||||||
| Total return(B) | (2.64 | %) | 0.52 | % | 6.03 | % | (0.47 | %) | 3.65 | % | ||||||||||
| Ratios and supplemental data: | ||||||||||||||||||||
| Net assets at end of period (000's) | $ | 23,807 | $ | 4,642 | $ | 6,513 | $ | 6,946 | $ | 8,725 | ||||||||||
| Ratio to average net assets: | ||||||||||||||||||||
| Net expenses | 1.65 | % | 1.65 | % | 1.65 | % | 1.65 | % | 1.61 | % | ||||||||||
| Gross expenses | 1.79 | % | 2.18 | % | 2.09 | % | 2.06 | % | 2.15 | % | ||||||||||
| Net investment income | 1.59 | % | 1.58 | % | 1.77 | % | 1.75 | % | 2.24 | % | ||||||||||
| Portfolio turnover rate | 448 | %(C) | 496 | % | 590 | % | 349 | % | 281 | % | ||||||||||
| (A) | Less than $0.005 per share. |
| (B) | Total returns shown exclude the effect of applicable sales loads and fees. If these charges were included, the returns would be lower. |
| (C) | Portfolio turnover excludes the purchases and sales of securities by the Sentinel Government Securities Fund and Sentinel Total Return Bond Fund acquired on October 27, 2017 (See Note 9 in the Notes to Financial Statements). If these transactions were included, portfolio turnover would have been higher. |
See accompanying Notes to Financial Statements.
| 133 |
Financial Highlights (Continued)
| Touchstone Active Bond Fund—Class Y |
| Selected Data for a Share Outstanding Throughout Each Period |
| Year Ended September 30, | ||||||||||||||||||||
| 2018 | 2017 | 2016 | 2015 | 2014 | ||||||||||||||||
| Net asset value at beginning of period | $ | 10.46 | $ | 10.59 | $ | 10.20 | $ | 10.45 | $ | 10.32 | ||||||||||
| Income (loss) from investment operations: | ||||||||||||||||||||
| Net investment income | 0.26 | 0.27 | 0.29 | 0.29 | 0.34 | |||||||||||||||
| Net realized and unrealized gains (losses) on investments | (0.43 | ) | (0.12 | ) | 0.43 | (0.24 | ) | 0.15 | ||||||||||||
| Total from investment operations | (0.17 | ) | 0.15 | 0.72 | 0.05 | 0.49 | ||||||||||||||
| Distributions from: | ||||||||||||||||||||
| Net investment income | (0.29 | ) | (0.28 | ) | (0.33 | ) | (0.30 | ) | (0.36 | ) | ||||||||||
| Realized capital gains | — | (A) | — | — | — | — | ||||||||||||||
| Total distributions | (0.29 | ) | (0.28 | ) | (0.33 | ) | (0.30 | ) | (0.36 | ) | ||||||||||
| Net asset value at end of period | $ | 10.00 | $ | 10.46 | $ | 10.59 | $ | 10.20 | $ | 10.45 | ||||||||||
| Total return | (1.62 | %) | 1.43 | % | 7.18 | % | 0.49 | % | 4.78 | % | ||||||||||
| Ratios and supplemental data: | �� | |||||||||||||||||||
| Net assets at end of period (000's) | $ | 165,937 | $ | 79,648 | $ | 76,544 | $ | 57,394 | $ | 59,764 | ||||||||||
| Ratio to average net assets: | ||||||||||||||||||||
| Net expenses | 0.65 | % | 0.65 | % | 0.65 | % | 0.65 | % | 0.61 | % | ||||||||||
| Gross expenses | 0.70 | % | 0.86 | % | 0.90 | % | 0.91 | % | 0.95 | % | ||||||||||
| Net investment income | 2.59 | % | 2.58 | % | 2.77 | % | 2.75 | % | 3.24 | % | ||||||||||
| Portfolio turnover rate | 448 | %(B) | 496 | % | 590 | % | 349 | % | 281 | % | ||||||||||
| Touchstone Active Bond Fund—Institutional Class |
| Selected Data for a Share Outstanding Throughout Each Period |
| Year Ended September 30, | ||||||||||||||||||||
| 2018 | 2017 | 2016 | 2015 | 2014 | ||||||||||||||||
| Net asset value at beginning of period | $ | 10.46 | $ | 10.58 | $ | 10.19 | $ | 10.44 | $ | 10.32 | ||||||||||
| Income (loss) from investment operations: | ||||||||||||||||||||
| Net investment income | 0.27 | 0.25 | 0.33 | 0.30 | 0.35 | |||||||||||||||
| Net realized and unrealized gains (losses) on investments | (0.43 | ) | (0.09 | ) | 0.40 | (0.24 | ) | 0.14 | ||||||||||||
| Total from investment operations | (0.16 | ) | 0.16 | 0.73 | 0.06 | 0.49 | ||||||||||||||
| Distributions from: | ||||||||||||||||||||
| Net investment income | (0.30 | ) | (0.28 | ) | (0.34 | ) | (0.31 | ) | (0.37 | ) | ||||||||||
| Realized capital gains | — | (A) | — | — | — | — | ||||||||||||||
| Total distributions | (0.30 | ) | (0.28 | ) | (0.34 | ) | (0.31 | ) | (0.37 | ) | ||||||||||
| Net asset value at end of period | $ | 10.00 | $ | 10.46 | $ | 10.58 | $ | 10.19 | $ | 10.44 | ||||||||||
| Total return | (1.54 | %) | 1.61 | % | 7.27 | % | 0.57 | % | 4.76 | % | ||||||||||
| Ratios and supplemental data: | ||||||||||||||||||||
| Net assets at end of period (000's) | $ | 38,715 | $ | 20,800 | $ | 6,841 | $ | 6,788 | $ | 7,393 | ||||||||||
| Ratio to average net assets: | ||||||||||||||||||||
| Net expenses | 0.57 | % | 0.57 | % | 0.57 | % | 0.57 | % | 0.53 | % | ||||||||||
| Gross expenses | 0.66 | % | 0.87 | % | 1.00 | % | 0.95 | % | 1.09 | % | ||||||||||
| Net investment income | 2.67 | % | 2.66 | % | 2.85 | % | 2.83 | % | 3.32 | % | ||||||||||
| Portfolio turnover rate | 448 | %(B) | 496 | % | 590 | % | 349 | % | 281 | % | ||||||||||
| (A) | Less than $0.005 per share. |
| (B) | Portfolio turnover excludes the purchases and sales of securities by the Sentinel Government Securities Fund and Sentinel Total Return Bond Fund acquired on October 27, 2017 (See Note 9 in the Notes to Financial Statements). If these transactions were included, portfolio turnover would have been higher. |
See accompanying Notes to Financial Statements.
| 134 |
Financial Highlights (Continued)
| Touchstone Arbitrage Fund—Class A |
| Selected Data for a Share Outstanding Throughout Each Period |
| Year Ended September 30, | ||||||||||||||||||||
| 2018 | 2017 | 2016 | 2015 | 2014(A) | ||||||||||||||||
| Net asset value at beginning of period | $ | 10.24 | $ | 10.31 | $ | 9.93 | $ | 9.87 | $ | 10.00 | ||||||||||
| Income (loss) from investment operations: | ||||||||||||||||||||
| Net investment loss(B) | (0.01 | ) | (0.12 | ) | (0.11 | ) | (0.08 | ) | (0.10 | ) | ||||||||||
| Net realized and unrealized gains (losses) on investments | (0.11 | ) | 0.34 | 0.66 | 0.16 | (0.03 | ) | |||||||||||||
| Total from investment operations | (0.12 | ) | 0.22 | 0.55 | 0.08 | (0.13 | ) | |||||||||||||
| Distributions from: | ||||||||||||||||||||
| Net investment income | — | — | (0.02 | ) | — | — | ||||||||||||||
| Realized capital gains | (0.44 | ) | (0.29 | ) | (0.15 | ) | (0.02 | ) | — | |||||||||||
| Total distributions | (0.44 | ) | (0.29 | ) | (0.17 | ) | (0.02 | ) | — | |||||||||||
| Net asset value at end of period | $ | 9.68 | $ | 10.24 | $ | 10.31 | $ | 9.93 | $ | 9.87 | ||||||||||
| Total return(C) | (1.18 | %) | 2.20 | % | 5.61 | % | 0.77 | % | (1.30 | %) | ||||||||||
| Ratios and supplemental data: | ||||||||||||||||||||
| Net assets at end of period (000's) | $ | 3,844 | $ | 8,186 | $ | 10,003 | $ | 20,672 | $ | 22,725 | ||||||||||
| Ratio to average net assets: | ||||||||||||||||||||
| Net expenses (including dividend and interest expense on securities sold short)(D) | 1.92 | % | 2.70 | % | 2.80 | % | 2.42 | % | 2.51 | % | ||||||||||
| Gross expenses (including dividend and interest expense on securities sold short)(E) | 2.25 | % | 2.91 | % | 3.03 | % | 2.44 | % | 2.51 | % | ||||||||||
| Net investment loss | (0.08 | %) | (1.20 | %) | (1.06 | %) | (0.83 | %) | (1.01 | %) | ||||||||||
| Portfolio turnover rate | 254 | % | 358 | % | 451 | % | 276 | % | 293 | % | ||||||||||
| (A) | Represents the period from commencement of operations (October 1, 2013) through September 30, 2014. |
| (B) | The net investment loss per share was based on average shares outstanding for the period. |
| (C) | Total returns shown exclude the effect of applicable sales loads and fees. If these charges were included, the returns would be lower. |
| (D) | The ratio of net expenses to average net assets excluding dividend and interest expense on securities sold short was 1.68%, 1.68%, 1.68%, 1.68% and 1.67% for the years ended September 30, 2018, 2017, 2016, 2015 and 2014, respectively. |
| (E) | The ratio of gross expenses to average net assets excluding dividend and interest expense on securities sold short was 2.01%, 1.89%, 1.91%, 1.70% and 1.67% for the years ended September 30, 2018, 2017, 2016, 2015 and 2014, respectively. |
See accompanying Notes to Financial Statements.
| 135 |
Financial Highlights (Continued)
| Touchstone Arbitrage Fund—Class C |
| Selected Data for a Share Outstanding Throughout Each Period |
| Year Ended September 30, | ||||||||||||||||||||
| 2018 | 2017 | 2016 | 2015 | 2014(A) | ||||||||||||||||
| Net asset value at beginning of period | $ | 9.95 | $ | 10.11 | $ | 9.80 | $ | 9.82 | $ | 10.00 | ||||||||||
| Income (loss) from investment operations: | ||||||||||||||||||||
| Net investments loss(B) | (0.08 | ) | (0.19 | ) | (0.18 | ) | (0.15 | ) | (0.17 | ) | ||||||||||
| Net realized and unrealized gains (losses) on investments | (0.11 | ) | 0.32 | 0.65 | 0.15 | (0.01 | ) | |||||||||||||
| Total from investment operations | (0.19 | ) | 0.13 | 0.47 | — | (0.18 | ) | |||||||||||||
| Distributions from: | ||||||||||||||||||||
| Net investment income | — | — | (0.01 | ) | — | — | ||||||||||||||
| Realized capital gains | (0.44 | ) | (0.29 | ) | (0.15 | ) | (0.02 | ) | — | |||||||||||
| Total distributions | (0.44 | ) | (0.29 | ) | (0.16 | ) | (0.02 | ) | — | |||||||||||
| Net asset value at end of period | $ | 9.32 | $ | 9.95 | $ | 10.11 | $ | 9.80 | $ | 9.82 | ||||||||||
| Total return(C) | (1.95 | %) | 1.33 | % | 4.81 | % | (0.05 | %) | (1.80 | %) | ||||||||||
| Ratios and supplemental data: | ||||||||||||||||||||
| Net assets at end of period (000's) | $ | 4,822 | $ | 8,762 | $ | 7,930 | $ | 8,694 | $ | 11,113 | ||||||||||
| Ratio to average net assets: | ||||||||||||||||||||
| Net expenses (including dividend and interest expense on securities sold short)(D) | 2.67 | % | 3.45 | % | 3.55 | % | 3.14 | % | 3.27 | % | ||||||||||
| Gross expenses (including dividend and interest expense on securities sold short)(E) | 2.85 | % | 3.60 | % | 3.62 | % | 3.14 | % | 3.29 | % | ||||||||||
| Net investment loss | (0.83 | %) | (1.95 | %) | (1.81 | %) | (1.55 | %) | (1.77 | %) | ||||||||||
| Portfolio turnover rate | 254 | % | 358 | % | 451 | % | 276 | % | 293 | % | ||||||||||
| (A) | Represents the period from commencement of operations (October 1, 2013) through September 30, 2014. |
| (B) | The net investment loss per share was based on average shares outstanding for the period. |
| (C) | Total returns shown exclude the effect of applicable sales loads and fees. If these charges were included, the returns would be lower. |
| (D) | The ratio of net expenses to average net assets excluding dividend and interest expense on securities sold short was 2.43%, 2.43%, 2.43%, 2.40% and 2.43% for the years ended September 30, 2018, 2017, 2016, 2015 and 2014, respectively. |
| (E) | The ratio of gross expenses to average net assets excluding dividend and interest expense on securities sold short was 2.61%, 2.58%, 2.50%, 2.40% and 2.45% for the years ended September 30, 2018, 2017, 2016, 2015 and 2014, respectively. |
See accompanying Notes to Financial Statements.
| 136 |
Financial Highlights (Continued)
| Touchstone Arbitrage Fund—Class Y |
| Selected Data for a Share Outstanding Throughout Each Period |
| Year Ended September 30, | ||||||||||||||||||||
| 2018 | 2017 | 2016 | 2015 | 2014(A) | ||||||||||||||||
| Net asset value at beginning of period | $ | 10.35 | $ | 10.40 | $ | 9.99 | $ | 9.91 | $ | 10.00 | ||||||||||
| Income (loss) from investment operations: | ||||||||||||||||||||
| Net investment income (loss)(B) | 0.02 | (0.09 | ) | (0.08 | ) | (0.05 | ) | (0.07 | ) | |||||||||||
| Net realized and unrealized gains (losses) on investments | (0.11 | ) | 0.33 | 0.67 | 0.15 | (0.02 | ) | |||||||||||||
| Total from investment operations | (0.09 | ) | 0.24 | 0.59 | 0.10 | (0.09 | ) | |||||||||||||
| Distributions from: | ||||||||||||||||||||
| Net investment income | — | — | (0.03 | ) | — | — | ||||||||||||||
| Realized capital gains | (0.44 | ) | (0.29 | ) | (0.15 | ) | (0.02 | ) | — | |||||||||||
| Total distributions | (0.44 | ) | (0.29 | ) | (0.18 | ) | (0.02 | ) | — | |||||||||||
| Net asset value at end of period | $ | 9.82 | $ | 10.35 | $ | 10.40 | $ | 9.99 | $ | 9.91 | ||||||||||
| Total return | (0.87 | %) | 2.38 | % | 6.00 | % | 0.97 | % | (0.90 | %) | ||||||||||
| Ratios and supplemental data: | ||||||||||||||||||||
| Net assets at end of period (000's) | $ | 164,946 | $ | 179,124 | $ | 121,794 | $ | 87,427 | $ | 117,589 | ||||||||||
| Ratio to average net assets: | ||||||||||||||||||||
| Net expenses (including dividend and interest expense on securities sold short)(C) | 1.60 | % | 2.39 | % | 2.51 | % | 2.10 | % | 2.19 | % | ||||||||||
| Gross expenses (including dividend and interest expense on securities sold short)(D) | 1.60 | % | 2.39 | % | 2.51 | % | 2.10 | % | 2.19 | % | ||||||||||
| Net investment income (loss) | 0.24 | % | (0.89 | %) | (0.77 | %) | (0.51 | %) | (0.69 | %) | ||||||||||
| Portfolio turnover rate | 254 | % | 358 | % | 451 | % | 276 | % | 293 | % | ||||||||||
| (A) | Represents the period from commencement of operations (October 1, 2013) through September 30, 2014. |
| (B) | The net investment income (loss) per share was based on average shares outstanding for the period. |
| (C) | The ratio of net expenses to average net assets excluding dividend and interest expense on securities sold short was 1.36%, 1.37%, 1.39%, 1.36% and 1.35% for the years ended September 30, 2018, 2017, 2016, 2015 and 2014, respectively. |
| (D) | The ratio of gross expenses to average net assets excluding dividend and interest expense on securities sold short was 1.36%, 1.37%, 1.39%, 1.36% and 1.35% for the years ended September 30, 2018, 2017, 2016, 2015 and 2014, respectively. |
See accompanying Notes to Financial Statements.
| 137 |
Financial Highlights (Continued)
| Touchstone Arbitrage Fund—Institutional Class |
| Selected Data for a Share Outstanding Throughout Each Period |
| Year Ended September 30, | ||||||||||||||||||||
| 2018 | 2017 | 2016 | 2015 | 2014(A) | ||||||||||||||||
| Net asset value at beginning of period | $ | 10.40 | $ | 10.43 | $ | 10.01 | $ | 9.92 | $ | 10.00 | ||||||||||
| Income (loss) from investment operations: | ||||||||||||||||||||
| Net investment income (loss)(B) | 0.03 | (0.08 | ) | (0.07 | ) | (0.04 | ) | (0.06 | ) | |||||||||||
| Net realized and unrealized gains (losses) on investments | (0.12 | ) | 0.34 | 0.68 | 0.15 | (0.02 | ) | |||||||||||||
| Total from investment operations | (0.09 | ) | 0.26 | 0.61 | 0.11 | (0.08 | ) | |||||||||||||
| Distributions from: | ||||||||||||||||||||
| Net investment income | — | — | (0.04 | ) | — | — | ||||||||||||||
| Realized capital gains | (0.44 | ) | (0.29 | ) | (0.15 | ) | (0.02 | ) | — | |||||||||||
| Total distributions | (0.44 | ) | (0.29 | ) | (0.19 | ) | (0.02 | ) | — | |||||||||||
| Net asset value at end of period | $ | 9.87 | $ | 10.40 | $ | 10.43 | $ | 10.01 | $ | 9.92 | ||||||||||
| Total return | (0.87 | %) | 2.57 | % | 6.12 | % | 1.06 | % | (0.80 | %) | ||||||||||
| Ratios and supplemental data: | ||||||||||||||||||||
| Net assets at end of period (000's) | $ | 33,886 | $ | 45,259 | $ | 13,782 | $ | 8,735 | $ | 47,763 | ||||||||||
| Ratio to average net assets: | ||||||||||||||||||||
| Net expenses (including dividend and interest expense on securities sold short)(C) | 1.52 | % | 2.30 | % | 2.40 | % | 2.02 | % | 2.12 | % | ||||||||||
| Gross expenses (including dividend and interest expense on securities sold short)(D) | 1.55 | % | 2.35 | % | 2.48 | % | 2.03 | % | 2.12 | % | ||||||||||
| Net investment income (loss) | 0.32 | % | (0.80 | %) | (0.66 | %) | (0.43 | %) | (0.62 | %) | ||||||||||
| Portfolio turnover rate | 254 | % | 358 | % | 451 | % | 276 | % | 293 | % | ||||||||||
| (A) | Represents the period from commencement of operations (October 1, 2013) through September 30, 2014. |
| (B) | The net investment income (loss) per share was based on average shares outstanding for the period. |
| (C) | The ratio of net expenses to average net assets excluding dividend and interest expense on securities sold short was 1.28%, 1.28%, 1.28%, 1.28% and 1.28% for the years ended September 30, 2018, 2017, 2016, 2015 and 2014, respectively. |
| (D) | The ratio of gross expenses to average net assets excluding dividend and interest expense on securities sold short was 1.31%, 1.33%, 1.36%, 1.29% and 1.28% for the years ended September 30, 2018, 2017, 2016, 2015 and 2014, respectively. |
See accompanying Notes to Financial Statements.
| 138 |
Financial Highlights (Continued)
| Touchstone Emerging Markets Small Cap Fund—Class A |
| Selected Data for a Share Outstanding Throughout Each Period |
| Year Ended September 30, | ||||||||||||||||||||
| 2018 | 2017 | 2016 | 2015 | 2014 | ||||||||||||||||
| Net asset value at beginning of period | $ | 11.08 | $ | 9.29 | $ | 9.15 | $ | 11.67 | $ | 11.52 | ||||||||||
| Income (loss) from investment operations: | ||||||||||||||||||||
| Net investment income (loss)(A) | 0.07 | 0.14 | (0.03 | ) | 0.07 | 0.09 | ||||||||||||||
| Net realized and unrealized gains (losses) on investments | (1.35 | ) | 1.65 | 0.87 | (2.53 | ) | 0.09 | |||||||||||||
| Total from investment operations | (1.28 | ) | 1.79 | 0.84 | (2.46 | ) | 0.18 | |||||||||||||
| Distributions from: | ||||||||||||||||||||
| Net investment income | (0.07 | ) | — | (0.70 | ) | (0.06 | ) | (0.03 | ) | |||||||||||
| Net asset value at end of period | $ | 9.73 | $ | 11.08 | $ | 9.29 | $ | 9.15 | $ | 11.67 | ||||||||||
| Total return(B) | (11.66 | %) | 19.27 | % | 10.01 | % | (21.18 | %) | 1.61 | % | ||||||||||
| Ratios and supplemental data: | ||||||||||||||||||||
| Net assets at end of period (000's) | $ | 1,329 | $ | 2,950 | $ | 2,376 | $ | 3,022 | $ | 5,307 | ||||||||||
| Ratio to average net assets: | ||||||||||||||||||||
| Net expenses | 1.69 | % | 1.69 | % | 1.69 | % | 1.69 | % | 1.69 | % | ||||||||||
| Gross expenses | 4.11 | % | 4.42 | % | 3.51 | % | 2.41 | % | 2.20 | % | ||||||||||
| Net investment income (loss) | 0.65 | % | 1.39 | % | (0.40 | %) | 0.66 | % | 0.75 | % | ||||||||||
| Portfolio turnover rate | 107 | % | 115 | % | 68 | % | 28 | % | 38 | % | ||||||||||
| Touchstone Emerging Markets Small Cap Fund—Class C |
| Selected Data for a Share Outstanding Throughout Each Period |
| Year Ended September 30, | ||||||||||||||||||||
| 2018 | 2017 | 2016 | 2015 | 2014 | ||||||||||||||||
| Net asset value at beginning of period | $ | 10.77 | $ | 9.10 | $ | 8.94 | $ | 11.43 | $ | 11.33 | ||||||||||
| Income (loss) from investment operations: | ||||||||||||||||||||
| Net investment income (loss)(A) | (0.01 | ) | 0.06 | (0.10 | ) | (0.01 | ) | (— | )(C) | |||||||||||
| Net realized and unrealized gains (losses) on investments | (1.31 | ) | 1.61 | 0.86 | (2.48 | ) | 0.10 | |||||||||||||
| Total from investment operations | (1.32 | ) | 1.67 | 0.76 | (2.49 | ) | 0.10 | |||||||||||||
| Distributions from: | ||||||||||||||||||||
| Net investment income | (0.01 | ) | — | (0.60 | ) | — | — | |||||||||||||
| Net asset value at end of period | $ | 9.44 | $ | 10.77 | $ | 9.10 | $ | 8.94 | $ | 11.43 | ||||||||||
| Total return(B) | (12.37 | %) | 18.46 | % | 9.18 | % | (21.79 | %) | 0.88 | % | ||||||||||
| Ratios and supplemental data: | ||||||||||||||||||||
| Net assets at end of period (000's) | $ | 749 | $ | 892 | $ | 912 | $ | 1,566 | $ | 2,874 | ||||||||||
| Ratio to average net assets: | ||||||||||||||||||||
| Net expenses | 2.44 | % | 2.44 | % | 2.44 | % | 2.44 | % | 2.44 | % | ||||||||||
| Gross expenses | 5.52 | % | 6.25 | % | 4.80 | % | 3.19 | % | 3.03 | % | ||||||||||
| Net investment income (loss) | (0.10 | %) | 0.64 | % | (1.15 | %) | (0.09 | %) | (0.00 | %)(C) | ||||||||||
| Portfolio turnover rate | 107 | % | 115 | % | 68 | % | 28 | % | 38 | % | ||||||||||
| (A) | The net investment income (loss) per share was based on average shares outstanding for the period. |
| (B) | Total returns shown exclude the effect of applicable sales loads and fees. If these charges were included, the returns would be lower. |
| (C) | Less than $0.005 per share or 0.005%. |
See accompanying Notes to Financial Statements.
| 139 |
Financial Highlights (Continued)
| Touchstone Emerging Markets Small Cap Fund—Class Y |
| Selected Data for a Share Outstanding Throughout Each Period |
| Year Ended September 30, | ||||||||||||||||||||
| 2018 | 2017 | 2016 | 2015 | 2014 | ||||||||||||||||
| Net asset value at beginning of period | $ | 11.14 | $ | 9.32 | $ | 9.10 | $ | 11.63 | $ | 11.54 | ||||||||||
| Income (loss) from investment operations: | ||||||||||||||||||||
| Net investment income (loss)(A) | 0.10 | 0.16 | (0.01 | ) | 0.10 | 0.12 | ||||||||||||||
| Net realized and unrealized gains (losses) on investments | (1.36 | ) | 1.66 | 0.88 | (2.52 | ) | 0.10 | |||||||||||||
| Total from investment operations | (1.26 | ) | 1.82 | 0.87 | (2.42 | ) | 0.22 | |||||||||||||
| Distributions from: | ||||||||||||||||||||
| Net investment income | (0.11 | ) | — | (0.65 | ) | (0.11 | ) | (0.13 | ) | |||||||||||
| Net asset value at end of period | $ | 9.77 | $ | 11.14 | $ | 9.32 | $ | 9.10 | $ | 11.63 | ||||||||||
| Total return | (11.50 | %) | 19.53 | % | 10.37 | % | (20.98 | %) | 1.99 | % | ||||||||||
| Ratios and supplemental data: | ||||||||||||||||||||
| Net assets at end of period (000's) | $ | 6,448 | $ | 8,931 | $ | 4,796 | $ | 70,066 | $ | 105,641 | ||||||||||
| Ratio to average net assets: | ||||||||||||||||||||
| Net expenses | 1.44 | % | 1.44 | % | 1.44 | % | 1.40 | % | 1.38 | % | ||||||||||
| Gross expenses | 2.97 | % | 3.56 | % | 2.27 | % | 1.40 | % | 1.38 | % | ||||||||||
| Net investment income (loss) | 0.90 | % | 1.64 | % | (0.15 | %) | 0.95 | % | 1.06 | % | ||||||||||
| Portfolio turnover rate | 107 | % | 115 | % | 68 | % | 28 | % | 38 | % | ||||||||||
| Touchstone Emerging Markets Small Cap Fund—Institutional Class |
| Selected Data for a Share Outstanding Throughout Each Period |
| Year Ended September 30, | ||||||||||||||||||||
| 2018 | 2017 | 2016 | 2015 | 2014 | ||||||||||||||||
| Net asset value at beginning of period | $ | 11.06 | $ | 9.24 | $ | 9.11 | $ | 11.64 | $ | 11.55 | ||||||||||
| Income (loss) from investment operations: | ||||||||||||||||||||
| Net investment income (loss)(A) | 0.12 | 0.17 | (— | )(B) | 0.12 | 0.13 | ||||||||||||||
| Net realized and unrealized gains (losses) on investments | (1.36 | ) | 1.65 | 0.88 | (2.53 | ) | 0.11 | |||||||||||||
| Total from investment operations | (1.24 | ) | 1.82 | 0.88 | (2.41 | ) | 0.24 | |||||||||||||
| Distributions from: | ||||||||||||||||||||
| Net investment income | (0.12 | ) | — | (0.75 | ) | (0.12 | ) | (0.15 | ) | |||||||||||
| Net asset value at end of period | $ | 9.70 | $ | 11.06 | $ | 9.24 | $ | 9.11 | $ | 11.64 | ||||||||||
| Total return | (11.37 | %) | 19.70 | % | 10.52 | % | (20.87 | %) | 2.13 | % | ||||||||||
| Ratios and supplemental data: | ||||||||||||||||||||
| Net assets at end of period (000's) | $ | 187 | $ | 831 | $ | 667 | $ | 184,841 | $ | 234,019 | ||||||||||
| Ratio to average net assets: | ||||||||||||||||||||
| Net expenses | 1.29 | % | 1.29 | % | 1.29 | % | 1.29 | % | 1.29 | % | ||||||||||
| Gross expenses | 4.80 | % | 5.62 | % | 2.16 | % | 1.33 | % | 1.31 | % | ||||||||||
| Net investment income (loss) | 1.05 | % | 1.79 | % | (0.00 | %)(B) | 1.06 | % | 1.15 | % | ||||||||||
| Portfolio turnover rate | 107 | % | 115 | % | 68 | % | 28 | % | 38 | % | ||||||||||
| (A) | The net investment income (loss) per share was based on average shares outstanding for the period. |
| (B) | Less than $0.005 per share or 0.005%. |
See accompanying Notes to Financial Statements.
| 140 |
Financial Highlights (Continued)
| Touchstone High Yield Fund—Class A |
| Selected Data for a Share Outstanding Throughout Each Period |
| Year Ended September 30, | ||||||||||||||||||||
| 2018 | 2017 | 2016 | 2015 | 2014 | ||||||||||||||||
| Net asset value at beginning of period | $ | 8.43 | $ | 8.21 | $ | 7.95 | $ | 8.91 | $ | 8.80 | ||||||||||
| Income (loss) from investment operations: | ||||||||||||||||||||
| Net investment income | 0.41 | 0.39 | 0.41 | 0.43 | 0.45 | |||||||||||||||
| Net realized and unrealized gains (losses) on investments | (0.31 | ) | 0.21 | 0.26 | (0.81 | ) | 0.12 | |||||||||||||
| Total from investment operations | 0.10 | 0.60 | 0.67 | (0.38 | ) | 0.57 | ||||||||||||||
| Distributions from: | ||||||||||||||||||||
| Net investment income | (0.41 | ) | (0.38 | ) | (0.41 | ) | (0.44 | ) | (0.46 | ) | ||||||||||
| Realized capital gains | — | — | — | (0.14 | ) | — | ||||||||||||||
| Total distributions | (0.41 | ) | (0.38 | ) | (0.41 | ) | (0.58 | ) | (0.46 | ) | ||||||||||
| Net asset value at end of period | $ | 8.12 | $ | 8.43 | $ | 8.21 | $ | 7.95 | $ | 8.91 | ||||||||||
| Total return(A) | 1.24 | % | 7.45 | % | 8.78 | % | (4.54 | %) | 6.54 | % | ||||||||||
| Ratios and supplemental data: | ||||||||||||||||||||
| Net assets at end of period (000's) | $ | 12,457 | $ | 16,925 | $ | 20,995 | $ | 26,797 | $ | 39,671 | ||||||||||
| Ratio to average net assets: | ||||||||||||||||||||
| Net expenses | 1.05 | % | 1.05 | % | 1.05 | % | 1.05 | % | 1.03 | % | ||||||||||
| Gross expenses | 1.29 | % | 1.24 | % | 1.23 | % | 1.15 | % | 1.14 | % | ||||||||||
| Net investment income | 4.76 | % | 4.63 | % | 5.19 | % | 4.92 | % | 4.95 | % | ||||||||||
| Portfolio turnover rate | 59 | % | 69 | % | 56 | % | 35 | % | 40 | % | ||||||||||
| Touchstone High Yield Fund—Class C |
| Selected Data for a Share Outstanding Throughout Each Period |
| Year Ended September 30, | ||||||||||||||||||||
| 2018 | 2017 | 2016 | 2015 | 2014 | ||||||||||||||||
| Net asset value at beginning of period | $ | 8.41 | $ | 8.19 | $ | 7.93 | $ | 8.90 | $ | 8.79 | ||||||||||
| Income (loss) from investment operations: | ||||||||||||||||||||
| Net investment income | 0.34 | 0.33 | 0.35 | 0.36 | 0.38 | |||||||||||||||
| Net realized and unrealized gains (losses) on investments | (0.30 | ) | 0.21 | 0.26 | (0.82 | ) | 0.12 | |||||||||||||
| Total from investment operations | 0.04 | 0.54 | 0.61 | (0.46 | ) | 0.50 | ||||||||||||||
| Distributions from: | ||||||||||||||||||||
| Net investment income | (0.35 | ) | (0.32 | ) | (0.35 | ) | (0.37 | ) | (0.39 | ) | ||||||||||
| Realized capital gains | — | — | — | (0.14 | ) | — | ||||||||||||||
| Total distributions | (0.35 | ) | (0.32 | ) | (0.35 | ) | (0.51 | ) | (0.39 | ) | ||||||||||
| Net asset value at end of period | $ | 8.10 | $ | 8.41 | $ | 8.19 | $ | 7.93 | $ | 8.90 | ||||||||||
| Total return(A) | 0.50 | % | 6.68 | % | 7.99 | % | (5.28 | %) | 5.64 | % | ||||||||||
| Ratios and supplemental data: | ||||||||||||||||||||
| Net assets at end of period (000's) | $ | 9,444 | $ | 13,025 | $ | 16,372 | $ | 24,755 | $ | 32,163 | ||||||||||
| Ratio to average net assets: | ||||||||||||||||||||
| Net expenses | 1.80 | % | 1.80 | % | 1.80 | % | 1.80 | % | 1.78 | % | ||||||||||
| Gross expenses | 2.00 | % | 1.97 | % | 1.94 | % | 1.87 | % | 1.86 | % | ||||||||||
| Net investment income | 4.01 | % | 3.88 | % | 4.44 | % | 4.17 | % | 4.21 | % | ||||||||||
| Portfolio turnover rate | 59 | % | 69 | % | 56 | % | 35 | % | 40 | % | ||||||||||
| (A) | Total returns shown exclude the effect of applicable sales loads and fees. If these charges were included, the returns would be lower. |
See accompanying Notes to Financial Statements
| 141 |
Financial Highlights (Continued)
| Touchstone High Yield Fund—Class Y |
| Selected Data for a Share Outstanding Throughout Each Period |
| Year Ended September 30, | ||||||||||||||||||||
| 2018 | 2017 | 2016 | 2015 | 2014 | ||||||||||||||||
| Net asset value at beginning of period | $ | 8.67 | $ | 8.44 | $ | 8.16 | $ | 9.14 | $ | 9.01 | ||||||||||
| Income (loss) from investment operations: | ||||||||||||||||||||
| Net investment income | 0.44 | 0.43 | 0.46 | 0.47 | 0.50 | |||||||||||||||
| Net realized and unrealized gains (losses) on investments | (0.32 | ) | 0.21 | 0.25 | (0.85 | ) | 0.12 | |||||||||||||
| Total from investment operations | 0.12 | 0.64 | 0.71 | (0.38 | ) | 0.62 | ||||||||||||||
| Distributions from: | ||||||||||||||||||||
| Net investment income | (0.44 | ) | (0.41 | ) | (0.43 | ) | (0.46 | ) | (0.49 | ) | ||||||||||
| Realized capital gains | — | — | — | (0.14 | ) | — | ||||||||||||||
| Total distributions | (0.44 | ) | (0.41 | ) | (0.43 | ) | (0.60 | ) | (0.49 | ) | ||||||||||
| Net asset value at end of period | $ | 8.35 | $ | 8.67 | $ | 8.44 | $ | 8.16 | $ | 9.14 | ||||||||||
| Total return | 1.44 | % | 7.74 | % | 9.11 | % | (4.42 | %) | 6.91 | % | ||||||||||
| Ratios and supplemental data: | ||||||||||||||||||||
| Net assets at end of period (000's) | $ | 63,983 | $ | 75,435 | $ | 85,739 | $ | 119,505 | $ | 166,071 | ||||||||||
| Ratio to average net assets: | ||||||||||||||||||||
| Net expenses | 0.80 | % | 0.80 | % | 0.80 | % | 0.80 | % | 0.74 | % | ||||||||||
| Gross expenses | 0.88 | % | 0.90 | % | 0.91 | % | 0.87 | % | 0.78 | % | ||||||||||
| Net investment income | 5.01 | % | 4.88 | % | 5.44 | % | 5.17 | % | 5.24 | % | ||||||||||
| Portfolio turnover rate | 59 | % | 69 | % | 56 | % | 35 | % | 40 | % | ||||||||||
| Touchstone High Yield Fund—Institutional Class |
| Selected Data for a Share Outstanding Throughout Each Period |
| Year Ended September 30, | ||||||||||||||||||||
| 2018 | 2017 | 2016 | 2015 | 2014 | ||||||||||||||||
| Net asset value at beginning of period | $ | 8.66 | $ | 8.43 | $ | 8.16 | $ | 9.13 | $ | 9.00 | ||||||||||
| Income (loss) from investment operations: | ||||||||||||||||||||
| Net investment income | 0.44 | 0.42 | 0.44 | 0.46 | 0.49 | |||||||||||||||
| Net realized and unrealized gains (losses) on investments | (0.30 | ) | 0.22 | 0.27 | (0.82 | ) | 0.13 | |||||||||||||
| Total from investment operations | 0.14 | 0.64 | 0.71 | (0.36 | ) | 0.62 | ||||||||||||||
| Distributions from: | ||||||||||||||||||||
| Net investment income | (0.45 | ) | (0.41 | ) | (0.44 | ) | (0.47 | ) | (0.49 | ) | ||||||||||
| Realized capital gains | — | — | — | (0.14 | ) | — | ||||||||||||||
| Total distributions | (0.45 | ) | (0.41 | ) | (0.44 | ) | (0.61 | ) | (0.49 | ) | ||||||||||
| Net asset value at end of period | $ | 8.35 | $ | 8.66 | $ | 8.43 | $ | 8.16 | $ | 9.13 | ||||||||||
| Total return | 1.63 | % | 7.70 | % | 9.19 | % | (4.23 | %) | 6.99 | % | ||||||||||
| Ratios and supplemental data: | ||||||||||||||||||||
| Net assets at end of period (000's) | $ | 111,705 | $ | 112,503 | $ | 93,267 | $ | 59,037 | $ | 56,228 | ||||||||||
| Ratio to average net assets: | ||||||||||||||||||||
| Net expenses | 0.72 | % | 0.72 | % | 0.72 | % | 0.72 | % | 0.68 | % | ||||||||||
| Gross expenses | 0.76 | % | 0.75 | % | 0.77 | % | 0.75 | % | 0.75 | % | ||||||||||
| Net investment income | 5.09 | % | 4.96 | % | 5.52 | % | 5.25 | % | 5.31 | % | ||||||||||
| Portfolio turnover rate | 59 | % | 69 | % | 56 | % | 35 | % | 40 | % | ||||||||||
See accompanying Notes to Financial Statements.
| 142 |
Financial Highlights (Continued)
| Touchstone Impact Bond Fund—Class A |
| Selected Data for a Share Outstanding Throughout Each Period |
| Year Ended September 30, | ||||||||||||||||||||
| 2018 | 2017 | 2016 | 2015 | 2014 | ||||||||||||||||
| Net asset value at beginning of period | $ | 10.13 | $ | 10.38 | $ | 10.19 | $ | 10.23 | $ | 10.07 | ||||||||||
| Income (loss) from investment operations: | ||||||||||||||||||||
| Net investment income | 0.22 | 0.18 | 0.24 | 0.22 | 0.23 | |||||||||||||||
| Net realized and unrealized gains (losses) on investments | (0.33 | ) | (0.17 | ) | 0.22 | 0.01 | 0.22 | |||||||||||||
| Total from investment operations | (0.11 | ) | 0.01 | 0.46 | 0.23 | 0.45 | ||||||||||||||
| Distributions from: | ||||||||||||||||||||
| Net investment income | (0.25 | ) | (0.26 | ) | (0.27 | ) | (0.27 | ) | (0.29 | ) | ||||||||||
| Net asset value at end of period | $ | 9.77 | $ | 10.13 | $ | 10.38 | $ | 10.19 | $ | 10.23 | ||||||||||
| Total return(A) | (1.07 | %) | 0.15 | % | 4.57 | % | 2.24 | % | 4.53 | % | ||||||||||
| Ratios and supplemental data: | ||||||||||||||||||||
| Net assets at end of period (000's) | $ | 5,697 | $ | 5,137 | $ | 8,639 | $ | 5,749 | $ | 5,144 | ||||||||||
| Ratio to average net assets: | ||||||||||||||||||||
| Net expenses | 0.85 | % | 0.85 | % | 0.87 | % | 0.90 | % | 0.90 | % | ||||||||||
| Gross expenses | 1.30 | % | 1.22 | % | 1.25 | % | 1.26 | % | 1.25 | % | ||||||||||
| Net investment income | 2.25 | % | 1.98 | % | 2.26 | % | 2.10 | % | 2.32 | % | ||||||||||
| Portfolio turnover rate | 40 | % | 18 | % | 12 | % | 19 | % | 5 | % | ||||||||||
| Touchstone Impact Bond Fund—Class C |
| Selected Data for a Share Outstanding Throughout Each Period |
| Year Ended September 30, | ||||||||||||||||||||
| 2018 | 2017 | 2016 | 2015 | 2014 | ||||||||||||||||
| Net asset value at beginning of period | $ | 10.12 | $ | 10.36 | $ | 10.18 | $ | 10.21 | $ | 10.05 | ||||||||||
| Income (loss) from investment operations: | ||||||||||||||||||||
| Net investment income | 0.16 | 0.11 | 0.15 | 0.14 | 0.15 | |||||||||||||||
| Net realized and unrealized gains (losses) on investments | (0.35 | ) | (0.17 | ) | 0.22 | 0.02 | 0.22 | |||||||||||||
| Total from investment operations | (0.19 | ) | (0.06 | ) | 0.37 | 0.16 | 0.37 | |||||||||||||
| Distributions from: | ||||||||||||||||||||
| Net investment income | (0.18 | ) | (0.18 | ) | (0.19 | ) | (0.19 | ) | (0.21 | ) | ||||||||||
| Net asset value at end of period | $ | 9.75 | $ | 10.12 | $ | 10.36 | $ | 10.18 | $ | 10.21 | ||||||||||
| Total return(A) | (1.94 | %) | (0.51 | %) | 3.70 | % | 1.60 | % | 3.75 | % | ||||||||||
| Ratios and supplemental data: | ||||||||||||||||||||
| Net assets at end of period (000's) | $ | 1,087 | $ | 1,876 | $ | 2,813 | $ | 2,368 | $ | 1,634 | ||||||||||
| Ratio to average net assets: | ||||||||||||||||||||
| Net expenses | 1.60 | % | 1.60 | % | 1.62 | % | 1.65 | % | 1.65 | % | ||||||||||
| Gross expenses | 2.78 | % | 2.30 | % | 2.19 | % | 2.27 | % | 2.47 | % | ||||||||||
| Net investment income | 1.50 | % | 1.23 | % | 1.51 | % | 1.35 | % | 1.57 | % | ||||||||||
| Portfolio turnover rate | 40 | % | 18 | % | 12 | % | 19 | % | 5 | % | ||||||||||
| (A) | Total returns shown exclude the effect of applicable sales loads and fees. If these charges were included, the returns would be lower. See accompanying Notes to Financial Statements. |
| 143 |
Financial Highlights (Continued)
| Touchstone Impact Bond Fund—Class Y |
| Selected Data for a Share Outstanding Throughout Each Period |
| Year Ended September 30, | ||||||||||||||||||||
| 2018 | 2017 | 2016 | 2015 | 2014 | ||||||||||||||||
| Net asset value at beginning of period | $ | 10.15 | $ | 10.39 | $ | 10.20 | $ | 10.24 | $ | 10.08 | ||||||||||
| Income (loss) from investment operations: | ||||||||||||||||||||
| Net investment income | 0.24 | 0.24 | 0.26 | 0.25 | 0.26 | |||||||||||||||
| Net realized and unrealized gains (losses) on investments | (0.33 | ) | (0.19 | ) | 0.23 | 0.01 | 0.22 | |||||||||||||
| Total from investment operations | (0.09 | ) | 0.05 | 0.49 | 0.26 | 0.48 | ||||||||||||||
| Distributions from: | ||||||||||||||||||||
| Net investment income | (0.28 | ) | (0.29 | ) | (0.30 | ) | (0.30 | ) | (0.32 | ) | ||||||||||
| Net asset value at end of period | $ | 9.78 | $ | 10.15 | $ | 10.39 | $ | 10.20 | $ | 10.24 | ||||||||||
| Total return | (0.92 | %) | 0.50 | % | 4.82 | % | 2.51 | % | 4.84 | % | ||||||||||
| Ratios and supplemental data: | ||||||||||||||||||||
| Net assets at end of period (000's) | $ | 54,895 | $ | 37,233 | $ | 49,484 | $ | 39,751 | $ | 19,397 | ||||||||||
| Ratio to average net assets: | ||||||||||||||||||||
| Net expenses | 0.60 | % | 0.60 | % | 0.62 | % | 0.65 | % | 0.61 | % | ||||||||||
| Gross expenses | 0.67 | % | 0.73 | % | 0.71 | % | 0.70 | % | 0.68 | % | ||||||||||
| Net investment income | 2.50 | % | 2.23 | % | 2.51 | % | 2.35 | % | 2.61 | % | ||||||||||
| Portfolio turnover rate | 40 | % | 18 | % | 12 | % | 19 | % | 5 | % | ||||||||||
| Touchstone Impact Bond Fund — Institutional Class |
| Selected Data for a Share Outstanding Throughout Each Period |
| Year Ended September 30, | ||||||||||||||||||||
| 2018 | 2017 | 2016 | 2015 | 2014 | ||||||||||||||||
| Net asset value at beginning of period | $ | 10.14 | $ | 10.39 | $ | 10.20 | $ | 10.24 | $ | 10.08 | ||||||||||
| Income (loss) from investment operations: | ||||||||||||||||||||
| Net investment income | 0.26 | 0.25 | 0.28 | 0.26 | 0.27 | |||||||||||||||
| Net realized and unrealized gains (losses) on investments | (0.33 | ) | (0.20 | ) | 0.22 | 0.01 | 0.22 | |||||||||||||
| Total from investment operations | (0.07 | ) | 0.05 | 0.50 | 0.27 | 0.49 | ||||||||||||||
| Distributions from: | ||||||||||||||||||||
| Net investment income | (0.29 | ) | (0.30 | ) | (0.31 | ) | (0.31 | ) | (0.33 | ) | ||||||||||
| Net asset value at end of period | $ | 9.78 | $ | 10.14 | $ | 10.39 | $ | 10.20 | $ | 10.24 | ||||||||||
| Total return | (0.72 | %) | 0.51 | % | 4.94 | % | 2.65 | % | 4.96 | % | ||||||||||
| Ratios and supplemental data: | ||||||||||||||||||||
| Net assets at end of period (000's) | $ | 191,224 | $ | 222,013 | $ | 166,008 | $ | 134,877 | $ | 116,404 | ||||||||||
| Ratio to average net assets: | ||||||||||||||||||||
| Net expenses | 0.50 | % | 0.50 | % | 0.50 | % | 0.50 | % | 0.50 | % | ||||||||||
| Gross expenses | 0.60 | % | 0.60 | % | 0.60 | % | 0.61 | % | 0.60 | % | ||||||||||
| Net investment income | 2.60 | % | 2.33 | % | 2.63 | % | 2.50 | % | 2.72 | % | ||||||||||
| Portfolio turnover rate | 40 | % | 18 | % | 12 | % | 19 | % | 5 | % | ||||||||||
See accompanying Notes to Financial Statements.
| 144 |
Financial Highlights (Continued)
| Touchstone Merger Arbitrage Fund—Class A |
| Selected Data for a Share Outstanding Throughout Each Period |
| Year Ended September 30, | ||||||||||||||||||||
| 2018 | 2017 | 2016 | 2015 | 2014 | ||||||||||||||||
| Net asset value at beginning of period | $ | 11.00 | $ | 11.00 | $ | 10.54 | $ | 10.49 | $ | 11.05 | ||||||||||
| Income (loss) from investment operations: | ||||||||||||||||||||
| Net investment loss(A) | (0.04 | ) | (0.11 | ) | (0.08 | ) | (0.11 | ) | (0.13 | ) | ||||||||||
| Net realized and unrealized gains (losses) on investments | (0.06 | ) | 0.43 | 0.54 | 0.21 | (0.05 | ) | |||||||||||||
| Total from investment operations | (0.10 | ) | 0.32 | 0.46 | 0.10 | (0.18 | ) | |||||||||||||
| Distributions from: | ||||||||||||||||||||
| Net investment income | — | — | — | — | (0.05 | ) | ||||||||||||||
| Realized capital gains | (0.59 | ) | (0.32 | ) | — | (0.05 | ) | (0.33 | ) | |||||||||||
| Total distributions | (0.59 | ) | (0.32 | ) | — | (0.05 | ) | (0.38 | ) | |||||||||||
| Net asset value at end of period | $ | 10.31 | $ | 11.00 | $ | 11.00 | $ | 10.54 | $ | 10.49 | ||||||||||
| Total return(B) | (0.96 | %) | 3.01 | % | 4.37 | % | 0.92 | % | (1.75 | %) | ||||||||||
| Ratios and supplemental data: | ||||||||||||||||||||
| Net assets at end of period (000's) | $ | 8,946 | $ | 14,144 | $ | 15,711 | $ | 21,858 | $ | 96,916 | ||||||||||
| Ratio to average net assets: | ||||||||||||||||||||
| Net expenses (including dividend and interest expense on securities sold short)(C) | 2.06 | % | 2.56 | % | 2.52 | % | 2.47 | % | 2.52 | % | ||||||||||
| Gross expenses (including dividend and interest expense on securities sold short)(D) | 2.19 | % | 2.64 | % | 2.55 | % | 2.47 | % | 2.52 | % | ||||||||||
| Net investment loss | (0.41 | %) | (1.05 | %) | (0.74 | %) | (0.99 | %) | (1.25 | %) | ||||||||||
| Portfolio turnover rate | 214 | % | 331 | % | 400 | % | 227 | % | 271 | % | ||||||||||
| (A) | The net investment loss per share was based on average shares outstanding for the period. |
| (B) | Total returns shown exclude the effect of applicable sales loads and fees. If these charges were included, the returns would be lower. |
| (C) | The ratio of net expenses to average net assets excluding dividend and interest expense on securities sold short was 1.68%, 1.68%, 1.68%, 1.60% and 1.57% for the years ended September 30, 2018, 2017, 2016, 2015 and 2014, respectively. |
| (D) | The ratio of gross expenses to average net assets excluding dividend and interest expense on securities sold short was 1.81%, 1.76%, 1.71%, 1.60% and 1.57% for the years ended September 30, 2018, 2017, 2016, 2015 and 2014, respectively. |
See accompanying Notes to Financial Statements.
| 145 |
Financial Highlights (Continued)
| Touchstone Merger Arbitrage Fund—Class C |
| Selected Data for a Share Outstanding Throughout Each Period |
| Year Ended September 30, | ||||||||||||||||||||
| 2018 | 2017 | 2016 | 2015 | 2014 | ||||||||||||||||
| Net asset value at beginning of period | $ | 10.50 | $ | 10.60 | $ | 10.22 | $ | 10.26 | $ | 10.85 | ||||||||||
| Income (loss) from investment operations: | ||||||||||||||||||||
| Net investment loss(A) | (0.12 | ) | (0.19 | ) | (0.16 | ) | (0.18 | ) | (0.22 | ) | ||||||||||
| Net realized and unrealized gains (losses) on investments | (0.05 | ) | 0.41 | 0.54 | 0.19 | (0.04 | ) | |||||||||||||
| Total from investment operations | (0.17 | ) | 0.22 | 0.38 | 0.01 | (0.26 | ) | |||||||||||||
| Distributions from: | ||||||||||||||||||||
| Net investment income | — | — | — | — | — | |||||||||||||||
| Realized capital gains | (0.59 | ) | (0.32 | ) | — | (0.05 | ) | (0.33 | ) | |||||||||||
| Total distributions | (0.59 | ) | (0.32 | ) | — | (0.05 | ) | (0.33 | ) | |||||||||||
| Net asset value at end of period | $ | 9.74 | $ | 10.50 | $ | 10.60 | $ | 10.22 | $ | 10.26 | ||||||||||
| Total return(B) | (1.70 | %) | 2.26 | % | 3.62 | % | 0.06 | % | (2.51 | %) | ||||||||||
| Ratios and supplemental data: | ||||||||||||||||||||
| Net assets at end of period (000's) | $ | 7,696 | $ | 11,071 | $ | 14,300 | $ | 18,868 | $ | 35,737 | ||||||||||
| Ratio to average net assets: | ||||||||||||||||||||
| Net expenses (including dividend and interest expense on securities sold short)(C) | 2.81 | % | 3.31 | % | 3.27 | % | 3.26 | % | 3.32 | % | ||||||||||
| Gross expenses (including dividend and interest expense on securities sold short)(D) | 2.94 | % | 3.40 | % | 3.28 | % | 3.26 | % | 3.32 | % | ||||||||||
| Net investment loss | (1.16 | %) | (1.80 | %) | (1.49 | %) | (1.79 | %) | (2.05 | %) | ||||||||||
| Portfolio turnover rate | 214 | % | 331 | % | 400 | % | 227 | % | 271 | % | ||||||||||
| (A) | The net investment loss per share was based on average shares outstanding for the period. |
| (B) | Total returns shown exclude the effect of applicable sales loads and fees. If these charges were included, the returns would be lower. |
| (C) | The ratio of net expenses to average net assets excluding dividend and interest expense on securities sold short was 2.43%, 2.43%, 2.43%, 2.39% and 2.37% for the years ended September 30, 2018, 2017, 2016, 2015 and 2014, respectively. |
| (D) | The ratio of gross expenses to average net assets excluding dividend and interest expense on securities sold short was 2.56%, 2.52%, 2.44%, 2.39% and 2.37% for the years ended September 30, 2018, 2017, 2016, 2015 and 2014, respectively. |
See accompanying Notes to Financial Statements.
| 146 |
Financial Highlights (Continued)
| Touchstone Merger Arbitrage Fund—Class Y |
| Selected Data for a Share Outstanding Throughout Each Period |
| Year Ended September 30, | ||||||||||||||||||||
| 2018 | 2017 | 2016 | 2015 | 2014 | ||||||||||||||||
| Net asset value at beginning of period | $ | 11.16 | $ | 11.13 | $ | 10.62 | $ | 10.55 | $ | 11.10 | ||||||||||
| Income (loss) from investment operations: | ||||||||||||||||||||
| Net investment loss(A) | (0.01 | ) | (0.09 | ) | (0.05 | ) | (0.08 | ) | (0.10 | ) | ||||||||||
| Net realized and unrealized gains (losses) on investments | (0.06 | ) | 0.44 | 0.56 | 0.20 | (0.05 | ) | |||||||||||||
| Total from investment operations | (0.07 | ) | 0.35 | 0.51 | 0.12 | (0.15 | ) | |||||||||||||
| Distributions from: | ||||||||||||||||||||
| Net investment income | — | — | — | — | (0.07 | ) | ||||||||||||||
| Realized capital gains | (0.59 | ) | (0.32 | ) | — | (0.05 | ) | (0.33 | ) | |||||||||||
| Total distributions | (0.59 | ) | (0.32 | ) | — | (0.05 | ) | (0.40 | ) | |||||||||||
| Net asset value at end of period | $ | 10.50 | $ | 11.16 | $ | 11.13 | $ | 10.62 | $ | 10.55 | ||||||||||
| Total return | (0.66 | %) | 3.35 | % | 4.71 | % | 1.10 | % | (1.41 | %) | ||||||||||
| Ratios and supplemental data: | ||||||||||||||||||||
| Net assets at end of period (000's) | $ | 83,211 | $ | 91,224 | $ | 85,841 | $ | 88,677 | $ | 178,305 | ||||||||||
| Ratio to average net assets: | ||||||||||||||||||||
| Net expenses (including dividend and interest expense on securities sold short)(B) | 1.77 | % | 2.28 | % | 2.21 | % | 2.20 | % | 2.24 | % | ||||||||||
| Gross expenses (including dividend and interest expense on securities sold short)(C) | 1.77 | % | 2.28 | % | 2.21 | % | 2.20 | % | 2.24 | % | ||||||||||
| Net investment loss | (0.13 | %) | (0.77 | %) | (0.43 | %) | (0.73 | %) | (0.97 | %) | ||||||||||
| Portfolio turnover rate | 214 | % | 331 | % | 400 | % | 227 | % | 271 | % | ||||||||||
| (A) | The net investment loss per share was based on average shares outstanding for the period. |
| (B) | The ratio of net expenses to average net assets excluding dividend and interest expense on securities sold short was 1.39%, 1.40%, 1.37%, 1.33% and 1.29% for the years ended September 30, 2018, 2017, 2016, 2015 and 2014, respectively. |
| (C) | The ratio of gross expenses to average net assets excluding dividend and interest expense on securities sold short was 1.39%, 1.40%, 1.37%, 1.33% and 1.29% for the years ended September 30, 2018, 2017, 2016, 2015 and 2014, respectively. |
See accompanying Notes to Financial Statements.
| 147 |
Financial Highlights (Continued)
| Touchstone Merger Arbitrage Fund—Institutional Class |
| Selected Data for a Share Outstanding Throughout Each Period |
| Year Ended September 30, | ||||||||||||||||||||
| 2018 | 2017 | 2016 | 2015 | 2014 | ||||||||||||||||
| Net asset value at beginning of period | $ | 11.21 | $ | 11.16 | $ | 10.65 | $ | 10.57 | $ | 11.13 | ||||||||||
| Income (loss) from investment operations: | ||||||||||||||||||||
| Net investment loss(A) | (— | )(B) | (0.07 | ) | (0.04 | ) | (0.07 | ) | (0.10 | ) | ||||||||||
| Net realized and unrealized gains (losses) on investments | (0.06 | ) | 0.44 | 0.55 | 0.20 | (0.05 | ) | |||||||||||||
| Total from investment operations | (0.06 | ) | 0.37 | 0.51 | 0.13 | (0.15 | ) | |||||||||||||
| Distributions from: | ||||||||||||||||||||
| Net investment income | — | — | — | — | (0.08 | ) | ||||||||||||||
| Realized capital gains | (0.59 | ) | (0.32 | ) | — | (0.05 | ) | (0.33 | ) | |||||||||||
| Total distributions | (0.59 | ) | (0.32 | ) | — | (0.05 | ) | (0.41 | ) | |||||||||||
| Net asset value at end of period | $ | 10.56 | $ | 11.21 | $ | 11.16 | $ | 10.65 | $ | 10.57 | ||||||||||
| Total return | (0.57 | %) | 3.43 | % | 4.79 | % | 1.19 | % | (1.44 | %) | ||||||||||
| Ratios and supplemental data: | ||||||||||||||||||||
| Net assets at end of period (000's) | $ | 39,740 | $ | 98,240 | $ | 76,910 | $ | 82,858 | $ | 119,727 | ||||||||||
| Ratio to average net assets: | ||||||||||||||||||||
| Net expenses (including dividend and interest expense on securities sold short)(C) | 1.66 | % | 2.16 | % | 2.12 | % | 2.13 | % | 2.21 | % | ||||||||||
| Gross expenses (including dividend and interest expense on securities sold short)(D) | 1.71 | % | 2.18 | % | 2.12 | % | 2.13 | % | 2.20 | % | ||||||||||
| Net investment loss | (0.01 | %) | (0.65 | %) | (0.34 | %) | (0.66 | %) | (0.94 | %) | ||||||||||
| Portfolio turnover rate | 214 | % | 331 | % | 400 | % | 227 | % | 271 | % | ||||||||||
| (A) | The net investment loss per share was based on average shares outstanding for the period. |
| (B) | Less than $0.005 per share. |
| (C) | The ratio of net expenses to average net assets excluding dividend and interest expense on securities sold short was 1.28%, 1.28%, 1.28%, 1.26% and 1.26% for the years ended September 30, 2018, 2017, 2016, 2015 and 2014, respectively. |
| (D) | The ratio of gross expenses to average net assets excluding dividend and interest expense on securities sold short was 1.33%, 1.30%, 1.28%, 1.26% and 1.25% for the years ended September 30, 2018, 2017, 2016, 2015 and 2014, respectively. |
See accompanying Notes to Financial Statements.
| 148 |
Financial Highlights (Continued)
| Touchstone Mid Cap Fund—Class A |
| Selected Data for a Share Outstanding Throughout Each Period |
| Year Ended September 30, | ||||||||||||||||||||
| 2018 | 2017 | 2016 | 2015 | 2014 | ||||||||||||||||
| Net asset value at beginning of period | $ | 30.50 | $ | 25.91 | $ | 23.22 | $ | 23.68 | $ | 20.87 | ||||||||||
| Income (loss) from investment operations: | ||||||||||||||||||||
| Net investment income (loss) | 0.01 | (A) | (0.02 | )(A) | 0.12 | (0.02 | )(A) | — | (B) | |||||||||||
| Net realized and unrealized gains (losses) on investments | 4.79 | 4.69 | 2.57 | (0.44 | ) | 2.83 | ||||||||||||||
| Total from investment operations | 4.80 | 4.67 | 2.69 | (0.46 | ) | 2.83 | ||||||||||||||
| Distributions from: | ||||||||||||||||||||
| Net investment income | — | (0.08 | ) | — | — | (0.02 | ) | |||||||||||||
| Realized capital gains | (0.31 | ) | — | — | — | — | ||||||||||||||
| Total distributions | (0.31 | ) | (0.08 | ) | — | — | (0.02 | ) | ||||||||||||
| Net asset value at end of period | $ | 34.99 | $ | 30.50 | $ | 25.91 | $ | 23.22 | $ | 23.68 | ||||||||||
| Total return(C) | 15.83 | % | 18.08 | % | 11.58 | % | (1.94 | %) | 13.57 | % | ||||||||||
| Ratios and supplemental data: | ||||||||||||||||||||
| Net assets at end of period (000's) | $ | 36,824 | $ | 34,761 | $ | 53,044 | $ | 62,717 | $ | 35,513 | ||||||||||
| Ratio to average net assets: | ||||||||||||||||||||
| Net expenses | 1.24 | % | 1.24 | % | 1.24 | % | 1.24 | % | 1.23 | % | ||||||||||
| Gross expenses | 1.35 | % | 1.36 | % | 1.35 | % | 1.35 | % | 1.40 | % | ||||||||||
| Net investment income (loss) | 0.04 | % | (0.09 | %) | 0.43 | % | (0.07 | %) | 0.01 | % | ||||||||||
| Portfolio turnover rate | 46 | % | 19 | % | 19 | % | 17 | % | 26 | % | ||||||||||
| Touchstone Mid Cap Fund—Class C |
| Selected Data for a Share Outstanding Throughout Each Period |
| Year Ended September 30, | ||||||||||||||||||||
| 2018 | 2017 | 2016 | 2015 | 2014 | ||||||||||||||||
| Net asset value at beginning of period | $ | 29.02 | $ | 24.76 | $ | 22.35 | $ | 22.97 | $ | 20.37 | ||||||||||
| Income (loss) from investment operations: | ||||||||||||||||||||
| Net investment loss | (0.22 | )(A) | (0.22 | )(A) | (0.12 | ) | (0.20 | )(A) | (0.15 | ) | ||||||||||
| Net realized and unrealized gains (losses) on investments | 4.52 | 4.48 | 2.53 | (0.42 | ) | 2.75 | ||||||||||||||
| Total from investment operations | 4.30 | 4.26 | 2.41 | (0.62 | ) | 2.60 | ||||||||||||||
| Distributions from: | ||||||||||||||||||||
| Realized capital gains | (0.31 | ) | — | — | — | — | ||||||||||||||
| Net asset value at end of period | $ | 33.01 | $ | 29.02 | $ | 24.76 | $ | 22.35 | $ | 22.97 | ||||||||||
| Total return(C) | 14.91 | % | 17.21 | % | 10.78 | % | (2.70 | %) | 12.76 | % | ||||||||||
| Ratios and supplemental data: | ||||||||||||||||||||
| Net assets at end of period (000's) | $ | 56,274 | $ | 57,224 | $ | 59,431 | $ | 60,815 | $ | 41,433 | ||||||||||
| Ratio to average net assets: | ||||||||||||||||||||
| Net expenses | 1.99 | % | 1.99 | % | 1.99 | % | 1.99 | % | 1.98 | % | ||||||||||
| Gross expenses | 2.08 | % | 2.11 | % | 2.13 | % | 2.12 | % | 2.16 | % | ||||||||||
| Net investment loss | (0.71 | %) | (0.84 | %) | (0.32 | %) | (0.82 | %) | (0.75 | %) | ||||||||||
| Portfolio turnover rate | 46 | % | 19 | % | 19 | % | 17 | % | 26 | % | ||||||||||
| (A) | The net investment income (loss) per share was based on average shares outstanding for the period. |
| (B) | Less than $0.005 per share. |
| (C) | Total returns shown exclude the effect of applicable sales loads and fees. If these charges were included, the returns would be lower. |
See accompanying Notes to Financial Statements.
| 149 |
Financial Highlights (Continued)
| Touchstone Mid Cap Fund—Class Y |
| Selected Data for a Share Outstanding Throughout Each Period |
| Year Ended September 30, | ||||||||||||||||||||
| 2018 | 2017 | 2016 | 2015 | 2014 | ||||||||||||||||
| Net asset value at beginning of period | $ | 30.77 | $ | 26.14 | $ | 23.38 | $ | 23.83 | $ | 20.98 | ||||||||||
| Income (loss) from investment operations: | ||||||||||||||||||||
| Net investment income | 0.10 | (A) | 0.05 | (A) | 0.18 | 0.05 | (A) | 0.06 | ||||||||||||
| Net realized and unrealized gains (losses) on investments | 4.82 | 4.74 | 2.59 | (0.45 | ) | 2.84 | ||||||||||||||
| Total from investment operations | 4.92 | 4.79 | 2.77 | (0.40 | ) | 2.90 | ||||||||||||||
| Distributions from: | ||||||||||||||||||||
| Net investment income | (0.05 | ) | (0.16 | ) | (0.01 | ) | (0.05 | ) | (0.05 | ) | ||||||||||
| Realized capital gains | (0.31 | ) | — | — | — | — | ||||||||||||||
| Total distributions | (0.36 | ) | (0.16 | ) | (0.01 | ) | (0.05 | ) | (0.05 | ) | ||||||||||
| Net asset value at end of period | $ | 35.33 | $ | 30.77 | $ | 26.14 | $ | 23.38 | $ | 23.83 | ||||||||||
| Total return | 16.09 | % | 18.40 | % | 11.87 | % | (1.69 | %) | 13.83 | % | ||||||||||
| Ratios and supplemental data: | ||||||||||||||||||||
| Net assets at end of period (000's) | $ | 712,578 | $ | 551,794 | $ | 476,831 | $ | 481,735 | $ | 266,446 | ||||||||||
| Ratio to average net assets: | ||||||||||||||||||||
| Net expenses | 0.99 | % | 0.99 | % | 0.99 | % | 0.99 | % | 0.98 | % | ||||||||||
| Gross expenses | 1.05 | % | 1.08 | % | 1.07 | % | 1.11 | % | 1.06 | % | ||||||||||
| Net investment income | 0.29 | % | 0.16 | % | 0.68 | % | 0.18 | % | 0.26 | % | ||||||||||
| Portfolio turnover rate | 46 | % | 19 | % | 19 | % | 17 | % | 26 | % | ||||||||||
| Touchstone Mid Cap Fund—Class Z |
| Selected Data for a Share Outstanding Throughout Each Period |
| Year Ended September 30, | ||||||||||||||||||||
| 2018 | 2017 | 2016 | 2015 | 2014 | ||||||||||||||||
| Net asset value at beginning of period | $ | 30.32 | $ | 25.75 | $ | 23.08 | $ | 23.54 | $ | 20.73 | ||||||||||
| Income (loss) from investment operations: | ||||||||||||||||||||
| Net investment income (loss) | 0.01 | (A) | (0.02 | )(A) | 0.12 | (0.02 | )(A) | 0.01 | ||||||||||||
| Net realized and unrealized gains (losses) on investments | 4.76 | 4.67 | 2.55 | (0.44 | ) | 2.81 | ||||||||||||||
| Total from investment operations | 4.77 | 4.65 | 2.67 | (0.46 | ) | 2.82 | ||||||||||||||
| Distributions from: | ||||||||||||||||||||
| Net investment income | — | (0.08 | ) | (— | )(B) | — | (0.01 | ) | ||||||||||||
| Realized capital gains | (0.31 | ) | — | — | — | — | ||||||||||||||
| Total distributions | (0.31 | ) | (0.08 | ) | (— | )(B) | — | (0.01 | ) | |||||||||||
| Net asset value at end of period | $ | 34.78 | $ | 30.32 | $ | 25.75 | $ | 23.08 | $ | 23.54 | ||||||||||
| Total return | 15.83 | % | 18.08 | % | 11.58 | % | (1.95 | %) | 13.58 | % | ||||||||||
| Ratios and supplemental data: | ||||||||||||||||||||
| Net assets at end of period (000's) | $ | 20,464 | $ | 19,312 | $ | 18,934 | $ | 18,693 | $ | 11,593 | ||||||||||
| Ratio to average net assets: | ||||||||||||||||||||
| Net expenses | 1.24 | % | 1.24 | % | 1.24 | % | 1.24 | % | 1.23 | % | ||||||||||
| Gross expenses | 1.40 | % | 1.44 | % | 1.46 | % | 1.44 | % | 1.55 | % | ||||||||||
| Net investment income (loss) | 0.04 | % | (0.09 | %) | 0.43 | % | (0.07 | %) | 0.01 | % | ||||||||||
| Portfolio turnover rate | 46 | % | 19 | % | 19 | % | 17 | % | 26 | % | ||||||||||
| (A) | The net investment income (loss) per share was based on average shares outstanding for the period. |
| (B) | Less than $0.005 per share. |
See accompanying Notes to Financial Statements.
| 150 |
Financial Highlights (Continued)
| Touchstone Mid Cap Fund—Institutional Class |
| Selected Data for a Share Outstanding Throughout Each Period |
| Year Ended September 30, | ||||||||||||||||||||
| 2018 | 2017 | 2016 | 2015 | 2014 | ||||||||||||||||
| Net asset value at beginning of period | $ | 30.81 | $ | 26.18 | $ | 23.40 | $ | 23.85 | $ | 20.99 | ||||||||||
| Income (loss) from investment operations: | ||||||||||||||||||||
| Net investment income | 0.12 | (A) | 0.07 | (A) | 0.19 | 0.06 | (A) | 0.08 | ||||||||||||
| Net realized and unrealized gains (losses) on investments | 4.83 | 4.74 | 2.61 | (0.44 | ) | 2.84 | ||||||||||||||
| Total from investment operations | 4.95 | 4.81 | 2.80 | (0.38 | ) | 2.92 | ||||||||||||||
| Distributions from: | ||||||||||||||||||||
| Net investment income | (0.07 | ) | (0.18 | ) | (0.02 | ) | (0.07 | ) | (0.06 | ) | ||||||||||
| Realized capital gains | (0.31 | ) | — | — | — | — | ||||||||||||||
| Total distributions | (0.38 | ) | (0.18 | ) | (0.02 | ) | (0.07 | ) | (0.06 | ) | ||||||||||
| Net asset value at end of period | $ | 35.38 | $ | 30.81 | $ | 26.18 | $ | 23.40 | $ | 23.85 | ||||||||||
| Total return | 16.18 | % | 18.50 | % | 11.92 | % | (1.62 | %) | 13.91 | % | ||||||||||
| Ratios and supplemental data: | ||||||||||||||||||||
| Net assets at end of period (000's) | $ | 129,284 | $ | 113,867 | $ | 77,775 | $ | 76,324 | $ | 90,998 | ||||||||||
| Ratio to average net assets: | ||||||||||||||||||||
| Net expenses | 0.92 | % | 0.92 | % | 0.92 | % | 0.92 | % | 0.91 | % | ||||||||||
| Gross expenses | 0.97 | % | 0.98 | % | 0.99 | % | 1.00 | % | 1.01 | % | ||||||||||
| Net investment income | 0.36 | % | 0.23 | % | 0.75 | % | 0.25 | % | 0.33 | % | ||||||||||
| Portfolio turnover rate | 46 | % | 19 | % | 19 | % | 17 | % | 26 | % | ||||||||||
| (A) | The net investment income per share was based on average shares outstanding for the period. |
See accompanying Notes to Financial Statements.
| 151 |
Financial Highlights (Continued)
| Touchstone Mid Cap Value Fund—Class A |
| Selected Data for a Share Outstanding Throughout Each Period |
| Year Ended September 30, | ||||||||||||||||||||
| 2018 | 2017 | 2016 | 2015 | 2014 | ||||||||||||||||
| Net asset value at beginning of period | $ | 19.36 | $ | 17.49 | $ | 15.70 | $ | 16.60 | $ | 16.09 | ||||||||||
| Income (loss) from investment operations: | ||||||||||||||||||||
| Net investment income | 0.07 | 0.04 | 0.09 | (A) | 0.12 | 0.05 | ||||||||||||||
| Net realized and unrealized gains (losses) on investments | 0.48 | 2.47 | 2.76 | (0.28 | ) | 1.85 | ||||||||||||||
| Total from investment operations | 0.55 | 2.51 | 2.85 | (0.16 | ) | 1.90 | ||||||||||||||
| Distributions from: | ||||||||||||||||||||
| Net investment income | (0.06 | ) | (0.03 | ) | (0.10 | ) | (0.10 | ) | (0.05 | ) | ||||||||||
| Realized capital gains | (1.14 | ) | (0.61 | ) | (0.96 | ) | (0.64 | ) | (1.34 | ) | ||||||||||
| Total distributions | (1.20 | ) | (0.64 | ) | (1.06 | ) | (0.74 | ) | (1.39 | ) | ||||||||||
| Net asset value at end of period | $ | 18.71 | $ | 19.36 | $ | 17.49 | $ | 15.70 | $ | 16.60 | ||||||||||
| Total return(B) | 2.80 | % | 14.62 | % | 19.20 | % | (1.14 | %) | 12.49 | % | ||||||||||
| Ratios and supplemental data: | ||||||||||||||||||||
| Net assets at end of period (000's) | $ | 17,217 | $ | 21,001 | $ | 21,867 | $ | 7,663 | $ | 14,029 | ||||||||||
| Ratio to average net assets: | ||||||||||||||||||||
| Net expenses | 1.25 | % | 1.27 | % | 1.27 | % | 1.29 | % | 1.29 | % | ||||||||||
| Gross expenses | 1.48 | % | 1.47 | % | 1.59 | % | 1.66 | % | 1.58 | % | ||||||||||
| Net investment income | 0.32 | % | 0.19 | % | 0.56 | % | 0.55 | % | 0.41 | % | ||||||||||
| Portfolio turnover rate | 31 | % | 43 | % | 45 | % | 54 | % | 85 | %(C) | ||||||||||
| Touchstone Mid Cap Value Fund—Class C |
| Selected Data for a Share Outstanding Throughout Each Period |
| Year Ended September 30, | ||||||||||||||||||||
| 2018 | 2017 | 2016 | 2015 | 2014 | ||||||||||||||||
| Net asset value at beginning of period | $ | 18.94 | $ | 17.23 | $ | 15.49 | $ | 16.42 | $ | 16.00 | ||||||||||
| Income (loss) from investment operations: | ||||||||||||||||||||
| Net investment loss | (0.13 | ) | (0.06 | ) | (0.03 | )(A) | (0.04 | ) | (0.04 | ) | ||||||||||
| Net realized and unrealized gains (losses) on investments | 0.53 | 2.38 | 2.73 | (0.25 | ) | 1.80 | ||||||||||||||
| Total from investment operations | 0.40 | 2.32 | 2.70 | (0.29 | ) | 1.76 | ||||||||||||||
| Distributions from: | ||||||||||||||||||||
| Net investment income | — | — | — | — | — | |||||||||||||||
| Realized capital gains | (1.14 | ) | (0.61 | ) | (0.96 | ) | (0.64 | ) | (1.34 | ) | ||||||||||
| Total distributions | (1.14 | ) | (0.61 | ) | (0.96 | ) | (0.64 | ) | (1.34 | ) | ||||||||||
| Net asset value at end of period | $ | 18.20 | $ | 18.94 | $ | 17.23 | $ | 15.49 | $ | 16.42 | ||||||||||
| Total return(B) | 2.04 | % | 13.78 | % | 18.32 | % | (1.91 | %) | 11.62 | % | ||||||||||
| Ratios and supplemental data: | ||||||||||||||||||||
| Net assets at end of period (000's) | $ | 7,755 | $ | 10,758 | $ | 4,088 | $ | 1,752 | $ | 2,002 | ||||||||||
| Ratio to average net assets: | ||||||||||||||||||||
| Net expenses | 2.01 | % | 2.02 | % | 2.02 | % | 2.04 | % | 2.04 | % | ||||||||||
| Gross expenses | 2.31 | % | 2.33 | % | 2.75 | % | 2.83 | % | 3.05 | % | ||||||||||
| Net investment loss | (0.43 | %) | (0.56 | %) | (0.19 | %) | (0.20 | %) | (0.34 | %) | ||||||||||
| Portfolio turnover rate | 31 | % | 43 | % | 45 | % | 54 | % | 85 | %(C) | ||||||||||
| (A) | The net investment income (loss) per share was based on average shares outstanding for the period. |
| (B) | Total returns shown exclude the effect of applicable sales loads and fees. If these charges were included, the returns would be lower. |
| (C) | Portfolio turnover excludes the purchases and sales of securities of the Touchstone Mid Cap Value Opportunities Fund acquired on March 21, 2014. If these transactions were included, portfolio turnover would have been higher. |
See accompanying Notes to Financial Statements.
| 152 |
Financial Highlights (Continued)
| Touchstone Mid Cap Value Fund—Class Y |
| Selected Data for a Share Outstanding Throughout Each Period |
| Year Ended September 30, | ||||||||||||||||||||
| 2018 | 2017 | 2016 | 2015 | 2014 | ||||||||||||||||
| Net asset value at beginning of period | $ | 19.45 | $ | 17.57 | $ | 15.76 | $ | 16.67 | $ | 16.15 | ||||||||||
| Income (loss) from investment operations: | ||||||||||||||||||||
| Net investment income | 0.11 | 0.08 | 0.13 | (A) | 0.14 | 0.07 | ||||||||||||||
| Net realized and unrealized gains (losses) on investments | 0.48 | 2.49 | 2.78 | (0.27 | ) | 1.88 | ||||||||||||||
| Total from investment operations | 0.59 | 2.57 | 2.91 | (0.13 | ) | 1.95 | ||||||||||||||
| Distributions from: | ||||||||||||||||||||
| Net investment income | (0.11 | ) | (0.08 | ) | (0.14 | ) | (0.14 | ) | (0.09 | ) | ||||||||||
| Realized capital gains | (1.14 | ) | (0.61 | ) | (0.96 | ) | (0.64 | ) | (1.34 | ) | ||||||||||
| Total distributions | (1.25 | ) | (0.69 | ) | (1.10 | ) | (0.78 | ) | (1.43 | ) | ||||||||||
| Net asset value at end of period | $ | 18.79 | $ | 19.45 | $ | 17.57 | $ | 15.76 | $ | 16.67 | ||||||||||
| Total return | 3.00 | % | 14.91 | % | 19.51 | % | (0.91 | %) | 12.77 | % | ||||||||||
| Ratios and supplemental data: | ||||||||||||||||||||
| Net assets at end of period (000's) | $ | 337,247 | $ | 322,979 | $ | 292,978 | $ | 208,525 | $ | 213,404 | ||||||||||
| Ratio to average net assets: | ||||||||||||||||||||
| Net expenses | 1.00 | % | 1.02 | % | 1.03 | % | 1.04 | % | 1.04 | % | ||||||||||
| Gross expenses | 1.05 | % | 1.10 | % | 1.13 | % | 1.13 | % | 1.14 | % | ||||||||||
| Net investment income | 0.57 | % | 0.43 | % | 0.81 | % | 0.81 | % | 0.66 | % | ||||||||||
| Portfolio turnover rate | 31 | % | 43 | % | 45 | % | 54 | % | 85 | %(B) | ||||||||||
| Touchstone Mid Cap Value Fund—Institutional Class |
| Selected Data for a Share Outstanding Throughout Each Period |
| Year Ended September 30, | ||||||||||||||||||||
| 2018 | 2017 | 2016 | 2015 | 2014 | ||||||||||||||||
| Net asset value at beginning of period | $ | 19.54 | $ | 17.64 | $ | 15.82 | $ | 16.73 | $ | 16.20 | ||||||||||
| Income (loss) from investment operations: | ||||||||||||||||||||
| Net investment income | 0.12 | 0.09 | 0.16 | (A) | 0.17 | 0.13 | ||||||||||||||
| Net realized and unrealized gains (losses) on investments | 0.50 | 2.52 | 2.78 | (0.27 | ) | 1.85 | ||||||||||||||
| Total from investment operations | 0.62 | 2.61 | 2.94 | (0.10 | ) | 1.98 | ||||||||||||||
| Distributions from: | ||||||||||||||||||||
| Net investment income | (0.13 | ) | (0.10 | ) | (0.16 | ) | (0.17 | ) | (0.11 | ) | ||||||||||
| Realized capital gains | (1.14 | ) | (0.61 | ) | (0.96 | ) | (0.64 | ) | (1.34 | ) | ||||||||||
| Total distributions | (1.27 | ) | (0.71 | ) | (1.12 | ) | (0.81 | ) | (1.45 | ) | ||||||||||
| Net asset value at end of period | $ | 18.89 | $ | 19.54 | $ | 17.64 | $ | 15.82 | $ | 16.73 | ||||||||||
| Total return | 3.17 | % | 15.04 | % | 19.71 | % | (0.76 | %) | 12.90 | % | ||||||||||
| Ratios and supplemental data: | ||||||||||||||||||||
| Net assets at end of period (000's) | $ | 431,412 | $ | 334,083 | $ | 185,989 | $ | 124,592 | $ | 134,259 | ||||||||||
| Ratio to average net assets: | ||||||||||||||||||||
| Net expenses | 0.87 | % | 0.89 | % | 0.89 | % | 0.89 | % | 0.89 | % | ||||||||||
| Gross expenses | 0.99 | % | 1.01 | % | 1.03 | % | 1.03 | % | 1.04 | % | ||||||||||
| Net investment income | 0.70 | % | 0.57 | % | 0.94 | % | 0.96 | % | 0.81 | % | ||||||||||
| Portfolio turnover rate | 31 | % | 43 | % | 45 | % | 54 | % | 85 | %(B) | ||||||||||
| (A) | The net investment income per share was based on average shares outstanding for the period. |
| (B) | Portfolio turnover excludes the purchases and sales of securities of the Touchstone Mid Cap Value Opportunities Fund acquired on March 21, 2014. If these transactions were included, portfolio turnover would have been higher. |
See accompanying Notes to Financial Statements.
| 153 |
Financial Highlights (Continued)
| Touchstone Premium Yield Equity Fund—Class A |
| Selected Data for a Share Outstanding Throughout Each Period |
| Year Ended September 30, | ||||||||||||||||||||
| 2018 | 2017 | 2016 | 2015 | 2014 | ||||||||||||||||
| Net asset value at beginning of period | $ | 9.40 | $ | 8.77 | $ | 8.27 | $ | 9.98 | $ | 8.92 | ||||||||||
| Income (loss) from investment operations: | ||||||||||||||||||||
| Net investment income | 0.24 | 0.25 | 0.22 | 0.24 | 0.40 | (A) | ||||||||||||||
| Net realized and unrealized gains (losses) on investments | 0.35 | 0.62 | 1.04 | (1.25 | ) | 1.07 | ||||||||||||||
| Total from investment operations | 0.59 | 0.87 | 1.26 | (1.01 | ) | 1.47 | ||||||||||||||
| Distributions from: | ||||||||||||||||||||
| Net investment income | (0.23 | ) | (0.24 | ) | (0.21 | ) | (0.25 | ) | (0.41 | ) | ||||||||||
| Realized capital gains | (0.18 | ) | — | (0.55 | ) | (0.45 | ) | — | ||||||||||||
| Total distributions | (0.41 | ) | (0.24 | ) | (0.76 | ) | (0.70 | ) | (0.41 | ) | ||||||||||
| Net asset value at end of period | $ | 9.58 | $ | 9.40 | $ | 8.77 | $ | 8.27 | $ | 9.98 | ||||||||||
| Total return(B) | 6.41 | % | 10.10 | % | 16.80 | % | (10.79 | %) | 16.79 | % | ||||||||||
| Ratios and supplemental data: | ||||||||||||||||||||
| Net assets at end of period (000's) | $ | 11,984 | $ | 22,725 | $ | 26,907 | $ | 36,023 | $ | 45,124 | ||||||||||
| Ratio to average net assets: | ||||||||||||||||||||
| Net expenses | 1.20 | % | 1.20 | % | 1.20 | % | 1.20 | % | 1.20 | % | ||||||||||
| Gross expenses | 1.41 | % | 1.36 | % | 1.34 | % | 1.25 | % | 1.29 | % | ||||||||||
| Net investment income | 2.16 | % | 2.69 | % | 2.57 | % | 2.57 | % | 4.24 | %(A) | ||||||||||
| Portfolio turnover rate | 68 | % | 39 | % | 38 | % | 31 | % | 26 | % | ||||||||||
| Touchstone Premium Yield Equity Fund—Class C |
| Selected Data for a Share Outstanding Throughout Each Period |
| Year Ended September 30, | ||||||||||||||||||||
| 2018 | 2017 | 2016 | 2015 | 2014 | ||||||||||||||||
| Net asset value at beginning of period | $ | 9.39 | $ | 8.75 | $ | 8.26 | $ | 9.97 | $ | 8.90 | ||||||||||
| Income (loss) from investment operations: | ||||||||||||||||||||
| Net investment income | 0.14 | 0.17 | 0.15 | 0.17 | 0.33 | (A) | ||||||||||||||
| Net realized and unrealized gains (losses) on investments | 0.38 | 0.64 | 1.04 | (1.24 | ) | 1.07 | ||||||||||||||
| Total from investment operations | 0.52 | 0.81 | 1.19 | (1.07 | ) | 1.40 | ||||||||||||||
| Distributions from: | ||||||||||||||||||||
| Net investment income | (0.16 | ) | (0.17 | ) | (0.15 | ) | (0.19 | ) | (0.33 | ) | ||||||||||
| Realized capital gains | (0.18 | ) | — | (0.55 | ) | (0.45 | ) | — | ||||||||||||
| Total distributions | (0.34 | ) | (0.17 | ) | (0.70 | ) | (0.64 | ) | (0.33 | ) | ||||||||||
| Net asset value at end of period | $ | 9.57 | $ | 9.39 | $ | 8.75 | $ | 8.26 | $ | 9.97 | ||||||||||
| Total return(B) | 5.62 | % | 9.42 | % | 15.81 | % | (11.45 | %) | 15.99 | % | ||||||||||
| Ratios and supplemental data: | ||||||||||||||||||||
| Net assets at end of period (000's) | $ | 19,455 | $ | 22,324 | $ | 25,781 | $ | 31,405 | $ | 31,190 | ||||||||||
| Ratio to average net assets: | ||||||||||||||||||||
| Net expenses | 1.95 | % | 1.95 | % | 1.95 | % | 1.95 | % | 1.95 | % | ||||||||||
| Gross expenses | 2.07 | % | 2.05 | % | 2.05 | % | 2.00 | % | 2.02 | % | ||||||||||
| Net investment income | 1.41 | % | 1.94 | % | 1.82 | % | 1.82 | % | 3.49 | %(A) | ||||||||||
| Portfolio turnover rate | 68 | % | 39 | % | 38 | % | 31 | % | 26 | % | ||||||||||
| (A) | Reflects the impact of a corporate action event that resulted in a one-time increase to net investment income. If the corporate action event had not occurred, the Class A and Class C net investment income per share and ratio of net investment income to average net assets would have been lower by $0.16 and 1.70%, respectively. |
| (B) | Total returns shown exclude the effect of applicable sales loads and fees. If these charges were included, the returns would be lower. |
See accompanying Notes to Financial Statements.
| 154 |
Financial Highlights (Continued)
| Touchstone Premium Yield Equity Fund—Class Y |
| Selected Data for a Share Outstanding Throughout Each Period |
| Year Ended September 30, | ||||||||||||||||||||
| 2018 | 2017 | 2016 | 2015 | 2014 | ||||||||||||||||
| Net asset value at beginning of period | $ | 9.38 | $ | 8.75 | $ | 8.25 | $ | 9.97 | $ | 8.90 | ||||||||||
| Income (loss) from investment operations: | ||||||||||||||||||||
| Net investment income | 0.23 | 0.26 | 0.23 | 0.26 | 0.43 | (A) | ||||||||||||||
| Net realized and unrealized gains (losses) on investments | 0.37 | 0.63 | 1.05 | (1.25 | ) | 1.07 | ||||||||||||||
| Total from investment operations | 0.60 | 0.89 | 1.28 | (0.99 | ) | 1.50 | ||||||||||||||
| Distributions from: | ||||||||||||||||||||
| Net investment income | (0.25 | ) | (0.26 | ) | (0.23 | ) | (0.28 | ) | (0.43 | ) | ||||||||||
| Realized capital gains | (0.18 | ) | — | (0.55 | ) | (0.45 | ) | — | ||||||||||||
| Total distributions | (0.43 | ) | (0.26 | ) | (0.78 | ) | (0.73 | ) | (0.43 | ) | ||||||||||
| Net asset value at end of period | $ | 9.55 | $ | 9.38 | $ | 8.75 | $ | 8.25 | $ | 9.97 | ||||||||||
| Total return | 6.59 | % | 10.41 | % | 17.13 | % | (10.58 | %) | 17.13 | % | ||||||||||
| Ratios and supplemental data: | ||||||||||||||||||||
| Net assets at end of period (000's) | $ | 56,185 | $ | 75,763 | $ | 99,953 | $ | 100,772 | $ | 109,201 | ||||||||||
| Ratio to average net assets: | ||||||||||||||||||||
| Net expenses | 0.95 | % | 0.95 | % | 0.95 | % | 0.95 | % | 0.95 | % | ||||||||||
| Gross expenses | 0.99 | % | 1.00 | % | 1.03 | % | 0.97 | % | 0.96 | % | ||||||||||
| Net investment income | 2.41 | % | 2.94 | % | 2.82 | % | 2.82 | % | 4.49 | %(A) | ||||||||||
| Portfolio turnover rate | 68 | % | 39 | % | 38 | % | 31 | % | 26 | % | ||||||||||
| (A) | Reflects the impact of a corporate action event that resulted in a one-time increase to net investment income. If the corporate action event had not occurred, the Class Y net investment income per share and ratio of net investment income to average net assets would have been lower by $0.16 and 1.70%, respectively. |
See accompanying Notes to Financial Statements.
| 155 |
Financial Highlights (Continued)
| Touchstone Sands Capital Select Growth Fund—Class A |
| Selected Data for a Share Outstanding Throughout Each Period |
| Year Ended September 30, | ||||||||||||||||||||
| 2018 | 2017 | 2016 | 2015 | 2014 | ||||||||||||||||
| Net asset value at beginning of period | $ | 16.58 | $ | 16.14 | $ | 16.48 | $ | 18.15 | $ | 16.08 | ||||||||||
| Income (loss) from investment operations: | ||||||||||||||||||||
| Net investment loss | (0.21 | ) | (0.34 | ) | (0.28 | ) | (0.15 | ) | (0.29 | ) | ||||||||||
| Net realized and unrealized gains (losses) on investments | 4.72 | 2.94 | 1.47 | (0.64 | ) | 2.49 | ||||||||||||||
| Total from investment operations | 4.51 | 2.60 | 1.19 | (0.79 | ) | 2.20 | ||||||||||||||
| Distributions from: | ||||||||||||||||||||
| Realized capital gains | (3.36 | ) | (2.16 | ) | (1.53 | ) | (0.88 | ) | (0.13 | ) | ||||||||||
| Net asset value at end of period | $ | 17.73 | $ | 16.58 | $ | 16.14 | $ | 16.48 | $ | 18.15 | ||||||||||
| Total return(A) | 33.03 | % | 19.63 | % | 7.17 | % | (4.70 | %) | 13.73 | % | ||||||||||
| Ratios and supplemental data: | ||||||||||||||||||||
| Net assets at end of period (000's) | $ | 97,583 | $ | 89,860 | $ | 138,315 | $ | 230,783 | $ | 289,506 | ||||||||||
| Ratio to average net assets: | ||||||||||||||||||||
| Net expenses (including liquidity provider expenses)(B) | 1.43 | % | 1.23 | % | 1.07 | % | 1.10 | % | 1.31 | % | ||||||||||
| Gross expenses (including liquidity provider expenses)(C) | 1.43 | % | 1.25 | % | 1.09 | % | 1.10 | % | 1.33 | % | ||||||||||
| Net investment loss | (1.28 | %) | (0.95 | %) | (0.81 | %) | (0.65 | %) | (0.91 | %) | ||||||||||
| Portfolio turnover rate | 21 | %(D) | 22 | % | 46 | % | 29 | % | 30 | % | ||||||||||
| Touchstone Sands Capital Select Growth Fund—Class C |
| Selected Data for a Share Outstanding Throughout Each Period |
| Year Ended September 30, | ||||||||||||||||||||
| 2018 | 2017 | 2016 | 2015 | 2014 | ||||||||||||||||
| Net asset value at beginning of period | $ | 15.51 | $ | 15.36 | $ | 15.86 | $ | 17.62 | $ | 15.74 | ||||||||||
| Income (loss) from investment operations: | ||||||||||||||||||||
| Net investment loss | (0.24 | ) | (0.79 | ) | (0.52 | ) | (0.30 | ) | (0.32 | ) | ||||||||||
| Net realized and unrealized gains (losses) on investments | 4.29 | 3.10 | 1.55 | (0.58 | ) | 2.33 | ||||||||||||||
| Total from investment operations | 4.05 | 2.31 | 1.03 | (0.88 | ) | 2.01 | ||||||||||||||
| Distributions from: | ||||||||||||||||||||
| Realized capital gains | (3.36 | ) | (2.16 | ) | (1.53 | ) | (0.88 | ) | (0.13 | ) | ||||||||||
| Net asset value at end of period | $ | 16.20 | $ | 15.51 | $ | 15.36 | $ | 15.86 | $ | 17.62 | ||||||||||
| Total return(A) | 32.11 | % | 18.77 | % | 6.32 | % | (5.38 | %) | 12.89 | % | ||||||||||
| Ratios and supplemental data: | ||||||||||||||||||||
| Net assets at end of period (000's) | $ | 80,444 | $ | 73,516 | $ | 111,951 | $ | 163,237 | $ | 203,865 | ||||||||||
| Ratio to average net assets: | ||||||||||||||||||||
| Net expenses (including liquidity provider expenses)(B) | 2.18 | % | 1.98 | % | 1.82 | % | 1.85 | % | 2.06 | % | ||||||||||
| Gross expenses (including liquidity provider expenses)(C) | 2.19 | % | 2.01 | % | 1.84 | % | 1.85 | % | 2.09 | % | ||||||||||
| Net investment loss | (2.03 | %) | (1.70 | %) | (1.56 | %) | (1.40 | %) | (1.65 | %) | ||||||||||
| Portfolio turnover rate | 21 | %(D) | 22 | % | 46 | % | 29 | % | 30 | % | ||||||||||
| (A) | Total returns shown exclude the effect of applicable sales loads and fees. If these charges were included, the returns would be lower. |
| (B) | The ratio of net expenses to average net assets excluding liquidity provider expenses for Class A was 1.42% and for Class C was 2.17% for the year ended September 30, 2018. There were no liquidity provider expenses prior to 2018. |
| (C) | The ratio of gross expenses to average net assets excluding liquidity provider expenses for Class A was 1.42% and for Class C was 2.18% for the year ended September 30, 2018. There were no liquidity provider expenses prior to 2018. |
| (D) | Portfolio turnover excludes securities delivered from processing redemptions-in-kind. |
See accompanying Notes to Financial Statements.
| 156 |
Financial Highlights (Continued)
| Touchstone Sands Capital Select Growth Fund—Class Y |
| Selected Data for a Share Outstanding Throughout Each Period |
| Year Ended September 30, | ||||||||||||||||||||
| 2018 | 2017 | 2016 | 2015 | 2014 | ||||||||||||||||
| Net asset value at beginning of period | $ | 17.29 | $ | 16.70 | $ | 16.96 | $ | 18.61 | $ | 16.44 | ||||||||||
| Income (loss) from investment operations: | ||||||||||||||||||||
| Net investment loss | (0.18 | ) | (0.10 | ) | (0.11 | ) | (0.08 | ) | (0.10 | ) | ||||||||||
| Net realized and unrealized gains (losses) on investments | 4.98 | 2.85 | 1.38 | (0.69 | ) | 2.40 | ||||||||||||||
| Total from investment operations | 4.80 | 2.75 | 1.27 | (0.77 | ) | 2.30 | ||||||||||||||
| Distributions from: | ||||||||||||||||||||
| Realized capital gains | (3.36 | ) | (2.16 | ) | (1.53 | ) | (0.88 | ) | (0.13 | ) | ||||||||||
| Net asset value at end of period | $ | 18.73 | $ | 17.29 | $ | 16.70 | $ | 16.96 | $ | 18.61 | ||||||||||
| Total return | 33.36 | % | 19.89 | % | 7.46 | % | (4.46 | %) | 14.04 | % | ||||||||||
| Ratios and supplemental data: | ||||||||||||||||||||
| Net assets at end of period (000's) | $ | 1,556,324 | $ | 1,775,755 | $ | 2,209,841 | $ | 3,198,758 | $ | 3,473,661 | ||||||||||
| Ratio to average net assets: | ||||||||||||||||||||
| Net expenses (including liquidity provider expenses)(A) | 1.18 | %(B) | 0.98 | % | 0.82 | % | 0.83 | % | 1.06 | % | ||||||||||
| Gross expenses (including liquidity provider expenses)(C) | 1.17 | % | 0.99 | % | 0.82 | % | 0.83 | % | 1.03 | % | ||||||||||
| Net investment loss | (1.03 | %) | (0.70 | %) | (0.56 | %) | (0.39 | %) | (0.66 | %) | ||||||||||
| Portfolio turnover rate | 21 | %(D) | 22 | % | 46 | % | 29 | % | 30 | % | ||||||||||
| Touchstone Sands Capital Select Growth Fund—Class Z |
| Selected Data for a Share Outstanding Throughout Each Period |
| Year Ended September 30, | ||||||||||||||||||||
| 2018 | 2017 | 2016 | 2015 | 2014 | ||||||||||||||||
| Net asset value at beginning of period | $ | 16.58 | $ | 16.15 | $ | 16.49 | $ | 18.15 | $ | 16.08 | ||||||||||
| Income (loss) from investment operations: | ||||||||||||||||||||
| Net investment loss | (0.20 | ) | (0.32 | ) | (0.29 | ) | (0.19 | ) | (0.17 | ) | ||||||||||
| Net realized and unrealized gains (losses) on investments | 4.73 | 2.91 | 1.48 | (0.59 | ) | 2.37 | ||||||||||||||
| Total from investment operations | 4.53 | 2.59 | 1.19 | (0.78 | ) | 2.20 | ||||||||||||||
| Distributions from: | ||||||||||||||||||||
| Realized capital gains | (3.36 | ) | (2.16 | ) | (1.53 | ) | (0.88 | ) | (0.13 | ) | ||||||||||
| Net asset value at end of period | $ | 17.75 | $ | 16.58 | $ | 16.15 | $ | 16.49 | $ | 18.15 | ||||||||||
| Total return | 33.10 | % | 19.62 | % | 7.24 | % | (4.70 | %) | 13.73 | % | ||||||||||
| Ratios and supplemental data: | ||||||||||||||||||||
| Net assets at end of period (000's) | $ | 611,071 | $ | 556,651 | $ | 777,930 | $ | 1,292,853 | $ | 2,302,038 | ||||||||||
| Ratio to average net assets: | ||||||||||||||||||||
| Net expenses (including liquidity provider expenses)(A) | 1.42 | % | 1.22 | % | 1.04 | % | 1.08 | % | 1.31 | % | ||||||||||
| Gross expenses (including liquidity-provider expenses)(C) | 1.47 | % | 1.28 | % | 1.11 | % | 1.13 | % | 1.35 | % | ||||||||||
| Net investment loss | (1.27 | %) | (0.94 | %) | (0.79 | %) | (0.64 | %) | (0.90 | %) | ||||||||||
| Portfolio turnover rate | 21 | %(D) | 22 | % | 46 | % | 29 | % | 30 | % | ||||||||||
| (A) | The ratio of net expenses to average net assets excluding liquidity provider expenses for Class Y was 1.17% and for Class Z was 1.41% for the year ended September 30, 2018. There were no liquidity provider expenses prior to 2018. |
| (B) | Net expenses include amounts recouped by the Advisor. |
| (C) | The ratio of gross expenses to average net assets excluding liquidity provider expenses for Class Y was 1.16% and for Class Z was 1.46% for the year ended September 30, 2018. There were no liquidity provider expenses prior to 2018. |
| (D) | Portfolio turnover excludes securities delivered from processing redemptions-in-kind. |
See accompanying Notes to Financial Statements.
| 157 |
Financial Highlights (Continued)
| Touchstone Small Cap Fund—Class A |
| Selected Data for a Share Outstanding Throughout Each Period |
| Year Ended September 30, | ||||||||||||||||||||
| 2018 | 2017 | 2016 | 2015 | 2014 | ||||||||||||||||
| Net asset value at beginning of period | $ | 17.73 | $ | 16.24 | $ | 17.73 | $ | 20.55 | $ | 19.44 | ||||||||||
| Income (loss) from investment operations: | ||||||||||||||||||||
| Net investment income (loss) | 0.32 | (A) | 0.02 | — | (B) | 0.15 | (C) | (0.09 | )(A) | |||||||||||
| Net realized and unrealized gains (losses) on investments | 1.52 | 1.47 | 0.59 | (1.38 | ) | 1.80 | ||||||||||||||
| Total from investment operations | 1.84 | 1.49 | 0.59 | (1.23 | ) | 1.71 | ||||||||||||||
| Distributions from: | ||||||||||||||||||||
| Net investment income | (0.34 | ) | — | (0.13 | ) | (— | )(B) | (0.31 | ) | |||||||||||
| Realized capital gains | (2.99 | ) | — | (1.95 | ) | (1.59 | ) | (0.29 | ) | |||||||||||
| Total distributions | (3.33 | ) | — | (2.08 | ) | (1.59 | ) | (0.60 | ) | |||||||||||
| Net asset value at end of period | $ | 16.24 | $ | 17.73 | $ | 16.24 | $ | 17.73 | $ | 20.55 | ||||||||||
| Total return(D) | 12.14 | % | 9.17 | % | 3.74 | % | (6.36 | %) | 8.80 | % | ||||||||||
| Ratios and supplemental data: | ||||||||||||||||||||
| Net assets at end of period (000's) | $ | 8,142 | $ | 12,461 | $ | 37,942 | $ | 62,423 | $ | 60,246 | ||||||||||
| Ratio to average net assets: | ||||||||||||||||||||
| Net expenses (including liquidity provider expenses)(E) | 1.39 | % | 1.38 | % | 1.38 | % | 1.38 | % | 1.36 | % | ||||||||||
| Gross expenses (including liquidity provider expenses)(F) | 1.65 | % | 1.52 | % | 1.45 | % | 1.42 | % | 1.43 | % | ||||||||||
| Net investment income (loss) | 1.99 | %(G) | 0.00 | %(B) | 0.00 | %(B) | 0.75 | %(C) | (0.45 | %) | ||||||||||
| Portfolio turnover rate | 29 | %(H) | 18 | % | 17 | % | 42 | % | 17 | % | ||||||||||
| (A) | The net investment income (loss) per share was based on average shares outstanding for the period. |
| (B) | Less than $0.005 per share or 0.005%. |
| (C) | Reflects the impact of a corporate action event that resulted in a one-time increase to net investment income. If the corporate action event had not occurred, the Class A net investment income per share and ratio of net investment income to average net assets would have been lower by $0.13 and 0.65%, respectively. |
| (D) | Total returns shown exclude the effect of applicable sales loads and fees. If these charges were included, the returns would be lower. |
| (E) | The ratio of net expenses to average net assets excluding liquidity provider expenses for Class A was 1.38% for the year ended September 30, 2018. There were no liquidity provider expenses prior to 2018. |
| (F) | The ratio of gross expenses to average net assets excluding liquidity provider expenses for Class A was 1.64% for the year ended September 30, 2018. There were no liquidity provider expenses prior to 2018. |
| (G) | Includes impact of special dividend from Alexander & Baldwin Inc. in January, 2018 as part of the company's conversion to a real estate investment trust. This special dividend enhanced the ratio of net investment income for Class A by 2.10% for the fiscal year ended September 30, 2018. |
| (H) | Portfolio turnover excludes securities delivered from processing redemptions-in-kind. |
See accompanying Notes to Financial Statements.
| 158 |
Financial Highlights (Continued)
| Touchstone Small Cap Fund—Class C |
| Selected Data for a Share Outstanding Throughout Each Period |
| Year Ended September 30, | ||||||||||||||||||||
| 2018 | 2017 | 2016 | 2015 | 2014 | ||||||||||||||||
| Net asset value at beginning of period | $ | 16.94 | $ | 15.63 | $ | 17.16 | $ | 20.07 | $ | 19.01 | ||||||||||
| Income (loss) from investment operations: | ||||||||||||||||||||
| Net investment income (loss) | 0.19 | (A) | (0.31 | ) | (0.16 | ) | — | (B)(C) | (0.24 | )(A) | ||||||||||
| Net realized and unrealized gains (losses) on investments | 1.45 | 1.62 | 0.60 | (1.32 | ) | 1.75 | ||||||||||||||
| Total from investment operations | 1.64 | 1.31 | 0.44 | (1.32 | ) | 1.51 | ||||||||||||||
| Distributions from: | ||||||||||||||||||||
| Net investment income | (0.19 | ) | — | (0.02 | ) | — | (0.16 | ) | ||||||||||||
| Realized capital gains | (2.99 | ) | — | (1.95 | ) | (1.59 | ) | (0.29 | ) | |||||||||||
| Total distributions | (3.18 | ) | — | (1.97 | ) | (1.59 | ) | (0.45 | ) | |||||||||||
| Net asset value at end of period | $ | 15.40 | $ | 16.94 | $ | 15.63 | $ | 17.16 | $ | 20.07 | ||||||||||
| Total return(D) | 11.33 | % | 8.38 | % | 2.92 | % | (7.01 | %) | 7.96 | % | ||||||||||
| Ratios and supplemental data: | ||||||||||||||||||||
| Net assets at end of period (000's) | $ | 6,299 | $ | 9,266 | $ | 14,957 | $ | 21,562 | $ | 27,104 | ||||||||||
| Ratio to average net assets: | ||||||||||||||||||||
| Net expenses (including liquidity provider expenses)(E) | 2.14 | % | 2.13 | % | 2.13 | % | 2.13 | % | 2.12 | % | ||||||||||
| Gross expenses (including liquidity provider expenses)(F) | 2.40 | % | 2.28 | % | 2.23 | % | 2.17 | % | 2.17 | % | ||||||||||
| Net investment income (loss) | 1.24 | %(G) | (0.75 | %) | (0.75 | %) | 0.00 | %(B)(C) | (1.20 | %) | ||||||||||
| Portfolio turnover rate | 29 | %(H) | 18 | % | 17 | % | 42 | % | 17 | % | ||||||||||
| (A) | The net investment income (loss) per share was based on average shares outstanding for the period. |
| (B) | Less than $0.005 per share or 0.005%. |
| (C) | Reflects the impact of a corporate action event that resulted in a one-time increase to net investment income. If the corporate action event had not occurred, the Class C net investment income per share and ratio of net investment income to average net assets would have been lower by $0.13 and 0.65%, respectively. |
| (D) | Total returns shown exclude the effect of applicable sales loads and fees. If these charges were included, the returns would be lower. |
| (E) | The ratio of net expenses to average net assets excluding liquidity provider expenses for Class C was 2.13% for the year ended September 30, 2018. There were no liquidity provider expenses prior to 2018. |
| (F) | The ratio of gross expenses to average net assets excluding liquidity provider expenses for Class C was 2.39% for the year ended September 30, 2018. There were no liquidity provider expenses prior to 2018. |
| (G) | Includes impact of special dividend from Alexander & Baldwin Inc. in January, 2018 as part of the company's conversion to a real estate investment trust. This special dividend enhanced the ratio of net investment income for Class C by 2.10% for the fiscal year ended September 30, 2018. |
| (H) | Portfolio turnover excludes securities delivered from processing redemptions-in-kind. |
See accompanying Notes to Financial Statements.
| 159 |
Financial Highlights (Continued)
| Touchstone Small Cap Fund—Class Y |
| Selected Data for a Share Outstanding Throughout Each Period |
| Year Ended September 30, | ||||||||||||||||||||
| 2018 | 2017 | 2016 | 2015 | 2014 | ||||||||||||||||
| Net asset value at beginning of period | $ | 17.94 | $ | 16.44 | $ | 17.93 | $ | 20.72 | $ | 19.59 | ||||||||||
| Income (loss) from investment operations: | ||||||||||||||||||||
| Net investment income (loss) | 0.37 | (A) | 0.05 | 0.05 | 0.18 | (B) | (0.03 | )(A) | ||||||||||||
| Net realized and unrealized gains (losses) on investments | 1.53 | 1.50 | 0.58 | (1.37 | ) | 1.81 | ||||||||||||||
| Total from investment operations | 1.90 | 1.55 | 0.63 | (1.19 | ) | 1.78 | ||||||||||||||
| Distributions from: | ||||||||||||||||||||
| Net investment income | (0.40 | ) | (0.05 | ) | (0.17 | ) | (0.01 | ) | (0.36 | ) | ||||||||||
| Realized capital gains | (2.99 | ) | — | (1.95 | ) | (1.59 | ) | (0.29 | ) | |||||||||||
| Total distributions | (3.39 | ) | (0.05 | ) | (2.12 | ) | (1.60 | ) | (0.65 | ) | ||||||||||
| Net asset value at end of period | $ | 16.45 | $ | 17.94 | $ | 16.44 | $ | 17.93 | $ | 20.72 | ||||||||||
| Total return | 12.44 | % | 9.46 | % | 3.97 | % | (6.11 | %) | 9.12 | % | ||||||||||
| Ratios and supplemental data: | ||||||||||||||||||||
| Net assets at end of period (000's) | $ | 51,218 | $ | 84,954 | $ | 295,198 | $ | 333,971 | $ | 309,367 | ||||||||||
| Ratio to average net assets: | ||||||||||||||||||||
| Net expenses (including liquidity provider expenses)(C) | 1.14 | % | 1.13 | % | 1.13 | % | 1.11 | % | 1.06 | % | ||||||||||
| Gross expenses (including liquidity provider expenses)(D) | 1.17 | % | 1.15 | % | 1.14 | % | 1.11 | % | 1.08 | % | ||||||||||
| Net investment income (loss) | 2.24 | %(E) | 0.25 | % | 0.25 | % | 1.02 | %(B) | (0.15 | %) | ||||||||||
| Portfolio turnover rate | 29 | %(F) | 18 | % | 17 | % | 42 | % | 17 | % | ||||||||||
| (A) | The net investment income (loss) per share was based on average shares outstanding for the period. |
| (B) | Reflects the impact of a corporate action event that resulted in a one-time increase to net investment income. If the corporate action event had not occurred, the Class Y net investment income per share and ratio of net investment income to average net assets would have been lower by $0.13 and 0.65%, respectively. |
| (C) | The ratio of net expenses to average net assets excluding liquidity provider expenses for Class Y was 1.13% for the year ended September 30, 2018. There were no liquidity provider expenses prior to 2018. |
| (D) | The ratio of gross expenses to average net assets excluding liquidity provider expenses for Class Y was 1.16% for the year ended September 30, 2018. There were no liquidity provider expenses prior to 2018. |
| (E) | Includes impact of special dividend from Alexander & Baldwin Inc. in January, 2018 as part of the company's conversion to a real estate investment trust. This special dividend enhanced the ratio of net investment income for Class Y by 2.10% for the fiscal year ended September 30, 2018. |
| (F) | Portfolio turnover excludes securities delivered from processing redemptions-in-kind. |
See accompanying Notes to Financial Statements.
| 160 |
Financial Highlights (Continued)
| Touchstone Small Cap Fund—Institutional Class |
| Selected Data for a Share Outstanding Throughout Each Period |
| Year Ended September 30, | ||||||||||||||||||||
| 2018 | 2017 | 2016 | 2015 | 2014 | ||||||||||||||||
| Net asset value at beginning of period | $ | 17.93 | $ | 16.43 | $ | 17.92 | $ | 20.69 | $ | 19.57 | ||||||||||
| Income (loss) from investment operations: | ||||||||||||||||||||
| Net investment income (loss) | 0.38 | (A) | 0.16 | 0.07 | 0.24 | (B) | (0.02 | )(A) | ||||||||||||
| Net realized and unrealized gains (losses) on investments | 1.53 | 1.41 | 0.57 | (1.41 | ) | 1.81 | ||||||||||||||
| Total from investment operations | 1.91 | 1.57 | 0.64 | (1.17 | ) | 1.79 | ||||||||||||||
| Distributions from: | ||||||||||||||||||||
| Net investment income | (0.45 | ) | (0.07 | ) | (0.18 | ) | (0.01 | ) | (0.38 | ) | ||||||||||
| Realized capital gains | (2.99 | ) | — | (1.95 | ) | (1.59 | ) | (0.29 | ) | |||||||||||
| Total distributions | (3.44 | ) | (0.07 | ) | (2.13 | ) | (1.60 | ) | (0.67 | ) | ||||||||||
| Net asset value at end of period | $ | 16.40 | $ | 17.93 | $ | 16.43 | $ | 17.92 | $ | 20.69 | ||||||||||
| Total return | 12.52 | % | 9.57 | % | 4.05 | % | (6.01 | %) | 9.17 | % | ||||||||||
| Ratios and supplemental data: | ||||||||||||||||||||
| Net assets at end of period (000's) | $ | 93,636 | $ | 122,876 | $ | 255,422 | $ | 301,868 | $ | 393,287 | ||||||||||
| Ratio to average net assets: | ||||||||||||||||||||
| Net expenses (including liquidity provider expenses)(C) | 1.06 | % | 1.05 | % | 1.04 | % | 1.04 | % | 1.01 | % | ||||||||||
| Gross expenses (including liquidity provider expenses)(D) | 1.10 | % | 1.05 | % | 1.04 | % | 1.04 | % | 1.04 | % | ||||||||||
| Net investment income (loss) | 2.32 | %(E) | 0.34 | % | 0.34 | % | 1.10 | %(B) | (0.10 | %) | ||||||||||
| Portfolio turnover rate | 29 | %(F) | 18 | % | 17 | % | 42 | % | 17 | % | ||||||||||
| (A) | The net investment income (loss) per share was based on average shares outstanding for the period. |
| (B) | Reflects the impact of a corporate action event that resulted in a one-time increase to net investment income. If the corporate action event had not occurred, the Institutional Class net investment income per share and ratio of net investment income to average net assets would have been lower by $0.13 and 0.65%, respectively. |
| (C) | The ratio of net expenses to average net assets excluding liquidity provider expenses for Institutional Class was 1.05% for the year ended September 30, 2018. There were no liquidity provider expenses prior to 2018. |
| (D) | The ratio of gross expenses to average net assets excluding liquidity provider expenses for Institutional Class was 1.09% for the year ended September 30, 2018. There were no liquidity provider expenses prior to 2018. |
| (E) | Includes impact of special dividend from Alexander & Baldwin Inc. in January, 2018 as part of the company's conversion to a real estate investment trust. This special dividend enhanced the ratio of net investment income for Institutional Class by 2.10% for the fiscal year ended September 30, 2018. |
| (F) | Portfolio turnover excludes securities delivered from processing redemptions-in-kind. |
See accompanying Notes to Financial Statements.
| 161 |
Financial Highlights (Continued)
| Touchstone Small Cap Value Fund—Class A |
| Selected Data for a Share Outstanding Throughout Each Period |
| Year Ended September 30, | ||||||||||||||||||||
| 2018 | 2017 | 2016 | 2015 | 2014 | ||||||||||||||||
| Net asset value at beginning of period | $ | 26.06 | $ | 22.20 | $ | 20.17 | $ | 23.23 | $ | 22.79 | ||||||||||
| Income (loss) from investment operations: | ||||||||||||||||||||
| Net investment income | 0.02 | 0.03 | 0.23 | 0.36 | 0.36 | |||||||||||||||
| Net realized and unrealized gains (losses) on investments | 1.83 | 3.85 | 2.80 | (2.15 | ) | 0.39 | ||||||||||||||
| Total from investment operations | 1.85 | 3.88 | 3.03 | (1.79 | ) | 0.75 | ||||||||||||||
| Distributions from: | ||||||||||||||||||||
| Net investment income | — | (A) | (0.02 | ) | (0.27 | ) | (0.35 | ) | (0.31 | ) | ||||||||||
| Realized capital gains | — | — | (0.73 | ) | (0.92 | ) | — | |||||||||||||
| Total distributions | — | (A) | (0.02 | ) | (1.00 | ) | (1.27 | ) | (0.31 | ) | ||||||||||
| Net asset value at end of period | $ | 27.91 | $ | 26.06 | $ | 22.20 | $ | 20.17 | $ | 23.23 | ||||||||||
| Total return(B) | 7.12 | % | 17.46 | % | 15.63 | % | (8.32 | %) | 3.19 | % | ||||||||||
| Ratios and supplemental data: | ||||||||||||||||||||
| Net assets at end of period (000's) | $ | 83,139 | $ | 76,884 | $ | 150,081 | $ | 24,659 | $ | 31,773 | ||||||||||
| Ratio to average net assets: | ||||||||||||||||||||
| Net expenses | 1.38 | % | 1.38 | % | 1.38 | % | 1.38 | % | 1.43 | % | ||||||||||
| Gross expenses | 1.75 | % | 1.83 | % | 1.67 | % | 1.60 | % | 1.67 | % | ||||||||||
| Net investment income | 0.09 | % | 0.07 | % | 1.05 | % | 1.51 | % | 1.44 | % | ||||||||||
| Portfolio turnover rate | 49 | %(C)(D) | 63 | %(D) | 155 | % | 112 | % | 100 | %(E)(F) | ||||||||||
| Touchstone Small Cap Value Fund—Class C |
| Selected Data for a Share Outstanding Throughout Each Period |
| Year Ended September 30, | ||||||||||||||||||||
| 2018 | 2017 | 2016 | 2015 | 2014 | ||||||||||||||||
| Net asset value at beginning of period | $ | 25.60 | $ | 21.95 | $ | 19.98 | $ | 23.00 | $ | 22.61 | ||||||||||
| Income (loss) from investment operations: | ||||||||||||||||||||
| Net investment income (loss) | (0.11 | ) | (0.22 | ) | 0.06 | 0.17 | 0.16 | |||||||||||||
| Net realized and unrealized gains (losses) on investments | 1.73 | 3.87 | 2.77 | (2.10 | ) | 0.40 | ||||||||||||||
| Total from investment operations | 1.62 | 3.65 | 2.83 | (1.93 | ) | 0.56 | ||||||||||||||
| Distributions from: | ||||||||||||||||||||
| Net investment income | — | — | (0.13 | ) | (0.17 | ) | (0.17 | ) | ||||||||||||
| Realized capital gains | — | — | (0.73 | ) | (0.92 | ) | — | |||||||||||||
| Total distributions | — | — | (0.86 | ) | (1.09 | ) | (0.17 | ) | ||||||||||||
| Net asset value at end of period | $ | 27.22 | $ | 25.60 | $ | 21.95 | $ | 19.98 | $ | 23.00 | ||||||||||
| Total return(B) | 6.29 | % | 16.63 | % | 14.72 | % | (9.01 | %) | 2.46 | % | ||||||||||
| Ratios and supplemental data: | ||||||||||||||||||||
| Net assets at end of period (000's) | $ | 1,433 | $ | 1,223 | $ | 1,376 | $ | 1,396 | $ | 2,169 | ||||||||||
| Ratio to average net assets: | ||||||||||||||||||||
| Net expenses | 2.13 | % | 2.13 | % | 2.13 | % | 2.13 | % | 2.18 | % | ||||||||||
| Gross expenses | 3.66 | % | 3.69 | % | 3.39 | % | 3.13 | % | 3.25 | % | ||||||||||
| Net investment income (loss) | (0.66 | %) | (0.68 | %) | 0.30 | % | 0.76 | % | 0.69 | % | ||||||||||
| Portfolio turnover rate | 49 | %(C)(D) | 63 | %(D) | 155 | % | 112 | % | 100 | %(E)(F) | ||||||||||
| (A) | Less than $0.005 per share. |
| (B) | Total returns shown exclude the effect of applicable sales loads and fees. If these charges were included, the returns would be lower. |
| (C) | Portfolio turnover excludes the purchases and sales of securities of the Touchstone Small Cap Value Opportunities Fund acquired on September 21, 2018 (See Note 9 in the Notes to Financial Statements). If these transactions were included, portfolio turnover would have been higher. |
| (D) | Portfolio turnover excludes securities delivered from processing redemptions-in-kind. |
| (E) | Portfolio turnover excludes securities received from a subscription-in-kind. |
| (F) | Portfolio turnover excludes the purchases and sales of securities of the Touchstone Small Company Value Fund acquired on March 21, 2014. If these transactions were included, portfolio turnover would have been higher. |
See accompanying Notes to Financial Statements.
| 162 |
Financial Highlights (Continued)
| Touchstone Small Cap Value Fund—Class Y |
| Selected Data for a Share Outstanding Throughout Each Period |
| Year Ended September 30, | ||||||||||||||||||||
| 2018 | 2017 | 2016 | 2015 | 2014 | ||||||||||||||||
| Net asset value at beginning of period | $ | 26.14 | $ | 22.24 | $ | 20.20 | $ | 23.25 | $ | 22.82 | ||||||||||
| Income (loss) from investment operations: | ||||||||||||||||||||
| Net investment income | 0.15 | 0.06 | 0.24 | 0.42 | 0.35 | |||||||||||||||
| Net realized and unrealized gains (losses) on investments | 1.78 | 3.88 | 2.84 | (2.14 | ) | 0.46 | ||||||||||||||
| Total from investment operations | 1.93 | 3.94 | 3.08 | (1.72 | ) | 0.81 | ||||||||||||||
| Distributions from: | ||||||||||||||||||||
| Net investment income | (0.11 | ) | (0.04 | ) | (0.31 | ) | (0.41 | ) | (0.38 | ) | ||||||||||
| Realized capital gains | — | — | (0.73 | ) | (0.92 | ) | — | |||||||||||||
| Total distributions | (0.11 | ) | (0.04 | ) | (1.04 | ) | (1.33 | ) | (0.38 | ) | ||||||||||
| Net asset value at end of period | $ | 27.96 | $ | 26.14 | $ | 22.24 | $ | 20.20 | $ | 23.25 | ||||||||||
| Total return | 7.41 | % | 17.80 | % | 15.86 | % | (8.08 | %) | 3.47 | % | ||||||||||
| Ratios and supplemental data: | ||||||||||||||||||||
| Net assets at end of period (000's) | $ | 41,365 | $ | 2,829 | $ | 3,080 | $ | 4,419 | $ | 9,097 | ||||||||||
| Ratio to average net assets: | ||||||||||||||||||||
| Net expenses | 1.13 | % | 1.13 | % | 1.13 | % | 1.13 | % | 1.18 | % | ||||||||||
| Gross expenses | 1.71 | % | 1.95 | % | 1.70 | % | 1.44 | % | 1.65 | % | ||||||||||
| Net investment income | 0.34 | % | 0.32 | % | 1.30 | % | 1.76 | % | 1.70 | % | ||||||||||
| Portfolio turnover rate | 49 | %(A)(B) | 63 | %(B) | 155 | % | 112 | % | 100 | %(C)(D) | ||||||||||
| Touchstone Small Cap Value Fund—Institutional Class |
| Selected Data for a Share Outstanding Throughout Each Period |
| Year Ended September 30, | ||||||||||||||||||||
| 2018 | 2017 | 2016 | 2015 | 2014 | ||||||||||||||||
| Net asset value at beginning of period | $ | 26.14 | $ | 22.22 | $ | 20.19 | $ | 23.24 | $ | 22.81 | ||||||||||
| Income (loss) from investment operations: | ||||||||||||||||||||
| Net investment income (loss) | 0.28 | (0.06 | ) | 0.30 | 0.45 | 0.40 | ||||||||||||||
| Net realized and unrealized gains (losses) on investments | 1.69 | 4.04 | 2.80 | (2.13 | ) | 0.44 | ||||||||||||||
| Total from investment operations | 1.97 | 3.98 | 3.10 | (1.68 | ) | 0.84 | ||||||||||||||
| Distributions from: | ||||||||||||||||||||
| Net investment income | (0.17 | ) | (0.06 | ) | (0.34 | ) | (0.45 | ) | (0.41 | ) | ||||||||||
| Realized capital gains | — | — | (0.73 | ) | (0.92 | ) | — | |||||||||||||
| Total distributions | (0.17 | ) | (0.06 | ) | (1.07 | ) | (1.37 | ) | (0.41 | ) | ||||||||||
| Net asset value at end of period | $ | 27.94 | $ | 26.14 | $ | 22.22 | $ | 20.19 | $ | 23.24 | ||||||||||
| Total return | 7.53 | % | 17.93 | % | 16.05 | % | (7.93 | %) | 3.59 | % | ||||||||||
| Ratios and supplemental data: | ||||||||||||||||||||
| Net assets at end of period (000's) | $ | 29,279 | $ | 7,699 | $ | 23,740 | $ | 25,968 | $ | 29,831 | ||||||||||
| Ratio to average net assets: | ||||||||||||||||||||
| Net expenses | 0.98 | % | 0.98 | % | 0.98 | % | 0.98 | % | 1.03 | % | ||||||||||
| Gross expenses | 1.27 | % | 1.52 | % | 1.22 | % | 1.19 | % | 1.30 | % | ||||||||||
| Net investment income | 0.49 | % | 0.47 | % | 1.45 | % | 1.91 | % | 1.84 | % | ||||||||||
| Portfolio turnover rate | 49 | %(A)(B) | 63 | %(B) | 155 | % | 112 | % | 100 | %(C)(D) | ||||||||||
| (A) | Portfolio turnover excludes the purchases and sales of securities of the Touchstone Small Cap Value Opportunities Fund acquired on September 21, 2018 (See Note 9 in the Notes to Financial Statements). If these transactions were included, portfolio turnover would have been higher. |
| (B) | Portfolio turnover excludes securities delivered from processing redemptions-in-kind. |
| (C) | Portfolio turnover excludes securities received from a subscription-in-kind. |
| (D) | Portfolio turnover excludes the purchases and sales of securities of the Touchstone Small Company Value Fund acquired on March 21, 2014. If these transactions were included, portfolio turnover would have been higher. |
See accompanying Notes to Financial Statements.
| 163 |
Financial Highlights (Continued)
| Touchstone Ultra Short Duration Fixed Income Fund—Class A |
| Selected Data for a Share Outstanding Throughout Each Period |
| Year Ended September 30, | ||||||||||||||||||||
| 2018 | 2017 | 2016 | 2015 | 2014 | ||||||||||||||||
| Net asset value at beginning of period | $ | 9.29 | $ | 9.32 | $ | 9.32 | $ | 9.41 | $ | 9.45 | ||||||||||
| Income (loss) from investment operations: | ||||||||||||||||||||
| Net investment income | 0.16 | 0.13 | 0.10 | 0.06 | 0.06 | |||||||||||||||
| Net realized and unrealized gains (losses) on investments | (0.01 | ) | (0.02 | ) | 0.02 | (0.03 | ) | 0.03 | ||||||||||||
| Total from investment operations | 0.15 | 0.11 | 0.12 | 0.03 | 0.09 | |||||||||||||||
| Distributions from: | ||||||||||||||||||||
| Net investment income | (0.19 | ) | (0.14 | ) | (0.12 | ) | (0.12 | ) | (0.13 | ) | ||||||||||
| Net asset value at end of period | $ | 9.25 | $ | 9.29 | $ | 9.32 | $ | 9.32 | $ | 9.41 | ||||||||||
| Total return(A) | 1.50 | % | 1.29 | % | 1.35 | % | 0.31 | % | 0.92 | % | ||||||||||
| Ratios and supplemental data: | ||||||||||||||||||||
| Net assets at end of period (000's) | $ | 76,623 | $ | 14,080 | $ | 16,946 | $ | 10,675 | $ | 10,596 | ||||||||||
| Ratio to average net assets: | ||||||||||||||||||||
| Net expenses | 0.69 | % | 0.69 | % | 0.69 | % | 0.69 | % | 0.69 | % | ||||||||||
| Gross expenses | 0.81 | % | 0.90 | % | 0.97 | % | 0.99 | % | 0.93 | % | ||||||||||
| Net investment income | 1.88 | % | 1.40 | % | 1.09 | % | 0.54 | % | 0.79 | % | ||||||||||
| Portfolio turnover rate | 143 | %(B) | 136 | % | 169 | % | 132 | % | 142 | % | ||||||||||
| Touchstone Ultra Short Duration Fixed Income Fund—Class C |
| Selected Data for a Share Outstanding Throughout Each Period |
| Year Ended September 30, | ||||||||||||||||||||
| 2018 | 2017 | 2016 | 2015 | 2014 | ||||||||||||||||
| Net asset value at beginning of period | $ | 9.29 | $ | 9.32 | $ | 9.32 | $ | 9.41 | $ | 9.45 | ||||||||||
| Income (loss) from investment operations: | ||||||||||||||||||||
| Net investment income | 0.13 | 0.08 | 0.06 | — | (C) | 0.02 | ||||||||||||||
| Net realized and unrealized gains (losses) on investments | (0.03 | ) | (0.02 | ) | 0.02 | (0.02 | ) | 0.02 | ||||||||||||
| Total from investment operations | 0.10 | 0.06 | 0.08 | (0.02 | ) | 0.04 | ||||||||||||||
| Distributions from: | ||||||||||||||||||||
| Net investment income | (0.14 | ) | (0.09 | ) | (0.08 | ) | (0.07 | ) | (0.08 | ) | ||||||||||
| Net asset value at end of period | $ | 9.25 | $ | 9.29 | $ | 9.32 | $ | 9.32 | $ | 9.41 | ||||||||||
| Total return(A) | 1.00 | % | 0.77 | % | 0.84 | % | (0.19 | %) | 0.42 | % | ||||||||||
| Ratios and supplemental data: | ||||||||||||||||||||
| Net assets at end of period (000's) | $ | 4,492 | $ | 5,704 | $ | 7,961 | $ | 8,291 | $ | 11,272 | ||||||||||
| Ratio to average net assets: | ||||||||||||||||||||
| Net expenses | 1.19 | % | 1.19 | % | 1.19 | % | 1.19 | % | 1.19 | % | ||||||||||
| Gross expenses | 1.67 | % | 1.56 | % | 1.54 | % | 1.48 | % | 1.44 | % | ||||||||||
| Net investment income | 1.38 | % | 0.90 | % | 0.59 | % | 0.04 | % | 0.29 | % | ||||||||||
| Portfolio turnover rate | 143 | %(B) | 136 | % | 169 | % | 132 | % | 142 | % | ||||||||||
| (A) | Total returns shown exclude the effect of applicable sales loads and fees. If these charges were included, the returns would be lower. |
| (B) | Portfolio turnover excludes the purchases and sales of securities of the Sentinel Low Duration Bond Fund acquired on October 27, 2017 (See Note 9 in the Notes to Financial Statements). If these transactions were included, portfolio turnover would have been higher. |
| (C) | Less than $0.005 per share. |
See accompanying Notes to Financial Statements.
| 164 |
Financial Highlights (Continued)
| Touchstone Ultra Short Duration Fixed Income Fund—Class S |
| Selected Data for a Share Outstanding Throughout The Period |
| Period | ||||
| Ended | ||||
| September 30, | ||||
| 2018(A) | ||||
| Net asset value at beginning of period | $ | 9.29 | ||
| Income (loss) from investment operations: | ||||
| Net investment income | 0.13 | |||
| Net realized and unrealized losses on investments | (0.02 | ) | ||
| Total from investment operations | 0.11 | |||
| Distributions from: | ||||
| Net investment income | (0.15 | ) | ||
| Net asset value at end of period | $ | 9.25 | ||
| Total return | 1.24 | %(B) | ||
| Ratios and supplemental data: | ||||
| Net assets at end of period (000's) | $ | 141,918 | ||
| Ratio to average net assets: | ||||
| Net expenses | 0.94 | %(C) | ||
| Gross expenses | 0.99 | %(C) | ||
| Net investment income | 1.63 | %(C) | ||
| Portfolio turnover rate | 143 | %(D) | ||
| Touchstone Ultra Short Duration Fixed Income Fund—Class Y |
| Selected Data for a Share Outstanding Throughout Each Period |
| Year Ended September 30, | ||||||||||||||||||||
| 2018 | 2017 | 2016 | 2015 | 2014 | ||||||||||||||||
| Net asset value at beginning of period | $ | 9.29 | $ | 9.32 | $ | 9.32 | $ | 9.41 | $ | 9.45 | ||||||||||
| Income (loss) from investment operations: | ||||||||||||||||||||
| Net investment income | 0.20 | 0.15 | 0.13 | 0.07 | 0.10 | |||||||||||||||
| Net realized and unrealized gains (losses) on investments | (0.03 | ) | (0.02 | ) | 0.02 | (0.02 | ) | 0.01 | ||||||||||||
| Total from investment operations | 0.17 | 0.13 | 0.15 | 0.05 | 0.11 | |||||||||||||||
| Distributions from: | ||||||||||||||||||||
| Net investment income | (0.21 | ) | (0.16 | ) | (0.15 | ) | (0.14 | ) | (0.15 | ) | ||||||||||
| Net asset value at end of period | $ | 9.25 | $ | 9.29 | $ | 9.32 | $ | 9.32 | $ | 9.41 | ||||||||||
| Total return | 1.75 | % | 1.55 | % | 1.60 | % | 0.56 | % | 1.17 | % | ||||||||||
| Ratios and supplemental data: | ||||||||||||||||||||
| Net assets at end of period (000's) | $ | 262,571 | $ | 260,830 | $ | 206,313 | $ | 200,456 | $ | 244,885 | ||||||||||
| Ratio to average net assets: | ||||||||||||||||||||
| Net expenses | 0.44 | % | 0.44 | % | 0.44 | % | 0.44 | % | 0.44 | % | ||||||||||
| Gross expenses | 0.50 | % | 0.51 | % | 0.53 | % | 0.52 | % | 0.49 | % | ||||||||||
| Net investment income | 2.13 | % | 1.65 | % | 1.34 | % | 0.79 | % | 1.04 | % | ||||||||||
| Portfolio turnover rate | 143 | %(D) | 136 | % | 169 | % | 132 | % | 142 | % | ||||||||||
| (A) | The Fund began issuing Class S shares on October 27, 2017. |
| (B) | Not annualized. |
| (C) | Annualized. |
| (D) | Portfolio turnover excludes the purchases and sales of securities of the Sentinel Low Duration Bond Fund acquired on October 27, 2017 (See Note 9 in the Notes to Financial Statements). If these transactions were included, portfolio turnover would have been higher. |
See accompanying Notes to Financial Statements.
| 165 |
Financial Highlights (Continued)
| Touchstone Ultra Short Duration Fixed Income Fund—Class Z |
| Selected Data for a Share Outstanding Throughout Each Period |
| Year Ended September 30, | ||||||||||||||||||||
| 2018 | 2017 | 2016 | 2015 | 2014 | ||||||||||||||||
| Net asset value at beginning of period | $ | 9.29 | $ | 9.32 | $ | 9.32 | $ | 9.41 | $ | 9.45 | ||||||||||
| Income (loss) from investment operations: | ||||||||||||||||||||
| Net investment income | 0.18 | 0.13 | 0.10 | 0.05 | 0.08 | |||||||||||||||
| Net realized and unrealized gains (losses) on investment | (0.03 | ) | (0.02 | ) | 0.02 | (0.02 | ) | 0.01 | ||||||||||||
| Total from investment operations | 0.15 | 0.11 | 0.12 | 0.03 | 0.09 | |||||||||||||||
| Distributions from: | ||||||||||||||||||||
| Net investment income | (0.19 | ) | (0.14 | ) | (0.12 | ) | (0.12 | ) | (0.13 | ) | ||||||||||
| Net asset value at end of period | $ | 9.25 | $ | 9.29 | $ | 9.32 | $ | 9.32 | $ | 9.41 | ||||||||||
| Total return | 1.50 | % | 1.29 | % | 1.35 | % | 0.31 | % | 0.91 | % | ||||||||||
| Ratios and supplemental data: | ||||||||||||||||||||
| Net assets at end of period (000's) | $ | 163,898 | $ | 211,797 | $ | 245,252 | $ | 304,553 | $ | 401,851 | ||||||||||
| Ratio to average net assets: | ||||||||||||||||||||
| Net expenses | 0.69 | % | 0.69 | % | 0.69 | % | 0.69 | % | 0.69 | % | ||||||||||
| Gross expenses | 0.78 | % | 0.78 | % | 0.79 | % | 0.76 | % | 0.76 | % | ||||||||||
| Net investment income | 1.88 | % | 1.40 | % | 1.09 | % | 0.54 | % | 0.79 | % | ||||||||||
| Portfolio turnover rate | 143 | %(A) | 136 | % | 169 | % | 132 | % | 142 | % | ||||||||||
| Touchstone Ultra Short Duration Fixed Income Fund—Institutional Class |
| Selected Data for a Share Outstanding Throughout Each Period |
| Year Ended September 30, | ||||||||||||||||||||
| 2018 | 2017 | 2016 | 2015 | 2014 | ||||||||||||||||
| Net asset value at beginning of period | $ | 9.29 | $ | 9.32 | $ | 9.32 | $ | 9.41 | $ | 9.45 | ||||||||||
| Income (loss) from investment operations: | ||||||||||||||||||||
| Net investment income | 0.21 | 0.16 | 0.13 | 0.08 | 0.10 | |||||||||||||||
| Net realized and unrealized gains (losses) on investments | (0.03 | ) | (0.02 | ) | 0.02 | (0.02 | ) | 0.01 | ||||||||||||
| Total from investment operations | 0.18 | 0.14 | 0.15 | 0.06 | 0.11 | |||||||||||||||
| Distributions from: | ||||||||||||||||||||
| Net investment income | (0.22 | ) | (0.17 | ) | (0.15 | ) | (0.15 | ) | (0.15 | ) | ||||||||||
| Net asset value at end of period | $ | 9.25 | $ | 9.29 | $ | 9.32 | $ | 9.32 | $ | 9.41 | ||||||||||
| Total return | 1.80 | % | 1.60 | % | 1.54 | % | 0.61 | % | 1.22 | % | ||||||||||
| Ratios and supplemental data: | ||||||||||||||||||||
| Net assets at end of period (000's) | $ | 275,561 | $ | 257,777 | $ | 142,913 | $ | 49,389 | $ | 50,853 | ||||||||||
| Ratio to average net assets: | ||||||||||||||||||||
| Net expenses | 0.39 | % | 0.39 | % | 0.39 | % | 0.39 | % | 0.39 | % | ||||||||||
| Gross expenses | 0.46 | % | 0.45 | % | 0.46 | % | 0.48 | % | 0.48 | % | ||||||||||
| Net investment income | 2.18 | % | 1.70 | % | 1.39 | % | 0.84 | % | 1.09 | % | ||||||||||
| Portfolio turnover rate | 143 | %(A) | 136 | % | 169 | % | 132 | % | 142 | % | ||||||||||
| (A) | Portfolio turnover excludes the purchases and sales of securities of the Sentinel Low Duration Bond Fund acquired on October 27, 2017 (See Note 9 in the Notes to Financial Statements). If these transactions were included, portfolio turnover would have been higher. |
See accompanying Notes to Financial Statements.
| 166 |
September 30, 2018
1. Organization
The Touchstone Funds Group Trust (the “Trust”) is registered under the Investment Company Act of 1940, as amended (the “1940 Act”), as an open-end management investment company. The Trust was established as a Delaware statutory trust pursuant to an Agreement and Declaration of Trust dated October 25, 1993. The Trust consists of the following thirteen funds (individually, a “Fund,” and collectively, the “Funds”):
Touchstone Active Bond Fund (“Active Bond Fund”)
Touchstone Arbitrage Fund (“Arbitrage Fund”)
Touchstone Emerging Markets Small Cap Fund (“Emerging Markets Small Cap Fund”)
Touchstone High Yield Fund (“High Yield Fund”)
Touchstone Impact Bond Fund (“Impact Bond Fund”) (formerly known as Touchstone Total Return Bond Fund)
Touchstone Merger Arbitrage Fund (“Merger Arbitrage Fund”)
Touchstone Mid Cap Fund (“Mid Cap Fund”)
Touchstone Mid Cap Value Fund (“Mid Cap Value Fund”)
Touchstone Premium Yield Equity Fund (“Premium Yield Equity Fund”)
Touchstone Sands Capital Select Growth Fund (“Sands Capital Select Growth Fund”)
Touchstone Small Cap Fund (“Small Cap Fund”)
Touchstone Small Cap Value Fund (“Small Cap Value Fund”)
Touchstone Ultra Short Duration Fixed Income Fund (“Ultra Short Duration Fixed Income Fund”)
Each Fund is diversified, with the exception of the Arbitrage Fund, the Merger Arbitrage Fund, the Sands Capital Select Growth Fund and the Small Cap Fund, which are non-diversified.
The Agreement and Declaration of Trust permits the Trust to issue an unlimited number of shares of beneficial interest of each Fund. The table below indicates the classes of shares that each Fund is registered to offer:
| Institutional | ||||||
| Class A | Class C | Class S | Class Y | Class Z | Class | |
| Active Bond Fund | X | X | X | X | ||
| Arbitrage Fund | X | X | X | X | ||
| Emerging Markets Small Cap Fund | X | X | X | X | ||
| High Yield Fund | X | X | X | X | ||
| Impact Bond Fund | X | X | X | X | ||
| Merger Arbitrage Fund | X | X | X | X | ||
| Mid Cap Fund | X | X | X | X | X | |
| Mid Cap Value Fund | X | X | X | X | ||
| Premium Yield Equity Fund | X | X | X | |||
| Sands Capital Select Growth Fund | X | X | X | X | ||
| Small Cap Fund | X | X | X | X | ||
| Small Cap Value Fund | X | X | X | X | ||
| Ultra Short Duration Fixed Income Fund | X | X | X | X | X | X |
The assets of each Fund are segregated, and a shareholder’s interest is limited to the Fund in which shares are held. The Funds’ prospectus provides a description of each Fund’s investment goal, policies, and strategies along with information on the classes of shares currently being offered.
2. Significant Accounting Policies
The following is a summary of the Funds’ significant accounting policies:
Each Fund is an investment company that follows the accounting and reporting guidance of Accounting Standards Codification Topic 946 applicable to investment companies.
Regulatory Updates — In August 2018, the Securities and Exchange Commission (the “SEC”) released its Final Rules that eliminated or amended disclosure requirements in the financial statements that were redundant or outdated in light of changes in SEC requirements or US GAAP. The Final Rules were effective November
| 167 |
Notes to Financial Statements (Continued)
5, 2018. Management has evaluated the SEC Final Rules and is complying with the amendments in the current financial statements.
Security valuation and fair value measurements — U.S. generally accepted accounting principles (“U.S. GAAP”) define fair value as the price the Funds would receive to sell an asset or pay to transfer a liability in an orderly transaction between market participants at the measurement date. All investments in securities are recorded at their fair value. The Funds define the term “market value”, as used throughout this report, as the estimated fair value. The Funds use various methods to measure fair value of their portfolio securities on a recurring basis. U.S. GAAP fair value measurement standards require disclosure of a hierarchy that prioritizes inputs to valuation methods.
These inputs are summarized in the three broad levels listed below:
| · Level 1 – | quoted prices in active markets for identical securities |
| · Level 2 – | other significant observable inputs (including quoted prices for similar securities, interest rates, prepayment speeds, credit risk, etc.) |
| · Level 3 – | significant unobservable inputs (including a Fund’s own assumptions in determining the fair value of investments) |
The inputs or methodology used for valuing securities are not necessarily an indication of the risk associated with investing in those securities.
The aggregate value by input level, as of September 30, 2018, for each Fund’s investments, as well as a reconciliation of assets for which significant unobservable inputs (Level 3) were used in determining value, if applicable, is included in each Fund’s Portfolio of Investments, which also includes a breakdown of the Fund’s investments by geographic, portfolio or sector allocation. The Arbitrage Fund, Merger Arbitrage Fund and Small Cap Value Fund held Level 3 categorized securities during the year ended September 30, 2018. Refer to the Portfolio of Investments for a reconciliation of Level 3 holdings.
Changes in valuation techniques may result in transfers into or out of an investment’s assigned level within the hierarchy. At September 30, 2018, there were no transfers for Level 3 for the Funds.
During the year ended September 30, 2018, there were no material changes to the valuation policies and techniques.
The Funds’ portfolio securities are valued as of the close of the regular session of trading on the New York Stock Exchange (“NYSE”) (currently 4:00 p.m., Eastern Time or at the times as of which the NYSE establishes official closing prices). Portfolio securities traded on stock exchanges are valued at the last reported sale price, official close price, or last bid price if no sales are reported. Portfolio securities quoted by NASDAQ are valued at the NASDAQ Official Closing Price (“NOCP”) or from the primary exchange on which the security trades. To the extent these securities are actively traded, they are categorized in Level 1 of the fair value hierarchy. Options and futures are valued at the last quoted sales price. If there is no such reported sale on the valuation date, long option positions are valued at the most recent bid price, and short option positions are valued at the most recent ask price on the valuation date and are categorized in Level 1. Shares of mutual funds in which the Funds invest are valued at their respective net asset value (“NAV”) as reported by the underlying funds (the “Underlying Funds”) and are categorized in Level 1.
Debt securities held by the Funds are valued at their evaluated bid by an independent pricing service or at their last broker-quoted bid prices as obtained from one or more of the major market makers for such securities. Independent pricing services use information provided by market makers or estimates of market values through accepted market modeling conventions. Observable inputs to the models may include prepayment speeds,
| 168 |
Notes to Financial Statements (Continued)
pricing spread, yield, trade information, dealer quotes, market color, cash flow models, the securities’ terms and conditions, among others, and are generally categorized in Level 2. The Active Bond Fund’s and Ultra Short Duration Fixed Income Fund’s investments in bank loans are normally valued at the bid quotation obtained from dealers in loans by an independent pricing service in accordance with the Funds’ valuation policies and procedures approved by the Funds’ Board of Trustees (the “Board”), and are generally categorized in Level 2. The Ultra Short Duration Fixed Income Fund’s investments in asset-backed and mortgage-backed securities are valued by independent pricing services using models that consider estimated cash flows of each tranche of the security, establish a benchmark yield and develop an estimated tranche specific spread to the benchmark yield based on the unique attributes of the tranche, and are generally categorized in Level 2. Debt securities with remaining maturities of 60 days or less may be valued at amortized cost, provided such amount approximates market value and are categorized in Level 2. While this method provides consistency in valuation (and may only be used if it approximates market value), it may result in periods during which fair value, as determined by amortized cost, is higher or lower than the price that would be received if the Fund sold the investment.
Foreign currency exchange contracts are valued at the mean between the bid and ask prices and are determined as of the close of regular trading on the NYSE. Interpolated values are derived when the settlement date of the contract is an interim date for which quotations are not available and are categorized in Level 2.
Securities mainly traded on a non-U.S. exchange or denominated in foreign currencies are generally valued according to the preceding closing values on that exchange, translated to U.S. dollars using currency exchange rates as of the close of regular trading on the NYSE, and are generally categorized in Level 1. However, if an event that may change the value of a security occurs after the time that the closing value on the non-U.S. exchange was determined, but before the close of regular trading on the NYSE, the security may be priced based on fair value and is generally categorized in Level 2. This may cause the value of the security, if held on the books of a Fund, to be different from the closing value on the non-U.S. exchange and may affect the calculation of that Fund’s NAV.
The Funds may use fair value pricing under the following circumstances, among others:
| · | If the value of a security has been materially affected by events occurring before the Funds’ pricing time but after the close of the primary markets on which the security is traded. |
| · | If the exchange on which a portfolio security is principally traded closes early or if trading in a particular portfolio security was halted during the day and did not resume prior to the Funds’ NAV calculation. |
| · | If a security is so thinly traded that reliable market quotations are unavailable due to infrequent trading. |
| · | If the validity of market quotations is not reliable. |
Securities held by the Funds that do not have readily available market quotations, significant observable inputs, or securities for which the available market quotations are not reliable, are priced at their estimated fair value using procedures approved by the Board and are generally categorized in Level 3.
Bank Loans — The Active Bond Fund and Ultra Short Duration Fixed Income Fund may invest in bank loans, which usually take the form of loan participations and assignments. Loan participations and assignments are agreements to make money available to U.S. or foreign corporations, partnerships or other business entities (the “Borrower”) in a specified amount, at a specified rate and within a specified time. A loan is typically originated, negotiated and structured by a U.S. or foreign bank, insurance company or other financial institution (the “Agent”) for a group of loan investors (“Loan Investors”). The Agent typically administers and enforces the loan on behalf of the other Loan Investors in the syndicate and may hold any collateral on behalf of the Loan Investors. Such loan participations and assignments are typically senior, secured and collateralized in nature. The Fund records an investment when the Borrower withdraws money and records interest as earned. These
| 169 |
Notes to Financial Statements (Continued)
loans pay interest at rates which are periodically reset by reference to a base lending rate plus a spread. These base lending rates are generally the prime rate offered by a designated U.S. bank or London InterBank Offered Rate (“LIBOR”).
The loans in which the Fund invests may be subject to some restrictions on resale. For example, the Fund may be contractually obligated to receive approval from the Agent and/or Borrower prior to the sale of these investments. The Fund generally has no right to enforce compliance with the terms of the loan agreement with the Borrower. As a result, the Fund assumes the credit risk of the Borrower, the selling participant and any other persons interpositioned between the Fund and the Borrower (“Intermediate Participants”). In the event that the Borrower, selling participant or Intermediate Participants become insolvent or enter into bankruptcy, the Fund may incur certain costs and delays in realizing payment or may suffer a loss of principal and/or interest.
Unfunded commitments represent the remaining obligation of the Fund to the Borrower. At any point in time, up to the maturity date of the issue, the Borrower may demand the unfunded portion. Until demanded by the Borrower, unfunded commitments are not recognized as an asset on the Statements of Assets and Liabilities. Unrealized appreciation/depreciation on unfunded commitments presented on the Statements of Assets and Liabilities represents fair value of the unfunded portion of the Fund’s bank loans.
As of September 30, 2018, the Funds did not hold any unfunded loan commitments.
Collateralized Loan Obligations — The Ultra Short Duration Fixed Income Fund may invest in collateralized loan obligations (“CLOs”). CLOs are types of asset-backed securities. A CLO is an entity that is backed by syndicated bank loans. The cash flows of the CLO can be split into multiple segments, called “tranches,” which will vary in risk profile and yield. The riskiest segment is the subordinated or “equity” tranche. This tranche bears the greatest risk of defaults from the underlying assets in the CLO and serves to protect the other, more senior, tranches from default in all but the most severe circumstances. Since it is shielded from defaults by the more junior tranches, a “senior” tranche will typically have higher credit ratings and lower yields than their underlying securities, and often receive higher ratings from one or more of the nationally recognized rating agencies. Despite the protection from the more junior tranches, senior tranches can experience substantial losses due to actual defaults, increased sensitivity to future defaults and the disappearance of one or more protecting tranches as a result of changes in the credit profile of the underlying pool of assets.
Investment companies — The Funds may invest in securities of other investment companies, including exchange-traded funds (“ETFs”), open-end funds and closed-end funds. Open-end funds are investment companies that issue new shares continuously and redeem shares daily. Closed-end funds are investment companies that typically issue a fixed number of shares that trade on a securities exchange or over-the-counter (“OTC”). An ETF is an investment company that typically seeks to track the performance of an index by holding in its portfolio shares of all the companies, or a representative sample of the companies, that are components of a particular index. ETF shares are traded on a securities exchange based on their market value. The risks of investment in other investment companies typically reflect the risks of the types of securities in which the other investment companies invest. Investments in ETFs and closed-end funds are subject to the additional risk that their shares may trade at a premium or discount to their NAV. When a Fund invests in another investment company, shareholders of the Fund indirectly bear their proportionate share of the other investment company’s fees and expenses, including operating, registration, trustee, licensing, and marketing, as well as their share of the Fund’s fees and expenses.
Securities sold short — The Funds may engage in selling securities short, which obligates the Fund to replace a security borrowed by purchasing the same security at the current market value. The Fund would incur a loss if the price of the security increases between the date of the short sale and the date on which the Fund replaces the borrowed security. The Fund would realize a gain if the price of the security declines between those dates. As of September 30, 2018, the Arbitrage Fund and Merger Arbitrage Fund had securities sold short with a
| 170 |
Notes to Financial Statements (Continued)
fair value of $(31,831,590) and $(19,360,501), respectively, and pledged securities with a fair value of $35,601,103 and $46,032,305, respectively, as collateral for both securities sold short and written options. Arbitrage Fund pledged cash collateral of $18,044,871 for both securities sold short and written options and Merger Arbitrage Fund had a related due to prime broker balance of $5,559,655.
Options — The Funds may write or purchase financial option contracts primarily to hedge against changes in the value of equity securities (or securities that the Funds intend to purchase), against fluctuations in fair value caused by changes in prevailing market interest rates or foreign currency exchange rates and against changes in overall equity market volatility. In addition, the Funds may utilize options in an attempt to generate gains from option premiums or to reduce overall portfolio risk. The Funds’ option strategy primarily focuses on the use of writing and/or purchasing call or put options on equity indexes. When the Funds write or purchase an option, an amount equal to the premium received or paid by the Funds is recorded as a liability or an asset and is subsequently adjusted to the current market value of the option written or purchased. Premiums received or paid from writing or purchasing options which expire unexercised are treated by the Funds on the expiration date as realized gains or losses. The difference between the premium and the amount paid or received on effecting a closing purchase or sale transaction, including brokerage commissions, is also treated as a realized gain or loss. If an option is exercised, the premium paid or received is added to the cost of the purchase or proceeds from the sale in determining whether the Funds have realized a gain or loss on investment transactions. The Funds, as writer of an option, may have no control over whether the underlying securities may be sold (call) or purchased (put) and as a result bear the market risk of an unfavorable change in the price of the security underlying the written option. The Funds, as purchaser of an option, bear the risk that the counterparties to the option may not have the ability to meet the terms of the option contracts. There is minimal counterparty credit risk involved in entering into option contracts since they are exchange-traded instruments and the exchange’s clearinghouse, as counterparty to all exchange-traded options, guarantees the options against default. As of September 30, 2018, the Arbitrage Fund and Merger Arbitrage Fund had written options with a fair value of $(72,000) and $(56,310), respectively, and pledged securities with a fair value of $35,601,103 and $46,032,305, respectively, as collateral for both securities sold short and written options. Arbitrage Fund pledged cash collateral of $18,044,871 for both securities sold short and written options and Merger Arbitrage Fund had a related due to prime broker balance of $5,559,655. The Arbitrage Fund and Merger Arbitrage Fund held purchased options with a fair value of $36,210 and $28,640, respectively, as of September 30, 2018.
Warrants — The Funds can invest in warrants and stock purchase rights of companies of any market capitalization. A warrant gives the holder the right to buy stock, typically from the issuer. The warrant specifies the amount of underlying stock, the purchase (or “exercise”) price, and the date the warrant expires. Certain warrants may permit, without legal obligation, net settlement for stock or cash. The Funds have no obligation to exercise the warrant and buy the stock.
Futures Contracts — The Active Bond Fund may buy and sell futures contracts and related options to manage its exposure to changing interest rates and securities prices. Some strategies reduce the Fund’s exposure to price fluctuations, while others tend to increase its market exposure. Futures and options on futures can be volatile instruments and involve certain risks that could negatively impact the Fund’s return. In order to avoid leveraging and related risks, when the Fund purchases futures contracts, it will collateralize its position by depositing an amount of cash or liquid securities, equal to the market value of the futures positions held, less margin deposits, in a segregated account with its custodian or otherwise “cover” its position in a manner consistent with the 1940 Act or the rules of the Securities and Exchange Commission (the “SEC”) or interpretations thereunder. Collateral equal to the current fair value of the futures position will be determined on a daily basis.
When the contract is closed, the Fund records a realized gain or loss equal to the difference between the proceeds from (or cost of) the closing transactions and the Fund’s basis in the contract. Risks of entering into futures contracts include the possibility that a change in the value of the contract may not correlate with the changes
| 171 |
Notes to Financial Statements (Continued)
in the value of the underlying instruments. Second, it is possible that a lack of liquidity for futures contracts could exist in the secondary market resulting in an inability to close a futures position prior to its maturity date. Third, the purchase of a futures contract involves the risk that the Fund could lose more than the original margin deposit required to initiate the futures transaction. Finally, the risk exists that losses could exceed amounts disclosed on the Statements of Assets and Liabilities. There is minimal counterparty credit risk involved in entering into futures contracts since they are exchange-traded instruments and the exchange’s clearinghouse, as counterparty to all exchange-traded futures, guarantees the futures against default.
As of September 30, 2018, the Active Bond Fund did not hold any futures contracts.
Foreign currency translation — The books and records of the Funds are maintained in U.S. dollars and translated into U.S. dollars on the following basis:
(1) market value of investment securities, assets and liabilities at the current rate of exchange on the valuation date; and
(2) purchases and sales of investment securities, income, and expenses at the relevant rates of exchange prevailing on the respective dates of such transactions.
The Funds do not isolate that portion of gains and losses on investments in equity securities that is due to changes in the foreign exchange rates from that which is due to changes in market prices of equity securities.
Forward foreign currency contracts — A forward foreign currency contract is an agreement between two parties to buy and sell a specific currency at a price that is set on the date of the contract. The forward contract calls for delivery of the currency on a future date that is specified in the contract. Risks related to the use of forwards include the possible failure of counterparties to meet the terms of the forward agreement, the failure of the counterparties to timely post collateral, the risk that currency movements will not occur thereby reducing a Fund’s total return, and the potential for losses in excess of a Fund’s initial investment.
The market value of a forward foreign currency contract fluctuates with changes in foreign currency exchange rates. Forward foreign currency contracts are marked to market daily and the change in value is recorded by a Fund as an unrealized gain or loss. Realized gains or losses, equal to the difference between the value of the contract at the time it was opened and the value at the time it was closed, are recorded upon delivery or receipt of the currency.
During the year ended September 30, 2018, the Arbitrage Fund and the Merger Arbitrage Fund used forward foreign currency contracts to enhance potential gains, hedge against anticipated currency exchange rates, maintain diversity and liquidity of the portfolio and/or adjust exposure to foreign currencies. As of September 30, 2018, there were no open forward foreign currency contracts.
Real Estate Investment Trusts — The Funds may invest in real estate investment trusts (“REITs”) that involve risks not associated with investing in stocks. Risks associated with investments in REITs include declines in the value of real estate, general and economic conditions, changes in the value of the underlying property and defaults by borrowers. The value of assets in the real estate industry may go through cycles of relative underperformance and outperformance in comparison to equity securities markets in general. Dividend income is recorded using management’s estimate of the income included in distributions received from REIT investments. The actual amounts of income, return of capital and capital gains are only determined by each REIT after its fiscal year-end and may differ from the estimated amount. Estimates of income are adjusted in the Funds to the actual amounts when the amounts are determined.
Master Limited Partnership — The Funds may invest in Master Limited Partnership (“MLP”) common units that represent limited partnership interests in the MLP. Common units are generally listed and traded on U.S. securities exchanges or OTC with their value fluctuating predominantly based on the success of the MLP. Unlike
| 172 |
Notes to Financial Statements (Continued)
owners of common stock of a corporation, owners of MLP common units have limited voting rights and have no ability to annually elect directors. MLPs generally distribute all available cash flow (cash flow from operations less maintenance capital expenditures) in the form of quarterly distributions. Common unit holders have first priority to receive quarterly cash distributions up to the minimum quarterly distribution and have arrearage rights. Distributions received from MLPs generally are comprised of income and return of capital. Investment income and return of capital are recorded based on estimates made at the time distributions are received. The actual amounts of income and return of capital are only determined by each MLP after its fiscal year-end and may differ from the estimated amount. Estimates of income are adjusted in the Funds to the actual amounts when the amounts are determined. In the event of liquidation, common unit holders have preference over subordinated units, but not debt holders or preferred unit holders, to the remaining assets of the MLP.
Pay-In-Kind (“PIK”) Bonds — PIK bonds are securities that, at the issuer’s option, pay interest in either cash or additional securities for a specified period. PIK bonds, like zero coupon bonds, are designed to give an issuer flexibility in managing cash flow. PIK bonds are expected to reflect the market value of the underlying debt plus an amount representing accrued interest since the last payment. PIK bonds are usually less volatile than zero coupon bonds, but more volatile than cash pay securities.
Derivative instruments and hedging activities — The Active Bond Fund, the Arbitrage Fund and the Merger Arbitrage Fund may enter into an International Swaps and Derivatives Associations, Inc. Master Agreement (“ISDA Master Agreement” or “MNA”) or similar agreement with certain counterparties. An ISDA Master Agreement is a bilateral agreement between a Fund and a counterparty that governs OTC derivatives and foreign exchange contracts, and typically contains, among other things, collateral posting terms and master netting provisions in the event of a default or termination. Under an ISDA Master Agreement, a party may, under certain circumstances, offset with the counterparty certain derivative financial instruments’ payables or receivables with collateral held or posted and create one single net payment. The provisions of the ISDA Master Agreement typically permit a single net payment in the event of default (close-out netting). These default events include bankruptcy or insolvency of the counterparty. Note, however, that bankruptcy or insolvency laws of a particular jurisdiction may impose restrictions on or prohibitions against the right of offset.
When entering into a derivative transaction, a Fund may be required to post and maintain collateral or margin (including both initial and maintenance margin). Collateral and margin requirements differ by type of derivative. Margin requirements are established by the broker or clearing house for exchange-traded and centrally cleared derivatives (financial futures contracts, options, and centrally cleared swaps). Brokers can ask for margining in excess of the clearing house’s minimum in certain circumstances. Collateral terms are contract specific for OTC derivatives (forward foreign currency contracts, options, and swaps). For derivatives traded under an ISDA Master Agreement, the collateral requirements are typically calculated by netting the marked-to-market amount for each transaction under such agreement and comparing that amount to the value of any collateral currently pledged by the Fund and the counterparty. For financial reporting purposes, cash collateral that has been pledged to cover obligations of the Fund and cash collateral received from the counterparty, if any, are reported separately on the Statements of Assets and Liabilities as cash deposits held at prime broker and due to prime broker, respectively. Non-cash collateral pledged by the Fund, if any, is noted in the Portfolio of Investments. To the extent amounts due to the Fund from its counterparties are not fully collateralized, contractually or otherwise, the Fund bears the risk of loss from counterparty non-performance.
Certain ISDA Master Agreements allow counterparties to OTC derivatives transactions to terminate derivative contracts prior to maturity in the event a Fund’s net assets decline by a stated percentage or the Fund fails to meet the terms of its ISDA Master Agreement, which would cause the Fund (counterparty) to accelerate payment of any net liability owed to the counterparty (Fund).
| 173 |
Notes to Financial Statements (Continued)
For financial reporting purposes, the Funds do not offset derivative assets and derivative liabilities that are subject to netting arrangements in the Statements of Assets and Liabilities.
As of September 30, 2018, the Arbitrage Fund’s and Merger Arbitrage Fund’s assets and liabilities that were subject to a MNA on a gross basis were as follows:
| Assets | Liabilities | |||||||
| Arbitrage Fund | ||||||||
| Written Options | $ | — | $ | 72,000 | ||||
| Merger Arbitrage Fund | ||||||||
| Written Options | $ | — | $ | 56,310 | ||||
The following table presents the Arbitrage Fund’s and Merger Arbitrage Fund’s liabilities net of amounts available for offset under MNA and net of the related collateral pledged by the Funds as of September 30, 2018:
| Fund | Counterparty | Derivative Type | Gross Amount of Recognized Liabilities | Gross Amount Available for Offset in Statement of Assets and Liabilities | Non- Cash Collateral Pledged | Cash Collateral Pledged | Net Amount(A) | |||||||||||||||||
| Arbitrage Fund | Pershing LLC | Written Options | $ | 72,000 | $ | — | $ | (31,276 | ) | $ | (40,724 | ) | $ | — | ||||||||||
| Merger Arbitrage Fund | Pershing LLC | Written Options | 56,310 | — | (56,310 | ) | — | — | ||||||||||||||||
| (A) | Net amount represents the net amount payable due to the counterparty in the event of default. |
The following table sets forth the fair value of the Arbitrage Fund’s and Merger Arbitrage Fund’s derivative financial instruments by primary risk exposure as of September 30, 2018:
Fair Value of Derivative Investments
as of September 30, 2018
| Derivatives not accounted for as hedging | Asset | Liability | ||||||||
| Fund | instruments under ASC 815 | Derivatives | Derivatives | |||||||
| Arbitrage Fund | Purchased Options-Equity Contracts* | $ | 36,210 | $ | — | |||||
| Written Options-Equity Contracts** | — | (72,000 | ) | |||||||
| Merger Arbitrage Fund | Purchased Options- Equity contracts* | 28,640 | — | |||||||
| Written Options-Equity Contracts** | — | (56,310 | ) | |||||||
| * | Statements of Assets and Liabilities Location: Investments, at market value. |
| ** | Statements of Assets and Liabilities Location: Written options, at market value. |
| 174 |
Notes to Financial Statements (Continued)
The following table sets forth the effect of the Active Bond Fund’s, Arbitrage Fund’s and Merger Arbitrage Fund’s derivative financial instruments by primary risk exposure on the Statements of Operations for the year ended September 30, 2018:
The Effect of Derivative Investments on the Statements of Operations for the Year Ended September 30, 2018 | ||||||||||
| Change in | ||||||||||
| Unrealized | ||||||||||
| Realized Gain | Appreciation | |||||||||
| Derivatives not accounted for as hedging | (Loss) | (Depreciation) | ||||||||
| Fund | instruments under ASC 815 | on Derivatives | on Derivatives | |||||||
| Active Bond Fund | Futures-Interest Rate Contracts* | $ | (678,340 | ) | $ | — | ||||
| Arbitrage Fund | Purchased Options-Equity Contracts** | (409,262 | ) | 39,491 | ||||||
| Written Options-Equity Contracts*** | 1,286,604 | (34,296 | ) | |||||||
| Forward Foreign Currency Contracts**** | 359,223 | (18,521 | ) | |||||||
| Merger Arbitrage Fund | Purchased Options-Equity Contracts** | (363,251 | ) | 35,460 | ||||||
| Written Options-Equity Contracts*** | 1,092,277 | (29,087 | ) | |||||||
| Forward Foreign Currency Contracts**** | 171,990 | (10,865 | ) | |||||||
* Statements of Operations Location: Net realized losses on futures contracts.
** Statements of Operations Location: Net realized gains (losses) on investments and net change in unrealized appreciation (depreciation) on investments, respectively.
*** Statements of Operations Location: Net realized gains on written options and net change in unrealized appreciation (depreciation) on written options, respectively.
**** Statements of Operations Location: Net realized gains on forward foreign currency contracts and net change in unrealized appreciation (depreciation) on forward foreign currency contracts, respectively.
For the year ended September 30, 2018, the average quarterly balances of outstanding derivative financial instruments were as follows:
| Active | Merger | |||||||||||
| Bond | Arbitrage | Arbitrage | ||||||||||
| Fund | Fund | Fund | ||||||||||
| Equity contracts: | ||||||||||||
| Purchased Options - Cost | $ | — | $ | 100,376 | $ | 81,969 | ||||||
| Written Options - Premiums received | $ | — | $ | 124,314 | $ | 98,553 | ||||||
| Forward foreign currency contracts: | ||||||||||||
| U.S. dollar amount received | $ | — | $ | 3,085,545 | $ | 1,684,617 | ||||||
| Interest rate contracts: | ||||||||||||
| Futures Contracts - Notional value | $ | 9,537,634 | $ | — | $ | — | ||||||
Portfolio securities loaned — The Funds may lend their portfolio securities. Lending portfolio securities exposes the Funds to the risk that the borrower may fail to return the loaned securities or may not be able to provide additional collateral or that the Funds may experience delays in recovery of the loaned securities or loss of rights in the collateral if the borrower fails financially. To minimize these risks, the borrower must agree to maintain cash collateral with the Funds’ custodian. The loaned securities are secured by collateral valued at least equal, at all times, to the market value of the loaned securities plus accrued interest, if any. When the collateral falls below specified amounts, the lending agent will use its best effort to obtain additional collateral on the next business day to meet required amounts under the security lending agreement. The cash collateral is reinvested by the Funds’ custodian into an approved short-term investment vehicle. The approved short-term investment vehicle is subject to market risk.
| 175 |
Notes to Financial Statements (Continued)
As of September 30, 2018, the following Funds loaned securities and received collateral as follows:
| Market | Market | |||||||||||||
| Value of | Value of | |||||||||||||
| Securities | Collateral | Net | ||||||||||||
| Fund | Security Type | Loaned* | Received** | Amount*** | ||||||||||
| Arbitrage Fund | Common Stocks | $ | 44,495 | $ | 111,711 | $ | 67,216 | |||||||
| High Yield Fund | Corporate Bonds | 4,722,101 | 5,324,784 | 602,683 | ||||||||||
| Merger Arbitrage Fund | Common Stocks | 591,845 | 658,866 | 67,021 | ||||||||||
| Mid Cap Value Fund | Common Stocks | 16,044,990 | 15,772,381 | (272,609 | ) | |||||||||
| Premium Yield Equity Fund | Common Stocks | 562,203 | 585,420 | 23,217 | ||||||||||
| Small Cap Fund | Common Stocks | 3,827,604 | 3,968,011 | 140,407 | ||||||||||
| Small Cap Value Fund | Common Stocks | 4,297,000 | 4,353,965 | 56,965 | ||||||||||
* The remaining contractual maturity is overnight for all securities.
** Gross amount of recognized liabilities for securities lending included in the Statements of Assets and Liabilities.
*** Net amount represents the net amount payable due to (receivable from) the borrower in the event of default.
All cash collateral is received, held, and administered by the Funds’ custodian for the benefit of the lending Fund in its custody account or other account established for the purpose of holding collateral in cash equivalents.
Funds participating in securities lending receive compensation in the form of fees. Securities lending income is derived from lending long securities from the Funds to creditworthy approved borrowers at rates that are determined based on daily trading volumes, float, short-term interest rates and market liquidity and is shown net of fees on the Statements of Operations. When a Fund lends securities, it retains the interest or dividends on the investment of any cash received as collateral, and the Fund continues to receive interest or dividends on the loaned securities.
Unrealized gain or loss on the market value of the loaned securities that may occur during the term of the loan is recognized by the Fund. The Fund has the right under the lending agreement to recover any loaned securities from the borrower on demand.
When-issued or delayed delivery transactions — Each Fund may purchase or sell securities on a when-issued or delayed delivery basis. These transactions involve a commitment by the Fund to purchase or sell securities for a predetermined price or yield, with payment and delivery taking place beyond the customary settlement period. When delayed delivery purchases are outstanding, the Fund will set aside liquid assets in an amount sufficient to meet the purchase price. When purchasing a security on a delayed delivery basis, the Fund assumes the rights and risks of ownership of the security, including the risk of price and yield fluctuations, and takes such fluctuations into account when determining NAV. The Fund may dispose of or renegotiate a delayed delivery transaction after it is entered into, and may sell when-issued securities before they are delivered, which may result in a capital gain or loss. When the Fund has sold a security on a delayed delivery basis, the Fund does not participate in future gains and losses with respect to the security.
Share valuation — The NAV per share of each class of shares of each Fund is calculated daily by dividing the total value of a Fund’s assets attributable to that class, less liabilities attributable to that class, by the number of outstanding shares of that class.
Effective August 17, 2018, the maximum offering price per share of Class A shares of the equity funds (all of the Funds except the Active Bond Fund, High Yield Fund, Impact Bond Fund and Ultra Short Duration Fixed Income Fund) is equal to the NAV per share plus a sales load equal to 5.26% of the NAV (or 5.00% of the offering price). The maximum offering price per share of Class A shares of the fixed income funds (Active Bond Fund, High Yield Fund, Impact Bond Fund and Ultra Short Duration Fixed Income Fund) is equal to the NAV per share plus a sales load equal to 2.04% of the NAV (or 2.00% of the offering price). Prior to August
| 176 |
Notes to Financial Statements (Continued)
17, 2018, the maximum offering price per share of Class A shares of the equity funds was equal to the NAV per share plus a sales load equal to 6.10% of the NAV (or 5.75% of the offering price). The maximum offering price per share of Class A shares of the Active Bond Fund, High Yield Fund and Impact Bond Fund was equal to the NAV per share plus a sales load equal to 4.99% of the NAV (or 4.75% of the offering price). The maximum offering price per share of Class A shares of the Ultra Short Duration Fixed Income Fund was equal to the NAV per share plus a sales load equal to 2.04% of the NAV (or 2.00% of the offering price). There is no sales load on equity or fixed income fund purchases when aggregate purchases in all Touchstone funds equal at least $1 million or $500,000, respectively. The maximum offering price per share of Classes C, S, Y, Z, and Institutional Class shares of the Funds is equal to the NAV per share.
The redemption price per share of each class of shares of the Funds is generally equal to the NAV per share. However, Class A redemptions that were part of a no-load purchase due to the aggregate purchase amount in all Touchstone funds equaling at least $1 million for equity funds or $500,000 for fixed income funds where a Finder’s Fee was paid may be subject to a contingent deferred sales charge (“CDSC”) of up to 1.00% or 0.50%, respectively, if redeemed within a one-year period from the date of purchase. Additionally, purchases of Class C shares of the Funds are subject to a CDSC of 1.00%. The CDSC will be assessed on an amount equal to the lesser of (1) the NAV at the time of purchase of the shares being redeemed or (2) the NAV of such shares being redeemed, if redeemed within a one-year period from the date of purchase.
Investment income — Dividend income from securities is recognized on the ex-dividend date, net of foreign withholding taxes, if any, which are reduced by any amounts reclaimable by the Funds, where applicable. Interest income from securities is recorded on the basis of interest accrued, premium amortized and discount accreted. Realized gains and losses resulting from principal paydowns on mortgage-backed and asset-backed securities are included in interest income. Market discounts, original issue discount and market premiums on debt securities are accreted/amortized to interest income over the life of the security with a corresponding adjustment in the cost basis of that security. In addition, it is the Funds’ policy to accrue for foreign capital gains taxes, if applicable, on certain foreign securities held by the Funds. An estimated foreign capital gains tax is recorded daily on net unrealized gains on these securities and is payable upon the sale of such securities when a gain is realized.
Distributions to shareholders — Each Fund intends to distribute to its shareholders substantially all of its income and capital gains. The Arbitrage Fund, Emerging Markets Small Cap Fund, Merger Arbitrage Fund, Mid Cap Fund, and Small Cap Fund distribute their income, if any, annually, as a dividend to shareholders. The Mid Cap Value Fund, Sands Capital Select Growth Fund, and Small Cap Value Fund declare and distribute their income, if any, quarterly, as a dividend to shareholders. The Active Bond Fund, High Yield Fund, Impact Bond Fund and Premium Yield Equity Fund declare and distribute their income, if any, monthly, as a dividend to shareholders. The Ultra Short Duration Fixed Income Fund declares its income, if any, daily, and distributes such income monthly, as a dividend to shareholders. Each Fund makes distributions of capital gains, if any, at least annually, net of applicable capital loss carryforwards. Income distributions and capital gain distributions are determined in accordance with income tax regulations. Recognition of the Funds’ net investment income from investments in Underlying Funds is affected by the timing of dividend declarations by the Underlying Funds.
Allocations — Investment income earned, realized capital gains and losses, and unrealized appreciation and depreciation for a Fund are allocated daily to each class of shares based upon its proportionate share of total net assets of the Fund. Class-specific expenses are charged directly to the class incurring the expense. Common expenses, which are not attributable to a specific class, are allocated daily to each class of shares based upon their proportionate share of total net assets of the Fund. Expenses not directly billed to a Fund are allocated proportionally among all the Funds in the Trust, and, if applicable, Touchstone Institutional FundsTrust, Touchstone Strategic Trust and Touchstone Variable Series Trust (collectively with the Trust, “Touchstone Fund Complex”), daily in relation to net assets of each Fund or another reasonable measure.
| 177 |
Notes to Financial Statements (Continued)
Security transactions — Security transactions are reflected for financial reporting purposes as of the trade date. Realized gains and losses on sales of portfolio securities are calculated using the identified cost basis.
Estimates — The preparation of financial statements in conformity with U.S. GAAP requires management to make estimates and assumptions that affect the reported amounts of assets and liabilities and disclosure of contingent assets and liabilities at the date of the financial statements and the reported amounts of income and expenses during the reporting period. Actual results could differ from those estimates.
3. Investment Transactions
Investment transactions (excluding short-term investments and U.S. Government securities) were as follows for the year ended September 30, 2018:
| Active | Emerging | |||||||||||||||
| Bond | Arbitrage | Markets Small | High Yield | |||||||||||||
| Fund* | Fund | Cap Fund | Fund | |||||||||||||
| Purchases of investment securities | $ | 206,245,673 | $ | 602,084,475 | $ | 12,653,759 | $ | 115,992,326 | ||||||||
| Proceeds from sales and maturities | $ | 160,718,236 | $ | 604,944,052 | $ | 16,385,705 | $ | 127,574,623 | ||||||||
| Impact | Merger | Mid Cap | ||||||||||||||
| Bond | Arbitrage | Mid Cap | Value | |||||||||||||
| Fund | Fund | Fund | Fund | |||||||||||||
| Purchases of investment securities | $ | 56,073,468 | $ | 387,521,097 | $ | 432,014,295 | $ | 326,099,883 | ||||||||
| Proceeds from sales and maturities | $ | 53,812,137 | $ | 436,814,682 | $ | 390,929,004 | $ | 233,479,272 | ||||||||
| Sands Capital | Small Cap | |||||||||||||||
| Premium Yield | Select Growth | Small Cap | Value | |||||||||||||
| Equity Fund | Fund** | Fund** | Fund*, ** | |||||||||||||
| Purchases of investment securities | $ | 72,703,731 | $ | 498,060,229 | $ | 50,358,748 | $ | 97,537,163 | ||||||||
| Proceeds from sales and maturities | $ | 109,441,348 | $ | 1,242,399,787 | $ | 128,134,724 | $ | 47,862,793 | ||||||||
| Ultra Short | ||||||||||||||||
| Duration Fixed | ||||||||||||||||
| Income Fund* | ||||||||||||||||
| Purchases of investment securities | $ | 931,904,324 | ||||||||||||||
| Proceeds from sales and maturities | $ | 878,437,258 | ||||||||||||||
*The cost of purchases and proceeds from sales and maturities excludes the purchases and sales of the Sentinel Government Securities Fund and Sentinel Total Return Bond Fund for the Active Bond Fund, the Small Cap Value Opportunities Fund for the Small Cap Value Fund and the Sentinel Low Duration Bond Fund for the Ultra Short Duration Fixed Income Fund (see Note 9). If these transactions were included, purchases and sales would have been higher.
**Sands Capital Select Growth Fund, Small Cap Fund and Small Cap Value Fund had redemptions-in-kind out of the Fund of $134,020,226, $6,486,196 and $385,048, respectively, which are excluded from the proceeds from sales and maturities. The redemptions were comprised of securities and cash in the amount of $129,984,251 and $4,035,975, respectively, of the Sands Capital Select Growth Fund, $6,287,326 and $198,870, respectively, of the Small Cap Fund and $375,935 and $9,113 respectively, of the Small Cap Value Fund.
For the year ended September 30, 2018, purchases and proceeds from sales and maturities in U.S. Government Securities were $1,414,256,408 and $1,498,665,226, respectively, for the Active Bond Fund, $50,427,811 and $61,228,884, respectively, for the Impact Bond Fund and $187,903,289 and $231,522,815, respectively, for the Ultra Short Duration Fixed Income Fund. There were no purchases or proceeds from sales and maturities of U.S. Government Securities by the remaining Funds for the year ended September 30, 2018.
4. Transactions with Affiliates and Other Related Parties
Certain officers of the Trust are also officers of Touchstone Advisors, Inc. (the “Advisor”), Touchstone Securities, Inc. (the “Underwriter”), or The Bank of New York Mellon, the Sub-Administrator to the Funds and BNY Mellon Investment Servicing (U.S.) Inc., the Transfer Agent to the Funds (collectively referenced to herein as
| 178 |
Notes to Financial Statements (Continued)
“BNY Mellon”). Such officers receive no compensation from the Trust. The Advisor and the Underwriter are each wholly-owned subsidiaries of Western & Southern Financial Group, Inc. (“Western & Southern”).
On behalf of the Funds, the Advisor pays each Independent Trustee a quarterly retainer plus additional retainers to the Lead Independent Trustee and the chairs of each standing committee. Interested Trustees do not receive compensation from the Funds. Each Independent Trustee also receives compensation for each Board meeting and committee meeting attended. Each standing committee chair receives additional compensation for each committee meeting that he or she oversees. The Advisor is reimbursed by the Funds for the Independent Trustees’ compensation and out-of-pocket expenses relating to their services. The Funds accrued Trustee-related expenses of $186,121 for the year ended September 30, 2018.
MANAGEMENT & EXPENSE LIMITATION AGREEMENTS
The Advisor provides general investment supervisory services for the Funds, under the terms of an advisory agreement (the “Advisory Agreement”). Under the Advisory Agreement, each Fund pays the Advisor a fee, which is computed and accrued daily and paid monthly, at an annual rate based on average daily net assets of each Fund as shown in the table below.
| Active Bond Fund | 0.40% on the first $300 million |
| 0.35% on such assets over $300 million | |
| Arbitrage Fund | 1.05% on the first $500 million |
| 1.00% on the next $500 million | |
| 0.95% on such assets over $1 billion | |
| Emerging Markets Small Cap Fund | 1.05% on the first $200 million |
| 1.00% on the next $200 million | |
| 0.90% on such assets over $400 million | |
| High Yield Fund | 0.60% on the first $50 million |
| 0.50% on the next $250 million | |
| 0.45% on such assets over $300 million | |
| Impact Bond Fund | 0.35% |
| Merger Arbitrage Fund | 1.05% |
| Mid Cap Fund | 0.80% on the first $500 million |
| 0.75% on the next $500 million | |
| 0.70% on such assets over $1 billion | |
| Mid Cap Value Fund* | 0.75% |
| Premium Yield Equity Fund | 0.70% on the first $100 million |
| 0.65% on such assets over $100 million | |
| Sands Capital Select Growth Fund | 0.85% on the first $1 billion |
| 0.80% on the next $500 million | |
| 0.75% on the next $500 million | |
| 0.70% on such assets over $2 billion | |
| Small Cap Fund | 0.85% |
| Small Cap Value Fund** | 0.85% |
| Ultra Short Duration Fixed Income Fund | 0.25% |
*Prior to June 1, 2018, the Fund paid 0.85% on the first $100 million, 0.80% on the next $300 million and 0.75% on such assets over $400 million.
**Prior to September 21, 2018, the Fund paid 0.90% on all assets.
In addition to the base advisory fee shown above for the Sands Capital Select Growth Fund, a performance fee adjustment will be added to or subtracted from the base advisory fee if the Fund outperforms or under-performs its benchmark index by more than 2.50% (the “Hurdle Rate”), for the preceding twelve month period, as follows:
| 179 |
Notes to Financial Statements (Continued)
| Performance | |||||||
| Benchmark | Required | Adjustment | |||||
| Index | Hurdle Rate | Rate | |||||
| Russell1000® | |||||||
| Sands Capital Select Growth Fund | Growth Index | +/-2.50% | +/-0.15% |
For the year ended September 30, 2018, the Advisor’s base fee was increased by $3,107,118 as a result of the performance fee adjustment.
The Advisor has entered into investment sub-advisory agreements with the following parties (each, a “Sub-Advisor”):
| Copper Rock Capital Partners LLC | The London Company |
| Emerging Markets Small Cap Fund | Mid Cap Fund |
| Small Cap Fund | |
| EARNEST Partners LLC | |
| Impact Bond Fund | Longfellow Investment Management Co., LLC |
| Arbitrage Fund | |
| Fort Washington Investment Advisors, Inc.* | Merger Arbitrage Fund |
| Active Bond Fund | |
| High Yield Fund | Miller/Howard Investments, Inc. |
| Ultra Short Duration Fixed Income Fund | Premium Yield Equity Fund |
| LMCG Investments, LLC | |
| Mid Cap Value Fund | Sands Capital Management, LLC |
| Small Cap Value Fund | Sands Capital Select Growth Fund |
*Affiliate of the Advisor and wholly-owned subsidiary of Western & Southern.
The Advisor, not the Funds, pays sub-advisory fees to each Sub-Advisor.
The Advisor entered into an expense limitation agreement (the “Expense Limitation Agreement”) to contractually limit the annual operating expenses of the Funds, excluding: dividend and interest expenses relating to short sales; interest; taxes; brokerage commissions and other transaction costs; portfolio transaction and investment related expenses, including expenses associated with the Funds’ liquidity providers; other expenditures which are capitalized in accordance with U.S. GAAP; the cost of “Acquired Fund Fees and Expenses”, if any; and other extraordinary expenses not incurred in the ordinary course of business. The maximum annual operating expense limit in any year with respect to the Funds is based on a percentage of the average daily net assets of the Funds. The Advisor has agreed to waive a portion of its fees, and to reimburse certain fund expenses in order to maintain the following expense limitations for the Funds:
| Institutional | ||||||||||||||||||||||||
| Class A | Class C | Class S | Class Y | Class Z | Class | |||||||||||||||||||
| Active Bond Fund | 0.90 | % | 1.65 | % | — | 0.65 | % | — | 0.57 | % | ||||||||||||||
| Arbitrage Fund | 1.68 | % | 2.43 | % | — | 1.43 | % | — | 1.28 | % | ||||||||||||||
| Emerging Markets Small Cap Fund | 1.69 | % | 2.44 | % | — | 1.44 | % | — | 1.29 | % | ||||||||||||||
| High Yield Fund | 1.05 | % | 1.80 | % | — | 0.80 | % | — | 0.72 | % | ||||||||||||||
| Impact Bond Fund | 0.85 | % | 1.60 | % | — | 0.60 | % | — | 0.50 | % | ||||||||||||||
| Merger Arbitrage Fund | 1.68 | % | 2.43 | % | — | 1.43 | % | — | 1.28 | % | ||||||||||||||
| Mid Cap Fund | 1.24 | % | 1.99 | % | — | 0.99 | % | 1.24 | % | 0.92 | % | |||||||||||||
| Mid Cap Value Fund* | 1.22 | % | 1.97 | % | — | 0.97 | % | — | 0.84 | % | ||||||||||||||
| Premium Yield Equity Fund | 1.20 | % | 1.95 | % | — | 0.95 | % | — | — | |||||||||||||||
| Sands Capital Select Growth Fund** | 0.25 | % | 0.25 | % | — | 0.25 | % | 0.25 | % | — | ||||||||||||||
| Small Cap Fund | 1.38 | % | 2.13 | % | — | 1.13 | % | — | 1.05 | % | ||||||||||||||
| Small Cap Value Fund | 1.38 | % | 2.13 | % | — | 1.13 | % | — | 0.98 | % | ||||||||||||||
| Ultra Short Duration Fixed Income Fund | 0.69 | % | 1.19 | % | 0.94 | % | 0.44 | % | 0.69 | % | 0.39 | % | ||||||||||||
| 180 |
Notes to Financial Statements (Continued)
*Prior to June 1, 2018, the expense limitations for Classes A, C, Y and Institutional Class shares were 1.27%, 2.02%, 1.02% and 0.89%, respectively.
**The Expense Limitation Agreement for Sands Capital Select Growth Fund limits other operating expenses to 0.25% for all classes of the Fund. Other operating expenses include all operating expenses of the Fund except for investment advisory fees, administration fees, performance fees, distribution fees (12b-1), shareholder service fees and any expenses excluded in the Expense Limitation Agreement.
These expense limitations will remain in effect for all Funds through at least January 29, 2019, except for Active Bond Fund and Ultra Short Duration Fixed Income Fund, which will remain in effect through at least October 26, 2019 and Small Cap Value Fund, which will remain in effect through at least July 14, 2019. The Expense Limitation Agreement can be terminated by a vote of the Funds’ Board if it deems the termination to be beneficial to the Funds’ shareholders.
During the year ended September 30, 2018, the Advisor or its affiliates waived investment advisory fees, administration fees and waived or reimbursed other operating expenses, including distribution fees of the Funds, as follows:
| Other | ||||||||||||||||
| Operating | ||||||||||||||||
| Investment | Expenses | |||||||||||||||
| Advisory | Administration | Reimbursed/ | ||||||||||||||
| Fees Waived | Fees Waived | Waived | Total | |||||||||||||
| Active Bond Fund | $ | — | $ | 97,315 | $ | 136,986 | $ | 234,301 | ||||||||
| Arbitrage Fund | — | — | 44,366 | 44,366 | ||||||||||||
| Emerging Markets Small Cap Fund | 126,906 | 17,525 | 91,779 | 236,210 | ||||||||||||
| High Yield Fund | — | 42,158 | 113,097 | 155,255 | ||||||||||||
| Impact Bond Fund | — | 99,361 | 206,527 | 305,888 | ||||||||||||
| Merger Arbitrage Fund | — | — | 57,165 | 57,165 | ||||||||||||
| Mid Cap Fund | — | 160,480 | 379,861 | 540,341 | ||||||||||||
| Mid Cap Value Fund | — | 476,107 | 271,613 | 747,720 | ||||||||||||
| Premium Yield Equity Fund | — | — | 87,222 | 87,222 | ||||||||||||
| Sands Capital Select Growth Fund | — | — | 343,929 | 343,929 | ||||||||||||
| Small Cap Fund | — | — | 109,412 | 109,412 | ||||||||||||
| Small Cap Value Fund | 54,586 | 143,615 | 174,998 | 373,199 | ||||||||||||
| Ultra Short Duration Fixed Income Fund | — | 320,621 | 357,010 | 677,631 | ||||||||||||
Under the terms of the Expense Limitation Agreement, the Advisor is entitled to recover, subject to approval by the Funds’ Board, such amounts waived or reimbursed for a period of up to three years from the date on which the Advisor reduced its compensation or assumed expenses for the Funds. No recoupment will occur unless a Fund’s operating expenses are below the expense limitation amount in effect at the time of the waiver or reimbursement and the Fund’s current expense limitation.
As of September 30, 2018, the Advisor may seek recoupment of previously waived fees and reimbursed expenses as follows:
| Expires on or | Expires on or | Expires on or | ||||||||||||||
| before | before | before | ||||||||||||||
| September 30, | September 30, | September 30, | ||||||||||||||
| Fund | 2019 | 2020 | 2021 | Total | ||||||||||||
| Active Bond Fund | $ | 236,361 | $ | 224,157 | $ | 150,083 | $ | 610,601 | ||||||||
| Arbitrage Fund | 8,272 | 15,946 | 17,556 | 41,774 | ||||||||||||
| Emerging Markets Small Cap Fund | 353,948 | 264,662 | 221,225 | 839,835 | ||||||||||||
| High Yield Fund | 149,452 | 122,090 | 103,212 | 374,754 | ||||||||||||
| Impact Bond Fund | 206,835 | 243,198 | 278,009 | 728,042 | ||||||||||||
| Merger Arbitrage Fund | — | 19,966 | 29,738 | 49,704 | ||||||||||||
| Mid Cap Fund | 545,460 | 576,954 | 468,850 | 1,591,264 | ||||||||||||
| Mid Cap Value Fund | 430,326 | 555,571 | 692,241 | �� | 1,678,138 | |||||||||||
| 181 |
Notes to Financial Statements (Continued)
| Expires on or | Expires on or | Expires on or | ||||||||||||||
| before | before | before | ||||||||||||||
| September 30, | September 30, | September 30, | ||||||||||||||
| Fund | 2019 | 2020 | 2021 | Total | ||||||||||||
| Premium Yield Equity Fund | $ | 71,385 | $ | 46,012 | $ | 26,244 | $ | 143,641 | ||||||||
| Sands Capital Select Growth Fund | 763,134 | 528,582 | 343,929 | 1,635,645 | ||||||||||||
| Small Cap Fund | 38,604 | 38,986 | 63,116 | 140,706 | ||||||||||||
| Small Cap Value Fund | 159,191 | 462,615 | 231,612 | 853,418 | ||||||||||||
| Ultra Short Duration Fixed Income Fund | 500,874 | 457,716 | 570,299 | 1,528,889 | ||||||||||||
For year ended September 30, 2018, the Advisor recouped previously waived fees or reimbursed expenses from Mid Cap Value Fund and Sands Capital Select Growth Fund of $48,669 and $68,840, respectively.
ADMINISTRATION AGREEMENT
The Advisor entered into an Administration Agreement with the Trust, whereby the Advisor is responsible for: supplying executive and regulatory compliance services; supervising the preparation of tax returns; coordinating the preparation of reports to shareholders and reports to, and filings with the SEC and state securities authorities, as well as materials for meetings of the Board; calculating the daily NAV per share; and maintaining the financial books and records of each Fund.
For its services, the Advisor’s annual administrative fee is:
0.145% on the first $20 billion of the aggregate average daily net assets;
0.11% on the next $10 billion of aggregate average daily net assets;
0.09% on the next $10 billion of aggregate average daily net assets; and
0.07% on the aggregate average daily net assets over $40 billion.
The fee is computed and allocated among the Touchstone Fund Complex (excluding Touchstone Institutional Funds Trust) on the basis of relative daily net assets.
The Advisor has engaged BNY Mellon as the Sub-Administrator to the Trust. BNY Mellon provides administrative and accounting services to the Trust and is compensated directly by the Advisor, not the Trust.
TRANSFER AGENT AGREEMENT
Under the terms of the Transfer Agent Agreement between the Trust and BNY Mellon, BNY Mellon maintains the records of each shareholder’s account, answers shareholders’ inquiries concerning their accounts, processes purchases and redemptions of each Fund’s shares, acts as dividend and distribution disbursing agent, and performs other shareholder service functions. For these services, BNY Mellon receives a monthly fee from each Fund. In addition, each Fund pays out-of-pocket expenses incurred by BNY Mellon, including, but not limited to, postage and supplies.
The Funds may reimburse the Advisor for fees paid to intermediaries such as banks, broker-dealers, financial advisors or other financial institutions for sub-transfer agency, sub-administration and other services provided to investors whose shares of record are held in omnibus, other group accounts, retirement plans or accounts traded through registered securities clearing agents. These fees may vary based on, for example, the nature of services provided, but generally range up to 0.15% of the assets of the class serviced or maintained by the intermediary or up to $22 per sub-account maintained by the intermediary.
| 182 |
Notes to Financial Statements (Continued)
PLANS OF DISTRIBUTION AND SHAREHOLDER SERVICING FEE ARRANGEMENTS
The Trust has adopted distribution plans pursuant to Rule 12b-1 under the 1940 Act for each class of shares it offers that is subject to 12b-1 distribution fees. The plans allow each Fund to pay distribution and other fees for the sale and distribution of its shares and for services provided to shareholders. The fees charged to the Funds are limited to the actual expenses incurred. Under the Class A plan, each Fund offering Class A shares, excluding the Active Bond Fund and High Yield Fund, pays an annual fee of up to 0.25% of average daily net assets that are attributable to Class A shares. The Active Bond Fund and High Yield Fund pay an annual fee not to exceed 0.35% of average daily net assets that are attributable to Class A shares. The Active Bond Fund and High Yield Fund currently limit the 12b-1 fees for Class A shares to 0.25% of average daily net assets attributable to such shares. Under the Class C plan, each Fund offering Class C shares (except the Ultra Short Duration Fixed Income Fund) pays an annual fee not to exceed 1.00% of average daily net assets that are attributable to Class C shares (of which up to 0.75% is a distribution fee and up to 0.25% is a shareholder servicing fee). The Ultra Short Duration Fixed Income Fund has limited the amount of the 12b-1 fees for Class C shares to 0.75% of average daily net assets through January 29, 2019. Under the Class S plan, the Ultra Short Duration Fixed Income Fund pays an annual shareholder servicing fee not to exceed 0.50% of average daily net assets that are attributable to Class S shares (of which up to 0.25% is a distribution fee and up to 0.25% is a shareholder servicing fee). Under the Class Z plan, each Fund offering Class Z shares pays an annual shareholder servicing fee not to exceed 0.25% of average daily net assets that are attributable to Class Z shares.
UNDERWRITING AGREEMENT
The Underwriter is the Funds’ principal underwriter and, as such, acts as exclusive agent for distribution of the Funds’ shares. Under the terms of the Underwriting Agreement between the Trust and the Underwriter, the Underwriter earned underwriting and broker commissions on the sale of Class A shares of the Funds. W&S Brokerage Services, Inc., an affiliate of the Underwriter and the Advisor, also earned broker commissions on the sale of Class A shares of the Funds. Listed below are the total underwriting and broker commissions earned by the Underwriter and its affiliate during the year ended September 30, 2018:
| Fund | Amount | |||
| Active Bond Fund | $ | 18,570 | ||
| Emerging Markets Small Cap Fund | 777 | |||
| High Yield Fund | 3,159 | |||
| Impact Bond Fund | 5,290 | |||
| Merger Arbitrage Fund | 3,709 | |||
| Mid Cap Fund | 10,629 | |||
| Mid Cap Value Fund | 5,883 | |||
| Premium Yield Equity Fund | 6,064 | |||
| Sands Capital Select Growth Fund | 23,107 | |||
| Small Cap Fund | 1,097 | |||
| Small Cap Value Fund | 556 | |||
| Ultra Short Duration Fixed Income Fund | 2,670 | |||
In addition, the Underwriter collected CDSC on the redemption of Class A and Class C shares of the Funds listed below during the year ended September 30, 2018:
| Fund | Class A | Class C | ||||||
| Active Bond Fund | $ | 11 | $ | 556 | ||||
| Arbitrage Fund | — | 1,116 | ||||||
| Emerging Markets Small Cap Fund | 3 | — | ||||||
| High Yield Fund | — | 160 | ||||||
| Mid Cap Fund | — | 547 | ||||||
| Mid Cap Value Fund | — | 846 | ||||||
| 183 |
Notes to Financial Statements (Continued)
| Fund | Class A | Class C | ||||||
| Sands Capital Select Growth Fund | $ | — | $ | 343 | ||||
| Small Cap Fund | — | 31 | ||||||
| Ultra Short Duration Fixed Income Fund | — | 111 | ||||||
INTERFUND TRANSACTIONS
The Funds may engage in purchase and sale transactions with funds that have a common investment advisor (or affiliated investment advisors), common Trustees and/or common officers. During the year ended September 30, 2018, the Funds did not engage in any Rule 17a-7 transactions as defined under the 1940 Act.
5. Liquidity
ReFlow Fund LLC — The Funds may participate in the ReFlow Fund LLC liquidity program (“ReFlow”), which is designed to provide an alternative liquidity source for funds experiencing redemptions. In order to pay cash to shareholders who redeem their shares on a given day, a fund typically must hold cash in its portfolio, liquidate portfolio securities, or borrow money. ReFlow provides participating funds with another source of cash by standing ready to purchase shares from a fund up to the amount of the fund’s net redemptions on a given day, cumulatively limited to 3% of the outstanding voting shares of a Fund. ReFlow then generally redeems those shares (in cash or in-kind) when the Fund experiences net sales at the end of a maximum holding period determined by ReFlow, or at other times at ReFlow’s discretion. In return for this service, the Fund will pay a fee to ReFlow at a rate determined by a daily auction with other participating mutual funds.
During the year ended September 30, 2018, the following Funds utilized ReFlow. The shares ReFlow subscribed to and redemptions-in-kind were as follows:
| Shares ReFlow | ||||||||
| Fund | Subscribed to | Redemptions-in-kind | ||||||
| Sands Capital Select Growth Fund | 7,847,686 | $ | 129,984,251 | |||||
| Small Cap Fund | 567,368 | 6,287,326 | ||||||
| Small Cap Value Fund | 16,400 | 375,935 | ||||||
Interfund lending — Pursuant to an Exemptive Order issued by the SEC on March 28, 2017, the Funds, along with certain other funds in the Touchstone Fund Complex, may participate in an interfund lending program. The interfund lending program provides an alternate credit facility that allows the Funds to lend to or borrow from other participating funds in the Touchstone Fund Complex, subject to the conditions of the Exemptive Order. The Funds may not borrow under the facility for leverage purposes and the loans’ duration may be no more than 7 days.
During the year ended September 30, 2018, the average amount loaned, average interest rate and interest income for Funds that participated as a lender in the interfund lending program were as follows:
| Average Amount | Average Interest | Interest | ||||||||||
| Fund | Loaned | Rate | Income* | |||||||||
| Sands Capital Select Growth Fund | $ | 346,402 | 1.72 | % | $ | 6,076 | ||||||
*Included in Interest in the Statements of Operations.
| 184 |
Notes to Financial Statements (Continued)
During the year ended September 30, 2018, the average amount borrowed, average interest rate and interest expense for Funds that participated as a borrower in the interfund lending program were as follows:
| Average Amount | Average Interest | Interest | ||||||||||
| Fund | Borrowed | Rate | Expense* | |||||||||
| Arbitrage Fund | $ | 139,570 | 1.60 | % | $ | 2,518 | ||||||
| High Yield Fund | $ | 30,370 | 1.65 | % | $ | 507 | ||||||
| Impact Bond Fund | $ | 11,113 | 1.64 | % | $ | 185 | ||||||
| Mid Cap Fund | $ | 81,093 | 1.32 | % | $ | 1,089 | ||||||
| Premium Yield Equity Fund | $ | 30,027 | 1.56 | % | $ | 453 | ||||||
| Sands Capital Growth Fund | $ | 169,828 | 1.68 | % | $ | 2,886 | ||||||
*Included in Other expenses in the Statements of Operations.
6. Federal Tax Information
Federal income tax — It is each Fund’s policy to continue to comply with the special provisions of the Internal Revenue Code applicable to regulated investment companies. As provided therein, in any fiscal year in which a Fund so qualifies and distributes at least 90% of its investment company taxable income, the Fund (but not the shareholders) will be relieved of federal income tax on the income distributed. It is each Fund’s policy to distribute all of its taxable income and accordingly, no provision for income taxes has been made.
In order to avoid imposition of the excise tax applicable to regulated investment companies, it is also each Fund’s intention to declare and pay as dividends in each calendar year at least 98% of its investment company taxable income (earned during the calendar year) and 98.2% of its net realized capital gains (earned during the twelve months ending October 31) plus undistributed amounts from prior years.
The tax character of distributions paid for the years ended September 30, 2018 and 2017 are as follows:
| Active Bond Fund | Arbitrage Fund | |||||||||||||||||||||||
| Year Ended | Year Ended | Year Ended | Year Ended | |||||||||||||||||||||
| September 30, | September 30, | September 30, | September 30, | |||||||||||||||||||||
| 2018 | 2017 | 2018 | 2017 | |||||||||||||||||||||
| From ordinary income | $ | 10,048,932 | $ | 2,885,074 | $ | 8,773,088 | $ | 4,688,177 | ||||||||||||||||
| From long-term capital gains | — | — | 633,584 | — | ||||||||||||||||||||
| Total distributions | $ | 10,048,932 | $ | 2,885,074 | $ | 9,406,672 | $ | 4,688,177 | ||||||||||||||||
| Emerging Markets | ||||||||||||||||||||||||
| Small Cap Fund | High Yield Fund | |||||||||||||||||||||||
| Year Ended | Year Ended | Year Ended | Year Ended | |||||||||||||||||||||
| September 30, | September 30, | September 30, | September 30, | |||||||||||||||||||||
| 2018 | 2017 | 2018 | 2017 | |||||||||||||||||||||
| From ordinary income | $ | 104,036 | $ | — | $ | 10,245,696 | $ | 11,116,195 | ||||||||||||||||
| From long-term capital gains | — | — | — | — | ||||||||||||||||||||
| Total distributions | $ | 104,036 | $ | — | $ | 10,245,696 | $ | 11,116,195 | ||||||||||||||||
| Impact Bond | Merger Arbitrage | Mid Cap | ||||||||||||||||||||||
| Fund | Fund | Fund | ||||||||||||||||||||||
| Year Ended | Year Ended | Year Ended | Year Ended | Year Ended | Year Ended | |||||||||||||||||||
| September 30, | September 30, | September 30, | September 30, | September 30, | September 30, | |||||||||||||||||||
| 2018 | 2017 | 2018 | 2017 | 2018 | 2017 | |||||||||||||||||||
| From ordinary income | $ | 8,079,643 | $ | 6,815,476 | $ | 8,602,412 | $ | 5,245,522 | $ | 2,340,836 | $ | 3,693,873 | ||||||||||||
| From long-term capital gains | — | — | 1,012,026 | — | 6,743,129 | — | ||||||||||||||||||
| Total distributions | $ | 8,079,643 | $ | 6,815,476 | $ | 9,614,438 | $ | 5,245,522 | $ | 9,083,965 | $ | 3,693,873 | ||||||||||||
| 185 |
Notes to Financial Statements (Continued)
| Mid Cap | Premium Yield | Sands Capital | ||||||||||||||||||||||
| Value Fund | Equity Fund | Select Growth Fund | ||||||||||||||||||||||
| Year Ended | Year Ended | Year Ended | Year Ended | Year Ended | Year Ended | |||||||||||||||||||
| September 30, | September 30, | September 30, | September 30, | September 30, | September 30, | |||||||||||||||||||
| 2018 | 2017 | 2018 | 2017 | 2018 | 2017 | |||||||||||||||||||
| From ordinary income | $ | 13,722,613 | $ | 7,502,271 | $ | 2,656,746 | $ | 3,698,205 | $ | — | $ | 5,136,516 | ||||||||||||
| From long-term capital gains | 33,142,075 | 13,872,720 | 2,381,070 | — | 476,473,679 | 361,190,380 | ||||||||||||||||||
| Total distributions | $ | 46,864,688 | $ | 21,374,991 | $ | 5,037,816 | $ | 3,698,205 | $ | 476,473,679 | $ | 366,326,896 | ||||||||||||
| Small Cap | Small Cap | Ultra Short Duration | ||||||||||||||||||||||
| Fund | Value Fund | Fixed Income Fund | ||||||||||||||||||||||
| Year Ended | Year Ended | Year Ended | Year Ended | Year Ended | Year Ended | |||||||||||||||||||
| September 30, | September 30, | September 30, | September 30, | September 30, | September 30, | |||||||||||||||||||
| 2018 | 2017 | 2018 | 2017 | 2018 | 2017 | |||||||||||||||||||
| From ordinary income | $ | 4,992,245 | $ | 1,853,070 | $ | 158,448 | $ | 137,427 | $ | 19,867,119 | $ | 10,787,697 | ||||||||||||
| From long-term capital gains | 34,210,136 | — | — | — | — | — | ||||||||||||||||||
| Total distributions | $ | 39,202,381 | $ | 1,853,070 | $ | 158,448 | $ | 137,427 | $ | 19,867,119 | $ | 10,787,697 | ||||||||||||
The following information is computed on a tax basis for each item as of September 30, 2018:
| Emerging | ||||||||||||||||
| Active Bond | Arbitrage | Markets Small Cap | High Yield | |||||||||||||
| Fund | Fund | Fund | Fund | |||||||||||||
| Tax cost of portfolio investments | $ | 368,109,290 | $ | 227,131,121 | $ | 9,146,569 | $ | 204,093,686 | ||||||||
| Gross unrealized appreciation on investments | 1,354,563 | 7,111,009 | 570,357 | 1,450,850 | ||||||||||||
| Gross unrealized depreciation on investments | (8,969,435 | ) | (11,427,914 | ) | (1,083,890 | ) | (4,593,713 | ) | ||||||||
| Net unrealized appreciation (depreciation) on investments | (7,614,872 | ) | (4,316,905 | ) | (513,533 | ) | (3,142,863 | ) | ||||||||
| Gross unrealized appreciation on short sales, derivatives and foreign currency transactions | — | 749,803 | 509 | — | ||||||||||||
| Gross unrealized depreciation on short sales, derivatives and foreign currency transactions | (212 | ) | (2,484,721 | ) | (229 | ) | — | |||||||||
| Net unrealized appreciation (depreciation) on short sales, derivatives and foreign currency transactions | (212 | ) | (1,734,918 | ) | 280 | — | ||||||||||
| Qualified late-year losses | (3,505,129 | ) | — | (733 | ) | — | ||||||||||
| Capital loss carryforwards | (91,097,777 | ) | (3,425,484 | ) | (97,055,039 | ) | (14,856,040 | ) | ||||||||
| Undistributed ordinary income | — | 1,319,660 | — | 210,700 | ||||||||||||
| Other temporary differences | — | (14,507 | ) | (2,799 | ) | — | ||||||||||
| Accumulated earnings (deficit) | $ | (102,217,990 | ) | $ | (8,172,154 | ) | $ | (97,571,824 | ) | $ | (17,788,203 | ) | ||||
| 186 |
Notes to Financial Statements (Continued)
| Impact Bond | Merger | Mid Cap | ||||||||||
| Fund | Arbitrage Fund | Fund | ||||||||||
| Tax cost of portfolio investments | $ | 258,362,424 | $ | 169,811,945 | $ | 778,000,720 | ||||||
| Gross unrealized appreciation on investments | 695,602 | 4,727,908 | 196,574,509 | |||||||||
| Gross unrealized depreciation on investments | (8,490,626 | ) | (8,383,646 | ) | (14,366,741 | ) | ||||||
| Net unrealized appreciation (depreciation) on investments | (7,795,024 | ) | (3,655,738 | ) | 182,207,768 | |||||||
| Gross unrealized appreciation on short sales, derivatives and foreign currency transactions | — | 497,896 | — | |||||||||
| Gross unrealized depreciation on short sales, derivatives and foreign currency transactions | — | (1,627,135 | ) | — | ||||||||
| Net unrealized appreciation (depreciation) on short sales, derivatives and foreign currency transactions | — | (1,129,239 | ) | — | ||||||||
| Capital loss carryforwards | (5,600,682 | ) | (2,113,018 | ) | — | |||||||
| Undistributed ordinary income | 117,309 | 1,220,797 | — | |||||||||
| Undistributed capital gains | — | — | 23,636,119 | |||||||||
| Other temporary differences | — | (10,836 | ) | — | ||||||||
| Accumulated earnings (deficit) | $ | (13,278,397 | ) | $ | (5,688,034 | ) | $ | 205,843,887 | ||||
| Premium | Sands Capital | |||||||||||
| Mid Cap Value | Yield Equity | Select Growth | ||||||||||
| Fund | Fund | Fund | ||||||||||
| Tax cost of portfolio investments | $ | 740,154,331 | $ | 72,796,846 | $ | 927,088,428 | ||||||
| Gross unrealized appreciation on investments | 130,877,126 | 13,957,313 | 1,445,879,583 | |||||||||
| Gross unrealized depreciation on investments | (58,761,578 | ) | (1,324,878 | ) | (23,829,182 | ) | ||||||
| Net unrealized appreciation (depreciation) on investments | 72,115,548 | 12,632,435 | 1,422,050,401 | |||||||||
| Qualified late-year losses | — | — | (21,770,779 | ) | ||||||||
| Undistributed ordinary income | 8,480,613 | 74,339 | — | |||||||||
| Undistributed capital gains | 23,404,903 | 6,831,546 | 381,218,195 | |||||||||
| Accumulated earnings (deficit) | $ | 104,001,064 | $ | 19,538,320 | $ | 1,781,497,817 | ||||||
| Ultra Short | ||||||||||||
| Duration | ||||||||||||
| Small Cap | Small Cap Value | Fixed Income | ||||||||||
| Fund | Fund | Fund | ||||||||||
| Tax cost of portfolio investments | $ | 112,144,016 | $ | 155,226,012 | $ | 945,408,182 | ||||||
| Gross unrealized appreciation on investments | 55,939,418 | 14,630,311 | 808,268 | |||||||||
| Gross unrealized depreciation on investments | (4,477,849 | ) | (7,296,061 | ) | (3,395,279 | ) | ||||||
| Net unrealized appreciation (depreciation) on investments | 51,461,569 | 7,334,250 | (2,587,011 | ) | ||||||||
| Capital loss carryforwards | — | — | (98,376,018 | ) | ||||||||
| Undistributed ordinary income | 124,190 | 17,686 | 268,218 | |||||||||
| Undistributed capital gains | 23,022,389 | 8,125,924 | — | |||||||||
| Other temporary differences | — | — | (210,415 | ) | ||||||||
| Accumulated earnings (deficit) | $ | 74,608,148 | $ | 15,477,860 | $ | (100,905,226 | ) | |||||
The difference between the tax cost of portfolio investments and the financial statement cost is primarily due to wash sale loss deferrals, investments in passive foreign investment company (“PFIC”) adjustments, amortization adjustments on bonds, preferred income outstanding and taxable interest on defaulted securities.
| 187 |
Notes to Financial Statements (Continued)
As of September 30, 2018, the Funds had the following capital loss carryforwards for federal income tax purposes:
| No | No | |||||||||||||||
| Short Term Expiring In* | Expiration | Expiration | ||||||||||||||
| 2019 | Short Term* | Long Term* | Total | |||||||||||||
| Active Bond Fund | $ | — | $ | 49,877,235 | $ | 41,220,542 | $ | 91,097,777 | ||||||||
| Arbitrage Fund | — | 3,425,484 | — | 3,425,484 | ||||||||||||
| Emerging Markets Small Cap Fund | — | 17,252,989 | 79,802,050 | 97,055,039 | ||||||||||||
| High Yield Fund | — | — | 14,856,040 | 14,856,040 | ||||||||||||
| Impact Bond Fund | — | 1,171,178 | 4,429,504 | 5,600,682 | ||||||||||||
| Merger Arbitrage Fund | — | 1,690,062 | 422,956 | 2,113,018 | ||||||||||||
| Ultra Short Duration Fixed Income Fund | 933,830 | 27,605,177 | 69,837,011 | 98,376,018 | ||||||||||||
* The Regulated Investment Company Modernization Act of 2010 (the “Act”) was enacted on December 22, 2010. The Act made changes to several tax rules impacting the Funds. The provisions of the Act first became effective for the Funds’ fiscal year ended September 30, 2012 and are applicable to all subsequent fiscal years. Although the Act provides several benefits, including the unlimited carryover of future capital losses, there may be a greater likelihood that all or a portion of each Fund’s pre-enactment capital loss carryovers may expire without being utilized due to the fact that post-enactment capital losses must be utilized before pre-enactment capital loss carryovers may be utilized. Under the Act, new capital losses may now be carried forward indefinitely, and retain the character of the original loss as compared with pre-enactment law, where capital losses could be carried forward for up to eight years, and carried forward as short-term capital losses, irrespective of the character of the original loss.
The capital loss carryforwards may be utilized in future years to offset net realized capital gains, if any, prior to distributing such gains to shareholders.
The following Funds had capital losses expiring in the current year as follows:
| Fund | Amount | |||
| Ultra Short Duration Fixed Income Fund | $ | 52,515,365 | ||
During the year ended September 30, 2018, the following Funds utilized capital loss carryforwards:
| Fund | Amount | |||
| Active Bond Fund | $ | 197,589 | ||
| Emerging Markets Small Cap Fund | 587,844 | |||
| High Yield Fund | 1,119,735 | |||
| Mid Cap Fund | 70,800,792 | |||
| Small Cap Value Fund | 1,957,088 | |||
Under current laws, certain capital losses realized after October 31 and ordinary losses realized after December 31 may be deferred (and certain ordinary losses after October and/or December 31 may be deferred) and treated as occurring on the first day of the following fiscal year. For the year ended September 30, 2018, the following Funds elected to defer the following losses:
| Realized | ||||||||||||
| Capital | Ordinary | |||||||||||
| Fund | Losses | Losses | Total | |||||||||
| Active Bond Fund | $ | 3,505,129 | $ | — | $ | 3,505,129 | ||||||
| Emerging Markets Small Cap Fund | — | 733 | 733 | |||||||||
| Sands Capital Select Growth Fund | — | 21,770,779 | 21,770,779 | |||||||||
The Funds have analyzed their tax positions taken on federal income tax returns for all open tax years (tax years ended September 30, 2015 through 2018) and have concluded that no provision for income tax is required in their financial statements.
Certain reclassifications, the result of permanent differences between financial statement and income tax reporting requirements, have been made to the components of capital. These reclassifications have no impact on the net assets or NAV per share of the Fund. The following reclassifications, which are primarily attributed to the tax
| 188 |
Notes to Financial Statements (Continued)
treatment of, deemed distributions on shareholder redemptions, reclassification of net operating losses, acquired capital loss carryforwards from mergers, expiration of capital loss carryforwards, acquired wash sales from mergers, and in-kind distributions on shareholder redemptions have been made to the following Funds for the year ended September 30, 2018:
| Paid-In | Distributable | |||||||
| Fund | Capital | Earnings | ||||||
| Active Bond Fund | $ | 91,227,345 | $ | (91,227,345 | ) | |||
| Mid Cap Value Fund | 4 | (4 | ) | |||||
| Premium Yield Equity Fund | 2,127,936 | (2,127,936 | ) | |||||
| Sands Capital Select Growth Fund | 137,677,515 | (137,677,515 | ) | |||||
| Small Cap Fund | 12,340,589 | (12,340,589 | ) | |||||
| Small Cap Value Fund | 245,993 | (245,993 | ) | |||||
| Ultra Short Duration Fixed Income Fund | 73,180,031 | (73,180,031 | ) | |||||
7. Commitments and Contingencies
The Funds indemnify the Trust’s officers and Trustees for certain liabilities that might arise from their performance of their duties to the Funds. Additionally, in the normal course of business, the Funds enter into contracts that contain a variety of representations and warranties and which provide general indemnifications. The Funds’ maximum exposure under these arrangements is unknown, as this would involve future claims that may be made against the Funds.
8. Principal Risks
Risks Associated with Foreign Investments — Some of the Funds may invest in the securities of foreign issuers. Investing in securities issued by companies whose principal business activities are outside the U.S. may involve significant risks not present in domestic investments. For example, there is generally less publicly available information about foreign companies, particularly those not subject to the disclosure and reporting requirements of the U.S. securities laws. Foreign issuers are generally not bound by uniform accounting, auditing, and financial reporting requirements and standards of practice comparable to those applicable to domestic issuers. Investments in foreign securities also involve the risk of possible adverse changes in investment or exchange control regulations, expropriation or confiscatory taxation, limitations on the removal of funds or other assets of a Fund, political or financial instability or diplomatic and other developments which could affect such investments. Foreign stock markets, while growing in volume and sophistication, are generally not as developed as those in the U.S., and securities of some foreign issuers (particularly those located in developing countries) may be less liquid and more volatile than securities of comparable U.S. companies. In general, there is less overall governmental supervision and regulation of foreign securities markets, broker-dealers, and issuers than in the U.S.
Risks Associated with Sector Concentration — Certain Funds may invest a high percentage of their assets in specific sectors of the market in order to achieve a potentially greater investment return. As a result, these Funds may be more susceptible to economic, political, and regulatory developments in a particular sector of the market, positive or negative, and may experience increased volatility on the Funds’ NAVs and magnified effect on the total return.
Risks Associated with Credit — An issuer may be unable to make timely payments of either principal or interest. This may cause the issuer’s securities to decline in value. Credit risk is particularly relevant to those Funds that invest a significant amount of their assets in junk bonds or lower-rated securities.
Risks Associated with Interest Rate Changes — As interest rates rise, the value of fixed-income securities a Fund owns will likely decrease. The price of debt securities is generally linked to the prevailing market interest rates. In general, when interest rates rise, the price of debt securities falls, and when interest rates fall, the price
| 189 |
Notes to Financial Statements (Continued)
of debt securities rises. The price volatility of a debt security also depends on its maturity. Longer-term securities are generally more volatile, so the longer the average maturity or duration of these securities, the greater their price risk. Duration is a measure of the expected life, taking into account any prepayment or call features of the security, that is used to determine the price sensitivity of the security for a given change in interest rates. Specifically, duration is the change in the value of a fixed-income security that will result from a 1% change in interest rates, and generally is stated in years. For example, as a general rule a 1% rise in interest rates means a 1% fall in value for every year of duration. Maturity, on the other hand, is the date on which a fixed-income security becomes due for payment of principal. The negative impact on fixed income securities if interest rates increase as a result could negatively impact a Fund’s NAV.
Risks Associated with Liquidity — Liquidity risk exists when particular investments are difficult to purchase or sell. This can reduce the Fund’s returns because the Fund may be unable to transact at advantageous times or prices, or at all.
Please see the Funds’ prospectus for a complete discussion of these and other risks.
9. Fund Mergers
Small Cap Value Fund:
The shareholders of the Touchstone Small Cap Value Opportunities Fund, a series of the Touchstone Strategic Trust, approved an Agreement and Plan of Reorganization providing for the transfer of all assets and liabilities of the Touchstone Small Cap Value Opportunities Fund to the Touchstone Small Cap Value Fund. The tax-free merger took place on September 21, 2018.
The following is a summary of shares outstanding, net assets, net asset value per share and unrealized appreciation immediately before and after the reorganizations.
| After | ||||||||||||
| Before Reorganization | Reorganization | |||||||||||
| Touchstone | ||||||||||||
| Small Cap Value | Touchstone | Touchstone | ||||||||||
| Opportunities | Small Cap | Small Cap | ||||||||||
| Fund | Value Fund | Value Fund | ||||||||||
| Class A | ||||||||||||
| Shares | 72,932 | (A) | 2,759,552 | 2,832,484 | ||||||||
| Net Assets | $ | 2,071,440 | $ | 78,377,638 | $ | 80,449,078 | ||||||
| Net Asset Value | $ | 28.40 | (A) | $ | 28.40 | $ | 28.40 | |||||
| Class C | ||||||||||||
| Shares | 16,657 | (B) | 36,296 | 52,953 | ||||||||
| Net Assets | $ | 461,382 | $ | 1,005,378 | $ | 1,466,760 | ||||||
| Net Asset Value | $ | 27.70 | (B) | $ | 27.70 | $ | 27.70 | |||||
| Class Y | ||||||||||||
| Shares | 1,429,509 | (C) | 102,513 | 1,532,022 | ||||||||
| Net Assets | $ | 40,693,020 | $ | 2,918,178 | $ | 43,611,198 | ||||||
| Net Asset Value | $ | 28.47 | (C) | $ | 28.47 | $ | 28.47 | |||||
| Institutional Class | ||||||||||||
| Shares | 127,709 | (D) | 950,401 | 1,078,110 | ||||||||
| Net Assets | $ | 3,632,489 | $ | 27,032,700 | $ | 30,665,189 | ||||||
| Net Asset Value | $ | 28.44 | (D) | $ | 28.44 | $ | 28.44 | |||||
| 190 |
Notes to Financial Statements (Continued)
| After | ||||||||||||
| Before Reorganization | Reorganization | |||||||||||
| Touchstone | ||||||||||||
| Small Cap Value | Touchstone | Touchstone | ||||||||||
| Opportunities | Small Cap | Small Cap | ||||||||||
| Fund | Value Fund | Value Fund | ||||||||||
| Fund Total | ||||||||||||
| Shares Outstanding | 2,667,791 | 3,848,762 | 5,495,569 | |||||||||
| Net Assets | $ | 46,858,331 | $ | 109,333,894 | $ | 156,192,225 | ||||||
| Unrealized Appreciation (Depreciation) | $ | 7,807,725 | $ | 9,757,990 | $ | 17,565,715 | ||||||
(A) Reflects a 0.5757:1 stock split which occurred on the date of reorganization, September 21, 2018.
(B) Reflects a 0.5610:1 stock split which occurred on the date of reorganization, September 21, 2018.
(C) Reflects a 0.6191:1 stock split which occurred on the date of reorganization, September 21, 2018.
(D) Reflects a 0.6307:1 stock split which occurred on the date of reorganization, September 21, 2018.
Assuming the reorganizations had been completed on October 1, 2017, the Small Cap Value Fund’s results of operations for the year ended September 30, 2018 would have been as follows:
| Net investment income | $ | 329 | ||
| Net realized and unrealized gain (loss) on investments | $ | 14,366,801 | ||
| Net increase in net assets resulting from operations | $ | 14,367,130 |
Because the combined investment portfolios have been managed as a single portfolio since the reorganizations were completed, it is not practical to separate the amounts of revenue and earnings to the Small Cap Value Fund that have been included in its statement of operations since the reorganizations.
Active Bond Fund:
The shareholders of the Sentinel Government Securities Fund and the Sentinel Total Return Bond Fund, both a series of the Sentinel Group Funds, Inc., approved an Agreement and Plan of Reorganization providing for the transfer of all assets and liabilities of the Sentinel Government Securities Fund and the Sentinel Total Return Bond Fund to the Touchstone Active Bond Fund. The tax-free mergers took place on October 27, 2017.
The following is a summary of shares outstanding, net assets, net asset value per share and unrealized appreciation immediately before and after the reorganizations.
| After | ||||||||||||||||
Before Reorganizations | Reorganizations | |||||||||||||||
| Sentinel | Sentinel | Touchstone | Touchstone | |||||||||||||
| Government | Total Return | Active | Active | |||||||||||||
| Securities | Bond | Bond | Bond | |||||||||||||
| Fund | Fund | Fund | Fund | |||||||||||||
| Class A* | ||||||||||||||||
| Shares | 11,174,957 | (A) | 3,834,554 | (D) | 2,051,008 | 17,060,519 | ||||||||||
| Net Assets | $ | 116,518,985 | $ | 39,982,285 | $ | 21,385,481 | $ | 177,886,751 | ||||||||
| Net Asset Value | $ | 10.43 | (A) | $ | 10.43 | (D) | $ | 10.43 | $ | 10.43 | ||||||
| Class C | ||||||||||||||||
| Shares | 1,315,564 | (B) | 1,646,712 | (E) | 470,496 | 3,432,772 | ||||||||||
| Net Assets | $ | 12,682,178 | $ | 15,874,543 | $ | 4,535,633 | $ | 33,092,354 | ||||||||
| Net Asset Value | $ | 9.64 | (B) | $ | 9.64 | (E) | $ | 9.64 | $ | 9.64 | ||||||
| Class Y** | ||||||||||||||||
| Shares | 1,572,671 | (C) | 11,128,019 | (F) | 7,576,068 | 20,276,758 | ||||||||||
| Net Assets | $ | 16,389,043 | $ | 115,967,591 | $ | 78,951,815 | $ | 211,308,449 | ||||||||
| Net Asset Value | $ | 10.42 | (C) | $ | 10.42 | (F) | $ | 10.42 | $ | 10.42 | ||||||
| 191 |
Notes to Financial Statements (Continued)
| After | ||||||||||||||||
| Before Reorganizations | Reorganizations | |||||||||||||||
| Sentinel | Sentinel | Touchstone | Touchstone | |||||||||||||
| Government | Total Return | Active | Active | |||||||||||||
| Securities | Bond | Bond | Bond | |||||||||||||
| Fund | Fund | Fund | Fund | |||||||||||||
| Institutional Class | ||||||||||||||||
| Shares | — | — | 2,374,145 | 2,374,145 | ||||||||||||
| Net Assets | — | — | $ | 24,733,043 | $ | 24,733,043 | ||||||||||
| Net Asset Value | — | — | $ | 10.42 | $ | 10.42 | ||||||||||
| Fund Total | ||||||||||||||||
| Shares Outstanding | 15,103,361 | 16,500,456 | 12,471,717 | 43,144,194 | ||||||||||||
| Net Assets | $ | 145,590,206 | $ | 171,824,419 | $ | 129,605,972 | $ | 447,020,597 | ||||||||
| Unrealized Appreciation (Depreciation) | $ | 857,879 | $ | 3,044,192 | $ | 1,368,123 | $ | 5,270,194 | ||||||||
(A) Reflects a 0.9244:1 stock split which occurred on the date of reorganizations, October 27, 2017.
(B) Reflects a 1.0008:1 reverse stock split which occurred on the date of reorganizations, October 27, 2017.
(C) Reflects a 0.9252:1 stock split which occurred on the date of reorganizations, October 27, 2017.
(D) Reflects a 0.9985: 1 stock split on Class A shares and a 0.9984: 1 stock split on Class R3 shares which occurred on the date of reorganization, October 27, 2017.
(E) Reflects a 1.0769:1 reverse stock split which occurred on the date of reorganizations, October 27, 2017.
(F) Reflects a 0.9997: 1 stock split on Class I shares and a 0.9999:1 stock split on Class R6 shares which occurred on the date of reorganization, October 27, 2017.
* The Sentinel Total Return Bond Fund had Class R3 shares outstanding immediately prior to the reorganizations, which were exchanged for Class A shares of the Active Bond Fund.
** The Sentinel Government Securities Fund and the Sentinel Total Return Bond Fund had Class I and Class R6 shares outstanding immediately prior to the reorganizations, which were exchanged for. Class Y shares of the Active Bond Fund.
Assuming the reorganizations had been completed on October 1, 2017, the Active Bond Fund’s results of operations for the year ended September 30, 2018 would have been as follows:
| Net investment income | $ | 18,802,056 | ||
| Net realized and unrealized gain (loss) on investments | $ | (15,782,337 | ) | |
| Net increase in net assets resulting from operations | $ | 3,019,719 |
Because the combined investment portfolios have been managed as a single portfolio since the reorganizations were completed, it is not practical to separate the amounts of revenue and earnings to the Active Bond Fund that have been included in its statement of operations since the reorganizations.
Ultra Short Duration Fixed Income Fund:
The shareholders of the Sentinel Low Duration Bond Fund, a series of the Sentinel Group Funds, Inc., approved an Agreement and Plan of Reorganization providing for the transfer of all assets and liabilities of the Sentinel Low Duration Bond Fund to the Touchstone Ultra Short Duration Fixed Income Fund. The tax-free merger took place on October 27, 2017.
| 192 |
Notes to Financial Statements (Continued)
The following is a summary of shares outstanding, net assets, net asset value per share and unrealized appreciation immediately before and after the reorganization.
| After | ||||||||||||
| Before Reorganization | Reorganization | |||||||||||
| Touchstone | Touchstone | |||||||||||
| Ultra Short | Ultra Short | |||||||||||
| Sentinel Low | Duration | Duration | ||||||||||
| Duration | Fixed Income | Fixed Income | ||||||||||
| Bond Fund | Fund | Fund | ||||||||||
| Class A | ||||||||||||
| Shares | 8,852,517 | (A) | 1,724,258 | 10,576,775 | ||||||||
| Net Assets | $ | 82,262,174 | $ | 16,022,642 | $ | 98,284,816 | ||||||
| Net Asset Value | $ | 9.29 | (A) | $ | 9.29 | $ | 9.29 | |||||
| Class C | ||||||||||||
| Shares | — | 595,689 | 595,689 | |||||||||
| Net Assets | $ | — | $ | 5,536,888 | $ | 5,536,888 | ||||||
| Net Asset Value | $ | — | $ | 9.29 | $ | 9.29 | ||||||
| Class S | ||||||||||||
| Shares | 18,778,658 | (B) | — | 18,778,658 | ||||||||
| Net Assets | $ | 174,475,987 | $ | — | $ | 174,475,987 | ||||||
| Net Asset Value | $ | 9.29 | (B) | $ | — | $ | 9.29 | |||||
| Class Y* | ||||||||||||
| Shares | 1,675,485 | (C) | 28,460,319 | 30,135,804 | ||||||||
| Net Assets | $ | 15,567,307 | $ | 264,430,327 | $ | 279,997,634 | ||||||
| Net Asset Value | $ | 9.29 | (C) | $ | 9.29 | $ | 9.29 | |||||
| Class Z | ||||||||||||
| Shares | — | 22,972,057 | 22,972,057 | |||||||||
| Net Assets | $ | — | $ | 213,484,506 | $ | 213,484,506 | ||||||
| Net Asset Value | $ | — | $ | 9.29 | $ | 9.29 | ||||||
| Institutional Class | ||||||||||||
| Shares | — | 28,593,394 | 28,593,394 | |||||||||
| Net Assets | $ | — | $ | 265,515,783 | $ | 265,515,783 | ||||||
| Net Asset Value | $ | — | $ | 9.29 | $ | 9.29 | ||||||
| Fund Total | ||||||||||||
| Shares Outstanding | 32,123,347 | 82,345,717 | 111,652,377 | |||||||||
| Net Assets | $ | 272,305,468 | $ | 764,990,146 | $ | 1,037,295,614 | ||||||
| Unrealized Appreciation (Depreciation) | $ | 1,842,713 | $ | (518,337 | ) | $ | 1,324,376 | |||||
(A) Reflects a 0.9113:1 stock split which occurred on the date of reorganization, October 27, 2017.
(B) Reflects a 0.9127:1 stock split which occurred on the date of reorganization, October 27, 2017.
(C) Reflects a 0.9131:1 stock split which occurred on the date of reorganization, October 27, 2017.
* The Sentinel Low Duration Bond Fund had Class I shares outstanding immediately prior to the reorganization, which were exchanged for Class Y shares of the Ultra Short Duration Fixed Income Fund.
Assuming the reorganization had been completed on October 1, 2017, the Ultra Short Duration Fixed Income Fund’s results of operations for the year ended September 30, 2018 would have been as follows:
| Net investment income | $ | 21,984,626 | ||
| Net realized and unrealized gain (loss) on investments | $ | (4,319,634 | ) | |
| Net increase in net assets resulting from operations | $ | 17,664,992 |
Because the combined investment portfolios have been managed as a single portfolio since the reorganization was completed, it is not practical to separate the amounts of revenue and earnings to the Ultra Short Duration Fixed Income Fund that have been included in its statement of operations since the reorganization.
| 193 |
Notes to Financial Statements (Continued)
10. Subsequent Events
Subsequent events occurring after the date of this report have been evaluated for potential impact to this report through the date the financial statements were issued. There were no subsequent events that necessitated recognition or disclosure in the Funds’ financial statements.
| 194 |
Report of Independent Registered Public Accounting Firm
To the Shareholders and Board of Trustees of Touchstone Funds Group Trust
Opinion on the Financial Statements
We have audited the accompanying statements of assets and liabilities of Touchstone Funds Group Trust (the “Trust”) (comprising Touchstone Active Bond Fund, Touchstone Arbitrage Fund, Touchstone Emerging Markets Small Cap Fund, Touchstone High Yield Fund, Touchstone Impact Bond Fund, Touchstone Merger Arbitrage Fund, Touchstone Mid Cap Fund, Touchstone Mid Cap Value Fund, Touchstone Premium Yield Equity Fund, Touchstone Sands Capital Select Growth Fund, Touchstone Small Cap Fund, Touchstone Small Cap Value Fund and Touchstone Ultra Short Duration Fixed Income Fund (collectively referred to as the “Funds”)), including the portfolios of investments, as of September 30, 2018, and the related statements of operations for the year then ended, the statements of changes in net assets for each of the two years in the period then ended, the financial highlights for each of the five years in the period then ended and the related notes (collectively referred to as the “financial statements”). In our opinion, the financial statements present fairly, in all material respects, the financial position of each of the Funds comprising Touchstone Funds Group Trust at September 30, 2018, the results of their operations for the year then ended, the changes in their net assets for each of the two years in the period then ended and their financial highlights for each of the five years in the period then ended, in conformity with U.S. generally accepted accounting principles.
Basis for Opinion
These financial statements are the responsibility of the Trust’s management. Our responsibility is to express an opinion on each of the Fund’s financial statements based on our audits. We are a public accounting firm registered with the Public Company Accounting Oversight Board (United States) (“PCAOB”) and are required to be independent with respect to the Trust in accordance with the U.S. federal securities laws and the applicable rules and regulations of the Securities and Exchange Commission and the PCAOB.
We conducted our audits in accordance with the standards of the PCAOB. Those standards require that we plan and perform the audit to obtain reasonable assurance about whether the financial statements are free of material misstatement, whether due to error or fraud. The Trust is not required to have, nor were we engaged to perform, an audit of the Trust’s internal control over financial reporting. As part of our audits, we are required to obtain an understanding of internal control over financial reporting but not for the purpose of expressing an opinion on the effectiveness of the Trust’s internal control over financial reporting. Accordingly, we express no such opinion.
Our audits included performing procedures to assess the risks of material misstatement of the financial statements, whether due to error or fraud, and performing procedures that respond to those risks. Such procedures included examining, on a test basis, evidence regarding the amounts and disclosures in the financial statements. Our procedures included confirmation of securities owned as of September 30, 2018, by correspondence with the custodian, transfer agent, and brokers or by other appropriate auditing procedures where replies from brokers were not received. Our audits also included evaluating the accounting principles used and significant estimates made by management, as well as evaluating the overall presentation of the financial statements. We believe that our audits provide a reasonable basis for our opinion.

We have served as the auditor of one or more Touchstone Investments’ investment companies since 1999.
Cincinnati, Ohio
November 19, 2018
| 195 |
Qualified Dividend Income
Under the Jobs and Growth Tax Relief Reconciliation Act of 2003 (the “Act”), the following percentages of ordinary dividends paid during the fiscal year ended September 30, 2018 are designated as “qualified dividend income,” as defined in the Act, and are subject to reduced tax rates. The Funds intend to pass through the maximum allowable percentage for Form 1099 Div.
| Arbitrage Fund | 29.53 | % | ||
| Emerging Markets Small Cap Fund | 100.00 | % | ||
| Merger Arbitrage Fund | 12.41 | % | ||
| Mid Cap Fund | 100.00 | % | ||
| Mid Cap Value Fund | 54.70 | % | ||
| Premium Yield Equity Fund | 100.00 | % | ||
| Small Cap Fund | 50.16 | % | ||
| Small Cap Value Fund | 100.00 | % |
Dividend Received Deduction
For corporate shareholders, the following ordinary distributions paid during the current fiscal year ended September 30, 2018 qualify for the corporate dividends received deduction. The Funds intend to pass through the maximum allowable percentage.
| Arbitrage Fund | 28.38 | % | ||
| Merger Arbitrage Fund | 13.00 | % | ||
| Mid Cap Fund | 100.00 | % | ||
| Mid Cap Value Fund | 55.00 | % | ||
| Premium Yield Equity Fund | 68.39 | % | ||
| Small Cap Fund | 49.77 | % | ||
| Small Cap Value Fund | 100.00 | % |
For the fiscal year ended September 30, 2018, the Funds designated long-term capital gains as follows:
| Arbitrage Fund | $ | 633,584 | ||
| Merger Arbitrage Fund | $ | 1,012,026 | ||
| Mid Cap Value Fund | $ | 33,142,075 | ||
| Premium Yield Equity Fund | $ | 8,991,706 | ||
| Sands Capital Select Growth Fund | $ | 542,669,966 | ||
| Small Cap Fund | $ | 44,095,342 | ||
| Small Cap Value Fund | $ | 8,125,924 |
Foreign Tax Income and Foreign Tax Credit
The Emerging Markets Small Cap Fund intends to pass through a foreign tax credit to the shareholders. For the fiscal year ended September 30, 2018, the total amount of foreign source income is $306,504 or $0.34 per share. The total amount of foreign taxes to be paid is $46,837 or $0.05 per share. Shareholder’s allocable share of the foreign tax credit will be reported on Form 1099 Div.
Proxy Voting Guidelines and Proxy Voting Records
The Sub-Advisors are responsible for exercising the voting rights associated with the securities purchased and held by the Funds. A description of the policies and procedures that the Sub-Advisors use in fulfilling this responsibility is available as an appendix to the most recent Statement of Additional Information, which can be obtained without charge by calling toll free 1.800.543.0407 or by visiting the Touchstone website at
| 196 |
Other Items (Unaudited) (Continued)
TouchstoneInvestments.com or on the Securities and Exchange Commission’s (the “Commission”) website sec.gov. Information regarding how those proxies were voted during the most recent twelve-month period ended June 30, which will be filed by August 31 of that year, is also available without charge by calling toll free 1.800.543.0407 or on the Commission’s website at sec.gov.
Quarterly Portfolio Disclosure
The Trust files a complete listing of portfolio holdings for each Fund as of the end of the first and third quarters of each fiscal year on Form N-Q. Effective March 2019, this information will be filed on form N-PORT within 60 days of the period end. The complete listing of each Fund’s portfolio holdings (i) is available on the Commission’s website; (ii) may be reviewed and copied at the Commission’s Public Reference Room in Washington, DC; or (iii) will be made available to shareholders upon request by calling 1.800.543.0407. Information on the operation of the Public Reference Room may be obtained by calling 1.800.SEC.0330.
Schedule of Shareholder Expenses
As a shareholder of the Funds, you incur two types of costs: (1) transaction costs, including reinvested dividends or other distributions; and (2) ongoing costs, including investment advisory fees; distribution (12b-1) fees; and other Fund expenses. This example is intended to help you understand your ongoing costs (in dollars) of investing in the Funds and to compare these costs with the ongoing costs of investing in other mutual funds. The example is based on an investment of $1,000 invested at the beginning of the period and held for the entire period (April 1, 2018 through September 30, 2018).
Actual Expenses
The first line for each share class of a Fund in the table below provides information about actual account values and actual expenses. You may use the information in this line, together with the amount you invested, to estimate the expenses that you paid over the period. Simply divide your account value by $1,000 (for example, an $8,600 account value divided by $1,000 = 8.6), then multiply the result by the number in the first line under the heading entitled “Expenses Paid During the Six Months Ended September 30, 2018” to estimate the expenses you paid on your account during this period.
Hypothetical Example for Comparison Purposes
The second line for each share class of a Fund in the table below provides information about hypothetical account values and hypothetical expenses based on the Funds’ actual expense ratio and an assumed rate of return of 5% per year before expenses, which is not the Funds’ actual return. The hypothetical account values and expenses may not be used to estimate the actual ending account balance or expenses you paid for the period. You may use this information to compare the ongoing costs of investing in the Funds and other funds. To do so, compare this 5% hypothetical example with the 5% hypothetical examples that appear in the shareholder reports of the other funds.
Please note that the expenses shown in the table below are meant to highlight your ongoing costs only and do not reflect any transactional costs, such as sales charges (loads), redemption fees, or exchange fees. Therefore, the second line for each share class of a Fund in the table below is useful in comparing ongoing costs only, and will not help you determine the relative total costs of owning different funds. In addition, if these transactional costs were included, your costs would have been higher.
| 197 |
Other Items (Unaudited) (Continued)
| Expenses | ||||||||||||||||||
| Net Expense | Beginning | Ending | Paid During | |||||||||||||||
| Ratio | Account | Account | the Six Months | |||||||||||||||
| Annualized | Value | Value | Ended | |||||||||||||||
| September 30, | April 1, | September 30, | September 30, | |||||||||||||||
| 2018 | 2018 | 2018 | 2018* | |||||||||||||||
| Touchstone Active Bond Fund | ||||||||||||||||||
| Class A | Actual | 0.90 | % | $ | 1,000.00 | $ | 997.20 | $ | 4.51 | |||||||||
| Class A | Hypothetical | 0.90 | % | $ | 1,000.00 | $ | 1,020.56 | $ | 4.56 | |||||||||
| Class C | Actual | 1.65 | % | $ | 1,000.00 | $ | 992.20 | $ | 8.24 | |||||||||
| Class C | Hypothetical | 1.65 | % | $ | 1,000.00 | $ | 1,016.80 | $ | 8.34 | |||||||||
| Class Y | Actual | 0.65 | % | $ | 1,000.00 | $ | 997.50 | $ | 3.25 | |||||||||
| Class Y | Hypothetical | 0.65 | % | $ | 1,000.00 | $ | 1,021.81 | $ | 3.29 | |||||||||
| Institutional Class | Actual | 0.57 | % | $ | 1,000.00 | $ | 998.90 | $ | 2.86 | |||||||||
| Institutional Class | Hypothetical | 0.57 | % | $ | 1,000.00 | $ | 1,022.21 | $ | 2.89 | |||||||||
| Touchstone Arbitrage Fund | ||||||||||||||||||
| Class A | Actual | 1.95 | % | $ | 1,000.00 | $ | 1,010.40 | $ | 9.83 | ** | ||||||||
| Class A | Hypothetical | 1.95 | % | $ | 1,000.00 | $ | 1,015.29 | $ | 9.85 | ** | ||||||||
| Class C | Actual | 2.70 | % | $ | 1,000.00 | $ | 1,005.40 | $ | 13.57 | ** | ||||||||
| Class C | Hypothetical | 2.70 | % | $ | 1,000.00 | $ | 1,011.53 | $ | 13.62 | ** | ||||||||
| Class Y | Actual | 1.64 | % | $ | 1,000.00 | $ | 1,011.30 | $ | 8.27 | ** | ||||||||
| Class Y | Hypothetical | 1.64 | % | $ | 1,000.00 | $ | 1,016.85 | $ | 8.29 | ** | ||||||||
| Institutional Class | Actual | 1.55 | % | $ | 1,000.00 | $ | 1,011.30 | $ | 7.82 | ** | ||||||||
| Institutional Class | Hypothetical | 1.55 | % | $ | 1,000.00 | $ | 1,017.30 | $ | 7.84 | ** | ||||||||
| Touchstone Emerging Markets Small Cap Fund | ||||||||||||||||||
| Class A | Actual | 1.69 | % | $ | 1,000.00 | $ | 822.50 | $ | 7.72 | |||||||||
| Class A | Hypothetical | 1.69 | % | $ | 1,000.00 | $ | 1,016.60 | $ | 8.54 | |||||||||
| Class C | Actual | 2.44 | % | $ | 1,000.00 | $ | 818.70 | $ | 11.12 | |||||||||
| Class C | Hypothetical | 2.44 | % | $ | 1,000.00 | $ | 1,012.84 | $ | 12.31 | |||||||||
| Class Y | Actual | 1.44 | % | $ | 1,000.00 | $ | 822.40 | $ | 6.58 | |||||||||
| Class Y | Hypothetical | 1.44 | % | $ | 1,000.00 | $ | 1,017.85 | $ | 7.28 | |||||||||
| Institutional Class | Actual | 1.29 | % | $ | 1,000.00 | $ | 823.40 | $ | 5.90 | |||||||||
| Institutional Class | Hypothetical | 1.29 | % | $ | 1,000.00 | $ | 1,018.60 | $ | 6.53 | |||||||||
| Touchstone High Yield Fund | ||||||||||||||||||
| Class A | Actual | 1.05 | % | $ | 1,000.00 | $ | 1,025.00 | $ | 5.33 | |||||||||
| Class A | Hypothetical | 1.05 | % | $ | 1,000.00 | $ | 1,019.80 | $ | 5.32 | |||||||||
| Class C | Actual | 1.80 | % | $ | 1,000.00 | $ | 1,021.30 | $ | 9.12 | |||||||||
| Class C | Hypothetical | 1.80 | % | $ | 1,000.00 | $ | 1,016.04 | $ | 9.10 | |||||||||
| Class Y | Actual | 0.80 | % | $ | 1,000.00 | $ | 1,026.00 | $ | 4.06 | |||||||||
| Class Y | Hypothetical | 0.80 | % | $ | 1,000.00 | $ | 1,021.06 | $ | 4.05 | |||||||||
| Institutional Class | Actual | 0.72 | % | $ | 1,000.00 | $ | 1,026.40 | $ | 3.66 | |||||||||
| Institutional Class | Hypothetical | 0.72 | % | $ | 1,000.00 | $ | 1,021.46 | $ | 3.65 | |||||||||
| 198 |
Other Items (Unaudited) (Continued)
| Expenses | ||||||||||||||||||
| Net Expense | Beginning | Ending | Paid During | |||||||||||||||
| Ratio | Account | Account | the Six Months | |||||||||||||||
| Annualized | Value | Value | Ended | |||||||||||||||
| September 30, | April 1, | September 30, | September 30, | |||||||||||||||
| 2018 | 2018 | 2018 | 2018* | |||||||||||||||
| Touchstone Impact Bond Fund | ||||||||||||||||||
| Class A | Actual | 0.85 | % | $ | 1,000.00 | $ | 997.50 | $ | 4.26 | |||||||||
| Class A | Hypothetical | 0.85 | % | $ | 1,000.00 | $ | 1,020.81 | $ | 4.31 | |||||||||
| Class C | Actual | 1.60 | % | $ | 1,000.00 | $ | 992.70 | $ | 7.99 | |||||||||
| Class C | Hypothetical | 1.60 | % | $ | 1,000.00 | $ | 1,017.05 | $ | 8.09 | |||||||||
| Class Y | Actual | 0.60 | % | $ | 1,000.00 | $ | 998.70 | $ | 3.01 | |||||||||
| Class Y | Hypothetical | 0.60 | % | $ | 1,000.00 | $ | 1,022.06 | $ | 3.04 | |||||||||
| Institutional Class | Actual | 0.50 | % | $ | 1,000.00 | $ | 999.20 | $ | 2.51 | |||||||||
| Institutional Class | Hypothetical | 0.50 | % | $ | 1,000.00 | $ | 1,022.56 | $ | 2.54 | |||||||||
| Touchstone Merger Arbitrage Fund | ||||||||||||||||||
| Class A | Actual | 2.13 | % | $ | 1,000.00 | $ | 1,007.80 | $ | 10.72 | *** | ||||||||
| Class A | Hypothetical | 2.13 | % | $ | 1,000.00 | $ | 1,014.39 | $ | 10.76 | *** | ||||||||
| Class C | Actual | 2.88 | % | $ | 1,000.00 | $ | 1,004.10 | $ | 14.47 | *** | ||||||||
| Class C | Hypothetical | 2.88 | % | $ | 1,000.00 | $ | 1,010.63 | $ | 14.52 | *** | ||||||||
| Class Y | Actual | 1.85 | % | $ | 1,000.00 | $ | 1,009.60 | $ | 9.32 | *** | ||||||||
| Class Y | Hypothetical | 1.85 | % | $ | 1,000.00 | $ | 1,015.79 | $ | 9.35 | *** | ||||||||
| Institutional Class | Actual | 1.73 | % | $ | 1,000.00 | $ | 1,009.60 | $ | 8.72 | *** | ||||||||
| Institutional Class | Hypothetical | 1.73 | % | $ | 1,000.00 | $ | 1,016.39 | $ | 8.74 | *** | ||||||||
| Touchstone Mid Cap Fund | ||||||||||||||||||
| Class A | Actual | 1.24 | % | $ | 1,000.00 | $ | 1,075.60 | $ | 6.45 | |||||||||
| Class A | Hypothetical | 1.24 | % | $ | 1,000.00 | $ | 1,018.85 | $ | 6.28 | |||||||||
| Class C | Actual | 1.99 | % | $ | 1,000.00 | $ | 1,071.40 | $ | 10.33 | |||||||||
| Class C | Hypothetical | 1.99 | % | $ | 1,000.00 | $ | 1,015.09 | $ | 10.05 | |||||||||
| Class Y | Actual | 0.99 | % | $ | 1,000.00 | $ | 1,077.10 | $ | 5.15 | |||||||||
| Class Y | Hypothetical | 0.99 | % | $ | 1,000.00 | $ | 1,020.10 | $ | 5.01 | |||||||||
| Class Z | Actual | 1.24 | % | $ | 1,000.00 | $ | 1,075.80 | $ | 6.45 | |||||||||
| Class Z | Hypothetical | 1.24 | % | $ | 1,000.00 | $ | 1,018.85 | $ | 6.28 | |||||||||
| Institutional Class | Actual | 0.92 | % | $ | 1,000.00 | $ | 1,077.40 | $ | 4.79 | |||||||||
| Institutional Class | Hypothetical | 0.92 | % | $ | 1,000.00 | $ | 1,020.46 | $ | 4.66 | |||||||||
| Touchstone Mid Cap Value Fund | ||||||||||||||||||
| Class A | Actual | 1.24 | % | $ | 1,000.00 | $ | 1,046.70 | $ | 6.36 | |||||||||
| Class A | Hypothetical | 1.24 | % | $ | 1,000.00 | $ | 1,018.85 | $ | 6.28 | |||||||||
| Class C | Actual | 1.99 | % | $ | 1,000.00 | $ | 1,042.40 | $ | 10.19 | |||||||||
| Class C | Hypothetical | 1.99 | % | $ | 1,000.00 | $ | 1,015.09 | $ | 10.05 | |||||||||
| Class Y | Actual | 0.99 | % | $ | 1,000.00 | $ | 1,047.30 | $ | 5.08 | |||||||||
| Class Y | Hypothetical | 0.99 | % | $ | 1,000.00 | $ | 1,020.10 | $ | 5.01 | |||||||||
| Institutional Class | Actual | 0.86 | % | $ | 1,000.00 | $ | 1,048.30 | $ | 4.42 | |||||||||
| Institutional Class | Hypothetical | 0.86 | % | $ | 1,000.00 | $ | 1,020.76 | $ | 4.36 | |||||||||
| 199 |
Other Items (Unaudited) (Continued)
| Expenses | ||||||||||||||||||
| Net Expense | Beginning | Ending | Paid During | |||||||||||||||
| Ratio | Account | Account | the Six Months | |||||||||||||||
| Annualized | Value | Value | Ended | |||||||||||||||
| September 30, | April 1, | September 30, | September 30, | |||||||||||||||
| 2018 | 2018 | 2018 | 2018* | |||||||||||||||
| Touchstone Premium Yield Equity Fund | ||||||||||||||||||
| Class A | Actual | 1.20 | % | $ | 1,000.00 | $ | 1,042.90 | $ | 6.15 | |||||||||
| Class A | Hypothetical | 1.20 | % | $ | 1,000.00 | $ | 1,019.05 | $ | 6.07 | |||||||||
| Class C | Actual | 1.95 | % | $ | 1,000.00 | $ | 1,038.90 | $ | 9.97 | |||||||||
| Class C | Hypothetical | 1.95 | % | $ | 1,000.00 | $ | 1,015.29 | $ | 9.85 | |||||||||
| Class Y | Actual | 0.95 | % | $ | 1,000.00 | $ | 1,043.20 | $ | 4.87 | |||||||||
| Class Y | Hypothetical | 0.95 | % | $ | 1,000.00 | $ | 1,020.31 | $ | 4.81 | |||||||||
| Touchstone Sands Capital Select Growth Fund | ||||||||||||||||||
| Class A | Actual | 1.47 | % | $ | 1,000.00 | $ | 1,172.50 | $ | 8.01 | **** | ||||||||
| Class A | Hypothetical | 1.47 | % | $ | 1,000.00 | $ | 1,017.70 | $ | 7.44 | **** | ||||||||
| Class C | Actual | 2.22 | % | $ | 1,000.00 | $ | 1,168.00 | $ | 12.07 | **** | ||||||||
| Class C | Hypothetical | 2.22 | % | $ | 1,000.00 | $ | 1,013.94 | $ | 11.21 | **** | ||||||||
| Class Y | Actual | 1.22 | % | $ | 1,000.00 | $ | 1,173.60 | $ | 6.65 | **** | ||||||||
| Class Y | Hypothetical | 1.22 | % | $ | 1,000.00 | $ | 1,018.95 | $ | 6.17 | **** | ||||||||
| Class Z | Actual | 1.46 | % | $ | 1,000.00 | $ | 1,171.60 | $ | 7.95 | **** | ||||||||
| Class Z | Hypothetical | 1.46 | % | $ | 1,000.00 | $ | 1,017.75 | $ | 7.38 | **** | ||||||||
| Touchstone Small Cap Fund | ||||||||||||||||||
| Class A | Actual | 1.40 | % | $ | 1,000.00 | $ | 1,080.50 | $ | 7.30 | ***** | ||||||||
| Class A | Hypothetical | 1.40 | % | $ | 1,000.00 | $ | 1,018.05 | $ | 7.08 | ***** | ||||||||
| Class C | Actual | 2.15 | % | $ | 1,000.00 | $ | 1,076.90 | $ | 11.19 | ***** | ||||||||
| Class C | Hypothetical | 2.15 | % | $ | 1,000.00 | $ | 1,014.29 | $ | 10.86 | ***** | ||||||||
| Class Y | Actual | 1.15 | % | $ | 1,000.00 | $ | 1,082.20 | $ | 6.00 | ***** | ||||||||
| Class Y | Hypothetical | 1.15 | % | $ | 1,000.00 | $ | 1,019.30 | $ | 5.82 | ***** | ||||||||
| Institutional Class | Actual | 1.07 | % | $ | 1,000.00 | $ | 1,082.50 | $ | 5.59 | ***** | ||||||||
| Institutional Class | Hypothetical | 1.07 | % | $ | 1,000.00 | $ | 1,019.70 | $ | 5.42 | ***** | ||||||||
| Touchstone Small Cap Value Fund | ||||||||||||||||||
| Class A | Actual | 1.38 | % | $ | 1,000.00 | $ | 1,087.40 | $ | 7.22 | |||||||||
| Class A | Hypothetical | 1.38 | % | $ | 1,000.00 | $ | 1,018.15 | $ | 6.98 | |||||||||
| Class C | Actual | 2.13 | % | $ | 1,000.00 | $ | 1,083.20 | $ | 11.12 | |||||||||
| Class C | Hypothetical | 2.13 | % | $ | 1,000.00 | $ | 1,014.39 | $ | 10.76 | |||||||||
| Class Y | Actual | 1.13 | % | $ | 1,000.00 | $ | 1,089.00 | $ | 5.92 | |||||||||
| Class Y | Hypothetical | 1.13 | % | $ | 1,000.00 | $ | 1,019.40 | $ | 5.72 | |||||||||
| Institutional Class | Actual | 0.98 | % | $ | 1,000.00 | $ | 1,089.60 | $ | 5.13 | |||||||||
| Institutional Class | Hypothetical | 0.98 | % | $ | 1,000.00 | $ | 1,020.16 | $ | 4.96 | |||||||||
| 200 |
Other Items (Unaudited) (Continued)
| Expenses | ||||||||||||||||||
| Net Expense | Beginning | Ending | Paid During | |||||||||||||||
| Ratio | Account | Account | the Six Months | |||||||||||||||
| Annualized | Value | Value | Ended | |||||||||||||||
| September 30, | April 1, | September 30, | September 30, | |||||||||||||||
| 2018 | 2018 | 2018 | 2018* | |||||||||||||||
| Touchstone Ultra Short Duration Fixed Income Fund | ||||||||||||||||||
| Class A | Actual | 0.69 | % | $ | 1,000.00 | $ | 1,010.00 | $ | 3.48 | |||||||||
| Class A | Hypothetical | 0.69 | % | $ | 1,000.00 | $ | 1,021.61 | $ | 3.50 | |||||||||
| Class C | Actual | 1.19 | % | $ | 1,000.00 | $ | 1,007.50 | $ | 5.99 | |||||||||
| Class C | Hypothetical | 1.19 | % | $ | 1,000.00 | $ | 1,019.10 | $ | 6.02 | |||||||||
| Class S | Actual | 0.94 | % | $ | 1,000.00 | $ | 1,009.80 | $ | 4.74 | |||||||||
| Class S | Hypothetical | 0.94 | % | $ | 1,000.00 | $ | 1,020.36 | $ | 4.76 | |||||||||
| Class Y | Actual | 0.44 | % | $ | 1,000.00 | $ | 1,012.40 | $ | 2.22 | |||||||||
| Class Y | Hypothetical | 0.44 | % | $ | 1,000.00 | $ | 1,022.86 | $ | 2.23 | |||||||||
| Class Z | Actual | 0.69 | % | $ | 1,000.00 | $ | 1,010.00 | $ | 3.48 | |||||||||
| Class Z | Hypothetical | 0.69 | % | $ | 1,000.00 | $ | 1,021.61 | $ | 3.50 | |||||||||
| Institutional Class | Actual | 0.39 | % | $ | 1,000.00 | $ | 1,011.50 | $ | 1.97 | |||||||||
| Institutional Class | Hypothetical | 0.39 | % | $ | 1,000.00 | $ | 1,023.11 | $ | 1.98 | |||||||||
| * | Expenses are equal to the Fund's annualized expense ratio, multiplied by the average account value over the period, multiplied by 183/365 (to reflect one-half year period). |
| ** | Excluding interest and dividend expenses on securities sold short, your actual cost of investment in Class A, Class C, Class Y and Institutional Class would be $8.47, $12.22, $6.91 and $6.45, respectively, and your hypothetical cost of investment in Class A, Class C, Class Y and Institutional Class would be $8.49, $12.26, $6.93 and $6.48, respectively. |
| *** | Excluding interest and dividend expenses on securities sold short, your actual cost of investment in Class A, Class C, Class Y and Institutional Class would be $8.46, $12.21, $7.05 and $6.45, respectively, and your hypothetical cost of investment in Class A, Class C, Class Y and Institutional Class would be $8.49, $12.26, $7.08 and $6.48, respectively. |
| **** | Excluding liquidity provider expenses, your actual cost of investment in Class A, Class C, Class Y and Class Z would be $7.90, $11.96, $6.54 and $7.84, respectively, and your hypothetical cost of investment in Class A, Class C, Class Y and Class Z would be $7.33, $11.11, $6.07 and $7.28, respectively. |
| ***** | Excluding liquidity provider expenses, your actual cost of investment in Class A, Class C, Class Y and Institutional Class would be $7.20, $11.09, $5.90 and $5.48, respectively, and your hypothetical cost of investment in Class A, Class C, Class Y and Institutional Class would be $6.98, $10.76, $5.72 and $5.32, respectively. |
Basis for Board's Approval of Sub-Advisory Agreement
At a meeting held on August 16, 2018, the Board of Trustees (the “Board” or “Trustees”) of the Touchstone Funds Group Trust (the “Trust”), and by a separate vote, the Independent Trustees of the Trust, approved a new sub-advisory agreement between Touchstone Advisors, Inc. (the “Advisor”) and Miller/Howard Investments Inc. (“Miller/Howard” or the “Sub-Advisor”) with respect to the Touchstone Premium Yield Equity Fund (the “Fund”) (the “New Sub-Advisory Agreement”), a series of the Trust.
The Board was asked to consider approval of the New Sub-Advisory Agreement with Miller/Howard in connection with the anticipated sale by the current stockholders of Miller/Howard of all of their stock to an Employee Stock Ownership Plan (the “Plan”) that would benefit all current and future employees of Miller/Howard (the “Sale”). The Sale was expected to occur in the fourth quarter of 2018. Management explained that the Sale would constitute an assignment of the current sub-advisory agreement between the Advisor and Miller/Howard (the “Prior Sub-Advisory Agreement”) with respect to the Fund, which would result in the automatic termination of the Prior Sub-Advisory Agreement. If approved by the Board, the New Sub-Advisory Agreement with Miller/Howard
| 201 |
Other Items (Unaudited) (Continued)
would become effective immediately upon the closing of the Sale. Management noted that approval of the New Sub-Advisory Agreement would ensure that there was no interruption in the portfolio management of the Fund.
In approving the New Sub-Advisory Agreement with Miller/Howard, the Board considered various factors with respect to the Fund, Miller/Howard and the New Sub-Advisory Agreement, among them: (1) the nature, extent and quality of services to be provided by the Sub-Advisor to the Fund, including the personnel providing such services; (2) the Sub-Advisor’s compensation; and (3) the terms of the New Sub-Advisory Agreement, which were substantially identical to those of the Prior Sub-Advisory Agreement. In considering the approval of the New Sub-Advisory Agreement, the Board took into account certain information and materials that the Board had received and considered in connection with its approval of the renewal of the Prior Sub-Advisory Agreement in November 2017 with respect to the Fund. That approval, on which the Board voted at its meeting held in person on November 16, 2017, followed a lengthy process during which the Board considered a variety of factors similar to those noted above. The Board’s analysis of the aforementioned factors is set forth below. The Independent Trustees were advised by independent legal counsel throughout the process.
Nature, Extent and Quality of Services Provided; Investment Personnel. The Board considered information provided by the Advisor regarding the services to be provided to the Fund by the Sub-Advisor. The Board noted that, on a periodic basis, the Board meets with portfolio managers of the Sub-Advisor to discuss the Fund’s performance and the Sub-Advisor’s investment processes and strategies. The Board considered the Sub-Advisor’s level of knowledge and investment style. The Board reviewed the experience and credentials of the applicable investment personnel who are responsible for managing the investment of portfolio securities with respect to the Fund. The Board noted that the management team and investment personnel who currently manage the Fund were not expected to change after the Sale, and that the Advisor did not anticipate any changes in how the Fund would be managed following the Sale. The Board also took into account the Advisor’s review of the Sale and its conclusion that the Sale was not expected to have any impact on the Sub-Advisor’s provision of investment management services to the Fund.
Sub-Advisor’s Compensation. The Board took into consideration the financial condition of the Sub-Advisor and any indirect benefits derived by the Sub-Advisor and its affiliates from the Sub-Advisor’s relationship with the Fund. In considering the anticipated profitability to the Sub-Advisor of its relationship with the Fund, the Board noted that the sub-advisory fees to be paid under the New Sub-Advisory Agreement would be identical to the sub-advisory fees currently paid under the Prior Sub-Advisory Agreement. The Board also noted that the sub-advisory fees under the New Sub-Advisory Agreement would be paid by the Advisor out of the advisory fees that it receives under its Investment Advisory Agreement. As a consequence, the anticipated profitability to the Sub-Advisor of its relationship with the Fund was not a substantial factor in the Board’s deliberations. For similar reasons, the Board did not consider the potential economies of scale in the Sub-Advisor’s management of the Fund to be a substantial factor in its consideration.
Sub-Advisory Fees and Fund Performance. The Board took into account that following the Sale the Fund would continue to pay advisory fees to the Advisor and that the Advisor would continue to pay sub-advisory fees to the Sub-Advisor out of the advisory fees it receives from the Fund. The Board noted that the amounts to be retained by the Advisor and the sub-advisory fees to be paid to the Sub-Advisor would not change as a result of the Sale. The Board also noted that the Advisor had negotiated the sub-advisory fees with the Sub-Advisor at arm’s-length. The Board took into account the performance of the Fund through June 30, 2018 and noted that it reviews on a quarterly basis detailed information about the Fund’s performance results, portfolio composition and investment strategies. In considering approval of the New Sub-Advisory Agreement, the Board noted the Advisor’s expertise and resources in monitoring the performance, investment style, and risk-adjusted performance of the Sub-Advisor.
| 202 |
Other Items (Unaudited) (Continued)
Conclusion. In reaching its decision to approve the New Sub-Advisory Agreement with respect to the Fund, the Board, including the Independent Trustees, did not identify any single factor as controlling, and each Trustee may have attributed different weights to the various factors. The Board reached the following conclusions regarding the New Sub-Advisory Agreement, among others: (a) the Sub-Advisor is qualified to manage the Fund’s assets in accordance with the Fund’s investment goals and policies; (b) the Sub-Advisor maintains an appropriate compliance program; (c) the Fund’s sub-advisory fee is reasonable relative to the services to be provided by the Sub-Advisor; and (d) the Sub-Advisor’s investment strategies are appropriate for pursuing the investment goals of the Fund. Based on its conclusions, the Board determined that approval of the New Sub-Advisory Agreement with respect to the Fund was in the best interests of the Fund and its shareholders.
| 203 |
Management of the Trust (Unaudited)
Listed below is required information regarding the Trustees and principal officers of the Trust. The Trust’s Statement of Additional Information includes additional information about the Trustees and is available, without charge, upon request by calling 1.800.543.0407 or by visiting the Touchstone website at TouchstoneInvestments.com.
Interested Trustee1:
| Number | ||||||||||
| of Funds | ||||||||||
| Overseen | ||||||||||
| Term of | in the | |||||||||
| Name | Position(s) | Office And | Touchstone | Other | ||||||
| Address | Held with | Length of | Principal Occupation(s) | Fund | Directorships | |||||
| Year of Birth | Trust | Time Served | During Past 5 Years | Complex2 | Held During Past 5 Years3 | |||||
| Jill T. McGruder Touchstone Advisors, Inc. 303 Broadway Suite 1100 Cincinnati, Ohio 45202 Year of Birth: 1955 | Trustee and President | Until retirement at age 75 or until she resigns or is removed Trustee since 1999 | President and CEO of IFS Financial Services, Inc. (a holding company). | 46 | IFS Financial Services, Inc. (a holding company) from 1999 to the present; Integrity and National Integrity Life Insurance Co. from 2005 to the present; Touchstone Securities (the Trust’s distributor) from 1999 to the present; Touchstone Advisors, Inc. (the Trust’s investment advisor and administrator) from 1999 to the present; W&S Brokerage Services (a brokerage company) from 1999 to the present; W&S Financial Group Distributors (a distribution company) from 1999 to the present; Cincinnati Analysts, Inc. from 2012 to the present; Columbus Life Insurance Co. from 2016 to the present; The Lafayette Life Insurance Co. from 2016 to the present; Taft Museum of Art from 2007 to the present; YWCA of Greater Cincinnati from 2012 to the present; and LL Global, Inc. from 2016 to the present. | |||||
| Independent Trustees: | ||||||||||
Phillip R. Cox c/o Touchstone Advisors, Inc. | Trustee | Until retirement at age 75 or until he resigns or is removed Trustee since 1999 | President and Chief Executive Officer of Cox Financial Corp. (a financial services company) from 1971 to the present. | 46 | Director of Cincinnati Bell (a communications company) from 1994 to the present; Bethesda Inc. (a hospital) from 2005 to the present; Timken Co. (a manufacturing company) from 2004 to 2014; TimkenSteel from 2014 to the present; Diebold, Inc. (a technology solutions company) from 2004 to the present; and Ohio Business Alliance for Higher Education and the Economy from 2005 to the present. | |||||
William C. Gale c/o Touchstone Advisors, Inc. | Trustee | Until retirement at age 75 or until he resigns or is removed Trustee since 2013 | Retired; formerly Senior Vice President and Chief Financial Officer (from 2003 to January 2015) of Cintas Corporation (a business services company). | 46 | None. | |||||
| 204 |
Management of the Trust (Unaudited) (Continued)
Independent Trustees (Continued):
| Number | ||||||||||
| of Funds | ||||||||||
| Overseen | ||||||||||
| Term of | in the | |||||||||
| Name | Position(s) | Office And | Touchstone | Other | ||||||
| Address | Held with | Length of | Principal Occupation(s) | Fund | Directorships | |||||
| Year of Birth | Trust | Time Served | During Past 5 Years | Complex2 | Held During the Past 5 Years3 | |||||
Susan J. Hickenlooper c/o Touchstone Advisors, Inc. | Trustee | Until retirement at age 75 or until she resigns or is removed Trustee since 2009 | Retired; formerly Financial Analyst for Impact 100 (charitable organization) from November 2012 to 2013. | 46 | Trustee of Diocese of Southern Ohio from 2014 to the present; and Trustee of Cincinnati Parks Foundation from 2000 to 2016. | |||||
Kevin A. Robie c/o Touchstone Advisors, Inc. | Trustee | Until retirement at age 75 or until he resigns or is removed Trustee since 2013 | Vice President of Portfolio Management at Soin International LLC (a multinational holding company) from 2004 to the present. | 46 | SaverSystems, Inc. from 2015 to the present; Director of Buckeye EcoCare, Inc. (a lawn care company) from 2013 to the present; Trustee of Dayton Region New Market Fund, LLC (a private fund) from 2010 to the present; and Trustee of the Entrepreneurs Center, Inc. (a small business incubator) from 2006 to the present. | |||||
Edward J. VonderBrink c/o Touchstone Advisors, Inc. | Trustee | Until retirement at age 75 or until he resigns or is removed Trustee since 2013 | Consultant, VonderBrink Consulting LLC from 2000 to the present. | 46 | Director of Streamline Health Solutions, Inc. (healthcare IT) from 2006 to 2015; Mercy Health from 2013 to the present; Mercy Health Foundation (healthcare nonprofit) from 2008 to the present; Al Neyer Inc. (a construction company) from 2013 to the present; and BASCO Shower Door from 2011 to the present. |
| 1 | Ms. McGruder, as a director of the Advisor and the Distributor, and an officer of affiliates of the Advisor and the Distributor, is an “interested person” of the Trust within the meaning of Section 2(a) (19) of the 1940 Act. |
| 2 | As of September 30, 2018, the Touchstone Fund Complex consisted of 13 series of the Trust, 1 series of Touchstone Institutional Funds Trust, 22 series of the Touchstone Strategic Trust, and 10 variable annuity series of Touchstone Variable Series Trust. |
| 3 | Each Trustee is also a Trustee of Touchstone Institutional Funds Trust, Touchstone Strategic Trust, and Touchstone Variable Series Trust. |
| 205 |
Management of the Trust (Unaudited) (Continued)
The following is a list of the Principal Officers of the Trusts, the length of time served, and principal occupations for the past five years.
Principal Officers:
| Term of | ||||||
| Name | Position | Office And | ||||
| Address | Held with | Length of | Principal Occupation(s) | |||
| Year of Birth | Trust1 | Time Served | During Past 5 Years | |||
| Jill T. McGruder Touchstone Advisors, Inc. 303 Broadway Suite 1100 Cincinnati, Ohio 45202 Year of Birth: 1955 | President and Trustee | Until resignation, removal or disqualification President since 2006 | See biography above. | |||
| Steven M. Graziano Touchstone Advisors, Inc. 303 Broadway Suite 1100 Cincinnati, Ohio 45202 Year of Birth: 1954 | Vice President | Until resignation, removal or disqualification Vice President since 2009 | President of Touchstone Advisors, Inc. | |||
| Timothy D. Paulin Touchstone Advisors, Inc. 303 Broadway Suite 1100 Cincinnati, Ohio 45202 Year of Birth: 1963 | Vice President | Until resignation, removal or disqualification Vice President since 2010 | Senior Vice President of Investment Research and Product Management of Touchstone Advisors, Inc. | |||
Timothy S. Stearns Touchstone Advisors, Inc. | Chief Compliance Officer | Until resignation, removal or disqualification Chief Compliance Officer since 2013 | Chief Compliance Officer of Touchstone Advisors, Inc.; Chief Compliance Officer of Envestnet Asset Management, Inc. (2009 to 2013). | |||
Terrie A. Wiedenheft Touchstone Advisors, Inc. | Controller and Treasurer | Until resignation, removal or disqualification Controller and Treasurer since 2006 | Senior Vice President, Chief Financial Officer and Chief Operations Officer, of IFS Financial Services, Inc. (a holding company). | |||
Ellen Blanchard The Bank of New York Mellon | Secretary | Until resignation, removal or disqualification Secretary since 2015 | Director of The Bank of New York Mellon. |
| 1 | Each officer also holds the same office with Touchstone Institutional Funds Trust, Touchstone Strategic Trust, and Touchstone Variable Series Trust. |
| 206 |
We Respect Your Privacy
Thank you for your decision to invest with us. Touchstone and its affiliates have always placed a high value on the trust and confidence our clients place in us. We believe that confidence must be earned and validated through time. In today’s world, when technology allows the sharing of information at light speeds, trust must be reinforced by our sincere pledge to take the steps necessary to ensure that the information you share with us is treated with respect and confidentiality.
Our Pledge to Our Clients
| · | We collect only the information we need to service your account and administer our business. |
| · | We are committed to keeping your information confidential and we place strict limits and controls on the use and sharing of your information. |
| · | We make every effort to ensure the accuracy of your information. |
We Collect the Following Nonpublic Personal Information About You:
| · | Information we receive from you on or in applications or other forms, correspondence, or conversations, including, but not limited to, your name, address, phone number, social security number, assets, income and date of birth; and |
| · | Information about your transactions with us, our affiliates, or others, including, but not limited to, your account number and balance, payment history, parties to transactions, cost basis information, and other financial information. |
Categories of Information We Disclose and Parties to Whom We Disclose
We do not disclose any nonpublic personal information about our current or former clients to nonaffiliated third parties, except as required or permitted by law.
We Place Strict Limits and Controls on the Use and Sharing of Your Information
| · | We restrict access to nonpublic personal information about you to authorized employees who need the information to administer your business. |
| · | We maintain physical, electronic and procedural safeguards that comply with federal standards to protect this information. |
| · | We do not disclose any nonpublic personal information about our current or former clients to anyone, except as required or permitted by law or as described in this document. |
| · | We will not sell your personal information to anyone. |
We May Provide Information to Service Your Account
Sometimes it is necessary to provide information about you to various companies such as transfer agents, custodians, broker-dealers and marketing service firms to facilitate the servicing of your account. These organizations have a legitimate business need to see some of your personal information in order for us to provide service to you. We may disclose to these various companies the information that we collect as described above. We require that these companies, including our own subsidiaries and affiliates, strictly maintain the confidentiality of this information and abide by all applicable laws. Companies within our corporate family that may receive this information are financial service providers and insurance companies. We do not permit these associated companies to sell the information for their own purposes, and we never sell our customer information.
This policy is applicable to the following affiliated companies: Touchstone Funds Group Trust, Touchstone Strategic Trust, Touchstone Variable Series Trust, Touchstone Institutional Funds Trust, Touchstone Securities, Inc.,* and W&S Brokerage Services, Inc.
* Touchstone Securities, Inc. serves as the underwriter to the Touchstone Funds.
A Member of Western & Southern Financial Group®
The Privacy Protection Policy is not part of the Annual Report.
| 207 |


Touchstone Investments
Distributor
Touchstone Securities, Inc.*
303 Broadway
Cincinnati, Ohio 45202-4203
800.638.8194
www.touchstoneinvestments.com
Investment Advisor
Touchstone Advisors, Inc.*
303 Broadway
Cincinnati, Ohio 45202-4203
Transfer Agent
BNY Mellon Investment Servicing (US) Inc.
4400 Computer Drive
Westborough, Massachusetts 01581
Shareholder Service
800.543.0407
* A Member of Western & Southern Financial Group
TSF-56-TFGT-AR-1810
| 207 |
Item 2. Code of Ethics.
| (a) | The registrant, as of the end of the period covered by this report, has adopted a code of ethics that applies to the registrant’s principal executive officer, principal financial officer, principal accounting officer or controller, or persons performing similar functions, regardless of whether these individuals are employed by the registrant or a third party. |
| (c) | There have been no amendments, during the period covered by this report, to a provision of the code of ethics that applies to the registrant’s principal executive officer, principal financial officer, principal accounting officer or controller, or persons performing similar functions, regardless of whether these individuals are employed by the registrant or a third party, and that relates to any element of the code of ethics description. |
| (d) | The registrant has not granted any waivers, including an implicit waiver, from a provision of the code of ethics that applies to the registrant’s principal executive officer, principal financial officer, principal accounting officer or controller, or persons performing similar functions, regardless of whether these individuals are employed by the registrant or a third party, that relates to one or more of the items set forth in paragraph (b) of this item’s instructions. |
Item 3. Audit Committee Financial Expert.
The registrant’s Board of Trustees has determined that the registrant has at least one audit committee financial expert serving on its audit committee. Mr. William Gale is the registrant’s audit committee financial expert and is an independent trustee within the meaning of the Investment Company Act of 1940, as amended (the “1940 Act”).
Item 4. Principal Accountant Fees and Services.
Audit Fees
| (a) | Audit fees for Touchstone Fund Group Trust totaled $242,850 and $226,000 for the fiscal years ended September 30, 2018 and September 30, 2017, respectively, including fees associated with the annual audits and filings of Form N1A and Form N-SAR. |
Audit-Related Fees
| (b) | The aggregate fees billed in each of the last two fiscal years for assurance and related services by the principal accountant that are reasonably related to the performance of the audit of the registrant's financial statements and are not reported under paragraph (a) of this Item are $8,000 and $0 for the fiscal years ended September 30, 2018 and September 30, 2017, respectively. The fees for 2018 relate to review the amended N-1A filing and N-14 filing. |
Tax Fees
| (c) | The aggregate fees billed in each of the last two fiscal years for professional services rendered by the principal accountant for tax compliance, tax advice, and tax planning were $92,521 and $87,357 for the fiscal years ended September 30, 2018 and September 30, 2017, respectively. The fess relate to the preparation of federal income and excise tax returns, review of capital gains distribution calculations, tax agent services and out of scope tax services. |
All Other Fees
| (d) | The aggregate fees billed in each of the last two fiscal years for products and services provided by the principal accountant, other than the services reported in paragraphs (a) through (c) of this Item are $15,173 and $19,625 for the fiscal years ended September 30, 2018 and September 30, 2017, respectively. The fees relate to the PFIC analyzer, Global Withholding Tax Reporter subscriptions. |
| (e)(1) | Disclose the audit committee's pre-approval policies and procedures described in paragraph (c)(7) of Rule 2-01 of Regulation S-X. |
The Audit Committee’s pre-approval policies describe the types of audit, audit-related, tax and other services that have the general pre-approval of the Audit Committee. The pre-approval policies provide that annual audit service fees, tax services not specifically granted pre-approval, services exceeding pre-approved cost levels and other services that have not received general pre-approval will be subject to specific pre-approval by the Audit Committee. The pre-approval policies further provide that the Committee may grant general pre-approval to other audit services (statutory audits and services associated with SEC registration statements, periodic reports and other documents filed with the SEC or other documents issued in connection with securities offerings), audit-related services (accounting consultations related to accounting, financial reporting or disclosure matters not classified as “audit services,” assistance with understanding and implementing new accounting and financial reporting guidance from rulemaking authorities, agreed-upon or expanded audit procedures related to accounting and/or billing records required to respond to or comply with financial, accounting or regulatory reporting matters and assistance with internal control reporting requirements under Form N-CSR), tax services that have historically been provided by the auditor that the Committee believes would not impair the independence of the auditor and are consistent with the SEC’s rules on auditor independence and permissible non-audit services classified as “all other services” that are routine and recurring services.
All of the services described in paragraphs (b) through (d) of Item 4 were approved by the Audit Committee.
| (f) | The percentage of hours expended on the principal accountant's engagement to audit the registrant's financial statements for the most recent fiscal year that were attributed to work performed by persons other than the principal accountant's full-time, permanent employees was less than fifty percent. |
| (g) | The aggregate non-audit fees for Touchstone Funds group Trust and certain entities*, totaled approximately $569,146 and $106,982 for the fiscal years ended September 30, 2018 and September 30, 2017, respectively. |
* These include the advisors (excluding non-affiliated sub-advisors) and any entity controlling, controlled by or under common control with the advisors that provides ongoing services to the registrant (Funds).
| (h) | The registrant's audit committee of the board of trustees has considered whether the provision of non-audit services that were rendered to the registrant's investment adviser (not including any sub-adviser whose role is primarily portfolio management and is subcontracted with or overseen by another investment adviser), and any entity controlling, controlled by, or under common control with the investment adviser that provides ongoing services to the registrant that were not pre-approved pursuant to paragraph (c)(7)(ii) of Rule 2-01 of Regulation S-X is compatible with maintaining the principal accountant's independence. |
Item 5. Audit Committee of Listed Registrants.
Not applicable.
Item 6. Investments.
| (a) | Schedule of Investments in securities of unaffiliated issuers as of the close of the reporting period is included as part of the report to shareholders filed under Item 1 of this form. |
| (b) | Not applicable. |
Item 7. Disclosure of Proxy Voting Policies and Procedures for Closed-End Management Investment Companies.
Not applicable.
Item 8. Portfolio Managers of Closed-End Management Investment Companies.
Not applicable.
Item 9. Purchases of Equity Securities by Closed-End Management Investment Company and Affiliated Purchasers.
Not applicable.
Item 10. Submission of Matters to a Vote of Security Holders.
There have been no material changes to the procedures by which the shareholders may recommend nominees to the registrant’s board of trustees, where those changes were implemented after the registrant last provided disclosure in response to the requirements of Item 407(c)(2)(iv) of Regulation S-K (17 CFR 229.407) (as required by Item 22(b)(15) of Schedule 14A (17 CFR 240.14a-101)), or this Item.
Item 11. Controls and Procedures.
| (a) | The registrant’s principal executive and principal financial officers, or persons performing similar functions, have concluded that the registrant’s disclosure controls and procedures (as defined in Rule 30a-3(c) under the Investment Company Act of 1940, as amended (the “1940 Act”) (17 CFR 270.30a-3(c))) are effective, as of a date within 90 days of the filing date of the report that includes the disclosure required by this paragraph, based on their evaluation of these controls and procedures required by Rule 30a-3(b) under the 1940 Act (17 CFR 270.30a-3(b)) and Rules 13a-15(b) or 15d-15(b) under the Securities Exchange Act of 1934, as amended (17 CFR 240.13a-15(b) or 240.15d-15(b)). |
| (b) | There were no changes in the registrant’s internal control over financial reporting (as defined in Rule 30a-3(d) under the 1940 Act (17 CFR 270.30a-3(d))) that occurred during the registrant’s last fiscal quarter that has materially affected, or is reasonably likely to materially affect, the registrant’s internal control over financial reporting. |
Item 12. Disclosure of Securities Lending Activities for Closed-End Management Investment Companies.
Not applicable.
Item 13. Exhibits.
| (a)(1) | Code of ethics, or any amendment thereto, that is the subject of disclosure required by Item 2 is attached hereto. |
| (a)(2) | Certifications pursuant to Rule 30a-2(a) under the 1940 Act and Section 302 of the Sarbanes-Oxley Act of 2002 are attached hereto. |
| (a)(3) | Not applicable. |
| (a)(4) | Not applicable. |
| (b) | Certifications pursuant to Rule 30a-2(b) under the 1940 Act and Section 906 of the Sarbanes-Oxley Act of 2002 are attached hereto. |
SIGNATURES
Pursuant to the requirements of the Securities Exchange Act of 1934 and the Investment Company Act of 1940, the registrant has duly caused this report to be signed on its behalf by the undersigned, thereunto duly authorized.
| (Registrant) | Touchstone Funds Group Trust |
| By (Signature and Title)* | /s/ Jill T. McGruder |
| Jill T. McGruder, President | |
| (principal executive officer) |
| Date | November 26, 2018 |
Pursuant to the requirements of the Securities Exchange Act of 1934 and the Investment Company Act of 1940, this report has been signed below by the following persons on behalf of the registrant and in the capacities and on the dates indicated.
| By (Signature and Title)* | /s/ Jill T. McGruder |
| Jill T. McGruder, President | |
| (principal executive officer) |
| Date | November 26, 2018 |
| By (Signature and Title)* | /s/ Terrie A. Wiedenheft |
| Terrie A. Wiedenheft, Controller and Treasurer | |
| (principal financial officer) |
| Date | November 26, 2018 |
* Print the name and title of each signing officer under his or her signature.