UNITED STATES
SECURITIES AND EXCHANGE COMMISSION
Washington, D.C. 20549
FORM N-CSR
CERTIFIED SHAREHOLDER REPORT OF REGISTERED MANAGEMENT INVESTMENT COMPANIES
Investment Company Act file number 811-08104
Touchstone Funds Group Trust
(Exact name of registrant as specified in charter)
303 Broadway, Suite 1100
Cincinnati, Ohio 45202-4203
(Address of principal executive offices) (Zip code)
Jill T. McGruder
303 Broadway, Suite 1100
Cincinnati, Ohio 45202-4203
(Name and address of agent for service)
Registrant's telephone number, including area code: 800-638-8194
Date of fiscal year end: September 30
Date of reporting period: September 30, 2017
Form N-CSR is to be used by management investment companies to file reports with the Commission not later than 10 days after the transmission to stockholders of any report that is required to be transmitted to stockholders under Rule 30e-1 under the Investment Company Act of 1940 (17 CFR 270.30e-1). The Commission may use the information provided on Form N-CSR in its regulatory, disclosure review, inspection, and policymaking roles.
A registrant is required to disclose the information specified by Form N-CSR, and the Commission will make this information public. A registrant is not required to respond to the collection of information contained in Form N-CSR unless the Form displays a currently valid Office of Management and Budget ("OMB") control number. Please direct comments concerning the accuracy of the information collection burden estimate and any suggestions for reducing the burden to Secretary, Securities and Exchange Commission, 450 Fifth Street, NW, Washington, DC 20549-0609. The OMB has reviewed this collection of information under the clearance requirements of 44 U.S.C. § 3507.
Item 1. Reports to Stockholders.
The Report to Shareholders is attached herewith.
September 30, 2017
Annual Report
Touchstone Funds Group Trust
Touchstone Active Bond Fund
Touchstone Arbitrage Fund
Touchstone Emerging Markets Small Cap Fund
Touchstone High Yield Fund
Touchstone Merger Arbitrage Fund
Touchstone Mid Cap Fund
Touchstone Mid Cap Value Fund
Touchstone Premium Yield Equity Fund
Touchstone Sands Capital Select Growth Fund
Touchstone Small Cap Fund
Touchstone Small Cap Value Fund
Touchstone Total Return Bond Fund
Touchstone Ultra Short Duration Fixed Income Fund

Table of Contents
This report identifies the Funds’ investments on September 30, 2017. These holdings are subject to change. Not all investments in each Fund performed the same, nor is there any guarantee that these investments will perform as well in the future. Market forecasts provided in this report may not occur.
| 2 |
Dear Fellow Shareholder:
We are pleased to provide you with the Touchstone Funds Group Trust Annual Report. Inside you will find key financial information, as well as manager commentaries, for the 12 months ended September 30, 2017.
In a year of considerable geopolitical uncertainty, steady but unspectacular economic growth provided the support needed for global capital markets to continue moving higher. The effects of 2016’s biggest political events (e.g., Brexit, President Trump’s election) extended into 2017 as the focus shifted from politics to policy. In the U.S., the much anticipated stimulus from infrastructure spending and tax reform failed to arrive in substantive form. Meanwhile across the Atlantic, the United Kingdom and the European Union continued to debate the exact form of their post-Brexit relationship. In both cases, policy disappointments and political risks were overshadowed by solid economic growth and an improvement in corporate fundamentals. These same factors were the impetus for continued monetary policy normalization by the U.S. Federal Reserve Board (Fed), which raised short-term interest rates three times during the fiscal year and announced plans for reducing its $4.5 trillion balance sheet.
Global equity markets posted strong results during the period with most major U.S. and non-U.S. indexes generating double-digit returns. Investors’ increased appetite for risk was apparent, as emerging market equities led global equities and small-cap stocks were the strongest domestic performers. After trailing value-oriented stocks during much of 2016, growth stocks returned to favor and outperformed across the market capitalization spectrum.
While the Fed pushed toward a normalization of U.S. monetary policy, other developed market central banks continued to provide accommodative monetary conditions in an attempt to solidify positive economic trends. U.S. interest rates increased due to a combination of short-term rate hikes by the Federal Reserve and increased expectations for growth and inflation following the presidential election. While the higher interest rates pressured returns for U.S. Treasuries, credit-exposed securities enjoyed the same tailwinds of a stable economy and improving corporate earnings that boosted equity prices. Corporate bonds across the credit quality spectrum generated positive returns with non-investment grade securities leading the way.
As we close in on the end of 2017, the turning of the year provides a natural point to assess the recent past and to look toward the future. From a financial perspective, it has been yet another period of strong returns across many asset classes. This makes it a particularly timely juncture to take stock of your current financial situation, and with the help of your financial advisor, reassess your plans for the year – and years – ahead.
We greatly appreciate your continued support. Thank you for including Touchstone as part of your investment plan.
Sincerely,

Jill T. McGruder
President
Touchstone Funds Group Trust
| 3 |
Management’s Discussion of Fund Performance (Unaudited)
Touchstone Active Bond Fund
Sub-Advised by Fort Washington Investment Advisors, Inc.
Investment Philosophy
The Touchstone Active Bond Fund seeks to provide as high a level of current income as is consistent with the preservation of capital. Capital appreciation is a secondary goal. In deciding what securities to buy and sell for the Fund, the overall investment opportunities and risks in different sectors of the debt securities market are analyzed by focusing on maximizing total return and reducing volatility of the Fund’s portfolio. A disciplined sector allocation process is followed in order to build a broadly diversified portfolio of bonds.
Fund Performance
The Touchstone Active Bond Fund (Class A Shares) outperformed its benchmark, the Bloomberg Barclays U.S. Aggregate Bond Index, for the 12-month period ended September 30, 2017. The Fund’s total return was 1.26 percent (excluding the maximum sales charge) while the total return of the benchmark was 0.07 percent.
Market Environment
Risk assets performed extremely well during the 12-month period and did so with some of the lowest volatility on record. The outperformance was driven in part by a steady increase in investor optimism surrounding domestic and global economic growth, which has been substantiated with solid underlying fundamentals.
Some investors have identified the election of President Donald Trump in November 2016 as the catalyst that spurred the 12-month market rally in the U.S. During the campaign, Donald Trump laid out a business-friendly agenda focused on fiscal stimulus and tax reform, and emphasized the subsequent economic boost that these policies would provide. This spurred what has become known as the “Trump Trade.” Immediately following the presidential election, yields on U.S. Treasuries spiked higher along the yield curve, the U.S. Dollar Index jumped, and the S&P 500® Index posted notable returns. However, as months passed and it became increasingly clear that passing key focal points of the agenda would be difficult, parts of the Trump Trade began to unwind. External events such as escalating tensions with North Korea, terrorist attacks, and two major hurricanes contributed to interest rates receding and the dollar losing ground against other major currencies. Risk assets, however, continued their impressive run as the S&P 500® Index reached record highs and corporate bond spreads narrowed to levels last seen in 2014.
As the Trump Trade began to unwind, the long end of the yield curve began to fall. However, rates at the short end of the curve maintained their upward momentum as the U.S. Federal Reserve Board (Fed) raised the federal funds rate three times during the last 12 months and signaled further tightening in the U.S. Financial conditions remained relatively easy and have provided support for risk assets and economic growth. While market expectations of Fed rate hikes are still very shallow going forward, it will be difficult for the Fed not to support a quicker pace of rate hikes if strong underlying fundamentals persist. Global central bank policies were generally accommodative during the period, but they have begun to inflect under the guidance of the European Central Bank.
Portfolio Review
The Fund outperformed during the 12-month period as a result of an overweight to non-Treasury sectors and positive security selection. Risk premiums across the bond market contracted during the period, and although the Fund’s positions across non-Treasury sectors benefited performance, the allocation to High Yield bonds (commonly known as “junk bonds”) was the most significant contributor to performance. The Fund maintained its overweight to that sector, as we believed High Yield bonds offered adequate compensation for their credit and liquidity risk. However, as credit spreads continued to tighten during the period and the relative return
| 4 |
Management’s Discussion of Fund Performance (Unaudited) (Continued)
potential from non-investment grade bonds degraded, the Fund decreased its exposure to High Yield, which now sits at multi-year lows.
The Fund has a neutral bias on the overall direction of interest rates in the near term, but made several tactical adjustments in an attempt to take advantage of short-term movements. These short-term tactical shifts, such as opportunistic investments in Treasury Inflation Protected Securities (TIPS), had a positive impact on the performance of the Fund.
Outlook
U.S. economic growth remains stable, and recession risk is increasingly low, notwithstanding the age of the credit cycle. Given this backdrop, the Fund continued to be overweight in risk assets relative to the benchmark, though this overweight has declined somewhat in recent quarters as asset prices have increased to reflect the market’s optimistic view of the economy. In our opinion, High Yield bonds are no longer attractive given current spread levels. Instead, the Fund has increased its exposure to securitized assets, particularly within Asset-Backed Securities and non-agency Mortgage-Backed Securities, where we believe a more attractive risk/reward profile is available. These sectors are closely levered to the health of the consumer, which we believe to be strong. In aggregate, we remain comfortable with a modest overweight to risk given the positive economic outlook and low rate of expected defaults. Global factors will be watched closely for any broader impact which might influence the economic outlook and affect the Fund’s allocation to risk assets.
The economic environment and the outlook for further action from the Fed suggest the potential for higher interest rates but, in our view, progress on tax reform or tax cuts will need to be made in order for rates to go meaningfully higher.
As previously mentioned, valuations across risk assets have adjusted to the more positive economic outlook and are at fair value given the positive macro outlook. Going forward, we believe the Trump administration’s inability to execute on expanded fiscal policy and lack of tangible progress on tax cuts or reform could create some disruption to risk assets. We believe global central banks will need to maintain accommodative policies to support ongoing recoveries abroad. Meanwhile, additional rate hikes by the Fed could further tighten domestic financial conditions as the year progresses.
| 5 |
Management’s Discussion of Fund Performance (Unaudited) (Continued)
Comparison of the Change in Value of a $10,000 Investment in the
Touchstone Active Bond Fund - Class A*and the
Bloomberg Barclays U.S. Aggregate Bond Index
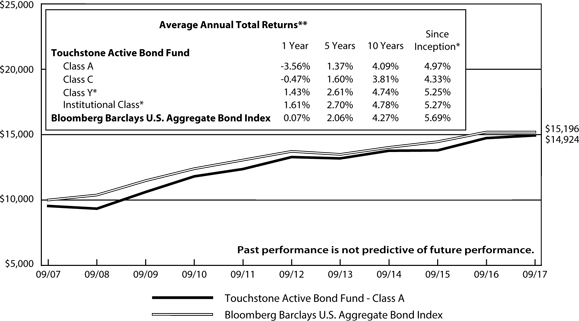
| * | The chart above represents performance of Class A shares only, which will vary from the performance of Class C shares, Class Y shares and Institutional Class shares based on the differences in sales loads and fees paid by shareholders in the different classes. The inception date of Class A shares, Class C shares, Class Y shares and Institutional Class shares was October 3, 1994, October 3, 1994, April 12, 2012, and April 12, 2012, respectively. Class Y shares and Institutional Class shares performance was calculated using the historical performance of Class A shares for the periods prior to April 12, 2012. The returns have been restated for sales loads and fees applicable to Class Y and Institutional Class shares. The returns of the index listed above are based on the inception date of the Fund. |
| ** | The average annual total returns shown above are adjusted for maximum sales loads and fees, if applicable. The maximum offering price per share of Class A shares is equal to the net asset value (“NAV”) per share plus a sales load equal to 4.99% of the NAV (or 4.75% of the offering price). Class C shares are subject to a contingent deferred sales charge (“CDSC”) of 1.00%. The CDSC will be assessed on an amount equal to the lesser of (1) the NAV at the time of purchase of the shares being redeemed or (2) the NAV of such shares being redeemed, if redeemed within a one-year period from the date of purchase. Class Y shares and Institutional Class shares are not subject to sales charges. |
The performance of the above Fund does not reflect the deduction of taxes that a shareholder would pay on Fund distributions or the redemption of Fund shares.
Note to Chart
Bloomberg Barclays U.S. Aggregate Bond Index is an unmanaged index comprised of U.S. investment grade, fixed rate bond market securities, including government, government agency, corporate and mortgage-backed securities between one and ten years.
| 6 |
Management’s Discussion of Fund Performance (Unaudited)
Touchstone Arbitrage Fund
Sub-Advised by Longfellow Investment Management Co.
Investment Philosophy
The Touchstone Arbitrage Fund seeks to achieve positive absolute returns regardless of market conditions over the long term by investing primarily in securities of companies that are involved in publicly announced mergers, takeovers, tender offers, debt restructurings, minority purchases, leveraged buyouts, spin-offs, liquidations and other corporate reorganizations.
Fund Performance
The Touchstone Arbitrage Fund (Class A Shares) outperformed its benchmark, the BofA Merrill Lynch 3-Month U.S. Treasury Bill Index, for the 12-month period ended September 30, 2017. The Fund’s total return was 2.20 percent (excluding the maximum sales charge) while the benchmark’s total return was 0.66 percent.
Market Environment
During the 12-month period ended September 30, 2017, risk assets continued to exhibit strong gains. U.S. equities posted double-digit total returns. Despite the strong return environment, price volatility following the U.S. election has been one of the calmest periods in history. This lack of realized volatility was a significant surprise given the uncertainty across monetary policy, fiscal policy, taxation and geopolitics. With the U.S. Federal Reserve Board (Fed) continuing on its path of rate normalization and balance sheet tapering, Longfellow’s view is that this lack of volatility will prove fleeting as risk assets revert back to their historical averages.
After excluding deal outliers (e.g., regulatory uncertainty, antitrust concerns, financing), we do not see a broad dispersion of annualized spreads across sectors. The pace of deal activity declined over the course of the period and reached the lowest point in the final quarter of the fiscal year. Those deals that were occurring tended to cluster in pockets of asset managers, regional banks, biotechnology, energy exploration and production (E&P to drilling) and semiconductors.
Portfolio Review
Though macro trends contributed to the performance of the broader equity markets, they did not have a discernable impact on the Fund over the 12-month period. Despite the three interest rate hikes from the Fed during the period, deal spreads tightened marginally as a result of low deal flow and continued investor interest in the merger arbitrage space. Deals tend to price in an annualized deal spread near 4 percent.
During the fiscal year, the Touchstone Arbitrage Fund invested in two broken deals (KLA-Tencor Corp. in late 2016 and RiteAid Corp. in early 2017), but managed to avoid other notable terminations in its investable universe, such as Lattice Semiconductor Corp., Humana Inc./Aetna Inc., Cigna Corp./Anthem Inc. and Deutsche Borse AG/London Stock Exchange Group PLC. While the Fund was able to manage its position in KLA-Tencor to minimize performance impact, the position in RiteAid was a primary detractor to Fund performance. Walgreens Boots Alliance Inc.’s proposed acquisition of RiteAid ran into regulatory trouble in 2016 as the Federal Trade Commission (FTC) refused to grant anti-trust approval based on the initial terms of the deal. The original merger agreement contained a provision to divest 865 stores to Fred’s Inc. that we believed would be sufficient to secure anti-trust approval. After initial indications that a greater number of stores would need to be divested, RiteAid and Walgreens revised their proposed deal, increasing the number of divested stores to 1,200. The FTC still was not satisfied with the size of the expanded divestiture, and the two companies eventually agreed to discontinue the merger agreement and proceed with an asset sale. Walgreens will acquire approximately half of RiteAid’s store locations, but the two companies will remain independent entities. RiteAid’s stock consistently traded down over the period, as the deal’s terms changed and its completion date extended.
| 7 |
Management’s Discussion of Fund Performance (Unaudited) (Continued)
After a tumultuous 2016, Abbott Laboratories and Alere Inc.’s new merger agreement received various regulatory approvals and progressed toward its early October close date. Abbott will acquire Alere for $51.00 per common share, compared to the previous agreement of $56 per share. As clarity around the deal closure increased, the deal spread tightened, which contributed to the Fund’s performance.
The Fund benefited from an upward revision in price in the merger between The Canadian Imperial Bank of Commerce (CIBC) and PrivateBancorp, Inc. PrivateBancorp is a high-quality, Chicago-based middle market commercial bank with nearly $20 billion in assets, complemented by private banking and wealth management capabilities. CIBC raised the price being paid for PrivateBancorp by approximately 20 percent. Stocks in the Financials sector enjoyed strong gains following the November election, and some PrivateBancorp shareholders raised opposition to the merger, believing that the deal price needed to be revised to reflect the change in market conditions.
The Fund also benefited from its involvement in a multiple bidder situation, as Starwood Capital Group Management LLC and D.R. Horton Inc. fought to acquire Forestar Group Inc. In April 2017, Forestar Group announced a definitive merger agreement to be acquired by Starwood Capital Group for $14.25 per share in cash. D.R. Horton made a competing proposal to acquire 75 percent of Forestar Group for $16.25 per share. Under the proposal, Forestar stockholders would have the right to elect, for each share of common stock held, either to receive $16.25 per share in cash as merger consideration or to retain such share of the surviving entity. The competitive bidding process between Starwood Capital Group and D.R. Horton continued for a couple more rounds, before D.R. Horton ultimately won out with a bid of $17.75 per share for 75 percent of the equity of Forestar Group.
Nexstar Media Group Inc.’s transaction with Media General Inc. closed during the period. Nexstar agreed to acquire Media General for $10.55 per share in cash and 0.1249 of a share of Nexstar Class A common stock for each Media General share. In addition, the terms allowed for additional consideration to Media General shareholders in the form of a contingent value right (CVR) for each Media General share. The CVR entitled Media General shareholders to net cash proceeds that would be received from the sale of Media General’s spectrum in an upcoming Federal Communications Commission (FCC) spectrum auction (a process whereby a government uses an auction system to sell the rights (licenses) to transmit signals over specific bands of the electromagnetic spectrum and to assign scarce spectrum resources). The Fund’s portfolio benefited not only from the closing of the merger, but also the additional upside from the contingent value right, which ended up being meaningfully higher than market expectations.
Reckitt Benckiser Group PLC signed a merger agreement with Mead Johnson Nutrition Co. under which Mead Johnson shareholders were to receive $90 in cash for each share of common stock. The transaction proceeded smoothly and attained the necessary shareholder and regulatory approvals en route to its June 2017 closing. The Fund benefited from the narrowing of the deal spread and timely closure of the deal.
Outlook
Access to capital, slow global growth and strong corporate balance sheets are expected to drive a rebound in strategic mergers and acquisitions (M&A), which has slowed in recent months. Historically, we believe low funding costs should also provide a tailwind for financial buyers. On balance, we see a backdrop that remains supportive for continued deal activity. The continued strength of the broad equity market should also provide a tailwind for deals. Our team at Longfellow has found a positive correlation between year-over-year gains in the S&P 500® Index and subsequent increases in deal activity. We believe this relationship should support an increase in deal activity for the year ahead, particularly should tax reform emerge out of Washington DC.
With deal spreads based in part on short-term interest rates, we believe Fund returns should benefit from the Fed’s continued path toward interest rate normalization. The current forecast from the Fed implies one additional
| 8 |
Management’s Discussion of Fund Performance (Unaudited) (Continued)
increase in calendar year 2017, as well as the start of balance sheet reductions in October. However, the prospect of the Fed stopping the reinvestment of its mortgage holdings leads to the risk of policy missteps that could introduce volatility to the market. We believe such volatility may provide the Fund incremental investment opportunities. Policy disappointments out of Congress or by President Trump could drive volatility as timelines for expectations of tax and other regulatory reform gets extended.
We continue to believe the Fund is well positioned to provide absolute returns, low realized volatility and low sensitivity to underlying price movements within equity markets. The Fund’s portfolio has a strong focus on liquidity management while managing downside risks. Off of our base-case expectations for deal activity and interest rate policy, we are optimistic regarding the tailwinds for deal activity and potential for wider spreads.
| 9 |
Management’s Discussion of Fund Performance (Unaudited) (Continued)
Comparison of the Change in Value of a $10,000 Investment in the
Touchstone Arbitrage Fund - Class A* and the
BofA Merrill Lynch 3-Month U.S. Treasury Bill Index
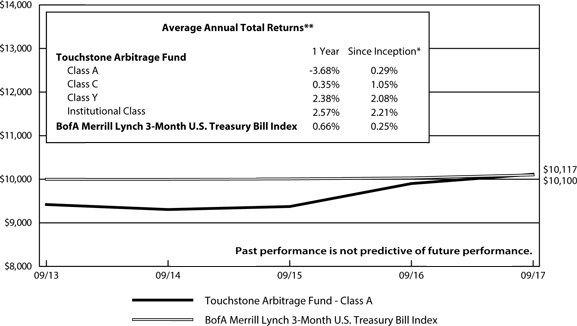
| * | The chart above represents performance of Class A shares only, which will vary from the performance of Class C shares, Class Y shares and Institutional Class shares based on the differences in sales loads and fees paid by shareholders in the different classes. The inception date of the Fund was September 30, 2013. The returns of the index listed above are based on the inception date of the Fund. |
| ** | The average annual total returns shown above are adjusted for maximum sales loads and fees, if applicable. The maximum offering price per share of Class A shares is equal to the net assets value (“NAV”) per share plus a sales load equal to 6.10% of the NAV (or 5.75% of the offering price). Class C shares are subject to a contingent deferred sales charge (“CDSC”) of 1.00%. The CDSC will be assessed on an amount equal to the lesser of (1) the NAV at the time of purchase of the shares being redeemed or (2) the NAV of such shares being redeemed, if redeemed within a one-year period from the date of purchase. Class Y shares and Institutional Class shares are not subject to sales charges. |
The performance of the above Fund does not reflect the deduction of taxes that a shareholder would pay on Fund distributions or the redemption of Fund shares.
Note To Chart
BofA Merrill Lynch 3-Month U.S. Treasury Bill Index is an unmanaged index of Treasury securities maturing in 90 days that assumes reinvestment of all income.
| 10 |
Management’s Discussion of Fund Performance (Unaudited)
Touchstone Emerging Markets Small Cap Fund
Sub-Advised by Copper Rock Capital Partners LLC
Investment Philosophy
The Touchstone Emerging Markets Small Cap Fund seeks capital appreciation by primarily investing in equity securities of emerging markets small-cap companies diversified across sectors and industries. The Fund’s investment process seeks to add value through bottom-up stock selection and in-depth fundamental research.
Fund Performance
The Touchstone Emerging Markets Small Cap Fund (Class A Shares) outperformed its benchmark, the MSCI Emerging Markets Small Cap Index for the 12-month period ended September 30, 2017. The Fund’s total return was 19.27 percent (calculated excluding the maximum sales charge) while the total return of the benchmark was 14.89 percent.
Market Environment
Global equity markets continued to climb higher during the 12-month period, as investor sentiment was generally positive overall and earnings revisions remained above average. Spurred by a weaker U.S. dollar relative to the end of 2016, fundamental economic improvements continued in 2017 as corporate earnings forecasts and economic growth in the emerging markets arena surpassed that of their developed market counterparts. The pace of earnings-per-share growth further benefited the emerging markets and helped boost returns throughout 2017. As a whole, emerging markets benefited from strong demand in the global technology cycle, better commodity prices and a solid economic environment in China.
Portfolio Review
Stock selection was broadly positive across the Fund’s portfolio during the period. At the sector level, the Fund’s performance benefited the most from the Materials, Information Technology, Consumer Discretionary and Health Care sectors. The Fund’s allocation to stocks in China was the largest contributor to performance by country. There was also positive stock selection from the Fund’s holdings in Brazil, India, South Africa, the United Arab Emirates, Indonesia and Mexico. Conversely, South Korea performed the worst among major emerging market countries, primarily due to geo-political concerns as well as individual stocks that performed poorly during the period.
Among the individual stocks that contributed to Fund performance were BYD Electronic (International) Co. Ltd., Elite Material Co. Ltd. (both from the Information Technology sector), China Lodging Group Ltd. and Magazine Luiza SA (both from the Consumer Discretionary sector). BYD Electronic, a China-based investment holding company, manufactures handset components as well as metal and glass casing systems for original equipment manufacturers. The continued growth of handsets and tablets to support mobile telephony throughout Asia was the primary driver of returns during the period. Further, at the end of April 2017, BYD Electronic reported first quarter year-over-year earnings that were significantly ahead of consensus estimates. In August 2017, BYD Electronic reported strong earnings as well as guidance for a positive second half of the year, primarily as a result of an increase in customer orders and improved operating efficiency within the company. Going forward, we believe there is opportunity for further upside as a new upgrade cycle in smartphones and tablets is on the horizon, and the company is positioned well as mobile device hardware upgrades come to market. Elite Material is a Taiwan-based producer of prepared laminated cover claddings for printed circuit boards. The company is among the largest halogen-free laminate suppliers in the world, and the stock outperformed as halogen-free laminates continued to grow in market penetration. China Lodging Group operates a multi-brand group of hotels in China that caters to a mix of business and leisure customers. The company reported strong quarterly results and revised its forward guidance. Revenues across all hotel categories rose during the period,
| 11 |
Management’s Discussion of Fund Performance (Unaudited) (Continued)
but a more significant increase was seen in the mid- to upscale hotel category. The company’s large customer base also proved to be a strategic advantage, as management can leverage its model with new hotel additions and smaller owner-operated facilities in its network. We exited the Fund’s position as the company continued to outperform and thus moved beyond the Fund’s investment strategy’s market cap limit. Magazine Luiza is a Brazil-based consumer electronics and home goods retailer. The company has benefited as Brazil’s economy has slowly begun to recover and discretionary spending has increased. The company also delivered strong top-line growth and operating leverage due to its superior omni-channel sales platform. Further, the company has spent the past few years revamping its stores and developing its e-commerce offering to match how modern consumers want to see and buy products.
Among the individual stocks that detracted from performance during the period were Vieworks Co. Ltd., Value Added Technology Co. (both from the Health Care sector) and Grape King Bio. Ltd. (Consumer Staples sector). Vieworks is a South Korea-based manufacturer of imaging equipment used in X-rays and flat-panel inspection. During 2017, the company experienced pricing pressure in its X-ray products as new entrants came to the market and one of its major customers increased its in-house production. These combined pressures contributed to the company’s weak results. While Vieworks’ industry can be volatile on a quarter-to-quarter basis, we believe the company has the ability to innovate and take share from incumbents in more challenging applications for imaging technology. Investors have also anticipated a recovery in the company’s sales, which we believe should benefit shares going forward. However, because Viework’s growth may be postponed we chose to reduce the Fund’s position in the stock. Value Added Technology Co. is a Korea-based manufacturer of radiographic systems for dental diagnoses. The company reported disappointing results during the first quarter of 2017 due to one-off expenses that impacted margins. Further, the company’s transition from 2D to 3D X-ray systems caused some inventory write-offs and higher research and development expenses. However, the demand for the company’s 3D product continued to be strong and we believe it is unlikely that the company will incur more charges. As such, we expect the stock to benefit going forward. Taiwan-based Grape King Bio produces and sells health food products with the genesis of its products derived from the medicinal qualities of the mushroom. Grape King Bio declined following reports that it had fabricated the expiration date on some products to extend shelf life. The company negated this finding in news briefs and public commentaries, and we believe the company made solid arguments on the invalidity of the allegations. However, the Taiwanese legal discovery process could take a long time and weigh on stock performance in the near term.
Outlook
We anticipate steady economic growth across emerging markets in 2018 and we believe earnings should continue to rise. Currently, there appears to be greater confidence in the economic cycle of emerging markets compared to developed markets, which we expect will lead to higher multiples.
At the end of the period, Brazil was the Fund’s largest overweight position as we identified a number of high-quality companies experiencing growth. Further, with the benefit of lower interest rates and increased employment, we believe Brazil will continue to recover from its deep recession. China also remains attractive, as its steady economic growth, along with focused policy, has helped reduce concern about the country’s debt levels. The new head of the China Banking Regulatory Commission has also been vocal about implementing tighter controls and a more aligned regulatory framework across the country. We believe these measures, combined with China’s supply-side discipline in overcapacity industries, should result in continued growth in the country’s private sector.
The Fund remained overweight to the Consumer Discretionary and Financials sectors as a result of what we believe are long-term trends of rising discretionary spending and financial market participation in emerging markets. In addition, the Fund was meaningfully overweight to the Industrials sector as global growth remained
| 12 |
Management’s Discussion of Fund Performance (Unaudited) (Continued)
solid in that sector. The Fund was positioned cautiously within the Consumer Staples sector as valuations have risen within the sector and growth in discretionary spending has increased.
Comparison of the Change in Value of a $10,000 Investment in the
Touchstone Emerging Markets Small Cap Fund - Class A* and the
MSCI Emerging Markets Small Cap Index
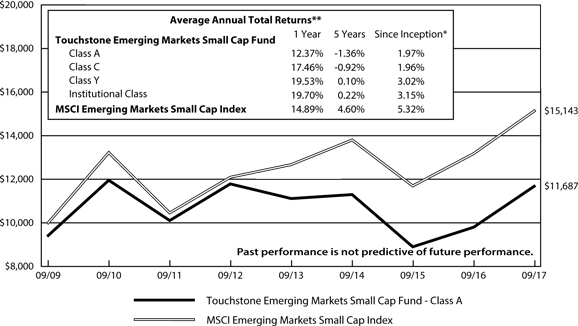
| * | The chart above represents performance of Class A shares only, which will vary from the performance of Class C shares, Class Y shares and Institutional Class shares based on the differences in sales loads and fees paid by shareholders in the different classes. The inception date of the Fund was September 30, 2009. The returns of the index listed above are based on the inception date of the Fund. |
| ** | The average annual total returns shown above are adjusted for maximum sales loads and fees, if applicable. The maximum offering price per share of Class A shares is equal to the net assets value (“NAV”) per share plus a sales load equal to 6.10% of the NAV (or 5.75% of the offering price). Class C shares are subject to a contingent deferred sales charge (“CDSC”) of 1.00%. The CDSC will be assessed on an amount equal to the lesser of (1) the NAV at the time of purchase of the shares being redeemed or (2) the NAV of such shares being redeemed, if redeemed within a one-year period from the date of purchase. Class Y shares and Institutional Class shares are not subject to sales charges. |
The performance of the above Fund does not reflect the deduction of taxes that a shareholder would pay on Fund distributions or the redemption of Fund shares.
Notes to Chart
MSCI Emerging Markets Small Cap Index is a free float-adjusted market capitalization index that is designed to measure equity market performance of small companies from emerging markets.
MSCI makes no express or implied warranties or representations and shall have no liability whatsoever with respect to any MSCI data contained herein. The MSCI data may not be further redistributed or used to create indices or financial products. This report is not approved or produced by MSCI.
| 13 |
Management’s Discussion of Fund Performance (Unaudited)
Touchstone High Yield Fund
Sub-Advised by Fort Washington Investment Advisors, Inc.
Investment Philosophy
The Touchstone High Yield Fund seeks a high level of income. Capital appreciation is a secondary consideration. The Fund primarily invests in non-investment-grade securities.
Fund Performance
The Touchstone High Yield Fund (Class A Shares) underperformed its benchmark, BofA Merrill Lynch High Yield Cash Pay Index, for the 12-month period ended September 30, 2017. The Fund’s total return was 7.45 percent (calculated excluding the maximum sales charge) while the benchmark’s total return was 9.06 percent.
Market Environment
The High Yield market has been a tale of two stories over the last 12 months. The period began with two very bullish quarters, as spreads across all ratings categories tightened significantly amid a broad-based rally in risk. CCC-rated bonds clearly outperformed in this environment as credit spreads tightened by nearly 250 basis points during the first half of the fiscal year. The rally in risk assets coincided with the presidential election and continued through February before moderating. The rally was supported by positive economic fundamentals (including gross domestic product (GDP), wages, employment, housing, etc.) but was further buoyed by the optimism surrounding hopes for healthcare reform, tax cuts and a more pro-business approach from the incoming administration. High yield returns continued to be solid in the second half of the fiscal year. However, those returns were more evenly distributed among ratings categories, as BB and B-rated bonds were able to perform well versus CCC-rated bonds. Spreads across categories have tightened to sit in the top quartile of their historical ranges.
Sector factors for the 12-month period also were bifurcated. The first six months of the period were marked by a continuation of commodity driven returns, with the Energy and Metals & Mining sectors being strong outperformers. During the latter half of the period, West Texas Intermediate (WTI) crude oil prices remained range bound between $40 and $50/barrel. As a result, low quality Energy-related names did quite poorly. The low commodity prices began to wear on the market which was counting on a more sustained rally in the underlying commodity.
Sector themes to highlight during this period were the weakness in Retail, weakness in Supermarkets and weakness in several large issuers with over-levered capital structures. Retail and Supermarkets both continued to struggle with the same issue: the fixed cost structures of brick-and-mortar locations make it difficult to compete in a lower cost, internet-based economy. While the equities of many of these companies have been pressured for some time, we have finally begun to see movement in their bond valuations as the competitive threats of e-commerce quickly became a reality.
The environment for credit remains positive as the economic fundamentals that have driven the last 12 months remain in place today: solid GDP growth, low unemployment, firm wages, strong housing market and ample liquidity. With monetary policy remaining accommodative, we would expect defaults to remain low and top-line growth to continue, which should allow companies to grow cash flows and reduce debt on their balance sheets.
Portfolio Review
As noted above, the bifurcated market environment over the last 12 months means that performance drivers have varied over the course of the fiscal year. The Fund’s higher quality bias was a significant headwind due to the outperformance of CCC-rated bonds versus BB/B. Based on performance attribution, the ratings composition seems to be the largest reason for underperformance relative to the benchmark.
| 14 |
Management’s Discussion of Fund Performance (Unaudited) (Continued)
The Fund’s positioning in the Energy sector was a headwind for the first half of the period and a significant contributor during the second half as low quality Energy names struggled towards the end of the fiscal year. The Fund had a cautious stance in the Retail sector for the entire period and that positioning has been a significant contributor throughout. Lastly, positioning within the Media and Health Care sectors (two sectors that we tend to favor) were also strong contributors throughout the period, materially adding to performance.
There were no material changes made to portfolio positioning in the period, though the Fund decreased its overweight to the Cable/Satellite sector while also reducing its large underweight to the Metals/Mining sector. The Fund has continued to pare down exposure to downgraded CCC-rated bonds as well as low spreading BBB/BB rated bonds. The capital has been redeployed into B-rated bonds, where we think there continues to be a favorable return outlook given the low default rate environment. The largest sector overweights for the Fund were to Midstream Energy and Food & Beverage. We view both of these sectors as having favorable cash flow characteristics relative to their leverage profiles. The largest underweight continued to be in the Packaging sector, a small sector with low yields and poor relative value.
Outlook
Positive data on GDP growth, unemployment and the consumer all point to a stable to positive economic outlook, creating a benign outlook for defaults going forward. With stable financial conditions and liquidity, and no significant concentration of debt maturing in the coming year, the supply/demand dynamics also appear relatively balanced for the foreseeable future. However, should the economy struggle and credit spreads widen, the Fund’s higher quality nature would be beneficial.
In light of the current historically low spread and yield levels, the Fund is positioned toward the lower portion of our risk range. Yield is below that of the benchmark and credit quality is one notch higher (BB- vs B+). We believe that the market is fairly valued and unlikely to experience significant additional spread tightening. The Fund is positioned to emphasize credit selection over sector allocation. In our view, few sectors are materially mispriced and meriting a considerable overweight or underweight.
| 15 |
Management’s Discussion of Fund Performance (Unaudited) (Continued)
Comparison of the Change in Value of a $10,000 Investment in the
Touchstone HighYield Fund - Class A*and the BofA Merrill Lynch HighYield Cash Pay Index
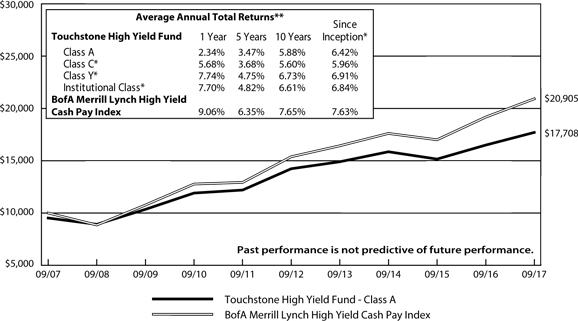
| * | The chart above represents performance of Class A shares only, which will vary from the performance of Class C shares, Class Y shares and Institutional Class shares based on the differences in sales loads and fees paid by shareholders in the different classes. The inception date of Class A shares, Class C shares, Class Y shares and Institutional Class shares was May 1, 2000, May 23, 2000, February 1, 2007, and January 27, 2012, respectively. Class C shares, Class Y shares and Institutional Class shares performance was calculated using the historical performance of Class A shares for the periods prior to May 23, 2000, February 1, 2007 and January 27, 2012, respectively. The returns have been restated for sales loads and fees applicable to Class C, Class Y and Institutional Class shares. The returns of the index listed above are based on the inception date of the Fund. |
| ** | The average annual total returns shown above are adjusted for maximum sales loads and fees, if applicable. The maximum offering price per share of Class A shares is equal to the net asset value (“NAV”) per share plus a sales load equal to 4.99% of the NAV (or 4.75% of the offering price). Class C shares are subject to a contingent deferred sales charge (“CDSC”) of 1.00%. The CDSC will be assessed on an amount equal to the lesser of (1) the NAV at the time of purchase of the shares being redeemed or (2) the NAV of such shares being redeemed, if redeemed within a one-year period from the date of purchase. Class Y shares and Institutional Class shares are not subject to sales charges. |
The performance of the above Fund does not reflect the deduction of taxes that a shareholder would pay on Fund distributions or the redemption of Fund shares.
Note to Chart
BofA Merrill Lynch High Yield Cash Pay Index is an unmanaged index used as a general measure of market performance consisting of fixed-rate, coupon-bearing bonds with an outstanding par which is greater than or equal to $50 million, a maturity range greater than or equal to one year and must be less than BBB/Baa3 rated but not in default.
| 16 |
Management’s Discussion of Fund Performance (Unaudited)
Touchstone Merger Arbitrage Fund
Sub-Advised by Longfellow Investment Management Co.
Investment Philosophy
The Touchstone Merger Arbitrage Fund seeks to achieve positive absolute returns regardless of market conditions over the long term by investing primarily in securities of companies that are involved in publicly announced mergers and other corporate reorganizations. Merger arbitrage is an investment strategy that seeks to capture the “arbitrage spread” represented by the difference between the market price of the securities of the company being purchased and the value that is offered for these securities by the acquiring company. The Fund selects securities based on proposed financing terms, the size of the transaction, anti-trust concerns, regulatory approvals and shareholder voting requirements.
Fund Performance
The Touchstone Merger Arbitrage Fund (Class A Shares) outperformed its benchmark, the BofA Merrill Lynch 3-Month U.S. Treasury Bill Index, for the 12-month period ended September 30, 2017. The Fund’s total return was 3.01 percent (excluding the maximum sales charge) while the benchmark’s total return was 0.66 percent.
Market Environment
During the 12-month period ended September 30, 2017, risk assets continued to exhibit strong gains. U.S. equities posted double-digit total returns. Despite the strong return environment, price volatility following the U.S. election has been one of the calmest periods in history. This lack of realized volatility was a significant surprise given the uncertainty across monetary policy, fiscal policy, taxation and geopolitics. With the U.S. Federal Reserve Board (Fed) continuing on its path of rate normalization and balance sheet tapering, Longfellow’s view is that this lack of volatility will prove fleeting as risk assets revert back to their historical averages.
After excluding deal outliers (e.g., regulatory uncertainty, antitrust concerns, financing), we do not see a broad dispersion of annualized spreads across sectors. The pace of deal activity declined over the course of the period and reached the lowest point in the final quarter of the fiscal year. Those deals that were occurring tended to cluster in pockets of asset managers, regional banks, biotechnology, energy exploration and production (E&P to drilling) and semiconductors.
Portfolio Review
Though macro trends contributed to the performance of the broader equity markets, they did not have a discernable impact on the Fund over the 12-month period. Despite the three interest rate hikes from the Fed during the period, deal spreads tightened marginally as a result of low deal flow and continued investor interest in the merger arbitrage space. Deals tend to price in an annualized deal spread near 4 percent.
During the fiscal year, the Touchstone Merger Arbitrage Fund invested in two broken deals (KLA-Tencor Corp. in late 2016 and RiteAid Corp. in early 2017), but managed to avoid other notable terminations in its investable universe, such as Lattice Semiconductor Corp., Humana Inc./Aetna Inc., Cigna Corp./Anthem Inc. and Deutsche Borse AG/London Stock Exchange Group PLC. While the Fund was able to manage its position in KLA-Tencor to minimize performance impact, the position in RiteAid was a primary detractor to Fund performance. Walgreens Boots Alliance Inc.’s proposed acquisition of RiteAid ran into regulatory trouble in 2016 as the Federal Trade Commission (FTC) refused to grant anti-trust approval based on the initial terms of the deal. The original merger agreement contained a provision to divest 865 stores to Fred’s Inc. that we believed would be sufficient to secure anti-trust approval. After initial indications that a greater number of stores would need to be divested, RiteAid and Walgreens revised their proposed deal, increasing the number of divested stores to 1,200. The
| 17 |
Management’s Discussion of Fund Performance (Unaudited) (Continued)
FTC still was not satisfied with the size of the expanded divestiture, and the two companies eventually agreed to discontinue the merger agreement and proceed with an asset sale. Walgreens will acquire approximately half of RiteAid’s store locations, but the two companies will remain independent entities. RiteAid’s stock consistently traded down over the period, as the deal’s terms changed and its completion date extended.
After a tumultuous 2016, Abbott Laboratories and Alere Inc.’s new merger agreement received various regulatory approvals and progressed toward its early October close date. Abbott will acquire Alere for $51.00 per common share, compared to the previous agreement of $56 per share. As clarity around the deal closure increased, the deal spread tightened, which contributed to the Fund’s performance.
The Fund benefited from an upward revision in price in the merger between The Canadian Imperial Bank of Commerce (CIBC) and PrivateBancorp, Inc. PrivateBancorp is a high-quality, Chicago-based middle market commercial bank with nearly $20 billion in assets, complemented by private banking and wealth management capabilities. CIBC raised the price being paid for PrivateBancorp by approximately 20 percent. Stocks in the Financials sector enjoyed strong gains following the November election, and some PrivateBancorp shareholders raised opposition to the merger, believing that the deal price needed to be revised to reflect the change in market conditions.
The Fund also benefited from its involvement in a multiple bidder situation, as Starwood Capital Group Management LLC and D.R. Horton Inc. fought to acquire Forestar Group Inc. In April 2017, Forestar Group announced a definitive merger agreement to be acquired by Starwood Capital Group for $14.25 per share in cash. D.R. Horton made a competing proposal to acquire 75 percent of Forestar Group for $16.25 per share. Under the proposal, Forestar stockholders would have the right to elect, for each share of common stock held, either to receive $16.25 per share in cash as merger consideration or to retain such share of the surviving entity. The competitive bidding process between Starwood Capital Group and D.R. Horton continued for a couple more rounds, before D.R. Horton ultimately won out with a bid of $17.75 per share for 75 percent of the equity of Forestar Group.
Nexstar Media Group Inc.’s transaction with Media General Inc. closed during the period. Nexstar agreed to acquire Media General for $10.55 per share in cash and 0.1249 of a share of Nexstar Class A common stock for each Media General share. In addition, the terms allowed for additional consideration to Media General shareholders in the form of a contingent value right (CVR) for each Media General share. The CVR entitled Media General shareholders to net cash proceeds that would be received from the sale of Media General’s spectrum in an upcoming Federal Communications Commission (FCC) spectrum auction (a process whereby a government uses an auction system to sell the rights (licences) to transmit signals over specific bands of the electromagnetic spectrum and to assign scarce spectrum resources). The Fund’s portfolio benefited not only from the closing of the merger, but also the additional upside from the contingent value right, which ended up being meaningfully higher than market expectations.
Reckitt Benckiser Group PLC signed a merger agreement with Mead Johnson Nutrition Co. under which Mead Johnson shareholders were to receive $90 in cash for each share of common stock. The transaction proceeded smoothly and attained the necessary shareholder and regulatory approvals en route to its June 2017 closing. The Fund benefited from the narrowing of the deal spread and timely closure of the deal.
Outlook
Access to capital, slow global growth and strong corporate balance sheets are expected to drive a rebound in strategic mergers and acquisitions (M&A), which has slowed in recent months. Historically we believe low funding costs should also provide a tailwind for financial buyers. On balance, we see a backdrop that remains supportive for continued deal activity. The continued strength of the broad equity market should also provide a tailwind for deals. Our team at Longfellow has found a positive correlation between year-over-year gains in
| 18 |
Management’s Discussion of Fund Performance (Unaudited) (Continued)
the S&P 500® Index and subsequent increases in deal activity. We believe this relationship should support an increase in deal activity for the year ahead, particularly should tax reform emerge out of Washington DC.
With deal spreads based in part on short-term interest rates, we believe Fund returns should benefit from the Fed’s continued path toward interest rate normalization. The current forecast from the Fed implies one additional increase in calendar year 2017, as well as the start of balance sheet reductions in October. However, the prospect of the Fed stopping the reinvestment of its mortgage holdings leads to the risk of policy missteps that could introduce volatility to the market. We believe such volatility may provide the Fund incremental investment opportunities. Policy disappointments out of Congress or by President Trump could drive volatility as timelines for expectations of tax and other regulatory reform gets extended.
We continue to believe the Fund is well positioned to provide absolute returns, low realized volatility and low sensitivity to underlying price movements within equity markets. The Fund’s portfolio has a strong focus on liquidity management while managing downside risks. Off of our base-case expectations for deal activity and interest rate policy, we are optimistic regarding the tailwinds for deal activity and potential for wider spreads.
| 19 |
Management’s Discussion of Fund Performance (Unaudited) (Continued)
Comparison of the Change in Value of a $10,000 Investment in the
Touchstone Merger Arbitrage Fund - Class A* and the
BofA Merrill Lynch 3-Month U.S. Treasury Bill Index
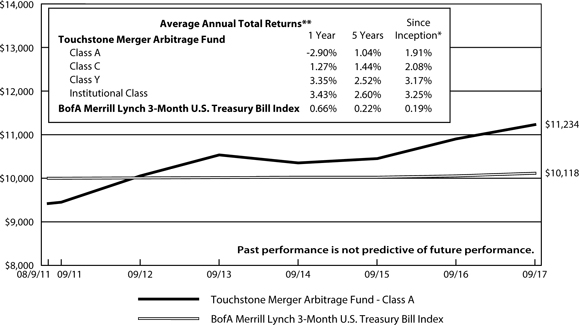
| * | The chart above represents performance of Class A shares only, which will vary from the performance of Class C shares, Class Y shares and Institutional Class shares based on the differences in sales loads and fees paid by shareholders in the different classes. The inception date of the Fund was August 9, 2011. The returns of the index listed above are based on the inception date of the Fund. |
| ** | The average annual total returns shown above are adjusted for maximum sales loads and fees, if applicable. The maximum offering price per share of Class A shares is equal to the net assets value (“NAV”) per share plus a sales load equal to 6.10% of the NAV (or 5.75% of the offering price). Class C shares are subject to a contingent deferred sales charge (“CDSC”) of 1.00%. The CDSC will be assessed on an amount equal to the lesser of (1) the NAV at the time of purchase of the shares being redeemed or (2) the NAV of such shares being redeemed, if redeemed within a one-year period from the date of purchase. Class Y shares and Institutional Class shares are not subject to sales charges. |
The performance of the above Fund does not reflect the deduction of taxes that a shareholder would pay on Fund distributions or the redemption of Fund shares.
Note to Chart
BofA Merrill Lynch 3-Month U.S. Treasury Bill Index is an unmanaged index of Treasury securities maturing in 90 days that assumes reinvestment of all income.
| 20 |
Management’s Discussion of Fund Performance (Unaudited)
Touchstone Mid Cap Fund
Sub-Advised by The London Company
Investment Philosophy
The Touchstone Mid Cap Fund seeks long-term capital growth by investing primarily in common stocks of mid-cap U.S.-listed companies. The Fund utilizes a bottom-up security selection process that screens potential investments against a proprietary quantitative model for return on capital, earnings-to-enterprise value ratio, and free cash flow yield. Its goal is to purchase financially stable companies that are believed to consistently generate high returns on unleveraged operating capital, are run by shareholder-oriented managements and are trading at a discount to their respective private market values.
Fund Performance
The Touchstone Mid Cap Fund (Class A Shares) outperformed its benchmark, the Russell Midcap® Index, for the 12-month period ended September 30, 2017. The Fund’s total return was 18.08 percent (excluding the maximum sales charge) while the benchmark’s total return was 15.32 percent.
Market Environment
For the 12-month period, U.S. equity markets were generally robust and many posted impressive double-digit returns. Following the U.S. presidential election in November, equity markets responded well and remained steady over the course of the period, primarily driven by generally positive economic data and investors’ optimism that fiscal policies could spur gross domestic product (GDP) growth. Among the most significant drivers of outperformance during the period were historically low interest rates and tepid inflation which helped keep equities in favor. Credit markets also remained healthy which further benefited equities. Additionally, the strong U.S. labor market coupled with rising wages and solid housing data continued to benefit consumers. The U.S. Federal Reserve Board (Fed) was fairly transparent in its actions during the period and there were expectations that the Fed will raise the short-term federal funds rate again in December 2017.
Within the benchmark, the Information Technology, Financials and Industrials sectors outperformed, while the Telecommunication Services, Energy and Consumer Staples sectors detracted from performance.
Portfolio Review
At the sector level, the Fund’s underweight to the Energy and Real Estate sectors contributed to relative performance, while an overweight to the Consumer Staples and Consumer Discretionary sectors detracted.
Among the individual stocks that contributed to Fund performance were Old Dominion Freight Lines Inc., Cintas Corp. (both from the Industrials sector), Progressive Corp., M&T Bank Corp. (both from the Financials sector) and CarMax Inc. (Consumer Discretionary sector). Old Dominion Freight Lines, a national less-than-truckload motor carrier, outperformed during the period due to rational pricing in the less-than-full truckload space and positive volume growth. Stable economic growth coupled with some improvement in the industrial side of the economy were also positive for Old Dominion. Cintas, a provider of specialized services to businesses, steadily outperformed during the year. The company’s acquisition of G&K Services Inc. also progressed well, which led to both revenue and cost synergies. The strong labor market was also a tailwind to performance. Progressive, an insurance provider, outperformed as the company continued to exhibit premium growth along with profitable underwriting results. Progressive also posted improving top line growth in its personal auto and property businesses. In particular, growth in the agency’s personal auto business outpaced the industry and its conservative underwriting philosophy contributed to strong profitability and well-managed expenses. M&T Bank, a bank holding company, rallied along with other banks immediately following the U.S. presidential election and throughout the course of the fiscal year, which reflected investors’ renewed optimism for stronger economic growth and rising interest
| 21 |
Management’s Discussion of Fund Performance (Unaudited) (Continued)
rates. CarMax, a used-car retailer, outperformed after the company reported better than expected results during the period. Further, the company’s same-store sales increased and its gross profit per used car remained strong. The company continued to add new stores across the country and also enhanced its digital platform.
Among the individual stocks that detracted from performance were Tempur Sealy International Inc. (Consumer Discretionary sector), New Market Corp., Ball Corp. (both from the Materials sector), Tenet Healthcare Corp. (Health Care sector) and Edgewell Personal Care Inc. (Consumer Staples sector). Tempur Sealy, a provider of mattresses and bedding products, fell notably during the period after the company’s largest retail partner Mattress Firm Inc. pushed back on price increases at Tempur Sealy. The two management teams could not agree, and Tempur Sealy products will no longer be sold at Mattress Firm stores. Mattress Firm represented a meaningful amount of Tempur Sealy’s sales, so the unexpected announcement led to significant weakness in the stock. While Tempur Sealy rallied later in the fiscal period as the company worked with other retailers, near-term results are expected to remain choppy as the company increases advertising spending and ships products to other channels. As such, we exited the Fund’s position in the stock. NewMarket, a petroleum additives company, was generally flat for the period but the stock detracted from relative Fund returns due to its large size in the portfolio. The stock price fell during the third quarter of 2017 after the company reported higher raw material costs and lower pricing. We, however, remain attracted to the stable revenue outlook in the market for fuel additives and lubricants, as well as the company’s pricing power in a consolidated industry and its history of capital allocation. Ball is a packaging company for food, beverages and household products. Ball announced weaker than expected results in its latest earnings release, which negatively impacted the stock, but later rebounded after announcing capacity reductions. Overall the stock was relatively flat but it lagged the benchmark, thus detracting from relative performance. Tenet Healthcare, a healthcare services company, underperformed due to general weakness in the Health Care sector, as well as concerns stemming from the U.S. presidential election results. We exited the Fund’s position in the stock. Edgewell Personal Care, a consumer products company, fell during the period as concerns about the competitive market environment (i.e., Dollar Shave Club, which was acquired by Unilever, and Gillette) negatively impacted the stock. Going forward, we remain attracted to the company’s strong staple of brands in large markets and the long-term potential for mergers and acquisitions activity.
The Fund initiated new positions in Post Holdings Inc. (Consumer Staples sector), T. Rowe Price Group Inc. (Financials sector), Armstrong World Industries Inc. (Industrials sector) and Tiffany & Co. (Consumer Discretionary sector). Post is a consumer packaged goods holding company. We believe the primary attraction to Post has been the long-term success of its chairman, Bill Stiritz, who has a history of success in building businesses and creating shareholder value. Additionally, Stiritz purchased a significant number of shares in the open market which provided further confidence in his execution. T. Rowe Price, an asset manager, is a best-in-breed operator that offers a compelling risk/reward entry point. Further, T. Rowe Price has maintained a strong balance sheet with no long-term debt, as well as a favorable amount of cash and other investments. We believe this will provide the company with flexibility to invest for the future and to better weather market downturns. Armstrong World Industries is the largest global producer of ceiling systems, operating in an oligopolistic industry with high barriers to entry. Armstrong has significant market share and pricing power as well as competitive advantages due to its exclusive long-term contracts with distributors. The company has generated high return on invested capital (ROIC) and has flexibility with its capital structure, which we believe provides downside protection. Tiffany & Co. is an iconic, global, luxury brand with an extensive history. The company’s strong brand recognition has allowed Tiffany to maintain consistently high earnings margins and returns. Although the company’s sales have decelerated in recent years, we believe Tiffany’s recent involvement with activist investor JANA Partners could lead to increased value by monetizing assets, optimizing its supply chain and accelerating topline growth.
The Fund sold its positions in PriceSmart Inc. (Consumer Staples sector), Tempur Sealy International Inc. (Consumer Discretionary sector), LogMeIn Inc. (Information Technology sector),Tenet Healthcare Corp. (Health
| 22 |
Management’s Discussion of Fund Performance (Unaudited) (Continued)
Care sector) and Dover Corp. (Industrials sector). The Fund trimmed its positions in Amphenol Corp. (Information Technology sector) and Copart Inc. (Industrials sector) due to valuation and size.
Outlook
A combination of solid economic growth, low inflation, and relatively low interest rates usually creates a positive environment for stocks. We believe this holds true today, but there are risks. In our opinion, we believe potential risks include relatively high valuations for stocks using traditional metrics, geopolitical turmoil, excessive government stimulus, or the Fed taking a more aggressive stance. We believe the risks and rewards are somewhat balanced as they relate to stocks overall, but we always remain cautious and focused on limiting downside in the Fund’s holdings.
Going forward, we believe the attractive candidates we are vetting today are a result of what the market is providing, and is consistent with our general outlook. Specifically, we believe the Fund’s downside risk can be mitigated by remaining focused on those companies with pricing power, copious cash generation and prudent capital allocation. We seek companies with strong returns on capital and flexibility to enhance shareholder value using the balance sheet. Further, global growth remains tepid but margins and in our opinion, returns on capital are stable and attractive. Looking ahead, we believe the Fund is positioned well for a slow growth environment that rewards strong capital allocation.
| 23 |
Management’s Discussion of Fund Performance (Unaudited) (Continued)
Comparison of the Change in Value of a $10,000 Investment in the Touchstone
Mid Cap Fund - Class A* and the Russell Midcap® Index
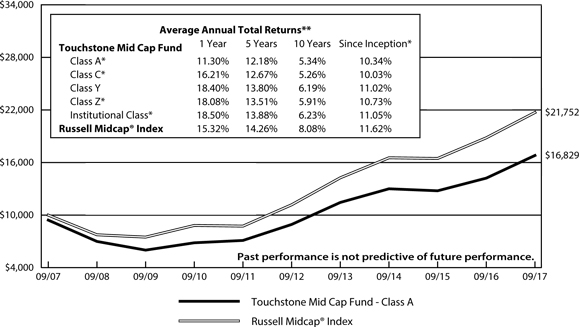
| * | The chart above represents performance of Class A shares only, which will vary from the performance of Class C shares, Class Y shares, Class Z shares and Institutional Class shares based on the differences in sales loads and fees paid by shareholders in the different classes. The inception date of Class A shares, Class C shares, Class Y shares, Class Z shares and Institutional Class shares was May 14, 2007, May 14, 2007, January 2, 2003, April 24, 2006 and January 27, 2012, respectively. Class A shares, Class C shares, Class Z shares and Institutional Class shares performance was calculated using the historical performance of Class Y shares for the periods prior to May 14, 2007, May 14, 2007, April 24, 2006 and January 27, 2012, respectively. The returns have been restated for sales loads and fees applicable to Class A, Class C, Class Z and Institutional Class shares. The returns of the index listed above are based on the inception date of the Fund. |
| ** | The average annual total returns shown above are adjusted for maximum sales loads and fees, if applicable. The maximum offering price per share of Class A shares is equal to the net assets value (“NAV”) per share plus a sales load equal to 6.10% of the NAV (or 5.75% of the offering price). Class C shares are subject to a contingent deferred sales charge (“CDSC”) of 1.00%. The CDSC will be assessed on an amount equal to the lesser of (1) the NAV at the time of purchase of the shares being redeemed or (2) the NAV of such shares being redeemed, if redeemed within a one-year period from the date of purchase. Class Y shares, Class Z shares and Institutional Class shares are not subject to sales charges. |
The performance of the above Fund does not reflect the deduction of taxes that a shareholder would pay on Fund distributions or the redemption of Fund shares.
Notes to Chart
Russell Midcap® Index measures the performance of the 800 smallest companies in the Russell 1000® Index.
The Frank Russell Company (FRC) is the source and owner of the Index data contained or reflected in this material and all trademarks and copyrights related thereto. The material may contain confidential information and unauthorized use, disclosure, copying, dissemination or redistribution is strictly prohibited. This is a Touchstone Investments presentation of the data, and FRC is not responsible for the formatting or configuration of this material or for any inaccuracy in the presentation thereof.
| 24 |
Management’s Discussion of Fund Performance (Unaudited)
Touchstone Mid Cap Value Fund
Sub-Advised by LMCG Investments, LLC
Investment Philosophy
The Touchstone Mid Cap Value Fund seeks capital appreciation by investing primarily in common stocks of medium capitalization companies. The Fund seeks to identify companies believed to be selling at a discount to their intrinsic value.
Fund Performance
The Touchstone Mid Cap Value Fund (Class A Shares) outperformed its benchmark, the Russell Midcap® Value Index, for the 12-month period ended September 30, 2017. The Fund’s total return was 14.62 percent (excluding the maximum sales charge) while the benchmark’s total return was 13.37 percent.
Market Environment
The beginning of the 12-month period was characterized by lackluster results as investors grew concerned about rising interest rates and uncertainty related to the upcoming U.S. presidential election. However, U.S. stock markets rallied in November and December of 2016 following the results of the election. Improved economic data, investors’ optimism about potential reductions in corporate and individual taxes, greater infrastructure spending, less government oversight and repatriation of foreign earnings contributed to the strong performance. U.S. markets also experienced a pronounced rotation out of defensive and higher yielding sectors into more cyclical market segments.
During 2017, the U.S. economy continued to expand at a modest to moderate pace with relatively low inflation. Economic data was generally favorable and included positive revisions to gross domestic product (GDP) growth during each quarter of the year. Consumers continued to lead the U.S. economy and help drive GDP growth. Specifically, consumers benefited from a strong labor market, low unemployment, steady wage growth and rising home prices—all of which contributed to greater consumer spending. The U.S. Federal Reserve Board (Fed) continued on its path to normalize the stance of monetary policy by raising interest rates three times and also started to reduce its balance sheet.
During the 12-month period, from a style standpoint within the mid-cap universe, growth stocks outperformed value stocks for the period. From a factor standpoint, the market favored quality and growth throughout much of the period, which was generally positive for the Fund.
Portfolio Review
The Fund’s strongest contributors to performance were reported in the Real Estate, Financials and Materials sectors. Primary detractors were from the Industrials and Energy sectors.
The Fund’s slightly overweight position to the Financials sector contributed to returns. Within the sector, the Fund’s stock selection within the insurance industry (Unum Group, Allstate Corp.) and capital markets (Ameriprise Financial Inc., E*TRADE Financial Corp.) were particularly strong. Stock selection also drove outperformance in the Materials sector, with particular strength in the Fund’s concentrated chemicals holdings, including FMC Corp., Olin Corp. and Allegheny Technologies Inc.
Conversely, weaker stock selection within the Energy sector was partially offset by the Fund’s overall underweight position to the sector. The Fund has tended to be overweight to exploration and production companies within the Energy space, which was negatively impacted most recently compared to transportation and refining companies. Among the Fund’s largest detractors were Newfield Exploration Co. and Pioneer Natural Resources Co. Stock selection within the Industrials sector also detracted from performance. Stericycle Inc. (a waste management
| 25 |
Management’s Discussion of Fund Performance (Unaudited) (Continued)
company) and Fluor Corp. (an infrastructure construction company) struggled during the period; however, we continued to hold both companies in the Fund’s portfolio.
Outlook
From a macroeconomic standpoint, we believe an improving global economic environment that leads to higher interest rates would benefit the Fund on a relative basis. Real estate investment trusts (REITs) and the Utilities sector have tended to perform opposite the direction of interest rates. Given how low interest rates have been globally, we believe any positive economic news could cause rates to move higher and cause these bond-proxy sectors to underperform.
Looking ahead, our greatest concern is that the market environment will continue to reward growth and visibility, irrespective of valuation and quality. However, we will not deviate from our process of buying high-quality companies that are temporarily out of favor and believe that buying growth and visibility, irrespective of valuation, is a risky strategy. We will continue to seek attractively valued investment opportunities with favorable risk-reward profiles.
The Fund utilizes a classic value-driven philosophy based on the belief that leading businesses selling at a discount to fair value have the potential to generate excess returns. The strategy focuses on stocks that are temporarily out of favor in the market, specifically, companies with higher returns on capital, free cash flow and strong balance sheets. Emphasis is placed on those companies having the cash flow characteristics as well as the balance sheet strength necessary to buffer the company from any prolonged weakness. The companies we select often dominate a particular industry niche and generally have significant barriers to entry. As a result, we believe they are able to perpetuate a higher return on capital over time. The Fund’s overall investment process utilizes fundamental bottom-up security selection, while risk-control measures ensure security and sector diversification.
| 26 |
Management’s Discussion of Fund Performance (Unaudited) (Continued)
Comparison of the Change in Value of a $10,000 Investment in the
Touchstone Mid Cap Value Fund - Class A* and the Russell Midcap® Value Index
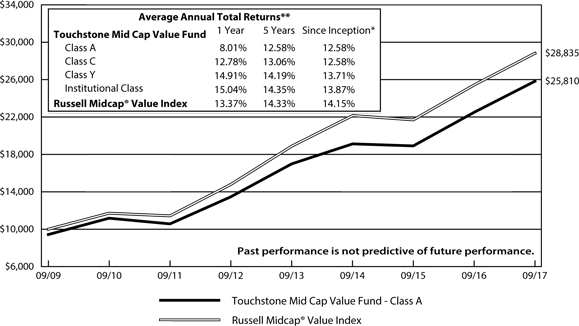
| * | The chart above represents performance of Class A shares only, which will vary from the performance of Class C shares, Class Y shares and Institutional Class shares based on the differences in sales loads and fees paid by shareholders in the different classes. The inception date of the Fund was September 30, 2009. The returns of the index listed above are based on the inception date of the Fund. |
| ** | The average annual total returns shown above are adjusted for maximum sales loads and fees, if applicable. The maximum offering price per share of Class A shares is equal to the net assets value (“NAV”) per share plus a sales load equal to 6.10% of the NAV (or 5.75% of the offering price). Class C shares are subject to a contingent deferred sales charge (“CDSC”) of 1.00%. The CDSC will be assessed on an amount equal to the lesser of (1) the NAV at the time of purchase of the shares being redeemed or (2) the NAV of such shares being redeemed, if redeemed within a one-year period from the date of purchase. Class Y shares and Institutional Class shares are not subject to sales charges. |
The performance of the above Fund does not reflect the deduction of taxes that a shareholder would pay on Fund distributions or the redemption of Fund shares.
Notes to Chart
Russell Midcap® Value Index measures the performance of those Russell Midcap companies with lower price-to-book ratios and lower forecasted growth values.
The Frank Russell Company (FRC) is the source and owner of the data contained or reflected in this material and all trademarks and copyrights related thereto. The material may contain confidential information and unauthorized use, disclosure, copying, dissemination or redistribution is strictly prohibited. This is a Touchstone Investments presentation of the data, and FRC is not responsible for the formatting or configuration of this material or for any inaccuracy in the presentation thereof.
| 27 |
Management’s Discussion of Fund Performance (Unaudited)
Touchstone Premium Yield Equity Fund
Sub-Advised by Miller/Howard Investments, Inc.
Investment Philosophy
The Touchstone Premium Yield Equity Fund seeks long-term growth of capital and high current income by focusing on dividend-paying equity securities of U.S. and foreign companies believed to possess attractive long-term return potential primarily due to lower than average valuations and improving business outlooks.
Fund Performance
The Touchstone Premium Yield Equity Fund (Class A Shares) underperformed the Russell 3000® Value Index and the Dow Jones U.S. Select Dividend Index for the 12-month period ended September 30, 2017. The Fund’s total return was 10.10 percent (excluding the maximum sales charge) while the returns of its benchmarks were 15.53 percent and 13.21 percent, respectively.
Market Environment
The U.S. economy continued to grow, though without inspiring investor confidence. The U.S. labor market, the strongest part of the economic picture, continued to tighten and labor force participation rates (percentage of the population that is either working or actively seeking work) increased. Job quality (part-time vs. full-time) was a drag on take-home pay until wage growth picked up at the end of the 12-month period. There has not yet been a meaningful impact on inflation, in part because of volatile energy and commodity prices, thereby allowing the U.S. Federal Reserve Board (Fed) to raise the federal funds rate in a measured, cautious manner.
Financials and Materials sectors were the best performing sectors in the Russell 3000® Value Index during the 12-month period ended September 30, 2017. Energy and Telecommunication Services were the worst performing sectors in the index for the same period. The Energy sector was driven by uncertainty around the commodity price environment and a tremendous amount of fatigue. Investors were waiting on the sidelines for commodity price fundamentals to firm before returning to the sector. Telecommunication Services posted negative absolute returns due to expectations that the next capex (capital expenditure) cycle will be expensive and would continue to put pressure on cash flow.
Portfolio Review
During the 12-month period, the highest dividend-yielding stocks underperformed those with low or no dividend, representing a headwind for the Fund’s process of investing in stocks that yield more than the Index and increase their dividends over time. The Fund’s overweight allocation to high-yielding stocks, and zero exposure to the lowest dividend-yielding quintile of stocks, detracted from Fund performance.
The Fund’s underweight allocation to the Financials sector detracted from returns during the period. Stock selection within the Financials and Industrials sectors also negatively impacted Fund performance. From a stock selection standpoint, top relative contributors to performance during the period included Western Digital Corp. (Information Technology sector), AbbVie Inc. (Health Care sector) and Microchip Technology Inc. (Information Technology sector).
Among the individual stocks that detracted from performance during the period included Qualcomm Inc. (Information Technology sector), Plains GP Holdings LP (Energy sector) and L Brands Inc. (Consumer Discretionary sector).
The following stocks were added to the Fund during the 12-month period. BB&T Corp. (Financials sector) is a well-managed, small business-oriented lender. BB&T experienced a demographic tailwind across its branch footprint in the southeast and mid-Atlantic regions. The company also has a solid yield and dividend culture,
| 28 |
Management’s Discussion of Fund Performance (Unaudited) (Continued)
and we anticipate return on equity (ROE) improvements as recent acquisitions are integrated. Dupont Fabros Technology Inc. (Real Estate sector), an industry leader in providing outsourced data, was purchased as we believe it was well positioned to benefit from the increasing demand for off-site data storage. Cracker Barrel Old Country Store Inc. (Consumer Discretionary sector) is a Southern-themed chain restaurant. The company moderated its intense expansion program and its balance sheet cash grew despite the company quadrupling its dividend payout since 2012. Crown Castle International Corp. (Real Estate sector) is a U.S. lessor of shared cell towers and other wireless infrastructure. We believe Crown Castle possesses strong infill growth opportunities where additional tower capacity is required to resolve data intensity-driven congestion. With many existing cell towers in its U.S. portfolio, we think Crown Castle’s incumbency positions it to directly benefit from the continuing data deluge. Pitney Bowes Inc. (Industrials sector) is a name that is synonymous with office postage and sorting machines. While the company’s legacy mail business continued its steady decline which began with the advent of email, we believe Pitney retains important strengths, including longstanding customer relationships with the majority of Fortune 500 businesses, as well as over a million small businesses. Pitney’s management plans to leverage its unparalleled customer base in order to move deeper into e-commerce, information management and business data intelligence. Taiwan Semiconductor Manufacturing Co. Ltd. (Information Technology sector), a chip fabricator, delivered a strong dividend and consistent dividend growth forecasts that were underpinned by a balance sheet with no net debt. Tupperware Brands Corp. (Consumer Discretionary sector) is a direct-to-consumer marketer of home goods. The company sources the vast majority of its sales outside the U.S., including two-thirds from Emerging Markets (China, Mexico and Brazil) where it is a leading aspirational brand among rapidly expanding middle class segments. Williams Companies Inc. (Energy sector), a pipeline operator and energy infrastructure company, took swift action under activist pressure to lower its cost of capital and reduce debt after rebuffing a hostile bid from Energy Transfer Partners LP (Energy sector, not owned by the Fund) last year. We believe the company is now better positioned and solid dividend growth should be possible through the end of the decade.
Hanesbrands Inc. (Consumer Discretionary sector) is an underwear manufacturer that sells its product through an ultra-low-cost global supply chain. The Fund initiated its purchase in January 2017 following a strong boost to the company’s dividend. Soon after the purchase, the stock fell on earnings guidance that came in below expectations. We believe the initial market reaction was overdone and believe the stock remains attractive. Welltower Inc. (Real Estate sector) is a healthcare real estate investment trust (REIT) that invests in senior housing and medical office buildings. Over the past decade, Welltower aggressively culled its portfolio to its best performing assets and created a streamlined high-recurring revenue model at the high end of the market in major metropolitan areas. We believe National Grid PLC (Utilities sector), a U.K. and U.S. utility company, provides a rare mix of good valuation, diversification and potential catalysts. The company agreed to divest its British gas utility business in December and plans to use proceeds for an aggressive buyback and special dividend that should supplement a well-supported current yield. International Paper Co. (Materials sector) is a paper company that has consistently paid consecutive quarterly dividends. While the company no longer supplies the majority of the nation’s newsprint as it did in years past, it streamlined its business toward pulp and containerboard, which are historically the two best mass market wood product categories. International Paper also continued to make progress on reducing debt following a large acquisition last year, which we believe should improve dividend growth prospects going forward. Cypress Semiconductor Corp. (Information Technology sector) is a manufacturer of digital dashboard hardware for automobiles. This feature continued to be an imperative focus for car manufacturers seeking to improve the intelligence capability and connectivity of the fleet. While Cypress’ stock lagged due to concerns about weakening automotive sales, we believe the increasing content-per-vehicle should offset any declines in auto unit volume. Analyst research also indicated that Cypress’ increasing content in the upcoming new iPhone and its products should also play an essential role in the industrial and residential Internet of things (IoT). HP Inc. (Information Technology sector), a printer and personal computers (PC) company, increased PC sales despite a soft industry overall. In addition, HP committed to leadership in the growing 3-D printing
| 29 |
Management’s Discussion of Fund Performance (Unaudited) (Continued)
market and also benefited from a buoyant steady cash flow and yield. Target Corp. (Consumer Discretionary sector), a large retailer, continued to focus on its private label brands, revamping its grocery segment, catching up in e-commerce and launching small box stores in urban areas to focus on millennials. We believe Target is among the most aggressive in pushing its higher quality private-label products, including newly launched apparel and houseware lines.
The following stocks were sold from the Fund during the 12-month period. Wells Fargo & Co. (Financials sector), a bank and financial services company, was sold following reports that the bank’s consumer division opened accounts on behalf of customers without consent. Environmental, social and governance (ESG) reviews are a vital layer of risk control in the Fund’s portfolio management, and we believe the scandal revealed a failure of corporate culture that needs to be resolved. Adient PLC (Consumer Discretionary sector), an automotive seating manufacturer, spun off from Johnson Controls International PLC (Industrials sector) and the Fund exited the shares that were received in the spin-off because they did not pay a dividend. General Electric Co. (Industrials sector), a global infrastructure and technology conglomerate, was sold due to its full valuation and dividend outlook. In particular, we believe General Electric’s disappointing cash generation and return on invested capital created near-term cloudiness on the company’s dividend outlook. Omega Healthcare Investors Inc. (Financials sector), a healthcare REIT, was sold in order to rotate into Welltower Inc. based on that company’s higher leverage. Novartis AG (Health Care sector), a healthcare products and pharmaceuticals company, was sold as the company’s immunotherapy progress continued to be elusive and asset dispositions were disappointing. Domtar Corp. (Materials sector) is a pulp, paper and personal care products company. The company was transitioning to personal care and pulp, but the majority of its earnings are generated by its uncoated free sheet paper. The strong U.S. dollar made imports more competitive in the uncoated free sheet paper space and, despite tariffs, certain countries like Brazil and Portugal can still export. We believe Domtar offers attractive exposure to healthy pulp and fluff markets, but we believe International Paper Co. (Materials sector, not owned by the Fund) has similar exposure and a better product mix. Plains GP Holdings was sold (also purchased in the 12-month period) in advance of the company’s expected dividend cut. Procter & Gamble Co. (Consumer Staples sector), a consumer goods company, was sold as we believe the stock reached full valuation. Further, we believe Amazon.com Inc.’s pricing power and house brands will likely be a growing threat to national brands.
Outlook
We see a variety of potential tailwinds for the Fund with four key examples: fifth generation wireless technology (5G), natural gas, banks and healthcare.
5G is the next generation of wireless communication. We believe the biggest players and beneficiaries are some of the largest companies and are all held in the Fund: AT&T Inc., Verizon Communications Inc. and its global peers, the most research-intensive semiconductor companies such as Qualcomm, auto companies, tower companies and network infrastructure companies. Certainly, there will be a place for smaller innovators and specialists, but we believe none of this will happen without the big and solid telecommunications and technology companies that already exist—including the high-quality dividend stocks that the Fund already owns.
Natural gas is abundant and cheap, thanks to the U.S. shale revolution, and it produces only moderate pollution, especially compared to coal. Indeed, there is such a quantity of natural gas and natural gas liquids that the U.S. has ample supplies for export. Since the great decline in oil prices, we believe many of these companies have been somewhat held hostage to price in terms of how investors have perceived the companies, but we believe this cannot last much longer. Business in these areas is good and growing. It is a volume business more than a price business, and it does not depend on oil quotes (though there are few overlaps where oil can be an influence or competitor). Obviously, domestic and global demand for natural gas has, and will continue to have, a strong influence across all portfolios and we believe there are many beneficiaries of this tailwind, including the high-yielding major pipeline companies held in the Fund.
| 30 |
Management’s Discussion of Fund Performance (Unaudited) (Continued)
Banks that passed the Fed’s Comprehensive Capital Analysis and Review stress test are once again able to raise dividends and buy back stock. A few have quickly entered the Fund’s dividend yield universe, and we believe most should qualify as sustainable dividend growers—in addition to offering their new found financial strength as an attractive feature. While we are not interest-rate bulls, we believe these stocks do offer a hedge against rising interest rates, should that come to pass. Further, reduced regulation will have a meaningful impact on costs for banks. Financial companies may play a larger role in the Fund, but we will be selective.
Healthcare is truly in a golden age for treatment breakthroughs. Indeed, and ironically, one of the biggest risks is that new drugs are too good and actually cure disease, reducing the patient population rather than merely treating a disease long term. Still, many serious illnesses are still untreated or uncured, the developed world’s population is aging and in need of more medical treatment and the developing world is increasing its ability to handle drug costs. As such, we believe there is ample opportunity for global healthcare companies, no matter what is finally decided in Washington, D.C.
We believe these tailwinds can help drive quality companies to greater growth, built on top of the established cash flows they have already created. Going forward, we will seek companies with established and repeatable cash flows and with a potential for upside surprises that are not yet appreciated in market prices. While not every tailwind proves sustainable, we believe they are always an investment factor worthy of our ardor and analysis.
We believe the current debates in Washington D.C. are a mixed bag for the Fund’s strategy: less regulation and rising interest rates could help its banking stocks, but healthcare reform could negatively impact its drug stocks. Income tax reform could reduce the advantages of REITs and master limited partnerships (MLPs), but we believe the remainder of the Fund’s holdings could benefit from the potential for improved after-tax returns and cash available to pay dividends. Juggling all the plusses and minuses, we still believe that what matters most is reliable income generation and growth of that income over time. Until we gain more clarity, we continue to look for safer balance sheets and cash flows, even at the cost of some current yield.
Dividend paying investments may not experience the same price appreciation as non-dividend paying instruments, dividend-issuing companies may choose not to pay a dividend or the dividend may be less than what is anticipated.
| 31 |
Management’s Discussion of Fund Performance (Unaudited) (Continued)
Comparison of the Change in Value of a $10,000 Investment in the
Touchstone Premium Yield Equity Fund - Class A*, the Russell 3000® Value Index and the Dow Jones U.S. Select Dividend Index
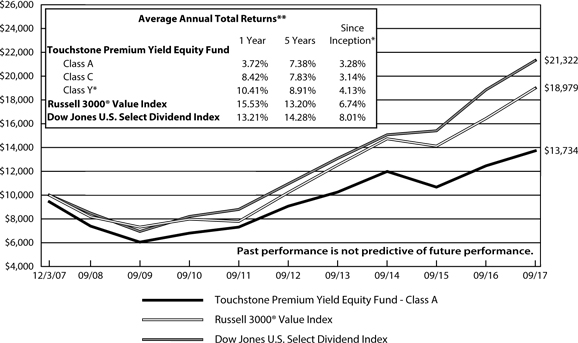
| * | The chart above represents performance of Class A shares only, which will vary from the performance of Class C shares and Class Y shares based on the differences in sales loads and fees paid by shareholders in the different classes. The inception date of Class A shares, Class C shares and Class Y shares was December 3, 2007, December 3, 2007 and August 12, 2008, respectively. Class Y shares performance was calculated using the historical performance of Class A shares for the periods prior to August 12, 2008. The returns have been restated for sales loads and fees applicable to Class Y shares. The returns of the indexes listed above are based on the inception date of the Fund. |
| ** | The average annual total returns shown above are adjusted for maximum sales loads and fees, if applicable. The maximum offering price per share of Class A shares is equal to the net asset value (“NAV”) per share plus a sales load equal to 6.10% of the NAV (or 5.75% of the offering price). Class C shares are subject to a contingent deferred sales charge (“CDSC”) of 1.00%. The CDSC will be assessed on an amount equal to the lesser of (1) the NAV at the time of purchase of the shares being redeemed or (2) the NAV of such shares being redeemed, if redeemed within a one-year period from the date of purchase. Class Y shares are not subject to sales charges. |
The performance of the above Fund does not reflect the deduction of taxes that a shareholder would pay on Fund distributions or the redemption of Fund shares.
Notes to Chart
Russell 3000® Value Index measures the performance of those Russell 3000 companies with lower price-to-book ratios and lower forecasted growth values.
Dow Jones U.S. Select Dividend Index measures 100 leading U.S. dividend-paying companies.
Frank Russell Company (FRC) is the source and owner of the Russell 3000® Value Index data contained or reflected in this material and all trademarks and copyrights related thereto. The material may contain confidential information and unauthorized use, disclosure, copying, dissemination or redistribution is strictly prohibited. This is a Touchstone Investments presentation of the data, and FRC is not responsible for the formatting or configuration of this material or for any inaccuracy in the presentation thereof.
| 32 |
Management’s Discussion of Fund Performance (Unaudited)
Touchstone Sands Capital Select Growth Fund
Sub-Advised by Sands Capital Management, LLC
Investment Philosophy
The Touchstone Sands Capital Select Growth Fund primarily invests in common stocks of large capitalization U.S. companies that are believed to have above-average potential for revenue or earnings growth. The Fund typically invests in 25 to 35 companies. Sands Capital generally seeks stocks with sustainable above-average earnings growth and capital appreciation potential. In addition, Sands Capital looks for companies that have a significant competitive advantage, a leadership position or proprietary niche, a clear mission in an understandable business, financial strength and are valued rationally in relation to comparable companies, the market and the business prospects for that particular company.
Fund Performance
The Touchstone Sands Capital Select Growth Fund (Class A Shares) underperformed its benchmark the Russell 1000® Growth Index for the 12-month period ended September 30, 2017. The Fund’s total return was 19.63 percent (excluding the maximum sales charge) while the total return of the benchmark was 21.94 percent for the same period.
Market Environment
We witnessed two extreme environments for U.S. growth equities over the past 12 months. The fourth quarter of 2016 was fueled by the reflation theme or “Trump Trade”—which benefited mostly stocks of slower growing or cyclical companies. During the first nine months of 2017, share prices of faster-growing U.S. companies outperformed stocks of slower growing companies. We believe the stark reversal in performance was a result of investors shifting their attention from potential short-term catalysts, back to fundamentals. We believe strong underlying fundamentals and consensus-beating earnings have supported this year’s steady climb of faster-growing company share prices.
While we monitor macroeconomic events, we believe the uncertainty of macro-driven factors reinforces the benefits of thoroughly understanding individual companies and secular trends from which they may benefit. Regardless of the macro environment, the foundation of our investment process will always remain our bottom-up analysis of business fundamentals. Because the only certainty in financial markets might be the constant of change, we expect that selectively owning the right businesses will be the main driver of our ability to add value for shareholders with prudence over time.
Portfolio Review
On a relative basis, among the top five contributors to the most recent 12-month’s investment results were Alibaba Group Holding Ltd. (Information Technology sector), Netflix Inc. (Consumer Discretionary sector) and Visa Inc., Salesforce.com Inc. and Adobe Systems Inc. (all from the Information Technology sector). Alibaba’s share price in 2015 was challenged by negative macro sentiment, as well as self-imposed business disruptions from platform enhancement initiatives. With its long-term investment horizon, the Fund continued to own the business because we believed the disruptions were transitory, and that the company’s efforts to set a clear standard of service, improve logistics and overhaul its advertising system would lead to higher, more sustainable growth over time.
Over the past year, Alibaba executed on these initiatives, which we believe translated into strong overall business performance. For example, gross merchandise value (GMV) through Tmall.com (a Chinese language website), Alibaba’s formalized e-commerce channel, accelerated to 49 percent year-over-year growth in the second quarter. This indicated to us that Alibaba’s initiatives to improve product quality and delivery are paying off. Alibaba’s
| 33 |
Management’s Discussion of Fund Performance (Unaudited) (Continued)
improvements to the advertising algorithm enhanced targeting accuracy, and we expect this to be the main driver of its guidance of 42 to 46 percent organic revenue growth in fiscal year 2018 (ending March 31, 2018).
These improvements are just the beginning, as we believe Alibaba is building a unique platform that is transforming the massive retail market in China. Furthermore, we believe that the company is at the forefront globally of bringing a completely integrated omni-channel experience at scale, which should expand Alibaba’s addressable market to all of retail, both online and offline. Starting with categories that have traditionally low online penetration such as large appliances and fresh produce, Alibaba has already started to help retail partners reconfigure existing stores and build new prototypes with digitized back-end operations and optimized storefronts. These new concepts are increasing productivity, and we expect more retailers should adopt this approach over time. Throughout the process, Alibaba has amassed vast amounts of rich data. Currently, this data is used to help monetization by increasing the algorithm’s targeting accuracy. Over time, we believe Alibaba could generate additional revenue from this data by providing retailers and brands with valuable consumer intelligence.
While many growth drivers remain for its domestic e-commerce revenue, Alibaba is also investing in earlier-stage assets that we believe could further extend its growth runway. For example, it is already a leader in the public cloud in China and formalized e-commerce in Southeast Asia. It is also the main channel for Chinese merchants to export to world consumers. All of these businesses have experienced strong revenue growth and could contribute to Alibaba growing at above-average rates for many years to come.
The top five relative detractors from investment results were Under Armour Inc. (Consumer Discretionary sector), Snap Inc. (Information Technology sector), Cerner Corp. (Health Care sector), Palo Alto Networks Inc. (Information Technology sector) and Chipotle Mexican Grill Inc. (Consumer Discretionary sector). Under Armour’s visionary management team has built a strong sports wear brand in the U.S., and is in the early stages of expanding its businesses internationally. As the company continued to execute well in its core categories of U.S. men’s and youth apparel, it is laying the foundation for the next potential legs of its growth in footwear, international and women’s. We believe success in these new categories will fuel the company’s transition into a global mega brand. However, the path from here to there is rarely without speed bumps, and Under Armour encountered its fair share recently. The U.S. athletic apparel and footwear channel was pressured from the broader retail consolidation and elevated inventories. Under Armour has more sizable exposure to the domestic wholesale channel than its peers, which magnified the negative impact on the company’s financials. In addition to this channel weakness, we believe the industry is in the midst of a cyclical preference for fashion-infused athletic apparel and footwear. In our view, Under Armour is under represented in this category, resulting in another headwind for the business.
While we expect the sporting goods retail channel to remain under pressure over the next couple of quarters, we believe Under Armour has some growth levers it can pull to grow through this period. The company made progress with its merchandising strategy and evolved its product offering, which we expect will enable it to diversify away from core wholesale segments (i.e., sporting goods retailers) by adding additional wholesale partners (e.g., mid-tier channel, family footwear channel). We believe these additional partners should stabilize Under Armour’s growth results until faster-growing and increasingly profitable business segments—including international, footwear and direct-to-consumer—reach critical mass and become important drivers of earnings growth.
Over the past 12 months, positions were initiated in ServiceNow Inc. (Information Technology sector), Monster Beverage Corp. (Consumer Staples sector), Snap Inc. (Information Technology sector), Starbucks Corp. (Consumer Discretionary sector), Costar Group Inc. and Activision Blizzard Inc. (both from the Information Technology sector). During the same time period, positions that were sold included Monsanto Co. (Materials sector), Cerner Corp. (Health Care sector), Mobileye NV (Information Technology sector), Schlumberger Ltd. (Energy sector) and athenahealth Inc. (Health Care sector).
| 34 |
Management’s Discussion of Fund Performance (Unaudited) (Continued)
Outlook
We view secular trends, innovation and company-specific competitive advantages as key to driving growth through a variety of economic environments. For a business to possess the above-average earnings growth potential we require, it is often a key innovator or vital facilitator within an attractive industry that is benefiting from positive secular change. Secular trends are distinct from short-term economic factors as they tend to persist through market cycles and can provide powerful structural tailwinds that enhance the sustainability of a business’s growth for many years. We believe our long-term investment horizon allows us to capture the benefit of these characteristics and realize the ultimate earnings power of a company, while weathering volatility over shorter periods. Furthermore, our approach—active, concentrated and benchmark-agnostic—enables us to have outsized exposure to companies within this sphere that we believe are the best fits with our six investment criteria. We believe the majority of businesses in the Fund’s portfolio benefit from one or more secular trends. However, we have identified four broad trends that together comprise a majority of the portfolio:
Retail Revolution: E-commerce
E-commerce is the fastest growing segment of retail sales, but only accounts for about 7 percent of the total worldwide retail market. As a proportion of total retail sales, e-commerce is expected to nearly double by 2019. Brands now have the ability to directly interact with consumers through novel mediums such as social media and lifestyle apps, and become embedded in their daily routines. Tools such as Amazon Prime and Visa Checkout reduce the friction associated with online payment. Portfolio beneficiaries include Alibaba Group Holding Ltd., Amazon.com Inc., Facebook Inc., The Priceline Group Inc. and Visa Inc.
Union of Healthcare and Technology
Major areas of unmet need continue to exist in the treatment of disease. However, improved understanding of disease biology and new approaches to treatment are enabling more productive drug development. Additionally, we expect genomic sequencing and health care information systems to facilitate precision medicine, enabling physicians to provide more targeted care. We are also witnessing the rise of minimally invasive surgical technologies, which have quality of life advantages for the patient and efficiency benefits for providers, leading them to increasingly become the standard of care. Portfolio beneficiaries include Alexion Pharmaceuticals Inc., BioMarin Pharmaceutical Inc., EdwardsLife sciences Corp., Illumina Inc. and Regeneron Pharmaceuticals Inc.
Software-as-a-Service (SaaS)
In our view, information technology spending is shifting toward innovations that make enterprises more agile and efficient. Cloud-based software is a key facilitator of this shift. Fast deployment, scalability, easy and frequent updates and lower total cost of ownership create a compelling customer value proposition. SaaS businesses tend to benefit from revenue visibility, “sticky” clientele, margin leverage opportunities and low customer acquisition costs. Portfolio beneficiaries include Adobe Systems Inc., Amazon.com Inc., Palo Alto Networks Inc., Service Now Inc. and Splunk Inc.
Data-Driven Decision Making
We believe companies with large, proprietary pools of consumer data and tools that use this data to create unique content have sizable monetization opportunities. Advertising is already well on its way toward transformation, as access to consumer data is enabling companies to create targeted, more effective ads. At the micro level, companies are beginning to use predictive analytics to generate insights from their own pools of data. Portfolio beneficiaries include Alphabet Inc., Baidu Inc., Facebook Inc., Netflix Inc. and Splunk Inc.
We believe the Fund owns companies that are positioned to deliver strong business results and earnings growth over our five- to ten-year investment horizon. Our focus on the sustainability of a business’s future earnings growth typically steers us toward companies we believe are benefiting from secular trends that should provide
| 35 |
Management’s Discussion of Fund Performance (Unaudited) (Continued)
powerful growth tailwinds throughout economic cycles. We have high conviction in the long-term growth estimates for the Fund’s portfolio companies and believe they can deliver the growth necessary to support above average relative and absolute returns over the next several years.
Comparison of the Change in Value of a $10,000 Investment in the
Touchstone Sands Capital Select Growth Fund - Class A* and the Russell 1000® Growth Index
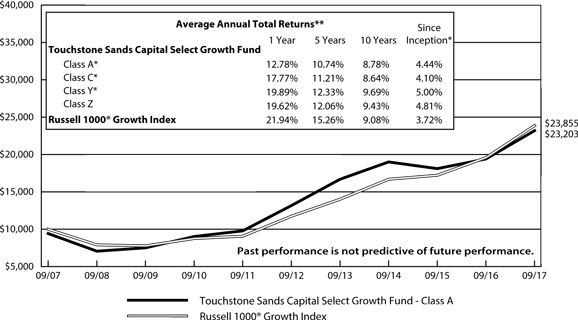
| * | The chart above represents performance of Class A shares only, which will vary from the performance of Class C shares, Class Y shares and Class Z shares based on the differences in sales loads and fees paid by shareholders in the different classes. The inception date of Class A shares, Class C shares, Class Y shares and Class Z shares was November 15, 2010, November 15, 2010, August 27, 2004 and August 11, 2000, respectively. Class A shares, Class C shares and Class Y shares performance was calculated using the historical performance of Class Z shares for the periods prior to November 15, 2010, November 15, 2010 and August 27, 2004, respectively. The returns have been restated for sales loads and fees applicable to Class A, Class C and Class Y shares. The returns of the index listed above are based on the inception date of the Fund. |
| ** | The average annual total returns shown above are adjusted for maximum sales loads and fees, if applicable. The maximum offering price per share of Class A shares is equal to the net asset value (“NAV”) per share plus a sales load equal to 6.10% of the NAV (or 5.75% of the offering price). Class C shares are subject to a contingent deferred sales charge (“CDSC”) of 1.00%. The CDSC will be assessed on an amount equal to the lesser of (1) the NAV at the time of purchase of the shares being redeemed or (2) the NAV of such shares being redeemed, if redeemed within a one-year period from the date of purchase. Class Y shares and Class Z shares are not subject to sales charges. |
The performance of the above Fund does not reflect the deduction of taxes that a shareholder would pay on Fund distributions or the redemption of Fund shares.
Notes to Chart
Russell 1000® Growth Index measures the performance of those Russell 1000 companies with higher price-to-book ratios and higher forecasted growth values.
The Frank Russell Company (FRC) is the source and owner of the data contained or reflected in this material and all trademarks and copyrights related thereto. The material may contain confidential information and unauthorized use, disclosure, copying, dissemination or redistribution is strictly prohibited. This is a Touchstone Investments presentation of the data, and FRC is not responsible for the formatting or configuration of this material or for any inaccuracy in the presentation thereof.
| 36 |
Management’s Discussion of Fund Performance (Unaudited)
Touchstone Small Cap Fund
Sub-Advised by The London Company
Investment Philosophy
The Touchstone Small Cap Fund seeks capital appreciation by investing primarily in common stocks of U.S. companies with small market capitalizations. The Fund utilizes a bottom-up security selection process that screens potential investments against a proprietary quantitative model for return on capital, earnings-to-enterprise value ratio, and free cash flow yield.
Fund Performance
The Touchstone Small Cap Fund (Class A Shares) underperformed its benchmark, the Russell 2000® Index, for the 12-month period ended September 30, 2017. The Fund’s total return was 9.17 percent (excluding the maximum sales charge) while the benchmark’s total return was 20.74 percent.
Market Environment
For the 12-month period, U.S. equity markets were generally robust and many posted impressive double-digit returns. Following the U.S. presidential election in November, equity markets responded well and remained steady over the course of the period, primarily driven by generally positive economic data and investors’ optimism that fiscal policies could spur gross domestic product (GDP) growth. Among the most significant drivers of outperformance during the period were historically low interest rates and tepid inflation which helped keep equities in favor. Credit markets also remained healthy which further benefited equities. Additionally, the strong U.S. labor market coupled with rising wages and solid housing data continued to benefit consumers. The U.S. Federal Reserve Board (Fed) was fairly transparent in its actions during the period and there were expectations that the Fed will raise the short-term federal funds rate again in December 2017.
Within the benchmark, the Financials, Industrials, Materials, Health Care and Information Technology sectors contributed to performance, while the Energy and Consumer Staples sectors lagged.
Portfolio Review
Within the Fund, sector exposure and stock selection had a negative impact on relative performance. At the sector level, the Fund’s underweight to the Financials sector and overweight to the Consumer Staples sector detracted from returns, which was partially offset by an overweight to the Materials and Industrials sectors.
Among the individual stocks that contributed to Fund performance during the period were Orbital ATK Inc., Landstar System Inc., GATX Corp. (all three from the Industrials sector), Olin Corp. (Materials sector) and Service Corp. International (Consumer Discretionary sector). Orbital ATK, an aerospace manufacturer and defense industry company, bounced back early in 2017 following weakness in late 2016, which was largely tied to an accounting restatement surrounding an ammunition contract with the U.S. Army. Orbital was later able to submit 10-Qs and 10-Ks for the periods in question. The company also reported solid operating results, strong bookings, and maintained its outlook for the remainder of the year. Furthermore, during the third quarter of the calendar year, Orbital received an all-cash takeover bid from Northrop Grumman Corp., which Orbital accepted. The deal is expected to close during the first quarter of 2018. Landstar System, a transportation services company specializing in logistics and supply chain solutions, rallied in step with the Industrials sector. Landstar posted better than expected results and raised near-term earnings guidance despite challenging business conditions. Going forward, we believe expectations of secular tightening in trucking capacity could lead to greater pricing power during the contract renewal season. As such, we remain attracted to the high returns on the company’s capital driven by its flexible business model with limited capital spending needs. GATX, a railcar leasing company, outperformed as investors focused on the potential for improved industrial activity and rising
| 37 |
Management’s Discussion of Fund Performance (Unaudited) (Continued)
lease rates following the U.S. presidential election. The company also benefited from steady fleet utilization, remarking income and an announcement that it intends to exit the majority of its Portfolio Management’s marine investment. While the railcar leasing environment remained difficult due to oversupply, low fleet utilization and large railcar manufacturing backlog, signs of improvement in rail traffic helped stabilize many commodities, which benefited the rail carloads. We remain attracted to the company’s long-term customer contracts and visibility of cash flow. Olin is a manufacturer of ammunition, chlorine and sodium hydroxide. The stock moved higher during the period as pricing for the company’s key chlor-alkali product (caustic soda) consistently increased. Further, there was a better global balance of supply and demand which led to improved industry fundamentals and a positive outlook for the company. Olin has also begun to demonstrate operating leverage following its acquisition of Dow Chemical’s chlorine business. Service Corp. is a provider of funeral goods and services, as well as cemetery property. The company continued to benefit from demographic tailwinds that favor the industry, and has also gained market share over the last few years through acquisitions as well as organic growth. Service Corp.’s cemetery pre-need sales were strong during the period and management raised guidance for the year. Further, the company returned a significant amount of capital to shareholders via dividends and share repurchases, which also benefited the stock.
Among the individual stocks that detracted from Fund performance were Vista Outdoor Inc. (Consumer Discretionary sector), Dril-Quip Inc. (Energy sector), NewMarket Corp. (Materials sector), Energizer Holdings Inc. (Consumer Staples sector) and Superior Energy Services Inc. (Energy sector). Vista Outdoor fell early in the calendar year after the company reported weaker than expected volume in its operations and took an impairment charge. The impairment charge was related to prior acquisitions, whereas the acquired businesses were determined to be worth less than what management previously anticipated. We exited the stock during the period based on the difficult outlook for the business and concerns around its acquisition strategy. Dril-Quip, a deep-water exploration and drilling company, moved lower during the quarter. The industry environment remained challenging and orders for offshore drilling were weak. We remain attracted to the company’s competitive advantages and strong balance sheet. New Market, a petroleum additives company, was generally flat for the period but the stock detracted from relative Fund returns due to its large size in the Fund’s portfolio. The stock price fell during the most recent quarter of the period after the company reported higher raw material costs and lower pricing. We, however, remain attracted to the positive revenue outlook in the market for fuel additives and lubricants, as well as the company’s pricing power in a consolidated industry and its history of capital allocation. Energizer, a battery manufacturer, declined during the period with most of the weakness occurring in the fourth quarter of 2016. Despite a strong rally in the market overall, some of the more conservative, defensive holdings like Energizer lagged. The Fund maintained its position as we believe industry fundamentals may continue to improve. Superior Energy Services, an oilfield services and equipment company, moved lower along with the majority of the Energy sector. The Fund exited its position in the stock.
During the period, the Fund initiated positions in Dril-Quip Inc. (Energy sector), Ingevity Corp. (Materials sector), Bruker Corp. (Health Care sector), Cooper Tire & Rubber Co. and Sturm Ruger & Co. Inc. (both from the Consumer Discretionary sector). Ingevity Corp. manufactures specialty chemicals and carbon materials. Increasingly stringent U.S. and global gasoline vapor emissions standards have driven increased demand for activated carbon, and products of Ingevity’s competitors have appeared inadequate to comply with these stricter standards. Given the risk associated with non-compliance for car manufacturers, we expect Ingevity to maintain its substantial market position and high margins. Bruker Corp. develops and manufactures high performance scientific instruments which enable scientists to explore life and materials at molecular, cellular and microscopic levels. The company’s leading market share and high quality products have led to improving returns and margins over the years. Cooper Tire & Rubber has benefited from the tire industry’s significant capacity utilization which has allowed for increased returns across the industry. Sturm Ruger & Co. has recently repurchased significant amounts of stock which has benefited the stock.
| 38 |
Management’s Discussion of Fund Performance (Unaudited) (Continued)
The Fund added to its existing positions in Landstar System Inc. (Industrials sector). The Fund trimmed its positions in Tempur Sealy International Inc. and Deckers Outdoor Corp. (both from the Consumer Discretionary sector) and Dril-Quip Inc. (Energy sector). The Fund sold its positions in Vista Outdoor Inc., Cabela’s Inc. (both from the Consumer Discretionary sector), World Fuel Services Inc., Superior Energy Services Inc. (both from the Energy sector) and Tenet Healthcare Corp. (Health Care sector).
Outlook
A combination of solid economic growth, low inflation, and relatively low interest rates usually creates a positive environment for stocks. We believe this holds true today, but there are risks. In our opinion, potential risks include relatively high valuations for stocks using traditional metrics, geopolitical turmoil, excessive government stimulus, or the Fed taking a more aggressive stance. We believe the risks and rewards are somewhat balanced as they relate to stocks overall, but we always remain cautious and focused on limiting downside in the Fund’s holdings.
Going forward, we believe the attractive candidates we are vetting today are a result of what the market is providing, and is consistent with our general outlook. Specifically, we believe the Fund’s downside risk can be mitigated by remaining focused on those companies with pricing power, copious cash generation and prudent capital allocation. We seek companies with strong returns on capital and flexibility to enhance shareholder value using the balance sheet. Further, global growth remains tepid but margins and in our opinion, returns on capital are stable and attractive. Looking ahead, we believe the Fund is positioned well for a slow growth environment that rewards strong capital allocation.
| 39 |
Management’s Discussion of Fund Performance (Unaudited) (Continued)
Comparison of the Change in Value of a $10,000 Investment in the
Touchstone Small Cap Fund - Class A* and the
Russell 2000® Index

| * | The chart above represents performance of Class A shares only, which will vary from the performance of Class C shares, Class Y shares and Institutional Class shares based on the differences in sales loads and fees paid by shareholders in the different classes. The inception date of the Fund was September 30, 2009. The returns of the index listed above are based on the inception date of the Fund. |
| ** | The average annual total returns shown above are adjusted for maximum sales loads and fees, if applicable. The maximum offering price per share of Class A shares is equal to the net assets value (“NAV”) per share plus a sales load equal to 6.10% of the NAV (or 5.75% of the offering price). Class C shares are subject to a contingent deferred sales charge (“CDSC”) of 1.00%. The CDSC will be assessed on an amount equal to the lesser of (1) the NAV at the time of purchase of the shares being redeemed or (2) the NAV of such shares being redeemed, if redeemed within a one-year period from the date of purchase. Class Y shares and Institutional Class shares are not subject to sales charges. |
The performance of the above Fund does not reflect the deduction of taxes that a shareholder would pay on Fund distributions or the redemption of Fund shares.
Notes to Chart
Russell 2000® Index measures the performance of the small-cap segment of the U.S. equity universe.
The Frank Russell Company (FRC) is the source and owner of the data contained or reflected in this material and all trademarks and copyrights related thereto. The material may contain confidential information and unauthorized use, disclosure, copying, dissemination or redistribution is strictly prohibited. This is a Touchstone Investments presentation of the data, and FRC is not responsible for the formatting or configuration of this material or for any inaccuracy in the presentation thereof.
| 40 |
Management’s Discussion of Fund Performance (Unaudited)
Touchstone Small Cap Value Fund
Sub-Advised by LMCG Investments, LLC
Investment Philosophy
The Touchstone Small Cap Value Fund seeks long-term capital growth by investing primarily in common stocks of small capitalization companies. The Fund seeks to identify companies believed to be selling at a discount to their intrinsic value.
Fund Performance
The Touchstone Small Cap Value Fund (Class A Shares) underperformed its benchmark, the Russell 2000® Value Index, for the 12-month period ended September 30, 2017. The Fund’s total return was 17.46 percent (excluding the maximum sales charge) while the benchmark’s total return was 20.55 percent.
Market Environment
The beginning of the 12-month period was characterized by lackluster results as investors grew concerned about rising interest rates and uncertainty related to the upcoming U.S. presidential election. However, U.S. stock markets rallied in November and December of 2016 following the results of the election. Improved economic data, investors’ optimism about potential reductions in corporate and individual taxes, greater infrastructure spending, less government oversight and repatriation of foreign earnings contributed to the strong performance. U.S. markets also experienced a pronounced rotation out of defensive and higher yielding sectors into more cyclical market segments.
During 2017, the U.S. economy continued to expand at a modest to moderate pace with relatively low inflation. Economic data was generally favorable and included positive revisions to gross domestic product (GDP) growth during each quarter of the year. Consumers continued to lead the U.S. economy and help drive GDP growth. Specifically, consumers benefited from a strong labor market, low unemployment, steady wage growth and rising home prices—all of which contributed to greater consumer spending. The U.S. Federal Reserve Board (Fed) continued on its path to normalize the stance of monetary policy by raising interest rates three times and also started to reduce its balance sheet.
From a style standpoint within the small-cap universe, growth stocks and value stocks finished in-line with one another for the 12-month period. From a factor perspective, the market favored stocks with higher beta1 and smaller capitalization for the first six months of the period, before switching to reward companies with lower or no yield and higher foreign exposure. This created a mixed overall backdrop for the Fund’s style, particularly during the most recent six months.
Portfolio Review
The Fund’s strongest contributors to performance were reported in the Information Technology and Materials sectors. Primary detractors were from the Health Care and Industrials sectors. Stock selection was the primary driver of underperformance during the period, though it was partially offset by relative strength from sector allocation.
Stock selection within the Health Care sector detracted from performance, with particular weakness from the Fund’s healthcare services and providers stocks. These holdings moved lower due to investors’ uncertainty about the U.S. election and potential for a rollback of the Affordable Care Act by the Trump administration. The Fund was also negatively impacted by its lack of exposure to biotechnology companies, which outperformed during the period.
| 41 |
Management’s Discussion of Fund Performance (Unaudited) (Continued)
The Fund’s overweight position to the Industrials sector contributed to performance but stock selection detracted. Team Inc., a provider of specialty industrial services, was the largest individual detractor. Team struggled as bottom-line results came in below expectations. On the positive side, the company continued to integrate acquisitions and streamline its organization. As such, we remain attracted to Team’s long-term prospects and expect reductions in company expenses in 2018. We added to the Fund’s position during the period as we believe the stock will benefit from a more normal spending environment going forward.
Stock selection drove performance within the Information Technology sector, with particular strength in the Fund’s information technology services and electronic equipment segments, including Blackhawk Network Holdings Inc., Virtusa Corp. and Coherent Inc. An overweight position to the sector during the period also benefited returns, though that weight was reduced later in the period as the Fund realized gains in the sector and identified opportunities elsewhere.
Sector allocation and stock selection drove performance within the Materials sector, with particular strength in the Fund’s chemicals segment. Olin Corp. and Innophos Holdings Inc. were the largest individual contributors in the sector for the period, along with Allegheny Technologies Inc. in the metals and mining industry.
Outlook
From a macroeconomic standpoint, we believe an improving global economic environment that leads to higher interest rates would benefit the Fund on a relative basis. Real estate investment trusts (REITs) and the Utilities sector have tended to perform opposite the direction of interest rates. Given how low interest rates have been globally, we believe any positive economic news could cause rates to move higher and cause these bond-proxy sectors to underperform.
Looking ahead, our greatest concern is that the market environment will continue to reward growth and visibility, irrespective of valuation and quality. However, we will not deviate from our process of buying high-quality companies that are temporarily out of favor and believe that buying growth and visibility, irrespective of valuation, is a risky strategy. We will continue to seek attractively valued investment opportunities with favorable risk-reward profiles.
The Fund utilizes a classic value-driven philosophy based on the belief that leading businesses selling at a discount to fair value have the potential to generate excess returns. The strategy focuses on stocks that are temporarily out of favor in the market, specifically companies with higher returns on capital, free cash flow and strong balance sheets. Emphasis is placed on those companies having the cash flow characteristics as well as the balance sheet strength necessary to buffer the company from any prolonged weakness. The companies we select often dominate a particular industry niche and generally have significant barriers to entry. As a result, we believe they are able to perpetuate a higher return on capital over time. The Fund’s overall investment process utilizes fundamental bottom-up security selection, while risk-control measures ensure security and sector diversification.
1Beta is a measure of the volatility of a portfolio relative to its benchmark.
| 42 |
Management’s Discussion of Fund Performance (Unaudited) (Continued)
Comparison of the Change in Value of a $10,000 Investment in the
Touchstone Small Cap Value Fund - Class A* and the
Russell 2000® Value Index
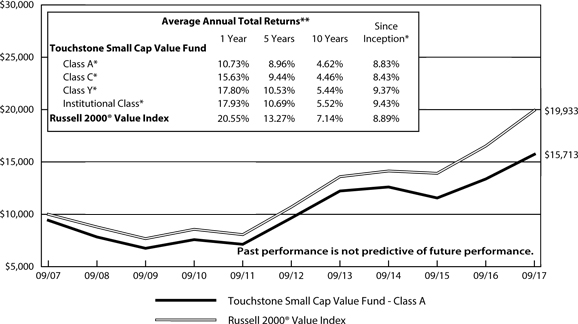
| * | The chart above represents performance of Class A shares only, which will vary from the performance of Class C shares, Class Y shares and Institutional Class shares based on the differences in sales loads and fees paid by shareholders in the different classes. The inception date of Class A shares, Class C shares, Class Y shares, Class Z shares and Institutional Class shares was March 1, 2011, March 1, 2011, March 1, 2011, March 4, 2002 and March 1, 2011, respectively. On June 10, 2011, Class Z shares were converted to Class A shares. Class A shares, Class C shares, Class Y shares and Institutional Class shares performance was calculated using the historical performance of Class Z shares for the periods prior to March 1, 2011. The returns have been restated for sales loads and fees applicable to Class A, Class C, Class Y and Institutional Class shares. The returns of the index listed above are based on the inception date of the Fund. |
| ** | The average annual total returns shown above are adjusted for maximum sales loads and fees, if applicable. The maximum offering price per share of Class A shares is equal to the net assets value (“NAV”) per share plus a sales load equal to 6.10% of the NAV (or 5.75% of the offering price). Class C shares are subject to a contingent deferred sales charge (“CDSC”) of 1.00%. The CDSC will be assessed on an amount equal to the lesser of (1) the NAV at the time of purchase of the shares being redeemed or (2) the NAV of such shares being redeemed, if redeemed within a one-year period from the date of purchase. Class Y shares and Institutional Class shares are not subject to sales charges. |
The performance of the above Fund does not reflect the deduction of taxes that a shareholder would pay on Fund distributions or the redemption of Fund shares.
Notes to Chart
Russell 2000® Value Index measures the performance of those Russell 2000 companies with lower price-to-book ratios and lower forecasted growth values.
The Frank Russell Company (FRC) is the source and owner of the data contained or reflected in this material and all trademarks and copyrights related thereto. The material may contain confidential information and unauthorized use, disclosure, copying, dissemination or redistribution is strictly prohibited. This is a Touchstone Investments presentation of the data, and FRC is not responsible for the formatting or configuration of this material or for any inaccuracy in the presentation thereof.
| 43 |
Management’s Discussion of Fund Performance (Unaudited)
Touchstone Total Return Bond Fund
Sub-Advised by EARNEST Partners LLC
Investment Philosophy
The Touchstone Total Return Bond Fund seeks current income. Capital appreciation is a secondary goal. The Fund invests primarily in fixed income securities or sectors that are considered undervalued for their risk characteristics.
Fund Performance
The Touchstone Total Return Bond Fund (Class A Shares) outperformed its benchmark, the Bloomberg Barclays U.S. Aggregate Bond Index, for the 12-month period ended September 30, 2017. The Fund’s total return was 0.15 percent (excluding the maximum sales charge) while the benchmark’s total return was 0.07 percent.
Market Environment
Major market events during the last 12 months began with the 2016 U.S. presidential election. The election of President Trump, along with Republicans maintaining control in both Congressional chambers, lifted investors’ expectations for economic growth and inflation. This shift in outlook was coined the “reflation trade” in which underlying expectations would lead to higher interest rates and increased demand for assets which generally tend to perform better during periods of higher economic growth. The yield on the 10-year Treasury note began to increase early in the period and approached its peak by December.
While consumer and business optimism significantly increased, economic data was mixed. Business spending and investments remained tepid for most of the period and the lack of wage increases kept consumer spending in check. The job market, however, was a source of strength throughout the period. But even as job participation increased and unemployment ticked lower - and eventually under the natural rate of employment - wages experienced only modest growth. The U.S. Federal Reserve Board (Fed) appeared convinced that the lack of wage growth was indicative of remaining slack in the labor markets, thereby providing a rationale for increasing the federal funds rate at a moderate pace over the last 12 months. All told, the Fed raised interest rates three times during the period.
As controversies and agendas unfolded in Washington, D.C., during the period, the market began to downplay the reflation trade, which helped drive down interest rate expectations in the latter half of the fiscal year. The yield on the 10-year Treasury declined from its peak, but finished the fiscal year higher.
Portfolio Review
Increasing interest rates created a difficult environment for fixed income investments. As such, the Bloomberg Barclays U.S. Aggregate Bond Index generated only a modest return for the period. However, due to the strong performance of spread sectors, the index outperformed relative to similar duration U.S. Treasuries during the period. The rising interest rate environment was especially difficult for U.S. Treasuries, as these securities are inherently exposed to interest rate risk without any of the additional yield spread that bonds can generate.
The steady economic growth environment coupled with investors’ high demand for bonds with additional yield provided a favorable backdrop for credit-sensitive securities such as U.S. Corporate Bonds, Commercial Mortgage-Backed Securities (CMBS), Asset-Backed Securities (ABS) and taxable Municipal Securities. Lower quality bonds were in particularly high demand during the period, as BBB-rated securities delivered outperformance. Securities rated A, AA and AAA also outperformed but to a lesser degree. Despite the increased demand for lower quality credit securities, investors did not abandon high-quality U.S. Agency bonds, which also outperformed during the period. Agency Multi-Family Mortgage-Backed Securities (MBS), whose prepayment protections
| 44 |
Management’s Discussion of Fund Performance (Unaudited) (Continued)
are typically beneficial during periods of uncertainty, delivered excess returns during the fiscal year. Conversely, Single-Family MBS underperformed due to the uncertain outlook.
The combination of the low interest rate environment and slow but steady growth economy helped create additional demand for spread products, which was the primary tailwind to Fund performance. The Fund’s underweight to Single-Family MBS and overweight to Agency Multi-Family MBS benefited Fund performance during the period. The Fund’s slight overweight to U.S. Corporate Credit was also a positive contributor to performance as the sector continued to experience strong demand.
The most notable change in the Fund’s positioning was a reduced weighting to CMBS. Specifically, the Fund’s pre-Financial Crisis CMBS holdings began to mature, thus reducing the Fund’s allocation. The proceeds from CMBS were spread throughout the portfolio, with Agency Multi-Family MBS receiving the largest portion of the allocation.
The Fund does not make active interest rate bets and, accordingly, the Fund’s duration was approximately matched to that of the benchmark during the period. By approximately matching the benchmark’s duration, the Fund’s interest rate risk is effectively equal to that of the benchmark over time.
Outlook
Conversations about the Fed’s balance sheet came into focus during the period, and it has become more evident that the Fed may gradually reduce the size of its holdings in the coming years. These holdings are almost entirely devoted to U.S. Treasuries and Single-Family MBS. If the Fed, the single largest buyer of these securities, is no longer at the table, these sectors could experience relative underperformance. For reasons related to these events, we have chosen to underweight both of these sectors. If these events were to unfold, the Fund could benefit from any weakness experienced by these sectors.
The commercial real estate and CMBS markets have recently been under scrutiny, largely due to the weakness that brick-and-mortar retailers have experienced. We believe this could benefit the Fund in two ways. First, the Fund’s CMBS holdings differ from the benchmark, as the portfolio’s holdings are pre-Financial Crisis securities with a larger focus on housing and office space. The performance and demand profile for these types of properties has remained strong, which we believe should benefit the Fund. Further, the properties backing these securities have demonstrated their value in surviving the Financial Crisis. We believe newer securities and properties have not necessarily encountered this type of environment, and surprises could loom. Second, the demand for CMBS debt has lost ground to Agency Multi-Family MBS. If the latter further gains in popularity, the Fund could benefit due to increased demand for holdings/sectors in which the Fund has been overweight.
Going forward, we believe an event that creates a surge in demand for U.S. Treasuries, such as a war with North Korea, could be a cause for concern. Historically, this type of exceptional demand for U.S. Treasuries has been short-lived as investors are reminded that other high-quality spread assets with a yield advantage exist as alternatives. The Fund’s overweight to spread products and slight overweight to U.S. Credit could cause a headwind to the Fund if economic growth significantly declined. However, the Fund’s emphasis on less economically sensitive sectors and high quality could act to mitigate this impact. Looking ahead, we believe the Fund is positioned well and maintains a discipline that balances risk and return objectives.
| 45 |
Management’s Discussion of Fund Performance (Unaudited) (Continued)
Comparison of the Change in Value of a $10,000 Investment in the
Touchstone Total Return Bond Fund - Class A* and the
Bloomberg Barclays U.S. Aggregate Bond Index

| * | The chart above represents performance of Class A shares only, which will vary from the performance of Class C shares, Class Y shares and Institutional Class shares based on the differences in sales loads and fees paid by shareholders in the different classes. The inception date of Class A shares, Class C shares, Class Y shares and Institutional Class shares was August 16, 2010, August 1, 2011, November 15, 1991 and August 1, 2011, respectively. Class A shares, Class C shares and Institutional Class shares performance was calculated using the historical performance of Class Y shares for the periods prior to August 16, 2010, August 1, 2011 and August 1, 2011, respectively. The returns have been restated for sales loads and fees applicable to Class A, Class C and Institutional Class shares. The returns of the index listed above are based on the inception date of the Fund. |
| ** | The average annual total returns shown above are adjusted for maximum sales loads and fees, if applicable. The maximum offering price per share of Class A shares is equal to the net asset value (“NAV”) per share plus a sales load equal to 4.99% of the NAV (or 4.75% of the offering price). Class C shares are subject to a contingent deferred sales charge (“CDSC”) of 1.00%. The CDSC will be assessed on an amount equal to the lesser of (1) the NAV at the time of purchase of the shares being redeemed or (2) the NAV of such shares being redeemed, if redeemed within a one-year period from the date of purchase. Class Y shares and Institutional Class shares are not subject to sales charges. |
The performance of the above Fund does not reflect the deduction of taxes that a shareholder would pay on Fund distributions or the redemption of Fund shares.
Note to Chart
Bloomberg Barclays U.S. Aggregate Bond Index is an unmanaged index comprised of U.S. investment grade, fixed rate bond market securities, including government, government agency, corporate and mortgage-backed securities between one and ten years.
| 46 |
Management’s Discussion of Fund Performance (Unaudited)
Touchstone Ultra Short Duration Fixed Income Fund
Sub-Advised by Fort Washington Investment Advisors, Inc.
Investment Philosophy
The Touchstone Ultra Short Duration Fixed Income Fund seeks maximum total return consistent with the preservation of capital by primarily investing in a diversified portfolio of fixed income securities of different maturities, including U.S.Treasury securities, U.S. government agency and U.S. government-sponsored enterprise securities, corporate bonds, mortgage-backed securities, commercial mortgage-backed securities, asset-backed securities, municipal bonds and cash equivalent securities including repurchase agreements and commercial paper. While the Fund may invest in securities of any maturity or duration, interest rate risk is managed by seeking to maintain an effective duration of one year or less under normal market conditions.
Fund Performance
The Touchstone Ultra Short Duration Fixed Income Fund (Class A shares) outperformed its benchmarks, the BofA Merrill Lynch 3-Month U.S. Treasury Bill Index and the BofA Merrill Lynch 1-Year U.S. Treasury Note Index for the 12-month period ended September 30, 2017. The Fund’s total return was 1.29 percent (excluding the maximum sales charge) while the total returns of its benchmarks were 0.66 percent and 0.60 percent, respectively.
Market Environment
The Fund’s fiscal year started off with a bang on the heels of the U.S. presidential election and expectations for President Trump’s pro-growth policies, which investors believed would shake gross domestic product (GDP) growth out of its stable but slow pace. The markets reacted strongly as the price of risk assets moved higher and interest rates climbed to heights not seen since the Taper Tantrum in 2013. Consumer and business confidence also reacted strongly and posted notable highs.
Overseas, the global economic outlook was less certain in late 2016 as central banks maintained a generally accommodative stance. The malaise within the Energy sector and China’s lackluster economic growth were still fresh in investors’ minds. The economic pictures in Europe and Asia were generally perceived as headwinds. Amid concerns surrounding key elections in the Netherlands, France and Germany – which would potentially give rise to more populist policies – and escalating tensions relating to Syria and North Korea, uncertainty on the global stage limited the upside potential for risk assets.
During the course of the fiscal year, however, populist candidates in Europe were largely defeated and growth in Europe and Asia began to firm, giving rise to a synchronized global expansion. Within the U.S., the White House and Republican-controlled Congress failed to reach an agreement on the Affordable Care Act and the markets began to question if the Trump administration could work with Congress to advance the president’s pro-growth policies. Despite the Trump administration’s inefficacy, domestic growth continued to improve and the global recovery gained traction with limited inflationary pressure. The U.S. Federal Reserve Board (Fed) raised the federal funds rate three times during the fiscal year, with rate increases of 25 basis points each in December, March and June. The yield curve on the U.S.Treasury ultimately shifted higher during the period, mirroring the Fed’s tightening of monetary policy.
Overall, equities, High Yield bonds (commonly known as “junk bonds”) and other risk assets posted strong results and performed best for the period. They were supported by the synchronized global expansion, low inflation and historically low volatility. Core bonds, as measured by the Bloomberg Barclays U.S. Aggregate Bond Index, were relatively flat for the period as coupon income and spread tightening offset the impact of higher interest rates. The short duration markets performed comparatively well. Tightening spreads largely
| 47 |
Management’s Discussion of Fund Performance (Unaudited) (Continued)
offset the impact of rising interest rates and the ability to reinvest cash flow at progressively higher rates over the course of the year produced positive returns.
Portfolio Review
Outperformance was primarily driven by the Fund’s favorable sector exposures. Consistent with its investment discipline and historical positioning, the Fund had limited exposure to government securities and maintained an emphasis on structured securities, such as Commercial Mortgage-Backed Securities (CMBS), Asset-Backed Securities (ABS) and Agency Mortgage-Backed Securities (MBS). This positioning benefited Fund performance, which was further bolstered by positive security selection. Given the spread tightening environment, portfolios with the most credit risk tended to perform best. Funds that focused on government securities generally posted lower returns.
The Fund’s sector allocations saw few meaningful changes during the fiscal year. Short duration Corporate Bonds remained attractive and the Fund’s allocation to that sector continued to be historically high. The Fund also maintained a significant allocation to ABS and slightly increased its exposure. We believe the ABS sector continues to offer the most compelling value, given its positive combination of quality and spread. As of the end of the period, the Corporate Bond and ABS sectors were the two most significant Fund weights. CMBS exposure remained fairly stable. Though CMBS is one of the highest returning sub-sectors, supply remains limited and bonds with attractive risk-return profiles in this sector are difficult to source. CMBS, ABS and Corporate Bonds all contributed to the Fund’s outperformance during the period. The most significant change was the increase in cash and equivalents toward the end of the period. With the yield curve relatively flat, generally tight spreads across all sectors, and the Fed likely to raise interest rates in December, we made a tactical decision to overweight the Fund’s allocation to cash. Further, we believe that commercial paper and variable rate demand notes are comparatively attractive assets in which to invest.
The Fund’s portfolio duration was near the lower end of its historical operating range. The Fund’s strategy focuses on low spread duration and high cash flow to mitigate the impact of spread widening. During the period, the short duration position reflected two primary concerns. First, the Fed expects to raise interest rates multiple times by the end of 2018, with the market potentially underappreciating the risk of inflation. Second, the flat Treasury curve and flat relative value landscape has not encouraged investors to move out on the curve and take duration risk or spread duration risk. The Fund’s historically low spread duration position likely had a small but negative impact on performance during the period.
Outlook
Looking ahead, our primary concerns are the tightening financial conditions brought on by the Fed’s rate increases, the potential for aggressive action by global central banks, and policy uncertainty in Europe, the Middle East and Asia. Compounding these risks is a fully valued market with most assets trading at historically tight spread levels. Global inflation and the resulting increase in foreign interest rates also pose significant risks. Given the relative attractiveness of U.S. markets, foreign purchases of U.S. assets have been strong and have contributed to the fully valued spread levels in the market. Should this trade unwind, it would create a difficult market environment in terms of both rates and spreads.
While it is difficult to predict changes in the level of interest rates, we believe the groundwork has been laid by the Fed to continue to raise rates. Tax reform, which the markets have largely ignored, has become a wild card that is gaining momentum and could have a substantive impact on growth, including fueling inflation. As such, we expect the front end of the yield curve to continue to rise and experience greater volatility than in prior quarters. Accordingly, the Fund’s current strategy targets a shorter duration with a concentrated maturity distribution, which should help to offset rate volatility in the front end of the curve. Given the potential for
| 48 |
Management’s Discussion of Fund Performance (Unaudited) (Continued)
higher rates and our belief that spreads will remain stable, the Fund is defensively positioned with regard to interest rate risk and neutrally positioned relative to spread risk.
Despite the risks present in the market, we still believe that an overweight to risk assets is appropriate, supported by steady economic growth expectations, a solid labor market, accommodative global central bank policies and supportive financial conditions. The market has also given little credence to the potential for significant tax reform or a fiscal policy boost, so any accomplishment of the Trump administration’s pro-growth policy initiatives would be an added bonus. Finally, consumer credit fundamentals appear favorable and support the Fund’s exposure to structured products. Given the positive consumer and commercial real estate fundamentals, we believe spreads on the Fund’s ABS and CMBS exposures should remain toward the low end of the range. A recovery in corporate profits should also support the spread environment for Corporate Bonds.
We remain most comfortable adding exposure in securities higher in the capital structure (i.e., higher credit quality), but in less liquid parts of the market where additional yield can be found without taking on additional fundamental credit risk. Valuations in most sectors are full, or fairly valued, and we believe are likely to remain so in the near term. The Fund’s exposure to subprime auto ABS presents some downside risk if liquidity premiums increase substantively, thereby creating a supply/demand imbalance. While it is possible that credit fundamentals could also deteriorate, we believe there is a low probability of this event and the downside price risk would likely be transient, as most of these securities would mature in six months to one year.
| 49 |
Management’s Discussion of Fund Performance (Unaudited) (Continued)
Comparison of the Change in Value of a $10,000 Investment in the
Touchstone Ultra Short Duration Fixed Income Fund - Class A*,
the BofA Merrill Lynch 3-Month U.S. Treasury Bill Index
and the BofA Merrill Lynch 1-Year U.S. Treasury Note Index
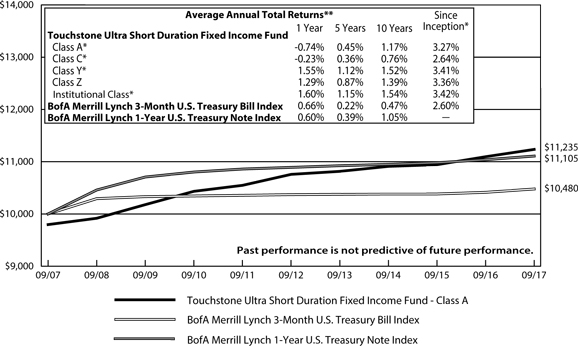
| * | The chart above represents performance of Class A shares only, which will vary from the performance of Class C shares, Class Y shares, Institutional Class shares and Class Z shares based on the differences in sales loads and fees paid by shareholders in the different classes. The inception date of Class A shares, Class C shares, Class Y shares, Class Z shares and Institutional Class shares was April 12, 2012, April 12, 2012, April 12, 2012, March 1, 1994 and April 12, 2012, respectively. Class A shares, Class C shares, Class Y shares and Institutional Class shares performance was calculated using the historical performance of Class Z shares for the periods prior to April 12, 2012. The returns have been restated for sales loads and fees applicable to Class A, Class C, Class Y and Institutional Class shares. The returns of the indexes listed above are based on the inception date of the Fund. The launch date of the BofA Merrill Lynch 1-Year U.S Treasury Note Index was after the inception date of the Fund, therefore there is no return for inception. |
| ** | The average annual total returns shown above are adjusted for maximum sales loads and fees, if applicable. The maximum offering price per share of Class A shares is equal to the net asset value (“NAV”) per share plus a sales load equal to 2.04% of the NAV (or 2.00% of the offering price). Class C shares are subject to a contingent deferred sales charge (“CDSC”) of 1.00%. The CDSC will be assessed on an amount equal to the lesser of (1) the NAV at the time of purchase of the shares being redeemed or (2) the NAV of such shares being redeemed, if redeemed within a one-year period from the date of purchase. Class Y shares, Class Z shares, and Institutional Class shares are not subject to sales charges. |
The performance of the above Fund does not reflect the deduction of taxes that a shareholder would pay on Fund distributions or the redemption of Fund shares.
Notes to Chart
BofA Merrill Lynch 3-Month U.S. Treasury Bill Index is an unmanaged index of Treasury securities maturing in 90 days that assumes reinvestment of all income.
BofA Merrill Lynch 1-Year U.S. Treasury Note Index is an unmanaged index comprised of a single issue purchased at the beginning of the month and held for a full month. The issue selected at each month-end rebalancing is the outstanding two-year Treasury Note Bill that matures closest to, but, not beyond one year from the rebalancing date.
| 50 |
Tabular Presentation of Portfolios of Investments (Unaudited)
September 30, 2017
The tables below provide each Fund’s geographic allocation, sector allocation or credit quality. We hope it will be useful to shareholders as it summarizes key information about each Fund’s investments.
| Touchstone Active Bond Fund | ||||
| Credit Quality* | (% of Investment Securities) | |||
| AAA/Aaa | 52.1 | % | ||
| AA/Aa | 1.8 | |||
| A/A | 10.5 | |||
| BBB/Baa | 22.9 | |||
| BB/Ba | 4.1 | |||
| B/B | 1.9 | |||
| CCC | 0.9 | |||
| Not Rated | 3.1 | |||
| Cash Equivalents | 2.7 | |||
| Total | 100.0 | % | ||
| Touchstone Arbitrage Fund | ||||
| Sector Allocation** | (% of Net Assets) | |||
| Long Positions | ||||
| Common Stocks | ||||
| Financials | 27.7 | % | ||
| Health Care | 15.7 | |||
| Information Technology | 9.8 | |||
| Consumer Discretionary | 8.9 | |||
| Telecommunication Services | 5.2 | |||
| Materials | 3.8 | |||
| Energy | 2.9 | |||
| Industrials | 2.2 | |||
| Real Estate | 1.6 | |||
| Utilities | 1.4 | |||
| Consumer Staples | 0.6 | |||
| Corporate Bonds | 12.5 | |||
| Preferred Stock | 0.8 | |||
| Commercial Mortgage-Backed Security | 0.6 | |||
| Warrants | 0.4 | |||
| Exchange Traded Funds | 0.2 | |||
| Purchased Options | 0.0 | |||
| Rights | 0.0 | |||
| Short-Term Investment Funds | 15.9 | |||
| Cash Collateral for Securities Sold Short and Written Options | 9.8 | |||
| Other Assets/Liabilities (Net) | (4.7 | ) | ||
| 115.3 | ||||
| Short Positions | ||||
| Common Stocks | ||||
| Energy | (3.0 | ) | ||
| Information Technology | (2.6 | ) | ||
| Telecommunication Services | (2.6 | ) | ||
| Consumer Discretionary | (1.7 | ) | ||
| Health Care | (1.2 | ) | ||
| Exchange Traded Funds | (4.1 | ) | ||
| Written Call Options | (0.1 | ) | ||
| Written Put Options | (0.0 | ) | ||
| (15.3 | ) | |||
| Total | 100.0 | % | ||
* Credit quality ratings are from Standard & Poor’s (“S&P”) and Moody’s Investors Service (“Moody’s”). If agency ratings differ, the higher rating will be used. Where no rating has been assigned, it may be for reasons unrelated to the creditworthiness of the issuer.
**Sector Classifications are based upon the Global Industry Classification Standard (GICS®).
| 51 |
Tabular Presentation of Portfolios of Investments (Unaudited) (Continued)
| Touchstone Emerging Markets Small Cap Fund | ||||
| Geographic Allocation | (% of Net Assets) | |||
| Common Stocks | ||||
| Taiwan | 14.0 | % | ||
| India | 13.3 | |||
| Cayman Islands | 11.9 | |||
| South Korea | 11.7 | |||
| Brazil | 8.4 | |||
| Thailand | 5.4 | |||
| South Africa | 3.5 | |||
| China | 3.5 | |||
| Philippines | 3.3 | |||
| United Kingdom | 2.9 | |||
| Indonesia | 2.7 | |||
| Malaysia | 2.6 | |||
| Mexico | 2.6 | |||
| Hong Kong | 2.4 | |||
| Hungary | 2.1 | |||
| Jersey | 1.6 | |||
| Singapore | 1.5 | |||
| Greece | 1.4 | |||
| Luxembourg | 1.3 | |||
| Poland | 1.2 | |||
| Turkey | 1.0 | |||
| Exchange Traded Fund | 1.0 | |||
| Short-Term Investment Funds | 2.8 | |||
| Other Assets/Liabilities (Net) | (2.1 | ) | ||
| Total | 100.0 | % | ||
| Touchstone High Yield Fund | ||||
| Credit Quality* | (% of Investment Securities) | |||
| BBB/Baa | 5.6 | % | ||
| BB/Ba | 56.9 | |||
| B/B | 35.7 | |||
| CCC | 0.3 | |||
| C or Lower | 0.2 | |||
| Not Rated | 1.0 | |||
| Cash equivalents | 0.3 | |||
| Total | 100.0 | % | ||
* Credit quality ratings are from Standard & Poor’s (“S&P”) and Moody’s Investors Service (“Moody’s”). If agency ratings differ, the higher rating will be used. Where no rating has been assigned, it may be for reasons unrelated to the creditworthiness of the issuer.
| 52 |
Tabular Presentation of Portfolios of Investments (Unaudited) (Continued)
| Touchstone Merger Arbitrage Fund | ||||
| Sector Allocation* | (% of Net Assets) | |||
| Long Positions | ||||
| Common Stocks | ||||
| Financials | 36.8 | % | ||
| Health Care | 10.6 | |||
| Information Technology | 7.5 | |||
| Consumer Discretionary | 6.5 | |||
| Telecommunication Services | 3.2 | |||
| Materials | 2.6 | |||
| Industrials | 2.0 | |||
| Energy | 1.9 | |||
| Real Estate | 1.0 | |||
| Utilities | 0.9 | |||
| Consumer Staples | 0.5 | |||
| Corporate Bonds | 15.2 | |||
| Commercial Mortgage-Backed Securities | 1.9 | |||
| Preferred Stock | 0.8 | |||
| Exchange Traded Funds | 0.6 | |||
| Warrants | 0.3 | |||
| Purchased Call Options | 0.0 | |||
| Purchased Put Options | 0.0 | |||
| Rights | 0.0 | |||
| Short-Term Investment Fund | 20.2 | |||
| Cash Collateral for Securities Sold Short and Written Options | 1.7 | |||
| Other Assets/Liabilities (Net) | (1.0 | ) | ||
| 113.2 | ||||
| Short Positions | ||||
| Common Stocks | ||||
| Information Technology | (2.4 | ) | ||
| Energy | (2.0 | ) | ||
| Telecommunication Services | (1.5 | ) | ||
| Consumer Discretionary | (1.5 | ) | ||
| Health Care | (0.9 | ) | ||
| Exchange Traded Funds | (4.9 | ) | ||
| Written Call Options | (0.0 | ) | ||
| Written Put Options | (0.0 | ) | ||
| (13.2 | ) | |||
| Total | 100.0 | % | ||
| Touchstone Mid Cap Fund | ||||
| Sector Allocation* | (% of Net Assets) | |||
| Consumer Discretionary | 26.3 | % | ||
| Financials | 19.0 | |||
| Industrials | 16.8 | |||
| Information Technology | 15.1 | |||
| Materials | 11.8 | |||
| Consumer Staples | 10.0 | |||
| Short-Term Investment Fund | 1.1 | |||
| Other Assets/Liabilities (Net) | (0.1 | ) | ||
| Total | 100.0 | % | ||
| Touchstone Mid Cap Value Fund | ||||
| Sector Allocation* | (% of Net Assets) | |||
| Financials | 18.5 | % | ||
| Industrials | 12.7 | |||
| Information Technology | 11.2 | |||
| Consumer Discretionary | 10.8 | |||
| Utilities | 8.2 | |||
| Real Estate | 8.0 | |||
| Materials | 7.9 | |||
| Energy | 6.5 | |||
| Health Care | 6.1 | |||
| Consumer Staples | 5.6 | |||
| Exchange Traded Fund | 1.9 | |||
| Short-Term Investment Funds | 5.8 | |||
| Other Assets/Liabilities (Net) | (3.2 | ) | ||
| Total | 100.0 | % | ||
* Sector Classifications are based upon the Global Industry Classification Standard (GICS®).
| 53 |
Tabular Presentation of Portfolios of Investments (Unaudited) (Continued)
| Touchstone Premium Yield Equity Fund | ||||
| Sector Allocation* | (% of Net Assets) | |||
| Information Technology | 16.4 | % | ||
| Real Estate | 15.7 | |||
| Health Care | 14.9 | |||
| Financials | 10.7 | |||
| Consumer Discretionary | 10.0 | |||
| Energy | 8.4 | |||
| Telecommunication Services | 8.0 | |||
| Industrials | 6.3 | |||
| Materials | 5.1 | |||
| Utilities | 1.8 | |||
| Short-Term Investment Funds | 4.4 | |||
| Other Assets/Liabilities (Net) | (1.7 | ) | ||
| Total | 100.0 | % | ||
| Touchstone Small Cap Fund | ||||
| Sector Allocation* | (% of Net Assets) | |||
| Industrials | 28.6 | % | ||
| Consumer Discretionary | 20.2 | |||
| Materials | 15.9 | |||
| Real Estate | 10.2 | |||
| Financials | 7.5 | |||
| Consumer Staples | 7.3 | |||
| Information Technology | 3.3 | |||
| Energy | 2.1 | |||
| Health Care | 1.6 | |||
| Short-Term Investment Funds | 11.3 | |||
| Other Assets/Liabilities (Net) | (8.0 | ) | ||
| Total | 100.0 | % | ||
| Touchstone Sands Capital Select Growth Fund | ||||
| Sector Allocation* | (% of Net Assets) | |||
| Information Technology | 54.2 | % | ||
| Consumer Discretionary | 19.1 | |||
| Health Care | 18.2 | |||
| Financials | 3.5 | |||
| Consumer Staples | 2.8 | |||
| Short-Term Investment Funds | 5.2 | |||
| Other Assets/Liabilities (Net) | (3.0 | ) | ||
| Total | 100.0 | % | ||
| Touchstone Small Cap Value Fund | ||||
| Sector Allocation* | (% of Net Assets) | |||
| Financials | 28.3 | % | ||
| Industrials | 20.6 | |||
| Information Technology | 9.5 | |||
| Consumer Discretionary | 8.9 | |||
| Consumer Staples | 6.9 | |||
| Materials | 6.2 | |||
| Health Care | 5.0 | |||
| Utilities | 4.3 | |||
| Real Estate | 4.2 | |||
| Energy | 3.8 | |||
| Telecommunication Services | 0.7 | |||
| Exchange Traded Fund | 0.4 | |||
| Short-Term Investment Funds | 9.0 | |||
| Other Assets/Liabilities (Net) | (7.8 | ) | ||
| Total | 100.0 | % | ||
* Sector Classifications are based upon the Global Industry Classification Standard (GICS®).
| 54 |
Tabular Presentation of Portfolios of Investments (Unaudited) (Continued)
| Touchstone Total Return Bond Fund | ||||
| Credit Quality* | (% of Investment Securities) | |||
| AAA/Aaa | 64.8 | % | ||
| AA/Aa | 7.7 | |||
| A/A | 8.6 | |||
| BBB/Baa | 13.6 | |||
| BB/Ba | 2.4 | |||
| CCC | 0.8 | |||
| Cash Equivalents | 2.1 | |||
| Total | 100.0 | % | ||
| Touchstone Ultra Short Duration Fixed Income Fund | ||||
| Credit Quality* | (% of Investment Securities) | |||
| AAA/Aaa | 31.5 | % | ||
| AA/Aa | 11.4 | |||
| A/A | 18.3 | |||
| BBB/Baa | 23.5 | |||
| CCC | 0.1 | |||
| Not Rated | 4.0 | |||
| Cash Equivalents | 11.2 | |||
| Total | 100.0 | % | ||
* Credit quality ratings are from Standard & Poor’s (“S&P”) and Moody’s Investors Service (“Moody’s”). If agency ratings differ, the higher rating will be used. Where no rating has been assigned, it may be for reasons unrelated to the creditworthiness of the issuer.
| 55 |
Touchstone Active Bond Fund – September 30, 2017
| Principal | Market | |||||||
| Amount | Value | |||||||
| U.S. Treasury Obligations — 41.1% | ||||||||
| $ | 3,185,000 | U.S. Treasury Bond, 2.750%, 8/15/47 | $ | 3,115,826 | ||||
| 565,000 | U.S. Treasury Bond, 2.875%, 11/15/46 | 567,008 | ||||||
| 135,000 | U.S. Treasury Bond, 3.000%, 5/15/45 | 139,008 | ||||||
| 3,085,000 | U.S. Treasury Bond, 3.000%, 2/15/47 | 3,173,332 | ||||||
| 1,500,000 | U.S. Treasury Note, 1.125%, 7/31/21 | 1,463,496 | ||||||
| 6,380,000 | U.S. Treasury Note, 1.250%, 6/30/19 | 6,357,570 | ||||||
| 1,500,000 | U.S. Treasury Note, 1.375%, 4/30/21 | 1,481,016 | ||||||
| 1,540,000 | U.S. Treasury Note, 1.750%, 6/30/22 | 1,528,751 | ||||||
| 7,350,000 | U.S. Treasury Note, 1.875%, 4/30/22 | 7,343,396 | ||||||
| 8,800,000 | U.S. Treasury Note, 2.000%, 12/31/21 | 8,854,656 | ||||||
| 10,308,000 | U.S. Treasury Note, 2.250%, 8/15/27 | 10,237,938 | ||||||
| 8,110,000 | United States Treasury Inflation | |||||||
| Indexed Bonds, 0.375%, 7/15/27 | 8,038,156 | |||||||
| Total U.S. Treasury Obligations | $ | 52,300,153 | ||||||
| Corporate Bonds — 35.9% | ||||||||
| Financials — 8.4% | ||||||||
| 38,000 | Ally Financial, Inc., 5.750%, 11/20/25† | 41,200 | ||||||
| 290,000 | Ally Financial, Inc., 8.000%, 11/1/31 | 374,100 | ||||||
| 550,000 | Bank of America Corp. MTN, | |||||||
| 4.000%, 1/22/25 | 569,135 | |||||||
| 535,000 | Bank of Nova Scotia (The) (Canada), | |||||||
| (3M LIBOR +0.620%), | ||||||||
| 1.944%, 9/19/22(A) | 535,736 | |||||||
| 370,000 | Barclays PLC (United Kingdom), | |||||||
| 3.250%, 1/12/21 | 376,671 | |||||||
| 384,000 | Branch Banking & Trust Co., | |||||||
| 3.625%, 9/16/25 | 399,425 | |||||||
| 575,000 | Capital One NA, 1.650%, 2/5/18 | 574,789 | ||||||
| 335,000 | Chubb INA Holdings, Inc., | |||||||
| 4.350%, 11/3/45 | 368,138 | |||||||
| 294,000 | Cincinnati Financial Corp., | |||||||
| 6.125%, 11/1/34 | 360,326 | |||||||
| 660,000 | Citigroup, Inc., (3M LIBOR +1.430%), | |||||||
| 2.746%, 9/1/23(A) | 676,878 | |||||||
| 250,000 | Citigroup, Inc., 3.300%, 4/27/25 | 251,877 | ||||||
| 152,000 | Citigroup, Inc., 4.750%, 5/18/46 | 165,465 | ||||||
| 58,000 | Citigroup, Inc., 6.125%(B) | 62,060 | ||||||
| 250,000 | Credit Suisse Group Funding | |||||||
| Guernsey Ltd. (Guernsey), | ||||||||
| 2.750%, 3/26/20 | 252,602 | |||||||
| 18,000 | CyrusOne LP / CyrusOne Finance | |||||||
| Corp., 144a, 5.000%, 3/15/24 | 18,945 | |||||||
| 6,000 | CyrusOne LP / CyrusOne Finance | |||||||
| Corp., 144a, 5.375%, 3/15/27 | 6,435 | |||||||
| 13,000 | Dana Financing Luxembourg Sarl | |||||||
| (Luxembourg), 144a, | ||||||||
| 5.750%, 4/15/25 | 13,707 | |||||||
| 380,000 | Fifth Third Bancorp, 2.875%, 7/27/20 | 387,215 | ||||||
| 19,000 | FirstCash, Inc., 144a, 5.375%, 6/1/24 | 19,808 | ||||||
| 232,000 | GE Capital International Funding Co. | |||||||
| Unlimited Co. (Ireland), | ||||||||
| 4.418%, 11/15/35 | 252,276 | |||||||
| 495,000 | General Motors Financial Co., Inc., | |||||||
| 3.200%, 7/13/20 | 506,932 | |||||||
| 400,000 | Goldman Sachs Group, Inc. (The), | |||||||
| 3.691%, 6/5/28 | 403,113 | |||||||
| 155,000 | Goldman Sachs Group, Inc. (The), | |||||||
| 5.250%, 7/27/21 | 170,316 | |||||||
| 55,000 | Goldman Sachs Group, Inc. (The), (3M | |||||||
| LIBOR +3.922%), 5.375%(A)(B) | 56,986 | |||||||
| 450,000 | HSBC Holdings PLC (United Kingdom), | |||||||
| 3.900%, 5/25/26 | 470,965 | |||||||
| 420,000 | Huntington National Bank (The), | |||||||
| 2.200%, 11/6/18 | 421,335 | |||||||
| 145,000 | JPMorgan Chase & Co., | |||||||
| 3.250%, 9/23/22 | 149,904 | |||||||
| 630,000 | JPMorgan Chase & Co., 5.150%(B) | 653,625 | ||||||
| 265,000 | JPMorgan Chase & Co., | |||||||
| 6.000%, 1/15/18 | 268,373 | |||||||
| 355,000 | Morgan Stanley, 3.950%, 4/23/27 | 361,134 | ||||||
| 51,000 | OneMain Financial Holdings LLC, | |||||||
| 144a, 7.250%, 12/15/21 | 53,231 | |||||||
| 250,000 | PNC Bank NA, 2.700%, 11/1/22 | 251,843 | ||||||
| 360,000 | Prudential Financial, Inc., | |||||||
| 5.625%, 6/15/43 | 392,400 | |||||||
| 28,000 | Quicken Loans, Inc., 144a, | |||||||
| 5.750%, 5/1/25 | 29,400 | |||||||
| 11,000 | Radian Group, Inc., 4.500%, 10/1/24 | 11,220 | ||||||
| 478,000 | State Street Corp., (3M LIBOR | |||||||
| +1.000%), 2.320%, 6/15/47(A) | 436,079 | |||||||
| 290,000 | Visa, Inc., 4.150%, 12/14/35 | 316,537 | ||||||
| 10,660,181 | ||||||||
| Energy — 4.6% | ||||||||
| 300,000 | Anadarko Petroleum Corp., | |||||||
| 5.550%, 3/15/26† | 335,052 | |||||||
| 308,000 | Boardwalk Pipelines LP, 5.950%, 6/1/26 | 344,537 | ||||||
| 230,000 | Canadian Natural Resources Ltd. | |||||||
| (Canada), 3.850%, 6/1/27 | 232,521 | |||||||
| 13,000 | Carrizo Oil & Gas, Inc., 8.250%, 7/15/25 | 14,121 | ||||||
| 398,000 | Cenovus Energy, Inc. (Canada), 144a, | |||||||
| 4.250%, 4/15/27 | 394,610 | |||||||
| 21,000 | Cheniere Energy Partners LP, 144a, | |||||||
| 5.250%, 10/1/25 | 21,473 | |||||||
| 336,000 | Concho Resources, Inc., | |||||||
| 3.750%, 10/1/27 | 337,495 | |||||||
| 21,000 | Continental Resources, Inc., | |||||||
| 4.500%, 4/15/23 | 21,053 | |||||||
| 16,000 | Delek Logistics Partners LP, 144a, | |||||||
| 6.750%, 5/15/25 | 16,120 | |||||||
| 270,000 | EOG Resources, Inc., 3.900%, 4/1/35 | 269,239 | ||||||
| 14,000 | Exterran Energy Solutions LP / EES | |||||||
| Finance Corp., 144a, 8.125%, 5/1/25 | 14,490 | |||||||
| 21,000 | Extraction Oil & Gas Holdings LLC / | |||||||
| Extraction Finance Corp., 144a, | ||||||||
| 7.875%, 7/15/21 | 22,155 | |||||||
| 5,000 | Extraction Oil & Gas, Inc., 144a, | |||||||
| 7.375%, 5/15/24 | 5,200 | |||||||
| 56 |
Touchstone Active Bond Fund (Continued)
| Principal | Market | |||||||
| Amount | Value | |||||||
| Corporate Bonds — 35.9% (Continued) | ||||||||
| Energy — (Continued) | ||||||||
| $ | 39,000 | Genesis Energy LP / Genesis Energy | ||||||
| Finance Corp., 6.000%, 5/15/23 | $ | 38,708 | ||||||
| 19,000 | Genesis Energy LP / Genesis Energy | |||||||
| Finance Corp., 6.750%, 8/1/22 | 19,428 | |||||||
| 46,000 | Gulfport Energy Corp., | |||||||
| 6.375%, 5/15/25 | 46,575 | |||||||
| 19,000 | Hilcorp Energy I LP / Hilcorp Finance | |||||||
| Co., 144a, 5.000%, 12/1/24 | 18,620 | |||||||
| 15,000 | Hilcorp Energy I LP / Hilcorp Finance | |||||||
| Co., 144a, 5.750%, 10/1/25 | 15,169 | |||||||
| 377,000 | Kinder Morgan Energy Partners LP, | |||||||
| 3.500%, 9/1/23 | 381,128 | |||||||
| 480,000 | Marathon Oil Corp., 3.850%, 6/1/25 | 476,654 | ||||||
| 392,000 | Midcontinent Express Pipeline LLC, | |||||||
| 144a, 6.700%, 9/15/19 | 419,930 | |||||||
| 8,000 | Murphy Oil USA, Inc., 5.625%, 5/1/27 | 8,600 | ||||||
| 215,000 | Nabors Industries, Inc., | |||||||
| 5.000%, 9/15/20 | 219,300 | |||||||
| 27,000 | PDC Energy, Inc., 6.125%, 9/15/24 | 28,215 | ||||||
| 14,000 | Peabody Securities Finance Corp., | |||||||
| 144a, 6.000%, 3/31/22 | 14,455 | |||||||
| 25,000 | Peabody Securities Finance Corp., | |||||||
| 144a, 6.375%, 3/31/25 | 25,688 | |||||||
| 285,000 | Petroleos Mexicanos (Mexico), | |||||||
| 4.500%, 1/23/26 | 284,516 | |||||||
| 27,000 | QEP Resources, Inc., 5.375%, 10/1/22 | 26,528 | ||||||
| 15,000 | Range Resources Corp., 144a, | |||||||
| 5.000%, 8/15/22 | 14,981 | |||||||
| 16,000 | Range Resources Corp., 144a, | |||||||
| 5.750%, 6/1/21 | 16,640 | |||||||
| 222,000 | Rockies Express Pipeline LLC, 144a, | |||||||
| 6.875%, 4/15/40 | 246,420 | |||||||
| 342,000 | Sabine Pass Liquefaction LLC, | |||||||
| 5.000%, 3/15/27 | 364,770 | |||||||
| 48,000 | SemGroup Corp. / Rose Rock Finance | |||||||
| Corp., 5.625%, 11/15/23 | 46,680 | |||||||
| 15,000 | SESI LLC, 7.125%, 12/15/21 | 15,300 | ||||||
| 27,000 | Shelf Drilling Holdings Ltd. (Cayman | |||||||
| Islands), 144a, 9.500%, 11/2/20 | 27,304 | |||||||
| 400,000 | Shell International Finance BV | |||||||
| (Netherlands), 1.875%, 5/10/21 | 397,152 | |||||||
| 24,000 | Southwestern Energy Co., | |||||||
| 6.700%, 1/23/25 | 24,360 | |||||||
| 16,000 | Southwestern Energy Co., | |||||||
| 7.500%, 4/1/26 | 16,640 | |||||||
| 31,000 | Tallgrass Energy Partners LP / Tallgrass | |||||||
| Energy Finance Corp., 144a, | ||||||||
| 5.500%, 9/15/24 | 31,852 | |||||||
| 6,000 | Tallgrass Energy Partners LP / Tallgrass | |||||||
| Energy Finance Corp., 144a, | ||||||||
| 5.500%, 1/15/28 | 6,098 | |||||||
| 52,250 | Transocean Phoenix 2 Ltd. (Cayman | |||||||
| Islands), 144a, 7.750%, 10/15/24 | 56,169 | |||||||
| 8,000 | Ultra Resources, Inc., 144a, | |||||||
| 6.875%, 4/15/22 | 8,160 | |||||||
| 14,000 | Ultra Resources, Inc., 144a, | |||||||
| 7.125%, 4/15/25 | 14,140 | |||||||
| 85,000 | Unit Corp., 6.625%, 5/15/21 | 85,212 | ||||||
| 436,000 | Williams Cos., Inc. (The), | |||||||
| 3.700%, 1/15/23 | 433,820 | |||||||
| 8,000 | Williams Cos., Inc. (The), | |||||||
| 5.750%, 6/24/44 | 8,460 | |||||||
| 6,000 | Williams Cos., Inc. (The), | |||||||
| 7.500%, 1/15/31 | 7,200 | |||||||
| 5,872,938 | ||||||||
| Consumer Discretionary — 4.3% | ||||||||
| 5,000 | 1011778 BC ULC / New Red Finance, | |||||||
| Inc. (Canada), 144a, 4.250%, 5/15/24 | 5,018 | |||||||
| 17,000 | 1011778 BC ULC / New Red Finance, | |||||||
| Inc. (Canada), 144a, | ||||||||
| 5.000%, 10/15/25 | 17,211 | |||||||
| 10,000 | 1011778 BC ULC / New Red Finance, | |||||||
| Inc. (Canada), 144a, | ||||||||
| 5.000%, 10/15/25 | 10,124 | |||||||
| 18,000 | ACCO Brands Corp., 144a, | |||||||
| 5.250%, 12/15/24 | 18,675 | |||||||
| 444,000 | Amazon.com, Inc., 144a, | |||||||
| 2.800%, 8/22/24 | 445,705 | |||||||
| 33,000 | AMC Entertainment Holdings, Inc., | |||||||
| 5.875%, 11/15/26 | 32,546 | |||||||
| 6,000 | American Builders & Contractors | |||||||
| Supply Co., Inc., 144a, | ||||||||
| 5.750%, 12/15/23 | 6,390 | |||||||
| 120,000 | Anheuser-Busch InBev Finance, Inc., | |||||||
| 2.650%, 2/1/21 | 121,949 | |||||||
| 306,000 | Anheuser-Busch InBev Finance, Inc., | |||||||
| 4.900%, 2/1/46 | 345,648 | |||||||
| 490,000 | AutoNation, Inc., 5.500%, 2/1/20 | 523,341 | ||||||
| 57,000 | Belo Corp., 7.250%, 9/15/27 | 64,125 | ||||||
| 11,000 | Brinker International, Inc., | |||||||
| 3.875%, 5/15/23 | 10,753 | |||||||
| 14,000 | Cable One, Inc., 144a, 5.750%, 6/15/22 | 14,630 | ||||||
| 70,000 | Cablevision Systems Corp., | |||||||
| 5.875%, 9/15/22 | 72,450 | |||||||
| 17,000 | CalAtlantic Group, Inc., | |||||||
| 5.875%, 11/15/24 | 18,572 | |||||||
| 205,000 | CBS Corp., 4.900%, 8/15/44 | 212,692 | ||||||
| 101,000 | CCO Holdings LLC / CCO Holdings | |||||||
| Capital Corp., 144a, 5.750%, 2/15/26 | 105,899 | |||||||
| 5,000 | Cedar Fair LP / Canada’s Wonderland | |||||||
| Co. / Magnum Management Corp. / | ||||||||
| Millennium Op, 144a, | ||||||||
| 5.375%, 4/15/27 | 5,250 | |||||||
| 16,000 | Century Communities, Inc., 144a, | |||||||
| 5.875%, 7/15/25 | 16,080 | |||||||
| 50,000 | Cimpress NV (Netherlands), 144a, | |||||||
| 7.000%, 4/1/22 | 51,813 | |||||||
| 5,000 | Cumberland Farms, Inc., 144a, | |||||||
| 6.750%, 5/1/25 | 5,314 | |||||||
| 57 |
Touchstone Active Bond Fund (Continued)
| Principal | Market | |||||||
| Amount | Value | |||||||
| Corporate Bonds — 35.9% (Continued) | ||||||||
| Consumer Discretionary — (Continued) | ||||||||
| $ | 436,000 | Delphi Automotive PLC (Jersey), | ||||||
| 3.150%, 11/19/20 | $ | 446,100 | ||||||
| 12,000 | Delphi Jersey Holdings PLC (Jersey), | |||||||
| 144a, 5.000%, 10/1/25 | 12,210 | |||||||
| 441,000 | Dollar General Corp., 3.875%, 4/15/27 | 458,345 | ||||||
| 15,000 | Dollar Tree, Inc., 5.750%, 3/1/23 | 15,825 | ||||||
| 156,000 | Ford Motor Co., 4.750%, 1/15/43 | 152,945 | ||||||
| 475,000 | Forest Laboratories LLC, 144a, | |||||||
| 5.000%, 12/15/21 | 519,128 | |||||||
| 10,000 | GLP Capital LP / GLP Financing II, Inc., | |||||||
| 5.375%, 11/1/23 | 10,950 | |||||||
| 58,000 | GLP Capital LP / GLP Financing II, Inc., | |||||||
| 5.375%, 4/15/26 | 63,292 | |||||||
| 12,000 | H&E Equipment Services, Inc., 144a, | |||||||
| 5.625%, 9/1/25 | 12,660 | |||||||
| 38,000 | Hanesbrands, Inc., 144a, | |||||||
| 4.625%, 5/15/24 | 39,568 | |||||||
| 220,000 | Home Depot, Inc. (The), | |||||||
| 5.950%, 4/1/41 | 289,898 | |||||||
| 33,000 | International Game Technology PLC | |||||||
| (United Kingdom), 144a, | ||||||||
| 6.250%, 2/15/22 | 36,482 | |||||||
| 12,000 | JC Penney Corp., Inc., 144a, | |||||||
| 5.875%, 7/1/23 | 12,120 | |||||||
| 316,000 | Lear Corp., 3.800%, 9/15/27 | 314,800 | ||||||
| 42,000 | Lennar Corp., 4.750%, 5/30/25 | 43,890 | ||||||
| 12,000 | Lennar Corp., 4.875%, 12/15/23 | 12,690 | ||||||
| 16,000 | Live Nation Entertainment, Inc., 144a, | |||||||
| 4.875%, 11/1/24 | 16,560 | |||||||
| 33,000 | LSC Communications, Inc., 144a, | |||||||
| 8.750%, 10/15/23 | 33,990 | |||||||
| 29,000 | M/I Homes, Inc., 6.750%, 1/15/21 | 30,269 | ||||||
| 5,000 | M/I Homes, Inc., 144a, 5.625%, 8/1/25 | 5,106 | ||||||
| 37,000 | MDC Partners, Inc. (Canada), 144a, | |||||||
| 6.500%, 5/1/24 | 37,278 | |||||||
| 30,000 | NCL Corp. Ltd. (Bermuda), 144a, | |||||||
| 4.750%, 12/15/21 | 31,125 | |||||||
| 12,000 | New Home Co., Inc. (The), | |||||||
| 7.250%, 4/1/22 | 12,390 | |||||||
| 9,000 | Penske Automotive Group, Inc., | |||||||
| 3.750%, 8/15/20 | 9,180 | |||||||
| 7,000 | Performance Food Group, Inc., 144a, | |||||||
| 5.500%, 6/1/24 | 7,228 | |||||||
| 19,000 | PulteGroup, Inc., 5.500%, 3/1/26 | 20,718 | ||||||
| 31,000 | Quad/Graphics, Inc., 7.000%, 5/1/22 | 31,775 | ||||||
| 20,000 | Sabre GLBL, Inc., 144a, | |||||||
| 5.250%, 11/15/23 | 20,550 | |||||||
| 21,000 | Scotts Miracle-Gro Co. (The), | |||||||
| 5.250%, 12/15/26 | 22,155 | |||||||
| 46,000 | ServiceMaster Co. LLC (The), 144a, | |||||||
| 5.125%, 11/15/24 | 47,265 | |||||||
| 7,000 | Sirius XM Radio, Inc., 144a, | |||||||
| 5.375%, 4/15/25 | 7,385 | |||||||
| 17,000 | Sirius XM Radio, Inc., 144a, | |||||||
| 5.375%, 7/15/26 | 17,892 | |||||||
| 7,000 | Sonic Automotive, Inc., | |||||||
| 5.000%, 5/15/23 | 6,842 | |||||||
| 13,000 | Sonic Automotive, Inc., | |||||||
| 6.125%, 3/15/27 | 13,325 | |||||||
| 41,000 | Staples, Inc., 144a, 8.500%, 9/15/25 | 39,873 | ||||||
| 8,000 | Suburban Propane Partners | |||||||
| LP/Suburban Energy Finance Corp., | ||||||||
| 5.875%, 3/1/27 | 7,920 | |||||||
| 12,000 | Tempur Sealy International, Inc., | |||||||
| 5.625%, 10/15/23 | 12,615 | |||||||
| 26,000 | Tenneco, Inc., 5.000%, 7/15/26 | 26,650 | ||||||
| 333,000 | Time Warner, Inc., 3.800%, 2/15/27 | 333,077 | ||||||
| 42,000 | Toll Brothers Finance Corp., | |||||||
| 4.875%, 11/15/25 | 43,743 | |||||||
| 17,000 | United Rentals North America, Inc., | |||||||
| 4.625%, 7/15/23 | 17,744 | |||||||
| 9,000 | United Rentals North America, Inc., | |||||||
| 4.625%, 10/15/25 | 9,112 | |||||||
| 8,000 | United Rentals North America, Inc., | |||||||
| 5.875%, 9/15/26 | 8,690 | |||||||
| 16,000 | Wabash National Corp., 144a, | |||||||
| 5.500%, 10/1/25 | 16,300 | |||||||
| 10,000 | William Lyon Homes, Inc., | |||||||
| 5.875%, 1/31/25 | 10,250 | |||||||
| 65,000 | ZF North America Capital, Inc., 144a, | |||||||
| 4.500%, 4/29/22 | 68,331 | |||||||
| 5,510,426 | ||||||||
| Health Care — 3.5% | ||||||||
| 395,000 | Abbott Laboratories, | |||||||
| 3.750%, 11/30/26 | 405,310 | |||||||
| 342,000 | AbbVie, Inc., 4.450%, 5/14/46 | 359,984 | ||||||
| 77,000 | Acadia Healthcare Co., Inc., | |||||||
| 6.500%, 3/1/24 | 82,679 | |||||||
| 195,000 | Allergan Funding SCS (Luxembourg), | |||||||
| 3.800%, 3/15/25 | 202,509 | |||||||
| 380,000 | Catholic Health Initiatives, | |||||||
| 4.200%, 8/1/23 | 395,535 | |||||||
| 272,000 | Celgene Corp., 5.000%, 8/15/45 | 307,490 | ||||||
| 12,000 | Centene Corp., 4.750%, 1/15/25 | 12,450 | ||||||
| 28,000 | CHS/Community Health Systems, Inc., | |||||||
| 6.250%, 3/31/23 | 27,510 | |||||||
| 28,000 | Envision Healthcare Corp., | |||||||
| 5.625%, 7/15/22 | 29,190 | |||||||
| 24,000 | Envision Healthcare Corp., 144a, | |||||||
| 6.250%, 12/1/24 | 25,740 | |||||||
| 336,000 | Express Scripts Holding Co., | |||||||
| 3.300%, 2/25/21 | 345,584 | |||||||
| 54,000 | HCA, Inc., 5.375%, 2/1/25 | 56,902 | ||||||
| 52,000 | HCA, Inc., 5.875%, 5/1/23 | 56,550 | ||||||
| 47,000 | HealthSouth Corp., 5.750%, 11/1/24 | 48,234 | ||||||
| 7,000 | Mallinckrodt International Finance SA | |||||||
| (Luxembourg), 4.750%, 4/15/23 | 5,968 | |||||||
| 58 |
Touchstone Active Bond Fund (Continued)
| Principal | Market | |||||||
| Amount | Value | |||||||
| Corporate Bonds — 35.9% (Continued) | ||||||||
| Health Care — (Continued) | ||||||||
| $ | 53,000 | Mallinckrodt International Finance SA | ||||||
| / Mallinckrodt CB LLC | ||||||||
| (Luxembourg), 144a, | ||||||||
| 5.500%, 4/15/25 | $ | 47,832 | ||||||
| 320,000 | Medtronic Global Holdings SCA | |||||||
| (Luxembourg), 3.350%, 4/1/27 | 328,922 | |||||||
| 180,000 | Mylan NV (Netherlands), | |||||||
| 3.000%, 12/15/18 | 182,032 | |||||||
| 300,000 | Ochsner Clinic Foundation, | |||||||
| 5.897%, 5/15/45 | 375,731 | |||||||
| 47,000 | Select Medical Corp., 6.375%, 6/1/21 | 48,410 | ||||||
| 426,000 | Shire Acquisitions Investments Ireland | |||||||
| DAC (Ireland), 2.400%, 9/23/21 | 424,511 | |||||||
| 8,000 | Teleflex, Inc., 4.875%, 6/1/26 | 8,300 | ||||||
| 6,000 | Tenet Healthcare Corp., | |||||||
| 4.750%, 6/1/20 | 6,196 | |||||||
| 15,000 | Tenet Healthcare Corp., 144a, | |||||||
| 7.500%, 1/1/22 | 15,881 | |||||||
| 378,000 | Teva Pharmaceutical Finance | |||||||
| Netherlands III BV (Netherlands), | ||||||||
| 3.150%, 10/1/26† | 348,401 | |||||||
| 28,000 | Universal Hospital Services, Inc., | |||||||
| 7.625%, 8/15/20 | 28,350 | |||||||
| 190,000 | Zimmer Biomet Holdings, Inc., | |||||||
| 3.150%, 4/1/22 | 193,450 | |||||||
| 110,000 | Zimmer Biomet Holdings, Inc., | |||||||
| 3.375%, 11/30/21 | 112,708 | |||||||
| 4,482,359 | ||||||||
| Information Technology — 2.8% | ||||||||
| 429,000 | Activision Blizzard, Inc., 144a, | |||||||
| 6.125%, 9/15/23 | 460,103 | |||||||
| 313,000 | Apple, Inc., 4.650%, 2/23/46 | 354,627 | ||||||
| 17,000 | CDW LLC / CDW Finance Corp., | |||||||
| 5.000%, 9/1/23 | 17,792 | |||||||
| 38,000 | CDW LLC / CDW Finance Corp., | |||||||
| 5.500%, 12/1/24 | 42,323 | |||||||
| 395,000 | Dell International LLC / EMC Corp., | |||||||
| 144a, 6.020%, 6/15/26 | 438,667 | |||||||
| 87,000 | Dell International LLC / EMC Corp., | |||||||
| 144a, 7.125%, 6/15/24 | 96,120 | |||||||
| 54,000 | Diebold Nixdorf, Inc., 8.500%, 4/15/24 | 58,537 | ||||||
| 10,000 | EMC Corp., 3.375%, 6/1/23 | 9,633 | ||||||
| 7,000 | First Data Corp., 144a, 7.000%, 12/1/23 | 7,475 | ||||||
| 982,000 | Hewlett Packard Enterprise Co., 144a, | |||||||
| 2.100%, 10/4/19 | 982,333 | |||||||
| 5,000 | j2 Cloud Services LLC / j2 Global | |||||||
| Co-Obligor, Inc., 144a, | ||||||||
| 6.000%, 7/15/25 | 5,231 | |||||||
| 190,000 | Microsoft Corp., 3.500%, 2/12/35 | �� | 193,398 | |||||
| 88,000 | NCR Corp., 5.875%, 12/15/21 | 90,926 | ||||||
| 20,000 | Open Text Corp. (Canada), 144a, | |||||||
| 5.875%, 6/1/26 | 21,950 | |||||||
| 338,000 | Oracle Corp., 2.650%, 7/15/26 | 332,007 | ||||||
| 425,000 | QUALCOMM, Inc., 3.450%, 5/20/25 | 438,471 | ||||||
| 11,000 | Quintiles IMS, Inc., 144a, | |||||||
| 4.875%, 5/15/23 | 11,440 | |||||||
| 31,000 | Sensata Technologies BV | |||||||
| (Netherlands), 144a, | ||||||||
| 5.000%, 10/1/25 | 32,676 | |||||||
| 3,593,709 | ||||||||
| Telecommunication Services — 2.8% | ||||||||
| 59,000 | Altice Financing SA (Luxemburg), | |||||||
| 144a, 6.625%, 2/15/23 | 62,540 | |||||||
| 6,000 | AMC Networks, Inc., 4.750%, 8/1/25 | 6,060 | ||||||
| 23,000 | AMC Networks, Inc., 5.000%, 4/1/24 | 23,748 | ||||||
| 225,000 | AT&T, Inc., 3.900%, 3/11/24 | 233,046 | ||||||
| 316,000 | AT&T, Inc., 3.900%, 8/14/27 | 316,615 | ||||||
| 90,000 | AT&T, Inc., 4.350%, 6/15/45 | 82,604 | ||||||
| 360,000 | AT&T, Inc., 4.500%, 5/15/35 | 355,423 | ||||||
| 7,000 | Block Communications, Inc., 144a, | |||||||
| 6.875%, 2/15/25 | 7,597 | |||||||
| 13,000 | CenturyLink, Inc., 5.625%, 4/1/25 | 12,448 | ||||||
| 34,000 | CenturyLink, Inc., 5.800%, 3/15/22 | 33,888 | ||||||
| 2,000 | CenturyLink, Inc., 6.450%, 6/15/21 | 2,081 | ||||||
| 13,000 | CenturyLink, Inc., 6.875%, 1/15/28 | 12,560 | ||||||
| 264,000 | Charter Communications Operating | |||||||
| LLC / Charter Communications | ||||||||
| Operating Capital, | ||||||||
| 6.484%, 10/23/45 | 309,851 | |||||||
| 372,000 | Comcast Corp., 2.850%, 1/15/23 | 377,744 | ||||||
| 16,000 | CommScope Technologies LLC, 144a, | |||||||
| 5.000%, 3/15/27 | 16,040 | |||||||
| 4,000 | CommScope, Inc., 144a, | |||||||
| 5.500%, 6/15/24 | 4,185 | |||||||
| 34,000 | CSC Holdings LLC, 5.250%, 6/1/24 | 34,383 | ||||||
| 48,000 | DISH DBS Corp., 5.125%, 5/1/20 | 50,326 | ||||||
| 15,000 | EW Scripps Co. (The), 144a, | |||||||
| 5.125%, 5/15/25 | 15,300 | |||||||
| 90,000 | Frontier Communications Corp., | |||||||
| 6.250%, 9/15/21 | 73,998 | |||||||
| 10,000 | Frontier Communications Corp., | |||||||
| 10.500%, 9/15/22 | 8,675 | |||||||
| 33,000 | Gray Television, Inc., 144a, | |||||||
| 5.125%, 10/15/24 | 33,165 | |||||||
| 5,000 | LIN Television Corp., 5.875%, 11/15/22 | 5,212 | ||||||
| 31,000 | Nexstar Broadcasting, Inc., 144a, | |||||||
| 5.625%, 8/1/24 | 32,085 | |||||||
| 8,000 | Nokia OYJ (Finland), 3.375%, 6/12/22 | 8,070 | ||||||
| 8,000 | Nokia OYJ (Finland), 4.375%, 6/12/27 | 8,230 | ||||||
| 382,000 | Qwest Corp., 6.750%, 12/1/21 | 417,138 | ||||||
| 12,000 | Sinclair Television Group, Inc., 144a, | |||||||
| 5.625%, 8/1/24 | 12,315 | |||||||
| 117,000 | Sprint Communications, Inc., | |||||||
| 6.000%, 11/15/22 | 125,251 | |||||||
| 7,000 | Symantec Corp., 144a, | |||||||
| 5.000%, 4/15/25 | 7,319 | |||||||
| 5,000 | TEGNA, Inc., 144a, 5.500%, 9/15/24 | 5,262 | ||||||
| 59 |
Touchstone Active Bond Fund (Continued)
| Principal | Market | |||||||
| Amount | Value | |||||||
| Corporate Bonds — 35.9% (Continued) | ||||||||
| Telecommunication Services — (Continued) | ||||||||
| $ | 9,000 | Univision Communications, Inc., 144a, | ||||||
| 5.125%, 2/15/25 | $ | 9,079 | ||||||
| 4,000 | VeriSign, Inc., 4.750%, 7/15/27 | 4,120 | ||||||
| 425,000 | Verizon Communications, Inc., | |||||||
| 4.672%, 3/15/55 | 404,854 | |||||||
| 331,000 | Verizon Communications, Inc., | |||||||
| 5.012%, 4/15/49 | 338,419 | |||||||
| 16,000 | ViaSat, Inc., 144a, 5.625%, 9/15/25 | 16,101 | ||||||
| 40,000 | Videotron Ltd. / Videotron Ltee | |||||||
| (Canada), 144a, 5.125%, 4/15/27 | 41,588 | |||||||
| 22,000 | Zayo Group LLC / Zayo Capital, Inc., | |||||||
| 6.000%, 4/1/23 | 23,238 | |||||||
| 13,000 | Zayo Group LLC / Zayo Capital, Inc., | |||||||
| 144a, 5.750%, 1/15/27 | 13,780 | |||||||
| 3,544,338 | ||||||||
| Consumer Staples — 2.4% | ||||||||
| 29,000 | Albertsons Cos. LLC / Safeway, Inc. / | |||||||
| New Albertson’s Inc. / Albertson’s | ||||||||
| LLC, 5.750%, 3/15/25 | 25,520 | |||||||
| 22,000 | Avis Budget Car Rental LLC / Avis | |||||||
| Budget Finance, Inc., | ||||||||
| 5.500%, 4/1/23 | 22,495 | |||||||
| 13,000 | Avis Budget Car Rental LLC / Avis | |||||||
| Budget Finance, Inc., 144a, | ||||||||
| 5.125%, 6/1/22 | 13,179 | |||||||
| 13,000 | B&G Foods, Inc., 5.250%, 4/1/25 | 13,325 | ||||||
| 19,000 | Booz Allen Hamilton, Inc., 144a, | |||||||
| 5.125%, 5/1/25 | 19,190 | |||||||
| 26,000 | Cardtronics, Inc. / Cardtronics USA, | |||||||
| 144a, 5.500%, 5/1/25 | 26,598 | |||||||
| 15,000 | CDK Global, Inc., 144a, 4.875%, 6/1/27 | 15,413 | ||||||
| 17,000 | Centene Corp., 6.125%, 2/15/24 | 18,381 | ||||||
| 27,000 | Cott Holdings, Inc., 144a, | |||||||
| 5.500%, 4/1/25 | 28,148 | |||||||
| 260,000 | CVS Health Corp., 5.125%, 7/20/45 | 299,014 | ||||||
| 20,000 | First Quality Finance Co., Inc., 144a, | |||||||
| 5.000%, 7/1/25 | 20,625 | |||||||
| 13,000 | Hertz Corp. (The), 6.750%, 4/15/19 | 12,968 | ||||||
| 12,000 | Hertz Corp. (The), 144a, | |||||||
| 7.625%, 6/1/22 | 12,375 | |||||||
| 55,000 | IHS Markit Ltd. (Bermuda), 144a, | |||||||
| 5.000%, 11/1/22 | 59,262 | |||||||
| 575,000 | Imperial Brands Finance PLC (United | |||||||
| Kingdom), 144a, 4.250%, 7/21/25 | 606,499 | |||||||
| 16,000 | JBS USA LLC / JBS USA Finance, Inc., | |||||||
| 144a, 7.250%, 6/1/21 | 16,320 | |||||||
| 40,000 | KFC Holding Co./Pizza Hut Holdings | |||||||
| LLC/Taco Bell of America LLC, 144a, | ||||||||
| 5.000%, 6/1/24 | 42,150 | |||||||
| 265,000 | Kraft Heinz Foods Co., 6.875%, 1/26/39 | 340,450 | ||||||
| 170,000 | Kroger Co. (The), 5.000%, 4/15/42 | 170,663 | ||||||
| 364,000 | Mead Johnson Nutrition Co., | |||||||
| 4.125%, 11/15/25 | 392,986 | |||||||
| 351,000 | Moody’s Corp., 2.750%, 12/15/21 | 353,756 | ||||||
| 2,000 | Pilgrim’s Pride Corp., 144a, | |||||||
| 5.750%, 3/15/25 | 2,065 | |||||||
| 2,000 | Pilgrim’s Pride Corp., 144a, | |||||||
| 5.875%, 9/30/27 | 2,042 | |||||||
| 73,000 | Post Holdings, Inc., 144a, | |||||||
| 5.000%, 8/15/26 | 72,818 | |||||||
| 394,000 | Reynolds American, Inc., | |||||||
| 4.450%, 6/12/25 | 422,305 | |||||||
| 56,000 | Rite Aid Corp., 144a, 6.125%, 4/1/23 | 54,390 | ||||||
| 2,000 | Spectrum Brands, Inc., | |||||||
| 6.125%, 12/15/24 | 2,142 | |||||||
| 17,000 | Tenet Healthcare Corp., 144a, | |||||||
| 5.125%, 5/1/25 | 16,766 | |||||||
| 14,000 | TreeHouse Foods, Inc., 144a, | |||||||
| 6.000%, 2/15/24 | 14,962 | |||||||
| 11,000 | US Foods, Inc., 144a, 5.875%, 6/15/24 | 11,522 | ||||||
| 3,108,329 | ||||||||
| Utilities — 2.3% | ||||||||
| 78,000 | AES Corp., 4.875%, 5/15/23 | 80,340 | ||||||
| 874,000 | Alabama Power Capital Trust V, (3M | |||||||
| LIBOR +3.100%), 4.435%, 10/1/42(A) | 863,075 | |||||||
| 27,000 | Calpine Corp., 5.375%, 1/15/23† | 26,295 | ||||||
| 420,000 | Dominion Energy, Inc., | |||||||
| 2.000%, 8/15/21 | 413,045 | |||||||
| 8,000 | Dynegy, Inc., 5.875%, 6/1/23 | 7,960 | ||||||
| 21,000 | Dynegy, Inc., 7.375%, 11/1/22 | 21,866 | ||||||
| 384,000 | Fortis, Inc. (Canada), 3.055%, 10/4/26 | 370,597 | ||||||
| 17,000 | NGL Energy Partners LP / NGL Energy | |||||||
| Finance Corp., 6.875%, 10/15/21 | 17,000 | |||||||
| 65,000 | NGL Energy Partners LP / NGL Energy | |||||||
| Finance Corp., 7.500%, 11/1/23 | 64,675 | |||||||
| 200,000 | OmGrid Funding Ltd. (Cayman | |||||||
| Islands), 144a, 5.196%, 5/16/27 | 200,690 | |||||||
| 330,000 | Oncor Electric Delivery Co. LLC, 144a, | |||||||
| 3.800%, 9/30/47 | 332,343 | |||||||
| 372,000 | PacifiCorp, 5.750%, 4/1/37 | 469,336 | ||||||
| 2,867,222 | ||||||||
| Industrials — 2.1% | ||||||||
| 9,000 | Allegion PLC (Ireland), | |||||||
| 5.875%, 9/15/23 | 9,720 | |||||||
| 31,000 | Arconic, Inc., 5.125%, 10/1/24 | 32,987 | ||||||
| 190,000 | Burlington Northern Santa Fe LLC, | |||||||
| 5.750%, 5/1/40 | 242,017 | |||||||
| 48,000 | CNH Industrial NV (Netherlands), | |||||||
| 4.500%, 8/15/23 | 50,832 | |||||||
| 400,000 | FedEx Corp., 5.100%, 1/15/44 | 451,518 | ||||||
| 15,000 | JB Poindexter & Co., Inc., 144a, | |||||||
| 9.000%, 4/1/22 | 15,675 | |||||||
| 57,000 | KLX, Inc., 144a, 5.875%, 12/1/22 | 59,719 | ||||||
| 29,000 | Louisiana-Pacific Corp., | |||||||
| 4.875%, 9/15/24 | 29,880 | |||||||
| 280,000 | Martin Marietta Materials, Inc., (3M | |||||||
| LIBOR +0.650%), 1.965%, 5/22/20(A) | 281,132 | |||||||
| 60 |
Touchstone Active Bond Fund (Continued)
| Principal | Market | |||||||
| Amount | Value | |||||||
| Corporate Bonds — 35.9% (Continued) | ||||||||
| Industrials — (Continued) | ||||||||
| $ | 3,000 | Moog, Inc., 144a, 5.250%, 12/1/22 | $ | 3,128 | ||||
| 15,000 | Multi-Color Corp., 144a, | |||||||
| 4.875%, 11/1/25 | 15,164 | |||||||
| 20,000 | Orbital ATK, Inc., 5.250%, 10/1/21 | 20,700 | ||||||
| 5,000 | Owens-Brockway Glass Container, Inc., | |||||||
| 144a, 5.875%, 8/15/23 | 5,525 | |||||||
| 430,000 | Roper Technologies, Inc., | |||||||
| 3.000%, 12/15/20 | 438,711 | |||||||
| 334,000 | SBA Tower Trust, 144a, | |||||||
| 2.898%, 10/8/19 | 336,068 | |||||||
| 350,000 | Siemens Financieringsmaatschappij | |||||||
| NV (Netherlands), 144a, | ||||||||
| 3.125%, 3/16/24 | 357,601 | |||||||
| 25,000 | Standard Industries, Inc./NJ, 144a, | |||||||
| 6.000%, 10/15/25 | 27,274 | |||||||
| 10,000 | TransDigm, Inc., 5.500%, 10/15/20 | 10,150 | ||||||
| 16,000 | TriMas Corp., 144a, 4.875%, 10/15/25 | 16,130 | ||||||
| 15,000 | Triumph Group, Inc., 5.250%, 6/1/22 | 14,662 | ||||||
| 12,000 | Triumph Group, Inc., 144a, | |||||||
| 7.750%, 8/15/25 | 12,630 | |||||||
| 280,000 | Vulcan Materials Co., 4.500%, 4/1/25 | 298,763 | ||||||
| 2,729,986 | ||||||||
| Real Estate — 1.8% | ||||||||
| 258,000 | Care Capital Properties LP. REIT, | |||||||
| 5.125%, 8/15/26 | 264,652 | |||||||
| 7,000 | CoreCivic, Inc. REIT, 4.125%, 4/1/20 | 7,175 | ||||||
| 6,000 | CoreCivic, Inc. REIT, 4.625%, 5/1/23 | 6,135 | ||||||
| 15,000 | CoreCivic, Inc. REIT, 5.000%, 10/15/22 | 15,600 | ||||||
| 476,000 | Crown Castle International Corp., | |||||||
| 3.650%, 9/1/27 | 475,738 | |||||||
| 332,000 | Digital Realty Trust LP, 2.750%, 2/1/23 | 330,533 | ||||||
| 3,000 | DuPont Fabros Technology LP, REIT, | |||||||
| 5.625%, 6/15/23 | 3,194 | |||||||
| 14,000 | Equinix, Inc. REIT, 5.375%, 4/1/23 | 14,571 | ||||||
| 7,000 | Equinix, Inc. REIT, 5.375%, 5/15/27 | 7,604 | ||||||
| 39,000 | ESH Hospitality, Inc. REIT, 144a, | |||||||
| 5.250%, 5/1/25 | 40,316 | |||||||
| 7,000 | iStar, Inc., 4.625%, 9/15/20 | 7,158 | ||||||
| 113,000 | Mid-America Apartments LP REIT, | |||||||
| 3.750%, 6/15/24 | 116,499 | |||||||
| 12,000 | Realogy Group LLC / Realogy | |||||||
| Co.-Issuer Corp. REIT, 144a, | ||||||||
| 4.875%, 6/1/23 | 12,330 | |||||||
| 330,000 | Simon Property Group LP REIT, | |||||||
| 2.750%, 2/1/23 | 331,252 | |||||||
| 398,000 | Ventas Realty LP, 3.500%, 2/1/25 | 399,553 | ||||||
| 175,000 | Vornado Realty LP REIT, | |||||||
| 5.000%, 1/15/22 | 188,979 | |||||||
| 2,221,289 | ||||||||
| Materials — 0.9% | ||||||||
| 13,000 | AK Steel Corp., 7.625%, 10/1/21 | 13,520 | ||||||
| 11,000 | ArcelorMittal (Luxembourg), | |||||||
| 6.000%, 3/1/21 | 12,073 | |||||||
| 200,000 | Braskem America Finance Co., 144a, | |||||||
| 7.125%, 7/22/41 | 227,000 | |||||||
| 13,000 | CF Industries, Inc., 144a, | |||||||
| 4.500%, 12/1/26 | 13,602 | |||||||
| 7,000 | Commercial Metals Co., | |||||||
| 5.375%, 7/15/27 | 7,350 | |||||||
| 48,000 | CVR Partners LP / CVR Nitrogen | |||||||
| Finance Corp., 144a, | ||||||||
| 9.250%, 6/15/23 | 51,120 | |||||||
| 39,000 | Freeport-Mcmoran Copper & Gold, | |||||||
| Inc., 3.550%, 3/1/22 | 38,403 | |||||||
| 13,000 | Freeport-McMoRan, Inc., | |||||||
| 6.750%, 2/1/22 | 13,552 | |||||||
| 3,000 | Freeport-McMoRan, Inc., | |||||||
| 6.875%, 2/15/23 | 3,270 | |||||||
| 21,000 | Hudbay Minerals, Inc. (Canada), 144a, | |||||||
| 7.250%, 1/15/23 | 22,365 | |||||||
| 16,000 | Hudbay Minerals, Inc. (Canada), 144a, | |||||||
| 7.625%, 1/15/25 | 17,320 | |||||||
| 26,000 | Kinross Gold Corp. (Canada), 144a, | |||||||
| 4.500%, 7/15/27 | 26,228 | |||||||
| 10,000 | Kraton Polymers LLC / Kraton | |||||||
| Polymers Capital Corp., 144a, | ||||||||
| 7.000%, 4/15/25 | 10,725 | |||||||
| 22,000 | Lundin Mining Corp. (Canada), 144a, | |||||||
| 7.500%, 11/1/20 | 22,880 | |||||||
| 4,000 | NOVA Chemicals Corp. (Canada), 144a, | |||||||
| 4.875%, 6/1/24 | 4,050 | |||||||
| 27,000 | NOVA Chemicals Corp. (Canada), 144a, | |||||||
| 5.250%, 8/1/23 | 27,810 | |||||||
| 170,000 | Sherwin-Williams Co. (The), | |||||||
| 4.500%, 6/1/47 | 178,406 | |||||||
| 36,000 | Steel Dynamics, Inc., 144a, | |||||||
| 4.125%, 9/15/25 | 36,292 | |||||||
| 336,000 | Suzano Austria GmbH, 144a, | |||||||
| 5.750%, 7/14/26 | 360,965 | |||||||
| 14,000 | Teck Resources Ltd. (Canada), | |||||||
| 6.250%, 7/15/41 | 15,810 | |||||||
| 13,000 | Trinseo Materials Operating SCA / | |||||||
| Trinseo Materials Finance, Inc. | ||||||||
| (Luxembourg), 144a, | ||||||||
| 5.375%, 9/1/25 | 13,374 | |||||||
| 1,116,115 | ||||||||
| Total Corporate Bonds | $ | 45,706,892 | ||||||
| U.S. Government Mortgage-Backed | ||||||||
| Obligations — 9.3% | ||||||||
| 64,595 | FHLMC, Pool #1B3366, (12M LIBOR | |||||||
| +1.783%), 3.447%, 3/1/37(A) | 68,206 | |||||||
| 157,800 | FHLMC, Pool #1H1348, (1 Year CMT | |||||||
| Rate +2.140%), 3.080%, 10/1/36(A) | 166,311 | |||||||
| 391,135 | FHLMC, Pool #1Q0339, (12M LIBOR | |||||||
| +1.932%), 3.578%, 4/1/37(A) | 411,939 | |||||||
| 61 |
Touchstone Active Bond Fund (Continued)
| Principal | Market | |||||||
| Amount | Value | |||||||
| U.S. Government Mortgage-Backed | ||||||||
| Obligations — 9.3% (Continued) | ||||||||
| $ | 21,598 | FHLMC, Pool #A12886, 5.000%, 8/1/33 | $ | 23,840 | ||||
| 60,573 | FHLMC, Pool #A13842, 6.000%, 9/1/33 | 68,141 | ||||||
| 13,249 | FHLMC, Pool #A21415, 5.000%, 5/1/34 | 14,488 | ||||||
| 28,926 | FHLMC, Pool #A35682, 5.000%, 7/1/35 | 31,636 | ||||||
| 14,889 | FHLMC, Pool #A36523, 5.000%, 8/1/35 | 16,246 | ||||||
| 84,356 | FHLMC, Pool #A46590, 5.000%, 8/1/35 | 91,611 | ||||||
| 24,711 | FHLMC, Pool #A56988, 5.500%, 2/1/37 | 27,525 | ||||||
| 160,312 | FHLMC, Pool #A96485, 4.500%, 1/1/41 | 172,530 | ||||||
| 773,816 | FHLMC, Pool #A97897, 4.500%, 4/1/41 | 846,085 | ||||||
| 20,129 | FHLMC, Pool #C62740, 7.000%, 1/1/32 | 21,904 | ||||||
| 26,020 | FHLMC, Pool #C72254, 6.500%, 7/1/32 | 29,609 | ||||||
| 95,648 | FHLMC, Pool #C90986, 7.000%, 6/1/26 | 104,745 | ||||||
| 26,021 | FHLMC, Pool #G02184, 5.000%, 4/1/36 | 28,535 | ||||||
| 415,615 | FHLMC, Pool #G05733, | |||||||
| 5.000%, 11/1/39 | 459,747 | |||||||
| 244,682 | FHLMC, Pool #J13584, | |||||||
| 3.500%, 11/1/25 | 257,118 | |||||||
| 92,807 | FNMA, Pool #255628, 5.500%, 2/1/25 | 102,561 | ||||||
| 4,369 | FNMA, Pool #432269, 6.500%, 8/1/28 | 4,842 | ||||||
| 1 | FNMA, Pool #535290, 8.000%, 5/1/30 | 1 | ||||||
| 10,070 | FNMA, Pool #540040, 7.500%, 6/1/28 | 10,094 | ||||||
| 20,792 | FNMA, Pool #561741, 7.500%, 1/1/31 | 23,607 | ||||||
| 38,181 | FNMA, Pool #640291, 7.000%, 8/1/32 | 39,172 | ||||||
| 32,402 | FNMA, Pool #653301, 6.500%, 7/1/32 | 35,905 | ||||||
| 71,517 | FNMA, Pool #653502, 6.500%, 7/1/32 | 79,250 | ||||||
| 41,406 | FNMA, Pool #670402, 6.500%, 6/1/32 | 46,291 | ||||||
| 1,415 | FNMA, Pool #704460, 6.000%, 5/1/18 | 1,417 | ||||||
| 5,342 | FNMA, Pool #725906, (12M LIBOR | |||||||
| +1.617%), 3.367%, 8/1/34(A) | 5,624 | |||||||
| 238,228 | FNMA, Pool #745257, 6.000%, 1/1/36 | 270,855 | ||||||
| 1,875 | FNMA, Pool #745974, (12M LIBOR | |||||||
| +1.853%), 3.337%, 10/1/36(A) | 1,980 | |||||||
| 106,271 | FNMA, Pool #810049, 5.500%, 3/1/35 | 118,043 | ||||||
| 150,682 | FNMA, Pool #819297, 6.000%, 9/1/35 | 171,776 | ||||||
| 53,704 | FNMA, Pool #889060, 6.000%, 1/1/38 | 61,058 | ||||||
| 115,124 | FNMA, Pool #889061, 6.000%, 1/1/38 | 132,613 | ||||||
| 37,407 | FNMA, Pool #893003, 7.000%, 9/1/36 | 38,735 | ||||||
| 12,343 | FNMA, Pool #895657, 6.500%, 8/1/36 | 13,604 | ||||||
| 184,358 | FNMA, Pool #905049, 5.500%, 11/1/36 | 203,728 | ||||||
| 90,364 | FNMA, Pool #908944, 5.500%, 1/1/37 | 99,858 | ||||||
| 602,203 | FNMA, Pool #928553, 5.500%, 8/1/37 | 685,999 | ||||||
| 298,532 | FNMA, Pool #AA3467, 4.500%, 4/1/39 | 324,959 | ||||||
| 475,189 | FNMA, Pool #AA4584, 4.500%, 4/1/39 | 517,269 | ||||||
| 109,056 | FNMA, Pool #AB1800, 4.000%, 11/1/40 | 116,246 | ||||||
| 374,327 | FNMA, Pool #AB2452, 4.000%, 3/1/26 | 393,556 | ||||||
| 119,577 | FNMA, Pool #AD3775, 4.500%, 3/1/25 | 126,701 | ||||||
| 160,288 | FNMA, Pool #AD6193, 5.000%, 6/1/40 | 175,257 | ||||||
| 393,494 | FNMA, Pool #AE0996, 4.000%, 2/1/41 | 419,364 | ||||||
| 225,302 | FNMA, Pool #AE1568, 4.000%, 9/1/40 | 238,252 | ||||||
| 685,274 | FNMA, Pool #AE2497, 4.500%, 9/1/40 | 748,365 | ||||||
| 109,660 | FNMA, Pool #AE5441, 5.000%, 10/1/40 | 119,955 | ||||||
| 351,282 | FNMA, Pool #AH1135, 5.000%, 1/1/41 | 384,511 | ||||||
| 553,680 | FNMA, Pool #AH3483, 3.500%, 2/1/26 | 578,800 | ||||||
| 225,880 | FNMA, Pool #AH3671, 4.000%, 2/1/26 | 237,093 | ||||||
| 591,076 | FNMA, Pool #AH6622, 4.000%, 3/1/41 | 633,967 | ||||||
| 764,913 | FNMA, Pool #AL0150, 4.000%, 2/1/41 | 815,417 | ||||||
| 178,746 | FNMA, Pool #AL0211, 5.000%, 4/1/41 | 195,498 | ||||||
| 79,112 | FNMA, Pool #AS7813, 4.000%, 8/1/46 | 83,344 | ||||||
| 36,193 | GNMA, Pool #5305, 4.000%, 2/20/42 | 38,379 | ||||||
| 4,456,303 | GNMA, Ser 2016-113, Class IO, | |||||||
| 1.191%, 2/16/58(A)(C)(D) | 411,564 | |||||||
| 323,832 | GNMA, Ser 2017-120, Class UZ, | |||||||
| 4.000%, 8/20/47 | 315,558 | |||||||
| Total U.S. Government | ||||||||
| Mortgage-Backed Obligations | $ | 11,861,284 | ||||||
| Asset-Backed Securities — 3.9% | ||||||||
| 475,000 | Ascentium Equipment Receivables | |||||||
| Trust, Ser 2016-1A, Class B, 144a, | ||||||||
| 2.850%, 7/10/20 | 479,390 | |||||||
| 3,352 | CIT Home Equity Loan Trust, Ser | |||||||
| 2002-1, Class AF5, | ||||||||
| 7.210%, 2/25/33(E) | 3,457 | |||||||
| 369,018 | CWHEQ Home Equity Loan Trust, Ser | |||||||
| 2007-S1, Class A5, | ||||||||
| 6.018%, 11/25/36(A)(D) | 355,403 | |||||||
| 430,279 | Dell Equipment Finance Trust, Ser | |||||||
| 2015-1, Class C, 144a, | ||||||||
| 2.420%, 3/23/20 | 430,740 | |||||||
| 360,000 | Domino’s Pizza Master Issuer LLC, Ser | |||||||
| 2017-1A, Class A23, 144a, | ||||||||
| 4.118%, 7/25/47 | 364,414 | |||||||
| 346,482 | FFMLT Trust, Ser 2005-FFA, Class M3, | |||||||
| 6.017%, 3/25/25(E) | 357,320 | |||||||
| 195,844 | FHLMC Structured Pass Through | |||||||
| Securities, Ser T-20, Class A5, | ||||||||
| 6.821%, 12/25/29(E) | 231,293 | |||||||
| 41,643 | FNMA REMIC Trust, Ser 2001-W2, Class | |||||||
| AF6, 6.589%, 10/25/31(E) | 44,097 | |||||||
| 1,460,769 | Mid-State Capital Corp. Trust, Ser | |||||||
| 2005-1, Class M2, 7.079%, 1/15/40 | 1,596,267 | |||||||
| 394,059 | Orange Lake Timeshare Trust, Ser | |||||||
| 2016-A, Class A, 144a, | ||||||||
| 2.610%, 3/8/29 | 392,934 | |||||||
| 1,709 | RASC Trust, Ser 2001-KS3, Class AI6, | |||||||
| 5.960%, 9/25/31(A)(D) | 1,777 | |||||||
| 313,163 | Sonic Capital LLC, Ser 2016-1A, Class | |||||||
| A2, 144a, 4.472%, 5/20/46 | 315,633 | |||||||
| 366,656 | SpringCastle America Funding LLC, | |||||||
| Ser 2016-AA, Class A, 144a, | ||||||||
| 3.050%, 4/25/29 | 369,155 | |||||||
| Total Asset-Backed Securities | $ | 4,941,880 | ||||||
| Non-Agency Collateralized Mortgage | ||||||||
| Obligations — 2.8% | ||||||||
| 3,846 | Adjustable Rate Mortgage Trust, Ser | |||||||
| 2004-4, Class 3A1, | ||||||||
| 3.397%, 3/25/35(A)(D) | 3,772 | |||||||
| 233,033 | Alternative Loan Trust, Ser 2004-30CB, | |||||||
| Class 3A1, 5.000%, 2/25/20 | 229,060 | |||||||
| 14,765 | Alternative Loan Trust, Ser 2005-J3, | |||||||
| Class 3A1, 6.500%, 9/25/34 | 14,271 | |||||||
| 62 |
Touchstone Active Bond Fund (Continued)
| Principal | Market | |||||||
| Amount | Value | |||||||
| Non-Agency Collateralized Mortgage | ||||||||
| Obligations — 2.8% (Continued) | ||||||||
| $ | 42,366 | CSFB Mortgage-Backed Trust, Ser | ||||||
| 2004-7, Class 6A1, 5.250%, 10/25/19 | $ | 42,786 | ||||||
| 89,516 | JP Morgan Mortgage Trust, Ser | |||||||
| 2005-A1, Class 2A1, | ||||||||
| 3.306%, 2/25/35(A)(D) | 90,915 | |||||||
| 255,071 | JP Morgan Mortgage Trust, Ser | |||||||
| 2005-A2, Class 7CB1, | ||||||||
| 3.529%, 4/25/35(A)(D) | 258,058 | |||||||
| 56,318 | JP Morgan Mortgage Trust, Ser | |||||||
| 2006-A4, Class 2A2, | ||||||||
| 3.335%, 6/25/36(A)(D) | 50,973 | |||||||
| 34,385 | MASTR Alternative Loans Trust, Ser | |||||||
| 2004-7, Class 10A1, 6.000%, 6/25/34 | 34,683 | |||||||
| 202,021 | Residential Asset Securitization Trust, | |||||||
| Ser 2006-A1, Class 1A3, | ||||||||
| 6.000%, 4/25/36 | 154,585 | |||||||
| 338,108 | Sequoia Mortgage Trust, Ser 2013-1, | |||||||
| Class B1, 3.641%, 2/25/43(A)(D) | 347,749 | |||||||
| 396,432 | Sequoia Mortgage Trust, Ser 2013-1, | |||||||
| Class B2, 3.640%, 2/25/43(A)(D) | 405,277 | |||||||
| 586,891 | Sequoia Mortgage Trust, Ser 2013-10, | |||||||
| Class B2, 144a, 3.563%, 8/25/43(A)(D) | 578,572 | |||||||
| 929 | Structured Asset Securities Corp. | |||||||
| Mortgage Pass-Through | ||||||||
| Certificates, Ser 2004-21XS, Class | ||||||||
| 2A6B, 5.650%, 12/25/34(E) | 921 | |||||||
| 132,845 | Structured Asset Securities Corp. Trust, | |||||||
| Ser 2005-17, Class 5A1, | ||||||||
| 5.500%, 10/25/35 | 110,677 | |||||||
| 700,000 | Towd Point Mortgage Trust, Ser | |||||||
| 2015-3, Class A2, 144a, | ||||||||
| 4.000%, 3/25/54(A)(D) | 715,338 | |||||||
| 327,068 | Towd Point Mortgage Trust, Ser | |||||||
| 2016-2, Class A1, 144a, | ||||||||
| 3.000%, 8/25/55(A)(D) | 330,778 | |||||||
| 108,294 | Washington Mutual Alternative | |||||||
| Mortgage Pass-Through | ||||||||
| Certificates, Ser 2005-9, Class 2A4, | ||||||||
| 5.500%, 11/25/35 | 99,588 | |||||||
| 114,858 | Wells Fargo Mortgage Backed | |||||||
| Securities Trust, Ser 2003-G, Class | ||||||||
| A1, 3.365%, 6/25/33(A)(D) | 115,741 | |||||||
| Total Non-Agency Collateralized | ||||||||
| Mortgage Obligations | $ | 3,583,744 | ||||||
| Commercial Mortgage-Backed Securities — 1.7% | ||||||||
| 472,000 | 280 Park Avenue 2017-280P Mortgage | |||||||
| Trust, Ser 2017-280P, Class A, 144a, | ||||||||
| (1M LIBOR +0.880%), | ||||||||
| 2.116%, 9/15/34(A) | 472,146 | |||||||
| 595,000 | Cosmopolitan Hotel Trust, Ser | |||||||
| 2016-CSMO, Class A, 144a, (1M | ||||||||
| LIBOR +1.400%), | ||||||||
| 2.634%, 11/15/33(A) | 598,640 | |||||||
| 550,000 | Eleven Madison Trust Mortgage Trust, | |||||||
| Ser 2015-11MD, Class C, 144a, | ||||||||
| 3.673%, 9/10/35(A)(D) | 556,079 | |||||||
| 528,000 | J.P. Morgan Chase Commercial | |||||||
| Mortgage Securities Trust, Ser | ||||||||
| 2016-NINE, Class B, 144a, | ||||||||
| 2.854%, 10/6/38(A)(D) | 507,537 | |||||||
| Total Commercial | ||||||||
| Mortgage-Backed Securities | $ | 2,134,402 | ||||||
| Sovereign Government Obligations — 1.2% | ||||||||
| 253,000 | Bermuda Government International | |||||||
| Bond, 144a, 3.717%, 1/25/27 | 256,163 | |||||||
| 350,000 | Mexico Government International | |||||||
| Bond, 4.350%, 1/15/47 | 340,375 | |||||||
| 432,000 | Portugal Government International | |||||||
| Bond, 144a, 5.125%, 10/15/24 | 458,417 | |||||||
| 470,000 | Province of Alberta Canada, 2.200%, | |||||||
| 7/26/22 | 467,729 | |||||||
| Total Sovereign Government | ||||||||
| Obligations | $ | 1,522,684 | ||||||
| Shares | ||||||||
| Preferred Stocks — 0.5% | ||||||||
| Utilities — 0.5% | ||||||||
| 1,773 | Entergy Arkansas, Inc., 4.875% | 44,343 | ||||||
| 7,620 | Entergy Louisiana LLC, 4.875% | 189,509 | ||||||
| 6,186 | Entergy Mississippi, Inc., 4.900% | 154,279 | ||||||
| 6,160 | Integrys Holding, Inc., 6.000% | 174,944 | ||||||
| Total Preferred Stocks | $ | 563,075 | ||||||
| Principal | ||||||||
| Amount | ||||||||
| Agency Collateralized Mortgage | ||||||||
| Obligations — 0.2% | ||||||||
| $ | 122,445 | FNMA REMIC, Ser 2015-51, Class KC, | ||||||
| 3.000%, 6/25/45 | 123,851 | |||||||
| 125,183 | FNMA Trust, Ser 2004-W15, Class 2AF, | |||||||
| (1M LIBOR +0.250%), | ||||||||
| 1.487%, 8/25/44(A) | 124,288 | |||||||
| Total Agency Collateralized | ||||||||
| Mortgage Obligations | $ | 248,139 | ||||||
| 63 |
Touchstone Active Bond Fund (Continued)
| Market | ||||||||
| Shares | Value | |||||||
| Short-Term Investment Funds — 3.3% | ||||||||
| 3,416,688 | Dreyfus Government Cash | |||||||
| Management, Institutional Shares, | ||||||||
| 0.92%¥W | $ | 3,416,688 | ||||||
| 766,137 | Invesco Government & Agency | |||||||
| Portfolio, Institutional Class, | ||||||||
| 0.93%**¥W | 766,137 | |||||||
| Total Short-Term Investment Funds | $ | 4,182,825 | ||||||
| Total Investment Securities —99.9% | ||||||||
| (Cost $125,061,695) | $ | 127,045,078 | ||||||
| Other Assets in | ||||||||
| Excess of Liabilities — 0.1% | 160,993 | |||||||
| Net Assets — 100.0% | $ | 127,206,071 | ||||||
| (A) | Variable rate security - Rate reflected is the rate in effect as of September 30, 2017. |
| (B) | Perpetual Bond - A bond with no definite maturity date. |
| (C) | Interest only security - This type of security represents the right to receive the monthly interest payments on an underlying pool of mortgages. Payments of principal on the pool reduce the value of the “interest only” holding. |
| (D) | Certain variable rate securities are not based on a published reference rate and spread but are determined by the issuer or agent and are based on current market conditions. These securities do not indicate a reference rate and spread in their description. |
| (E) | Step Bond - A bond that pays an initial interest rate for the first period and then a higher interest rate for the following periods until maturity. The interest rate shown reflects the rate in effect as of September 30, 2017. |
| ** | Represents collateral for securities loaned. |
| † | All or a portion of the security is on loan. The total market value of the securities on loan as of September 30, 2017 was $743,226. |
| ¥ | Open-End Fund. |
| W | Represents the 7-day SEC yield as of September 30, 2017. |
Portfolio Abbreviations:
DAC - Designated Activity Company
FHLMC - Federal Home Loan Mortgage Corporation
FNMA - Federal National Mortgage Association
GNMA - Government National Mortgage Association
LIBOR - London Inter Bank Offered Rate
LLC - Limited Liability Company
LP - Limited Partnership
MTN - Medium Term Note
PLC - Public Limited Company
REIT - Real Estate Investment Trust
REMIC - Real Estate Mortgage Investment Conduit
144a - This is a restricted security that was sold in a transaction qualifying for the exemption under Rule 144A of the Securities Act of 1933. This security may be sold in transactions exempt from registration, normally to qualified institutional buyers. At September 30, 2017, these securities were valued at $15,764,748 or 12.4% of net assets. These securities were deemed liquid pursuant to procedures approved by the Board of Trustees.
| 64 |
Touchstone Active Bond Fund (Continued)
Other Information:
The inputs or methodology used for valuing securities may not be an indication of the risk associated with investing in those securities. For more information on valuation inputs, and their aggregation into the levels used in the table below, please refer to the security valuation section in the accompanying Notes to Financial Statements.
| Valuation inputs at Reporting Date: | ||||||||||||||||
| Description | Level 1 | Level 2 | Level 3 | Total | ||||||||||||
| Assets: | ||||||||||||||||
| U.S. Treasury Obligations | $ | — | $ | 52,300,153 | $ | — | $ | 52,300,153 | ||||||||
| Corporate Bonds | — | 45,706,892 | — | 45,706,892 | ||||||||||||
| U.S. Government Mortgage-Backed Obligations | — | 11,861,284 | — | 11,861,284 | ||||||||||||
| Asset-Backed Securities | — | 4,941,880 | — | 4,941,880 | ||||||||||||
| Non-Agency Collateralized Mortgage Obligations | — | 3,583,744 | — | 3,583,744 | ||||||||||||
| Commercial Mortgage-Backed Securities | — | 2,134,402 | — | 2,134,402 | ||||||||||||
| Sovereign Government Obligations | — | 1,522,684 | — | 1,522,684 | ||||||||||||
| Preferred Stocks | 563,075 | — | — | 563,075 | ||||||||||||
| Agency Collateralized Mortgage Obligations | — | 248,139 | — | 248,139 | ||||||||||||
| Short-Term Investment Funds | 4,182,825 | — | — | 4,182,825 | ||||||||||||
| Total Assets | $ | 4,745,900 | $ | 122,299,178 | $ | — | $ | 127,045,078 | ||||||||
See accompanying Notes to Financial Statements.
| 65 |
Touchstone Arbitrage Fund – September 30, 2017
| Market | ||||||||
| Shares | Value | |||||||
| Common Stocks — 79.8% | ||||||||
| Financials — 27.7% | ||||||||
| Avista Healthcare Public Acquisition Corp. - Class A (Cayman Islands)*† | 223,494 | $ | 2,234,940 | |||||
| Avista Healthcare Public Acquisition Corp. (Cayman Islands)* | 682 | 7,052 | ||||||
| Boulevard Acquisition Corp. I* | 29,300 | 305,306 | ||||||
| Boulevard Acquisition Corp. II*† | 169,249 | 1,692,490 | ||||||
| Capitol Investment Corp. IV (Cayman Islands)* | 289,219 | 2,926,896 | ||||||
| Double Eagle Acquisition Corp. - Class A (Cayman Islands)* | 45,145 | 455,964 | ||||||
| Federal Street Acquisition Corp.* | 521,559 | 5,356,411 | ||||||
| Federal Street Acquisition Corp., - Class A* | 53,700 | 523,575 | ||||||
| Gores Holdings II, Inc.* | 107,940 | 1,129,052 | ||||||
| Gores Holdings II, Inc., Class A* | 330,850 | 3,298,574 | ||||||
| GTY Technology Holdings, Inc. (Cayman Islands)* | 11,286 | 118,052 | ||||||
| GTY Technology Holdings, Inc., Class A (Cayman Islands)* | 344,401 | 3,437,122 | ||||||
| Hennessy Capital Acquisition Corp. III* | 127,532 | 1,257,466 | ||||||
| Hennessy Capital Acquisition Corp. III* | 2,800 | 28,910 | ||||||
| Kayne Anderson Acquisition Corp., Class A* | 119,629 | 1,166,383 | ||||||
| Kayne Anderson Acquisition Corp., Class C* | 565,300 | 5,647,347 | ||||||
| Landcadia Holdings, Inc.* | 190,207 | 1,905,874 | ||||||
| Landcadia Holdings, Inc.* | 65,000 | 698,100 | ||||||
| Matlin and Partners Acquisition Corp.* | 349,105 | 3,543,416 | ||||||
| Matlin and Partners Acquisition Corp., Class A* | 146,098 | 1,418,612 | ||||||
| Pensare Acquisition Corp.* | 316,247 | 3,266,832 | ||||||
| Saban Capital Acquisition Corp. (Cayman Islands)* | 68,140 | 723,647 | ||||||
| Saban Capital Acquisition Corp., Class A (Cayman Island)* | 152,516 | 1,532,786 | ||||||
| Silver Run Acquisition Corp. II, Class A* | 507,315 | 5,164,467 | ||||||
| TPG Pace Energy Holdings Corp.* | 626,812 | 6,368,410 | ||||||
| TPG Pace Energy Holdings Corp., Class A* | 39,584 | 366,152 | ||||||
| TPG Pace Holdings Corp. (Cayman Islands)* | 552,984 | 5,695,735 | ||||||
| TPG Pace Holdings Corp., Class A (Cayman Islands)* | 82,000 | 779,000 | ||||||
| Vantage Energy Acquisition Corp., Class A*† | 222,177 | 2,172,891 | ||||||
| Vantage Energy Acquisition Corp., Class C* | 363,435 | 3,696,134 | ||||||
| 66,917,596 | ||||||||
| Health Care — 15.7% | ||||||||
| Akorn, Inc.*†† | 230,295 | 7,643,491 | ||||||
| Alere, Inc.*†† | 191,135 | 9,745,974 | ||||||
| CR Bard, Inc.†† | 23,170 | 7,425,985 | ||||||
| Humana, Inc. | 2,500 | 609,075 | ||||||
| Kite Pharma, Inc.* | 37,960 | 6,825,588 | ||||||
| NxStage Medical, Inc.*†† | 6,900 | 190,440 | ||||||
| PAREXEL International Corp.* | 44,579 | 3,926,518 | ||||||
| VWR Corp.* | 43,200 | 1,430,352 | ||||||
| 37,797,423 | ||||||||
| Information Technology — 9.8% | ||||||||
| Brocade Communications Systems, Inc.†† | 697,480 | 8,334,886 | ||||||
| Dell Technologies, Inc. - Class V* | 52,270 | 4,035,767 | ||||||
| Nets A/S, 144a* | 141,500 | 3,663,212 | ||||||
| NXP Semiconductors NV (Netherlands)* | 62,770 | 7,098,659 | ||||||
| Silver Spring Networks, Inc.* | 5,850 | 94,594 | ||||||
| VMware, Inc. - Class A* | 4,600 | 502,274 | ||||||
| 23,729,392 | ||||||||
| Consumer Discretionary — 8.9% | ||||||||
| Lennar Corp. - Class A | 31,500 | 1,663,200 | ||||||
| Lennar Corp. - Class B | 37,320 | 1,682,386 | ||||||
| Scripps Networks Interactive, Inc. - Class A | 40,600 | 3,487,134 | ||||||
| Time Warner, Inc.†† | 70,000 | 7,171,500 | ||||||
| Tribune Media Co., Class A†† | 183,460 | 7,496,176 | ||||||
| 21,500,396 | ||||||||
| Telecommunication Services — 5.2% | ||||||||
| Level 3 Communications, Inc.* | 147,860 | 7,879,459 | ||||||
| Straight Path Communications, Inc., Class B* | 25,857 | 4,671,584 | ||||||
| 12,551,043 | ||||||||
| Materials — 3.8% | ||||||||
| Calgon Carbon Corp. | 270,759 | 5,794,243 | ||||||
| Dominion Diamond Corp.† | 232,000 | 3,289,760 | ||||||
| 9,084,003 | ||||||||
| Energy — 2.9% | ||||||||
| Atwood Oceanics, Inc.*† | 747,900 | 7,022,781 | ||||||
| Industrials — 2.2% | ||||||||
| Orbital ATK, Inc. | 40,510 | 5,394,312 | ||||||
| Real Estate — 1.6% | ||||||||
| First Potomac Realty Trust | 192,584 | 2,145,386 | ||||||
| Forestar Group, Inc.* | 93,555 | 1,609,146 | ||||||
| 3,754,532 | ||||||||
| Utilities — 1.4% | ||||||||
| Calpine Corp.* | 232,000 | 3,422,000 | ||||||
| Consumer Staples — 0.6% | ||||||||
| Rite Aid Corp.* | 697,942 | 1,367,966 | ||||||
| Total Common Stocks | $ | 192,541,444 | ||||||
| 66 |
Touchstone Arbitrage Fund (Continued)
| Principal | Market | |||||||
| Amount | Value | |||||||
| Corporate Bonds — 12.5% | ||||||||
| Financials — 4.7% | ||||||||
| $ | 1,000,000 | Allstate Corp. (The), (3M LIBOR | ||||||
| +1.935%), 3.250%, 5/15/37(A) | $ | 985,000 | ||||||
| 1,800,000 | Banco Bilbao Vizcaya Argentaria SA | |||||||
| (Spain), 9.000%(B) | 1,863,000 | |||||||
| 1,000,000 | Barclays PLC (United Kingdom), | |||||||
| 8.250%(B) | 1,056,250 | |||||||
| 2,000,000 | Cloverie PLC for Zurich Insurance Co. | |||||||
| Ltd., EMTN, (Ireland), (USD 6 Year | ||||||||
| Swap Rate +6.840%), 8.250%(B) | 2,035,096 | |||||||
| 1,000,000 | Cooperatieve Rabobank UA | |||||||
| (Netherlands), 144a, 11.000%(B) | 1,130,000 | |||||||
| 500,000 | Corestates Capital III, 144a, (3M LIBOR | |||||||
| +0.570%), 1.885%, 2/15/27(A) | 473,750 | |||||||
| 500,000 | JPMorgan Chase Capital XIII, (3M | |||||||
| LIBOR +0.950%), 2.283%, 9/30/34(A) | 461,250 | |||||||
| 500,000 | JPMorgan Chase Capital XXIII, (3M | |||||||
| LIBOR +1.000%), 2.315%, 5/15/47(A) | 457,350 | |||||||
| 1,375,000 | Manufacturers & Traders Trust Co., (3M | |||||||
| LIBOR +0.640%), 1.956%, 12/1/21(A) | 1,360,828 | |||||||
| 375,000 | NB Capital Trust III, (3M LIBOR | |||||||
| +0.550%), 1.854%, 1/15/27(A) | 354,094 | |||||||
| 1,000,000 | Societe Generale SA, EMTN, (France), | |||||||
| 8.250%(B) | 1,057,400 | |||||||
| 11,234,018 | ||||||||
| Information Technology — 1.4% | ||||||||
| 2,325,000 | EMC Corp., 1.875%, 6/1/18 | 2,315,770 | ||||||
| 1,000,000 | QUALCOMM, Inc., (3M LIBOR | |||||||
| +0.360%), 1.676%, 5/20/19(A) | 1,003,844 | |||||||
| 3,319,614 | ||||||||
| Materials — 1.2% | ||||||||
| 1,000,000 | Monsanto Co., 1.850%, 11/15/18 | 998,545 | ||||||
| 1,000,000 | Silgan Holdings, Inc., 5.500%, 2/1/22 | 1,026,250 | ||||||
| 1,000,000 | Vulcan Materials Co., (3M LIBOR | |||||||
| +0.600%), 1.920%, 6/15/20(A) | 1,000,611 | |||||||
| 3,025,406 | ||||||||
| Consumer Staples — 1.2% | ||||||||
| 2,750,000 | Post Holdings, Inc., 144a, | |||||||
| 6.000%, 12/15/22 | 2,880,625 | |||||||
| Telecommunication Services — 1.1% | ||||||||
| 1,000,000 | Clearwire Communications LLC / | |||||||
| Clearwire Finance, Inc., 144a, | ||||||||
| 8.250%, 12/1/40 | 1,010,000 | |||||||
| 250,000 | Nexstar Broadcasting, Inc., 144a, | |||||||
| 6.125%, 2/15/22 | 260,625 | |||||||
| 1,250,000 | T-Mobile USA, Inc., 6.125%, 1/15/22 | 1,300,000 | ||||||
| 2,570,625 | ||||||||
| Consumer Discretionary — 1.0% | ||||||||
| 1,450,000 | Downstream Development Authority | |||||||
| of Quapaw Tribe of Oklahoma, | ||||||||
| 144a, 10.500%, 7/1/19 | 1,421,000 | |||||||
| 1,000,000 | LIN Television Corp., 5.875%, 11/15/22 | 1,042,500 | ||||||
| 2,463,500 | ||||||||
| Energy — 0.8% | ||||||||
| 557,000 | Rice Energy, Inc., 6.250%, 5/1/22 | 582,065 | ||||||
| 1,350,000 | Sunoco LP / Sunoco Finance Corp., | |||||||
| 6.250%, 4/15/21 | 1,414,597 | |||||||
| 1,996,662 | ||||||||
| Health Care — 0.6% | ||||||||
| 1,500,000 | CR Bard, Inc., 1.375%, 1/15/18 | 1,498,607 | ||||||
| Industrials — 0.5% | ||||||||
| 1,250,000 | Jabil, Inc., 8.250%, 3/15/18 | 1,280,562 | ||||||
| Total Corporate Bonds | $ | 30,269,619 | ||||||
| Shares | ||||||||
| Preferred Stock — 0.8% | ||||||||
| Utilities — 0.8% | ||||||||
| NextEra Energy Capital Holdings, Inc., | ||||||||
| 5.700% | 80,000 | 2,015,200 | ||||||
| Principal | ||||||||
| Amount | ||||||||
| Commercial Mortgage-Backed Security — 0.6% | ||||||||
| $ | 1,500,000 | CFCRE Mortgage Trust, Ser 2015-RUM, | ||||||
| Class C, 144a, (1M LIBOR +2.750%), | ||||||||
| 3.977%, 7/15/30(A) | 1,477,820 | |||||||
| Shares | ||||||||
| Warrants — 0.4% | ||||||||
| Financials — 0.4% | ||||||||
| Avista Healthcare Public, Class A | ||||||||
| (Cayman Islands), Exp 12/2/21, | ||||||||
| Price $5.75* | 344,500 | 137,800 | ||||||
| Constellation Alpha Capital Corp., | ||||||||
| Exp 3/23/24, Price $11.50* | 430,950 | 99,118 | ||||||
| Double Eagle Acquisition Corp., Class | ||||||||
| A (Cayman Islands), Exp 10/16/20, | ||||||||
| Price $11.50* | 179,021 | 123,524 | ||||||
| Gores Holdings II, Inc., Class A, | ||||||||
| Exp 3/6/22, Price $11.50* | 48,125 | 68,337 | ||||||
| GTY Technology Holdings, Inc., Class | ||||||||
| A (Cayman Islands), Exp 11/14/21, | ||||||||
| Price $11.50* | 55,488 | 64,921 | ||||||
| Saban Capital Acquisition Corp., Class | ||||||||
| A (Cayman Islands), Exp 9/21/21, | ||||||||
| Price $11.50* | 15,357 | 18,121 | ||||||
| 67 |
Touchstone Arbitrage Fund (Continued)
| Market | ||||||||
| Shares | Value | |||||||
| Warrants — 0.4% (Continued) | ||||||||
| Financials — (Continued) | ||||||||
| Silver Run Acquisition Corp. II, Class A, | ||||||||
| Exp 4/27/22, Price 11.50* | 234,522 | $ | 356,473 | |||||
| Total Warrants | $ | 868,294 | ||||||
| Exchange Traded Funds — 0.2% | ||||||||
| Consumer Discretionary Select Sector | ||||||||
| SPDR Fund | 363 | 32,699 | ||||||
| Financial Select Sector SPDR Fund | 2,499 | 64,624 | ||||||
| Health Care Select Sector SPDR Fund | 230 | 18,798 | ||||||
| Industrial Select Sector SPDR Fund | 615 | 43,665 | ||||||
| iShares US Telecommunications ETF† | 855 | 26,001 | ||||||
| Materials Select Sector SPDR Fund | 747 | 42,430 | ||||||
| Technology Select Sector SPDR Fund | 2,243 | 132,561 | ||||||
| Total Exchange Traded Funds | $ | 360,778 | ||||||
| Number | ||||||||||||
| of | Notional | |||||||||||
| Contracts | Amount | |||||||||||
| Purchased Options — 0.0% | ||||||||||||
| Purchased Call Options — 0.0% | ||||||||||||
| VMware, Inc., Strike @ 116.00, | ||||||||||||
| Exp 10/17†† | 265 | $ | 2,893,535 | 1,325 | ||||||||
| VMware, Inc., Strike @110.00, | ||||||||||||
| Exp 10/17†† | 265 | 2,893,535 | 33,920 | |||||||||
| 35,245 | ||||||||||||
| SPDR S&P 500 ETF Trust., | ||||||||||||
| Strike @250.00, Exp 10/17†† | 150 | 3,768,450 | 5,550 | |||||||||
| 5,550 | ||||||||||||
| Total Purchased Options | $ | 40,795 | ||||||||||
| Number | ||||||||
| of | ||||||||
| Rights | ||||||||
| Rights — 0.0% | ||||||||
| Media General, Inc. Exp 1/19/18, Strike | ||||||||
| Price $10.00(C) | 180,000 | $ | 18,000 | |||||
| Shares | ||||||||
| Short-Term Investment Funds — 15.9% | ||||||||
| Dreyfus Government Cash | ||||||||
| Management, Institutional Shares, | ||||||||
| 0.92%¥W | 30,286,359 | 30,286,359 | ||||||
| Invesco Government & Agency | ||||||||
| Portfolio, Institutional Class, | ||||||||
| 0.93%**¥W | 7,995,632 | 7,995,632 | ||||||
| Total Short-Term Investment Funds | $ | 38,281,991 | ||||||
| Market | ||||||||
| Shares | Value | |||||||
| Total Long Positions | ||||||||
| (Cost $266,961,717) | $ | 265,873,941 | ||||||
| Securities Sold Short — (15.2%) | ||||||||
| Common Stocks — (11.1%) | ||||||||
| Energy — (3.0%) | ||||||||
| Ensco PLC, Class A (United Kingdom) | (1,196,640 | ) | (7,143,941 | ) | ||||
| Information Technology — (2.6%) | ||||||||
| VMware, Inc. - Class A* | (56,870 | ) | (6,209,635 | ) | ||||
| Telecommunication Services — (2.6%) | ||||||||
| AT&T, Inc. | (56,000 | ) | (2,193,520 | ) | ||||
| CenturyLink, Inc. | (211,231 | ) | (3,992,266 | ) | ||||
| (6,185,786 | ) | |||||||
| Consumer Discretionary — (1.7%) | ||||||||
| Sinclair Broadcast Group, Inc., Class A | (42,195 | ) | (1,352,350 | ) | ||||
| Lennar Corp. - Class A | (54,520 | ) | (2,878,656 | ) | ||||
| (4,231,006 | ) | |||||||
| Health Care — (1.2%) | ||||||||
| Humana, Inc. | (2,500 | ) | (609,075 | ) | ||||
| Becton Dickinson and Co. | (11,763 | ) | (2,304,960 | ) | ||||
| (2,914,035 | ) | |||||||
| Total Common Stocks | $ | (26,684,403 | ) | |||||
| Exchange Traded Funds — (4.1%) | ||||||||
| Consumer Staples Select Sector SPDR | ||||||||
| Fund | (777 | ) | (41,942 | ) | ||||
| Energy Select Sector SPDR Fund | (3,103 | ) | (212,493 | ) | ||||
| Real Estate Select Sector SPDR Fund | (2,771 | ) | (89,337 | ) | ||||
| SPDR S&P 500 ETF Trust | (38,100 | ) | (9,571,863 | ) | ||||
| Utilities Select Sector SPDR Fund | (478 | ) | (25,358 | ) | ||||
| Total Exchange Traded Funds | $ | (9,940,993 | ) | |||||
| Total Securities Sold Short | ||||||||
| (Proceeds $34,592,393) | $ | (36,625,396 | ) | |||||
| Number | ||||||||||||
| of | Notional | |||||||||||
| Contracts | Amount | |||||||||||
| Written Options — (0.1%) | ||||||||||||
| Written Call Options — (0.1%) | ||||||||||||
| Calgon Carbon Corp., Strike | ||||||||||||
| @ 22.50, | ||||||||||||
| Exp 1/18 | (330 | ) | $ | (706,200 | ) | (4,950 | ) | |||||
| Lennar Corp., Strike @ 50.00, | ||||||||||||
| Exp 10/17 | (143 | ) | (755,040 | ) | (47,190 | ) | ||||||
| VMware, Inc., Strike @ | ||||||||||||
| 114.00, Exp 10/17 | (530 | ) | (5,787,070 | ) | (15,900 | ) | ||||||
| $ | (68,040 | ) | ||||||||||
| 68 |
Touchstone Arbitrage Fund (Continued)
| Number | ||||||||||||
| of | Notional | Market | ||||||||||
| Contracts | Amount | Value | ||||||||||
| Written Put Options — (0.0%) | ||||||||||||
| Lennar Corp., Strike @ 50.00, | ||||||||||||
| Exp 10/17 | (68 | ) | $ | (359,040 | ) | $ | (2,380 | ) | ||||
| SPDR S&P 500 ETF Trust., | ||||||||||||
| Strike @ 2,475.00, | ||||||||||||
| Exp 10/17 | (64 | ) | (16,123,904 | ) | (640 | ) | ||||||
| SPDR S&P 500 ETF Trust., | ||||||||||||
| Strike @ 2,485.00, | ||||||||||||
| Exp 10/17 | (300 | ) | (75,580,800 | ) | (6,300 | ) | ||||||
| VMware, Inc., Strike @ | ||||||||||||
| 108.00, Exp 10/17 | (104 | ) | (1,135,576 | ) | (5,720 | ) | ||||||
| $ | (15,040 | ) | ||||||||||
| Total Written Options | ||||||||||||
| (Premiums received $110,741) | $ | (83,080 | ) | |||||||||
| Total — 94.9% | $ | 229,165,465 | ||||||||||
| Cash Collateral for Securities | ||||||||||||
| Sold Short and Written Options — 9.8% | 23,584,940 | |||||||||||
| Liabilities in Excess of Other Assets — (4.7%) | (11,418,699 | ) | ||||||||||
| Net Assets — 100.0% | $ | 241,331,706 | ||||||||||
| (A) | Variable rate security - Rate reflected is the rate in effect as of September 30, 2017. |
| (B) | Perpetual Bond - A bond with no definite maturity date. |
| (C) | Level 3 - For more information on valuation inputs, and their aggregation into the levels used in the table below, please refer to the security valuation section in the accompanying Notes to Financial Statements. |
| * | Non-income producing security. |
| ** | Represents collateral for securities loaned. |
| † | All or a portion of the security is on loan. The total market value of the securities on loan as of September 30, 2017 was $7,865,394. |
| †† | All or a portion of these securities are pledged as collateral for securities sold short and written options. The total value of the securities pledged as collateral as of September 30, 2017 was $41,364,429. |
| ¥ | Open-End Fund. |
| W | Represents the 7-day SEC yield as of September 30, 2017. |
Portfolio Abbreviations:
DKK - Denmark Krone
ETF - Exchange Traded Fund
EMTN - Euro Medium Term Note
LIBOR - London Inter Bank Offered Rate
LLC - Limited Liability Company
PLC - Public Limited Company
SPDR - Standard & Poor’s Depositary Receipt
USD - United States Dollar
144a - This is a restricted security that was sold in a transaction qualifying for the exemption under Rule 144A of the Securities Act of 1933. This security may be sold in transactions exempt from registration, normally to qualified institutional buyers. At September 30, 2017, these securities were valued at $12,317,032 or 5.1% of net assets. These securities were deemed liquid pursuant to procedures approved by the Board of Trustees.
| 69 |
Touchstone Arbitrage Fund (Continued)
Other Information:
The inputs or methodology used for valuing securities may not be an indication of the risk associated with investing in those securities. For more information on valuation inputs, and their aggregation into the levels used in the table below, please refer to the security valuation section in the accompanying Notes to Financial Statements.
| Valuation inputs at Reporting Date: | ||||||||||||||||
| Description | Level 1 | Level 2 | Level 3 | Total | ||||||||||||
| Assets: | ||||||||||||||||
| Common Stocks | ||||||||||||||||
| Financials | $ | 66,917,596 | $ | — | $ | — | $ | 66,917,596 | ||||||||
| Health Care | 37,797,423 | — | — | 37,797,423 | ||||||||||||
| Information Technology | 23,729,392 | — | — | 23,729,392 | ||||||||||||
| Consumer Discretionary | 21,500,396 | — | — | 21,500,396 | ||||||||||||
| Telecommunication Services | 12,551,043 | — | — | 12,551,043 | ||||||||||||
| Materials | 9,084,003 | — | — | 9,084,003 | ||||||||||||
| Energy | 7,022,781 | — | — | 7,022,781 | ||||||||||||
| Industrials | 5,394,312 | — | — | 5,394,312 | ||||||||||||
| Real Estate | 2,145,386 | 1,609,146 | — | 3,754,532 | ||||||||||||
| Utilities | 3,422,000 | — | — | 3,422,000 | ||||||||||||
| Consumer Staples | 1,367,966 | — | — | 1,367,966 | ||||||||||||
| Corporate Bonds | — | 30,269,619 | — | 30,269,619 | ||||||||||||
| Commercial Mortgage-Backed Security | — | 1,477,820 | — | 1,477,820 | ||||||||||||
| Preferred Stock | 2,015,200 | — | — | 2,015,200 | ||||||||||||
| Warrants | 868,294 | — | — | 868,294 | ||||||||||||
| Exchange Traded Funds | 360,778 | — | — | 360,778 | ||||||||||||
| Purchased Options Equity Contracts | 40,795 | — | — | 40,795 | ||||||||||||
| Rights | — | — | 18,000 | 18,000 | ||||||||||||
| Short-Term Investment Funds | 38,281,991 | — | — | 38,281,991 | ||||||||||||
| Other Financial Instruments*** | ||||||||||||||||
| Forward Foreign Currency Contract | — | 18,521 | — | 18,521 | ||||||||||||
| Total Assets | $ | 232,499,356 | $ | 33,375,106 | $ | 18,000 | $ | 265,892,462 | ||||||||
| Liabilities: | ||||||||||||||||
| Securities Sold Short | ||||||||||||||||
| Common Stocks | $ | (26,684,403 | ) | $ | — | $ | — | $ | (26,684,403 | ) | ||||||
| Exchange Traded Funds | (9,940,993 | ) | — | — | (9,940,993 | ) | ||||||||||
| Other Financial Instruments*** | ||||||||||||||||
| Written Options Equity Contracts | (83,080 | ) | — | — | (83,080 | ) | ||||||||||
| Total Liabilities | $ | (36,708,476 | ) | $ | — | $ | — | $ | (36,708,476 | ) | ||||||
| Total | $ | 195,790,880 | $ | 33,375,106 | $ | 18,000 | $ | 229,183,986 | ||||||||
*** Other Financial Instruments are derivative instruments not reflected in total investments. Amounts shown represent market value for written option equity contracts and unrealized appreciation on forward foreign currency contracts.
| Measurements Using Unobservable Inputs (Level 3) | ||||
| Assets | Rights | |||
| Beginning balance September 30, 2016 | $ | — | ||
| Unrealized gain from corporate action | 372,600 | |||
| Realized gain from distributions received | (354,600 | ) | ||
| Ending balance September 30, 2017 | $ | 18,000 | ||
| Net Change in Unrealized Appreciation/Depreciation for Investments in Securities still held at September 30,2017 | $ | 18,000 | ||
| Valuation | Unobservable | |||||||
| Rights | Fair Value | Technique | Input | |||||
| Media General, Inc. Exp 1/19/18, Strike Price $10.00 | $ | 18,000 | Issuer Guidance | New Issuer | ||||
Forward Foreign Currency Contracts
| Contract to | Unrealized | |||||||||||||
| Counterparty | Expiration Date | Receive | Deliver | Appreciation | ||||||||||
| Brown Brothers Harriman | 12/27/2017 | USD | 3,747,292 | DKK | 23,347,500 | $ | 18,521 | |||||||
| $ | 18,521 | |||||||||||||
See accompanying Notes to Financial Statements.
| 70 |
Touchstone Emerging Markets Small Cap Fund – September 30, 2017
| Market | ||||||||
| Shares | Value | |||||||
| Common Stocks — 98.3% | ||||||||
| Taiwan — 14.0% | ||||||||
| Consumer Discretionary — 1.0% | ||||||||
| Basso Industry Corp. | 47,000 | $ | 131,341 | |||||
| Consumer Staples — 0.9% | ||||||||
| TCI Co. Ltd. | 20,000 | 126,232 | ||||||
| Industrials — 0.9% | ||||||||
| Sunny Friend Environmental Technology Co. Ltd. | 20,000 | 126,077 | ||||||
| Information Technology — 9.9% | ||||||||
| E Ink Holdings, Inc. | 142,000 | 199,707 | ||||||
| Elite Advanced Laser Corp. | 40,400 | 150,347 | ||||||
| Elite Material Co. Ltd. | 30,000 | 142,868 | ||||||
| Inventec Corp. | 247,000 | 182,878 | ||||||
| King Yuan Electronics Co. Ltd. | 185,000 | 181,860 | ||||||
| Micro-Star International Co. Ltd. | 62,000 | 133,732 | ||||||
| Powertech Technology, Inc. | 56,000 | 161,847 | ||||||
| Primax Electronics Ltd. | 81,000 | 200,917 | ||||||
| Materials — 1.3% | ||||||||
| China General Plastics Corp. | 171,289 | 170,733 | ||||||
| Total Taiwan | 1,908,539 | |||||||
| India — 13.3% | ||||||||
| Consumer Discretionary — 3.2% | ||||||||
| Ceat Ltd. | 5,885 | 154,746 | ||||||
| Exide Industries Ltd. | 55,118 | 174,094 | ||||||
| Videocon d2h Ltd. ADR* | 11,469 | 102,074 | ||||||
| Financials — 6.1% | ||||||||
| Capital First Ltd. | 10,945 | 123,171 | ||||||
| Edelweiss Financial Services Ltd. | 53,475 | 220,299 | ||||||
| Karnataka Bank Ltd. (The) | 64,676 | 140,422 | ||||||
| L&T Finance Holdings Ltd. | 65,169 | 195,029 | ||||||
| Reliance Capital Ltd. | 16,140 | 145,091 | ||||||
| Industrials — 2.5% | ||||||||
| Jain Irrigation Systems Ltd. | 106,628 | 154,768 | ||||||
| Voltas Ltd. | 24,346 | 188,852 | ||||||
| Utilities — 1.5% | ||||||||
| Indraprastha Gas Ltd. | 9,268 | 209,082 | ||||||
| Total India | 1,807,628 | |||||||
| Cayman Islands — 11.9% | ||||||||
| Consumer Discretionary — 6.0% | ||||||||
| Gourmet Master Co. Ltd. | 16,470 | 175,521 | ||||||
| Tarena International, Inc. ADR† | 10,390 | 151,174 | ||||||
| Tianneng Power International Ltd. | 184,000 | 190,649 | ||||||
| Xinyi Glass Holdings Ltd. | 194,000 | 192,278 | ||||||
| Xtep International Holdings Ltd. | 327,000 | 112,606 | ||||||
| Industrials — 3.1% | ||||||||
| Bizlink Holding, Inc. | 23,031 | 211,397 | ||||||
| Lonking Holdings Ltd. | 492,000 | 208,763 | ||||||
| Information Technology — 1.2% | ||||||||
| Tongda Group Holdings Ltd.† | 630,000 | 169,856 | ||||||
| Materials — 1.6% | ||||||||
| China Resources Cement Holdings Ltd. | 346,000 | 213,313 | ||||||
| Total Cayman Islands | 1,625,557 | |||||||
| South Korea — 11.7% | ||||||||
| Consumer Discretionary — 2.6% | ||||||||
| Innocean Worldwide, Inc. | 1,896 | 110,746 | ||||||
| Loen Entertainment, Inc. | 1,578 | 120,415 | ||||||
| Modetour Network, Inc. | 5,794 | 122,674 | ||||||
| Financials — 1.4% | ||||||||
| KIWOOM Securities Co. Ltd. | 3,004 | 190,415 | ||||||
| Health Care — 1.6% | ||||||||
| Value Added Technologies Co. Ltd. | 5,257 | 125,597 | ||||||
| Vieworks Co. Ltd. | 2,841 | 97,228 | ||||||
| Industrials — 1.2% | ||||||||
| Hyundai Engineering & Construction Co. Ltd. | 4,671 | 156,956 | ||||||
| Information Technology — 3.6% | ||||||||
| Douzone Bizon Co. Ltd. | 5,172 | 140,888 | ||||||
| Jusung Engineering Co. Ltd.* | 14,435 | 179,794 | ||||||
| Silicon Works Co. Ltd. | 4,539 | 175,578 | ||||||
| Materials — 1.3% | ||||||||
| Korea Petrochemical Ind Co. Ltd. | 797 | 173,108 | ||||||
| Total South Korea | 1,593,399 | |||||||
| Brazil — 8.4% | ||||||||
| Consumer Discretionary — 2.0% | ||||||||
| Magazine Luiza SA | 7,000 | 163,222 | ||||||
| Ser Educacional SA | 11,200 | 109,696 | ||||||
| Health Care — 3.7% | ||||||||
| Fleury SA | 19,700 | 183,244 | ||||||
| Hypermarcas SA | 14,400 | 145,903 | ||||||
| Qualicorp SA | 14,900 | 176,515 | ||||||
| Industrials — 1.3% | ||||||||
| Localiza Rent a Car SA | 9,655 | 176,324 | ||||||
| Real Estate — 1.4% | ||||||||
| Iguatemi Empresa de Shopping | ||||||||
| Centers SA | 15,000 | 185,182 | ||||||
| Total Brazil | 1,140,086 | |||||||
| 71 |
Touchstone Emerging Markets Small Cap Fund (Continued)
| Market | ||||||||
| Shares | Value | |||||||
| Common Stocks — 98.3% (Continued) | ||||||||
| Thailand — 5.4% | ||||||||
| Energy — 0.8% | ||||||||
| Star Petroleum Refining PCL | 197,400 | $ | 104,767 | |||||
| Financials — 2.2% | ||||||||
| Krungthai Card PCL | 41,200 | 139,598 | ||||||
| Muangthai Leasing PCL | 148,500 | 156,960 | ||||||
| Information Technology — 1.0% | ||||||||
| Hana Microelectronics PCL | 99,600 | 141,859 | ||||||
| Real Estate — 1.4% | ||||||||
| Sansiri PCL | 2,860,400 | 195,554 | ||||||
| Total Thailand | 738,738 | |||||||
| South Africa — 3.5% | ||||||||
| Consumer Staples — 2.1% | ||||||||
| AVI Ltd. | 17,083 | 123,529 | ||||||
| Clicks Group Ltd. | 13,678 | 159,655 | ||||||
| Materials — 1.4% | ||||||||
| Sappi Ltd. | 28,714 | 195,248 | ||||||
| Total South Africa | 478,432 | |||||||
| China — 3.5% | ||||||||
| Industrials — 2.3% | ||||||||
| Haitian International Holdings Ltd. | 45,000 | 129,327 | ||||||
| Zhejiang Expressway Co. Ltd. - Class H | 148,000 | 183,967 | ||||||
| Real Estate — 1.2% | ||||||||
| Guangzhou R&F Properties Co. Ltd. - Class H | 68,000 | 157,561 | ||||||
| Total China | 470,855 | |||||||
| Philippines — 3.3% | ||||||||
| Financials — 1.1% | ||||||||
| Metro Pacific Investments Corp. | 1,150,000 | 151,844 | ||||||
| Industrials — 2.2% | ||||||||
| Cebu Air, Inc. | 59,860 | 129,266 | ||||||
| International Container Terminal Services, Inc. | 79,200 | 162,495 | ||||||
| Total Philippines | 443,605 | |||||||
| United Kingdom — 2.9% | ||||||||
| Health Care — 1.4% | ||||||||
| NMC Health PLC | 5,071 | 186,934 | ||||||
| Materials — 1.5% | ||||||||
| Evraz PLC | 48,356 | 203,051 | ||||||
| Total United Kingdom | 389,985 | |||||||
| Indonesia — 2.7% | ||||||||
| Financials — 1.4% | ||||||||
| Bank Tabungan Negara Persero Tbk PT | 826,900 | $ | 193,664 | |||||
| Health Care — 0.6% | ||||||||
| Mitra Keluarga Karyasehat Tbk PT | 495,300 | 74,650 | ||||||
| Industrials — 0.7% | ||||||||
| Waskita Karya Persero Tbk PT | 726,800 | 95,781 | ||||||
| Total Indonesia | 364,095 | |||||||
| Malaysia — 2.6% | ||||||||
| Industrials — 2.6% | ||||||||
| AirAsia Bhd | 218,400 | 178,611 | ||||||
| Malaysia Airports Holdings Bhd | 87,200 | 175,536 | ||||||
| Total Malaysia | 354,147 | |||||||
| Mexico — 2.6% | ||||||||
| Consumer Discretionary — 1.0% | ||||||||
| Alsea SAB de CV | 37,500 | 138,344 | ||||||
| Industrials — 1.6% | ||||||||
| Grupo Aeroportuario del Centro | ||||||||
| Norte SAB de CV | 18,500 | 102,334 | ||||||
| Promotora y Operadora de | ||||||||
| Infraestructura SAB de CV | 10,335 | 109,116 | ||||||
| Total Mexico | 349,794 | |||||||
| Hong Kong — 2.4% | ||||||||
| Information Technology — 1.2% | ||||||||
| BYD Electronic International Co. Ltd. | 58,000 | 171,870 | ||||||
| Real Estate — 1.2% | ||||||||
| Shenzhen Investment Ltd. | 352,000 | 159,893 | ||||||
| Total Hong Kong | 331,763 | |||||||
| Hungary — 2.1% | ||||||||
| Health Care — 1.3% | ||||||||
| Richter Gedeon Nyrt | 7,337 | 182,317 | ||||||
| Telecommunication Services — 0.8% | ||||||||
| Magyar Telekom Telecommunications PLC | 58,755 | 106,937 | ||||||
| Total Hungary | 289,254 | |||||||
| Jersey — 1.6% | ||||||||
| Materials — 1.6% | ||||||||
| West China Cement Ltd.* | 1,294,000 | 211,141 | ||||||
| Singapore — 1.5% | ||||||||
| Real Estate — 1.5% | ||||||||
| Yanlord Land Group Ltd. | 150,600 | 205,737 | ||||||
| 72 |
Touchstone Emerging Markets Small Cap Fund (Continued)
| Market | ||||||||
| Shares | Value | |||||||
| Common Stocks — 98.3% (Continued) | ||||||||
| Greece — 1.4% | ||||||||
| Consumer Discretionary — 1.4% | ||||||||
| JUMBO SA | 11,694 | $ | 193,357 | |||||
| Luxembourg — 1.3% | ||||||||
| Materials — 1.3% | ||||||||
| Ternium SA ADR | 5,741 | 177,569 | ||||||
| Poland — 1.2% | ||||||||
| Financials — 1.2% | ||||||||
| KRUK SA | 2,009 | 161,562 | ||||||
| Turkey — 1.0% | ||||||||
| Consumer Discretionary — 1.0% | ||||||||
| Arcelik AS | 20,789 | 132,583 | ||||||
| Total Common Stocks | $ | 13,367,826 | ||||||
| Exchange Traded Fund — 1.0% | ||||||||
| iShares MSCI Emerging Markets Small-Cap ETF | 2,817 | $ | 139,106 | |||||
| Short-Term Investment Funds — 2.8% | ||||||||
| Dreyfus Government Cash | ||||||||
| Management, Institutional Shares, | ||||||||
| 0.92%¥W | 93,207 | 93,207 | ||||||
| Invesco Government & Agency | ||||||||
| Portfolio, Institutional Class, | ||||||||
| 0.93%**¥W | 295,388 | 295,388 | ||||||
| Total Short-Term Investment Funds | $ | 388,595 | ||||||
| Total Investment Securities —102.1% | ||||||||
| (Cost $12,608,337) | $ | 13,895,527 | ||||||
| Liabilities in Excess of Other Assets — (2.1%) | (291,430 | ) | ||||||
| Net Assets — 100.0% | $ | 13,604,097 | ||||||
| * | Non-income producing security. |
| ** | Represents collateral for securities loaned. |
| † | All or a portion of the security is on loan. The total market value of the securities on loan as of September 30, 2017 was $282,592. |
| ¥ | Open-End Fund. |
| W | Represents the 7-day SEC yield as of September 30, 2017. |
Portfolio Abbreviations:
ADR - American Depositary Receipt
ETF - Exchange Traded Fund
PCL - Public Company Limited
PLC - Public Limited Company
Other Information:
The inputs or methodology used for valuing securities may not be an indication of the risk associated with investing in those securities. For more information on valuation inputs, and their aggregation into the levels used in the table below, please refer to the security valuation section in the accompanying Notes to Financial Statements.
| Valuation inputs at Reporting Date: | ||||||||||||||||
| Description | Level 1 | Level 2 | Level 3 | Total | ||||||||||||
| Common Stocks | ||||||||||||||||
| Taiwan | $ | — | $ | 1,908,539 | $ | — | $ | 1,908,539 | ||||||||
| India | 102,074 | 1,705,554 | — | 1,807,628 | ||||||||||||
| Cayman Islands | 263,780 | 1,361,777 | — | 1,625,557 | ||||||||||||
| South Korea | 494,723 | 1,098,676 | — | 1,593,399 | ||||||||||||
| Brazil | 1,140,086 | — | — | 1,140,086 | ||||||||||||
| Thailand | 738,738 | — | — | 738,738 | ||||||||||||
| South Africa | 478,432 | — | — | 478,432 | ||||||||||||
| China | 470,855 | — | — | 470,855 | ||||||||||||
| Philippines | 129,266 | 314,339 | — | 443,605 | ||||||||||||
| United Kingdom | 186,934 | 203,051 | — | 389,985 | ||||||||||||
| Indonesia | 170,431 | 193,664 | — | 364,095 | ||||||||||||
| Malaysia | 175,536 | 178,611 | — | 354,147 | ||||||||||||
| Mexico | 349,794 | — | — | 349,794 | ||||||||||||
| Hong Kong | — | 331,763 | — | 331,763 | ||||||||||||
| Hungary | 106,937 | 182,317 | — | 289,254 | ||||||||||||
| Jersey | — | 211,141 | — | 211,141 | ||||||||||||
| Singapore | — | 205,737 | — | 205,737 | ||||||||||||
| Greece | 193,357 | — | — | 193,357 | ||||||||||||
| Luxembourg | 177,569 | — | — | 177,569 | ||||||||||||
| Poland | 161,562 | — | — | 161,562 | ||||||||||||
| Turkey | — | 132,583 | — | 132,583 | ||||||||||||
| Exchange Traded Fund | 139,106 | — | — | 139,106 | ||||||||||||
| Short-Term Investment Funds | 388,595 | — | — | 388,595 | ||||||||||||
| Total | $ | 5,867,775 | $ | 8,027,752 | $ | — | $ | 13,895,527 | ||||||||
| 73 |
Touchstone Emerging Markets Small Cap Fund (Continued)
At September 30, 2017, equity securities valued at $357,837 and $940,623 were transferred from Level 1 to Level 2 and from Level 2 to Level 1, respectively. Transfers from Level 1 to Level 2 are due to movements of a designated U.S. market index, triggering a systematic valuation model provided by an independent third party, when required confidence levels are achieved to fair value the international equity securities. Transfers from Level 2 to Level 1 occur when there is no longer movement of the designated U.S. market index or required confidence levels were not reached in the systematic model.
See accompanying Notes to Financial Statements.
| 74 |
Touchstone High Yield Fund – September 30, 2017
| Principal | Market | |||||||
| Amount | Value | |||||||
| Corporate Bonds — 98.3% | ||||||||
| Consumer Discretionary — 22.3% | ||||||||
| $ | 263,000 | 1011778 BC ULC / New Red Finance, | ||||||
| Inc. (Canada), 144a, 4.250%, 5/15/24 | $ | 263,920 | ||||||
| 602,000 | 1011778 BC ULC / New Red Finance, | |||||||
| Inc. (Canada), 144a, | ||||||||
| 5.000%, 10/15/25 | 609,465 | |||||||
| 398,000 | 1011778 BC ULC / New Red Finance, | |||||||
| Inc. (Canada), 144a, | ||||||||
| 5.000%, 10/15/25 | 402,935 | |||||||
| 414,000 | ACCO Brands Corp., 144a, | |||||||
| 5.250%, 12/15/24 | 429,525 | |||||||
| 667,000 | AMC Entertainment Holdings, Inc., | |||||||
| 5.875%, 11/15/26 | 657,829 | |||||||
| 265,000 | AMC Networks, Inc., 4.750%, 8/1/25 | 267,650 | ||||||
| 592,000 | AMC Networks, Inc., 5.000%, 4/1/24 | 611,240 | ||||||
| 277,000 | American Builders & Contractors | |||||||
| Supply Co., Inc., 144a, | ||||||||
| 5.750%, 12/15/23 | 295,005 | |||||||
| 373,000 | Ashtead Capital, Inc., 144a, | |||||||
| 4.125%, 8/15/25 | 384,190 | |||||||
| 536,000 | Ashtead Capital, Inc., 144a, | |||||||
| 4.375%, 8/15/27 | 552,080 | |||||||
| 716,000 | Avis Budget Car Rental LLC / Avis | |||||||
| Budget Finance, Inc., | ||||||||
| 5.500%, 4/1/23 | 732,110 | |||||||
| 598,000 | Avis Budget Car Rental LLC / Avis | |||||||
| Budget Finance, Inc., 144a, | ||||||||
| 5.125%, 6/1/22 | 606,223 | |||||||
| 985,000 | Belo Corp., 7.250%, 9/15/27 | 1,108,125 | ||||||
| 339,000 | Block Communications, Inc., 144a, | |||||||
| 6.875%, 2/15/25 | 367,917 | |||||||
| 661,000 | Booz Allen Hamilton, Inc., 144a, | |||||||
| 5.125%, 5/1/25 | 667,610 | |||||||
| 655,000 | Brinker International, Inc., | |||||||
| 3.875%, 5/15/23 | 640,263 | |||||||
| 534,000 | Brinker International, Inc., 144a, | |||||||
| 5.000%, 10/1/24 | 529,328 | |||||||
| 114,000 | Brookfield Residential Properties, Inc., | |||||||
| (Canada), 144a, 6.500%, 12/15/20 | 116,708 | |||||||
| 527,000 | Cable One, Inc., 144a, 5.750%, 6/15/22 | 550,715 | ||||||
| 905,000 | Cablevision Systems Corp., | |||||||
| 5.875%, 9/15/22 | 936,675 | |||||||
| 500,000 | Cablevision Systems Corp., | |||||||
| 8.000%, 4/15/20 | 554,375 | |||||||
| 620,000 | CalAtlantic Group, Inc., | |||||||
| 5.375%, 10/1/22 | 675,118 | |||||||
| 168,000 | CalAtlantic Group, Inc., | |||||||
| 5.875%, 11/15/24 | 183,540 | |||||||
| 625,000 | Cardtronics, Inc., 5.125%, 8/1/22 | 645,313 | ||||||
| 271,000 | CCO Holdings LLC / CCO Holdings | |||||||
| Capital Corp., 5.750%, 1/15/24 | 281,501 | |||||||
| 797,000 | CCO Holdings LLC / CCO Holdings | |||||||
| Capital Corp., 144a, 5.125%, 5/1/27 | 807,959 | |||||||
| 1,625,000 | CCO Holdings LLC / CCO Holdings | |||||||
| Capital Corp., 144a, 5.750%, 2/15/26 | 1,703,813 | |||||||
| 215,000 | Cedar Fair LP / Canada's Wonderland | |||||||
| Co. / Magnum Management Corp. / | ||||||||
| Millennium Op, 144a, | ||||||||
| 5.375%, 4/15/27 | 225,750 | |||||||
| 700,000 | Century Communities, Inc., 144a, | |||||||
| 5.875%, 7/15/25 | 703,500 | |||||||
| 1,191,000 | Cimpress NV (Netherlands), 144a, | |||||||
| 7.000%, 4/1/22 | 1,234,174 | |||||||
| 490,000 | Delphi Jersey Holdings PLC (Jersey), | |||||||
| 144a, 5.000%, 10/1/25 | 498,575 | |||||||
| 336,000 | Dollar Tree, Inc., 5.750%, 3/1/23 | 354,480 | ||||||
| 243,000 | GLP Capital LP / GLP Financing II, Inc., | |||||||
| 5.375%, 11/1/23 | 266,085 | |||||||
| 1,025,000 | GLP Capital LP / GLP Financing II, Inc., | |||||||
| 5.375%, 4/15/26 | 1,118,531 | |||||||
| 481,000 | Hanesbrands, Inc., 144a, | |||||||
| 4.625%, 5/15/24 | 500,841 | |||||||
| 611,000 | Hertz Corp. (The), 6.750%, 4/15/19 | 609,472 | ||||||
| 540,000 | Hertz Corp. (The), 144a, | |||||||
| 7.625%, 6/1/22 | 556,875 | |||||||
| 1,051,000 | International Game Technology PLC | |||||||
| (United Kingdom), 144a, | ||||||||
| 6.250%, 2/15/22 | 1,161,880 | |||||||
| 594,000 | JC Penney Corp., Inc., 144a, | |||||||
| 5.875%, 7/1/23 | 599,940 | |||||||
| 638,000 | KFC Holding Co./Pizza Hut Holdings | |||||||
| LLC/Taco Bell of America LLC, 144a, | ||||||||
| 5.000%, 6/1/24 | 672,292 | |||||||
| 358,000 | L Brands, Inc., 5.625%, 2/15/22 | 382,129 | ||||||
| 270,000 | Lennar Corp., 4.125%, 1/15/22 | 278,775 | ||||||
| 398,000 | Lennar Corp., 4.875%, 12/15/23 | 420,885 | ||||||
| 305,000 | Live Nation Entertainment, Inc., 144a, | |||||||
| 4.875%, 11/1/24 | 315,675 | |||||||
| 1,008,000 | LSC Communications, Inc., 144a, | |||||||
| 8.750%, 10/15/23 | 1,038,240 | |||||||
| 601,000 | M/I Homes, Inc., 6.750%, 1/15/21 | 627,294 | ||||||
| 205,000 | M/I Homes, Inc., 144a, 5.625%, 8/1/25 | 209,356 | ||||||
| 1,021,000 | MDC Partners, Inc. (Canada), 144a, | |||||||
| 6.500%, 5/1/24 | 1,028,658 | |||||||
| 510,000 | Men's Wearhouse, Inc. (The), | |||||||
| 7.000%, 7/1/22 | 485,775 | |||||||
| 531,000 | Meritage Homes Corp., | |||||||
| 7.150%, 4/15/20 | 584,100 | |||||||
| 1,122,000 | MGM Resorts International, | |||||||
| 6.000%, 3/15/23 | 1,237,005 | |||||||
| 747,000 | NCL Corp. Ltd. (Bermuda), 144a, | |||||||
| 4.625%, 11/15/20 | 766,609 | |||||||
| 643,000 | NCL Corp. Ltd. (Bermuda), 144a, | |||||||
| 4.750%, 12/15/21 | 667,112 | |||||||
| 185,000 | Netflix, Inc., 5.750%, 3/1/24 | 201,650 | ||||||
| 546,000 | New Home Co., Inc. (The), | |||||||
| 7.250%, 4/1/22 | 563,745 | |||||||
| 926,000 | Penske Automotive Group, Inc., | |||||||
| 5.375%, 12/1/24 | 953,780 | |||||||
| 661,000 | Quad/Graphics, Inc., 7.000%, 5/1/22 | 677,525 | ||||||
| 700,000 | Quebecor Media, Inc. (Canada), | |||||||
| 5.750%, 1/15/23 | 761,250 | |||||||
| 75 |
Touchstone High Yield Fund (Continued)
| Principal | Market | |||||||
| Amount | Value | |||||||
| Corporate Bonds — 98.3% (Continued) | ||||||||
| Consumer Discretionary — (Continued) | ||||||||
| $ | 200,000 | QVC, Inc., 5.125%, 7/2/22 | $ | 213,824 | ||||
| 346,000 | Sabre GLBL, Inc., 144a, | |||||||
| 5.250%, 11/15/23 | 355,515 | |||||||
| 768,000 | Sabre GLBL, Inc., 144a, | |||||||
| 5.375%, 4/15/23 | 795,878 | |||||||
| 476,000 | Scotts Miracle-Gro Co. (The), | |||||||
| 5.250%, 12/15/26 | 502,180 | |||||||
| 528,000 | Service Corp. International, | |||||||
| 5.375%, 5/15/24 | 561,000 | |||||||
| 485,000 | Service Corp. International, | |||||||
| 8.000%, 11/15/21 | 572,300 | |||||||
| 896,000 | ServiceMaster Co. LLC (The), 144a, | |||||||
| 5.125%, 11/15/24 | 920,640 | |||||||
| 824,000 | SFR Group SA (France), 144a, | |||||||
| 6.250%, 5/15/24 | 870,144 | |||||||
| 284,000 | SFR Group SA (France), 144a, | |||||||
| 7.375%, 5/1/26 | 306,720 | |||||||
| 490,000 | Sirius XM Radio, Inc., 144a, | |||||||
| 5.375%, 4/15/25 | 516,950 | |||||||
| 440,000 | Sirius XM Radio, Inc., 144a, | |||||||
| 5.375%, 7/15/26 | 463,100 | |||||||
| 176,000 | Sirius XM Radio, Inc., 144a, | |||||||
| 6.000%, 7/15/24 | 189,420 | |||||||
| 243,000 | Sonic Automotive, Inc., | |||||||
| 5.000%, 5/15/23 | 237,532 | |||||||
| 633,000 | Sonic Automotive, Inc., | |||||||
| 6.125%, 3/15/27 | 648,825 | |||||||
| 1,601,000 | Staples, Inc., 144a, 8.500%, 9/15/25 | 1,556,973 | ||||||
| 383,000 | Suburban Propane Partners | |||||||
| LP/Suburban Energy Finance Corp., | ||||||||
| 5.875%, 3/1/27 | 379,170 | |||||||
| 491,000 | Tempur Sealy International, Inc., | |||||||
| 5.625%, 10/15/23 | 516,164 | |||||||
| 108,000 | Toll Brothers Finance Corp., | |||||||
| 4.875%, 11/15/25 | 112,482 | |||||||
| 773,000 | Toll Brothers Finance Corp., | |||||||
| 5.875%, 2/15/22 | 852,232 | |||||||
| 228,000 | United Rentals North America, Inc., | |||||||
| 4.625%, 10/15/25 | 230,850 | |||||||
| 317,000 | United Rentals North America, Inc., | |||||||
| 5.875%, 9/15/26 | 344,341 | |||||||
| 266,000 | Videotron Ltd (Canada), 144a, | |||||||
| 5.125%, 4/15/27 | 276,560 | |||||||
| 490,000 | William Lyon Homes, Inc., | |||||||
| 5.875%, 1/31/25 | 502,250 | |||||||
| 1,301,000 | ZF North America Capital, Inc., 144a, | |||||||
| 4.750%, 4/29/25 | 1,372,555 | |||||||
| 48,580,695 | ||||||||
| Energy — 13.9% | ||||||||
| 1,084,000 | Blue Racer Midstream LLC / Blue Racer | |||||||
| Finance Corp., 144a, | ||||||||
| 6.125%, 11/15/22 | 1,124,650 | |||||||
| 556,000 | Carrizo Oil & Gas, Inc., 8.250%, 7/15/25 | 603,955 | ||||||
| 658,000 | Cheniere Corpus Christi Holdings LLC, | |||||||
| 7.000%, 6/30/24 | 750,120 | |||||||
| 849,000 | Cheniere Energy Partners LP, 144a, | |||||||
| 5.250%, 10/1/25 | 868,102 | |||||||
| 577,000 | Continental Resources, Inc., | |||||||
| 4.500%, 4/15/23 | 578,442 | |||||||
| 725,000 | Delek Logistics Partners LP, 144a, | |||||||
| 6.750%, 5/15/25 | 730,438 | |||||||
| 648,000 | Exterran Energy Solutions LP / EES | |||||||
| Finance Corp., 144a, 8.125%, 5/1/25 | 670,680 | |||||||
| 849,000 | Extraction Oil & Gas Inc. / Extraction | |||||||
| Finance Corp., 144a, | ||||||||
| 7.875%, 7/15/21 | 895,695 | |||||||
| 205,000 | Extraction Oil & Gas, Inc., 144a, | |||||||
| 7.375%, 5/15/24 | 213,200 | |||||||
| 207,000 | FTS International, Inc., 144a, (3M LIBOR | |||||||
| +7.500%), 8.820%, 6/15/20(A) | 210,364 | |||||||
| 251,000 | Genesis Energy LP / Genesis Energy | |||||||
| Finance Corp., 6.000%, 5/15/23 | 249,118 | |||||||
| 2,128,000 | Genesis Energy LP / Genesis Energy | |||||||
| Finance Corp., 6.750%, 8/1/22 | 2,175,880 | |||||||
| 1,575,000 | Gulfport Energy Corp., | |||||||
| 6.375%, 5/15/25 | 1,594,688 | |||||||
| 574,000 | Hilcorp Energy I LP / Hilcorp Finance | |||||||
| Co., 144a, 5.000%, 12/1/24 | 562,520 | |||||||
| 703,000 | Hilcorp Energy I LP / Hilcorp Finance | |||||||
| Co., 144a, 5.750%, 10/1/25 | 710,909 | |||||||
| 647,000 | MEG Energy Corp. (Canada), 144a, | |||||||
| 6.375%, 1/30/23 | 564,508 | |||||||
| 352,000 | Murphy Oil USA, Inc., 5.625%, 5/1/27 | 378,400 | ||||||
| 609,000 | Newfield Exploration Co., | |||||||
| 5.625%, 7/1/24 | 653,152 | |||||||
| 1,022,000 | PDC Energy, Inc., 6.125%, 9/15/24 | 1,067,990 | ||||||
| 699,000 | Peabody Securities Finance Corp., | |||||||
| 144a, 6.000%, 3/31/22 | 721,718 | |||||||
| 539,000 | Peabody Securities Finance Corp., | |||||||
| 144a, 6.375%, 3/31/25 | 553,822 | |||||||
| 276,000 | QEP Resources, Inc., 5.375%, 10/1/22 | 271,170 | ||||||
| 598,000 | QEP Resources, Inc., 6.800%, 3/1/20 | 623,415 | ||||||
| 627,000 | Range Resources Corp., 144a, | |||||||
| 5.000%, 8/15/22 | 626,216 | |||||||
| 563,000 | Range Resources Corp., 144a, | |||||||
| 5.750%, 6/1/21 | 585,520 | |||||||
| 285,000 | Rockies Express Pipeline LLC, 144a, | |||||||
| 6.875%, 4/15/40 | 316,350 | |||||||
| 564,000 | SemGroup Corp. / Rose Rock Finance | |||||||
| Corp., 5.625%, 7/15/22 | 551,310 | |||||||
| 996,000 | SemGroup Corp. / Rose Rock Finance | |||||||
| Corp., 5.625%, 11/15/23 | 968,610 | |||||||
| 721,000 | SESI LLC, 7.125%, 12/15/21 | 735,420 | ||||||
| 1,076,000 | Shelf Drilling Holdings Ltd. (Cayman | |||||||
| Islands), 144a, 9.500%, 11/2/20 | 1,088,105 | |||||||
| 1,118,000 | Southwestern Energy Co., | |||||||
| 6.700%, 1/23/25 | 1,134,770 | |||||||
| 675,000 | Southwestern Energy Co., | |||||||
| 7.500%, 4/1/26 | 702,000 | |||||||
| 1,370,000 | Tallgrass Energy Partners LP / Tallgrass | |||||||
| Energy Finance Corp., 144a, | ||||||||
| 5.500%, 9/15/24 | 1,407,675 | |||||||
| 76 |
Touchstone High Yield Fund (Continued)
| Principal | Market | |||||||
| Amount | Value | |||||||
| Corporate Bonds — 98.3% (Continued) | ||||||||
| Energy — (Continued) | ||||||||
| $ | 253,000 | Tallgrass Energy Partners LP / Tallgrass | ||||||
| Energy Finance Corp., 144a, | ||||||||
| 5.500%, 1/15/28 | $ | 257,111 | ||||||
| 1,083,950 | Transocean Phoenix 2 Ltd. (Cayman | |||||||
| Islands), 144a, 7.750%, 10/15/24 | 1,165,246 | |||||||
| 711,000 | Tullow Oil PLC (United Kingdom), | |||||||
| 144a, 6.000%, 11/1/20 | 705,668 | |||||||
| 353,000 | Ultra Resources, Inc., 144a, | |||||||
| 6.875%, 4/15/22 | 360,060 | |||||||
| 475,000 | Ultra Resources, Inc., 144a, | |||||||
| 7.125%, 4/15/25 | 479,750 | |||||||
| 1,784,000 | Unit Corp., 6.625%, 5/15/21 | 1,788,460 | ||||||
| 314,000 | Williams Cos., Inc. (The), | |||||||
| 5.750%, 6/24/44 | 332,055 | |||||||
| 223,000 | Williams Cos., Inc. (The), | |||||||
| 7.500%, 1/15/31 | 267,600 | |||||||
| 30,244,862 | ||||||||
| Telecommunication Services — 13.5% | ||||||||
| 863,000 | Altice Financing SA (Luxembourg), | |||||||
| 144a, 7.500%, 5/15/26 | 949,300 | |||||||
| 1,599,000 | Altice Financing SA (Luxemburg), | |||||||
| 144a, 6.625%, 2/15/23 | 1,694,940 | |||||||
| 1,051,000 | Altice US Finance I Corp., 144a, | |||||||
| 5.500%, 5/15/26 | 1,108,479 | |||||||
| 580,000 | CenturyLink, Inc., 5.625%, 4/1/25 | 555,350 | ||||||
| 1,432,000 | CenturyLink, Inc., 5.800%, 3/15/22 | 1,427,274 | ||||||
| 436,000 | CenturyLink, Inc., 6.450%, 6/15/21 | 453,671 | ||||||
| 564,000 | CenturyLink, Inc., 6.875%, 1/15/28 | 544,930 | ||||||
| 741,000 | CommScope Technologies LLC, 144a, | |||||||
| 5.000%, 3/15/27 | 742,852 | |||||||
| 204,000 | CommScope, Inc., 144a, | |||||||
| 5.500%, 6/15/24 | 213,435 | |||||||
| 801,000 | CSC Holdings LLC, 5.250%, 6/1/24 | 810,011 | ||||||
| 1,013,000 | CSC Holdings LLC, 144a, | |||||||
| 10.125%, 1/15/23 | 1,168,749 | |||||||
| 1,265,000 | DISH DBS Corp., 5.125%, 5/1/20 | 1,326,289 | ||||||
| 514,000 | DISH DBS Corp., 6.750%, 6/1/21 | 565,400 | ||||||
| 599,000 | EW Scripps Co. (The), 144a, | |||||||
| 5.125%, 5/15/25 | 610,980 | |||||||
| 100,000 | Frontier Communications Corp., | |||||||
| 7.125%, 1/15/23 | 76,750 | |||||||
| 290,000 | Frontier Communications Corp., | |||||||
| 8.500%, 4/15/20† | 281,300 | |||||||
| 2,071,000 | Frontier Communications Corp., | |||||||
| 10.500%, 9/15/22 | 1,796,592 | |||||||
| 772,000 | Gray Television, Inc., 144a, | |||||||
| 5.125%, 10/15/24 | 775,860 | |||||||
| 741,000 | Intelsat Jackson Holdings SA | |||||||
| (Luxembourg), 5.500%, 8/1/23 | 627,998 | |||||||
| 49,000 | Intelsat Jackson Holdings SA | |||||||
| (Luxembourg), 7.500%, 4/1/21 | 46,428 | |||||||
| 84,000 | LIN Television Corp., 5.875%, 11/15/22 | 87,570 | ||||||
| 938,000 | Nexstar Broadcasting, Inc., 144a, | |||||||
| 5.625%, 8/1/24 | 970,830 | |||||||
| 362,000 | Nokia OYJ (Finland), 3.375%, 6/12/22 | 365,168 | ||||||
| 362,000 | Nokia OYJ (Finland), 4.375%, 6/12/27 | 372,408 | ||||||
| 305,000 | Qwest Corp., 6.750%, 12/1/21 | 333,055 | ||||||
| 806,000 | SFR Group SA (France), 144a, | |||||||
| 6.000%, 5/15/22 | 842,270 | |||||||
| 497,000 | Sinclair Television Group, Inc., 144a, | |||||||
| 5.625%, 8/1/24 | 510,046 | |||||||
| 386,000 | SoftBank Group Corp. (Japan), 144a, | |||||||
| 4.500%, 4/15/20 | 398,225 | |||||||
| 505,000 | Sprint Capital Corp., 6.875%, 11/15/28 | 565,600 | ||||||
| 602,000 | Sprint Communications, Inc., | |||||||
| 6.000%, 11/15/22 | 644,453 | |||||||
| 2,693,000 | Sprint Corp., 7.125%, 6/15/24 | 3,029,625 | ||||||
| 223,000 | Sprint Corp., 7.625%, 2/15/25 | 255,753 | ||||||
| 303,000 | T-Mobile USA, Inc., 6.000%, 3/1/23 | 319,286 | ||||||
| 629,000 | T-Mobile USA, Inc., 6.000%, 4/15/24 | 667,526 | ||||||
| 1,025,000 | T-Mobile USA, Inc., 6.625%, 4/1/23 | 1,078,833 | ||||||
| 581,000 | Univision Communications, Inc., 144a, | |||||||
| 5.125%, 5/15/23 | 592,620 | |||||||
| 323,000 | Univision Communications, Inc., 144a, | |||||||
| 5.125%, 2/15/25 | 325,826 | |||||||
| 374,000 | UPCB Finance IV Ltd. (Cayman Islands), | |||||||
| 144a, 5.375%, 1/15/25 | 388,960 | |||||||
| 147,000 | VeriSign, Inc., 4.750%, 7/15/27 | 151,410 | ||||||
| 636,000 | ViaSat, Inc., 144a, 5.625%, 9/15/25 | 640,007 | ||||||
| 391,000 | Videotron Ltd. (Canada), | |||||||
| 5.000%, 7/15/22 | 422,280 | |||||||
| 575,000 | Zayo Group LLC / Zayo Capital, Inc., | |||||||
| 144a, 5.750%, 1/15/27 | 609,500 | |||||||
| 29,347,839 | ||||||||
| Health Care — 8.2% | ||||||||
| 627,000 | Acadia Healthcare Co., Inc., | |||||||
| 5.625%, 2/15/23 | 658,350 | |||||||
| 475,000 | Acadia Healthcare Co., Inc., | |||||||
| 6.500%, 3/1/24 | 510,031 | |||||||
| 1,013,000 | Centene Corp., 4.750%, 1/15/25 | 1,050,988 | ||||||
| 1,412,000 | CHS/Community Health Systems, Inc., | |||||||
| 6.250%, 3/31/23 | 1,387,290 | |||||||
| 638,000 | Envision Healthcare Corp., | |||||||
| 5.625%, 7/15/22 | 665,115 | |||||||
| 206,000 | Envision Healthcare Corp., 144a, | |||||||
| 5.125%, 7/1/22 | 213,725 | |||||||
| 520,000 | Envision Healthcare Corp., 144a, | |||||||
| 6.250%, 12/1/24 | 557,700 | |||||||
| 1,362,000 | HCA, Inc., 5.375%, 2/1/25 | 1,435,208 | ||||||
| 487,000 | HCA, Inc., 5.875%, 3/15/22 | 539,352 | ||||||
| 554,000 | HCA, Inc., 5.875%, 5/1/23 | 602,475 | ||||||
| 1,159,000 | HCA, Inc., 5.875%, 2/15/26 | 1,244,476 | ||||||
| 1,125,000 | HealthSouth Corp., 5.750%, 11/1/24 | 1,154,531 | ||||||
| 49,000 | LifePoint Health, Inc., 5.375%, 5/1/24 | 50,960 | ||||||
| 1,145,000 | Mallinckrodt International Finance SA | |||||||
| / Mallinckrodt CB LLC | ||||||||
| (Luxembourg), 144a, | ||||||||
| 5.500%, 4/15/25 | 1,033,362 | |||||||
| 684,000 | Select Medical Corp., 6.375%, 6/1/21 | 704,520 | ||||||
| 134,000 | Teleflex, Inc., 4.875%, 6/1/26 | 139,025 | ||||||
| 77 |
Touchstone High Yield Fund (Continued)
| Principal | Market | |||||||
| Amount | Value | |||||||
| Corporate Bonds — 98.3% (Continued) | ||||||||
| Health Care — (Continued) | ||||||||
| $ | 223,000 | Tenet Healthcare Corp., | ||||||
| 4.500%, 4/1/21 | $ | 227,393 | ||||||
| 250,000 | Tenet Healthcare Corp., | |||||||
| 4.750%, 6/1/20 | 258,175 | |||||||
| 1,613,000 | Tenet Healthcare Corp., | |||||||
| 6.000%, 10/1/20 | 1,718,990 | |||||||
| 705,000 | Tenet Healthcare Corp., 144a, | |||||||
| 5.125%, 5/1/25 | 695,306 | |||||||
| 320,000 | Tenet Healthcare Corp., 144a, | |||||||
| 7.500%, 1/1/22 | 338,800 | |||||||
| 551,000 | Universal Hospital Services, Inc., | |||||||
| 7.625%, 8/15/20 | 557,888 | |||||||
| 19,000 | Valeant Pharmaceuticals | |||||||
| International., 144a, | ||||||||
| 6.375%, 10/15/20 | 19,048 | |||||||
| 101,000 | Valeant Pharmaceuticals | |||||||
| International., 144a, | ||||||||
| 6.750%, 8/15/21 | 99,106 | |||||||
| 829,000 | Valeant Pharmaceuticals International, | |||||||
| Inc. (Canada), 144a, 5.500%, 3/1/23 | 727,448 | |||||||
| 398,000 | Valeant Pharmaceuticals International, | |||||||
| Inc. (Canada), 144a, 5.875%, 5/15/23 | 351,732 | |||||||
| 931,000 | Valeant Pharmaceuticals International, | |||||||
| Inc. (Canada), 144a, 6.125%, 4/15/25 | 815,789 | |||||||
| 17,756,783 | ||||||||
| Materials — 7.8% | ||||||||
| 558,000 | AK Steel Corp., 7.625%, 10/1/21 | 580,320 | ||||||
| 494,000 | Alcoa Nederland Holding BV | |||||||
| (Netherlands), 144a, | ||||||||
| 7.000%, 9/30/26 | 559,455 | |||||||
| 585,000 | ArcelorMittal (Luxembourg), | |||||||
| 5.750%, 8/5/20 | 636,188 | |||||||
| 89,000 | ArcelorMittal (Luxembourg), | |||||||
| 6.000%, 3/1/21 | 97,678 | |||||||
| 460,000 | ArcelorMittal (Luxembourg), | |||||||
| 6.750%, 2/25/22 | 527,275 | |||||||
| 393,000 | Blue Cube Spinco, Inc., | |||||||
| 9.750%, 10/15/23 | 477,495 | |||||||
| 30,000 | Cascades, Inc. (Canada), 144a, | |||||||
| 5.500%, 7/15/22 | 31,125 | |||||||
| 864,000 | Cascades, Inc. (Canada), 144a, | |||||||
| 5.750%, 7/15/23 | 907,200 | |||||||
| 516,000 | CF Industries, Inc., 144a, | |||||||
| 4.500%, 12/1/26 | 539,894 | |||||||
| 285,000 | Commercial Metals Co., | |||||||
| 5.375%, 7/15/27 | 299,250 | |||||||
| 1,041,000 | CVR Partners LP / CVR Nitrogen | |||||||
| Finance Corp., 144a, | ||||||||
| 9.250%, 6/15/23 | 1,108,665 | |||||||
| 1,846,000 | Freeport-McMoRan, Inc., | |||||||
| 3.550%, 3/1/22 | 1,817,738 | |||||||
| 646,000 | Freeport-McMoRan, Inc., | |||||||
| 6.750%, 2/1/22 | 673,455 | |||||||
| 112,000 | Freeport-McMoRan, Inc., | |||||||
| 6.875%, 2/15/23 | 122,080 | |||||||
| 818,000 | Hudbay Minerals, Inc. (Canada), 144a, | |||||||
| 7.250%, 1/15/23 | 871,170 | |||||||
| 854,000 | Hudbay Minerals, Inc. (Canada), 144a, | |||||||
| 7.625%, 1/15/25 | 924,472 | |||||||
| 111,000 | Kaiser Aluminum Corp., | |||||||
| 5.875%, 5/15/24 | 118,770 | |||||||
| 1,060,000 | Kinross Gold Corp. (Canada), 144a, | |||||||
| 4.500%, 7/15/27 | 1,069,275 | |||||||
| 476,000 | Kraton Polymers LLC / Kraton | |||||||
| Polymers Capital Corp., 144a, | ||||||||
| 7.000%, 4/15/25 | 510,510 | |||||||
| 365,000 | Lundin Mining Corp. (Canada), 144a, | |||||||
| 7.875%, 11/1/22 | 396,938 | |||||||
| 965,000 | NOVA Chemicals Corp. (Canada), 144a, | |||||||
| 4.875%, 6/1/24 | 977,062 | |||||||
| 373,000 | NOVA Chemicals Corp. (Canada), 144a, | |||||||
| 5.250%, 8/1/23 | 384,190 | |||||||
| 643,000 | PolyOne Corp., 5.250%, 3/15/23 | 681,580 | ||||||
| 401,000 | Steel Dynamics, Inc., 5.000%, 12/15/26 | 428,068 | ||||||
| 249,000 | Steel Dynamics, Inc., 5.250%, 4/15/23 | 258,960 | ||||||
| 688,000 | Steel Dynamics, Inc., 144a, | |||||||
| 4.125%, 9/15/25 | 693,587 | |||||||
| 588,000 | Teck Resources Ltd. (Canada), | |||||||
| 6.250%, 7/15/41 | 664,040 | |||||||
| 521,000 | Trinseo Materials Operating SCA / | |||||||
| Trinseo Materials Finance, Inc. | ||||||||
| (Luxembourg), 144a, | ||||||||
| 5.375%, 9/1/25 | 535,979 | |||||||
| 16,892,419 | ||||||||
| Industrials — 7.4% | ||||||||
| 720,000 | AECOM Global II LLC / URS Fox US LP, | |||||||
| 5.000%, 4/1/22 | 748,800 | |||||||
| 139,000 | Allegion PLC (Ireland), | |||||||
| 5.875%, 9/15/23 | 150,117 | |||||||
| 200,000 | Allegion US Holding Co., Inc., | |||||||
| 5.750%, 10/1/21 | 205,760 | |||||||
| 1,119,178 | American Airlines 2013-2 Class B Pass | |||||||
| Through Trust, 144a, | ||||||||
| 5.600%, 7/15/20 | 1,172,339 | |||||||
| 826,000 | Amsted Industries, Inc., 144a, | |||||||
| 5.000%, 3/15/22 | 852,845 | |||||||
| 267,000 | Amsted Industries, Inc., 144a, | |||||||
| 5.375%, 9/15/24 | 280,684 | |||||||
| 504,000 | Arconic, Inc., 5.125%, 10/1/24 | 536,306 | ||||||
| 245,000 | Arconic, Inc., 5.870%, 2/23/22 | 268,275 | ||||||
| 510,000 | Ardagh Packaging Finance PLC / | |||||||
| Ardagh Holdings USA, Inc. (Ireland), | ||||||||
| 144a, 6.000%, 2/15/25 | 539,963 | |||||||
| 540,000 | Bombardier, Inc. (Canada), 144a, | |||||||
| 7.500%, 3/15/25 | 539,676 | |||||||
| 858,000 | CNH Industrial NV (Netherlands), | |||||||
| 4.500%, 8/15/23 | 908,622 | |||||||
| 952,000 | JB Poindexter & Co., Inc., 144a, | |||||||
| 9.000%, 4/1/22 | 994,840 | |||||||
| 965,000 | KLX, Inc., 144a, 5.875%, 12/1/22 | 1,011,030 | ||||||
| 78 |
Touchstone High Yield Fund (Continued)
| Principal | Market | |||||||
| Amount | Value | |||||||
| Corporate Bonds — 98.3% (Continued) | ||||||||
| Industrials — (Continued) | ||||||||
| $ | 700,000 | Louisiana-Pacific Corp., | ||||||
| 4.875%, 9/15/24 | $ | 721,252 | ||||||
| 121,000 | Moog, Inc., 144a, 5.250%, 12/1/22 | 126,142 | ||||||
| 686,000 | Multi-Color Corp., 144a, | |||||||
| 4.875%, 11/1/25 | 693,512 | |||||||
| 731,000 | Multi-Color Corp., 144a, | |||||||
| 6.125%, 12/1/22 | 766,819 | |||||||
| 860,000 | Orbital ATK, Inc., 5.500%, 10/1/23 | 919,125 | ||||||
| 256,000 | Owens-Brockway Glass Container, Inc., | |||||||
| 144a, 5.875%, 8/15/23 | 282,880 | |||||||
| 365,000 | Standard Industries, Inc., 144a, | |||||||
| 5.375%, 11/15/24 | 387,922 | |||||||
| 649,000 | Standard Industries, Inc./NJ, 144a, | |||||||
| 6.000%, 10/15/25 | 708,033 | |||||||
| 406,000 | Tenneco, Inc., 5.000%, 7/15/26 | 416,150 | ||||||
| 391,000 | TransDigm, Inc., 5.500%, 10/15/20 | 396,865 | ||||||
| 647,000 | TriMas Corp., 144a, 4.875%, 10/15/25 | 652,257 | ||||||
| 570,000 | Triumph Group, Inc., 5.250%, 6/1/22 | 557,175 | ||||||
| 499,000 | Triumph Group, Inc., 144a, | |||||||
| 7.750%, 8/15/25 | 525,198 | |||||||
| 175,209 | United Airlines 2014-2 Class B Pass | |||||||
| Through Trust, 4.625%, 9/3/22 | 181,779 | |||||||
| 655,000 | Wabash National Corp., 144a, | |||||||
| 5.500%, 10/1/25 | 667,281 | |||||||
| 16,211,647 | ||||||||
| Financials — 6.5% | ||||||||
| 475,000 | Aircastle Ltd. (Bermuda), | |||||||
| 5.500%, 2/15/22 | 518,938 | |||||||
| 926,000 | Ally Financial, Inc., 8.000%, 11/1/31 | 1,194,540 | ||||||
| 978,000 | Bank of America Corp., 6.100%(B) | 1,078,245 | ||||||
| 1,158,000 | Citigroup, Inc., 6.125%(B) | 1,239,060 | ||||||
| 263,000 | Credit Acceptance Corp., | |||||||
| 6.125%, 2/15/21 | 266,945 | |||||||
| 776,000 | Credit Acceptance Corp., | |||||||
| 7.375%, 3/15/23 | 820,620 | |||||||
| 578,000 | Dana Financing Luxembourg Sarl | |||||||
| (Luxembourg), 144a, | ||||||||
| 5.750%, 4/15/25 | 609,429 | |||||||
| 842,000 | FirstCash, Inc., 144a, 5.375%, 6/1/24 | 877,785 | ||||||
| 1,215,000 | Goldman Sachs Group, Inc. (The), (3M | |||||||
| LIBOR +3.922%), 5.375%(A)(B) | 1,258,862 | |||||||
| 249,000 | iStar, Inc., 4.625%, 9/15/20 | 254,602 | ||||||
| 1,264,000 | JPMorgan Chase & Co., (3M LIBOR | |||||||
| +3.800%), 5.300%(A)(B) | 1,317,720 | |||||||
| 1,131,000 | MetLife, Inc., (3M LIBOR +3.575%), | |||||||
| 5.250%(A)(B) | 1,166,016 | |||||||
| 597,000 | Navient Corp., 5.000%, 10/26/20 | 614,164 | ||||||
| 504,000 | OneMain Financial Holdings LLC, | |||||||
| 144a, 7.250%, 12/15/21 | 526,050 | |||||||
| 1,460,000 | Quicken Loans, Inc., 144a, | |||||||
| 5.750%, 5/1/25 | 1,533,000 | |||||||
| 430,000 | Radian Group, Inc., 4.500%, 10/1/24 | 438,600 | ||||||
| 497,000 | Realogy Group LLC / Realogy | |||||||
| Co.-Issuer Corp., 144a, | ||||||||
| 4.875%, 6/1/23 | 510,668 | |||||||
| 14,225,244 | ||||||||
| Consumer Staples — 6.5% | ||||||||
| 1,123,000 | Albertsons Cos. LLC / Safeway, Inc. / | |||||||
| New Albertson's Inc. / Albertson's | ||||||||
| LLC, 5.750%, 3/15/25 | 988,240 | |||||||
| 528,000 | B&G Foods, Inc., 5.250%, 4/1/25 | 541,200 | ||||||
| 201,000 | Barry Callebaut Services NV (Belgium), | |||||||
| 144a, 5.500%, 6/15/23 | 216,879 | |||||||
| 685,000 | Cardtronics, Inc. / Cardtronics USA, | |||||||
| 144a, 5.500%, 5/1/25 | 700,765 | |||||||
| 671,000 | CDK Global, Inc., 144a, 4.875%, 6/1/27 | 689,453 | ||||||
| 713,000 | Cott Holdings, Inc., 144a, | |||||||
| 5.500%, 4/1/25 | 743,302 | |||||||
| 229,000 | Cumberland Farms, Inc., 144a, | |||||||
| 6.750%, 5/1/25 | 243,381 | |||||||
| 873,000 | First Quality Finance Co., Inc., 144a, | |||||||
| 5.000%, 7/1/25 | 900,281 | |||||||
| 455,000 | H&E Equipment Services, Inc., 144a, | |||||||
| 5.625%, 9/1/25 | 480,025 | |||||||
| 698,000 | IHS Markit Ltd. (Bermuda), 144a, | |||||||
| 5.000%, 11/1/22 | 752,095 | |||||||
| 775,000 | Ingles Markets, Inc., 5.750%, 6/15/23 | 757,562 | ||||||
| 684,000 | JBS USA LLC / JBS USA Finance, Inc., | |||||||
| 144a, 5.875%, 7/15/24 | 685,710 | |||||||
| 160,000 | JBS USA LLC / JBS USA Finance, Inc., | |||||||
| 144a, 7.250%, 6/1/21 | 163,200 | |||||||
| 298,000 | JBS USA LUX SA / JBS USA Finance, | |||||||
| Inc., 144a, 7.250%, 6/1/21 | 303,960 | |||||||
| 309,000 | Performance Food Group, Inc., 144a, | |||||||
| 5.500%, 6/1/24 | 319,042 | |||||||
| 66,000 | Pilgrim's Pride Corp., 144a, | |||||||
| 5.750%, 3/15/25 | 68,145 | |||||||
| 66,000 | Pilgrim's Pride Corp., 144a, | |||||||
| 5.875%, 9/30/27 | 67,402 | |||||||
| 1,296,000 | Post Holdings, Inc., 144a, | |||||||
| 5.000%, 8/15/26 | 1,292,760 | |||||||
| 562,000 | Post Holdings, Inc., 144a, | |||||||
| 5.500%, 3/1/25 | 583,075 | |||||||
| 2,197,000 | Rite Aid Corp., 144a, 6.125%, 4/1/23 | 2,133,836 | ||||||
| 108,000 | Spectrum Brands, Inc., | |||||||
| 6.125%, 12/15/24 | 115,695 | |||||||
| 820,000 | TreeHouse Foods, Inc., 144a, | |||||||
| 6.000%, 2/15/24 | 876,375 | |||||||
| 559,000 | US Foods, Inc., 144a, 5.875%, 6/15/24 | 585,552 | ||||||
| 14,207,935 | ||||||||
| Information Technology — 5.6% | ||||||||
| 310,000 | CDW LLC / CDW Finance Corp., | |||||||
| 5.000%, 9/1/23 | 324,437 | |||||||
| 849,000 | CDW LLC / CDW Finance Corp., | |||||||
| 5.500%, 12/1/24 | 945,582 | |||||||
| 148,000 | Dell International LLC / EMC Corp., | |||||||
| 144a, 5.875%, 6/15/21 | 154,722 | |||||||
| 79 |
Touchstone High Yield Fund (Continued)
| Principal | Market | |||||||
| Amount | Value | |||||||
| Corporate Bonds — 98.3% (Continued) | ||||||||
| Information Technology — (Continued) | ||||||||
| $ | 1,517,000 | Dell International LLC / EMC Corp., | ||||||
| 144a, 7.125%, 6/15/24 | $ | 1,676,020 | ||||||
| 1,016,000 | Diebold Nixdorf, Inc., 8.500%, 4/15/24 | 1,101,364 | ||||||
| 711,000 | EMC Corp., 3.375%, 6/1/23 | 684,897 | ||||||
| 997,000 | First Data Corp., 144a, 5.000%, 1/15/24 | 1,035,185 | ||||||
| 578,000 | First Data Corp., 144a, 5.375%, 8/15/23 | 604,588 | ||||||
| 336,000 | First Data Corp., 144a, 7.000%, 12/1/23 | 358,781 | ||||||
| 211,000 | j2 Cloud Services LLC / j2 Global | |||||||
| Co-Obligor, Inc., 144a, | ||||||||
| 6.000%, 7/15/25 | 220,759 | |||||||
| 1,051,000 | Open Text Corp. (Canada), 144a, | |||||||
| 5.875%, 6/1/26 | 1,153,472 | |||||||
| 238,000 | Quintiles IMS, Inc., 144a, | |||||||
| 4.875%, 5/15/23 | 247,520 | |||||||
| 575,000 | Quintiles IMS, Inc., 144a, | |||||||
| 5.000%, 10/15/26 | 609,500 | |||||||
| 690,000 | Sensata Technologies BV | |||||||
| (Netherlands), 144a, | ||||||||
| 5.000%, 10/1/25 | 727,294 | |||||||
| 338,000 | Symantec Corp., 144a, | |||||||
| 5.000%, 4/15/25 | 353,423 | |||||||
| 623,000 | Western Digital Corp., 10.500%, 4/1/24 | 732,025 | ||||||
| 276,000 | Western Digital Corp., 144a, | |||||||
| 7.375%, 4/1/23 | 302,358 | |||||||
| 962,000 | Zayo Group LLC / Zayo Capital, Inc., | |||||||
| 6.000%, 4/1/23 | 1,016,112 | |||||||
| 12,248,039 | ||||||||
| Utilities — 4.0% | ||||||||
| 604,000 | AES Corp., 4.875%, 5/15/23 | 622,120 | ||||||
| 161,000 | AES Corp., 7.375%, 7/1/21 | 183,959 | ||||||
| 1,166,000 | Calpine Corp., 5.375%, 1/15/23† | 1,135,567 | ||||||
| 699,000 | DPL, Inc., 7.250%, 10/15/21 | 761,910 | ||||||
| 362,000 | Dynegy, Inc., 5.875%, 6/1/23 | 360,190 | ||||||
| 902,000 | Dynegy, Inc., 7.375%, 11/1/22 | 939,208 | ||||||
| 500,000 | GenOn Energy, Inc., 6/15/17(C) | 372,500 | ||||||
| 541,000 | GenOn Energy, Inc., 10/15/18(C) | 396,282 | ||||||
| 698,000 | InterGen NV (Netherlands), 144a, | |||||||
| 7.000%, 6/30/23 | 680,550 | |||||||
| 654,000 | NGL Energy Partners LP / NGL Energy | |||||||
| Finance Corp., 6.125%, 3/1/25 | 608,220 | |||||||
| 950,000 | NGL Energy Partners LP / NGL Energy | |||||||
| Finance Corp., 6.875%, 10/15/21 | 950,000 | |||||||
| 869,000 | NGL Energy Partners LP / NGL Energy | |||||||
| Finance Corp., 7.500%, 11/1/23 | 864,655 | |||||||
| 870,000 | NRG Energy, Inc., 6.250%, 7/15/22 | 913,500 | ||||||
| 8,788,661 | ||||||||
| Real Estate — 2.6% | ||||||||
| 135,000 | CoreCivic, Inc. REIT, 4.125%, 4/1/20 | 138,375 | ||||||
| 123,000 | CoreCivic, Inc. REIT, 4.625%, 5/1/23 | 125,768 | ||||||
| 781,000 | CyrusOne LP / CyrusOne Finance | |||||||
| Corp. REIT, 144a, 5.000%, 3/15/24 | 822,002 | |||||||
| 277,000 | CyrusOne LP / CyrusOne Finance | |||||||
| Corp. REIT, 144a, 5.375%, 3/15/27 | 297,082 | |||||||
| 511,000 | Equinix, Inc. REIT, 5.375%, 4/1/23 | 531,849 | ||||||
| 263,000 | Equinix, Inc. REIT, 5.375%, 5/15/27 | 285,684 | ||||||
| 1,238,000 | ESH Hospitality, Inc. REIT, 144a, | |||||||
| 5.250%, 5/1/25 | 1,279,782 | |||||||
| 110,000 | GEO Group, Inc. (The) REIT, | |||||||
| 5.125%, 4/1/23 | 111,375 | |||||||
| 72,000 | GEO Group, Inc. (The) REIT, | |||||||
| 5.875%, 10/15/24 | 75,060 | |||||||
| 523,000 | MGM Growth Properties Operating | |||||||
| Partnership LP / MGP Finance | ||||||||
| Co-Issuer, Inc. REIT, 5.625%, 5/1/24 | 566,712 | |||||||
| 1,308,000 | Sabra Health Care LP. REIT, | |||||||
| 5.125%, 8/15/26 | 1,341,725 | |||||||
| 5,575,414 | ||||||||
| Total Corporate Bonds | $ | 214,079,538 | ||||||
| Shares | ||||||||
| Short-Term Investment Funds — 1.5% | ||||||||
| 1,887,126 | Dreyfus Government Cash | |||||||
| Management, Institutional Shares, | ||||||||
| 0.92%∞Ω | 1,887,126 | |||||||
| 1,467,010 | Invesco Government & Agency | |||||||
| Portfolio, Institutional Class, | ||||||||
| 0.93%**∞Ω | 1,467,010 | |||||||
| Total Short-Term Investment Funds | $ | 3,354,136 | ||||||
| Total Investment Securities —99.8% | ||||||||
| (Cost $212,387,674) | $ | 217,433,674 | ||||||
| Other Assets in | ||||||||
| Excess of Liabilities — 0.2% | 454,996 | |||||||
| Net Assets — 100.0% | $ | 217,888,670 | ||||||
| (A) | Variable rate security - Rate reflected is the rate in effect as of September 30, 2017. |
| (B) | Perpetual Bond - A bond with no definite maturity date. |
| (C) | The issuer is in default of certain debt covenants. Income is not being accrued. The total value of such securities as of September 30, 2017 was $768,782 or 0.4% of net assets. |
| ** | Represents collateral for securities loaned. |
| † | All or a portion of the security is on loan. The total market value of the securities on loan as of September 30, 2017 was $1,401,729. |
| ∞ | Open-End Fund. |
| Ω | Represents the 7-day SEC yield as of September 30, 2017. |
| 80 |
Touchstone High Yield Fund (Continued)
Portfolio Abbreviations:
LIBOR - London InterBank Offered Rate
LLC - Limited Liability Company
LP - Limited Partnership
PLC - Public Limited Company
REIT - Real Estate Investment Trust
144a - This is a restricted security that was sold in a transaction qualifying for the exemption under Rule 144A of the Securities Act of 1933. This security may be sold in transactions exempt from registration, normally to qualified institutional buyers. At September 30, 2017, these securities were valued at $104,400,678 or 47.9% of net assets. These securities were deemed liquid pursuant to procedures approved by the Board of Trustees.
Other Information:
The inputs or methodology used for valuing securities may not be an indication of the risk associated with investing in those securities. For more information on valuation inputs, and their aggregation into the levels used in the table below, please refer to the security valuation section in the accompanying Notes to Financial Statements.
Valuation inputs at Reporting Date:
| Description | Level 1 | Level 2 | Level 3 | Total | ||||||||||||
| Corporate Bonds | $ | — | $ | 214,079,538 | $ | — | $ | 214,079,538 | ||||||||
| Short-Term Investment Funds | 3,354,136 | — | — | 3,354,136 | ||||||||||||
| Total | $ | 3,354,136 | $ | 214,079,538 | $ | — | $ | 217,433,674 | ||||||||
See accompanying Notes to Financial Statements.
| 81 |
Touchstone Merger Arbitrage Fund – September 30, 2017
| Market | ||||||||
| Shares | Value | |||||||
| Common Stocks — 73.5% | ||||||||
| Financials — 36.8% | ||||||||
| Avista Healthcare Public Acquisition Corp. - Class A (Cayman Islands)* | 175,823 | $ | 1,758,230 | |||||
| Avista Healthcare Public Acquisition Corp. (Cayman Islands)* | 618 | 6,390 | ||||||
| Boulevard Acquisition Corp. I* | 30,651 | 319,383 | ||||||
| Boulevard Acquisition Corp. II* | 173,911 | 1,739,110 | ||||||
| Capitol Investment Corp. IV (Cayman Islands)* | 249,408 | 2,524,009 | ||||||
| Constellation Alpha Capital Corp. (British Virgin Islands)* | 329,890 | 3,364,878 | ||||||
| Double Eagle Acquisition Corp. - Class A (Cayman Islands)* | 44,919 | 453,682 | ||||||
| Draper Oakwood Technology Acquisition, Inc.* | 130,000 | 1,323,400 | ||||||
| Federal Street Acquisition Corp.*†† | 428,203 | 4,397,645 | ||||||
| Federal Street Acquisition Corp. - Class A* | 35,128 | 342,498 | ||||||
| FinTech Acquisition Corp. II*†† | 426,825 | 4,374,956 | ||||||
| Gores Holdings II, Inc.* | 106,950 | 1,118,697 | ||||||
| Gores Holdings II, Inc., Class A* | 306,541 | 3,056,214 | ||||||
| GP Investments Acquisition Corp. (Cayman Islands)* | 484,108 | 4,599,026 | ||||||
| GTY Technology Holdings, Inc. (Cayman Islands)* | 10,755 | 112,497 | ||||||
| GTY Technology Holdings, Inc., Class A (Cayman Islands)*†† | 377,137 | 3,763,827 | ||||||
| Hennessy Capital Acquisition Corp. III* | 181,416 | 1,873,120 | ||||||
| Hennessy Capital Acquisition Corp. III* | 123,677 | 1,219,455 | ||||||
| Kayne Anderson Acquisition Corp., Class A* | 105,902 | 1,032,545 | ||||||
| Kayne Anderson Acquisition Corp., Class C* | 423,689 | 4,232,653 | ||||||
| Landcadia Holdings, Inc.* | 187,943 | 1,883,189 | ||||||
| Landcadia Holdings, Inc.* | 72,900 | 782,946 | ||||||
| M III Acquisition Corp.*†† | 281,242 | 2,764,609 | ||||||
| M III Acquisition Corp.* | 121,133 | 1,248,881 | ||||||
| Matlin and Partners Acquisition Corp.* | 376,592 | 3,822,409 | ||||||
| Matlin and Partners Acquisition Corp., Class A* | 91,103 | 884,610 | ||||||
| Modern Media Acquisition Corp.* | 164,441 | 1,718,408 | ||||||
| Pensare Acquisition Corp.* | 231,041 | 2,386,654 | ||||||
| Saban Capital Acquisition Corp. (Cayman Islands)* | 40,170 | 426,605 | ||||||
| Saban Capital Acquisition Corp., Class A (Cayman Island)* | 163,499 | 1,643,165 | ||||||
| Silver Run Acquisition Corp. II* | 438,789 | 4,703,818 | ||||||
| TPG Pace Energy Holdings Corp.* | 510,916 | 5,190,907 | ||||||
| TPG Pace Energy Holdings Corp., Class A* | 14,884 | 137,677 | ||||||
| TPG Pace Holdings Corp. (Cayman Islands)* | 438,133 | 4,512,770 | ||||||
| TPG Pace Holdings Corp., Class A (Cayman Islands)* | 58,550 | 556,225 | ||||||
| Vantage Energy Acquisition Corp., Class A* | 143,759 | 1,405,963 | ||||||
| Vantage Energy Acquisition Corp., Class C* | 334,180 | 3,398,611 | ||||||
| 79,079,662 | ||||||||
| Health Care — 10.6% | ||||||||
| Akorn, Inc.*†† | 126,138 | 4,186,520 | ||||||
| Alere, Inc.*†† | 127,560 | 6,504,284 | ||||||
| CR Bard, Inc.†† | 13,330 | 4,272,265 | ||||||
| Humana, Inc. | 2,500 | 609,075 | ||||||
| Kite Pharma, Inc.* | 22,270 | 4,004,369 | ||||||
| NxStage Medical, Inc.*†† | 4,600 | 126,960 | ||||||
| PAREXEL International Corp.*†† | 24,300 | 2,140,344 | ||||||
| VWR Corp.* | 25,341 | 839,041 | ||||||
| 22,682,858 | ||||||||
| Information Technology — 7.5% | ||||||||
| Brocade Communications Systems, Inc.†† | 486,180 | 5,809,851 | ||||||
| Dell Technologies, Inc. - Class V* | 45,830 | 3,538,534 | ||||||
| Nets A/S (Denmark), 144a* | 83,000 | 2,148,739 | ||||||
| NXP Semiconductors NV (Netherlands)* | 38,800 | 4,387,892 | ||||||
| Silver Spring Networks, Inc.* | 3,401 | 54,994 | ||||||
| VMware, Inc. - Class A* | 1,400 | 152,866 | ||||||
| 16,092,876 | ||||||||
| Consumer Discretionary — 6.5% | ||||||||
| Lennar Corp. - Class A | 23,600 | 1,246,080 | ||||||
| Lennar Corp. - Class B | 30,557 | 1,377,510 | ||||||
| Scripps Networks Interactive, Inc. - Class A | 24,150 | 2,074,244 | ||||||
| Time Warner, Inc.†† | 41,200 | 4,220,940 | ||||||
| Tribune Media Co., Class A†† | 124,510 | 5,087,479 | ||||||
| 14,006,253 | ||||||||
| Telecommunication Services — 3.2% | ||||||||
| Level 3 Communications, Inc.* | 74,080 | 3,947,723 | ||||||
| Straight Path Communications, Inc., Class B*†† | 16,186 | 2,924,325 | ||||||
| 6,872,048 | ||||||||
| Materials — 2.6% | ||||||||
| Calgon Carbon Corp.†† | 165,476 | 3,541,186 | ||||||
| Dominion Diamond Corp. (Canada)†† | 138,100 | 1,958,258 | ||||||
| 5,499,444 | ||||||||
| Industrials — 2.0% | ||||||||
| Orbital ATK, Inc.†† | 23,890 | 3,181,192 | ||||||
| Sparton Corp.* | 46,109 | 1,070,190 | ||||||
| 4,251,382 | ||||||||
| Energy — 1.9% | ||||||||
| Atwood Oceanics, Inc.* | 439,300 | 4,125,027 | ||||||
| Real Estate — 1.0% | ||||||||
| First Potomac Realty Trust | 111,200 | 1,238,768 | ||||||
| Forestar Group, Inc.* | 55,180 | 949,096 | ||||||
| 2,187,864 | ||||||||
| 82 |
Touchstone Merger Arbitrage Fund (Continued)
| Market | ||||||||
| Shares | Value | |||||||
| Common Stocks — 73.5% (Continued) | ||||||||
| Utilities — 0.9% | ||||||||
| Calpine Corp.*†† | 138,100 | $ | 2,036,975 | |||||
| Consumer Staples — 0.5% | ||||||||
| Rite Aid Corp.* | 525,002 | 1,029,004 | ||||||
| Total Common Stocks | $ | 157,863,393 | ||||||
| Principal Amount | ||||||||
| Corporate Bonds — 15.2% | ||||||||
| Financials — 5.4% | ||||||||
| $ | 1,000,000 | Allstate Corp. (The), (3M LIBOR | ||||||
| +1.935%), 3.250%, 5/15/37(A) | 985,000 | |||||||
| 2,200,000 | Banco Bilbao Vizcaya Argentaria SA | |||||||
| (Spain), 9.000%(B) | 2,277,000 | |||||||
| 1,000,000 | Barclays PLC (United Kingdom), | |||||||
| 8.250%(B) | 1,056,250 | |||||||
| 2,000,000 | Cloverie PLC for Zurich Insurance Co. | |||||||
| Ltd., EMTN, (Ireland), (USD 6 Year | ||||||||
| Swap Rate +6.840%), 8.250%(B) | 2,035,096 | |||||||
| 1,000,000 | Cooperatieve Rabobank UA | |||||||
| (Netherlands), 144a, 11.000%(B) | 1,130,000 | |||||||
| 500,000 | Corestates Capital III, 144a, (3M LIBOR | |||||||
| +0.570%), 1.885%, 2/15/27(A) | 473,750 | |||||||
| 500,000 | JPMorgan Chase Capital XIII, (3M | |||||||
| LIBOR +0.950%), 2.283%, 9/30/34(A) | 461,250 | |||||||
| 500,000 | JPMorgan Chase Capital XXIII, (3M | |||||||
| LIBOR +1.000%), 2.315%, 5/15/47(A) | 457,350 | |||||||
| 1,375,000 | Manufacturers & Traders Trust Co., (3M | |||||||
| LIBOR +0.640%), 1.956%, 12/1/21(A) | 1,360,828 | |||||||
| 375,000 | NB Capital Trust III, (3M LIBOR | |||||||
| +0.550%), 1.854%, 1/15/27(A) | 354,094 | |||||||
| 1,000,000 | Societe Generale SA, EMTN, (France), | |||||||
| 8.250%(B) | 1,057,400 | |||||||
| 11,648,018 | ||||||||
| Information Technology — 2.4% | ||||||||
| 4,050,000 | EMC Corp., 1.875%, 6/1/18 | 4,033,922 | ||||||
| 1,000,000 | QUALCOMM, Inc., (3M LIBOR | |||||||
| +0.360%), 1.676%, 5/20/19(A) | 1,003,844 | |||||||
| 5,037,766 | ||||||||
| Telecommunication Services — 1.4% | ||||||||
| 1,000,000 | Clearwire Communications LLC / | |||||||
| Clearwire Finance, Inc., 144a, | ||||||||
| 8.250%, 12/1/40 | 1,010,000 | |||||||
| 750,000 | Nexstar Broadcasting, Inc., 144a, | |||||||
| 6.125%, 2/15/22 | 781,875 | |||||||
| 1,200,000 | T-Mobile USA, Inc., 6.125%, 1/15/22 | 1,248,000 | ||||||
| 3,039,875 | ||||||||
| Materials — 1.4% | ||||||||
| 1,000,000 | Monsanto Co., 1.850%, 11/15/18 | 998,545 | ||||||
| 1,000,000 | Silgan Holdings, Inc., 5.500%, 2/1/22 | 1,026,250 | ||||||
| 1,000,000 | Vulcan Materials Co., (3M LIBOR | |||||||
| +0.600%), 1.920%, 6/15/20 (A) | 1,000,611 | |||||||
| 3,025,406 | ||||||||
| Consumer Discretionary — 1.3% | ||||||||
| 1,750,000 | Downstream Development Authority | |||||||
| of Quapaw Tribe of Oklahoma, | ||||||||
| 144a, 10.500%, 7/1/19 | 1,715,000 | |||||||
| 1,005,000 | LIN Television Corp., 5.875%, 11/15/22 | 1,047,712 | ||||||
| 2,762,712 | ||||||||
| Consumer Staples — 1.1% | ||||||||
| 2,250,000 | Post Holdings, Inc., 144a, | |||||||
| 6.000%, 12/15/22 | 2,356,875 | |||||||
| Energy — 0.9% | ||||||||
| 725,000 | Rice Energy, Inc., 6.250%, 5/1/22 | 757,625 | ||||||
| 1,100,000 | Sunoco LP / Sunoco Finance Corp., | |||||||
| 6.250%, 4/15/21 | 1,152,635 | |||||||
| 1,910,260 | ||||||||
| Health Care — 0.7% | ||||||||
| 1,500,000 | CR Bard, Inc., 1.375%, 1/15/18 | 1,498,607 | ||||||
| Industrials — 0.6% | ||||||||
| 1,200,000 | Jabil, Inc., 8.250%, 3/15/18 | 1,229,340 | ||||||
| Total Corporate Bonds | $ | 32,508,859 | ||||||
| Commercial Mortgage-Backed Securities — 1.9% | ||||||||
| 2,750,000 | CFCRE Mortgage Trust, Ser 2015-RUM, | |||||||
| Class C, 144a, (1M LIBOR +2.750%), | ||||||||
| 3.977%, 7/15/30(A) | 2,709,336 | |||||||
| 1,320,000 | GSCCRE Commercial Mortgage Trust, | |||||||
| Ser 2015-HULA, Class C, 144a, (1M | ||||||||
| LIBOR +2.750%), 3.984%, 8/15/32(A) | 1,324,113 | |||||||
| Total Commercial | ||||||||
| Mortgage-Backed Securities | $ | 4,033,449 | ||||||
| Shares | ||||||||
| Preferred Stock — 0.8% | ||||||||
| Utilities — 0.8% | ||||||||
| NextEra Energy Capital Holdings, Inc., | ||||||||
| 5.700% | 70,000 | 1,763,300 | ||||||
| Exchange Traded Funds — 0.6% | ||||||||
| Consumer Discretionary Select Sector | ||||||||
| SPDR Fund | 318 | 28,645 | ||||||
| Financial Select Sector SPDR Fund | 2,187 | 56,556 | ||||||
| Health Care Select Sector SPDR Fund | 201 | 16,428 | ||||||
| Industrial Select Sector SPDR Fund | 538 | 38,198 | ||||||
| iShares US Telecommunications ETF | 748 | 22,747 | ||||||
| Materials Select Sector SPDR Fund | 653 | $ | 37,090 | |||||
| SPDR S&P 500 ETF Trust | 4,100 | 1,030,043 | ||||||
| 83 |
Touchstone Merger Arbitrage Fund (Continued)
| Market | ||||||||
| Shares | Value | |||||||
| Exchange Traded Funds — 0.6% (Continued) | ||||||||
| Technology Select Sector SPDR Fund | 1,963 | 116,013 | ||||||
| Total Exchange Traded Funds | $ | 1,345,720 | ||||||
| Warrants — 0.3% | ||||||||
| Financials — 0.3% | ||||||||
| Avista Healthcare Public, Class A | ||||||||
| (Cayman Islands), Exp 12/2/21, | ||||||||
| Price $5.75* | 308,182 | $ | 123,273 | |||||
| Constellation Alpha Capital Corp., | ||||||||
| (British Virgin Islands), Exp 3/23/24, | ||||||||
| Price $11.50* | 350,000 | 80,500 | ||||||
| Double Eagle Acquisition Corp., Class | ||||||||
| A (Cayman Islands), Exp 10/16/20, | ||||||||
| Price $11.50* | 181,698 | 125,372 | ||||||
| Gores Holdings II, Inc., Class A, Exp | ||||||||
| 3/6/22, Price $11.50* | 50,425 | 71,604 | ||||||
| GP Investments Acqusition, Class C, | ||||||||
| Exp 5/26/22, Price $11.50* | 66,263 | 29,812 | ||||||
| GTY Technology Holdings, Inc., Class | ||||||||
| A (Cayman Islands), Exp 11/14/21, | ||||||||
| Price $11.50* | 59,477 | 69,588 | ||||||
| M III Acquisition Corp., Exp 8/29/21, | ||||||||
| Price $5.75* | 161,760 | 87,350 | ||||||
| Saban Capital Acquisition Corp., Class | ||||||||
| A (Cayman Islands), Exp 9/21/21, | ||||||||
| Price $11.50* | 21,247 | 25,071 | ||||||
| Silver Run Acquisition Corp. II, Class A, | ||||||||
| Exp 4/27/22, Price 11.50* | 68,070 | 103,466 | ||||||
| Total Warrants | $ | 716,036 | ||||||
| Number | ||||||||||||
| of | Notional | |||||||||||
| Contracts | Amount | |||||||||||
| Purchased Options — 0.0% | ||||||||||||
| Purchased Call Options — 0.0% | ||||||||||||
| VMware, Inc., Strike @ 116.00, | ||||||||||||
| Exp 10/17†† | 230 | $ | 2,511,370 | 1,150 | ||||||||
| VMware, Inc., Strike @110.00, | ||||||||||||
| Exp 10/17†† | 230 | 2,511,370 | 29,440 | |||||||||
| $ | 30,590 | |||||||||||
| Purchased Put Option — 0.0% | ||||||||||||
| SPDR S&P 500 ETF Trust., Strike | ||||||||||||
| @250.00, Exp 10/17†† | 100 | 2,512,300 | 3,700 | |||||||||
| Total Purchased Options | $ | 34,290 | ||||||||||
| Number | ||||||||
| of | ||||||||
| Rights | ||||||||
| Rights — 0.0% | ||||||||
| Media General, Inc. Exp 1/19/18, Strike | ||||||||
| Price $10.00(C) | 208,090 | $ | 20,809 | |||||
| Shares | ||||||||
| Short-Term Investment Fund — 20.2% | ||||||||
| Dreyfus Government Cash | ||||||||
| Management, Institutional Shares, | ||||||||
| 0.92%∞Ω | 43,344,884 | 43,344,884 | ||||||
| Total Long Positions | ||||||||
| (Cost $242,290,915) | $ | 241,630,740 | ||||||
| Securities Sold Short — (13.2%) | ||||||||
| Common Stocks — (8.3%) | ||||||||
| Information Technology — (2.4%) | ||||||||
| VMware, Inc. - Class A* | (47,230 | ) | (5,157,044 | ) | ||||
| Energy — (2.0%) | ||||||||
| Ensco PLC, Class A (United Kingdom) | (702,880 | ) | (4,196,194 | ) | ||||
| Telecommunication Services — (1.5%) | ||||||||
| AT&T, Inc. | (32,960 | ) | (1,291,043 | ) | ||||
| CenturyLink, Inc. | (105,836 | ) | (2,000,300 | ) | ||||
| (3,291,343 | ) | |||||||
| Consumer Discretionary — (1.5%) | ||||||||
| Lennar Corp. - Class A | (43,457 | ) | (2,294,530 | ) | ||||
| Sinclair Broadcast Group, Inc., Class A | (28,639 | ) | (917,880 | ) | ||||
| (3,212,410 | ) | |||||||
| Health Care — (0.9%) | ||||||||
| Becton Dickinson and Co. | (6,768 | ) | (1,326,190 | ) | ||||
| Humana, Inc. | (2,500 | ) | (609,075 | ) | ||||
| (1,935,265 | ) | |||||||
| Total Common Stocks | $ | (17,792,256 | ) | |||||
| Exchange Traded Funds — (4.9%) | ||||||||
| Consumer Staples Select Sector SPDR | ||||||||
| Fund | (680 | ) | (36,706 | ) | ||||
| Energy Select Sector SPDR Fund | (2,715 | ) | (185,923 | ) | ||||
| Real Estate Select Sector SPDR Fund | (2,425 | ) | (78,182 | ) | ||||
| SPDR S&P 500 ETF Trust | (41,000 | ) | (10,300,430 | ) | ||||
| Utilities Select Sector SPDR Fund | (418 | ) | (22,175 | ) | ||||
| Total Exchange Traded Funds | $ | (10,623,416 | ) | |||||
| Total Securities Sold Short | ||||||||
| (Proceeds $25,916,498) | $ | (28,415,672 | ) | |||||
| 84 |
Touchstone Merger Arbitrage Fund (Continued)
| Number | ||||||||||||
| of | Notional | Market | ||||||||||
| Contracts | Amount | Value | ||||||||||
| Written Options — (0.0%) | ||||||||||||
| Written Call Options — (0.0%) | ||||||||||||
| Calgon Carbon Corp., Strike | ||||||||||||
| @ 22.50, Exp 01/18 | (270 | ) | $ | (577,800 | ) | $ | (4,050 | ) | ||||
| Lennar Corp., Strike @ 50.00, | ||||||||||||
| Exp 10/17 | (107 | ) | (564,960 | ) | (35,310 | ) | ||||||
| VMware, Inc., Strike @ | ||||||||||||
| 114.00, Exp 10/17 | (460 | ) | (5,022,740 | ) | (13,800 | ) | ||||||
| $ | (53,160 | ) | ||||||||||
| Written Put Options — (0.0%) | ||||||||||||
| Lennar Corp., Strike @ 50.00, | ||||||||||||
| Exp 10/17 | (53 | ) | (279,840 | ) | (1,855 | ) | ||||||
| SPDR S&P 500 ETF Trust., | ||||||||||||
| Strike @ 2,475.00, | ||||||||||||
| Exp 10/17 | (86 | ) | (21,666,496 | ) | (860 | ) | ||||||
| SPDR S&P 500 ETF Trust., | ||||||||||||
| Strike @ 2,485.00, | ||||||||||||
| Exp 10/17 | (200 | ) | (50,387,200 | ) | (4,200 | ) | ||||||
| VMware, Inc., Strike @ 108.00, | ||||||||||||
| Exp 10/17 | (94 | ) | (1,026,386 | ) | (5,170 | ) | ||||||
| (12,085 | ) | |||||||||||
| Total Written Options | ||||||||||||
| (Premiums received $89,487) | $ | (65,245 | ) | |||||||||
| Total — 99.3% | $ | 213,149,823 | ||||||||||
| Cash Collateral for Securities | ||||||||||||
| Sold Short and Written Options — 1.7% | 3,641,369 | |||||||||||
| Liabilities in Excess of Other Assets — (1.0%) | (2,111,269 | ) | ||||||||||
| Net Assets — 100.0% | $ | 214,679,923 | ||||||||||
| (A) | Variable rate security - Rate reflected is the rate in effect as of September 30, 2017. |
| (B) | Perpetual Bond - A bond with no definite maturity date. |
| (C) | Level 3 - For more information on valuation inputs, and their aggregation into the levels used in the table below, please refer to the security valuation section in the accompanying Notes to Financial Statements. |
| * | Non-income producing security. |
| †† | All or a portion of these securities are pledged as collateral for securities sold short and written options. The total value of the securities pledged as collateral as of September 30, 2017 was $56,285,095. |
| ∞ | Open-End Fund. |
| Ω | Represents the 7-day SEC yield as of September 30, 2017. |
Portfolio Abbreviations:
DKK - Danish Krone
EMTN - Euro Medium Term Note
ETF - Exchange Traded Fund
LIBOR - London Interbank Offered Rate
LLC - Limited Liability Company
PLC - Public Limited Company
SPDR - Standard & Poor's Depositary Receipt
USD - United States Dollar
144a - This is a restricted security that was sold in a transaction qualifying for the exemption under Rule 144A of the Securities Act of 1933. This security may be sold in transactions exempt from registration, normally to qualified institutional buyers. At September 30, 2017, these securities were valued at $13,649,688 or 6.4% of net assets. These securities were deemed liquid pursuant to procedures approved by the Board of Trustees.
| 85 |
Touchstone Merger Arbitrage Fund (Continued)
Other Information:
The inputs or methodology used for valuing securities may not be an indication of the risk associated with investing in those securities. For more information on valuation inputs, and their aggregation into the levels used in the table below, please refer to the security valuation section in the accompanying Notes to Financial Statements.
Valuation inputs at Reporting Date:
| Description | Level 1 | Level 2 | Level 3 | Total | ||||||||||||
| Assets: | ||||||||||||||||
| Common Stocks | ||||||||||||||||
| Financials | $ | 77,361,254 | $ | 1,718,408 | $ | — | $ | 79,079,662 | ||||||||
| Health Care | 22,682,858 | — | — | 22,682,858 | ||||||||||||
| Information Technology | 16,092,876 | — | — | 16,092,876 | ||||||||||||
| Consumer Discretionary | 14,006,253 | — | — | 14,006,253 | ||||||||||||
| Telecommunication Services | 6,872,048 | — | — | 6,872,048 | ||||||||||||
| Materials | 5,499,444 | — | — | 5,499,444 | ||||||||||||
| Industrials | 4,251,382 | — | — | 4,251,382 | ||||||||||||
| Energy | 4,125,027 | — | — | 4,125,027 | ||||||||||||
| Real Estate | 1,238,768 | 949,096 | — | 2,187,864 | ||||||||||||
| Utilities | 2,036,975 | — | — | 2,036,975 | ||||||||||||
| Consumer Staples | 1,029,004 | — | — | 1,029,004 | ||||||||||||
| Corporate Bonds | — | 32,508,859 | — | 32,508,859 | ||||||||||||
| Commercial Mortgage-Backed Securities | — | 4,033,449 | — | 4,033,449 | ||||||||||||
| Preferred Stock | 1,763,300 | — | — | 1,763,300 | ||||||||||||
| Exchange Traded Funds | 1,345,720 | — | — | 1,345,720 | ||||||||||||
| Warrants | 716,036 | — | — | 716,036 | ||||||||||||
| Purchased Options Equity Contracts | 34,290 | — | — | 34,290 | ||||||||||||
| Rights | — | — | 20,809 | 20,809 | ||||||||||||
| Short-Term Investment Fund | 43,344,884 | — | — | 43,344,884 | ||||||||||||
| Other Financial Instruments** | ||||||||||||||||
| Forward Foreign Currency Contract | — | 10,864 | — | 10,864 | ||||||||||||
| Total Assets | $ | 202,400,119 | $ | 39,220,676 | $ | 20,809 | $ | 241,641,604 | ||||||||
| Liabilities: | ||||||||||||||||
| Securities Sold Short | ||||||||||||||||
| Common Stocks | $ | (17,792,256 | ) | $ | — | $ | — | $ | (17,792,256 | ) | ||||||
| Exchange Traded Funds | (10,623,416 | ) | — | — | (10,623,416 | ) | ||||||||||
| Other Financial Instruments** | ||||||||||||||||
| Written Options Equity Contracts | (65,245 | ) | — | — | (65,245 | ) | ||||||||||
| Total Liabilities | $ | (28,480,917 | ) | $ | — | $ | — | $ | (28,480,917 | ) | ||||||
| Total | $ | 173,919,202 | $ | 39,220,676 | $ | 20,809 | $ | 213,160,687 | ||||||||
** Other Financial Instruments are derivative instruments not reflected in total investments. Amounts shown represent market value for written option equity contracts and unrealized appreciation on forward foreign currency contracts.
Measurements Using Unobservable Inputs (Level 3)
| Assets | Rights | |||
| Beginning balance September 30, 2016 | $ | — | ||
| Unrealized gain from corporate action | 430,746 | |||
| Realized gain from distributions received | (409,937 | ) | ||
| Ending balance September 30, 2017 | $ | 20,809 | ||
| Net Change in Unrealized Appreciation/Depreciation for Investments in Securities still held at September 30, 2017 | $ | 20,809 | ||
| Valuation | Unobservable | |||||||
| Rights | Fair Value | Technique | Input | |||||
| Media General, Inc. Exp 1/19/18, Strike Price $10.00 | $ | 20,809 | Issuer Guidance | New Issuer | ||||
| 86 |
Touchstone Merger Arbitrage Fund (Continued)
Forward Foreign Currency Contracts
| Contract to | Unrealized | |||||||||||||
| Counterparty | Expiration Date | Receive | Deliver | Appreciation | ||||||||||
| Brown Brothers Harriman | 12/27/2017 | USD | 2,198,058 | DKK | 13,695,000 | $ | 10,864 | |||||||
| $ | 10,864 | |||||||||||||
See accompanying Notes to Financial Statements.
| 87 |
Touchstone Mid Cap Fund – September 30, 2017
| Market | ||||||||
| Shares | Value | |||||||
| Common Stocks — 99.0% | ||||||||
| Consumer Discretionary — 26.3% | ||||||||
| CarMax, Inc.* | 438,110 | $ | 33,213,119 | |||||
| Deckers Outdoor Corp.* | 193,000 | 13,203,130 | ||||||
| Dollar Tree, Inc.* | 275,330 | 23,904,151 | ||||||
| Hasbro, Inc. | 280,950 | 27,440,387 | ||||||
| Penske Automotive Group, Inc. | 489,634 | 23,291,889 | ||||||
| PulteGroup, Inc. | 1,197,560 | 32,729,315 | ||||||
| Tiffany & Co. | 292,200 | 26,818,116 | ||||||
| Whirlpool Corp. | 127,380 | 23,493,967 | ||||||
| 204,094,074 | ||||||||
| Financials — 19.0% | ||||||||
| Alleghany Corp.* | 57,710 | 31,971,917 | ||||||
| M&T Bank Corp. | 205,860 | 33,151,694 | ||||||
| Progressive Corp. (The) | 746,230 | 36,132,457 | ||||||
| T Rowe Price Group, Inc. | 304,580 | 27,610,177 | ||||||
| Voya Financial, Inc. | 476,310 | 19,000,006 | ||||||
| 147,866,251 | ||||||||
| Industrials — 16.8% | ||||||||
| Armstrong World Industries, Inc.* | 497,220 | 25,482,525 | ||||||
| Cintas Corp. | 357,650 | 51,601,742 | ||||||
| Copart, Inc.* | 677,268 | 23,277,701 | ||||||
| Old Dominion Freight Line, Inc. | 273,920 | 30,161,331 | ||||||
| 130,523,299 | ||||||||
| Information Technology — 15.1% | ||||||||
| Amphenol Corp. - Class A | 408,340 | 34,561,898 | ||||||
| Citrix Systems, Inc.* | 309,520 | 23,777,326 | ||||||
| Paychex, Inc. | 505,040 | 30,282,198 | ||||||
| Symantec Corp. | 876,340 | 28,752,715 | ||||||
| 117,374,137 | ||||||||
| Materials — 11.8% | ||||||||
| Ball Corp. | 798,580 | 32,981,354 | ||||||
| NewMarket Corp. | 74,350 | 31,654,513 | ||||||
| Vulcan Materials Co. | 225,820 | 27,008,072 | ||||||
| 91,643,939 | ||||||||
| Consumer Staples — 10.0% | ||||||||
| Brown-Forman Corp. - Class B | 421,520 | 22,888,536 | ||||||
| Edgewell Personal Care Co.* | 215,130 | 15,655,010 | ||||||
| Energizer Holdings, Inc. | 346,621 | 15,961,897 | ||||||
| Post Holdings, Inc.* | 265,872 | 23,468,521 | ||||||
| 77,973,964 | ||||||||
| Total Common Stocks | $ | 769,475,664 | ||||||
| Short-Term Investment Fund — 1.1% | ||||||||
| Dreyfus Government Cash | ||||||||
| Management, Institutional Shares, | ||||||||
| 0.92%∞Ω | 8,406,422 | $ | 8,406,422 | |||||
| Total Investment Securities —100.1% | ||||||||
| (Cost $617,148,867) | $ | 777,882,086 | ||||||
| Liabilities in Excess of Other Assets — (0.1%) | (924,012 | ) | ||||||
| Net Assets — 100.0% | $ | 776,958,074 | ||||||
| * | Non-income producing security. |
| ∞ | Open-End Fund. |
| Ω | Represents the 7-day SEC yield as of September 30, 2017. |
Other Information:
The inputs or methodology used for valuing securities may not be an indication of the risk associated with investing in those securities. For more information on valuation inputs, and their aggregation into the levels used in the table below, please refer to the security valuation section in the accompanying Notes to Financial Statements.
Valuation inputs at Reporting Date:
| Description | Level 1 | Level 2 | Level 3 | Total | ||||||||||||
| Common Stocks | $ | 769,475,664 | $ | — | $ | — | $ | 769,475,664 | ||||||||
| Short-Term Investment Fund | 8,406,422 | — | — | 8,406,422 | ||||||||||||
| Total | $ | 777,882,086 | $ | — | $ | — | $ | 777,882,086 | ||||||||
See accompanying Notes to Financial Statements.
| 88 |
Touchstone Mid Cap Value Fund – September 30, 2017
| Market | ||||||||
| Shares | Value | |||||||
| Common Stocks — 95.5% | ||||||||
| Financials — 18.5% | ||||||||
| Allstate Corp. (The) | 119,531 | $ | 10,986,094 | |||||
| Ameriprise Financial, Inc. | 76,198 | 11,316,165 | ||||||
| Blackstone Mortgage Trust, Inc. - Class A, REIT† | 333,224 | 10,336,608 | ||||||
| E*TRADE Financial Corp.* | 209,544 | 9,138,214 | ||||||
| Hanover Insurance Group, Inc. (The) | 76,387 | 7,404,192 | ||||||
| Hartford Financial Services Group, Inc. (The) | 183,092 | 10,148,790 | ||||||
| M&T Bank Corp. | 60,543 | 9,749,845 | ||||||
| Reinsurance Group of America, Inc. | 76,387 | 10,658,278 | ||||||
| Signature Bank* | 79,216 | 10,142,817 | ||||||
| SLM Corp.* | 853,171 | 9,785,871 | ||||||
| SVB Financial Group* | 54,272 | 10,153,748 | ||||||
| TCF Financial Corp. | 413,524 | 7,046,449 | ||||||
| Unum Group | 200,821 | 10,267,978 | ||||||
| 127,135,049 | ||||||||
| Industrials — 12.7% | ||||||||
| Aercap Holdings N.V. (Netherlands)* | 250,095 | 12,782,355 | ||||||
| Clean Harbors, Inc.* | 129,291 | 7,330,800 | ||||||
| Dover Corp. | 141,975 | 12,975,095 | ||||||
| Fluor Corp. | 129,810 | 5,465,001 | ||||||
| KAR Auction Services, Inc. | 234,535 | 11,196,701 | ||||||
| Parker-Hannifin Corp. | 47,954 | 8,392,909 | ||||||
| Regal-Beloit Corp. | 140,089 | 11,067,031 | ||||||
| Snap-on, Inc. | 65,589 | 9,773,417 | ||||||
| Stericycle, Inc.* | 119,719 | 8,574,275 | ||||||
| 87,557,584 | ||||||||
| Information Technology — 11.2% | ||||||||
| Cadence Design Systems, Inc.* | 196,719 | 7,764,499 | ||||||
| CSRA, Inc. | 365,901 | 11,807,625 | ||||||
| Diebold Nixdorf, Inc.† | 268,060 | 6,125,171 | ||||||
| Fidelity National Information Services, Inc. | 120,945 | 11,295,054 | ||||||
| MACOM Technology Solutions Holdings, Inc.* | 227,085 | 10,130,262 | ||||||
| PTC, Inc.* | 163,146 | 9,181,857 | ||||||
| Qorvo, Inc.* | 137,260 | 9,701,537 | ||||||
| Synopsys, Inc.* | 138,533 | 11,156,062 | ||||||
| 77,162,067 | ||||||||
| Consumer Discretionary — 10.8% | ||||||||
| Aramark | 248,209 | 10,079,768 | ||||||
| BorgWarner, Inc. | 240,335 | 12,312,362 | ||||||
| Carter's, Inc. | 53,904 | 5,323,020 | ||||||
| Dollar General Corp. | 93,126 | 7,547,862 | ||||||
| Dollar Tree, Inc.* | 118,541 | 10,291,730 | ||||||
| Harley-Davidson, Inc. | 135,421 | 6,528,646 | ||||||
| LKQ Corp.* | 496,229 | 17,859,282 | ||||||
| Michaels Cos., Inc. (The)* | 210,582 | 4,521,196 | ||||||
| 74,463,866 | ||||||||
| Utilities — 8.2% | ||||||||
| DTE Energy Co. | 107,790 | 11,572,334 | ||||||
| Edison International | 135,185 | 10,432,226 | ||||||
| Great Plains Energy, Inc. | 252,453 | 7,649,326 | ||||||
| Pinnacle West Capital Corp. | 143,060 | 12,097,154 | ||||||
| PPL Corp. | 210,864 | 8,002,289 | ||||||
| Westar Energy, Inc. | 142,447 | 7,065,371 | ||||||
| 56,818,700 | ||||||||
| Real Estate — 8.0% | ||||||||
| Alexandria Real Estate Equities, Inc., REIT | 94,257 | 11,213,755 | ||||||
| American Campus Communities, Inc., REIT | 205,866 | 9,088,984 | ||||||
| Brixmor Property Group, Inc., REIT | 474,586 | 8,922,217 | ||||||
| Equinix, Inc., REIT | 19,380 | 8,649,294 | ||||||
| Host Hotels & Resorts, Inc., REIT | 438,609 | 8,109,880 | ||||||
| Mid-America Apartment Communities, Inc., REIT | 84,921 | 9,076,356 | ||||||
| 55,060,486 | ||||||||
| Materials — 7.9% | ||||||||
| Allegheny Technologies, Inc.*† | 289,891 | 6,928,395 | ||||||
| Bemis Co., Inc. | 163,901 | 7,468,969 | ||||||
| FMC Corp. | 97,464 | 8,704,510 | ||||||
| Olin Corp. | 202,754 | 6,944,325 | ||||||
| PPG Industries, Inc. | 81,903 | 8,899,580 | ||||||
| Sonoco Products Co. | 108,235 | 5,460,456 | ||||||
| Valvoline, Inc. | 418,428 | 9,812,137 | ||||||
| 54,218,372 | ||||||||
| Energy — 6.5% | ||||||||
| Anadarko Petroleum Corp. | 187,005 | 9,135,194 | ||||||
| Cimarex Energy Co. | 91,894 | 10,445,591 | ||||||
| EQT Corp. | 145,559 | 9,496,269 | ||||||
| Newfield Exploration Co.* | 237,835 | 7,056,564 | ||||||
| Noble Energy, Inc. | 292,343 | 8,290,847 | ||||||
| 44,424,465 | ||||||||
| Health Care — 6.1% | ||||||||
| AmerisourceBergen Corp. | 57,196 | 4,732,969 | ||||||
| Charles River Laboratories International, Inc.* | 88,457 | 9,555,125 | ||||||
| DENTSPLY SIRONA, Inc. | 158,667 | 9,489,873 | ||||||
| Envision Healthcare Corp.* | 202,236 | 9,090,508 | ||||||
| Patterson Cos., Inc. | 242,173 | 9,359,986 | ||||||
| 42,228,461 | ||||||||
| Consumer Staples — 5.6% | ||||||||
| Darling Ingredients, Inc.* | 385,138 | 6,747,618 | ||||||
| Hain Celestial Group, Inc. (The)* | 240,355 | 9,890,608 | ||||||
| Kroger Co. (The) | 357,743 | 7,176,325 | ||||||
| TreeHouse Foods, Inc.* | 105,621 | 7,153,710 | ||||||
| Tyson Foods, Inc. - Class A | 109,865 | 7,739,989 | ||||||
| 38,708,250 | ||||||||
| Total Common Stocks | $ | 657,777,300 | ||||||
| 89 |
Touchstone Mid Cap Value Fund (Continued)
| Market | ||||||||
| Shares | Value | |||||||
| Exchange Traded Fund — 1.9% | ||||||||
| iShares Russell Mid-Cap Value ETF | 159,091 | $ | 13,511,599 | |||||
| Short-Term Investment Funds — 5.8% | ||||||||
| Dreyfus Government Cash | ||||||||
| Management, Institutional Shares, | ||||||||
| 0.92%∞Ω | 20,619,870 | 20,619,870 | ||||||
| Invesco Government & Agency | ||||||||
| Portfolio, Institutional Class, | ||||||||
| 0.93%**∞Ω | 19,265,914 | 19,265,914 | ||||||
| Total Short-Term Investment Funds | $ | 39,885,784 | ||||||
| Total Investment Securities —103.2% | ||||||||
| (Cost $615,799,281) | $ | 711,174,683 | ||||||
| Liabilities in Excess of Other Assets — (3.2%) | (22,353,902 | ) | ||||||
| Net Assets — 100.0% | $ | 688,820,781 | ||||||
| * | Non-income producing security. |
| ** | Represents collateral for securities loaned. |
| † | All or a portion of the security is on loan. The total market value of the securities on loan as of September 30, 2017 was $18,923,622. |
| ∞ | Open-End Fund. |
| Ω | Represents the 7-day SEC yield as of September 30, 2017. |
Portfolio Abbreviations:
ETF - Exchange Traded Fund
REIT - Real Estate Investment Trust
Other Information:
The inputs or methodology used for valuing securities may not be an indication of the risk associated with investing in those securities. For more information on valuation inputs, and their aggregation into the levels used in the table below, please refer to the security valuation section in the accompanying Notes to Financial Statements.
Valuation inputs at Reporting Date:
| Description | Level 1 | Level 2 | Level 3 | Total | ||||||||||||
| Common Stocks | $ | 657,777,300 | $ | — | $ | — | $ | 657,777,300 | ||||||||
| Exchanged Traded Fund | 13,511,599 | — | — | 13,511,599 | ||||||||||||
| Short-Term Investment Funds | 39,885,784 | — | — | 39,885,784 | ||||||||||||
| Total | $ | 711,174,683 | $ | — | $ | — | $ | 711,174,683 | ||||||||
See accompanying Notes to Financial Statements.
| 90 |
Touchstone Premium Yield Equity Fund – September 30, 2017
| Market | ||||||||
| Shares | Value | |||||||
| Common Stocks — 97.3% | ||||||||
| Information Technology — 16.4% | ||||||||
| Cisco Systems, Inc. | 130,958 | $ | 4,404,118 | |||||
| Cypress Semiconductor Corp. | 221,163 | 3,321,868 | ||||||
| HP, Inc. | 122,482 | 2,444,741 | ||||||
| International Business Machines Corp. | 9,845 | 1,428,313 | ||||||
| Microchip Technology, Inc. | 14,424 | 1,294,987 | ||||||
| QUALCOMM, Inc. | 42,584 | 2,207,555 | ||||||
| Taiwan Semiconductor Manufacturing | ||||||||
| Co. Ltd., ADR | 73,950 | 2,776,822 | ||||||
| Western Digital Corp. | 21,750 | 1,879,200 | ||||||
| 19,757,604 | ||||||||
| Real Estate — 15.7% | ||||||||
| Crown Castle International Corp., REIT | 37,547 | 3,753,949 | ||||||
| Digital Realty Trust, Inc., REIT | 27,170 | 3,215,026 | ||||||
| Hospitality Properties Trust, REIT | 73,492 | 2,093,787 | ||||||
| Lamar Advertising Co. - Class A, REIT | 42,355 | 2,902,588 | ||||||
| Ventas, Inc., REIT | 32,511 | 2,117,441 | ||||||
| Welltower, Inc., REIT | 17,400 | 1,222,872 | ||||||
| Weyerhaeuser Co., REIT | 105,774 | 3,599,489 | ||||||
| 18,905,152 | ||||||||
| Health Care — 14.9% | ||||||||
| Abbott Laboratories | 54,261 | 2,895,367 | ||||||
| AbbVie, Inc. | 29,992 | 2,665,089 | ||||||
| GlaxoSmithKline PLC, ADR | 54,947 | 2,230,848 | ||||||
| Johnson & Johnson | 22,895 | 2,976,579 | ||||||
| Merck & Co., Inc. | 62,274 | 3,987,404 | ||||||
| Pfizer, Inc. | 90,205 | 3,220,319 | ||||||
| 17,975,606 | ||||||||
| Financials — 10.7% | ||||||||
| Bank of Montreal (Canada) | 34,113 | 2,582,695 | ||||||
| BB&T Corp. | 78,987 | 3,707,650 | ||||||
| CME Group, Inc. | 19,003 | 2,578,327 | ||||||
| PacWest Bancorp | 26,787 | 1,353,011 | ||||||
| Toronto-Dominion Bank (The) (Canada) | 48,766 | 2,744,063 | ||||||
| 12,965,746 | ||||||||
| Consumer Discretionary — 10.0% | ||||||||
| Coach, Inc. | 69,600 | 2,803,488 | ||||||
| Cracker Barrel Old Country Store, Inc.† | 13,279 | 2,013,362 | ||||||
| Hanesbrands, Inc. | 99,821 | 2,459,589 | ||||||
| L Brands, Inc. | 26,329 | 1,095,550 | ||||||
| Target Corp. | 42,801 | 2,525,687 | ||||||
| Tupperware Brands Corp. | 19,918 | 1,231,331 | ||||||
| 12,129,007 | ||||||||
| Energy — 8.4% | ||||||||
| Enbridge, Inc. (Canada) | 87,916 | 3,678,405 | ||||||
| ONEOK, Inc. | 51,971 | 2,879,713 | ||||||
| Pembina Pipeline Corp. (Canada) | 32,053 | 1,125,060 | ||||||
| Williams Cos., Inc. (The) | 80,132 | 2,404,761 | ||||||
| 10,087,939 | ||||||||
| Telecommunication Services — 8.0% | ||||||||
| AT&T, Inc. | 76,926 | 3,013,191 | ||||||
| BCE, Inc. (Canada) | 65,937 | 3,087,830 | ||||||
| Verizon Communications, Inc. | 25,871 | 1,280,356 | ||||||
| Vodafone Group PLC, ADR | 79,674 | 2,267,522 | ||||||
| 9,648,899 | ||||||||
| Industrials — 6.3% | ||||||||
| Covanta Holding Corp. | 48,308 | 717,374 | ||||||
| Eaton Corp. PLC (Ireland) | 27,932 | 2,144,898 | ||||||
| Pitney Bowes, Inc. | 187,591 | 2,628,150 | ||||||
| United Parcel Service, Inc. - Class B | 17,858 | 2,144,567 | ||||||
| 7,634,989 | ||||||||
| Materials — 5.1% | ||||||||
| International Paper Co. | 57,008 | 3,239,195 | ||||||
| LyondellBasell Industries NV - Class A | ||||||||
| (Netherlands) | 29,992 | 2,970,708 | ||||||
| 6,209,903 | ||||||||
| Utilities — 1.8% | ||||||||
| National Grid PLC, ADR | 35,029 | 2,196,669 | ||||||
| Total Common Stocks | $ | 117,511,514 | ||||||
| Short-Term Investment Funds — 4.4% | ||||||||
| Dreyfus Government Cash | ||||||||
| Management, Institutional Shares, | ||||||||
| 0.92%∞Ω | 3,310,094 | 3,310,094 | ||||||
| Invesco Government & Agency | ||||||||
| Portfolio, Institutional Class, | ||||||||
| 0.93%**∞Ω | 2,017,911 | 2,017,911 | ||||||
| Total Short-Term Investment Funds | $ | 5,328,005 | ||||||
| Total Investment Securities —101.7% | ||||||||
| (Cost $105,333,633) | $ | 122,839,519 | ||||||
| Liabilities in Excess of Other Assets — (1.7%) | (2,027,323 | ) | ||||||
| Net Assets — 100.0% | $ | 120,812,196 | ||||||
| ** | Represents collateral for securities loaned. |
| † | All or a portion of the security is on loan. The total market value of the securities on loan as of September 30, 2017 was $1,993,197. |
| ∞ | Open-End Fund. |
| Ω | Represents the 7-day SEC yield as of September 30, 2017. |
| 91 |
Touchstone Premium Yield Equity Fund (Continued)
Portfolio Abbreviations:
ADR - American Depositary Receipt
PLC - Public Limited Company
REIT - Real Estate Investment Trust
Other Information:
The inputs or methodology used for valuing securities may not be an indication of the risk associated with investing in those securities. For more information on valuation inputs, and their aggregation into the levels used in the table below, please refer to the security valuation section in the accompanying Notes to Financial Statements.
Valuation inputs at Reporting Date:
| Description | Level 1 | Level 2 | Level 3 | Total | ||||||||||||
| Common Stocks | $ | 117,511,514 | $ | — | $ | — | $ | 117,511,514 | ||||||||
| Short-Term Investment Funds | 5,328,005 | — | — | 5,328,005 | ||||||||||||
| Total | $ | 122,839,519 | $ | — | $ | — | $ | 122,839,519 | ||||||||
See accompanying Notes to Financial Statements.
| 92 |
Touchstone Sands Capital Select Growth Fund – September 30, 2017
| Market | ||||||||
| Shares | Value | |||||||
| Common Stocks — 97.8% | ||||||||
| Information Technology — 54.2% | ||||||||
| Activision Blizzard, Inc. | 786,000 | $ | 50,704,860 | |||||
| Adobe Systems, Inc.* | 731,634 | 109,145,160 | ||||||
| Alibaba Group Holding Ltd. ADR* | 894,867 | 154,552,479 | ||||||
| Alphabet, Inc. - Class A* | 120,500 | 117,333,260 | ||||||
| Alphabet, Inc. - Class C* | 20,600 | 19,757,666 | ||||||
| Baidu, Inc. ADR* | 467,480 | 115,790,121 | ||||||
| CoStar Group, Inc.* | 178,598 | 47,908,913 | ||||||
| Facebook, Inc. - Class A* | 940,880 | 160,768,166 | ||||||
| Palo Alto Networks, Inc.* | 365,000 | 52,596,500 | ||||||
| salesforce.com, Inc.* | 1,574,612 | 147,100,253 | ||||||
| ServiceNow, Inc.* | 903,000 | 106,129,590 | ||||||
| Snap, Inc. - Class A*† | 1,670,924 | 24,295,235 | ||||||
| Splunk Inc.* | 964,844 | 64,094,587 | ||||||
| Visa, Inc. - Class A | 1,735,699 | 182,664,963 | ||||||
| 1,352,841,753 | ||||||||
| Consumer Discretionary — 19.1% | ||||||||
| Amazon.com, Inc.* | 144,000 | 138,434,400 | ||||||
| Chipotle Mexican Grill, Inc.* | 143,500 | 44,173,605 | ||||||
| Netflix, Inc.* | 626,000 | 113,525,100 | ||||||
| Priceline Group, Inc. (The)* | 62,400 | 114,243,168 | ||||||
| Starbucks Corp. | 750,000 | 40,282,500 | ||||||
| Under Armour, Inc. - Class A*† | 803,000 | 13,233,440 | ||||||
| Under Armour, Inc. - Class C*† | 814,019 | 12,226,565 | ||||||
| 476,118,778 | ||||||||
| Health Care — 18.2% | ||||||||
| Alexion Pharmaceuticals, Inc.* | 574,230 | 80,558,727 | ||||||
| athenahealth, Inc.* | 70,169 | 8,726,217 | ||||||
| Biogen, Inc.* | 144,090 | 45,117,461 | ||||||
| BioMarin Pharmaceutical, Inc.* | 583,681 | 54,323,191 | ||||||
| Edwards Lifesciences Corp.* | 472,677 | 51,668,323 | ||||||
| Illumina, Inc.* | 355,396 | 70,794,883 | ||||||
| Incyte Corp.* | 537,062 | 62,696,618 | ||||||
| Regeneron Pharmaceuticals, Inc.* | 177,500 | 79,363,800 | ||||||
| 453,249,220 | ||||||||
| Financials — 3.5% | ||||||||
| Charles Schwab Corp. (The) | 1,605,000 | 70,202,700 | ||||||
| LendingClub Corp.* | 2,723,000 | 16,583,070 | ||||||
| 86,785,770 | ||||||||
| Consumer Staples — 2.8% | ||||||||
| Monster Beverage Corp.* | 1,278,000 | 70,609,500 | ||||||
| Total Common Stocks | $ | 2,439,605,021 | ||||||
| Short-Term Investment Funds — 5.2% | ||||||||
| Dreyfus Government Cash | ||||||||
| Management, Institutional Shares, | ||||||||
| 0.92%∞Ω | 80,646,919 | 80,646,919 | ||||||
| Invesco Government & Agency | ||||||||
| Portfolio, Institutional Class, | ||||||||
| 0.93%**∞Ω | 50,169,710 | 50,169,710 | ||||||
| Total Short-Term Investment Funds | $ | 130,816,629 | ||||||
| Total Investment Securities —103.0% | ||||||||
| (Cost $1,327,436,750) | $ | 2,570,421,650 | ||||||
| Liabilities in Excess of Other Assets — (3.0%) | (74,640,137 | ) | ||||||
| Net Assets — 100.0% | $ | 2,495,781,513 | ||||||
| * | Non-income producing security. |
| ** | Represents collateral for securities loaned. |
| † | All or a portion of the security is on loan. The total market value of the securities on loan as of September 30, 2017 was $49,257,364. |
| ∞ | Open-End Fund. |
| Ω | Represents the 7-day SEC yield as of September 30, 2017. |
Portfolio Abbreviation:
ADR - American Depositary Receipt
Other Information:
The inputs or methodology used for valuing securities may not be an indication of the risk associated with investing in those securities. For more information on valuation inputs, and their aggregation into the levels used in the table below, please refer to the security valuation section in the accompanying Notes to Financial Statements.
Valuation inputs at Reporting Date:
| Description | Level 1 | Level 2 | Level 3 | Total | ||||||||||||
| Common Stocks | $ | 2,439,605,021 | $ | — | $ | — | $ | 2,439,605,021 | ||||||||
| Short-Term Investment Funds | 130,816,629 | — | — | 130,816,629 | ||||||||||||
| Total | $ | 2,570,421,650 | $ | — | $ | — | $ | 2,570,421,650 | ||||||||
See accompanying Notes to Financial Statements.
| 93 |
Touchstone Small Cap Fund – September 30, 2017
| Market | ||||||||
| Shares | Value | |||||||
| Common Stocks — 96.7% | ||||||||
| Industrials — 28.6% | ||||||||
| Armstrong World Industries, Inc.* | 152,850 | $ | 7,833,563 | |||||
| GATX Corp.† | 176,300 | 10,853,028 | ||||||
| Kaman Corp. | 161,884 | 9,029,890 | ||||||
| Landstar System, Inc. | 128,770 | 12,831,930 | ||||||
| Matson, Inc. | 153,895 | 4,336,761 | ||||||
| Orbital ATK, Inc. | 84,842 | 11,297,561 | ||||||
| USG Corp.* | 291,990 | 9,533,474 | ||||||
| 65,716,207 | ||||||||
| Consumer Discretionary — 20.2% | ||||||||
| Cooper Tire & Rubber Co. | 177,480 | 6,637,752 | ||||||
| Deckers Outdoor Corp.* | 42,500 | 2,907,425 | ||||||
| MSG Networks, Inc., Class A* | 205,230 | 4,350,876 | ||||||
| Penske Automotive Group, Inc. | 203,720 | 9,690,960 | ||||||
| Service Corp. International | 323,760 | 11,169,720 | ||||||
| Sturm Ruger & Co., Inc.† | 114,512 | 5,920,270 | ||||||
| Tempur Sealy International, Inc.*† | 87,180 | 5,624,854 | ||||||
| 46,301,857 | ||||||||
| Materials — 15.9% | ||||||||
| Ingevity Corp.* | 126,210 | 7,884,339 | ||||||
| NewMarket Corp. | 33,033 | 14,063,800 | ||||||
| Olin Corp. | 348,690 | 11,942,632 | ||||||
| Tredegar Corp. | 137,363 | 2,472,534 | ||||||
| 36,363,305 | ||||||||
| Real Estate — 10.2% | ||||||||
| Alexander & Baldwin, Inc. | 254,158 | 11,775,140 | ||||||
| First Industrial Realty Trust, Inc. REIT | 312,821 | 9,412,784 | ||||||
| Tejon Ranch Co.* | 106,071 | 2,238,098 | ||||||
| 23,426,022 | ||||||||
| Financials — 7.5% | ||||||||
| Eaton Vance Corp. | 116,719 | 5,762,417 | ||||||
| MBIA, Inc.* | 462,584 | 4,024,481 | ||||||
| White Mountains Insurance Group Ltd. | ||||||||
| (Bermuda)* | 8,549 | 7,326,493 | ||||||
| 17,113,391 | ||||||||
| Consumer Staples — 7.3% | ||||||||
| Energizer Holdings, Inc. | 180,440 | 8,309,262 | ||||||
| PriceSmart, Inc. | 95,665 | 8,538,101 | ||||||
| 16,847,363 | ||||||||
| Information Technology — 3.3% | ||||||||
| DST Systems, Inc. | 138,090 | 7,578,379 | ||||||
| Energy — 2.1% | ||||||||
| Dril-Quip, Inc.* | 109,290 | 4,825,154 | ||||||
| Health Care — 1.6% | ||||||||
| Bruker Corp. | 125,020 | 3,719,345 | ||||||
| Total Common Stocks | $ | 221,891,023 | ||||||
| Short-Term Investment Funds — 11.3% | ||||||||
| Dreyfus Government Cash | ||||||||
| Management, Institutional Shares, | ||||||||
| 0.92%∞Ω | 7,402,806 | 7,402,806 | ||||||
| Invesco Government & Agency | ||||||||
| Portfolio, Institutional Class, | ||||||||
| 0.93%**∞Ω | 18,630,416 | 18,630,416 | ||||||
| Total Short-Term Investment Funds | $ | 26,033,222 | ||||||
| Total Investment Securities —108.0% | ||||||||
| (Cost $170,906,193) | $ | 247,924,245 | ||||||
| Liabilities in Excess of Other Assets — (8.0%) | (18,367,322 | ) | ||||||
| Net Assets — 100.0% | $ | 229,556,923 | ||||||
| * | Non-income producing security. |
| ** | Represents collateral for securities loaned. |
| † | All or a portion of the security is on loan. The total market value of the securities on loan as of September 30, 2017 was $17,878,002. |
| ∞ | Open-End Fund. |
| Ω | Represents the 7-day SEC yield as of September 30, 2017. |
Portfolio Abbreviation:
REIT - Real Estate Investment Trust
Other Information:
The inputs or methodology used for valuing securities may not be an indication of the risk associated with investing in those securities. For more information on valuation inputs, and their aggregation into the levels used in the table below, please refer to the security valuation section in the accompanying Notes to Financial Statements.
Valuation inputs at Reporting Date:
| Description | Level 1 | Level 2 | Level 3 | Total | ||||||||||||
| Common Stocks | $ | 221,891,023 | $ | — | $ | — | $ | 221,891,023 | ||||||||
| Short-Term Investment Funds | 26,033,222 | — | — | 26,033,222 | ||||||||||||
| Total | $ | 247,924,245 | $ | — | $ | — | $ | 247,924,245 | ||||||||
See accompanying Notes to Financial Statements.
| 94 |
Touchstone Small Cap Value Fund – September 30, 2017
| Market | ||||||||
| Shares | Value | |||||||
| Common Stocks — 98.4% | ||||||||
| Financials — 28.3% | ||||||||
| Banc of California, Inc.† | 19,459 | $ | 403,774 | |||||
| Bank of NT Butterfield & Son Ltd. (The) | ||||||||
| (Bermuda) | 26,287 | 963,156 | ||||||
| BankUnited, Inc. | 42,208 | 1,501,339 | ||||||
| Blackstone Mortgage Trust, Inc. - Class A | ||||||||
| REIT† | 51,546 | 1,598,957 | ||||||
| Chemical Financial Corp. | 21,928 | 1,145,957 | ||||||
| Federated Investors, Inc. - Class B | 12,077 | 358,687 | ||||||
| First Horizon National Corp. | 72,848 | 1,395,039 | ||||||
| FNB Corp. | 119,232 | 1,672,825 | ||||||
| Hancock Holding Co. | 24,281 | 1,176,415 | ||||||
| Hanover Insurance Group, Inc. (The) | 13,237 | 1,283,062 | ||||||
| Hercules Capital, Inc. | 74,060 | 955,374 | ||||||
| Horace Mann Educators Corp. | 35,754 | 1,406,920 | ||||||
| IBERIABANK Corp. | 20,657 | 1,696,973 | ||||||
| Infinity Property & Casualty Corp. | 9,971 | 939,268 | ||||||
| MB Financial, Inc. | 29,269 | 1,317,690 | ||||||
| National General Holdings Corp. | 20,210 | 386,213 | ||||||
| SLM Corp.* | 130,081 | 1,492,029 | ||||||
| Sterling Bancorp | 83,860 | 2,067,149 | ||||||
| TCF Financial Corp. | 59,263 | 1,009,842 | ||||||
| Univest Corp. of Pennsylvania | 42,314 | 1,354,048 | ||||||
| Validus Holdings Ltd. (Bermuda) | 18,781 | 924,213 | ||||||
| 25,048,930 | ||||||||
| Industrials — 20.6% | ||||||||
| Actuant Corp. - Class A | 27,505 | 704,128 | ||||||
| Altra Industrial Motion Corp. | 14,704 | 707,262 | ||||||
| Clean Harbors, Inc.* | 16,259 | 921,885 | ||||||
| EMCOR Group, Inc. | 17,202 | 1,193,475 | ||||||
| EnPro Industries, Inc. | 19,558 | 1,575,005 | ||||||
| Generac Holdings, Inc.* | 21,213 | 974,313 | ||||||
| Hexcel Corp. | 17,784 | 1,021,157 | ||||||
| Huron Consulting Group, Inc.* | 23,548 | 807,696 | ||||||
| ITT, Inc. | 23,249 | 1,029,233 | ||||||
| Korn/Ferry International | 36,701 | 1,447,120 | ||||||
| Masonite International Corp.* | 9,848 | 681,482 | ||||||
| Matthews International Corp. - Class A | 11,184 | 696,204 | ||||||
| Milacron Holdings Corp.* | 57,544 | 970,192 | ||||||
| Regal Beloit Corp. | 15,010 | 1,185,790 | ||||||
| Standex International Corp. | 12,025 | 1,277,055 | ||||||
| Team, Inc.*† | 74,863 | 999,421 | ||||||
| Tetra Tech, Inc. | 10,077 | 469,084 | ||||||
| TriMas Corp.* | 38,657 | 1,043,739 | ||||||
| Triumph Group, Inc. | 18,797 | 559,211 | ||||||
| 18,263,452 | ||||||||
| Information Technology — 9.5% | ||||||||
| Blackhawk Network Holdings, Inc.* | 30,403 | 1,331,651 | ||||||
| BroadSoft, Inc.* | 20,823 | 1,047,397 | ||||||
| CACI International, Inc. - Class A* | 6,013 | 837,912 | ||||||
| CSRA, Inc. | 46,622 | 1,504,492 | ||||||
| Diebold Nixdorf, Inc.† | 38,924 | 889,413 | ||||||
| MACOM Technology Solutions | ||||||||
| Holdings, Inc.*† | 27,411 | 1,222,805 | ||||||
| Semtech Corp.* | 13,280 | 498,664 | ||||||
| Virtusa Corp.* | 29,447 | 1,112,508 | ||||||
| 8,444,842 | ||||||||
| Consumer Discretionary — 8.9% | ||||||||
| Buffalo Wild Wings, Inc.* | 3,608 | 381,366 | ||||||
| Callaway Golf Co. | 43,775 | 631,673 | ||||||
| DSW, Inc. - Class A | 31,851 | 684,160 | ||||||
| Express, Inc.* | 17,358 | 117,340 | ||||||
| Horizon Global Corp.* | 47,778 | 842,804 | ||||||
| Michaels Cos., Inc. (The)* | 18,529 | 397,818 | ||||||
| Murphy USA, Inc.* | 28,818 | 1,988,442 | ||||||
| Nexstar Media Group, Inc. - Class A | 20,681 | 1,288,426 | ||||||
| Oxford Industries, Inc. | 9,484 | 602,613 | ||||||
| Steven Madden Ltd.* | 15,642 | 677,299 | ||||||
| Tailored Brands, Inc.† | 17,950 | 259,198 | ||||||
| 7,871,139 | ||||||||
| Consumer Staples — 6.9% | ||||||||
| B&G Foods, Inc.† | 18,044 | 574,701 | ||||||
| Darling Ingredients, Inc.* | 57,087 | 1,000,164 | ||||||
| Hain Celestial Group, Inc. (The)* | 31,242 | 1,285,608 | ||||||
| Hostess Brands, Inc.* | 54,171 | 739,976 | ||||||
| Performance Food Group Co.* | 21,352 | 603,194 | ||||||
| Snyder's-Lance, Inc. | 20,163 | 769,017 | ||||||
| TreeHouse Foods, Inc.* | 16,297 | 1,103,796 | ||||||
| 6,076,456 | ||||||||
| Materials — 6.2% | ||||||||
| Allegheny Technologies, Inc.*† | 35,962 | 859,492 | ||||||
| HB Fuller Co. | 15,900 | 923,154 | ||||||
| Ingevity Corp.* | 9,417 | 588,280 | ||||||
| Olin Corp. | 18,665 | 639,276 | ||||||
| Silgan Holdings, Inc. | 27,454 | 807,971 | ||||||
| Sonoco Products Co. | 11,130 | 561,509 | ||||||
| Valvoline, Inc. | 46,941 | 1,100,766 | ||||||
| 5,480,448 | ||||||||
| Health Care — 5.0% | ||||||||
| Charles River Laboratories International, | ||||||||
| Inc.* | 11,271 | 1,217,493 | ||||||
| Envision Healthcare Corp.* | 19,787 | 889,426 | ||||||
| HealthSouth Corp. | 28,843 | 1,336,873 | ||||||
| Patterson Cos., Inc. | 26,192 | 1,012,321 | ||||||
| 4,456,113 | ||||||||
| Utilities — 4.3% | ||||||||
| Great Plains Energy, Inc. | 39,247 | 1,189,184 | ||||||
| Hawaiian Electric Industries, Inc. | 16,307 | 544,165 | ||||||
| IDACORP, Inc. | 8,666 | 762,001 | ||||||
| Portland General Electric Co. | 29,815 | 1,360,757 | ||||||
| 3,856,107 | ||||||||
| Real Estate — 4.2% | ||||||||
| Columbia Property Trust, Inc. REIT | 38,655 | 841,519 | ||||||
| Corporate Office Properties Trust REIT | 38,199 | 1,254,073 | ||||||
| Education Realty Trust, Inc. REIT | 25,966 | 932,958 | ||||||
| 95 |
Touchstone Small Cap Value Fund (Continued)
| Market | ||||||||
| Shares | Value | |||||||
| Common Stocks — 98.4% (Continued) | ||||||||
| Real Estate — (Continued) | ||||||||
| Lexington Realty Trust REIT | 63,686 | $ | 650,871 | |||||
| 3,679,421 | ||||||||
| Energy — 3.8% | ||||||||
| Callon Petroleum Co.* | 64,004 | 719,405 | ||||||
| Carrizo Oil & Gas, Inc.* | 43,954 | 752,932 | ||||||
| Select Energy Services, Inc. - Class A*† | 27,265 | 434,059 | ||||||
| SRC Energy, Inc.*† | 91,241 | 882,301 | ||||||
| World Fuel Services Corp. | 17,263 | 585,388 | ||||||
| 3,374,085 | ||||||||
| Telecommunication Services — 0.7% | ||||||||
| Cogent Communications Holdings, Inc. | 13,517 | 660,981 | ||||||
| Total Common Stocks | $ | 87,211,974 | ||||||
| Exchange Traded Fund — 0.4% | ||||||||
| iShares Russell 2000 Value ETF | 2,898 | 359,700 | ||||||
| Short-Term Investment Funds — 9.0% | ||||||||
| Dreyfus Government Cash | ||||||||
| Management, Institutional Shares, | ||||||||
| 0.92%∞Ω | 1,896,939 | 1,896,939 | ||||||
| Invesco Government & Agency | ||||||||
| Portfolio, Institutional Class, | ||||||||
| 0.93%**∞Ω | 6,055,485 | 6,055,485 | ||||||
| Total Short-Term Investment Funds | $ | 7,952,424 | ||||||
| Total Investment Securities —107.8% | ||||||||
| (Cost $90,699,791) | $ | 95,524,098 | ||||||
| Liabilities in Excess of Other Assets — (7.8%) | (6,889,371 | ) | ||||||
| Net Assets — 100.0% | $ | 88,634,727 | ||||||
| * | Non-income producing security. |
| ** | Represents collateral for securities loaned. |
| † | All or a portion of the security is on loan. The total market value of the securities on loan as of September 30, 2017 was $5,951,490. |
| ∞ | Open-End Fund. |
| Ω | Represents the 7-day SEC yield as of September 30, 2017. |
Portfolio Abbreviations:
ETF - Exchange Traded Fund
REIT - Real Estate Investment Trust
Other Information:
The inputs or methodology used for valuing securities may not be an indication of the risk associated with investing in those securities. For more information on valuation inputs, and their aggregation into the levels used in the table below, please refer to the security valuation section in the accompanying Notes to Financial Statements.
Valuation inputs at Reporting Date:
| Description | Level 1 | Level 2 | Level 3 | Total | ||||||||||||
| Common Stocks | $ | 87,211,974 | $ | — | $ | — | $ | 87,211,974 | ||||||||
| Exchange Traded Fund | 359,700 | — | — | 359,700 | ||||||||||||
| Short-Term Investment Funds | 7,952,424 | — | — | 7,952,424 | ||||||||||||
| Total | $ | 95,524,098 | $ | — | $ | — | $ | 95,524,098 | ||||||||
See accompanying Notes to Financial Statements.
| 96 |
Touchstone Total Return Bond Fund – September 30, 2017
| Principal | Market | |||||||
| Amount | Value | |||||||
| Corporate Bonds — 30.0% | ||||||||
| Industrials — 9.4% | ||||||||
| $ | 1,238,353 | American Airlines 2011-1 Class B Pass | ||||||
| Through Trust, 144a, | ||||||||
| 7.000%, 1/31/18 | $ | 1,253,832 | ||||||
| 23,463 | Burlington Northern and Santa Fe | |||||||
| Railway Co. 1998-C Pass Through | ||||||||
| Trust, 6.230%, 7/2/18 | 23,846 | |||||||
| 62,824 | Burlington Northern and Santa Fe | |||||||
| Railway Co. 2004-1 Pass Through | ||||||||
| Trust, 4.575%, 1/15/21 | 64,888 | |||||||
| 279,035 | Burlington Northern and Santa Fe | |||||||
| Railway Co. 2005-3 Pass Through | ||||||||
| Trust, 4.830%, 1/15/23 | 293,443 | |||||||
| 1,297,400 | Burlington Northern and Santa Fe | |||||||
| Railway Co. 2005-4 Pass Through | ||||||||
| Trust, 4.967%, 4/1/23 | 1,373,931 | |||||||
| 865,195 | Continental Airlines 2000-2 Class A-1 | |||||||
| Pass Through Trust, 7.707%, 4/2/21 | 932,248 | |||||||
| 1,558,226 | CSX Transportation, Inc., | |||||||
| 6.251%, 1/15/23 | 1,783,733 | |||||||
| 1,174,291 | Delta Air Lines 2010-2 Class A Pass | |||||||
| Through Trust, 4.950%, 5/23/19 | 1,212,338 | |||||||
| 654,408 | Federal Express Corp. 1998 Pass | |||||||
| Through Trust, 6.845%, 1/15/19 | 674,040 | |||||||
| 860,649 | Federal Express Corp. 1999 Pass | |||||||
| Through Trust, 7.650%, 1/15/23 | 974,685 | |||||||
| 1,800,000 | GATX Corp., 3.250%, 3/30/25 | 1,788,003 | ||||||
| 541,000 | General Electric Co. MTN, | |||||||
| 3.450%, 5/15/24 | 566,824 | |||||||
| 1,180,000 | Kansas City Southern, 3.000%, 5/15/23 | 1,182,938 | ||||||
| 1,475,000 | Kansas City Southern, 3.125%, 6/1/26 | 1,432,623 | ||||||
| 1,941,000 | Norfolk Southern Corp., | |||||||
| 2.903%, 2/15/23 | 1,968,639 | |||||||
| 1,404,000 | Republic Services, Inc., | |||||||
| 5.250%, 11/15/21 | 1,550,051 | |||||||
| 1,000,000 | SBA Tower Trust, 144a, | |||||||
| 3.168%, 4/11/22 | 999,312 | |||||||
| 1,501,756 | Southwest Airlines Co. 2007-1 Pass | |||||||
| Through Trust, 6.150%, 8/1/22 | 1,651,931 | |||||||
| 29,061 | Union Pacific Railroad Co. 2001 Pass | |||||||
| Through Trust, 6.630%, 1/27/22 | 32,768 | |||||||
| 1,166,915 | Union Pacific Railroad Co. 2003 Pass | |||||||
| Through Trust, 4.698%, 1/2/24 | 1,230,542 | |||||||
| 623,957 | Union Pacific Railroad Co. 2006 Pass | |||||||
| Through Trust, 5.866%, 7/2/30 | 709,508 | |||||||
| 1,644,000 | United Rentals North America, Inc., | |||||||
| 5.750%, 11/15/24 | 1,744,695 | |||||||
| 1,616,000 | Waste Management, Inc., | |||||||
| 2.400%, 5/15/23 | 1,597,333 | |||||||
| 25,042,151 | ||||||||
| Financials — 7.6% | ||||||||
| 2,008,000 | American Express Co., | |||||||
| 2.650%, 12/2/22 | 2,018,455 | |||||||
| 1,777,000 | Delphi Financial Group, Inc., | |||||||
| 7.875%, 1/31/20 | 1,978,892 | |||||||
| 1,970,291 | Fishers Lane Associates LLC, 144a, | |||||||
| 3.666%, 8/5/30 | 2,017,988 | |||||||
| 2,050,000 | Ford Motor Credit Co. LLC, | |||||||
| 4.375%, 8/6/23 | 2,163,445 | |||||||
| 1,386,000 | GE Capital International Funding Co. | |||||||
| (Ireland), 3.373%, 11/15/25 | 1,433,459 | |||||||
| 2,106,000 | National Rural Utilities Cooperative | |||||||
| Finance Corp., 3.400%, 11/15/23 | 2,191,318 | |||||||
| 708,000 | Nationwide Mutual Insurance Co., | |||||||
| 144a, 9.375%, 8/15/39 | 1,174,594 | |||||||
| 270,000 | Pacific Life Insurance Co., 144a, | |||||||
| 9.250%, 6/15/39 | 443,454 | |||||||
| 1,500,000 | Provident Cos., Inc., 7.000%, 7/15/18 | 1,557,812 | ||||||
| 1,398,000 | Torchmark Corp., 3.800%, 9/15/22 | 1,441,301 | ||||||
| 2,000,000 | USB Capital IX, 3.500% | 1,781,100 | ||||||
| 2,000,000 | Wachovia Capital Trust III, 5.570% | 2,005,000 | ||||||
| 20,206,818 | ||||||||
| Utilities — 4.5% | ||||||||
| 1,314,409 | Bruce Mansfield Unit 1, 2007 Pass | |||||||
| Through Trust, 6.850%, 6/1/34 | 575,054 | |||||||
| 610,000 | California Water Service Co., | |||||||
| 5.500%, 12/1/40 | 747,190 | |||||||
| 1,311,000 | Commonwealth Edison Co., | |||||||
| 5.900%, 3/15/36 | 1,663,065 | |||||||
| 1,780,000 | Dominion Resources, Inc., (3M LIBOR | |||||||
| +2.300%), 3.633%, 9/30/66(A) | 1,632,260 | |||||||
| 275,000 | Duke Energy Progress LLC, | |||||||
| 6.300%, 4/1/38 | 370,173 | |||||||
| 1,700,000 | Entergy Louisiana LLC, | |||||||
| 4.440%, 1/15/26 | 1,832,365 | |||||||
| 500,000 | Georgia Power Co., 4.750%, 9/1/40 | 547,202 | ||||||
| 581,924 | Kiowa Power Partners LLC, 144a, | |||||||
| 5.737%, 3/30/21 | 600,577 | |||||||
| 2,000,000 | NextEra Energy Capital Holdings, Inc., | |||||||
| (3M LIBOR +2.068%), | ||||||||
| 3.403%, 10/1/66(A) | 1,900,000 | |||||||
| 1,983,000 | South Carolina Electric & Gas Co., | |||||||
| 4.600%, 6/15/43 | 2,142,894 | |||||||
| 12,010,780 | ||||||||
| Energy — 3.7% | ||||||||
| 1,000,000 | Apache Corp., 3.250%, 4/15/22 | 1,014,304 | ||||||
| 1,253,000 | Chesapeake Energy Corp., | |||||||
| 6.625%, 8/15/20† | 1,290,590 | |||||||
| 1,530,000 | Newfield Exploration Co., | |||||||
| 5.750%, 1/30/22 | 1,633,275 | |||||||
| 1,000,000 | Petrobras Global Finance BV | |||||||
| (Netherlands), 7.375%, 1/17/27 | 1,101,000 | |||||||
| 1,500,000 | Petroleos Mexicanos (Mexico), | |||||||
| 4.875%, 1/24/22 | 1,573,125 | |||||||
| 400,000 | Spectra Energy Partners LP, | |||||||
| 3.500%, 3/15/25 | 402,666 | |||||||
| 1,914,000 | Tennessee Valley Authority, | |||||||
| 4.650%, 6/15/35 | 2,298,919 | |||||||
| 97 |
Touchstone Total Return Bond Fund (Continued)
| Principal | Market | |||||||
| Amount | Value | |||||||
| Corporate Bonds — 30.0% (Continued) | ||||||||
| Energy — (Continued) | ||||||||
| $ | 500,000 | Texas Eastern Transmission LP, | ||||||
| 7.000%, 7/15/32 | $ | 633,839 | ||||||
| 9,947,718 | ||||||||
| Consumer Staples — 1.8% | ||||||||
| 2,848,572 | CVS Pass-Through Trust, | |||||||
| 6.036%, 12/10/28 | 3,219,595 | |||||||
| 1,500,000 | Kroger Co. (The), 3.850%, 8/1/23 | 1,553,583 | ||||||
| 4,773,178 | ||||||||
| Consumer Discretionary — 1.8% | ||||||||
| 818,000 | American Airlines 2016-3 Class AA | |||||||
| Pass Through Trust, | ||||||||
| 3.000%, 10/15/28 | 811,865 | |||||||
| 654,564 | Continental Airlines 2012-2 Class A | |||||||
| Pass Through Trust, | ||||||||
| 4.000%, 10/29/24 | 685,656 | |||||||
| 990,000 | PulteGroup, Inc., 7.875%, 6/15/32 | 1,213,047 | ||||||
| 1,300,000 | Royal Caribbean Cruises Ltd. (Liberia), | |||||||
| 5.250%, 11/15/22 | 1,441,007 | |||||||
| 466,000 | Service Corp. International, | |||||||
| 5.375%, 5/15/24 | 495,125 | |||||||
| 4,646,700 | ||||||||
| Health Care — 0.6% | ||||||||
| 1,650,000 | HCA, Inc., 4.250%, 10/15/19 | 1,707,750 | ||||||
| Telecommunication Services — 0.6% | ||||||||
| 1,422,000 | Verizon Communications, Inc., | |||||||
| 5.012%, 4/15/49 | 1,453,874 | |||||||
| Total Corporate Bonds | $ | 79,788,969 | ||||||
| U.S. Government Agency Obligations — 26.3% | ||||||||
| 22,256 | Astro Offshore Corp., | |||||||
| 6.000%, 12/20/19 | 22,800 | |||||||
| 1,371,000 | Canal Barge Co., Inc., 4.500%, 11/12/34 | 1,444,451 | ||||||
| 364,828 | EJM Airport LLC, 6.271%, 5/15/20 | 384,550 | ||||||
| 1,765,133 | Helios Leasing I LLC, 1.734%, 7/24/24 | 1,732,229 | ||||||
| 490,000 | Matson Navigation Co., Inc., | |||||||
| 5.337%, 9/4/28 | 543,247 | |||||||
| 1,423,500 | Petroleos Mexicanos (Mexico), | |||||||
| 2.290%, 2/15/24 | 1,424,922 | |||||||
| 2,392,000 | Private Export Funding Corp., | |||||||
| 2.450%, 7/15/24 | 2,399,497 | |||||||
| 1,708,053 | Reliance Industries Ltd. (India), | |||||||
| 1.870%, 1/15/26 | 1,676,158 | |||||||
| 169,751 | Small Business Administration | |||||||
| Participation Certificates, Ser | ||||||||
| 2001-20A, Class 1, 6.290%, 1/1/21 | 177,523 | |||||||
| 36,718 | Small Business Administration | |||||||
| Participation Certificates, Ser | ||||||||
| 2001-20K, Class 1, 5.340%, 11/1/21 | 38,083 | |||||||
| 103,629 | Small Business Administration | |||||||
| Participation Certificates, Ser | ||||||||
| 2002-20H, Class 1, 5.310%, 8/1/22 | 108,590 | |||||||
| 98,373 | Small Business Administration | |||||||
| Participation Certificates, Ser | ||||||||
| 2003-20B, Class 1, 4.840%, 2/1/23 | 103,305 | |||||||
| 35,528 | Small Business Administration | |||||||
| Participation Certificates, Ser | ||||||||
| 2003-20D, Class 1, 4.760%, 4/1/23 | 37,086 | |||||||
| 27,645 | Small Business Administration | |||||||
| Participation Certificates, Ser | ||||||||
| 2004-20D, Class 1, 4.770%, 4/1/24 | 28,904 | |||||||
| 248,192 | Small Business Administration | |||||||
| Participation Certificates, Ser | ||||||||
| 2004-20K, Class 1, 4.880%, 11/1/24 | 260,818 | |||||||
| 132,261 | Small Business Administration | |||||||
| Participation Certificates, Ser | ||||||||
| 2005-20B, Class 1, 4.625%, 2/1/25 | 138,112 | |||||||
| 101,039 | Small Business Administration | |||||||
| Participation Certificates, Ser | ||||||||
| 2005-20H, Class 1, 5.110%, 8/1/25 | 106,542 | |||||||
| 718,164 | Small Business Administration | |||||||
| Participation Certificates, Ser | ||||||||
| 2006-20B, Class 1, 5.350%, 2/1/26 | 765,832 | |||||||
| 175,951 | Small Business Administration | |||||||
| Participation Certificates, Ser | ||||||||
| 2006-20H, Class 1, 5.700%, 8/1/26 | 188,327 | |||||||
| 497,017 | Small Business Administration | |||||||
| Participation Certificates, Ser | ||||||||
| 2006-20K, Class 1, 5.360%, 11/1/26 | 530,016 | |||||||
| 619,909 | Small Business Administration | |||||||
| Participation Certificates, Ser | ||||||||
| 2006-20L, Class 1, 5.120%, 12/1/26 | 658,430 | |||||||
| 567,721 | Small Business Administration | |||||||
| Participation Certificates, Ser | ||||||||
| 2007-20A, Class 1, 5.320%, 1/1/27 | 605,075 | |||||||
| 652,373 | Small Business Administration | |||||||
| Participation Certificates, Ser | ||||||||
| 2007-20E, Class 1, 5.310%, 5/1/27 | 694,634 | |||||||
| 259,896 | Small Business Administration | |||||||
| Participation Certificates, Ser | ||||||||
| 2007-20F, Class 1, 5.710%, 6/1/27 | 278,435 | |||||||
| 714,518 | Small Business Administration | |||||||
| Participation Certificates, Ser | ||||||||
| 2007-20L, Class 1, 5.290%, 12/1/27 | 760,361 | |||||||
| 427,271 | Small Business Administration | |||||||
| Participation Certificates, Ser | ||||||||
| 2008-20A, Class 1, 5.170%, 1/1/28 | 462,728 | |||||||
| 1,131,687 | Small Business Administration | |||||||
| Participation Certificates, Ser | ||||||||
| 2008-20K, Class 1, 6.770%, 11/1/28 | 1,264,755 | |||||||
| 1,055,970 | Small Business Administration | |||||||
| Participation Certificates, Ser | ||||||||
| 2009-20B, Class 1, 4.760%, 2/1/29 | 1,124,295 | |||||||
| 1,234,129 | Small Business Administration | |||||||
| Participation Certificates, Ser | ||||||||
| 2009-20C, Class 1, 4.660%, 3/1/29 | 1,311,573 | |||||||
| 98 |
Touchstone Total Return Bond Fund (Continued)
| Principal | Market | |||||||
| Amount | Value | |||||||
| U.S. Government Agency Obligations — 26.3% | ||||||||
| (Continued) | ||||||||
| $ | 524,884 | Small Business Administration | ||||||
| Participation Certificates, Ser | ||||||||
| 2009-20D, Class 1, 4.310%, 4/1/29 | $ | 555,141 | ||||||
| 1,179,671 | Small Business Administration | |||||||
| Participation Certificates, Ser | ||||||||
| 2009-20E, Class 1, 4.430%, 5/1/29 | 1,251,630 | |||||||
| 601,578 | Small Business Administration | |||||||
| Participation Certificates, Ser | ||||||||
| 2009-20F, Class 1, 4.950%, 6/1/29 | 642,559 | |||||||
| 975,977 | Small Business Administration | |||||||
| Participation Certificates, Ser | ||||||||
| 2009-20J, Class 1, 3.920%, 10/1/29 | 1,023,205 | |||||||
| 1,678,771 | Small Business Administration | |||||||
| Participation Certificates, Ser | ||||||||
| 2010-20F, Class 1, 3.880%, 6/1/30 | 1,763,666 | |||||||
| 1,462,809 | Small Business Administration | |||||||
| Participation Certificates, Ser | ||||||||
| 2010-20I, Class 1, 3.210%, 9/1/30 | 1,503,941 | |||||||
| 835,597 | Small Business Administration | |||||||
| Participation Certificates, Ser | ||||||||
| 2012-10C, Class 1, 1.240%, 5/1/22 | 826,681 | |||||||
| 3,872,414 | Small Business Administration | |||||||
| Participation Certificates, Ser | ||||||||
| 2013-20C, Class 1, 2.220%, 3/1/33 | 3,833,784 | |||||||
| 1,823,887 | Small Business Administration | |||||||
| Participation Certificates, Ser | ||||||||
| 2013-20E, Class 1, 2.070%, 5/1/33 | 1,784,564 | |||||||
| 2,852,313 | Small Business Administration | |||||||
| Participation Certificates, Ser | ||||||||
| 2013-20G, Class 1, 3.150%, 7/1/33 | 2,943,588 | |||||||
| 2,341,795 | Small Business Administration | |||||||
| Participation Certificates, Ser | ||||||||
| 2014-20H, Class 1, 2.880%, 8/1/34 | 2,366,262 | |||||||
| 1,877,686 | Small Business Administration | |||||||
| Participation Certificates, Ser | ||||||||
| 2014-20K, Class 1, 2.800%, 11/1/34 | 1,894,561 | |||||||
| 4,227,707 | Small Business Administration | |||||||
| Participation Certificates, Ser | ||||||||
| 2015-20E, Class 1, 2.770%, 5/1/35 | �� | 4,266,628 | ||||||
| 2,954,900 | Small Business Administration | |||||||
| Participation Certificates, Ser | ||||||||
| 2015-20I, Class 1, 2.820%, 9/1/35 | 2,986,164 | |||||||
| 4,220,782 | Small Business Administration | |||||||
| Participation Certificates, Ser | ||||||||
| 2016-20A, Class 1, 2.780%, 1/1/36 | 4,227,701 | |||||||
| 2,212,000 | Small Business Administration | |||||||
| Participation Certificates, Ser | ||||||||
| 2017-10A, Class 1, 2.845%, 3/10/27 | 2,242,951 | |||||||
| 2,740,000 | Small Business Administration | |||||||
| Participation Certificates, Ser | ||||||||
| 2017-10B, Class 1, 2.518%, 9/10/27 | 2,745,105 | |||||||
| 4,080,000 | Small Business Administration | |||||||
| Participation Certificates, Ser | ||||||||
| 2017-20D, Class 1, 2.840%, 4/1/37 | 4,106,617 | |||||||
| 2,500,000 | Small Business Administration | |||||||
| Participation Certificates, Ser | ||||||||
| 2017-20E, Class 1, 2.880%, 5/1/37 | 2,525,185 | |||||||
| 3,270,000 | Small Business Administration | |||||||
| Participation Certificates, Ser | ||||||||
| 2017-20F, Class 1, 2.810%, 6/1/37 | 3,280,400 | |||||||
| 67,046 | Sterling Equipment, 6.125%, 9/28/19 | 70,165 | ||||||
| 1,290,562 | Tagua Leasing LLC, 1.581%, 11/16/24 | 1,257,894 | ||||||
| 941,000 | Totem Ocean Trailer Express, Inc., | |||||||
| 6.365%, 4/15/28 | 1,066,813 | |||||||
| 1,360,000 | Vessel Management Services, Inc., | |||||||
| 5.125%, 4/16/35 | 1,575,422 | |||||||
| Total U.S. Government Agency | ||||||||
| Obligations | $ | 70,011,905 | ||||||
| U.S. Government Mortgage-Backed | ||||||||
| Obligations — 14.7% | ||||||||
| 1,839,189 | FHLMC, Pool #W30008, | |||||||
| 7.645%, 5/1/25 | 2,141,952 | |||||||
| 207,162 | FNMA, Pool #465711, 4.680%, 8/1/28 | 226,438 | ||||||
| 1,523,362 | FNMA, Pool #469616, 3.500%, 11/1/21 | 1,595,270 | ||||||
| 108,475 | FNMA, Pool #874210, 5.260%, 1/1/25 | 116,785 | ||||||
| 470,298 | FNMA, Pool #888829, 5.832%, 6/1/37 | 527,710 | ||||||
| 275,035 | FNMA, Pool #958736, 4.940%, 5/1/19 | 287,090 | ||||||
| 289,645 | FNMA, Pool #AD0101, 4.821%, 7/1/19 | 303,542 | ||||||
| 279,488 | FNMA, Pool #AD0166, 4.829%, 8/1/19 | 292,676 | ||||||
| 875,156 | FNMA, Pool #AD0342, 4.650%, 10/1/19 | 914,650 | ||||||
| 799,452 | FNMA, Pool #AD0786, 4.501%, 1/1/20 | 835,932 | ||||||
| 423,318 | FNMA, Pool #AD0910, 4.629%, 4/1/20 | 442,646 | ||||||
| 347,003 | FNMA, Pool #AE0209, 4.380%, 6/1/20 | 363,500 | ||||||
| 1,015,568 | FNMA, Pool #AE0446, 4.041%, 9/1/20 | 1,062,631 | ||||||
| 442,662 | FNMA, Pool #AE2771, 3.500%, 8/1/26 | 462,374 | ||||||
| 243,937 | FNMA, Pool #AE8886, 3.500%, 12/1/25 | 254,084 | ||||||
| 1,890,859 | FNMA, Pool #AH8854, 4.500%, 4/1/41 | 2,042,137 | ||||||
| 1,760,465 | FNMA, Pool #AM0157, 2.680%, 2/1/22 | 1,795,633 | ||||||
| 1,837,212 | FNMA, Pool #AM0566, 1.940%, 9/1/19 | 1,835,297 | ||||||
| 3,359,000 | FNMA, Pool #AN3613, 2.680%, 12/1/26 | 3,299,950 | ||||||
| 2,283,532 | FNMA, Pool #AP7488, 3.500%, 9/1/42 | 2,364,064 | ||||||
| 1,104,435 | FNMA, Pool #AT0924, 2.000%, 3/1/28 | 1,077,535 | ||||||
| 3,864,604 | FNMA, Pool #AU1628, 3.000%, 7/1/43 | 3,898,017 | ||||||
| 2,016,343 | FNMA, Pool #AX7699, 3.500%, 2/1/45 | 2,080,161 | ||||||
| 2,384,986 | FNMA, Pool #BC0153, 4.000%, 1/1/46 | 2,511,781 | ||||||
| 4,829,152 | FNMA, Pool #BD7165, 4.000%, 4/1/47 | 5,086,738 | ||||||
| 814,866 | GNMA, Pool #5276, 3.000%, 1/20/27 | 843,151 | ||||||
| 981,106 | GNMA, Pool #710077, | |||||||
| 4.700%, 5/20/61(A)(B) | 998,040 | |||||||
| 323,858 | GNMA, Pool #751408, | |||||||
| 4.843%, 6/20/61(A)(B) | 342,284 | |||||||
| 432,426 | GNMA, Pool #751409, | |||||||
| 4.623%, 7/20/61(A)(B) | 441,488 | |||||||
| 426,827 | GNMA, Pool #756686, | |||||||
| 4.707%, 9/20/61(A)(B) | 436,534 | |||||||
| 284,504 | GNMA, Pool #757327, | |||||||
| 4.332%, 7/20/61(A)(B) | 289,363 | |||||||
| Total U.S. Government | ||||||||
| Mortgage-Backed Obligations | $ | 39,169,453 | ||||||
| 99 |
Touchstone Total Return Bond Fund (Continued)
| Principal | Market | |||||||
| Amount | Value | |||||||
| Agency Collateralized Mortgage | ||||||||
| Obligations — 13.3% | ||||||||
| $ | 2,250,000 | FHLMC Multifamily Structured Pass | ||||||
| Through Certificates, Ser KW03 | ||||||||
| Class A1, 2.617%, 12/25/26 | $ | 2,249,267 | ||||||
| 1,020,000 | FREMF Mortgage Trust, Ser 2011-K702, | |||||||
| Class B, 144a, 4.930%, 4/25/44(A)(B) | 1,029,940 | |||||||
| 1,000,000 | FREMF Mortgage Trust, Ser 2012-K19, | |||||||
| Class B, 144a, 4.172%, 5/25/45(A)(B) | 1,045,746 | |||||||
| 925,000 | FREMF Mortgage Trust, Ser 2012-K706, | |||||||
| Class B, 144a, 4.169%, 11/25/44(A)(B) | 939,797 | |||||||
| 1,200,000 | FREMF Mortgage Trust, Ser 2012-K710, | |||||||
| Class B, 144a, 3.942%, 6/25/47(A)(B) | 1,225,787 | |||||||
| 750,000 | FREMF Mortgage Trust, Ser 2013-K30, | |||||||
| Class B, 144a, 3.668%, 6/25/45(A)(B) | 774,802 | |||||||
| 2,386,022 | FRESB Mortgage Trust, Ser 2015-SB9, | |||||||
| Class A5, (1M LIBOR +0.700%), | ||||||||
| 2.535%, 12/25/35(A) | 2,401,362 | |||||||
| 1,672,261 | FRESB Mortgage Trust, Ser 2016-SB17, | |||||||
| Class A5H, (1M LIBOR +2.160%), | ||||||||
| 2.160%, 5/25/36(A) | 1,674,291 | |||||||
| 2,410,522 | FRESB Mortgage Trust, Ser 2017-SB27, | |||||||
| Class A10F, 3.090%, 1/25/27(A)(B) | 2,442,986 | |||||||
| 2,600,000 | GNMA, Ser 2011-142, Class B, | |||||||
| 3.485%, 2/16/44(A)(B) | 2,657,416 | |||||||
| 470,623 | GNMA, Ser 2011-147, Class A, | |||||||
| 2.174%, 7/16/38 | 470,821 | |||||||
| 2,818,000 | GNMA, Ser 2012-1, Class C, | |||||||
| 3.310%, 11/16/49 | 2,871,589 | |||||||
| 2,975,000 | GNMA, Ser 2012-46, Class C, | |||||||
| 3.176%, 5/16/50(A)(B) | 3,015,272 | |||||||
| 2,358,075 | GNMA, Ser 2012-53, Class AC, | |||||||
| 2.381%, 12/16/43 | 2,334,925 | |||||||
| 1,222,253 | GNMA, Ser 2013-40, Class AC, | |||||||
| 1.584%, 1/16/46 | 1,189,418 | |||||||
| 2,540,000 | GNMA, Ser 2015-32, Class HG, | |||||||
| 3.000%, 9/16/49(A)(B) | 2,328,512 | |||||||
| 2,009,000 | GNMA, Ser 2015-73, Class B, | |||||||
| 2.700%, 10/16/55(A)(B) | 1,922,864 | |||||||
| 2,650,726 | GNMA, Ser 2017-46, Class AB, | |||||||
| 2.600%, 1/16/52 | 2,621,246 | |||||||
| 2,191,801 | GNMA, Ser 2017-H11, Class FV, (1M | |||||||
| LIBOR +0.500%), 1.731%, 5/20/67(A) | 2,188,188 | |||||||
| Total Agency Collateralized | ||||||||
| Mortgage Obligations | $ | 35,384,229 | ||||||
| Municipal Bonds — 6.9% | ||||||||
| California — 1.9% | ||||||||
| 1,225,000 | CA State City of San Francisco Public | |||||||
| Utilities Commission Water | ||||||||
| Revenue, Build America Bonds, | ||||||||
| 6.950%, 11/1/50 | 1,780,280 | |||||||
| 1,710,000 | CA State East Bay Municipal Utility | |||||||
| District Water System Revenue, | ||||||||
| Build America Bonds Sub, | ||||||||
| 5.874%, 6/1/40 | 2,267,802 | |||||||
| 969,851 | CA State HFA Residential Mortgage | |||||||
| Revenue, Ser A, 2.900%, 2/1/42 | 966,621 | |||||||
| 5,014,703 | ||||||||
| Florida — 0.4% | ||||||||
| 935,936 | FL State HFC Revenue, | |||||||
| Homeownership Mortgage Special | ||||||||
| Project, 2.800%, 7/1/41 | 931,350 | |||||||
| Louisiana — 0.8% | ||||||||
| 2,251,380 | LA State Housing Corp., Revenue, | |||||||
| 2.875%, 11/1/38 | 2,247,124 | |||||||
| Missouri — 0.3% | ||||||||
| 810,000 | MO State Housing Development | |||||||
| Commission, Special | ||||||||
| Homeownership Loan Program, Ser | ||||||||
| C, 2.650%, 11/1/40 | 800,798 | |||||||
| New York — 0.6% | ||||||||
| 1,400,000 | NY State Port Authority of New York | |||||||
| and New Jersey, Cons One | ||||||||
| Hundred Sixty Eight, | ||||||||
| 4.926%, 10/1/51 | 1,683,752 | |||||||
| Ohio — 0.7% | ||||||||
| 1,910,000 | Oh State HFA, Revenue, Ser 1, | |||||||
| 2.650%, 11/1/41 | 1,875,792 | |||||||
| Texas — 1.2% | ||||||||
| 1,770,000 | TX State Dallas Area Rapid Transit, | |||||||
| Revenue, Build America Bonds, | ||||||||
| 5.999%, 12/1/44 | 2,387,128 | |||||||
| 775,000 | TX State Texas Dept of Housing & | |||||||
| Community Affairs, Revenue, Ser A, | ||||||||
| 2.800%, 3/1/36 | 780,650 | |||||||
| 3,167,778 | ||||||||
| Virginia — 0.3% | ||||||||
| 808,082 | VA State Housing Development | |||||||
| Authority, Pass Thru Ser B, | ||||||||
| 2.750%, 4/25/42 | 800,502 | |||||||
| Washington — 0.7% | ||||||||
| 1,515,000 | WA State of Washington, Build | |||||||
| America Bonds Ser D, UTGO, | ||||||||
| 5.481%, 8/1/39 | 1,914,218 | |||||||
| Total Municipal Bonds | $ | 18,436,017 | ||||||
| U.S. Treasury Obligations — 3.5% | ||||||||
| 3,695,000 | U.S. Treasury Strip, Principal, | |||||||
| 0.000%, 5/15/40# | 1,950,017 | |||||||
| 100 |
Touchstone Total Return Bond Fund (Continued)
| Principal | Market | |||||||
| Amount | Value | |||||||
| U.S. Treasury Obligations — 3.5% (Continued) | ||||||||
| $ | 10,429,000 | U.S. Treasury Strip, Principal, | ||||||
| 0.000%, 5/15/43# | $ | 4,954,646 | ||||||
| 5,379,000 | U.S. Treasury Strip, Principal, | |||||||
| 0.000%, 5/15/45# | 2,401,112 | |||||||
| Total U.S. Treasury Obligations | $ | 9,305,775 | ||||||
| Asset-Backed Securities — 2.3% | ||||||||
| 1,447,914 | 321 Henderson Receivables I LLC, Ser | |||||||
| 2012-1A, Class A, 144a, | ||||||||
| 4.210%, 2/16/65 | 1,470,076 | |||||||
| 1,295,774 | 321 Henderson Receivables I LLC, Ser | |||||||
| 2012-2A, Class A, 144a, | ||||||||
| 3.840%, 10/15/59 | 1,318,208 | |||||||
| 1,575,917 | 321 Henderson Receivables I LLC, Ser | |||||||
| 2015-2A, Class A, 144a, | ||||||||
| 3.870%, 3/15/58 | 1,623,986 | |||||||
| 287,960 | FPL Recovery Funding LLC, Ser | |||||||
| 2007-A, Class A4, 5.256%, 8/1/21 | 297,149 | |||||||
| 1,325,000 | JCP&L Transition Funding LLC, Ser | |||||||
| 2006-A, Class A4, 5.610%, 6/5/23 | 1,428,614 | |||||||
| Total Asset-Backed Securities | $ | 6,138,033 | ||||||
| Commercial Mortgage-Backed Securities — 0.2% | ||||||||
| 163,255 | Citigroup Commercial Mortgage Trust, | |||||||
| Ser 2008-C7, Class A4, | ||||||||
| 6.427%, 12/10/49(A)(B) | 163,173 | |||||||
| 505,000 | Citigroup/Deutsche Bank Commercial | |||||||
| Mortgage Trust, Ser 2006-CD3, | ||||||||
| Class AJ, 5.688%, 10/15/48 | 259,478 | |||||||
| Total Commercial | ||||||||
| Mortgage-Backed Securities | $ | 422,651 | ||||||
| Shares | ||||||||
| Short-Term Investment Funds — 1.9% | ||||||||
| 4,778,573 | Dreyfus Government Cash | |||||||
| Management, Institutional Shares, | ||||||||
| 0.92%¥W | 4,778,573 | |||||||
| 327,231 | Invesco Government & Agency | |||||||
| Portfolio, Institutional Class, | ||||||||
| 0.93%**¥W | 327,231 | |||||||
| Total Short-Term Investment Funds | $ | 5,105,804 | ||||||
| Total Investment Securities — 99.1% | ||||||||
| (Cost $262,898,882) | $ | 263,762,836 | ||||||
| Other Assets in Excess of | ||||||||
| Liabilities — 0.9% | 2,496,350 | |||||||
| Net Assets — 100.0% | $ | 266,259,186 | ||||||
| # | Strip Security - Separate trading of Registered Interest and Principal. Holders of a principal strip security are entitled to the portion of the payment representing principal only. |
| (A) | Variable rate security - Rate reflected is the rate in effect as of September 30, 2017. |
| (B) | Certain variable rate securities are not based on a published reference rate and spread but are determined by the issuer or agent and are based on current market conditions. These securities do not indicate a reference rate and spread in their description. |
| ** | Represents collateral for securities loaned. |
| † | All or a portion of the security is on loan. The total market value of the securities on loan as of September 30, 2017 was $318,270. |
| ¥ | Open-End Fund. |
| W | Represents the 7-day SEC yield as of September 30, 2017. |
Portfolio Abbreviations:
FHLMC - Federal Home Loan Mortgage Corporation
FNMA - Federal National Mortgage Association
FREMF - Finnish Real Estate Management Federation
FRESB - Freddie Mac Multifamily Securitization Small Balance Loan
GNMA - Government National Mortgage Association
HFA - Housing Finance Authority/Agency
LIBOR - London Interbank Offered Rate
HFC - Housing Finance Corporation
LLC - Limited Liability Company
LP - Limited Partnership
MTN - Medium Term Note
UTGO - Unlimited Tax General Obligation
144a - This is a restricted security that was sold in a transaction qualifying for the exemption under Rule 144A of the Securities Act of 1933. This security may be sold in transactions exempt from registration, normally to qualified institutional buyers. At September 30, 2017, these securities were valued at $15,918,099 or 6.0% of net assets. These securities were deemed liquid pursuant to procedures approved by the Board of Trustees.
| 101 |
Touchstone Total Return Bond Fund (Continued)
Other Information:
The inputs or methodology used for valuing securities may not be an indication of the risk associated with investing in those securities. For more information on valuation inputs, and their aggregation into the levels used in the table below, please refer to the security valuation section in the accompanying Notes to Financial Statements.
| Valuation inputs at Reporting Date: | ||||||||||||||||
| Description | Level 1 | Level 2 | Level 3 | Total | ||||||||||||
| Corporate Bonds | $ | — | $ | 79,788,969 | $ | — | $ | 79,788,969 | ||||||||
| U.S. Government Agency Obligations | — | 70,011,905 | — | 70,011,905 | ||||||||||||
| U.S. Government Mortgage-Backed Obligations | — | 39,169,453 | — | 39,169,453 | ||||||||||||
| Agency Collateralized Mortgage Obligations | — | 35,384,229 | — | 35,384,229 | ||||||||||||
| Municipal Bonds | — | 18,436,017 | — | 18,436,017 | ||||||||||||
| U.S. Treasury Obligations | — | 9,305,775 | — | 9,305,775 | ||||||||||||
| Asset-Backed Securities | — | 6,138,033 | — | 6,138,033 | ||||||||||||
| Commercial Mortgage-Backed Securities | — | 422,651 | — | 422,651 | ||||||||||||
| Short-Term Investment Funds | 5,105,804 | — | — | 5,105,804 | ||||||||||||
| Total | $ | 5,105,804 | $ | 258,657,032 | $ | — | $ | 263,762,836 | ||||||||
See accompanying Notes to Financial Statements.
| 102 |
Touchstone Ultra Short Duration Fixed Income Fund – September 30, 2017
| Principal | Market | |||||||
| Amount | Value | |||||||
| Asset-Backed Securities — 38.0% | ||||||||
| $ | 7,750,000 | American Credit Acceptance | ||||||
| Receivables Trust, Ser 2014-3, Class | ||||||||
| D, 144a, 4.700%, 11/10/21 | $ | 7,771,951 | ||||||
| 3,958,663 | American Credit Acceptance | |||||||
| Receivables Trust, Ser 2014-4, Class | ||||||||
| C, 144a, 4.250%, 10/12/20 | 3,993,693 | |||||||
| 3,479,056 | American Credit Acceptance | |||||||
| Receivables Trust, Ser 2017-2, Class | ||||||||
| A, 144a, 1.840%, 7/13/20 | 3,480,154 | |||||||
| 3,830,000 | American Credit Acceptance | |||||||
| Receivables Trust, Ser 2017-3, Class | ||||||||
| B, 144a, 2.250%, 1/11/21 | 3,823,965 | |||||||
| 955,760 | AmeriCredit Automobile Receivables | |||||||
| Trust, Ser 2013-4, Class C, | ||||||||
| 2.720%, 9/9/19 | 956,805 | |||||||
| 2,294,000 | Ascentium Equipment Receivables, | |||||||
| Ser 2015-2A, Class D, 144a, | ||||||||
| 3.440%, 10/12/21 | 2,320,911 | |||||||
| 1,628,877 | Ascentium Equipment Receivables | |||||||
| Trust, Ser 2016-1A, Class A2, 144a, | ||||||||
| 1.750%, 11/13/18 | 1,629,586 | |||||||
| 3,915,000 | Ascentium Equipment Receivables | |||||||
| Trust, Ser 2017-1A, Class A2, 144a, | ||||||||
| 1.870%, 7/10/19 | 3,915,748 | |||||||
| 2,378,311 | BlueVirgo Trust, Ser 2015-1A, 144a, | |||||||
| 3.000%, 12/15/22 | 2,388,347 | |||||||
| 2,985,000 | Bsprt Issuer Ltd. (Cayman Islands), Ser | |||||||
| 2017-FL1, Class A, 144a, (1M LIBOR | ||||||||
| +1.350%), 2.665%, 6/15/27(A) | 2,992,401 | |||||||
| 3,345,000 | California Republic Auto Receivables | |||||||
| Trust, Ser 2013-2, Class C, | ||||||||
| 3.320%, 8/17/20 | 3,363,046 | |||||||
| 6,710,000 | Capital Auto Receivables Asset Trust, | |||||||
| Ser 2014-1, Class E, 144a, | ||||||||
| 4.090%, 9/22/22 | 6,782,023 | |||||||
| 5,710,000 | Capital Auto Receivables Asset Trust, | |||||||
| Ser 2014-3, Class E, 3.940%, 4/20/23 | 5,813,170 | |||||||
| 5,250,000 | Capital Auto Receivables Asset Trust, | |||||||
| Ser 2015-2, Class E, 4.500%, 1/22/24 | 5,367,609 | |||||||
| 7,930,000 | CarFinance Capital Auto Trust, Ser | |||||||
| 2013-2A, Class D, 144a, | ||||||||
| 5.930%, 8/15/19 | 7,990,772 | |||||||
| 7,720,000 | Carfinance Capital Auto Trust, Ser | |||||||
| 2013-2A, Class E, 144a, | ||||||||
| 7.860%, 10/15/20 | 7,810,038 | |||||||
| 472,286 | CarFinance Capital Auto Trust, Ser | |||||||
| 2015-1A, Class A, 144a, | ||||||||
| 1.750%, 6/15/21 | 472,157 | |||||||
| 863,232 | Cazenovia Creek Funding I LLC, Ser | |||||||
| 2015-1A, Class A, 144a, | ||||||||
| 2.000%, 12/10/23 | 859,455 | |||||||
| 4,925,000 | CCG Receivables Trust, Ser 2017-1, | |||||||
| Class A2, 144a, 1.840%, 11/14/23 | 4,921,164 | |||||||
| 8,485,000 | Chrysler Capital Auto Receivables | |||||||
| Trust, Ser 2013-BA, Class D, 144a, | ||||||||
| 2.890%, 10/15/20 | 8,500,717 | |||||||
| 636,765 | CNH Equipment Trust, Ser 2014-C, | |||||||
| Class A3, 1.050%, 11/15/19 | 635,926 | |||||||
| 16,873 | College & University Facility Loan | |||||||
| Trust, Ser 2, Class D, 4.000%, 6/1/18 | 16,873 | |||||||
| 2,399,869 | Credit Acceptance Auto Loan Trust, | |||||||
| Ser 2015-1A, Class A, 144a, | ||||||||
| 2.000%, 7/15/22 | 2,400,280 | |||||||
| 5,387,058 | Credit Acceptance Auto Loan Trust, | |||||||
| Ser 2015-2A, Class A, 144a, | ||||||||
| 2.400%, 2/15/23 | 5,399,888 | |||||||
| 2,725,000 | Dell Equipment Finance Trust, Ser | |||||||
| 2015-1, Class D, 144a, | ||||||||
| 2.840%, 9/22/20 | 2,728,088 | |||||||
| 3,000,000 | Dell Equipment Finance Trust, Ser | |||||||
| 2015-2, Class B, 144a, | ||||||||
| 2.210%, 9/22/20 | 3,004,637 | |||||||
| 4,500,000 | Dell Equipment Finance Trust, Ser | |||||||
| 2015-2, Class C, 144a, | ||||||||
| 2.750%, 9/22/20 | 4,511,938 | |||||||
| 1,470,230 | Dell Equipment Finance Trust, Ser | |||||||
| 2016-1, Class A2, 144a, | ||||||||
| 1.430%, 9/24/18 | 1,469,918 | |||||||
| 2,900,000 | Drive Auto Receivables Trust, Ser | |||||||
| 2017-2, Class B, 2.250%, 6/15/21 | 2,901,984 | |||||||
| 7,520,000 | DT Auto Owner Trust, Ser 2014-3A, | |||||||
| Class D, 144a, 4.470%, 11/15/21 | 7,660,911 | |||||||
| 2,183,554 | DT Auto Owner Trust, Ser 2015-1A, | |||||||
| Class C, 144a, 2.870%, 11/16/20 | 2,187,564 | |||||||
| 3,381,717 | DT Auto Owner Trust, Ser 2017-2A, | |||||||
| Class A, 144a, 1.720%, 5/15/20 | 3,382,032 | |||||||
| 804,271 | Elara HGV Timeshare Issuer LLC, Ser | |||||||
| 2014-A, Class A, 144a, | ||||||||
| 2.530%, 2/25/27 | 799,014 | |||||||
| 12,889,215 | Exeter Automobile Receivables Trust, | |||||||
| Ser 2013-2A, Class D, 144a, | ||||||||
| 6.810%, 8/17/20 | 13,124,875 | |||||||
| 7,675,000 | Exeter Automobile Receivables Trust, | |||||||
| Ser 2014-3A, Class C, 144a, | ||||||||
| 4.170%, 6/15/20 | 7,803,760 | |||||||
| 3,754,995 | First Investors Auto Owner Trust, Ser | |||||||
| 2014-1A, Class B, 144a, | ||||||||
| 2.260%, 1/15/20 | 3,758,320 | |||||||
| 1,242,984 | First Investors Auto Owner Trust, Ser | |||||||
| 2016-2A, Class A1, 144a, | ||||||||
| 1.530%, 11/16/20 | 1,240,939 | |||||||
| 1,307,449 | Flagship Credit Auto Trust, Ser 2016-3, | |||||||
| Class A1, 144a, 1.610%, 12/15/19 | 1,307,111 | |||||||
| 979,614 | FNA 2015-1 Trust, Ser 2015-1, Class A, | |||||||
| 144a, 3.240%, 12/10/23 | 975,166 | |||||||
| 103 |
Touchstone Ultra Short Duration Fixed Income Fund (Continued)
| Principal | Market | |||||||
| Amount | Value | |||||||
| Asset-Backed Securities — 38.0% (Continued) | ||||||||
| $ | 1,876,827 | GLS Auto Receivables Trust, Ser | ||||||
| 2016-1A, Class A, 144a, | ||||||||
| 2.730%, 10/15/20 | $ | 1,876,536 | ||||||
| 6,820,000 | GLS Auto Receivables Trust, Ser | |||||||
| 2017-1A, Class A2, 144a, | ||||||||
| 2.670%, 4/15/21 | 6,815,450 | |||||||
| 623,177 | GreatAmerica Leasing Receivables | |||||||
| Funding LLC Series, Ser 2016-1, | ||||||||
| Class A2, 144a, 1.570%, 5/21/18 | 622,851 | |||||||
| 7,450,000 | Hertz Vehicle Financing LLC, Ser | |||||||
| 2016-1A, Class A, 144a, | ||||||||
| 2.320%, 3/25/20 | 7,441,732 | |||||||
| 5,669,794 | Hillmark Funding Ltd., Ser 2006-1A, | |||||||
| Class A2, 144a, (3M LIBOR +0.400%), | ||||||||
| 1.716%, 5/21/21(A) | 5,664,488 | |||||||
| 3,431,000 | Kabbage Asset Securitization LLC, Ser | |||||||
| 2017-1, Class A, 144a, | ||||||||
| 4.571%, 3/15/22 | 3,516,055 | |||||||
| 7,910,000 | Kingsland IV Ltd., Ser 2007-4A, Class C, | |||||||
| 144a, (3M LIBOR +0.650%), | ||||||||
| 1.954%, 4/16/21(A) | 7,849,465 | |||||||
| 1,889,942 | Morgan Stanley ABS Capital I, Inc. | |||||||
| Trust, Ser 2006-NC1, Class A4, (1M | ||||||||
| LIBOR +0.300%), | ||||||||
| 1.534%, 12/25/35(A) | 1,889,927 | |||||||
| 7,059,709 | Navitas Equipment Receivables LLC, | |||||||
| Ser 2016-1, Class A2, 144a, | ||||||||
| 2.200%, 6/15/21 | 7,058,006 | |||||||
| 4,127,935 | New Century Home Equity Loan Trust, | |||||||
| Ser 2005-B, Class A2D, (1M LIBOR | ||||||||
| +0.400%), 1.637%, 10/25/35(A) | 4,136,851 | |||||||
| 1,472,273 | OneMain Direct Auto Receivables | |||||||
| Trust, Ser 2016-1A, Class A, 144a, | ||||||||
| 2.040%, 1/15/21 | 1,473,077 | |||||||
| 1,610,060 | Orange Lake Timeshare Trust, Ser | |||||||
| 2012-AA, Class A, 144a, | ||||||||
| 3.450%, 3/10/27 | 1,617,181 | |||||||
| 842,212 | Orange Lake Timeshare Trust, Ser | |||||||
| 2014-AA, Class A, 144a, | ||||||||
| 2.290%, 7/9/29 | 836,302 | |||||||
| 140,456 | Park Place Securities, Inc. Asset Backed | |||||||
| Pass Through Certificates, Ser | ||||||||
| 2005-WHQ3, Class M2, (1M LIBOR | ||||||||
| +0.675%), 1.909%, 6/25/35(A) | 140,557 | |||||||
| 7,038,000 | Santander Drive Auto Receivables | |||||||
| Trust, Ser 2013-5, Class D, | ||||||||
| 2.730%, 10/15/19 | 7,081,415 | |||||||
| 9,200,000 | Santander Drive Auto Receivables | |||||||
| Trust, Ser 2014-1, Class E, | ||||||||
| 3.920%, 5/17/21 | 9,326,570 | |||||||
| 6,500,000 | Santander Drive Auto Receivables | |||||||
| Trust, Ser 2014-2, Class E, 144a, | ||||||||
| 3.760%, 7/15/21 | 6,568,448 | |||||||
| 6,500,000 | Santander Drive Auto Receivables | |||||||
| Trust, Ser 2014-3, Class E, 144a, | ||||||||
| 3.490%, 9/15/21 | 6,564,044 | |||||||
| 223,814 | Santander Drive Auto Receivables | |||||||
| Trust, Ser 2015-1, Class B, | ||||||||
| 1.970%, 11/15/19 | 223,856 | |||||||
| 4,725,000 | Securitized Equipment Receivables | |||||||
| Trust, Ser 2017-1A, 144a, | ||||||||
| 2.760%, 12/13/22 | 4,719,897 | |||||||
| 2,038,344 | Sierra Timeshare Receivables Funding | |||||||
| LLC, Ser 2012-3A, Class A, 144a, | ||||||||
| 1.870%, 8/20/29 | 2,038,003 | |||||||
| 930,415 | Sierra Timeshare Receivables Funding | |||||||
| LLC, Ser 2013-1A, Class A, 144a, | ||||||||
| 1.590%, 11/20/29 | 929,688 | |||||||
| 1,667,828 | Sierra Timeshare Receivables Funding | |||||||
| LLC, Ser 2013-3A, Class A, 144a, | ||||||||
| 2.200%, 10/20/30 | 1,666,877 | |||||||
| 660,646 | Sierra Timeshare Receivables Funding | |||||||
| LLC, Ser 2014-1A, Class A, 144a, | ||||||||
| 2.070%, 3/20/30 | 659,712 | |||||||
| 2,709,849 | Sierra Timeshare Receivables Funding | |||||||
| LLC, Ser 2014-2A, Class A, 144a, | ||||||||
| 2.050%, 6/20/31(A)(B) | 2,705,274 | |||||||
| 1,384,132 | Sierra Timeshare Receivables Funding | |||||||
| LLC, Ser 2014-3A, Class A, 144a, | ||||||||
| 2.300%, 10/20/31 | 1,382,855 | |||||||
| 1,280,745 | Sierra Timeshare Receivables Funding | |||||||
| LLC, Ser 2015-1A, Class A, 144a, | ||||||||
| 2.400%, 3/22/32 | 1,280,148 | |||||||
| 1,830,000 | Stoney Lane Funding I Corp. (Cayman | |||||||
| Islands), Ser 2007-1A, Class B, 144a, | ||||||||
| (3M LIBOR +0.700%), | ||||||||
| 2.004%, 4/18/22(A) | 1,816,557 | |||||||
| 9,535,000 | Symphony CLO II Ltd., Ser 2006-2A, | |||||||
| Class A3, 144a, (3M LIBOR +0.420%), | ||||||||
| 1.737%, 10/25/20(A) | 9,519,515 | |||||||
| 5,133,150 | Taco Bell Funding LLC, Ser 2016-1A, | |||||||
| Class A2I, 144a, 3.832%, 5/25/46 | 5,233,246 | |||||||
| 264,189 | Tidewater Auto Receivables Trust, Ser | |||||||
| 2016-AA, Class A2, 144a, | ||||||||
| 2.300%, 9/15/19 | 264,140 | |||||||
| 448,052 | United Auto Credit Securitization | |||||||
| Trust, Ser 2016-2, Class A, 144a, | ||||||||
| 1.670%, 9/10/18 | 448,061 | |||||||
| 8,308,960 | United Auto Credit Securitization | |||||||
| Trust, Ser 2017-1, Class A, 144a, | ||||||||
| 1.890%, 5/10/19 | 8,305,271 | |||||||
| 3,400,000 | Vibrant CLO II Ltd., Ser 2013-2A, Class | |||||||
| A1BR, 144a, (3M LIBOR +0.900%), | ||||||||
| 2.213%, 7/24/24(A) | 3,399,976 | |||||||
| 2,627,242 | Welk Resorts LLC, Ser 2013-AA, Class | |||||||
| A, 144a, 3.100%, 3/15/29 | 2,638,862 | |||||||
| 1,533,429 | Westgate Resorts LLC, Ser 2015-1A, | |||||||
| Class A, 144a, 2.750%, 5/20/27 | 1,537,198 | |||||||
| 4,959,886 | Westgate Resorts LLC, Ser 2016-1A, | |||||||
| Class A, 144a, 3.500%, 12/20/28 | 5,003,064 | |||||||
| 66,744 | Westlake Automobile Receivables | |||||||
| Trust, Ser 2016-1A, Class A2A, 144a, | ||||||||
| 1.820%, 1/15/19 | 66,754 | |||||||
| 104 |
Touchstone Ultra Short Duration Fixed Income Fund (Continued)
| Principal | Market | |||||||
| Amount | Value | |||||||
| Asset-Backed Securities — 38.0% (Continued) | ||||||||
| $ | 344,138 | Westlake Automobile Receivables | ||||||
| Trust, Ser 2016-1A, Class A2B, 144a, | ||||||||
| (1M LIBOR +1.050%), | ||||||||
| 2.284%, 1/15/19(A) | $ | 344,421 | ||||||
| Total Asset-Backed Securities | $ | 285,125,266 | ||||||
| Corporate Bonds — 33.6% | ||||||||
| Financials — 7.9% | ||||||||
| 3,400,000 | Bank of America Corp. MTN, | |||||||
| 2.369%, 7/21/21 | 3,400,252 | |||||||
| 3,000,000 | Bank of America Corp. MTN, | |||||||
| 5.650%, 5/1/18 | 3,068,499 | |||||||
| 700,000 | Bank One Corp., 8.530%, 3/1/19(C) | 761,186 | ||||||
| 875,000 | Capital One NA/Mclean VA, | |||||||
| 1.650%, 2/5/18 | 874,680 | |||||||
| 6,800,000 | Capital One NA/Mclean VA, (3M LIBOR | |||||||
| +0.820%), 2.132%, 8/8/22(A) | 6,775,182 | |||||||
| 1,000,000 | Capital One NA/Mclean VA, | |||||||
| 2.350%, 8/17/18 | 1,003,803 | |||||||
| 6,050,000 | Citibank NA, (3M LIBOR +0.340%), | |||||||
| 1.665%, 3/20/19(A) | 6,060,814 | |||||||
| 750,000 | Citigroup, Inc., 1.700%, 4/27/18 | 749,930 | ||||||
| 1,800,000 | Citigroup, Inc., 1.800%, 2/5/18 | 1,800,010 | ||||||
| 1,290,000 | Citigroup, Inc., 6.125%, 5/15/18 | 1,323,960 | ||||||
| 1,500,000 | Credit Suisse AG/New York NY | |||||||
| (Switzerland), 1.750%, 1/29/18 | 1,501,175 | |||||||
| 500,000 | Intercontinental Exchange, Inc., | |||||||
| 2.750%, 12/1/20 | 509,579 | |||||||
| 1,000,000 | JPMorgan Chase & Co., | |||||||
| 6.000%, 1/15/18 | 1,012,727 | |||||||
| 2,800,000 | Mizuho Bank Ltd. (Japan), 144a, | |||||||
| 1.550%, 10/17/17 | 2,800,221 | |||||||
| 3,000,000 | Moody's Corp., (3M LIBOR +0.350%), | |||||||
| 1.666%, 9/4/18(A) | 3,005,293 | |||||||
| 250,000 | Morgan Stanley MTN, | |||||||
| 5.950%, 12/28/17 | 252,544 | |||||||
| 8,685,000 | Mountain Agency, Inc. (The), | |||||||
| 1.360%, 12/1/23(A)(B) | 8,685,000 | |||||||
| 1,029,000 | PNC Bank NA, 6.000%, 12/7/17 | 1,037,069 | ||||||
| 2,500,000 | Principal Life Global Funding II, 144a, | |||||||
| 1.500%, 4/18/19 | 2,484,927 | |||||||
| 2,505,000 | Societe Generale SA (France), | |||||||
| 2.750%, 10/12/17 | 2,505,883 | |||||||
| 1,755,000 | State Street Corp., 4.956%, 3/15/18 | 1,779,651 | ||||||
| 4,977,000 | SunTrust Bank/Atlanta GA, | |||||||
| 7.250%, 3/15/18 | 5,098,603 | |||||||
| 2,600,000 | XLIT Ltd. (Cayman Islands), | |||||||
| 2.300%, 12/15/18 | 2,610,109 | |||||||
| 59,101,097 | ||||||||
| Consumer Discretionary — 4.6% | ||||||||
| 2,000,000 | AutoNation, Inc., 6.750%, 4/15/18 | 2,052,409 | ||||||
| 1,800,000 | Dollar General Corp., 1.875%, 4/15/18 | 1,801,872 | ||||||
| 7,000,000 | ERAC USA Finance LLC, 144a, | |||||||
| 6.375%, 10/15/17 | 7,010,784 | |||||||
| 6,300,000 | General Motors Co., (3M LIBOR | |||||||
| +0.800%), 2.112%, 8/7/20(A) | 6,305,678 | |||||||
| 1,000,000 | General Motors Financial Co., Inc., | |||||||
| 2.400%, 4/10/18 | 1,003,186 | |||||||
| 2,000,000 | Hyundai Capital America, 144a, | |||||||
| 2.000%, 3/19/18 | 2,000,729 | |||||||
| 3,808,000 | Lear Corp., 5.375%, 3/15/24 | 4,057,085 | ||||||
| 2,273,000 | Marriott International, Inc., | |||||||
| 6.750%, 5/15/18 | 2,342,379 | |||||||
| 6,000,000 | Newell Brands, Inc., 2.050%, 12/1/17 | 6,004,721 | ||||||
| 1,000,000 | Newell Brands, Inc., 5.000%, 11/15/23 | 1,066,299 | ||||||
| 650,000 | Volkswagen Group of America | |||||||
| Finance LLC, 144a, 1.650%, 5/22/18 | 649,353 | |||||||
| 34,294,495 | ||||||||
| Consumer Staples — 3.4% | ||||||||
| 7,000,000 | BAT Capital Corp., 144a, | |||||||
| 2.297%, 8/14/20 | 7,022,355 | |||||||
| 1,239,000 | Constellation Brands, Inc., | |||||||
| 3.875%, 11/15/19 | 1,285,787 | |||||||
| 6,800,000 | Kraft Heinz Foods Co., (3M LIBOR | |||||||
| +0.570%), 1.879%, 2/10/21(A) | 6,806,112 | |||||||
| 1,540,000 | Reckitt Benckiser Treasury Services | |||||||
| PLC (United Kingdom), 144a, (3M | ||||||||
| LIBOR +0.560%), 1.888%, 6/24/22(A) | 1,544,749 | |||||||
| 5,827,000 | Reynolds American, Inc., | |||||||
| 2.300%, 6/12/18 | 5,852,607 | |||||||
| 3,200,000 | Tyson Foods, Inc., (3M LIBOR | |||||||
| +0.550%), 1.868%, 6/2/20(A) | 3,215,221 | |||||||
| 25,726,831 | ||||||||
| Energy — 3.1% | ||||||||
| 1,000,000 | Columbia Pipeline Group, Inc., | |||||||
| 2.450%, 6/1/18 | 1,003,440 | |||||||
| 3,650,000 | Phillips 66, 144a, (3M LIBOR +0.650%), | |||||||
| 1.954%, 4/15/19(A) | 3,654,596 | |||||||
| 800,000 | Questar Pipeline LLC, 5.830%, 2/1/18 | 809,889 | ||||||
| 1,500,000 | Ras Laffan Liquefied Natural Gas Co. | |||||||
| (Qatar), 6.750%, 9/30/19 | 1,617,825 | |||||||
| 339,210 | Ras Laffan Liquefied Natural Gas Co. | |||||||
| Ltd. II (Qatar), 144a, 5.298%, 9/30/20 | 351,198 | |||||||
| 1,500,000 | Schlumberger Holdings Corp., 144a, | |||||||
| 1.900%, 12/21/17 | 1,501,373 | |||||||
| 4,441,000 | Spectra Energy Partners LP, | |||||||
| 2.950%, 9/25/18 | 4,486,424 | |||||||
| 10,000,000 | TransCanada PipeLines Ltd. (Canada), | |||||||
| 1.625%, 11/9/17 | 9,998,961 | |||||||
| 23,423,706 | ||||||||
| Materials — 2.9% | ||||||||
| 4,900,000 | Cabot Corp., 2.550%, 1/15/18 | 4,910,907 | ||||||
| 7,000,000 | Chevron Phillips Chemical Co. LLC / | |||||||
| Chevron Phillips Chemical Co. LP, | ||||||||
| 144a, 1.700%, 5/1/18 | 6,999,615 | |||||||
| 2,700,000 | EI du Pont de Nemours & Co., | |||||||
| 2.200%, 5/1/20 | 2,717,376 | |||||||
| 7,100,000 | Westlake Chemical Corp., | |||||||
| 4.625%, 2/15/21 | 7,337,850 | |||||||
| 21,965,748 | ||||||||
| 105 |
Touchstone Ultra Short Duration Fixed Income Fund (Continued)
| Principal | Market | |||||||
| Amount | Value | |||||||
| Corporate Bonds — 33.6% (Continued) | ||||||||
| Utilities — 2.9% | ||||||||
| $ | 3,000,000 | Dominion Energy, Inc., 2.579%, 7/1/20 | $ | 3,025,034 | ||||
| 825,000 | Dominion Resources, Inc., 144a, | |||||||
| 1.500%, 9/30/18 | 822,990 | |||||||
| 2,705,000 | E.ON International Finance BV | |||||||
| (Netherlands), 144a, | ||||||||
| 5.800%, 4/30/18 | 2,764,772 | |||||||
| 5,000,000 | Georgia Power Co., 2.000%, 3/30/20 | 5,004,873 | ||||||
| 700,000 | ITC Holdings Corp., 144a, | |||||||
| 5.500%, 1/15/20 | 748,856 | |||||||
| 800,000 | New York State Electric & Gas Corp., | |||||||
| 144a, 6.150%, 12/15/17 | 807,556 | |||||||
| 900,000 | South Carolina Electric & Gas Co., | |||||||
| 5.250%, 11/1/18 | 933,807 | |||||||
| 451,000 | Southern Electric Generating Co., | |||||||
| 144a, 2.200%, 12/1/18 | 452,499 | |||||||
| 650,000 | TECO Finance, Inc., 6.572%, 11/1/17 | 652,413 | ||||||
| 4,981,000 | United Utilities PLC (United Kingdom), | |||||||
| 4.550%, 6/19/18 | 5,070,870 | |||||||
| 1,255,000 | West Penn Power Co., 144a, | |||||||
| 5.950%, 12/15/17 | 1,264,916 | |||||||
| 21,548,586 | ||||||||
| Health Care — 2.7% | ||||||||
| 2,100,000 | Amgen, Inc., 1.900%, 5/10/19 | 2,103,228 | ||||||
| 2,100,000 | Amgen, Inc., 2.200%, 5/11/20 | 2,106,560 | ||||||
| 1,955,000 | Catholic Health Initiatives, | |||||||
| 1.600%, 11/1/17 | 1,954,918 | |||||||
| 7,700,000 | Dignity Health, 2.637%, 11/1/19 | 7,768,831 | ||||||
| 6,500,000 | Zoetis, Inc., 1.875%, 2/1/18 | 6,513,293 | ||||||
| 20,446,830 | ||||||||
| Information Technology — 2.1% | ||||||||
| 3,200,000 | Dell International LLC / EMC Corp., | |||||||
| 144a, 3.480%, 6/1/19 | 3,263,543 | |||||||
| 1,400,000 | Fidelity National Information Services, | |||||||
| Inc., 2.000%, 4/15/18 | 1,401,990 | |||||||
| 1,616,000 | Hewlett Packard Enterprise Co., | |||||||
| 2.450%, 10/5/17 | 1,616,075 | |||||||
| 9,300,000 | Hewlett Packard Enterprise Co., 144a, | |||||||
| 2.100%, 10/4/19 | 9,303,155 | |||||||
| 15,584,763 | ||||||||
| Industrials — 2.0% | ||||||||
| 3,650,000 | Arrow Electronics, Inc., 3.000%, 3/1/18 | 3,666,565 | ||||||
| 6,515,000 | Johnson Controls International PLC | |||||||
| (Ireland), 1.400%, 11/2/17 | 6,507,864 | |||||||
| 3,669,000 | Martin Marietta Materials, Inc., | |||||||
| 6.600%, 4/15/18 | 3,762,874 | |||||||
| 958,000 | SBA Tower Trust, 144a, | |||||||
| 2.898%, 10/8/19(C) | 963,931 | |||||||
| 14,901,234 | ||||||||
| Real Estate — 1.4% | ||||||||
| 2,250,000 | Equity Commonwealth, | |||||||
| 5.875%, 9/15/20 | 2,400,351 | |||||||
| 1,790,000 | Highwoods Realty LP, 7.500%, 4/15/18 | 1,843,062 | ||||||
| 865,000 | Prologis LP, 4.000%, 1/15/18 | 865,820 | ||||||
| 1,250,000 | Realty Income Corp., 2.000%, 1/31/18 | 1,251,080 | ||||||
| 650,000 | Select Income REIT, 2.850%, 2/1/18 | 651,482 | ||||||
| 2,210,000 | Simon Property Group LP, 144a, | |||||||
| 1.500%, 2/1/18 | 2,210,158 | |||||||
| 1,060,000 | Welltower, Inc., 2.250%, 3/15/18 | 1,062,635 | ||||||
| 10,284,588 | ||||||||
| Telecommunication Services — 0.6% | ||||||||
| 406,000 | Crown Castle Towers LLC, 144a, | |||||||
| 6.113%, 1/15/20 | 433,805 | |||||||
| 2,000,000 | DIRECTV Holdings LLC / DIRECTV | |||||||
| Financing Co., Inc., 1.750%, 1/15/18 | 2,001,219 | |||||||
| 1,405,000 | Sky PLC (United Kingdom), 144a, | |||||||
| 2.625%, 9/16/19 | 1,414,559 | |||||||
| 1,000,000 | Sky PLC (United Kingdom), 144a, | |||||||
| 6.100%, 2/15/18 | 1,016,293 | |||||||
| 4,865,876 | ||||||||
| Total Corporate Bonds | $ | 252,143,754 | ||||||
| Commercial Mortgage-Backed Securities — 7.2% | ||||||||
| 6,669,000 | A10 Term Asset Financing LLC, Ser | |||||||
| 2017-1A, Class A1FL, 144a, (1M | ||||||||
| LIBOR +0.850%), 2.084%, 3/15/36(A) | 6,669,000 | |||||||
| 3,835,117 | CD Mortgage Trust, Ser 2006-CD3, | |||||||
| Class AM, 5.648%, 10/15/48 | 3,933,404 | |||||||
| 6,560,000 | CGDB Commercial Mortgage Trust, | |||||||
| Ser 2017-BIO, Class B, 144a, (1M | ||||||||
| LIBOR +0.950%), 2.177%, 5/15/30(A) | 6,560,005 | |||||||
| 5,762,000 | COMM Mortgage Trust, Ser | |||||||
| 2016-SAVA, Class A, 144a, (1M | ||||||||
| LIBOR +1.720%), | ||||||||
| 2.955%, 10/15/34(A) | 5,783,595 | |||||||
| 259,848 | Commercial Mortgage Loan Trust, Ser | |||||||
| 2008-LS1, Class A4B, | ||||||||
| 6.267%, 12/10/49(A)(B) | 259,667 | |||||||
| 914,246 | DBUBS Mortgage Trust, Ser | |||||||
| 2011-LC2A, Class A1FL, 144a, (1M | ||||||||
| LIBOR +1.350%), 2.587%, 7/12/44(A) | 924,615 | |||||||
| 24,239 | FDIC Guaranteed Notes, Ser 2010-C1, | |||||||
| Class A, 144a, 2.980%, 12/6/20 | 24,273 | |||||||
| 143,822,000 | GS Mortgage Securities Corp. Trust, | |||||||
| Ser 2017-GPTX, Class XCP, 144a, | ||||||||
| 0.911%, 5/10/34(A)(B)(D) | 2,985,874 | |||||||
| 8,320,000 | Hospitality Mortgage Trust, Ser | |||||||
| 2017-HIT, Class B, 144a, (1M LIBOR | ||||||||
| +1.180%), 2.409%, 5/8/30(A) | 8,320,033 | |||||||
| 1,883,000 | Merrill Lynch Mortgage Investors | |||||||
| Trust, Ser 1998-C1, Class E, | ||||||||
| 6.750%, 11/15/26(A)(B) | 2,030,279 | |||||||
| 1,451,892 | PFP Ltd. (Cayman Islands), Ser 2015-2, | |||||||
| Class A, 144a, (1M LIBOR +1.450%), | ||||||||
| 2.684%, 7/14/34(A) | 1,451,096 | |||||||
| 106 |
Touchstone Ultra Short Duration Fixed Income Fund (Continued)
| Principal | Market | |||||||
| Amount | Value | |||||||
| Commercial Mortgage-Backed Securities — 7.2% (Continued) | ||||||||
| $ | 3,784,741 | RAIT Trust, Ser 2017-FL7, Class A, 144a, | ||||||
| (1M LIBOR +0.950%), | ||||||||
| 2.177%, 6/15/37(A) | $ | 3,786,314 | ||||||
| 14,228,922 | UBS-Citigroup Commercial Mortgage | |||||||
| Trust, Ser 2011-C1, Class XA, 144a, | ||||||||
| 2.424%, 1/10/45(A)(B)(D) | 1,030,325 | |||||||
| 5,249,000 | Wells Fargo Commercial Mortgage | |||||||
| Trust, Ser 2014-TISH, Class A, 144a, | ||||||||
| (1M LIBOR +1.030%), | ||||||||
| 2.257%, 2/15/27(A) | 5,243,021 | |||||||
| 5,000,000 | Wells Fargo Commercial Mortgage | |||||||
| Trust, Ser 2014-TISH, Class B, 144a, | ||||||||
| (1M LIBOR +1.350%), | ||||||||
| 2.577%, 2/15/27(A) | 5,017,130 | |||||||
| Total Commercial | ||||||||
| Mortgage-Backed Securities | $ | 54,018,631 | ||||||
| U.S. Government Mortgage-Backed | ||||||||
| Obligations — 3.9% | ||||||||
| 140,256 | FHLMC, Pool #1B1580, (12M LIBOR | |||||||
| +1.961%), 3.711%, 3/1/34(A) | 149,562 | |||||||
| 134,035 | FHLMC, Pool #1B2629, (12M LIBOR | |||||||
| +1.750%), 3.250%, 11/1/34(A) | 141,254 | |||||||
| 396,309 | FHLMC, Pool #1B7189, (12M LIBOR | |||||||
| +2.470%), 4.129%, 3/1/36(A) | 428,150 | |||||||
| 111,805 | FHLMC, Pool #1G1471, (12M LIBOR | |||||||
| +1.668%), 3.220%, 1/1/37(A) | 117,204 | |||||||
| 639,789 | FHLMC, Pool #1H1354, (1 Year CMT | |||||||
| Rate +2.250%), 3.016%, 11/1/36(A) | 674,897 | |||||||
| 68,702 | FHLMC, Pool #1H2524, (1 Year CMT | |||||||
| Rate +2.250%), 3.101%, 8/1/35(A) | 72,424 | |||||||
| 336,389 | FHLMC, Pool #1J1813, (12M LIBOR | |||||||
| +1.925%), 3.675%, 8/1/37(A) | 355,662 | |||||||
| 244,572 | FHLMC, Pool #1K1238, (1 Year CMT | |||||||
| Rate +2.250%), 3.232%, 7/1/36(A) | 258,162 | |||||||
| 147,783 | FHLMC, Pool #1L0087, (1 Year CMT | |||||||
| Rate +2.250%), 3.232%, 6/1/35(A) | 155,841 | |||||||
| 348,682 | FHLMC, Pool #1L0147, (1 Year CMT | |||||||
| Rate +2.290%), 3.377%, 7/1/35(A) | 369,091 | |||||||
| 206,023 | FHLMC, Pool #1L1288, (1 Year CMT | |||||||
| Rate +2.250%), 3.043%, 5/1/36(A) | 217,277 | |||||||
| 182,725 | FHLMC, Pool #1Q0080, (12M LIBOR | |||||||
| +1.688%), 3.338%, 1/1/36(A) | 191,963 | |||||||
| 420,055 | FHLMC, Pool #1Q0119, (12M LIBOR | |||||||
| +1.842%), 3.597%, 9/1/36(A) | 443,427 | |||||||
| 609,346 | FHLMC, Pool #1Q0187, (12M LIBOR | |||||||
| +1.780%), 3.278%, 12/1/36(A) | 638,269 | |||||||
| 350,950 | FHLMC, Pool #1Q0339, (12M LIBOR | |||||||
| +1.932%), 3.578%, 4/1/37(A) | 369,616 | |||||||
| 128,643 | FHLMC, Pool #1Q0669, (12M LIBOR | |||||||
| +1.723%), 3.326%, 11/1/37(A) | 135,044 | |||||||
| 518,764 | FHLMC, Pool #1Q1303, (1 Year CMT | |||||||
| Rate +2.250%), 3.001%, 11/1/36(A) | 547,308 | |||||||
| 641,157 | FHLMC, Pool #781515, (1 Year CMT | |||||||
| Rate +2.250%), 3.074%, 4/1/34(A) | 675,849 | |||||||
| 295,776 | FHLMC, Pool #782760, (1 Year CMT | |||||||
| Rate +2.250%), 3.093%, 11/1/36(A) | 312,970 | |||||||
| 244,696 | FHLMC, Pool #847795, (1 Year CMT | |||||||
| Rate +2.276%), 2.954%, 4/1/35(A) | 258,133 | |||||||
| 139,665 | FHLMC, Pool #848088, (1 Year CMT | |||||||
| Rate +2.245%), 2.979%, 4/1/35(A) | 147,052 | |||||||
| 500,375 | FHLMC, Pool #848539, (1 Year CMT | |||||||
| Rate +2.271%), 3.055%, 4/1/37(A) | 528,548 | |||||||
| 1,205,656 | FHLMC, Pool #848583, (1 Year CMT | |||||||
| Rate +2.300%), 3.050%, 1/1/36(A) | 1,274,802 | |||||||
| 17,392 | FHLMC, Pool #A92646, 5.500%, 6/1/40 | 19,631 | ||||||
| 16,458 | FHLMC, Pool #C03505, 5.500%, 6/1/40 | 18,152 | ||||||
| 68,891 | FHLMC, Pool #C66916, 7.000%, 5/1/32 | 77,062 | ||||||
| 12,704 | FHLMC, Pool #D94598, 6.500%, 4/1/21 | 13,332 | ||||||
| 50,729 | FHLMC, Pool #G01840, 5.000%, 7/1/35 | 55,658 | ||||||
| 451,466 | FHLMC, Pool #G11769, | |||||||
| 5.000%, 10/1/20 | 466,843 | |||||||
| 282,193 | FHLMC, Pool #G11773, | |||||||
| 5.000%, 10/1/20 | 289,720 | |||||||
| 142,232 | FHLMC, Pool #J10895, | |||||||
| 4.000%, 10/1/19 | 147,019 | |||||||
| 159,744 | FNMA, Pool #254868, 5.000%, 9/1/33 | 176,019 | ||||||
| 76,940 | FNMA, Pool #256272, 5.500%, 6/1/26 | 85,049 | ||||||
| 132,559 | FNMA, Pool #256852, 6.000%, 8/1/27 | 149,104 | ||||||
| 29,564 | FNMA, Pool #323832, 7.500%, 7/1/29 | 34,568 | ||||||
| 2,270 | FNMA, Pool #334593, 7.000%, 5/1/24 | 2,474 | ||||||
| 104,624 | FNMA, Pool #555380, (12M LIBOR | |||||||
| +1.600%), 3.266%, 4/1/33(A) | 110,331 | |||||||
| 55,323 | FNMA, Pool #665773, 7.500%, 6/1/31 | 56,997 | ||||||
| 111,418 | FNMA, Pool #679742, (1 Year CMT Rate | |||||||
| +2.580%), 3.273%, 1/1/40(A) | 114,636 | |||||||
| 78,038 | FNMA, Pool #681842, (1 Year CMT Rate | |||||||
| +2.125%), 2.900%, 2/1/33(A) | 81,752 | |||||||
| 157,204 | FNMA, Pool #681898, (1 Year CMT Rate | |||||||
| +2.125%), 2.935%, 4/1/33(A) | 165,341 | |||||||
| 170,137 | FNMA, Pool #725245, (1 Year CMT Rate | |||||||
| +2.140%), 2.952%, 2/1/34(A) | 179,079 | |||||||
| 179,867 | FNMA, Pool #725424, 5.500%, 4/1/34 | 201,646 | ||||||
| 1,116,769 | FNMA, Pool #725490, (12M LIBOR | |||||||
| +1.617%), 3.361%, 4/1/34(A) | 1,174,117 | |||||||
| 30,822 | FNMA, Pool #735439, 6.000%, 9/1/19 | 31,502 | ||||||
| 31,332 | FNMA, Pool #735484, 5.000%, 5/1/35 | 34,528 | ||||||
| 138,191 | FNMA, Pool #735539, (1 Year CMT Rate | |||||||
| +2.204%), 3.018%, 4/1/35(A) | 145,923 | |||||||
| 65,672 | FNMA, Pool #743207, (12M LIBOR | |||||||
| +1.520%), 2.947%, 10/1/33(A) | 68,656 | |||||||
| 47,768 | FNMA, Pool #745467, (12M LIBOR | |||||||
| +1.947%), 3.387%, 4/1/36(A) | 50,312 | |||||||
| 56,270 | FNMA, Pool #745790, (1 Year CMT Rate | |||||||
| +2.082%), 2.984%, 8/1/36(A) | 58,902 | |||||||
| 249,798 | FNMA, Pool #761411, 4.500%, 5/1/19 | 255,468 | ||||||
| 107 |
Touchstone Ultra Short Duration Fixed Income Fund (Continued)
| Principal | Market | |||||||
| Amount | Value | |||||||
| U.S. Government Mortgage-Backed | ||||||||
| Obligations — 3.9% (Continued) | ||||||||
| $ | 84,675 | FNMA, Pool #784365, (6M LIBOR | ||||||
| +1.550%), 2.925%, 5/1/34(A) | $ | 87,544 | ||||||
| 187,118 | FNMA, Pool #791978, (6M LIBOR | |||||||
| +1.518%), 2.969%, 9/1/34(A) | 194,650 | |||||||
| 62,792 | FNMA, Pool #804001, (1 Year CMT Rate | |||||||
| +2.185%), 2.685%, 10/1/34(A) | 66,058 | |||||||
| 54,335 | FNMA, Pool #809897, (12M LIBOR | |||||||
| +1.704%), 3.364%, 3/1/35(A) | �� | 57,223 | ||||||
| 182,703 | FNMA, Pool #813170, (12M LIBOR | |||||||
| +1.575%), 3.200%, 1/1/35(A) | 191,435 | |||||||
| 958,611 | FNMA, Pool #815323, (6M LIBOR | |||||||
| +1.537%), 2.914%, 1/1/35(A) | 991,414 | |||||||
| 197,954 | FNMA, Pool #820364, (12M LIBOR | |||||||
| +0.969%), 2.720%, 4/1/35(A) | 205,405 | |||||||
| 465,375 | FNMA, Pool #827787, (6M LIBOR | |||||||
| +1.550%), 2.925%, 5/1/35(A) | 481,511 | |||||||
| 55,614 | FNMA, Pool #828480, (12M LIBOR | |||||||
| +1.730%), 3.605%, 6/1/35(A) | 58,446 | |||||||
| 130,294 | FNMA, Pool #839239, (12M LIBOR | |||||||
| +1.760%), 3.402%, 9/1/35(A) | 137,362 | |||||||
| 105,261 | FNMA, Pool #888179, (12M LIBOR | |||||||
| +1.822%), 3.449%, 2/1/37(A) | 111,194 | |||||||
| 63,581 | FNMA, Pool #888548, (1 Year CMT Rate | |||||||
| +2.250%), 2.935%, 5/1/35(A) | 67,172 | |||||||
| 107,408 | FNMA, Pool #889060, 6.000%, 1/1/38 | 122,116 | ||||||
| 102,140 | FNMA, Pool #889061, 6.000%, 1/1/38 | 117,657 | ||||||
| 6,469 | FNMA, Pool #889382, 5.500%, 4/1/38 | 7,253 | ||||||
| 365,810 | FNMA, Pool #922674, (12M LIBOR | |||||||
| +1.905%), 3.581%, 4/1/36(A) | 388,403 | |||||||
| 106,129 | FNMA, Pool #931676, 5.500%, 1/1/19 | 107,691 | ||||||
| 176,860 | FNMA, Pool #950385, (6M LIBOR | |||||||
| +0.956%), 2.406%, 8/1/37(A) | 179,024 | |||||||
| 52,266 | FNMA, Pool #960376, 5.500%, 12/1/37 | 58,091 | ||||||
| 853 | FNMA, Pool #995284, 5.500%, 3/1/20 | 855 | ||||||
| 385,134 | FNMA, Pool #AA1150, 4.000%, 4/1/23 | 398,227 | ||||||
| 10,533 | FNMA, Pool #AD0941, 5.500%, 4/1/40 | 11,933 | ||||||
| 80,745 | FNMA, Pool #AE0363, 5.000%, 7/1/37 | 88,987 | ||||||
| 152,782 | FNMA, Pool #AE0727, 4.000%, 10/1/20 | 157,976 | ||||||
| 109,660 | FNMA, Pool #AE5441, 5.000%, 10/1/40 | 119,955 | ||||||
| 184,431 | FNMA, Pool #AI6588, 4.000%, 7/1/26 | 193,929 | ||||||
| 199,021 | FNMA, Pool #AI8506, 4.000%, 8/1/26 | 209,375 | ||||||
| 178,746 | FNMA, Pool #AL0211, 5.000%, 4/1/41 | 195,498 | ||||||
| 28,757 | FNMA, Pool #AL0302, 5.000%, 4/1/24 | 30,351 | ||||||
| 1,157,680 | FNMA, Pool #AL0478, (12M LIBOR | |||||||
| +1.793%), 3.312%, 4/1/36(A) | 1,223,608 | |||||||
| 308,077 | FNMA, Pool #AL0543, 5.000%, 7/1/41 | 336,864 | ||||||
| 167,145 | FNMA, Pool #AL1105, 4.500%, 12/1/40 | 182,099 | ||||||
| 56,810 | FNMA, Pool #AL2591, 5.500%, 5/1/38 | 59,646 | ||||||
| 614,111 | FNMA, Pool #AL5275, (6M LIBOR | |||||||
| +1.493%), 2.876%, 9/1/37(A) | 633,522 | |||||||
| 3,318,163 | FNMA, Pool #AL7396, (6M LIBOR | |||||||
| +1.538%), 2.918%, 2/1/37(A) | 3,429,195 | |||||||
| 9,351 | GNMA, Pool #344233, 8.000%, 2/15/23 | 10,011 | ||||||
| 55,022 | GNMA, Pool #345123, | |||||||
| 8.000%, 12/15/23 | 59,338 | |||||||
| 5,185 | GNMA, Pool #569337, 6.500%, 4/15/22 | 5,480 | ||||||
| 12,580 | GNMA, Pool #780322, | |||||||
| 8.000%, 11/15/22 | 13,652 | |||||||
| 557,675 | GNMA, Pool #80826, (1 Year CMT Rate | |||||||
| +1.500%), 2.375%, 2/20/34(A) | 580,588 | |||||||
| 241,492 | GNMA, Pool #80889, (1 Year CMT Rate | |||||||
| +1.500%), 2.625%, 4/20/34(A) | 251,680 | |||||||
| 409,062 | GNMA, Pool #81016, (1 Year CMT Rate | |||||||
| +1.500%), 2.125%, 8/20/34(A) | 425,337 | |||||||
| 848,203 | GNMA, Pool #82760, (1 Year CMT Rate | |||||||
| +1.500%), 2.375%, 3/20/41(A) | 874,020 | |||||||
| 981 | GNMA, Pool #8426, (1 Year CMT Rate | |||||||
| +1.500%), 3.000%, 11/20/18(A) | 981 | |||||||
| 636,560 | GNMA, Pool #MA2392, (1 Year CMT | |||||||
| Rate +1.500%), 2.000%, 11/20/44(A) | 654,905 | |||||||
| 2,466,758 | GNMA, Pool #MA2466, (1 Year CMT | |||||||
| Rate +1.500%), 2.000%, 12/20/44(A) | 2,539,949 | |||||||
| Total U.S. Government | ||||||||
| Mortgage-Backed Obligations | $ | 29,043,936 | ||||||
| Municipal Bonds — 3.2% | ||||||||
| California — 0.6% | ||||||||
| 2,340,000 | CA St Enterprise Dev Authority, Txbl | |||||||
| Variable J Harris Indl Wt, (LOC: City | ||||||||
| National Bank), 144a, 1.480%, | ||||||||
| 9/1/41(A)(B) | 2,340,000 | |||||||
| 110,000 | CA St Infrastructure & Economic Dev | |||||||
| Bank, Txbl Tobinworld Pj, Ser B, | ||||||||
| (LOC: Comerica Bank), 2.180%, | ||||||||
| 11/1/36(A)(B) | 110,000 | |||||||
| 1,885,000 | CA St Infrastructure & Economic Dev | |||||||
| Bank, Variable Canyon Plastics Inc P, | ||||||||
| (LOC: Bank Of West (The), 1.090%, | ||||||||
| 12/1/39(A)(B) | 1,885,000 | |||||||
| 4,335,000 | ||||||||
| Connecticut — 0.1% | ||||||||
| 425,000 | State of Connecticut, Ser A, UTGO, | |||||||
| (MUNISPA +0.920%), 1.860%, | ||||||||
| 5/15/18(A) | 426,666 | |||||||
| Florida — 0.7% | ||||||||
| 5,000,000 | State Brd of Admin Fin Corp., Txbl Ser | |||||||
| A, 2.163%, 7/1/19 | 5,021,400 | |||||||
| Massachusetts — 0.2% | ||||||||
| 1,842,000 | MA St Edu Fin Auth, Ser B 1, (1M LIBOR | |||||||
| +1.750%), 2.987%, 1/1/31(A) | 1,843,787 | |||||||
| Minnesota — 0.2% | ||||||||
| 1,095,000 | Saint Paul MN Hsg & Redev Auth, Txbl | |||||||
| Ref Healthpartners Oblig, 1.838%, | ||||||||
| 7/1/18 | 1,096,172 | |||||||
| 108 |
Touchstone Ultra Short Duration Fixed Income Fund (Continued)
| Principal | Market | |||||||
| Amount | Value | |||||||
| Municipal Bonds — 3.2% (Continued) | ||||||||
| New Mexico — 0.0% | ||||||||
| $ | 30,000 | New Mexico Educational Assistance | ||||||
| Foundation, (3M LIBOR +0.650%), | ||||||||
| 1.966%, 12/1/28(A) | $ | 30,017 | ||||||
| New York — 0.4% | ||||||||
| 3,300,000 | Brookhaven NY IDA, Variable | |||||||
| Intercounty Asso, (LOC: Capital One | ||||||||
| NA), 1.300%, 1/1/25(A)(B) | 3,300,000 | |||||||
| Ohio — 0.1% | ||||||||
| 1,000,000 | West Carrollton OH Non-Tax Rev, Txbl | |||||||
| Various Purpose BANS, 1.600%, | ||||||||
| 5/1/18 | 999,310 | |||||||
| Other Territory — 0.8% | ||||||||
| 5,900,000 | Rib Floater Trust, Txbl Muni Floaters Trs | |||||||
| Ser 201, (LOC: Barclays Bank | ||||||||
| PLC), 144a, 1.590%, 7/1/22(A)(B) | 5,900,000 | |||||||
| South Carolina — 0.1% | ||||||||
| 535,000 | Spartanburg SC Wtrwks Rev, Txbl Ref | |||||||
| Sys Ser B, 1.519%, 12/1/17 | 535,037 | |||||||
| 280,000 | Spartanburg SC Wtrwks Rev, Txbl Ref | |||||||
| Sys Ser B, 1.785%, 12/1/18 | 280,283 | |||||||
| 815,320 | ||||||||
| Total Municipal Bonds | $ | 23,767,672 | ||||||
| Agency Collateralized Mortgage | ||||||||
| Obligations — 2.5% | ||||||||
| 124,620,384 | FHLMC Multifamily Structured Pass | |||||||
| Through Certificates, Ser K504 Class | ||||||||
| X1, 0.322%, 9/25/20(A)(B)(D) | 480,250 | |||||||
| 131,333,332 | FHLMC Multifamily Structured Pass | |||||||
| Through Certificates, Ser KAIV Class | ||||||||
| X1, 1.303%, 6/25/21(A)(B)(D) | 4,839,016 | |||||||
| 32,860 | FHLMC REMIC, Ser 2510 Class TA, | |||||||
| 4.000%, 6/15/32 | 33,321 | |||||||
| 379,101 | FHLMC REMIC, Ser 2770 Class FH, (1M | |||||||
| LIBOR +0.400%), 1.634%, 3/15/34(A) | 378,963 | |||||||
| 55,440 | FHLMC REMIC, Ser 3414 Class MB, | |||||||
| 4.250%, 12/15/19 | 55,979 | |||||||
| 2,165 | FHLMC REMIC, Ser 4459 Class NG, | |||||||
| 6.500%, 10/15/24 | 2,175 | |||||||
| 222,021 | FNMA REMIC, Ser 2003-119, Class PU, | |||||||
| 4.000%, 11/25/33 | 223,763 | |||||||
| 80,680 | FNMA REMIC, Ser 2003-33, Class AM, | |||||||
| 4.250%, 5/25/33 | 85,033 | |||||||
| 71,596 | FNMA REMIC, Ser 2003-42, Class CA, | |||||||
| 4.000%, 5/25/33 | 74,146 | |||||||
| 313,494 | FNMA REMIC, Ser 2003-81, Class FE, | |||||||
| (1M LIBOR +0.500%), | ||||||||
| 1.737%, 9/25/33(A) | 314,711 | |||||||
| 70,934 | FNMA REMIC, Ser 2010-13, Class WD, | |||||||
| 4.250%, 3/25/25 | 72,095 | |||||||
| 39,688 | FNMA REMIC, Ser 2011-52, Class AH, | |||||||
| 2.750%, 10/25/18 | 39,728 | |||||||
| 292,785 | FNMA REMIC, Ser 2012-102, Class NA, | |||||||
| 1.500%, 9/25/27 | 284,891 | |||||||
| 142,031 | FNMA REMIC Trust, Ser 2001-W4, Class | |||||||
| AF5, 6.114%, 2/25/32(C) | 171,911 | |||||||
| 128,588 | GNMA, Ser 2002-72, Class AB, | |||||||
| 4.500%, 10/20/32 | 137,236 | |||||||
| 97,441 | GNMA, Ser 2011-57, Class BA, | |||||||
| 3.000%, 5/20/40 | 98,980 | |||||||
| 198,548 | GNMA, Ser 2012-27, Class A, | |||||||
| 1.614%, 7/16/39 | 195,034 | |||||||
| 6,361,044 | GNMA, Ser 2016-40, Class F, (1M LIBOR | |||||||
| +0.400%), 1.634%, 7/16/57(A) | 6,295,178 | |||||||
| 5,032,556 | GNMA, Ser 2016-95, Class F, (1M LIBOR | |||||||
| +0.450%), 1.684%, 1/16/58(A) | 4,987,768 | |||||||
| Total Agency Collateralized | ||||||||
| Mortgage Obligations | $ | 18,770,178 | ||||||
| Non-Agency Collateralized Mortgage | ||||||||
| Obligations — 2.0% | ||||||||
| 2,482,380 | Bear Stearns ARM Trust, Ser 2003-1, | |||||||
| Class 5A1, 3.171%, 4/25/33(A)(B)†† | 2,512,996 | |||||||
| 295,775 | Bear Stearns ARM Trust, Ser 2004-1, | |||||||
| Class 13A3, 3.701%, 4/25/34(A)(B)†† | 297,803 | |||||||
| 219,975 | Bear Stearns Asset Backed Securities | |||||||
| Trust, Ser 2003-AC7, Class A2, | ||||||||
| 5.750%, 1/25/34(C)†† | 223,435 | |||||||
| 75,441 | Community Program Loan Trust, Ser | |||||||
| 1987-A, Class A5, 4.500%, 4/1/29 | 75,214 | |||||||
| 329,730 | CSMC Trust, Ser 2012-CIM1, Class A1, | |||||||
| 144a, 3.380%, 2/25/42(A)(B) | 334,354 | |||||||
| 3,565,510 | CSMC Trust, Ser 2014-WIN1, Class 2A5, | |||||||
| 144a, 3.000%, 9/25/44(A)(B) | 3,565,510 | |||||||
| 63,676 | FDIC Structured Sale Guaranteed | |||||||
| Notes, Ser 2010-S3, Class A, 144a, | ||||||||
| 2.740%, 12/3/20 | 63,687 | |||||||
| 177,403 | JP Morgan Mortgage Trust, Ser | |||||||
| 2006-A4, Class 2A2, | ||||||||
| 3.335%, 6/25/36(A)(B) | 160,566 | |||||||
| 21,572 | Merrill Lynch Mortgage Investors | |||||||
| Trust, Ser 2003-A1, Class 2A, (12M | ||||||||
| LIBOR +1.625%), | ||||||||
| 3.337%, 12/25/32(A) | 21,531 | |||||||
| 164,672 | Merrill Lynch Mortgage Investors | |||||||
| Trust, Ser 2004-1, Class 1A, | ||||||||
| 3.136%, 12/25/34(A)(B) | 163,453 | |||||||
| 873,415 | RFMSI Trust, Ser 2007-SA1, Class 1A1, | |||||||
| 3.517%, 2/25/37(A)(B) | 747,056 | |||||||
| 3,549,790 | Springleaf Mortgage Loan Trust, Ser | |||||||
| 2013-3A, Class A, 144a, | ||||||||
| 1.870%, 9/25/57(A)(B) | 3,544,889 | |||||||
| 2,830,288 | Towd Point Mortgage Trust, Ser | |||||||
| 2015-4, Class A1B, 144a, | ||||||||
| 2.750%, 4/25/55(A)(B) | 2,844,566 | |||||||
| 109 |
Touchstone Ultra Short Duration Fixed Income Fund (Continued)
| Principal | Market | |||||||
| Amount | Value | |||||||
| Non-Agency Collateralized Mortgage | ||||||||
| Obligations — 2.0% (Continued) | ||||||||
| $ | 176,595 | Wells Fargo Mortgage Backed | ||||||
| Securities Trust, Ser 2003-G, Class | ||||||||
| A1, 3.365%, 6/25/33(A)(B) | $ | 177,952 | ||||||
| 421,362 | Wells Fargo Mortgage Backed | |||||||
| Securities Trust, Ser 2003-M, Class | ||||||||
| A1, 3.034%, 12/25/33(A)(B) | 426,049 | |||||||
| Total Non-Agency Collateralized | ||||||||
| Mortgage Obligations | $ | 15,159,061 | ||||||
| U.S. Government Agency Obligations — 1.0% | ||||||||
| 5,000,000 | Overseas Private Investment Corp., | |||||||
| 1.120%, 7/20/22(A) | 5,000,000 | |||||||
| 2,100,000 | Overseas Private Investment Corp., | |||||||
| 1.120%, 10/15/33(A) | 2,100,000 | |||||||
| 19,816 | Small Business Administration | |||||||
| Participation Certificates, Ser | ||||||||
| 2002-20A, Class 1, 6.140%, 1/1/22 | 20,935 | |||||||
| 35,029 | Small Business Administration | |||||||
| Participation Certificates, Ser | ||||||||
| 2003-20E, Class 1, 4.640%, 5/1/23 | 36,343 | |||||||
| 187,789 | Small Business Administration Pools, | |||||||
| 1.650%, 1/25/26(A) | 186,772 | |||||||
| 155,784 | Small Business Administration Pools, | |||||||
| 1.750%, 4/25/28(A) | 155,456 | |||||||
| Total U.S. Government Agency | ||||||||
| Obligations | $ | 7,499,506 | ||||||
| Commercial Paper — 8.8% | ||||||||
| 12,000,000 | CenterPoint Energy, Inc., 1.280%, | |||||||
| 10/2/17(E) | 11,998,650 | |||||||
| 10,000,000 | Entergy Corp., 1.300%, 10/2/17(E) | 9,998,646 | ||||||
| 12,000,000 | Kroger Co., 1.250%, 10/2/17(E) | 11,998,650 | ||||||
| 10,650,000 | Mondelez International, Inc., 1.250%, | |||||||
| 10/2/17(E) | 10,648,802 | |||||||
| 3,150,000 | Orange and Rockland Utilities, Inc., | |||||||
| 1.301%, 10/2/17(E) | 3,149,646 | |||||||
| 10,050,000 | Snap-on, Inc., 1.200%, 10/5/17(E) | 10,047,726 | ||||||
| 8,000,000 | Spectra Energy Partners LP, 1.280%, | |||||||
| 10/2/17(E) | 7,999,100 | |||||||
| Total Commercial Paper | $ | 65,841,220 | ||||||
| Shares | ||||||||
| Short-Term Investment Fund — 0.0% | ||||||||
| 88,420 | Dreyfus Government Cash | |||||||
| Management, Institutional Shares, | ||||||||
| 0.92%¥W | $ | 88,420 | ||||||
| Total Investment Securities —100.2% | ||||||||
| (Cost $751,638,144) | $ | 751,457,644 | ||||||
| Liabilities in Excess of | ||||||||
| Other Assets — (0.2%) | (1,268,973 | ) | ||||||
| Net Assets — 100.0% | $ | 750,188,671 | ||||||
| (A) | Variable rate security - Rate reflected is the rate in effect as of September 30, 2017. |
| (B) | Certain variable rate securities are not based on a published reference rate and spread but are determined by the issuer or agent and are based on current market conditions. These securities do not indicate a reference rate and spread in their description. |
| (C) | Step Bond - A bond that pays an initial interest rate for the first period and then a higher interest rate for the following periods until maturity. The interest rate shown reflects the rate in effect as of September 30, 2017. |
| (D) | Interest only security - This type of security represents the right to receive the monthly interest payments on an underlying pool of mortgages. Payments of principal on the pool reduce the value of the “interest only” holding. |
| (E) | Rate reflects yield at the time of purchase. |
| †† | The issuers and/or sponsors of certain mortgage-backed securities may no longer exist; however, the securities held by the Fund are separate legal entities organized as trusts and publicly traded. The Fund receives principal and interest payments directly from these trusts. |
| ¥ | Open-End Fund. |
| W | Represents the 7-day SEC yield as of September 30, 2017. |
| 110 |
Touchstone Ultra Short Duration Fixed Income Fund (Continued)
Portfolio Abbreviations:
ARM - Adjustable Rate Mortgage
CLO - Collateralized Loan Obligations
CMT - Constant Maturity Treasury
FDIC - Federal Deposit Insurance Corporation
FHLMC - Federal Home Loan Mortgage Corporation
FNMA - Federal National Mortgage Association
GNMA - Government National Mortgage Association
IDA - Industrial Development Agency
LIBOR - London Interbank Offered Rate
LLC - Limited Liability Company
LOC - Letter of Credit
LP - Limited Partnership
MTN - Medium Term Note
MUNISPA - SIFMA Municipal Swap Index Yield
PLC - Public Limited Company
REIT - Real Estate Investment Trust
REMIC - Real Estate Mortgage Investment Conduit
UTGO - Unlimited Tax General Obligation
144a - This is a restricted security that was sold in a transaction qualifying for the exemption under Rule 144A of the Securities Act of 1933. This security may be sold in transactions exempt from registration, normally to qualified institutional buyers. At September 30, 2017, these securities were valued at $371,145,897 or 49.5% of net assets. These securities were deemed liquid pursuant to procedures approved by the Board of Trustees.
Other Information:
The inputs or methodology used for valuing securities may not be an indication of the risk associated with investing in those securities. For more information on valuation inputs, and their aggregation into the levels used in the table below, please refer to the security valuation section in the accompanying Notes to Financial Statements.
| Valuation inputs at Reporting Date: | ||||||||||||||||
| Description | Level 1 | Level 2 | Level 3 | Total | ||||||||||||
| Asset-Backed Securities | $ | — | $ | 285,125,266 | $ | — | $ | 285,125,266 | ||||||||
| Corporate Bonds | — | 252,143,754 | — | 252,143,754 | ||||||||||||
| Commercial Mortgage-Backed Securities | — | 54,018,631 | — | 54,018,631 | ||||||||||||
| U.S. Government Mortgage-Backed Obligations | — | 29,043,936 | — | 29,043,936 | ||||||||||||
| Municipal Bonds | — | 23,767,672 | — | 23,767,672 | ||||||||||||
| Agency Collateralized Mortgage Obligations | — | 18,770,178 | — | 18,770,178 | ||||||||||||
| Non-Agency Collateralized Mortgage Obligations | — | 15,159,061 | — | 15,159,061 | ||||||||||||
| U.S. Government Agency Obligations | — | 7,499,506 | — | 7,499,506 | ||||||||||||
| Commercial Paper | — | 65,841,220 | — | 65,841,220 | ||||||||||||
| Short-Term Investment Fund | 88,420 | — | — | 88,420 | ||||||||||||
| Total | $ | 88,420 | $ | 751,369,224 | $ | — | $ | 751,457,644 | ||||||||
See accompanying Notes to Financial Statements.
| 111 |
Statements of Assets and Liabilities
September 30, 2017
| Touchstone | ||||||||||||||||
| Touchstone | Touchstone | Emerging | Touchstone | |||||||||||||
| Active Bond | Arbitrage | Markets Small | High Yield | |||||||||||||
| Fund | Fund | Cap Fund | Fund | |||||||||||||
| Assets | ||||||||||||||||
| Investments, at cost | $ | 125,061,695 | $ | 266,961,717 | $ | 12,608,337 | $ | 212,387,674 | ||||||||
| Investments, at market value (A) | $ | 127,045,078 | $ | 265,873,941 | $ | 13,895,527 | $ | 217,433,674 | ||||||||
| Cash | 471,319 | 1,878 | — | — | ||||||||||||
| Foreign currency (B) | — | — | 106,106 | — | ||||||||||||
| Cash collateral for securities sold short and written options | — | 23,584,940 | — | — | ||||||||||||
| Unrealized appreciation on forward foreign currency contracts | — | 18,521 | — | — | ||||||||||||
| Dividends and interest receivable | 795,599 | 422,206 | 22,980 | 3,576,347 | ||||||||||||
| Receivable for capital shares sold | 136,227 | 859,763 | 21,500 | 53,660 | ||||||||||||
| Receivable for investments sold | 8,655,048 | 2,740,810 | 125,905 | 1,143,361 | ||||||||||||
| Receivable for securities lending income | 1,283 | 1,989 | 214 | 1,347 | ||||||||||||
| Receivable from Investment Advisor | — | — | 5,274 | — | ||||||||||||
| Tax reclaim receivable | — | — | 147 | — | ||||||||||||
| Other assets | 29,317 | 25,083 | 14,250 | 25,405 | ||||||||||||
| Total Assets | 137,133,871 | 293,529,131 | 14,191,903 | 222,233,794 | ||||||||||||
| Liabilities | ||||||||||||||||
| Foreign currency(B) | — | 189,004 | — | — | ||||||||||||
| Written options, at market value(C) | — | 83,080 | — | — | ||||||||||||
| Securities sold short(D) | — | 36,625,396 | — | — | ||||||||||||
| Dividend and interest payable on securities sold short | — | 5,387 | — | — | ||||||||||||
| Payable for return of collateral for securities on loan | 766,137 | 7,995,632 | 295,388 | 1,467,010 | ||||||||||||
| Deferred foreign capital gains tax(E) | — | — | 43,056 | — | ||||||||||||
| Payable for capital shares redeemed | 25,907 | 727,894 | 48,493 | 184,992 | ||||||||||||
| Payable for investments purchased | 8,984,513 | 6,238,539 | 108,039 | 2,468,306 | ||||||||||||
| Payable to Investment Advisor | 37,793 | 206,032 | — | 88,553 | ||||||||||||
| Payable to other affiliates | 7,629 | 35,663 | 132 | 30,721 | ||||||||||||
| Payable to Trustees | 3,920 | 3,920 | 3,920 | 3,920 | ||||||||||||
| Payable for professional services | 24,533 | 29,187 | 52,168 | 26,443 | ||||||||||||
| Payable to Transfer Agent | 38,787 | 30,216 | 4,225 | 42,420 | ||||||||||||
| Payable for reports to shareholders | 10,307 | 15,914 | 9,884 | 11,420 | ||||||||||||
| Other accrued expenses and liabilities | 28,274 | 11,561 | 22,501 | 21,339 | ||||||||||||
| Total Liabilities | 9,927,800 | 52,197,425 | 587,806 | 4,345,124 | ||||||||||||
| Net Assets | $ | 127,206,071 | $ | 241,331,706 | $ | 13,604,097 | $ | 217,888,670 | ||||||||
| Net assets consist of: | ||||||||||||||||
| Par value | $ | 121,960 | $ | 233,357 | $ | 12,260 | $ | 252,528 | ||||||||
| Paid-in capital | 125,074,114 | 237,582,870 | 109,967,098 | 228,081,628 | ||||||||||||
| Accumulated net investment income (loss) | 100,863 | (249,346 | ) | 38,936 | 484,289 | |||||||||||
| Accumulated net realized gains (losses) on investments, forward foreign currency contracts, foreign currency transactions, futures contracts, written options and securities sold short | (74,249 | ) | 6,843,668 | (97,658,217 | ) | (15,975,775 | ) | |||||||||
| Net unrealized appreciation (depreciation) on investments, foreign | ||||||||||||||||
| currency transactions, written options and securities sold short | 1,983,383 | (3,078,843 | ) | 1,244,020 | 5,046,000 | |||||||||||
| Net Assets | $ | 127,206,071 | $ | 241,331,706 | $ | 13,604,097 | $ | 217,888,670 | ||||||||
| (A) Includes market value of securities on loan of: | $ | 743,226 | $ | 7,865,394 | $ | 282,592 | $ | 1,401,729 | ||||||||
| (B) Cost of foreign currency: | $ | — | $ | (184,602 | ) | $ | 106,099 | $ | — | |||||||
| (C) Premiums received from written options: | $ | — | $ | 110,741 | $ | — | $ | — | ||||||||
| (D) Proceeds received for securities sold short: | $ | — | $ | 34,592,393 | $ | — | $ | — | ||||||||
| (E) See Note 2 in Notes to Financial Statements. | ||||||||||||||||
See accompanying Notes to Financial Statements.
| 112 |
Statements of Assets and Liabilities (Continued)
| Touchstone | Touchstone | Touchstone | Touchstone | Touchstone | Touchstone | |||||||||||||||||
| Merger | Mid | Mid Cap | Premium | Sands Capital | Small | |||||||||||||||||
| Arbitrage | Cap | Value | Yield Equity | Select Growth | Cap | |||||||||||||||||
| Fund | Fund | Fund | Fund | Fund | Fund | |||||||||||||||||
| $ | 242,290,915 | $ | 617,148,867 | $ | 615,799,281 | $ | 105,333,633 | $ | 1,327,436,750 | $ | 170,906,193 | |||||||||||
| $ | 241,630,740 | $ | 777,882,086 | $ | 711,174,683 | $ | 122,839,519 | $ | 2,570,421,650 | $ | 247,924,245 | |||||||||||
| 423,672 | — | — | 13,346 | — | — | |||||||||||||||||
| — | — | — | — | — | — | |||||||||||||||||
| 3,641,369 | — | — | — | — | — | |||||||||||||||||
| 10,864 | — | — | — | — | — | |||||||||||||||||
| 435,474 | 392,405 | 977,651 | 208,193 | — | 271,003 | |||||||||||||||||
| 440,501 | 1,554,650 | 2,700,256 | 97,662 | 1,671,216 | 186,312 | |||||||||||||||||
| 1,791,711 | 18,532,597 | 536,697 | — | 19,435,714 | 14,470,151 | |||||||||||||||||
| — | 27 | 3,086 | 6,401 | 140,854 | 22,559 | |||||||||||||||||
| — | — | — | — | — | — | |||||||||||||||||
| — | — | — | 23,630 | — | — | |||||||||||||||||
| 20,813 | 35,244 | 31,241 | 13,546 | 21,478 | 14,529 | |||||||||||||||||
| 248,395,144 | 798,397,009 | 715,423,614 | 123,202,297 | 2,591,690,912 | 262,888,799 | |||||||||||||||||
| 99,850 | — | — | — | — | — | |||||||||||||||||
| 65,245 | — | — | — | — | — | |||||||||||||||||
| 28,415,672 | — | — | — | — | — | |||||||||||||||||
| 60,768 | — | — | — | — | — | |||||||||||||||||
| — | — | 19,265,914 | 2,017,911 | 50,169,710 | 18,630,416 | |||||||||||||||||
| — | — | — | — | — | — | |||||||||||||||||
| 125,888 | 1,255,479 | 328,161 | 203,763 | 14,096,575 | 13,094,712 | |||||||||||||||||
| 4,644,795 | 19,364,363 | 6,352,117 | — | 28,532,174 | 1,307,168 | |||||||||||||||||
| 180,595 | 475,291 | 453,739 | 75,786 | 1,687,724 | 174,551 | |||||||||||||||||
| 36,927 | 129,229 | 48,717 | 32,670 | 782,940 | 38,329 | |||||||||||||||||
| 3,920 | 3,920 | 3,920 | 3,920 | 3,920 | 3,920 | |||||||||||||||||
| 28,848 | 28,770 | 26,550 | 21,924 | 46,045 | 21,983 | |||||||||||||||||
| 28,725 | 134,799 | 85,844 | 20,211 | 495,530 | 36,960 | |||||||||||||||||
| 12,259 | 43,775 | 34,691 | 11,458 | 82,411 | 19,952 | |||||||||||||||||
| 11,729 | 3,309 | 3,180 | 2,458 | 12,370 | 3,885 | |||||||||||||||||
| 33,715,221 | 21,438,935 | 26,602,833 | 2,390,101 | 95,909,399 | 33,331,876 | |||||||||||||||||
| $ | 214,679,923 | $ | 776,958,074 | $ | 688,820,781 | $ | 120,812,196 | $ | 2,495,781,513 | $ | 229,556,923 | |||||||||||
| $ | 192,732 | $ | 260,156 | $ | 353,541 | $ | 128,734 | $ | 1,464,442 | $ | 128,389 | |||||||||||
| 209,109,497 | 686,338,243 | 560,037,343 | 100,840,727 | 808,999,600 | 124,763,819 | |||||||||||||||||
| (297,174 | ) | 477,776 | 186,621 | 282,429 | (12,169,854 | ) | 929,602 | |||||||||||||||
| 8,801,086 | (70,851,320 | ) | 32,867,874 | 2,054,420 | 454,502,425 | 26,717,061 | ||||||||||||||||
| (3,126,218 | ) | 160,733,219 | 95,375,402 | 17,505,886 | 1,242,984,900 | 77,018,052 | ||||||||||||||||
| $ | 214,679,923 | $ | 776,958,074 | $ | 688,820,781 | $ | 120,812,196 | $ | 2,495,781,513 | $ | 229,556,923 | |||||||||||
| $ | — | $ | — | $ | 18,923,622 | $ | 1,993,197 | $ | 49,257,364 | $ | 17,878,002 | |||||||||||
| $ | (97,815 | ) | $ | — | $ | — | $ | — | $ | — | $ | — | ||||||||||
| $ | 89,487 | $ | — | $ | — | $ | — | $ | — | $ | — | |||||||||||
| $ | 25,916,498 | $ | — | $ | — | $ | — | $ | — | $ | — | |||||||||||
| 113 |
Statements of Assets and Liabilities (Continued)
| Touchstone | ||||||||||||||||
| Touchstone | Emerging | |||||||||||||||
| Active | Touchstone | Markets | Touchstone | |||||||||||||
| Bond | Arbitrage | Small Cap | High Yield | |||||||||||||
| Fund | Fund | Fund | Fund | |||||||||||||
| Pricing of Class A Shares | ||||||||||||||||
| Net assets applicable to Class A shares | $ | 22,116,927 | $ | 8,185,992 | $ | 2,950,303 | $ | 16,925,100 | ||||||||
| Shares of beneficial interest outstanding | ||||||||||||||||
| (unlimited number of shares authorized, $0.01 par value) | 2,113,273 | 799,762 | 266,334 | 2,008,594 | ||||||||||||
| Net asset value price per share* | $ | 10.47 | $ | 10.24 | $ | 11.08 | $ | 8.43 | ||||||||
| Maximum sales charge - Class A shares | 4.75 | % | 5.75 | % | 5.75 | % | 4.75 | % | ||||||||
| Maximum offering price per share | ||||||||||||||||
| (100%/(100%-maximum sales charge) of net asset value adjusted to the nearest cent) - Class A shares | $ | 10.99 | $ | 10.86 | $ | 11.76 | $ | 8.85 | ||||||||
| Pricing of Class C Shares | ||||||||||||||||
| Net assets applicable to Class C shares | $ | 4,641,587 | $ | 8,761,891 | $ | 891,618 | $ | 13,025,485 | ||||||||
| Shares of beneficial interest outstanding | ||||||||||||||||
| (unlimited number of shares authorized, $0.01 par value) | 479,631 | 880,249 | 82,773 | 1,549,316 | ||||||||||||
| Net asset value and offering price per share** | $ | 9.68 | $ | 9.95 | $ | 10.77 | $ | 8.41 | ||||||||
| Pricing of Class Y Shares | ||||||||||||||||
| Net assets applicable to Class Y shares | $ | 79,647,973 | $ | 179,124,077 | $ | 8,931,463 | $ | 75,435,028 | ||||||||
| Shares of beneficial interest outstanding | ||||||||||||||||
| (unlimited number of shares authorized, $0.01 par value) | 7,614,111 | 17,301,966 | 801,800 | 8,704,644 | ||||||||||||
| Net asset value, offering price and redemption price per share | $ | 10.46 | $ | 10.35 | $ | 11.14 | $ | 8.67 | ||||||||
| Pricing of Class Z Shares | ||||||||||||||||
| Net assets applicable to Class Z shares | $ | — | $ | — | $ | — | $ | — | ||||||||
| Shares of beneficial interest outstanding | ||||||||||||||||
| (unlimited number of shares authorized, $0.01 par value) | — | — | — | — | ||||||||||||
| Net asset value, offering price and redemption price per share | $ | — | $ | — | $ | — | $ | — | ||||||||
| Pricing of Institutional Class Shares | ||||||||||||||||
| Net assets applicable to Institutional Class shares | $ | 20,799,584 | $ | 45,258,794 | $ | 830,713 | $ | 112,503,057 | ||||||||
| Shares of beneficial interest outstanding | ||||||||||||||||
| (unlimited number of shares authorized, $0.01 par value) | 1,988,996 | 4,353,713 | 75,137 | 12,990,193 | ||||||||||||
| Net asset value, offering price and redemption price per share | $ | 10.46 | $ | 10.40 | $ | 11.06 | $ | 8.66 | ||||||||
* There is no sales load on subscriptions of $1 million or more. Redemptions that were part of a $1 million or more subscription may be subject to a contingent deferred sales load if redeemed within a one-year period from the date of purchase.
** Redemption price per share varies by length of time shares are held due to the terms of the contingent deferred sales charge.
See accompanying Notes to Financial Statements.
| 114 |
Statements of Assets and Liabilities (Continued)
| Touchstone | Touchstone | Touchstone | Touchstone | Touchstone | Touchstone | |||||||||||||||||
| Merger | Mid | Mid Cap | Premium | Sands Capital | Small | |||||||||||||||||
| Arbitrage | Cap | Value | Yield Equity | Select | Cap | |||||||||||||||||
| Fund | Fund | Fund | Fund | Growth Fund | Fund | |||||||||||||||||
| $ | 14,144,199 | $ | 34,760,905 | $ | 21,001,036 | $ | 22,724,515 | $ | 89,859,956 | $ | 12,460,993 | |||||||||||
| 1,285,579 | 1,139,547 | 1,084,699 | 2,417,412 | 5,421,333 | 702,970 | |||||||||||||||||
| $ | 11.00 | $ | 30.50 | $ | 19.36 | $ | 9.40 | $ | 16.58 | $ | 17.73 | |||||||||||
| 5.75 | % | 5.75 | % | 5.75 | % | 5.75 | % | 5.75 | % | 5.75 | % | |||||||||||
| $ | 11.67 | $ | 32.36 | $ | 20.54 | $ | 9.97 | $ | 17.59 | $ | 18.81 | |||||||||||
| $ | 11,070,887 | $ | 57,224,326 | $ | 10,757,969 | $ | 22,324,424 | $ | 73,515,643 | $ | 9,265,908 | |||||||||||
| 1,054,012 | 1,972,176 | 567,909 | 2,377,727 | 4,738,492 | 547,042 | |||||||||||||||||
| $ | 10.50 | $ | 29.02 | $ | 18.94 | $ | 9.39 | $ | 15.51 | $ | 16.94 | |||||||||||
| $ | 91,223,689 | $ | 551,793,734 | $ | 322,978,791 | $ | 75,763,257 | $ | 1,775,755,371 | $ | 84,953,653 | |||||||||||
| 8,173,491 | 17,934,161 | 16,606,212 | 8,078,220 | 102,717,329 | 4,735,735 | |||||||||||||||||
| $ | 11.16 | $ | 30.77 | $ | 19.45 | $ | 9.38 | $ | 17.29 | $ | 17.94 | |||||||||||
| $ | — | $ | 19,312,456 | $ | — | $ | — | $ | 556,650,543 | $ | — | |||||||||||
| — | 636,877 | — | — | 33,567,024 | — | |||||||||||||||||
| $ | — | $ | 30.32 | $ | — | $ | — | $ | 16.58 | $ | — | |||||||||||
| $ | 98,240,265 | $ | 113,866,653 | $ | 334,082,985 | $ | — | $ | — | $ | 122,876,369 | |||||||||||
| 8,760,133 | 3,695,930 | 17,095,289 | — | — | 6,853,167 | |||||||||||||||||
| $ | 11.21 | $ | 30.81 | $ | 19.54 | $ | — | $ | — | $ | 17.93 | |||||||||||
| 115 |
Statements of Assets and Liabilities (Continued)
| Touchstone | Touchstone | |||||||||||
| Small | Touchstone | Ultra Short | ||||||||||
| Cap Value | Total Return | Duration Fixed | ||||||||||
| Fund | Bond Fund | Income Fund | ||||||||||
| Assets | ||||||||||||
| Investments, at cost | $ | 90,699,791 | $ | 262,898,882 | $ | 751,638,144 | ||||||
| Investments, at market value (A) | $ | 95,524,098 | $ | 263,762,836 | $ | 751,457,644 | ||||||
| Cash | — | 167,636 | 37 | |||||||||
| Dividends and interest receivable | 123,247 | 1,952,404 | 3,101,239 | |||||||||
| Receivable for capital shares sold | 10,062 | 1,104,131 | 2,650,941 | |||||||||
| Receivable for investments sold | 145,596 | — | 305,176 | |||||||||
| Receivable from securities lending income | 1,144 | 350 | — | |||||||||
| Receivable from affiliates | 15,254 | — | — | |||||||||
| Other assets | 12,461 | 20,738 | 39,856 | |||||||||
| Total Assets | 95,831,862 | 267,008,095 | 757,554,893 | |||||||||
| Liabilities | ||||||||||||
| Distributions payable | — | — | 178,965 | |||||||||
| Payable for return of collateral for securities on loan | 6,055,485 | 327,231 | — | |||||||||
| Payable for capital shares redeemed | 36,293 | 87,008 | 1,450,976 | |||||||||
| Payable for investments purchased | 886,529 | 167,531 | 5,256,030 | |||||||||
| Payable to Investment Advisor | 77,618 | 59,014 | 140,160 | |||||||||
| Payable to other affiliates | — | 25,435 | 182,358 | |||||||||
| Payable to Trustees | 3,920 | 3,920 | 3,920 | |||||||||
| Payable for professional services | 23,130 | 25,782 | 30,714 | |||||||||
| Payable to Transfer Agent | 97,506 | 29,902 | 75,293 | |||||||||
| Payable for reports to shareholders | 13,354 | 10,175 | 19,751 | |||||||||
| Other accrued expenses and liabilities | 3,300 | 12,911 | 28,055 | |||||||||
| Total Liabilities | 7,197,135 | 748,909 | 7,366,222 | |||||||||
| Net Assets | $ | 88,634,727 | $ | 266,259,186 | $ | 750,188,671 | ||||||
| Net assets consist of: | ||||||||||||
| Par value | $ | 34,006 | $ | 262,458 | $ | 807,101 | ||||||
| Paid-in capital | 86,332,077 | 268,835,470 | 773,894,127 | |||||||||
| Accumulated net investment income | 18,138 | 74,296 | 326,573 | |||||||||
| Accumulated net realized losses on investments | (2,573,801 | ) | (3,776,992 | ) | (24,658,630 | ) | ||||||
| Net unrealized appreciation (depreciation) on investments | 4,824,307 | 863,954 | (180,500 | ) | ||||||||
| Net Assets | $ | 88,634,727 | $ | 266,259,186 | $ | 750,188,671 | ||||||
| (A) Includes market value of securities on loan of: | $ | 5,951,490 | $ | 318,270 | $ | — | ||||||
See accompanying Notes to Financial Statements.
| 116 |
Statements of Assets and Liabilities (Continued)
| Touchstone | Touchstone | |||||||||||
| Small | Touchstone | Ultra Short | ||||||||||
| Cap Value | Total Return | Duration Fixed | ||||||||||
| Fund | Bond Fund | Income Fund | ||||||||||
| Pricing of Class A Shares | ||||||||||||
| Net assets applicable to Class A shares | $ | 76,884,261 | $ | 5,136,815 | $ | 14,079,979 | ||||||
| Shares of beneficial interest outstanding | ||||||||||||
| (unlimited number of shares authorized, $0.01 par value) | 2,950,139 | 506,859 | 1,514,814 | |||||||||
| Net asset value price per share* | $ | 26.06 | $ | 10.13 | $ | 9.29 | ||||||
| Maximum sales charge - Class A shares | 5.75 | % | 4.75 | % | 2.00 | % | ||||||
| Maximum offering price per share | ||||||||||||
| (100%/(100%-maximum sales charge) of net asset value adjusted to the nearest cent) - Class A shares | $ | 27.65 | $ | 10.64 | $ | 9.48 | ||||||
| Pricing of Class C Shares | ||||||||||||
| Net assets applicable to Class C shares | $ | 1,222,668 | $ | 1,876,198 | $ | 5,703,981 | ||||||
| Shares of beneficial interest outstanding | ||||||||||||
| (unlimited number of shares authorized, $0.01 par value) | 47,760 | 185,399 | 613,671 | |||||||||
| Net asset value and offering price per share** | $ | 25.60 | $ | 10.12 | $ | 9.29 | ||||||
| Pricing of Class Y Shares | ||||||||||||
| Net assets applicable to Class Y shares | $ | 2,829,119 | $ | 37,233,318 | $ | 260,830,004 | ||||||
| Shares of beneficial interest outstanding | ||||||||||||
| (unlimited number of shares authorized, $0.01 par value) | 108,210 | 3,669,489 | 28,061,757 | |||||||||
| Net asset value, offering price and redemption price per share | $ | 26.14 | $ | 10.15 | $ | 9.29 | ||||||
| Pricing of Class Z Shares | ||||||||||||
| Net assets applicable to Class Z shares | $ | — | $ | — | $ | 211,797,272 | ||||||
| Shares of beneficial interest outstanding | ||||||||||||
| (unlimited number of shares authorized, $0.01 par value) | — | — | 22,786,502 | |||||||||
| Net asset value, offering price and redemption price per share | $ | — | $ | — | $ | 9.29 | ||||||
| Pricing of Institutional Class Shares | ||||||||||||
| Net assets applicable to Institutional Class shares | $ | 7,698,679 | $ | 222,012,855 | $ | 257,777,435 | ||||||
| Shares of beneficial interest outstanding | ||||||||||||
| (unlimited number of shares authorized, $0.01 par value) | 294,492 | 21,884,028 | 27,733,342 | |||||||||
| Net asset value, offering price and redemption price per share | $ | 26.14 | $ | 10.14 | $ | 9.29 | ||||||
* There is no sales load on subscriptions of $1 million or more. Redemptions that were part of a $1 million or more subscription may be subject to a contingent deferred sales load if redeemed within a one-year period from the date of purchase.
** Redemption price per share varies by length of time shares are held due to the terms of the contingent deferred sales charge.
See accompanying Notes to Financial Statements.
| 117 |
For the Year Ended September 30, 2017
| Touchstone | ||||||||||||
| Touchstone | Touchstone | Emerging | ||||||||||
| Active Bond | Arbitrage | Markets Small | ||||||||||
| Fund | Fund | Cap Fund | ||||||||||
| Investment Income | ||||||||||||
| Dividends (A) | $ | 68,085 | $ | 2,197,559 | $ | 334,543 | ||||||
| Interest | 3,567,031 | 736,141 | — | |||||||||
| Income from securities loaned | 5,770 | 55,957 | 3,467 | |||||||||
| Total Investment Income | 3,640,886 | 2,989,657 | 338,010 | |||||||||
| Expenses | ||||||||||||
| Investment advisory fees | 450,402 | 2,086,717 | 115,252 | |||||||||
| Administration fees | 163,271 | 288,166 | 15,916 | |||||||||
| Compliance fees and expenses | 2,298 | 2,298 | 2,298 | |||||||||
| Custody fees | 40,665 | 55,477 | 66,039 | |||||||||
| Professional fees | 26,155 | 32,694 | 95,285 | |||||||||
| Transfer Agent fees, Class A | 31,442 | 12,143 | 7,745 | |||||||||
| Transfer Agent fees, Class C | 6,356 | 6,463 | 2,131 | |||||||||
| Transfer Agent fees, Class Y | 92,692 | 120,387 | 6,490 | |||||||||
| Transfer Agent fees, Class Z | — | — | — | |||||||||
| Transfer Agent fees, Institutional Class | 526 | 2,055 | 555 | |||||||||
| Pricing expense | 62,693 | 11,692 | 25,712 | |||||||||
| Registration Fees, Class A | 17,214 | 17,155 | 16,662 | |||||||||
| Registration Fees, Class C | 14,559 | 16,340 | 11,121 | |||||||||
| Registration Fees, Class Y | 17,525 | 26,925 | 16,679 | |||||||||
| Registration Fees, Class Z | — | — | — | |||||||||
| Registration Fees, Institutional Class | 14,047 | 13,875 | 12,533 | |||||||||
| Dividend expense on securities sold short | — | 1,565,748 | — | |||||||||
| Interest expense on securities sold short | — | 469,572 | — | |||||||||
| Reports to Shareholders, Class A | 6,488 | 6,055 | 5,218 | |||||||||
| Reports to Shareholders, Class C | 5,495 | 5,714 | 4,765 | |||||||||
| Reports to Shareholders, Class Y | 6,167 | 18,913 | 4,987 | |||||||||
| Reports to Shareholders, Class Z | — | — | — | |||||||||
| Reports to Shareholders, Institutional Class | 5,097 | 5,487 | 4,676 | |||||||||
| Shareholder servicing fees, Class Z | — | — | — | |||||||||
| Distribution expenses, Class A | 59,199 | 23,400 | 7,129 | |||||||||
| Distribution and shareholder servicing expenses, Class C | 54,826 | 90,008 | 8,525 | |||||||||
| Trustee fees | 15,607 | 15,607 | 15,607 | |||||||||
| Other expenses | 26,685 | 11,215 | 7,612 | |||||||||
| Total Expenses | 1,119,409 | 4,904,106 | 452,937 | |||||||||
| Fees waived and/or reimbursed by the Advisor and/or Affiliates(B) | (282,492 | ) | (48,650 | ) | (280,316 | ) | ||||||
| Net Expenses | 836,917 | 4,855,456 | 172,621 | |||||||||
| Net Investment Income (Loss) | 2,803,969 | (1,865,799 | ) | 165,389 | ||||||||
| Realized and Unrealized Gains (Losses) on Investments | ||||||||||||
| Net realized gains on investments(C) | 339,498 | 8,796,006 | 1,611,696 | |||||||||
| Net realized gains (losses) on forward foreign currency contracts | — | (39,150 | ) | — | ||||||||
| Net realized gains (losses) on foreign currency transactions | — | (71,150 | ) | 8,487 | ||||||||
| Net realized losses on futures contracts | (66,849 | ) | — | — | ||||||||
| Net realized gains on written options | — | 2,024,238 | — | |||||||||
| Net realized losses on securities sold short | — | (2,060,664 | ) | — | ||||||||
| Net change in unrealized appreciation (depreciation) on investments(D) | (1,681,396 | ) | (1,172,605 | ) | 480,718 | |||||||
| Net change in unrealized appreciation (depreciation) on forward foreign currency contracts | — | (50,308 | ) | — | ||||||||
| Net change in unrealized appreciation (depreciation) on foreign currency transactions | — | (4,247 | ) | (588 | ) | |||||||
| Net change in unrealized appreciation (depreciation) on written options | — | (892 | ) | — | ||||||||
| Net change in unrealized appreciation (depreciation) on securities sold short | — | (984,896 | ) | — | ||||||||
| Net Realized and Unrealized Gains (Losses) on Investments | (1,408,747 | ) | 6,436,332 | 2,100,313 | ||||||||
| Change in Net Assets Resulting from Operations | $ | 1,395,222 | $ | 4,570,533 | $ | 2,265,702 | ||||||
| (A) Net of foreign tax withholding of: | $ | — | $ | 36,539 | $ | 31,001 | ||||||
| (B)See Note 4 in Notes to Financial Statements. | ||||||||||||
| (C)Net of foreign capital gains tax withheld of: | $ | — | $ | — | $ | 43,637 | ||||||
| (D) Includes change in deferred foreign capital gains tax of: | $ | — | $ | — | $ | (43,056 | ) | |||||
| See accompanying Notes to Financial Statements. | ||||||||||||
| 118 |
Statements of Operations (Continued)
| Touchstone | Touchstone | Touchstone | Touchstone | Touchstone | ||||||||||||||||||||||
| Touchstone | Merger | Mid | Mid Cap | Premium | Sands Capital | Touchstone | ||||||||||||||||||||
| High Yield | Arbitrage | Cap | Value | Yield Equity | Select Growth | Small Cap | ||||||||||||||||||||
| Fund | Fund | Fund | Fund | Fund | Fund | Fund | ||||||||||||||||||||
| $ | 16,192 | $ | 1,867,987 | $ | 8,327,934 | $ | 8,556,841 | $ | 5,238,563 | $ | 3,965,963 | $ | 5,994,184 | |||||||||||||
| 13,247,310 | 1,154,996 | — | — | — | — | — | ||||||||||||||||||||
| 33,635 | — | 66,953 | 280,635 | 27,210 | 3,170,548 | 568,357 | ||||||||||||||||||||
| 13,297,137 | 3,022,983 | 8,394,887 | 8,837,476 | 5,265,773 | 7,136,511 | 6,562,541 | ||||||||||||||||||||
| 1,221,630 | 2,102,332 | 5,706,913 | 4,803,086 | 929,532 | 18,801,425 | 4,028,859 | ||||||||||||||||||||
| 339,773 | 290,322 | 1,055,003 | 880,263 | 196,203 | 3,733,391 | 687,276 | ||||||||||||||||||||
| 2,298 | 2,298 | 2,298 | 2,298 | 2,298 | 2,298 | 2,298 | ||||||||||||||||||||
| 20,293 | 58,096 | 23,859 | 23,424 | 11,747 | 44,176 | 26,885 | ||||||||||||||||||||
| 29,973 | 32,243 | 39,812 | 40,972 | 25,047 | 81,881 | 29,325 | ||||||||||||||||||||
| 27,414 | 12,514 | 41,250 | 27,622 | 30,804 | 93,863 | 34,054 | ||||||||||||||||||||
| 13,737 | 11,160 | 65,452 | 9,146 | 18,492 | 73,623 | 12,422 | ||||||||||||||||||||
| 110,680 | 91,949 | 575,423 | 370,092 | 68,581 | 1,618,874 | 220,788 | ||||||||||||||||||||
| — | — | 22,683 | — | — | 869,637 | — | ||||||||||||||||||||
| 7,288 | 13,665 | 13,826 | 99,963 | — | — | 40,527 | ||||||||||||||||||||
| 50,862 | 12,301 | 1,269 | 3,168 | 2,066 | 1,349 | 1,290 | ||||||||||||||||||||
| 17,173 | 17,064 | 18,891 | 19,530 | 17,819 | 18,608 | 17,458 | ||||||||||||||||||||
| 15,222 | 15,983 | 17,615 | 15,389 | 15,929 | 18,157 | 14,272 | ||||||||||||||||||||
| 25,535 | 20,175 | 31,329 | 36,867 | 20,896 | 52,018 | 29,304 | ||||||||||||||||||||
| — | — | 17,867 | — | — | 47,380 | — | ||||||||||||||||||||
| 13,505 | 15,569 | 13,195 | 23,831 | — | — | 16,682 | ||||||||||||||||||||
| — | 1,208,972 | — | — | — | — | — | ||||||||||||||||||||
| — | 558,681 | — | — | — | — | — | ||||||||||||||||||||
| 6,188 | 5,448 | 8,058 | 9,849 | 6,006 | 8,476 | 6,138 | ||||||||||||||||||||
| 6,002 | 5,509 | 11,054 | 7,901 | 5,997 | 9,711 | 5,724 | ||||||||||||||||||||
| 7,496 | 9,014 | 70,047 | 50,876 | 13,507 | 107,489 | 34,581 | ||||||||||||||||||||
| — | — | 7,429 | — | — | 33,177 | — | ||||||||||||||||||||
| 5,487 | 4,831 | 6,134 | 23,481 | — | — | 5,839 | ||||||||||||||||||||
| — | — | 48,519 | — | — | 1,511,048 | — | ||||||||||||||||||||
| 48,148 | 35,688 | 105,645 | 52,958 | 59,582 | 253,731 | 57,421 | ||||||||||||||||||||
| 145,811 | 126,376 | 583,912 | 87,415 | 237,663 | 835,098 | 122,725 | ||||||||||||||||||||
| 15,607 | 15,607 | 15,607 | 15,607 | 15,607 | 15,607 | 15,607 | ||||||||||||||||||||
| 25,411 | 13,095 | 41,499 | 33,811 | 13,969 | 124,375 | 27,573 | ||||||||||||||||||||
| 2,155,533 | 4,678,892 | 8,544,589 | 6,637,549 | 1,691,745 | 28,355,392 | 5,437,048 | ||||||||||||||||||||
| (180,995 | ) | (42,403 | ) | (669,491 | ) | (645,620 | ) | (110,170 | ) | (528,582 | ) | (89,097 | ) | |||||||||||||
| 1,974,538 | 4,636,489 | 7,875,098 | 5,991,929 | 1,581,575 | 27,826,810 | 5,347,951 | ||||||||||||||||||||
| 11,322,599 | (1,613,506 | ) | 519,789 | 2,845,547 | 3,684,198 | (20,690,299 | ) | 1,214,590 | ||||||||||||||||||
| 5,678,503 | 10,098,207 | 28,922,903 | 39,280,159 | 5,512,271 | 603,132,169 | 95,404,969 | ||||||||||||||||||||
| — | 125,995 | — | — | — | — | — | ||||||||||||||||||||
| — | (89,279 | ) | — | — | — | — | — | |||||||||||||||||||
| — | — | — | — | — | — | — | ||||||||||||||||||||
| — | 2,110,729 | — | — | — | — | — | ||||||||||||||||||||
| — | (1,961,783 | ) | — | — | — | — | — | |||||||||||||||||||
| 863,209 | (960,969 | ) | 92,701,133 | 39,673,618 | 3,897,864 | (168,487,741 | ) | (58,514,550 | ) | |||||||||||||||||
| — | (58,148 | ) | — | — | — | — | — | |||||||||||||||||||
| — | (1,976 | ) | — | — | — | — | — | |||||||||||||||||||
| — | (22,071 | ) | — | — | — | — | — | |||||||||||||||||||
| — | (1,269,137 | ) | — | — | — | — | — | |||||||||||||||||||
| 6,541,712 | 7,971,568 | 121,624,036 | 78,953,777 | 9,410,135 | 434,644,428 | 36,890,419 | ||||||||||||||||||||
| $ | 17,864,311 | $ | 6,358,062 | $ | 122,143,825 | $ | 81,799,324 | $ | 13,094,333 | $ | 413,954,129 | $ | 38,105,009 | |||||||||||||
| $ | — | $ | 27,063 | $ | — | $ | — | $ | 101,760 | $ | 34,673 | $ | — | |||||||||||||
| $ | — | $ | — | $ | — | $ | — | $ | — | $ | — | $ | — | |||||||||||||
| $ | — | $ | — | $ | — | $ | — | $ | — | $ | — | $ | — | |||||||||||||
| 119 |
Statements of Operations (Continued)
| Touchstone | ||||||||||||
| Touchstone | Touchstone | Ultra Short | ||||||||||
| Small Cap | Total Return | Duration | ||||||||||
| Value | Bond | Fixed Income | ||||||||||
| Fund | Fund | Fund | ||||||||||
| Investment Income | ||||||||||||
| Dividends | $ | 2,035,647 | $ | 62,826 | $ | 3,004 | ||||||
| Interest | — | 6,561,692 | 13,469,703 | |||||||||
| Income from securities loaned | 50,321 | 5,874 | — | |||||||||
| Total Investment Income | 2,085,968 | 6,630,392 | 13,472,707 | |||||||||
| Expenses | ||||||||||||
| Investment advisory fees | 1,295,102 | 818,677 | 1,613,669 | |||||||||
| Administration fees | 208,655 | 339,166 | 935,920 | |||||||||
| Compliance fees and expenses | 2,298 | 2,298 | 2,298 | |||||||||
| Custody fees | 14,736 | 14,527 | 37,507 | |||||||||
| Professional fees | 29,988 | 29,256 | 40,673 | |||||||||
| Transfer Agent fees, Class A | 379,455 | 9,543 | 9,217 | |||||||||
| Transfer Agent fees, Class C | 2,107 | 2,094 | 4,950 | |||||||||
| Transfer Agent fees, Class Y | 5,117 | 44,704 | 142,731 | |||||||||
| Transfer Agent fees, Class Z | — | — | 176,307 | |||||||||
| Transfer Agent fees, Institutional Class | 1,472 | 86,893 | 18,231 | |||||||||
| Transfer Agent out-of-pocket expenses | 227,990 | 1,562 | 13,483 | |||||||||
| Pricing expense | 4,063 | 29,399 | 63,543 | |||||||||
| Registration Fees, Class A | 32,566 | 16,330 | 18,353 | |||||||||
| Registration Fees, Class C | 11,426 | 10,121 | 16,850 | |||||||||
| Registration Fees, Class Y | 12,264 | 20,979 | 22,504 | |||||||||
| Registration Fees, Class Z | — | — | 34,284 | |||||||||
| Registration Fees, Institutional Class | 8,935 | 19,146 | 20,343 | |||||||||
| Reports to Shareholders, Class A | 26,225 | 4,799 | 5,399 | |||||||||
| Reports to Shareholders, Class C | 5,343 | 4,779 | 5,009 | |||||||||
| Reports to Shareholders, Class Y | 5,409 | 5,514 | 9,970 | |||||||||
| Reports to Shareholders, Class Z | — | — | 15,322 | |||||||||
| Reports to Shareholders, Institutional Class | 2,719 | 5,569 | 5,059 | |||||||||
| Shareholder servicing fees, Class Z | — | — | 544,771 | |||||||||
| Distribution expenses, Class A | 335,826 | 17,682 | 36,603 | |||||||||
| Distribution and shareholder servicing expenses, Class C | 13,173 | 22,420 | 52,330 | |||||||||
| Trustee fees | 15,607 | 15,607 | 15,607 | |||||||||
| Other expenses | 8,692 | 12,617 | 26,460 | |||||||||
| Total Expenses | 2,649,168 | 1,533,682 | 3,887,393 | |||||||||
| Fees waived and/or reimbursed by the Advisor and/or Affiliates(A) | (681,628 | ) | (275,614 | ) | (507,207 | ) | ||||||
| Net Expenses | 1,967,540 | 1,258,068 | 3,380,186 | |||||||||
| Net Investment Income | 118,428 | 5,372,324 | 10,092,521 | |||||||||
| Realized and Unrealized Gains (Losses) on Investments | ||||||||||||
| Net realized gains (losses) on investments(B) | 20,198,408 | (148,821 | ) | (1,954,477 | ) | |||||||
| Net change in unrealized appreciation (depreciation) on investments | 2,881,276 | (4,095,482 | ) | 1,285,240 | ||||||||
| Net Realized and Unrealized Gains (Losses) on Investments | 23,079,684 | (4,244,303 | ) | (669,237 | ) | |||||||
| Change in Net Assets Resulting from Operations | $ | 23,198,112 | $ | 1,128,021 | $ | 9,423,284 | ||||||
(A) See Note 4 in Notes to Financial Statements.
(B)On April 7, 2017, the Small Cap Value Fund had a redemption-in-kind of securities in the amount of $102,794,327. Net realized gains (losses) on investments includes the realized gain on the transaction of $11,357,683 which will not be realized by the Fund for tax purposes.
See accompanying Notes to Financial Statements.
| 120 |
This page intentionally left blank.
| 121 |
Statements of Changes in Net Assets
| Touchstone | Touchstone | |||||||||||||||
| Active Bond | Arbitrage | |||||||||||||||
| Fund | Fund | |||||||||||||||
| For the | For the | For the | For the | |||||||||||||
| Year Ended | Year Ended | Year Ended | Year Ended | |||||||||||||
| September 30, | September 30, | September 30, | September 30, | |||||||||||||
| 2017 | 2016 | 2017 | 2016 | |||||||||||||
| From Operations | ||||||||||||||||
| Net investment income (loss) | $ | 2,803,969 | $ | 2,758,133 | $ | (1,865,799 | ) | $ | (1,074,188 | ) | ||||||
| Net realized gains (losses) on investments, forward foreign currency contracts, foreign currency transactions, written options, futures contracts, swap agreements and securities sold short | 272,649 | 164,645 | 8,649,280 | 7,116,499 | ||||||||||||
| Net change in unrealized appreciation (depreciation) on investments, forward foreign currency contracts, foreign currency transactions, written options, futures contracts, swap agreements and securities sold short | (1,681,396 | ) | 4,504,581 | (2,212,948 | ) | 914,912 | ||||||||||
| Change in Net Assets from Operations | 1,395,222 | 7,427,359 | 4,570,533 | 6,957,223 | ||||||||||||
| Distributions to Shareholders from: | ||||||||||||||||
| Net investment income, Class A | (567,055 | ) | (793,010 | ) | — | (17,509 | ) | |||||||||
| Net investment income, Class C | (101,877 | ) | (163,270 | ) | — | (6,332 | ) | |||||||||
| Net investment income, Class Y | (1,896,650 | ) | (2,017,062 | ) | — | (287,174 | ) | |||||||||
| Net investment income, Institutional Class | (319,492 | ) | (182,651 | ) | — | (31,972 | ) | |||||||||
| Net realized gains, Class A | — | — | (267,450 | ) | (154,157 | ) | ||||||||||
| Net realized gains, Class C | — | — | (260,994 | ) | (131,554 | ) | ||||||||||
| Net realized gains, Class Y | — | — | (3,766,286 | ) | (1,293,949 | ) | ||||||||||
| Net realized gains, Institutional Class | — | — | (393,447 | ) | (133,669 | ) | ||||||||||
| Total Distributions | (2,885,074 | ) | (3,155,993 | ) | (4,688,177 | ) | (2,056,316 | ) | ||||||||
| Net Increase (Decrease) from Share Transactions(A) | 13,473,288 | 10,687,819 | 87,940,770 | 23,078,874 | ||||||||||||
| Total Increase (Decrease) in Net Assets | 11,983,436 | 14,959,185 | 87,823,126 | 27,979,781 | ||||||||||||
| Net Assets | ||||||||||||||||
| Beginning of period | 115,222,635 | 100,263,450 | 153,508,580 | 125,528,799 | ||||||||||||
| End of period | $ | 127,206,071 | $ | 115,222,635 | $ | 241,331,706 | $ | 153,508,580 | ||||||||
| Accumulated Net Investment Income (Loss) | $ | 100,863 | $ | 100,282 | $ | (249,346 | ) | $ | (131,773 | ) | ||||||
(A) For details on share transactions by class, see Statements of Changes in Net Assets - Capital Stock Activity in pages 128-130.
See accompanying Notes to Financial Statements.
| 122 |
Statements of Changes in Net Assets (Continued)
| Touchstone | Touchstone | Touchstone | ||||||||||||||||||||
| Emerging Markets | High Yield | Merger Arbitrage | ||||||||||||||||||||
| Small Cap Fund | Fund | Fund | ||||||||||||||||||||
| For the | For the | For the | For the | For the | For the | |||||||||||||||||
| Year Ended | Year Ended | Year Ended | Year Ended | Year Ended | Year Ended | |||||||||||||||||
| September 30, | September 30, | September 30, | September 30, | September 30, | September 30, | |||||||||||||||||
| 2017 | 2016 | 2017 | 2016 | 2017 | 2016 | |||||||||||||||||
| $ | 165,389 | $ | (48,934 | ) | $ | 11,322,599 | $ | 11,086,721 | $ | (1,613,506 | ) | $ | (1,026,448 | ) | ||||||||
| 1,620,183 | (50,423,326 | ) | 5,678,503 | (20,953,503 | ) | 10,283,869 | 7,911,334 | |||||||||||||||
| 480,130 | 60,525,400 | 863,209 | 25,923,699 | (2,312,301 | ) | 2,303,320 | ||||||||||||||||
| 2,265,702 | 10,053,140 | 17,864,311 | 16,056,917 | 6,358,062 | 9,188,206 | |||||||||||||||||
| — | (188,269 | ) | (875,914 | ) | (1,196,537 | ) | — | — | ||||||||||||||
| — | (82,074 | ) | (552,993 | ) | (827,572 | ) | — | — | ||||||||||||||
| — | (620,411 | ) | (4,073,517 | ) | (4,925,536 | ) | — | — | ||||||||||||||
| — | (1,728,009 | ) | (5,613,771 | ) | (3,934,366 | ) | — | — | ||||||||||||||
| — | — | — | — | (431,396 | ) | — | ||||||||||||||||
| — | — | — | — | (416,865 | ) | — | ||||||||||||||||
| — | — | — | — | (2,373,169 | ) | — | ||||||||||||||||
| — | — | — | — | (2,024,092 | ) | — | ||||||||||||||||
| — | (2,618,763 | ) | (11,116,195 | ) | (10,884,011 | ) | (5,245,522 | ) | — | |||||||||||||
| 2,586,750 | (258,177,711 | ) | (5,232,555 | ) | (18,893,488 | ) | 20,805,545 | (28,687,623 | ) | |||||||||||||
| 4,852,452 | (250,743,334 | ) | 1,515,561 | (13,720,582 | ) | 21,918,085 | (19,499,417 | ) | ||||||||||||||
| 8,751,645 | 259,494,979 | 216,373,109 | 230,093,691 | 192,761,838 | 212,261,255 | |||||||||||||||||
| $ | 13,604,097 | $ | 8,751,645 | $ | 217,888,670 | $ | 216,373,109 | $ | 214,679,923 | $ | 192,761,838 | |||||||||||
| $ | 38,936 | $ | (120,063 | ) | $ | 484,289 | $ | 272,401 | $ | (297,174 | ) | $ | (123,559 | ) | ||||||||
| 123 |
Statements of Changes in Net Assets (Continued)
| Touchstone | Touchstone | |||||||||||||||
| Mid Cap | Mid Cap | |||||||||||||||
| Fund | Value Fund | |||||||||||||||
| For the | For the | For the | For the | |||||||||||||
| Year Ended | Year Ended | Year Ended | Year Ended | |||||||||||||
| September 30, | September 30, | September 30, | September 30, | |||||||||||||
| 2017 | 2016 | 2017 | 2016 | |||||||||||||
| From Operations | ||||||||||||||||
| Net investment income (loss) | $ | 519,789 | $ | 4,056,097 | $ | 2,845,547 | $ | 3,211,512 | ||||||||
| Net realized gains (losses) on investments | 28,922,903 | 17,791,453 | 39,280,159 | 14,992,172 | ||||||||||||
| Net change in unrealized appreciation (depreciation) on investments | 92,701,133 | 55,983,037 | 39,673,618 | 48,991,829 | ||||||||||||
| Change in Net Assets from Operations | 122,143,825 | 77,830,587 | 81,799,324 | 67,195,513 | ||||||||||||
| Distributions to Shareholders from: | ||||||||||||||||
| Net investment income, Class A | (156,233 | ) | — | (31,801 | ) | (69,498 | ) | |||||||||
| Net investment income, Class C | — | — | — | — | ||||||||||||
| Net investment income, Class Y | (2,919,041 | ) | (302,705 | ) | (1,318,968 | ) | (1,918,693 | ) | ||||||||
| Net investment income, Class Z | (49,552 | ) | (1,361 | ) | — | — | ||||||||||
| Net investment income, Institutional Class | (569,047 | ) | (61,198 | ) | (1,494,495 | ) | (1,444,479 | ) | ||||||||
| Net realized gains, Class A | — | — | (721,984 | ) | (466,658 | ) | ||||||||||
| Net realized gains, Class C | — | — | (214,768 | ) | (117,202 | ) | ||||||||||
| Net realized gains, Class Y | — | — | (10,153,339 | ) | (12,371,938 | ) | ||||||||||
| Net realized gains, Class Z | — | — | — | — | ||||||||||||
| Net realized gains, Institutional Class | — | — | (7,439,636 | ) | (6,757,290 | ) | ||||||||||
| Total Distributions | (3,693,873 | ) | (365,264 | ) | (21,374,991 | ) | (23,145,758 | ) | ||||||||
| Net Increase (Decrease) from Share Transactions(A) | (27,506,901 | ) | (91,734,050 | ) | 123,474,421 | 118,340,157 | ||||||||||
| Total Increase (Decrease) in Net Assets | 90,943,051 | (14,268,727 | ) | 183,898,754 | 162,389,912 | |||||||||||
| Net Assets | ||||||||||||||||
| Beginning of period | 686,015,023 | 700,283,750 | 504,922,027 | 342,532,115 | ||||||||||||
| End of period | $ | 776,958,074 | $ | 686,015,023 | $ | 688,820,781 | $ | 504,922,027 | ||||||||
| Accumulated Net Investment Income (Loss) | $ | 477,776 | $ | 3,651,860 | $ | 186,621 | $ | 52,237 | ||||||||
(A) For details on share transactions by class, see Statements of Changes in Net Assets - Capital Stock Activity on pages 130-132.
See accompanying Notes to Financial Statements.
| 124 |
Statements of Changes in Net Assets (Continued)
| Touchstone | ||||||||||||||||||||||
| Touchstone | Sands Capital | Touchstone | ||||||||||||||||||||
| Premium Yield | Select Growth | Small Cap | ||||||||||||||||||||
| Equity Fund | Fund | Fund | ||||||||||||||||||||
| For the | For the | For the | For the | For the | For the | |||||||||||||||||
| Year Ended | Year Ended | Year Ended | Year Ended | Year Ended | Year Ended | |||||||||||||||||
| September 30, | September 30, | September 30, | September 30, | September 30, | September 30, | |||||||||||||||||
| 2017 | 2016 | 2017 | 2016 | 2017 | 2016 | |||||||||||||||||
| $ | 3,684,198 | $ | 3,869,652 | $ | (20,690,299 | ) | $ | (26,846,894 | ) | $ | 1,214,590 | $ | 1,560,500 | |||||||||
| 5,512,271 | (1,237,607 | ) | 603,132,169 | 461,133,830 | 95,404,969 | (60,975,970 | ) | |||||||||||||||
| 3,897,864 | 20,365,252 | (168,487,741 | ) | (201,305,875 | ) | (58,514,550 | ) | 89,708,679 | ||||||||||||||
| 13,094,333 | 22,997,297 | 413,954,129 | 232,981,061 | 38,105,009 | 30,293,209 | |||||||||||||||||
| (642,807 | ) | (732,361 | ) | — | — | — | (459,982 | ) | ||||||||||||||
| (462,088 | ) | (504,463 | ) | — | — | — | (26,741 | ) | ||||||||||||||
| (2,593,310 | ) | (2,622,164 | ) | — | — | (856,969 | ) | (3,110,979 | ) | |||||||||||||
| — | — | — | — | — | — | |||||||||||||||||
| — | — | — | — | (996,101 | ) | (2,961,769 | ) | |||||||||||||||
| — | (2,086,246 | ) | (15,772,640 | ) | (19,790,200 | ) | — | (6,403,253 | ) | |||||||||||||
| — | (2,029,563 | ) | (13,604,302 | ) | (15,311,943 | ) | — | (2,276,849 | ) | |||||||||||||
| — | (6,140,759 | ) | (243,534,116 | ) | (278,000,457 | ) | — | (33,435,598 | ) | |||||||||||||
| — | — | (93,415,838 | ) | (112,244,362 | ) | — | — | |||||||||||||||
| — | — | — | — | — | (29,370,263 | ) | ||||||||||||||||
| (3,698,205 | ) | (14,115,556 | ) | (366,326,896 | ) | (425,346,962 | ) | (1,853,070 | ) | (78,045,434 | ) | |||||||||||
| (41,225,090 | ) | (24,439,466 | ) | (789,883,325 | ) | (1,455,227,653 | ) | (410,214,463 | ) | (68,552,191 | ) | |||||||||||
| (31,828,962 | ) | (15,557,725 | ) | (742,256,092 | ) | (1,647,593,554 | ) | (373,962,524 | ) | (116,304,416 | ) | |||||||||||
| 152,641,158 | 168,198,883 | 3,238,037,605 | 4,885,631,159 | 603,519,447 | 719,823,863 | |||||||||||||||||
| $ | 120,812,196 | $ | 152,641,158 | $ | 2,495,781,513 | $ | 3,238,037,605 | $ | 229,556,923 | $ | 603,519,447 | |||||||||||
| $ | 282,429 | $ | 208,614 | $ | (12,169,854 | ) | $ | (17,640,732 | ) | $ | 929,602 | $ | 1,744,841 | |||||||||
| 125 |
Statements of Changes in Net Assets (Continued)
| Touchstone Small Cap Value Fund | Touchstone Total Return Bond Fund | |||||||||||||||
| For the Year Ended September 30, 2017 | For the Year Ended September 30, 2016 | For the Year Ended September 30, 2017 | For the Year Ended September 30, 2016 | |||||||||||||
| From Operations | ||||||||||||||||
| Net investment income | $ | 118,428 | $ | 893,898 | $ | 5,372,324 | $ | 5,254,047 | ||||||||
| Net realized gains (losses) on investments | 20,198,408 | (6,960,047 | ) | (148,821 | ) | (45,495 | ) | |||||||||
| Net change in unrealized appreciation (depreciation) on investments | 2,881,276 | 14,496,319 | (4,095,482 | ) | 4,436,944 | |||||||||||
| Change in Net Assets from Operations | 23,198,112 | 8,430,170 | 1,128,021 | 9,645,496 | ||||||||||||
| Distributions to Shareholders from: | ||||||||||||||||
| Net investment income, Class A | (125,781 | ) | (438,953 | ) | (181,518 | ) | (155,483 | ) | ||||||||
| Net investment income, Class C | — | (8,814 | ) | (40,739 | ) | (47,330 | ) | |||||||||
| Net investment income, Class Y | (6,170 | ) | (59,822 | ) | (1,072,822 | ) | (1,269,095 | ) | ||||||||
| Net investment income, Class Z | — | — | — | — | ||||||||||||
| Net investment income, Institutional Class | (5,476 | ) | (378,488 | ) | (5,520,397 | ) | (4,538,220 | ) | ||||||||
| Net realized gains, Class A | — | (865,953 | ) | — | — | |||||||||||
| Net realized gains, Class C | — | (49,306 | ) | — | — | |||||||||||
| Net realized gains, Class Y | — | (150,398 | ) | — | — | |||||||||||
| Net realized gains, Institutional Class | — | (792,852 | ) | — | — | |||||||||||
| Total Distributions | (137,427 | ) | (2,744,586 | ) | (6,815,476 | ) | (6,010,128 | ) | ||||||||
| Net Increase (Decrease) from Share Transactions(A) | (112,703,097 | ) | 116,149,710 | 45,002,768 | 40,563,136 | |||||||||||
| Total Increase (Decrease) in Net Assets | (89,642,412 | ) | 121,835,294 | 39,315,313 | 44,198,504 | |||||||||||
| Net Assets | ||||||||||||||||
| Beginning of period | 178,277,139 | 56,441,845 | 226,943,873 | 182,745,369 | ||||||||||||
| End of period | $ | 88,634,727 | $ | 178,277,139 | $ | 266,259,186 | $ | 226,943,873 | ||||||||
| Accumulated Net Investment Income | $ | 18,138 | $ | 39,218 | $ | 74,296 | $ | 138,900 | ||||||||
(A) For details on share transactions by class, see Statements of Changes in Net Assets - Capital Stock Activity on page 133-134.
See accompanying Notes to Financial Statements.
| 126 |
Statements of Changes in Net Assets (Continued)
| Touchstone Ultra Short Duration Fixed Income Fund | ||||||
| For the Year Ended September 30, 2017 | For the Year Ended September 30, 2016 | |||||
| $ | 10,092,521 | $ | 7,108,909 | |||
| (1,954,477 | ) | 10,953 | ||||
| 1,285,240 | 1,127,268 | |||||
| 9,423,284 | 8,247,130 | |||||
| (214,947 | ) | (138,872 | ) | |||
| (66,973 | ) | (73,201 | ) | |||
| (3,880,242 | ) | (3,408,667 | ) | |||
| (3,248,560 | ) | (3,136,351 | ) | |||
| (3,471,689 | ) | (1,706,659 | ) | |||
| — | — | |||||
| — | — | |||||
| — | — | |||||
| — | — | |||||
| (10,882,411 | ) | (8,463,750 | ) | |||
| 132,263,146 | 46,236,958 | |||||
| 130,804,019 | 46,020,338 | |||||
| 619,384,652 | 573,364,314 | |||||
| $ | 750,188,671 | $ | 619,384,652 | |||
| $ | 326,573 | $ | 314,261 | |||
| 127 |
Statements of Changes in Net Assets - Capital Stock Activity
| Touchstone Active Bond Fund | Touchstone Arbitrage Fund | |||||||||||||||||||||||||||||||
| For the Year Ended September 30, 2017 | For the Year Ended September 30, 2016 | For the Year Ended September 30, 2017 | For the Year Ended September 30, 2016 | |||||||||||||||||||||||||||||
| Shares | Dollars | Shares | Dollars | Shares | Dollars | Shares | Dollars | |||||||||||||||||||||||||
| Class A | ||||||||||||||||||||||||||||||||
| Proceeds from Shares issued | 114,125 | $ | 1,187,727 | 422,516 | $ | 4,377,566 | 422,923 | $ | 4,310,951 | 636,422 | $ | 6,496,133 | ||||||||||||||||||||
| Reinvestment of distributions | 47,971 | 498,530 | 64,512 | 663,170 | 26,086 | 264,509 | 17,213 | 171,655 | ||||||||||||||||||||||||
| Cost of Shares redeemed | (439,482 | ) | (4,579,262 | ) | (952,555 | ) | (9,803,201 | ) | (619,127 | ) | (6,319,297 | ) | (1,765,938 | ) | (17,730,722 | ) | ||||||||||||||||
| Change from Class A Share Transactions | (277,386 | ) | (2,893,005 | ) | (465,527 | ) | (4,762,465 | ) | (170,118 | ) | (1,743,837 | ) | (1,112,303 | ) | (11,062,934 | ) | ||||||||||||||||
| Class C | ||||||||||||||||||||||||||||||||
| Proceeds from Shares issued | 9,487 | 91,456 | 52,531 | 498,074 | 334,745 | 3,344,957 | 227,699 | 2,258,773 | ||||||||||||||||||||||||
| Reinvestment of distributions | 7,547 | 72,561 | 11,675 | 111,191 | 25,833 | 256,269 | 13,631 | 133,742 | ||||||||||||||||||||||||
| Cost of Shares redeemed | (200,983 | ) | (1,934,055 | ) | (133,602 | ) | (1,280,684 | ) | (264,616 | ) | (2,633,313 | ) | (344,365 | ) | (3,436,570 | ) | ||||||||||||||||
| Change from Class C Share Transactions | (183,949 | ) | (1,770,038 | ) | (69,396 | ) | (671,419 | ) | 95,962 | 967,913 | (103,035 | ) | (1,044,055 | ) | ||||||||||||||||||
| Class Y | ||||||||||||||||||||||||||||||||
| Proceeds from Shares issued | 3,351,078 | 34,955,912 | 3,546,908 | 36,345,102 | 9,308,258 | 95,788,312 | 5,014,120 | 51,434,095 | ||||||||||||||||||||||||
| Reinvestment of distributions | 107,675 | 1,119,483 | 116,399 | 1,198,270 | 367,566 | 3,760,202 | 155,458 | 1,559,811 | ||||||||||||||||||||||||
| Cost of Shares redeemed | (3,074,005 | ) | (31,929,928 | ) | (2,062,857 | ) | (21,159,535 | ) | (4,089,565 | ) | (42,024,784 | ) | (2,203,090 | ) | (22,478,967 | ) | ||||||||||||||||
| Change from Class Y Share Transactions | 384,748 | 4,145,467 | 1,600,450 | 16,383,837 | 5,586,259 | 57,523,730 | 2,966,488 | 30,514,939 | ||||||||||||||||||||||||
| Institutional Class | ||||||||||||||||||||||||||||||||
| Proceeds from Shares issued | 1,735,083 | 18,084,313 | 469,433 | 4,740,317 | 3,879,650 | 39,938,927 | 1,249,780 | 12,808,253 | ||||||||||||||||||||||||
| Reinvestment of distributions | 5,878 | 61,316 | 1,481 | 15,119 | 35,266 | 361,834 | 16,462 | 165,641 | ||||||||||||||||||||||||
| Cost of Shares redeemed | (398,424 | ) | (4,154,765 | ) | (490,474 | ) | (5,017,570 | ) | (882,899 | ) | (9,107,797 | ) | (816,893 | ) | (8,302,970 | ) | ||||||||||||||||
| Change from Institutional Class Share Transactions | 1,342,537 | 13,990,864 | (19,560 | ) | (262,134 | ) | 3,032,017 | 31,192,964 | 449,349 | 4,670,924 | ||||||||||||||||||||||
| Change from Share Transactions | 1,265,950 | $ | 13,473,288 | 1,045,967 | $ | 10,687,819 | 8,544,120 | $ | 87,940,770 | 2,200,499 | $ | 23,078,874 | ||||||||||||||||||||
See accompanying Notes to Financial Statements.
| 128 |
Statements of Changes in Net Assets - Capital Stock Activity (Continued)
| Touchstone Emerging Markets Small Cap Fund | Touchstone High Yield Fund | |||||||||||||||||||||||||||||
| For the Year Ended September 30, 2017 | For the Year Ended September 30, 2016 | For the Year Ended September 30, 2017 | For the Year Ended September 30, 2016 | |||||||||||||||||||||||||||
| Shares | Dollars | Shares | Dollars | Shares | Dollars | Shares | Dollars | |||||||||||||||||||||||
| 215,767 | $ | 2,024,110 | 61,377 | $ | 526,287 | 1,151,664 | $ | 9,567,953 | 1,840,076 | $ | 14,313,901 | |||||||||||||||||||
| — | — | 21,437 | 180,076 | 85,856 | 710,212 | 126,429 | 995,257 | |||||||||||||||||||||||
| (205,112 | ) | (2,064,155 | ) | (157,406 | ) | (1,384,545 | ) | (1,786,930 | ) | (14,793,029 | ) | (2,779,467 | ) | (21,828,720 | ) | |||||||||||||||
| 10,655 | (40,045 | ) | (74,592 | ) | (678,182 | ) | (549,410 | ) | (4,514,864 | ) | (812,962 | ) | (6,519,562 | ) | ||||||||||||||||
| 12,887 | 124,473 | 11,480 | 105,215 | 145,109 | 1,182,888 | 276,329 | 2,167,022 | |||||||||||||||||||||||
| — | — | 9,925 | 82,074 | 55,043 | 454,327 | 86,491 | 677,823 | |||||||||||||||||||||||
| (30,291 | ) | (285,757 | ) | (96,415 | ) | (840,648 | ) | (649,501 | ) | (5,352,223 | ) | (1,484,518 | ) | (11,552,083 | ) | |||||||||||||||
| (17,404 | ) | (161,284 | ) | (75,010 | ) | (653,359 | ) | (449,349 | ) | (3,715,008 | ) | (1,121,698 | ) | (8,707,238 | ) | |||||||||||||||
| 512,686 | 4,967,925 | 642,770 | 5,876,947 | 3,105,249 | 26,380,378 | 3,605,884 | 29,012,898 | |||||||||||||||||||||||
| — | — | 73,578 | 618,052 | 293,819 | 2,502,707 | 296,981 | 2,401,348 | |||||||||||||||||||||||
| (225,475 | ) | (2,208,327 | ) | (7,901,441 | ) | (72,245,185 | ) | (4,853,969 | ) | (41,432,077 | ) | (8,383,588 | ) | (67,033,983 | ) | |||||||||||||||
| 287,211 | 2,759,598 | (7,185,093 | ) | (65,750,186 | ) | (1,454,901 | ) | (12,548,992 | ) | (4,480,723 | ) | (35,619,737 | ) | |||||||||||||||||
| 6,693 | 64,871 | 453,173 | 3,882,643 | 6,630,700 | 55,508,953 | 5,429,812 | 44,956,988 | |||||||||||||||||||||||
| — | — | 197,701 | 1,644,874 | 628,998 | 5,351,427 | 437,280 | 3,530,745 | |||||||||||||||||||||||
| (3,766 | ) | (36,390 | ) | (20,875,902 | ) | (196,623,501 | ) | (5,329,230 | ) | (45,314,071 | ) | (2,044,785 | ) | (16,534,684 | ) | |||||||||||||||
| 2,927 | 28,481 | (20,225,028 | ) | (191,095,984 | ) | 1,930,468 | 15,546,309 | 3,822,307 | 31,953,049 | |||||||||||||||||||||
| 283,389 | $ | 2,586,750 | (27,559,723 | ) | $ | (258,177,711 | ) | (523,192 | ) | $ | (5,232,555 | ) | (2,593,076 | ) | $ | (18,893,488 | ) | |||||||||||||
| 129 |
Statements of Changes in Net Assets - Capital Stock Activity (Continued)
| Touchstone Merger Arbitrage Fund | Touchstone Mid Cap Fund | |||||||||||||||||||||||||||||||
| For the Year Ended September 30, 2017 | For the Year Ended September 30, 2016 | For the Year Ended September 30, 2017 | For the Year Ended September 30, 2016 | |||||||||||||||||||||||||||||
| Shares | Dollars | Shares | Dollars | Shares | Dollars | Shares | Dollars | |||||||||||||||||||||||||
| Class A | ||||||||||||||||||||||||||||||||
| Proceeds from Shares issued | 663,943 | $ | 7,189,677 | 395,192 | $ | 4,243,218 | 310,383 | $ | 8,581,092 | 690,963 | $ | 16,958,049 | ||||||||||||||||||||
| Reinvestment of distributions | 35,099 | 378,369 | — | — | 5,217 | 141,962 | — | — | ||||||||||||||||||||||||
| Cost of Shares redeemed | (841,352 | ) | (9,106,640 | ) | (1,041,709 | ) | (11,242,430 | ) | (1,223,230 | ) | (33,868,799 | ) | (1,344,791 | ) | (32,261,785 | ) | ||||||||||||||||
| Change from Class A Share Transactions | (142,310 | ) | (1,538,594 | ) | (646,517 | ) | (6,999,212 | ) | (907,630 | ) | (25,145,745 | ) | (653,828 | ) | (15,303,736 | ) | ||||||||||||||||
| Class C | ||||||||||||||||||||||||||||||||
| Proceeds from Shares issued | 28,884 | 302,799 | 25,575 | 269,111 | 295,609 | 7,797,366 | 493,383 | 11,515,804 | ||||||||||||||||||||||||
| Reinvestment of distributions | 40,213 | 416,206 | — | — | — | — | — | — | ||||||||||||||||||||||||
| Cost of Shares redeemed | (364,713 | ) | (3,810,386 | ) | (521,358 | ) | (5,450,169 | ) | (724,111 | ) | (19,243,359 | ) | (813,813 | ) | (18,986,298 | ) | ||||||||||||||||
| Change from Class C Share Transactions | (295,616 | ) | (3,091,381 | ) | (495,783 | ) | (5,181,058 | ) | (428,502 | ) | (11,445,993 | ) | (320,430 | ) | (7,470,494 | ) | ||||||||||||||||
| Class Y | ||||||||||||||||||||||||||||||||
| Proceeds from Shares issued | 3,101,270 | 34,159,735 | 1,400,121 | 15,261,513 | 6,812,111 | 193,127,657 | 7,186,523 | 176,426,122 | ||||||||||||||||||||||||
| Reinvestment of distributions | 216,908 | 2,364,301 | — | — | 75,256 | 2,062,953 | 9,378 | 226,837 | ||||||||||||||||||||||||
| Cost of Shares redeemed | (2,860,614 | ) | (31,743,547 | ) | (2,032,901 | ) | (22,066,584 | ) | (7,194,091 | ) | (204,292,667 | ) | (9,559,803 | ) | (239,131,360 | ) | ||||||||||||||||
| Change from Class Y Share Transactions | 457,564 | 4,780,489 | (632,780 | ) | (6,805,071 | ) | (306,724 | ) | (9,102,057 | ) | (2,363,902 | ) | (62,478,401 | ) | ||||||||||||||||||
| Class Z | ||||||||||||||||||||||||||||||||
| Proceeds from Shares issued | — | — | — | — | 248,309 | 6,933,230 | 653,874 | 15,736,708 | ||||||||||||||||||||||||
| Reinvestment of distributions | — | — | — | — | 1,828 | 49,486 | 57 | 1,361 | ||||||||||||||||||||||||
| Cost of Shares redeemed | — | — | — | — | (348,521 | ) | (9,827,195 | ) | (728,737 | ) | (17,272,179 | ) | ||||||||||||||||||||
| Change from Class Z Share Transactions | — | — | — | — | (98,384 | ) | (2,844,479 | ) | (74,806 | ) | (1,534,110 | ) | ||||||||||||||||||||
| Institutional Class | ||||||||||||||||||||||||||||||||
| Proceeds from Shares issued | 4,238,661 | 46,907,941 | 718,753 | 7,858,014 | 1,881,647 | 53,915,231 | 1,263,355 | 32,341,689 | ||||||||||||||||||||||||
| Reinvestment of distributions | 164,732 | 1,803,811 | — | — | 11,814 | 324,185 | 1,800 | 43,567 | ||||||||||||||||||||||||
| Cost of Shares redeemed | (2,532,066 | ) | (28,056,721 | ) | (1,610,541 | ) | (17,560,296 | ) | (1,168,557 | ) | (33,208,043 | ) | (1,556,379 | ) | (37,332,565 | ) | ||||||||||||||||
| Change from Institutional Class Share Transactions | 1,871,327 | 20,655,031 | (891,788 | ) | (9,702,282 | ) | 724,904 | 21,031,373 | (291,224 | ) | (4,947,309 | ) | ||||||||||||||||||||
| Change from Share Transactions | 1,890,965 | $ | 20,805,545 | (2,666,868 | ) | $ | (28,687,623 | ) | (1,016,336 | ) | $ | (27,506,901 | ) | (3,704,190 | ) | $ | (91,734,050 | ) | ||||||||||||||
See accompanying Notes to Financial Statements.
| 130 |
Statements of Changes in Net Assets - Capital Stock Activity (Continued)
| Touchstone Mid Cap Value Fund | Touchstone Premium Yield Equity Fund | |||||||||||||||||||||||||||||
| For the Year Ended September 30, 2017 | For the Year Ended September 30, 2016 | For the Year Ended September 30, 2017 | For the Year Ended September 30, 2016 | |||||||||||||||||||||||||||
| Shares | Dollars | Shares | Dollars | Shares | Dollars | Shares | Dollars | |||||||||||||||||||||||
| 701,153 | $ | 12,828,822 | 895,554 | $ | 15,389,896 | 642,872 | $ | 5,805,412 | 893,980 | $ | 7,265,127 | |||||||||||||||||||
| 36,952 | 668,472 | 33,498 | 513,921 | 51,326 | 458,763 | 321,003 | 2,457,627 | |||||||||||||||||||||||
| (903,403 | ) | (16,632,912 | ) | (167,163 | ) | (2,768,421 | ) | (1,346,365 | ) | (12,078,014 | ) | (2,501,557 | ) | (20,481,758 | ) | |||||||||||||||
| (165,298 | ) | (3,135,618 | ) | 761,889 | 13,135,396 | (652,167 | ) | (5,813,839 | ) | (1,286,574 | ) | (10,759,004 | ) | |||||||||||||||||
| 412,284 | 7,373,904 | 159,177 | 2,622,368 | 141,970 | 1,264,192 | 240,470 | 1,977,576 | |||||||||||||||||||||||
| 11,309 | 200,962 | 7,245 | 108,314 | 46,771 | 417,141 | 297,727 | 2,267,553 | |||||||||||||||||||||||
| (92,951 | ) | (1,692,148 | ) | (42,291 | ) | (668,664 | ) | (755,879 | ) | (6,756,321 | ) | (1,395,315 | ) | (11,204,814 | ) | |||||||||||||||
| 330,642 | 5,882,718 | 124,131 | 2,062,018 | (567,138 | ) | (5,074,988 | ) | (857,118 | ) | (6,959,685 | ) | |||||||||||||||||||
| 8,004,954 | 148,753,892 | 5,770,403 | 98,377,196 | 4,322,451 | 38,621,210 | 5,449,973 | 44,567,862 | |||||||||||||||||||||||
| 615,344 | 11,210,752 | 912,703 | 14,062,747 | 273,255 | 2,434,528 | 1,055,348 | 8,111,513 | |||||||||||||||||||||||
| (8,685,917 | ) | (161,204,179 | ) | (3,240,894 | ) | (52,471,504 | ) | (7,945,883 | ) | (71,392,001 | ) | (7,288,142 | ) | (59,400,152 | ) | |||||||||||||||
| (65,619 | ) | (1,239,535 | ) | 3,442,212 | 59,968,439 | (3,350,177 | ) | (30,336,263 | ) | (782,821 | ) | (6,720,777 | ) | |||||||||||||||||
| — | — | — | — | — | — | — | — | |||||||||||||||||||||||
| — | — | — | — | — | — | — | — | |||||||||||||||||||||||
| — | — | — | — | — | — | — | — | |||||||||||||||||||||||
| — | — | — | — | — | — | — | — | |||||||||||||||||||||||
| 10,402,481 | 194,155,853 | 6,959,601 | 115,342,356 | — | — | — | — | |||||||||||||||||||||||
| 322,849 | 5,927,128 | 300,454 | 4,672,213 | — | — | — | — | |||||||||||||||||||||||
| (4,173,196 | ) | (78,116,125 | ) | (4,592,736 | ) | (76,840,265 | ) | — | — | — | — | |||||||||||||||||||
| 6,552,134 | 121,966,856 | 2,667,319 | 43,174,304 | — | — | — | — | |||||||||||||||||||||||
| 6,651,859 | $ | 123,474,421 | 6,995,551 | $ | 118,340,157 | (4,569,482 | ) | $ | (41,225,090 | ) | (2,926,513 | ) | $ | (24,439,466 | ) | |||||||||||||||
| 131 |
Statements of Changes in Net Assets - Capital Stock Activity (Continued)
| Touchstone Sands Capital Select Growth Fund | Touchstone Small Cap Fund | |||||||||||||||||||||||||||||||
| For the Year Ended September 30, 2017 | For the Year Ended September 30, 2016 | For the Year Ended September 30, 2017 | For the Year Ended September 30, 2016 | |||||||||||||||||||||||||||||
| Shares | Dollars | Shares | Dollars | Shares | Dollars | Shares | Dollars | |||||||||||||||||||||||||
| Class A | ||||||||||||||||||||||||||||||||
| Proceeds from Shares issued | 1,212,081 | $ | 17,814,655 | 1,781,144 | $ | 27,608,651 | 139,684 | $ | 2,397,730 | 403,980 | $ | 6,570,669 | ||||||||||||||||||||
| Reinvestment of distributions | 917,286 | 12,007,271 | 1,013,500 | 16,469,382 | — | — | 407,403 | 6,419,574 | ||||||||||||||||||||||||
| Cost of Shares redeemed | (5,277,157 | ) | (77,763,400 | ) | (8,227,919 | ) | (127,495,191 | ) | (1,773,199 | ) | (30,587,056 | ) | (1,995,355 | ) | (32,579,500 | ) | ||||||||||||||||
| Change from Class A Share Transactions | (3,147,790 | ) | (47,941,474 | ) | (5,433,275 | ) | (83,417,158 | ) | (1,633,515 | ) | (28,189,326 | ) | (1,183,972 | ) | (19,589,257 | ) | ||||||||||||||||
| Class C | ||||||||||||||||||||||||||||||||
| Proceeds from Shares issued | 361,269 | 4,654,639 | 331,830 | 5,104,448 | 7,490 | 124,311 | 22,915 | 359,013 | ||||||||||||||||||||||||
| Reinvestment of distributions | 848,904 | 10,466,987 | 719,512 | 11,188,418 | — | — | 137,154 | 2,078,131 | ||||||||||||||||||||||||
| Cost of Shares redeemed | (3,762,317 | ) | (52,025,885 | ) | (4,053,250 | ) | (59,099,723 | ) | (417,241 | ) | (6,781,423 | ) | (460,139 | ) | (7,288,098 | ) | ||||||||||||||||
| Change from Class C Share Transactions | (2,552,144 | ) | (36,904,259 | ) | (3,001,908 | ) | (42,806,857 | ) | (409,751 | ) | (6,657,112 | ) | (300,070 | ) | (4,850,954 | ) | ||||||||||||||||
| Class Y | ||||||||||||||||||||||||||||||||
| Proceeds from Shares issued | 26,578,930 | 413,169,218 | 27,425,606 | 434,736,619 | 1,799,187 | 30,786,320 | 6,097,043 | 95,431,681 | ||||||||||||||||||||||||
| Reinvestment of distributions | 13,712,898 | 186,906,606 | 11,303,725 | 189,677,066 | 46,428 | 813,579 | 2,083,885 | 33,271,220 | ||||||||||||||||||||||||
| Cost of Shares redeemed | (69,920,725 | ) | (1,075,067,986 | ) | (94,962,088 | ) | (1,498,045,256 | ) | (15,062,183 | ) | (258,695,632 | ) | (8,854,273 | ) | (145,834,007 | ) | ||||||||||||||||
| Change from Class Y Share Transactions | (29,628,897 | ) | (474,992,162 | ) | (56,232,757 | ) | (873,631,571 | ) | (13,216,568 | ) | (227,095,733 | ) | (673,345 | ) | (17,131,106 | ) | ||||||||||||||||
| Class Z | ||||||||||||||||||||||||||||||||
| Proceeds from Shares issued | 2,878,806 | 42,519,038 | 5,906,679 | 92,270,499 | — | — | — | — | ||||||||||||||||||||||||
| Reinvestment of distributions | 7,085,965 | 92,826,102 | 6,855,766 | 111,406,290 | — | — | — | — | ||||||||||||||||||||||||
| Cost of Shares redeemed | (24,567,869 | ) | (365,390,570 | ) | (43,009,825 | ) | (659,048,856 | ) | — | — | — | — | ||||||||||||||||||||
| Change from Class Z Share Transactions | (14,603,098 | ) | (230,045,430 | ) | (30,247,380 | ) | (455,372,067 | ) | — | — | — | — | ||||||||||||||||||||
| Institutional Class | ||||||||||||||||||||||||||||||||
| Proceeds from Shares issued | — | — | — | — | 2,359,283 | 40,385,355 | 6,414,250 | 104,506,111 | ||||||||||||||||||||||||
| Reinvestment of distributions | — | — | — | — | 21,057 | 368,294 | 1,130,473 | 18,036,138 | ||||||||||||||||||||||||
| Cost of Shares redeemed | — | — | — | — | (11,069,857 | ) | (189,025,941 | ) | (8,849,233 | ) | (149,523,123 | ) | ||||||||||||||||||||
| Change from Institutional Class Share Transactions | — | — | — | — | (8,689,517 | ) | (148,272,292 | ) | (1,304,510 | ) | (26,980,874 | ) | ||||||||||||||||||||
| Change from Share Transactions | (49,931,929 | ) | $ | (789,883,325 | ) | (94,915,320 | ) | $ | (1,455,227,653 | ) | (23,949,351 | ) | $ | (410,214,463 | ) | (3,461,897 | ) | $ | (68,552,191 | ) | ||||||||||||
See accompanying Notes to Financial Statements.
| 132 |
Statements of Changes in Net Assets - Capital Stock Activity (Continued)
| Touchstone Small Cap Value Fund | Touchstone Total Return Bond Fund | |||||||||||||||||||||||||||||
| For the Year Ended September 30, 2017 | For the Year Ended September 30, 2016 | For the Year Ended September 30, 2017 | For the Year Ended September 30, 2016 | |||||||||||||||||||||||||||
| Shares | Dollars | Shares | Dollars | Shares | Dollars | Shares | Dollars | |||||||||||||||||||||||
| 6,181,616 | $ | 151,720,611 | 5,882,525 | $ | 130,027,094 | 142,982 | $ | 1,446,473 | 404,980 | $ | 4,176,299 | |||||||||||||||||||
| 4,698 | 117,711 | 62,383 | 1,249,310 | 10,803 | 109,086 | 10,799 | 110,510 | |||||||||||||||||||||||
| (9,997,487 | ) | (247,642,110 | ) | (405,894 | ) | (8,670,985 | ) | (479,501 | ) | (4,837,636 | ) | (147,362 | ) | (1,505,459 | ) | |||||||||||||||
| (3,811,173 | ) | (95,803,788 | ) | 5,539,014 | 122,605,419 | (325,716 | ) | (3,282,077 | ) | 268,417 | 2,781,350 | |||||||||||||||||||
| 5,318 | 130,606 | 8,467 | 169,445 | 21,651 | 218,960 | 139,295 | 1,417,759 | |||||||||||||||||||||||
| — | — | 1,924 | 37,527 | 2,929 | 29,526 | 3,370 | 34,456 | |||||||||||||||||||||||
| (20,255 | ) | (492,379 | ) | (17,559 | ) | (366,361 | ) | (110,674 | ) | (1,113,559 | ) | (103,849 | ) | (1,057,076 | ) | |||||||||||||||
| (14,937 | ) | (361,773 | ) | (7,168 | ) | (159,389 | ) | (86,094 | ) | (865,073 | ) | 38,816 | 395,139 | |||||||||||||||||
| 38,975 | 970,075 | 20,965 | 429,261 | 1,523,187 | 15,441,533 | 1,932,957 | 19,881,344 | |||||||||||||||||||||||
| 168 | 4,219 | 8,366 | 165,828 | 86,872 | 878,381 | 79,717 | 817,213 | |||||||||||||||||||||||
| (69,439 | ) | (1,736,564 | ) | (109,569 | ) | (2,278,011 | ) | (2,703,076 | ) | (27,107,007 | ) | (1,145,680 | ) | (11,760,046 | ) | |||||||||||||||
| (30,296 | ) | (762,270 | ) | (80,238 | ) | (1,682,922 | ) | (1,093,017 | ) | (10,787,093 | ) | 866,994 | 8,938,511 | |||||||||||||||||
| — | — | — | — | — | — | — | — | |||||||||||||||||||||||
| — | — | — | — | — | — | — | — | |||||||||||||||||||||||
| — | — | — | — | — | — | — | — | |||||||||||||||||||||||
| — | — | — | — | — | — | — | — | |||||||||||||||||||||||
| 225,874 | 5,617,330 | 153,488 | 3,135,912 | 10,005,361 | 101,401,166 | 6,930,518 | 71,129,405 | |||||||||||||||||||||||
| 218 | 5,475 | 58,793 | 1,171,340 | 501,136 | 5,066,898 | 418,347 | 4,287,777 | |||||||||||||||||||||||
| (999,989 | ) | (21,398,071 | ) | (429,978 | ) | (8,920,650 | ) | (4,601,840 | ) | (46,531,053 | ) | (4,589,373 | ) | (46,969,046 | ) | |||||||||||||||
| (773,897 | ) | (15,775,266 | ) | (217,697 | ) | (4,613,398 | ) | 5,904,657 | 59,937,011 | 2,759,492 | 28,448,136 | |||||||||||||||||||
| (4,630,303 | ) | $ | (112,703,097 | ) | 5,233,911 | $ | 116,149,710 | 4,399,830 | $ | 45,002,768 | 3,933,719 | $ | 40,563,136 | |||||||||||||||||
| 133 |
Statements of Changes in Net Assets - Capital Stock Activity (Continued)
| Touchstone Ultra Short Duration Fixed Income Fund | ||||||||||||||||
| For the Year Ended September 30, 2017 | For the Year Ended September 30, 2016 | |||||||||||||||
| Shares | Dollars | Shares | Dollars | |||||||||||||
| Class A | ||||||||||||||||
| Proceeds from Shares issued | 1,661,765 | $ | 15,471,923 | 1,455,659 | $ | 13,554,444 | ||||||||||
| Reinvestment of distributions | 20,548 | 191,248 | 13,073 | 121,660 | ||||||||||||
| Cost of Shares redeemed | (1,986,378 | ) | (18,488,192 | ) | (795,071 | ) | (7,399,901 | ) | ||||||||
| Change from Class A Share Transactions | (304,065 | ) | (2,825,021 | ) | 673,661 | 6,276,203 | ||||||||||
| Class C | ||||||||||||||||
| Proceeds from Shares issued | 218,081 | 2,030,199 | 445,090 | 4,142,012 | ||||||||||||
| Reinvestment of distributions | 5,052 | 47,032 | 5,126 | 47,688 | ||||||||||||
| Cost of Shares redeemed | (463,934 | ) | (4,319,053 | ) | (484,982 | ) | (4,514,193 | ) | ||||||||
| Change from Class C Share Transactions | (240,801 | ) | (2,241,822 | ) | (34,766 | ) | (324,493 | ) | ||||||||
| Class Y | ||||||||||||||||
| Proceeds from Shares issued | 16,443,475 | 153,020,422 | 16,170,047 | 150,487,329 | ||||||||||||
| Reinvestment of distributions | 239,815 | 2,231,627 | 238,789 | 2,222,199 | ||||||||||||
| Cost of Shares redeemed | (10,766,225 | ) | (100,223,831 | ) | (15,767,661 | ) | (146,728,963 | ) | ||||||||
| Change from Class Y Share Transactions | 5,917,065 | 55,028,218 | 641,175 | 5,980,565 | ||||||||||||
| Class Z | ||||||||||||||||
| Proceeds from Shares issued | 8,854,432 | 82,424,899 | 14,233,209 | 132,476,170 | ||||||||||||
| Reinvestment of distributions | 340,928 | 3,172,968 | 333,217 | 3,101,505 | ||||||||||||
| Cost of Shares redeemed | (12,733,081 | ) | (118,534,540 | ) | (20,909,389 | ) | (194,733,929 | ) | ||||||||
| Change from Class Z Share Transactions | (3,537,721 | ) | (32,936,673 | ) | (6,342,963 | ) | (59,156,254 | ) | ||||||||
| Institutional Class | ||||||||||||||||
| Proceeds from Shares issued | 26,763,928 | 248,905,046 | 20,434,716 | 190,239,052 | ||||||||||||
| Reinvestment of distributions | 311,948 | 2,900,582 | 159,277 | 1,481,955 | ||||||||||||
| Cost of Shares redeemed | (14,682,093 | ) | (136,567,184 | ) | (10,553,125 | ) | (98,260,070 | ) | ||||||||
| Change from Institutional Class Share Transactions | 12,393,783 | 115,238,444 | 10,040,868 | 93,460,937 | ||||||||||||
| Change from Share Transactions | 14,228,261 | $ | 132,263,146 | 4,977,975 | $ | 46,236,958 | ||||||||||
See accompanying Notes to Financial Statements.
| 134 |
| Touchstone Active Bond Fund—Class A |
| Selected Data for a Share Outstanding Throughout Each Period |
| Year Ended September 30, | ||||||||||||||||||||
| 2017 | 2016 | 2015 | 2014 | 2013 | ||||||||||||||||
| Net asset value at beginning of period | $ | 10.59 | $ | 10.20 | $ | 10.45 | $ | 10.33 | $ | 10.89 | ||||||||||
| Income (loss) from investment operations: | ||||||||||||||||||||
| Net investment income | 0.24 | 0.26 | 0.26 | 0.32 | 0.30 | |||||||||||||||
| Net realized and unrealized gains (losses) on investments | (0.11 | ) | 0.43 | (0.23 | ) | 0.13 | (0.38 | ) | ||||||||||||
| Total from investment operations | 0.13 | 0.69 | 0.03 | 0.45 | (0.08 | ) | ||||||||||||||
| Distributions from: | ||||||||||||||||||||
| Net investment income | (0.25 | ) | (0.30 | ) | (0.28 | ) | (0.33 | ) | (0.36 | ) | ||||||||||
| Realized capital gains | — | — | — | — | (0.12 | ) | ||||||||||||||
| Total distributions | (0.25 | ) | (0.30 | ) | (0.28 | ) | (0.33 | ) | (0.48 | ) | ||||||||||
| Net asset value at end of period | $ | 10.47 | $ | 10.59 | $ | 10.20 | $ | 10.45 | $ | 10.33 | ||||||||||
| Total return(A) | 1.26 | % | 6.90 | % | 0.24 | % | 4.41 | % | (0.85 | )% | ||||||||||
| Ratios and supplemental data: | ||||||||||||||||||||
| Net assets at end of period (000's) | $ | 22,117 | $ | 25,324 | $ | 29,135 | $ | 28,920 | $ | 34,635 | ||||||||||
| Ratio to average net assets: | ||||||||||||||||||||
| Net expenses | 0.90 | % | 0.90 | % | 0.90 | % | 0.86 | % | 0.83 | % | ||||||||||
| Gross expenses | 1.18 | % | 1.19 | % | 1.19 | % | 1.28 | % | 1.18 | % | ||||||||||
| Net investment income | 2.33 | % | 2.52 | % | 2.50 | % | 2.99 | % | 2.94 | % | ||||||||||
| Portfolio turnover rate | 496 | % | 590 | % | 349 | % | 281 | % | 353 | % | ||||||||||
| Touchstone Active Bond Fund—Class C |
| Selected Data for a Share Outstanding Throughout Each Period |
| Year Ended September 30, | ||||||||||||||||||||
| 2017 | 2016 | 2015 | 2014 | 2013 | ||||||||||||||||
| Net asset value at beginning of period | $ | 9.82 | $ | 9.48 | $ | 9.73 | $ | 9.64 | $ | 10.20 | ||||||||||
| Income (loss) from investment operations: | ||||||||||||||||||||
| Net investment income | 0.14 | 0.16 | 0.17 | 0.21 | 0.20 | |||||||||||||||
| Net realized and unrealized gains (losses) on investments | (0.10 | ) | 0.41 | (0.21 | ) | 0.14 | (0.35 | ) | ||||||||||||
| Total from investment operations | 0.04 | 0.57 | (0.04 | ) | 0.35 | (0.15 | ) | |||||||||||||
| Distributions from: | ||||||||||||||||||||
| Net investment income | (0.18 | ) | (0.23 | ) | (0.21 | ) | (0.26 | ) | (0.29 | ) | ||||||||||
| Realized capital gains | — | — | — | — | (0.12 | ) | ||||||||||||||
| Total distributions | (0.18 | ) | (0.23 | ) | (0.21 | ) | (0.26 | ) | (0.41 | ) | ||||||||||
| Net asset value at end of period | $ | 9.68 | $ | 9.82 | $ | 9.48 | $ | 9.73 | $ | 9.64 | ||||||||||
| Total return(A) | 0.52 | % | 6.03 | % | (0.47 | )% | 3.65 | % | (1.55 | )% | ||||||||||
| Ratios and supplemental data: | ||||||||||||||||||||
| Net assets at end of period (000's) | $ | 4,642 | $ | 6,513 | $ | 6,946 | $ | 8,725 | $ | 11,337 | ||||||||||
| Ratio to average net assets: | ||||||||||||||||||||
| Net expenses | 1.65 | % | 1.65 | % | 1.65 | % | 1.61 | % | 1.58 | % | ||||||||||
| Gross expenses | 2.18 | % | 2.09 | % | 2.06 | % | 2.15 | % | 1.98 | % | ||||||||||
| Net investment income | 1.58 | % | 1.77 | % | 1.75 | % | 2.24 | % | 2.19 | % | ||||||||||
| Portfolio turnover rate | 496 | % | 590 | % | 349 | % | 281 | % | 353 | % | ||||||||||
| (A) | Total returns shown exclude the effect of applicable sales loads. If these charges were included, the returns would be lower. |
See accompanying Notes to Financial Statements.
| 135 |
Financial Highlights (Continued)
| Touchstone Active Bond Fund—Class Y |
| Selected Data for a Share Outstanding Throughout Each Period |
| Year Ended September 30, | ||||||||||||||||||||
| 2017 | 2016 | 2015 | 2014 | 2013 | ||||||||||||||||
| Net asset value at beginning of period | $ | 10.59 | $ | 10.20 | $ | 10.45 | $ | 10.32 | $ | 10.89 | ||||||||||
| Income (loss) from investment operations: | ||||||||||||||||||||
| Net investment income | 0.27 | 0.29 | 0.29 | 0.34 | 0.33 | |||||||||||||||
| Net realized and unrealized gains (losses) on investments | (0.12 | ) | 0.43 | (0.24 | ) | 0.15 | (0.39 | ) | ||||||||||||
| Total from investment operations | 0.15 | 0.72 | 0.05 | 0.49 | (0.06 | ) | ||||||||||||||
| Distributions from: | ||||||||||||||||||||
| Net investment income | (0.28 | ) | (0.33 | ) | (0.30 | ) | (0.36 | ) | (0.39 | ) | ||||||||||
| Realized capital gains | — | — | — | — | (0.12 | ) | ||||||||||||||
| Total distributions | (0.28 | ) | (0.33 | ) | (0.30 | ) | (0.36 | ) | (0.51 | ) | ||||||||||
| Net asset value at end of period | $ | 10.46 | $ | 10.59 | $ | 10.20 | $ | 10.45 | $ | 10.32 | ||||||||||
| Total return | 1.43 | % | 7.18 | % | 0.49 | % | 4.78 | % | (0.60 | )% | ||||||||||
| Ratios and supplemental data: | ||||||||||||||||||||
| Net assets at end of period (000's) | $ | 79,648 | $ | 76,544 | $ | 57,394 | $ | 59,764 | $ | 58,944 | ||||||||||
| Ratio to average net assets: | ||||||||||||||||||||
| Net expenses | 0.65 | % | 0.65 | % | 0.65 | % | 0.61 | % | 0.58 | % | ||||||||||
| Gross expenses | 0.86 | % | 0.90 | % | 0.91 | % | 0.95 | % | 0.88 | % | ||||||||||
| Net investment income | 2.58 | % | 2.77 | % | 2.75 | % | 3.24 | % | 3.19 | % | ||||||||||
| Portfolio turnover rate | 496 | % | 590 | % | 349 | % | 281 | % | 353 | % | ||||||||||
| Touchstone Active Bond Fund—Institutional Class |
| Selected Data for a Share Outstanding Throughout Each Period |
| Year Ended September 30, | ||||||||||||||||||||
| 2017 | 2016 | 2015 | 2014 | 2013 | ||||||||||||||||
| Net asset value at beginning of period | $ | 10.58 | $ | 10.19 | $ | 10.44 | $ | 10.32 | $ | 10.89 | ||||||||||
| Income (loss) from investment operations: | ||||||||||||||||||||
| Net investment income | 0.25 | 0.33 | 0.30 | 0.35 | 0.34 | |||||||||||||||
| Net realized and unrealized gains (losses) on investments | (0.09 | ) | 0.40 | (0.24 | ) | 0.14 | (0.39 | ) | ||||||||||||
| Total from investment operations | 0.16 | 0.73 | 0.06 | 0.49 | (0.05 | ) | ||||||||||||||
| Distributions from: | ||||||||||||||||||||
| Net investment income | (0.28 | ) | (0.34 | ) | (0.31 | ) | (0.37 | ) | (0.40 | ) | ||||||||||
| Realized capital gains | — | — | — | — | (0.12 | ) | ||||||||||||||
| Total distributions | (0.28 | ) | (0.34 | ) | (0.31 | ) | (0.37 | ) | (0.52 | ) | ||||||||||
| Net asset value at end of period | $ | 10.46 | $ | 10.58 | $ | 10.19 | $ | 10.44 | $ | 10.32 | ||||||||||
| Total return | 1.61 | % | 7.27 | % | 0.57 | % | 4.76 | % | (0.52 | )% | ||||||||||
| Ratios and supplemental data: | ||||||||||||||||||||
| Net assets at end of period (000's) | $ | 20,800 | $ | 6,841 | $ | 6,788 | $ | 7,393 | $ | 7,606 | ||||||||||
| Ratio to average net assets: | ||||||||||||||||||||
| Net expenses | 0.57 | % | 0.57 | % | 0.57 | % | 0.53 | % | 0.50 | % | ||||||||||
| Gross expenses | 0.87 | % | 1.00 | % | 0.95 | % | 1.09 | % | 0.95 | % | ||||||||||
| Net investment income | 2.66 | % | 2.85 | % | 2.83 | % | 3.32 | % | 3.27 | % | ||||||||||
| Portfolio turnover rate | 496 | % | 590 | % | 349 | % | 281 | % | 353 | % | ||||||||||
See accompanying Notes to Financial Statements.
| 136 |
Financial Highlights (Continued)
| Touchstone Arbitrage Fund—Class A |
| Selected Data for a Share Outstanding Throughout Each Period |
| Year Ended September 30, | ||||||||||||||||
| 2017 | 2016 | 2015 | 2014(A) | |||||||||||||
| Net asset value at beginning of period | $ | 10.31 | $ | 9.93 | $ | 9.87 | $ | 10.00 | ||||||||
| Income (loss) from investment operations: | ||||||||||||||||
| Net investment loss(B) | (0.12 | ) | (0.11 | ) | (0.08 | ) | (0.10 | ) | ||||||||
| Net realized and unrealized gains (losses) on investments | 0.34 | 0.66 | 0.16 | (0.03 | ) | |||||||||||
| Total from investment operations | 0.22 | 0.55 | 0.08 | (0.13 | ) | |||||||||||
| Distributions from: | ||||||||||||||||
| Net investment income | — | (0.02 | ) | — | — | |||||||||||
| Realized capital gains | (0.29 | ) | (0.15 | ) | (0.02 | ) | — | |||||||||
| Total distributions | (0.29 | ) | (0.17 | ) | (0.02 | ) | — | |||||||||
| Net asset value at end of period | $ | 10.24 | $ | 10.31 | $ | 9.93 | $ | 9.87 | ||||||||
| Total return(C) | 2.20 | % | 5.61 | % | 0.77 | % | (1.30 | )% | ||||||||
| Ratios and supplemental data: | ||||||||||||||||
| Net assets at end of period (000's) | $ | 8,186 | $ | 10,003 | $ | 20,672 | $ | 22,725 | ||||||||
| Ratio to average net assets: | ||||||||||||||||
| Net expenses (including dividend and interest expense on securities sold short)(D) | 2.70 | % | 2.80 | % | 2.42 | % | 2.51 | % | ||||||||
| Gross expenses (including dividend and interest expense on securities sold short)(E) | 2.91 | % | 3.03 | % | 2.44 | % | 2.51 | % | ||||||||
| Net investment loss | (1.20 | )% | (1.06 | )% | (0.83 | )% | (1.01 | )% | ||||||||
| Portfolio turnover rate | 358 | % | 451 | % | 276 | % | 293 | % | ||||||||
| Touchstone Arbitrage Fund—Class C |
| Selected Data for a Share Outstanding Throughout Each Period |
| Year Ended September 30, | ||||||||||||||||
| 2017 | 2016 | 2015 | 2014(A) | |||||||||||||
| Net asset value at beginning of period | $ | 10.11 | $ | 9.80 | $ | 9.82 | $ | 10.00 | ||||||||
| Income (loss) from investment operations: | ||||||||||||||||
| Net investments loss(B) | (0.19 | ) | (0.18 | ) | (0.15 | ) | (0.17 | ) | ||||||||
| Net realized and unrealized gains (losses) on investments | 0.32 | 0.65 | 0.15 | (0.01 | ) | |||||||||||
| Total from investment operations | 0.13 | 0.47 | — | (0.18 | ) | |||||||||||
| Distributions from: | ||||||||||||||||
| Net investment income | — | (0.01 | ) | — | — | |||||||||||
| Realized capital gains | (0.29 | ) | (0.15 | ) | (0.02 | ) | — | |||||||||
| Total distributions | (0.29 | ) | (0.16 | ) | (0.02 | ) | — | |||||||||
| Net asset value at end of period | $ | 9.95 | $ | 10.11 | $ | 9.80 | $ | 9.82 | ||||||||
| Total return(C) | 1.33 | % | 4.81 | % | (0.05 | )% | (1.80 | )% | ||||||||
| Ratios and supplemental data: | ||||||||||||||||
| Net assets at end of period (000's) | $ | 8,762 | $ | 7,930 | $ | 8,694 | $ | 11,113 | ||||||||
| Ratio to average net assets: | ||||||||||||||||
| Net expenses (including dividend and interest expense on securities sold short)(D) | 3.45 | % | 3.55 | % | 3.14 | % | 3.27 | % | ||||||||
| Gross expenses (including dividend and interest expense on securities sold short)(E) | 3.60 | % | 3.62 | % | 3.14 | % | 3.29 | % | ||||||||
| Net investment loss | (1.95 | )% | (1.81 | )% | (1.55 | )% | (1.77 | )% | ||||||||
| Portfolio turnover rate | 358 | % | 451 | % | 276 | % | 293 | % | ||||||||
| (A) | Represents the period from commencement of operations (October 1, 2013) through September 30, 2014. |
| (B) | The net investment loss per share is based on average shares outstanding for the period. |
| (C) | Total returns shown exclude the effect of applicable sales loads. If these charges were included, the returns would be lower. |
| (D) | The ratio of net expenses to average net assets excluding dividend and interest expense on securities sold short for Class A is 1.68%, 1.68%, 1.68% and 1.67% and for Class C is 2.43%, 2.43%, 2.40% and 2.43% for the years ended September 30, 2017, 2016, 2015 and 2014, respectively. |
| (E) | The ratio of gross expenses to average net assets excluding dividend and interest expense on securities sold short for Class A is 1.89%, 1.91%, 1.70% and 1.67% and for Class C is 2.58%, 2.50%, 2.40% and 2.45% for the years ended September 30, 2017, 2016, 2015 and 2014, respectively. |
See accompanying Notes to Financial Statements.
| 137 |
Financial Highlights (Continued)
| Touchstone Arbitrage Fund—Class Y |
| Selected Data for a Share Outstanding Throughout Each Period |
| Year Ended September 30, | ||||||||||||||||
| 2017 | 2016 | 2015 | 2014(A) | |||||||||||||
| Net asset value at beginning of period | $ | 10.40 | $ | 9.99 | $ | 9.91 | $ | 10.00 | ||||||||
| Income (loss) from investment operations: | ||||||||||||||||
| Net investment loss(B) | (0.09 | ) | (0.08 | ) | (0.05 | ) | (0.07 | ) | ||||||||
| Net realized and unrealized gains (losses) on investments | 0.33 | 0.67 | 0.15 | (0.02 | ) | |||||||||||
| Total from investment operations | 0.24 | 0.59 | 0.10 | (0.09 | ) | |||||||||||
| Distributions from: | ||||||||||||||||
| Net investment income | — | (0.03 | ) | — | — | |||||||||||
| Realized capital gains | (0.29 | ) | (0.15 | ) | (0.02 | ) | — | |||||||||
| Total distributions | (0.29 | ) | (0.18 | ) | (0.02 | ) | — | |||||||||
| Net asset value at end of period | $ | 10.35 | $ | 10.40 | $ | 9.99 | $ | 9.91 | ||||||||
| Total return | 2.38 | % | 6.00 | % | 0.97 | % | (0.90 | )% | ||||||||
| Ratios and supplemental data: | ||||||||||||||||
| Net assets at end of period (000's) | $ | 179,124 | $ | 121,794 | $ | 87,427 | $ | 117,589 | ||||||||
| Ratio to average net assets: | ||||||||||||||||
| Net expenses (including dividend and interest expense on securities sold short)(C) | 2.39 | % | 2.51 | % | 2.10 | % | 2.19 | % | ||||||||
| Gross expenses (including dividend and interest expense on securities sold short)(D) | 2.39 | % | 2.51 | % | 2.10 | % | 2.19 | % | ||||||||
| Net investment loss | (0.89 | )% | (0.77 | )% | (0.51 | )% | (0.69 | )% | ||||||||
| Portfolio turnover rate | 358 | % | 451 | % | 276 | % | 293 | % | ||||||||
| Touchstone Arbitrage Fund—Institutional Class |
| Selected Data for a Share Outstanding Throughout Each Period |
| Year Ended September 30, | ||||||||||||||||
| 2017 | 2016 | 2015 | 2014(A) | |||||||||||||
| Net asset value at beginning of period | $ | 10.43 | $ | 10.01 | $ | 9.92 | $ | 10.00 | ||||||||
| Income (loss) from investment operations: | ||||||||||||||||
| Net investments loss(B) | (0.08 | ) | (0.07 | ) | (0.04 | ) | (0.06 | ) | ||||||||
| Net realized and unrealized gains (losses) on investments | 0.34 | 0.68 | 0.15 | (0.02 | ) | |||||||||||
| Total from investment operations | 0.26 | 0.61 | 0.11 | (0.08 | ) | |||||||||||
| Distributions from: | ||||||||||||||||
| Net investment income | — | (0.04 | ) | — | — | |||||||||||
| Realized capital gains | (0.29 | ) | (0.15 | ) | (0.02 | ) | — | |||||||||
| Total distributions | (0.29 | ) | (0.19 | ) | (0.02 | ) | — | |||||||||
| Net asset value at end of period | $ | 10.40 | $ | 10.43 | $ | 10.01 | $ | 9.92 | ||||||||
| Total return | 2.57 | % | 6.12 | % | 1.06 | % | (0.80 | )% | ||||||||
| Ratios and supplemental data: | ||||||||||||||||
| Net assets at end of period (000's) | $ | 45,259 | $ | 13,782 | $ | 8,735 | $ | 47,763 | ||||||||
| Ratio to average net assets: | ||||||||||||||||
| Net expenses (including dividend and interest expense on securities sold short)(C) | 2.30 | % | 2.40 | % | 2.02 | % | 2.12 | % | ||||||||
| Gross expenses (including dividend and interest expense on securities sold short)(D) | 2.35 | % | 2.48 | % | 2.03 | % | 2.12 | % | ||||||||
| Net investment loss | (0.80 | )% | (0.66 | )% | (0.43 | )% | (0.62 | )% | ||||||||
| Portfolio turnover rate | 358 | % | 451 | % | 276 | % | 293 | % | ||||||||
| (A) | Represents the period from commencement of operations (October 1, 2013) through September 30, 2014. |
| (B) | The net investment loss per share is based on average shares outstanding for the period. |
| (C) | The ratio of net expenses to average net assets excluding dividend and interest expense on securities sold short for Class Y is 1.37%, 1.39%, 1.36% and 1.35% and for Institutional Class is 1.28%, 1.28%, 1.28% and 1.28% for the years ended September 30, 2017, 2016, 2015 and 2014, respectively. |
| (D) | The ratio of gross expenses to average net assets excluding dividend and interest expense on securities sold short for Class Y is 1.37%, 1.39%, 1.36% and 1.35% and for Institutional Class is 1.33%, 1.36%, 1.29% and 1.28% for the years ended September 30, 2017, 2016, 2015 and 2014, respectively. |
See accompanying Notes to Financial Statements.
| 138 |
Financial Highlights (Continued)
| Touchstone Emerging Markets Small Cap Fund—Class A |
| Selected Data for a Share Outstanding Throughout Each Period |
| Year Ended September 30, | ||||||||||||||||||||
| 2017 | 2016 | 2015 | 2014 | 2013 | ||||||||||||||||
| Net asset value at beginning of period | $ | 9.29 | $ | 9.15 | $ | 11.67 | $ | 11.52 | $ | 12.24 | ||||||||||
| Income (loss) from investment operations: | ||||||||||||||||||||
| Net investment income (loss)(A) | 0.14 | (0.03 | ) | 0.07 | 0.09 | 0.09 | ||||||||||||||
| Net realized and unrealized gains (losses) on investments | 1.65 | 0.87 | (2.53 | ) | 0.09 | (0.80 | ) | |||||||||||||
| Total from investment operations | 1.79 | 0.84 | (2.46 | ) | 0.18 | (0.71 | ) | |||||||||||||
| Distributions from: | ||||||||||||||||||||
| Net investment income | — | (0.70 | ) | (0.06 | ) | (0.03 | ) | (0.01 | ) | |||||||||||
| Net asset value at end of period | $ | 11.08 | $ | 9.29 | $ | 9.15 | $ | 11.67 | $ | 11.52 | ||||||||||
| Total return(B) | 19.27 | % | 10.01 | % | (21.18 | )% | 1.61 | % | (5.69 | )% | ||||||||||
| Ratios and supplemental data: | ||||||||||||||||||||
| Net assets at end of period (000's) | $ | 2,950 | $ | 2,376 | $ | 3,022 | $ | 5,307 | $ | 9,843 | ||||||||||
| Ratio to average net assets: | ||||||||||||||||||||
| Net expenses | 1.69 | % | 1.69 | % | 1.69 | % | 1.69 | % | 1.69 | % | ||||||||||
| Gross expenses | 4.42 | % | 3.51 | % | 2.41 | % | 2.20 | % | 1.93 | % | ||||||||||
| Net investment income (loss) | 1.39 | % | (0.40 | )% | 0.66 | % | 0.75 | % | 0.71 | % | ||||||||||
| Portfolio turnover rate | 115 | % | 68 | % | 28 | % | 38 | % | 25 | % | ||||||||||
| Touchstone Emerging Markets Small Cap Fund—Class C |
| Selected Data for a Share Outstanding Throughout Each Period |
| Year Ended September 30, | ||||||||||||||||||||
| 2017 | 2016 | 2015 | 2014 | 2013 | ||||||||||||||||
| Net asset value at beginning of period | $ | 9.10 | $ | 8.94 | $ | 11.43 | $ | 11.33 | $ | 12.13 | ||||||||||
| Income (loss) from investment operations: | ||||||||||||||||||||
| Net investment income (loss)(A) | 0.06 | (0.10 | ) | (0.01 | ) | (—) | (C) | (—) | (C) | |||||||||||
| Net realized and unrealized gains (losses) on investments | 1.61 | 0.86 | (2.48 | ) | 0.10 | (0.80 | ) | |||||||||||||
| Total from investment operations | 1.67 | 0.76 | (2.49 | ) | 0.10 | (0.80 | ) | |||||||||||||
| Distributions from: | ||||||||||||||||||||
| Net investment income | — | (0.60 | ) | — | — | — | ||||||||||||||
| Net asset value at end of period | $ | 10.77 | $ | 9.10 | $ | 8.94 | $ | 11.43 | $ | 11.33 | ||||||||||
| Total return(B) | 18.46 | % | 9.18 | % | (21.79 | )% | 0.88 | % | (6.44 | )% | ||||||||||
| Ratios and supplemental data: | ||||||||||||||||||||
| Net assets at end of period (000's) | $ | 892 | $ | 912 | $ | 1,566 | $ | 2,874 | $ | 3,719 | ||||||||||
| Ratio to average net assets: | ||||||||||||||||||||
| Net expenses | 2.44 | % | 2.44 | % | 2.44 | % | 2.44 | % | 2.44 | % | ||||||||||
| Gross expenses | 6.25 | % | 4.80 | % | 3.19 | % | 3.03 | % | 2.84 | % | ||||||||||
| Net investment income (loss) | 0.64 | % | (1.15 | )% | (0.09 | )% | (0.00 | )%(C) | (0.04 | )% | ||||||||||
| Portfolio turnover rate | 115 | % | 68 | % | 28 | % | 38 | % | 25 | % | ||||||||||
(A) The net investment income (loss) per share is based on average shares outstanding for the period.
(B) Total returns shown exclude the effect of applicable sales loads. If these charges were included, the returns would be lower.
(C) Less than $0.005 per share or 0.005%.
See accompanying Notes to Financial Statements.
| 139 |
Financial Highlights (Continued)
| Touchstone Emerging Markets Small Cap Fund—Class Y |
| Selected Data for a Share Outstanding Throughout Each Period |
| Year Ended September 30, | ||||||||||||||||||||
| 2017 | 2016 | 2015 | 2014 | 2013 | ||||||||||||||||
| Net asset value at beginning of period | $ | 9.32 | $ | 9.10 | $ | 11.63 | $ | 11.54 | $ | 12.27 | ||||||||||
| Income (loss) from investment operations: | ||||||||||||||||||||
| Net investment income (loss)(A) | 0.16 | (0.01 | ) | 0.10 | 0.12 | 0.13 | ||||||||||||||
| Net realized and unrealized gains (losses) on investments | 1.66 | 0.88 | (2.52 | ) | 0.10 | (0.81 | ) | |||||||||||||
| Total from investment operations | 1.82 | 0.87 | (2.42 | ) | 0.22 | (0.68 | ) | |||||||||||||
| Distributions from: | ||||||||||||||||||||
| Net investment income | — | (0.65 | ) | (0.11 | ) | (0.13 | ) | (0.05 | ) | |||||||||||
| Net asset value at end of period | $ | 11.14 | $ | 9.32 | $ | 9.10 | $ | 11.63 | $ | 11.54 | ||||||||||
| Total return | 19.53 | % | 10.37 | % | (20.98 | )% | 1.99 | % | (5.45 | )% | ||||||||||
| Ratios and supplemental data: | ||||||||||||||||||||
| Net assets at end of period (000's) | $ | 8,931 | $ | 4,796 | $ | 70,066 | $ | 105,641 | $ | 138,451 | ||||||||||
| Ratio to average net assets: | ||||||||||||||||||||
| Net expenses | 1.44 | % | 1.44 | % | 1.40 | % | 1.38 | % | 1.37 | % | ||||||||||
| Gross expenses | 3.56 | % | 2.27 | % | 1.40 | % | 1.38 | % | 1.35 | % | ||||||||||
| Net investment income (loss) | 1.64 | % | (0.15 | )% | 0.95 | % | 1.06 | % | 1.04 | % | ||||||||||
| Portfolio turnover rate | 115 | % | 68 | % | 28 | % | 38 | % | 25 | % | ||||||||||
| Touchstone Emerging Markets Small Cap Fund—Institutional Class |
| Selected Data for a Share Outstanding Throughout Each Period |
| Year Ended September 30, | ||||||||||||||||||||
| 2017 | 2016 | 2015 | 2014 | 2013 | ||||||||||||||||
| Net asset value at beginning of period | $ | 9.24 | $ | 9.11 | $ | 11.64 | $ | 11.55 | $ | 12.28 | ||||||||||
| Income (loss) from investment operations: | ||||||||||||||||||||
| Net investment income (loss)(A) | 0.17 | (— | )(B) | 0.12 | 0.13 | 0.14 | ||||||||||||||
| Net realized and unrealized gains (losses) on investments | 1.65 | 0.88 | (2.53 | ) | 0.11 | (0.81 | ) | |||||||||||||
| Total from investment operations | 1.82 | 0.88 | (2.41 | ) | 0.24 | (0.67 | ) | |||||||||||||
| Distributions from: | ||||||||||||||||||||
| Net investment income | — | (0.75 | ) | (0.12 | ) | (0.15 | ) | (0.06 | ) | |||||||||||
| Net asset value at end of period | $ | 11.06 | $ | 9.24 | $ | 9.11 | $ | 11.64 | $ | 11.55 | ||||||||||
| Total return | 19.70 | % | 10.52 | % | (20.87 | )% | 2.13 | % | (5.43 | )% | ||||||||||
| Ratios and supplemental data: | ||||||||||||||||||||
| Net assets at end of period (000's) | $ | 831 | $ | 667 | $ | 184,841 | $ | 234,019 | $ | 218,523 | ||||||||||
| Ratio to average net assets: | ||||||||||||||||||||
| Net expenses | 1.29 | % | 1.29 | % | 1.29 | % | 1.29 | % | 1.29 | % | ||||||||||
| Gross expenses | 5.62 | % | 2.16 | % | 1.33 | % | 1.31 | % | 1.29 | % | ||||||||||
| Net investment income (loss) | 1.79 | % | (0.00 | )%(B) | 1.06 | % | 1.15 | % | 1.11 | % | ||||||||||
| Portfolio turnover rate | 115 | % | 68 | % | 28 | % | 38 | % | 25 | % | ||||||||||
| (A) | The net investment income (loss) per share is based on average shares outstanding for the period. |
| (B) | Less than $0.005 per share or 0.005%. |
See accompanying Notes to Financial Statements.
| 140 |
Financial Highlights (Continued)
| Touchstone High Yield Fund—Class A |
| Selected Data for a Share Outstanding Throughout Each Period |
| Year Ended September 30, | ||||||||||||||||||||
| 2017 | 2016 | 2015 | 2014 | 2013 | ||||||||||||||||
| Net asset value at beginning of period | $ | 8.21 | $ | 7.95 | $ | 8.91 | $ | 8.80 | $ | 8.90 | ||||||||||
| Income (loss) from investment operations: | ||||||||||||||||||||
| Net investment income | 0.39 | 0.41 | 0.43 | 0.45 | 0.51 | |||||||||||||||
| Net realized and unrealized gains (losses) on investments | 0.21 | 0.26 | (0.81 | ) | 0.12 | (0.10 | ) | |||||||||||||
| Total from investment operations | 0.60 | 0.67 | (0.38 | ) | 0.57 | 0.41 | ||||||||||||||
| Distributions from: | ||||||||||||||||||||
| Net investment income | (0.38 | ) | (0.41 | ) | (0.44 | ) | (0.46 | ) | (0.51 | ) | ||||||||||
| Realized capital gains | — | — | (0.14 | ) | — | — | ||||||||||||||
| Total distributions | (0.38 | ) | (0.41 | ) | (0.58 | ) | (0.46 | ) | (0.51 | ) | ||||||||||
| Net asset value at end of period | $ | 8.43 | $ | 8.21 | $ | 7.95 | $ | 8.91 | $ | 8.80 | ||||||||||
| Total return(A) | 7.45 | % | 8.78 | % | (4.54 | )% | 6.54 | % | 4.68 | % | ||||||||||
| Ratios and supplemental data: | ||||||||||||||||||||
| Net assets at end of period (000's) | $ | 16,925 | $ | 20,995 | $ | 26,797 | $ | 39,671 | $ | 54,845 | ||||||||||
| Ratio to average net assets: | ||||||||||||||||||||
| Net expenses | 1.05 | % | 1.05 | % | 1.05 | % | 1.03 | % | 0.99 | % | ||||||||||
| Gross expenses | 1.24 | % | 1.23 | % | 1.15 | % | 1.14 | % | 1.13 | % | ||||||||||
| Net investment income | 4.63 | % | 5.19 | % | 4.92 | % | 4.95 | % | 5.60 | % | ||||||||||
| Portfolio turnover rate | 69 | % | 56 | % | 35 | % | 40 | % | 47 | % | ||||||||||
| Touchstone High Yield Fund—Class C |
| Selected Data for a Share Outstanding Throughout Each Period |
| Year Ended September 30, | ||||||||||||||||||||
| 2017 | 2016 | 2015 | 2014 | 2013 | ||||||||||||||||
| Net asset value at beginning of period | $ | 8.19 | $ | 7.93 | $ | 8.90 | $ | 8.79 | $ | 8.89 | ||||||||||
| Income (loss) from investment operations: | ||||||||||||||||||||
| Net investment income | 0.33 | 0.35 | 0.36 | 0.38 | 0.44 | |||||||||||||||
| Net realized and unrealized gains (losses) on investments | 0.21 | 0.26 | (0.82 | ) | 0.12 | (0.09 | ) | |||||||||||||
| Total from investment operations | 0.54 | 0.61 | (0.46 | ) | 0.50 | 0.35 | ||||||||||||||
| Distributions from: | ||||||||||||||||||||
| Net investment income | (0.32 | ) | (0.35 | ) | (0.37 | ) | (0.39 | ) | (0.45 | ) | ||||||||||
| Realized capital gains | — | — | (0.14 | ) | — | — | ||||||||||||||
| Total distributions | (0.32 | ) | (0.35 | ) | (0.51 | ) | (0.39 | ) | (0.45 | ) | ||||||||||
| Net asset value at end of period | $ | 8.41 | $ | 8.19 | $ | 7.93 | $ | 8.90 | $ | 8.79 | ||||||||||
| Total return(A) | 6.68 | % | 7.99 | % | (5.28 | )% | 5.64 | % | 3.92 | % | ||||||||||
| Ratios and supplemental data: | ||||||||||||||||||||
| Net assets at end of period (000's) | $ | 13,025 | $ | 16,372 | $ | 24,755 | $ | 32,163 | $ | 34,661 | ||||||||||
| Ratio to average net assets: | ||||||||||||||||||||
| Net expenses | 1.80 | % | 1.80 | % | 1.80 | % | 1.78 | % | 1.74 | % | ||||||||||
| Gross expenses | 1.97 | % | 1.94 | % | 1.87 | % | 1.86 | % | 1.87 | % | ||||||||||
| Net investment income | 3.88 | % | 4.44 | % | 4.17 | % | 4.21 | % | 4.86 | % | ||||||||||
| Portfolio turnover rate | 69 | % | 56 | % | 35 | % | 40 | % | 47 | % | ||||||||||
| (A) | Total returns shown exclude the effect of applicable sales loads. If these charges were included, the returns would be lower. |
See accompanying Notes to Financial Statements.
| 141 |
Financial Highlights (Continued)
| Touchstone High Yield Fund—Class Y |
| Selected Data for a Share Outstanding Throughout Each Period |
| Year Ended September 30, | ||||||||||||||||||||
| 2017 | 2016 | 2015 | 2014 | 2013 | ||||||||||||||||
| Net asset value at beginning of period | $ | 8.44 | $ | 8.16 | $ | 9.14 | $ | 9.01 | $ | 9.10 | ||||||||||
| Income (loss) from investment operations: | ||||||||||||||||||||
| Net investment income | 0.43 | 0.46 | 0.47 | 0.50 | 0.56 | |||||||||||||||
| Net realized and unrealized gains (losses) on investments | 0.21 | 0.25 | (0.85 | ) | 0.12 | (0.11 | ) | |||||||||||||
| Total from investment operations | 0.64 | 0.71 | (0.38 | ) | 0.62 | 0.45 | ||||||||||||||
| Distributions from: | ||||||||||||||||||||
| Net investment income | (0.41 | ) | (0.43 | ) | (0.46 | ) | (0.49 | ) | (0.54 | ) | ||||||||||
| Realized capital gains | — | — | (0.14 | ) | — | — | ||||||||||||||
| Total distributions | (0.41 | ) | (0.43 | ) | (0.60 | ) | (0.49 | ) | (0.54 | ) | ||||||||||
| Net asset value at end of period | $ | 8.67 | $ | 8.44 | $ | 8.16 | $ | 9.14 | $ | 9.01 | ||||||||||
| Total return | 7.74 | % | 9.11 | % | (4.42 | )% | 6.91 | % | 5.00 | % | ||||||||||
| Ratios and supplemental data: | ||||||||||||||||||||
| Net assets at end of period (000's) | $ | 75,435 | $ | 85,739 | $ | 119,505 | $ | 166,071 | $ | 187,463 | ||||||||||
| Ratio to average net assets: | ||||||||||||||||||||
| Net expenses | 0.80 | % | 0.80 | % | 0.80 | % | 0.74 | % | 0.69 | % | ||||||||||
| Gross expenses | 0.90 | % | 0.91 | % | 0.87 | % | 0.78 | % | 0.83 | % | ||||||||||
| Net investment income | 4.88 | % | 5.44 | % | 5.17 | % | 5.24 | % | 5.90 | % | ||||||||||
| Portfolio turnover rate | 69 | % | 56 | % | 35 | % | 40 | % | 47 | % | ||||||||||
| Touchstone High Yield Fund—Institutional Class |
| Selected Data for a Share Outstanding Throughout Each Period |
| Year Ended September 30, | ||||||||||||||||||||
| 2017 | 2016 | 2015 | 2014 | 2013 | ||||||||||||||||
| Net asset value at beginning of period | $ | 8.43 | $ | 8.16 | $ | 9.13 | $ | 9.00 | $ | 9.10 | ||||||||||
| Income (loss) from investment operations: | ||||||||||||||||||||
| Net Investment income | 0.42 | 0.44 | 0.46 | 0.49 | 0.54 | |||||||||||||||
| Net realized and unrealized gains (losses) on investments | 0.22 | 0.27 | (0.82 | ) | 0.13 | (0.09 | ) | |||||||||||||
| Total from investment operations | 0.64 | 0.71 | (0.36 | ) | 0.62 | 0.45 | ||||||||||||||
| Distributions from: | ||||||||||||||||||||
| Net Investment income | (0.41 | ) | (0.44 | ) | (0.47 | ) | (0.49 | ) | (0.55 | ) | ||||||||||
| Realized capital gains | — | — | (0.14 | ) | — | — | ||||||||||||||
| Total distributions | (0.41 | ) | (0.44 | ) | (0.61 | ) | (0.49 | ) | (0.55 | ) | ||||||||||
| Net asset value at end of period | $ | 8.66 | $ | 8.43 | $ | 8.16 | $ | 9.13 | $ | 9.00 | ||||||||||
| Total return | 7.70 | % | 9.19 | % | (4.23 | )% | 6.99 | % | 5.00 | % | ||||||||||
| Ratios and supplemental data: | ||||||||||||||||||||
| Net assets at end of period (000's) | $ | 112,503 | $ | 93,267 | $ | 59,037 | $ | 56,228 | $ | 53,844 | ||||||||||
| Ratio to average net assets: | ||||||||||||||||||||
| Net expenses | 0.72 | % | 0.72 | % | 0.72 | % | 0.68 | % | 0.59 | % | ||||||||||
| Gross expenses | 0.75 | % | 0.77 | % | 0.75 | % | 0.75 | % | 0.75 | % | ||||||||||
| Net investment income | 4.96 | % | 5.52 | % | 5.25 | % | 5.31 | % | 6.00 | % | ||||||||||
| Portfolio turnover rate | 69 | % | 56 | % | 35 | % | 40 | % | 47 | % | ||||||||||
See accompanying Notes to Financial Statements.
| 142 |
Financial Highlights (Continued)
| Touchstone Merger Arbitrage Fund—Class A |
| Selected Data for a Share Outstanding Throughout Each Period |
| Year Ended September 30, | ||||||||||||||||||||
| 2017 | 2016 | 2015 | 2014 | 2013 | ||||||||||||||||
| Net asset value at beginning of period | $ | 11.00 | $ | 10.54 | $ | 10.49 | $ | 11.05 | $ | 10.65 | ||||||||||
| Income (loss) from investment operations: | ||||||||||||||||||||
| Net investment income (loss)(A) | (0.11 | ) | (0.08 | ) | (0.11 | ) | (0.13 | ) | 0.07 | |||||||||||
| Net realized and unrealized gains (losses) on investments | 0.43 | 0.54 | 0.21 | (0.05 | ) | 0.44 | ||||||||||||||
| Total from investment operations | 0.32 | 0.46 | 0.10 | (0.18 | ) | 0.51 | ||||||||||||||
| Distributions from: | ||||||||||||||||||||
| Net investment income | — | — | — | (0.05 | ) | — | ||||||||||||||
| Realized capital gains | (0.32 | ) | — | (0.05 | ) | (0.33 | ) | (0.11 | ) | |||||||||||
| Total distributions | (0.32 | ) | — | (0.05 | ) | (0.38 | ) | (0.11 | ) | |||||||||||
| Net asset value at end of period | $ | 11.00 | $ | 11.00 | $ | 10.54 | $ | 10.49 | $ | 11.05 | ||||||||||
| Total return(B) | 3.01 | % | 4.37 | % | 0.92 | % | (1.75 | )% | 4.84 | % | ||||||||||
| Ratios and supplemental data: | ||||||||||||||||||||
| Net assets at end of period (000's) | $ | 14,144 | $ | 15,711 | $ | 21,858 | $ | 96,916 | $ | 275,858 | ||||||||||
| Ratio to average net assets: | ||||||||||||||||||||
| Net expenses (including dividend and interest expense on securities sold short)(C) | 2.56 | % | 2.52 | % | 2.47 | % | 2.52 | % | 2.27 | % | ||||||||||
| Gross expenses (including dividend and interest expense on securities sold short)(D) | 2.64 | % | 2.55 | % | 2.47 | % | 2.52 | % | 2.27 | % | ||||||||||
| Net investment income (loss) | (1.05 | )% | (0.74 | )% | (0.99 | )% | (1.25 | )% | 0.65 | % | ||||||||||
| Portfolio turnover rate | 331 | % | 400 | % | 227 | % | 271 | % | 288 | % | ||||||||||
| (A) | The net investment income (loss) per share is based on average shares outstanding for the period. |
| (B) | Total returns shown exclude the effect of applicable sales loads. If these charges were included, the returns would be lower. |
| (C) | The ratio of net expenses to average net assets excluding dividend and interest expense on securities sold short is 1.68%, 1.68%, 1.60%, 1.57% and 1.64% for the years ended September 30, 2017, 2016, 2015, 2014 and 2013, respectively. |
| (D) | The ratio of gross expenses to average net assets excluding dividend and interest expense on securities sold short is 1.76%, 1.71%, 1.60%, 1.57% and 1.64% for the years ended September 30, 2017, 2016, 2015, 2014 and 2013, respectively. |
See accompanying Notes to Financial Statements.
| 143 |
Financial Highlights (Continued)
| Touchstone Merger Arbitrage Fund—Class C |
| Selected Data for a Share Outstanding Throughout Each Period |
| Year Ended September 30, | ||||||||||||||||||||
| 2017 | 2016 | 2015 | 2014 | 2013 | ||||||||||||||||
| Net asset value at beginning of period | $ | 10.60 | $ | 10.22 | $ | 10.26 | $ | 10.85 | $ | 10.54 | ||||||||||
| Income (loss) from investment operations: | ||||||||||||||||||||
| Net investment loss(A) | (0.19 | ) | (0.16 | ) | (0.18 | ) | (0.22 | ) | (0.01 | ) | ||||||||||
| Net realized and unrealized gains (losses) on investments | 0.41 | 0.54 | 0.19 | (0.04 | ) | 0.43 | ||||||||||||||
| Total from investment operations | 0.22 | 0.38 | 0.01 | (0.26 | ) | 0.42 | ||||||||||||||
| Distributions from: | ||||||||||||||||||||
| Net investment income | — | — | — | — | — | |||||||||||||||
| Realized capital gains | (0.32 | ) | — | (0.05 | ) | (0.33 | ) | (0.11 | ) | |||||||||||
| Total distributions | (0.32 | ) | — | (0.05 | ) | (0.33 | ) | (0.11 | ) | |||||||||||
| Net asset value at end of period | $ | 10.50 | $ | 10.60 | $ | 10.22 | $ | 10.26 | $ | 10.85 | ||||||||||
| Total return(B) | 2.26 | % | 3.62 | % | 0.06 | % | (2.51 | )% | 3.93 | % | ||||||||||
| Ratios and supplemental data: | ||||||||||||||||||||
| Net assets at end of period (000's) | $ | 11,071 | $ | 14,300 | $ | 18,868 | $ | 35,737 | $ | 50,001 | ||||||||||
| Ratio to average net assets: | ||||||||||||||||||||
| Net expenses (including dividend and interest expense on securities sold short)(C) | 3.31 | % | 3.27 | % | 3.26 | % | 3.32 | % | 3.05 | % | ||||||||||
| Gross expenses (including dividend and interest expense on securities sold short)(D) | 3.40 | % | 3.28 | % | 3.26 | % | 3.32 | % | 3.05 | % | ||||||||||
| Net investment loss | (1.80 | )% | (1.49 | )% | (1.79 | )% | (2.05 | )% | (0.13 | )% | ||||||||||
| Portfolio turnover rate | 331 | % | 400 | % | 227 | % | 271 | % | 288 | % | ||||||||||
| (A) | The net investment loss per share is based on average shares outstanding for the period. |
| (B) | Total returns shown exclude the effect of applicable sales loads. If these charges were included, the returns would be lower. |
| (C) | The ratio of net expenses to average net assets excluding dividend and interest expense on securities sold short is 2.43%, 2.43%, 2.39%, 2.37% and 2.42% for the years ended September 30, 2017, 2016, 2015, 2014 and 2013, respectively. |
| (D) | The ratio of gross expenses to average net assets excluding dividend and interest expense on securities sold short is 2.52%, 2.44%, 2.39%, 2.37% and 2.42% for the years ended September 30, 2017, 2016, 2015, 2014 and 2013, respectively. |
See accompanying Notes to Financial Statements.
| 144 |
Financial Highlights (Continued)
| Touchstone Merger Arbitrage Fund—Class Y |
| Selected Data for a Share Outstanding Throughout Each Period |
| Year Ended September 30, | ||||||||||||||||||||
| 2017 | 2016 | 2015 | 2014 | 2013 | ||||||||||||||||
| Net asset value at beginning of period | $ | 11.13 | $ | 10.62 | $ | 10.55 | $ | 11.10 | $ | 10.68 | ||||||||||
| Income (loss) from investment operations: | ||||||||||||||||||||
| Net investment income (loss)(A) | (0.09 | ) | (0.05 | ) | (0.08 | ) | (0.10 | ) | 0.10 | |||||||||||
| Net realized and unrealized gains (losses) on investments | 0.44 | 0.56 | 0.20 | (0.05 | ) | 0.43 | ||||||||||||||
| Total from investment operations | 0.35 | 0.51 | 0.12 | (0.15 | ) | 0.53 | ||||||||||||||
| Distributions from: | ||||||||||||||||||||
| Net investment income | — | — | — | (0.07 | ) | — | ||||||||||||||
| Realized capital gains | (0.32 | ) | — | (0.05 | ) | (0.33 | ) | (0.11 | ) | |||||||||||
| Total distributions | (0.32 | ) | — | (0.05 | ) | (0.40 | ) | (0.11 | ) | |||||||||||
| Net asset value at end of period | $ | 11.16 | $ | 11.13 | $ | 10.62 | $ | 10.55 | $ | 11.10 | ||||||||||
| Total return | 3.35 | % | 4.71 | % | 1.10 | % | (1.41 | )% | 5.01 | % | ||||||||||
| Ratios and supplemental data: | ||||||||||||||||||||
| Net assets at end of period (000's) | $ | 91,224 | $ | 85,841 | $ | 88,677 | $ | 178,305 | $ | 192,095 | ||||||||||
| Ratio to average net assets: | ||||||||||||||||||||
| Net expenses (including dividend and interest expense on securities sold short)(B) | 2.28 | % | 2.21 | % | 2.20 | % | 2.24 | % | 2.02 | % | ||||||||||
| Gross expenses (including dividend and interest expense on securities sold short)(C) | 2.28 | % | 2.21 | % | 2.20 | % | 2.24 | % | 2.01 | % | ||||||||||
| Net investment income (loss) | (0.77 | )% | (0.43 | )% | (0.73 | )% | (0.97 | )% | 0.90 | % | ||||||||||
| Portfolio turnover rate | 331 | % | 400 | % | 227 | % | 271 | % | 288 | % | ||||||||||
| (A) | The net investment income (loss) per share is based on average shares outstanding for the period. |
| (B) | The ratio of net expenses to average net assets excluding dividend and interest expense on securities sold short is 1.40%, 1.37%, 1.33%, 1.29% and 1.39% for the years ended September 30, 2017, 2016, 2015, 2014 and 2013, respectively. |
| (C) | The ratio of gross expenses to average net assets excluding dividend and interest expense on securities sold short is 1.40%, 1.37%, 1.33%, 1.29%, and 1.38%, for the years ended September 30, 2017, 2016, 2015, 2014 and 2013, respectively. |
See accompanying Notes to Financial Statements.
| 145 |
Financial Highlights (Continued)
| Touchstone Merger Arbitrage Fund—Institutional Class |
| Selected Data for a Share Outstanding Throughout Each Period |
| Year Ended September 30, | ||||||||||||||||||||
| 2017 | 2016 | 2015 | 2014 | 2013 | ||||||||||||||||
| Net asset value at beginning of period | $ | 11.16 | $ | 10.65 | $ | 10.57 | $ | 11.13 | $ | 10.69 | ||||||||||
| Income (loss) from investment operations: | ||||||||||||||||||||
| Net investment income (loss)(A) | (0.07 | ) | (0.04 | ) | (0.07 | ) | (0.10 | ) | 0.11 | |||||||||||
| Net realized and unrealized gains (losses) on investments | 0.44 | 0.55 | 0.20 | (0.05 | ) | 0.44 | ||||||||||||||
| Total from investment operations | 0.37 | 0.51 | 0.13 | (0.15 | ) | 0.55 | ||||||||||||||
| Distributions from: | ||||||||||||||||||||
| Net investment income | — | — | — | (0.08 | ) | — | ||||||||||||||
| Realized capital gains | (0.32 | ) | — | (0.05 | ) | (0.33 | ) | (0.11 | ) | |||||||||||
| Total distributions | (0.32 | ) | — | (0.05 | ) | (0.41 | ) | (0.11 | ) | |||||||||||
| Net asset value at end of period | $ | 11.21 | $ | 11.16 | $ | 10.65 | $ | 10.57 | $ | 11.13 | ||||||||||
| Total return | 3.43 | % | 4.79 | % | 1.19 | % | (1.44 | )% | 5.20 | % | ||||||||||
| Ratios and supplemental data: | ||||||||||||||||||||
| Net assets at end of period (000's) | $ | 98,240 | $ | 76,910 | $ | 82,858 | $ | 119,727 | $ | 170,930 | ||||||||||
| Ratio to average net assets: | ||||||||||||||||||||
| Net expenses (including dividend and interest expense on securities sold short)(B) | 2.16 | % | 2.12 | % | 2.13 | % | 2.21 | % | 1.91 | % | ||||||||||
| Gross expenses (including dividend and interest expense on securities sold short)(C) | 2.18 | % | 2.12 | % | 2.13 | % | 2.20 | % | 1.92 | % | ||||||||||
| Net investment income (loss) | (0.65 | )% | (0.34 | )% | (0.66 | )% | (0.94 | )% | 1.01 | % | ||||||||||
| Portfolio turnover rate | 331 | % | 400 | % | 227 | % | 271 | % | 288 | % | ||||||||||
| (A) | The net investment income (loss) per share is based on average shares outstanding for the period. |
| (B) | The ratio of net expenses to average net assets excluding dividend and interest expense on securities sold short is 1.28%, 1.28%, 1.26%, 1.26% and 1.28% for the years ended September 30, 2017, 2016, 2015, 2014 and 2013, respectively. |
| (C) | The ratio of gross expenses to average net assets excluding dividend and interest expense on securities sold short is 1.30%, 1.28%, 1.26%, 1.25% and 1.29% for the years ended September 30, 2017, 2016, 2015, 2014 and 2013, respectively. |
See accompanying Notes to Financial Statements.
| 146 |
Financial Highlights (Continued)
| Touchstone Mid Cap Fund—Class A |
| Selected Data for a Share Outstanding Throughout Each Period |
| Year Ended September 30, | ||||||||||||||||||||
| 2017 | 2016 | 2015 | 2014 | 2013 | ||||||||||||||||
| Net asset value at beginning of period | $ | 25.91 | $ | 23.22 | $ | 23.68 | $ | 20.87 | $ | 16.55 | ||||||||||
| Income (loss) from investment operations: | ||||||||||||||||||||
| Net investment income (loss) | (0.02 | )(A) | 0.12 | (0.02 | )(A) | — | (B) | 0.12 | (A) | |||||||||||
| Net realized and unrealized gains (losses) on investments | 4.69 | 2.57 | (0.44 | ) | 2.83 | 4.51 | ||||||||||||||
| Total from investment operations | 4.67 | 2.69 | (0.46 | ) | 2.83 | 4.63 | ||||||||||||||
| Distributions from: | ||||||||||||||||||||
| Net investment income | (0.08 | ) | — | — | (0.02 | ) | (0.31 | ) | ||||||||||||
| Net asset value at end of period | $ | 30.50 | $ | 25.91 | $ | 23.22 | $ | 23.68 | $ | 20.87 | ||||||||||
| Total return(C) | 18.08 | % | 11.58 | % | (1.94 | )% | 13.57 | % | 28.43 | % | ||||||||||
| Ratios and supplemental data: | ||||||||||||||||||||
| Net assets at end of period (000's) | $ | 34,761 | $ | 53,044 | $ | 62,717 | $ | 35,513 | $ | 43,611 | ||||||||||
| Ratio to average net assets: | ||||||||||||||||||||
| Net expenses | 1.24 | % | 1.24 | % | 1.24 | % | 1.23 | % | 1.21 | % | ||||||||||
| Gross expenses | 1.36 | % | 1.35 | % | 1.35 | % | 1.40 | % | 1.50 | % | ||||||||||
| Net investment income (loss) | (0.09 | )% | 0.43 | % | (0.07 | )% | 0.01 | % | 0.61 | % | ||||||||||
| Portfolio turnover rate | 19 | % | 19 | % | 17 | % | 26 | % | 20 | % | ||||||||||
| Touchstone Mid Cap Fund—Class C |
| Selected Data for a Share Outstanding Throughout Each Period |
| Year Ended September 30, | ||||||||||||||||||||
| 2017 | 2016 | 2015 | 2014 | 2013 | ||||||||||||||||
| Net asset value at beginning of period | $ | 24.76 | $ | 22.35 | $ | 22.97 | $ | 20.37 | $ | 16.21 | ||||||||||
| Income (loss) from investment operations: | ||||||||||||||||||||
| Net investment loss | (0.22 | )(A) | (0.12 | ) | (0.20 | )(A) | (0.15 | ) | (0.03 | )(A) | ||||||||||
| Net realized and unrealized gains (losses) on investments | 4.48 | 2.53 | (0.42 | ) | 2.75 | 4.42 | ||||||||||||||
| Total from investment operations | 4.26 | 2.41 | (0.62 | ) | 2.60 | 4.39 | ||||||||||||||
| Distributions from: | ||||||||||||||||||||
| Net investment income | — | — | — | — | (0.23 | ) | ||||||||||||||
| Net asset value at end of period | $ | 29.02 | $ | 24.76 | $ | 22.35 | $ | 22.97 | $ | 20.37 | ||||||||||
| Total return(C) | 17.21 | % | 10.78 | % | (2.70 | )% | 12.76 | % | 27.43 | % | ||||||||||
| Ratios and supplemental data: | ||||||||||||||||||||
| Net assets at end of period (000's) | $ | 57,224 | $ | 59,431 | $ | 60,815 | $ | 41,433 | $ | 25,018 | ||||||||||
| Ratio to average net assets: | ||||||||||||||||||||
| Net expenses | 1.99 | % | 1.99 | % | 1.99 | % | 1.98 | % | 1.96 | % | ||||||||||
| Gross expenses | 2.11 | % | 2.13 | % | 2.12 | % | 2.16 | % | 2.37 | % | ||||||||||
| Net investment loss | (0.84 | )% | (0.32 | )% | (0.82 | )% | (0.75 | )% | (0.14 | )% | ||||||||||
| Portfolio turnover rate | 19 | % | 19 | % | 17 | % | 26 | % | 20 | % | ||||||||||
| (A) | The net investment income (loss) per share is based on average shares outstanding for the period. |
| (B) | Less than $0.005 per share. |
| (C) | Total returns shown exclude the effect of applicable sales loads. If these charges were included, the returns would be lower. |
See accompanying Notes to Financial Statements.
| 147 |
Financial Highlights (Continued)
| Touchstone Mid Cap Fund—Class Y |
| Selected Data for a Share Outstanding Throughout Each Period |
| Year Ended September 30, | ||||||||||||||||||||
| 2017 | 2016 | 2015 | 2014 | 2013 | ||||||||||||||||
| Net asset value at beginning of period | $ | 26.14 | $ | 23.38 | $ | 23.83 | $ | 20.98 | $ | 16.60 | ||||||||||
| Income (loss) from investment operations: | ||||||||||||||||||||
| Net investment income | 0.05 | (A) | 0.18 | 0.05 | (A) | 0.06 | 0.17 | (A) | ||||||||||||
| Net realized and unrealized gains (losses) on investments | 4.74 | 2.59 | (0.45 | ) | 2.84 | 4.53 | ||||||||||||||
| Total from investment operations | 4.79 | 2.77 | (0.40 | ) | 2.90 | 4.70 | ||||||||||||||
| Distributions from: | ||||||||||||||||||||
| Net investment income | (0.16 | ) | (0.01 | ) | (0.05 | ) | (0.05 | ) | (0.32 | ) | ||||||||||
| Net asset value at end of period | $ | 30.77 | $ | 26.14 | $ | 23.38 | $ | 23.83 | $ | 20.98 | ||||||||||
| Total return | 18.40 | % | 11.87 | % | (1.69 | )% | 13.83 | % | 28.78 | % | ||||||||||
| Ratios and supplemental data: | ||||||||||||||||||||
| Net assets at end of period (000's) | $ | 551,794 | $ | 476,831 | �� | $ | 481,735 | $ | 266,446 | $ | 181,276 | |||||||||
| Ratio to average net assets: | ||||||||||||||||||||
| Net expenses | 0.99 | % | 0.99 | % | 0.99 | % | 0.98 | % | 0.95 | % | ||||||||||
| Gross expenses | 1.08 | % | 1.07 | % | 1.11 | % | 1.06 | % | 1.09 | % | ||||||||||
| Net investment income | 0.16 | % | 0.68 | % | 0.18 | % | 0.26 | % | 0.87 | % | ||||||||||
| Portfolio turnover rate | 19 | % | 19 | % | 17 | % | 26 | % | 20 | % | ||||||||||
| Touchstone Mid Cap Fund—Class Z |
| Selected Data for a Share Outstanding Throughout Each Period |
| Year Ended September 30, | ||||||||||||||||||||
| 2017 | 2016 | 2015 | 2014 | 2013 | ||||||||||||||||
| Net asset value at beginning of period | $ | 25.75 | $ | 23.08 | $ | 23.54 | $ | 20.73 | $ | 16.45 | ||||||||||
| Income (loss) from investment operations: | ||||||||||||||||||||
| Net investment income (loss) | (0.02 | )(A) | 0.12 | (0.02 | )(A) | 0.01 | 0.12 | (A) | ||||||||||||
| Net realized and unrealized gains (losses) on investments | 4.67 | 2.55 | (0.44 | ) | 2.81 | 4.48 | ||||||||||||||
| Total from investment operations | 4.65 | 2.67 | (0.46 | ) | 2.82 | 4.60 | ||||||||||||||
| Distributions from: | ||||||||||||||||||||
| Net investment income | (0.08 | ) | (— | )(B) | — | (0.01 | ) | (0.32 | ) | |||||||||||
| Net asset value at end of period | $ | 30.32 | $ | 25.75 | $ | 23.08 | $ | 23.54 | $ | 20.73 | ||||||||||
| Total return | 18.08 | % | 11.58 | % | (1.95 | )% | 13.58 | % | 28.45 | % | ||||||||||
| Ratios and supplemental data: | ||||||||||||||||||||
| Net assets at end of period (000's) | $ | 19,312 | $ | 18,934 | $ | 18,693 | $ | 11,593 | $ | 12,858 | ||||||||||
| Ratio to average net assets: | ||||||||||||||||||||
| Net expenses | 1.24 | % | 1.24 | % | 1.24 | % | 1.23 | % | 1.21 | % | ||||||||||
| Gross expenses | 1.44 | % | 1.46 | % | 1.44 | % | 1.55 | % | 1.55 | % | ||||||||||
| Net investment income (loss) | (0.09 | )% | 0.43 | % | (0.07 | )% | 0.01 | % | 0.61 | % | ||||||||||
| Portfolio turnover rate | 19 | % | 19 | % | 17 | % | 26 | % | 20 | % | ||||||||||
| (A) | The net investment income (loss) per share is based on average shares outstanding for the period. |
| (B) | Less than $0.005 per share. |
See accompanying Notes to Financial Statements.
| 148 |
Financial Highlights (Continued)
| Touchstone Mid Cap Fund—Institutional Class |
| Selected Data for a Share Outstanding Throughout Each Period |
| Year Ended September 30, | ||||||||||||||||||||
| 2017 | 2016 | 2015 | 2014 | 2013 | ||||||||||||||||
| Net asset value at beginning of period | $ | 26.18 | $ | 23.40 | $ | 23.85 | $ | 20.99 | $ | 16.61 | ||||||||||
| Income (loss) from investment operations: | ||||||||||||||||||||
| Net investment income | 0.07 | (A) | 0.19 | 0.06 | (A) | 0.08 | 0.19 | (A) | ||||||||||||
| Net realized and unrealized gains (losses) on investments | 4.74 | 2.61 | (0.44 | ) | 2.84 | 4.52 | ||||||||||||||
| Total from investment operations | 4.81 | 2.80 | (0.38 | ) | 2.92 | 4.71 | ||||||||||||||
| Distributions from: | ||||||||||||||||||||
| Net investment income | (0.18 | ) | (0.02 | ) | (0.07 | ) | (0.06 | ) | (0.33 | ) | ||||||||||
| Net asset value at end of period | $ | 30.81 | $ | 26.18 | $ | 23.40 | $ | 23.85 | $ | 20.99 | ||||||||||
| Total return | 18.50 | % | 11.92 | % | (1.62 | )% | 13.91 | % | 28.85 | % | ||||||||||
| Ratios and supplemental data: | ||||||||||||||||||||
| Net assets at end of period (000's) | $ | 113,867 | $ | 77,775 | $ | 76,324 | $ | 90,998 | $ | 74,170 | ||||||||||
| Ratio to average net assets: | ||||||||||||||||||||
| Net expenses | 0.92 | % | 0.92 | % | 0.92 | % | 0.91 | % | 0.89 | % | ||||||||||
| Gross expenses | 0.98 | % | 0.99 | % | 1.00 | % | 1.01 | % | 1.07 | % | ||||||||||
| Net investment income | 0.23 | % | 0.75 | % | 0.25 | % | 0.33 | % | 0.93 | % | ||||||||||
| Portfolio turnover rate | 19 | % | 19 | % | 17 | % | 26 | % | 20 | % | ||||||||||
(A) The net investment income per share is based on average shares outstanding for the period.
See accompanying Notes to Financial Statements.
| 149 |
Financial Highlights (Continued)
| Touchstone Mid Cap Value Fund—Class A |
| Selected Data for a Share Outstanding Throughout Each Period |
| Year Ended September 30, | ||||||||||||||||||||
| 2017 | 2016 | 2015 | 2014 | 2013 | ||||||||||||||||
| Net asset value at beginning of period | $ | 17.49 | $ | 15.70 | $ | 16.60 | $ | 16.09 | $ | 12.98 | ||||||||||
| Income (loss) from investment operations: | ||||||||||||||||||||
| Net investment income | 0.04 | 0.09 | (A) | 0.12 | 0.05 | 0.10 | ||||||||||||||
| Net realized and unrealized gains (losses) on investments | 2.47 | 2.76 | (0.28 | ) | 1.85 | 3.26 | ||||||||||||||
| Total from investment operations | 2.51 | 2.85 | (0.16 | ) | 1.90 | 3.36 | ||||||||||||||
| Distributions from: | ||||||||||||||||||||
| Net investment income | (0.03 | ) | (0.10 | ) | (0.10 | ) | (0.05 | ) | (0.10 | ) | ||||||||||
| Realized capital gains | (0.61 | ) | (0.96 | ) | (0.64 | ) | (1.34 | ) | (0.15 | ) | ||||||||||
| Total distributions | (0.64 | ) | (1.06 | ) | (0.74 | ) | (1.39 | ) | (0.25 | ) | ||||||||||
| Net asset value at end of period | $ | 19.36 | $ | 17.49 | $ | 15.70 | $ | 16.60 | $ | 16.09 | ||||||||||
| Total return(B) | 14.62 | % | 19.20 | % | (1.14 | )% | 12.49 | % | 26.26 | % | ||||||||||
| Ratios and supplemental data: | ||||||||||||||||||||
| Net assets at end of period (000's) | $ | 21,001 | $ | 21,867 | $ | 7,663 | $ | 14,029 | $ | 5,307 | ||||||||||
| Ratio to average net assets: | ||||||||||||||||||||
| Net expenses | 1.27 | % | 1.27 | % | 1.29 | % | 1.29 | % | 1.29 | % | ||||||||||
| Gross expenses | 1.47 | % | 1.59 | % | 1.66 | % | 1.58 | % | 1.75 | % | ||||||||||
| Net investment income | 0.19 | % | 0.56 | % | 0.55 | % | 0.41 | % | 0.73 | % | ||||||||||
| Portfolio turnover rate | 43 | % | 45 | % | 54 | % | 85 | %(C) | 68 | % | ||||||||||
| Touchstone Mid Cap Value Fund—Class C |
| Selected Data for a Share Outstanding Throughout Each Period |
| Year Ended September 30, | ||||||||||||||||||||
| 2017 | 2016 | 2015 | 2014 | 2013 | ||||||||||||||||
| Net asset value at beginning of period | $ | 17.23 | $ | 15.49 | $ | 16.42 | $ | 16.00 | $ | 12.92 | ||||||||||
| Income (loss) from investment operations: | ||||||||||||||||||||
| Net investment loss | (0.06 | ) | (0.03 | )(A) | (0.04 | ) | (0.04 | ) | (— | )(D) | ||||||||||
| Net realized and unrealized gains (losses) on investments | 2.38 | 2.73 | (0.25 | ) | 1.80 | 3.24 | ||||||||||||||
| Total from investment operations | 2.32 | 2.70 | (0.29 | ) | 1.76 | 3.24 | ||||||||||||||
| Distributions from: | ||||||||||||||||||||
| Net investment income | — | — | — | — | (0.01 | ) | ||||||||||||||
| Realized capital gains | (0.61 | ) | (0.96 | ) | (0.64 | ) | (1.34 | ) | (0.15 | ) | ||||||||||
| Total distributions | (0.61 | ) | (0.96 | ) | (0.64 | ) | (1.34 | ) | (0.16 | ) | ||||||||||
| Net asset value at end of period | $ | 18.94 | $ | 17.23 | $ | 15.49 | $ | 16.42 | $ | 16.00 | ||||||||||
| Total return(B) | 13.78 | % | 18.32 | % | (1.91 | )% | 11.62 | % | 25.32 | % | ||||||||||
| Ratios and supplemental data: | ||||||||||||||||||||
| Net assets at end of period (000's) | $ | 10,758 | $ | 4,088 | $ | 1,752 | $ | 2,002 | $ | 719 | ||||||||||
| Ratio to average net assets: | ||||||||||||||||||||
| Net expenses | 2.02 | % | 2.02 | % | 2.04 | % | 2.04 | % | 2.04 | % | ||||||||||
| Gross expenses | 2.33 | % | 2.75 | % | 2.83 | % | 3.05 | % | 4.17 | % | ||||||||||
| Net investment loss | (0.56 | )% | (0.19 | )% | (0.20 | )% | (0.34 | )% | (0.02 | )% | ||||||||||
| Portfolio turnover rate | 43 | % | 45 | % | 54 | % | 85 | %(C) | 68 | % | ||||||||||
| (A) | The net investment income (loss) per share is based on average shares outstanding for the period. |
| (B) | Total returns shown exclude the effect of applicable sales loads. If these charges were included, the returns would be lower. |
| (C) | Portfolio turnover excludes the purchases and sales of the Touchstone Mid Cap Value Opportunities Fund acquired on March 21, 2014. If these transactions were included, portfolio turnover would have been higher. |
| (D) | Less than $0.005 per share. |
See accompanying Notes to Financial Statements.
| 150 |
Financial Highlights (Continued)
Touchstone Mid Cap Value Fund—Class Y
Selected Data for a Share Outstanding Throughout Each Period
| Year Ended September 30, | ||||||||||||||||||||
| 2017 | 2016 | 2015 | 2014 | 2013 | ||||||||||||||||
| Net asset value at beginning of period | $ | 17.57 | $ | 15.76 | $ | 16.67 | $ | 16.15 | $ | 13.03 | ||||||||||
| Income (loss) from investment operations: | ||||||||||||||||||||
| Net investment income | 0.08 | 0.13 | (A) | 0.14 | 0.07 | 0.15 | ||||||||||||||
| Net realized and unrealized gains (losses) on investments | 2.49 | 2.78 | (0.27 | ) | 1.88 | 3.26 | ||||||||||||||
| Total from investment operations | 2.57 | 2.91 | (0.13 | ) | 1.95 | 3.41 | ||||||||||||||
| Distributions from: | ||||||||||||||||||||
| Net investment income | (0.08 | ) | (0.14 | ) | (0.14 | ) | (0.09 | ) | (0.14 | ) | ||||||||||
| Realized capital gains | (0.61 | ) | (0.96 | ) | (0.64 | ) | (1.34 | ) | (0.15 | ) | ||||||||||
| Total distributions | (0.69 | ) | (1.10 | ) | (0.78 | ) | (1.43 | ) | (0.29 | ) | ||||||||||
| Net asset value at end of period | $ | 19.45 | $ | 17.57 | $ | 15.76 | $ | 16.67 | $ | 16.15 | ||||||||||
| Total return | 14.91 | % | 19.51 | % | (0.91 | %) | 12.77 | % | 26.53 | % | ||||||||||
| Ratios and supplemental data: | ||||||||||||||||||||
| Net assets at end of period (000's) | $ | 322,979 | $ | 292,978 | $ | 208,525 | $ | 213,404 | $ | 15,782 | ||||||||||
| Ratio to average net assets: | ||||||||||||||||||||
| Net expenses | 1.02 | % | 1.03 | % | 1.04 | % | 1.04 | % | 1.04 | % | ||||||||||
| Gross expenses | 1.10 | % | 1.13 | % | 1.13 | % | 1.14 | % | 1.37 | % | ||||||||||
| Net investment income | 0.43 | % | 0.81 | % | 0.81 | % | 0.66 | % | 0.98 | % | ||||||||||
| Portfolio turnover rate | 43 | % | 45 | % | 54 | % | 85 | %(B) | 68 | % | ||||||||||
Touchstone Mid Cap Value Fund—Institutional Class
Selected Data for a Share Outstanding Throughout Each Period
| Year Ended September 30, | ||||||||||||||||||||
| 2017 | 2016 | 2015 | 2014 | 2013 | ||||||||||||||||
| Net asset value at beginning of period | $ | 17.64 | $ | 15.82 | $ | 16.73 | $ | 16.20 | $ | 13.07 | ||||||||||
| Income (loss) from investment operations: | ||||||||||||||||||||
| Net investment income | 0.09 | 0.16 | (A) | 0.17 | 0.13 | 0.16 | ||||||||||||||
| Net realized and unrealized gains (losses) on investments | 2.52 | 2.78 | (0.27 | ) | 1.85 | 3.28 | ||||||||||||||
| Total from investment operations | 2.61 | 2.94 | (0.10 | ) | 1.98 | 3.44 | ||||||||||||||
| Distributions from: | ||||||||||||||||||||
| Net investment income | (0.10 | ) | (0.16 | ) | (0.17 | ) | (0.11 | ) | (0.16 | ) | ||||||||||
| Realized capital gains | (0.61 | ) | (0.96 | ) | (0.64 | ) | (1.34 | ) | (0.15 | ) | ||||||||||
| Total distributions | (0.71 | ) | (1.12 | ) | (0.81 | ) | (1.45 | ) | (0.31 | ) | ||||||||||
| Net asset value at end of period | $ | 19.54 | $ | 17.64 | $ | 15.82 | $ | 16.73 | $ | 16.20 | ||||||||||
| Total return | 15.04 | % | 19.71 | % | (0.76 | %) | 12.90 | % | 26.71 | % | ||||||||||
| Ratios and supplemental data: | ||||||||||||||||||||
| Net assets at end of period (000's) | $ | 334,083 | $ | 185,989 | $ | 124,592 | $ | 134,259 | $ | 144,965 | ||||||||||
| Ratio to average net assets: | ||||||||||||||||||||
| Net expenses | 0.89 | % | 0.89 | % | 0.89 | % | 0.89 | % | 0.89 | % | ||||||||||
| Gross expenses | 1.01 | % | 1.03 | % | 1.03 | % | 1.04 | % | 1.09 | % | ||||||||||
| Net investment income | 0.57 | % | 0.94 | % | 0.96 | % | 0.81 | % | 1.13 | % | ||||||||||
| Portfolio turnover rate | 43 | % | 45 | % | 54 | % | 85 | %(B) | 68 | % | ||||||||||
| (A) | The net investment income per share is based on average shares outstanding for the period. |
| (B) | Portfolio turnover excludes the purchases and sales of the Touchstone Mid Cap Value Opportunities Fund acquired on March 21, 2014. If these transactions were included, portfolio turnover would have been higher. |
See accompanying Notes to Financial Statements.
| 151 |
Financial Highlights (Continued)
Touchstone Premium Yield Equity Fund—Class A
Selected Data for a Share Outstanding Throughout Each Period
| Year Ended September 30, | ||||||||||||||||||||
| 2017 | 2016 | 2015 | 2014 | 2013 | ||||||||||||||||
| Net asset value at beginning of period | $ | 8.77 | $ | 8.27 | $ | 9.98 | $ | 8.92 | $ | 8.11 | ||||||||||
| Income (loss) from investment operations: | ||||||||||||||||||||
| Net investment income | 0.25 | 0.22 | 0.24 | 0.40 | (A) | 0.24 | ||||||||||||||
| Net realized and unrealized gains (losses) on investments | 0.62 | 1.04 | (1.25 | ) | 1.07 | 0.80 | ||||||||||||||
| Total from investment operations | 0.87 | 1.26 | (1.01 | ) | 1.47 | 1.04 | ||||||||||||||
| Distributions from: | ||||||||||||||||||||
| Net investment income | (0.24 | ) | (0.21 | ) | (0.25 | ) | (0.41 | ) | (0.23 | ) | ||||||||||
| Realized capital gains | — | (0.55 | ) | (0.45 | ) | — | — | |||||||||||||
| Total distributions | (0.24 | ) | (0.76 | ) | (0.70 | ) | (0.41 | ) | (0.23 | ) | ||||||||||
| Net asset value at end of period | $ | 9.40 | $ | 8.77 | $ | 8.27 | $ | 9.98 | $ | 8.92 | ||||||||||
| Total return(B) | 10.10 | % | 16.80 | % | (10.79 | %) | 16.79 | % | 12.97 | % | ||||||||||
| Ratios and supplemental data: | ||||||||||||||||||||
| Net assets at end of period (000's) | $ | 22,725 | $ | 26,907 | $ | 36,023 | $ | 45,124 | $ | 86,171 | ||||||||||
| Ratio to average net assets: | ||||||||||||||||||||
| Net expenses | 1.20 | % | 1.20 | % | 1.20 | % | 1.20 | % | 1.20 | % | ||||||||||
| Gross expenses | 1.36 | % | 1.34 | % | 1.25 | % | 1.29 | % | 1.29 | % | ||||||||||
| Net investment income | 2.69 | % | 2.57 | % | 2.57 | % | 4.24 | %(A) | 2.74 | % | ||||||||||
| Portfolio turnover rate | 39 | % | 38 | % | 31 | % | 26 | % | 56 | % | ||||||||||
Touchstone Premium Yield Equity Fund—Class C
Selected Data for a Share Outstanding Throughout Each Period
| Year Ended September 30, | ||||||||||||||||||||
| 2017 | 2016 | 2015 | 2014 | 2013 | ||||||||||||||||
| Net asset value at beginning of period | $ | 8.75 | $ | 8.26 | $ | 9.97 | $ | 8.90 | $ | 8.10 | ||||||||||
| Income (loss) from investment operations: | ||||||||||||||||||||
| Net investment income | 0.17 | 0.15 | 0.17 | 0.33 | (A) | 0.16 | ||||||||||||||
| Net realized and unrealized gains (losses) on investments | 0.64 | 1.04 | (1.24 | ) | 1.07 | 0.80 | ||||||||||||||
| Total from investment operations | 0.81 | 1.19 | (1.07 | ) | 1.40 | 0.96 | ||||||||||||||
| Distributions from: | ||||||||||||||||||||
| Net investment income | (0.17 | ) | (0.15 | ) | (0.19 | ) | (0.33 | ) | (0.16 | ) | ||||||||||
| Realized capital gains | — | (0.55 | ) | (0.45 | ) | — | — | |||||||||||||
| Total distributions | (0.17 | ) | (0.70 | ) | (0.64 | ) | (0.33 | ) | (0.16 | ) | ||||||||||
| Net asset value at end of period | $ | 9.39 | $ | 8.75 | $ | 8.26 | $ | 9.97 | $ | 8.90 | ||||||||||
| Total return(B) | 9.42 | % | 15.81 | % | (11.45 | %) | 15.99 | % | 12.03 | % | ||||||||||
| Ratios and supplemental data: | ||||||||||||||||||||
| Net assets at end of period (000's) | $ | 22,324 | $ | 25,781 | $ | 31,405 | $ | 31,190 | $ | 24,009 | ||||||||||
| Ratio to average net assets: | ||||||||||||||||||||
| Net expenses | 1.95 | % | 1.95 | % | 1.95 | % | 1.95 | % | 1.95 | % | ||||||||||
| Gross expenses | 2.05 | % | 2.05 | % | 2.00 | % | 2.02 | % | 2.08 | % | ||||||||||
| Net investment income | 1.94 | % | 1.82 | % | 1.82 | % | 3.49 | %(A) | 1.99 | % | ||||||||||
| Portfolio turnover rate | 39 | % | 38 | % | 31 | % | 26 | % | 56 | % | ||||||||||
| (A) | Reflects the impact of a corporate action event that resulted in a one-time increase to net investment income. If the corporate action event had not occurred, the Class A and Class C net investment income per share and ratio of net investment income to average net assets would have been lower by $0.16 and 1.70%, respectively. |
| (B) | Total returns shown exclude the effect of applicable sales loads. If these charges were included, the returns would be lower. |
See accompanying Notes to Financial Statements.
| 152 |
Financial Highlights (Continued)
Touchstone Premium Yield Equity Fund—Class Y
Selected Data for a Share Outstanding Throughout Each Period
| Year Ended September 30, | ||||||||||||||||||||
| 2017 | 2016 | 2015 | 2014 | 2013 | ||||||||||||||||
| Net asset value at beginning of period | $ | 8.75 | $ | 8.25 | $ | 9.97 | $ | 8.90 | $ | 8.10 | ||||||||||
| Income (loss) from investment operations: | ||||||||||||||||||||
| Net investment income | 0.26 | 0.23 | 0.26 | 0.43 | (A) | 0.25 | ||||||||||||||
| Net realized and unrealized gains (losses) on investments | 0.63 | 1.05 | (1.25 | ) | 1.07 | 0.80 | ||||||||||||||
| Total from investment operations | 0.89 | 1.28 | (0.99 | ) | 1.50 | 1.05 | ||||||||||||||
| Distributions from: | ||||||||||||||||||||
| Net investment income | (0.26 | ) | (0.23 | ) | (0.28 | ) | (0.43 | ) | (0.25 | ) | ||||||||||
| Realized capital gains | — | (0.55 | ) | (0.45 | ) | — | — | |||||||||||||
| Total distributions | (0.26 | ) | (0.78 | ) | (0.73 | ) | (0.43 | ) | (0.25 | ) | ||||||||||
| Net asset value at end of period | $ | 9.38 | $ | 8.75 | $ | 8.25 | $ | 9.97 | $ | 8.90 | ||||||||||
| Total return | 10.41 | % | 17.13 | % | (10.58 | %) | 17.13 | % | 13.14 | % | ||||||||||
| Ratios and supplemental data: | ||||||||||||||||||||
| Net assets at end of period (000's) | $ | 75,763 | $ | 99,953 | $ | 100,772 | $ | 109,201 | $ | 66,644 | ||||||||||
| Ratio to average net assets: | ||||||||||||||||||||
| Net expenses | 0.95 | % | 0.95 | % | 0.95 | % | 0.95 | % | 0.95 | % | ||||||||||
| Gross expenses | 1.00 | % | 1.03 | % | 0.97 | % | 0.96 | % | 1.04 | % | ||||||||||
| Net investment income | 2.94 | % | 2.82 | % | 2.82 | % | 4.49 | %(A) | 2.99 | % | ||||||||||
| Portfolio turnover rate | 39 | % | 38 | % | 31 | % | 26 | % | 56 | % | ||||||||||
| (A) | Reflects the impact of a corporate action event that resulted in a one-time increase to net investment income. If the corporate action event had not occurred, the Class Y net investment income per share and ratio of net investment income to average net assets would have been lower by $0.16 and 1.70%, respectively. |
See accompanying Notes to Financial Statements.
| 153 |
Financial Highlights (Continued)
Touchstone Sands Capital Select Growth Fund—Class A
Selected Data for a Share Outstanding Throughout Each Period
| Year Ended September 30, | ||||||||||||||||||||
| 2017 | 2016 | 2015 | 2014 | 2013 | ||||||||||||||||
| Net asset value at beginning of period | $ | 16.14 | $ | 16.48 | $ | 18.15 | $ | 16.08 | $ | 12.65 | ||||||||||
| Income (loss) from investment operations: | ||||||||||||||||||||
| Net investment loss | (0.34 | ) | (0.28 | ) | (0.15 | ) | (0.29 | ) | (0.05 | ) | ||||||||||
| Net realized and unrealized gains (losses) on investments | 2.94 | 1.47 | (0.64 | ) | 2.49 | 3.48 | ||||||||||||||
| Total from investment operations | 2.60 | 1.19 | (0.79 | ) | 2.20 | 3.43 | ||||||||||||||
| Distributions from: | ||||||||||||||||||||
| Realized capital gains | (2.16 | ) | (1.53 | ) | (0.88 | ) | (0.13 | ) | — | |||||||||||
| Net asset value at end of period | $ | 16.58 | $ | 16.14 | $ | 16.48 | $ | 18.15 | $ | 16.08 | ||||||||||
| Total return(A) | 19.63 | % | 7.17 | % | (4.70 | %) | 13.73 | % | 27.11 | % | ||||||||||
| Ratios and supplemental data: | ||||||||||||||||||||
| Net assets at end of period (000's) | $ | 89,860 | $ | 138,315 | $ | 230,783 | $ | 289,506 | $ | 416,396 | ||||||||||
| Ratio to average net assets: | ||||||||||||||||||||
| Net expenses | 1.23 | % | 1.07 | % | 1.10 | % | 1.31 | % | 1.28 | % | ||||||||||
| Gross expenses | 1.25 | % | 1.09 | % | 1.10 | % | 1.33 | % | 1.37 | % | ||||||||||
| Net investment loss | (0.95 | %) | (0.81 | %) | (0.65 | %) | (0.91 | %) | (0.62 | %) | ||||||||||
| Portfolio turnover rate | 22 | % | 46 | % | 29 | % | 30 | % | 37 | % | ||||||||||
Touchstone Sands Capital Select Growth Fund—Class C
Selected Data for a Share Outstanding Throughout Each Period
| Year Ended September 30, | ||||||||||||||||||||
| 2017 | 2016 | 2015 | 2014 | 2013 | ||||||||||||||||
| Net asset value at beginning of period | $ | 15.36 | $ | 15.86 | $ | 17.62 | $ | 15.74 | $ | 12.47 | ||||||||||
| Income (loss) from investment operations: | ||||||||||||||||||||
| Net investment loss | (0.79 | ) | (0.52 | ) | (0.30 | ) | (0.32 | ) | (0.13 | ) | ||||||||||
| Net realized and unrealized gains (losses) on investments | 3.10 | 1.55 | (0.58 | ) | 2.33 | 3.40 | ||||||||||||||
| Total from investment operations | 2.31 | 1.03 | (0.88 | ) | 2.01 | 3.27 | ||||||||||||||
| Distributions from: | ||||||||||||||||||||
| Realized capital gains | (2.16 | ) | (1.53 | ) | (0.88 | ) | (0.13 | ) | — | |||||||||||
| Net asset value at end of period | $ | 15.51 | $ | 15.36 | $ | 15.86 | $ | 17.62 | $ | 15.74 | ||||||||||
| Total return(A) | 18.77 | % | 6.32 | % | (5.38 | %) | 12.89 | % | 26.14 | % | ||||||||||
| Ratios and supplemental data: | ||||||||||||||||||||
| Net assets at end of period (000's) | $ | 73,516 | $ | 111,951 | $ | 163,237 | $ | 203,865 | $ | 198,584 | ||||||||||
| Ratio to average net assets: | ||||||||||||||||||||
| Net expenses | 1.98 | % | 1.82 | % | 1.85 | % | 2.06 | % | 2.03 | % | ||||||||||
| Gross expenses | 2.01 | % | 1.84 | % | 1.85 | % | 2.09 | % | 2.14 | % | ||||||||||
| Net investment loss | (1.70 | %) | (1.56 | %) | (1.40 | %) | (1.65 | %) | (1.37 | %) | ||||||||||
| Portfolio turnover rate | 22 | % | 46 | % | 29 | % | 30 | % | 37 | % | ||||||||||
| (A) | Total returns shown exclude the effect of applicable sales loads. If these charges were included, the returns would be lower. |
See accompanying Notes to Financial Statements.
| 154 |
Financial Highlights (Continued)
Touchstone Sands Capital Select Growth Fund—Class Y
Selected Data for a Share Outstanding Throughout Each Period
| Year Ended September 30, | ||||||||||||||||||||
| 2017 | 2016 | 2015 | 2014 | 2013 | ||||||||||||||||
| Net asset value at beginning of period | $ | 16.70 | $ | 16.96 | $ | 18.61 | $ | 16.44 | $ | 12.90 | ||||||||||
| Income (loss) from investment operations: | ||||||||||||||||||||
| Net investment loss | (0.10 | ) | (0.11 | ) | (0.08 | ) | (0.10 | ) | (0.02 | ) | ||||||||||
| Net realized and unrealized gains (losses) on investments | 2.85 | 1.38 | (0.69 | ) | 2.40 | 3.56 | ||||||||||||||
| Total from investment operations | 2.75 | 1.27 | (0.77 | ) | 2.30 | 3.54 | ||||||||||||||
| Distributions from: | ||||||||||||||||||||
| Realized capital gains | (2.16 | ) | (1.53 | ) | (0.88 | ) | (0.13 | ) | — | |||||||||||
| Net asset value at end of period | $ | 17.29 | $ | 16.70 | $ | 16.96 | $ | 18.61 | $ | 16.44 | ||||||||||
| Total return | 19.89 | % | 7.46 | % | (4.46 | %) | 14.04 | % | 27.44 | % | ||||||||||
| Ratios and supplemental data: | ||||||||||||||||||||
| Net assets at end of period (000's) | $ | 1,775,755 | $ | 2,209,841 | $ | 3,198,758 | $ | 3,473,661 | $ | 2,684,731 | ||||||||||
| Ratio to average net assets: | ||||||||||||||||||||
| Net expenses | 0.98 | % | 0.82 | % | 0.83 | % | 1.06 | % | 1.03 | % | ||||||||||
| Gross expenses | 0.99 | % | 0.82 | % | 0.83 | % | 1.03 | % | 1.06 | % | ||||||||||
| Net investment loss | (0.70 | %) | (0.56 | %) | (0.39 | %) | (0.66 | %) | (0.37 | %) | ||||||||||
| Portfolio turnover rate | 22 | % | 46 | % | 29 | % | 30 | % | 37 | % | ||||||||||
Touchstone Sands Capital Select Growth Fund—Class Z
Selected Data for a Share Outstanding Throughout Each Period
| Year Ended September 30, | ||||||||||||||||||||
| 2017 | 2016 | 2015 | 2014 | 2013 | ||||||||||||||||
| Net asset value at beginning of period | $ | 16.15 | $ | 16.49 | $ | 18.15 | $ | 16.08 | $ | 12.65 | ||||||||||
| Income (loss) from investment operations: | ||||||||||||||||||||
| Net investment loss | (0.32 | ) | (0.29 | ) | (0.19 | ) | (0.17 | ) | (0.10 | ) | ||||||||||
| Net realized and unrealized gains (losses) on investments | 2.91 | 1.48 | (0.59 | ) | 2.37 | 3.53 | ||||||||||||||
| Total from investment operations | 2.59 | 1.19 | (0.78 | ) | 2.20 | 3.43 | ||||||||||||||
| Distributions from: | ||||||||||||||||||||
| Realized capital gains | (2.16 | ) | (1.53 | ) | (0.88 | ) | (0.13 | ) | — | |||||||||||
| Net asset value at end of period | $ | 16.58 | $ | 16.15 | $ | 16.49 | $ | 18.15 | $ | 16.08 | ||||||||||
| Total return | 19.62 | % | 7.24 | % | (4.70 | %) | 13.73 | % | 27.11 | % | ||||||||||
| Ratios and supplemental data: | ||||||||||||||||||||
| Net assets at end of period (000's) | $ | 556,651 | $ | 777,930 | $ | 1,292,853 | $ | 2,302,038 | $ | 2,140,884 | ||||||||||
| Ratio to average net assets: | ||||||||||||||||||||
| Net expenses | 1.22 | % | 1.04 | % | 1.08 | % | 1.31 | % | 1.28 | % | ||||||||||
| Gross expenses | 1.28 | % | 1.11 | % | 1.13 | % | 1.35 | % | 1.37 | % | ||||||||||
| Net investment loss | (0.94 | %) | (0.79 | %) | (0.64 | %) | (0.90 | %) | (0.62 | %) | ||||||||||
| Portfolio turnover rate | 22 | % | 46 | % | 29 | % | 30 | % | 37 | % | ||||||||||
See accompanying Notes to Financial Statements.
| 155 |
Financial Highlights (Continued)
Touchstone Small Cap Fund—Class A
Selected Data for a Share Outstanding Throughout Each Period
| Year Ended September 30, | ||||||||||||||||||||
| 2017 | 2016 | 2015 | 2014 | 2013 | ||||||||||||||||
| Net asset value at beginning of period | $ | 16.24 | $ | 17.73 | $ | 20.55 | $ | 19.44 | $ | 16.02 | ||||||||||
| Income (loss) from investment operations: | ||||||||||||||||||||
| Net investment income (loss) | 0.02 | — | (A) | 0.15 | (B) | (0.09 | )(C) | 0.44 | ||||||||||||
| Net realized and unrealized gains (losses) on investments | 1.47 | 0.59 | (1.38 | ) | 1.80 | 3.28 | ||||||||||||||
| Total from investment operations | 1.49 | 0.59 | (1.23 | ) | 1.71 | 3.72 | ||||||||||||||
| Distributions from: | ||||||||||||||||||||
| Net investment income | — | (0.13 | ) | (— | )(A) | (0.31 | ) | (0.18 | ) | |||||||||||
| Realized capital gains | — | (1.95 | ) | (1.59 | ) | (0.29 | ) | (0.12 | ) | |||||||||||
| Total distributions | — | (2.08 | ) | (1.59 | ) | (0.60 | ) | (0.30 | ) | |||||||||||
| Net asset value at end of period | $ | 17.73 | $ | 16.24 | $ | 17.73 | $ | 20.55 | $ | 19.44 | ||||||||||
| Total return(D) | 9.17 | % | 3.74 | % | (6.36 | %) | 8.80 | % | 23.60 | % | ||||||||||
| Ratios and supplemental data: | ||||||||||||||||||||
| Net assets at end of period (000's) | $ | 12,461 | $ | 37,942 | $ | 62,423 | $ | 60,246 | $ | 122,394 | ||||||||||
| Ratio to average net assets: | ||||||||||||||||||||
| Net expenses | 1.38 | % | 1.38 | % | 1.38 | % | 1.36 | % | 1.34 | % | ||||||||||
| Gross expenses | 1.52 | % | 1.45 | % | 1.42 | % | 1.43 | % | 1.53 | % | ||||||||||
| Net investment income (loss) | 0.00 | %(A) | 0.00 | %(A) | 0.75 | %(B) | (0.45 | %) | 2.47 | % | ||||||||||
| Portfolio turnover rate | 18 | % | 17 | % | 42 | % | 17 | % | 15 | % | ||||||||||
Touchstone Small Cap Fund—Class C
Selected Data for a Share Outstanding Throughout Each Period
| Year Ended September 30, | ||||||||||||||||||||
| 2017 | 2016 | 2015 | 2014 | 2013 | ||||||||||||||||
| Net asset value at beginning of period | $ | 15.63 | $ | 17.16 | $ | 20.07 | $ | 19.01 | $ | 15.69 | ||||||||||
| Income (loss) from investment operations: | ||||||||||||||||||||
| Net investment income (loss) | (0.31 | ) | (0.16 | ) | — | (A)(B) | (0.24 | )(C) | 0.30 | |||||||||||
| Net realized and unrealized gains (losses) on investments | 1.62 | 0.60 | (1.32 | ) | 1.75 | 3.22 | ||||||||||||||
| Total from investment operations | 1.31 | 0.44 | (1.32 | ) | 1.51 | 3.52 | ||||||||||||||
| Distributions from: | ||||||||||||||||||||
| Net investment income | — | (0.02 | ) | — | (0.16 | ) | (0.08 | ) | ||||||||||||
| Realized capital gains | — | (1.95 | ) | (1.59 | ) | (0.29 | ) | (0.12 | ) | |||||||||||
| Total distributions | — | (1.97 | ) | (1.59 | ) | (0.45 | ) | (0.20 | ) | |||||||||||
| Net asset value at end of period | $ | 16.94 | $ | 15.63 | $ | 17.16 | $ | 20.07 | $ | 19.01 | ||||||||||
| Total return(D) | 8.38 | % | 2.92 | % | (7.01 | %) | 7.96 | % | 22.69 | % | ||||||||||
| Ratios and supplemental data: | ||||||||||||||||||||
| Net assets at end of period (000's) | $ | 9,266 | $ | 14,957 | $ | 21,562 | $ | 27,104 | $ | 28,685 | ||||||||||
| Ratio to average net assets: | ||||||||||||||||||||
| Net expenses | 2.13 | % | 2.13 | % | 2.13 | % | 2.12 | % | 2.09 | % | ||||||||||
| Gross expenses | 2.28 | % | 2.23 | % | 2.17 | % | 2.17 | % | 2.24 | % | ||||||||||
| Net investment income (loss) | (0.75 | %) | (0.75 | %) | 0.00 | %(A)(B) | (1.20 | %) | 1.72 | % | ||||||||||
| Portfolio turnover rate | 18 | % | 17 | % | 42 | % | 17 | % | 15 | % | ||||||||||
| (A) | Less than $0.005 per share or 0.005%. |
| (B) | Reflects the impact of a corporate action event that resulted in a one-time increase to net investment income. If the corporate action event had not occurred, the Class A and Class C net investment income per share and ratio of net investment income to average net assets would have been lower by $0.13 and 0.65%, respectively. |
| (C) | The net investment loss per share is based on average shares outstanding for the period. |
| (D) | Total returns shown exclude the effect of applicable sales loads. If these charges were included, the returns would be lower. |
See accompanying Notes to Financial Statements.
| 156 |
Financial Highlights (Continued)
Touchstone Small Cap Fund—Class Y
Selected Data for a Share Outstanding Throughout Each Period
| Year Ended September 30, | ||||||||||||||||||||
| 2017 | 2016 | 2015 | 2014 | 2013 | ||||||||||||||||
| Net asset value at beginning of period | $ | 16.44 | $ | 17.93 | $ | 20.72 | $ | 19.59 | $ | 16.13 | ||||||||||
| Income (loss) from investment operations: | ||||||||||||||||||||
| Net investment income (loss) | 0.05 | 0.05 | 0.18 | (A) | (0.03 | )(B) | 0.46 | |||||||||||||
| Net realized and unrealized gains (losses) on investments | 1.50 | 0.58 | (1.37 | ) | 1.81 | 3.34 | ||||||||||||||
| Total from investment operations | 1.55 | 0.63 | (1.19 | ) | 1.78 | 3.80 | ||||||||||||||
| Distributions from: | ||||||||||||||||||||
| Net investment income | (0.05 | ) | (0.17 | ) | (0.01 | ) | (0.36 | ) | (0.22 | ) | ||||||||||
| Realized capital gains | — | (1.95 | ) | (1.59 | ) | (0.29 | ) | (0.12 | ) | |||||||||||
| Total distributions | (0.05 | ) | (2.12 | ) | (1.60 | ) | (0.65 | ) | (0.34 | ) | ||||||||||
| Net asset value at end of period | $ | 17.94 | $ | 16.44 | $ | 17.93 | $ | 20.72 | $ | 19.59 | ||||||||||
| Total return | 9.46 | % | 3.97 | % | (6.11 | %) | 9.12 | % | 24.01 | % | ||||||||||
| Ratios and supplemental data: | ||||||||||||||||||||
| Net assets at end of period (000's) | $ | 84,954 | $ | 295,198 | $ | 333,971 | $ | 309,367 | $ | 258,024 | ||||||||||
| Ratio to average net assets: | ||||||||||||||||||||
| Net expenses | 1.13 | % | 1.13 | % | 1.11 | % | 1.06 | % | 1.03 | % | ||||||||||
| Gross expenses | 1.15 | % | 1.14 | % | 1.11 | % | 1.08 | % | 1.14 | % | ||||||||||
| Net investment income (loss) | 0.25 | % | 0.25 | % | 1.02 | %(A) | (0.15 | %) | 2.78 | % | ||||||||||
| Portfolio turnover rate | 18 | % | 17 | % | 42 | % | 17 | % | 15 | % | ||||||||||
Touchstone Small Cap Fund—Institutional Class
Selected Data for a Share Outstanding Throughout Each Period
| Year Ended September 30, | ||||||||||||||||||||
| 2017 | 2016 | 2015 | 2014 | 2013 | ||||||||||||||||
| Net asset value at beginning of period | $ | 16.43 | $ | 17.92 | $ | 20.69 | $ | 19.57 | $ | 16.11 | ||||||||||
| Income (loss) from investment operations: | ||||||||||||||||||||
| Net investment income (loss) | 0.16 | 0.07 | 0.24 | (A) | (0.02 | )(B) | 0.49 | |||||||||||||
| Net realized and unrealized gains (losses) on investments | 1.41 | 0.57 | (1.41 | ) | 1.81 | 3.32 | ||||||||||||||
| Total from investment operations | 1.57 | 0.64 | (1.17 | ) | 1.79 | 3.81 | ||||||||||||||
| Distributions from: | ||||||||||||||||||||
| Net investment income | (0.07 | ) | (0.18 | ) | (0.01 | ) | (0.38 | ) | (0.23 | ) | ||||||||||
| Realized capital gains | — | (1.95 | ) | (1.59 | ) | (0.29 | ) | (0.12 | ) | |||||||||||
| Total distributions | (0.07 | ) | (2.13 | ) | (1.60 | ) | (0.67 | ) | (0.35 | ) | ||||||||||
| Net asset value at end of period | $ | 17.93 | $ | 16.43 | $ | 17.92 | $ | 20.69 | $ | 19.57 | ||||||||||
| Total return | 9.57 | % | 4.05 | % | (6.01 | %) | 9.17 | % | 24.13 | % | ||||||||||
| Ratios and supplemental data: | ||||||||||||||||||||
| Net assets at end of period (000's) | $ | 122,876 | $ | 255,422 | $ | 301,868 | $ | 393,287 | $ | 395,770 | ||||||||||
| Ratio to average net assets: | ||||||||||||||||||||
| Net expenses | 1.05 | % | 1.04 | % | 1.04 | % | 1.01 | % | 0.94 | % | ||||||||||
| Gross expenses | 1.05 | % | 1.04 | % | 1.04 | % | 1.04 | % | 1.07 | % | ||||||||||
| Net investment income (loss) | 0.34 | % | 0.34 | % | 1.10 | %(A) | (0.10 | %) | 2.87 | % | ||||||||||
| Portfolio turnover rate | 18 | % | 17 | % | 42 | % | 17 | % | 15 | % | ||||||||||
| (A) | Reflects the impact of a corporate action event that resulted in a one-time increase to net investment income. If the corporate action event had not occurred, the Class Y and Institutional Class net investment income per share and ratio of net investment income to average net assets would have been lower by $0.13 and 0.65%, respectively. |
| (B) | The net investment loss per share is based on average shares outstanding for the period. |
See accompanying Notes to Financial Statements.
| 157 |
Financial Highlights (Continued)
Touchstone Small Cap Value Fund—Class A
Selected Data for a Share Outstanding Throughout Each Period
| Year Ended September 30, | ||||||||||||||||||||
| 2017 | 2016 | 2015 | 2014 | 2013 | ||||||||||||||||
| Net asset value at beginning of period | $ | 22.20 | $ | 20.17 | $ | 23.23 | $ | 22.79 | $ | 18.33 | ||||||||||
| Income (loss) from investment operations: | ||||||||||||||||||||
| Net investment income | 0.03 | 0.23 | 0.36 | 0.36 | 0.41 | |||||||||||||||
| Net realized and unrealized gains (losses) on investments | 3.85 | 2.80 | (2.15 | ) | 0.39 | 4.45 | ||||||||||||||
| Total from investment operations | 3.88 | 3.03 | (1.79 | ) | 0.75 | 4.86 | ||||||||||||||
| Distributions from: | ||||||||||||||||||||
| Net investment income | (0.02 | ) | (0.27 | ) | (0.35 | ) | (0.31 | ) | (0.40 | ) | ||||||||||
| Realized capital gains | — | (0.73 | ) | (0.92 | ) | — | — | |||||||||||||
| Total distributions | (0.02 | ) | (1.00 | ) | (1.27 | ) | (0.31 | ) | (0.40 | ) | ||||||||||
| Net asset value at end of period | $ | 26.06 | $ | 22.20 | $ | 20.17 | $ | 23.23 | $ | 22.79 | ||||||||||
| Total return(A) | 17.46 | % | 15.63 | % | (8.32 | %) | 3.19 | % | 26.82 | % | ||||||||||
| Ratios and supplemental data: | ||||||||||||||||||||
| Net assets at end of period (000's) | $ | 76,884 | $ | 150,081 | $ | 24,659 | $ | 31,773 | $ | 34,826 | ||||||||||
| Ratio to average net assets: | ||||||||||||||||||||
| Net expenses | 1.38 | % | 1.38 | % | 1.38 | % | 1.43 | % | 1.43 | % | ||||||||||
| Gross expenses | 1.83 | % | 1.67 | % | 1.60 | % | 1.67 | % | 1.78 | % | ||||||||||
| Net investment income | 0.07 | % | 1.05 | % | 1.51 | % | 1.44 | % | 1.98 | % | ||||||||||
| Portfolio turnover rate | 63 | %(B) | 155 | % | 112 | % | 100 | %(C)(D) | 98 | % | ||||||||||
Touchstone Small Cap Value Fund—Class C
Selected Data for a Share Outstanding Throughout Each Period
| Year Ended September 30, | ||||||||||||||||||||
| 2017 | 2016 | 2015 | 2014 | 2013 | ||||||||||||||||
| Net asset value at beginning of period | $ | 21.95 | $ | 19.98 | $ | 23.00 | $ | 22.61 | $ | 18.23 | ||||||||||
| Income (loss) from investment operations: | ||||||||||||||||||||
| Net investment income | (0.22 | ) | 0.06 | 0.17 | 0.16 | 0.29 | ||||||||||||||
| Net realized and unrealized gains (losses) on investments | 3.87 | 2.77 | (2.10 | ) | 0.40 | 4.39 | ||||||||||||||
| Total from investment operations | 3.65 | 2.83 | (1.93 | ) | 0.56 | 4.68 | ||||||||||||||
| Distributions from: | ||||||||||||||||||||
| Net investment income | — | (0.13 | ) | (0.17 | ) | (0.17 | ) | (0.30 | ) | |||||||||||
| Realized capital gains | — | (0.73 | ) | (0.92 | ) | — | — | |||||||||||||
| Total distributions | — | (0.86 | ) | (1.09 | ) | (0.17 | ) | (0.30 | ) | |||||||||||
| Net asset value at end of period | $ | 25.60 | $ | 21.95 | $ | 19.98 | $ | 23.00 | $ | 22.61 | ||||||||||
| Total return(A) | 16.63 | % | 14.72 | % | (9.01 | %) | 2.46 | % | 25.90 | % | ||||||||||
| Ratios and supplemental data: | ||||||||||||||||||||
| Net assets at end of period (000's) | $ | 1,223 | $ | 1,376 | $ | 1,396 | $ | 2,169 | $ | 841 | ||||||||||
| Ratio to average net assets: | ||||||||||||||||||||
| Net expenses | 2.13 | % | 2.13 | % | 2.13 | % | 2.18 | % | 2.18 | % | ||||||||||
| Gross expenses | 3.69 | % | 3.39 | % | 3.13 | % | 3.25 | % | 5.19 | % | ||||||||||
| Net investment income | (0.68 | %) | 0.30 | % | 0.76 | % | 0.69 | % | 1.23 | % | ||||||||||
| Portfolio turnover rate | 63 | %(B) | 155 | % | 112 | % | 100 | %(C)(D) | 98 | % | ||||||||||
| (A) | Total returns shown exclude the effect of applicable sales loads. If these charges were included, the returns would be lower. |
| (B) | Portfolio turnover rate excludes securities delivered from processing a redemption-in-kind. |
| (C) | Portfolio turnover rate excludes securities received from a subscription-in-kind. |
| (D) | Portfolio turnover excludes the purchases and sales of the Touchstone Small Company Value Fund acquired on March 21, 2014. If these transactions were included, portfolio turnover would have been higher. |
See accompanying Notes to Financial Statements.
| 158 |
Financial Highlights (Continued)
Touchstone Small Cap Value Fund—Class Y
Selected Data for a Share Outstanding Throughout Each Period
| Year Ended September 30, | ||||||||||||||||||||
| 2017 | 2016 | 2015 | 2014 | 2013 | ||||||||||||||||
| Net asset value at beginning of period | $ | 22.24 | $ | 20.20 | $ | 23.25 | $ | 22.82 | $ | 18.36 | ||||||||||
| Income (loss) from investment operations: | ||||||||||||||||||||
| Net investment income | 0.06 | 0.24 | 0.42 | 0.35 | 0.48 | |||||||||||||||
| Net realized and unrealized gains (losses) on investments | 3.88 | 2.84 | (2.14 | ) | 0.46 | 4.44 | ||||||||||||||
| Total from investment operations | 3.94 | 3.08 | (1.72 | ) | 0.81 | 4.92 | ||||||||||||||
| Distributions from: | ||||||||||||||||||||
| Net investment income | (0.04 | ) | (0.31 | ) | (0.41 | ) | (0.38 | ) | (0.46 | ) | ||||||||||
| Realized capital gains | — | (0.73 | ) | (0.92 | ) | — | — | |||||||||||||
| Total distributions | (0.04 | ) | (1.04 | ) | (1.33 | ) | (0.38 | ) | (0.46 | ) | ||||||||||
| Net asset value at end of period | $ | 26.14 | $ | 22.24 | $ | 20.20 | $ | 23.25 | $ | 22.82 | ||||||||||
| Total return | 17.80 | % | 15.86 | % | (8.08 | %) | 3.47 | % | 27.11 | % | ||||||||||
| Ratios and supplemental data: | ||||||||||||||||||||
| Net assets at end of period (000's) | $ | 2,829 | $ | 3,080 | $ | 4,419 | $ | 9,097 | $ | 769 | ||||||||||
| Ratio to average net assets: | ||||||||||||||||||||
| Net expenses | 1.13 | % | 1.13 | % | 1.13 | % | 1.18 | % | 1.18 | % | ||||||||||
| Gross expenses | 1.95 | % | 1.70 | % | 1.44 | % | 1.65 | % | 3.45 | % | ||||||||||
| Net investment income | 0.32 | % | 1.30 | % | 1.76 | % | 1.70 | % | 2.23 | % | ||||||||||
| Portfolio turnover rate | 63 | %(A) | 155 | % | 112 | % | 100 | %(B)(C) | 98 | % | ||||||||||
Touchstone Small Cap Value Fund—Institutional Class
Selected Data for a Share Outstanding Throughout Each Period
| Year Ended September 30, | ||||||||||||||||||||
| 2017 | 2016 | 2015 | 2014 | 2013 | ||||||||||||||||
| Net asset value at beginning of period | $ | 22.22 | $ | 20.19 | $ | 23.24 | $ | 22.81 | $ | 18.35 | ||||||||||
| Income (loss) from investment operations: | ||||||||||||||||||||
| Net investment income | (0.06 | ) | 0.30 | 0.45 | 0.40 | 0.48 | ||||||||||||||
| Net realized and unrealized gains (losses) on investments | 4.04 | 2.80 | (2.13 | ) | 0.44 | 4.47 | ||||||||||||||
| Total from investment operations | 3.98 | 3.10 | (1.68 | ) | 0.84 | 4.95 | ||||||||||||||
| Distributions from: | ||||||||||||||||||||
| Net investment income | (0.06 | ) | (0.34 | ) | (0.45 | ) | (0.41 | ) | (0.49 | ) | ||||||||||
| Realized capital gains | — | (0.73 | ) | (0.92 | ) | — | — | |||||||||||||
| Total distributions | (0.06 | ) | (1.07 | ) | (1.37 | ) | (0.41 | ) | (0.49 | ) | ||||||||||
| Net asset value at end of period | $ | 26.14 | $ | 22.22 | $ | 20.19 | $ | 23.24 | $ | 22.81 | ||||||||||
| Total return | 17.93 | % | 16.05 | % | (7.93 | %) | 3.59 | % | 27.30 | % | ||||||||||
| Ratios and supplemental data: | ||||||||||||||||||||
| Net assets at end of period (000's) | $ | 7,699 | $ | 23,740 | $ | 25,968 | $ | 29,831 | $ | 2,665 | ||||||||||
| Ratio to average net assets: | ||||||||||||||||||||
| Net expenses | 0.98 | % | 0.98 | % | 0.98 | % | 1.03 | % | 1.03 | % | ||||||||||
| Gross expenses | 1.52 | % | 1.22 | % | 1.19 | % | 1.30 | % | 1.83 | % | ||||||||||
| Net investment income | 0.47 | % | 1.45 | % | 1.91 | % | 1.84 | % | 2.38 | % | ||||||||||
| Portfolio turnover rate | 63 | %(A) | 155 | % | 112 | % | 100 | %(B)(C) | 98 | % | ||||||||||
| (A) | Portfolio turnover rate excludes securities delivered from processing a redemption-in-kind. |
| (B) | Portfolio turnover rate excludes securities received from a subscription-in-kind. |
| (C) | Portfolio turnover excludes the purchases and sales of the Touchstone Small Company Value Fund acquired on March 21, 2014. If these transactions were included, portfolio turnover would have been higher. |
See accompanying Notes to Financial Statements.
| 159 |
Financial Highlights (Continued)
Touchstone Total Return Bond Fund—Class A
Selected Data for a Share Outstanding Throughout Each Period
| Year Ended September 30, | ||||||||||||||||||||
| 2017 | 2016 | 2015 | 2014 | 2013 | ||||||||||||||||
| Net asset value at beginning of period | $ | 10.38 | $ | 10.19 | $ | 10.23 | $ | 10.07 | $ | 10.50 | ||||||||||
| Income (loss) from investment operations: | ||||||||||||||||||||
| Net investment income | 0.18 | 0.24 | 0.22 | 0.23 | 0.21 | |||||||||||||||
| Net realized and unrealized gains (losses) on investments | (0.17 | ) | 0.22 | 0.01 | 0.22 | (0.36 | ) | |||||||||||||
| Total from investment operations | 0.01 | 0.46 | 0.23 | 0.45 | (0.15 | ) | ||||||||||||||
| Distributions from: | ||||||||||||||||||||
| Net investment income | (0.26 | ) | (0.27 | ) | (0.27 | ) | (0.29 | ) | (0.27 | ) | ||||||||||
| Realized capital gains | — | — | — | — | (0.01 | ) | ||||||||||||||
| Total distributions | (0.26 | ) | (0.27 | ) | (0.27 | ) | (0.29 | ) | (0.28 | ) | ||||||||||
| Net asset value at end of period | $ | 10.13 | $ | 10.38 | $ | 10.19 | $ | 10.23 | $ | 10.07 | ||||||||||
| Total return(A) | 0.15 | % | 4.57 | % | 2.24 | % | 4.53 | % | (1.48 | %) | ||||||||||
| Ratios and supplemental data: | ||||||||||||||||||||
| Net assets at end of period (000's) | $ | 5,137 | $ | 8,639 | $ | 5,749 | $ | 5,144 | $ | 12,167 | ||||||||||
| Ratio to average net assets: | ||||||||||||||||||||
| Net expenses | 0.85 | % | 0.87 | % | 0.90 | % | 0.90 | % | 0.90 | % | ||||||||||
| Gross expenses | 1.22 | % | 1.25 | % | 1.26 | % | 1.25 | % | 1.10 | % | ||||||||||
| Net investment income | 1.98 | % | 2.26 | % | 2.10 | % | 2.32 | % | 2.07 | % | ||||||||||
| Portfolio turnover rate | 18 | % | 12 | % | 19 | % | 5 | % | 35 | % | ||||||||||
Touchstone Total Return Bond Fund—Class C
Selected Data for a Share Outstanding Throughout Each Period
| Year Ended September 30, | ||||||||||||||||||||
| 2017 | 2016 | 2015 | 2014 | 2013 | ||||||||||||||||
| Net asset value at beginning of period | $ | 10.36 | $ | 10.18 | $ | 10.21 | $ | 10.05 | $ | 10.49 | ||||||||||
| Income (loss) from investment operations: | ||||||||||||||||||||
| Net investment income | 0.11 | 0.15 | 0.14 | 0.15 | 0.11 | |||||||||||||||
| Net realized and unrealized gains (losses) on investments | (0.17 | ) | 0.22 | 0.02 | 0.22 | (0.35 | ) | |||||||||||||
| Total from investment operations | (0.06 | ) | 0.37 | 0.16 | 0.37 | (0.24 | ) | |||||||||||||
| Distributions from: | ||||||||||||||||||||
| Net investment income | (0.18 | ) | (0.19 | ) | (0.19 | ) | (0.21 | ) | (0.19 | ) | ||||||||||
| Realized capital gains | — | — | — | — | (0.01 | ) | ||||||||||||||
| Total distributions | (0.18 | ) | (0.19 | ) | (0.19 | ) | (0.21 | ) | (0.20 | ) | ||||||||||
| Net asset value at end of period | $ | 10.12 | $ | 10.36 | $ | 10.18 | $ | 10.21 | $ | 10.05 | ||||||||||
| Total return(A) | (0.51 | %) | 3.70 | % | 1.60 | % | 3.75 | % | (2.33 | %) | ||||||||||
| Ratios and supplemental data: | ||||||||||||||||||||
| Net assets at end of period (000's) | $ | 1,876 | $ | 2,813 | $ | 2,368 | $ | 1,634 | $ | 2,455 | ||||||||||
| Ratio to average net assets: | ||||||||||||||||||||
| Net expenses | 1.60 | % | 1.62 | % | 1.65 | % | 1.65 | % | 1.65 | % | ||||||||||
| Gross expenses | 2.30 | % | 2.19 | % | 2.27 | % | 2.47 | % | 2.10 | % | ||||||||||
| Net investment income | 1.23 | % | 1.51 | % | 1.35 | % | 1.57 | % | 1.32 | % | ||||||||||
| Portfolio turnover rate | 18 | % | 12 | % | 19 | % | 5 | % | 35 | % | ||||||||||
| (A) | Total returns shown exclude the effect of applicable sales loads. If these charges were included, the returns would be lower. |
See accompanying Notes to Financial Statements.
| 160 |
Financial Highlights (Continued)
Touchstone Total Return Bond Fund—Class Y
Selected Data for a Share Outstanding Throughout Each Period
| Year Ended September 30, | ||||||||||||||||||||
| 2017 | 2016 | 2015 | 2014 | 2013 | ||||||||||||||||
| Net asset value at beginning of period | $ | 10.39 | $ | 10.20 | $ | 10.24 | $ | 10.08 | $ | 10.52 | ||||||||||
| Income (loss) from investment operations: | ||||||||||||||||||||
| Net investment income | 0.24 | 0.26 | 0.25 | 0.26 | 0.23 | |||||||||||||||
| Net realized and unrealized gains (losses) on investments | (0.19 | ) | 0.23 | 0.01 | 0.22 | (0.36 | ) | |||||||||||||
| Total from investment operations | 0.05 | 0.49 | 0.26 | 0.48 | (0.13 | ) | ||||||||||||||
| Distributions from: | ||||||||||||||||||||
| Net investment income | (0.29 | ) | (0.30 | ) | (0.30 | ) | (0.32 | ) | (0.30 | ) | ||||||||||
| Realized capital gains | — | — | — | — | (0.01 | ) | ||||||||||||||
| Total distributions | (0.29 | ) | (0.30 | ) | (0.30 | ) | (0.32 | ) | (0.31 | ) | ||||||||||
| Net asset value at end of period | $ | 10.15 | $ | 10.39 | $ | 10.20 | $ | 10.24 | $ | 10.08 | ||||||||||
| Total return | 0.50 | % | 4.82 | % | 2.51 | % | 4.84 | % | (1.32 | %) | ||||||||||
| Ratios and supplemental data: | ||||||||||||||||||||
| Net assets at end of period (000's) | $ | 37,233 | $ | 49,484 | $ | 39,751 | $ | 19,397 | $ | 19,635 | ||||||||||
| Ratio to average net assets: | ||||||||||||||||||||
| Net expenses | 0.60 | % | 0.62 | % | 0.65 | % | 0.61 | % | 0.62 | % | ||||||||||
| Gross expenses | 0.73 | % | 0.71 | % | 0.70 | % | 0.68 | % | 0.71 | % | ||||||||||
| Net investment income | 2.23 | % | 2.51 | % | 2.35 | % | 2.61 | % | 2.34 | % | ||||||||||
| Portfolio turnover rate | 18 | % | 12 | % | 19 | % | 5 | % | 35 | % | ||||||||||
Touchstone Total Return Bond Fund — Institutional Class
Selected Data for a Share Outstanding Throughout Each Period
| Year Ended September 30, | ||||||||||||||||||||
| 2017 | 2016 | 2015 | 2014 | 2013 | ||||||||||||||||
| Net asset value at beginning of period | $ | 10.39 | $ | 10.20 | $ | 10.24 | $ | 10.08 | $ | 10.51 | ||||||||||
| Income (loss) from investment operations: | ||||||||||||||||||||
| Net investment income | 0.25 | 0.28 | 0.26 | 0.27 | 0.25 | |||||||||||||||
| Net realized and unrealized gains (losses) on investments | (0.20 | ) | 0.22 | 0.01 | 0.22 | (0.36 | ) | |||||||||||||
| Total from investment operations | 0.05 | 0.50 | 0.27 | 0.49 | (0.11 | ) | ||||||||||||||
| Distributions from: | ||||||||||||||||||||
| Net investment income | (0.30 | ) | (0.31 | ) | (0.31 | ) | (0.33 | ) | (0.31 | ) | ||||||||||
| Realized capital gains | — | — | — | — | (0.01 | ) | ||||||||||||||
| Total distributions | (0.30 | ) | (0.31 | ) | (0.31 | ) | (0.33 | ) | (0.32 | ) | ||||||||||
| Net asset value at end of period | $ | 10.14 | $ | 10.39 | $ | 10.20 | $ | 10.24 | $ | 10.08 | ||||||||||
| Total return | 0.51 | % | 4.94 | % | 2.65 | % | 4.96 | % | (1.09 | %) | ||||||||||
| Ratios and supplemental data: | ||||||||||||||||||||
| Net assets at end of period (000's) | $ | 222,013 | $ | 166,008 | $ | 134,877 | $ | 116,404 | $ | 133,051 | ||||||||||
| Ratio to average net assets: | ||||||||||||||||||||
| Net expenses | 0.50 | % | 0.50 | % | 0.50 | % | 0.50 | % | 0.50 | % | ||||||||||
| Gross expenses | 0.60 | % | 0.60 | % | 0.61 | % | 0.60 | % | 0.60 | % | ||||||||||
| Net investment income | 2.33 | % | 2.63 | % | 2.50 | % | 2.72 | % | 2.47 | % | ||||||||||
| Portfolio turnover rate | 18 | % | 12 | % | 19 | % | 5 | % | 35 | % | ||||||||||
See accompanying Notes to Financial Statements.
| 161 |
Financial Highlights (Continued)
Touchstone Ultra Short Duration Fixed Income Fund—Class A
Selected Data for a Share Outstanding Throughout Each Period
| Year Ended September 30, | ||||||||||||||||||||
| 2017 | 2016 | 2015 | 2014 | 2013 | ||||||||||||||||
| Net asset value at beginning of period | $ | 9.32 | $ | 9.32 | $ | 9.41 | $ | 9.45 | $ | 9.56 | ||||||||||
| Income (loss) from investment operations: | ||||||||||||||||||||
| Net investment income | 0.13 | 0.10 | 0.06 | 0.06 | 0.09 | |||||||||||||||
| Net realized and unrealized gains (losses) on investments | (0.02 | ) | 0.02 | (0.03 | ) | 0.03 | (0.04 | ) | ||||||||||||
| Total from investment operations | 0.11 | 0.12 | 0.03 | 0.09 | 0.05 | |||||||||||||||
| Distributions from: | ||||||||||||||||||||
| Net investment income | (0.14 | ) | (0.12 | ) | (0.12 | ) | (0.13 | ) | (0.16 | ) | ||||||||||
| Net asset value at end of period | $ | 9.29 | $ | 9.32 | $ | 9.32 | $ | 9.41 | $ | 9.45 | ||||||||||
| Total return(A) | 1.29 | % | 1.35 | % | 0.31 | % | 0.92 | % | 0.48 | % | ||||||||||
| Ratios and supplemental data: | ||||||||||||||||||||
| Net assets at end of period (000's) | $ | 14,080 | $ | 16,946 | $ | 10,675 | $ | 10,596 | $ | 32,088 | ||||||||||
| Ratio to average net assets: | ||||||||||||||||||||
| Net expenses | 0.69 | % | 0.69 | % | 0.69 | % | 0.69 | % | 0.69 | % | ||||||||||
| Gross expenses | 0.90 | % | 0.97 | % | 0.99 | % | 0.93 | % | 0.83 | % | ||||||||||
| Net investment income | 1.40 | % | 1.09 | % | 0.54 | % | 0.79 | % | 0.85 | % | ||||||||||
| Portfolio turnover rate | 136 | % | 169 | % | 132 | % | 142 | % | 107 | %(B) | ||||||||||
Touchstone Ultra Short Duration Fixed Income Fund—Class C
Selected Data for a Share Outstanding Throughout Each Period
| Year Ended September 30, | ||||||||||||||||||||
| 2017 | 2016 | 2015 | 2014 | 2013 | ||||||||||||||||
| Net asset value at beginning of period | $ | 9.32 | $ | 9.32 | $ | 9.41 | $ | 9.45 | $ | 9.56 | ||||||||||
| Income (loss) from investment operations: | ||||||||||||||||||||
| Net investment income | 0.08 | 0.06 | — | (C) | 0.02 | 0.04 | ||||||||||||||
| Net realized and unrealized gains (losses) on investments | (0.02 | ) | 0.02 | (0.02 | ) | 0.02 | (0.04 | ) | ||||||||||||
| Total from investment operations | 0.06 | 0.08 | (0.02 | ) | 0.04 | — | ||||||||||||||
| Distributions from: | ||||||||||||||||||||
| Net investment income | (0.09 | ) | (0.08 | ) | (0.07 | ) | (0.08 | ) | (0.11 | ) | ||||||||||
| Net asset value at end of period | $ | 9.29 | $ | 9.32 | $ | 9.32 | $ | 9.41 | $ | 9.45 | ||||||||||
| Total return(A) | 0.77 | % | 0.84 | % | (0.19 | %) | 0.42 | % | (0.02 | %) | ||||||||||
| Ratios and supplemental data: | ||||||||||||||||||||
| Net assets at end of period (000's) | $ | 5,704 | $ | 7,961 | $ | 8,291 | $ | 11,272 | $ | 13,568 | ||||||||||
| Ratio to average net assets: | ||||||||||||||||||||
| Net expenses | 1.19 | % | 1.19 | % | 1.19 | % | 1.19 | % | 1.19 | % | ||||||||||
| Gross expenses | 1.56 | % | 1.54 | % | 1.48 | % | 1.44 | % | 1.39 | % | ||||||||||
| Net investment income | 0.90 | % | 0.59 | % | 0.04 | % | 0.29 | % | 0.35 | % | ||||||||||
| Portfolio turnover rate | 136 | % | 169 | % | 132 | % | 142 | % | 107 | %(B) | ||||||||||
| (A) | Total returns shown exclude the effect of applicable sales loads. If these charges were included, the returns would be lower. |
| (B) | Portfolio turnover excludes the purchases and sales of the Touchstone Short Duration Fixed Income Fund acquired on May 17, 2013. If these transactions were included, portfolio turnover would have been higher. |
| (C) | Less than $0.005 per share. |
See accompanying Notes to Financial Statements.
| 162 |
Financial Highlights (Continued)
Touchstone Ultra Short Duration Fixed Income Fund—Class Y
Selected Data for a Share Outstanding Throughout Each Period
| Year Ended September 30, | ||||||||||||||||||||
| 2017 | 2016 | 2015 | 2014 | 2013 | ||||||||||||||||
| Net asset value at beginning of period | $ | 9.32 | $ | 9.32 | $ | 9.41 | $ | 9.45 | $ | 9.56 | ||||||||||
| Income (loss) from investment operations: | ||||||||||||||||||||
| Net investment income | 0.15 | 0.13 | 0.07 | 0.10 | 0.12 | |||||||||||||||
| Net realized and unrealized gains (losses) on investments | (0.02 | ) | 0.02 | (0.02 | ) | 0.01 | (0.05 | ) | ||||||||||||
| Total from investment operations | 0.13 | 0.15 | 0.05 | 0.11 | 0.07 | |||||||||||||||
| Distributions from: | ||||||||||||||||||||
| Net investment income | (0.16 | ) | (0.15 | ) | (0.14 | ) | (0.15 | ) | (0.18 | ) | ||||||||||
| Net asset value at end of period | $ | 9.29 | $ | 9.32 | $ | 9.32 | $ | 9.41 | $ | 9.45 | ||||||||||
| Total return | 1.55 | % | 1.60 | % | 0.56 | % | 1.17 | % | 0.74 | % | ||||||||||
| Ratios and supplemental data: | ||||||||||||||||||||
| Net assets at end of period (000's) | $ | 260,830 | $ | 206,313 | $ | 200,456 | $ | 244,885 | $ | 249,250 | ||||||||||
| Ratio to average net assets: | ||||||||||||||||||||
| Net expenses | 0.44 | % | 0.44 | % | 0.44 | % | 0.44 | % | 0.44 | % | ||||||||||
| Gross expenses | 0.51 | % | 0.53 | % | 0.52 | % | 0.49 | % | 0.51 | % | ||||||||||
| Net investment income | 1.65 | % | 1.34 | % | 0.79 | % | 1.04 | % | 1.10 | % | ||||||||||
| Portfolio turnover rate | 136 | % | 169 | % | 132 | % | 142 | % | 107 | %(A) | ||||||||||
Touchstone Ultra Short Duration Fixed Income Fund—Class Z
Selected Data for a Share Outstanding Throughout Each Period
| Year Ended September 30, | ||||||||||||||||||||
| 2017 | 2016 | 2015 | 2014 | 2013 | ||||||||||||||||
| Net asset value at beginning of period | $ | 9.32 | $ | 9.32 | $ | 9.41 | $ | 9.45 | $ | 9.56 | ||||||||||
| Income (loss) from investment operations: | ||||||||||||||||||||
| Net investment income | 0.13 | 0.10 | 0.05 | 0.08 | 0.09 | |||||||||||||||
| Net realized and unrealized gains (losses) on investment | (0.02 | ) | 0.02 | (0.02 | ) | 0.01 | (0.04 | ) | ||||||||||||
| Total from investment operations | 0.11 | 0.12 | 0.03 | 0.09 | 0.05 | |||||||||||||||
| Distributions from: | ||||||||||||||||||||
| Net investment income | (0.14 | ) | (0.12 | ) | (0.12 | ) | (0.13 | ) | (0.16 | ) | ||||||||||
| Net asset value at end of period | $ | 9.29 | $ | 9.32 | $ | 9.32 | $ | 9.41 | $ | 9.45 | ||||||||||
| Total return | 1.29 | % | 1.35 | % | 0.31 | % | 0.91 | % | 0.52 | % | ||||||||||
| Ratios and supplemental data: | ||||||||||||||||||||
| Net assets at end of period (000's) | $ | 211,797 | $ | 245,252 | $ | 304,553 | $ | 401,851 | $ | 381,554 | ||||||||||
| Ratio to average net assets: | ||||||||||||||||||||
| Net expenses | 0.69 | % | 0.69 | % | 0.69 | % | 0.69 | % | 0.65 | % | ||||||||||
| Gross expenses | 0.78 | % | 0.79 | % | 0.76 | % | 0.76 | % | 0.73 | % | ||||||||||
| Net Investment Income | 1.40 | % | 1.09 | % | 0.54 | % | 0.79 | % | 0.89 | % | ||||||||||
| Portfolio turnover rate | 136 | % | 169 | % | 132 | % | 142 | % | 107 | %(A) | ||||||||||
| (A) | Portfolio turnover excludes the purchases and sales of the Touchstone Short Duration Fixed Income Fund acquired on May 17, 2013. If these transactions were included, portfolio turnover would have been higher. |
See accompanying Notes to Financial Statements.
| 163 |
Financial Highlights (Continued)
Touchstone Ultra Short Duration Fixed Income Fund—Institutional Class
Selected Data for a Share Outstanding Throughout Each Period
| Year Ended September 30, | ||||||||||||||||||||
| 2017 | 2016 | 2015 | 2014 | 2013 | ||||||||||||||||
| Net asset value at beginning of period | $ | 9.32 | $ | 9.32 | $ | 9.41 | $ | 9.45 | $ | 9.56 | ||||||||||
| Income (loss) from investment operations: | ||||||||||||||||||||
| Net investment income | 0.16 | 0.13 | 0.08 | 0.10 | 0.14 | |||||||||||||||
| Net realized and unrealized gains (losses) on investments | (0.02 | ) | 0.02 | (0.02 | ) | 0.01 | (0.07 | ) | ||||||||||||
| Total from investment operations | 0.14 | 0.15 | 0.06 | 0.11 | 0.07 | |||||||||||||||
| Distributions from: | ||||||||||||||||||||
| Net investment income | (0.17 | ) | (0.15 | ) | (0.15 | ) | (0.15 | ) | (0.18 | ) | ||||||||||
| Net asset value at end of period | $ | 9.29 | $ | 9.32 | $ | 9.32 | $ | 9.41 | $ | 9.45 | ||||||||||
| Total return | 1.60 | % | 1.54 | % | 0.61 | % | 1.22 | % | 0.78 | % | ||||||||||
| Ratios and supplemental data: | ||||||||||||||||||||
| Net assets at end of period (000's) | $ | 257,777 | $ | 142,913 | $ | 49,389 | $ | 50,853 | $ | 59,662 | ||||||||||
| Ratio to average net assets: | ||||||||||||||||||||
| Net expenses | 0.39 | % | 0.39 | % | 0.39 | % | 0.39 | % | 0.39 | % | ||||||||||
| Gross expenses | 0.45 | % | 0.46 | % | 0.48 | % | 0.48 | % | 0.52 | % | ||||||||||
| Net investment income | 1.70 | % | 1.39 | % | 0.84 | % | 1.09 | % | 1.15 | % | ||||||||||
| Portfolio turnover rate | 136 | % | 169 | % | 132 | % | 142 | % | 107 | %(A) | ||||||||||
| (A) | Portfolio turnover excludes the purchases and sales of the Touchstone Short Duration Fixed Income Fund acquired on May 17, 2013. If these transactions were included, portfolio turnover would have been higher. |
See accompanying Notes to Financial Statements.
| 164 |
September 30, 2017
1. Organization
The Touchstone Funds Group Trust (the “Trust”) is registered under the Investment Company Act of 1940, as amended (the “1940 Act”), as an open-end management investment company. The Trust was established as a Delaware statutory trust pursuant to an Agreement and Declaration of Trust dated October 25, 1993. The Trust consists of the following thirteen funds (individually, a “Fund,” and collectively, the “Funds”):
Touchstone Active Bond Fund (“Active Bond Fund”)*
Touchstone Arbitrage Fund (“Arbitrage Fund”)
Touchstone Emerging Markets Small Cap Fund (“Emerging Markets Small Cap Fund”)
Touchstone High Yield Fund (“High Yield Fund”)*
Touchstone Merger Arbitrage Fund (“Merger Arbitrage Fund”)
Touchstone Mid Cap Fund (“Mid Cap Fund”)
Touchstone Mid Cap Value Fund (“Mid Cap Value Fund”)
Touchstone Premium Yield Equity Fund (“Premium Yield Equity Fund”)
Touchstone Sands Capital Select Growth Fund (“Sands Capital Select Growth Fund”)
Touchstone Small Cap Fund (“Small Cap Fund”)
Touchstone Small Cap Value Fund (“Small Cap Value Fund”)
Touchstone Total Return Bond Fund (“Total Return Bond Fund”)
Touchstone Ultra Short Duration Fixed Income Fund (“Ultra Short Duration Fixed Income Fund”)
* See Note 8 in Notes to Financial Statements for details on Fund reorganizations.
Each Fund is diversified, with the exception of the Arbitrage Fund, the Merger Arbitrage Fund, the Sands Capital Select Growth Fund and the Small Cap Fund, which are non-diversified.
The Agreement and Declaration of Trust permits the Trust to issue an unlimited number of shares of beneficial interest of each Fund. The table below indicates the classes of shares that each Fund is registered to offer:
| Institutional | |||||
| Class A | Class C | Class Y | Class Z | Class | |
| Active Bond Fund | X | X | X | X | |
| Arbitrage Fund | X | X | X | X | |
| Emerging Markets Small Cap Fund | X | X | X | X | |
| High Yield Fund | X | X | X | X | |
| Merger Arbitrage Fund | X | X | X | X | |
| Mid Cap Fund | X | X | X | X | X |
| Mid Cap Value Fund | X | X | X | X | |
| Premium Yield Equity Fund | X | X | X | ||
| Sands Capital Select Growth Fund | X | X | X | X | |
| Small Cap Fund | X | X | X | X | |
| Small Cap Value Fund | X | X | X | X | |
| Total Return Bond Fund | X | X | X | X | |
| Ultra Short Duration Fixed Income Fund | X | X | X | X | X |
The assets of each Fund are segregated, and a shareholder’s interest is limited to the Fund in which shares are held. The Funds’ prospectus provides a description of each Fund’s investment goals, policies, and strategies along with information on the classes of shares currently being offered.
2. Significant Accounting Policies
The following is a summary of the Funds’ significant accounting policies:
Each Fund is an investment company that follows the accounting and reporting guidance of Accounting Standards Codification Topic 946 applicable to investment companies.
Security valuation and fair value measurements — U.S. generally accepted accounting principles (“U.S. GAAP”) define fair value as the price the Funds would receive to sell an asset or pay to transfer a liability in an orderly
| 165 |
Notes to Financial Statements (Continued)
transaction between market participants at the measurement date. All investments in securities are recorded at their fair value. The Funds define the term “market value”, as used throughout this report, as the estimated fair value. The Funds use various methods to measure fair value of their portfolio securities on a recurring basis. U.S. GAAP fair value measurement standards require disclosure of a hierarchy that prioritizes inputs to valuation methods. These inputs are summarized in the three broad levels listed below:
| • | Level 1 – | quoted prices in active markets for identical securities |
| • | Level 2 – | other significant observable inputs (including quoted prices for similar securities, interest rates, prepayment speeds, credit risk, etc.) |
| • | Level 3 – | significant unobservable inputs (including a Fund’s own assumptions in determining the fair value of investments) |
The inputs or methodology used for valuing securities are not necessarily an indication of the risk associated with investing in those securities.
The aggregate value by input level, as of September 30, 2017, for each Fund’s investments, as well as a reconciliation of assets for which significant unobservable inputs (Level 3) were used in determining value, if applicable, is included in each Fund’s Portfolio of Investments, which also includes a breakdown of the Fund’s investments by geographic, portfolio or sector allocation. The Arbitrage Fund and Merger Arbitrage Fund held Level 3 categorized securities during the year ended September 30, 2017. Refer to the Portfolio of Investments for a reconciliation of Level 3 holdings.
Changes in valuation techniques may result in transfers into or out of an investment’s assigned level within the hierarchy. All transfers in and out of the levels are recognized at the value at the end of the period. At September 30, 2017, there were no transfers between Levels 1, 2 and 3 for the Funds, except as discussed in the Portfolio of Investments for the Emerging Markets Small Cap Fund.
During the year ended September 30, 2017, there were no material changes to the valuation policies and techniques.
The Funds’ portfolio securities are valued as of the close of the regular session of trading on the New York Stock Exchange (“NYSE”) (currently 4:00 p.m., Eastern Time). Portfolio securities traded on stock exchanges are valued at the last reported sale price, official close price, or last bid price if no sales are reported. Portfolio securities quoted by NASDAQ are valued at the NASDAQ Official Closing Price (“NOCP”) or from the primary exchange on which the security trades.To the extent these securities are actively traded, they are categorized in Level 1 of the fair value hierarchy. Options are valued at the last quoted sales price. If there is no such reported sale on the valuation date, long option positions are valued at the most recent bid price, and short option positions are valued at the most recent ask price on the valuation date and are categorized in Level 1. Shares of mutual funds in which the Funds invest are valued at their respective net asset values (“NAV”) as reported by the underlying funds (the “Underlying Funds”) and are categorized in Level 1.
Debt securities held by the Funds are valued at their evaluated bid by an independent pricing service or at their last broker-quoted bid prices as obtained from one or more of the major market makers for such securities. Independent pricing services use information provided by market makers or estimates of market values through accepted market modeling conventions. Observable inputs to the models may include prepayment speeds, pricing spread, yield, trade information, dealer quotes, market color, cash flow models, the securities’ terms and conditions, among others, and are generally categorized in Level 2. Debt securities with remaining maturities of 60 days or less may be valued at amortized cost, provided such amount approximates market value and are categorized in Level 2. While this method provides consistency in valuation (and may only be used if it approximates
| 166 |
Notes to Financial Statements (Continued)
market value), it may result in periods during which fair value, as determined by amortized cost, is higher or lower than the price that would be received if the Fund sold the investment.
Foreign currency exchange contracts are valued at the mean between the bid and ask prices and are determined as of the close of regular trading on the NYSE. Interpolated values are derived when the settlement date of the contract is an interim date for which quotations are not available and categorized in Level 2.
Securities mainly traded on a non-U.S. exchange or denominated in foreign currencies are generally valued according to the preceding closing values on that exchange, translated to U.S. dollars using currency exchange rates as of the close of regular trading on the NYSE, and are generally categorized in Level 1. However, if an event that may change the value of a security occurs after the time that the closing value on the non-U.S. exchange was determined, but before the close of regular trading on the NYSE, the security may be priced based on fair value and generally categorized in Level 2. This may cause the value of the security, if held on the books of a Fund to be different from the closing value on the non-U.S. exchange and may affect the calculation of that Fund’s NAV.
The Funds may use fair value pricing under the following circumstances, among others:
| • | If the value of a security has been materially affected by events occurring before the Funds’ pricing time but after the close of the primary markets on which the security is traded. |
| • | If the exchange on which a portfolio security is principally traded closes early or if trading in a particular portfolio security was halted during the day and did not resume prior to the Funds’ NAV calculation. |
| • | If a security is so thinly traded that reliable market quotations are unavailable due to infrequent trading. |
| • | If the validity of market quotations is not reliable. |
Securities held by the Funds that do not have readily available market quotations, significant observable inputs, or securities for which the available market quotations are not reliable, are priced at their estimated fair value using procedures approved by the Funds’ Board of Trustees (the “Board”) and are generally categorized in Level 3.
Collateralized Loan Obligations — The Ultra Short Duration Fixed Income Fund may invest in collateralized loan obligations (“CLOs”). CLOs are types of asset-backed securities. A CLO is an entity that is backed by syndicated bank loans. The cash flows of the CLO can be split into multiple segments, called “tranches,” which will vary in risk profile and yield. The riskiest segment is the subordinated or “equity” tranche. This tranche bears the greatest risk of defaults from the underlying assets in the CLO and serves to protect the other, more senior, tranches from default in all but the most severe circumstances. Since it is shielded from defaults by the more junior tranches, a “senior” tranche will typically have higher credit ratings and lower yields than their underlying securities, and often receive investment grade ratings from one or more of the nationally recognized rating agencies. Despite the protection from the more junior tranches, senior tranches can experience substantial losses due to actual defaults, increased sensitivity to future defaults and the disappearance of one or more protecting tranches as a result of changes in the credit profile of the underlying pool of assets.
Investment companies — The Funds may invest in securities of other investment companies, including exchange-traded funds (“ETFs”), open-end funds and closed-end funds. Open-end funds are investment companies that issue new shares continuously and redeem shares daily. Closed-end funds are investment companies that typically issue a fixed number of shares that trade on a securities exchange or over-the-counter (“OTC”). An ETF is an investment company that typically seeks to track the performance of an index by holding in its portfolio shares of all the companies, or a representative sample of the companies, that are components of a particular index. ETF shares are traded on a securities exchange based on their market value. The risks of investment in other investment companies typically reflect the risks of the types of securities in which the other investment companies invest. Investments in ETFs and closed-end funds are subject to the additional risk that their shares
| 167 |
Notes to Financial Statements (Continued)
may trade at a premium or discount to their NAV. When a Fund invests in another investment company, shareholders of the Fund indirectly bear their proportionate share of the other investment company’s fees and expenses, including operating, registration, trustee, licensing, and marketing, as well as their share of the Fund’s fees and expenses.
Securities sold short — The Funds may engage in selling securities short, which obligates the Fund to replace a security borrowed by purchasing the same security at the current market value. The Fund would incur a loss if the price of the security increases between the date of the short sale and the date on which the Fund replaces the borrowed security. The Fund would realize a gain if the price of the security declines between those dates. As of September 30, 2017, the Arbitrage Fund and Merger Arbitrage Fund had securities sold short with a fair value of $(36,625,396) and $(28,415,672), respectively, and pledged securities with a fair value of $41,364,429 and $56,285,095, respectively, as collateral and pledged cash collateral of $23,584,940 and $3,641,369, respectively, for both securities sold short and written options.
Options — The Funds may write or purchase financial option contracts primarily to hedge against changes in the value of equity securities (or securities that the Funds intend to purchase), against fluctuations in fair value caused by changes in prevailing market interest rates or foreign currency exchange rates and against changes in overall equity market volatility. In addition, the Funds may utilize options in an attempt to generate gains from option premiums or to reduce overall portfolio risk. The Funds’ option strategy primarily focuses on the use of writing and/or purchasing call or put options on equity indexes. When the Funds write or purchase an option, an amount equal to the premium received or paid by the Funds is recorded as a liability or an asset and is subsequently adjusted to the current market value of the option written or purchased. Premiums received or paid from writing or purchasing options which expire unexercised are treated by the Funds on the expiration date as realized gains or losses. The difference between the premium and the amount paid or received on effecting a closing purchase or sale transaction, including brokerage commissions, is also treated as a realized gain or loss. If an option is exercised, the premium paid or received is added to the cost of the purchase or proceeds from the sale in determining whether the Funds have realized a gain or loss on investment transactions. The Funds, as writer of an option, may have no control over whether the underlying securities may be sold (call) or purchased (put) and as a result bear the market risk of an unfavorable change in the price of the security underlying the written option. The Funds, as purchaser of an option, bear the risk that the counterparties to the option may not have the ability to meet the terms of the option contracts. There is minimal counterparty credit risk involved in entering into option contracts since they are exchange-traded instruments and the exchange’s clearinghouse, as counterparty to all exchange-traded options, guarantees the options against default. As of September 30, 2017, the Arbitrage Fund and Merger Arbitrage Fund had written options with a fair value of ($83,080) and ($65,245), respectively, and pledged securities with a fair value of $41,364,429 and $56,285,095, respectively, as collateral and pledged cash collateral of $23,584,940 and $3,641,369, respectively, for both securities sold short and written options. The Arbitrage Fund and Merger Arbitrage Fund held purchased options with a fair value of $40,795 and $34,290, as of September 30, 2017.
Warrants — The Funds can invest in warrants and stock purchase rights of companies of any market capitalization. A warrant gives the company the right to buy stock, typically from the issuer. The warrant specifies the amount of underlying stock, the purchase (or “exercise”) price, and the date the warrant expires. Certain warrants may permit, without legal obligation, net settlement for stock or cash. The Funds have no obligation to exercise the warrant and buy the stock.
Futures Contracts — The Active Bond Fund may buy and sell futures contracts and related options to manage its exposure to changing interest rates and securities prices. Some strategies reduce the Fund’s exposure to price fluctuations, while others tend to increase its market exposure. Futures and options on futures can be volatile instruments and involve certain risks that could negatively impact the Fund’s return. In order to avoid leveraging and related risks, when the Fund purchases futures contracts, it will collateralize its position by depositing an
| 168 |
Notes to Financial Statements (Continued)
amount of cash or liquid securities, equal to the market value of the futures positions held, less margin deposits, in a segregated account with its custodian or otherwise “cover” its position in a manner consistent with the 1940 Act or the rules of the Securities and Exchange Commission (the “SEC”) or interpretations thereunder. Collateral equal to the current market value of the futures position will be marked to market on a daily basis.
When the contract is closed, the Fund records a realized gain or loss equal to the difference between the proceeds from (or cost of) the closing transactions and the Fund’s basis in the contract. Risks of entering into futures contracts include the possibility that a change in the value of the contract may not correlate with the changes in the value of the underlying instruments. Second, it is possible that a lack of liquidity for futures contracts could exist in the secondary market resulting in an inability to close a futures position prior to its maturity date. Third, the purchase of a futures contract involves the risk that the Fund could lose more than the original margin deposit required to initiate the futures transaction. Finally, the risk exists that losses could exceed amounts disclosed on the Statements of Assets and Liabilities. There is minimal counterparty credit risk involved in entering into futures contracts since they are exchange-traded instruments and the exchange’s clearinghouse, as counterparty to all exchange-traded futures, guarantees the futures against default.
As of September 30, 2017, the Active Bond Fund did not hold any futures contracts.
Foreign currency translation — The books and records of the Funds are maintained in U.S. dollars and translated into U.S. dollars on the following basis:
(1) market value of investment securities, assets and liabilities at the current rate of exchange on the valuation date; and
(2) purchases and sales of investment securities, income, and expenses at the relevant rates of exchange prevailing on the respective dates of such transactions.
The Funds do not isolate that portion of gains and losses on investments in equity securities that is due to changes in the foreign exchange rates from that which is due to changes in market prices of equity securities.
Forward foreign currency contracts — A forward foreign currency contract is an agreement between two parties to buy and sell a specific currency at a price that is set on the date of the contract. The forward contract calls for delivery of the currency on a future date that is specified in the contract. Risks related to the use of forwards include the possible failure of counterparties to meet the terms of the forward agreement, the failure of the counterparties to timely post collateral, the risk that currency movements will not occur thereby reducing the Fund’s total return, and the potential for losses in excess of the Fund’s initial investment.
The market value of a forward foreign currency contract fluctuates with changes in foreign currency exchange rates. Forward foreign currency contracts are marked to market daily and the change in value is recorded by a Fund as an unrealized gain or loss. Realized gains or losses, equal to the difference between the value of the contract at the time it was opened and the value at the time it was closed, are recorded upon delivery or receipt of the currency.
During the year ended September 30, 2017, the Arbitrage Fund and the Merger Arbitrage Fund used forward foreign currency contracts to enhance potential gains, hedge against anticipated currency exchange rates, maintain diversity and liquidity of the portfolio and/or adjust exposure to foreign currencies.
Real Estate Investment Trusts — The Funds may invest in real estate investment trusts (“REITs”) that involve risks not associated with investing in stocks. Risks include declines in the value of real estate, general and economic conditions, changes in the value of the underlying property and defaults by borrowers. The value of assets in the real estate industry may go through cycles of relative underperformance and outperformance in comparison to equity securities markets in general. Dividend income is recorded using management’s estimate of the income included in distributions received from REIT investments. The actual amounts of income, return of capital
| 169 |
Notes to Financial Statements (Continued)
and capital gains are only determined by each REIT after its fiscal year-end and may differ from the estimated amount. Estimates of income are adjusted in the Funds to the actual amounts when the amounts are determined.
Master Limited Partnership — The Funds may invest in Master Limited Partnership (“MLP”) common units that represent limited partnership interests in the MLP. Common units are generally listed and traded on U.S. securities exchanges or OTC with their value fluctuating predominantly based on the success of the MLP. Unlike owners of common stock of a corporation, owners of MLP common units have limited voting rights and have no ability to annually elect directors. MLPs generally distribute all available cash flow (cash flow from operations less maintenance capital expenditures) in the form of quarterly distributions. Common unit holders have first priority to receive quarterly cash distributions up to the minimum quarterly distribution and have arrearage rights. Distributions received from MLPs generally are comprised of income and return of capital. Investment income and return of capital are recorded based on estimates made at the time distributions are received. The actual amounts of income and return of capital are only determined by each MLP after its fiscal year-end and may differ from the estimated amount. Estimates of income are adjusted in the Funds to the actual amounts when the amounts are determined. In the event of liquidation, common unit holders have preference over subordinated units, but not debt holders or preferred unit holders, to the remaining assets of the MLP.
Pay-In-Kind (“PIK”) Bonds — PIK bonds are securities that, at the issuer’s option, pay interest in either cash or additional securities for a specified period. PIK bonds, like zero coupon bonds, are designed to give an issuer flexibility in managing cash flow. PIK bonds are expected to reflect the market value of the underlying debt plus an amount representing accrued interest since the last payment. PIK bonds are usually less volatile than zero coupon bonds, but more volatile than cash pay securities.
Derivative instruments and hedging activities — The Active Bond Fund, the Arbitrage Fund and the Merger Arbitrage Fund may enter into an International Swaps and Derivatives Associations, Inc. Master Agreement (“ISDA Master Agreement” or “MNA”) or similar agreement with certain counterparties. An ISDA Master Agreement is a bilateral agreement between a Fund and a counterparty that governs OTC derivatives and foreign exchange contracts, and typically contains, among other things, collateral posting terms and master netting provisions in the event of a default or termination. Under an ISDA Master Agreement, a party may, under certain circumstances, offset with the counterparty certain derivative financial instrument’s payables or receivables with collateral held or posted and create one single net payment. The provisions of the ISDA Master Agreement typically permit a single net payment in the event of default (close-out netting). These default events include bankruptcy or insolvency of the counterparty. Note, however, that bankruptcy or insolvency laws of a particular jurisdiction may impose restrictions on or prohibitions against the right of offset.
When entering into a derivative transaction, a Fund may be required to post and maintain collateral or margin (including both initial and maintenance margin). Collateral and margin requirements differ by type of derivative. Margin requirements are established by the broker or clearing house for exchange traded and centrally cleared derivatives (financial futures contracts, options, and centrally cleared swaps). Brokers can ask for margining in excess of the clearing house’s minimum in certain circumstances. Collateral terms are contract specific for OTC derivatives (foreign currency exchange contracts, options, and swaps). For derivatives traded under an ISDA Master Agreement, the collateral requirements are typically calculated by netting the marked-to-market amount for each transaction under such agreement and comparing that amount to the value of any collateral currently pledged by the Fund and the counterparty. For financial reporting purposes, cash collateral that has been pledged to cover obligations of the Fund and cash collateral received from the counterparty, if any, are reported separately on the Statements of Assets and Liabilities as cash pledged as collateral and cash received as collateral, respectively. Non-cash collateral pledged by the Fund, if any, is noted in the Portfolio of Investments. To the extent amounts
| 170 |
Notes to Financial Statements (Continued)
due to the Fund from its counterparties are not fully collateralized, contractually or otherwise, the Fund bears the risk of loss from counterparty non-performance.
Certain ISDA Master Agreements allow counterparties to OTC derivatives transactions to terminate derivative contracts prior to maturity in the event a Fund’s net assets decline by a stated percentage or the Fund fails to meet the terms of its ISDA Master Agreement, which would cause the Fund (counterparty) to accelerate payment of any net liability owed to the counterparty (Fund).
For financial reporting purposes, a Fund does not offset derivative assets and derivative liabilities that are subject to netting arrangements in the Statements of Assets and Liabilities.
As of September 30, 2017, the Arbitrage and Merger Arbitrage Fund’s assets and liabilities that were subject to a MNA on a gross basis were as follows:
| Assets | Liabilities | |||||||
| Arbitrage Fund | ||||||||
| Written Options | $ | — | $ | (83,080 | ) | |||
| Merger Arbitrage Fund | ||||||||
| Written Options | — | (65,245 | ) | |||||
| Forward Foreign Currency Contracts | 10,864 | — | ||||||
| Total gross amount of assets and liabilities subject to MNA | $ | 10,864 | $ | (148,325 | ) | |||
The following table presents the Merger Arbitrage Funds’ assets net of amounts available for offset under a MNA and net of the related collateral pledged to the Funds as of September 30, 2017:
| Gross | ||||||||||||||||||||||||
| Amount | ||||||||||||||||||||||||
| Available | ||||||||||||||||||||||||
| for Offset in | ||||||||||||||||||||||||
| Gross | Statement | Non- | ||||||||||||||||||||||
| Amount of | of Assets | Cash | Cash | |||||||||||||||||||||
| Derivative | Recognized | and | Collateral | Collateral | Net | |||||||||||||||||||
| Fund | Counterparty | Type | Assets | Liabilities | Received | Received | Amount(A) | |||||||||||||||||
| Merger Arbitrage Fund | Brown | Forward | ||||||||||||||||||||||
| Brothers | Foreign | |||||||||||||||||||||||
| Harriman | Currency | |||||||||||||||||||||||
| Contracts | $ | 10,864 | $ | — | $ | — | $ | — | $ | 10,864 | ||||||||||||||
| (A) | Net amount represents the net amount receivable from the counterparty in the event of default. |
The following table presents the Arbitrage and Merger Arbitrage Funds’ liabilities net of amounts available for offset under MNA and net of the related collateral pledged by the Fund as of September 30, 2017:
| Gross | ||||||||||||||||||||||||
| Amount | ||||||||||||||||||||||||
| Available | ||||||||||||||||||||||||
| for Offset in | ||||||||||||||||||||||||
| Gross | Statement | Non- | ||||||||||||||||||||||
| Amount of | of Assets | Cash | Cash | |||||||||||||||||||||
| Recognized | and | Collateral | Collateral | Net | ||||||||||||||||||||
| Fund | Counterparty | Derivative Type | Liabilities | Liabilities | Pledged | Pledged | Amount(A) | |||||||||||||||||
| Arbitrage Fund | Pershing LLC | Written | ||||||||||||||||||||||
| Options | $ | 83,080 | $ | — | $ | (29,702 | ) | $ | (53,378 | ) | $ | — | ||||||||||||
| Merger Arbitrage Fund | Pershing LLC | Written | ||||||||||||||||||||||
| Options | 65,245 | — | (56,903 | ) | (8,342 | ) | — | |||||||||||||||||
| (A) | Net amount represents the net amount payable due to the counterparty in the event of default. |
| 171 |
Notes to Financial Statements (Continued)
The following table sets forth the fair value of the Arbitrage and Merger Arbitrage Funds’ derivative financial instruments by primary risk exposure as of September 30, 2017:
| Fair Value of Derivative Investments | ||||||||||
| as of September 30, 2017 | ||||||||||
| Derivatives not accounted for as hedging | Asset | Liability | ||||||||
| Fund | instruments under ASC 815 | Derivatives | Derivatives | |||||||
| Arbitrage Fund | Purchased Options-Equity Contracts* | $ | 40,795 | $ | — | |||||
| Written Options-Equity Contracts** | — | (83,080 | ) | |||||||
| Forward Foreign Currency Contracts*** | 18,521 | — | ||||||||
| Merger Arbitrage Fund | Purchased Options-Equity Contracts* | 34,290 | — | |||||||
| Written Options-Equity Contracts** | — | (65,245 | ) | |||||||
| Forward Foreign Currency Contracts*** | 10,864 | — | ||||||||
* Statements of Assets and Liabilities Location: Investments, at market value.
** Statements of Assets and Liabilities Location: Written options, at market value.
*** Statements of Assets and Liabilities Location: Unrealized appreciation on forward foreign currency contracts.
The following table sets forth the effect of the Active Bond, Arbitrage and Merger Arbitrage Funds’ derivative financial instruments by primary risk exposure on the Statements of Operations for the year ended September 30, 2017:
| The Effect of Derivative Investments on the Statement of Operations | ||||||||||
| for the Year Ended September 30, 2017 | ||||||||||
| Change in | ||||||||||
| Unrealized | ||||||||||
| Realized Gain | Appreciation | |||||||||
| Derivatives not accounted for as hedging | (Loss) | (Depreciation) | ||||||||
| Fund | instruments under ASC 815 | on Derivatives | on Derivatives | |||||||
| Active Bond Fund | Futures-Interest Rate Contracts* | $ | (66,849 | ) | $ | — | ||||
| Arbitrage Fund | Purchased Options-Equity Contracts** | (912,397 | ) | (24,339 | ) | |||||
| Written Options-Equity Contracts*** | 2,024,238 | (892 | ) | |||||||
| Forward Foreign Currency Contracts**** | (39,150 | ) | (50,308 | ) | ||||||
| Merger Arbitrage Fund | Purchased Options-Equity Contracts** | (988,682 | ) | (4,304 | ) | |||||
| Written Options-Equity Contracts*** | 2,110,729 | (22,071 | ) | |||||||
| Forward Foreign Currency Contracts**** | 125,995 | (58,148 | ) | |||||||
* Statements of Operations Location: Net realized losses on futures contracts.
** Statements of Operations Location: Net realized gains on investments and net change in unrealized appreciation (depreciation) on investments, respectively.
*** Statements of Operations Location: Net realized gains on written options and net change in unrealized appreciation (depreciation) on written options, respectively.
**** Statements of Operations Location: Net realized gains (losses) on forward foreign currency contracts and net change in unrealized appreciation (depreciation) on forward foreign currency contracts, respectively.
| 172 |
Notes to Financial Statements (Continued)
For the year ended September 30, 2017, the average quarterly balances of outstanding derivative financial instruments were as follows:
| Active | Merger | |||||||||||
| Bond | Arbitrage | Arbitrage | ||||||||||
| Fund | Fund | Fund | ||||||||||
| Equity contracts: | ||||||||||||
| Purchased Options - Cost | $ | — | $ | 124,169 | $ | 129,147 | ||||||
| Written Options - Premiums received | $ | — | $ | 134,856 | $ | 129,931 | ||||||
| Forward foreign currency contracts: | ||||||||||||
| Average U.S. dollar amount received | $ | — | $ | 6,600,984 | $ | 5,200,836 | ||||||
| Interest rate contracts: | ||||||||||||
| Futures Contracts - Average notional value | $ | 5,845,422 | $ | — | $ | — | ||||||
Portfolio securities loaned — The Funds may lend their portfolio securities. Lending portfolio securities exposes the Funds to the risk that the borrower may fail to return the loaned securities or may not be able to provide additional collateral or that the Funds may experience delays in recovery of the loaned securities or loss of rights in the collateral if the borrower fails financially. To minimize these risks, the borrower must agree to maintain cash collateral with the Funds’ custodian. The loaned securities are secured by collateral valued at least equal, at all times, to the market value of the loaned securities plus accrued interest, if any. When the collateral falls below specified amounts, the lending agent will use its best effort to obtain additional collateral on the next business day to meet required amounts under the security lending agreement. The cash collateral is reinvested by the Funds’ custodian into an approved short-term investment vehicle. The approved short-term investment vehicle is subject to market risk.
As of September 30, 2017, the following Funds loaned securities and received collateral as follows:
| Market | Market | |||||||||||||
| Value of | Value of | |||||||||||||
| Securities | Collateral | Net | ||||||||||||
| Fund | Security Type | Loaned* | Received** | Amount*** | ||||||||||
| Active Bond Fund | Corporate Bonds | $ | 743,226 | $ | 766,137 | $ | 22,911 | |||||||
| Arbitrage Fund | Exchange Traded Funds | 25,727 | 26,649 | 922 | ||||||||||
| Common Stocks | 7,839,667 | 7,968,983 | 129,316 | |||||||||||
| Total Arbitrage Fund | 7,865,394 | 7,995,632 | 130,238 | |||||||||||
| Emerging Markets Small Cap Fund | Common Stocks | 282,592 | 295,388 | 12,796 | ||||||||||
| High Yield Fund | Corporate Bonds | 1,401,729 | 1,467,010 | 65,281 | ||||||||||
| Mid Cap Value Fund | Common Stocks | 18,923,622 | 19,265,914 | 342,292 | ||||||||||
| Premium Yield Equity Fund | Common Stocks | 1,993,197 | 2,017,911 | 24,714 | ||||||||||
| Sands Capital Select Growth Fund | Common Stocks | 49,257,364 | 50,169,710 | 912,346 | ||||||||||
| Small Cap Fund | Common Stocks | 17,878,002 | 18,630,416 | 752,414 | ||||||||||
| Small Cap Value Fund | Common Stocks | 5,951,490 | 6,055,485 | 103,995 | ||||||||||
| Total Return Bond Fund | Corporate Bonds | 318,270 | 327,231 | 8,961 | ||||||||||
* The remaining contractual maturity is overnight for all securities.
** Gross amount of recognized liabilities for securities lending is included in the Statements of Assets and Liabilities.
*** Net amount represents the net amount payable due to the borrower in the event of default.
All cash collateral is received, held, and administered by the Funds’ custodian for the benefit of the lending Fund in its custody account or other account established for the purpose of holding collateral.
Funds participating in securities lending receive compensation in the form of fees. Securities lending income is derived from lending long securities from the Funds to creditworthy approved borrowers at rates that are determined based on daily trading volumes, float, short-term interest rates and market liquidity and is shown net of fees on the Statements of Operations. When a Fund lends securities, it retains the interest or dividends
| 173 |
Notes to Financial Statements (Continued)
on the investment of any cash received as collateral, and the Fund continues to receive interest or dividends on the loaned securities.
Unrealized gain or loss on the market value of the loaned securities that may occur during the term of the loan is recognized by the Fund. The Fund has the right under the lending agreement to recover any loaned securities from the borrower on demand.
When-issued or delayed delivery transactions — Each Fund may purchase or sell securities on a when-issued or delayed delivery basis. These transactions involve a commitment by the Fund to purchase or sell securities for a predetermined price or yield, with payment and delivery taking place beyond the customary settlement period. When delayed delivery purchases are outstanding, the Fund will set aside liquid assets in an amount sufficient to meet the purchase price. When purchasing a security on a delayed delivery basis, the Fund assumes the rights and risks of ownership of the security, including the risk of price and yield fluctuations, and takes such fluctuations into account when determining NAV. The Fund may dispose of or renegotiate a delayed delivery transaction after it is entered into, and may sell when-issued securities before they are delivered, which may result in a capital gain or loss. When the Fund has sold a security on a delayed delivery basis, the Fund does not participate in future gains and losses with respect to the security.
Share valuation — The NAV per share of each class of shares of each Fund is calculated daily by dividing the total value of a Fund’s assets attributable to that class, less liabilities attributable to that class, by the number of outstanding shares of that class.
The maximum offering price per share of Class A shares of the Funds (except the Active Bond Fund, High Yield Fund, Total Return Bond Fund and Ultra Short Duration Fixed Income Fund) is equal to the NAV per share plus a sales load equal to 6.10% of the NAV (or 5.75% of the offering price). The maximum offering price per share of Class A shares of the Active Bond Fund, High Yield Fund and Total Return Bond Fund is equal to the NAV per share plus a sales load equal to 4.99% of the NAV (or 4.75% of the offering price). The maximum offering price per share of Class A shares of the Ultra Short Duration Fixed Income Fund is equal to the NAV per share plus sales load equal to 2.04% of the NAV (or 2.00% of the offering price). There is no sales load on purchases of $1 million or more of Class A shares. The maximum offering price per share of Classes C, Y, Z, and Institutional Class shares of the Funds is equal to the NAV per share.
The redemption price per share of each class of shares of the Funds is generally equal to the NAV per share. However, Class A redemptions that were part of a no-load $1 million subscription may be subject to a contingent deferred sales charge (“CDSC”) of up to 1.00% if redeemed within a one-year period from the date of purchase. Additionally, purchases of Class C shares of the Funds are subject to a CDSC of 1.00%. The CDSC will be assessed on an amount equal to the lesser of (1) the NAV at the time of purchase of the shares being redeemed or (2) the NAV of such shares being redeemed, if redeemed within a one-year period from the date of purchase.
Investment income — Dividend income from securities is recognized on the ex-dividend date, net of foreign withholding taxes, if any, which are reduced by any amounts reclaimable by the Funds, where applicable. Interest income from securities is recorded on the basis of interest accrued, premium amortized and discount accreted. Realized gains and losses resulting from principal paydowns on mortgage-backed and asset-backed securities are included in interest income. Market discounts, original issue discount (“OID”) and market premiums on debt securities are accreted/amortized to interest income over the life of the security with a corresponding adjustment in the cost basis of that security. In addition, it is the Funds’ policy to accrue for foreign capital gains taxes, if applicable, on certain foreign securities held by the Funds. An estimated foreign capital gains tax is recorded daily on net unrealized gains on these securities and is payable upon the sale of such securities when a gain is realized.
| 174 |
Notes to Financial Statements (Continued)
Distributions to shareholders — Each Fund intends to distribute to its shareholders substantially all of its income and capital gains. The Arbitrage Fund, Emerging Markets Small Cap Fund, Merger Arbitrage Fund, Mid Cap Fund, and Small Cap Fund distribute their income, if any, annually, as a dividend to shareholders. The Mid Cap Value Fund, Sands Capital Select Growth Fund, and Small Cap Value Fund declare and distribute their income, if any, quarterly, as a dividend to shareholders. The Active Bond Fund, High Yield Fund, Premium Yield Equity Fund and Total Return Bond Fund declare and distribute their income, if any, monthly, as a dividend to shareholders. The Ultra Short Duration Fixed Income Fund declares its income, if any, daily, and distributes such income monthly, as a dividend to shareholders. Each Fund makes distributions of capital gains, if any, at least annually, net of applicable capital loss carryforwards. Income distributions and capital gain distributions are determined in accordance with income tax regulations. Recognition of the Funds’ net investment income from investments in Underlying Funds is affected by the timing of dividend declarations by the Underlying Funds.
Allocations — Investment income earned, realized capital gains and losses, and unrealized appreciation and depreciation for a Fund are allocated daily to each class of shares based upon its proportionate share of total net assets of the Fund. Class-specific expenses are charged directly to the class incurring the expense. Common expenses, which are not attributable to a specific class, are allocated daily to each class of shares based upon their proportionate share of total net assets of the Fund. Expenses not directly billed to a Fund are allocated proportionally among all the Funds in the Trust, and, if applicable,Touchstone Institutional Funds Trust, Touchstone Strategic Trust and Touchstone Variable Series Trust (collectively with the Trust, “Touchstone Fund Complex”), daily in relation to net assets of each Fund or another reasonable measure.
Security transactions — Security transactions are reflected for financial reporting purposes as of the trade date. Realized gains and losses on sales of portfolio securities are calculated using the identified cost basis.
Estimates — The preparation of financial statements in conformity with U.S. GAAP requires management to make estimates and assumptions that affect the reported amounts of assets and liabilities and disclosure of contingent assets and liabilities at the date of the financial statements and the reported amounts of income and expenses during the reporting period. Actual results could differ from those estimates.
3. Investment Transactions
Investment transactions (excluding short-term investments and U.S. Government securities) were as follows for the year ended September 30, 2017:
| Active | Emerging | |||||||||||||||
| Bond | Arbitrage | Markets Small | High Yield | |||||||||||||
| Fund | Fund | Cap Fund | Fund | |||||||||||||
| Purchases of investment securities | $ | 552,246,079 | $ | 734,322,590 | $ | 14,899,882 | $ | 156,721,242 | ||||||||
| Proceeds from sales and maturities | $ | 539,821,518 | $ | 665,624,548 | $ | 12,372,159 | $ | 156,265,720 | ||||||||
| Merger | Mid Cap | |||||||||||||||
| Arbitrage | Mid Cap | Value | Premium Yield | |||||||||||||
| Fund | Fund | Fund | Equity Fund | |||||||||||||
| Purchases of investment securities | $ | 617,862,505 | $ | 140,055,793 | $ | 342,111,004 | $ | 52,169,861 | ||||||||
| Proceeds from sales and maturities | $ | 603,328,861 | $ | 161,424,192 | $ | 259,014,649 | $ | 89,562,713 | ||||||||
| Sands Capital | Small Cap | Total Return | ||||||||||||||
| Select Growth | Small Cap | Value | Bond | |||||||||||||
| Fund | Fund | Fund* | Fund | |||||||||||||
| Purchases of investment securities | $ | 550,714,063 | $ | 80,335,590 | $ | 90,786,615 | $ | 57,920,999 | ||||||||
| Proceeds from sales and maturities | $ | 1,723,028,437 | $ | 491,468,743 | $ | 201,048,336 | $ | 26,901,699 | ||||||||
| 175 |
Notes to Financial Statements (Continued)
| Ultra Short | ||||
| Duration Fixed | ||||
| Income Fund | ||||
| Purchases of investment securities | $ | 715,912,615 | ||
| Proceeds from sales and maturities | $ | 612,974,673 | ||
*Small Cap Value Fund had a redemption-in-kind on April 7, 2017, which resulted in a redemption out of the fund of $103,960,665 and is excluded from the proceeds from sales and maturities. The redemption was comprised of securities and cash in the amount of $102,794,327 and $1,166,338, respectively.
For the year ended September 30, 2017, purchases and proceeds from sales and maturities in U.S. Government Securities were $528,309,514 and $509,365,153, respectively, for the Active Bond Fund, $26,222,027 and $12,778,477, respectively, for the Total Return Bond Fund and $86,415,706 and $93,704,044, respectively, for the Ultra Short Duration Fixed Income Fund. There were no purchases or proceeds from sales and maturities of U.S. Government Securities by the remaining Funds for the year ended September 30, 2017.
4. Transactions with Affiliates and Other Related Parties
Certain officers of the Trust are also officers of Touchstone Advisors, Inc. (the “Advisor”),Touchstone Securities, Inc. (the “Underwriter”), or The Bank of New York Mellon, the Sub-Administrator to the Funds and BNY Mellon Investment Servicing (U.S.) Inc., the Transfer Agent to the Funds (collectively referenced to herein as “BNY Mellon”). Such officers receive no compensation from the Trust. The Advisor and the Underwriter are each wholly-owned, indirect subsidiaries of Western & Southern Financial Group, Inc. (“Western & Southern”).
On behalf of the Funds, the Advisor pays each Independent Trustee a quarterly retainer plus additional retainers to the Lead Independent Trustee and the chairs of each standing committee. Interested Trustees do not receive compensation from the Funds. Each Independent Trustee also receives compensation for each Board meeting and committee meeting attended. Each standing committee chair receives additional compensation for each committee meeting that he or she oversees. The Advisor is reimbursed by the Funds for the Independent Trustees’ compensation and out-of-pocket expenses relating to their services. The Funds accrued Trustee-related expenses of $202,891 for the year ended September 30, 2017.
MANAGEMENT & EXPENSE LIMITATION AGREEMENTS
The Advisor provides general investment supervisory services for the Funds, under the terms of an advisory agreement (the “Advisory Agreement”). Under the Advisory Agreement, each Fund pays the Advisor a fee, which is computed and accrued daily and paid monthly, at an annual rate based on average daily net assets of each Fund as shown in the table below.
| Active Bond Fund | 0.40% on the first $300 million |
| 0.35% on such assets in excess of $300 million | |
| Arbitrage Fund | 1.05% on the first $500 million |
| 1.00% on the next $500 million | |
| 0.95% on such assets over $1 billion | |
| Emerging Markets Small Cap Fund | 1.05% on the first $200 million |
| 1.00% on the next $200 million | |
| 0.90% on such assets over $400 million | |
| High Yield Fund | 0.60% on the first $50 million |
| 0.50% on the next $250 million | |
| 0.45% on such assets in excess of $300 million | |
| Merger Arbitrage Fund | 1.05% |
| 176 |
Notes to Financial Statements (Continued)
| Mid Cap Fund | 0.80% on the first $500 million |
| 0.75% on the next $500 million | |
| 0.70% on such assets over $1 billion | |
| Mid Cap Value Fund | 0.85% on the first $100 million |
| 0.80% on the next $300 million | |
| 0.75% on such assets over $400 million | |
| Premium Yield Equity Fund | 0.70% on the first $100 million |
| 0.65% on such assets over $100 million | |
| Sands Capital Select Growth Fund | 0.85% on the first $1 billion |
| 0.80% on the next $500 million | |
| 0.75% on the next $500 million | |
| 0.70% on such assets over $2 billion | |
| Small Cap Fund | 0.85% |
| Small Cap Value Fund | 0.90% |
| Total Return Bond Fund | 0.35% |
| Ultra Short Duration Fixed Income Fund | 0.25% |
In addition to the base advisory fee shown above for the Sands Capital Select Growth Fund, a performance fee adjustment will be added to or subtracted from the base advisory fee depending on the performance of the Fund in relation to the investment performance of the Fund’s benchmark index, for the preceding twelve month period, as follows:
| Annual | Highest / Lowest | |||||||||||||
| Benchmark | Benchmark | Adjustment | Possible Advisory | |||||||||||
| Index | Threshold | Rate | Fee | |||||||||||
| Russell1000® | ||||||||||||||
| Sands Capital Select Growth Fund | Growth Index | +/-2.50% | +/-0.15% | 1.00% / 0.55% |
For the year ended September 30, 2017, the Advisor’s base fee was decreased by $1,471,841 as a result of the performance fee adjustment.
The Advisor has entered into investment sub-advisory agreements with the following parties (each, a “Sub-Advisor”):
| Copper Rock Capital Partners LLC | The London Company |
| Emerging Markets Small Cap Fund | Mid Cap Fund |
| Small Cap Fund | |
| EARNEST Partners LLC | |
| Total Return Bond Fund | Longfellow Investment Management Co. |
| Arbitrage Fund | |
| Fort Washington Investment Advisors, Inc.* | Merger Arbitrage Fund |
| Active Bond Fund | |
| High Yield Fund | Miller/Howard Investments, Inc. |
| Ultra Short Duration Fixed Income Fund | Premium Yield Equity Fund |
| LMCG Investments, LLC | |
| Mid Cap Value Fund | Sands Capital Management, LLC |
| Small Cap Value Fund | Sands Capital Select Growth Fund |
*Affiliate of the Advisor and wholly-owned indirect subsidiary of Western & Southern.
The Advisor, not the Funds, pays sub-advisory fees to each Sub-Advisor.
| 177 |
Notes to Financial Statements (Continued)
The Advisor entered into an expense limitation agreement (the “Expense Limitation Agreement”) to contractually limit the annual operating expenses of the Funds, excluding: dividend and interest expenses relating to short sales; interest; taxes; brokerage commissions and other transaction costs; portfolio transactions and investment related expenses; other expenditures which are capitalized in accordance with U.S. GAAP; the cost of “Acquired Fund Fees and Expenses”, if any; and other extraordinary expenses not incurred in the ordinary course of business. The maximum annual operating expense limit in any year with respect to the Funds is based on a percentage of the average daily net assets of the Funds. The Advisor has agreed to separately waive class-level expenses, advisory fees and administration fees, and to reimburse expenses in order to maintain the following expense limitations for the Funds:
| Institutional | ||||||||||||||||||||
| Class A | Class C | Class Y | Class Z | Class | ||||||||||||||||
| Active Bond Fund | 0.90 | % | 1.65 | % | 0.65 | % | — | 0.57 | % | |||||||||||
| Arbitrage Fund | 1.68 | % | 2.43 | % | 1.43 | % | — | 1.28 | % | |||||||||||
| Emerging Markets Small Cap Fund | 1.69 | % | 2.44 | % | 1.44 | % | — | 1.29 | % | |||||||||||
| High Yield Fund | 1.05 | % | 1.80 | % | 0.80 | % | — | 0.72 | % | |||||||||||
| Merger Arbitrage Fund | 1.68 | % | 2.43 | % | 1.43 | % | — | 1.28 | % | |||||||||||
| Mid Cap Fund | 1.24 | % | 1.99 | % | 0.99 | % | 1.24 | % | 0.92 | % | ||||||||||
| Mid Cap Value Fund | 1.27 | % | 2.02 | % | 1.02 | % | — | 0.89 | % | |||||||||||
| Premium Yield Equity Fund | 1.20 | % | 1.95 | % | 0.95 | % | — | — | ||||||||||||
| Sands Capital Select Growth Fund* | 0.25 | % | 0.25 | % | 0.25 | % | 0.25 | % | — | |||||||||||
| Small Cap Fund | 1.38 | % | 2.13 | % | 1.13 | % | — | 1.05 | % | |||||||||||
| Small Cap Value Fund | 1.38 | % | 2.13 | % | 1.13 | % | — | 0.98 | % | |||||||||||
| Total Return Bond Fund | 0.85 | % | 1.60 | % | 0.60 | % | — | 0.50 | % | |||||||||||
| Ultra Short Duration Fixed Income Fund | 0.69 | % | 1.19 | % | 0.44 | % | 0.69 | % | 0.39 | % | ||||||||||
*The Expense Limitation Agreement for Sands Capital Select Growth Fund limits other operating expenses to 0.25% for all classes of the Fund. Other operating expenses include all operating expenses of the Fund except for investment advisory fees, administration fees, performance fees, distribution fees (12b-1), shareholder service fees and any expenses excluded in the Expense Limitation Agreement.
These expense limitations will remain in effect for all Funds through at least January 29, 2018, but can be terminated by a vote of the Funds’ Board if it deems the termination to be beneficial to the Funds’ shareholders.
During the year ended September 30, 2017, the Advisor or its affiliates waived investment advisory fees and administration fees or reimbursed expenses, including distribution fees of the Funds, as follows:
| Other | ||||||||||||||||
| Operating | ||||||||||||||||
| Investment | Expenses | |||||||||||||||
| Advisory | Administration | Reimbursed/ | ||||||||||||||
| Fees Waived | Fees Waived | Waived | Total | |||||||||||||
| Active Bond Fund | $ | — | $ | 145,404 | $ | 137,088 | $ | 282,492 | ||||||||
| Arbitrage Fund | — | — | 48,650 | 48,650 | ||||||||||||
| Emerging Markets Small Cap Fund | 115,252 | 15,916 | 149,148 | 280,316 | ||||||||||||
| High Yield Fund | — | 20,426 | 160,569 | 180,995 | ||||||||||||
| Merger Arbitrage Fund | — | — | 42,403 | 42,403 | ||||||||||||
| Mid Cap Fund | — | 194,220 | 475,271 | 669,491 | ||||||||||||
| Mid Cap Value Fund | — | 415,144 | 230,476 | 645,620 | ||||||||||||
| Premium Yield Equity Fund | — | — | 110,170 | 110,170 | ||||||||||||
| Sands Capital Select Growth Fund | — | — | 528,582 | 528,582 | ||||||||||||
| Small Cap Fund | — | — | 89,097 | 89,097 | ||||||||||||
| Small Cap Value Fund | 221,366 | 208,655 | 251,607 | 681,628 | ||||||||||||
| Total Return Bond Fund | — | 93,570 | 182,044 | 275,614 | ||||||||||||
| Ultra Short Duration Fixed Income Fund | — | 227,756 | 279,451 | 507,207 | ||||||||||||
| 178 |
Notes to Financial Statements (Continued)
Under the terms of the Expense Limitation Agreement, the Advisor is entitled to recover, subject to approval by the Funds’ Board, such amounts waived or reimbursed for a period of up to three years from the year in which the Advisor reduced its compensation or assumed expenses for the Funds. No recoupment will occur unless a Fund’s operating expenses are below the expense limitation amount in effect at the time of the waiver or reimbursement.
As of September 30, 2017, the Advisor may seek recoupment of previously waived fees and reimbursed expenses as follows:
| Expiration | Expiration | Expiration | ||||||||||||||
| Fund | September 30, 2018 | September 30, 2019 | September 30, 2020 | Total | ||||||||||||
| Active Bond Fund | $ | 248,771 | $ | 236,361 | $ | 224,157 | $ | 709,289 | ||||||||
| Arbitrage Fund | 2,350 | 8,272 | 15,946 | 26,568 | ||||||||||||
| Emerging Markets Small Cap Fund | 117,715 | 353,948 | 264,662 | 736,325 | ||||||||||||
| High Yield Fund | 125,918 | 149,452 | 122,090 | 397,460 | ||||||||||||
| Merger Arbitrage Fund | — | — | 19,966 | 19,966 | ||||||||||||
| Mid Cap Fund | 632,713 | 545,460 | 576,954 | 1,755,127 | ||||||||||||
| Mid Cap Value Fund | 411,352 | 438,591 | 595,975 | 1,445,918 | ||||||||||||
| Premium Yield Equity Fund | 28,340 | 71,385 | 46,012 | 145,737 | ||||||||||||
| Sands Capital Select Growth Fund | 946,969 | 831,974 | 528,582 | 2,307,525 | ||||||||||||
| Small Cap Fund | — | 38,604 | 38,986 | 77,590 | ||||||||||||
| Small Cap Value Fund | 144,541 | 159,191 | 462,615 | 766,347 | ||||||||||||
| Total Return Bond Fund | 170,094 | 206,835 | 243,198 | 620,127 | ||||||||||||
| Ultra Short Duration Fixed Income Fund | 465,366 | 500,874 | 457,716 | 1,423,956 | ||||||||||||
The Advisor did not recoup any amounts it previously waived or reimbursed during the year ended September 30, 2017.
ADMINISTRATION AGREEMENT
The Advisor entered into an Administration Agreement with the Trust, whereby the Advisor is responsible for supplying executive and regulatory compliance services; supervising the preparation of tax returns; coordinating the preparation of reports to shareholders and reports to, and filings with the SEC and state securities authorities, as well as materials for meetings of the Board; calculating the daily NAV per share; and maintaining the financial books and records of each Fund.
For its services, the Advisor’s annual administrative fee is:
0.145% on the first $20 billion of the aggregate average daily net assets;
0.11% on the next $10 billion of aggregate average daily net assets;
0.09% on the next $10 billion of aggregate average daily net assets; and
0.07% on the aggregate average daily net assets over $40 billion.
The fee is computed and allocated among the Touchstone Fund Complex (excluding Touchstone Institutional Funds Trust) on the basis of relative daily net assets.
The Advisor has engaged BNY Mellon as the Sub-Administrator to theTrust. BNY Mellon provides administrative and accounting services to the Trust and is compensated directly by the Advisor, not the Trust.
TRANSFER AGENT AGREEMENT
Under the terms of the Transfer Agent Agreement between the Trust and BNY Mellon, BNY Mellon maintains the records of each shareholder’s account, answers shareholders’ inquiries concerning their accounts, processes purchases and redemptions of each Fund’s shares, acts as dividend and distribution disbursing agent, and performs
| 179 |
Notes to Financial Statements (Continued)
other shareholder service functions. For these services, BNY Mellon receives a monthly fee from each Fund. In addition, each Fund pays out-of-pocket expenses incurred by BNY Mellon, including, but not limited to, postage and supplies.
The Funds may reimburse the Advisor for fees paid to intermediaries such as banks, broker-dealers, financial advisors or other financial institutions for sub-transfer agency, sub-administration and other services provided to investors whose shares of record are held in omnibus, other group accounts, retirement plans or accounts traded through registered securities clearing agents. These fees may vary based on, for example, the nature of services provided, but generally range up to 0.15% of the assets of the class serviced or maintained by the intermediary or up to $22 per sub-account maintained by the intermediary.
PLANS OF DISTRIBUTION AND SHAREHOLDER SERVICING FEE ARRANGEMENTS
The Trust has adopted distribution plans pursuant to Rule 12b-1 under the 1940 Act for each class of shares it offers that is subject to 12b-1 distribution fees. The plans allow each Fund to pay distribution and other fees for the sale and distribution of its shares and for services provided to shareholders. The fees charged to the Funds are limited to the actual expenses incurred. Under the Class A plan, each Fund offering Class A shares, excluding the Active Bond Fund and High Yield Fund, pays an annual fee of up to 0.25% of average daily net assets that are attributable to Class A shares. The Active Bond Fund and High Yield Fund pay an annual fee of up to 0.35% of average daily net assets that are attributable to Class A shares. The Active Bond Fund and High Yield Fund currently limit the 12b-1 fees for Class A shares to 0.25% of average daily net assets attributable to such shares. Under the Class C plan, each Fund offering Class C shares (except the Ultra Short Duration Fixed Income Fund) pays an annual fee of up to 1.00% of average daily net assets that are attributable to Class C shares (of which up to 0.75% is a distribution fee and up to 0.25% is a shareholder servicing fee). The Ultra Short Duration Fixed Income Fund has limited the amount of the 12b-1 fees for Class C shares to 0.75% of average daily net assets through January 29, 2018. Under the Class Z plan, each Fund offering Class Z shares pays an annual shareholder servicing fee of up to 0.25% of average daily net assets that are attributed to Class Z shares.
UNDERWRITING AGREEMENT
The Underwriter is the Funds’ principal underwriter and, as such, acts as exclusive agent for distribution of the Funds’ shares. Under the terms of the Underwriting Agreement between the Trust and the Underwriter, the Underwriter earned underwriting and broker commissions on the sale of Class A shares of the Funds. W&S Brokerage Services, Inc., an affiliate of the Underwriter and the Advisor, also earned broker commissions on the sale of Class A shares of the Funds. Listed below are the total underwriting and broker commissions earned by the Underwriter and its affiliate during the year ended September 30, 2017:
| Fund | Amount | |||
| Active Bond Fund | $ | 11,618 | ||
| Arbitrage Fund | 6,716 | |||
| Emerging Markets Small Cap Fund | 1,330 | |||
| High Yield Fund | 8,372 | |||
| Merger Arbitrage Fund | 1,317 | |||
| Mid Cap Fund | 21,448 | |||
| Mid Cap Value Fund | 16,758 | |||
| Premium Yield Equity Fund | 10,073 | |||
| Sands Capital Select Growth Fund | 15,099 | |||
| Small Cap Fund | 814 | |||
| Small Cap Value Fund | 4,012 | |||
| Total Return Bond Fund | 1,238 | |||
| Ultra Short Duration Fixed Income Fund | 1,786 | |||
| 180 |
Notes to Financial Statements (Continued)
In addition, the Underwriter collected CDSC on the redemption of Class C shares of the Funds listed below during the year ended September 30, 2017:
| Fund | Amount | |||
| Active Bond Fund | $ | 19 | ||
| Arbitrage Fund | 97 | |||
| Emerging Markets Small Cap Fund | 16 | |||
| High Yield Fund | 13 | |||
| Mid Cap Fund | 693 | |||
| Mid Cap Value Fund | 935 | |||
| Sands Capital Select Growth Fund | 3,501 | |||
| Small Cap Value Fund | 3 | |||
| Total Return Bond Fund | 467 | |||
| Ultra Short Duration Fixed Income Fund | 256 | |||
INTERFUND TRANSACTIONS
The Funds may engage in purchase and sale transactions with funds that have a common investment advisor (or affiliated investment advisors), common Trustees and/or common Officers. During the year ended September 30, 2017 the Funds did not engage in any Rule 17a-7 transactions as defined under the 1940 Act.
5. Federal Tax Information
Federal income tax — It is each Fund’s policy to continue to comply with the special provisions of the Internal Revenue Code applicable to regulated investment companies. As provided therein, in any fiscal year in which a Fund so qualifies and distributes at least 90% of its investment company taxable income, the Fund (but not the shareholders) will be relieved of federal income tax on the income distributed. It is each Fund’s policy to distribute all of its taxable income and accordingly, no provision for income taxes has been made.
In order to avoid imposition of the excise tax applicable to regulated investment companies, it is also each Fund’s intention to declare and pay as dividends in each calendar year at least 98% of its investment company taxable income (earned during the calendar year) and 98.2% of its net realized capital gains (earned during the twelve months ending October 31) plus undistributed amounts from prior years.
The tax character of distributions paid for the years ended September 30, 2017 and 2016 are as follows:
| Active Bond Fund | Arbitrage Fund | |||||||||||||||
| Year Ended | Year Ended | Year Ended | Year Ended | |||||||||||||
| September 30, | September 30, | September 30, | September 30, | |||||||||||||
| 2017 | 2016 | 2017 | 2016 | |||||||||||||
| From ordinary income | $ | 2,885,074 | $ | 3,155,993 | $ | 4,688,177 | $ | 1,713,725 | ||||||||
| From long-term capital gains | — | — | — | 342,591 | ||||||||||||
| $ | 2,885,074 | $ | 3,155,993 | $ | 4,688,177 | $ | 2,056,316 | |||||||||
| Emerging Markets | ||||||||||||||||
| Small Cap Fund | High Yield Fund | |||||||||||||||
| Year Ended | Year Ended | Year Ended | Year Ended | |||||||||||||
| September 30, | September 30, | September 30, | September 30, | |||||||||||||
| 2017 | 2016 | 2017 | 2016 | |||||||||||||
| From ordinary income | $ | — | $ | 2,618,763 | $ | 11,116,195 | $ | 10,884,011 | ||||||||
| From long-term capital gains | — | — | — | — | ||||||||||||
| Total distributions | $ | — | $ | 2,618,763 | $ | 11,116,195 | $ | 10,884,011 | ||||||||
| 181 |
Notes to Financial Statements (Continued)
| Merger Arbitrage | Mid Cap | Mid Cap | ||||||||||||||||||||||
| Fund | Fund | Value Fund | ||||||||||||||||||||||
| Year Ended | Year Ended | Year Ended | Year Ended | Year Ended | Year Ended | |||||||||||||||||||
| September 30, | September 30, | September 30, | September 30, | September 30, | September 30, | |||||||||||||||||||
| 2017 | 2016 | 2017 | 2016 | 2017 | 2016 | |||||||||||||||||||
| From ordinary income | $ | 5,245,522 | $ | — | $ | 3,693,873 | $ | 365,264 | $ | 7,502,271 | $ | 7,115,657 | ||||||||||||
| From long-term capital gains | — | — | — | — | 13,872,720 | 16,030,101 | ||||||||||||||||||
| Total distributions | $ | 5,245,522 | $ | — | $ | 3,693,873 | $ | 365,264 | $ | 21,374,991 | $ | 23,145,758 | ||||||||||||
| Premium Yield | Sands Capital | Small Cap | ||||||||||||||||||||||
| Equity Fund | Select Growth Fund | Fund | ||||||||||||||||||||||
| Year Ended | Year Ended | Year Ended | Year Ended | Year Ended | Year Ended | |||||||||||||||||||
| September 30, | September 30, | September 30, | September 30, | September 30, | September 30, | |||||||||||||||||||
| 2017 | 2016 | 2017 | 2016 | 2017 | 2016 | |||||||||||||||||||
| From ordinary income | $ | 3,698,205 | $ | 3,858,988 | $ | 5,136,516 | $ | — | $ | 1,853,070 | $ | 13,028,179 | ||||||||||||
| From long-term capital gains | — | 10,256,568 | 361,190,380 | 425,346,962 | — | 65,017,255 | ||||||||||||||||||
| Total distributions | $ | 3,698,205 | $ | 14,115,556 | $ | 366,326,896 | $ | 425,346,962 | $ | 1,853,070 | $ | 78,045,434 | ||||||||||||
| Small Cap | Total Return | Ultra Short Duration | ||||||||||||||||||||||
| Value Fund | Bond Fund | Fixed Income Fund | ||||||||||||||||||||||
| Year Ended | Year Ended | Year Ended | Year Ended | Year Ended | Year Ended | |||||||||||||||||||
| September 30, | September 30, | September 30, | September 30, | September 30, | September 30, | |||||||||||||||||||
| 2017 | 2016 | 2017 | 2016 | 2017 | 2016 | |||||||||||||||||||
| From ordinary income | $ | 137,427 | $ | 911,469 | $ | 6,815,476 | $ | 6,010,128 | $ | 10,787,697 | $ | 8,481,610 | ||||||||||||
| From long-term capital gains | — | 1,833,117 | — | — | — | — | ||||||||||||||||||
| Total distributions | $ | 137,427 | $ | 2,744,586 | $ | 6,815,476 | $ | 6,010,128 | $ | 10,787,697 | $ | 8,481,610 | ||||||||||||
The following information is computed on a tax basis for each item as of September 30, 2017:
| Emerging | ||||||||||||||||
| Active Bond | Arbitrage | Markets Small Cap | High Yield | |||||||||||||
| Fund | Fund | Fund | Fund | |||||||||||||
| Tax cost of portfolio investments | $ | 125,097,436 | $ | 267,337,466 | $ | 12,673,435 | $ | 212,418,657 | ||||||||
| Gross unrealized appreciation on investments | 2,613,406 | 4,902,945 | 1,789,389 | 6,810,048 | ||||||||||||
| Gross unrealized depreciation on investments | (665,764 | ) | (6,366,470 | ) | (567,297 | ) | (1,795,031 | ) | ||||||||
| Net unrealized appreciation (depreciation) on investments | 1,947,642 | (1,463,525 | ) | 1,222,092 | 5,015,017 | |||||||||||
| Gross unrealized appreciation on short sales, derivatives and foreign currency contracts | — | 1,206,066 | 35 | — | ||||||||||||
| Gross unrealized depreciation on short sales, derivatives and foreign currency contracts | — | (3,656,931 | ) | (43,205 | ) | — | ||||||||||
| Net unrealized appreciation (depreciation) on short sales, derivatives and foreign currency contracts | — | (2,450,865 | ) | (43,170 | ) | — | ||||||||||
| Capital loss carryforwards | — | — | (97,642,883 | ) | (15,975,775 | ) | ||||||||||
| Undistributed ordinary income | 100,608 | 7,225,614 | 91,956 | 515,272 | ||||||||||||
| Undistributed capital gains | — | 366,454 | — | — | ||||||||||||
| Other temporary differences | (38,253 | ) | (162,199 | ) | (3,256 | ) | — | |||||||||
| Accumulated earnings (deficit) | $ | 2,009,997 | $ | 3,515,479 | $ | (96,375,261 | ) | $ | (10,445,486 | ) | ||||||
| 182 |
Notes to Financial Statements (Continued)
| Merger | Mid Cap | Mid Cap Value | ||||||||||
| Arbitrage Fund | Fund | Fund | ||||||||||
| Tax cost of portfolio investments | $ | 242,702,264 | $ | 617,199,395 | $ | 623,022,871 | ||||||
| Gross unrealized appreciation on investments | 4,400,792 | 165,273,442 | 115,400,847 | |||||||||
| Gross unrealized depreciation on investments | (5,472,316 | ) | (4,590,751 | ) | (27,249,035 | ) | ||||||
| Net unrealized appreciation (depreciation) on investments | (1,071,524 | ) | 160,682,691 | 88,151,812 | ||||||||
| Gross unrealized appreciation on short sales, derivatives and foreign currency contracts | 695,331 | — | — | |||||||||
| Gross unrealized depreciation on short sales, derivatives and foreign currency contracts | (3,611,526 | ) | — | — | ||||||||
| Net unrealized appreciation (depreciation) on short sales, derivatives and foreign currency contracts | (2,916,195 | ) | — | — | ||||||||
| Capital loss carryforwards | — | (70,800,792 | ) | — | ||||||||
| Undistributed ordinary income | 8,785,796 | 477,776 | 9,078,278 | |||||||||
| Undistributed capital gains | 797,071 | — | 31,199,807 | |||||||||
| Other temporary differences | (217,454 | ) | — | — | ||||||||
| Accumulated earnings (deficit) | $ | 5,377,694 | $ | 90,359,675 | $ | 128,429,897 | ||||||
| Premium | Sands Capital | |||||||||||
| Yield Equity | Select Growth | Small Cap | ||||||||||
| Fund | Fund | Fund | ||||||||||
| Tax cost of portfolio investments | $ | 105,432,401 | $ | 1,349,407,005 | $ | 172,986,048 | ||||||
| Gross unrealized appreciation | 19,619,903 | 1,281,553,518 | 80,060,283 | |||||||||
| Gross unrealized depreciation | (2,212,785 | ) | (60,538,873 | ) | (5,122,086 | ) | ||||||
| Net unrealized appreciation (depreciation) on investments | 17,407,118 | 1,221,014,645 | 74,938,197 | |||||||||
| Qualified late-year losses | — | (12,169,854 | ) | — | ||||||||
| Undistributed ordinary income | 282,429 | — | 929,602 | |||||||||
| Undistributed capital gains | 2,153,188 | 476,472,680 | 28,796,916 | |||||||||
| Accumulated earnings (deficit) | $ | 19,842,735 | $ | 1,685,317,471 | $ | 104,664,715 | ||||||
| Ultra Short | ||||||||||||
| Total | Duration | |||||||||||
| Small Cap Value | Return Bond | Fixed Income | ||||||||||
| Fund | Fund | Fund | ||||||||||
| Tax cost of portfolio investments | $ | 91,303,658 | $ | 262,898,889 | $ | 751,637,966 | ||||||
| Gross unrealized appreciation | 9,919,882 | 3,779,282 | 1,177,208 | |||||||||
| Gross unrealized depreciation | (5,699,442 | ) | (2,915,335 | ) | (1,357,530 | ) | ||||||
| Net unrealized appreciation (depreciation) on investments | 4,220,440 | 863,947 | (180,322 | ) | ||||||||
| Capital loss carryforwards | (1,969,934 | ) | (3,776,985 | ) | (24,658,808 | ) | ||||||
| Undistributed ordinary income | 18,138 | 74,296 | 505,538 | |||||||||
| Other temporary differences | — | — | (178,965 | ) | ||||||||
| Accumulated earnings (deficit) | $ | 2,268,644 | $ | (2,838,742 | ) | $ | (24,512,557 | ) | ||||
The difference between the tax cost of portfolio investments and the financial statement cost is primarily due to wash sale loss deferrals, investments in passive foreign investment company (“PFIC”) adjustments, regulated investment companies adjustments, amortization adjustments on bonds, real estate investment trusts adjustments,
| 183 |
Notes to Financial Statements (Continued)
preferred income outstanding, taxable interest on defaulted securities, and certain timing differences in the recognition of capital losses under income tax regulations and U.S. GAAP.
As of September 30, 2017, the Funds had the following capital loss carryforwards for federal income tax purposes:
| No | No | |||||||||||||||||||
| Short Term Expiring In | Expiration | Expiration | ||||||||||||||||||
| 2018 | 2019 | Short Term* | Long Term* | Total | ||||||||||||||||
| Emerging Markets Small Cap Fund | $ | — | $ | — | $ | 17,348,130 | $ | 80,294,753 | $ | 97,642,883 | ||||||||||
| High Yield Fund | — | — | — | 15,975,775 | 15,975,775 | |||||||||||||||
| Mid Cap Fund | 70,800,792 | — | — | — | 70,800,792 | |||||||||||||||
| Small Cap Value Fund | 1,969,934 | — | — | — | 1,969,934 | |||||||||||||||
| Total Return Bond Fund | — | — | 757,743 | 3,019,242 | 3,776,985 | |||||||||||||||
| Ultra Short Duration Fixed Income Fund | 3,336,624 | 933,830 | 7,744,661 | 12,643,693 | 24,658,808 | |||||||||||||||
* The Regulated Investment Company Modernization Act of 2010 (the “Act”) was enacted on December 22, 2010. The Act made changes to several tax rules impacting the Funds. The provisions of the Act first became effective for the Funds’ fiscal year ended September 30, 2012 and are applicable to all subsequent fiscal years. Although the Act provides several benefits, including the unlimited carryover of future capital losses, there may be a greater likelihood that all or a portion of each Fund’s pre-enactment capital loss carryovers may expire without being utilized due to the fact that post-enactment capital losses must be utilized before pre-enactment capital loss carryovers may be utilized. Under the Act, new capital losses may now be carried forward indefinitely, and retain the character of the original loss as compared with pre-enactment law, where capital losses could be carried forward for up to eight years, and carried forward as short-term capital losses, irrespective of the character of the original loss.
The capital loss carryforwards may be utilized in future years to offset net realized capital gains, if any, prior to distributing such gains to shareholders.
The following Funds had capital losses expiring in the current year as follows:
| Fund | Amount | |||
| Active Bond Fund | $ | 8,321,769 | ||
| Mid Cap Fund | 6,358,350 | |||
| Ultra Short Duration Fixed Income Fund | 3,231,117 | |||
During the year ended September 30, 2017, the following Funds utilized capital loss carryforwards:
| Fund | Amount | |||
| Active Bond Fund | $ | 106,191 | ||
| Emerging Markets Small Cap Fund | 1,598,247 | |||
| High Yield Fund | 5,672,963 | |||
| Mid Cap Fund | 28,871,516 | |||
| Small Cap Fund | 60,167,812 | |||
| Small Cap Value Fund | 9,365,845 | |||
Under current laws, certain capital losses realized after October 31 and ordinary losses realized after December 31 may be deferred (and certain ordinary losses after October and/or December 31 may be deferred) and treated as occurring on the first day of the following fiscal year. For the year ended September 30, 2017, the Funds did not elect to defer any losses.
The Funds have analyzed their tax positions taken on federal income tax returns for all open tax years (tax years ended September 30, 2014 through 2017) and have concluded that no provision for income tax is required in their financial statements.
Certain reclassifications, the result of permanent differences between financial statement and income tax reporting requirements, have been made to the components of capital. These reclassifications have no impact on the net assets or NAV per share of the Fund. The following reclassifications, which are primarily attributed to the tax
| 184 |
Notes to Financial Statements (Continued)
treatment of net investment losses, current year overdistributions, deemed distributions on shareholder redemptions, foreign currency gains/losses, gains/losses and dividend expenses on short sales, paydown gains/losses on mortgage-backed securities, gains/losses on passive foreign investment companies, reclassification of distributions, foreign capital gains tax, expiration of prior year capital loss carryovers,TIPs (Treasury Inflation Protected Securities) income adjustments, preferred adjustment for securities sold, re-designation of dividends paid, in-kind distributions on shareholder redemptions and prior year wash sale deferral written off due to redemption-in-kind have been made to the following Funds for the year ended September 30, 2017:
| Accumulated | Accumulated | |||||||||||
| Paid-In | Net Investment | Net Realized | ||||||||||
| Fund | Capital | Income(Loss) | Gains(Losses) | |||||||||
| Active Bond Fund | $ | (8,321,769 | ) | $ | 81,686 | $ | 8,240,083 | |||||
| Arbitrage Fund | — | 1,748,226 | (1,748,226 | ) | ||||||||
| Emerging Markets Small Cap Fund | — | (6,390 | ) | 6,390 | ||||||||
| High Yield Fund | — | 5,484 | (5,484 | ) | ||||||||
| Merger Arbitrage Fund | — | 1,439,891 | (1,439,891 | ) | ||||||||
| Mid Cap Fund | (6,358,350 | ) | — | 6,358,350 | ||||||||
| Mid Cap Value Fund | — | 134,101 | (134,101 | ) | ||||||||
| Premium Yield Equity Fund | — | 87,822 | (87,822 | ) | ||||||||
| Sands Capital Select Growth Fund | 73,438,323 | 26,161,177 | (99,599,500 | ) | ||||||||
| Small Cap Fund | 5,652,332 | (176,759 | ) | (5,475,573 | ) | |||||||
| Small Cap Value Fund | 11,268,613 | (2,081 | ) | (11,266,532 | ) | |||||||
| Total Return Bond Fund | — | 1,378,548 | (1,378,548 | ) | ||||||||
| Ultra Short Duration Fixed Income Fund | (3,231,117 | ) | 802,202 | 2,428,915 | ||||||||
6. Commitments and Contingencies
The Funds indemnify the Trust’s officers and Trustees for certain liabilities that might arise from their performance of their duties to the Funds. Additionally, in the normal course of business, the Funds enter into contracts that contain a variety of representations and warranties and which provide general indemnifications. The Funds’ maximum exposure under these arrangements is unknown, as this would involve future claims that may be made against the Funds.
7. Principal Risks
Risks Associated with Foreign Investments — Some of the Funds may invest in the securities of foreign issuers. Investing in securities issued by companies whose principal business activities are outside the U.S. may involve significant risks not present in domestic investments. For example, there is generally less publicly available information about foreign companies, particularly those not subject to the disclosure and reporting requirements of the U.S. securities laws. Foreign issuers are generally not bound by uniform accounting, auditing, and financial reporting requirements and standards of practice comparable to those applicable to domestic issuers. Investments in foreign securities also involve the risk of possible adverse changes in investment or exchange control regulations, expropriation or confiscatory taxation, limitations on the removal of funds or other assets of a Fund, political or financial instability or diplomatic and other developments which could affect such investments. Foreign stock markets, while growing in volume and sophistication, are generally not as developed as those in the U.S., and securities of some foreign issuers (particularly those located in developing countries) may be less liquid and more volatile than securities of comparable U.S. companies. In general, there is less overall governmental supervision and regulation of foreign securities markets, broker-dealers, and issuers than in the U.S.
Risks Associated with Concentration — Certain Funds may invest a high percentage of their assets in specific sectors of the market in order to achieve a potentially greater investment return. As a result, these Funds may
| 185 |
Notes to Financial Statements (Continued)
be more susceptible to economic, political, and regulatory developments in a particular sector of the market, positive or negative, and may experience increased volatility on the Funds’ NAVs and magnified effect on the total return.
Risks Associated with Credit — An issuer may be unable to make timely payments of either principal or interest. This may cause the issuer’s securities to decline in value. Credit risk is particularly relevant to those Funds that invest a significant amount of their assets in junk bonds or lower-rated securities.
Risks Associated with Interest Rate Changes — As interest rates rise, the value of fixed-income securities a Fund owns will likely decrease. The price of debt securities is generally linked to the prevailing market interest rates. In general, when interest rates rise, the price of debt securities falls, and when interest rates fall, the price of debt securities rises. The price volatility of a debt security also depends on its maturity. Longer-term securities are generally more volatile, so the longer the average maturity or duration of these securities, the greater their price risk. Duration is a measure of the expected life, taking into account any prepayment or call features of the security, that is used to determine the price sensitivity of the security for a given change in interest rates. Specifically, duration is the change in the value of a fixed-income security that will result from a 1% change in interest rates, and generally is stated in years. For example, as a general rule a 1% rise in interest rates means a 1% fall in value for every year of duration. Maturity, on the other hand, is the date on which a fixed-income security becomes due for payment of principal. The negative impact on fixed income securities if interest rates increase as a result could negatively impact a Fund’s NAV.
Risks Associated with Liquidity — Liquidity risk exists when particular investments are difficult to purchase or sell. This can reduce the Fund’s returns because the Fund may be unable to transact at advantageous times or prices, or at all.
Please see the Funds’ prospectus for complete discussion of these and other risks.
8. Fund Reorganizations
On January 27, 2017, the Touchstone Active Bond Fund and Touchstone High Yield Fund, each a series of Touchstone Investment Trust (the “Predecessor Funds”), were reorganized into the Active Bond Fund and High Yield Fund, respectively, each a new series of the Trust. As a result of the tax-free reorganization, the performance and accounting history of the Predecessor Funds were assumed by the Active Bond Fund and High Yield Fund.
9. Subsequent Events
Subsequent events occurring after the date of this report have been evaluated for potential impact to this report through the date the financial statements were issued.
At a meeting of the Board of Trustees (the “Board”) of the Trust held on April 18, 2017, the Board approved an Agreement and Plan of Reorganization for the Touchstone Ultra Short Duration Fixed Income Fund to acquire the assets of the Sentinel Low Duration Bond Fund and the Touchstone Active Bond Fund to acquire the assets of the Sentinel Government Securities Fund and the Sentinel Total Return Bond Fund, collectively the “Reorganization”. The Reorganization occurred on October 27, 2017.
There were no other subsequent events that necessitated recognition or disclosure in the Funds’ financial statements.
| 186 |
Report of Independent Registered Public Accounting Firm
To the Board of Trustees and Shareholders of Touchstone Funds Group Trust
We have audited the accompanying statements of assets and liabilities, including the portfolios of investments, of Touchstone Funds Group Trust (comprising, respectively, the Touchstone Active Bond,Touchstone Arbitrage, Touchstone Emerging Markets Small Cap, Touchstone High Yield, Touchstone Merger Arbitrage, Touchstone Mid Cap, Touchstone Mid Cap Value, Touchstone Premium Yield Equity, Touchstone Sands Capital Select Growth, Touchstone Small Cap, Touchstone Small Cap Value, Touchstone Total Return Bond and Touchstone Ultra Short Duration Fixed Income Funds) (the “Funds”) as of September 30, 2017, and the related statements of operations for the year then ended, the statements of changes in net assets for each of the two years in the period then ended and the financial highlights for each of the years or periods indicated therein. These financial statements and financial highlights are the responsibility of the Funds’ management. Our responsibility is to express an opinion on these financial statements and financial highlights based on our audits.
We conducted our audits in accordance with the standards of the Public Company Accounting Oversight Board (United States). Those standards require that we plan and perform the audits to obtain reasonable assurance about whether the financial statements and financial highlights are free of material misstatement. We were not engaged to perform an audit of the Funds’ internal control over financial reporting. Our audits included consideration of internal control over financial reporting as a basis for designing audit procedures that are appropriate in the circumstances, but not for the purpose of expressing an opinion on the effectiveness of the Funds’ internal control over financial reporting. Accordingly, we express no such opinion. An audit also includes examining, on a test basis, evidence supporting the amounts and disclosures in the financial statements and financial highlights, assessing the accounting principles used and significant estimates made by management, and evaluating the overall financial statement presentation. Our procedures included confirmation of securities owned as of September 30, 2017, by correspondence with the custodian, transfer agent, and brokers or by other appropriate auditing procedures where replies from brokers were not received. We believe that our audits provide a reasonable basis for our opinion.
In our opinion, the financial statements and financial highlights referred to above present fairly, in all material respects, the financial position of each of the respective funds constituting Touchstone Funds Group Trust at September 30, 2017, the results of their operations for the year then ended, the changes in their net assets for each of the two years in the period then ended and the financial highlights for each of the years or periods indicated therein, in conformity with U.S generally accepted accounting principles.

Cincinnati, Ohio
November 22, 2017
| 187 |
Qualified Dividend Income
Under the Jobs and Growth Tax Relief Reconciliation Act of 2003 (the “Act”), the following percentages of ordinary dividends paid during the fiscal year ended September 30, 2017 are designated as “qualified dividend income,” as defined in the Act, and are subject to reduced tax rates. The Funds intend to pass through the maximum allowable percentage for Form 1099 Div.
| Arbitrage Fund | 14.02 | % | ||
| Emerging Markets Small Cap Fund | 100.00 | % | ||
| Merger Arbitrage Fund | 20.43 | % | ||
| Mid Cap Fund | 100.00 | % | ||
| Mid Cap Value Fund | 61.25 | % | ||
| Premium Yield Equity Fund | 100.00 | % | ||
| Small Cap Fund | 100.00 | % | ||
| Small Cap Value Fund | 100.00 | % |
Dividend Received Deduction
For corporate shareholders, the following ordinary distributions paid during the current fiscal year ended September 30, 2017 qualify for the corporate dividends received deduction. The Funds intend to pass through the maximum allowable percentage.
| Arbitrage Fund | 11.58 | % | ||
| Merger Arbitrage Fund | 17.23 | % | ||
| Mid Cap Fund | 100.00 | % | ||
| Mid Cap Value Fund | 61.17 | % | ||
| Premium Yield Equity Fund | 68.31 | % | ||
| Small Cap Fund | 100.00 | % | ||
| Small Cap Value Fund | 100.00 | % |
For the fiscal year ended September 30, 2017, the Funds designated long-term capital gains as follows:
| Arbitrage Fund | $ | 366,454 | ||
| Merger Arbitrage Fund | $ | 797,071 | ||
| Mid Cap Value Fund | $ | 33,226,181 | ||
| Premium Yield Equity Fund | $ | 2,153,188 | ||
| Sands Capital Select Growth Fund | $ | 567,766,839 | ||
| Small Cap Fund | $ | 34,272,489 |
Foreign Tax Income and Foreign Tax Credit
The Emerging Markets Small Cap Fund intends to pass through a foreign tax credit to the shareholders. For the fiscal year ended September 30, 2017, the total amount of foreign source income is $364,243 or $0.30 per share. The total amount of foreign taxes to be paid is $11,999 or $0.01 per share. Shareholder’s allocable share of the foreign tax credit will be reported on Form 1099 Div.
Proxy Voting Guidelines and Proxy Voting Records
The Sub-Advisors are responsible for exercising the voting rights associated with the securities purchased and held by the Funds. A description of the policies and procedures that the Sub-Advisors use in fulfilling this responsibility is available as an appendix to the most recent Statement of Additional Information, which can be obtained without charge by calling toll free 1.800.543.0407 or by visiting the Touchstone website at TouchstoneInvestments.com or on the Securities and Exchange Commission’s (the “Commission”) website
| 188 |
Other Items (Unaudited) (Continued)
sec.gov. Information regarding how those proxies were voted during the most recent twelve-month period ended June 30 is also available without charge by calling toll free 1.800.543.0407 or on the Commission’s website at sec.gov.
Quarterly Portfolio Disclosure
The Trust files a complete listing of portfolio holdings for each Fund as of the end of the first and third quarters of each fiscal year on Form N-Q. The complete listing (i) is available on the Commission’s website; (ii) may be reviewed and copied at the Commission’s Public Reference Room in Washington, DC; or (iii) will be made available to shareholders upon request by calling 1.800.543.0407. Information on the operation of the Public Reference Room may be obtained by calling 1.800.SEC.0330.
Schedule of Shareholder Expenses
As a shareholder of the Funds, you incur two types of costs: (1) transaction costs, including reinvested dividends or other distributions; and (2) ongoing costs, including investment advisory fees; distribution (12b-1) fees; and other Fund expenses. This example is intended to help you understand your ongoing costs (in dollars) of investing in the Funds and to compare these costs with the ongoing costs of investing in other mutual funds. The example is based on an investment of $1,000 invested at the beginning of the period and held for the entire period (April 1, 2017 through September 30, 2017).
Actual Expenses
The first line for each share class of a Fund in the table below provides information about actual account values and actual expenses. You may use the information in this line, together with the amount you invested, to estimate the expenses that you paid over the period. Simply divide your account value by $1,000 (for example, an $8,600 account value divided by $1,000 = 8.6), then multiply the result by the number in the first line under the heading entitled “Expenses Paid During the Six Months Ended September 30, 2017” to estimate the expenses you paid on your account during this period.
Hypothetical Example for Comparison Purposes
The second line for each share class of a Fund in the table below provides information about hypothetical account values and hypothetical expenses based on the Funds’ actual expense ratio and an assumed rate of return of 5% per year before expenses, which is not the Funds’ actual return. The hypothetical account values and expenses may not be used to estimate the actual ending account balance or expenses you paid for the period. You may use this information to compare the ongoing costs of investing in the Funds and other funds. To do so, compare this 5% hypothetical example with the 5% hypothetical examples that appear in the shareholder reports of the other funds.
Please note that the expenses shown in the table below are meant to highlight your ongoing costs only and do not reflect any transactional costs, such as sales charges (loads), redemption fees, or exchange fees. Therefore, the second line for each share class of a Fund in the table below is useful in comparing ongoing costs only, and will not help you determine the relative total costs of owning different funds. In addition, if these transactional costs were included, your costs would have been higher.
| 189 |
Other Items (Unaudited) (Continued)
| Expenses | ||||||||||||||||||
| Net Expense | Beginning | Ending | Paid During | |||||||||||||||
| Ratio | Account | Account | the Six Months | |||||||||||||||
| Annualized | Value | Value | Ended | |||||||||||||||
| September 30, | April 1, | September 30, | September 30, | |||||||||||||||
| 2017 | 2017 | 2017 | 2017* | |||||||||||||||
| Touchstone Active Bond Fund | ||||||||||||||||||
| Class A | Actual | 0.90 | % | $ | 1,000.00 | $ | 1,022.40 | $ | 4.56 | |||||||||
| Class A | Hypothetical | 0.90 | % | $ | 1,000.00 | $ | 1,020.56 | $ | 4.56 | |||||||||
| Class C | Actual | 1.65 | % | $ | 1,000.00 | $ | 1,018.30 | $ | 8.35 | |||||||||
| Class C | Hypothetical | 1.65 | % | $ | 1,000.00 | $ | 1,016.80 | $ | 8.34 | |||||||||
| Class Y | Actual | 0.65 | % | $ | 1,000.00 | $ | 1,022.70 | $ | 3.30 | |||||||||
| Class Y | Hypothetical | 0.65 | % | $ | 1,000.00 | $ | 1,021.81 | $ | 3.29 | |||||||||
| Institutional Class | Actual | 0.57 | % | $ | 1,000.00 | $ | 1,024.10 | $ | 2.89 | |||||||||
| Institutional Class | Hypothetical | 0.57 | % | $ | 1,000.00 | $ | 1,022.21 | $ | 2.89 | |||||||||
| Touchstone Arbitrage Fund | ||||||||||||||||||
| Class A | Actual | 2.64 | % | $ | 1,000.00 | $ | 1,017.90 | 13.35 | ** | |||||||||
| Class A | Hypothetical | 2.64 | % | $ | 1,000.00 | $ | 1,011.83 | 13.31 | ** | |||||||||
| Class C | Actual | 3.39 | % | $ | 1,000.00 | $ | 1,014.30 | 17.12 | ** | |||||||||
| Class C | Hypothetical | 3.39 | % | $ | 1,000.00 | $ | 1,008.07 | 17.07 | ** | |||||||||
| Class Y | Actual | 2.34 | % | $ | 1,000.00 | $ | 1,019.70 | 11.85 | ** | |||||||||
| Class Y | Hypothetical | 2.34 | % | $ | 1,000.00 | $ | 1,013.34 | 11.81 | ** | |||||||||
| Institutional Class | Actual | 2.24 | % | $ | 1,000.00 | $ | 1,020.60 | 11.35 | ** | |||||||||
| Institutional Class | Hypothetical | 2.24 | % | $ | 1,000.00 | $ | 1,013.84 | 11.31 | ** | |||||||||
| Touchstone Emerging Markets Small Cap Fund | ||||||||||||||||||
| Class A | Actual | 1.69 | % | $ | 1,000.00 | $ | 1,148.20 | $ | 9.10 | |||||||||
| Class A | Hypothetical | 1.69 | % | $ | 1,000.00 | $ | 1,016.60 | $ | 8.54 | |||||||||
| Class C | Actual | 2.44 | % | $ | 1,000.00 | $ | 1,144.40 | $ | 13.12 | |||||||||
| Class C | Hypothetical | 2.44 | % | $ | 1,000.00 | $ | 1,012.84 | $ | 12.31 | |||||||||
| Class Y | Actual | 1.44 | % | $ | 1,000.00 | $ | 1,149.60 | $ | 7.76 | |||||||||
| Class Y | Hypothetical | 1.44 | % | $ | 1,000.00 | $ | 1,017.85 | $ | 7.28 | |||||||||
| Institutional Class | Actual | 1.29 | % | $ | 1,000.00 | $ | 1,150.90 | $ | 6.96 | |||||||||
| Institutional Class | Hypothetical | 1.29 | % | $ | 1,000.00 | $ | 1,018.60 | $ | 6.53 | |||||||||
| Touchstone High Yield Fund | ||||||||||||||||||
| Class A | Actual | 1.05 | % | $ | 1,000.00 | $ | 1,044.60 | $ | 5.38 | |||||||||
| Class A | Hypothetical | 1.05 | % | $ | 1,000.00 | $ | 1,019.80 | $ | 5.32 | |||||||||
| Class C | Actual | 1.80 | % | $ | 1,000.00 | $ | 1,039.70 | $ | 9.20 | |||||||||
| Class C | Hypothetical | 1.80 | % | $ | 1,000.00 | $ | 1,016.04 | $ | 9.10 | |||||||||
| Class Y | Actual | 0.80 | % | $ | 1,000.00 | $ | 1,045.20 | $ | 4.10 | |||||||||
| Class Y | Hypothetical | 0.80 | % | $ | 1,000.00 | $ | 1,021.06 | $ | 4.05 | |||||||||
| Institutional Class | Actual | 0.72 | % | $ | 1,000.00 | $ | 1,045.60 | $ | 3.69 | |||||||||
| Institutional Class | Hypothetical | 0.72 | % | $ | 1,000.00 | $ | 1,021.46 | $ | 3.65 | |||||||||
| 190 |
Other Items (Unaudited) (Continued)
| Expenses | ||||||||||||||||||
| Net Expense | Beginning | Ending | Paid During | |||||||||||||||
| Ratio | Account | Account | the Six Months | |||||||||||||||
| Annualized | Value | Value | Ended | |||||||||||||||
| September 30, | April 1, | September 30, | September 30, | |||||||||||||||
| 2017 | 2017 | 2017 | 2017* | |||||||||||||||
| Touchstone Merger Arbitrage Fund | ||||||||||||||||||
| Class A | Actual | 2.48 | % | $ | 1,000.00 | $ | 1,022.30 | $ | 12.57 | *** | ||||||||
| Class A | Hypothetical | 2.48 | % | $ | 1,000.00 | $ | 1,012.63 | $ | 12.51 | *** | ||||||||
| Class C | Actual | 3.23 | % | $ | 1,000.00 | $ | 1,018.40 | $ | 16.34 | *** | ||||||||
| Class C | Hypothetical | 3.23 | % | $ | 1,000.00 | $ | 1,008.87 | $ | 16.27 | *** | ||||||||
| Class Y | Actual | 2.20 | % | $ | 1,000.00 | $ | 1,023.90 | $ | 11.16 | *** | ||||||||
| Class Y | Hypothetical | 2.20 | % | $ | 1,000.00 | $ | 1,014.04 | $ | 11.11 | *** | ||||||||
| Institutional Class | Actual | 2.08 | % | $ | 1,000.00 | $ | 1,024.70 | $ | 10.56 | *** | ||||||||
| Institutional Class | Hypothetical | 2.08 | % | $ | 1,000.00 | $ | 1,014.64 | $ | 10.50 | *** | ||||||||
| Touchstone Mid Cap Fund | ||||||||||||||||||
| Class A | Actual | 1.24 | % | $ | 1,000.00 | $ | 1,080.80 | $ | 6.47 | |||||||||
| Class A | Hypothetical | 1.24 | % | $ | 1,000.00 | $ | 1,018.85 | $ | 6.28 | |||||||||
| Class C | Actual | 1.99 | % | $ | 1,000.00 | $ | 1,076.80 | $ | 10.36 | |||||||||
| Class C | Hypothetical | 1.99 | % | $ | 1,000.00 | $ | 1,015.09 | $ | 10.05 | |||||||||
| Class Y | Actual | 0.99 | % | $ | 1,000.00 | $ | 1,082.30 | $ | 5.17 | |||||||||
| Class Y | Hypothetical | 0.99 | % | $ | 1,000.00 | $ | 1,020.10 | $ | 5.01 | |||||||||
| Class Z | Actual | 1.24 | % | $ | 1,000.00 | $ | 1,080.90 | $ | 6.47 | |||||||||
| Class Z | Hypothetical | 1.24 | % | $ | 1,000.00 | $ | 1,018.85 | $ | 6.28 | |||||||||
| Institutional Class | Actual | 0.92 | % | $ | 1,000.00 | $ | 1,082.60 | $ | 4.80 | |||||||||
| Institutional Class | Hypothetical | 0.92 | % | $ | 1,000.00 | $ | 1,020.46 | $ | 4.66 | |||||||||
| Touchstone Mid Cap Value Fund | ||||||||||||||||||
| Class A | Actual | 1.27 | % | $ | 1,000.00 | $ | 1,036.60 | $ | 6.48 | |||||||||
| Class A | Hypothetical | 1.27 | % | $ | 1,000.00 | $ | 1,018.70 | $ | 6.43 | |||||||||
| Class C | Actual | 2.02 | % | $ | 1,000.00 | $ | 1,032.20 | $ | 10.29 | |||||||||
| Class C | Hypothetical | 2.02 | % | $ | 1,000.00 | $ | 1,014.94 | $ | 10.20 | |||||||||
| Class Y | Actual | 1.02 | % | $ | 1,000.00 | $ | 1,037.70 | $ | 5.21 | |||||||||
| Class Y | Hypothetical | 1.02 | % | $ | 1,000.00 | $ | 1,019.95 | $ | 5.16 | |||||||||
| Institutional Class | Actual | 0.89 | % | $ | 1,000.00 | $ | 1,038.20 | $ | 4.55 | |||||||||
| Institutional Class | Hypothetical | 0.89 | % | $ | 1,000.00 | $ | 1,020.61 | $ | 4.51 | |||||||||
| Touchstone Premium Yield Equity Fund | ||||||||||||||||||
| Class A | Actual | 1.20 | % | $ | 1,000.00 | $ | 1,047.70 | $ | 6.16 | |||||||||
| Class A | Hypothetical | 1.20 | % | $ | 1,000.00 | $ | 1,019.05 | $ | 6.07 | |||||||||
| Class C | Actual | 1.95 | % | $ | 1,000.00 | $ | 1,043.80 | $ | 9.99 | |||||||||
| Class C | Hypothetical | 1.95 | % | $ | 1,000.00 | $ | 1,015.29 | $ | 9.85 | |||||||||
| Class Y | Actual | 0.95 | % | $ | 1,000.00 | $ | 1,049.10 | $ | 4.88 | |||||||||
| Class Y | Hypothetical | 0.95 | % | $ | 1,000.00 | $ | 1,020.31 | $ | 4.81 | |||||||||
| 191 |
Other Items (Unaudited) (Continued)
| Expenses | ||||||||||||||||||
| Net Expense | Beginning | Ending | Paid During | |||||||||||||||
| Ratio | Account | Account | the Six Months | |||||||||||||||
| Annualized | Value | Value | Ended | |||||||||||||||
| September 30, | April 1, | September 30, | September 30, | |||||||||||||||
| 2017 | 2017 | 2017 | 2017* | |||||||||||||||
| Touchstone Sands Capital Select Growth Fund | ||||||||||||||||||
| Class A | Actual | 1.35 | % | $ | 1,000.00 | $ | 1,137.30 | $ | 7.23 | |||||||||
| Class A | Hypothetical | 1.35 | % | $ | 1,000.00 | $ | 1,018.30 | $ | 6.83 | |||||||||
| Class C | Actual | 2.10 | % | $ | 1,000.00 | $ | 1,132.90 | $ | 11.23 | |||||||||
| Class C | Hypothetical | 2.10 | % | $ | 1,000.00 | $ | 1,014.54 | $ | 10.61 | |||||||||
| Class Y | Actual | 1.10 | % | $ | 1,000.00 | $ | 1,139.10 | $ | 5.90 | |||||||||
| Class Y | Hypothetical | 1.10 | % | $ | 1,000.00 | $ | 1,019.55 | $ | 5.57 | |||||||||
| Class Z | Actual | 1.34 | % | $ | 1,000.00 | $ | 1,137.20 | $ | 7.18 | |||||||||
| Class Z | Hypothetical | 1.34 | % | $ | 1,000.00 | $ | 1,018.35 | $ | 6.78 | |||||||||
| Touchstone Small Cap Fund | ||||||||||||||||||
| Class A | Actual | 1.38 | % | $ | 1,000.00 | $ | 1,028.40 | $ | 7.02 | |||||||||
| Class A | Hypothetical | 1.38 | % | $ | 1,000.00 | $ | 1,018.15 | $ | 6.98 | |||||||||
| Class C | Actual | 2.13 | % | $ | 1,000.00 | $ | 1,024.80 | $ | 10.81 | |||||||||
| Class C | Hypothetical | 2.13 | % | $ | 1,000.00 | $ | 1,014.39 | $ | 10.76 | |||||||||
| Class Y | Actual | 1.13 | % | $ | 1,000.00 | $ | 1,029.60 | $ | 5.75 | |||||||||
| Class Y | Hypothetical | 1.13 | % | $ | 1,000.00 | $ | 1,019.40 | $ | 5.72 | |||||||||
| Institutional Class | Actual | 1.05 | % | $ | 1,000.00 | $ | 1,030.20 | $ | 5.34 | |||||||||
| Institutional Class | Hypothetical | 1.05 | % | $ | 1,000.00 | $ | 1,019.80 | $ | 5.32 | |||||||||
| Touchstone Small Cap Value Fund | ||||||||||||||||||
| Class A | Actual | 1.38 | % | $ | 1,000.00 | $ | 1,030.90 | $ | 7.03 | |||||||||
| Class A | Hypothetical | 1.38 | % | $ | 1,000.00 | $ | 1,018.15 | $ | 6.98 | |||||||||
| Class C | Actual | 2.13 | % | $ | 1,000.00 | $ | 1,026.90 | $ | 10.82 | |||||||||
| Class C | Hypothetical | 2.13 | % | $ | 1,000.00 | $ | 1,014.39 | $ | 10.76 | |||||||||
| Class Y | Actual | 1.13 | % | $ | 1,000.00 | $ | 1,032.00 | $ | 5.76 | |||||||||
| Class Y | Hypothetical | 1.13 | % | $ | 1,000.00 | $ | 1,019.40 | $ | 5.72 | |||||||||
| Institutional Class | Actual | 0.98 | % | $ | 1,000.00 | $ | 1,032.80 | $ | 4.99 | |||||||||
| Institutional Class | Hypothetical | 0.98 | % | $ | 1,000.00 | $ | 1,020.16 | $ | 4.96 | |||||||||
| Touchstone Total Return Bond Fund | ||||||||||||||||||
| Class A | Actual | 0.85 | % | $ | 1,000.00 | $ | 1,023.40 | $ | 4.31 | |||||||||
| Class A | Hypothetical | 0.85 | % | $ | 1,000.00 | $ | 1,020.81 | $ | 4.31 | |||||||||
| Class C | Actual | 1.60 | % | $ | 1,000.00 | $ | 1,019.60 | $ | 8.10 | |||||||||
| Class C | Hypothetical | 1.60 | % | $ | 1,000.00 | $ | 1,017.05 | $ | 8.09 | |||||||||
| Class Y | Actual | 0.60 | % | $ | 1,000.00 | $ | 1,024.70 | $ | 3.05 | |||||||||
| Class Y | Hypothetical | 0.60 | % | $ | 1,000.00 | $ | 1,022.06 | $ | 3.04 | |||||||||
| Institutional Class | Actual | 0.50 | % | $ | 1,000.00 | $ | 1,025.30 | $ | 2.54 | |||||||||
| Institutional Class | Hypothetical | 0.50 | % | $ | 1,000.00 | $ | 1,022.56 | $ | 2.54 | |||||||||
| 192 |
Other Items (Unaudited) (Continued)
| Expenses | ||||||||||||||||||
| Net Expense | Beginning | Ending | Paid During | |||||||||||||||
| Ratio | Account | Account | the Six Months | |||||||||||||||
| Annualized | Value | Value | Ended | |||||||||||||||
| September 30, | April 1, | September 30, | September 30, | |||||||||||||||
| 2017 | 2017 | 2017 | 2017* | |||||||||||||||
| Touchstone Ultra Short Duration Fixed Income Fund | ||||||||||||||||||
| Class A | Actual | 0.69 | % | $ | 1,000.00 | $ | 1,007.40 | $ | 3.47 | |||||||||
| Class A | Hypothetical | 0.69 | % | $ | 1,000.00 | $ | 1,021.61 | $ | 3.50 | |||||||||
| Class C | Actual | 1.19 | % | $ | 1,000.00 | $ | 1,004.90 | $ | 5.98 | |||||||||
| Class C | Hypothetical | 1.19 | % | $ | 1,000.00 | $ | 1,019.10 | $ | 6.02 | |||||||||
| Class Y | Actual | 0.44 | % | $ | 1,000.00 | $ | 1,008.60 | $ | 2.22 | |||||||||
| Class Y | Hypothetical | 0.44 | % | $ | 1,000.00 | $ | 1,022.86 | $ | 2.23 | |||||||||
| Class Z | Actual | 0.69 | % | $ | 1,000.00 | $ | 1,007.40 | $ | 3.47 | |||||||||
| Class Z | Hypothetical | 0.69 | % | $ | 1,000.00 | $ | 1,021.61 | $ | 3.50 | |||||||||
| Institutional Class | Actual | 0.39 | % | $ | 1,000.00 | $ | 1,008.90 | $ | 1.96 | |||||||||
| Institutional Class | Hypothetical | 0.39 | % | $ | 1,000.00 | $ | 1,023.11 | $ | 1.98 | |||||||||
| * | Expenses are equal to the Fund's annualized expense ratio, multiplied by the average account value over the period, multiplied by 183/365 (to reflect one-half year period). |
| ** | Excluding interest and dividend expenses on securities sold short, your actual cost of investment in Class A, Class C, Class Y and Institutional Class would be $8.50, $12.27, $6.99 and $6.48, respectively, and your hypothetical cost of investment in Class A, Class C, Class Y and Institutional Class would be $8.49, $12.26, $6.98, and $6.48, respectively. |
| *** | Excluding interest and dividend expenses on securities sold short, your actual cost of investment in Class A, Class C, Class Y and Institutional Class would be $8.52, $12.30, $7.10 and $6.50, respectively, and your hypothetical cost of investment in Class A, Class C, Class Y and Institutional Class would be $8.49, $12.26, $7.08, and $6.48, respectively. |
| 193 |
Management of the Trust (Unaudited)
Listed below is required information regarding the Trustees and principal officers of the Trust. The Trust’s Statement of Additional Information includes additional information about the Trustees and is available, without charge, upon request by calling 1.800.543.0407 or by visiting the Touchstone website at TouchstoneInvestments.com.
| Interested Trustee1: | ||||||||||
| Number | ||||||||||
| of Funds | ||||||||||
| Overseen | ||||||||||
| Term of | in the | |||||||||
| Name | Position(s) | Office And | Touchstone | Other | ||||||
| Address | Held with | Length of | Principal Occupation(s) | Fund | Directorships | |||||
| Year of Birth | Trust | Time Served | During Past 5 Years | Complex2 | Held During the Past 5 Years3 | |||||
Jill T. McGruder Touchstone Advisors, Inc. 303 Broadway Suite 1100 Cincinnati, Ohio 45202 Year of Birth: 1955 | Trustee and President | Until retirement at age 75 or until she resigns or is removed Trustee since 1999 | President and CEO of IFS Financial Services, Inc. (a holding company). | 41 | IFS Financial Services, Inc. (a holding company) from 1999 to the present; Integrity and National Integrity Life Insurance Co. from 2005 to the present; Touchstone Securities (the Trust’s distributor) from 1999 to the present; Touchstone Advisors, Inc. (the Trust’s investment advisor and administrator) from 1999 to the present; W&S Brokerage Services (a brokerage company) from 1999 to the present; W&S Financial Group Distributors (a distribution company) from 1999 to the present; Cincinnati Analysts, Inc. from 2012 to the present; Columbus Life Insurance Co. from 2016 to the present; The Lafayette Life Insurance Co. from 2016 to the present; Taft Museum of Art from 2007 to the present; YWCA of Greater Cincinnati from 2012 to the present; and LL Global, Inc. from 2016 to the present. | |||||
| Independent Trustees: | ||||||||||
Phillip R. Cox c/o Touchstone Advisors, Inc. 303 Broadway Suite 1100 Cincinnati, Ohio 45202 Year of Birth: 1947 | Trustee | Until retirement at age 75 or until he resigns or is removed Trustee since 1999 | President and Chief Executive Officer of Cox Financial Corp. (a financial services company) from 1971 to the present. | 41 | Director of Cincinnati Bell (a communications company) from 1994 to the present; Bethesda Inc. (a hospital) from 2005 to the present; Timken Co. (a manufacturing company) from 2004 to 2014; TimkenSteel from 2014 to the present; Diebold, Inc. (a technology solutions company) from 2004 to the present; and Ohio Business Alliance for Higher Education and the Economy from 2005 to the present. | |||||
William C. Gale c/o Touchstone Advisors, Inc. 303 Broadway Suite 1100 Cincinnati, Ohio 45202 Year of Birth: 1952 | Trustee | Until retirement at age 75 or until he resigns or is removed Trustee since 2013 | Retired; formerly Senior Vice President and Chief Financial Officer (from 2003 to January 2015) of Cintas Corporation (a business services company). | 41 | None. |
| 194 |
Management of the Trust (Unaudited) (Continued)
| Independent Trustees (Continued): | ||||||||||
| Number | ||||||||||
| of Funds | ||||||||||
| Overseen | ||||||||||
| Term of | in the | |||||||||
| Name | Position(s) | Office And | Touchstone | Other | ||||||
| Address | Held with | Length of | Principal Occupation(s) | Fund | Directorships | |||||
| Year of Birth | Trust | Time Served | During Past 5 Years | Complex2 | Held During the Past 5 Years3 | |||||
| Susan J. Hickenlooper c/o Touchstone Advisors, Inc. 303 Broadway Suite 1100 Cincinnati, Ohio 45202 Year of Birth: 1946 | Trustee | Until retirement at age 75 or until she resigns or is removed Trustee since 2009 | Retired; formerly Financial Analyst for Impact 100 (charitable organization) from November 2012 to 2013. | 41 | Trustee of Diocese of Southern Ohio from 2014 to the present; and Trustee of Cincinnati Parks Foundation from 2000 to 2016. | |||||
| Kevin A. Robie c/o Touchstone Advisors, Inc. 303 Broadway Suite 1100 Cincinnati, Ohio 45202 Year of Birth: 1956 | Trustee | Until retirement at age 75 or until he resigns or is removed Trustee since 2013 | Vice President of Portfolio Management at Soin International LLC (a multinational holding company) from 2004 to the present. | 41 | SaverSystems, Inc. from 2015 to the present; Director of Buckeye EcoCare, Inc. (a lawn care company) from 2013 to the present; Trustee of Dayton Region New Market Fund, LLC (a private fund) from 2010 to the present; and Trustee of the Entrepreneurs Center, Inc. (a small business incubator) from 2006 to the present. | |||||
| Edward J. VonderBrink c/o Touchstone Advisors, Inc. 303 Broadway Suite 1100 Cincinnati, Ohio 45202 Year of Birth: 1944 | Trustee | Until retirement at age 75 or until he resigns or is removed Trustee since 2013 | Consultant, VonderBrink Consulting LLC from 2000 to the present. | 41 | Director of Streamline Health Solutions, Inc. (healthcare IT) from 2006 to 2015; Mercy Health from 2013 to the present; Mercy Health Foundation (healthcare nonprofit) from 2008 to the present; Al Neyer Inc. (a construction company) from 2013 to the present; and BASCO Shower Door from 2011 to the present. | |||||
| 1 | Ms. McGruder, as a director of the Advisor and the Distributor, and an officer of affiliates of the Advisor and the Distributor, is an “interested person” of the Trust within the meaning of Section 2(a) (19) of the 1940 Act. |
| 2 | As of September 30, 2017, the Touchstone Fund Complex consisted of 13 series of the Trust, 1 series of Touchstone Institutional Funds Trust, 21 series of the Touchstone Strategic Trust, and 6 variable annuity series of Touchstone Variable Series Trust. |
| 3 | Each Trustee is also a Trustee of Touchstone Institutional Funds Trust, Touchstone Strategic Trust, and Touchstone Variable Series Trust. |
| 195 |
Management of the Trust (Unaudited) (Continued)
The following is a list of the Principal Officers of the Trusts, the length of time served, and principal occupations for the past five years.
| Principal Officers: | ||||||
| Term of | ||||||
| Name | Position(s) | Office And | ||||
| Address | Held with | Length of | Principal Occupation(s) | |||
| Year of Birth | Trust1 | Time Served | During the Past 5 Years | |||
| Jill T. McGruder Touchstone Advisors, Inc. 303 Broadway Suite 1100 Cincinnati, Ohio 45202 Year of Birth: 1955 | President and Trustee | Until resignation, removal or disqualification President since 2006 | See biography above. | |||
| Steven M. Graziano Touchstone Advisors, Inc. 303 Broadway Suite 1100 Cincinnati, Ohio 45202 Year of Birth: 1954 | Vice President | Until resignation, removal or disqualification Vice President since 2009 | President of Touchstone Advisors, Inc. | |||
| Timothy D. Paulin Touchstone Advisors, Inc. 303 Broadway Suite 1100 Cincinnati, Ohio 45202 Year of Birth: 1963 | Vice President | Until resignation, removal or disqualification Vice President since 2010 | Senior Vice President of Investment Research and Product Management of Touchstone Advisors, Inc. | |||
| Timothy S. Stearns Touchstone Advisors, Inc. 303 Broadway Suite 1100 Cincinnati, Ohio 45202 Year of Birth: 1963 | Chief Compliance Officer | Until resignation, removal or disqualification Chief Compliance Officer since 2013 | Chief Compliance Officer of Touchstone Advisors, Inc.; Chief Compliance Officer of Envestnet Asset Management, Inc. (2009 to 2013). | |||
| Terrie A. Wiedenheft Touchstone Advisors, Inc. 303 Broadway Suite 1100 Cincinnati, Ohio 45202 Year of Birth: 1962 | Controller and Treasurer | Until resignation, removal or disqualification Controller and Treasurer since 2006 | Senior Vice President, Chief Financial Officer and Chief Operations Officer, of IFS Financial Services, Inc. (a holding company). | |||
Ellen Blanchard Year of Birth: 1973 | Secretary | Until resignation, removal or disqualification Secretary since 2015 | Director of The Bank of New York Mellon. |
1Each officer also holds the same office with Touchstone Institutional Funds Trust, Touchstone Strategic Trust, and Touchstone Variable Series Trust.
| 196 |
This page intentionally left blank.
| 197 |
This page intentionally left blank.
| 198 |
We Respect Your Privacy
Thank you for your decision to invest with us. Touchstone and its affiliates have always placed a high value on the trust and confidence our clients place in us. We believe that confidence must be earned and validated through time. In today’s world, when technology allows the sharing of information at light speeds, trust must be reinforced by our sincere pledge to take the steps necessary to ensure that the information you share with us is treated with respect and confidentiality.
Our Pledge to Our Clients
| • | We collect only the information we need to service your account and administer our business. |
| • | We are committed to keeping your information confidential and we place strict limits and controls on the use and sharing of your information. |
| • | We make every effort to ensure the accuracy of your information. |
We Collect the Following Nonpublic Personal Information About You:
| • | Information we receive from you on or in applications or other forms, correspondence, or conversations, including, but not limited to, your name, address, phone number, social security number, assets, income and date of birth; and |
| • | Information about your transactions with us, our affiliates, or others, including, but not limited to, your account number and balance, payment history, parties to transactions, cost basis information, and other financial information. |
Categories of Information We Disclose and Parties to Whom We Disclose
We do not disclose any nonpublic personal information about our current or former clients to nonaffiliated third parties, except as required or permitted by law.
We Place Strict Limits and Controls on the Use and Sharing of Your Information
| • | We restrict access to nonpublic personal information about you to authorized employees who need the information to administer your business. |
| • | We maintain physical, electronic and procedural safeguards that comply with federal standards to protect this information. |
| • | We do not disclose any nonpublic personal information about our current or former clients to anyone, except as required or permitted by law or as described in this document. |
| • | We will not sell your personal information to anyone. |
We May Provide Information to Service Your Account
Sometimes it is necessary to provide information about you to various companies such as transfer agents, custodians, broker-dealers and marketing service firms to facilitate the servicing of your account. These organizations have a legitimate business need to see some of your personal information in order for us to provide service to you. We may disclose to these various companies the information that we collect as described above. We require that these companies, including our own subsidiaries and affiliates, strictly maintain the confidentiality of this information and abide by all applicable laws. Companies within our corporate family that may receive this information are financial service providers and insurance companies. We do not permit these associated companies to sell the information for their own purposes, and we never sell our customer information.
This policy is applicable to the following affiliated companies: Touchstone Funds Group Trust, Touchstone Strategic Trust, Touchstone Variable Series Trust, Touchstone Institutional Funds Trust, Touchstone Securities, Inc.,* and W&S Brokerage Services, Inc.
* Touchstone Securities, Inc. serves as the underwriter to the Touchstone Funds.
A Member of Western & Southern Financial Group®
The Privacy Protection Policy is not part of the Annual Report.
| 199 |


Touchstone Investments
Distributor
Touchstone Securities, Inc.*
303 Broadway
Cincinnati, Ohio 45202-4203
800.638.8194
www.touchstoneinvestments.com
Investment Advisor
Touchstone Advisors, Inc.*
303 Broadway
Cincinnati, Ohio 45202-4203
Transfer Agent
BNY Mellon Investment Servicing (US) Inc.
4400 Computer Drive
Westborough, Massachusetts 01581
Shareholder Service
800.543.0407
* A Member of Western & Southern Financial Group
TSF-56-TFGT-AR-1710
Item 2. Code of Ethics.
| (a) | The registrant, as of the end of the period covered by this report, has adopted a code of ethics that applies to the registrant’s principal executive officer, principal financial officer, principal accounting officer or controller, or persons performing similar functions, regardless of whether these individuals are employed by the registrant or a third party. |
| (c) | There have been no amendments, during the period covered by this report, to a provision of the code of ethics that applies to the registrant’s principal executive officer, principal financial officer, principal accounting officer or controller, or persons performing similar functions, regardless of whether these individuals are employed by the registrant or a third party, and that relates to any element of the code of ethics description. |
| (d) | The registrant has not granted any waivers, including an implicit waiver, from a provision of the code of ethics that applies to the registrant’s principal executive officer, principal financial officer, principal accounting officer or controller, or persons performing similar functions, regardless of whether these individuals are employed by the registrant or a third party, that relates to one or more of the items set forth in paragraph (b) of this item’s instructions. |
Item 3. Audit Committee Financial Expert.
The registrant’s Board of Trustees has determined that the registrant has at least one audit committee financial expert serving on its audit committee. Mr. William Gale is the registrant’s audit committee financial expert and is an independent trustee within the meaning of the Investment Company Act of 1940, as amended (the “1940 Act”).
Item 4. Principal Accountant Fees and Services.
Audit Fees
| (a) | Audit fees for Touchstone Fund Group Trust totaled $226,000 and $185,450 in fiscal 2017 and 2016, respectively, including fees associated with the annual audits and filings of Form N1A and Form N-SAR. |
Audit-Related Fees
| (b) | There were no audit-related fees for the 2017 and 2016 fiscal years. |
Tax Fees
| (c) | The aggregate fees for tax compliance services totaled $87,357 and $88,440 in fiscal 2017 and 2016, respectively. |
Fees for both 2017 and 2016 relate to the preparation of federal income and excise tax returns review of capital gains distribution calculations and tax agent services.
All Other Fees
| (d) | The aggregate fees billed in each of the last two fiscal years for products and services provided by the principal accountant, other than the services reported in paragraphs (a) through (c) of this Item are for fiscal years 2017 and 2016 are $19,625 and $28,143, respectively. The fees relate to the PFIC analyzer, Global Withholding Tax Reporter subscriptions. |
| (e)(1) | Disclose the audit committee's pre-approval policies and procedures described in paragraph (c)(7) of Rule 2-01 of Regulation S-X. |
The Audit Committee’s pre-approval policies describe the types of audit, audit-related, tax and other services that have the general pre-approval of the Audit Committee. The pre-approval policies provide that annual audit service fees, tax services not specifically granted pre-approval, services exceeding pre-approved cost levels and other services that have not received general pre-approval will be subject to specific pre-approval by the Audit Committee. The pre-approval policies further provide that the Committee may grant general pre-approval to other audit services (statutory audits and services associated with SEC registration statements, periodic reports and other documents filed with the SEC or other documents issued in connection with securities offerings), audit-related services (accounting consultations related to accounting, financial reporting or disclosure matters not classified as “audit services,” assistance with understanding and implementing new accounting and financial reporting guidance from rulemaking authorities, agreed-upon or expanded audit procedures related to accounting and/or billing records required to respond to or comply with financial, accounting or regulatory reporting matters and assistance with internal control reporting requirements under Form N-SAR and Form N-CSR), tax services that have historically been provided by the auditor that the Committee believes would not impair the independence of the auditor and are consistent with the SEC’s rules on auditor independence and permissible non-audit services classified as “all other services” that are routine and recurring services.
| (e)(2) | All of the services described in paragraphs (b) through (d) of Item 4 were approved by the Audit Committee. |
| (f) | The percentage of hours expended on the principal accountant's engagement to audit the registrant's financial statements for the most recent fiscal year that were attributed to work performed by persons other than the principal accountant's full-time, permanent employees was less than fifty percent. |
| (g) | The aggregate non-audit fees billed by the registrant's accountant for services rendered to the registrant, and rendered to the registrant's investment adviser (not including any sub-adviser whose role is primarily portfolio management and is subcontracted with or overseen by another investment adviser), and any entity controlling, controlled by, or under common control with the adviser that provides ongoing services to the registrant for each of the last two fiscal years of the registrant was $106,982 for 2017 and $116,583 for 2016. |
| (h) | The registrant's audit committee of the board of trustees has considered whether the provision of non-audit services that were rendered to the registrant's investment adviser (not including any sub-adviser whose role is primarily portfolio management and is subcontracted with or overseen by another investment adviser), and any entity controlling, controlled by, or under common control with the investment adviser that provides ongoing services to the registrant that were not pre-approved pursuant to paragraph (c)(7)(ii) of Rule 2-01 of Regulation S-X is compatible with maintaining the principal accountant's independence. |
Item 5. Audit Committee of Listed Registrants.
Not applicable.
Item 6. Investments.
| (a) | Schedule of Investments in securities of unaffiliated issuers as of the close of the reporting period is included as part of the report to shareholders filed under Item 1 of this form. |
| (b) | Not applicable. |
Item 7. Disclosure of Proxy Voting Policies and Procedures for Closed-End Management Investment Companies.
Not applicable.
Item 8. Portfolio Managers of Closed-End Management Investment Companies.
Not applicable.
Item 9. Purchases of Equity Securities by Closed-End Management Investment Company and Affiliated Purchasers.
Not applicable.
Item 10. Submission of Matters to a Vote of Security Holders.
There have been no material changes to the procedures by which the shareholders may recommend nominees to the registrant’s board of trustees, where those changes were implemented after the registrant last provided disclosure in response to the requirements of Item 407(c)(2)(iv) of Regulation S-K (17 CFR 229.407) (as required by Item 22(b)(15) of Schedule 14A (17 CFR 240.14a-101)), or this Item.
Item 11. Controls and Procedures.
| (a) | The registrant’s principal executive and principal financial officers, or persons performing similar functions, have concluded that the registrant’s disclosure controls and procedures (as defined in Rule 30a-3(c) under the Investment Company Act of 1940, as amended (the “1940 Act”) (17 CFR 270.30a-3(c))) are effective, as of a date within 90 days of the filing date of the report that includes the disclosure required by this paragraph, based on their evaluation of these controls and procedures required by Rule 30a-3(b) under the 1940 Act (17 CFR 270.30a-3(b)) and Rules 13a-15(b) or 15d-15(b) under the Securities Exchange Act of 1934, as amended (17 CFR 240.13a-15(b) or 240.15d-15(b)). |
| (b) | There were no changes in the registrant’s internal control over financial reporting (as defined in Rule 30a-3(d) under the 1940 Act (17 CFR 270.30a-3(d))) that occurred during the registrant’s last fiscal quarter that has materially affected, or is reasonably likely to materially affect, the registrant’s internal control over financial reporting. |
Item 12. Disclosure of Securities Lending Activities for Closed-End Management Investment Companies.
Not applicable.
Item 13. Exhibits.
| (a)(1) | Code of ethics, or any amendment thereto, that is the subject of disclosure required by Item 2 is attached hereto. |
| (a)(2) | Certifications pursuant to Rule 30a-2(a) under the 1940 Act and Section 302 of the Sarbanes-Oxley Act of 2002 are attached hereto. |
| (a)(3) | Not applicable. |
| (a)(4) | Not applicable. |
| (b) | Certifications pursuant to Rule 30a-2(b) under the 1940 Act and Section 906 of the Sarbanes-Oxley Act of 2002 are attached hereto. |
SIGNATURES
Pursuant to the requirements of the Securities Exchange Act of 1934 and the Investment Company Act of 1940, the registrant has duly caused this report to be signed on its behalf by the undersigned, thereunto duly authorized.
(Registrant) Touchstone Funds Group Trust
By (Signature and Title)* /s/ Jill T. McGruder
Jill T. McGruder, President
(principal executive officer)
Date 11/22/2017
Pursuant to the requirements of the Securities Exchange Act of 1934 and the Investment Company Act of 1940, this report has been signed below by the following persons on behalf of the registrant and in the capacities and on the dates indicated.
By (Signature and Title)* /s/ Jill T. McGruder
Jill T. McGruder, President
(principal executive officer)
Date 11/22/2017
By (Signature and Title)* /s/ Terrie A. Wiedenheft
Terrie A. Wiedenheft, Controller and Treasurer
(principal financial officer)
Date 11/22/2017
* Print the name and title of each signing officer under his or her signature.