UNITED STATES
SECURITIES AND EXCHANGE COMMISSION
Washington, D.C. 20549
FORMN-CSR
CERTIFIED SHAREHOLDER REPORT OF REGISTERED
MANAGEMENT INVESTMENT COMPANIES
Investment Company Act file number:811-07332 and811-08162
Name of Fund: BlackRock Funds III
BlackRock LifePath® Index Retirement Fund
BlackRock LifePath® Index 2025 Fund
BlackRock LifePath® Index 2030 Fund
BlackRock LifePath® Index 2035 Fund
BlackRock LifePath® Index 2040 Fund
BlackRock LifePath® Index 2045 Fund
BlackRock LifePath® Index 2050 Fund
BlackRock LifePath® Index 2055 Fund
BlackRock LifePath® Index 2060 Fund
BlackRock LifePath® Index 2065 Fund
Master Investment Portfolio
LifePath® Index Retirement Master Portfolio
LifePath® Index 2025 Master Portfolio
LifePath® Index 2030 Master Portfolio
LifePath® Index 2035 Master Portfolio
LifePath® Index 2040 Master Portfolio
LifePath® Index 2045 Master Portfolio
LifePath® Index 2050 Master Portfolio
LifePath® Index 2055 Master Portfolio
LifePath® Index 2060 Master Portfolio
LifePath® Index 2065 Master Portfolio
Fund Address: 100 Bellevue Parkway, Wilmington, DE 19809
Name and address of agent for service: John M. Perlowski, Chief Executive Officer, BlackRock Funds III and Master Investment Portfolio, 55 East 52nd Street, New York, NY 10055
Registrants’ telephone number, including area code: (800)537-4942
Date of fiscal year end: 12/31/2019
Date of reporting period: 12/31/2019
| Item 1 – | Report to Stockholders |
| | |
 | | DECEMBER 31, 2019 |
BlackRock Funds III
| · | | BlackRock LifePath® Index Retirement Fund |
| · | | BlackRock LifePath® Index 2025 Fund |
| · | | BlackRock LifePath® Index 2030 Fund |
| · | | BlackRock LifePath® Index 2035 Fund |
| · | | BlackRock LifePath® Index 2040 Fund |
| · | | BlackRock LifePath® Index 2045 Fund |
| · | | BlackRock LifePath® Index 2050 Fund |
| · | | BlackRock LifePath® Index 2055 Fund |
| · | | BlackRock LifePath® Index 2060 Fund |
| · | | BlackRock LifePath® Index 2065 Fund |
Beginning on January 1, 2021, as permitted by regulations adopted by the Securities and Exchange Commission, paper copies of each Fund’s shareholder reports will no longer be sent by mail, unless you specifically request paper copies of the reports from BlackRock or from your financial intermediary, such as a broker-dealer or bank. Instead, the reports will be made available on a website, and you will be notified by mail each time a report is posted and provided with a website link to access the report.
You may elect to receive all future reports in paper free of charge. If you hold accounts directly with BlackRock, you can call(800) 441-7762 to inform BlackRock that you wish to continue receiving paper copies of your shareholder reports. If you hold accounts through a financial intermediary, you can follow the instructions included with this disclosure, if applicable, or contact your financial intermediary to request that you continue to receive paper copies of your shareholder reports. Please note that not all financial intermediaries may offer this service. Your election to receive reports in paper will apply to all funds advised by BlackRock Advisors, LLC, BlackRock Fund Advisors or their affiliates, or all funds held with your financial intermediary, as applicable.
If you already elected to receive shareholder reports electronically, you will not be affected by this change and you need not take any action. You may elect to receive electronic delivery of shareholder reports and other communications by: (i) accessing the BlackRock website at blackrock.com/edelivery and logging into your accounts, if you hold accounts directly with BlackRock, or (ii) contacting your financial intermediary, if you hold accounts through a financial intermediary. Please note that not all financial intermediaries may offer this service.
|
| Not FDIC Insured • May Lose Value • No Bank Guarantee |
The Markets in Review
Dear Shareholder,
U.S. equities and bonds finished the last year of the decade with impressive returns, putting an exclamation point on a decade of strong performance despite the fears and doubts about the economy that were ultimately laid to rest with unprecedented monetary stimulus and a sluggish yet resolute performance from the U.S. economy. In many ways, it was fitting that the themes of 2019 — geopolitical uncertainty, fears of recession, and decisive monetary stimulus — put the capstone on a decade that was defined by grappling with these competing forces.
Equity and bond markets posted solid returns, particularly in the second half of the year, as investors began to realize that the U.S. economy was maintaining the modest yet steady growth that has characterized this economic cycle. U.S. large cap equities advanced the most, while equities at the high end of the risk spectrum — emerging markets and U.S. small cap — lagged while still posting solid returns.
Fixed-income securities played an important role in diversified portfolios by delivering strong returns amid economic uncertainty, as interest rates declined (and bond prices rose). Long-term bonds, particularly long-term Treasuries, generally posted the strongest returns, as inflation remained low. Investment-grade and high-yield corporate bonds also posted solid returns, as the credit fundamentals in corporate markets remained relatively solid.
As equity performance faltered in late 2018 and global economic growth slowed, the U.S. Federal Reserve (the “Fed”) shifted away from policies designed to decrease inflation in favor of renewed efforts to stimulate economic activity. The Fed left interest rates unchanged in January 2019, then reduced interest rates three times thereafter, starting in July 2019. Similarly, the Fed took measures to support liquidity in short-term lending markets. Following in the Fed’s footsteps, the European Central Bank announced aggressive economic stimulus measures, including lower interest rates and the return of its bond purchasing program. The Bank of Japan signaled a continuation of accommodative monetary policy, while China committed to looser credit conditions and an increase in fiscal spending.
The outpouring of global economic stimulus led to a sharp rally in risk assets throughout the world despite the headwind of rising geopolitical and trade tensions. Hopes continued to remain high as the current economic expansion became the longest in U.S. history.
Looking ahead, we believe U.S. economic growth will stabilize and gradually improve in 2020. The primary drivers of recent market performance — trade and monetary policies — could take a back seat to a nascent expansion in manufacturing and a recent uptick in global growth. The headwinds of policy uncertainty in 2019 could become tailwinds in 2020 due topro-cyclical policy shifts.
Overall, we favor increasing investment risk to benefit from the brighter outlook. In addition to having a positive view for equities overall, we favor emerging market equities over developed market equities. Increasing cyclical exposure through value-style investing and maintaining a meaningful emphasis on high-quality companies through quality factors also makes sense for diversified investors. In fixed income, government bonds continue to be important portfolio stabilizers, while emerging market bonds, particularly local currency bonds, offer relatively attractive income opportunities.
In this environment, investors need to think globally, extend their scope across a broad array of asset classes, and be nimble as market conditions change. We encourage you to talk with your financial advisor and visitblackrock.com for further insight about investing in today’s markets.
Sincerely,

Rob Kapito
President, BlackRock Advisors, LLC

Rob Kapito
President, BlackRock Advisors, LLC
| | | | |
| Total Returns as of December 31, 2019 |
| | | 6-month | | 12-month |
U.S. large cap equities
(S&P 500® Index) | | 10.92% | | 31.49% |
U.S. small cap equities
(Russell 2000® Index) | | 7.30 | | 25.52 |
International equities
(MSCI Europe, Australasia, Far East Index) | | 7.01 | | 22.01 |
Emerging market equities
(MSCI Emerging Markets Index) | | 7.09 | | 18.42 |
3-month Treasury bills
(ICE BofAML3-Month U.S. Treasury Bill Index) | | 1.03 | | 2.28 |
U.S. Treasury securities
(ICE BofAML10-Year U.S. Treasury Index) | | 1.36 | | 8.91 |
U.S. investment grade bonds
(Bloomberg Barclays U.S. Aggregate Bond Index) | | 2.45 | | 8.72 |
Tax-exempt municipal bonds
(S&P Municipal Bond Index) | | 2.21 | | 7.26 |
U.S. high yield bonds
(Bloomberg Barclays U.S. Corporate High Yield 2% Issuer Capped Index) | | 3.98 | | 14.32 |
| Past performance is no guarantee of future results. Index performance is shown for illustrative purposes only. You cannot invest directly in an index. |
| | |
| 2 | | THIS PAGEISNOT PARTOF YOUR FUND REPORT |
Table of Contents

| | | | |
| Fund Summary as of December 31, 2019 | | BlackRock LifePath® Index Funds |
Portfolio Management Commentary
How did each Fund perform?
Each of the BlackRock LifePath® Index Funds with target dates of 2025, 2030, 2035, 2040, 2045, 2050, 2055, 2060, 2065 and BlackRock LifePath® Index Retirement Fund (together, the “LifePath® Index Funds”) invest in their respective LifePath® Index Master Portfolio.
For the 12-month period ended December 31, 2019, all the LifePath® Index Funds’ shares across the vintages Retirement, 2030, 2035, 2045, 2050, 2055 and 2060 underperformed their respective custom benchmarks. For the LifePath® Index Funds with target dates 2025 and 2040, the Funds’ Class K Shares performed in line with their respective custom benchmarks, while the Funds’ Institutional, Investor A and Investor P Shares underperformed. For the LifePath® Index 2065 Fund for the period from October 30, 2019 through December 31, 2019, all the Fund’s share classes performed in line with its respective custom benchmark.
What factors influenced performance?
Positive mistracking in the underlying iShares Developed Real Estate Index Fund contributed to relative performance for the LifePath® Index Funds, particularly in the farther-dated funds with larger allocations to equities.
Negative mistrackings in the underlying Large Cap Index Master Portfolio and iShares Core MSCI Total International Stock ETF were the main detractors from the LifePath® Index Funds’ performance relative to their custom benchmarks. There was also some negative impact attributed to unit value rounding, misweightings and transaction costs.
Describe recent portfolio activity.
Each LifePath® Index Fund has its own time horizon, which affects its acceptable level of risk and, in turn, the strategic allocation of its holdings across asset classes. On a quarterly basis, the strategic allocation of each LifePath® Index Fund is systematically adjusted to reflect the shareholders’ remaining investment time horizon. During the period, the LifePath® Index Funds were rebalanced in accordance with their updated strategic allocations. Daily cash flows were allocated to the underlying funds and instruments as appropriate.
Describe portfolio positioning at period end.
At period end, each of the LifePath® Index Funds was invested according to its respective strategic allocation benchmark within tolerance limits.
The views expressed reflect the opinions of BlackRock as of the date of this report and are subject to change based on changes in market, economic or other conditions.
These views are not intended to be a forecast of future events and are no guarantee of future results.
Glide Path Evolution
Under normal circumstances, the asset allocation of each LifePath Index Fund will change over time according to a predetermined “glide path” as each LifePath® Index Fund approaches its respective target date. The glide path represents the shifting of asset classes over time. Each LifePath® Index Fund’s asset allocations become more conservative prior to retirement as time elapses. This reflects the need for reduced investment risks as retirement approaches and the need for lower volatility of each LifePath Index® Fund, which may be a primary source of income after retirement. As each LifePath® Index Fund approaches its target date, its asset allocation will shift so that each LifePath® Index Fund invests a greater percentage of its assets in fixed-income index funds. The asset allocation targets are established by the portfolio managers. The investment team, including the portfolio managers, meets regularly to assess market conditions, review the asset allocation targets of each LifePath® Index Fund, and determine whether any changes are required to enable each LifePath® Index Fund to achieve its investment objective. Because the BlackRock LifePath® Index Retirement Fund is in its most conservative phase, its allocation generally does not become more conservative over time, although its allocation may change to maintain its risk profile.
Although the asset allocation targets listed for the glide path are general, long-term targets, BlackRock Fund Advisors (“BFA” or the “Manager”) may periodically adjust the proportion of equity index funds and fixed-income index funds in each LifePath® Index Fund, based on an assessment of the current market conditions, the potential contribution of each asset class to the expected risk and return characteristics of each LifePath® Index Fund, reallocations of each LifePath® Index Fund’s composition to reflect intra-year movement along the glide path and other factors. In general, such adjustments will be limited; however, BFA may determine that a greater degree of variation is warranted to protect a LifePath® Index Fund or achieve its investment objective.
| | |
| 4 | | 2019 BLACKROCK ANNUAL REPORTTO SHAREHOLDERS |
| | | | |
| Fund Summary as of December 31, 2019 | | BlackRock LifePath® Index Retirement Fund |
Investment Objective
BlackRock LifePath® Index Retirement Fund’s (“LifePath Index Retirement Fund” or the “LifePath Index Fund”) investment objective is to seek to provide for retirement outcomes based on quantitatively measured risk. In pursuit of this objective, the LifePath Index Fund will be broadly diversified across global asset classes.
At a meeting held on May 15, 2019, the Board of Trustees of BlackRock Funds III, on behalf of LifePath Index Fund, approved a reorganization (“the Reorganization”) of BlackRock LifePath® Index 2020 Fund (the “Target Fund”), with and into the LifePath Index Fund. Shareholders of the Target Fund or LifePath Index Fund were not required to approve the Reorganization. The Reorganization closed on November 18, 2019.
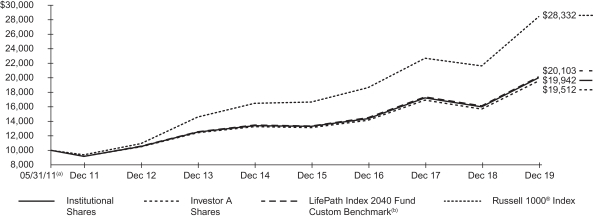
TOTAL RETURN BASED ON A $10,000 INVESTMENT
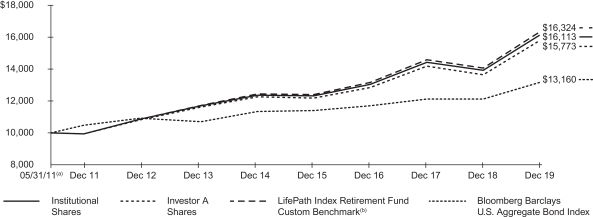
| (a) | Commencement of operations. |
| (b) | The LifePath Index Fund compares its performance to that of a customized weighted index (the “LifePath Index Retirement Fund Custom Benchmark”) comprised of the indexes indicated below, which reflects the investment adviser’s changes to the benchmark’s weightings over time. The investment adviser adjusts the weightings of these indexes periodically based upon its evaluation and adjustment of the LifePath Index Fund’s asset allocation strategy. The weightings are presented annually but they are adjusted quarterly. |
The LifePath Index Fund’s custom benchmark consists of the following:
| | | | | | | | | | | | | | | | | | | | | | | | |
| Period (a) | | Bloomberg Barclays
U.S. Aggregate
Bond Index | | | Bloomberg Barclays
U.S. Treasury
Inflation Protected
Securities (TIPS) Index
(Series L) | | | FTSE
EPRA Nareit
Developed Index | | | MSCI
ACWI ex USA
IMI Index | | | Russell 1000®
Index | | | Russell 2000®
Index | |
05/31/11 to 12/31/11 | | | 37.1 | % | | | 6.0 | % | | | N/A | | | | 17.5 | % | | | 35.7 | % | | | 3.7 | % |
01/01/12 to 12/31/12 | | | 39.0 | | | | 6.3 | | | | 1.6 | % | | | 16.6 | | | | 32.9 | | | | 3.6 | |
01/01/13 to 12/31/13 | | | 40.9 | | | | 6.6 | | | | 3.1 | | | | 16.0 | | | | 29.7 | | | | 3.7 | |
01/01/14 to 12/31/14 | | | 42.1 | | | | 6.8 | | | | 3.0 | | | | 16.0 | | | | 28.4 | | | | 3.7 | |
01/01/15 to 12/31/15 | | | 40.4 | | | | 6.7 | | | | 3.3 | | | | 16.9 | | | | 29.3 | | | | 3.4 | |
01/01/16 to 12/31/16 | | | 51.2 | | | | 8.8 | | | | 0.6 | | | | 13.3 | | | | 22.3 | | | | 3.8 | |
01/01/17 to 12/31/17 | | | 51.2 | | | | 8.8 | | | | 0.5 | | | | 13.3 | | | | 21.8 | | | | 4.4 | |
01/01/18 to 12/31/18 | | | 51.2 | | | | 8.8 | | | | 0.5 | | | | 13.7 | | | | 21.8 | | | | 4.0 | |
01/01/19 to 12/31/19 | | | 52.0 | | | | 8.0 | | | | 2.2 | | | | 12.3 | | | | 22.1 | | | | 3.4 | |
| | (a) | The LifePath Index Fund commenced operations on May 31, 2011. | |
See “About Fund Performance” on page 24 for descriptions of the indexes.
| | |
| Fund Summary as of December 31, 2019 (continued) | | BlackRock LifePath® Index Retirement Fund |
Performance Summary for the Period Ended December 31, 2019
| | | | | | | | | | | | | | | | | | | | | | | | | | | | | | | | | | | | | | | | | | | | |
| | | | | | | | | Average Annual Total Returns (a) | |
| | | | | | | | | 1 Year | | | | | | | | | 5 Years | | | | | | Since Inception (b) | |
| | | 6-Month
Total Returns | | | | | | w/o sales
charge | | | w/sales
charge | | | | | | | | | w/o sales
charge | | | w/sales
charge | | | | | | w/o sales
charge | | | w/sales
charge | |
Institutional | | | 5.01 | % | | | | | | | 15.84 | % | | | N/A | | | | | | | | | | | | 5.46 | % | | | N/A | | | | | | | | 5.71 | % | | | N/A | |
Investor A | | | 4.91 | | | | | | | | 15.60 | | | | N/A | | | | | | | | | | | | 5.19 | | | | N/A | | | | | | | | 5.45 | | | | N/A | |
Class K | | | 5.04 | | | | | | | | 15.90 | | | | N/A | | | | | | | | | | | | 5.49 | | | | N/A | | | | | | | | 5.75 | | | | N/A | |
Investor P | | | 4.83 | | | | | | | | 15.52 | | | | 9.45 | % | | | | | | | | | | | 5.20 | | | | 4.07 | % | | | | | | | 5.45 | | | | 4.79 | % |
LifePath Index Retirement Fund Custom Benchmark | | | 5.08 | | | | | | | | 16.05 | | | | N/A | | | | | | | | | | | | 5.61 | | | | N/A | | | | | | | | 5.88 | | | | N/A | |
Bloomberg Barclays U.S. Aggregate Bond Index | | | 2.45 | | | | | | | | 8.72 | | | | N/A | | | | | | | | | | | | 3.05 | | | | N/A | | | | | | | | 3.25 | | | | N/A | |
Bloomberg Barclays U.S. TIPS Index (Series L) | | | 2.15 | | | | | | | | 8.43 | | | | N/A | | | | | | | | | | | | 2.62 | | | | N/A | | | | | | | | 2.61 | | | | N/A | |
FTSE EPRA Nareit Developed Index | | | 6.46 | | | | | | | | 21.91 | | | | N/A | | | | | | | | | | | | 5.56 | | | | N/A | | | | | | | | 6.54 | | | | N/A | |
MSCI ACWI ex USA IMI Index | | | 7.33 | | | | | | | | 21.63 | | | | N/A | | | | | | | | | | | | 5.71 | | | | N/A | | | | | | | | 4.01 | | | | N/A | |
Russell 1000® Index | | | 10.59 | | | | | | | | 31.43 | | | | N/A | | | | | | | | | | | | 11.48 | | | | N/A | | | | | | | | 12.90 | | | | N/A | |
Russell 2000® Index | | | 7.30 | | | | | | | | 25.52 | | | | N/A | | | | | | | | | | | | 8.23 | | | | N/A | | | | | | | | 9.72 | | | | N/A | |
| | (a) | Assuming maximum sales charges, if any. Average annual total returns with and without sales charges reflect reductions for distribution and service fees. See “About Fund Performance” on page 24 for a detailed description of share classes, including any related sales charges and fees, and how performance was calculated for certain share classes. | |
| | (b) | The LifePath Index Fund commenced operations on May 31, 2011. | |
N/A — Not applicable as share class and index do not have a sales charge.
Past performance is not indicative of future results.
Performance results may include adjustments made for financial reporting purposes in accordance with U.S. generally accepted accounting principles.
| | |
| 6 | | 2019 BLACKROCK ANNUAL REPORTTO SHAREHOLDERS |
| | |
| Fund Summary as of December 31, 2019 | | BlackRock LifePath® Index 2025 Fund |
Investment Objective
BlackRock LifePath® Index 2025 Fund’s (“LifePath Index 2025 Fund” or the “LifePath Index Fund”) investment objective is to seek to provide for retirement outcomes based on quantitatively measured risk. In pursuit of this objective, the LifePath Index Fund will be broadly diversified across global asset classes, with asset allocations becoming more conservative over time.
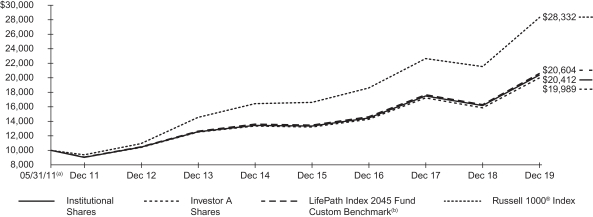
TOTAL RETURN BASED ON A $10,000 INVESTMENT
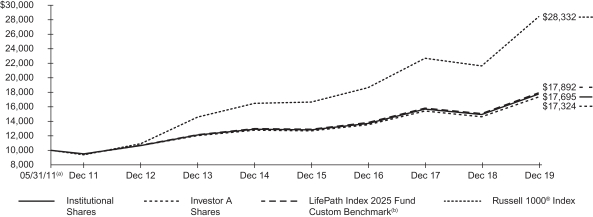
| (a) | Commencement of operations. |
| (b) | The LifePath Index Fund compares its performance to that of a customized weighted index (the “LifePath Index 2025 Fund Custom Benchmark”) comprised of the indexes indicated below, which reflects the investment adviser’s changes to the benchmark’s weightings over time. The investment adviser adjusts the weightings of these indexes periodically based upon its evaluation and adjustment of the LifePath Index Fund’s asset allocation strategy. The weightings are presented annually but they are adjusted quarterly. |
The LifePath Index Fund’s custom benchmark consists of the following:
| | | | | | | | | | | | | | | | | | | | | | | | |
| Period (a) | | Bloomberg Barclays
U.S. Aggregate
Bond Index | | | Bloomberg Barclays
U.S. Treasury
Inflation Protected
Securities (TIPS) Index
(Series L) | | | FTSE
EPRA Nareit
Developed
Index | | | MSCI
ACWI ex USA
IMI Index | | | Russell 1000®
Index | | | Russell 2000®
Index | |
05/31/11 to 12/31/11 | | | 30.0 | % | | | 4.7 | % | | | N/A | | | | 20.5 | % | | | 41.2 | % | | | 3.6 | % |
01/01/12 to 12/31/12 | | | 31.9 | | | | 8.0 | | | | 2.4 | % | | | 19.3 | | | | 38.1 | | | | 3.3 | |
01/01/13 to 12/31/13 | | | 33.7 | | | | 5.3 | | | | 4.8 | | | | 18.3 | | | | 34.6 | | | | 3.3 | |
01/01/14 to 12/31/14 | | | 34.5 | | | | 5.4 | | | | 4.9 | | | | 18.5 | | | | 33.4 | | | | 3.3 | |
01/01/15 to 12/31/15 | | | 30.9 | | | | 5.0 | | | | 5.9 | | | | 20.1 | | | | 35.1 | | | | 3.0 | |
01/01/16 to 12/31/16 | | | 32.4 | | | | 5.3 | | | | 5.8 | | | | 19.8 | | | | 33.8 | | | | 2.9 | |
01/01/17 to 12/31/17 | | | 35.0 | | | | 5.7 | | | | 5.3 | | | | 19.3 | | | | 31.7 | | | | 3.1 | |
01/01/18 to 12/31/18 | | | 36.5 | | | | 5.9 | | | | 4.5 | | | | 19.3 | | | | 30.7 | | | | 3.1 | |
01/01/19 to 12/31/19 | | | 38.1 | | | | 7.1 | | | | 2.5 | | | | 19.5 | | | | 29.7 | | | | 3.1 | |
| | (a) | The LifePath Index Fund commenced operations on May 31, 2011. | |
See “About Fund Performance” on page 24 for descriptions of the indexes.
| | |
| Fund Summary as of December 31, 2019 (continued) | | BlackRock LifePath® Index 2025 Fund |
Performance Summary for the Period Ended December 31, 2019
| | | | | | | | | | | | | | | | | | | | | | | | | | | | | | | | | | | | | | | | |
| | | | | | | | | Average Annual Total Returns (a) | |
| | | | | | | | | 1 Year | | | | | | 5 Years | | | | | | Since Inception (b) | |
| | | 6-Month
Total Returns | | | | | | w/o sales
charge | | | w/sales
charge | | | | | | w/o sales
charge | | | w/sales
charge | | | | | | w/o sales
charge | | | w/sales
charge | |
Institutional | | | 6.00 | % | | | | | | | 18.84 | % | | | N/A | | | | | | | | 6.59 | % | | | N/A | | | | | | | | 6.87 | % | | | N/A | |
Investor A | | | 5.87 | | | | | | | | 18.59 | | | | N/A | | | | | | | | 6.32 | | | | N/A | | | | | | | | 6.61 | | | | N/A | |
Class K | | | 6.10 | | | | | | | | 18.98 | | | | N/A | | | | | | | | 6.64 | | | | N/A | | | | | | | | 6.92 | | | | N/A | |
Investor P | | | 5.91 | | | | | | | | 18.60 | | | | 12.37 | % | | | | | | | 6.33 | | | | 5.19 | % | | | | | | | 6.61 | | | | 5.95 | % |
LifePath Index 2025 Fund Custom Benchmark | | | 6.08 | | | | | | | | 19.01 | | | | N/A | | | | | | | | 6.68 | | | | N/A | | | | | | | | 7.01 | | | | N/A | |
Bloomberg Barclays U.S. Aggregate Bond Index | | | 2.45 | | | | | | | | 8.72 | | | | N/A | | | | | | | | 3.05 | | | | N/A | | | | | | | | 3.25 | | | | N/A | |
Bloomberg Barclays U.S. TIPS Index (Series L) | | | 2.15 | | | | | | | | 8.43 | | | | N/A | | | | | | | | 2.62 | | | | N/A | | | | | | | | 2.61 | | | | N/A | |
FTSE EPRA Nareit Developed Index | | | 6.46 | | | | | | | | 21.91 | | | | N/A | | | | | | | | 5.56 | | | | N/A | | | | | | | | 6.54 | | | | N/A | |
MSCI ACWI ex USA IMI Index | | | 7.33 | | | | | | | | 21.63 | | | | N/A | | | | | | | | 5.71 | | | | N/A | | | | | | | | 4.01 | | | | N/A | |
Russell 1000® Index | | | 10.59 | | | | | | | | 31.43 | | | | N/A | | | | | | | | 11.48 | | | | N/A | | | | | | | | 12.90 | | | | N/A | |
Russell 2000® Index | | | 7.30 | | | | | | | | 25.52 | | | | N/A | | | | | | | | 8.23 | | | | N/A | | | | | | | | 9.72 | | | | N/A | |
| | (a) | Assuming maximum sales charges, if any. Average annual total returns with and without sales charges reflect reductions for distribution and service fees. See “About Fund Performance” on page 24 for a detailed description of share classes, including any related sales charges and fees, and how performance was calculated for certain share classes. | |
| | (b) | The LifePath Index Fund commenced operations on May 31, 2011. | |
N/A — Not applicable as share class and index do not have a sales charge.
Past performance is not indicative of future results.
Performance results may include adjustments made for financial reporting purposes in accordance with U.S. generally accepted accounting principles.
| | |
| 8 | | 2019 BLACKROCK ANNUAL REPORTTO SHAREHOLDERS |
| | |
| Fund Summary as of December 31, 2019 | | BlackRock LifePath® Index 2030 Fund |
Investment Objective
BlackRock LifePath® Index 2030 Fund’s (“LifePath Index 2030 Fund” or the “LifePath Index Fund”) investment objective is to seek to provide for retirement outcomes based on quantitatively measured risk. In pursuit of this objective, the LifePath Index Fund will be broadly diversified across global asset classes, with asset allocations becoming more conservative over time.
TOTAL RETURN BASED ON A $10,000 INVESTMENT
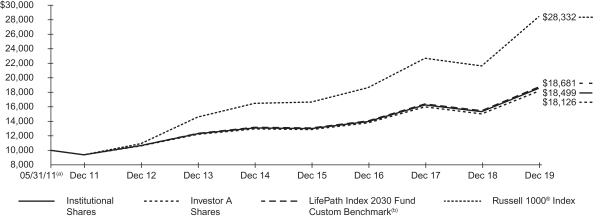
| (a) | Commencement of operations. |
| (b) | The LifePath Index Fund compares its performance to that of a customized weighted index (the “LifePath Index 2030 Fund Custom Benchmark”) comprised of the indexes indicated below, which reflects the investment adviser’s changes to the benchmark’s weightings over time. The investment adviser adjusts the weightings of these indexes periodically based upon its evaluation and adjustment of the LifePath Index Fund’s asset allocation strategy. The weightings are presented annually but they are adjusted quarterly. |
The LifePath Index Fund’s custom benchmark consists of the following:
| | | | | | | | | | | | | | | | | | | | | | | | |
| Period (a) | | Bloomberg Barclays
U.S. Aggregate
Bond Index | | | Bloomberg Barclays
U.S. Treasury
Inflation Protected
Securities (TIPS) Index
(Series L) | | | FTSE
EPRA Nareit
Developed
Index | | | MSCI
ACWI ex USA
IMI Index | | | Russell 1000®
Index | | | Russell 2000®
Index | |
05/31/11 to 12/31/11 | | | 23.8 | % | | | 3.5 | % | | | N/A | | | | 23.1 | % | | | 46.1 | % | | | 3.5 | % |
01/01/12 to 12/31/12 | | | 25.8 | | | | 3.8 | | | | 3.1 | % | | | 21.6 | | | | 42.6 | | | | 3.1 | |
01/01/13 to 12/31/13 | | | 27.6 | | | | 4.0 | | | | 6.2 | | | | 20.3 | | | | 38.9 | | | | 3.0 | |
01/01/14 to 12/31/14 | | | 27.7 | | | | 4.1 | | | | 6.6 | | | | 20.9 | | | | 37.8 | | | | 2.9 | |
01/01/15 to 12/31/15 | | | 21.8 | | | | 3.4 | | | | 8.3 | | | | 23.1 | | | | 40.8 | | | | 2.6 | |
01/01/16 to 12/31/16 | | | 23.4 | | | | 3.6 | | | | 8.3 | | | | 22.9 | | | | 39.3 | | | | 2.5 | |
01/01/17 to 12/31/17 | | | 25.9 | | | | 4.0 | | | | 8.1 | | | | 22.5 | | | | 37.2 | | | | 2.4 | |
01/01/18 to 12/31/18 | | | 27.2 | | | | 4.2 | | | | 7.5 | | | | 22.5 | | | | 36.2 | | | | 2.5 | |
01/01/19 to 12/31/19 | | | 26.9 | | | | 6.1 | | | | 3.1 | | | | 25.2 | | | | 36.0 | | | | 2.7 | |
| | (a) | The LifePath Index Fund commenced operations on May 31, 2011. | |
See “About Fund Performance” on page 24 for descriptions of the indexes.
| | |
| Fund Summary as of December 31, 2019 (continued) | | BlackRock LifePath® Index 2030 Fund |
Performance Summary for the Period Ended December 31, 2019
| | | | | | | | | | | | | | | | | | | | | | | | | | | | | | | | | | | | | | | | |
| | | | | | | | | Average Annual Total Returns (a) | |
| | | | | | | | | 1 Year | | | | | | 5 Years | | | | | | Since Inception (b) | |
| | | 6-Month
Total Returns | | | | | | w/o sales
charge | | | w/sales
charge | | | | | | w/o sales
charge | | | w/sales
charge | | | | | | w/o sales
charge | | | w/sales
charge | |
Institutional | | | 6.87 | % | | | | | | | 21.00 | % | | | N/A | | | | | | | | 7.21 | % | | | N/A | | | | | | | | 7.43 | % | | | N/A | |
Investor A | | | 6.73 | | | | | | | | 20.81 | | | | N/A | | | | | | | | 6.97 | | | | N/A | | | | | | | | 7.17 | | | | N/A | |
Class K | | | 6.90 | | | | | | | | 21.08 | | | | N/A | | | | | | | | 7.27 | | | | N/A | | | | | | | | 7.46 | | | | N/A | |
Investor P | | | 6.73 | | | | | | | | 20.72 | | | | 14.38 | % | | | | | | | 6.96 | | | | 5.81 | % | | | | | | | 7.17 | | | | 6.50 | % |
LifePath Index 2030 Fund Custom Benchmark | | | 6.92 | | | | | | | | 21.17 | | | | N/A | | | | | | | | 7.29 | | | | N/A | | | | | | | | 7.55 | | | | N/A | |
Bloomberg Barclays U.S. Aggregate Bond Index | | | 2.45 | | | | | | | | 8.72 | | | | N/A | | | | | | | | 3.05 | | | | N/A | | | | | | | | 3.25 | | | | N/A | |
Bloomberg Barclays U.S. TIPS Index (Series L) | | | 2.15 | | | | | | | | 8.43 | | | | N/A | | | | | | | | 2.62 | | | | N/A | | | | | | | | 2.61 | | | | N/A | |
FTSE EPRA Nareit Developed Index | | | 6.46 | | | | | | | | 21.91 | | | | N/A | | | | | | | | 5.56 | | | | N/A | | | | | | | | 6.54 | | | | N/A | |
MSCI ACWI ex USA IMI Index | | | 7.33 | | | | | | | | 21.63 | | | | N/A | | | | | | | | 5.71 | | | | N/A | | | | | | | | 4.01 | | | | N/A | |
Russell 1000® Index | | | 10.59 | | | | | | | | 31.43 | | | | N/A | | | | | | | | 11.48 | | | | N/A | | | | | | | | 12.90 | | | | N/A | |
Russell 2000® Index | | | 7.30 | | | | | | | | 25.52 | | | | N/A | | | | | | | | 8.23 | | | | N/A | | | | | | | | 9.72 | | | | N/A | |
| | (a) | Assuming maximum sales charges, if any. Average annual total returns with and without sales charges reflect reductions for distribution and service fees. See “About Fund Performance” on page 24 for a detailed description of share classes, including any related sales charges and fees, and how performance was calculated for certain share classes. | |
| | (b) | The LifePath Index Fund commenced operations on May 31, 2011. | |
N/A — Not applicable as share class and index do not have a sales charge.
Past performance is not indicative of future results.
Performance results may include adjustments made for financial reporting purposes in accordance with U.S. generally accepted accounting principles.
| | |
| 10 | | 2019 BLACKROCK ANNUAL REPORTTO SHAREHOLDERS |
| | |
| Fund Summary as of December 31, 2019 | | BlackRock LifePath® Index 2035 Fund |
Investment Objective
BlackRock LifePath® Index 2035 Fund’s (“LifePath Index 2035 Fund” or the “LifePath Index Fund”) investment objective is to seek to provide for retirement outcomes based on quantitatively measured risk. In pursuit of this objective, the LifePath Index Fund will be broadly diversified across global asset classes, with asset allocations becoming more conservative over time.
TOTAL RETURN BASED ON A $10,000 INVESTMENT
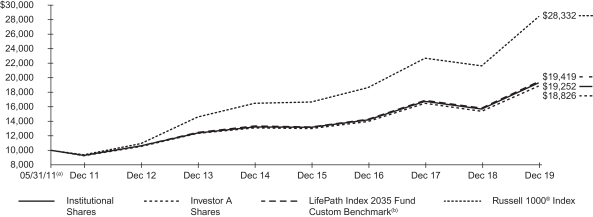
| (a) | Commencement of operations. |
| (b) | The LifePath Index Fund compares its performance to that of a customized weighted index (the “LifePath Index 2035 Fund Custom Benchmark”) comprised of the indexes indicated below, which reflects the investment adviser’s changes to the benchmark’s weightings over time. The investment adviser adjusts the weightings of these indexes periodically based upon its evaluation and adjustment of the LifePath Index Fund’s asset allocation strategy. The weightings are presented annually but they are adjusted quarterly. |
The LifePath Index Fund’s custom benchmark consists of the following:
| | | | | | | | | | | | | | | | | | | | | | | | |
| Period (a) | | Bloomberg Barclays
U.S. Aggregate
Bond Index | | | Bloomberg Barclays
U.S. Treasury
Inflation Protected
Securities (TIPS) Index
(Series L) | | | FTSE
EPRA Nareit
Developed
Index | | | MSCI
ACWI ex USA
IMI Index | | | Russell 1000®
Index | | | Russell 2000®
Index | |
05/31/11 to 12/31/11 | | | 18.2 | % | | | 2.4 | % | | | N/A | | | | 25.4 | % | | | 50.5 | % | | | 3.5 | % |
01/01/12 to 12/31/12 | | | 20.3 | | | | 2.6 | | | | 3.7 | % | | | 23.7 | | | | 46.7 | | | | 3.0 | |
01/01/13 to 12/31/13 | | | 22.1 | | | | 2.9 | | | | 7.5 | | | | 22.2 | | | | 42.7 | | | | 2.6 | |
01/01/14 to 12/31/14 | | | 21.6 | | | | 2.9 | | | | 8.1 | | | | 23.0 | | | | 41.8 | | | | 2.6 | |
01/01/15 to 12/31/15 | | | 13.2 | | | | 1.9 | | | | 10.6 | | | | 26.0 | | | | 46.0 | | | | 2.3 | |
01/01/16 to 12/31/16 | | | 14.7 | | | | 2.2 | | | | 10.7 | | | | 25.7 | | | | 44.6 | | | | 2.1 | |
01/01/17 to 12/31/17 | | | 17.1 | | | | 2.5 | | | | 10.8 | | | | 25.5 | | | | 42.4 | | | | 1.7 | |
01/01/18 to 12/31/18 | | | 18.4 | | | | 2.7 | | | | 10.3 | | | | 25.5 | | | | 41.3 | | | | 1.8 | |
01/01/19 to 12/31/19 | | | 17.1 | | | | 4.6 | | | | 3.7 | | | | 30.4 | | | | 41.8 | | | | 2.4 | |
| | (a) | The LifePath Index Fund commenced operations on May 31, 2011. | |
See “About Fund Performance” on page 24 for descriptions of the indexes.
| | |
| Fund Summary as of December 31, 2019 (continued) | | BlackRock LifePath® Index 2035 Fund |
Performance Summary for the Period Ended December 31, 2019
| | | | | | | | | | | | | | | | | | | | | | | | | | | | | | | | | | | | | | | | |
| | | | | | | | | Average Annual Total Returns (a) | |
| | | | | | | | | 1 Year | | | | | | 5 Years | | | | | | Since Inception (b) | |
| | | 6-Month
Total Returns | | | | | | w/o sales
charge | | | w/sales
charge | | | | | | w/o sales
charge | | | w/sales
charge | | | | | | w/o sales
charge | | | w/sales
charge | |
Institutional | | | 7.68 | % | | | | | | | 23.08 | % | | | N/A | | | | | | | | 7.85 | % | | | N/A | | | | | | | | 7.92 | % | | | N/A | |
Investor A | | | 7.49 | | | | | | | | 22.77 | | | | N/A | | | | | | | | 7.57 | | | | N/A | | | | | | | | 7.64 | | | | N/A | |
Class K | | | 7.65 | | | | | | | | 23.08 | | | | N/A | | | | | | | | 7.87 | | | | N/A | | | | | | | | 7.95 | | | | N/A | |
Investor P | | | 7.53 | | | | | | | | 22.79 | | | | 16.34 | % | | | | | | | 7.58 | | | | 6.44 | % | | | | | | | 7.66 | | | | 6.99 | % |
LifePath Index 2035 Fund Custom Benchmark | | | 7.69 | | | | | | | | 23.20 | | | | N/A | | | | | | | | 7.86 | | | | N/A | | | | | | | | 8.04 | | | | N/A | |
Bloomberg Barclays U.S. Aggregate Bond Index | | | 2.45 | | | | | | | | 8.72 | | | | N/A | | | | | | | | 3.05 | | | | N/A | | | | | | | | 3.25 | | | | N/A | |
Bloomberg Barclays U.S. TIPS Index (Series L) | | | 2.15 | | | | | | | | 8.43 | | | | N/A | | | | | | | | 2.62 | | | | N/A | | | | | | | | 2.61 | | | | N/A | |
FTSE EPRA Nareit Developed Index | | | 6.46 | | | | | | | | 21.91 | | | | N/A | | | | | | | | 5.56 | | | | N/A | | | | | | | | 6.54 | | | | N/A | |
MSCI ACWI ex USA IMI Index | | | 7.33 | | | | | | | | 21.63 | | | | N/A | | | | | | | | 5.71 | | | | N/A | | | | | | | | 4.01 | | | | N/A | |
Russell 1000® Index | | | 10.59 | | | | | | | | 31.43 | | | | N/A | | | | | | | | 11.48 | | | | N/A | | | | | | | | 12.90 | | | | N/A | |
Russell 2000® Index | | | 7.30 | | | | | | | | 25.52 | | | | N/A | | | | | | | | 8.23 | | | | N/A | | | | | | | | 9.72 | | | | N/A | |
| | (a) | Assuming maximum sales charges, if any. Average annual total returns with and without sales charges reflect reductions for distribution and service fees. See “About Fund Performance” on page 24 for a detailed description of share classes, including any related sales charges and fees, and how performance was calculated for certain share classes. | |
| | (b) | The LifePath Index Fund commenced operations on May 31, 2011. | |
N/A — Not applicable as share class and index do not have a sales charge.
Past performance is not indicative of future results.
Performance results may include adjustments made for financial reporting purposes in accordance with U.S. generally accepted accounting principles.
| | |
| 12 | | 2019 BLACKROCK ANNUAL REPORTTO SHAREHOLDERS |
| | |
| Fund Summary as of December 31, 2019 | | BlackRock LifePath® Index 2040 Fund |
Investment Objective
BlackRock LifePath® Index 2040 Fund’s (“LifePath Index 2040 Fund” or the “LifePath Index Fund”) investment objective is to seek to provide for retirement outcomes based on quantitatively measured risk. In pursuit of this objective, the LifePath Index Fund will be broadly diversified across global asset classes, with asset allocations becoming more conservative over time.
TOTAL RETURN BASED ON A $10,000 INVESTMENT
| (a) | Commencement of operations. |
| (b) | The LifePath Index Fund compares its performance to that of a customized weighted index (the “LifePath Index 2040 Fund Custom Benchmark”) comprised of the indexes indicated below, which reflects the investment adviser’s changes to the benchmark’s weightings over time. The investment adviser adjusts the weightings of these indexes periodically based upon its evaluation and adjustment of the LifePath Index Fund’s asset allocation strategy. The weightings are presented annually but they are adjusted quarterly. |
The LifePath Index Fund’s custom benchmark consists of the following:
| | | | | | | | | | | | | | | | | | | | | | | | |
| Period (a) | | Bloomberg Barclays
U.S. Aggregate
Bond Index | | | Bloomberg Barclays
U.S. Treasury
Inflation Protected
Securities (TIPS)
Index (Series L) | | | FTSE
EPRA Nareit
Developed
Index | | | MSCI
ACWI ex USA
IMI Index | | | Russell 1000®
Index | | | Russell 2000®
Index | |
05/31/11 to 12/31/11 | | | 13.1 | % | | | 1.3 | % | | | N/A | | | | 27.6 | % | | | 54.6 | % | | | 3.4 | % |
01/01/12 to 12/31/12 | | | 15.3 | | | | 1.6 | | | | 4.2 | % | | | 25.6 | | | | 50.5 | | | | 2.8 | |
01/01/13 to 12/31/13 | | | 17.1 | | | | 1.7 | | | | 8.7 | | | | 23.9 | | | | 46.2 | | | | 2.4 | |
01/01/14 to 12/31/14 | | | 16.3 | | | | 1.6 | | | | 9.5 | | | | 24.9 | | | | 45.3 | | | | 2.4 | |
01/01/15 to 12/31/15 | | | 5.6 | | | | 0.7 | | | | 12.9 | | | | 28.6 | | | | 50.1 | | | | 2.1 | |
01/01/16 to 12/31/16 | | | 6.9 | | | | 0.9 | | | | 12.9 | | | | 28.5 | | | | 48.9 | | | | 1.9 | |
01/01/17 to 12/31/17 | | | 9.2 | | | | 1.2 | | | | 13.2 | | | | 28.2 | | | | 47.1 | | | | 1.1 | |
01/01/18 to 12/31/18 | | | 10.3 | | | | 1.4 | | | | 12.8 | | | | 28.3 | | | | 46.0 | | | | 1.3 | |
01/01/19 to 12/31/19 | | | 8.4 | | | | 3.0 | | | | 4.2 | | | | 35.2 | | | | 47.0 | | | | 2.2 | |
| | (a) | The LifePath Index Fund commenced operations on May 31, 2011. | |
See “About Fund Performance” on page 24 for descriptions of the indexes.
| | |
| Fund Summary as of December 31, 2019 (continued) | | BlackRock LifePath® Index 2040 Fund |
Performance Summary for the Period Ended December 31, 2019
| | | | | | | | | | | | | | | | | | | | | | | | | | | | | | | | | | | | | | | | |
| | | | | | | | | Average Annual Total Returns (a) | |
| | | | | | | | | 1 Year | | | | | | 5 Years | | | | | | Since Inception (b) | |
| | | 6-Month
Total Returns | | | | | | w/o sales
charge | | | w/sales
charge | | | | | | w/o sales
charge | | | w/sales
charge | | | | | | w/o sales
charge | | | w/sales
charge | |
Institutional | | | 8.34 | % | | | | | | | 24.95 | % | | | N/A | | | | | | | | 8.35 | % | | | N/A | | | | | | | | 8.37 | % | | | N/A | |
Investor A | | | 8.15 | | | | | | | | 24.62 | | | | N/A | | | | | | | | 8.08 | | | | N/A | | | | | | | | 8.09 | | | | N/A | |
Class K | | | 8.37 | | | | | | | | 25.01 | | | | N/A | | | | | | | | 8.42 | | | | N/A | | | | | | | | 8.41 | | | | N/A | |
Investor P | | | 8.23 | | | | | | | | 24.63 | | | | 18.08 | % | | | | | | | 8.08 | | | | 6.92 | % | | | | | | | 8.10 | | | | 7.43 | % |
LifePath Index 2040 Fund Custom Benchmark | | | 8.40 | | | | | | | | 25.05 | | | | N/A | | | | | | | | 8.36 | | | | N/A | | | | | | | | 8.47 | | | | N/A | |
Bloomberg Barclays U.S. Aggregate Bond Index | | | 2.45 | | | | | | | | 8.72 | | | | N/A | | | | | | | | 3.05 | | | | N/A | | | | | | | | 3.25 | | | | N/A | |
Bloomberg Barclays U.S. TIPS Index (Series L) | | | 2.15 | | | | | | | | 8.43 | | | | N/A | | | | | | | | 2.62 | | | | N/A | | | | | | | | 2.61 | | | | N/A | |
FTSE EPRA Nareit Developed Index | | | 6.46 | | | | | | | | 21.91 | | | | N/A | | | | | | | | 5.56 | | | | N/A | | | | | | | | 6.54 | | | | N/A | |
MSCI ACWI ex USA IMI Index | | | 7.33 | | | | | | | | 21.63 | | | | N/A | | | | | | | | 5.71 | | | | N/A | | | | | | | | 4.01 | | | | N/A | |
Russell 1000® Index | | | 10.59 | | | | | | | | 31.43 | | | | N/A | | | | | | | | 11.48 | | | | N/A | | | | | | | | 12.90 | | | | N/A | |
Russell 2000® Index | | | 7.30 | | | | | | | | 25.52 | | | | N/A | | | | | | | | 8.23 | | | | N/A | | | | | | | | 9.72 | | | | N/A | |
| | (a) | Assuming maximum sales charges, if any. Average annual total returns with and without sales charges reflect reductions for distribution and service fees. See “About Fund Performance” on page 24 for a detailed description of share classes, including any related sales charges and fees, and how performance was calculated for certain share classes. | |
| | (b) | The LifePath Index Fund commenced operations on May 31, 2011. | |
N/A — Not applicable as share class and index do not have a sales charge.
Past performance is not indicative of future results.
Performance results may include adjustments made for financial reporting purposes in accordance with U.S. generally accepted accounting principles.
| | |
| 14 | | 2019 BLACKROCK ANNUAL REPORTTO SHAREHOLDERS |
| | |
| Fund Summary as of December 31, 2019 | | BlackRock LifePath® Index 2045 Fund |
Investment Objective
BlackRock LifePath® Index 2045 Fund’s (“LifePath Index 2045 Fund” or the “LifePath Index Fund”) investment objective is to seek to provide for retirement outcomes based on quantitatively measured risk. In pursuit of this objective, the LifePath Index Fund will be broadly diversified across global asset classes, with asset allocations becoming more conservative over time.
TOTAL RETURN BASED ON A $10,000 INVESTMENT
| (a) | Commencement of operations. |
| (b) | The LifePath Index Fund compares its performance to that of a customized weighted index (the “LifePath Index 2045 Fund Custom Benchmark”) comprised of the indexes indicated below, which reflects the investment adviser’s changes to the benchmark’s weightings over time. The investment adviser adjusts the weightings of these indexes periodically based upon its evaluation and adjustment of the LifePath Index Fund’s asset allocation strategy. The weightings are presented annually but they are adjusted quarterly. |
The LifePath Index Fund’s custom benchmark consists of the following:
| | | | | | | | | | | | | | | | | | | | | | | | |
| Period (a) | | Bloomberg Barclays
U.S. Aggregate
Bond Index | | | Bloomberg Barclays
U.S. Treasury
Inflation Protected
Securities (TIPS) Index
(Series L) | | | FTSE
EPRA Nareit Developed
Index | | | MSCI
ACWI ex USA
IMI Index | | | Russell 1000®
Index | | | Russell 2000®
Index | |
05/31/11 to 12/31/11 | | | 8.7 | % | | | N/A | | | | N/A | | | | 29.6 | % | | | 58.3 | % | | | 3.4 | % |
01/01/12 to 12/31/12 | | | 11.2 | | | | N/A | | | | 4.8 | % | | | 27.4 | | | | 54.0 | | | | 2.6 | |
01/01/13 to 12/31/13 | | | 13.2 | | | | N/A | | | | 9.8 | | | | 25.4 | | | | 49.5 | | | | 2.1 | |
01/01/14 to 12/31/14 | | | 12.6 | | | | N/A | | | | 10.7 | | | | 26.4 | | | | 48.1 | | | | 2.2 | |
01/01/15 to 12/31/15 | | | 1.8 | | | | 0.2 | % | | | 14.2 | | | | 30.0 | | | | 51.7 | | | | 2.1 | |
01/01/16 to 12/31/16 | | | 2.3 | | | | 0.2 | | | | 14.6 | | | | 30.2 | | | | 50.8 | | | | 1.9 | |
01/01/17 to 12/31/17 | | | 3.4 | | | | 0.3 | | | | 15.3 | | | | 30.5 | | | | 49.5 | | | | 0.9 | |
01/01/18 to 12/31/18 | | | 4.0 | | | | 0.4 | | | | 15.0 | | | | 30.7 | | | | 48.9 | | | | 1.1 | |
01/01/19 to 12/31/19 | | | 3.0 | | | | 1.4 | | | | 4.6 | | | | 38.5 | | | | 50.5 | | | | 2.0 | |
| | (a) | The LifePath Index Fund commenced operations on May 31, 2011. | |
See “About Fund Performance” on page 24 for descriptions of the indexes.
| | |
| Fund Summary as of December 31, 2019 (continued) | | BlackRock LifePath® Index 2045 Fund |
Performance Summary for the Period Ended December 31, 2019
| | | | | | | | | | | | | | | | | | | | | | | | | | | | | | | | | | | | | | | | |
| | | | | | | | | Average Annual Total Returns (a) | |
| | | | | | | | | 1 Year | | | | | | 5 Years | | | | | | Since Inception (b) | |
| | | 6-Month
Total Returns | | | | | | w/o sales
charge | | | w/sales
charge | | | | | | w/o sales
charge | | | w/sales
charge | | | | | | w/o sales
charge | | | w/sales
charge | |
Institutional | | | 8.77 | % | | | | | | | 26.14 | % | | | N/A | | | | | | | | 8.69 | % | | | N/A | | | | | | | | 8.66 | % | | | N/A | |
Investor A | | | 8.66 | | | | | | | | 25.91 | | | | N/A | | | | | | | | 8.43 | | | | N/A | | | | | | | | 8.40 | | | | N/A | |
Class K | | | 8.79 | | | | | | | | 26.25 | | | | N/A | | | | | | | | 8.75 | | | | N/A | | | | | | | | 8.72 | | | | N/A | |
Investor P | | | 8.62 | | | | | | | | 25.91 | | | | 19.30 | % | | | | | | | 8.42 | | | | 7.25 | % | | | | | | | 8.39 | | | | 7.72 | % |
LifePath Index 2045 Fund Custom Benchmark | | | 8.86 | | | | | | | | 26.37 | | | | N/A | | | | | | | | 8.66 | | | | N/A | | | | | | | | 8.79 | | | | N/A | |
Bloomberg Barclays U.S. Aggregate Bond Index | | | 2.45 | | | | | | | | 8.72 | | | | N/A | | | | | | | | 3.05 | | | | N/A | | | | | | | | 3.25 | | | | N/A | |
Bloomberg Barclays U.S. TIPS Index (Series L) | | | 2.15 | | | | | | | | 8.43 | | | | N/A | | | | | | | | 2.62 | | | | N/A | | | | | | | | 2.61 | | | | N/A | |
FTSE EPRA Nareit Developed Index | | | 6.46 | | | | | | | | 21.91 | | | | N/A | | | | | | | | 5.56 | | | | N/A | | | | | | | | 6.54 | | | | N/A | |
MSCI ACWI ex USA IMI Index | | | 7.33 | | | | | | | | 21.63 | | | | N/A | | | | | | | | 5.71 | | | | N/A | | | | | | | | 4.01 | | | | N/A | |
Russell 1000® Index | | | 10.59 | | | | | | | | 31.43 | | | | N/A | | | | | | | | 11.48 | | | | N/A | | | | | | | | 12.90 | | | | N/A | |
Russell 2000® Index | | | 7.30 | | | | | | | | 25.52 | | | | N/A | | | | | | | | 8.23 | | | | N/A | | | | | | | | 9.72 | | | | N/A | |
| | (a) | Assuming maximum sales charges, if any. Average annual total returns with and without sales charges reflect reductions for distribution and service fees. See “About Fund Performance” on page 24 for a detailed description of share classes, including any related sales charges and fees, and how performance was calculated for certain share classes. | |
| | (b) | The LifePath Index Fund commenced operations on May 31, 2011. | |
N/A — Not applicable as share class and index do not have a sales charge.
Past performance is not indicative of future results.
Performance results may include adjustments made for financial reporting purposes in accordance with U.S. generally accepted accounting principles.
| | |
| 16 | | 2019 BLACKROCK ANNUAL REPORTTO SHAREHOLDERS |
| | | | |
| Fund Summary as of December 31, 2019 | | BlackRock LifePath® Index 2050 Fund |
Investment Objective
BlackRock LifePath® Index 2050 Fund’s (“LifePath Index 2050 Fund” or the “LifePath Index Fund”) investment objective is to seek to provide for retirement outcomes based on quantitatively measured risk. In pursuit of this objective, the LifePath Index Fund will be broadly diversified across global asset classes, with asset allocations becoming more conservative over time.
TOTAL RETURN BASED ON A $10,000 INVESTMENT

| (a) | Commencement of operations. |
| (b) | The LifePath Index Fund compares its performance to that of a customized weighted index (the “LifePath Index 2050 Fund Custom Benchmark”) comprised of the indexes indicated below, which reflects the investment adviser’s changes to the benchmark’s weightings over time. The investment adviser adjusts the weightings of these indexes periodically based upon its evaluation and adjustment of the LifePath Index Fund’s asset allocation strategy. The weightings are presented annually but they are adjusted quarterly. |
The LifePath Index Fund’s custom benchmark consists of the following:
| | | | | | | | | | | | | | | | | | | | | | | | |
| Period (a) | | Bloomberg Barclays
U.S. Aggregate
Bond Index | | | Bloomberg Barclays
U.S. TIPS Index
(Series L) | | | FTSE
EPRA Nareit Developed Index | | | MSCI
ACWI ex USA
IMI Index | | | Russell 1000®
Index | | | Russell 2000®
Index | |
05/31/11 to 12/31/11 | | | 3.3 | % | | | N/A | | | | N/A | | | | 31.6 | % | | | 61.7 | % | | | 3.4 | % |
01/01/12 to 12/31/12 | | | 5.8 | | | | N/A | | | | 5.3 | % | | | 29.2 | | | | 57.1 | | | | 2.6 | |
01/01/13 to 12/31/13 | | | 7.9 | | | | N/A | | | | 10.8 | | | | 26.9 | | | | 52.5 | | | | 1.9 | |
01/01/14 to 12/31/14 | | | 8.3 | | | | N/A | | | | 11.7 | | | | 27.7 | | | | 50.4 | | | | 1.9 | |
01/01/15 to 12/31/15 | | | 1.0 | | | | N/A | | | | 14.5 | | | | 30.3 | | | | 52.1 | | | | 2.1 | |
01/01/16 to 12/31/16 | | | 1.0 | | | | N/A | | | | 15.0 | | | | 30.9 | | | | 51.2 | | | | 1.9 | |
01/01/17 to 12/31/17 | | | 1.0 | | | | N/A | | | | 16.2 | | | | 31.5 | | | | 50.4 | | | | 0.9 | |
01/01/18 to 12/31/18 | | | 1.2 | | | | N/A | | | | 16.0 | | | | 31.7 | | | | 50.2 | | | | 1.0 | |
01/01/19 to 12/31/19 | | | 1.0 | | | | 0.4 | % | | | 4.8 | | | | 39.9 | | | | 52.0 | | | | 1.9 | |
| | (a) | The LifePath Index Fund commenced operations on May 31, 2011. | |
See “About Fund Performance” on page 24 for descriptions of the indexes.
| | |
| Fund Summary as of December 31, 2019 (continued) | | BlackRock LifePath® Index 2050 Fund |
Performance Summary for the Period Ended December 31, 2019
| | | | | | | | | | | | | | | | | | | | | | | | | | | | | | | | | | | | | | | | |
| | | | | | | | | Average Annual Total Returns (a) | |
| | | | | | | | | 1 Year | | | | | | 5 Years | | | | | | Since Inception (b) | |
| | | 6-Month
Total Returns | | | | | | w/o sales
charge | | | w/sales
charge | | | | | | w/o sales
charge | | | w/sales
charge | | | | | | w/o sales
charge | | | w/sales
charge | |
Institutional | | | 8.94 | % | | | | | | | 26.71 | % | | | N/A | | | | | | | | 8.80 | % | | | N/A | | | | | | | | 8.86 | % | | | N/A | |
Investor A | | | 8.83 | | | | | | | | 26.40 | | | | N/A | | | | | | | | 8.53 | | | | N/A | | | | | | | | 8.58 | | | | N/A | |
Class K | | | 8.97 | | | | | | | | 26.77 | | | | N/A | | | | | | | | 8.85 | | | | N/A | | | | | | | | 8.90 | | | | N/A | |
Investor P | | | 8.83 | | | | | | | | 26.40 | | | | 19.77 | % | | | | | | | 8.53 | | | | 7.37 | % | | | | | | | 8.59 | | | | 7.91 | % |
LifePath Index 2050 Fund Custom Benchmark | | | 9.05 | | | | | | | | 26.92 | | | | N/A | | | | | | | | 8.77 | | | | N/A | | | | | | | | 8.97 | | | | N/A | |
Bloomberg Barclays U.S. Aggregate Bond Index | | | 2.45 | | | | | | | | 8.72 | | | | N/A | | | | | | | | 3.05 | | | | N/A | | | | | | | | 3.25 | | | | N/A | |
Bloomberg Barclays U.S. TIPS Index (Series L) | | | 2.15 | | | | | | | | 8.43 | | | | N/A | | | | | | | | 2.62 | | | | N/A | | | | | | | | 2.61 | | | | N/A | |
FTSE EPRA Nareit Developed Index | | | 6.46 | | | | | | | | 21.91 | | | | N/A | | | | | | | | 5.56 | | | | N/A | | | | | | | | 6.54 | | | | N/A | |
MSCI ACWI ex USA IMI Index | | | 7.33 | | | | | | | | 21.63 | | | | N/A | | | | | | | | 5.71 | | | | N/A | | | | | | | | 4.01 | | | | N/A | |
Russell 1000® Index | | | 10.59 | | | | | | | | 31.43 | | | | N/A | | | | | | | | 11.48 | | | | N/A | | | | | | | | 12.90 | | | | N/A | |
Russell 2000® Index | | | 7.30 | | | | | | | | 25.52 | | | | N/A | | | | | | | | 8.23 | | | | N/A | | | | | | | | 9.72 | | | | N/A | |
| | (a) | Assuming maximum sales charges, if any. Average annual total returns with and without sales charges reflect reductions for distribution and service fees. See “About Fund Performance” on page 24 for a detailed description of share classes, including any related sales charges and fees, and how performance was calculated for certain share classes. | |
| | (b) | The LifePath Index Fund commenced operations on May 31, 2011. | |
N/A — Not applicable as share class and index do not have a sales charge.
Past performance is not indicative of future results.
Performance results may include adjustments made for financial reporting purposes in accordance with U.S. generally accepted accounting principles.
| | |
| 18 | | 2019 BLACKROCK ANNUAL REPORTTO SHAREHOLDERS |
| | |
| Fund Summary as of December 31, 2019 | | BlackRock LifePath® Index 2055 Fund |
Investment Objective
BlackRock LifePath® Index 2055 Fund’s (“LifePath Index 2055 Fund” or the “LifePath Index Fund”) investment objective is to seek to provide for retirement outcomes based on quantitatively measured risk. In pursuit of this objective, the LifePath Index Fund will be broadly diversified across global asset classes, with asset allocations becoming more conservative over time.
TOTAL RETURN BASED ON A $10,000 INVESTMENT
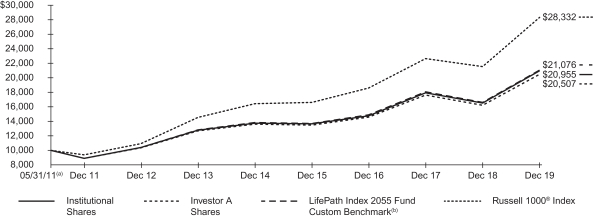
| (a) | Commencement of operations. |
| (b) | The LifePath Index Fund compares its performance to that of a customized weighted index (the “LifePath Index 2055 Fund Custom Benchmark”) comprised of the indexes indicated below, which reflects the investment adviser’s changes to the benchmark’s weightings over time. The investment adviser adjusts the weightings of these indexes periodically based upon its evaluation and adjustment of the LifePath Index Fund’s asset allocation strategy. The weightings are presented annually but they are adjusted quarterly. |
The LifePath Index Fund’s custom benchmark consists of the following:
| | | | | | | | | | | | | | | | | | | | | | | | |
| Period (a) | | Bloomberg Barclays
U.S. Aggregate
Bond Index | | | Bloomberg Barclays
U.S. TIPS Index
(Series L) | | | FTSE
EPRA Nareit Developed Index | | | MSCI
ACWI ex USA
IMI Index | | | Russell 1000®
Index | | | Russell 2000®
Index | |
05/31/11 to 12/31/11 | | | 1.0 | % | | | N/A | | | | N/A | | | | 33.2 | % | | | 59.8 | % | | | 6.0 | % |
01/01/12 to 12/31/12 | | | 1.1 | | | | N/A | | | | 5.9 | % | | | 31.4 | | | | 57.4 | | | | 4.2 | |
01/01/13 to 12/31/13 | | | 2.7 | | | | N/A | | | | 12.2 | | | | 28.4 | | | | 54.8 | | | | 1.9 | |
01/01/14 to 12/31/14 | | | 4.2 | | | | N/A | | | | 12.8 | | | | 29.0 | | | | 52.1 | | | | 1.9 | |
01/01/15 to 12/31/15 | | | 1.0 | | | | N/A | | | | 14.5 | | | | 30.3 | | | | 52.1 | | | | 2.1 | |
01/01/16 to 12/31/16 | | | 1.0 | | | | N/A | | | | 15.0 | | | | 30.9 | | | | 51.2 | | | | 1.9 | |
01/01/17 to 12/31/17 | | | 1.0 | | | | N/A | | | | 16.2 | | | | 31.5 | | | | 50.4 | | | | 0.9 | |
01/01/18 to 12/31/18 | | | 1.0 | | | | N/A | | | | 16.1 | | | | 31.8 | | | | 50.1 | | | | 1.0 | |
01/01/19 to 12/31/19 | | | 0.9 | | | | 0.1 | % | | | 4.8 | | | | 40.2 | | | | 52.0 | | | | 2.0 | |
| | (a) | The LifePath Index Fund commenced operations on May 31, 2011. | |
See “About Fund Performance” on page 24 for descriptions of the indexes.
| | |
| Fund Summary as of December 31, 2019 (continued) | | BlackRock LifePath® Index 2055 Fund |
Performance Summary for the Period Ended December 31, 2019
| | | | | | | | | | | | | | | | | | | | | | | | | | | | | | | | | | | | | | | | |
| | | | | | | | | Average Annual Total Returns (a) | |
| | | | | | | | | 1 Year | | | | | | 5 Years | | | | | | Since Inception (b) | |
| | | 6-Month Total Returns | | | | | | w/o sales
charge | | | w/sales
charge | | | | | | w/o sales
charge | | | w/sales
charge | | | | | | w/o sales
charge | | | w/sales
charge | |
Institutional | | | 8.93 | % | | | | | | | 26.75 | % | | | N/A | | | | | | | | 8.82 | % | | | N/A | | | | | | | | 8.99 | % | | | N/A | |
Investor A | | | 8.83 | | | | | | | | 26.46 | | | | N/A | | | | | | | | 8.56 | | | | N/A | | | | | | | | 8.72 | | | | N/A | |
Class K | | | 9.03 | | | | | | | | 26.89 | | | | N/A | | | | | | | | 8.89 | | | | N/A | | | | | | | | 9.05 | | | | N/A | |
Investor P | | | 8.85 | | | | | | | | 26.54 | | | | 19.90 | % | | | | | | | 8.55 | | | | 7.39 | % | | | | | | | 8.72 | | | | 8.05 | % |
LifePath Index 2055 Fund Custom Benchmark | | | 9.08 | | | | | | | | 26.99 | | | | N/A | | | | | | | | 8.77 | | | | N/A | | | | | | | | 9.07 | | | | N/A | |
Bloomberg Barclays U.S. Aggregate Bond Index | | | 2.45 | | | | | | | | 8.72 | | | | N/A | | | | | | | | 3.05 | | | | N/A | | | | | | | | 3.25 | | | | N/A | |
Bloomberg Barclays U.S. TIPS Index (Series L) | | | 2.15 | | | | | | | | 8.43 | | | | N/A | | | | | | | | 2.62 | | | | N/A | | | | | | | | 2.61 | | | | N/A | |
FTSE EPRA Nareit Developed Index | | | 6.46 | | | | | | | | 21.91 | | | | N/A | | | | | | | | 5.56 | | | | N/A | | | | | | | | 6.54 | | | | N/A | |
MSCI ACWI ex USA IMI Index | | | 7.33 | | | | | | | | 21.63 | | | | N/A | | | | | | | | 5.71 | | | | N/A | | | | | | | | 4.01 | | | | N/A | |
Russell 1000® Index | | | 10.59 | | | | | | | | 31.43 | | | | N/A | | | | | | | | 11.48 | | | | N/A | | | | | | | | 12.90 | | | | N/A | |
Russell 2000® Index | | | 7.30 | | | | | | | | 25.52 | | | | N/A | | | | | | | | 8.23 | | | | N/A | | | | | | | | 9.72 | | | | N/A | |
| | (a) | Assuming maximum sales charges, if any. Average annual total returns with and without sales charges reflect reductions for distribution and service fees. See “About Fund Performance” on page 24 for a detailed description of share classes, including any related sales charges and fees, and how performance was calculated for certain share classes. | |
| | (b) | The LifePath Index Fund commenced operations on May 31, 2011. | |
N/A — Not applicable as share class and index do not have a sales charge.
Past performance is not indicative of future results.
Performance results may include adjustments made for financial reporting purposes in accordance with U.S. generally accepted accounting principles.
| | |
| 20 | | 2019 BLACKROCK ANNUAL REPORTTO SHAREHOLDERS |
| | |
| Fund Summary as of December 31, 2019 | | BlackRock LifePath® Index 2060 Fund |
Investment Objective
BlackRock LifePath® Index 2060 Fund’s (“LifePath Index 2060 Fund” or the “LifePath Index Fund”) investment objective is to seek to provide for retirement outcomes based on quantitatively measured risk. In pursuit of this objective, the LifePath Index Fund will be broadly diversified across global asset classes, with asset allocations becoming more conservative over time.
TOTAL RETURN BASED ON A $10,000 INVESTMENT
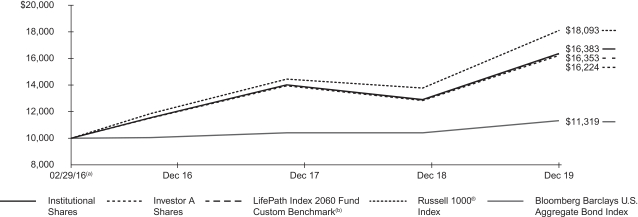
| (a) | Commencement of operations. |
| (b) | The LifePath Index Fund compares its performance to that of a customized weighted index (the “LifePath Index 2060 Fund Custom Benchmark”) comprised of the indexes indicated below, which reflects the investment adviser’s changes to the benchmark’s weightings over time. The investment adviser adjusts the weightings of these indexes periodically based upon its evaluation and adjustment of the LifePath Index Fund’s asset allocation strategy. The weightings are presented annually but they are adjusted quarterly. |
The LifePath Index Fund’s custom benchmark consists of the following:
| | | | | | | | | | | | | | | | | | | | | | | | |
| Period (a) | | Bloomberg Barclays
U.S. Aggregate
Bond Index | | | Bloomberg Barclays
U.S. TIPS Index
(Series L) | | | FTSE
EPRA Nareit
Developed
Index | | | MSCI
ACWI ex USA
IMI Index | | | Russell 1000®
Index | | | Russell 2000®
Index | |
02/29/16 to 12/31/16 | | | 1.0 | % | | | N/A | | | | 15.0 | % | | | 30.9 | % | | | 51.2 | % | | | 1.9 | % |
01/01/17 to 12/31/17 | | | 1.0 | | | | N/A | | | | 16.2 | | | | 31.5 | | | | 50.4 | | | | 0.9 | |
01/01/18 to 12/31/18 | | | 1.0 | | | | N/A | | | | 16.1 | | | | 31.8 | | | | 50.1 | | | | 1.0 | |
01/01/19 to 12/31/19 | | | 0.9 | | | | 0.1 | % | | | 4.8 | | | | 40.2 | | | | 52.0 | | | | 2.0 | |
| | (a) | The LifePath Index Fund commenced operations on February 29, 2016. | |
See “About Fund Performance” on page 24 for descriptions of the indexes.
| | |
| Fund Summary as of December 31, 2019 (continued) | | BlackRock LifePath® Index 2060 Fund |
Performance Summary for the Period Ended December 31, 2019
| | | | | | | | | | | | | | | | | | | | | | | | | | | | |
| | | | | | | | | Average Annual Total Returns (a) | |
| | | | | | | | | 1 Year | | | | | | Since Inception (b) | |
| | | 6-Month
Total Returns | | | | | | w/o sales
charge | | | w/sales
charge | | | | | | w/o sales
charge | | | w/sales
charge | |
Institutional | | | 8.92 | % | | | | | | | 26.78 | % | | | N/A | | | | | | | | 13.71 | % | | | N/A | |
Investor A | | | 8.81 | | | | | | | | 26.46 | | | | N/A | | | | | | | | 13.43 | | | | N/A | |
Class K | | | 9.01 | | | | | | | | 26.92 | | | | N/A | | | | | | | | 13.78 | | | | N/A | |
Investor P | | | 8.90 | | | | | | | | 26.51 | | | | 19.87 | % | | | | | | | 13.47 | | | | 11.90 | % |
LifePath Index 2060 Fund Custom Benchmark | | | 9.08 | | | | | | | | 26.99 | | | | N/A | | | | | | | | 13.69 | | | | N/A | |
Bloomberg Barclays U.S. Aggregate Bond Index | | | 2.45 | | | | | | | | 8.72 | | | | N/A | | | | | | | | 3.28 | | | | N/A | |
Bloomberg Barclays U.S. TIPS Index (Series L) | | | 2.15 | | | | | | | | 8.43 | | | | N/A | | | | | | | | 3.12 | | | | N/A | |
FTSE EPRA Nareit Developed Index | | | 6.46 | | | | | | | | 21.91 | | | | N/A | | | | | | | | 8.64 | | | | N/A | |
MSCI ACWI ex USA IMI Index | | | 7.33 | | | | | | | | 21.63 | | | | N/A | | | | | | | | 11.15 | | | | N/A | |
Russell 1000® Index | | | 10.59 | | | | | | | | 31.43 | | | | N/A | | | | | | | | 16.62 | | | | N/A | |
Russell 2000® Index | | | 7.30 | | | | | | | | 25.52 | | | | N/A | | | | | | | | 14.88 | | | | N/A | |
| | (a) | Assuming maximum sales charges, if any. Average annual total returns with and without sales charges reflect reductions for distribution and service fees. See “About Fund Performance” on page 24 for a detailed description of share classes, including any related sales charges and fees, and how performance was calculated for certain share classes. | |
| | (b) | The LifePath Index Fund commenced operations on February 29, 2016. | |
N/A — Not applicable as share class and index do not have a sales charge.
Past performance is not indicative of future results.
Performance results may include adjustments made for financial reporting purposes in accordance with U.S. generally accepted accounting principles.
| | |
| 22 | | 2019 BLACKROCK ANNUAL REPORTTO SHAREHOLDERS |
| | |
| Fund Summary as of December 31, 2019 | | BlackRock LifePath® Index 2065 Fund |
Investment Objective
BlackRock LifePath® Index 2065 Fund’s (“LifePath Index 2065 Fund” or the “LifePath Index Fund”) investment objective is to seek to provide for retirement outcomes based on quantitatively measured risk. In pursuit of this objective, the LifePath Index Fund will be broadly diversified across global asset classes, with asset allocations becoming more conservative over time.
The LifePath Index Fund’s custom benchmark consists of the following:
| | | | | | | | | | | | | | | | | | | | | | | | |
| Period (a) | | Bloomberg Barclays
U.S. Aggregate
Bond Index | | | Bloomberg Barclays
U.S. TIPS Index
(Series L) | | | FTSE
EPRA Nareit Developed
Index | | | MSCI
ACWI ex USA
IMI Index | | | Russell 1000®
Index | | | Russell 2000®
Index | |
10/30/19 to 12/31/19 | | | 1.0 | % | | | 0.0 | % | | | 4.8 | % | | | 40.2 | % | | | 52.0 | % | | | 2.0 | % |
| | (a) | The LifePath Index Fund commenced operations on October 30, 2019. | |
See “About Fund Performance” on page 24 for descriptions of the indexes.
Performance Summary for the Period Ended December 31, 2019
| | | | | | | | | | | | |
| | | | | | Total Returns (a)(b) | |
| | | | | | Since Inception (c) | |
| | | | | | w/o sales
charge | | | w/sales
charge | |
Institutional | | | | | | | 5.71 | % | | | N/A | |
Investor A | | | | | | | 5.67 | | | | N/A | |
Class K | | | | | | | 5.72 | | | | N/A | |
Investor P | | | | | | | 5.67 | | | | 0.16 | % |
LifePath Index 2065 Fund Custom Benchmark | | | | | | | 5.69 | | | | N/A | |
Bloomberg Barclays U.S. Aggregate Bond Index | | | | | | | 0.41 | | | | N/A | |
Bloomberg Barclays U.S. TIPS Index (Series L) | | | | | | | 1.08 | | | | N/A | |
FTSE EPRA Nareit Developed Index | | | | | | | (0.52 | ) | | | N/A | |
MSCI ACWI ex USA IMI Index | | | | | | | 5.56 | | | | N/A | |
Russell 1000® Index | | | | | | | 6.42 | | | | N/A | |
Russell 2000® Index | | | | | | | 6.42 | | | | N/A | |
| | (a) | Assuming maximum sales charges, if any. Aggregate total returns with and without sales charges reflect reductions for distribution and service fees. See “About Fund Performance” on page 24 for a detailed description of share classes, including any related sales charges and fees. | |
| | (b) | The LifePath Index Fund compares its performance to that of a customized weighted index (the “LifePath Index 2065 Fund Custom Benchmark”) comprised of the indexes indicated above, which reflects the investment adviser’s changes to the benchmark’s weightings over time. The investment adviser adjusts the weightings of these indexes periodically based upon its evaluation and adjustment of the LifePath Index Fund’s asset allocation strategy. The weightings are presented annually but they are adjusted quarterly. | |
| | (c) | The LifePath Index Fund commenced operations on October 30, 2019. | |
N/A — Not applicable as share class and index do not have a sales charge.
Past performance is not indicative of future results.
Performance results may include adjustments made for financial reporting purposes in accordance with U.S. generally accepted accounting principles.
About Fund Performance
Institutional and Class K Shares are not subject to any sales charge. These shares bear no ongoing distribution or service fees and are available only to certain eligible investors.
Investor A Shares are not subject to any sales charge and bear no ongoing distribution fee. These shares are subject to an ongoing service fee of 0.25% per year. These shares are generally available through financial intermediaries.
Investor P Sharesare subject to a maximum initial sales charge (front-end load) of 5.25% and a service fee of 0.25% per year (but no distribution fee). Certain redemptions of these shares may be subject to a contingent deferred sales charge (“CDSC”) where no initial sales charge was paid at the time of purchase. These shares are only available to investors purchasing shares through registered representatives of an insurance company’s broker-dealer that has entered into an agreement with the LifePath Index Funds’ distributor to offer such shares. Except with respect to LifePath Index 2065 Fund, Investor P Shares performance shown prior to the Investor P Shares inception date of August 6, 2018 is that of Institutional Shares (which have no distribution or service fees) and was restated to reflect Investor P Shares fees.
Performance information reflects past performance and does not guarantee future results. Current performance may be lower or higher than the performance data quoted. Refer toblackrock.com to obtain performance data current to the most recent month-end. Performance results do not reflect the deduction of taxes that a shareholder would pay on distributions or the redemption of shares. Figures shown in the performance tables on the previous pages assume reinvestment of all distributions, if any, at net asset value (“NAV”) on the ex-dividend date. Investment return and principal value of shares will fluctuate so that shares, when redeemed, may be worth more or less than their original cost. Distributions paid to each class of shares will vary because of the different levels of service, distribution and transfer agency fees applicable to each class, which are deducted from the income available to be paid to shareholders.
BlackRock Advisors, LLC (“BAL” or the “Administrator”), each LifePath Index Fund’s administrator, has contractually agreed to waive and/or reimburse a portion of each LifePath Index Fund’s expenses. Without such waiver and/or reimbursement, each LifePath Index Fund’s performance would have been lower. With respect to each Fund’s contractual waivers, the Administrator is under no obligation to continue waiving and/or reimbursing its fees after the applicable termination date of such agreement. See Note 4 of the Notes to Financial Statements for additional information on waivers and/or reimbursements.
The LifePath Index Funds’ custom benchmarks are hypothetical representations of the performance of the respective LifePath Index Fund’s asset classes according to their weightings as of the most recent quarter-end. The weightings of the various indexes that are included in the LifePath Index Funds’ custom benchmarks are adjusted quarterly to reflect the LifePath Index Fund’s changing asset allocations over time. As of December 31, 2019, the following indexes are used to calculate the LifePath Index Funds’ custom benchmarks: Bloomberg Barclays U.S. Aggregate Bond Index, Bloomberg Barclays U.S. Treasury Inflation Protected Securities (“TIPS”) Index (Series L), FTSE EPRA Nareit Developed Index, MSCI ACWI ex USA IMI Index, Russell 1000® Index and Russell 2000® Index.
The Bloomberg Barclays U.S. Aggregate Bond Index is a widely recognized unmanaged market-weighted index comprised of investment-grade corporate bonds rated BBB or better, mortgages and U.S. Treasury and U.S. Government agency issues with at least one year to maturity. The Bloomberg Barclays U.S. TIPS Index (Series L) is a market value-weighted index that tracks inflation-protected securities issued by the U.S. Treasury. The FTSE EPRA Nareit Developed Index is a global market capitalization weighted index composed of listed real estate securities from developed market countries in North America, Europe, and Asia. The MSCI ACWI ex USA IMI Index is a free float-adjusted market capitalization weighted index that measures the equity market performance of the developed (excluding the U.S.) and emerging investable market universe. The Russell 1000® Index is an index that measures the performance of the large cap segment of the U.S. equity universe. It is a subset of the Russell 3000® Index and includes approximately 1,000 of the largest securities based on a combination of their market capitalization and current index membership. The Russell 1000® Index represents approximately 92% of the total market capitalization of the Russell 3000® Index. The Russell 2000® Index is an unmanaged index that is a subset of the Russell 3000® Index representing approximately 10% of the total market capitalization of that Index. It includes approximately 2000 of the smallest securities based on a combination of their market cap and current index membership.
Disclosure of Expenses
Shareholders of each LifePath Index Fund may incur the following charges: (a) transactional expenses, such as sales charges; and (b) operating expenses, including administration fees, service and distribution fees, including 12b-1 fees, and other fund expenses. The expense examples shown below (which are based on a hypothetical investment of $1,000 invested on July 1, 2019 and held through December 31, 2019, except with respect to LifePath® Index 2065 Fund’s Shares which are based on a hypothetical investment of $1,000 on October 30, 2019 (commencement of operations) and held through December 31, 2019) are intended to assist shareholders both in calculating expenses based on an investment in each LifePath Index Fund and in comparing these expenses with similar costs of investing in other mutual funds.
The expense examples provide information about actual account values and actual expenses. In order to estimate the expenses a shareholder paid during the period covered by this report, shareholders can divide their account value by $1,000 and then multiply the result by the number corresponding to their LifePath Index Fund and share class under the heading entitled “Expenses Paid During the Period.”
The expense examples also provide information about hypothetical account values and hypothetical expenses based on each LifePath Index Fund’s actual expense ratio and an assumed rate of return of 5% per year before expenses. In order to assist shareholders in comparing the ongoing expenses of investing in a LifePath Index Fund and other funds, compare the 5% hypothetical examples with the 5% hypothetical examples that appear in shareholder reports of other funds.
The expenses shown in the expense examples are intended to highlight shareholders’ ongoing costs only and do not reflect transactional expenses, such as sales charges, if any. Therefore, the hypothetical examples are useful in comparing ongoing expenses only, and will not help shareholders determine the relative total expenses of owning different funds. If these transactional expenses were included, shareholder expenses would have been higher.
| | |
| 24 | | 2019 BLACKROCK ANNUAL REPORTTO SHAREHOLDERS |
Disclosure of Expenses (continued)
Expense Examples
| | | | | | | | | | | | | | | | | | | | | | | | | | | | | | | | |
| | | Actual | | | | | | Hypothetical (b) | | | | |
| | | Beginning
Account Value
(07/01/19) | | | Ending
Account Value
(12/31/19) | | | Expenses
Paid During
the Period (a) | | | | | | Beginning
Account Value
(07/01/19) | | | Ending
Account Value
(12/31/19) | | | Expenses
Paid During
the Period (a) | | | Annualized
Expense
Ratio | |
| | | | | | | | |
| LifePath Index Retirement Fund | | | | | | | | | | | | | | | | | | | | | | | | |
Institutional | | $ | 1,000.00 | | | $ | 1,050.10 | | | $ | 0.62 | | | | | | | $ | 1,000.00 | | | $ | 1,024.60 | | | $ | 0.61 | | | | 0.12 | % |
Investor A | | | 1,000.00 | | | | 1,049.10 | | | | 1.91 | | | | | | | | 1,000.00 | | | | 1,023.34 | | | | 1.89 | | | | 0.37 | |
Class K | | | 1,000.00 | | | | 1,050.40 | | | | 0.36 | | | | | | | | 1,000.00 | | | | 1,024.85 | | | | 0.36 | | | | 0.07 | |
Investor P | | | 1,000.00 | | | | 1,048.30 | | | | 1.91 | | | | | | | | 1,000.00 | | | | 1,023.34 | | | | 1.89 | | | | 0.37 | |
| | | | | | | | |
| LifePath Index 2025 Fund | | | | | | | | | | | | | | | | | | | | | | | | |
Institutional | | $ | 1,000.00 | | | $ | 1,060.00 | | | $ | 0.57 | | | | | | | $ | 1,000.00 | | | $ | 1,024.65 | | | $ | 0.56 | | | | 0.11 | % |
Investor A | | | 1,000.00 | | | | 1,058.70 | | | | 1.87 | | | | | | | | 1,000.00 | | | | 1,023.39 | | | | 1.84 | | | | 0.36 | |
Class K | | | 1,000.00 | | | | 1,061.00 | | | | 0.31 | | | | | | | | 1,000.00 | | | | 1,024.90 | | | | 0.31 | | | | 0.06 | |
Investor P | | | 1,000.00 | | | | 1,059.10 | | | | 1.87 | | | | | | | | 1,000.00 | | | | 1,023.39 | | | | 1.84 | | | | 0.36 | |
| | | | | | | | |
| LifePath Index 2030 Fund | | | | | | | | | | | | | | | | | | | | | | | | |
Institutional | | $ | 1,000.00 | | | $ | 1,068.70 | | | $ | 0.57 | | | | | | | $ | 1,000.00 | | | $ | 1,024.65 | | | $ | 0.56 | | | | 0.11 | % |
Investor A | | | 1,000.00 | | | | 1,067.30 | | | | 1.88 | | | | | | | | 1,000.00 | | | | 1,023.39 | | | | 1.84 | | | | 0.36 | |
Class K | | | 1,000.00 | | | | 1,069.00 | | | | 0.31 | | | | | | | | 1,000.00 | | | | 1,024.90 | | | | 0.31 | | | | 0.06 | |
Investor P | | | 1,000.00 | | | | 1,067.30 | | | | 1.88 | | | | | | | | 1,000.00 | | | | 1,023.39 | | | | 1.84 | | | | 0.36 | |
| | | | | | | | |
| LifePath Index 2035 Fund | | | | | | | | | | | | | | | | | | | | | | | | |
Institutional | | $ | 1,000.00 | | | $ | 1,076.80 | | | $ | 0.52 | | | | | | | $ | 1,000.00 | | | $ | 1,024.70 | | | | 0.51 | % | | | 0.10 | % |
Investor A | | | 1,000.00 | | | | 1,074.90 | | | | 1.83 | | | | | | | | 1,000.00 | | | | 1,023.44 | | | | 1.79 | | | | 0.35 | |
Class K | | | 1,000.00 | | | | 1,076.50 | | | | 0.26 | | | | | | | | 1,000.00 | | | | 1,024.95 | | | | 0.26 | | | | 0.05 | |
Investor P | | | 1,000.00 | | | | 1,075.30 | | | | 1.83 | | | | | | | | 1,000.00 | | | | 1,023.44 | | | | 1.79 | | | | 0.35 | |
| | | | | | | | |
| LifePath Index 2040 Fund | | | | | | | | | | | | | | | | | | | | | | | | |
Institutional | | $ | 1,000.00 | | | $ | 1,083.40 | | | $ | 0.53 | | | | | | | $ | 1,000.00 | | | $ | 1,024.70 | | | $ | 0.51 | | | | 0.10 | % |
Investor A | | | 1,000.00 | | | | 1,081.50 | | | | 1.84 | | | | | | | | 1,000.00 | | | | 1,023.44 | | | | 1.79 | | | | 0.35 | |
Class K | | | 1,000.00 | | | | 1,083.70 | | | | 0.26 | | | | | | | | 1,000.00 | | | | 1,024.95 | | | | 0.26 | | | | 0.05 | |
Investor P | | | 1,000.00 | | | | 1,082.30 | | | | 1.84 | | | | | | | | 1,000.00 | | | | 1,023.44 | | | | 1.79 | | | | 0.35 | |
| | | | | | | | |
| LifePath Index 2045 Fund | | | | | | | | | | | | | | | | | | | | | | | | |
Institutional | | $ | 1,000.00 | | | $ | 1,087.70 | | | $ | 0.53 | | | | | | | $ | 1,000.00 | | | $ | 1,024.70 | | | $ | 0.51 | | | | 0.10 | % |
Investor A | | | 1,000.00 | | | | 1,086.60 | | | | 1.84 | | | | | | | | 1,000.00 | | | | 1,023.44 | | | | 1.79 | | | | 0.35 | |
Class K | | | 1,000.00 | | | | 1,087.90 | | | | 0.26 | | | | | | | | 1,000.00 | | | | 1,024.95 | | | | 0.26 | | | | 0.05 | |
Investor P | | | 1,000.00 | | | | 1,086.20 | | | | 1.84 | | | | | | | | 1,000.00 | | | | 1,023.44 | | | | 1.79 | | | | 0.35 | |
| | | | | | | | |
| LifePath Index 2050 Fund | | | | | | | | | | | | | | | | | | | | | | | | |
Institutional | | $ | 1,000.00 | | | $ | 1,089.40 | | | $ | 0.53 | | | | | | | $ | 1,000.00 | | | $ | 1,024.70 | | | $ | 0.51 | | | | 0.10 | % |
Investor A | | | 1,000.00 | | | | 1,088.30 | | | | 1.84 | | | | | | | | 1,000.00 | | | | 1,023.44 | | | | 1.79 | | | | 0.35 | |
Class K | | | 1,000.00 | | | | 1,089.70 | | | | 0.26 | | | | | | | | 1,000.00 | | | | 1,024.95 | | | | 0.26 | | | | 0.05 | |
Investor P | | | 1,000.00 | | | | 1,088.30 | | | | 1.84 | | | | | | | | 1,000.00 | | | | 1,023.44 | | | | 1.79 | | | | 0.35 | |
| | | | | | | | |
| LifePath Index 2055 Fund | | | | | | | | | | | | | | | | | | | | | | | | |
Institutional | | $ | 1,000.00 | | | $ | 1,089.30 | | | $ | 0.47 | | | | | | | $ | 1,000.00 | | | $ | 1,024.75 | | | $ | 0.46 | | | | 0.09 | % |
Investor A | | | 1,000.00 | | | | 1,088.30 | | | | 1.79 | | | | | | | | 1,000.00 | | | | 1,023.49 | | | | 1.73 | | | | 0.34 | |
Class K | | | 1,000.00 | | | | 1,090.30 | | | | 0.21 | | | | | | | | 1,000.00 | | | | 1,025.00 | | | | 0.20 | | | | 0.04 | |
Investor P | | | 1,000.00 | | | | 1,088.50 | | | | 1.79 | | | | | | | | 1,000.00 | | | | 1,023.49 | | | | 1.73 | | | | 0.34 | |
| | | | | | | | |
| LifePath Index 2060 Fund | | | | | | | | | | | | | | | | | | | | | | | | |
Institutional | | $ | 1,000.00 | | | $ | 1,089.20 | | | $ | 0.47 | | | | | | | $ | 1,000.00 | | | $ | 1,024.75 | | | $ | 0.46 | | | | 0.09 | % |
Investor A | | | 1,000.00 | | | | 1,088.10 | | | | 1.79 | | | | | | | | 1,000.00 | | | | 1,023.49 | | | | 1.73 | | | | 0.34 | |
Class K | | | 1,000.00 | | | | 1,090.10 | | | | 0.21 | | | | | | | | 1,000.00 | | | | 1,025.00 | | | | 0.20 | | | | 0.04 | |
Investor P | | | 1,000.00 | | | | 1,089.00 | | | | 1.79 | | | | | | | | 1,000.00 | | | | 1,023.49 | | | | 1.73 | | | | 0.34 | |
| | | | | | | | |
| LifePath Index 2065 Fund | | | | | | | | | | | | | | | | | | | | | | | | |
Institutional | | $ | 1,000.00 | | | $ | 1,057.10 | | | $ | 0.19 | | | | | | | $ | 1,000.00 | | | $ | 1,008.31 | | | $ | 0.19 | | | | 0.11 | % |
Investor A | | | 1,000.00 | | | | 1,056.70 | | | | 0.65 | | | | | | | | 1,000.00 | | | | 1,007.86 | | | | 0.63 | | | | 0.37 | |
Class K | | | 1,000.00 | | | | 1,057.20 | | | | 0.10 | | | | | | | | 1,000.00 | | | | 1,008.39 | | | | 0.10 | | | | 0.06 | |
Investor P | | | 1,000.00 | | | | 1,056.70 | | | | 0.65 | | | | | | | | 1,000.00 | | | | 1,007.86 | | | | 0.63 | | | | 0.37 | |
| | (a) | For each class of a LifePath Index Fund, expenses are equal to the annualized expense ratio for the class, multiplied by the average account value over the period, multiplied by 184/365 (to reflect the one-half year period shown), except LifePath Index 2065 Fund which is multiplied by 62/365 (to reflect the period since inception date of 10/30/19). Because a LifePath Index Fund invests all of its assets in its respective LifePath Index Master Portfolio, the expense examples reflect the net expenses of both the LifePath Index Fund and the LifePath Index Master Portfolio in which it invests. | |
| | (b) | Hypothetical 5% return before expenses is calculated by pro rating the number of days in the most recent fiscal half year divided by 365. | |
See “Disclosure of Expenses” on page 24 for further information on how expenses were calculated.
Statements of Assets and Liabilities
December 31, 2019
| | | | | | | | | | | | | | | | | | | | |
| | | BlackRock
LifePath Index
Retirement Fund | | | BlackRock
LifePath Index
2025 Fund | | | BlackRock
LifePath Index
2030 Fund | | | BlackRock
LifePath Index
2035 Fund | | | BlackRock
LifePath Index
2040 Fund | |
|
ASSETS | |
Investments at value — from the applicable LifePath Index Master Portfolio | | $ | 7,852,103,092 | | | $ | 4,518,686,114 | | | $ | 7,805,759,353 | | | $ | 4,081,777,293 | | | $ | 6,170,028,653 | |
Receivables: | |
Capital shares sold | | | 16,823,740 | | | | 17,039,269 | | | | 16,027,590 | | | | 11,188,017 | | | | 10,488,498 | |
From the Administrator/Manager | | | 91,662 | | | | 84,748 | | | | 155,858 | | | | 81,211 | | | | 135,663 | |
Prepaid expenses | | | 74,793 | | | | 32,170 | | | | 34,677 | | | | 28,332 | | | | 34,009 | |
| | | | | | | | | | | | | | | | | | | | |
Total assets | | | 7,869,093,287 | | | | 4,535,842,301 | | | | 7,821,977,478 | | | | 4,093,074,853 | | | | 6,180,686,823 | |
| | | | | | | | | | | | | | | | | | | | |
|
LIABILITIES | |
Payables: | |
Capital gains distributions | | | 307,777 | | | | 913,141 | | | | 1,686,226 | | | | 1,472,517 | | | | 1,418,191 | |
Capital shares redeemed | | | 16,262,392 | | | | 4,532,374 | | | | 9,015,518 | | | | 5,990,635 | | | | 9,786,184 | |
Contributions to the LifePath Index Master Portfolio | | | 561,348 | | | | 12,506,895 | | | | 7,012,072 | | | | 5,197,382 | | | | 702,314 | |
Income dividend distributions | | | 1,936,572 | | | | 2,409,020 | | | | 2,640,144 | | | | 2,465,590 | | | | 2,286,817 | |
Officer’s fees | | | 1,840 | | | | 1,181 | | | | 2,224 | | | | 1,061 | | | | 1,738 | |
Other accrued expenses | | | 2,044 | | | | 6,599 | | | | 6,597 | | | | 6,602 | | | | 6,615 | |
Printing fees | | | — | | | | 29,630 | | | | 55,256 | | | | 26,455 | | | | 43,249 | |
Professional fees | | | 37,657 | | | | 20,304 | | | | 20,295 | | | | 20,304 | | | | 20,299 | |
Registration fees | | | — | | | | 63,221 | | | | 54,692 | | | | 61,748 | | | | 50,243 | |
Reorganization costs | | | 77,793 | | | | — | | | | — | | | | — | | | | — | |
Service fees | | | 604,475 | | | | 38,842 | | | | 491,921 | | | | 34,692 | | | | 362,991 | |
Transfer agent fees | | | 302,706 | | | | 52,987 | | | | 349,541 | | | | 52,449 | | | | 285,941 | |
| | | | | | | | | | | | | | | | | | | | |
Total liabilities | | | 20,094,604 | | | | 20,574,194 | | | | 21,334,486 | | | | 15,329,435 | | | | 14,964,582 | |
| | | | | | | | | | | | | | | | | | | | |
| | | | | |
NET ASSETS | | $ | 7,848,998,683 | | | $ | 4,515,268,107 | | | $ | 7,800,642,992 | | | $ | 4,077,745,418 | | | $ | 6,165,722,241 | |
| | | | | | | | | | | | | | | | | | | | |
|
NET ASSETS CONSIST OF | |
Paid-in capital | | $ | 6,974,050,271 | | | $ | 3,966,136,473 | | | $ | 6,780,309,960 | | | $ | 3,482,576,733 | | | $ | 5,249,451,675 | |
Accumulated earnings | | | 874,948,412 | | | | 549,131,634 | | | | 1,020,333,032 | | | | 595,168,685 | | | | 916,270,566 | |
| | | | | | | | | | | | | | | | | | | | |
NET ASSETS | | $ | 7,848,998,683 | | | $ | 4,515,268,107 | | | $ | 7,800,642,992 | | | $ | 4,077,745,418 | | | $ | 6,165,722,241 | |
| | | | | | | | | | | | | | | | | | | | |
|
NET ASSET VALUE | |
|
| Institutional | |
Net assets | | $ | 532,913,184 | | | $ | 189,201,969 | | | $ | 561,901,676 | | | $ | 148,826,500 | | | $ | 577,302,974 | |
| | | | | | | | | | | | | | | | | | | | |
Shares outstanding(a) | | | 40,830,270 | | | | 13,286,177 | | | | 38,160,852 | | | | 9,709,868 | | | | 36,579,708 | |
| | | | | | | | | | | | | | | | | | | | |
Net asset value | | $ | 13.05 | | | $ | 14.24 | | | $ | 14.72 | | | $ | 15.33 | | | $ | 15.78 | |
| | | | | | | | | | | | | | | | | | | | |
|
| Investor A | |
Net assets | | $ | 306,254,027 | | | $ | 157,606,289 | | | $ | 343,033,136 | | | $ | 158,772,661 | | | $ | 240,111,614 | |
| | | | | | | | | | | | | | | | | | | | |
Shares outstanding(a) | | | 23,493,229 | | | | 11,081,319 | | | | 23,302,937 | | | | 10,385,590 | | | | 15,243,836 | |
| | | | | | | | | | | | | | | | | | | | |
Net asset value | | $ | 13.04 | | | $ | 14.22 | | | $ | 14.72 | | | $ | 15.29 | | | $ | 15.75 | |
| | | | | | | | | | | | | | | | | | | | |
|
| Class K | |
Net assets | | $ | 4,462,411,580 | | | $ | 4,134,269,707 | | | $ | 4,892,278,020 | | | $ | 3,758,092,316 | | | $ | 3,849,265,188 | |
| | | | | | | | | | | | | | | | | | | | |
Shares outstanding(a) | | | 342,082,525 | | | | 290,211,614 | | | | 332,547,887 | | | | 245,404,157 | | | | 243,927,808 | |
| | | | | | | | | | | | | | | | | | | | |
Net asset value | | $ | 13.04 | | | $ | 14.25 | | | $ | 14.71 | | | $ | 15.31 | | | $ | 15.78 | |
| | | | | | | | | | | | | | | | | | | | |
|
| Investor P | |
Net assets | | $ | 2,547,419,892 | | | $ | 34,190,142 | | | $ | 2,003,430,160 | | | $ | 12,053,941 | | | $ | 1,499,042,465 | |
| | | | | | | | | | | | | | | | | | | | |
Shares outstanding(a) | | | 195,586,764 | | | | 2,408,101 | | | | 136,208,361 | | | | 789,568 | | | | 95,244,020 | |
| | | | | | | | | | | | | | | | | | | | |
Net asset value | | $ | 13.02 | | | $ | 14.20 | | | $ | 14.71 | | | $ | 15.27 | | | $ | 15.74 | |
| | | | | | | | | | | | | | | | | | | | |
| (a) | No par value, unlimited number of shares authorized. |
See notes to financial statements.
| | |
| 26 | | 2019 BLACKROCK ANNUAL REPORTTO SHAREHOLDERS |
Statements of Assets and Liabilities (continued)
December 31, 2019
| | | | | | | | | | | | | | | | | | | | |
| | | BlackRock
LifePath Index
2045 Fund | | | BlackRock
LifePath Index
2050 Fund | | | BlackRock
LifePath Index
2055 Fund | | | BlackRock
LifePath Index
2060 Fund | | | BlackRock
LifePath Index 2065 Fund | |
|
ASSETS | |
Investments at value — from the applicable LifePath Index Master Portfolio | | $ | 2,963,571,244 | | | $ | 3,113,539,308 | | | $ | 1,502,651,373 | | | $ | 410,881,465 | | | $ | 2,080,719 | |
Receivables: | |
Capital shares sold | | | 6,633,756 | | | | 7,646,573 | | | | 4,405,101 | | | | 1,708,774 | | | | 14,154 | |
Withdrawals from the LifePath Index Master Portfolio | | | — | | | | — | | | | 338,950 | | | | — | | | | — | |
From the Administrator/Manager | | | 63,781 | | | | — | | | | 44,921 | | | | 21,911 | | | | 37,908 | |
Deferred offering costs | | | — | | | | — | | | | — | | | | — | | | | 149,219 | |
Prepaid expenses | | | 26,160 | | | | — | | | | 22,091 | | | | 47,112 | | | | — | |
| | | | | | | | | | | | | | | | | | | | |
Total assets | | | 2,970,294,941 | | | | 3,121,185,881 | | | | 1,507,462,436 | | | | 412,659,262 | | | | 2,282,000 | |
| | | | | | | | | | | | | | | | | | | | |
|
LIABILITIES | |
Payables: | |
Capital gains distributions | | | 934,390 | | | | 703,132 | | | | 230,895 | | | | — | | | | — | |
Capital shares redeemed | | | 5,710,981 | | | | 5,941,702 | | | | 4,744,051 | | | | 714,389 | | | | — | |
Contributions to the LifePath Index Master Portfolio | | | 922,775 | | | | 1,704,871 | | | | — | | | | 994,385 | | | | 14,154 | |
Income dividend distributions | | | 1,729,425 | | | | 1,310,185 | | | | 786,846 | | | | 264,864 | | | | 9,169 | |
Offering costs | | | — | | | | — | | | | — | | | | — | | | | 120,224 | |
Officer’s fees | | | 730 | | | | 793 | | | | 370 | | | | — | | | | — | |
Other accrued expenses | | | 6,600 | | | | 36,427 | | | | 48,074 | | | | 6,884 | | | | 1,842 | |
Printing fees | | | 18,465 | | | | 20,123 | | | | — | | | | 1,773 | | | | 12,028 | |
Professional fees | | | 20,290 | | | | 20,314 | | | | 20,306 | | | | 20,309 | | | | 27,345 | |
Registration fees | | | 47,922 | | | | — | | | | — | | | | 12,379 | | | | — | |
Service fees | | | 25,036 | | | | 126,892 | | | | 16,290 | | | | 2,630 | | | | 21 | |
Transfer agent fees | | | 42,127 | | | | — | | | | 27,089 | | | | — | | | | — | |
| | | | | | | | | | | | | | | | | | | | |
Total liabilities | | | 9,458,741 | | | | 9,864,439 | | | | 5,873,921 | | | | 2,017,613 | | | | 184,783 | |
| | | | | | | | | | | | | | | | | | | | |
| | | | | |
NET ASSETS | | $ | 2,960,836,200 | | | $ | 3,111,321,442 | | | $ | 1,501,588,515 | | | $ | 410,641,649 | | | $ | 2,097,217 | |
| | | | | | | | | | | | | | | | | | | | |
|
NET ASSETS CONSIST OF | |
Paid-in capital | | $ | 2,506,905,405 | | | $ | 2,640,154,054 | | | $ | 1,288,982,948 | | | $ | 369,194,586 | | | $ | 2,027,577 | |
Accumulated earnings | | | 453,930,795 | | | | 471,167,388 | | | | 212,605,567 | | | | 41,447,063 | | | | 69,640 | |
| | | | | | | | | | | | | | | | | | | | |
NET ASSETS | | $ | 2,960,836,200 | | | $ | 3,111,321,442 | | | $ | 1,501,588,515 | | | $ | 410,641,649 | | | $ | 2,097,217 | |
| | | | | | | | | | | | | | | | | | | | |
|
NET ASSET VALUE | |
|
| Institutional | |
Net assets | | $ | 116,727,186 | | | $ | 111,104,789 | | | $ | 76,250,298 | | | $ | 11,131,785 | | | $ | 52,411 | |
| | | | | | | | | | | | | | | | | | | | |
Shares outstanding(a) | | | 7,181,130 | | | | 6,712,219 | | | | 4,503,375 | | | | 738,928 | | | | 5,000 | |
| | | | | | | | | | | | | | | | | | | | |
Net asset value | | $ | 16.25 | | | $ | 16.55 | | | $ | 16.93 | | | $ | 15.06 | | | $ | 10.48 | |
| | | | | | | | | | | | | | | | | | | | |
|
| Investor A | |
Net assets | | $ | 120,718,368 | | | $ | 138,396,616 | | | $ | 78,918,727 | | | $ | 11,357,536 | | | $ | 52,768 | |
| | | | | | | | | | | | | | | | | | | | |
Shares outstanding(a) | | | 7,442,913 | | | | 8,381,746 | | | | 4,672,033 | | | | 755,519 | | | | 5,034 | |
| | | | | | | | | | | | | | | | | | | | |
Net asset value | | $ | 16.22 | | | $ | 16.51 | | | $ | 16.89 | | | $ | 15.03 | | | $ | 10.48 | |
| | | | | | | | | | | | | | | | | | | | |
|
| Class K | |
Net assets | | $ | 2,720,014,199 | | | $ | 2,388,474,967 | | | $ | 1,344,553,786 | | | $ | 386,112,896 | | | $ | 1,939,627 | |
| | | | | | | | | | | | | | | | | | | | |
Shares outstanding(a) | | | 167,198,523 | | | | 144,298,501 | | | | 79,394,145 | | | | 25,625,450 | | | | 185,036 | |
| | | | | | | | | | | | | | | | | | | | |
Net asset value | | $ | 16.27 | | | $ | 16.55 | | | $ | 16.94 | | | $ | 15.07 | | | $ | 10.48 | |
| | | | | | | | | | | | | | | | | | | | |
|
| Investor P | |
Net assets | | $ | 3,376,447 | | | $ | 473,345,070 | | | $ | 1,865,704 | | | $ | 2,039,432 | | | $ | 52,411 | |
| | | | | | | | | | | | | | | | | | | | |
Shares outstanding(a) | | | 208,419 | | | | 28,690,111 | | | | 110,525 | | | | 135,734 | | | | 5,000 | |
| | | | | | | | | | | | | | | | | | | | |
Net asset value | | $ | 16.20 | | | $ | 16.50 | | | $ | 16.88 | | | $ | 15.03 | | | $ | 10.48 | |
| | | | | | | | | | | | | | | | | | | | |
| (a) | No par value, unlimited number of shares authorized. |
See notes to financial statements.
Statements of Operations
Year Ended December 31, 2019
| | | | | | | | | | | | | | | | | | | | |
| | | BlackRock
LifePath Index
Retirement Fund | | | BlackRock
LifePath Index
2025 Fund | | | BlackRock
LifePath Index
2030 Fund | | | BlackRock
LifePath Index
2035 Fund | | | BlackRock
LifePath Index
2040 Fund | |
|
INVESTMENT INCOME | |
Net investment income allocated from the applicable LifePath Index Master Portfolio: | |
Dividends — affiliated | | $ | 47,523,488 | | | $ | 60,875,407 | | | $ | 130,280,766 | | | $ | 75,453,167 | | | $ | 131,752,799 | |
Income — affiliated | | | 49,640,477 | | | | 42,584,021 | | | | 55,849,614 | | | | 18,310,416 | | | | 15,924,410 | |
Securities lending income — affiliated — net | | | 25,713 | | | | 51,640 | | | | 74,451 | | | | 73,622 | | | | 70,718 | |
Expenses | | | (2,719,333 | ) | | | (3,056,115 | ) | | | (5,299,358 | ) | | | (2,569,850 | ) | | | (3,915,851 | ) |
Fees waived | | | 538,308 | | | | 668,937 | | | | 1,128,250 | | | | 796,270 | | | | 1,339,251 | |
| | | | | | | | | | | | | | | | | | | | |
Total investment income | | | 95,008,653 | | | | 101,123,890 | | | | 182,033,723 | | | | 92,063,625 | | | | 145,171,327 | |
| | | | | | | | | | | | | | | | | | | | |
|
FUND EXPENSES | |
Service — class specific | | | 3,114,660 | | | | 402,749 | | | | 5,610,650 | | | | 356,283 | | | | 4,049,161 | |
Transfer agent — class specific | | | 972,460 | | | | 252,405 | | | | 2,012,031 | | | | 253,625 | | | | 1,698,955 | |
Administration | | | 955,286 | | | | 1,126,970 | | | | 2,027,252 | | | | 1,003,758 | | | | 1,586,610 | |
Registration | | | 129,114 | | | | 138,064 | | | | 266,652 | | | | 123,890 | | | | 236,658 | |
Professional | | | 56,994 | | | | 49,984 | | | | 54,472 | | | | 46,309 | | | | 49,492 | |
Printing | | | 45,814 | | | | 50,120 | | | | 102,591 | | | | 49,241 | | | | 89,865 | |
Reorganization cost | | | 20,750 | | | | — | | | | — | | | | — | | | | — | |
Organization and offering | | | 20,211 | | | | 20,211 | | | | 20,211 | | | | 20,211 | | | | 20,211 | |
Accounting services | | | 5,088 | | | | 5,088 | | | | 5,088 | | | | 5,088 | | | | 5,088 | |
Officer | | | 1,209 | | | | 1,633 | | | | 3,231 | | | | 1,457 | | | | 2,511 | |
Miscellaneous | | | 13,311 | | | | 13,679 | | | | 14,610 | | | | 13,054 | | | | 13,538 | |
| | | | | | | | | | | | | | | | | | | | |
Total expenses | | | 5,334,897 | | | | 2,060,903 | | | | 10,116,788 | | | | 1,872,916 | | | | 7,752,089 | |
Less: | |
Fees waived and/or reimbursed by the Administrator/Manager | | | (1,245,630 | ) | | | (1,404,250 | ) | | | (2,492,600 | ) | | | (1,261,865 | ) | | | (2,002,823 | ) |
Transfer agent fees waived and/or reimbursed — class specific | | | (249,927 | ) | | | (108,714 | ) | | | (664,468 | ) | | | (126,272 | ) | | | (634,328 | ) |
| | | | | | | | | | | | | | | | | | | | |
Total expenses after fees waived and/or reimbursed | | | 3,839,340 | | | | 547,939 | | | | 6,959,720 | | | | 484,779 | | | | 5,114,938 | |
| | | | | | | | | | | | | | | | | | | | |
Net investment income | | | 91,169,313 | | | | 100,575,951 | | | | 175,074,003 | | | | 91,578,846 | | | | 140,056,389 | |
| | | | | | | | | | | | | | | | | | | | |
| | | | | |
REALIZED AND UNREALIZED GAIN ALLOCATED FROM THE APPLICABLE LIFEPATH INDEX MASTER PORTFOLIO | | | | | | | | | | | | | | | | | | | | |
Net realized gain from investments | | | 13,951,325 | | | | 20,258,035 | | | | 44,140,504 | | | | 24,407,154 | | | | 42,088,478 | |
Net change in unrealized appreciation (depreciation) on investments | | | 352,596,303 | | | | 510,145,924 | | | | 1,043,117,751 | | | | 558,734,138 | | | | 967,219,018 | |
| | | | | | | | | | | | | | | | | | | | |
Total realized and unrealized gain | | | 366,547,628 | | | | 530,403,959 | | | | 1,087,258,255 | | | | 583,141,292 | | | | 1,009,307,496 | |
| | | | | | | | | | | | | | | | | | | | |
NET INCREASE IN NET ASSETS RESULTING FROM OPERATIONS | | $ | 457,716,941 | | | $ | 630,979,910 | | | $ | 1,262,332,258 | | | $ | 674,720,138 | | | $ | 1,149,363,885 | |
| | | | | | | | | | | | | | | | | | | | |
See notes to financial statements.
| | |
| 28 | | 2019 BLACKROCK ANNUAL REPORTTO SHAREHOLDERS |
Statements of Operations (continued)
Year Ended December 31, 2019
| | | | | | | | | | | | | | | | | | | | |
| | | BlackRock
LifePath Index
2045 Fund | | | BlackRock
LifePath Index
2050 Fund | | | BlackRock
LifePath Index
2055 Fund | | | BlackRock
LifePath Index
2060 Fund | | | BlackRock
LifePath Index
2065 Fund (a) | |
|
INVESTMENT INCOME | |
Net investment income allocated from the applicable LifePath Index Master Portfolio: | |
Dividends — affiliated | | $ | 64,221,639 | | | $ | 70,352,691 | | | $ | 32,722,866 | | | $ | 7,943,022 | | | $ | 18,692 | |
Income — affiliated | | | 3,070,663 | | | | 1,597,837 | | | | 701,107 | | | | 165,014 | | | | 166 | |
Securities lending income — affiliated — net | | | 8,972 | | | | 15,943 | | | | 8,964 | | | | — | | | | — | |
Expenses | | | (1,751,198 | ) | | | (1,861,812 | ) | | | (882,966 | ) | | | (267,942 | ) | | | (17,733 | ) |
Fees waived | | | 623,513 | | | | 663,253 | | | | 451,146 | | | | 167,670 | | | | 17,579 | |
| | | | | | | | | | | | | | | | | | | | |
Total investment income | | | 66,173,589 | | | | 70,767,912 | | | | 33,001,117 | | | | 8,007,764 | | | | 18,704 | |
| | | | | | | | | | | | | | | | | | | | |
|
FUND EXPENSES | |
Administration | | | 708,561 | | | | 759,645 | | | | 347,107 | | | | 80,517 | | | | 80 | |
Service — class specific | | | 238,235 | | | | 1,373,484 | | | | 155,185 | | | | 21,897 | | | | 44 | |
Transfer agent — class specific | | | 221,668 | | | | 623,342 | | | | 217,650 | | | | 85,069 | | | | 64 | |
Registration | | | 109,584 | | | | 130,593 | | | | 87,205 | | | | 69,731 | | | | — | |
Professional | | | 42,700 | | | | 41,875 | | | | 38,523 | | | | 41,706 | | | | 27,345 | |
Printing | | | 36,467 | | | | 50,328 | | | | 27,670 | | | | 8,367 | | | | 12,028 | |
Organization and offering | | | 20,211 | | | | 20,211 | | | | 20,211 | | | | 20,211 | | | | 55,621 | |
Accounting services | | | 5,088 | | | | 5,088 | | | | 5,088 | | | | 5,088 | | | | 868 | |
Officer | | | 1,001 | | | | 1,118 | | | | 495 | | | | 101 | | | | — | |
Miscellaneous | | | 11,468 | | | | 11,296 | | | | 10,779 | | | | 10,460 | | | | 1,674 | |
| | | | | | | | | | | | | | | | | | | | |
Total expenses | | | 1,394,983 | | | | 3,016,980 | | | | 909,913 | | | | 343,147 | | | | 97,724 | |
Less: | |
Fees waived and/or reimbursed by the Administrator/Manager | | | (934,908 | ) | | | (1,020,093 | ) | | | (537,020 | ) | | | (236,256 | ) | | | (97,613 | ) |
Transfer agent fees waived and/or reimbursed — class specific | | | (130,006 | ) | | | (305,875 | ) | | | (150,464 | ) | | | (77,706 | ) | | | (50 | ) |
| | | | | | | | | | | | | | | | | | | | |
Total expenses after fees waived and/or reimbursed | | | 330,069 | | | | 1,691,012 | | | | 222,429 | | | | 29,185 | | | | 61 | |
| | | | | | | | | | | | | | | | | | | | |
Net investment income | | | 65,843,520 | | | | 69,076,900 | | | | 32,778,688 | | | | 7,978,579 | | | | 18,643 | |
| | | | | | | | | | | | | | | | | | | | |
| | | | | |
REALIZED AND UNREALIZED GAIN (LOSS) ALLOCATED FROM THE APPLICABLE LIFEPATH INDEX MASTER PORTFOLIO | | | | | | | | | | | | | | | | | | | | |
| |
Net realized gain (loss) from investments | | | 19,696,430 | | | | 22,244,047 | | | | 5,381,048 | | | | 455,441 | | | | (3,914 | ) |
Net change in unrealized appreciation (depreciation) on investments | | | 448,039,345 | | | | 491,517,970 | | | | 225,544,668 | | | | 52,117,026 | | | | 73,112 | |
| | | | | | | | | | | | | | | | | | | | |
Net realized and unrealized gain | | | 467,735,775 | | | | 513,762,017 | | | | 230,925,716 | | | | 52,572,467 | | | | 69,198 | |
| | | | | | | | | | | | | | | | | | | | |
NET INCREASE IN NET ASSETS RESULTING FROM OPERATIONS | | $ | 533,579,295 | | | $ | 582,838,917 | | | $ | 263,704,404 | | | $ | 60,551,046 | | | $ | 87,841 | |
| | | | | | | | | | | | | | | | | | | | |
| (a) | Commenced operations on October 30, 2019. |
See notes to financial statements.
Statements of Changes in Net Assets
| | | | | | | | | | | | | | | | | | | | |
| | | BlackRock LifePath Index
Retirement Fund | | | | | | BlackRock LifePath Index 2025 Fund | |
| | | Year Ended December 31, | | | | | | Year Ended December 31, | |
| | | 2019 | | | 2018 | | | | | | 2019 | | | 2018 | |
| | | | | |
INCREASE (DECREASE) IN NET ASSETS | | | | | | | | | | | | | | | | | | | | |
| | | | | |
OPERATIONS | | | | | | | | | | | | | | | | | | | | |
Net investment income | | $ | 91,169,313 | | | $ | 36,315,765 | | | | | | | $ | 100,575,951 | | | $ | 70,965,279 | |
Net realized gain (loss) | | | 13,951,325 | | | | (5,296,150 | ) | | | | | | | 20,258,035 | | | | (5,159,414 | ) |
Net change in unrealized appreciation (depreciation) | | | 352,596,303 | | | | (99,347,538 | ) | | | | | | | 510,145,924 | | | | (218,830,890 | ) |
| | | | | | | | | | | | | | | | | | | | |
Net increase (decrease) in net assets resulting from operations | | | 457,716,941 | | | | (68,327,923 | ) | | | | | | | 630,979,910 | | | | (153,025,025 | ) |
| | | | | | | | | | | | | | | | | | | | |
| | | | | |
DISTRIBUTIONS(a) | | | | | | | | | | | | | | | | | | | | |
Institutional | | | (6,591,739 | ) | | | (1,863,610 | ) | | | | | | | (4,309,186 | ) | | | (2,690,202 | ) |
Investor A | | | (3,622,782 | ) | | | (1,701,611 | ) | | | | | | | (4,248,493 | ) | | | (3,022,227 | ) |
Class K | | | (57,978,286 | ) | | | (28,326,410 | ) | | | | | | | (114,171,579 | ) | | | (70,018,318 | ) |
Investor P | | | (32,521,554 | ) | | | (6,176,947 | ) | | | | | | | (661,107 | ) | | | (18,628 | ) |
| | | | | | | | | | | | | | | | | | | | |
Decrease in net assets resulting from distributions to shareholders | | | (100,714,361 | ) | | | (38,068,578 | ) | | | | | | | (123,390,365 | ) | | | (75,749,375 | ) |
| | | | | | | | | | | | | | | | | | | | |
| | | | | |
CAPITAL SHARE TRANSACTIONS | | | | | | | | | | | | | | | | | | | | |
Net increase in net assets derived from capital share transactions | | | 5,191,689,998 | | | | 1,171,859,011 | | | | | | | | 1,003,685,105 | | | | 732,145,328 | |
| | | | | | | | | | | | | | | | | | | | |
| | | | | |
NET ASSETS | | | | | | | | | | | | | | | | | | | | |
Total increase in net assets | | | 5,548,692,578 | | | | 1,065,462,510 | | | | | | | | 1,511,274,650 | | | | 503,370,928 | |
Beginning of year | | | 2,300,306,105 | | | | 1,234,843,595 | | | | | | | | 3,003,993,457 | | | | 2,500,622,529 | |
| | | | | | | | | | | | | | | | | | | | |
End of year | | $ | 7,848,998,683 | | | $ | 2,300,306,105 | | | | | | | $ | 4,515,268,107 | | | $ | 3,003,993,457 | |
| | | | | | | | | | | | | | | | | | | | |
| (a) | Distributions for annual periods determined in accordance with U.S. federal income tax regulations. |
See notes to financial statements.
| | |
| 30 | | 2019 BLACKROCK ANNUAL REPORTTO SHAREHOLDERS |
Statements of Changes in Net Assets (continued)
| | | | | | | | | | | | | | | | | | | | |
| | | BlackRock LifePath Index 2030 Fund | | | | | | BlackRock LifePath Index 2035 Fund | |
| | | Year Ended December 31, | | | | | | Year Ended December 31, | |
| | | 2019 | | | 2018 | | | | | | 2019 | | | 2018 | |
| | | | | |
INCREASE (DECREASE) IN NET ASSETS | | | | | | | | | | | | | | | | | | | | |
| | | | | |
OPERATIONS | | | | | | | | | | | | | | | | | | | | |
Net investment income | | $ | 175,074,003 | | | $ | 99,970,826 | | | | | | | $ | 91,578,846 | | | $ | 62,544,819 | |
Net realized gain (loss) | | | 44,140,504 | | | | (8,831,035 | ) | | | | | | | 24,407,154 | | | | (3,348,596 | ) |
Net change in unrealized appreciation (depreciation) | | | 1,043,117,751 | | | | (402,679,866 | ) | | | | | | | 558,734,138 | | | | (238,976,379 | ) |
| | | | | | | | | | | | | | | | | | | | |
Net increase (decrease) in net assets resulting from operations | | | 1,262,332,258 | | | | (311,540,075 | ) | | | | | | | 674,720,138 | | | | (179,780,156 | ) |
| | | | | | | | | | | | | | | | | | | | |
| | | | | |
DISTRIBUTIONS(a) | | | | | | | | | | | | | | | | | | | | |
Institutional | | | (16,070,249 | ) | | | (4,756,501 | ) | | | | | | | (4,231,753 | ) | | | (2,215,283 | ) |
Investor A | | | (10,110,562 | ) | | | (5,489,756 | ) | | | | | | | (4,706,896 | ) | | | (2,509,087 | ) |
Class K | | | (147,751,384 | ) | | | (74,020,681 | ) | | | | | | | (115,482,080 | ) | | | (54,921,017 | ) |
Investor P | | | (59,340,951 | ) | | | (12,415,867 | ) | | | | | | | (270,832 | ) | | | (5,192 | ) |
| | | | | | | | | | | | | | | | | | | | |
Decrease in net assets resulting from distributions to shareholders | | | (233,273,146 | ) | | | (96,682,805 | ) | | | | | | | (124,691,561 | ) | | | (59,650,579 | ) |
| | | | | | | | | | | | | | | | | | | | |
| | | | | |
CAPITAL SHARE TRANSACTIONS | | | | | | | | | | | | | | | | | | | | |
Net increase in net assets derived from capital share transactions | | | 1,041,772,501 | | | | 3,007,159,930 | | | | | | | | 935,493,593 | | | | 714,943,481 | |
| | | | | | | | | | | | | | | | | | | | |
| | | | | |
NET ASSETS | | | | | | | | | | | | | | | | | | | | |
Total increase in net assets | | | 2,070,831,613 | | | | 2,598,937,050 | | | | | | | | 1,485,522,170 | | | | 475,512,746 | |
Beginning of year | | | 5,729,811,379 | | | | 3,130,874,329 | | | | | | | | 2,592,223,248 | | | | 2,116,710,502 | |
| | | | | | | | | | | | | | | | | | | | |
End of year | | $ | 7,800,642,992 | | | $ | 5,729,811,379 | | | | | | | $ | 4,077,745,418 | | | $ | 2,592,223,248 | |
| | | | | | | | | | | | | | | | | | | | |
| (a) | Distributions for annual periods determined in accordance with U.S. federal income tax regulations. |
See notes to financial statements.
Statements of Changes in Net Assets (continued)
| | | | | | | | | | | | | | | | | | | | |
| | | BlackRock LifePath Index 2040 Fund | | | | | | BlackRock LifePath Index 2045 Fund | |
| | | Year Ended December 31, | | | | | | Year Ended December 31, | |
| | | 2019 | | | 2018 | | | | | | 2019 | | | 2018 | |
| | | | | |
INCREASE (DECREASE) IN NET ASSETS | | | | | | | | | | | | | | | | | | | | |
| | | | | |
OPERATIONS | | | | | | | | | | | | | | | | | | | | |
Net investment income | | $ | 140,056,389 | | | $ | 79,336,308 | | | | | | | $ | 65,843,520 | | | $ | 43,722,634 | |
Net realized gain (loss) | | | 42,088,478 | | | | (17,782,484 | ) | | | | | | | 19,696,430 | | | | (4,471,220 | ) |
Net change in unrealized appreciation (depreciation) | | | 967,219,018 | | | | (373,948,239 | ) | | | | | | | 448,039,345 | | | | (188,690,572 | ) |
| | | | | | | | | | | | | | | | | | | | |
Net increase (decrease) in net assets resulting from operations | | | 1,149,363,885 | | | | (312,394,415 | ) | | | | | | | 533,579,295 | | | | (149,439,158 | ) |
| | | | | | | | | | | | | | | | | | | | |
| | | | | |
DISTRIBUTIONS(a) | | | | | | | | | | | | | | | | | | | | |
Institutional | | | (18,461,540 | ) | | | (4,857,706 | ) | | | | | | | (3,408,416 | ) | | | (1,664,434 | ) |
Investor A | | | (7,249,676 | ) | | | (3,596,340 | ) | | | | | | | (3,471,521 | ) | | | (1,476,281 | ) |
Class K | | | (121,455,537 | ) | | | (56,256,528 | ) | | | | | | | (83,920,186 | ) | | | (37,519,200 | ) |
Investor P | | | (46,395,443 | ) | | | (9,370,925 | ) | | | | | | | (82,419 | ) | | | (2,779 | ) |
| | | | | | | | | | | | | | | | | | | | |
Decrease in net assets resulting from distributions to shareholders | | | (193,562,196 | ) | | | (74,081,499 | ) | | | | | | | (90,882,542 | ) | | | (40,662,694 | ) |
| | | | | | | | | | | | | | | | | | | | |
| | | | | |
CAPITAL SHARE TRANSACTIONS | | | | | | | | | | | | | | | | | | | | |
Net increase in net assets derived from capital share transactions | | | 824,786,114 | | | | 2,437,404,493 | | | | | | | | 736,577,068 | | | | 585,732,158 | |
| | | | | | | | | | | | | | | | | | | | |
| | | | | |
NET ASSETS | | | | | | | | | | | | | | | | | | | | |
Total increase in net assets | | | 1,780,587,803 | | | | 2,050,928,579 | | | | | | | | 1,179,273,821 | | | | 395,630,306 | |
Beginning of year | | | 4,385,134,438 | | | | 2,334,205,859 | | | | | | | | 1,781,562,379 | | | | 1,385,932,073 | |
| | | | | | | | | | | | | | | | | | | | |
End of year | | $ | 6,165,722,241 | | | $ | 4,385,134,438 | | | | | | | $ | 2,960,836,200 | | | $ | 1,781,562,379 | |
| | | | | | | | | | | | | | | | | | | | |
| (a) | Distributions for annual periods determined in accordance with U.S. federal income tax regulations. |
See notes to financial statements.
| | |
| 32 | | 2019 BLACKROCK ANNUAL REPORTTO SHAREHOLDERS |
Statements of Changes in Net Assets (continued)
| | | | | | | | | | | | | | | | | | | | |
| | | BlackRock LifePath Index 2050 Fund | | | | | | BlackRock LifePath Index 2055 Fund | |
| | | Year Ended December 31, | | | | | | Year Ended December 31, | |
| | | 2019 | | | 2018 | | | | | | 2019 | | | 2018 | |
| | | | | |
INCREASE (DECREASE) IN NET ASSETS | | | | | | | | | | | | | | | | | | | | |
| | | | | |
OPERATIONS | | | | | | | | | | | | | | | | | | | | |
Net investment income | | $ | 69,076,900 | | | $ | 41,798,280 | | | | | | | $ | 32,778,688 | | | $ | 19,339,136 | |
Net realized gain (loss) | | | 22,244,047 | | | | (9,596,714 | ) | | | | | | | 5,381,048 | | | | (5,510,087 | ) |
Net change in unrealized appreciation (depreciation) | | | 491,517,970 | | | | (196,328,322 | ) | | | | | | | 225,544,668 | | | | (84,811,123 | ) |
| | | | | | | | | | | | | | | | | | | | |
Net increase (decrease) in net assets resulting from operations | | | 582,838,917 | | | | (164,126,756 | ) | | | | | | | 263,704,404 | | | | (70,982,074 | ) |
| | | | | | | | | | | | | | | | | | | | |
| | | | | |
DISTRIBUTIONS(a) | | | | | | | | | | | | | | | | | | | | |
Institutional | | | (3,246,036 | ) | | | (1,584,622 | ) | | | | | | | (2,263,835 | ) | | | (1,303,230 | ) |
Investor A | | | (3,979,316 | ) | | | (1,684,498 | ) | | | | | | | (1,993,606 | ) | | | (825,974 | ) |
Class K | | | (72,989,299 | ) | | | (31,641,931 | ) | | | | | | | (36,123,446 | ) | | | (15,248,291 | ) |
Investor P | | | (14,301,744 | ) | | | (3,032,970 | ) | | | | | | | (38,961 | ) | | | (2,309 | ) |
| | | | | | | | | | | | | | | | | | | | |
Decrease in net assets resulting from distributions to shareholders | | | (94,516,395 | ) | | | (37,944,021 | ) | | | | | | | (40,419,848 | ) | | | (17,379,804 | ) |
| | | | | | | | | | | | | | | | | | | | |
| | | | | |
CAPITAL SHARE TRANSACTIONS | | | | | | | | | | | | | | | | | | | | |
Net increase in net assets derived from capital share transactions | | | 657,315,796 | | | | 915,730,764 | | | | | | | | 458,558,455 | | | | 330,037,613 | |
| | | | | | | | | | | | | | | | | | | | |
| | | | | |
NET ASSETS | | | | | | | | | | | | | | | | | | | | |
Total increase in net assets | | | 1,145,638,318 | | | | 713,659,987 | | | | | | | | 681,843,011 | | | | 241,675,735 | |
Beginning of year | | | 1,965,683,124 | | | | 1,252,023,137 | | | | | | | | 819,745,504 | | | | 578,069,769 | |
| | | | | | | | | | | | | | | | | | | | |
End of year | | $ | 3,111,321,442 | | | $ | 1,965,683,124 | | | | | | | $ | 1,501,588,515 | | | $ | 819,745,504 | |
| | | | | | | | | | | | | | | | | | | | |
| (a) | Distributions for annual periods determined in accordance with U.S. federal income tax regulations. |
See notes to financial statements.
Statements of Changes in Net Assets (continued)
| | | | | | | | | | | | | | | | |
| | | BlackRock LifePath Index 2060 Fund | | | | | | BlackRock
LifePath Index
2065 Fund | |
| | | Year Ended December 31, | | | | | | Period from 10/30/19 (a) to 12/31/19 | |
| | | 2019 | | | 2018 | | | | |
| | | | |
INCREASE (DECREASE) IN NET ASSETS | | | | | | | | | | | | | | | | |
| | | | |
OPERATIONS | | | | | | | | | | | | | | | | |
Net investment income | | $ | 7,978,579 | | | $ | 3,224,790 | | | | | | | $ | 18,643 | |
Net realized gain (loss) | | | 455,441 | | | | (4,528,884 | ) | | | | | | | (3,914 | ) |
Net change in unrealized appreciation (depreciation) | | | 52,117,026 | | | | (12,235,947 | ) | | | | | | | 73,112 | |
| | | | | | | | | | | | | | | | |
Net increase (decrease) in net assets resulting from operations | | | 60,551,046 | | | | (13,540,041 | ) | | | | | | | 87,841 | |
| | | | | | | | | | | | | | | | |
| | | | |
DISTRIBUTIONS(b) | | | | | | | | | | | | | | | | |
Institutional | | | (198,331 | ) | | | (54,600 | ) | | | | | | | (440 | ) |
Investor A | | | (221,351 | ) | | | (64,121 | ) | | | | | | | (457 | ) |
Class K | | | (8,001,965 | ) | | | (2,729,840 | ) | | | | | | | (16,869 | ) |
Investor P | | | (33,958 | ) | | | (2,587 | ) | | | | | | | (435 | ) |
| | | | | | | | | | | | | | | | |
Decrease in net assets resulting from distributions to shareholders | | | (8,455,605 | ) | | | (2,851,148 | ) | | | | | | | (18,201 | ) |
| | | | | | | | | | | | | | | | |
| | | | |
CAPITAL SHARE TRANSACTIONS | | | | | | | | | | | | | | | | |
Net increase in net assets derived from capital share transactions | | | 201,024,175 | | | | 99,363,718 | | | | | | | | 2,027,577 | |
| | | | | | | | | | | | | | | | |
| | | | |
NET ASSETS | | | | | | | | | | | | | | | | |
Total increase in net assets | | | 253,119,616 | | | | 82,972,529 | | | | | | | | 2,097,217 | |
Beginning of period | | | 157,522,033 | | | | 74,549,504 | | | | | | | | — | |
| | | | | | | | | | | | | | | | |
End of period | | $ | 410,641,649 | | | $ | 157,522,033 | | | | | | | $ | 2,097,217 | |
| | | | | | | | | | | | | | | | |
| (a) | Commencement of operations. |
| (b) | Distributions for annual periods determined in accordance with U.S. federal income tax regulations. |
See notes to financial statements.
| | |
| 34 | | 2019 BLACKROCK ANNUAL REPORTTO SHAREHOLDERS |
Financial Highlights
(For a share outstanding throughout each period)
| | | | | | | | | | | | | | | | | | | | |
| | | BlackRock LifePath Index Retirement Fund | |
| |
| | | Institutional | |
| |
| | | Year Ended December 31, | |
| | | 2019 | | | 2018 | | | 2017 | | | 2016 | | | 2015 | |
| | | | | | |
Net asset value, beginning of year | | $ | 11.55 | | | $ | 12.26 | | | $ | 11.33 | | | $ | 10.97 | | | $ | 11.33 | |
| | | | | | | | | | | | | | | | | | | | |
Net investment income(a) | | | 0.37 | | | | 0.30 | | | | 0.25 | | | | 0.23 | | | | 0.21 | |
Net realized and unrealized gain (loss) | | | 1.44 | | | | (0.73 | ) | | | 0.96 | | | | 0.41 | | | | (0.25 | ) |
| | | | | | | | | | | | | | | | | | | | |
Net increase (decrease) from investment operations | | | 1.81 | | | | (0.43 | ) | | | 1.21 | | | | 0.64 | | | | (0.04 | ) |
| | | | | | | | | | | | | | | | | | | | |
|
Distributions(b) | |
From net investment income | | | (0.30 | ) | | | (0.27 | ) | | | (0.25 | ) | | | (0.22 | ) | | | (0.21 | ) |
From net realized gain | | | (0.01 | ) | | | (0.01 | ) | | | (0.03 | ) | | | (0.06 | ) | | | (0.11 | ) |
| | | | | | | | | | | | | | | | | | | | |
Total distributions | | | (0.31 | ) | | | (0.28 | ) | | | (0.28 | ) | | | (0.28 | ) | | | (0.32 | ) |
| | | | | | | | | | | | | | | | | | | | |
| | | | | |
Net asset value, end of year | | $ | 13.05 | | | $ | 11.55 | | | $ | 12.26 | | | $ | 11.33 | | | $ | 10.97 | |
| | | | | | | | | | | | | | | | | | | | |
|
Total Return(c) | |
Based on net asset value | | | 15.84 | % | | | (3.55 | )% | | | 10.69 | % | | | 5.86 | % | | | (0.36 | )% |
| | | | | | | | | | | | | | | | | | | | |
|
Ratios to Average Net Assets(d)(e) | |
Total expenses | | | 0.17 | %(f) | | | 0.18 | %(g) | | | 0.17 | % | | | 0.19 | % | | | 0.21 | % |
| | | | | | | | | | | | | | | | | | | | |
Total expenses after fees waived and/or reimbursed | | | 0.12 | %(f) | | | 0.12 | %(g) | | | 0.13 | % | | | 0.13 | % | | | 0.14 | % |
| | | | | | | | | | | | | | | | | | | | |
Net investment income | | | 2.92 | % | | | 2.51 | % | | | 2.10 | % | | | 2.02 | % | | | 1.79 | % |
| | | | | | | | | | | | | | | | | | | | |
|
Supplemental Data | |
Net assets, end of year (000) | | $ | 532,913 | | | $ | 145,418 | | | $ | 72,929 | | | $ | 71,606 | | | $ | 68,492 | |
| | | | | | | | | | | | | | | | | | | | |
Portfolio turnover rate of the LifePath Index Master Portfolio(h) | | | 13 | % | | | 25 | % | | | 10 | % | | | 13 | % | | | 25 | % |
| | | | | | | | | | | | | | | | | | | | |
| (a) | Based on average shares outstanding. |
| (b) | Distributions for annual periods determined in accordance with U.S. federal income tax regulations. |
| (c) | Where applicable, assumes the reinvestment of distributions. |
| (d) | Includes the LifePath Index Fund’s share of its corresponding LifePath Index Master Portfolio’s allocated net expenses and/or net investment income. |
| (e) | Includes the LifePath Index Fund’s share of its corresponding LifePath Index Master Portfolio’s allocated fees waived and expenses and/or net investment income. Excludes expenses incurred indirectly as a result of the LifePath Index Master Portfolio’s investments in underlying funds as follows: |
| | | | | | | | | | | | | | | | | | | | |
| | | Year Ended December 31, | |
| | | 2019 | | | 2018 | | | 2017 | | | 2016 | | | 2015 | |
Allocated fees waived | | | 0.02 | % | | | 0.01 | % | | | 0.02 | % | | | 0.02 | % | | | 0.02 | % |
Investments in underlying funds | | | 0.03 | % | | | 0.03 | % | | | 0.03 | % | | | 0.03 | % | | | 0.03 | % |
| | | | | | | | | | | | | | | | | | | | |
| (f) | Includes reorganization cost. Without this cost, total expenses and total expenses after fees waived and/or reimbursed would have been 0.17% and 0.12%, respectively. |
| (g) | Includes reorganization, offering, and board realignment and consolidation costs. Without these costs, total expenses and total expenses after fees waived and/or reimbursed would have been 0.17% and 0.12%, respectively. |
| (h) | Includes the LifePath Index Master Portfolio’s purchases and sales of the underlying funds and Large Cap Index Master Portfolio, Master Small Cap Index Series, Total International ex U.S. Index Master Portfolio and U.S. Total Bond Index Master Portfolio. |
See notes to financial statements.
Financial Highlights (continued)
(For a share outstanding throughout each period)
| | | | | | | | | | | | | | | | | | | | |
| | | BlackRock LifePath Index Retirement Fund (continued) | |
| |
| | | Investor A | |
| |
| | | Year Ended December 31, | |
| | | 2019 | | | 2018 | | | 2017 | | | 2016 | | | 2015 | |
| | | | | | |
Net asset value, beginning of year | | $ | 11.54 | | | $ | 12.25 | | | $ | 11.32 | | | $ | 10.97 | | | $ | 11.33 | |
| | | | | | | | | | | | | | | | | | | | |
Net investment income(a) | | | 0.34 | | | | 0.27 | | | | 0.22 | | | | 0.20 | | | | 0.17 | |
Net realized and unrealized gain (loss) | | | 1.45 | | | | (0.73 | ) | | | 0.96 | | | | 0.40 | | | | (0.24 | ) |
| | | | | | | | | | | | | | | | | | | | |
Net increase (decrease) from investment operations | | | 1.79 | | | | (0.46 | ) | | | 1.18 | | | | 0.60 | | | | (0.07 | ) |
| | | | | | | | | | | | | | | | | | | | |
|
Distributions(b) | |
From net investment income | | | (0.28 | ) | | | (0.24 | ) | | | (0.22 | ) | | | (0.19 | ) | | | (0.18 | ) |
From net realized gain | | | (0.01 | ) | | | (0.01 | ) | | | (0.03 | ) | | | (0.06 | ) | | | (0.11 | ) |
| | | | | | | | | | | | | | | | | | | | |
Total distributions | | | (0.29 | ) | | | (0.25 | ) | | | (0.25 | ) | | | (0.25 | ) | | | (0.29 | ) |
| | | | | | | | | | | | | | | | | | | | |
| | | | | |
Net asset value, end of year | | $ | 13.04 | | | $ | 11.54 | | | $ | 12.25 | | | $ | 11.32 | | | $ | 10.97 | |
| | | | | | | | | | | | | | | | | | | | |
|
Total Return(c) | |
Based on net asset value | | | 15.60 | % | | | (3.80 | )% | | | 10.43 | % | | | 5.51 | % | | | (0.61 | )% |
| | | | | | | | | | | | | | | | | | | | |
|
Ratios to Average Net Assets(d)(e) | |
Total expenses | | | 0.47 | %(f) | | | 0.44 | %(g) | | | 0.42 | % | | | 0.44 | % | | | 0.46 | % |
| | | | | | | | | | | | | | | | | | | | |
Total expenses after fees waived and/or reimbursed | | | 0.37 | %(f) | | | 0.38 | %(g) | | | 0.38 | % | | | 0.38 | % | | | 0.39 | % |
| | | | | | | | | | | | | | | | | | | | |
Net investment income | | | 2.67 | % | | | 2.24 | % | | | 1.84 | % | | | 1.75 | % | | | 1.54 | % |
| | | | | | | | | | | | | | | | | | | | |
|
Supplemental Data | |
Net assets, end of year (000) | | $ | 306,254 | | | $ | 82,454 | | | $ | 89,720 | | | $ | 72,286 | | | $ | 61,886 | |
| | | | | | | | | | | | | | | | | | | | |
Portfolio turnover rate of the LifePath Index Master Portfolio(h) | | | 13 | % | | | 25 | % | | | 10 | % | | | 13 | % | | | 25 | % |
| | | | | | | | | | | | | | | | | | | | |
| (a) | Based on average shares outstanding. |
| (b) | Distributions for annual periods determined in accordance with U.S. federal income tax regulations. |
| (c) | Where applicable, assumes the reinvestment of distributions. |
| (d) | Includes the LifePath Index Fund’s share of its corresponding LifePath Index Master Portfolio’s allocated net expenses and/or net investment income. |
| (e) | Includes the LifePath Index Fund’s share of its corresponding LifePath Index Master Portfolio’s allocated fees waived and expenses and/or net investment income. Excludes expenses incurred indirectly as a result of the LifePath Index Master Portfolio’s investments in underlying funds as follows: |
| | | | | | | | | | | | | | | | | | | | |
| | | Year Ended December 31, | |
| | | 2019 | | | 2018 | | | 2017 | | | 2016 | | | 2015 | |
Allocated fees waived | | | 0.02 | % | | | 0.01 | % | | | 0.02 | % | | | 0.02 | % | | | 0.02 | % |
Investments in underlying funds | | | 0.03 | % | | | 0.03 | % | | | 0.03 | % | | | 0.03 | % | | | 0.03 | % |
| | | | | | | | | | | | | | | | | | | | |
| (f) | Includes reorganization cost. Without this cost, total expenses and total expenses after fees waived and/or reimbursed would have been 0.47% and 0.37%, respectively. |
| (g) | Includes reorganization, offering, and board realignment and consolidation costs. Without these costs, total expenses and total expenses after fees waived and/or reimbursed have been 0.43% and 0.38%, respectively. |
| (h) | Includes the LifePath Index Master Portfolio’s purchases and sales of the underlying funds and Large Cap Index Master Portfolio, Master Small Cap Index Series, Total International ex U.S. Index Master Portfolio and U.S. Total Bond Index Master Portfolio. |
See notes to financial statements.
| | |
| 36 | | 2019 BLACKROCK ANNUAL REPORTTO SHAREHOLDERS |
Financial Highlights (continued)
(For a share outstanding throughout each period)
| | | | | | | | | | | | | | | | | | | | |
| | | BlackRock LifePath Index Retirement Fund (continued) | |
| |
| | | Class K | |
| |
| | | Year Ended December 31, | |
| | | 2019 | | | 2018 | | | 2017 | | | 2016 | | | 2015 | |
| | | | | | |
Net asset value, beginning of year | | $ | 11.54 | | | $ | 12.25 | | | $ | 11.32 | | | $ | 10.97 | | | $ | 11.33 | |
| | | | | | | | | | | | | | | | | | | | |
Net investment income(a) | | | 0.38 | | | | 0.31 | | | | 0.26 | | | | 0.23 | | | | 0.20 | |
Net realized and unrealized gain (loss) | | | 1.44 | | | | (0.73 | ) | | | 0.95 | | | | 0.40 | | | | (0.23 | ) |
| | | | | | | | | | | | | | | | | | | | |
Net increase (decrease) from investment operations | | | 1.82 | | | | (0.42 | ) | | | 1.21 | | | | 0.63 | | | | (0.03 | ) |
| | | | | | | | | | | | | | | | | | | | |
|
Distributions(b) | |
From net investment income | | | (0.31 | ) | | | (0.28 | ) | | | (0.25 | ) | | | (0.22 | ) | | | (0.22 | ) |
From net realized gain | | | (0.01 | ) | | | (0.01 | ) | | | (0.03 | ) | | | (0.06 | ) | | | (0.11 | ) |
| | | | | | | | | | | | | | | | | | | | |
Total distributions | | | (0.32 | ) | | | (0.29 | ) | | | (0.28 | ) | | | (0.28 | ) | | | (0.33 | ) |
| | | | | | | | | | | | | | | | | | | | |
| | | | | |
Net asset value, end of year | | $ | 13.04 | | | $ | 11.54 | | | $ | 12.25 | | | $ | 11.32 | | | $ | 10.97 | |
| | | | | | | | | | | | | | | | | | | | |
|
Total Return(c) | |
Based on net asset value | | | 15.90 | % | | | (3.51 | )% | | | 10.75 | % | | | 5.82 | % | | | (0.31 | )% |
| | | | | | | | | | | | | | | | | | | | |
|
Ratios to Average Net Assets(d)(e) | |
Total expenses | | | 0.11 | %(f) | | | 0.13 | %(g) | | | 0.12 | % | | | 0.14 | % | | | 0.15 | % |
| | | | | | | | | | | | | | | | | | | | |
Total expenses after fees waived and/or reimbursed | | | 0.07 | %(f) | | | 0.08 | %(g) | | | 0.08 | % | | | 0.08 | % | | | 0.09 | % |
| | | | | | | | | | | | | | | | | | | | |
Net investment income | | | 2.96 | % | | | 2.54 | % | | | 2.13 | % | | | 2.05 | % | | | 1.84 | % |
| | | | | | | | | | | | | | | | | | | | |
|
Supplemental Data | |
Net assets, end of year (000) | | $ | 4,462,412 | | | $ | 1,160,344 | | | $ | 1,072,195 | | | $ | 666,364 | | | $ | 369,359 | |
| | | | | | | | | | | | | | | | | | | | |
Portfolio turnover rate of the LifePath Index Master Portfolio(h) | | | 13 | % | | | 25 | % | | | 10 | % | | | 13 | % | | | 25 | % |
| | | | | | | | | | | | | | | | | | | | |
| (a) | Based on average shares outstanding. |
| (b) | Distributions for annual periods determined in accordance with U.S. federal income tax regulations. |
| (c) | Where applicable, assumes the reinvestment of distributions. |
| (d) | Includes the LifePath Index Fund’s share of its corresponding LifePath Index Master Portfolio’s allocated net expenses and/or net investment income. |
| (e) | Includes the LifePath Index Fund’s share of its corresponding LifePath Index Master Portfolio’s allocated fees waived and expenses and/or net investment income. Excludes expenses incurred indirectly as a result of the LifePath Index Master Portfolio’s investments in underlying funds as follows: |
| | | | | | | | | | | | | | | | | | | | |
| | | Year Ended December 31, | |
| | | 2019 | | | 2018 | | | 2017 | | | 2016 | | | 2015 | |
Allocated fees waived | | | 0.02 | % | | | 0.01 | % | | | 0.02 | % | | | 0.02 | % | | | 0.02 | % |
Investments in underlying funds | | | 0.03 | % | | | 0.03 | % | | | 0.03 | % | | | 0.03 | % | | | 0.03 | % |
| | | | | | | | | | | | | | | | | | | | |
| (f) | Includes reorganization cost. Without this cost, total expenses and total expenses after fees waived and/or reimbursed would have been 0.11% and 0.07%, respectively. |
| (g) | Includes reorganization, offering, and board realignment and consolidation costs. Without these costs, total expenses and total expenses after fees waived and/or reimbursed would have been 0.12% and 0.08%, respectively. |
| (h) | Includes the LifePath Index Master Portfolio’s purchases and sales of the underlying funds and Large Cap Index Master Portfolio, Master Small Cap Index Series, Total International ex U.S. Index Master Portfolio and U.S. Total Bond Index Master Portfolio. |
See notes to financial statements.
Financial Highlights (continued)
(For a share outstanding throughout each period)
| | | | | | | | |
| | | BlackRock LifePath Index Retirement
Fund (continued) | |
| |
| | | Investor P | |
| | | Year Ended
December 31, 2019 | | | Period from
08/06/18 (a) to 12/31/18 | |
| | | |
Net asset value, beginning of period | | $ | 11.53 | | | $ | 12.23 | |
| | | | | | | | |
Net investment income(b) | | | 0.34 | | | | 0.12 | |
Net realized and unrealized gain (loss) | | | 1.43 | | | | (0.67 | ) |
| | | | | | | | |
Net increase (decrease) from investment operations | | | 1.77 | | | | (0.55 | ) |
| | | | | | | | |
| | |
| Distributions(c) | | | | | | |
From net investment income | | | (0.27 | ) | | | (0.14 | ) |
From net realized gain | | | (0.01 | ) | | | (0.01 | ) |
| | | | | | | | |
Total distributions | | | (0.28 | ) | | | (0.15 | ) |
| | | | | | | | |
| | |
Net asset value, end of period | | $ | 13.02 | | | $ | 11.53 | |
| | | | | | | | |
| | |
Total Return(d) | | | | | | | | |
Based on net asset value | | | 15.52 | % | | | (4.56 | )%(e) |
| | | | | | | | |
| | |
Ratios to Average Net Assets(f)(g) | | | | | | | | |
Total expenses | | | 0.42 | %(h) | | | 0.41 | %(i)(j)(k) |
| | | | | | | | |
Total expenses after fees waived and/or reimbursed | | | 0.37 | %(h) | | | 0.36 | %(i)(j)(k) |
| | | | | | | | |
Net investment income | | | 2.67 | % | | | 2.47 | %(i) |
| | | | | | | | |
| | |
Supplemental Data | | | | | | | | |
Net assets, end of period (000) | | $ | 2,547,420 | | | $ | 912,090 | |
| | | | | | | | |
Portfolio turnover rate of the LifePath Index Master Portfolio(l) | | | 13 | % | | | 25 | % |
| | | | | | | | |
| (a) | Commencement of operations. |
| (b) | Based on average shares outstanding. |
| (c) | Distributions for annual periods determined in accordance with U.S. federal income tax regulations. |
| (d) | Where applicable, excludes the effects of any sales charges and assumes the reinvestment of distributions. |
| (e) | Aggregate total return. |
| (f) | Includes the LifePath Index Fund’s share of its corresponding LifePath Index Master Portfolio’s allocated fees waived and expenses and/or net investment income. Excludes expenses incurred indirectly as a result of the LifePath Index Master Portfolio’s investments in underlying funds as follows: |
| | | | | | | | |
| | | Year Ended December 31, 2019, | | | Period from
08/06/18 (a) to 12/31/18 | |
Allocated fees waived | | | 0.02 | % | | | 0.01 | % |
Investments in underlying funds | | | 0.03 | % | | | 0.03 | % |
| | | | | | | | |
| (g) | Includes the LifePath Index Fund’s share of its corresponding LifePath Index Master Portfolio’s allocated net expenses and/or net investment income. |
| (h) | Includes reorganization cost. Without this cost, total expenses and total expenses after fees waived and/or reimbursed would have been 0.41% and 0.37%, respectively. |
| (j) | Reorganization, offering, and board realignment and consolidation costs were not annualized in the calculation of the expense ratios. If these expenses were annualized, the total expenses and total expenses after fees waived and/or reimbursed would have been 0.42% and 0.37%, respectively. |
| (k) | Includes reorganization, offering, and board realignment and consolidation costs. Without these costs, total expenses and total expenses after fees waived and/or reimbursed would have been 0.39% and 0.36%, respectively. |
| (l) | Includes the LifePath Index Master Portfolio’s purchases and sales of the underlying funds and Large Cap Index Master Portfolio, Master Small Cap Index Series, Total International ex U.S. Index Master Portfolio and U.S. Total Bond Index Master Portfolio. |
See notes to financial statements.
| | |
| 38 | | 2019 BLACKROCK ANNUAL REPORTTO SHAREHOLDERS |
Financial Highlights (continued)
(For a share outstanding throughout each period)
| | | | | | | | | | | | | | | | | | | | |
| | | BlackRock LifePath Index 2025 Fund | |
| |
| | | Institutional | |
| |
| | | Year Ended December 31, | |
| | | 2019 | | | 2018 | | | 2017 | | | 2016 | | | 2015 | |
| | | | | | |
Net asset value, beginning of year | | $ | 12.35 | | | $ | 13.31 | | | $ | 11.90 | | | $ | 11.39 | | | $ | 11.74 | |
| | | | | | | | | | | | | | | | | | | | |
Net investment income(a) | | | 0.37 | | | | 0.32 | | | | 0.29 | | | | 0.25 | | | | 0.24 | |
Net realized and unrealized gain (loss) | | | 1.94 | | | | (0.95 | ) | | | 1.41 | | | | 0.53 | | | | (0.29 | ) |
| | | | | | | | | | | | | | | | | | | | |
Net increase (decrease) from investment operations | | | 2.31 | | | | (0.63 | ) | | | 1.70 | | | | 0.78 | | | | (0.05 | ) |
| | | | | | | | | | | | | | | | | | | | |
|
Distributions(b) | |
From net investment income | | | (0.36 | ) | | | (0.30 | ) | | | (0.28 | ) | | | (0.24 | ) | | | (0.23 | ) |
From net realized gain | | | (0.06 | ) | | | (0.03 | ) | | | (0.01 | ) | | | (0.03 | ) | | | (0.07 | ) |
From return of capital | | | — | | | | — | | | | — | | | | (0.00 | )(c) | | | (0.00 | )(c) |
| | | | | | | | | | | | | | | | | | | | |
Total distributions | | | (0.42 | ) | | | (0.33 | ) | | | (0.29 | ) | | | (0.27 | ) | | | (0.30 | ) |
| | | | | | | | | | | | | | | | | | | | |
| | | | | |
Net asset value, end of year | | $ | 14.24 | | | $ | 12.35 | | | $ | 13.31 | | | $ | 11.90 | | | $ | 11.39 | |
| | | | | | | | | | | | | | | | | | | | |
|
Total Return(d) | |
Based on net asset value | | | 18.84 | % | | | (4.83 | )% | | | 14.38 | % | | | 6.82 | % | | | (0.42 | )% |
| | | | | | | | | | | | | | | | | | | | |
|
Ratios to Average Net Assets(e)(f) | |
Total expenses | | | 0.16 | % | | | 0.16 | % | | | 0.17 | % | | | 0.18 | % | | | 0.20 | % |
| | | | | | | | | | | | | | | | | | | | |
Total expenses after fees waived and/or reimbursed | | | 0.11 | % | | | 0.12 | % | | | 0.13 | % | | | 0.13 | % | | | 0.14 | % |
| | | | | | | | | | | | | | | | | | | | |
Net investment income | | | 2.69 | % | | | 2.41 | % | | | 2.26 | % | | | 2.16 | % | | | 2.00 | % |
| | | | | | | | | | | | | | | | | | | | |
|
Supplemental Data | |
Net assets, end of year (000) | | $ | 189,202 | | | $ | 104,908 | | | $ | 102,921 | | | $ | 76,593 | | | $ | 73,993 | |
| | | | | | | | | | | | | | | | | | | | |
Portfolio turnover rate of the LifePath Index Master Portfolio(g) | | | 11 | % | | | 11 | % | | | 8 | % | | | 16 | % | | | 12 | % |
| | | | | | | | | | | | | | | | | | | | |
| (a) | Based on average shares outstanding. |
| (b) | Distributions for annual periods determined in accordance with U.S. federal income tax regulations. |
| (c) | Amount is greater than $(0.005) per share. |
| (d) | Where applicable, assumes the reinvestment of distributions. |
| (e) | Includes the LifePath Index Fund’s share of its corresponding LifePath Index Master Portfolio’s allocated net expenses and/or net investment income. |
| (f) | Includes the LifePath Index Fund’s share of its corresponding LifePath Index Master Portfolio’s allocated fees waived and expenses and/or net investment income. Excludes expenses incurred indirectly as a result of the LifePath Index Master Portfolio’s investments in underlying funds as follows: |
| | | | | | | | | | | | | | | | | | | | |
| | | Year Ended December 31, | |
| | | 2019 | | | 2018 | | | 2017 | | | 2016 | | | 2015 | |
Allocated fees waived | | | 0.02 | % | | | 0.01 | % | | | 0.01 | % | | | 0.01 | % | | | 0.01 | % |
Investments in underlying funds | | | 0.04 | % | | | 0.04 | % | | | 0.04 | % | | | 0.06 | % | | | 0.05 | % |
| | | | | | | | | | | | | | | | | | | | |
| (g) | Includes the LifePath Index Master Portfolio’s purchases and sales of the underlying funds and Large Cap Index Master Portfolio, Master Small Cap Index Series, Total International ex U.S. Index Master Portfolio and U.S. Total Bond Index Master Portfolio. |
See notes to financial statements.
Financial Highlights (continued)
(For a share outstanding throughout each period)
| | | | | | | | | | | | | | | | | | | | |
| | | BlackRock LifePath Index 2025 Fund (continued) | |
| |
| | | Investor A | |
| |
| | | Year Ended December 31, | |
| | | 2019 | | | 2018 | | | 2017 | | | 2016 | | | 2015 | |
| | | | | | |
Net asset value, beginning of year | | $ | 12.33 | | | $ | 13.29 | | | $ | 11.89 | | | $ | 11.38 | | | $ | 11.73 | |
| | | | | | | | | | | | | | | | | | | | |
Net investment income(a) | | | 0.32 | | | | 0.28 | | | | 0.25 | | | | 0.22 | | | | 0.20 | |
Net realized and unrealized gain (loss) | | | 1.96 | | | | (0.94 | ) | | | 1.40 | | | | 0.53 | | | | (0.28 | ) |
| | | | | | | | | | | | | | | | | | | | |
Net increase (decrease) from investment operations | | | 2.28 | | | | (0.66 | ) | | | 1.65 | | | | 0.75 | | | | (0.08 | ) |
| | | | | | | | | | | | | | | | | | | | |
|
Distributions(b) | |
From net investment income | | | (0.33 | ) | | | (0.27 | ) | | | (0.24 | ) | | | (0.21 | ) | | | (0.20 | ) |
From net realized gain | | | (0.06 | ) | | | (0.03 | ) | | | (0.01 | ) | | | (0.03 | ) | | | (0.07 | ) |
From return of capital | | | — | | | | — | | | | — | | | | (0.00 | )(c) | | | (0.00 | )(c) |
| | | | | | | | | | | | | | | | | | | | |
Total distributions | | | (0.39 | ) | | | (0.30 | ) | | | (0.25 | ) | | | (0.24 | ) | | | (0.27 | ) |
| | | | | | | | | | | | | | | | | | | | |
| | | | | |
Net asset value, end of year | | $ | 14.22 | | | $ | 12.33 | | | $ | 13.29 | | | $ | 11.89 | | | $ | 11.38 | |
| | | | | | | | | | | | | | | | | | | | |
|
Total Return(d) | |
Based on net asset value | | | 18.59 | % | | | (5.08 | )% | | | 14.03 | % | | | 6.57 | % | | | (0.67 | )% |
| | | | | | | | | | | | | | | | | | | | |
|
Ratios to Average Net Assets(e)(f) | |
Total expenses | | | 0.42 | % | | | 0.41 | % | | | 0.41 | % | | | 0.43 | % | | | 0.45 | % |
| | | | | | | | | | | | | | | | | | | | |
Total expenses after fees waived and/or reimbursed | | | 0.36 | % | | | 0.37 | % | | | 0.38 | % | | | 0.38 | % | | | 0.39 | % |
| | | | | | | | | | | | | | | | | | | | |
Net investment income | | | 2.37 | % | | | 2.10 | % | | | 1.98 | % | | | 1.90 | % | | | 1.75 | % |
| | | | | | | | | | | | | | | | | | | | |
|
Supplemental Data | |
Net assets, end of year (000) | | $ | 157,606 | | | $ | 119,566 | | | $ | 157,207 | | | $ | 133,514 | | | $ | 104,993 | |
| | | | | | | | | | | | | | | | | | | | |
Portfolio turnover rate of the LifePath Index Master Portfolio(g) | | | 11 | % | | | 11 | % | | | 8 | % | | | 16 | % | | | 12 | % |
| | | | | | | | | | | | | | | | | | | | |
| (a) | Based on average shares outstanding. |
| (b) | Distributions for annual periods determined in accordance with U.S. federal income tax regulations. |
| (c) | Amount is greater than $(0.005) per share. |
| (d) | Where applicable, assumes the reinvestment of distributions. |
| (e) | Includes the LifePath Index Fund’s share of its corresponding LifePath Index Master Portfolio’s allocated net expenses and/or net investment income. |
| (f) | Includes the LifePath Index Fund’s share of its corresponding LifePath Index Master Portfolio’s allocated fees waived and expenses and/or net investment income. Excludes expenses incurred indirectly as a result of the LifePath Index Master Portfolio’s investments in underlying funds as follows: |
| | | | | | | | | | | | | | | | | | | | |
| | | Year Ended December 31, | |
| | | 2019 | | | 2018 | | | 2017 | | | 2016 | | | 2015 | |
Allocated fees waived | | | 0.02 | % | | | 0.01 | % | | | 0.01 | % | | | 0.01 | % | | | 0.01 | % |
Investments in underlying funds | | | 0.04 | % | | | 0.04 | % | | | 0.04 | % | | | 0.06 | % | | | 0.05 | % |
| | | | | | | | | | | | | | | | | | | | |
| (g) | Includes the LifePath Index Master Portfolio’s purchases and sales of the underlying funds and Large Cap Index Master Portfolio, Master Small Cap Index Series, Total International ex U.S. Index Master Portfolio and U.S. Total Bond Index Master Portfolio. |
See notes to financial statements.
| | |
| 40 | | 2019 BLACKROCK ANNUAL REPORTTO SHAREHOLDERS |
Financial Highlights (continued)
(For a share outstanding throughout each period)
| | | | | | | | | | | | | | | | | | | | |
| | | BlackRock LifePath Index 2025 Fund (continued) | |
| |
| | | Class K | |
| |
| | | Year Ended December 31, | |
| | | 2019 | | | 2018 | | | 2017 | | | 2016 | | | 2015 | |
| | | | | | |
Net asset value, beginning of year | | $ | 12.35 | | | $ | 13.31 | | | $ | 11.90 | | | $ | 11.39 | | | $ | 11.75 | |
| | | | | | | | | | | | | | | | | | | | |
Net investment income(a) | | | 0.36 | | | | 0.33 | | | | 0.30 | | | | 0.26 | | | | 0.24 | |
Net realized and unrealized gain (loss) | | | 1.97 | | | | (0.95 | ) | | | 1.40 | | | | 0.52 | | | | (0.29 | ) |
| | | | | | | | | | | | | | | | | | | | |
Net increase (decrease) from investment operations | | | 2.33 | | | | (0.62 | ) | | | 1.70 | | | | 0.78 | | | | (0.05 | ) |
| | | | | | | | | | | | | | | | | | | | |
|
Distributions(b) | |
From net investment income | | | (0.37 | ) | | | (0.31 | ) | | | (0.28 | ) | | | (0.24 | ) | | | (0.24 | ) |
From net realized gain | | | (0.06 | ) | | | (0.03 | ) | | | (0.01 | ) | | | (0.03 | ) | | | (0.07 | ) |
From return of capital | | | — | | | | — | | | | — | | | | (0.00 | )(c) | | | (0.00 | )(c) |
| | | | | | | | | | | | | | | | | | | | |
Total distributions | | | (0.43 | ) | | | (0.34 | ) | | | (0.29 | ) | | | (0.27 | ) | | | (0.31 | ) |
| | | | | | | | | | | | | | | | | | | | |
| | | | | |
Net asset value, end of year | | $ | 14.25 | | | $ | 12.35 | | | $ | 13.31 | | | $ | 11.90 | | | $ | 11.39 | |
| | | | | | | | | | | | | | | | | | | | |
|
Total Return(d) | |
Based on net asset value | | | 18.98 | % | | | (4.78 | )% | | | 14.43 | % | | | 6.87 | % | | | (0.45 | )% |
| | | | | | | | | | | | | | | | | | | | |
|
Ratios to Average Net Assets(e)(f) | |
Total expenses | | | 0.10 | % | | | 0.11 | % | | | 0.11 | % | | | 0.13 | % | | | 0.14 | % |
| | | | | | | | | | | | | | | | | | | | |
Total expenses after fees waived and/or reimbursed | | | 0.06 | % | | | 0.07 | % | | | 0.07 | % | | | 0.08 | % | | | 0.09 | % |
| | | | | | | | | | | | | | | | | | | | |
Net investment income | | | 2.68 | % | | | 2.47 | % | | | 2.34 | % | | | 2.19 | % | | | 2.06 | % |
| | | | | | | | | | | | | | | | | | | | |
|
Supplemental Data | |
Net assets, end of year (000) | | $ | 4,134,270 | | | $ | 2,777,710 | | | $ | 2,240,495 | | | $ | 1,225,637 | | | $ | 597,527 | |
| | | | | | | | | | | | | | | | | | | | |
Portfolio turnover rate of the LifePath Index Master Portfolio(g) | | | 11 | % | | | 11 | % | | | 8 | % | | | 16 | % | | | 12 | % |
| | | | | | | | | | | | | | | | | | | | |
| (a) | Based on average shares outstanding. |
| (b) | Distributions for annual periods determined in accordance with U.S. federal income tax regulations. |
| (c) | Amount is greater than $(0.005) per share. |
| (d) | Where applicable, assumes the reinvestment of distributions. |
| (e) | Includes the LifePath Index Fund’s share of its corresponding LifePath Index Master Portfolio’s allocated net expenses and/or net investment income. |
| (f) | Includes the LifePath Index Fund’s share of its corresponding LifePath Index Master Portfolio’s allocated fees waived and expenses and/or net investment income. Excludes expenses incurred indirectly as a result of the LifePath Index Master Portfolio’s investments in underlying funds as follows: |
| | | | | | | | | | | | | | | | | | | | |
| | | Year Ended December 31, | |
| | | 2019 | | | 2018 | | | 2017 | | | 2016 | | | 2015 | |
Allocated fees waived | | | 0.02 | % | | | 0.01 | % | | | 0.01 | % | | | 0.01 | % | | | 0.01 | % |
Investments in underlying funds | | | 0.04 | % | | | 0.04 | % | | | 0.04 | % | | | 0.06 | % | | | 0.05 | % |
| | | | | | | | | | | | | | | | | | | | |
| (g) | Includes the LifePath Index Master Portfolio’s purchases and sales of the underlying funds and Large Cap Index Master Portfolio, Master Small Cap Index Series, Total International ex U.S. Index Master Portfolio and U.S. Total Bond Index Master Portfolio. |
See notes to financial statements.
Financial Highlights (continued)
(For a share outstanding throughout each period)
| | | | | | | | |
| | | BlackRock LifePath Index
2025 Fund (continued) | |
| |
| | | Investor P | |
| | | Year Ended
December 31, 2019 | | | Period from
08/06/18 (a) to 12/31/18 | |
| | | |
Net asset value, beginning of period | | $ | 12.32 | | | $ | 13.38 | |
| | | | | | | | |
Net investment income(b) | | | 0.35 | | | | 0.17 | |
Net realized and unrealized gain (loss) | | | 1.93 | | | | (1.04 | ) |
| | | | | | | | |
Net increase (decrease) from investment operations | | | 2.28 | | | | (0.87 | ) |
| | | | | | | | |
| | |
| Distributions(c) | | | | | | |
From net investment income | | | (0.34 | ) | | | (0.16 | ) |
From net realized gain | | | (0.06 | ) | | | (0.03 | ) |
| | | | | | | | |
Total distributions | | | (0.40 | ) | | | (0.19 | ) |
| | | | | | | | |
| | |
Net asset value, end of period | | $ | 14.20 | | | $ | 12.32 | |
| | | | | | | | |
| | |
Total Return(d) | | | | | | | | |
Based on net asset value | | | 18.60 | % | | | (6.57 | )%(e) |
| | | | | | | | |
| | |
Ratios to Average Net Assets(f)(g) | | | | | | | | |
Total expenses | | | 0.41 | % | | | 0.40 | %(h) |
| | | | | | | | |
Total expenses after fees waived and/or reimbursed | | | 0.36 | % | | | 0.35 | %(h) |
| | | | | | | | |
Net investment income | | | 2.59 | % | | | 3.53 | %(h) |
| | | | | | | | |
| | |
Supplemental Data | | | | | | | | |
Net assets, end of period (000) | | $ | 34,190 | | | $ | 1,810 | |
| | | | | | | | |
Portfolio turnover rate of the LifePath Index Master Portfolio(i) | | | 11 | % | | | 11 | % |
| | | | | | | | |
| (a) | Commencement of operations. |
| (b) | Based on average Common Shares outstanding. |
| (c) | Distributions for annual periods determined in accordance with U.S. federal income tax regulations. |
| (d) | Where applicable, excludes the effects of any sales charges and assumes the reinvestment of distributions. |
| (e) | Aggregate total return. |
| (f) | Includes the LifePath Index Fund’s share of its corresponding LifePath Index Master Portfolio’s allocated net expenses and/or net investment income. |
| (g) | Includes the LifePath Index Fund’s share of its corresponding LifePath Index Master Portfolio’s allocated fees waived and expenses and/or net investment income. Excludes expenses incurred indirectly as a result of the LifePath Index Master Portfolio’s investments in underlying funds as follows: |
| | | | | | | | |
| | | Year Ended
December 31, 2019 | | | Period from
08/06/18 (a) to 12/31/18 | |
Allocated fees waived | | | 0.02 | % | | | 0.01 | % |
Investments in underlying funds | | | 0.04 | % | | | 0.04 | % |
| | | | | | | | |
| (i) | Includes the LifePath Index Master Portfolio’s purchases and sales of the underlying funds and Large Cap Index Master Portfolio, Master Small Cap Index Series, Total International ex U.S. Index Master Portfolio and U.S. Total Bond Index Master Portfolio. |
See notes to financial statements.
| | |
| 42 | | 2019 BLACKROCK ANNUAL REPORTTO SHAREHOLDERS |
Financial Highlights (continued)
(For a share outstanding throughout each period)
| | | | | | | | | | | | | | | | | | | | |
| | | BlackRock LifePath Index 2030 Fund | |
| |
| | | Institutional | |
| |
| | | Year Ended December 31, | |
| | | 2019 | | | 2018 | | | 2017 | | | 2016 | | | 2015 | |
| | | | | | |
Net asset value, beginning of year | | $ | 12.57 | | | $ | 13.62 | | | $ | 11.99 | | | $ | 11.45 | | | $ | 11.86 | |
| | | | | | | | | | | | | | | | | | | | |
Net investment income(a) | | | 0.37 | | | | 0.38 | | | | 0.31 | | | | 0.26 | | | | 0.25 | |
Net realized and unrealized gain (loss) | | | 2.25 | | | | (1.13 | ) | | | 1.63 | | | | 0.56 | | | | (0.31 | ) |
| | | | | | | | | | | | | | | | | | | | |
Net increase (decrease) from investment operations | | | 2.62 | | | | (0.75 | ) | | | 1.94 | | | | 0.82 | | | | (0.06 | ) |
| | | | | | | | | | | | | | | | | | | | |
| | | | | |
Distributions(b) | | | | | | | | | | | | | | | | | | | | |
From net investment income | | | (0.38 | ) | | | (0.29 | ) | | | (0.29 | ) | | | (0.25 | ) | | | (0.25 | ) |
From net realized gain | | | (0.09 | ) | | | (0.01 | ) | | | (0.02 | ) | | | (0.03 | ) | | | (0.10 | ) |
From return of capital | | | — | | | | — | | | | — | | | | (0.00 | )(c) | | | — | |
| | | | | | | | | | | | | | | | | | | | |
Total distributions | | | (0.47 | ) | | | (0.30 | ) | | | (0.31 | ) | | | (0.28 | ) | | | (0.35 | ) |
| | | | | | | | | | | | | | | | | | | | |
| | | | | |
Net asset value, end of year | | $ | 14.72 | | | $ | 12.57 | | | $ | 13.62 | | | $ | 11.99 | | | $ | 11.45 | |
| | | | | | | | | | | | | | | | | | | | |
| | | | | |
Total Return(d) | | | | | | | | | | | | | | | | | | | | |
Based on net asset value | | | 21.00 | % | | | (5.60 | )% | | | 16.29 | % | | | 7.23 | % | | | (0.55 | )% |
| | | | | | | | | | | | | | | | | | | | |
| | | | | |
Ratios to Average Net Assets(e)(f) | | | | | | | | | | | | | | | | | | | | |
Total expenses | | | 0.17 | % | | | 0.16 | %(g) | | | 0.16 | % | | | 0.19 | % | | | 0.20 | % |
| | | | | | | | | | | | | | | | | | | | |
Total expenses after fees waived and/or reimbursed | | | 0.11 | % | | | 0.11 | %(g) | | | 0.12 | % | | | 0.13 | % | | | 0.14 | % |
| | | | | | | | | | | | | | | | | | | | |
Net investment income | | | 2.66 | % | | | 2.82 | % | | | 2.36 | % | | | 2.22 | % | | | 2.08 | % |
| | | | | | | | | | | | | | | | | | | | |
| | | | | |
Supplemental Data | | | | | | | | | | | | | | | | | | | | |
Net assets, end of year (000) | | $ | 561,902 | | | $ | 393,584 | | | $ | 137,120 | | | $ | 99,722 | | | $ | 88,246 | |
| | | | | | | | | | | | | | | | | | | | |
Portfolio turnover rate of the LifePath Index Master Portfolio(h) | | | 14 | % | | | 15 | % | | | 7 | % | | | 19 | % | | | 12 | % |
| | | | | | | | | | | | | | | | | | | | |
| (a) | Based on average shares outstanding. |
| (b) | Distributions for annual periods determined in accordance with U.S. federal income tax regulations. |
| (c) | Amount is greater than $(0.005) per share. |
| (d) | Where applicable, assumes the reinvestment of distributions. |
| (e) | Includes the LifePath Index Fund’s share of its corresponding LifePath Index Master Portfolio’s allocated net expenses and/or net investment income. |
| (f) | Includes the LifePath Index Fund’s share of its corresponding LifePath Index Master Portfolio’s allocated fees waived and expenses and/or net investment income. Excludes expenses incurred indirectly as a result of the LifePath Index Master Portfolio’s investments in underlying funds as follows: |
| | | | | | | | | | | | | | | | | | | | |
| |
| | | Year Ended December 31, | |
| | | 2019 | | | 2018 | | | 2017 | | | 2016 | | | 2015 | |
Allocated fees waived | | | 0.02 | % | | | 0.01 | % | | | 0.02 | % | | | 0.01 | % | | | 0.01 | % |
Investments in underlying funds | | | 0.04 | % | | | 0.04 | % | | | 0.05 | % | | | 0.07 | % | | | 0.06 | % |
| | | | | | | | | | | | | | | | | | | | |
| (g) | Includes reorganization, offering, and board realignment and consolidation costs. Without these costs, total expenses and total expenses after fees waived and/or reimbursed would have been 0.15% and 0.11%, respectively. |
| (h) | Includes the LifePath Index Master Portfolio’s purchases and sales of the underlying funds and Large Cap Index Master Portfolio, Master Small Cap Index Series, Total International ex U.S. Index Master Portfolio and U.S. Total Bond Index Master Portfolio. |
See notes to financial statements.
Financial Highlights (continued)
(For a share outstanding throughout each period)
| | | | | | | | | | | | | | | | | | | | |
| | | BlackRock LifePath Index 2030 Fund (continued) | |
| |
| | | Investor A | |
| |
| | | Year Ended December 31, | |
| | | 2019 | | | 2018 | | | 2017 | | | 2016 | | | 2015 | |
| | | | | | |
Net asset value, beginning of year | | $ | 12.56 | | | $ | 13.62 | | | $ | 11.99 | | | $ | 11.45 | | | $ | 11.85 | |
| | | | | | | | | | | | | | | | | | | | |
Net investment income(a) | | | 0.33 | | | | 0.30 | | | | 0.27 | | | | 0.22 | | | | 0.22 | |
Net realized and unrealized gain (loss) | | | 2.26 | | | | (1.09 | ) | | | 1.64 | | | | 0.57 | | | | (0.30 | ) |
| | | | | | | | | | | | | | | | | | | | |
Net increase (decrease) from investment operations | | | 2.59 | | | | (0.79 | ) | | | 1.91 | | | | 0.79 | | | | (0.08 | ) |
| | | | | | | | | | | | | | | | | | | | |
| | | | | |
Distributions(b) | | | | | | | | | | | | | | | | | | | | |
From net investment income | | | (0.34 | ) | | | (0.26 | ) | | | (0.26 | ) | | | (0.22 | ) | | | (0.22 | ) |
From net realized gain | | | (0.09 | ) | | | (0.01 | ) | | | (0.02 | ) | | | (0.03 | ) | | | (0.10 | ) |
From return of capital | | | — | | | | — | | | | — | | | | (0.00 | )(c) | | | — | |
| | | | | | | | | | | | | | | | | | | | |
Total distributions | | | (0.43 | ) | | | (0.27 | ) | | | (0.28 | ) | | | (0.25 | ) | | | (0.32 | ) |
| | | | | | | | | | | | | | | | | | | | |
| | | | | |
Net asset value, end of year | | $ | 14.72 | | | $ | 12.56 | | | $ | 13.62 | | | $ | 11.99 | | | $ | 11.45 | |
| | | | | | | | | | | | | | | | | | | | |
| | | | | |
Total Return(d) | | | | | | | | | | | | | | | | | | | | |
Based on net asset value | | | 20.81 | % | | | (5.92 | )% | | | 16.01 | % | | | 6.98 | % | | | (0.80 | )% |
| | | | | | | | | | | | | | | | | | | | |
| | | | | |
Ratios to Average Net Assets(e)(f) | | | | | | | | | | | | | | | | | | | | |
Total expenses | | | 0.47 | % | | | 0.41 | %(g) | | | 0.41 | % | | | 0.43 | % | | | 0.45 | % |
| | | | | | | | | | | | | | | | | | | | |
Total expenses after fees waived and/or reimbursed | | | 0.36 | % | | | 0.36 | %(g) | | | 0.37 | % | | | 0.38 | % | | | 0.39 | % |
| | | | | | | | | | | | | | | | | | | | |
Net investment income | | | 2.36 | % | | | 2.23 | % | | | 2.10 | % | | | 1.90 | % | | | 1.84 | % |
| | | | | | | | | | | | | | | | | | | | |
| | | | | |
Supplemental Data | | | | | | | | | | | | | | | | | | | | |
Net assets, end of year (000) | | $ | 343,033 | | | $ | 283,011 | | | $ | 284,679 | | | $ | 209,757 | | | $ | 117,745 | |
| | | | | | | | | | | | | | | | | | | | |
Portfolio turnover rate of the LifePath Index Master Portfolio(h) | | | 14 | % | | | 15 | % | | | 7 | % | | | 19 | % | | | 12 | % |
| | | | | | | | | | | | | | | | | | | | |
| (a) | Based on average shares outstanding. |
| (b) | Distributions for annual periods determined in accordance with U.S. federal income tax regulations. |
| (c) | Amount is greater than $(0.005) per share. |
| (d) | Where applicable, assumes the reinvestment of distributions. |
| (e) | Includes the LifePath Index Fund’s share of its corresponding LifePath Index Master Portfolio’s allocated net expenses and/or net investment income. |
| (f) | Includes the LifePath Index Fund’s share of its corresponding LifePath Index Master Portfolio’s allocated fees waived and expenses and/or net investment income. Excludes expenses incurred indirectly as a result of the LifePath Index Master Portfolio’s investments in underlying funds as follows: |
| | | | | | | | | | | | | | | | | | | | |
| | | Year Ended December 31, | |
| | | 2019 | | | 2018 | | | 2017 | | | 2016 | | | 2015 | |
Allocated fees waived | | | 0.02 | % | | | 0.01 | % | | | 0.02 | % | | | 0.01 | % | | | 0.01 | % |
Investments in underlying funds | | | 0.04 | % | | | 0.04 | % | | | 0.05 | % | | | 0.07 | % | | | 0.06 | % |
| | | | | | | | | | | | | | | | | | | | |
| (g) | Includes reorganization, offering, and board realignment and consolidation costs. Without these costs, total expenses and total expenses after fees waived and/or reimbursed would have been 0.40% and 0.36%, respectively. |
| (h) | Includes the LifePath Index Master Portfolio’s purchases and sales of the underlying funds and Large Cap Index Master Portfolio, Master Small Cap Index Series, Total International ex U.S. Index Master Portfolio and U.S. Total Bond Index Master Portfolio. |
See notes to financial statements.
| | |
| 44 | | 2019 BLACKROCK ANNUAL REPORTTO SHAREHOLDERS |
Financial Highlights (continued)
(For a share outstanding throughout each period)
| | | | | | | | | | | | | | | | | | | | |
| | | BlackRock LifePath Index 2030 Fund (continued) | |
| |
| | | Class K | |
| |
| | | Year Ended December 31, | |
| | | 2019 | | | 2018 | | | 2017 | | | 2016 | | | 2015 | |
| | | | | | |
Net asset value, beginning of year | | $ | 12.56 | | | $ | 13.61 | | | $ | 11.98 | | | $ | 11.44 | | | $ | 11.85 | |
| | | | | | | | | | | | | | | | | | | | |
Net investment income(a) | | | 0.38 | | | | 0.34 | | | | 0.31 | | | | 0.27 | | | | 0.26 | |
Net realized and unrealized gain (loss) | | | 2.25 | | | | (1.08 | ) | | | 1.64 | | | | 0.55 | | | | (0.32 | ) |
| | | | | | | | | | | | | | | | | | | | |
Net increase (decrease) from investment operations | | | 2.63 | | | | (0.74 | ) | | | 1.95 | | | | 0.82 | | | | (0.06 | ) |
| | | | | | | | | | | | | | | | | | | | |
| | | | | |
Distributions(b) | | | | | | | | | | | | | | | | | | | | |
From net investment income | | | (0.39 | ) | | | (0.30 | ) | | | (0.30 | ) | | | (0.25 | ) | | | (0.25 | ) |
From net realized gain | | | (0.09 | ) | | | (0.01 | ) | | | (0.02 | ) | | | (0.03 | ) | | | (0.10 | ) |
From return of capital | | | — | | | | — | | | | — | | | | (0.00 | )(c) | | | — | |
| | | | | | | | | | | | | | | | | | | | |
Total distributions | | | (0.48 | ) | | | (0.31 | ) | | | (0.32 | ) | | | (0.28 | ) | | | (0.35 | ) |
| | | | | | | | | | | | | | | | | | | | |
| | | | | |
Net asset value, end of year | | $ | 14.71 | | | $ | 12.56 | | | $ | 13.61 | | | $ | 11.98 | | | $ | 11.44 | |
| | | | | | | | | | | | | | | | | | | | |
| | | | | |
Total Return(d) | | | | | | | | | | | | | | | | | | | | |
Based on net asset value | | | 21.08 | % | | | (5.56 | )% | | | 16.36 | % | | | 7.29 | % | | | (0.50 | )% |
| | | | | | | | | | | | | | | | | | | | |
| | | | | |
Ratios to Average Net Assets(e)(f) | | | | | | | | | | | | | | | | | | | | |
Total expenses | | | 0.10 | % | | | 0.11 | %(g) | | | 0.10 | % | | | 0.13 | % | | | 0.14 | % |
| | | | | | | | | | | | | | | | | | | | |
Total expenses after fees waived and/or reimbursed | | | 0.06 | % | | | 0.06 | %(g) | | | 0.07 | % | | | 0.08 | % | | | 0.09 | % |
| | | | | | | | | | | | | | | | | | | | |
Net investment income | | | 2.70 | % | | | 2.55 | % | | | 2.40 | % | | | 2.27 | % | | | 2.15 | % |
| | | | | | | | | | | | | | | | | | | | |
| | | | | |
Supplemental Data | | | | | | | | | | | | | | | | | | | | |
Net assets, end of year (000) | | $ | 4,892,278 | | | $ | 3,250,556 | | | $ | 2,709,075 | | | $ | 1,601,355 | | | $ | 870,661 | |
| | | | | | | | | | | | | | | | | | | | |
Portfolio turnover rate of the LifePath Index Master Portfolio(h) | | | 14 | % | | | 15 | % | | | 7 | % | | | 19 | % | | | 12 | % |
| | | | | | | | | | | | | | | | | | | | |
| (a) | Based on average shares outstanding. |
| (b) | Distributions for annual periods determined in accordance with U.S. federal income tax regulations. |
| (c) | Amount is greater than $(0.005) per share. |
| (d) | Where applicable, assumes the reinvestment of distributions. |
| (e) | Includes the LifePath Index Fund’s share of its corresponding LifePath Index Master Portfolio’s allocated net expenses and/or net investment income. |
| (f) | Includes the LifePath Index Fund’s share of its corresponding LifePath Index Master Portfolio’s allocated fees waived and expenses and/or net investment income. Excludes expenses incurred indirectly as a result of the LifePath Index Master Portfolio’s investments in underlying funds as follows: |
| | | | | | | | | | | | | | | | | | | | |
| | | Year Ended December 31, | |
| | | 2019 | | | 2018 | | | 2017 | | | 2016 | | | 2015 | |
Allocated fees waived | | | 0.02 | % | | | 0.01 | % | | | 0.02 | % | | | 0.01 | % | | | 0.01 | % |
Investments in underlying funds | | �� | 0.04 | % | | | 0.04 | % | | | 0.05 | % | | | 0.07 | % | | | 0.06 | % |
| | | | | | | | | | | | | | | | | | | | |
| (g) | Includes reorganization, offering, and board realignment and consolidation costs. Without these costs, total expenses and total expenses after fees waived and/or reimbursed would have been 0.10% and 0.06%, respectively. |
| (h) | Includes the LifePath Index Master Portfolio’s purchases and sales of the underlying funds and Large Cap Index Master Portfolio, Master Small Cap Index Series, Total International ex U.S. Index Master Portfolio and U.S. Total Bond Index Master Portfolio. |
See notes to financial statements.
Financial Highlights (continued)
(For a share outstanding throughout each period)
| | | | | | | | |
| | | BlackRock LifePath Index
2030 Fund (continued) | |
| |
| | | Investor P | |
| | | Year Ended
December 31, 2019 | | | Period from 08/06/18 (a) to 12/31/18 | |
| |
| | | |
Net asset value, beginning of period | | $ | 12.56 | | | $ | 13.77 | |
| | | | | | | | |
Net investment income(b) | | | 0.33 | | | | 0.21 | |
Net realized and unrealized gain (loss) | | | 2.25 | | | | (1.27 | ) |
| | | | | | | | |
Net increase (decrease) from investment operations | | | 2.58 | | | | (1.06 | ) |
| | | | | | | | |
|
Distributions(c) | |
From net investment income | | | (0.34 | ) | | | (0.15 | ) |
From net realized gain | | | (0.09 | ) | | | (0.00 | )(d) |
| | | | | | | | |
Total distributions | | | (0.43 | ) | | | (0.15 | ) |
| | | | | | | | |
Net asset value, end of period | | $ | 14.71 | | | $ | 12.56 | |
| | | | | | | | |
|
Total Return(e) | |
Based on net asset value | | | 20.72 | % | | | (7.73 | )%(f) |
| | | | | | | | |
|
Ratios to Average Net Assets(g)(h) | |
Total expenses | | | 0.41 | % | | | 0.39 | %(i) |
| | | | | | | | |
Total expenses after fees waived and/or reimbursed | | | 0.36 | % | | | 0.35 | %(i) |
| | | | | | | | |
Net investment income | | | 2.35 | % | | | 3.95 | %(i) |
| | | | | | | | |
|
Supplemental Data | |
Net assets, end of period (000) | | $ | 2,003,430 | | | $ | 1,802,660 | |
| | | | | | | | |
Portfolio turnover rate of the LifePath Index Master Portfolio(j) | | | 14 | % | | | 15 | % |
| | | | | | | | |
| (a) | Commencement of operations. |
| (b) | Based on average shares outstanding. |
| (c) | Distributions for annual periods determined in accordance with U.S. federal income tax regulations. |
| (d) | Amount is greater than $(0.005) per share. |
| (e) | Where applicable, excludes the effects of any sales charges and assumes the reinvestment of distributions. |
| (f) | Aggregate total return. |
| (g) | Includes the LifePath Index Fund’s share of its corresponding LifePath Index Master Portfolio’s allocated net expenses and/or net investment income. |
| (h) | Includes the LifePath Index Fund’s share of its corresponding LifePath Index Master Portfolio’s allocated fees waived and expenses and/or net investment income. Excludes expenses incurred indirectly as a result of the LifePath Index Master Portfolio’s investments in underlying funds as follows: |
| | | | | | | | |
| | | Year Ended
December 31, 2019, | | | Period from
08/06/18 (a) to 12/31/18 | |
Allocated fees waived | | | 0.02 | % | | | 0.01 | % |
Investments in underlying funds | | | 0.04 | % | | | 0.04 | % |
| | | | | | | | |
| (j) | Includes the LifePath Index Master Portfolio’s purchases and sales of the underlying funds and Large Cap Index Master Portfolio, Master Small Cap Index Series, Total International ex U.S. Index Master Portfolio and U.S. Total Bond Index Master Portfolio. |
See notes to financial statements.
| | |
| 46 | | 2019 BLACKROCK ANNUAL REPORTTO SHAREHOLDERS |
Financial Highlights (continued)
(For a share outstanding throughout each period)
| | | | | | | | | | | | | | | | | | | | |
| | | BlackRock LifePath Index 2035 Fund | |
| |
| | | Institutional | |
| |
| | | Year Ended December 31, | |
| | | 2019 | | | 2018 | | | 2017 | | | 2016 | | | 2015 | |
| | | | | | |
Net asset value, beginning of year | | $ | 12.88 | | | $ | 14.08 | | | $ | 12.19 | | | $ | 11.58 | | | $ | 11.98 | |
| | | | | | | | | | | | | | | | | | | | |
Net investment income(a) | | | 0.40 | | | | 0.34 | | | | 0.33 | | | | 0.27 | | | | 0.26 | |
Net realized and unrealized gain (loss) | | | 2.55 | | | | (1.23 | ) | | | 1.88 | | | | 0.61 | | | | (0.32 | ) |
| | | | | | | | | | | | | | | | | | | | |
Net increase (decrease) from investment operations | | | 2.95 | | | | (0.89 | ) | | | 2.21 | | | | 0.88 | | | | (0.06 | ) |
| | | | | | | | | | | | | | | | | | | | |
| | | | | |
Distributions(b) | | | | | | | | | | | | | | | | | | | | |
From net investment income | | | (0.39 | ) | | | (0.31 | ) | | | (0.31 | ) | | | (0.25 | ) | | | (0.26 | ) |
From net realized gain | | | (0.11 | ) | | | (0.00 | )(c) | | | (0.01 | ) | | | (0.02 | ) | | | (0.08 | ) |
From return of capital | | | — | | | | — | | | | — | | | | (0.00 | )(c) | | | — | |
| | | | | | | | | | | | | | | | | | | | |
Total distributions | | | (0.50 | ) | | | (0.31 | ) | | | (0.32 | ) | | | (0.27 | ) | | | (0.34 | ) |
| | | | | | | | | | | | | | | | | | | | |
| | | | | |
Net asset value, end of year | | $ | 15.33 | | | $ | 12.88 | | | $ | 14.08 | | | $ | 12.19 | | | $ | 11.58 | |
| | | | | | | | | | | | | | | | | | | | |
| | | | | |
Total Return(d) | | | | | | | | | | | | | | | | | | | | |
Based on net asset value | | | 23.08 | % | | | (6.40 | )% | | | 18.22 | % | | | 7.69 | % | | | (0.53 | )% |
| | | | | | | | | | | | | | | | | | | | |
| | | | | |
Ratios to Average Net Assets(e)(f) | | | | | | | | | | | | | | | | | | | | |
Total expenses | | | 0.15 | % | | | 0.16 | % | | | 0.16 | % | | | 0.18 | % | | | 0.20 | % |
| | | | | | | | | | | | | | | | | | | | |
Total expenses after fees waived and/or reimbursed | | | 0.10 | % | | | 0.11 | % | | | 0.11 | % | | | 0.12 | % | | | 0.13 | % |
| | | | | | | | | | | | | | | | | | | | |
Net investment income | | | 2.73 | % | | | 2.41 | % | | | 2.47 | % | | | 2.30 | % | | | 2.19 | % |
| | | | | | | | | | | | | | | | | | | | |
| | | | | |
Supplemental Data | | | | | | | | | | | | | | | | | | | | |
Net assets, end of year (000) | | $ | 148,827 | | | $ | 94,316 | | | $ | 97,302 | | | $ | 61,939 | | | $ | 57,253 | |
| | | | | | | | | | | | | | | | | | | | |
Portfolio turnover rate of the LifePath Index Master Portfolio(g) | | | 13 | % | | | 10 | % | | | 6 | % | | | 22 | % | | | 10 | % |
| | | | | | | | | | | | | | | | | | | | |
| (a) | Based on average shares outstanding. |
| (b) | Distributions for annual periods determined in accordance with U.S. federal income tax regulations. |
| (c) | Amount is greater than $(0.005) per share. |
| (d) | Where applicable, assumes the reinvestment of distributions. |
| (e) | Includes the LifePath Index Fund’s share of its corresponding LifePath Index Master Portfolio’s allocated net expenses and/or net investment income. |
| (f) | Includes the LifePath Index Fund’s share of its corresponding LifePath Index Master Portfolio’s allocated fees waived and expenses and/or net investment income. Excludes expenses incurred indirectly as a result of the LifePath Index Master Portfolio’s investments in underlying funds as follows: |
| | | | | | | | | | | | | | | | | | | | |
| | | Year Ended December 31, | |
| | | 2019 | | | 2018 | | | 2017 | | | 2016 | | | 2015 | |
Allocated fees waived | | | 0.02 | % | | | 0.02 | % | | | 0.02 | % | | | 0.02 | % | | | 0.02 | % |
Investments in underlying funds | | | 0.05 | % | | | 0.05 | % | | | 0.05 | % | | | 0.08 | % | | | 0.07 | % |
| | | | | | | | | | | | | | | | | | | | |
| (g) | Includes the LifePath Index Master Portfolio’s purchases and sales of the underlying funds and Large Cap Index Master Portfolio, Master Small Cap Index Series, Total International ex U.S. Index Master Portfolio and U.S. Total Bond Index Master Portfolio. |
See notes to financial statements.
Financial Highlights (continued)
(For a share outstanding throughout each period)
| | | | | | | | | | | | | | | | | | | | |
| | | BlackRock LifePath Index 2035 Fund (continued) | |
| |
| | | Investor A | |
| |
| | | Year Ended December 31, | |
| | | 2019 | | | 2018 | | | 2017 | | | 2016 | | | 2015 | |
| | | | | | |
Net asset value, beginning of year | | $ | 12.85 | | | $ | 14.04 | | | $ | 12.16 | | | $ | 11.56 | | | $ | 11.96 | |
| | | | | | | | | | | | | | | | | | | | |
Net investment income(a) | | | 0.35 | | | | 0.29 | | | | 0.29 | | | | 0.24 | | | | 0.23 | |
Net realized and unrealized gain (loss) | | | 2.56 | | | | (1.21 | ) | | | 1.88 | | | | 0.60 | | | | (0.32 | ) |
| | | | | | | | | | | | | | | | | | | | |
Net increase (decrease) from investment operations | | | 2.91 | | | | (0.92 | ) | | | 2.17 | | | | 0.84 | | | | (0.09 | ) |
| | | | | | | | | | | | | | | | | | | | |
| | | | | |
Distributions(b) | | | | | | | | | | | | | | | | | | | | |
From net investment income | | | (0.36 | )�� | | | (0.27 | ) | | | (0.28 | ) | | | (0.22 | ) | | | (0.23 | ) |
From net realized gain | | | (0.11 | ) | | | (0.00 | )(c) | | | (0.01 | ) | | | (0.02 | ) | | | (0.08 | ) |
From return of capital | | | — | | | | — | | | | — | | | | (0.00 | )(c) | | | — | |
| | | | | | | | | | | | | | | | | | | | |
Total distributions | | | (0.47 | ) | | | (0.27 | ) | | | (0.29 | ) | | | (0.24 | ) | | | (0.31 | ) |
| | | | | | | | | | | | | | | | | | | | |
| | | | | |
Net asset value, end of year | | $ | 15.29 | | | $ | 12.85 | | | $ | 14.04 | | | $ | 12.16 | | | $ | 11.56 | |
| | | | | | | | | | | | | | | | | | | | |
| | | | | |
Total Return(d) | | | | | | | | | | | | | | | | | | | | |
Based on net asset value | | | 22.77 | % | | | (6.59 | )% | | | 17.89 | % | | | 7.36 | % | | | (0.78 | )% |
| | | | | | | | | | | | | | | | | | | | |
| | | | | |
Ratios to Average Net Assets(e)(f) | | | | | | | | | | | | | | | | | | | | |
Total expenses | | | 0.41 | % | | | 0.41 | % | | | 0.41 | % | | | 0.42 | % | | | 0.45 | % |
| | | | | | | | | | | | | | | | | | | | |
Total expenses after fees waived and/or reimbursed | | | 0.35 | % | | | 0.36 | % | | | 0.36 | % | | | 0.37 | % | | | 0.38 | % |
| | | | | | | | | | | | | | | | | | | | |
Net investment income | | | 2.45 | % | | | 2.08 | % | | | 2.17 | % | | | 2.05 | % | | | 1.95 | % |
| | | | | | | | | | | | | | | | | | | | |
| | | | | |
Supplemental Data | | | | | | | | | | | | | | | | | | | | |
Net assets, end of year (000) | | $ | 158,773 | | | $ | 103,712 | | | $ | 158,712 | | | $ | 124,021 | | | $ | 94,830 | |
| | | | | | | | | | | | | | | | | | | | |
Portfolio turnover rate of the LifePath Index Master Portfolio(g) | | | 13 | % | | | 10 | % | | | 6 | % | | | 22 | % | | | 10 | % |
| | | | | | | | | | | | | | | | | | | | |
| (a) | Based on average shares outstanding. |
| (b) | Distributions for annual periods determined in accordance with U.S. federal income tax regulations. |
| (c) | Amount is greater than $(0.005) per share. |
| (d) | Where applicable, assumes the reinvestment of distributions. |
| (e) | Includes the LifePath Index Fund’s share of its corresponding LifePath Index Master Portfolio’s allocated net expenses and/or net investment income. |
| (f) | Includes the LifePath Index Fund’s share of its corresponding LifePath Index Master Portfolio’s allocated fees waived and expenses and/or net investment income. Excludes expenses incurred indirectly as a result of the LifePath Index Master Portfolio’s investments in underlying funds as follows: |
| | | | | | | | | | | | | | | | | | | | |
| | | Year Ended December 31, | |
| | | 2019 | | | 2018 | | | 2017 | | | 2016 | | | 2015 | |
Allocated fees waived | | | 0.02 | % | | | 0.02 | % | | | 0.02 | % | | | 0.02 | % | | | 0.02 | % |
Investments in underlying funds | | | 0.05 | % | | | 0.05 | % | | | 0.05 | % | | | 0.08 | % | | | 0.07 | % |
| | | | | | | | | | | | | | | | | | | | |
| (g) | Includes the LifePath Index Master Portfolio’s purchases and sales of the underlying funds and Large Cap Index Master Portfolio, Master Small Cap Index Series, Total International ex U.S. Index Master Portfolio and U.S. Total Bond Index Master Portfolio. |
See notes to financial statements.
| | |
| 48 | | 2019 BLACKROCK ANNUAL REPORTTO SHAREHOLDERS |
Financial Highlights (continued)
(For a share outstanding throughout each period)
| | | | | | | | | | | | | | | | | | | | |
| | | BlackRock LifePath Index 2035 Fund (continued) | |
| |
| | | Class K | |
| |
| | | Year Ended December 31, | |
| | | 2019 | | | 2018 | | | 2017 | | | 2016 | | | 2015 | |
| | | | | | |
Net asset value, beginning of year | | $ | 12.87 | | | $ | 14.07 | | | $ | 12.18 | | | $ | 11.57 | | | $ | 11.98 | |
| | | | | | | | | | | | | | | | | | | | |
Net investment income(a) | | | 0.40 | | | | 0.35 | | | | 0.34 | | | | 0.28 | | | | 0.27 | |
Net realized and unrealized gain (loss) | | | 2.55 | | | | (1.23 | ) | | | 1.88 | | | | 0.61 | | | | (0.33 | ) |
| | | | | | | | | | | | | | | | | | | | |
Net increase (decrease) from investment operations | | | 2.95 | | | | (0.88 | ) | | | 2.22 | | | | 0.89 | | | | (0.06 | ) |
| | | | | | | | | | | | | | | | | | | | |
| | | | | |
Distributions(b) | | | | | | | | | | | | | | | | | | | | |
From net investment income | | | (0.40 | ) | | | (0.32 | ) | | | (0.32 | ) | | | (0.26 | ) | | | (0.27 | ) |
From net realized gain | | | (0.11 | ) | | | (0.00 | )(c) | | | (0.01 | ) | | | (0.02 | ) | | | (0.08 | ) |
From return of capital | | | — | | | | — | | | | — | | | | (0.00 | )(c) | | | — | |
| | | | | | | | | | | | | | | | | | | | |
Total distributions | | | (0.51 | ) | | | (0.32 | ) | | | (0.33 | ) | | | (0.28 | ) | | | (0.35 | ) |
| | | | | | | | | | | | | | | | | | | | |
| | | | | |
Net asset value, end of year | | $ | 15.31 | | | $ | 12.87 | | | $ | 14.07 | | | $ | 12.18 | | | $ | 11.57 | |
| | | | | | | | | | | | | | | | | | | | |
| | | | | |
Total Return(d) | | | | | | | | | | | | | | | | | | | | |
Based on net asset value | | | 23.08 | % | | | (6.36 | )% | | | 18.29 | % | | | 7.74 | % | | | (0.56 | )% |
| | | | | | | | | | | | | | | | | | | | |
| | | | | |
Ratios to Average Net Assets(e)(f) | | | | | | | | | | | | | | | | | | | | |
Total expenses | | | 0.09 | % | | | 0.10 | % | | | 0.10 | % | | | 0.12 | % | | | 0.14 | % |
| | | | | | | | | | | | | | | | | | | | |
Total expenses after fees waived and/or reimbursed | | | 0.05 | % | | | 0.06 | % | | | 0.06 | % | | | 0.07 | % | | | 0.08 | % |
| | | | | | | | | | | | | | | | | | | | |
Net investment income | | | 2.74 | % | | | 2.51 | % | | | 2.52 | % | | | 2.33 | % | | | 2.26 | % |
| | | | | | | | | | | | | | | | | | | | |
| | | | | |
Supplemental Data | | | | | | | | | | | | | | | | | | | | |
Net assets, end of year (000) | | $ | 3,758,092 | | | $ | 2,393,634 | | | $ | 1,860,697 | | | $ | 983,867 | | | $ | 457,472 | |
| | | | | | | | | | | | | | | | | | | | |
Portfolio turnover rate of the LifePath Index Master Portfolio(g) | | | 13 | % | | | 10 | % | | | 6 | % | | | 22 | % | | | 10 | % |
| | | | | | | | | | | | | | | | | | | | |
| (a) | Based on average shares outstanding. |
| (b) | Distributions for annual periods determined in accordance with U.S. federal income tax regulations. |
| (c) | Amount is greater than $(0.005) per share. |
| (d) | Where applicable, assumes the reinvestment of distributions. |
| (e) | Includes the LifePath Index Fund’s share of its corresponding LifePath Index Master Portfolio’s allocated net expenses and/or net investment income. |
| (f) | Includes the LifePath Index Fund’s share of its corresponding LifePath Index Master Portfolio’s allocated fees waived and expenses and/or net investment income. Excludes expenses incurred indirectly as a result of the LifePath Index Master Portfolio’s investments in underlying funds as follows: |
| | | | | | | | | | | | | | | | | | | | |
| | | Year Ended December 31, | |
| | | 2019 | | | 2018 | | | 2017 | | | 2016 | | | 2015 | |
Allocated fees waived | | | 0.02 | % | | | 0.02 | % | | | 0.02 | % | | | 0.02 | % | | | 0.02 | % |
Investments in underlying funds | | | 0.05 | % | | | 0.05 | % | | | 0.05 | % | | | 0.08 | % | | | 0.07 | % |
| | | | | | | | | | | | | | | | | | | | |
| (g) | Includes the LifePath Index Master Portfolio’s purchases and sales of the underlying funds and Large Cap Index Master Portfolio, Master Small Cap Index Series, Total International ex U.S. Index Master Portfolio and U.S. Total Bond Index Master Portfolio. |
See notes to financial statements.
Financial Highlights (continued)
(For a share outstanding throughout each period)
| | | | | | | | |
| | | BlackRock LifePath Index 2035 Fund (continued) | |
| |
| | | Investor P | |
| | | Year Ended
December 31, 2019 | | | Period from
08/06/18 (a) to 12/31/18 | |
| | | |
Net asset value, beginning of period | | $ | 12.84 | | | $ | 14.26 | |
| | | | | | | | |
Net investment income(b) | | | 0.42 | | | | 0.17 | |
Net realized and unrealized gain (loss) | | | 2.49 | | | | (1.43 | ) |
| | | | | | | | |
Net increase (decrease) from investment operations | | | 2.91 | | | | (1.26 | ) |
| | | | | | | | |
| | |
| Distributions(c) | | | | | | |
From net investment income | | | (0.37 | ) | | | (0.16 | ) |
From net realized gain | | | (0.11 | ) | | | (0.00 | )(d) |
| | | | | | | | |
Total distributions | | | (0.48 | ) | | | (0.16 | ) |
| | | | | | | | |
| | |
Net asset value, end of period | | $ | 15.27 | | | $ | 12.84 | |
| | | | | | | | |
| | |
Total Return(e) | | | | | | | | |
Based on net asset value | | | 22.79 | % | | | (8.87 | )%(f) |
| | | | | | | | |
| | |
Ratios to Average Net Assets(g)(h) | | | | | | | | |
Total expenses | | | 0.43 | % | | | 0.38 | %(i) |
| | | | | | | | |
Total expenses after fees waived and/or reimbursed | | | 0.35 | % | | | 0.34 | %(i) |
| | | | | | | | |
Net investment income | | | 2.85 | % | | | 3.22 | %(i) |
| | | | | | | | |
| | |
Supplemental Data | | | | | | | | |
Net assets, end of period (000) | | $ | 12,054 | | | $ | 561 | |
| | | | | | | | |
Portfolio turnover rate of the LifePath Index Master Portfolio(j) | | | 13 | % | | | 10 | % |
| | | | | | | | |
| (a) | Commencement of operations. |
| (b) | Based on average shares outstanding. |
| (c) | Distributions for annual periods determined in accordance with U.S. federal income tax regulations. |
| (d) | Amount is greater than $(0.005) per share. |
| (e) | Where applicable, excludes the effects of any sales charges and assumes the reinvestment of distributions. |
| (f) | Aggregate total return. |
| (g) | Includes the LifePath Index Fund’s share of its corresponding LifePath Index Master Portfolio’s allocated net expenses and/or net investment income. |
| (h) | Includes the LifePath Index Fund’s share of its corresponding LifePath Index Master Portfolio’s allocated fees waived and expenses and/or net investment income. Excludes expenses incurred indirectly as a result of the LifePath Index Master Portfolio’s investments in underlying funds as follows: |
| | | | | | | | |
| | | Year Ended
December 31, 2019 | | | Period from
08/06/18 (a) to 12/31/18 | |
Allocated fees waived | | | 0.02 | % | | | 0.02 | % |
Investments in underlying funds | | | 0.05 | % | | | 0.05 | % |
| | | | | | | | |
| (j) | Includes the LifePath Index Master Portfolio’s purchases and sales of the underlying funds and Large Cap Index Master Portfolio, Master Small Cap Index Series, Total International ex U.S. Index Master Portfolio and U.S. Total Bond Index Master Portfolio. |
See notes to financial statements.
| | |
| 50 | | 2019 BLACKROCK ANNUAL REPORTTO SHAREHOLDERS |
Financial Highlights (continued)
(For a share outstanding throughout each period)
| | | | | | | | | | | | | | | | | | | | |
| | | BlackRock LifePath Index 2040 Fund | |
| |
| | | Institutional | |
| |
| | | Year Ended December 31, | |
| | | 2019 | | | 2018 | | | 2017 | | | 2016 | | | 2015 | |
| | | | | | |
Net asset value, beginning of year | | $ | 13.07 | | | $ | 14.39 | | | $ | 12.29 | | | $ | 11.65 | | | $ | 12.11 | |
| | | | | | | | | | | | | | | | | | | | |
Net investment income(a) | | | 0.40 | | | | 0.47 | | | | 0.35 | | | | 0.28 | | | | 0.28 | |
Net realized and unrealized gain (loss) | | | 2.84 | | | | (1.48 | ) | | | 2.08 | | | | 0.65 | | | | (0.36 | ) |
| | | | | | | | | | | | | | | | | | | | |
Net increase (decrease) from investment operations | | | 3.24 | | | | (1.01 | ) | | | 2.43 | | | | 0.93 | | | | (0.08 | ) |
| | | | | | | | | | | | | | | | | | | | |
|
Distributions(b) | |
From net investment income | | | (0.42 | ) | | | (0.30 | ) | | | (0.33 | ) | | | (0.26 | ) | | | (0.27 | ) |
From net realized gain | | | (0.11 | ) | | | (0.01 | ) | | | (0.00 | )(c) | | | (0.03 | ) | | | (0.11 | ) |
From return of capital | | | — | | | | — | | | | — | | | | (0.00 | )(c) | | | — | |
| | | | | | | | | | | | | | | | | | | | |
Total distributions | | | (0.53 | ) | | | (0.31 | ) | | | (0.33 | ) | | | (0.29 | ) | | | (0.38 | ) |
| | | | | | | | | | | | | | | | | | | | |
| | | | | |
Net asset value, end of year | | $ | 15.78 | | | $ | 13.07 | | | $ | 14.39 | | | $ | 12.29 | | | $ | 11.65 | |
| | | | | | | | | | | | | | | | | | | | |
|
Total Return(d) | |
Based on net asset value | | | 24.95 | % | | | (7.12 | )% | | | 19.89 | % | | | 8.05 | % | | | (0.69 | )% |
| | | | | | | | | | | | | | | | | | | | |
|
Ratios to Average Net Assets(e)(f) | |
Total expenses | | | 0.17 | % | | | 0.15 | %(g) | | | 0.15 | % | | | 0.18 | % | | | 0.20 | % |
| | | | | | | | | | | | | | | | | | | | |
Total expenses after fees waived and/or reimbursed | | | 0.10 | % | | | 0.10 | %(g) | | | 0.11 | % | | | 0.12 | % | | | 0.13 | % |
| | | | | | | | | | | | | | | | | | | | |
Net investment income | | | 2.67 | % | | | 3.29 | % | | | 2.56 | % | | | 2.36 | % | | | 2.26 | % |
| | | | | | | | | | | | | | | | | | | | |
|
Supplemental Data | |
Net assets, end of year (000) | | $ | 577,303 | | | $ | 446,192 | | | $ | 107,509 | | | $ | 68,324 | | | $ | 66,512 | |
| | | | | | | | | | | | | | | | | | | | |
Portfolio turnover rate of the LifePath Index Master Portfolio(h) | | | 14 | % | | | 12 | % | | | 6 | % | | | 26 | % | | | 11 | % |
| | | | | | | | | | | | | | | | | | | | |
| (a) | Based on average shares outstanding. |
| (b) | Distributions for annual periods determined in accordance with U.S. federal income tax regulations. |
| (c) | Amount is greater than $(0.005) per share. |
| (d) | Where applicable, assumes the reinvestment of distributions. |
| (e) | Includes the LifePath Index Fund’s share of its corresponding LifePath Index Master Portfolio’s allocated net expenses and/or net investment income. |
| (f) | Includes the LifePath Index Fund’s share of its corresponding LifePath Index Master Portfolio’s allocated fees waived and expenses and/or net investment income. Excludes expenses incurred indirectly as a result of the LifePath Index Master Portfolio’s investments in underlying funds as follows: |
| | | | | | | | | | | | | | | | | | | | |
| | | Year Ended December 31, | |
| | | 2019 | | | 2018 | | | 2017 | | | 2016 | | | 2015 | |
Allocated fees waived | | | 0.03 | % | | | 0.03 | % | | | 0.03 | % | | | 0.02 | % | | | 0.02 | % |
Investments in underlying funds | | | 0.05 | % | | | 0.05 | % | | | 0.06 | % | | | 0.09 | % | | | 0.07 | % |
| | | | | | | | | | | | | | | | | | | | |
| (g) | Includes reorganization, offering, and board realignment and consolidation costs. Without these costs, total expenses and total expenses after fees waived and/or reimbursed would have been 0.14% and 0.10%, respectively. |
| (h) | Includes the LifePath Index Master Portfolio’s purchases and sales of the underlying funds and Large Cap Index Master Portfolio, Master Small Cap Index Series, Total International ex U.S. Index Master Portfolio and U.S. Total Bond Index Master Portfolio. |
See notes to financial statements.
Financial Highlights (continued)
(For a share outstanding throughout each period)
| | | | | | | | | | | | | | | | | | | | |
| | | BlackRock LifePath Index 2040 Fund (continued) | |
| |
| | | Investor A | |
| |
| | | Year Ended December 31, | |
| | | 2019 | | | 2018 | | | 2017 | | | 2016 | | | 2015 | |
| | | | | | |
Net asset value, beginning of year | | $ | 13.05 | | | $ | 14.36 | | | $ | 12.27 | | | $ | 11.64 | | | $ | 12.09 | |
| | | | | | | | | | | | | | | | | | | | |
Net investment income(a) | | | 0.36 | | | | 0.32 | | | | 0.31 | | | | 0.24 | | | | 0.25 | |
Net realized and unrealized gain (loss) | | | 2.83 | | | | (1.35 | ) | | | 2.07 | | | | 0.66 | | | | (0.35 | ) |
| | | | | | | | | | | | | | | | | | | | |
Net increase (decrease) from investment operations | | | 3.19 | | | | (1.03 | ) | | | 2.38 | | | | 0.90 | | | | (0.10 | ) |
| | | | | | | | | | | | | | | | | | | | |
|
Distributions(b) | |
From net investment income | | | (0.38 | ) | | | (0.27 | ) | | | (0.29 | ) | | | (0.24 | ) | | | (0.24 | ) |
From net realized gain | | | (0.11 | ) | | | (0.01 | ) | | | (0.00 | )(c) | | | (0.03 | ) | | | (0.11 | ) |
From return of capital | | | — | | | | — | | | | — | | | | (0.00 | )(c) | | | — | |
| | | | | | | | | | | | | | | | | | | | |
Total distributions | | | (0.49 | ) | | | (0.28 | ) | | | (0.29 | ) | | | (0.27 | ) | | | (0.35 | ) |
| | | | | | | | | | | | | | | | | | | | |
| | | | | |
Net asset value, end of year | | $ | 15.75 | | | $ | 13.05 | | | $ | 14.36 | | | $ | 12.27 | | | $ | 11.64 | |
| | | | | | | | | | | | | | | | | | | | |
|
Total Return(d) | |
Based on net asset value | | | 24.62 | % | | | (7.30 | )% | | | 19.56 | % | | | 7.72 | % | | | (0.94 | )% |
| | | | | | | | | | | | | | | | | | | | |
|
Ratios to Average Net Assets(e)(f) | |
Total expenses | | | 0.45 | % | | | 0.40 | %(g) | | | 0.40 | % | | | 0.43 | % | | | 0.45 | % |
| | | | | | | | | | | | | | | | | | | | |
Total expenses after fees waived and/or reimbursed | | | 0.35 | % | | | 0.35 | %(g) | | | 0.36 | % | | | 0.37 | % | | | 0.38 | % |
| | | | | | | | | | | | | | | | | | | | |
Net investment income | | | 2.45 | % | | | 2.21 | % | | | 2.29 | % | | | 2.02 | % | | | 2.02 | % |
| | | | | | | | | | | | | | | | | | | | |
|
Supplemental Data | |
Net assets, end of year (000) | | $ | 240,112 | | | $ | 174,340 | | | $ | 204,873 | | | $ | 134,897 | | | $ | 69,660 | |
| | | | | | | | | | | | | | | | | | | | |
Portfolio turnover rate of the LifePath Index Master Portfolio(h) | | | 14 | % | | | 12 | % | | | 6 | % | | | 26 | % | | | 11 | % |
| | | | | | | | | | | | | | | | | | | | |
| (a) | Based on average shares outstanding. |
| (b) | Distributions for annual periods determined in accordance with U.S. federal income tax regulations. |
| (c) | Amount is greater than $(0.005) per share. |
| (d) | Where applicable, assumes the reinvestment of distributions. |
| (e) | Includes the LifePath Index Fund’s share of its corresponding LifePath Index Master Portfolio’s allocated net expenses and/or net investment income. |
| (f) | Includes the LifePath Index Fund’s share of its corresponding LifePath Index Master Portfolio’s allocated fees waived and expenses and/or net investment income. Excludes expenses incurred indirectly as a result of the LifePath Index Master Portfolio’s investments in underlying funds as follows: |
| | | | | | | | | | | | | | | | | | | | |
| | | Year Ended December 31, | |
| | | 2019 | | | 2018 | | | 2017 | | | 2016 | | | 2015 | |
Allocated fees waived | | | 0.03 | % | | | 0.03 | % | | | 0.03 | % | | | 0.02 | % | | | 0.02 | % |
Investments in underlying funds | | | 0.05 | % | | | 0.05 | % | | | 0.06 | % | | | 0.09 | % | | | 0.07 | % |
| | | | | | | | | | | | | | | | | | | | |
| (g) | Includes reorganization, offering, and board realignment and consolidation costs. Without these costs, total expenses and total expenses after fees waived and/or reimbursed would have been 0.39% and 0.35%, respectively. |
| (h) | Includes the LifePath Index Master Portfolio’s purchases and sales of the underlying funds and Large Cap Index Master Portfolio, Master Small Cap Index Series, Total International ex U.S. Index Master Portfolio and U.S. Total Bond Index Master Portfolio. |
See notes to financial statements.
| | |
| 52 | | 2019 BLACKROCK ANNUAL REPORTTO SHAREHOLDERS |
Financial Highlights (continued)
(For a share outstanding throughout each period)
| | | | | | | | | | | | | | | | | | | | |
| | | BlackRock LifePath Index 2040 Fund (continued) | |
| |
| | | Class K | |
| |
| | | Year Ended December 31, | |
| | | 2019 | | | 2018 | | | 2017 | | | 2016 | | | 2015 | |
| | | | | |
Net asset value, beginning of year | | $ | 13.07 | | | $ | 14.39 | | | $ | 12.29 | | | $ | 11.65 | | | $ | 12.10 | |
| | | | | | | | | | | | | | | | | | | | |
Net investment income(a) | | | 0.41 | | | | 0.37 | | | | 0.35 | | | | 0.28 | | | | 0.28 | |
Net realized and unrealized gain (loss) | | | 2.84 | | | | (1.37 | ) | | | 2.08 | | | | 0.66 | | | | (0.34 | ) |
| | | | | | | | | | | | | | | | | | | | |
Net increase (decrease) from investment operations | | | 3.25 | | | | (1.00 | ) | | | 2.43 | | | | 0.94 | | | | (0.06 | ) |
| | | | | | | | | | | | | | | | | | | | |
| | | | | |
Distributions(b) | | | | | | | | | | | | | | | | | | | | |
From net investment income | | | (0.43 | ) | | | (0.31 | ) | | | (0.33 | ) | | | (0.27 | ) | | | (0.28 | ) |
From net realized gain | | | (0.11 | ) | | | (0.01 | ) | | | (0.00 | )(c) | | | (0.03 | ) | | | (0.11 | ) |
From return of capital | | | — | | | | — | | | | — | | | | (0.00 | )(c) | | | — | |
| | | | | | | | | | | | | | | | | | | | |
Total distributions | | | (0.54 | ) | | | (0.32 | ) | | | (0.33 | ) | | | (0.30 | ) | | | (0.39 | ) |
| | | | | | | | | | | | | | | | | | | | |
| | | | | |
Net asset value, end of year | | $ | 15.78 | | | $ | 13.07 | | | $ | 14.39 | | | $ | 12.29 | | | $ | 11.65 | |
| | | | | | | | | | | | | | | | | | | | |
| | | | | |
Total Return(d) | | | | | | | | | | | | | | | | | | | | |
Based on net asset value | | | 25.01 | % | | | (7.08 | )% | | | 19.95 | % | | | 8.10 | % | | | (0.56 | )% |
| | | | | | | | | | | | | | | | | | | | |
| | | | | |
Ratios to Average Net Assets(e)(f) | | | | | | | | | | | | | | | | | | | | |
Total expenses | | | 0.09 | % | | | 0.10 | %(g) | | | 0.10 | % | | | 0.12 | % | | | 0.14 | % |
| | | | | | | | | | | | | | | | | | | | |
Total expenses after fees waived and/or reimbursed | | | 0.05 | % | | | 0.05 | %(g) | | | 0.06 | % | | | 0.07 | % | | | 0.08 | % |
| | | | | | | | | | | | | | | | | | | | |
Net investment income | | | 2.77 | % | | | 2.57 | % | | | 2.60 | % | | | 2.39 | % | | | 2.33 | % |
| | | | | | | | | | | | | | | | | | | | |
| | | | | |
Supplemental Data | | | | | | | | | | | | | | | | | | | | |
Net assets, end of year (000) | | $ | 3,849,265 | | | $ | 2,478,916 | | | $ | 2,021,824 | | | $ | 1,151,477 | | | $ | 615,122 | |
| | | | | | | | | | | | | | | | | | | | |
Portfolio turnover rate of the LifePath Index Master Portfolio(h) | | | 14 | % | | | 12 | % | | | 6 | % | | | 26 | % | | | 11 | % |
| | | | | | | | | | | | | | | | | | | | |
| (a) | Based on average shares outstanding. |
| (b) | Distributions for annual periods determined in accordance with U.S. federal income tax regulations. |
| (c) | Amount is greater than $(0.005) per share. |
| (d) | Where applicable, assumes the reinvestment of distributions. |
| (e) | Includes the LifePath Index Fund’s share of its corresponding LifePath Index Master Portfolio’s allocated net expenses and/or net investment income. |
| (f) | Includes the LifePath Index Fund’s share of its corresponding LifePath Index Master Portfolio’s allocated fees waived and expenses and/or net investment income. Excludes expenses incurred indirectly as a result of the LifePath Index Master Portfolio’s investments in underlying funds as follows: |
| | | | | | | | | | | | | | | | | | | | |
| | | Year Ended December 31, | |
| | | 2019 | | | 2018 | | | 2017 | | | 2016 | | | 2015 | |
Allocated fees waived | | | 0.03 | % | | | 0.03 | % | | | 0.03 | % | | | 0.02 | % | | | 0.02 | % |
Investments in underlying funds | | | 0.05 | % | | | 0.05 | % | | | 0.06 | % | | | 0.09 | % | | | 0.07 | % |
| | | | | | | | | | | | | | | | | | | | |
| (g) | Includes reorganization, offering, and board realignment and consolidation costs. Without these costs, total expenses and total expenses after fees waived and/or reimbursed would have been 0.09% and 0.05%, respectively. |
| (h) | Includes the LifePath Index Master Portfolio’s purchases and sales of the underlying funds and Large Cap Index Master Portfolio, Master Small Cap Index Series, Total International ex U.S. Index Master Portfolio and U.S. Total Bond Index Master Portfolio. |
See notes to financial statements.
Financial Highlights (continued)
(For a share outstanding throughout each period)
| | | | | | | | |
| | | BlackRock LifePath Index
2040 Fund (continued) | |
| |
| | | Investor P | |
| | | Year Ended
December 31, 2019 | | | Period from 08/06/18 (a) to 12/31/18 | |
| | | |
Net asset value, beginning of period | | $ | 13.04 | | | $ | 14.64 | |
| | | | | | | | |
Net investment income(b) | | | 0.35 | | | | 0.28 | |
Net realized and unrealized gain (loss) | | | 2.84 | | | | (1.72 | ) |
| | | | | | | | |
Net increase (decrease) from investment operations | | | 3.19 | | | | (1.44 | ) |
| | | | | | | | |
|
| Distributions(c) | |
From net investment income | | | (0.38 | ) | | | (0.15 | ) |
From net realized gain | | | (0.11 | ) | | | (0.01 | ) |
| | | | | | | | |
Total distributions | | | (0.49 | ) | | | (0.16 | ) |
| | | | | | | | |
| | |
Net asset value, end of period | | $ | 15.74 | | | $ | 13.04 | |
| | | | | | | | |
| | |
Total Return(d) | | | | | | | | |
Based on net asset value | | | 24.63 | % | | | (9.89 | )%(e) |
| | | | | | | | |
| | |
Ratios to Average Net Assets(f)(g) | | | | | | | | |
Total expenses | | | 0.41 | % | | | 0.38 | %(h)(i) |
| | | | | | | | |
Total expenses after fees waived and/or reimbursed | | | 0.35 | % | | | 0.34 | %(h)(i) |
| | | | | | | | |
Net investment income | | | 2.39 | % | | | 4.99 | %(h) |
| | | | | | | | |
| | |
Supplemental Data | | | | | | | | |
Net assets, end of period (000) | | $ | 1,499,042 | | | $ | 1,285,686 | |
| | | | | | | | |
Portfolio turnover rate of the LifePath Index Master Portfolio(j) | | | 14 | % | | | 12 | % |
| | | | | | | | |
| (a) | Commencement of operations. |
| (b) | Based on average shares outstanding. |
| (c) | Distributions for annual periods determined in accordance with U.S. federal income tax regulations. |
| (d) | Where applicable, excludes the effects of any sales charge and assumes the reinvestment of distributions. |
| (e) | Aggregate total return. |
| (f) | Includes the LifePath Index Fund’s share of its corresponding LifePath Index Master Portfolio’s allocated net expenses and/or net investment income. |
| (g) | Includes the LifePath Index Fund’s share of its corresponding LifePath Index Master Portfolio’s allocated fees waived and expenses and/or net investment income. Excludes expenses incurred indirectly as a result of the LifePath Index Master Portfolio’s investments in underlying funds as follows: |
| | | | | | | | |
| | | Year Ended
December 31, 2019 | | | Period from 08/06/18 (a) to 12/31/18 | |
Allocated fees waived | | | 0.03 | % | | | 0.03 | % |
Investments in underlying funds | | | 0.05 | % | | | 0.05 | % |
| | | | | | | | |
| (i) | Includes reorganization, offering, and board realignment and consolidation costs. Without these costs, total expenses and total expenses after fees waived and/or reimbursed would have been 0.37% and 0.34%, respectively. |
| (j) | Includes the LifePath Index Master Portfolio’s purchases and sales of the underlying funds and Large Cap Index Master Portfolio, Master Small Cap Index Series, Total International ex U.S. Index Master Portfolio and U.S. Total Bond Index Master Portfolio. |
See notes to financial statements.
| | |
| 54 | | 2019 BLACKROCK ANNUAL REPORTTO SHAREHOLDERS |
Financial Highlights (continued)
(For a share outstanding throughout each period)
| | | | | | | | | | | | | | | | | | | | |
| | | BlackRock LifePath Index 2045 Fund | |
| |
| | | Institutional | |
| |
| | | Year Ended December 31, | |
| | | 2019 | | | 2018 | | | 2017 | | | 2016 | | | 2015 | |
| | | | | |
Net asset value, beginning of year | | $ | 13.33 | | | $ | 14.75 | | | $ | 12.48 | | | $ | 11.80 | | | $ | 12.25 | |
| | | | | | | | | | | | | | | | | | | | |
Net investment income(a) | | | 0.42 | | | | 0.36 | | | | 0.36 | | | | 0.29 | | | | 0.29 | |
Net realized and unrealized gain (loss) | | | 3.04 | | | | (1.45 | ) | | | 2.25 | | | | 0.68 | | | | (0.37 | ) |
| | | | | | | | | | | | | | | | | | | | |
Net increase (decrease) from investment operations | | | 3.46 | | | | (1.09 | ) | | | 2.61 | | | | 0.97 | | | | (0.08 | ) |
| | | | | | | | | | | | | | | | | | | | |
| | | | | |
Distributions(b) | | | | | | | | | | | | | | | | | | | | |
From net investment income | | | (0.43 | ) | | | (0.32 | ) | | | (0.34 | ) | | | (0.27 | ) | | | (0.28 | ) |
From net realized gain | | | (0.11 | ) | | | (0.01 | ) | | | — | | | | (0.02 | ) | | | (0.09 | ) |
From return of capital | | | — | | | | — | | | | — | | | | (0.00 | )(c) | | | — | |
| | | | | | | | | | | | | | | | | | | | |
Total distributions | | | (0.54 | ) | | | (0.33 | ) | | | (0.34 | ) | | | (0.29 | ) | | | (0.37 | ) |
| | | | | | | | | | | | | | | | | | | | |
| | | | | |
Net asset value, end of year | | $ | 16.25 | | | $ | 13.33 | | | $ | 14.75 | | | $ | 12.48 | | | $ | 11.80 | |
| | | | | | | | | | | | | | | | | | | | |
| | | | | |
Total Return(d) | | | | | | | | | | | | | | | | | | | | |
Based on net asset value | | | 26.14 | % | | | (7.56 | )% | | | 21.03 | % | | | 8.23 | % | | | (0.70 | )% |
| | | | | | | | | | | | | | | | | | | | |
| | | | | |
Ratios to Average Net Assets(e)(f) | | | | | | | | | | | | | | | | | | | | |
Total expenses | | | 0.15 | % | | | 0.15 | % | | | 0.15 | % | | | 0.18 | % | | | 0.21 | % |
| | | | | | | | | | | | | | | | | | | | |
Total expenses after fees waived and/or reimbursed | | | 0.10 | % | | | 0.10 | % | | | 0.10 | % | | | 0.11 | % | | | 0.12 | % |
| | | | | | | | | | | | | | | | | | | | |
Net investment income | | | 2.78 | % | | | 2.43 | % | | | 2.63 | % | | | 2.39 | % | | | 2.32 | % |
| | | | | | | | | | | | | | | | | | | | |
| | | | | |
Supplemental Data | | | | | | | | | | | | | | | | | | | | |
Net assets, end of year (000) | | $ | 116,727 | | | $ | 70,629 | | | $ | 74,092 | | | $ | 45,760 | | | $ | 45,228 | |
| | | | | | | | | | | | | | | | | | | | |
Portfolio turnover rate of the LifePath Index Master Portfolio(g) | | | 12 | % | | | 8 | % | | | 6 | % | | | 26 | % | | | 10 | % |
| | | | | | | | | | | | | | | | | | | | |
| (a) | Based on average shares outstanding. |
| (b) | Distributions for annual periods determined in accordance with U.S. federal income tax regulations. |
| (c) | Amount is greater than $(0.005) per share. |
| (d) | Where applicable, assumes the reinvestment of distributions. |
| (e) | Includes the LifePath Index Fund’s share of its corresponding LifePath Index Master Portfolio’s allocated net expenses and/or net investment income. |
| (f) | Includes the LifePath Index Fund’s share of its corresponding LifePath Index Master Portfolio’s allocated fees waived and expenses and/or net investment income. Excludes expenses incurred indirectly as a result of the LifePath Index Master Portfolio’s investments in underlying funds as follows: |
| | | | | | | | | | | | | | | | | | | | |
| | | Year Ended December 31, | |
| | | 2019 | | | 2018 | | | 2017 | | | 2016 | | | 2015 | |
Allocated fees waived | | | 0.03 | % | | | 0.03 | % | | | 0.03 | % | | | 0.04 | % | | | 0.03 | % |
Investments in underlying funds | | | 0.05 | % | | | 0.06 | % | | | 0.06 | % | | | 0.10 | % | | | 0.08 | % |
| | | | | | | | | | | | | | | | | | | | |
| (g) | Includes the LifePath Index Master Portfolio’s purchases and sales of the underlying funds and Large Cap Index Master Portfolio, Master Small Cap Index Series, Total International ex U.S. Index Master Portfolio and U.S. Total Bond Index Master Portfolio. |
See notes to financial statements.
Financial Highlights (continued)
(For a share outstanding throughout each period)
| | | | | | | | | | | | | | | | | | | | |
| | | BlackRock LifePath Index 2045 Fund (continued) | |
| |
| | | Investor A | |
| |
| | | Year Ended December 31, | |
| | | 2019 | | | 2018 | | | 2017 | | | 2016 | | | 2015 | |
| | | | | |
Net asset value, beginning of year | | $ | 13.30 | | | $ | 14.73 | | | $ | 12.46 | | | $ | 11.78 | | | $ | 12.23 | |
| | | | | | | | | | | | | | | | | | | | |
Net investment income(a) | | | 0.39 | | | | 0.31 | | | | 0.32 | | | | 0.26 | | | | 0.26 | |
Net realized and unrealized gain (loss) | | | 3.03 | | | | (1.45 | ) | | | 2.25 | | | | 0.68 | | | | (0.37 | ) |
| | | | | | | | | | | | | | | | | | | | |
Net increase (decrease) from investment operations | | | 3.42 | | | | (1.14 | ) | | | 2.57 | | | | 0.94 | | | | (0.11 | ) |
| | | | | | | | | | | | | | | | | | | | |
| | | | | |
Distributions(b) | | | | | | | | | | | | | | | | | | | | |
From net investment income | | | (0.39 | ) | | | (0.28 | ) | | | (0.30 | ) | | | (0.24 | ) | | | (0.25 | ) |
From net realized gain | | | (0.11 | ) | | | (0.01 | ) | | | — | | | | (0.02 | ) | | | (0.09 | ) |
From return of capital | | | — | | | | — | | | | — | | | | (0.00 | )(c) | | | — | |
| | | | | | | | | | | | | | | | | | | | |
Total distributions | | | (0.50 | ) | | | (0.29 | ) | | | (0.30 | ) | | | (0.26 | ) | | | (0.34 | ) |
| | | | | | | | | | | | | | | | | | | | |
| | | | | |
Net asset value, end of year | | $ | 16.22 | | | $ | 13.30 | | | $ | 14.73 | | | $ | 12.46 | | | $ | 11.78 | |
| | | | | | | | | | | | | | | | | | | | |
| | | | | |
Total Return(d) | | | | | | | | | | | | | | | | | | | | |
Based on net asset value | | | 25.91 | % | | | (7.87 | )% | | | 20.77 | % | | | 8.00 | % | | | (0.94 | )% |
| | | | | | | | | | | | | | | | | | | | |
| | | | | |
Ratios to Average Net Assets(e)(f) | | | | | | | | | | | | | | | | | | | | |
Total expenses | | | 0.41 | % | | | 0.40 | % | | | 0.40 | % | | | 0.42 | % | | | 0.46 | % |
| | | | | | | | | | | | | | | | | | | | |
Total expenses after fees waived and/or reimbursed | | | 0.35 | % | | | 0.35 | % | | | 0.35 | % | | | 0.36 | % | | | 0.37 | % |
| | | | | | | | | | | | | | | | | | | | |
Net investment income | | | 2.56 | % | | | 2.12 | % | | | 2.32 | % | | | 2.15 | % | | | 2.09 | % |
| | | | | | | | | | | | | | | | | | | | |
| | | | | |
Supplemental Data | | | | | | | | | | | | | | | | | | | | |
Net assets, end of year (000) | | $ | 120,718 | | | $ | 65,642 | | | $ | 83,711 | | | $ | 61,642 | | | $ | 43,155 | |
| | | | | | | | | | | | | | | | | | | | |
Portfolio turnover rate of the LifePath Index Master Portfolio(g) | | | 12 | % | | | 8 | % | | | 6 | % | | | 26 | % | | | 10 | % |
| | | | | | | | | | | | | | | | | | | | |
| (a) | Based on average shares outstanding. |
| (b) | Distributions for annual periods determined in accordance with U.S. federal income tax regulations. |
| (c) | Amount is greater than $(0.005) per share. |
| (d) | Where applicable, assumes the reinvestment of distributions. |
| (e) | Includes the LifePath Index Fund’s share of its corresponding LifePath Index Master Portfolio’s allocated net expenses and/or net investment income. |
| (f) | Includes the LifePath Index Fund’s share of its corresponding LifePath Index Master Portfolio’s allocated fees waived and expenses and/or net investment income. Excludes expenses incurred indirectly as a result of the LifePath Index Master Portfolio’s investments in underlying funds as follows: |
| | | | | | | | | | | | | | | | | | | | |
| | | Year Ended December 31, | |
| | | 2019 | | | 2018 | | | 2017 | | | 2016 | | | 2015 | |
Allocated fees waived | | | 0.03 | % | | | 0.03 | % | | | 0.03 | % | | | 0.04 | % | | | 0.03 | % |
Investments in underlying funds | | | 0.05 | % | | | 0.06 | % | | | 0.06 | % | | | 0.10 | % | | | 0.08 | % |
| | | | | | | | | | | | | | | | | | | | |
| (g) | Includes the LifePath Index Master Portfolio’s purchases and sales of the underlying funds and Large Cap Index Master Portfolio, Master Small Cap Index Series, Total International ex U.S. Index Master Portfolio and U.S. Total Bond Index Master Portfolio. |
See notes to financial statements.
| | |
| 56 | | 2019 BLACKROCK ANNUAL REPORTTO SHAREHOLDERS |
Financial Highlights (continued)
(For a share outstanding throughout each period)
| | | | | | | | | | | | | | | | | | | | |
| | | BlackRock LifePath Index 2045 Fund (continued) | |
| |
| | | Class K | |
| |
| | | Year Ended December 31, | |
| | | 2019 | | | 2018 | | | 2017 | | | 2016 | | | 2015 | |
| | | | | |
Net asset value, beginning of year | | $ | 13.34 | | | $ | 14.76 | | | $ | 12.49 | | | $ | 11.81 | | | $ | 12.26 | |
| | | | | | | | | | | | | | | | | | | | |
Net investment income(a) | | | 0.42 | | | | 0.37 | | | | 0.38 | | | | 0.29 | | | | 0.29 | |
Net realized and unrealized gain (loss) | | | 3.06 | | | | (1.46 | ) | | | 2.23 | | | | 0.68 | | | | (0.37 | ) |
| | | | | | | | | | | | | | | | | | | | |
Net increase (decrease) from investment operations | | | 3.48 | | | | (1.09 | ) | | | 2.61 | | | | 0.97 | | | | (0.08 | ) |
| | | | | | | | | | | | | | | | | | | | |
| | | | | |
Distributions(b) | | | | | | | | | | | | | | | | | | | | |
From net investment income | | | (0.44 | ) | | | (0.32 | ) | | | (0.34 | ) | | | (0.27 | ) | | | (0.28 | ) |
From net realized gain | | | (0.11 | ) | | | (0.01 | ) | | | — | | | | (0.02 | ) | | | (0.09 | ) |
From return of capital | | | — | | | | — | | | | — | | | | (0.00 | )(c) | | | — | |
| | | | | | | | | | | | | | | | | | | | |
Total distributions | | | (0.55 | ) | | | (0.33 | ) | | | (0.34 | ) | | | (0.29 | ) | | | (0.37 | ) |
| | | | | | | | | | | | | | | | | | | | |
| | | | | |
Net asset value, end of year | | $ | 16.27 | | | $ | 13.34 | | | $ | 14.76 | | | $ | 12.49 | | | $ | 11.81 | |
| | | | | | | | | | | | | | | | | | | | |
| | | | | |
Total Return(d) | | | | | | | | | | | | | | | | | | | | |
Based on net asset value | | | 26.25 | % | | | (7.50 | )% | | | 21.07 | % | | | 8.28 | % | | | (0.64 | )% |
| | | | | | | | | | | | | | | | | | | | |
| | | | | |
Ratios to Average Net Assets(e)(f) | | | | | | | | | | | | | | | | | | | | |
Total expenses | | | 0.09 | % | | | 0.10 | % | | | 0.09 | % | | | 0.13 | % | | | 0.15 | % |
| | | | | | | | | | | | | | | | | | | | |
Total expenses after fees waived and/or reimbursed | | | 0.05 | % | | | 0.05 | % | | | 0.05 | % | | | 0.06 | % | | | 0.07 | % |
| | | | | | | | | | | | | | | | | | | | |
Net investment income | | | 2.80 | % | | | 2.55 | % | | | 2.72 | % | | | 2.44 | % | | | 2.39 | % |
| | | | | | | | | | | | | | | | | | | | |
| | | | | |
Supplemental Data | | | | | | | | | | | | | | | | | | | | |
Net assets, end of year (000) | | $ | 2,720,014 | | | $ | 1,645,042 | | | $ | 1,228,130 | | | $ | 584,168 | | | $ | 252,843 | |
| | | | | | | | | | | | | | | | | | | | |
Portfolio turnover rate of the LifePath Index Master Portfolio(g) | | | 12 | % | | | 8 | % | | | 6 | % | | | 26 | % | | | 10 | % |
| | | | | | | | | | | | | | | | | | | | |
| (a) | Based on average shares outstanding. |
| (b) | Distributions for annual periods determined in accordance with U.S. federal income tax regulations. |
| (c) | Amount is greater than $(0.005) per share. |
| (d) | Where applicable, assumes the reinvestment of distributions. |
| (e) | Includes the LifePath Index Fund’s share of its corresponding LifePath Index Master Portfolio’s allocated net expenses and/or net investment income. |
| (f) | Includes the LifePath Index Fund’s share of its corresponding LifePath Index Master Portfolio’s allocated fees waived and expenses and/or net investment income. Excludes expenses incurred indirectly as a result of the LifePath Index Master Portfolio’s investments in underlying funds as follows: |
| | | | | | | | | | | | | | | | | | | | |
| | | Year Ended December 31, | |
| | | 2019 | | | 2018 | | | 2017 | | | 2016 | | | 2015 | |
Allocated fees waived | | | 0.03 | % | | | 0.03 | % | | | 0.03 | % | | | 0.04 | % | | | 0.03 | % |
Investments in underlying funds | | | 0.05 | % | | | 0.06 | % | | | 0.06 | % | | | 0.10 | % | | | 0.08 | % |
| | | | | | | | | | | | | | | | | | | | |
| (g) | Includes the LifePath Index Master Portfolio’s purchases and sales of the underlying funds and Large Cap Index Master Portfolio, Master Small Cap Index Series, Total International ex U.S. Index Master Portfolio and U.S. Total Bond Index Master Portfolio. |
See notes to financial statements.
Financial Highlights (continued)
(For a share outstanding throughout each period)
| | | | | | | | |
| | | BlackRock LifePath Index 2045 Fund (continued) | |
| |
| | | Investor P | |
| | | Year Ended
December 31, 2019 | | | Period from
08/06/18 (a) to 12/31/18 | |
| | |
Net asset value, beginning of period | | $ | 13.29 | | | $ | 15.05 | |
| | | | | | | | |
Net investment income(b) | | | 0.44 | | | | 0.16 | |
Net realized and unrealized gain (loss) | | | 2.98 | | | | (1.75 | ) |
| | | | | | | | |
Net increase (decrease) from investment operations | | | 3.42 | | | | (1.59 | ) |
| | | | | | | | |
|
| Distributions(c) | |
From net investment income | | | (0.40 | ) | | | (0.16 | ) |
From net realized gain | | | (0.11 | ) | | | (0.01 | ) |
| | | | | | | | |
Total distributions | | | (0.51 | ) | | | (0.17 | ) |
| | | | | | | | |
| | |
Net asset value, end of period | | $ | 16.20 | | | $ | 13.29 | |
| | | | | | | | |
|
Total Return(d) | |
Based on net asset value | | | 25.91 | % | | | (10.64 | )%(e) |
| | | | | | | | |
|
Ratios to Average Net Assets(f)(g) | |
Total expenses | | | 0.49 | % | | | 0.37 | %(h) |
| | | | | | | | |
Total expenses after fees waived and/or reimbursed | | | 0.35 | % | | | 0.32 | %(h) |
| | | | | | | | |
Net investment income | | | 2.87 | % | | | 2.71 | %(h) |
| | | | | | | | |
|
Supplemental Data | |
Net assets, end of period (000) | | $ | 3,376 | | | $ | 249 | |
| | | | | | | | |
Portfolio turnover rate of the LifePath Index Master Portfolio(i) | | | 12 | % | | | 8 | % |
| | | | | | | | |
| (a) | Commencement of operations. |
| (b) | Based on average Common Shares outstanding. |
| (c) | Distributions for annual periods determined in accordance with U.S. federal income tax regulations. |
| (d) | Where applicable, excludes the effects of any sales charges and assumes the reinvestment of distributions. |
| (e) | Aggregate total return. |
| (f) | Includes the LifePath Index Fund’s share of its corresponding LifePath Index Master Portfolio’s allocated net expenses and/or net investment income. |
| (g) | Includes the LifePath Index Fund’s share of its corresponding LifePath Index Master Portfolio’s allocated fees waived and expenses and/or net investment income. Excludes expenses incurred indirectly as a result of the LifePath Index Master Portfolio’s investments in underlying funds as follows: |
| | | | | | | | |
| | | Year Ended
December 31, 2019 | | | Period from 08/06/18 (a) to 12/31/18 | |
Allocated fees waived | | | 0.03 | % | | | 0.03 | % |
Investments in underlying funds | | | 0.05 | % | | | 0.06 | % |
| | | | | | | | |
| (i) | Includes the LifePath Index Master Portfolio’s purchases and sales of the underlying funds and Large Cap Index Master Portfolio, Master Small Cap Index Series, Total International ex U.S. Index Master Portfolio and U.S. Total Bond Index Master Portfolio. |
See notes to financial statements.
| | |
| 58 | | 2019 BLACKROCK ANNUAL REPORTTO SHAREHOLDERS |
Financial Highlights (continued)
(For a share outstanding throughout each period)
| | | | | | | | | | | | | | | | | | | | |
| | | BlackRock LifePath Index 2050 Fund | |
| |
| | | Institutional | |
| |
| | | Year Ended December 31, | |
| | | 2019 | | | 2018 | | | 2017 | | | 2016 | | | 2015 | |
| | | | | | |
Net asset value, beginning of year | | $ | 13.51 | | | $ | 14.99 | | | $ | 12.65 | | | $ | 11.95 | | | $ | 12.41 | |
| | | | | | | | | | | | | | | | | | | | |
Net investment income(a) | | | 0.43 | | | | 0.37 | | | | 0.37 | | | | 0.29 | | | | 0.29 | |
Net realized and unrealized gain (loss) | | | 3.15 | | | | (1.53 | ) | | | 2.32 | | | | 0.70 | | | | (0.38 | ) |
| | | | | | | | | | | | | | | | | | | | |
Net increase (decrease) from investment operations | | | 3.58 | | | | (1.16 | ) | | | 2.69 | | | | 0.99 | | | | (0.09 | ) |
| | | | | | | | | | | | | | | | | | | | |
| | | | | |
Distributions(b) | | | | | | | | | | | | | | | | | | | | |
From net investment income | | | (0.44 | ) | | | (0.31 | ) | | | (0.35 | ) | | | (0.27 | ) | | | (0.28 | ) |
From net realized gain | | | (0.10 | ) | | | (0.01 | ) | | | — | | | | (0.02 | ) | | | (0.09 | ) |
From return of capital | | | — | | | | — | | | | — | | | | (0.00 | )(c) | | | — | |
| | | | | | | | | | | | | | | | | | | | |
Total distributions | | | (0.54 | ) | | | (0.32 | ) | | | (0.35 | ) | | | (0.29 | ) | | | (0.37 | ) |
| | | | | | | | | | | | | | | | | | | | |
| | | | | |
Net asset value, end of year | | $ | 16.55 | | | $ | 13.51 | | | $ | 14.99 | | | $ | 12.65 | | | $ | 11.95 | |
| | | | | | | | | | | | | | | | | | | | |
| | | | | |
Total Return(d) | | | | | | | | | | | | | | | | | | | | |
Based on net asset value | | | 26.71 | % | | | (7.87 | )% | | | 21.38 | % | | | 8.36 | % | | | (0.72 | )% |
| | | | | | | | | | | | | | | | | | | | |
| | | | | |
Ratios to Average Net Assets(e)(f) | | | | | | | | | | | | | | | | | | | | |
Total expenses | | | 0.15 | % | | | 0.16 | %(g) | | | 0.15 | % | | | 0.19 | % | | | 0.22 | % |
| | | | | | | | | | | | | | | | | | | | |
Total expenses after fees waived and/or reimbursed | | | 0.10 | % | | | 0.10 | %(g) | | | 0.10 | % | | | 0.11 | % | | | 0.12 | % |
| | | | | | | | | | | | | | | | | | | | |
Net investment income | | | 2.78 | % | | | 2.45 | % | | | 2.68 | % | | | 2.40 | % | | | 2.32 | % |
| | | | | | | | | | | | | | | | | | | | |
| | | | | |
Supplemental Data | | | | | | | | | | | | | | | | | | | | |
Net assets, end of year (000) | | $ | 111,105 | | | $ | 68,949 | | | $ | 70,450 | | | $ | 40,196 | | | $ | 38,476 | |
| | | | | | | | | | | | | | | | | | | | |
Portfolio turnover rate of the LifePath Index Master Portfolio(h) | | | 12 | % | | | 11 | % | | | 5 | % | | | 28 | % | | | 14 | % |
| | | | | | | | | | | | | | | | | | | | |
| (a) | Based on average shares outstanding. |
| (b) | Distributions for annual periods determined in accordance with U.S. federal income tax regulations. |
| (c) | Amount is greater than $(0.005) per share. |
| (d) | Where applicable, assumes the reinvestment of distributions. |
| (e) | Includes the LifePath Index Fund’s share of its corresponding LifePath Index Master Portfolio’s allocated net expenses and/or net investment income. |
| (f) | Includes the LifePath Index Fund’s share of its corresponding LifePath Index Master Portfolio’s allocated fees waived and expenses and/or net investment income. Excludes expenses incurred indirectly as a result of the LifePath Index Master Portfolio’s investments in underlying funds as follows: |
| | | | | | | | | | | | | | | | | | | | |
| | | Year Ended December 31, | |
| | | 2019 | | | 2018 | | | 2017 | | | 2016 | | | 2015 | |
Allocated fees waived | | | 0.03 | % | | | 0.03 | % | | | 0.03 | % | | | 0.04 | % | | | 0.03 | % |
Investments in underlying funds | | | 0.05 | % | | | 0.06 | % | | | 0.06 | % | | | 0.10 | % | | | 0.09 | % |
| | | | | | | | | | | | | | | | | | | | |
| (g) | Includes reorganization, offering, and board realignment and consolidation costs. Without these costs, total expenses and total expenses after fees waived and/or reimbursed would have been 0.15% and 0.10%, respectively. |
| (h) | Includes the LifePath Index Master Portfolio’s purchases and sales of the underlying funds and Large Cap Index Master Portfolio, Master Small Cap Index Series, Total International ex U.S. Index Master Portfolio and U.S. Total Bond Index Master Portfolio. |
See notes to financial statements.
Financial Highlights (continued)
(For a share outstanding throughout each period)
| | | | | | | | | | | | | | | | | | | | |
| | | BlackRock LifePath Index 2050 Fund (continued) | |
| |
| | | Investor A | |
| |
| | | Year Ended December 31, | |
| | | 2019 | | | 2018 | | | 2017 | | | 2016 | | | 2015 | |
| | | | | | |
Net asset value, beginning of year | | $ | 13.48 | | | $ | 14.96 | | | $ | 12.62 | | | $ | 11.93 | | | $ | 12.39 | |
| | | | | | | | | | | | | | | | | | | | |
Net investment income(a) | | | 0.39 | | | | 0.33 | | | | 0.33 | | | | 0.25 | | | | 0.26 | |
Net realized and unrealized gain (loss) | | | 3.14 | | | | (1.52 | ) | | | 2.32 | | | | 0.71 | | | | (0.38 | ) |
| | | | | | | | | | | | | | | | | | | | |
Net increase (decrease) from investment operations | | | 3.53 | | | | (1.19 | ) | | | 2.65 | | | | 0.96 | | | | (0.12 | ) |
| | | | | | | | | | | | | | | | | | | | |
| | | | | |
Distributions(b) | | | | | | | | | | | | | | | | | | | | |
From net investment income | | | (0.40 | ) | | | (0.28 | ) | | | (0.31 | ) | | | (0.25 | ) | | | (0.25 | ) |
From net realized gain | | | (0.10 | ) | | | (0.01 | ) | | | — | | | | (0.02 | ) | | | (0.09 | ) |
From return of capital | | | — | | | | — | | | | — | | | | (0.00 | )(c) | | | — | |
| | | | | | | | | | | | | | | | | | | | |
Total distributions | | | (0.50 | ) | | | (0.29 | ) | | | (0.31 | ) | | | (0.27 | ) | | | (0.34 | ) |
| | | | | | | | | | | | | | | | | | | | |
| | | | | |
Net asset value, end of year | | $ | 16.51 | | | $ | 13.48 | | | $ | 14.96 | | | $ | 12.62 | | | $ | 11.93 | |
| | | | | | | | | | | | | | | | | | | | |
| | | | | |
Total Return(d) | | | | | | | | | | | | | | | | | | | | |
Based on net asset value | | | 26.40 | % | | | (8.11 | )% | | | 21.14 | % | | | 8.04 | % | | | (0.96 | )% |
| | | | | | | | | | | | | | | | | | | | |
| | | | | |
Ratios to Average Net Assets(e)(f) | | | | | | | | | | | | | | | | | | | | |
Total expenses | | | 0.44 | % | | | 0.42 | %(g) | | | 0.40 | % | | | 0.43 | % | | | 0.46 | % |
| | | | | | | | | | | | | | | | | | | | |
Total expenses after fees waived and/or reimbursed | | | 0.35 | % | | | 0.35 | %(g) | | | 0.35 | % | | | 0.36 | % | | | 0.37 | % |
| | | | | | | | | | | | | | | | | | | | |
Net investment income | | | 2.53 | % | | | 2.18 | % | | | 2.40 | % | | | 2.07 | % | | | 2.09 | % |
| | | | | | | | | | | | | | | | | | | | |
| | | | | |
Supplemental Data | | | | | | | | | | | | | | | | | | | | |
Net assets, end of year (000) | | $ | 138,397 | | | $ | 82,677 | | | $ | 95,477 | | | $ | 60,051 | | | $ | 27,413 | |
| | | | | | | | | | | | | | | | | | | | |
Portfolio turnover rate of the LifePath Index Master Portfolio(h) | | | 12 | % | | | 11 | % | | | 5 | % | | | 28 | % | | | 14 | % |
| | | | | | | | | | | | �� | | | | | | | | |
| (a) | Based on average shares outstanding. |
| (b) | Distributions for annual periods determined in accordance with U.S. federal income tax regulations. |
| (c) | Amount is greater than $(0.005) per share. |
| (d) | Where applicable, assumes the reinvestment of distributions. |
| (e) | Includes the LifePath Index Fund’s share of its corresponding LifePath Index Master Portfolio’s allocated net expenses and/or net investment income. |
| (f) | Includes the LifePath Index Fund’s share of its corresponding LifePath Index Master Portfolio’s allocated fees waived and expenses and/or net investment income. Excludes expenses incurred indirectly as a result of the LifePath Index Master Portfolio’s investments in underlying funds as follows: |
| | | | | | | | | | | | | | | | | | | | |
| | | Year Ended December 31, | |
| | | 2019 | | | 2018 | | | 2017 | | | 2016 | | | 2015 | |
Allocated fees waived | | | 0.03 | % | | | 0.03 | % | | | 0.03 | % | | | 0.04 | % | | | 0.03 | % |
Investments in underlying funds | | | 0.05 | % | | | 0.06 | % | | | 0.06 | % | | | 0.10 | % | | | 0.09 | % |
| | | | | | | | | | | | | | | | | | | | |
| (g) | Includes reorganization, offering, and board realignment and consolidation costs. Without these costs, total expenses and total expenses after fees waived and/or reimbursed would have been 0.41% and 0.35%, respectively. |
| (h) | Includes the LifePath Index Master Portfolio’s purchases and sales of the underlying funds and Large Cap Index Master Portfolio, Master Small Cap Index Series, Total International ex U.S. Index Master Portfolio and U.S. Total Bond Index Master Portfolio. |
See notes to financial statements.
| | |
| 60 | | 2019 BLACKROCK ANNUAL REPORTTO SHAREHOLDERS |
Financial Highlights (continued)
(For a share outstanding throughout each period)
| | | | | | | | | | | | | | | | | | | | |
| | | BlackRock LifePath Index 2050 Fund (continued) | |
| |
| | | Class K | |
| |
| | | Year Ended December 31, | |
| | | 2019 | | | 2018 | | | 2017 | | | 2016 | | | 2015 | |
| | | | | | |
Net asset value, beginning of year | | $ | 13.51 | | | $ | 14.99 | | | $ | 12.65 | | | $ | 11.95 | | | $ | 12.41 | |
| | | | | | | | | | | | | | | | | | | | |
Net investment income(a) | | | 0.43 | | | | 0.38 | | | | 0.39 | | | | 0.30 | | | | 0.30 | |
Net realized and unrealized gain (loss) | | | 3.16 | | | | (1.53 | ) | | | 2.30 | | | | 0.70 | | | | (0.38 | ) |
| | | | | | | | | | | | | | | | | | | | |
Net increase (decrease) from investment operations | | | 3.59 | | | | (1.15 | ) | | | 2.69 | | | | 1.00 | | | | (0.08 | ) |
| | | | | | | | | | | | | | | | | | | | |
| | | | | |
Distributions(b) | | | | | | | | | | | | | | | | | | | | |
From net investment income | | | (0.45 | ) | | | (0.32 | ) | | | (0.35 | ) | | | (0.28 | ) | | | (0.29 | ) |
From net realized gain | | | (0.10 | ) | | | (0.01 | ) | | | — | | | | (0.02 | ) | | | (0.09 | ) |
From return of capital | | | — | | | | — | | | | — | | | | (0.00 | )(c) | | | — | |
| | | | | | | | | | | | | | | | | | | | |
Total distributions | | | (0.55 | ) | | | (0.33 | ) | | | (0.35 | ) | | | (0.30 | ) | | | (0.38 | ) |
| | | | | | | | | | | | | | | | | | | | |
| | | | | |
Net asset value, end of year | | $ | 16.55 | | | $ | 13.51 | | | $ | 14.99 | | | $ | 12.65 | | | $ | 11.95 | |
| | | | | | | | | | | | | | | | | | | | |
| | | | | |
Total Return(d) | | | | | | | | | | | | | | | | | | | | |
Based on net asset value | | | 26.77 | % | | | (7.82 | )% | | | 21.43 | % | | | 8.41 | % | | | (0.67 | )% |
| | | | | | | | | | | | | | | | | | | | |
| | | | | |
Ratios to Average Net Assets(e)(f) | | | | | | | | | | | | | | | | | | | | |
Total expenses | | | 0.09 | % | | | 0.11 | %(g) | | | 0.10 | % | | | 0.13 | % | | | 0.16 | % |
| | | | | | | | | | | | | | | | | | | | |
Total expenses after fees waived and/or reimbursed | | | 0.05 | % | | | 0.05 | %(g) | | | 0.05 | % | | | 0.06 | % | | | 0.07 | % |
| | | | | | | | | | | | | | | | | | | | |
Net investment income | | | 2.81 | % | | | 2.57 | % | | | 2.73 | % | | | 2.45 | % | | | 2.39 | % |
| | | | | | | | | | | | | | | | | | | | |
| | | | | |
Supplemental Data | | | | | | | | | | | | | | | | | | | | |
Net assets, end of year (000) | | $ | 2,388,475 | | | $ | 1,420,616 | | | $ | 1,086,096 | | | $ | 549,541 | | | $ | 271,178 | |
| | | | | | | | | | | | | | | | | | | | |
Portfolio turnover rate of the LifePath Index Master Portfolio(h) | | | 12 | % | | | 11 | % | | | 5 | % | | | 28 | % | | | 14 | % |
| | | | | | | | | | | | | | | | | | | | |
| (a) | Based on average shares outstanding. |
| (b) | Distributions for annual periods determined in accordance with U.S. federal income tax regulations. |
| (c) | Amount is greater than $(0.005) per share. |
| (d) | Where applicable, assumes the reinvestment of distributions. |
| (e) | Includes the LifePath Index Fund’s share of its corresponding LifePath Index Master Portfolio’s allocated net expenses and/or net investment income. |
| (f) | Includes the LifePath Index Fund’s share of its corresponding LifePath Index Master Portfolio’s allocated fees waived and expenses and/or net investment income. Excludes expenses incurred indirectly as a result of the LifePath Index Master Portfolio’s investments in underlying funds as follows: |
| | | | | | | | | | | | | | | | | | | | |
| | | Year Ended December 31, | |
| | | 2019 | | | 2018 | | | 2017 | | | 2016 | | | 2015 | |
Allocated fees waived | | | 0.03 | % | | | 0.03 | % | | | 0.03 | % | | | 0.04 | % | | | 0.03 | % |
Investments in underlying funds | | | 0.05 | % | | | 0.06 | % | | | 0.06 | % | | | 0.10 | % | | | 0.09 | % |
| | | | | | | | | | | | | | | | | | | | |
| (g) | Includes reorganization, offering, and board realignment and consolidation costs. Without these costs, total expenses and total expenses after fees waived and/or reimbursed would have been 0.10% and 0.05%, respectively. |
| (h) | Includes the LifePath Index Master Portfolio’s purchases and sales of the underlying funds and Large Cap Index Master Portfolio, Master Small Cap Index Series, Total International ex U.S. Index Master Portfolio and U.S. Total Bond Index Master Portfolio. |
See notes to financial statements.
Financial Highlights (continued)
(For a share outstanding throughout each period)
| | | | | | | | |
| | | BlackRock LifePath Index
2050 Fund (continued) | |
| |
| | | Investor P | |
| | | Year Ended
December 31, 2019 | | | Period from 08/06/18 (a) to 12/31/18 | |
| | | |
Net asset value, beginning of period | | $ | 13.47 | | | $ | 15.30 | |
| | | | | | | | |
Net investment income(b) | | | 0.37 | | | | 0.34 | |
Net realized and unrealized gain (loss) | | | 3.16 | | | | (2.00 | ) |
| | | | | | | | |
Net increase (decrease) from investment operations | | | 3.53 | | | | (1.66 | ) |
| | | | | | | | |
| | |
| Distributions(c) | | | | | | |
From net investment income | | | (0.40 | ) | | | (0.16 | ) |
From net realized gain | | | (0.10 | ) | | | (0.01 | ) |
| | | | | | | | |
Total distributions | | | (0.50 | ) | | | (0.17 | ) |
| | | | | | | | |
| | |
Net asset value, end of period | | $ | 16.50 | | | $ | 13.47 | |
| | | | | | | | |
| | |
Total Return(d) | | | | | | | | |
Based on net asset value | | | 26.40 | % | | | (10.93 | )%(e) |
| | | | | | | | |
| | |
Ratios to Average Net Assets(f)(g) | | | | | | | | |
Total expenses | | | 0.42 | % | | | 0.39 | %(h)(i)(j) |
| | | | | | | | |
Total expenses after fees waived and/or reimbursed | | | 0.35 | % | | | 0.34 | %(h)(i)(j) |
| | | | | | | | |
Net investment income | | | 2.41 | % | | | 5.73 | %(h) |
| | | | | | | | |
| | |
Supplemental Data | | | | | | | | |
Net assets, end of period (000) | | $ | 473,345 | | | $ | 393,442 | |
| | | | | | | | |
Portfolio turnover rate of the LifePath Index Master Portfolio(k) | | | 12 | % | | | 11 | % |
| | | | | | | | |
| (a) | Commencement of operations. |
| (b) | Based on average Common Shares outstanding. |
| (c) | Distributions for annual periods determined in accordance with U.S. federal income tax regulations. |
| (d) | Where applicable, excludes the effects of any sales charges and assumes the reinvestment of distributions. |
| (e) | Aggregate total return. |
| (f) | Includes the LifePath Index Fund’s share of its corresponding LifePath Index Master Portfolio’s allocated net expenses and/or net investment income. |
| (g) | Includes the LifePath Index Fund’s share of its corresponding LifePath Index Master Portfolio’s allocated fees waived and expenses and/or net investment income. Excludes expenses incurred indirectly as a result of the LifePath Index Master Portfolio’s investments in underlying funds as follows: |
| | | | | | | | |
| | | Year Ended
December 31, 2019 | | | Period from 08/06/18 (a) to 12/31/18 | |
Allocated fees waived | | | 0.03 | % | | | 0.03 | % |
Investments in underlying funds | | | 0.05 | % | | | 0.06 | % |
| | | | | | | | |
| (i) | Reorganization, offering, and board realignment and consolidation costs were not annualized in the calculation of the expense ratios. If these expenses were annualized, the total expenses and total expenses after fees waived and/or reimbursed would have been 0.40% and 0.34%, respectively. |
| (j) | Includes reorganization, offering, and board realignment and consolidation costs. Without these costs, total expenses and total expenses after fees waived and/or reimbursed would have been 0.38% and 0.34%, respectively. |
| (k) | Includes the LifePath Index Master Portfolio’s purchases and sales of the underlying funds and Large Cap Index Master Portfolio, Master Small Cap Index Series, Total International ex U.S. Index Master Portfolio and U.S. Total Bond Index Master Portfolio. |
See notes to financial statements.
| | |
| 62 | | 2019 BLACKROCK ANNUAL REPORTTO SHAREHOLDERS |
Financial Highlights (continued)
(For a share outstanding throughout each period)
| | | | | | | | | | | | | | | | | | | | |
| | | BlackRock LifePath Index 2055 Fund | |
| |
| | | Institutional | |
| |
| | | Year Ended December 31, | |
| | | 2019 | | | 2018 | | | 2017 | | | 2016 | | | 2015 | |
| | | | | | |
Net asset value, beginning of year | | $ | 13.77 | | | $ | 15.27 | | | $ | 12.88 | | | $ | 12.17 | | | $ | 12.60 | |
| | | | | | | | | | | | | | | | | | | | |
Net investment income(a) | | | 0.42 | | | | 0.38 | | | | 0.39 | | | | 0.30 | | | | 0.30 | |
Net realized and unrealized gain (loss) | | | 3.24 | | | | (1.56 | ) | | | 2.35 | | | | 0.71 | | | | (0.38 | ) |
| | | | | | | | | | | | | | | | | | | | |
Net increase (decrease) from investment operations | | | 3.66 | | | | (1.18 | ) | | | 2.74 | | | | 1.01 | | | | (0.08 | ) |
| | | | | | | | | | | | | | | | | | | | |
|
Distributions(b) | |
From net investment income | | | (0.44 | ) | | | (0.32 | ) | | | (0.35 | ) | | | (0.28 | ) | | | (0.28 | ) |
From net realized gain | | | (0.06 | ) | | | — | | | | — | | | | (0.02 | ) | | | (0.07 | ) |
From return of capital | | | — | | | | — | | | | — | | | | (0.00 | )(c) | | | — | |
| | | | | | | | | | | | | | | | | | | | |
Total distributions | | | (0.50 | ) | | | (0.32 | ) | | | (0.35 | ) | | | (0.30 | ) | | | (0.35 | ) |
| | | | | | | | | | | | | | | | | | | | |
| | | | | |
Net asset value, end of year | | $ | 16.93 | | | $ | 13.77 | | | $ | 15.27 | | | $ | 12.88 | | | $ | 12.17 | |
| | | | | | | | | | | | | | | | | | | | |
|
Total Return(d) | |
Based on net asset value | | | 26.75 | % | | | (7.83 | )% | | | 21.38 | % | | | 8.32 | % | | | (0.64 | )% |
| | | | | | | | | | | | | | | | | | | | |
|
Ratios to Average Net Assets(e)(f) | |
Total expenses | | | 0.16 | % | | | 0.17 | % | | | 0.16 | % | | | 0.23 | % | | | 0.30 | % |
| | | | | | | | | | | | | | | | | | | | |
Total expenses after fees waived and/or reimbursed | | | 0.09 | % | | | 0.09 | % | | | 0.09 | % | | | 0.10 | % | | | 0.11 | % |
| | | | | | | | | | | | | | | | | | | | |
Net investment income | | | 2.70 | % | | | 2.49 | % | | | 2.73 | % | | | 2.45 | % | | | 2.39 | % |
| | | | | | | | | | | | | | | | | | | | |
|
Supplemental Data | |
Net assets, end of year (000) | | $ | 76,250 | | | $ | 60,993 | | | $ | 52,487 | | | $ | 26,561 | | | $ | 19,214 | |
| | | | | | | | | | | | | | | | | | | | |
Portfolio turnover rate of the LifePath Index Master Portfolio(g) | | | 12 | % | | | 8 | % | | | 5 | % | | | 33 | % | | | 17 | % |
| | | | | | | | | | | | | | | | | | | | |
| (a) | Based on average shares outstanding. |
| (b) | Distributions for annual periods determined in accordance with U.S. federal income tax regulations. |
| (c) | Amount is greater than $(0.005) per share. |
| (d) | Where applicable, assumes the reinvestment of distributions. |
| (e) | Includes the LifePath Index Fund’s share of its corresponding LifePath Index Master Portfolio’s allocated net expenses and/or net investment income. |
| (f) | Includes the LifePath Index Fund’s share of its corresponding LifePath Index Master Portfolio’s allocated fees waived and expenses and/or net investment income. Excludes expenses incurred indirectly as a result of the LifePath Index Master Portfolio’s investments in underlying funds as follows: |
| | | | | | | | | | | | | | | | | | | | |
| | | Year Ended December 31, | |
| | | 2019 | | | 2018 | | | 2017 | | | 2016 | | | 2015 | |
Allocated fees waived | | | 0.04 | % | | | 0.04 | % | | | 0.04 | % | | | 0.06 | % | | | 0.05 | % |
Investments in underlying funds | | | 0.05 | % | | | 0.06 | % | | | 0.07 | % | | | 0.11 | % | | | 0.09 | % |
| | | | | | | | | | | | | | | | | | | | |
| (g) | Includes the LifePath Index Master Portfolio’s purchases and sales of the underlying funds and Large Cap Index Master Portfolio, Master Small Cap Index Series, Total International ex U.S. Index Master Portfolio and U.S. Total Bond Index Master Portfolio. |
See notes to financial statements.
Financial Highlights (continued)
(For a share outstanding throughout each period)
| | | | | | | | | | | | | | | | | | | | |
| | | BlackRock LifePath Index 2055 Fund (continued) | |
| |
| | | Investor A | |
| |
| | | Year Ended December 31, | |
| | | 2019 | | | 2018 | | | 2017 | | | 2016 | | | 2015 | |
| | | | | | |
Net asset value, beginning of year | | $ | 13.74 | | | $ | 15.24 | | | $ | 12.86 | | | $ | 12.15 | | | $ | 12.58 | |
| | | | | | | | | | | | | | | | | | | | |
Net investment income(a) | | | 0.40 | | | | 0.34 | | | | 0.34 | | | | 0.27 | | | | 0.27 | |
Net realized and unrealized gain (loss) | | | 3.22 | | | | (1.55 | ) | | | 2.35 | | | | 0.71 | | | | (0.38 | ) |
| | | | | | | | | | | | | | | | | | | | |
Net increase (decrease) from investment operations | | | 3.62 | | | | (1.21 | ) | | | 2.69 | | | | 0.98 | | | | (0.11 | ) |
| | | | | | | | | | | | | | | | | | | | |
|
Distributions(b) | |
From net investment income | | | (0.41 | ) | | | (0.29 | ) | | | (0.31 | ) | | | (0.25 | ) | | | (0.25 | ) |
From net realized gain | | | (0.06 | ) | | | — | | | | — | | | | (0.02 | ) | | | (0.07 | ) |
From return of capital | | | — | | | | — | | | | — | | | | (0.00 | )(c) | | | — | |
| | | | | | | | | | | | | | | | | | | | |
Total distributions | | | (0.47 | ) | | | (0.29 | ) | | | (0.31 | ) | | | (0.27 | ) | | | (0.32 | ) |
| | | | | | | | | | | | | | | | | | | | |
| | | | | |
Net asset value, end of year | | $ | 16.89 | | | $ | 13.74 | | | $ | 15.24 | | | $ | 12.86 | | | $ | 12.15 | |
| | | | | | | | | | | | | | | | | | | | |
|
Total Return(d) | |
Based on net asset value | | | 26.46 | % | | | (8.08 | )% | | | 21.05 | % | | | 8.10 | % | | | (0.88 | )% |
| | | | | | | | | | | | | | | | | | | | |
|
Ratios to Average Net Assets(e)(f) | |
Total expenses | | | 0.43 | % | | | 0.43 | % | | | 0.41 | % | | | 0.46 | % | | | 0.53 | % |
| | | | | | | | | | | | | | | | | | | | |
Total expenses after fees waived and/or reimbursed | | | 0.34 | % | | | 0.34 | % | | | 0.34 | % | | | 0.34 | % | | | 0.36 | % |
| | | | | | | | | | | | | | | | | | | | |
Net investment income | | | 2.57 | % | | | 2.23 | % | | | 2.41 | % | | | 2.19 | % | | | 2.13 | % |
| | | | | | | | | | | | | | | | | | | | |
|
Supplemental Data | |
Net assets, end of year (000) | | $ | 78,919 | | | $ | 41,909 | | | $ | 41,580 | | | $ | 27,026 | | | $ | 13,140 | |
| | | | | | | | | | | | | | | | | | | | |
Portfolio turnover rate of the LifePath Index Master Portfolio(g) | | | 12 | % | | | 8 | % | | | 5 | % | | | 33 | % | | | 17 | % |
| | | | | | | | | | | | | | | | | | | | |
| (a) | Based on average shares outstanding. |
| (b) | Distributions for annual periods determined in accordance with U.S. federal income tax regulations. |
| (c) | Amount is greater than $(0.005) per share. |
| (d) | Where applicable, assumes the reinvestment of distributions. |
| (e) | Includes the LifePath Index Fund’s share of its corresponding LifePath Index Master Portfolio’s allocated net expenses and/or net investment income. |
| (f) | Includes the LifePath Index Fund’s share of its corresponding LifePath Index Master Portfolio’s allocated fees waived and expenses and/or net investment income. Excludes expenses incurred indirectly as a result of the LifePath Index Master Portfolio’s investments in underlying funds as follows: |
| | | | | | | | | | | | | | | | | | | | |
| | | Year Ended December 31, | |
| | | 2019 | | | 2018 | | | 2017 | | | 2016 | | | 2015 | |
Allocated fees waived | | | 0.04 | % | | | 0.04 | % | | | 0.04 | % | | | 0.06 | % | | | 0.05 | % |
Investments in underlying funds | | | 0.05 | % | | | 0.06 | % | | | 0.07 | % | | | 0.11 | % | | | 0.09 | % |
| | | | | | | | | | | | | | | | | | | | |
| (g) | Includes the LifePath Index Master Portfolio’s purchases and sales of the underlying funds and Large Cap Index Master Portfolio, Master Small Cap Index Series, Total International ex U.S. Index Master Portfolio and U.S. Total Bond Index Master Portfolio. |
See notes to financial statements.
| | |
| 64 | | 2019 BLACKROCK ANNUAL REPORTTO SHAREHOLDERS |
Financial Highlights (continued)
(For a share outstanding throughout each period)
| | | | | | | | | | | | | | | | | | | | |
| | | BlackRock LifePath Index 2055 Fund (continued) | |
| |
| | | Class K | |
| |
| | | Year Ended December 31, | |
| | | 2019 | | | 2018 | | | 2017 | | | 2016 | | | 2015 | |
| | | | | | |
Net asset value, beginning of year | | $ | 13.77 | | | $ | 15.27 | | | $ | 12.88 | | | $ | 12.17 | | | $ | 12.60 | |
| | | | | | | | | | | | | | | | | | | | |
Net investment income(a) | | | 0.45 | | | | 0.40 | | | | 0.41 | | | | 0.31 | | | | 0.31 | |
Net realized and unrealized gain (loss) | | | 3.23 | | | | (1.57 | ) | | | 2.33 | | | | 0.70 | | | | (0.38 | ) |
| | | | | | | | | | | | | | | | | | | | |
Net increase (decrease) from investment operations | | | 3.68 | | | | (1.17 | ) | | | 2.74 | | | | 1.01 | | | | (0.07 | ) |
| | | | | | | | | | | | | | | | | | | | |
|
Distributions(b) | |
From net investment income | | | (0.45 | ) | | | (0.33 | ) | | | (0.35 | ) | | | (0.28 | ) | | | (0.29 | ) |
From net realized gain | | | (0.06 | ) | | | — | | | | — | | | | (0.02 | ) | | | (0.07 | ) |
From return of capital | | | — | | | | — | | | | — | | | | (0.00 | )(c) | | | — | |
| | | | | | | | | | | | | | | | | | | | |
Total distributions | | | (0.51 | ) | | | (0.33 | ) | | | (0.35 | ) | | | (0.30 | ) | | | (0.36 | ) |
| | | | | | | | | | | | | | | | | | | | |
| | | | | |
Net asset value, end of year | | $ | 16.94 | | | $ | 13.77 | | | $ | 15.27 | | | $ | 12.88 | | | $ | 12.17 | |
| | | | | | | | | | | | | | | | | | | | |
|
Total Return(d) | |
Based on net asset value | | | 26.89 | % | | | (7.79 | )% | | | 21.43 | % | | | 8.37 | % | | | (0.60 | )% |
| | | | | | | | | | | | | | | | | | | | |
|
Ratios to Average Net Assets(e)(f) | |
Total expenses | | | 0.09 | % | | | 0.11 | % | | | 0.10 | % | | | 0.18 | % | | | 0.24 | % |
| | | | | | | | | | | | | | | | | | | | |
Total expenses after fees waived and/or reimbursed | | | 0.04 | % | | | 0.04 | % | | | 0.04 | % | | | 0.04 | % | | | 0.06 | % |
| | | | | | | | | | | | | | | | | | | | |
Net investment income | | | 2.86 | % | | | 2.60 | % | | | 2.79 | % | | | 2.50 | % | | | 2.43 | % |
| | | | | | | | | | | | | | | | | | | | |
|
Supplemental Data | |
Net assets, end of year (000) | | $ | 1,344,554 | | | $ | 716,634 | | | $ | 484,002 | | | $ | 197,394 | | | $ | 74,656 | |
| | | | | | | | | | | | | | | | | | | | |
Portfolio turnover rate of the LifePath Index Master Portfolio(g) | | | 12 | % | | | 8 | % | | | 5 | % | | | 33 | % | | | 17 | % |
| | | | | | | | | | | | | | | | | | | | |
| (a) | Based on average shares outstanding. |
| (b) | Distributions for annual periods determined in accordance with U.S. federal income tax regulations. |
| (c) | Amount is greater than $(0.005) per share. |
| (d) | Where applicable, assumes the reinvestment of distributions. |
| (e) | Includes the LifePath Index Fund’s share of its corresponding LifePath Index Master Portfolio’s allocated net expenses and/or net investment income. |
| (f) | Includes the LifePath Index Fund’s share of its corresponding LifePath Index Master Portfolio’s allocated fees waived and expenses and/or net investment income. Excludes expenses incurred indirectly as a result of the LifePath Index Master Portfolio’s investments in underlying funds as follows: |
| | | | | | | | | | | | | | | | | | | | |
| | | 2019 | | | 2018 | | | 2017 | | | 2016 | | | 2015 | |
Allocated fees waived | | | 0.04 | % | | | 0.04 | % | | | 0.04 | % | | | 0.06 | % | | | 0.05 | % |
Investments in underlying funds | | | 0.05 | % | | | 0.06 | % | | | 0.07 | % | | | 0.11 | % | | | 0.09 | % |
| | | | | | | | | | | | | | | | | | | | |
| (g) | Includes the LifePath Index Master Portfolio’s purchases and sales of the underlying funds and Large Cap Index Master Portfolio, Master Small Cap Index Series, Total International ex U.S. Index Master Portfolio and U.S. Total Bond Index Master Portfolio. |
See notes to financial statements.
Financial Highlights (continued)
(For a share outstanding throughout each period)
| | | | | | | | |
| | | BlackRock LifePath Index
2055 Fund (continued) | |
| |
| | | Investor P | |
| | | Year Ended
December 31, 2019 | | | Period from
08/06/18 (a) to 12/31/18 | |
| | | |
Net asset value, beginning of period | | $ | 13.73 | | | $ | 15.60 | |
| | | | | | | | |
Net investment income(b) | | | 0.47 | | | | 0.16 | |
Net realized and unrealized gain (loss) | | | 3.15 | | | | (1.87 | ) |
| | | | | | | | |
Net increase (decrease) from investment operations | | | 3.62 | | | | (1.71 | ) |
| | | | | | | | |
| | |
| Distributions(c) | | | | | | |
From net investment income | | | (0.41 | ) | | | (0.16 | ) |
From net realized gain | | | (0.06 | ) | | | — | |
| | | | | | | | |
Total distributions | | | (0.47 | ) | | | (0.16 | ) |
| | | | | | | | |
| | |
Net asset value, end of period | | $ | 16.88 | | | $ | 13.73 | |
| | | | | | | | |
| | |
Total Return(d) | | | | | | | | |
Based on net asset value | | | 26.54 | % | | | (11.00 | )%(e) |
| | | | | | | | |
| | |
Ratios to Average Net Assets(f)(g) | | | | | | | | |
Total expenses | | | 0.59 | % | | | 0.37 | %(h)(i) |
| | | | | | | | |
Total expenses after fees waived and/or reimbursed | | | 0.34 | % | | | 0.32 | %(h)(i) |
| | | | | | | | |
Net investment income | | | 2.99 | % | | | 2.63 | %(h) |
| | | | | | | | |
| | |
Supplemental Data | | | | | | | | |
Net assets, end of period (000) | | $ | 1,866 | | | $ | 209 | |
| | | | | | | | |
Portfolio turnover rate of the LifePath Index Master Portfolio(j) | | | 12 | % | | | 8 | % |
| | | | | | | | |
| (a) | Commencement of operations. |
| (b) | Based on average Common Shares outstanding. |
| (c) | Distributions for annual periods determined in accordance with U.S. federal income tax regulations. |
| (d) | Where applicable, excludes the effects of any sales charges and assumes the reinvestment of distributions. |
| (e) | Aggregate total return. |
| (f) | Includes the LifePath Index Fund’s share of its corresponding LifePath Index Master Portfolio’s allocated net expenses and/or net investment income. |
| (g) | Includes the LifePath Index Fund’s share of its corresponding LifePath Index Master Portfolio’s allocated fees waived and expenses and/or net investment income. Excludes expenses incurred indirectly as a result of the LifePath Index Master Portfolio’s investments in underlying funds as follows: |
| | | | | | | | |
| | | Year Ended
December 31, 2019 | | | Period from
08/06/18 (a) to 12/31/18 | |
Allocated fees waived | | | 0.04 | % | | | 0.04 | % |
Investments in underlying funds | | | 0.05 | % | | | 0.06 | % |
| | | | | | | | |
| (i) | Offering and board realignment and consolidation costs were not annualized in the calculation of the expense ratios. If these expenses were annualized, the total expenses and total expenses after fees waived and/or reimbursed would have been 0.38% and 0.32%, respectively. |
| (j) | Includes the LifePath Index Master Portfolio’s purchases and sales of the underlying funds and Large Cap Index Master Portfolio, Master Small Cap Index Series, Total International ex U.S. Index Master Portfolio and U.S. Total Bond Index Master Portfolio. |
See notes to financial statements.
| | |
| 66 | | 2019 BLACKROCK ANNUAL REPORTTO SHAREHOLDERS |
Financial Highlights (continued)
(For a share outstanding throughout each period)
| | | | | | | | | | | | | | | | | | | | |
| | | BlackRock LifePath Index 2060 Fund | |
| |
| | | Institutional | |
| | | Year Ended December 31, | | | | | | Period from
02/29/16 (a) to 12/31/16 | |
| | | 2019 | | | 2018 | | | 2017 | | | | |
| | | | | | |
Net asset value, beginning of period | | $ | 12.19 | | | $ | 13.50 | | | $ | 11.36 | | | | | | | $ | 10.00 | |
| | | | | | | | | | | | | | | | | | | | |
Net investment income(b) | | | 0.44 | | | | 0.36 | | | | 0.39 | | | | | | | | 0.33 | |
Net realized and unrealized gain (loss) | | | 2.80 | | | | (1.40 | ) | | | 2.03 | | | | | | | | 1.21 | |
| | | | | | | | | | | | | | | | | | | | |
Net increase (decrease) from investment operations | | | 3.24 | | | | (1.04 | ) | | | 2.42 | | | | | | | | 1.54 | |
| | | | | | | | | | | | | | | | | | | | |
|
Distributions(c) | |
From net investment income | | | (0.37 | ) | | | (0.27 | ) | | | (0.28 | ) | | | | | | | (0.18 | ) |
From net realized gain | | | — | | | | — | | | | — | | | | | | | | (0.00 | )(d) |
From return of capital | | | — | | | | — | | | | — | | | | | | | | (0.00 | )(d) |
| | | | | | | | | | | | | | | | | | | | |
Total distributions | | | (0.37 | ) | | | (0.27 | ) | | | (0.28 | ) | | | | | | | (0.18 | ) |
| | | | | | | | | | | | | | | | | | | | |
| | | | | |
Net asset value, end of period | | $ | 15.06 | | | $ | 12.19 | | | $ | 13.50 | | | | | | | $ | 11.36 | |
| | | | | | | | | | | | | | | | | | | | |
|
Total Return(e) | |
Based on net asset value | | | 26.78 | % | | | (7.82 | )% | | | 21.38 | % | | | | | | | 15.50 | %(f) |
| | | | | | | | | | | | | | | | | | | | |
|
Ratios to Average Net Assets(g)(h) | |
Total expenses | | | 0.29 | % | | | 0.37 | %(i) | | | 0.54 | % | | | | | | | 9.54 | %(j)(k) |
| | | | | | | | | | | | | | | | | | | | |
Total expenses after fees waived and/or reimbursed | | | 0.09 | % | | | 0.09 | %(i) | | | 0.09 | % | | | | | | | 0.11 | %(j) |
| | | | | | | | | | | | | | | | | | | | |
Net investment income | | | 3.11 | % | | | 2.68 | % | | | 3.05 | % | | | | | | | 3.56 | %(j) |
| | | | | | | | | | | | | | | | | | | | |
|
Supplemental Data | |
Net assets, end of period (000) | | $ | 11,132 | | | $ | 2,773 | | | $ | 1,021 | | | | | | | $ | 118 | |
| | | | | | | | | | | | | | | | | | | | |
Portfolio turnover rate of the LifePath Index Master Portfolio(l) | | | 11 | % | | | 13 | % | | | 1 | % | | | | | | | 71 | % |
| | | | | | | | | | | | | | | | | | | | |
| (a) | Commencement of operations. |
| (b) | Based on average shares outstanding. |
| (c) | Distributions for annual periods determined in accordance with U.S. federal income tax regulations. |
| (d) | Amount is greater than $(0.005) per share. |
| (e) | Where applicable, assumes the reinvestment of distributions. |
| (f) | Aggregate total return. |
| (g) | Includes the LifePath Index Fund’s share of its corresponding LifePath Index Master Portfolio’s allocated net expenses and/or net investment income. |
| (h) | Includes the LifePath Index Fund’s share of its corresponding LifePath Index Master Portfolio’s allocated fees waived and expenses and/or net investment income. Excludes expenses incurred indirectly as a result of the LifePath Index Master Portfolio’s investments in underlying funds as follows: |
| | | | | | | | | | | | | | | | | | | | |
| | | Year Ended December 31, | | | | | | Period from 02/29/16 (a) to 12/31/16 | |
| | | 2019 | | | 2018 | | | 2017 | | | | |
Allocated fees waived | | | 0.05 | % | | | 0.08 | % | | | 0.11 | % | | | | | | | 2.41 | % |
Investments in underlying funds | | | 0.05 | % | | | 0.06 | % | | | 0.07 | % | | | | | | | 0.12 | % |
| | | | | | | | | | | | | | | | | | | | |
| (i) | Includes offering, and board realignment and consolidation costs. Without these costs, total expenses and total expenses after fees waived and/or reimbursed would have been 0.34% and 0.09%, respectively. |
| (k) | Audit, Offering and Organization costs were not annualized in the calculation of the expense ratio. If these expenses were annualized, the total expenses would have been 11.15% |
| (l) | Includes the LifePath Index Master Portfolio’s purchases and sales of the underlying funds and Large Cap Index Master Portfolio, Master Small Cap Index Series and U.S. Total Bond Index Master Portfolio. |
See notes to financial statements.
Financial Highlights (continued)
(For a share outstanding throughout each period)
| | | | | | | | | | | | | | | | |
| | | BlackRock LifePath Index 2060 Fund (continued) | |
| |
| | | Investor A | |
| | |
| | | Year Ended December 31, | | | Period from
02/29/16 (a)
to 12/31/16 | |
| | | 2019 | | | 2018 | | | 2017 | |
| | | | |
Net asset value, beginning of period | | $ | 12.17 | | | $ | 13.48 | | | $ | 11.35 | | | $ | 10.00 | |
| | | | | | | | | | | | | | | | |
Net investment income(b) | | | 0.37 | | | | 0.31 | | | | 0.36 | | | | 0.26 | |
Net realized and unrealized gain (loss) | | | 2.83 | | | | (1.38 | ) | | | 2.02 | | | | 1.26 | |
| | | | | | | | | | | | | | | | |
Net increase (decrease) from investment operations | | | 3.20 | | | | (1.07 | ) | | | 2.38 | | | | 1.52 | |
| | | | | | | | | | | | | | | | |
| | | | |
| Distributions(c) | | | | | | | | | | | | |
From net investment income | | | (0.34 | ) | | | (0.24 | ) | | | (0.25 | ) | | | (0.17 | ) |
From net realized gain | | | — | | | | — | | | | — | | | | (0.00 | )(d) |
From return of capital | | | — | | | | — | | | | — | | | | (0.00 | )(d) |
| | | | | | | | | | | | | | | | |
Total distributions | | | (0.34 | ) | | | (0.24 | ) | | | (0.25 | ) | | | (0.17 | ) |
| | | | | | | | | | | | | | | | |
| | | | |
Net asset value, end of period | | $ | 15.03 | | | $ | 12.17 | | | $ | 13.48 | | | $ | 11.35 | |
| | | | | | | | | | | | | | | | |
| |
Total Return(e) | | | | | |
Based on net asset value | | | 26.46 | % | | | (8.04 | )% | | | 21.06 | % | | | 15.24 | %(f) |
| | | | | | | | | | | | | | | | |
| |
Ratios to Average Net Assets(g)(h) | | | | | |
Total expenses | | | 0.57 | % | | | 0.61 | %(i) | | | 0.74 | % | | | 6.36 | %(j)(k) |
| | | | | | | | | | | | | | | | |
Total expenses after fees waived and/or reimbursed | | | 0.34 | % | | | 0.34 | %(i) | | | 0.34 | % | | | 0.34 | %(j) |
| | | | | | | | | | | | | | | | |
Net investment income | | | 2.66 | % | | | 2.29 | % | | | 2.85 | % | | | 2.85 | %(j) |
| | | | | | | | | | | | | | | | |
| |
Supplemental Data | | | | | |
Net assets, end of period (000) | | $ | 11,358 | | | $ | 4,371 | | | $ | 2,950 | | | $ | 386 | |
| | | | | | | | | | | | | | | | |
Portfolio turnover rate of the LifePath Index Master Portfolio(l) | | | 11 | % | | | 13 | % | | | 1 | % | | | 71 | % |
| | | | | | | | | | | | | | | | |
| (a) | Commencement of operations. |
| (b) | Based on average shares outstanding. |
| (c) | Distributions for annual periods determined in accordance with U.S. federal income tax regulations. |
| (d) | Amount is greater than $(0.005) per share. |
| (e) | Where applicable, assumes the reinvestment of distributions. |
| (f) | Aggregate total return. |
| (g) | Includes the LifePath Index Fund’s share of its corresponding LifePath Index Master Portfolio’s allocated net expenses and/or net investment income. |
| (h) | Includes the LifePath Index Fund’s share of its corresponding LifePath Index Master Portfolio’s allocated fees waived and expenses and/or net investment income. Excludes expenses incurred indirectly as a result of the LifePath Index Master Portfolio’s investments in underlying funds as follows: |
| | | | | | | | | | | | | | | | |
| | | Year Ended December 31, | | | Period from
02/29/16 (a)
to 12/31/16 | |
| | | 2019 | | | 2018 | | | 2017 | |
Allocated fees waived | | | 0.05 | % | | | 0.08 | % | | | 0.11 | % | | | 1.68 | % |
Investments in underlying funds | | | 0.05 | % | | | 0.06 | % | | | 0.07 | % | | | 0.12 | % |
| | | | | | | | | | | | | | | | |
| (i) | Includes offering, and board realignment and consolidation costs. Without these costs, total expenses and total expenses after fees waived and/or reimbursed would have been 0.58% and 0.34%, respectively. |
| (k) | Audit, Offering and Organization costs were not annualized in the calculation of the expense ratio. If these expenses were annualized, the total expenses would have been 7.39%. |
| (l) | Includes the LifePath Index Master Portfolio’s purchases and sales of the underlying funds and Large Cap Index Master Portfolio, Master Small Cap Index Series and U.S. Total Bond Index Master Portfolio. |
See notes to financial statements.
| | |
| 68 | | 2019 BLACKROCK ANNUAL REPORTTO SHAREHOLDERS |
Financial Highlights (continued)
(For a share outstanding throughout each period)
| | | | | | | | | | | | | | | | |
| | | BlackRock LifePath Index 2060 Fund (continued) | |
| |
| | | Class K | |
| | |
| | | Year Ended December 31, | | | Period from
02/29/16 (a)
to 12/31/16 | |
| | | 2019 | | | 2018 | | | 2017 | |
| | | | |
Net asset value, beginning of period | | $ | 12.19 | | | $ | 13.51 | | | $ | 11.36 | | | $ | 10.00 | |
| | | | | | | | | | | | | | | | |
Net investment income(b) | | | 0.42 | | | | 0.36 | | | | 0.41 | | | | 0.25 | |
Net realized and unrealized gain (loss) | | | 2.84 | | | | (1.40 | ) | | | 2.02 | | | | 1.30 | |
| | | | | | | | | | | | | | | | |
Net increase (decrease) from investment operations | | | 3.26 | | | | (1.04 | ) | | | 2.43 | | | | 1.55 | |
| | | | | | | | | | | | | | | | |
| | | | |
| Distributions(c) | | | | | | | | | | | | |
From net investment income | | | (0.38 | ) | | | (0.28 | ) | | | (0.28 | ) | | | (0.19 | ) |
From net realized gain | | | — | | | | — | | | | — | | | | (0.00 | )(d) |
From return of capital | | | — | | | | — | | | | — | | | | (0.00 | )(d) |
| | | | | | | | | | | | | | | | |
Total distributions | | | (0.38 | ) | | | (0.28 | ) | | | (0.28 | ) | | | (0.19 | ) |
| | | | | | | | | | | | | | | | |
| | | | |
Net asset value, end of period | | $ | 15.07 | | | $ | 12.19 | | | $ | 13.51 | | | $ | 11.36 | |
| | | | | | | | | | | | | | | | |
| |
Total Return(e) | | | | | |
Based on net asset value | | | 26.92 | % | | | (7.84 | )% | | | 21.51 | % | | | 15.54 | %(f) |
| | | | | | | | | | | | | | | | |
| |
Ratios to Average Net Assets(g)(h) | | | | | |
Total expenses | | | 0.15 | % | | | 0.24 | %(i) | | | 0.48 | % | | | 5.07 | %(j)(k) |
| | | | | | | | | | | | | | | | |
Total expenses after fees waived and/or reimbursed | | | 0.04 | % | | | 0.04 | %(i) | | | 0.04 | % | | | 0.04 | %(j) |
| | | | | | | | | | | | | | | | |
Net investment income | | | 2.98 | % | | | 2.71 | % | | | 3.20 | % | | | 2.72 | %(j) |
| | | | | | | | | | | | | | | | |
| |
Supplemental Data | | | | | |
Net assets, end of period (000) | | $ | 386,113 | | | $ | 150,118 | | | $ | 70,579 | | | $ | 10,233 | |
| | | | | | | | | | | | | | | | |
Portfolio turnover rate of the LifePath Index Master Portfolio(l) | | | 11 | % | | | 13 | % | | | 1 | % | | | 71 | % |
| | | | | | | | | | | | | | | | |
| (a) | Commencement of operations. |
| (b) | Based on average shares outstanding. |
| (c) | Distributions for annual periods determined in accordance with U.S. federal income tax regulations. |
| (d) | Amount is greater than $(0.005) per share. |
| (e) | Where applicable, assumes the reinvestment of distributions. |
| (f) | Aggregate total return. |
| (g) | Includes the LifePath Index Fund’s share of its corresponding LifePath Index Master Portfolio’s allocated net expenses and/or net investment income. |
| (h) | Includes the LifePath Index Fund’s share of its corresponding LifePath Index Master Portfolio’s allocated fees waived and expenses and/or net investment income. Excludes expenses incurred indirectly as a result of the LifePath Index Master Portfolio’s investments in underlying funds as follows: |
| | | | | | | | | | | | | | | | |
| | | Year Ended December 31, | | | Period from
02/29/16 (a)
to 12/31/16 | |
| | | 2019 | | | 2018 | | | 2017 | |
Allocated fees waived | | | 0.05 | % | | | 0.08 | % | | | 0.11 | % | | | 1.47 | % |
Investments in underlying funds | | | 0.05 | % | | | 0.06 | % | | | 0.07 | % | | | 0.12 | % |
| | | | | | | | | | | | | | | | |
| (i) | Includes offering, and board realignment and consolidation costs. Without these costs, total expenses and total expenses after fees waived and/or reimbursed would have been 0.21% and 0.04%, respectively. |
| (k) | Audit, Offering and Organization costs were not annualized in the calculation of the expense ratio. If these expenses were annualized, the total expenses would have been 5.94%. |
| (l) | Includes the LifePath Index Master Portfolio’s purchases and sales of the underlying funds and Large Cap Index Master Portfolio, Master Small Cap Index Series and U.S. Total Bond Index Master Portfolio. |
See notes to financial statements.
Financial Highlights (continued)
(For a share outstanding throughout each period)
| | | | | | | | |
| | | BlackRock LifePath Index
2060 Fund (continued) | |
| |
| | | Investor P | |
| | | Year Ended
December 31, 2019 | | | Period from 08/06/18 (a) to 12/31/18 | |
| | | |
Net asset value, beginning of period | | $ | 12.17 | | | $ | 13.81 | |
| | | | | | | | |
Net investment income(b) | | | 0.42 | | | | 0.15 | |
Net realized and unrealized gain (loss) | | | 2.79 | | | | (1.65 | ) |
| | | | | | | | |
Net increase (decrease) from investment operations | | | 3.21 | | | | (1.50 | ) |
| | | | | | | | |
Distributions from net investment income(c) | | | (0.35 | ) | | | (0.14 | ) |
| | | | | | | | |
| | |
Net asset value, end of period | | $ | 15.03 | | | $ | 12.17 | |
| | | | | | | | |
|
Total Return(d) | |
Based on net asset value | | | 26.51 | % | | | (10.92 | )%(e) |
| | | | | | | | |
|
Ratios to Average Net Assets(f)(g) | |
Total expenses | | | 0.65 | % | | | 0.47 | %(h)(i)(j) |
| | | | | | | | |
Total expenses after fees waived and/or reimbursed | | | 0.34 | % | | | 0.33 | %(h)(i)(j) |
| | | | | | | | |
Net investment income | | | 2.97 | % | | | 2.86 | %(h) |
| | | | | | | | |
|
Supplemental Data | |
Net assets, end of period (000) | | $ | 2,039 | | | $ | 259 | |
| | | | | | | | |
Portfolio turnover rate of the LifePath Index Master Portfolio(k) | | | 11 | % | | | 13 | % |
| | | | | | | | |
| (a) | Commencement of operations. |
| (b) | Based on average shares outstanding. |
| (c) | Distributions for annual periods determined in accordance with U.S. federal income tax regulations. |
| (d) | Where applicable, excludes the effects of any sales charges and assumes the reinvestment of distributions. |
| (e) | Aggregate total return. |
| (f) | Includes the LifePath Index Fund’s share of its corresponding LifePath Index Master Portfolio’s allocated net expenses and/or net investment income. |
| (g) | Includes the LifePath Index Fund’s share of its corresponding LifePath Index Master Portfolio’s allocated fees waived and expenses and/or net investment income. Excludes expenses incurred indirectly as a result of the LifePath Index Master Portfolio’s investments in underlying funds as follows: |
| | | | | | | | |
| | | Year Ended
December 31, 2019 | | | Period from
08/06/18 (a) to 12/31/18 | |
Allocated fees waived | | | 0.05 | % | | | 0.08 | % |
Investments in underlying funds | | | 0.05 | % | | | 0.06 | % |
| | | | | | | | |
| (i) | Offering costs, board realignment and consolidation costs were not annualized in the calculation of the expense ratios. If these expenses were annualized, the total expenses and total expenses after fees waived and/or reimbursed would have been 0.49% and 0.33%, respectively. |
| (j) | Includes offering, and board realignment and consolidation costs. Without these costs, total expenses and total expenses after fees waived and/or reimbursed would have been 0.46% and 0.33%, respectively. |
| (k) | Includes the LifePath Index Master Portfolio’s purchases and sales of the underlying funds and Large Cap Index Master Portfolio, Master Small Cap Index Series and U.S. Total Bond Index Master Portfolio. |
See notes to financial statements.
| | |
| 70 | | 2019 BLACKROCK ANNUAL REPORTTO SHAREHOLDERS |
Financial Highlights (continued)
(For a share outstanding throughout the period)
| | | | |
| | | BlackRock
LifePath Index
2065 Fund | |
| |
| | | Institutional | |
| | | Period from 10/30/19 (a) to 12/31/19 | |
| | |
Net asset value, beginning of period | | $ | 10.00 | |
| | | | |
Net investment income(b) | | | 0.11 | |
Net realized and unrealized gain | | | 0.46 | |
| | | | |
Net increase from investment operations | | | 0.57 | |
| | | | |
Distributions from net investment income(c) | | | (0.09 | ) |
| | | | |
| |
Net asset value, end of period | | $ | 10.48 | |
| | | | |
|
Total Return(d) | |
Based on net asset value | | | 5.71 | %(e) |
| | | | |
|
Ratios to Average Net Assets(f)(g) | |
Total expenses | | | 13.00 | %(h)(i) |
| | | | |
Total expenses after fees waived and/or reimbursed | | | 0.11 | %(h) |
| | | | |
Net investment income | | | 6.26 | %(h) |
| | | | |
|
Supplemental Data | |
Net assets, end of period (000) | | $ | 52 | |
| | | | |
Portfolio turnover rate of the LifePath Index Master Portfolio(j) | | | 1 | % |
| | | | |
| (a) | Commencement of operations. |
| (b) | Based on average shares outstanding. |
| (c) | Distributions for annual periods determined in accordance with U.S. federal income tax regulations. |
| (d) | Where applicable, assumes the reinvestment of distributions. |
| (e) | Aggregate total return. |
| (f) | Includes the LifePath Index Fund’s share of its corresponding LifePath Index Master Portfolio’s allocated net expenses and/or net investment income. |
| (g) | Includes the LifePath Index Fund’s share of its corresponding LifePath Index Master Portfolio’s allocated fees waived and expenses and/or net investment income of 6.58%. Excludes expenses incurred indirectly as a result of the LifePath Index Master Portfolio’s investments in underlying funds of 0.11%. |
| (i) | Audit, offering and organization costs were not annualized in the calculation of expense ratios. If these expenses were annualized, the total expenses would have been 44.41%. |
| (j) | Includes the LifePath Index Master Portfolio’s purchases and sales of the underlying funds and Large Cap Index Master Portfolio, Master Small Cap Index Series and U.S. Total Bond Index Master Portfolio. |
See notes to financial statements.
Financial Highlights (continued)
(For a share outstanding throughout the period)
| | | | |
| | | BlackRock
LifePath Index
2065 Fund (continued) | |
| |
| | | Investor A | |
| | | Period from 10/30/19 (a) to 12/31/19 | |
| | |
Net asset value, beginning of period | | $ | 10.00 | |
| | | | |
Net investment income(b) | | | 0.11 | |
Net realized and unrealized gain | | | 0.46 | |
| | | | |
Net increase from investment operations | | | 0.57 | |
| | | | |
Distributions from net investment income(c) | | | (0.09 | ) |
| | | | |
| |
Net asset value, end of period | | $ | 10.48 | |
| | | | |
|
Total Return(d) | |
Based on net asset value | | | 5.67 | %(e) |
| | | | |
|
Ratios to Average Net Assets(f)(g) | |
Total expenses | | | 13.24 | %(h)(i) |
| | | | |
Total expenses after fees waived and/or reimbursed | | | 0.36 | %(h) |
| | | | |
Net investment income | | | 6.03 | %(h) |
| | | | |
|
Supplemental Data | |
Net assets, end of period (000) | | $ | 53 | |
| | | | |
Portfolio turnover rate of the LifePath Index Master Portfolio(j) | | | 1 | % |
| | | | |
| (a) | Commencement of operations. |
| (b) | Based on average shares outstanding. |
| (c) | Distributions for annual periods determined in accordance with U.S. federal income tax regulations. |
| (d) | Where applicable, assumes the reinvestment of distributions. |
| (e) | Aggregate total return. |
| (f) | Includes the LifePath Index Fund’s share of its corresponding LifePath Index Master Portfolio’s allocated net expenses and/or net investment income. |
| (g) | Includes the LifePath Index Fund’s share of its corresponding LifePath Index Master Portfolio’s allocated fees waived and expenses and/or net investment income of 6.58%. Excludes expenses incurred indirectly as a result of the LifePath Index Master Portfolio’s investments in underlying funds of 0.11%. |
| (i) | Audit, offering and organization costs were not annualized in the calculation of expense ratios. If these expenses were annualized, the total expenses would have been 44.60%. |
| (j) | Includes the LifePath Index Master Portfolio’s purchases and sales of the underlying funds and Large Cap Index Master Portfolio, Master Small Cap Index Series and U.S. Total Bond Index Master Portfolio. |
See notes to financial statements.
| | |
| 72 | | 2019 BLACKROCK ANNUAL REPORTTO SHAREHOLDERS |
Financial Highlights (continued)
(For a share outstanding throughout the period)
| | | | |
| | | BlackRock
LifePath Index
2065 Fund (continued) | |
| |
| | | Class K | |
| | | Period from
10/30/19 (a) to 12/31/19 | |
| | |
Net asset value, beginning of period | | $ | 10.00 | |
| | | | |
Net investment income(b) | | | 0.12 | |
Net realized and unrealized gain | | | 0.45 | |
| | | | |
Net increase from investment operations | | | 0.57 | |
| | | | |
Distributions from net investment income(c) | | | (0.09 | ) |
| | | | |
| |
Net asset value, end of period | | $ | 10.48 | |
| | | | |
|
Total Return(d) | |
Based on net asset value | | | 5.72 | %(e) |
| | | | |
|
Ratios to Average Net Assets(f)(g) | |
Total expenses | | | 11.12 | %(h)(i) |
| | | | |
Total expenses after fees waived and/or reimbursed | | | 0.06 | %(h) |
| | | | |
Net investment income | | | 7.08 | %(h) |
| | | | |
|
Supplemental Data | |
Net assets, end of period (000) | | $ | 1,940 | |
| | | | |
Portfolio turnover rate of the LifePath Index Master Portfolio(j) | | | 1 | % |
| | | | |
| (a) | Commencement of operations. |
| (b) | Based on average shares outstanding. |
| (c) | Distributions for annual periods determined in accordance with U.S. federal income tax regulations. |
| (d) | Where applicable, assumes the reinvestment of distributions. |
| (e) | Aggregate total return. |
| (f) | Includes the LifePath Index Fund’s share of its corresponding LifePath Index Master Portfolio’s allocated net expenses and/or net investment income. |
| (g) | Includes the LifePath Index Fund’s share of its corresponding LifePath Index Master Portfolio’s allocated fees waived and expenses and/or net investment income of 6.58%. Excludes expenses incurred indirectly as a result of the LifePath Index Master Portfolio’s investments in underlying funds of 0.11%. |
| (i) | Audit, offering and organization costs were not annualized in the calculation of expense ratios. If these expenses were annualized, the total expenses would have been 35.79%. |
| (j) | Includes the LifePath Index Master Portfolio’s purchases and sales of the underlying funds and Large Cap Index Master Portfolio, Master Small Cap Index Series, and U.S. Total Bond Index Master Portfolio. |
See notes to financial statements.
Financial Highlights (continued)
(For a share outstanding throughout the period)
| | | | |
| | | BlackRock
LifePath Index
2065 Fund (continued) | |
| |
| | | Investor P | |
| | | Period from 10/30/19 (a) to 12/31/19 | |
| | |
Net asset value, beginning of period | | $ | 10.00 | |
| | | | |
Net investment income(b) | | | 0.11 | |
Net realized and unrealized gain | | | 0.46 | |
| | | | |
Net increase from investment operations | | | 0.57 | |
| | | | |
Distributions from net investment income(c) | | | (0.09 | ) |
| | | | |
| |
Net asset value, end of period | | $ | 10.48 | |
| | | | |
|
Total Return(d) | |
Based on net asset value | | | 5.67 | %(e) |
| | | | |
|
Ratios to Average Net Assets(f)(g) | |
Total expenses | | | 13.25 | %(h)(i) |
| | | | |
Total expenses after fees waived and/or reimbursed | | | 0.36 | %(h) |
| | | | |
Net investment income | | | 6.01 | %(h) |
| | | | |
|
Supplemental Data | |
Net assets, end of period (000) | | $ | 52 | |
| | | | |
Portfolio turnover rate of the LifePath Index Master Portfolio(j) | | | 1 | % |
| | | | |
| (a) | Commencement of operations. |
| (b) | Based on average shares outstanding. |
| (c) | Distributions for annual periods determined in accordance with U.S. federal income tax regulations. |
| (d) | Where applicable, excludes the effects of any sales charges and assumes the reinvestment of distributions. |
| (e) | Aggregate total return. |
| (f) | Includes the LifePath Index Fund’s share of its corresponding LifePath Index Master Portfolio’s allocated net expenses and/or net investment income. |
| (g) | Includes the LifePath Index Fund’s share of its corresponding LifePath Index Master Portfolio’s allocated fees waived and expenses and/or net investment income of 6.58%. Excludes expenses incurred indirectly as a result of the LifePath Index Master Portfolio’s investments in underlying funds of 0.11%. |
| (i) | Audit, offering and organization costs were not annualized in the calculation of expense ratios. If these expenses were annualized, the total expenses would have been 44.67%. |
| (i) | Includes the LifePath Index Master Portfolio’s purchases and sales of the underlying funds and Large Cap Index Master Portfolio, Master Small Cap Index Series, and U.S. Total Bond Index Master Portfolio. |
See notes to financial statements.
| | |
| 74 | | 2019 BLACKROCK ANNUAL REPORTTO SHAREHOLDERS |
Notes to Financial Statements
BlackRock Funds III (the “Trust”) is registered under the Investment Company Act of 1940, as amended (the “1940 Act”), as anopen-end management investment company. The Trust is organized as a Delaware statutory trust. The following series of the Trust are referred to herein collectively as the “LifePath Index Funds” or individually, as a “LifePath Index Fund”:
| | | | |
| LifePath Index Fund Name | | Herein Referred To As | | Diversification Classification |
BlackRock LifePath® Index Retirement Fund | | LifePath Index Retirement Fund | | Diversified |
BlackRock LifePath® Index 2025 Fund | | LifePath Index 2025 Fund | | Diversified |
BlackRock LifePath® Index 2030 Fund | | LifePath Index 2030 Fund | | Diversified |
BlackRock LifePath® Index 2035 Fund | | LifePath Index 2035 Fund | | Diversified |
BlackRock LifePath® Index 2040 Fund | | LifePath Index 2040 Fund | | Diversified |
BlackRock LifePath® Index 2045 Fund | | LifePath Index 2045 Fund | | Diversified |
BlackRock LifePath® Index 2050 Fund | | LifePath Index 2050 Fund | | Diversified |
BlackRock LifePath® Index 2055 Fund | | LifePath Index 2055 Fund | | Diversified |
BlackRock LifePath® Index 2060 Fund | | LifePath Index 2060 Fund | | Diversified |
BlackRock LifePath® Index 2065 Fund | | LifePath Index 2065 Fund | | Diversified |
Each LifePath Index Fund seeks to achieve its investment objective by investing all of its assets in a corresponding series of Master Investment Portfolio (“MIP”): LifePath Index Retirement Master Portfolio, LifePath Index 2025 Master Portfolio, LifePath Index 2030 Master Portfolio, LifePath Index 2035 Master Portfolio, LifePath Index 2040 Master Portfolio, LifePath Index 2045 Master Portfolio, LifePath Index 2050 Master Portfolio, LifePath Index 2055 Master Portfolio, LifePath Index 2060 Master Portfolio and LifePath Index 2065 Master Portfolio (each, a “LifePath Index Master Portfolio” and together, the “LifePath Index Master Portfolios”). MIP is an affiliate of the Trust. Each LifePath Index Master Portfolio has the same investment objective and strategies as its corresponding LifePath Index Fund. The value of each LifePath Index Fund’s investment in its corresponding LifePath Index Master Portfolio reflects the LifePath Index Fund’s proportionate interest in the net assets of the LifePath Index Master Portfolio. The performance of each LifePath Index Fund is directly affected by the performance of the LifePath Index Master Portfolios. At December 31, 2019, the percentage of each LifePath Index Master Portfolio owned by the corresponding LifePath Index Fund was approximately 100%. The financial statements of the LifePath Index Master Portfolios, including the Schedules of Investments, are included elsewhere in this report and should be read in conjunction with the LifePath Index Funds’ financial statements.
Each LifePath Index Fund offers multiple classes of shares. All classes of shares have identical voting, dividend, liquidation and other rights and are subject to the same terms and conditions, except that certain classes bear expenses related to the shareholder servicing and distribution of such shares. Institutional and Class K Shares are sold only to certain eligible investors. Investor A Shares are generally available through financial intermediaries. Investor P Shares are only available through registered representatives of an insurance company’s broker-dealer that has entered into an agreement with the LifePath Index Funds’ distributor to offer such shares. Each class has exclusive voting rights with respect to matters relating to its shareholder servicing and distribution expenditures. The Board of Trustees of the Trust and Board of Trustees of MIP are referred to throughout this report as the “Board of Trustees” or the “Board” and the members are referred to as “Trustees.”
| | | | | | | | |
| Share Class | | Initial Sales Charge | | CDSC | | | Conversion Privilege |
Institutional, Investor A and Class K Shares | | No | | | No | | | None |
Investor P Shares | | Yes | | | No | (a) | | None |
| | (a) | Investor P Shares may be subject to a contingent deferred sales charge (“CDSC”) for certain redemptions where no initial sales charge was paid at the time of purchase. | |
The LifePath Index Funds, together with certain other registered investment companies advised by BlackRock Fund Advisors (“BFA” or the “Manager”) or its affiliates, are included in a complex of equity, multi-asset, index and money market funds referred to as the BlackRock Multi-Asset Complex.
On November 12-13, 2019, the Board approved a proposal pursuant to which each LifePath Index Fund will cease to invest in its corresponding LifePath Index Master Portfolio as part of a “master-feeder” structure and instead operate as a stand-alone fund. In connection with this change, the Trust, on behalf of each LifePath Index Fund, will enter into a management agreement with BFA, the terms of which will be substantially the same as the current management agreement between BFA and each corresponding LifePath Index Master Portfolio, including the management fee rate. The change into a stand-alone structure will not create a taxable event for the LifePath Index Funds or their shareholders. These changes are expected to be effective on or about March 2, 2020.
Reorganization: The Board of the Trust approved the reorganization of BlackRock LifePath® Index 2020 Fund (the “Target Fund” or “LifePath Index 2020 Fund”) into the LifePath Index Retirement Fund. As a result, the LifePath Index Retirement Fund acquired substantially all of the assets and assumed substantially all of the liabilities of the Target Fund in exchange for an equal aggregate value of newly-issued shares of the LifePath Index Retirement Fund.
Each shareholder of the Target Fund received shares of LifePath Index Retirement Fund in an amount equal to the aggregate net asset value (“NAV”) of such shareholder’s Target Fund shares, as determined at the close of business on November 18, 2019, less the costs of the Target Fund’s reorganization.
| | | | |
| NOTESTO FINANCIAL STATEMENTS | | | 75 | |
Notes to Financial Statements (continued)
The reorganization was accomplished by atax-free exchange of shares of the LifePath Index Retirement Fund in the following amounts and at the following conversion ratios:
| | | | | | | | |
| Target Fund’s Share Class | | Shares Prior to Reorganization | | Conversion Ratio | | LifePath Index Retirement Fund’s Share Class | | Shares of the LifePath Index
Retirement Fund |
Institutional | | 26,942,429 | | 1.02588801 | | Institutional | | 27,639,915 |
Investor A | | 14,520,233 | | 1.02558282 | | Investor A | | 14,891,702 |
Class K | | 179,822,190 | | 1.02628034 | | Class K | | 184,547,978 |
Investor P | | 122,228,795 | | 1.02502346 | | Investor P | | 125,287,382 |
The Target Fund’s net assets and composition of net assets on November 15, 2019, the valuation date of the reorganization were as follows:
| | | | |
| | | Target Fund | |
Net assets | | $ | 4,549,202,345 | |
Paid-in-capital | | | 4,027,750,180 | |
Accumulated earnings | | | 521,452,165 | |
For financial reporting purposes, assets received and shares issued by the LifePath Index Retirement Fund were recorded at fair value. However, the cost basis of the investments received from the Target Fund was carried forward to align ongoing reporting of the LifePath Index Retirement Fund’s realized and unrealized gains and losses with amounts distributable to shareholders for tax purposes.
The net assets of the LifePath Index Retirement Fund before the reorganization were $3,191,903,085. The aggregate net assets of the LifePath Index Retirement Fund immediately after the reorganization amounted to $7,741,105,430. The Target Fund’s fair value prior to the reorganization was as follows:
| | |
| Target Fund | | Fair Value of Investments |
LifePath® Index 2020 Fund | | $4,549,563,254 |
The purpose of these transactions was to combine two funds managed by the Manager with substantially similar (but not identical) investment objectives, investment policies, strategies, risks and restrictions. The reorganization was atax-free event and was effective on November 18, 2019.
Assuming the reorganization had been completed on January 1, 2019, the beginning of the fiscal reporting period of LifePath Index Retirement Fund, the pro forma results of operations for the year ended December 31, 2019, are as follows:
| | • | | Net investment income: $182,805,060 |
| | • | | Net realized and change in unrealized gain on investments: $281,951,966 |
| | • | | Net increase in net assets resulting from operations: $464,757,026 |
Because the combined investment portfolios have been managed as a single integrated portfolio since the reorganization was completed, it is not practicable to separate the amounts of revenue and earnings of the Target Fund that have been included in the LifePath Index Retirement Fund’s Statement of Operations since November 18, 2019.
Reorganization costs incurred by the LifePath Index Retirement Fund in connection with the reorganization were expensed by the LifePath Index Retirement Fund. The Manager reimbursed the Fund $20,750, which is included in fees waived and/or reimbursed by the Manager in the LifePath Index Retirement Fund’s Statement of Operations.
Prior Year Reorganization: The Board of Trustees of the Trust and the Board of Trustees of State Farm Mutual Fund Trust and shareholders of State Farm LifePath Retirement Fund, State Farm LifePath 2020 Fund, State Farm LifePath 2030 Fund, State Farm LifePath 2040 Fund and State Farm LifePath 2050 Fund (individually, a “State Farm Target Fund” and collectively the “State Farm Target Funds”) approved the reorganization of the State Farm Target Funds with and into LifePath Index Retirement Fund, LifePath Index 2020 Fund, LifePath Index 2030 Fund, LifePath Index 2040 Fund and LifePath Index 2050 Fund, respectively. As a result, the applicable LifePath Index Funds acquired substantially all of the assets and assumed certain stated liabilities of the State Farm Target Funds in exchange for an equal aggregate value of newly-issued shares of the LifePath Index Funds.
Each shareholder of the State Farm Target Funds received shares of the LifePath Index Funds in an amount equal to the aggregate NAV of the shareholder’s State Farm Target Funds shares, as determined at the close of business on November 16, 2018.
On November 19, 2018, all of the portfolio securities previously held by the Target Funds were subsequently contributed by the LifePath Index Funds to the LifePath Index Master Portfolios in exchange for investments in the LifePath Index Master Portfolios.
| | |
| 76 | | 2019 BLACKROCK ANNUAL REPORTTO SHAREHOLDERS |
Notes to Financial Statements (continued)
The reorganizations were accomplished by atax-free exchange of shares of the LifePath Index Funds in the following amounts and at the following conversion ratio:
State Farm LifePath Retirement Fund
| | | | | | | | |
| State Farm Target Fund’s Share Class | | Shares Prior to Reorganization | | Conversion Ratio | | LifePath Index Retirement Fund’s
Share Class | | Shares of the LifePath Index
Retirement Fund |
Premier | | 779,297 | | 1.00563378 | | Investor A | | 783,687 |
Premier | | 52,379,511 | | 1.00612667 | | Investor P | | 52,700,423 |
Legacy Class B | | 21,805 | | 1.01323558 | | Investor A | | 22,093 |
Legacy Class B | | 122,854 | | 1.01373220 | | Investor P | | 124,541 |
Class A | | 870,727 | | 0.98041269 | | Investor A | | 853,672 |
Class A | | 25,106,506 | | 0.98089323 | | Investor P | | 24,626,801 |
Class B | | 19,454 | | 0.98735567 | | Investor A | | 19,208 |
Class B | | 334,773 | | 0.98783961 | | Investor P | | 330,702 |
Institutional | | 8,459,799 | | 1.00443698 | | Institutional | | 8,497,335 |
Class R-1 | | 386,582 | | 0.98491571 | | Investor P | | 380,751 |
Class R-2 | | 1,598,778 | | 1.00979423 | | Investor P | | 1,614,436 |
Class R-3 | | 157,853 | | 1.00287645 | | Institutional | | 158,307 |
State Farm LifePath 2020 Fund
| | | | | | | | |
| State Farm Target Fund’s Share Class | | Shares Prior to Reorganization | | Conversion Ratio | | LifePath Index 2020 Fund’s Share Class | | Shares of the LifePath Index
2020 Fund |
Premier | | 1,089,621 | | 1.04280016 | | Investor A | | 1,136,257 |
Premier | | 69,198,769 | | 1.04377724 | | Investor P | | 72,228,100 |
Legacy Class B | | 99,350 | | 1.05716728 | | Investor A | | 105,030 |
Legacy Class B | | 314,164 | | 1.05815782 | | Investor P | | 332,435 |
Class A | | 3,195,046 | | 1.04962963 | | Investor A | | 3,353,615 |
Class A | | 50,996,934 | | 1.05061311 | | Investor P | | 53,578,047 |
Class B | | 104,214 | | 1.04435490 | | Investor A | | 108,836 |
Class B | | 905,035 | | 1.04533344 | | Investor P | | 946,063 |
Institutional | | 15,206,381 | | 1.05023844 | | Institutional | | 15,970,326 |
Class R-1 | | 1,065,335 | | 1.04461645 | | Investor P | | 1,112,866 |
Class R-2 | | 4,148,490 | | 1.04396464 | | Investor P | | 4,330,877 |
Class R-3 | | 242,995 | | 1.04745193 | | Institutional | | 254,526 |
State Farm LifePath 2030 Fund
| | | | | | | | |
| State Farm Target Fund’s Share Class | | Shares Prior to Reorganization | | Conversion Ratio | | LifePath Index 2030 Fund’s Share Class | | Shares of the LifePath Index
2030 Fund |
Premier | | 1,292,201 | | 1.01620709 | | Investor A | | 1,313,144 |
Premier | | 64,548,099 | | 1.01650733 | | Investor P | | 65,613,615 |
Legacy Class B | | 36,198 | | 1.02564355 | | Investor A | | 37,126 |
Legacy Class B | | 392,913 | | 1.02594658 | | Investor P | | 403,107 |
Class A | | 2,337,082 | | 1.01578298 | | Investor A | | 2,373,968 |
Class A | | 67,710,975 | | 1.01608309 | | Investor P | | 68,799,976 |
Class B | | 111,011 | | 1.01232950 | | Investor A | | 112,380 |
Class B | | 1,345,220 | | 1.01262860 | | Investor P | | 1,362,208 |
Institutional | | 20,857,879 | | 1.02302034 | | Institutional | | 21,338,035 |
Class R-1 | | 2,171,558 | | 1.00878017 | | Investor P | | 2,190,625 |
Class R-2 | | 4,992,512 | | 1.01264375 | | Investor P | | 5,055,636 |
Class R-3 | | 395,754 | | 1.02375439 | | Institutional | | 405,154 |
| | | | |
| NOTESTO FINANCIAL STATEMENTS | | | 77 | |
Notes to Financial Statements (continued)
State Farm LifePath 2040 Fund
| | | | | | | | |
| State Farm Target Fund’s Share Class | | Shares Prior to Reorganization | | Conversion Ratio | | LifePath Index 2040 Fund’s Share Class | | Shares of the LifePath Index
2040 Fund |
Premier | | 503,507 | | 0.99754805 | | Investor A | | 502,273 |
Premier | | 32,457,845 | | 0.99790577 | | Investor P | | 32,389,871 |
Legacy Class B | | 10,852 | | 1.00731999 | | Investor A | | 10,932 |
Legacy Class B | | 411,824 | | 1.00768122 | | Investor P | | 414,987 |
Class A | | 1,053,459 | | 0.99234304 | | Investor A | | 1,045,393 |
Class A | | 58,493,196 | | 0.99269890 | | Investor P | | 58,066,131 |
Class B | | 47,916 | | 0.98908812 | | Investor A | | 47,393 |
Class B | | 1,475,217 | | 0.98944281 | | Investor P | | 1,459,643 |
Institutional | | 26,199,385 | | 1.00206025 | | Institutional | | 26,253,363 |
Class R-1 | | 1,580,103 | | 0.98767849 | | Investor P | | 1,560,634 |
Class R-2 | | 4,352,563 | | 0.99156572 | | Investor P | | 4,315,853 |
Class R-3 | | 562,789 | | 1.01598838 | | Institutional | | 571,787 |
State Farm LifePath 2050 Fund
| | | | | | | | |
| State Farm Target Fund’s Share Class | | Shares Prior to Reorganization | | Conversion Ratio | | LifePath Index 2050 Fund’s Share Class | | Shares of the LifePath Index
2050 Fund |
Premier | | 288,189 | | 0.65640189 | | Investor A | | 189,168 |
Premier | | 11,161,450 | | 0.65671837 | | Investor P | | 7,329,929 |
Class A | | 424,597 | | 0.65849477 | | Investor A | | 279,595 |
Class A | | 30,151,051 | | 0.65881227 | | Investor P | | 19,863,883 |
Class R-1 | | 835,592 | | 0.66080284 | | Investor P | | 552,162 |
Class R-2 | | 1,882,093 | | 0.66132632 | | Investor P | | 1,244,678 |
The State Farm Target Funds’ net assets and composition of net assets on November 16, 2018, the valuation date of the reorganization were as follows:
| | | | | | | | | | | | | | | | | | | | |
| | | State Farm
LifePath
Retirement Fund | | | State Farm
LifePath
2020 Fund | | | State Farm
LifePath
2030 Fund | | | State Farm
LifePath
2040 Fund | | | State Farm
LifePath
2050 Fund | |
Net assets | | $ | 1,066,536,384 | | | $ | 1,884,086,385 | | | $ | 2,231,224,745 | | | $ | 1,766,697,146 | | | $ | 427,707,810 | |
Paid-in-capital | | | 1,071,750,687 | | | | 1,890,349,104 | | | | 2,242,979,193 | | | | 1,778,456,627 | | | | 430,778,842 | |
Accumulated loss | | | (5,214,303 | ) | | | (6,262,719 | ) | | | (11,754,448) | | | | (11,759,481 | ) | | | (3,071,032 | ) |
For financial reporting purposes, assets received and shares issued by the LifePath Index Funds were recorded at fair value. However, the cost basis of the investments received from the State Farm Target Funds was carried forward to align ongoing reporting of the LifePath Index Funds’ realized and unrealized gains and losses with amounts distributable to shareholders for tax purposes.
The net assets of the LifePath Index Funds before the acquisitions and the aggregate net assets of the LifePath Index Funds immediately after the acquisitions were as follows:
| | | | | | | | |
| Fund | | Net Assets Before
the Acquisitions | | | Aggregate Net Assets
After the Acquisitions | |
LifePath Index Retirement Fund | | $ | 1,319,095,939 | | | $ | 2,385,632,322 | |
LifePath Index 2020 Fund | | | 2,572,859,383 | | | | 4,456,945,768 | |
LifePath Index 2030 Fund | | | 3,709,866,268 | | | | 5,941,091,013 | |
LifePath Index 2040 Fund | | | 2,833,724,125 | | | | 4,600,421,271 | |
LifePath Index 2050 Fund | | | 1,630,431,407 | | | | 2,058,139,217 | |
The State Farm Target Funds’ fair value and cost of investments prior to the reorganizations were as follows:
| | | | | | | | |
| State Farm Target Fund | | Fair Value
of Investments | | | Cost of Investments | |
State Farm LifePath Retirement Fund | | $ | 1,060,853,760 | | | $ | 1,064,814,227 | |
State Farm LifePath 2020 Fund | | | 1,876,177,923 | | | | 1,879,869,831 | |
State Farm LifePath 2030 Fund | | | 2,221,557,497 | | | | 2,227,161,576 | |
State Farm LifePath 2040 Fund | | | 1,751,947,113 | | | | 1,757,351,755 | |
State Farm LifePath 2050 Fund | | | 427,090,360 | | | | 428,381,738 | |
| | |
| 78 | | 2019 BLACKROCK ANNUAL REPORTTO SHAREHOLDERS |
Notes to Financial Statements (continued)
The purpose of the transaction was to combine the assets of the State Farm Target Funds with the assets of the LifePath Index Funds. The reorganization was atax-free event and closed on November 19, 2018.
Assuming the acquisitions had been completed on January 1, 2018, the beginning of the fiscal reporting period of the LifePath Index Funds, the pro forma results of operations for the year ended December 31, 2018, are as follows:
| | | | | | | | | | | | |
| State Farm Target Fund | | Net Investment
Income (Loss) | | | Net Realized and Change
in Unrealized Gain (Loss)
on Investments | | | Net Increase (Decrease)
in Net Assets resulting
from Operations | |
LifePath Index Retirement Fund | | $ | 52,949,483 | | | $ | 59,361,115 | | | $ | 112,310,597 | |
LifePath Index 2020 Fund | | | 98,774,694 | | | | (280,681,649 | ) | | | (181,906,955 | ) |
LifePath Index 2030 Fund | | | 100,291,822 | | | | (432,912,063 | ) | | | (332,620,240 | ) |
LifePath Index 2040 Fund | | | 101,453,171 | | | | (440,934,033 | ) | | | (339,480,861 | ) |
LifePath Index 2050 Fund | | | 46,987,477 | | | | (218,506,855 | ) | | | (171,519,379 | ) |
Because the combined investment portfolios have been managed as single integrated portfolios since the reorganizations were completed, it is not practicable to separate the amounts of revenue and earnings of the State Farm Target Funds that have been included in the LifePath Index Funds’ Statements of Operations since November 19, 2018.
| 2. | SIGNIFICANT ACCOUNTING POLICIES |
The financial statements are prepared in conformity with accounting principles generally accepted in the United States of America (“U.S. GAAP”), which may require management to make estimates and assumptions that affect the reported amounts of assets and liabilities in the financial statements, disclosure of contingent assets and liabilities at the date of the financial statements and the reported amounts of increases and decreases in net assets from operations during the reporting period. Actual results could differ from those estimates. Each LifePath Index Fund is considered an investment company under U.S. GAAP and follows the accounting and reporting guidance applicable to investment companies. Below is a summary of significant accounting policies:
Investment Transactions and Income Recognition: For financial reporting purposes, contributions to and withdrawals from each LifePath Index Master Portfolio are accounted for on a trade date basis. Each LifePath Index Fund records its proportionate share of its LifePath Index Master Portfolio’s income, expenses and realized and unrealized gains and losses on a daily basis. Realized and unrealized gains and losses are adjusted utilizing partnership tax allocation rules. In addition, the LifePath Index Funds accrue their own expenses. Income, expenses and realized and unrealized gains and losses are allocated daily to each class based on its relative net assets.
Distributions: Distributions from net investment income are declared and paid quarterly. Distributions of capital gains are recorded on theex-dividend date and made at least annually. The portion of distributions, if any, that exceeds a LifePath Index Fund’s current and accumulated earnings and profits, as measured on a tax basis, constitute anon-taxable return of capital. The character and timing of distributions are determined in accordance with U.S. federal income tax regulations, which may differ from U.S. GAAP.
Organization and Offering Costs: Upon commencement of operations, organization costs associated with the establishment of LifePath Index 2065 Fund were expensed by LifePath Index 2065 Fund and reimbursed by the Manager. The Manager reimbursed LifePath Index 2065 Fund $62,074, which is included in fees waived and/or reimbursed by the Administrator/Manager in the Statements of Operations. Offering costs are amortized over a 12-month period beginning with the commencement of operations of a class of shares.
Indemnifications:In the normal course of business, a LifePath Index Fund enters into contracts that contain a variety of representations that provide general indemnification. A LifePath Index Fund’s maximum exposure under these arrangements is unknown because it involves future potential claims against a LifePath Index Fund, which cannot be predicted with any certainty.
Other: Expenses directly related to a LifePath Index Fund or its classes are charged to that LifePath Index Fund or the applicable class. Other operating expenses shared by several funds, including other funds managed by the Manager, are prorated among those funds on the basis of relative net assets or other appropriate methods. Expenses directly related to the LifePath Index Funds and other shared expenses prorated to the LifePath Index Funds are allocated daily to each class based on their relative net assets or other appropriate methods.
| 3. | INVESTMENT VALUATION AND FAIR VALUE MEASUREMENTS |
Investment Valuation Policies: Each LifePath Index Funds’ policy is to value its financial instruments at fair value. Each LifePath Index Fund records its investment in the LifePath Index Master Portfolio at fair value based on each LifePath Index Fund’s proportionate interest in the net assets of its corresponding LifePath Index Master Portfolio. Valuation of securities held by the LifePath Index Master Portfolios is discussed in Note 3 of the LifePath Index Master Portfolios’ Notes to Financial Statements, which are included elsewhere in this report.
| | | | |
| NOTESTO FINANCIAL STATEMENTS | | | 79 | |
Notes to Financial Statements (continued)
| 4. | ADMINISTRATION AGREEMENT AND OTHER TRANSACTIONS WITH AFFILIATES |
Administration: The Trust, on behalf of the LifePath Index Funds, entered into an Administration Agreement with BlackRock Advisors, LLC (“BAL” or the “Administrator”), an indirect, wholly-owned subsidiary of BlackRock, Inc. (“BlackRock”), to provide general administrative services (other than investment advice and related portfolio activities). For such services, the LifePath Index Funds pay BAL a monthly fee at an annual rate of 0.03% of the average daily net assets of each LifePath Index Fund.
Service Fees:The Trust, on behalf of the LifePath Index Funds, entered into a Distribution Agreement and a Distribution and Service Plan with BlackRock Investments, LLC (“BRIL”), an affiliate of the Administrator. Pursuant to the Distribution and Service Plan and in accordance with Rule12b-1 under the 1940 Act, each LifePath Index Fund pays BRIL ongoing service fees. The fees are accrued daily and paid monthly at the annual rate of 0.25% based upon the average daily net assets of the each LifePath Index Fund’s Investor A and Investor P Shares.
BRIL and broker-dealers, pursuant tosub-agreements with BRIL, provide shareholder servicing services to the LifePath Index Funds. The ongoing service and/or distribution fee compensates BRIL and each broker-dealer for providing shareholder servicing and/or distribution related services to shareholders.
For the year ended December 31, 2019, the following table shows the class specific service fees borne directly by each share class of each LifePath Index Fund:
| | | | | | | | | | | | |
| Service Fees | | Investor A | | | Investor P | | | Total | |
LifePath Index Retirement Fund | | $ | 294,104 | | | $ | 2,820,556 | | | $ | 3,114,660 | |
LifePath Index 2025 Fund | | | 362,233 | | | | 40,516 | | | | 402,749 | |
LifePath Index 2030 Fund | | | 802,212 | | | | 4,808,438 | | | | 5,610,650 | |
LifePath Index 2035 Fund | | | 342,588 | | | | 13,695 | | | | 356,283 | |
LifePath Index 2040 Fund | | | 524,860 | | | | 3,524,301 | | | | 4,049,161 | |
LifePath Index 2045 Fund | | | 233,920 | | | | 4,315 | | | | 238,235 | |
LifePath Index 2050 Fund | | | 277,329 | | | | 1,096,155 | | | | 1,373,484 | |
LifePath Index 2055 Fund | | | 152,964 | | | | 2,221 | | | | 155,185 | |
LifePath Index 2060 Fund | | | 19,365 | | | | 2,532 | | | | 21,897 | |
LifePath Index 2065 Fund | | | 22 | | | | 22 | | | | 44 | |
Transfer Agent:Pursuant to written agreements, certain financial intermediaries, some of which may be affiliates, provide the LifePath Index Funds withsub-accounting, recordkeeping,sub-transfer agency and other administrative services with respect to servicing of underlying investor accounts. For these services, these entities receive an asset-based fee or an annual fee per shareholder account, which will vary depending on share class and/or net assets. For the year ended December 31, 2019, the LifePath Index Funds did not pay any amounts to affiliates in return for these services.
The Administrator maintains a call center that is responsible for providing certain shareholder services to the LifePath Index Funds. Shareholder services include responding to inquiries and processing purchases and sales based upon instructions from shareholders. For the year ended December 31, 2019, each LifePath Index Fund reimbursed the Administrator the following amounts for costs incurred in running the call center, which are included in transfer agent — class specific in the Statements of Operations:
| | | | | | | | | | | | | | | | | | | | |
| | | Institutional | | | Investor A | | | Class K | | | Investor P | | | Total | |
LifePath Index Retirement Fund | | $ | 1,884 | | | $ | 15,584 | | | $ | 3,959 | | | $ | 5,640 | | | $ | 27,067 | |
LifePath Index 2025 Fund | | | 482 | | | | 2,176 | | | | 8,037 | | | | 103 | | | | 10,798 | |
LifePath Index 2030 Fund | | | 7,310 | | | | 50,639 | | | | 9,362 | | | | 12,848 | | | | 80,159 | |
LifePath Index 2035 Fund | | | 426 | | | | 1,617 | | | | 8,225 | | | | 95 | | | | 10,363 | |
LifePath Index 2040 Fund | | | 7,962 | | | | 24,785 | | | | 7,786 | | | | 10,759 | | | | 51,292 | |
LifePath Index 2045 Fund | | | 423 | | | | 2,649 | | | | 5,762 | | | | 85 | | | | 8,919 | |
LifePath Index 2050 Fund | | | 480 | | | | 9,270 | | | | 5,505 | | | | 4,280 | | | | 19,535 | |
LifePath Index 2055 Fund | | | 411 | | | | 2,770 | | | | 3,716 | | | | 92 | | | | 6,989 | |
LifePath Index 2060 Fund | | | 1,363 | | | | 182 | | | | 1,983 | | | | 109 | | | | 3,637 | |
LifePath Index 2065 Fund | | | — | | | | — | | | | — | | | | — | | | | — | |
For the year ended December 31, 2019, the following table shows the class specific transfer agent fees borne directly by each share class of each LifePath Index Fund:
| | | | | | | | | | | | | | | | | | | | |
| | | Institutional | | | Investor A | | | Class K | | | Investor P | | | Total | |
LifePath Index Retirement Fund | | $ | 131,227 | | | $ | 131,643 | | | $ | 58,309 | | | $ | 651,281 | | | $ | 972,460 | |
LifePath Index 2025 Fund | | | 70,390 | | | | 93,920 | | | | 78,140 | | | | 9,955 | | | | 252,405 | |
LifePath Index 2030 Fund | | | 317,012 | | | | 378,598 | | | | 91,557 | | | | 1,224,864 | | | | 2,012,031 | |
LifePath Index 2035 Fund | | | 64,166 | | | | 92,525 | | | | 92,185 | | | | 4,749 | | | | 253,625 | |
LifePath Index 2040 Fund | | | 404,011 | | | | 231,131 | | | | 94,340 | | | | 969,473 | | | | 1,698,955 | |
LifePath Index 2045 Fund | | | 53,329 | | | | 72,220 | | | | 93,567 | | | | 2,552 | | | | 221,668 | |
LifePath Index 2050 Fund | | | 54,459 | | | | 114,821 | | | | 106,660 | | | | 347,402 | | | | 623,342 | |
LifePath Index 2055 Fund | | | 52,683 | | | | 61,645 | | | | 101,030 | | | | 2,292 | | | | 217,650 | |
LifePath Index 2060 Fund | | | 9,790 | | | | 14,870 | | | | 57,668 | | | | 2,741 | | | | 85,069 | |
LifePath Index 2065 Fund | | | 16 | | | | 16 | | | | 16 | | | | 16 | | | | 64 | |
| | |
| 80 | | 2019 BLACKROCK ANNUAL REPORTTO SHAREHOLDERS |
Notes to Financial Statements (continued)
Other Fees: For the year ended December 31, 2019, affiliates earned underwriting discounts, direct commissions and dealer concessions on sales of each LifePath Index Fund’s Investor P Shares as follows:
| | | | | | | | | | | | | | | | | | | | |
| | | LifePath Index
Retirement Fund | | | LifePath Index 2025 Fund | | | LifePath Index 2030 Fund | | | LifePath Index 2035 Fund | | | LifePath Index
2040 Fund | |
Investor P | | $ | 70,397 | | | $ | 45,116 | | | $ | 141,105 | | | $ | 15,576 | | | $ | 128,461 | |
| | | | | | | | | | | | | | | | | | | | |
| | | LifePath Index 2045 Fund | | | LifePath Index 2050 Fund | | | LifePath Index 2055 Fund | | | LifePath Index 2060 Fund | | | LifePath Index 2065 Fund | |
Investor P | | $ | 3,707 | | | $ | 58,537 | | | $ | 2,468 | | | $ | 2,149 | | | $ | — | |
For the year ended December 31, 2019, affiliates received CDSCs as follows:
| | | | | | | | | | | | |
| | | LifePath Index
Retirement Fund | | | LifePath Index 2025 Fund | | | LifePath Index 2040 Fund | |
Investor P | | $ | 301 | | | $ | 3 | | | $ | 5 | |
Expense Limitations, Waivers, Reimbursements, and Recoupments:With respect to each LifePath Index Fund, BFA, the investment manager for the LifePath Index Master Portfolios, and BAL have each contractually agreed to waive and/or reimburse fees or expenses in order to limit expenses, excluding interest expense, dividend expense, tax expense, acquired fund fees and expenses, and certain other fund expenses, which constitute extraordinary expenses not incurred in the ordinary course of each LifePath Index Fund’s business (“expense limitation”). The current expense limitations as a percentage of average daily net assets are as follows:
| | | | | | | | | | | | | | | | | | | | | | | | | | | | | | | | |
| | | Contractual Caps through April 30, 2021 (a) | | | Contractual Caps through March 1, 2020 (b) | |
| | | Institutional | | | Investor A | | | Class K | | | Investor P | | | Institutional | | | Investor A | | | Class K | | | Investor P | |
LifePath Index Retirement Fund | | | 0.09 | % | | | 0.34 | % | | | 0.04 | % | | | 0.34 | % | | | 1.09 | % | | | 1.34 | % | | | 1.04 | % | | | 1.34 | % |
LifePath Index 2030 Fund | | | 0.09 | | | | 0.34 | | | | 0.04 | | | | 0.34 | | | | 1.09 | | | | 1.34 | | | | 1.04 | | | | 1.34 | |
LifePath Index 2040 Fund | | | 0.08 | | | | 0.33 | | | | 0.03 | | | | 0.33 | | | | 1.08 | | | | 1.33 | | | | 1.03 | | | | 1.33 | |
LifePath Index 2050 Fund | | | 0.08 | | | | 0.33 | | | | 0.03 | | | | 0.33 | | | | 1.10 | | | | 1.35 | | | | 1.05 | | | | 1.35 | |
LifePath Index 2065 Fund | | | 0.09 | | | | 0.34 | | | | 0.04 | | | | 0.34 | | | | 1.09 | | | | 1.34 | | | | 1.04 | | | | 1.34 | |
| | | | | | | | | | | | | | | | | | | | | | | | | | | | | | | | |
| | | Contractual Caps through April 30, 2020 (a) | | | Contractual Caps through March 1, 2020 (b) | |
| | | Institutional | | | Investor A | | | Class K | | | Investor P | | | Institutional | | | Investor A | | | Class K | | | Investor P | |
LifePath Index 2025 Fund | | | 0.09 | % | | | 0.34 | % | | | 0.04 | % | | | 0.34 | % | | | 1.09 | % | | | 1.34 | % | | | 1.04 | % | | | 1.34 | % |
LifePath Index 2035 Fund | | | 0.08 | | | | 0.33 | | | | 0.03 | | | | 0.33 | | | | 1.08 | | | | 1.33 | | | | 1.03 | | | | 1.33 | |
LifePath Index 2045 Fund | | | 0.08 | | | | 0.33 | | | | 0.03 | | | | 0.33 | | | | 1.10 | | | | 1.35 | | | | 1.05 | | | | 1.35 | |
LifePath Index 2055 Fund | | | 0.07 | | | | 0.32 | | | | 0.02 | | | | 0.32 | | | | 1.10 | | | | 1.35 | | | | 1.05 | | | | 1.35 | |
LifePath Index 2060 Fund | | | 0.07 | | | | 0.32 | | | | 0.02 | | | | 0.32 | | | | 1.10 | | | | 1.35 | | | | 1.05 | | | | 1.35 | |
| | Prior | to April 30, 2019, the expense limitations for LifePath Index Funds as a percentage of average daily net assets for were as follows: | |
| | | | | | | | | | | | | | | | | | | | | | | | | | | | | | | | |
| | | Contractual Caps through April 30, 2021 (a) | | | Contractual Caps through March 1, 2020 (b) | |
| | | Institutional | | | Investor A | | | Class K | | | Investor P | | | Institutional | | | Investor A | | | Class K | | | Investor P | |
LifePath Index Retirement Fund | | | 0.10 | % | | | 0.35 | % | | | 0.05 | % | | | 0.35 | % | | | 1.10 | % | | | 1.35 | % | | | 1.05 | % | | | 1.35 | % |
| | | | | | | | | | | | | | | | | | | | | | | | | | | | | | | | |
| | | Contractual Caps through April 30, 2020 (a) | | | Contractual Caps through March 1, 2020 (b) | |
| | | Institutional | | | Investor A | | | Class K | | | Investor P | | | Institutional | | | Investor A | | | Class K | | | Investor P | |
LifePath Index 2035 Fund | | | 0.09 | % | | | 0.34 | % | | | 0.04 | % | | | 0.34 | % | | | 1.10 | % | | | 1.35 | % | | | 1.05 | % | | | 1.35 | % |
| | (a) | The contractual agreements may be terminated upon 90 days’ notice by the Board, including a majority of the trustees who are not “interested persons” of the Trust, as defined in the 1940 Act (“Independent Trustees”), or by a vote of the majority of the outstanding voting securities of the applicable LifePath Index Fund. | |
| | (b) | Effective March 1, 2020, the Board approved the termination of these contractual expense limitations. | |
These amounts waived and/or reimbursed are included in fees waived and/or reimbursed by the Administrator/Manager and transfer agent fees waived and/or reimbursed — class specific respectively, in the Statements of Operations.
| | | | |
| NOTESTO FINANCIAL STATEMENTS | | | 81 | |
Notes to Financial Statements (continued)
For the year ended December 31, 2019, the amounts included in fees waived and/or reimbursed by the Administrator/Manager were as follows:
| | | | |
LifePath Index Retirement Fund | | $ | 1,245,630 | |
LifePath Index 2025 Fund | | | 1,404,250 | |
LifePath Index 2030 Fund | | | 2,492,600 | |
LifePath Index 2035 Fund | | | 1,261,865 | |
LifePath Index 2040 Fund | | | 2,002,823 | |
LifePath Index 2045 Fund | | | 934,908 | |
LifePath Index 2050 Fund | | | 1,020,093 | |
LifePath Index 2055 Fund | | | 537,020 | |
LifePath Index 2060 Fund | | | 236,256 | |
LifePath Index 2065 Fund | | | 97,613 | |
For the year ended December 31, 2019, the amounts included in transfer agent fees waived and/or reimbursed — class specific were as follows:
| | | | | | | | | | | | | | | | | | | | |
| | | Institutional | | | Investor A | | | Class K | | | Investor P | | | Total | |
LifePath Index Retirement Fund | | $ | 32,605 | | | $ | 72,771 | | | $ | 58,307 | | | $ | 86,244 | | | $ | 249,927 | |
LifePath Index 2025 Fund | | | 7,251 | | | | 21,433 | | | | 78,138 | | | | 1,892 | | | | 108,714 | |
LifePath Index 2030 Fund | | | 92,446 | | | | 218,032 | | | | 91,556 | | | | 262,434 | | | | 664,468 | |
LifePath Index 2035 Fund | | | 8,082 | | | | 23,985 | | | | 92,183 | | | | 2,022 | | | | 126,272 | |
LifePath Index 2040 Fund | | | 149,628 | | | | 126,126 | | | | 94,339 | | | | 264,235 | | | | 634,328 | |
LifePath Index 2045 Fund | | | 9,308 | | | | 25,443 | | | | 93,564 | | | | 1,691 | | | | 130,006 | |
LifePath Index 2050 Fund | | | 11,840 | | | | 59,348 | | | | 106,659 | | | | 128,028 | | | | 305,875 | |
LifePath Index 2055 Fund | | | 16,538 | | | | 31,050 | | | | 101,028 | | | | 1,848 | | | | 150,464 | |
LifePath Index 2060 Fund | | | 6,810 | | | | 10,996 | | | | 57,666 | | | | 2,234 | | | | 77,706 | |
LifePath Index 2065 Fund | | | 11 | | | | 12 | | | | 15 | | | | 12 | | | | 50 | |
With respect to the contractual expense limitation, if during a LifePath Index Fund’s fiscal year the operating expenses of a share class, that at any time during the prior two fiscal years received a waiver and/or reimbursement from the Administrator, are less than the current expense limitation for that share class, the Administrator is entitled to be reimbursed by such share class up to the lesser of: (a) the amount of fees waived and/or expenses reimbursed during those prior two fiscal years under the agreement and (b) an amount not to exceed either the current expense limitation of that share class or the expense limitation of the share class in effect at the time that the share class received the applicable waiver and/or reimbursement, provided that:
(1) each LifePath Index Fund, of which the share class is a part, has more than $50 million in assets for the fiscal year, and
(2) the Administrator or an affiliate continues to serve as a LifePath Index Fund’s investment adviser or administrator.
This repayment applies only to the contractual expense limitation on net expenses and does not apply to any voluntary waivers that may be in effect from time to time. Effective December 1, 2019, the repayment arrangement between each Fund and the Manager pursuant to which such Fund may be required to repay amounts waived and/or reimbursed under the Fund’s contractual caps on net expenses was terminated, except with respect to LifePath Index 2060 Fund and Lifepath Index 2065 Fund, with respect to which such arrangement will terminate on March 2, 2020.
As of December 31, 2019, the following fund level and class specific waivers and/or reimbursements subject to possible future recoupment under the expense limitation agreement are as follows:
| | | | |
| | | Expiring
March 2, 2020 | |
LifePath Index 2060 Fund | | | | |
Fund Level | | $ | 542,356 | |
Institutional | | | 10,010 | |
Investor A | | | 15,149 | |
Class K | | | 118,308 | |
Investor P | | | 2,234 | |
LifePath Index 2065 Fund | | | | |
Fund Level | | | 97,613 | |
Institutional | | | 11 | |
Investor A | | | 12 | |
Class K | | | 15 | |
Investor P | | | 12 | |
| | |
| 82 | | 2019 BLACKROCK ANNUAL REPORTTO SHAREHOLDERS |
Notes to Financial Statements (continued)
The following LifePath Index Fund level and class specific waivers and/or reimbursements previously recorded by the LifePath Index Funds, which were subject to recoupment by the Administrator, expired on December 1, 2019:
| | | | |
LifePath Index Retirement Fund | | | | |
Fund Level | | $ | 1,947,260 | |
Institutional | | | 34,021 | |
Investor A | | | 75,370 | |
Class K | | | 132,993 | |
Investor P | | | 72,492 | |
LifePath Index 2025 Fund | | | | |
Fund Level | | | 3,011,705 | |
Institutional | | | 16,015 | |
Investor A | | | 36,795 | |
Class K | | | 167,873 | |
Investor P | | | 1,511 | |
LifePath Index 2030 Fund | | | | |
Fund Level | | | 4,409,895 | |
Institutional | | | 92,577 | |
Investor A | | | 231,676 | |
Class K | | | 205,768 | |
Investor P | | | 217,388 | |
LifePath Index 2035 Fund | | | | |
Fund Level | | | 2,658,496 | |
Institutional | | | 17,431 | |
Investor A | | | 42,086 | |
Class K | | | 188,790 | |
Investor P | | | 1,573 | |
LifePath Index 2040 Fund | | | | |
Fund Level | | | 3,490,191 | |
Institutional | | | 140,764 | |
Investor A | | | 142,598 | |
Class K | | | 208,735 | |
Investor P | | | 218,752 | |
LifePath Index 2045 Fund | | | | |
Fund Level | | | 1,920,553 | |
Institutional | | | 20,986 | |
Investor A | | | 40,669 | |
Class K | | | 195,834 | |
Investor P | | | 1,325 | |
LifePath Index 2050 Fund | | | | |
Fund Level | | | 1,911,917 | |
Institutional | | | 22,529 | |
Investor A | | | 75,830 | |
Class K | | | 229,497 | |
Investor P | | | 106,424 | |
LifePath Index 2055 Fund | | | | |
Fund Level | | | 1,050,149 | |
Institutional | | | 34,348 | |
Investor A | | | 49,446 | |
Class K | | | 212,868 | |
Investor P | | | 1,441 | |
Interfund Lending: In accordance with an exemptive order (the “Order”) from the U.S. Securities and Exchange Commission (“SEC”), each LifePath Index Fund may participate in a joint lending and borrowing facility for temporary purposes (the “Interfund Lending Program”), subject to compliance with the terms and conditions of the Order, and to the extent permitted by each LifePath Index Fund’s investment policies and restrictions. Each LifePath Index Fund is currently permitted to borrow and lend under the Interfund Lending Program.
A lending BlackRock fund may lend in aggregate up to 15% of its net assets, but may not lend more than 5% of its net assets to any one borrowing fund through the Interfund Lending Program. A borrowing BlackRock fund may not borrow through the Interfund Lending Program or from any other source more than 33 1/3% of its total assets (or any lower threshold provided for by the fund’s investment restrictions). If a borrowing BlackRock fund’s total outstanding borrowings exceed 10% of its total assets, each of its outstanding interfund loans will be subject to collateralization of at least 102% of the outstanding principal value of the loan. All interfund loans are for temporary or emergency purposes and the interest rate to be charged will be the average of the highest current overnight repurchase agreement rate available to a lending fund and the bank loan rate, as calculated according to a formula established by the Board.
During the year ended December 31, 2019, the LifePath Index Funds did not participate in the Interfund Lending Program.
Trustees and Officers:Certain trustees and/or officers of the Trusts are directors and/or officers of BlackRock or its affiliates.
| | | | |
| NOTESTO FINANCIAL STATEMENTS | | | 83 | |
Notes to Financial Statements (continued)
It is each LifePath Index Fund’s policy to comply with the requirements of the Internal Revenue Code of 1986, as amended, applicable to regulated investment companies, and to distribute substantially all of its taxable income to its shareholders. Therefore, no U.S. federal income tax provision is required.
Each LifePath Index Fund files U.S. federal and various state and local tax returns. No income tax returns are currently under examination. The statute of limitations on each LifePath Index Fund’s U.S. federal tax returns generally remains open for each of the four years ended December 31, 2019, except for LifePath Index 2060 Fund, which remains open for the years ended December 31, 2019, December 31, 2018 and December 31, 2017 and for the period ended December 31, 2016, and LifePath Index 2065 Fund, which remains open for the period ended December 31, 2019. The statutes of limitations on each LifePath Index Fund’s state and local tax returns may remain open for an additional year depending upon the jurisdiction.
Management has analyzed tax laws and regulations and their application to the LifePath Index Funds as of June 30, 2019, inclusive of the open tax return years, and does not believe that there are any uncertain tax positions that require recognition of a tax liability in the LifePath Index Fund’s financial statements.
The tax character of distributions paid was as follows:
| | | | | | | | | | | | | | | | | | | | |
| | | | | | LifePath Index
Retirement Fund | | | LifePath Index 2025 Fund | | | LifePath Index 2030 Fund | | | LifePath Index 2035 Fund | |
Ordinary income | | | 12/31/19 | | | $ | 97,732,162 | | | $ | 111,629,296 | | | $ | 207,662,131 | | | $ | 101,947,198 | |
| | | 12/31/18 | | | | 36,440,772 | | | | 70,444,802 | | | | 98,285,957 | | | | 61,654,663 | |
Long-term capital gains | | | 12/31/19 | | | | 2,982,199 | | | | 11,761,069 | | | | 25,611,015 | | | | 22,744,363 | |
| | | 12/31/18 | | | | 1,627,806 | | | | 5,992,869 | | | | 2,023,513 | | | | 396,534 | |
| | | | | | | | | | | | | | | | | | | | |
Total | | | 12/31/19 | | | $ | 100,714,361 | | | $ | 123,390,365 | | | $ | 233,273,146 | | | $ | 124,691,561 | |
| | | | | | | | | | | | | | | | | | | | |
| | | 12/31/18 | | | $ | 38,068,578 | | | $ | 76,437,671 | | | $ | 100,309,470 | | | $ | 62,051,197 | |
| | | | | | | | | | | | | | | | | | | | |
| | | | | | | | | | | | | | | | | | | | | | | | | | | | |
| | | | LifePath Index
2040 Fund | | | LifePath Index 2045 Fund | | | LifePath Index 2050 Fund | | | LifePath Index 2055 Fund | | | LifePath Index 2060 Fund | | | LifePath Index 2065 Fund | |
Ordinary income | | | 12/31/19 | | | $ | 174,844,665 | | | $ | 73,195,299 | | | $ | 81,801,983 | | | $ | 36,357,901 | | | $ | 8,455,605 | | | $ | 18,201 | |
| | | 12/31/18 | | | | 75,020,175 | | | | 41,993,674 | | | | 39,232,216 | | | | 18,153,081 | | | | 3,063,594 | | | | — | |
Long-term capital gains | | | 12/31/19 | | | | 18,717,531 | | | | 17,687,243 | | | | 12,714,412 | | | | 4,061,947 | | | | — | | | | — | |
| | | 12/31/18 | | | | 2,215,621 | | | | 282,680 | | | | 367,932 | | | | — | | | | — | | | | — | |
| | | | | | | | | | | | | | | | | | | | | | | | | | | | |
Total | | | 12/31/19 | | | $ | 193,562,196 | | | $ | 90,882,542 | | | $ | 94,516,395 | | | $ | 40,419,848 | | | $ | 8,455,605 | | | $ | 18,201 | |
| | | | | | | | | | | | | | | | | | | | | | | | | | | | |
| | | 12/31/18 | | | $ | 77,235,796 | | | $ | 42,276,354 | | | $ | 39,600,148 | | | $ | 18,153,081 | | | $ | 3,063,594 | | | $ | — | |
| | | | | | | | | | | | | | | | | | | | | | | | | | | | |
As of period end, the tax components of accumulated net earnings were as follows:
| | | | | | | | | | | | | | | | | | | | |
| | | LifePath Index
Retirement Fund | | | LifePath Index 2025 Fund | | | LifePath Index 2030 Fund | | | LifePath Index 2035 Fund | | | LifePath Index 2040 Fund | |
Undistributed ordinary income | | $ | 2,983,799 | | | $ | 1,126,937 | | | $ | 2,297,453 | | | $ | 1,443,010 | | | $ | 2,283,596 | |
Undistributed long-term capital gains | | | 1,077,658 | | | | 731,869 | | | | 953,603 | | | | 770,402 | | | | 687,174 | |
Non-expiring capital loss carryforwards(a) | | | — | | | | — | | | | — | | | | — | | | | — | |
Net unrealized gains (losses)(b) | | | 870,886,955 | | | | 547,272,828 | | | | 1,017,081,976 | | | | 592,955,273 | | | | 913,299,796 | |
| | | | | | | | | | | | | | | | | | | | |
| | $ | 874,948,412 | | | $ | 549,131,634 | | | $ | 1,020,333,032 | | | $ | 595,168,685 | | | $ | 916,270,566 | |
| | | | | | | | | | | | | | | | | | | | |
| | | | | | | | | | | | | | | | | | | | |
| | | LifePath Index 2045 Fund | | | LifePath Index 2050 Fund | | | LifePath Index 2055 Fund | | | LifePath Index 2060 Fund | | | LifePath Index 2065 Fund | |
Undistributed ordinary income | | $ | 1,171,706 | | | $ | 1,199,565 | | | $ | 534,369 | | | $ | 24,328 | | | $ | 460 | |
Undistributed long-term capital gains | | | 542,280 | | | | 467,271 | | | | 212,216 | | | | — | | | | — | |
Non-expiring capital loss carryforwards(a) | | | — | | | | — | | | | — | | | | (2,590,063 | ) | | | (1,802 | ) |
Net unrealized gains (losses)(b) | | | 452,216,809 | | | | 469,500,552 | | | | 211,858,982 | | | | 44,012,798 | | | | 70,982 | |
| | | | | | | | | | | | | | | | | | | | |
| | $ | 453,930,795 | | | $ | 471,167,388 | | | $ | 212,605,567 | | | $ | 41,447,063 | | | $ | 69,640 | |
| | | | | | | | | | | | | | | | | | | | |
| | (a) | Amounts available to offset future realized capital gains. | |
| | (b) | The difference between book-basis and tax-basis net unrealized gains were attributable primarily to the timing and recognition of partnership income. | |
| | |
| 84 | | 2019 BLACKROCK ANNUAL REPORTTO SHAREHOLDERS |
Notes to Financial Statements (continued)
During the year ended December 31, 2019, the LifePath Index Funds listed below utilized the following amounts of their respective capital loss carryforwards:
| | | | | | | | |
| | | LifePath Index
2055
Fund | | | LifePath Index
2060
Fund | |
Amount utilized | | $ | 1,163,553 | | | $ | 640,871 | |
| 6. | CAPITAL SHARE TRANSACTIONS |
Transactions in capital shares for each class were as follows:
| | | | | | | | | | | | | | | | |
| | | Year Ended
12/31/19 | | | Year Ended
12/31/18 | |
| LifePath Index Retirement Fund | | Shares | | | Amount | | | Shares | | | Amount | |
Institutional | |
Shares sold | | | 4,905,764 | | | $ | 62,262,954 | | | | 1,018,761 | | | $ | 12,306,958 | |
Shares issued in reinvestment of distributions | | | 513,150 | | | | 6,591,337 | | | | 157,830 | | | | 1,863,349 | |
Shares issued in reorganization | | | 27,639,915 | | | | 357,244,026 | | | | 8,655,642 | | | | 102,611,665 | |
Shares redeemed | | | (4,822,605 | ) | | | (60,496,765 | ) | | | (3,185,794 | ) | | | (38,910,422 | ) |
| | | | | | | | | | | | | | | | |
Net increase | | | 28,236,224 | | | $ | 365,601,552 | | | | 6,646,439 | | | $ | 77,871,550 | |
| | | | | | | | | | | | | | | | |
| | | | |
Investor A | | | | | | | | | | | | | | | | |
Shares sold | | | 4,564,803 | | | $ | 57,839,346 | | | | 1,803,896 | | | $ | 21,822,814 | |
Shares issued in reinvestment of distributions | | | 281,351 | | | | 3,610,000 | | | | 142,119 | | | | 1,695,936 | |
Shares issued in reorganization | | | 14,891,702 | | | | 192,208,015 | | | | 1,678,660 | | | | 19,874,164 | |
Shares redeemed | | | (3,392,383 | ) | | | (42,835,432 | ) | | | (3,800,607 | ) | | | (45,851,833 | ) |
| | | | | | | | | | | | | | | | |
Net increase (decrease) | | | 16,345,473 | | | $ | 210,821,929 | | | | (175,932 | ) | | $ | (2,458,919 | ) |
| | | | | | | | | | | | | | | | |
| | | | |
Class K | | | | | | | | | | | | | | | | |
Shares sold | | | 86,341,268 | | | $ | 1,094,046,524 | | | | 42,820,116 | | | $ | 520,333,908 | |
Shares issued in reinvestment of distributions | | | 4,517,341 | | | | 57,935,745 | | | | 2,370,700 | | | | 28,321,393 | |
Shares issued in reorganization | | | 184,547,978 | | | | 2,384,059,929 | | | | — | | | | — | |
Shares redeemed | | | (33,878,510 | ) | | | (427,109,047 | ) | | | (32,129,043 | ) | | | (388,710,104 | ) |
| | | | | | | | | | | | | | | | |
Net increase | | | 241,528,077 | | | $ | 3,108,933,151 | | | | 13,061,773 | | | $ | 159,945,197 | |
| | | | | | | | | | | | | | | | |
| | |
| | | | | | Period from
08/06/18 (a)
12/31/18 | |
Investor P | | | | | | | | | | | | | | | | |
Shares sold | | | 3,607,587 | | | $ | 45,490,004 | | | | 286,654 | | | $ | 3,354,804 | |
Shares issued in reinvestment of distributions | | | 2,542,411 | | | | 32,515,330 | | | | 535,522 | | | | 6,174,572 | |
Shares issued in reorganization | | | 125,287,382 | | | | 1,615,690,375 | | | | 79,777,654 | | | | 944,050,555 | |
Shares redeemed | | | (14,988,562 | ) | | | (187,362,343 | ) | | | (1,461,884 | ) | | | (17,078,748 | ) |
| | | | | | | | | | | | | | | | |
Net increase | | | 116,448,818 | | | $ | 1,506,333,366 | | | | 79,137,946 | | | $ | 936,501,183 | |
| | | | | | | | | | | | | | | | |
Total Net Increase | | | 402,558,592 | | | $ | 5,191,689,998 | | | | 98,670,226 | | | $ | 1,171,859,011 | |
| | | | | | | | | | | | | | | | |
| | | | |
| NOTESTO FINANCIAL STATEMENTS | | | 85 | |
Notes to Financial Statements (continued)
| | | | | | | | | | | | | | | | |
| | | Year Ended
12/31/19 | | | Year Ended
12/31/18 | |
| LifePath Index 2025 Fund | | Shares | | | Amount | | | Shares | | | Amount | |
Institutional | |
Shares sold | | | 8,671,908 | | | $ | 118,306,056 | | | | 2,786,123 | | | $ | 36,662,354 | |
Shares issued in reinvestment of distributions | | | 308,993 | | | | 4,309,186 | | | | 208,838 | | | | 2,690,202 | |
Shares redeemed | | | (4,192,327 | ) | | | (55,991,978 | ) | | | (2,230,551 | ) | | | (29,584,230 | ) |
| | | | | | | | | | | | | | | | |
Net increase | | | 4,788,574 | | | $ | 66,623,264 | | | | 764,410 | | | $ | 9,768,326 | |
| | | | | | | | | | | | | | | | |
| | | | |
Investor A | | | | | | | | | | | | | | | | |
Shares sold | | | 4,402,937 | | | $ | 59,574,100 | | | | 4,114,519 | | | $ | 53,756,622 | |
Shares issued in reinvestment of distributions | | | 306,470 | | | | 4,248,493 | | | | 234,212 | | | | 3,022,227 | |
Shares redeemed | | | (3,322,780 | ) | | | (45,459,031 | ) | | | (6,478,953 | ) | | | (84,783,504 | ) |
| | | | | | | | | | | | | | | | |
Net increase (decrease) | | | 1,386,627 | | | $ | 18,363,562 | | | | (2,130,222 | ) | | $ | (28,004,655 | ) |
| | | | | | | | | | | | | | | | |
| | | | |
Class K | | | | | | | | | | | | | | | | |
Shares sold | | | 92,247,193 | | | $ | 1,249,686,541 | | | | 85,436,344 | | | $ | 1,130,731,768 | |
Shares issued in reinvestment of distributions | | | 8,207,331 | | | | 114,044,149 | | | | 5,436,397 | | | | 69,992,604 | |
Shares redeemed | | | (35,156,325 | ) | | | (475,785,645 | ) | | | (34,247,010 | ) | | | (452,194,477 | ) |
| | | | | | | | | | | | | | | | |
Net increase | | | 65,298,199 | | | $ | 887,945,045 | | | | 56,625,731 | | | $ | 748,529,895 | |
| | | | | | | | | | | | | | | | |
| | |
| | | | | | Period from
08/06/18 (a)
12/31/18 | |
Investor P | | | | | | | | | | | | | | | | |
Shares sold | | | 2,360,250 | | | $ | 32,081,289 | | | | 146,038 | | | $ | 1,841,449 | |
Shares issued in reinvestment of distributions | | | 46,892 | | | | 655,178 | | | | 1,287 | | | | 15,853 | |
Shares redeemed | | | (145,937 | ) | | | (1,983,233 | ) | | | (429 | ) | | | (5,540 | ) |
| | | | | | | | | | | | | | | | |
Net increase | | | 2,261,205 | | | $ | 30,753,234 | | | | 146,896 | | | $ | 1,851,762 | |
| | | | | | | | | | | | | | | | |
Total Net Increase | | | 73,734,605 | | | $ | 1,003,685,105 | | | | 55,406,815 | | | $ | 732,145,328 | |
| | | | | | | | | | | | | | | | |
| | | | | | | | | | | | | | | | |
| | | Year Ended
12/31/19 | | | Year Ended
12/31/18 | |
| LifePath Index 2030 Fund | | Shares | | | Amount | | | Shares | | | Amount | |
Institutional | |
Shares sold | | | 12,286,887 | | | $ | 172,309,139 | | | | 2,743,880 | | | $ | 36,971,977 | |
Shares issued in reinvestment of distributions | | | 1,116,959 | | | | 16,070,239 | | | | 366,961 | | | | 4,756,501 | |
Shares issued in reorganization | | | — | | | | — | | | | 21,743,189 | | | | 287,322,872 | |
Shares redeemed | | | (6,556,867 | ) | | | (89,999,831 | ) | | | (3,604,541 | ) | | | (49,058,080 | ) |
| | | | | | | | | | | | | | | | |
Net increase | | | 6,846,979 | | | $ | 98,379,547 | | | | 21,249,489 | | | $ | 279,993,270 | |
| | | | | | | | | | | | | | | | |
| | | | |
Investor A | | | | | | | | | | | | | | | | |
Shares sold | | | 5,545,925 | | | $ | 77,172,744 | | | | 4,918,089 | | | $ | 66,186,329 | |
Shares issued in reinvestment of distributions | | | 703,278 | | | | 10,099,959 | | | | 414,863 | | | | 5,486,766 | |
Shares issued in reorganization | | | — | | | | — | | | | 3,836,618 | | | | 50,659,133 | |
Shares redeemed | | | (5,471,152 | ) | | | (76,586,975 | ) | | | (7,549,133 | ) | | | (101,230,237 | ) |
| | | | | | | | | | | | | | | | |
Net increase | | | 778,051 | | | $ | 10,685,728 | | | | 1,620,437 | | | $ | 21,101,991 | |
| | | | | | | | | | | | | | | | |
| | | | |
Class K | | | | | | | | | | | | | | | | |
Shares sold | | | 100,048,389 | | | $ | 1,391,816,762 | | | | 88,692,082 | | | $ | 1,202,120,206 | |
Shares issued in reinvestment of distributions | | | 10,285,729 | | | | 147,707,101 | | | | 5,593,577 | | | | 74,012,088 | |
Shares redeemed | | | (36,638,871 | ) | | | (507,064,310 | ) | | | (34,469,319 | ) | | | (464,989,328 | ) |
| | | | | | | | | | | | | | | | |
Net increase | | | 73,695,247 | | | $ | 1,032,459,553 | | | | 59,816,340 | | | $ | 811,142,966 | |
| | | | | | | | | | | | | | | | |
| | |
| | | | | | Period from
08/06/18 (a)
12/31/18 | |
Investor P | | | | | | | | | | | | | | | | |
Shares sold | | | 6,400,755 | | | $ | 89,352,544 | | | | 695,685 | | | $ | 8,937,775 | |
Shares issued in reinvestment of distributions | | | 4,135,772 | | | | 59,334,598 | | | | 988,350 | | | | 12,413,678 | |
Shares issued in reorganization | | | — | | | | — | | | | 143,425,167 | | | | 1,893,242,740 | |
Shares redeemed | | | (17,903,626 | ) | | | (248,439,469 | ) | | | (1,533,742 | ) | | | (19,672,490 | ) |
| | | | | | | | | | | | | | | | |
Net increase (decrease) | | | (7,367,099 | ) | | $ | (99,752,327 | ) | | | 143,575,460 | | | $ | 1,894,921,703 | |
| | | | | | | | | | | | | | | | |
Total Net Increase | | | 73,953,178 | | | $ | 1,041,772,501 | | | | 226,261,726 | | | $ | 3,007,159,930 | |
| | | | | | | | | | | | | | | | |
| | |
| 86 | | 2019 BLACKROCK ANNUAL REPORTTO SHAREHOLDERS |
Notes to Financial Statements (continued)
| | | | | | | | | | | | | | | | |
| | | Year Ended
12/31/19 | | | Year Ended
12/31/18 | |
| LifePath Index 2035 Fund | | Shares | | | Amount | | | Shares | | | Amount | |
Institutional | |
Shares sold | | | 5,638,310 | | | $ | 81,445,287 | | | | 2,368,966 | | | $ | 33,176,038 | |
Shares issued in reinvestment of distributions | | | 283,106 | | | | 4,231,753 | | | | 162,424 | | | | 2,215,283 | |
Shares redeemed | | | (3,535,268 | ) | | | (50,303,945 | ) | | | (2,120,005 | ) | | | (29,784,429 | ) |
| | | | | | | | | | | | | | | | |
Net increase | | | 2,386,148 | | | $ | 35,373,095 | | | | 411,385 | | | $ | 5,606,892 | |
| | | | | | | | | | | | | | | | |
| | | | |
Investor A | | | | | | | | | | | | | | | | |
Shares sold | | | 4,685,276 | | | $ | 67,068,400 | | | | 3,577,658 | | | $ | 49,526,634 | |
Shares issued in reinvestment of distributions | | | 316,370 | | | | 4,706,667 | | | | 183,582 | | | | 2,509,086 | |
Shares redeemed | | | (2,687,655 | ) | | | (39,067,868 | ) | | | (6,990,357 | ) | | | (97,092,915 | ) |
| | | | | | | | | | | | | | | | |
Net increase (decrease) | | | 2,313,991 | | | $ | 32,707,199 | | | | (3,229,117 | ) | | $ | (45,057,195 | ) |
| | | | | | | | | | | | | | | | |
| | | | |
Class K | | | | | | | | | | | | | | | | |
Shares sold | | | 76,574,620 | | | $ | 1,098,990,051 | | | | 73,766,605 | | | $ | 1,035,015,252 | |
Shares issued in reinvestment of distributions | | | 7,746,108 | | | | 115,409,385 | | | | 4,034,863 | | | | 54,919,314 | |
Shares redeemed | | | (24,944,651 | ) | | | (357,738,221 | ) | | | (24,064,060 | ) | | | (336,144,172 | ) |
| | | | | | | | | | | | | | | | |
Net increase | | | 59,376,077 | | | $ | 856,661,215 | | | | 53,737,408 | | | $ | 753,790,394 | |
| | | | | | | | | | | | | | | | |
| | |
| | | | | | Period from
08/06/18 (a)
12/31/18 | |
Investor P | | | | | | | | | | | | | | | | |
Shares sold | | | 793,365 | | | $ | 11,414,227 | | | | 50,416 | | | $ | 698,111 | |
Shares issued in reinvestment of distributions | | | 17,583 | | | | 264,146 | | | | 228 | | | | 2,930 | |
Shares redeemed | | | (65,069 | ) | | | (926,289 | ) | | | (6,955 | ) | | | (97,651 | ) |
| | | | | | | | | | | | | | | | |
Net increase | | | 745,879 | | | $ | 10,752,084 | | | | 43,689 | | | $ | 603,390 | |
| | | | | | | | | | | | | | | | |
Total Net Increase | | | 64,822,095 | | | $ | 935,493,593 | | | | 50,963,365 | | | $ | 714,943,481 | |
| | | | | | | | | | | | | | | | |
| | | | | | | | | | | | | | | | |
| | | Year Ended
12/31/19 | | | Year Ended
12/31/18 | |
| LifePath Index 2040 Fund | | Shares | | | Amount | | | Shares | | | Amount | |
Institutional | |
Shares sold | | | 7,869,162 | | | $ | 116,162,801 | | | | 2,348,124 | | | $ | 33,491,008 | |
Shares issued in reinvestment of distributions | | | 1,205,226 | | | | 18,461,539 | | | | 361,143 | | | | 4,857,705 | |
Shares issued in reorganization | | | — | | | | — | | | | 26,825,150 | | | | 374,985,551 | |
Shares redeemed | | | (6,623,487 | ) | | | (97,093,441 | ) | | | (2,877,170 | ) | | | (41,457,093 | ) |
| | | | | | | | | | | | | | | | |
Net increase | | | 2,450,901 | | | $ | 37,530,899 | | | | 26,657,247 | | | $ | 371,877,171 | |
| | | | | | | | | | | | | | | | |
| | | | |
Investor A | | | | | | | | | | | | | | | | |
Shares sold | | | 3,933,402 | | | $ | 63,168,276 | | | | 3,092,910 | | | $ | 44,012,849 | |
Shares issued in reinvestment of distributions | | | 847,924 | | | | 7,246,146 | | | | 258,397 | | | | 3,595,278 | |
Shares issued in reorganization | | | — | | | | — | | | | 1,605,991 | | | | 22,400,500 | |
Shares redeemed | | | (2,896,325 | ) | | | (42,662,793 | ) | | | (5,862,446 | ) | | | (83,217,233 | ) |
| | | | | | | | | | | | | | | | |
Net increase (decrease) | | | 1,885,001 | | | $ | 27,751,629 | | | | (905,148 | ) | | $ | (13,208,606 | ) |
| | | | | | | | | | | | | | | | |
| | | | |
Class K | | | | | | | | | | | | | | | | |
Shares sold | | | 72,855,160 | | | $ | 1,066,849,549 | | | | 68,493,857 | | | $ | 984,415,934 | |
Shares issued in reinvestment of distributions | | | 7,543,745 | | | | 121,403,043 | | | | 4,038,313 | | | | 56,253,940 | |
Shares redeemed | | | (26,101,264 | ) | | | (381,597,209 | ) | | | (23,435,959 | ) | | | (336,249,609 | ) |
| | | | | | | | | | | | | | | | |
Net increase | | | 54,297,641 | | | $ | 806,655,383 | | | | 49,096,211 | | | $ | 704,420,265 | |
| | | | | | | | | | | | | | | | |
| | | | |
| NOTESTO FINANCIAL STATEMENTS | | | 87 | |
Notes to Financial Statements (continued)
| | | | | | | | | | | | | | | | |
| | | Year Ended
12/31/19 | | | Period from
08/06/18 (a)
12/31/18 | |
| LifePath Index 2040 Fund | | Shares | | | Amount | | | Shares | | | Amount | |
Investor P | | | | | | | | | | | | | | | | |
Shares sold | | | 5,339,456 | | | $ | 78,560,818 | | | | 610,682 | | | $ | 8,249,747 | |
Shares issued in reinvestment of distributions | | | 3,036,381 | | | | 46,388,729 | | | | 718,462 | | | | 9,368,763 | |
Shares issued in reorganization | | | — | | | | — | | | | 98,207,119 | | | | 1,369,311,095 | |
Shares redeemed | | | (11,727,881 | ) | | | (172,101,344 | ) | | | (940,199 | ) | | | (12,613,942 | ) |
| | | | | | | | | | | | | | | | |
Net increase (decrease) | | | (3,352,044 | ) | | $ | (47,151,797 | ) | | | 98,596,064 | | | $ | 1,374,315,663 | |
| | | | | | | | | | | | | | | | |
Total Net Increase | | | 55,281,499 | | | $ | 824,786,114 | | | | 173,444,374 | | | $ | 2,437,404,493 | |
| | | | | | | | | | | | | | | | |
| | | | | | | | | | | | | | | | |
| | | Year Ended
12/31/19 | | | Year Ended
12/31/18 | |
| LifePath Index 2045 Fund | | Shares | | | Amount | | | Shares | | | Amount | |
Institutional | |
Shares sold | | | 4,134,440 | | | $ | 62,675,783 | | | | 1,761,127 | | | $ | 25,974,627 | |
Shares issued in reinvestment of distributions | | | 198,083 | | | | 3,126,280 | | | | 116,891 | | | | 1,664,435 | |
Shares redeemed | | | (2,451,852 | ) | | | (36,690,669 | ) | | | (1,599,604 | ) | | | (23,680,179 | ) |
| | | | | | | | | | | | | | | | |
Net increase | | | 1,880,671 | | | $ | 29,111,394 | | | | 278,414 | | | $ | 3,958,883 | |
| | | | | | | | | | | | | | | | |
| | | | |
Investor A | | | | | | | | | | | | | | | | |
Shares sold | | | 3,481,014 | | | $ | 55,742,213 | | | | 2,097,187 | | | $ | 30,545,308 | |
Shares issued in reinvestment of distributions | | | 466,810 | | | | 3,753,639 | | | | 103,627 | | | | 1,476,280 | |
Shares redeemed | | | (1,440,103 | ) | | | (21,858,169 | ) | | | (2,950,219 | ) | | | (43,060,237 | ) |
| | | | | | | | | | | | | | | | |
Net increase (decrease) | | | 2,507,721 | | | $ | 37,637,683 | | | | (749,405 | ) | | $ | (11,038,649 | ) |
| | | | | | | | | | | | | | | | |
| | | | |
Class K | | | | | | | | | | | | | | | | |
Shares sold | | | 53,873,707 | | | $ | 811,182,666 | | | | 52,152,175 | | | $ | 770,272,652 | |
Shares issued in reinvestment of distributions | | | 5,090,520 | | | | 83,895,290 | | | | 2,636,073 | | | | 37,504,077 | |
Shares redeemed | | | (15,125,320 | ) | | | (228,116,394 | ) | | | (14,612,103 | ) | | | (215,240,097 | ) |
| | | | | | | | | | | | | | | | |
Net increase | | | 43,838,907 | | | $ | 666,961,562 | | | | 40,176,145 | | | $ | 592,536,632 | |
| | | | | | | | | | | | | | | | |
| | |
| | | | | | Period from
08/06/18 (a)
12/31/18 | |
Investor P | | | | | | | | | | | | | | | | |
Shares sold | | | 274,521 | | | $ | 4,154,025 | | | | 18,713 | | | $ | 274,716 | |
Shares issued in reinvestment of distributions | | | 4,768 | | | | 75,631 | | | | 43 | | | | 576 | |
Shares redeemed | | | (89,626 | ) | | | (1,363,227 | ) | | | — | | | | — | |
| | | | | | | | | | | | | | | | |
Net increase | | | 189,663 | | | $ | 2,866,429 | | | | 18,756 | | | $ | 275,292 | |
| | | | | | | | | | | | | | | | |
Total Net Increase | | | 48,416,962 | | | $ | 736,577,068 | | | | 39,723,910 | | | $ | 585,732,158 | |
| | | | | | | | | | | | | | | | |
| | | | | | | | | | | | | | | | |
| | | Year Ended
12/31/19 | | | Year Ended
12/31/18 | |
| LifePath Index 2050 Fund | | Shares | | | Amount | | | Shares | | | Amount | |
| Institutional | |
Shares sold | | | 4,330,085 | | | $ | 66,648,432 | | | | 1,921,818 | | | $ | 28,798,586 | |
Shares issued in reinvestment of distributions | | | 193,605 | | | | 3,110,797 | | | | 109,448 | | | | 1,584,622 | |
Shares redeemed | | | (2,915,933 | ) | | | (44,484,704 | ) | | | (1,627,411 | ) | | | (24,463,793 | ) |
| | | | | | | | | | | | | | | | |
Net increase | | | 1,607,757 | | | $ | 25,274,525 | | | | 403,855 | | | $ | 5,919,415 | |
| | | | | | | | | | | | | | | | |
| | | | |
Investor A | | | | | | | | | | | | | | | | |
Shares sold | | | 3,135,666 | | | $ | 50,818,895 | | | | 1,909,678 | | | $ | 28,396,016 | |
Shares issued in reinvestment of distributions | | | 435,815 | | | | 3,961,737 | | | | 116,711 | | | | 1,684,226 | |
Shares issued in reorganization | | | — | | | | — | | | | 468,763 | | | | 6,808,977 | |
Shares redeemed | | | (1,323,680 | ) | | | (20,382,687 | ) | | | (2,744,609 | ) | | | (40,597,035 | ) |
| | | | | | | | | | | | | | | | |
Net increase (decrease) | | | 2,247,801 | | | $ | 34,397,945 | | | | (249,457 | ) | | $ | (3,707,816 | ) |
| | | | | | | | | | | | | | | | |
| | |
| 88 | | 2019 BLACKROCK ANNUAL REPORTTO SHAREHOLDERS |
Notes to Financial Statements (continued)
| | | | | | | | | | | | | | | | |
| | | Year Ended
12/31/19 | | | Year Ended
12/31/18 | |
| LifePath Index 2050 Fund | | Shares | | | Amount | | | Shares | | | Amount | |
| | | | |
Class K | | | | | | | | | | | | | | | | |
Shares sold | | | 49,981,430 | | | $ | 764,140,308 | | | | 44,071,463 | | | $ | 660,447,388 | |
Shares issued in reinvestment of distributions | | | 4,369,899 | | | | 73,138,948 | | | | 2,188,372 | | | | 31,631,006 | |
Shares redeemed | | | (15,228,350 | ) | | | (232,305,398 | ) | | | (13,552,432 | ) | | | (202,522,689 | ) |
| | | | | | | | | | | | | | | | |
Net increase | | | 39,122,979 | | | $ | 604,973,858 | | | | 32,707,403 | | | $ | 489,555,705 | |
| | | | | | | | | | | | | | | | |
| | |
| | | | | | Period from
08/06/18 (a)
12/31/18 | |
Investor P | | | | | | | | | | | | | | | | |
Shares sold | | | 2,474,823 | | | $ | 37,927,935 | | | | 288,227 | | | $ | 4,036,933 | |
Shares issued in reinvestment of distributions | | | 894,935 | | | | 14,295,142 | | | | 225,005 | | | | 3,030,818 | |
Shares issued in reorganization | | | — | | | | — | | | | 28,990,652 | | | | 420,898,833 | |
Shares redeemed | | | (3,897,691 | ) | | | (59,553,609 | ) | | | (285,840 | ) | | | (4,003,124 | ) |
| | | | | | | | | | | | | | | | |
Net increase (decrease) | | | (527,933 | ) | | $ | (7,330,532 | ) | | | 29,218,044 | | | $ | 423,963,460 | |
| | | | | | | | | | | | | | | | |
Total Net Increase | | | 42,450,604 | | | $ | 657,315,796 | | | | 62,079,845 | | | $ | 915,730,764 | |
| | | | | | | | | | | | | | | | |
| | | | | | | | | | | | | | | | |
| | | Year Ended
12/31/19 | | | Year Ended
12/31/18 | |
| LifePath Index 2055 Fund | | Shares | | | Amount | | | Shares | | | Amount | |
Institutional | |
Shares sold | | | 3,390,696 | | | $ | 53,061,446 | | | | 2,107,289 | | | $ | 32,048,848 | |
Shares issued in reinvestment of distributions | | | 134,518 | | | | 2,263,835 | | | | 88,556 | | | | 1,303,230 | |
Shares redeemed | | | (3,452,650 | ) | | | (53,704,844 | ) | | | (1,201,441 | ) | | | (18,368,110 | ) |
| | | | | | | | | | | | | | | | |
Net increase | | | 72,564 | | | $ | 1,620,437 | | | | 994,404 | | | $ | 14,983,968 | |
| | | | | | | | | | | | | | | | |
| | | | |
Investor A | | | | | | | | | | | | | | | | |
Shares sold | | | 2,474,834 | | | $ | 38,772,796 | | | | 1,772,760 | | | $ | 26,744,014 | |
Shares issued in reinvestment of distributions | | | 121,480 | | | | 1,993,577 | | | | 56,193 | | | | 825,967 | |
Shares redeemed | | | (975,049 | ) | | | (15,544,849 | ) | | | (1,505,879 | ) | | | (22,806,201 | ) |
| | | | | | | | | | | | | | | | |
Net increase | | | 1,621,265 | | | $ | 25,221,524 | | | | 323,074 | | | $ | 4,763,780 | |
| | | | | | | | | | | | | | | | |
| | | | |
Class K | | | | | | | | | | | | | | | | |
Shares sold | | | 33,196,411 | | | $ | 520,913,388 | | | | 25,856,060 | | | $ | 394,481,228 | |
Shares issued in reinvestment of distributions | | | 2,210,087 | | | | 36,083,191 | | | | 1,036,696 | | | | 15,248,145 | |
Shares redeemed | | | (8,065,519 | ) | | | (126,795,533 | ) | | | (6,525,650 | ) | | | (99,674,872 | ) |
| | | | | | | | | | | | | | | | |
Net increase | | | 27,340,979 | | | $ | 430,201,046 | | | | 20,367,106 | | | $ | 310,054,501 | |
| | | | | | | | | | | | | | | | |
| | |
| | | | | | Period from
08/06/18 (a)
12/31/18 | |
Investor P | | | | | | | | | | | | | | | | |
Shares sold | | | 94,831 | | | $ | 1,507,303 | | | | 15,211 | | | $ | 235,121 | |
Shares issued in reinvestment of distributions | | | 1,995 | | | | 32,915 | | | | 18 | | | | 243 | |
Shares redeemed | | | (1,530 | ) | | | (24,770 | ) | | | — | | | | — | |
| | | | | | | | | | | | | | | | |
Net increase | | | 95,296 | | | $ | 1,515,448 | | | | 15,229 | | | $ | 235,364 | |
| | | | | | | | | | | | | | | | |
Total Net Increase | | | 29,130,104 | | | $ | 458,558,455 | | | | 21,699,813 | | | $ | 330,037,613 | |
| | | | | | | | | | | | | | | | |
| | | | | | | | | | | | | | | | |
| | | Year Ended
12/31/19 | | | Year Ended
12/31/18 | |
| LifePath Index 2060 Fund | | Shares | | | Amount | | | Shares | | | Amount | |
Institutional | |
Shares sold | | | 769,062 | | | $ | 10,701,713 | | | | 282,879 | | | $ | 3,835,618 | |
Shares issued in reinvestment of distributions | | | 13,578 | | | | 198,331 | | | | 4,187 | | | | 54,600 | |
Shares redeemed | | | (271,175 | ) | | | (3,774,832 | ) | | | (135,209 | ) | | | (1,727,284 | ) |
| | | | | | | | | | | | | | | | |
Net increase | | | 511,465 | | | $ | 7,125,212 | | | | 151,857 | | | $ | 2,162,934 | |
| | | | | | | | | | | | | | | | |
| | | | |
| NOTESTO FINANCIAL STATEMENTS | | | 89 | |
Notes to Financial Statements (continued)
| | | | | | | | | | | | | | | | |
| | | Year Ended
12/31/19 | | | Year Ended
12/31/18 | |
| LifePath Index 2060 Fund | | Shares | | | Amount | | | Shares | | | Amount | |
| | | | |
Investor A | | | | | | | | | | | | | | | | |
Shares sold | | | 552,935 | | | $ | 7,707,090 | | | | 287,980 | | | $ | 3,809,813 | |
Shares issued in reinvestment of distributions | | | 15,283 | | | | 221,349 | | | | 4,959 | | | | 64,121 | |
Shares redeemed | | | (171,832 | ) | | | (2,426,776 | ) | | | (152,560 | ) | | | (2,014,458 | ) |
| | | | | | | | | | | | | | | | |
Net increase | | | 396,386 | | | $ | 5,501,663 | | | | 140,379 | | | $ | 1,859,476 | |
| | | | | | | | | | | | | | | | |
| | | | |
Class K | | | | | | | | | | | | | | | | |
Shares sold | | | 16,256,353 | | | $ | 227,305,816 | | | | 9,592,596 | | | $ | 129,240,676 | |
Shares issued in reinvestment of distributions | | | 551,181 | | | | 8,000,911 | | | | 210,669 | | | | 2,729,831 | |
Shares redeemed | | | (3,493,925 | ) | | | (48,511,972 | ) | | | (2,717,537 | ) | | | (36,917,240 | ) |
| | | | | | | | | | | | | | | | |
Net increase | | | 13,313,609 | | | $ | 186,794,755 | | | | 7,085,728 | | | $ | 95,053,267 | |
| | | | | | | | | | | | | | | | |
| | |
| | | | | | Period from
08/06/18 (a)
12/31/18 | |
Investor P | | | | | | | | | | | | | | | | |
Shares sold | | | 125,007 | | | $ | 1,749,678 | | | | 21,274 | | | $ | 287,443 | |
Shares issued in reinvestment of distributions | | | 1,979 | | | | 28,925 | | | | 49 | | | | 598 | |
Shares redeemed | | | (12,575 | ) | | | (176,058 | ) | | | — | | | | — | |
| | | | | | | | | | | | | | | | |
Net increase | | | 114,411 | | | $ | 1,602,545 | | | | 21,323 | | | $ | 288,041 | |
| | | | | | | | | | | | | | | | |
Total Net Increase | | | 14,335,871 | | | $ | 201,024,175 | | | | 7,399,287 | | | $ | 99,363,718 | |
| | | | | | | | | | | | | | | | |
| | | | | | | | |
| | | Period from
10/30/19 (a)
12/31/19 | |
| LifePath Index 2065 Fund | | Shares | | | Amount | |
Institutional | |
Shares sold | | | 5,001 | | | $ | 50,010 | |
Shares redeemed | | | (1 | ) | | | (10 | ) |
| | | | | | | | |
Net increase | | | 5,000 | | | $ | 50,000 | |
| | | | | | | | |
| | |
Investor A | | | | | | | | |
Shares sold | | | 5,035 | | | $ | 50,360 | |
Shares issued in reinvestment of distributions | | | — | | | | 3 | |
Shares redeemed | | | (1 | ) | | | (10 | ) |
| | | | | | | | |
Net increase | | | 5,034 | | | $ | 50,353 | |
| | | | | | | | |
| | |
Class K | | | | | | | | |
Shares sold | | | 184,319 | | | $ | 1,869,688 | |
Shares issued in reinvestment of distributions | | | 861 | | | | 9,028 | |
Shares redeemed | | | (144 | ) | | | (1,492 | ) |
| | | | | | | | |
Net increase | | | 185,036 | | | $ | 1,877,224 | |
| | | | | | | | |
| | |
Investor P | | | | | | | | |
Shares sold | | | 5,001 | | | $ | 50,010 | |
Shares redeemed | | | (1 | ) | | | (10 | ) |
| | | | | | | | |
Net increase | | | 5,000 | | | $ | 50,000 | |
| | | | | | | | |
Total Net Increase | | | 200,070 | | | $ | 2,027,577 | |
| | | | | | | | |
| | (a) | Commencement of operations. | |
| | |
| 90 | | 2019 BLACKROCK ANNUAL REPORTTO SHAREHOLDERS |
Notes to Financial Statements (continued)
As of December 31, 2019, shares owned by BlackRock Financial Management, Inc., an affiliate of the LifePath Index Funds, were as follows:
| | | | | | | | | | | | | | | | |
| | | Institutional | | | Investor A | | | Class K | | | Investor P | |
LifePath Index Retirement Fund | | | — | | | | — | | | | — | | | | 32,483 | |
LifePath Index 2025 Fund | | | — | | | | — | | | | — | | | | 14,948 | |
LifePath Index 2030 Fund | | | — | | | | — | | | | — | | | | 14,524 | |
LifePath Index 2035 Fund | | | — | | | | — | | | | — | | | | 14,025 | |
LifePath Index 2040 Fund | | | — | | | | — | | | | — | | | | 13,661 | |
LifePath Index 2045 Fund | | | — | | | | — | | | | — | | | | 13,289 | |
LifePath Index 2050 Fund | | | — | | | | — | | | | — | | | | 13,072 | |
LifePath Index 2055 Fund | | | — | | | | — | | | | — | | | | 12,821 | |
LifePath Index 2060 Fund | | | — | | | | — | | | | — | | | | 14,482 | |
LifePath Index 2065 Fund | | | 5,000 | | | | 5,000 | | | | 85,000 | | | | 5,000 | |
Management has evaluated the impact of all subsequent events on the LifePath Index Funds through the date the financial statements were issued and has determined that there were no subsequent events requiring adjustment or additional disclosure in the financial statements.
| | | | |
| NOTESTO FINANCIAL STATEMENTS | | | 91 | |
| | |
| Report of Independent Registered Public Accounting Firm | | BlackRock Funds III |
To the Board of Trustees of
BlackRock Funds III and Shareholders of each of the ten series listed in the table below
Opinions on the Financial Statements
We have audited the accompanying statements of assets and liabilities of each of the series listed in the table below (ten of the series constituting BlackRock Funds III, hereafter collectively referred to as the “Funds”) as of December 31, 2019, the related statements of operations and of changes in net assets for each of the periods indicated in the table below, including the related notes, and the financial highlights for each of the periods indicated in the table below (collectively referred to as the “financial statements”). In our opinion, the financial statements present fairly, in all material respects, the financial position of each of the Funds as of December 31, 2019, the results of each of their operations, the changes in each of their net assets, and each of the financial highlights for each of the periods indicated in the table below, in conformity with accounting principles generally accepted in the United States of America.
| | | | | | |
| Fund | | Statement of operations | | Statement of changes in net assets | | Financial highlights |
BlackRock LifePath® Index Retirement Fund BlackRock LifePath® Index 2025 Fund BlackRock LifePath® Index 2030 Fund BlackRock LifePath® Index 2035 Fund BlackRock LifePath® Index 2040 Fund BlackRock LifePath® Index 2045 Fund BlackRock LifePath® Index 2050 Fund BlackRock LifePath® Index 2055 Fund BlackRock LifePath® Index 2060 Fund | | For the year ended December 31, 2019 | | For the years ended December 31, 2019 and 2018 | | For each of the periods indicated therein |
BlackRock LifePath® Index 2065 Fund | | For the period October 30, 2019 (commencement of operations) through December 31, 2019 |
Basis for Opinions
These financial statements are the responsibility of the Funds’ management. Our responsibility is to express an opinion on the Funds’ financial statements based on our audits. We are a public accounting firm registered with the Public Company Accounting Oversight Board (United States) (“PCAOB”) and are required to be independent with respect to the Funds in accordance with the U.S. federal securities laws and the applicable rules and regulations of the Securities and Exchange Commission and the PCAOB.
We conducted our audits of these financial statements in accordance with the standards of the PCAOB. Those standards require that we plan and perform the audit to obtain reasonable assurance about whether the financial statements are free of material misstatement, whether due to error or fraud.
Our audits included performing procedures to assess the risks of material misstatement of the financial statements, whether due to error or fraud, and performing procedures that respond to those risks. Such procedures included examining, on a test basis, evidence regarding the amounts and disclosures in the financial statements. Our audits also included evaluating the accounting principles used and significant estimates made by management, as well as evaluating the overall presentation of the financial statements. Our procedures included confirmation of securities owned as of December 31, 2019 by correspondence with the administrator of the Master Portfolios. We believe that our audits provide a reasonable basis for our opinions.
/s/PricewaterhouseCoopers LLP
Philadelphia, Pennsylvania
February 27, 2020
We have served as the auditor of one or more BlackRock investment companies since 2000.
| | |
| 92 | | 2019 BLACKROCK ANNUAL REPORTTO SHAREHOLDERS |
Important Tax Information (unaudited)
During the fiscal year ended December 31, 2019, the following information is provided with respect to the ordinary income distributions paid:
| | | | | | | | | | | | | | | | | | | | | | | | | | | | | | | | | | | | | | | | | | | | |
| | | LifePath
Index
Retirement
Fund | | | LifePath
Index
2020
Fund (a) | | | LifePath
Index
2025
Fund | | | LifePath
Index
2030
Fund | | | LifePath
Index
2035
Fund | | | LifePath
Index
2040
Fund | | | LifePath
Index
2045
Fund | | | LifePath
Index
2050
Fund | | | LifePath
Index
2055
Fund | | | LifePath
Index
2060
Fund | | | LifePath
Index
2065
Fund | |
Qualified Dividend Income for Individuals(b) | | | 29.73 | % | | | 25.58 | % | | | 35.98 | % | | | 41.98 | % | | | 49.88 | % | | | 51.33 | % | | | 60.08 | % | | | 59.17 | % | | | 61.86 | % | | | 64.12 | % | | | 62.98 | % |
Qualified Business Income(b) | | | 0.32 | | | | 0.77 | | | | 2.20 | | | | 2.80 | | | | 4.49 | | | | 4.26 | | | | 6.26 | | | | 5.77 | | | | 5.95 | | | | 4.42 | | | | — | |
Dividends Qualifying for the Dividend Received Deduction for Corporations(b) | | | 13.10 | | | | 17.10 | | | | 18.09 | | | | 20.56 | | | | 23.56 | | | | 24.10 | | | | 27.39 | | | | 26.88 | | | | 27.64 | | | | 27.52 | | | | 14.17 | |
Federal Obligation Interest(c) | | | 19.06 | | | | 22.53 | | | | 15.67 | | | | 11.00 | | | | 7.87 | | | | 4.04 | | | | 1.87 | | | | 0.68 | | | | 0.65 | | | | 0.67 | | | | 1.79 | |
Interest Related Dividends and Short-Term Capital Gains forNon-U.S. Residents(d) | | | 49.07 | | | | 57.87 | | | | 40.83 | | | | 35.30 | | | | 21.94 | | | | 21.55 | | | | 6.44 | | | | 9.17 | | | | 3.96 | | | | 1.49 | | | | 5.07 | |
| | (a) | Effective November 18, 2019, LifePath® Index 2020 Fund reorganized into LifePath Index Retirement Fund. | |
| | (b) | The LifePath Index Funds hereby designate the percentages indicated above or the maximum amount allowable by law. | |
| | (c) | The law varies in each state as to whether and what percentage of dividend income attributable to federal obligations is exempt from state income tax. We recommend that you consult your tax advisor to determine if any portion of the dividends you received is exempt from state income taxes. | |
| | (d) | Represents the portion of the taxable ordinary income dividends eligible for exemption from U.S. withholding tax for nonresident aliens and foreign corporations. | |
Additionally, the LifePath Index Funds distributed long-term capital gains per-share to shareholder of record as follows:
| | | | | | | | | | | | | | | | | | | | | | | | | | | | | | | | | | | | | | | | | | | | | | |
| | | Record
Date | | LifePath
Index
Retirement
Fund | | | LifePath
Index 2020
Fund (a) | | | LifePath
Index 2025 Fund | | | LifePath
Index 2030 Fund | | | LifePath
Index 2035 Fund | | | LifePath
Index 2040 Fund | | | LifePath
Index 2045 Fund | | | LifePath
Index 2050 Fund | | | LifePath
Index 2055 Fund | | | LifePath
Index
2060
Fund | | | LifePath
Index
2065
Fund | |
Long-Term Capital Gains Per Share | | 6/27/2019 | | $ | — | | | $ | — | | | $ | 0.0105700 | | | $ | — | | | $ | 0.0126430 | | | $ | — | | | $ | 0.0109960 | | | $ | — | | | $ | — | | | $ | — | | | $ | — | |
| | 11/12/2019 | | | — | | | | 0.0256950 | | | | — | | | | — | | | | — | | | | — | | | | — | | | | — | | | | — | | | | — | | | | — | |
| | | 12/30/2019 | | | 0.0049900 | | | | — | | | | 0.0284440 | | | | 0.0491030 | | | | 0.0758570 | | | | 0.0487040 | | | | 0.0894010 | | | | 0.0687900 | | | | 0.0464410 | | | | — | | | | — | |
| | | | |
| IMPORTANT TAX INFORMATION | | | 93 | |
| | |
| Master Portfolio Information as of December 31, 2019 | | |
LifePath® Index Retirement Master Portfolio
PORTFOLIO COMPOSITION
| | | | |
| Asset Type | | Percent of
Net Assets | |
Fixed Income Funds | | | 60 | % |
Equity Funds | | | 40 | |
TEN LARGEST HOLDINGS
| | | | |
| Holdings | | Percent of
Net Assets | |
U.S. Total Bond Index Master Portfolio | | | 52 | % |
Large Cap Index Master Portfolio | | | 22 | |
iShares Core MSCI Total International Stock ETF | | | 12 | |
iShares TIPS Bond ETF | | | 8 | |
Master Small Cap Index Series | | | 3 | |
iShares Developed Real Estate Index Fund — Class K | | | 2 | |
LifePath® Index 2025 Master Portfolio
PORTFOLIO COMPOSITION
| | | | |
| Asset Type | | Percent of
Net Assets | |
Equity Funds | | | 54 | % |
Fixed Income Funds | | | 46 | |
Short-Term Securities | | | 1 | |
Liabilities in Excess of Other Assets | | | (1 | ) |
TEN LARGEST HOLDINGS
| | | | |
| Holdings | | Percent of
Net Assets | |
U.S. Total Bond Index Master Portfolio | | | 38 | % |
Large Cap Index Master Portfolio | | | 29 | |
iShares Core MSCI Total International Stock ETF | | | 19 | |
iShares TIPS Bond ETF | | | 7 | |
Master Small Cap Index Series | | | 3 | |
iShares Developed Real Estate Index Fund — Class K | | | 2 | |
LifePath® Index 2030 Master Portfolio
PORTFOLIO COMPOSITION
| | | | |
| Asset Type | | Percent of
Net Assets | |
Equity Funds | | | 67 | % |
Fixed Income Funds | | | 33 | |
Short-Term Securities | | | 1 | |
Liabilities in Excess of Other Assets | | | (1 | ) |
TEN LARGEST HOLDINGS
| | | | |
| Holdings | | Percent of
Net Assets | |
Large Cap Index Master Portfolio | | | 36 | % |
U.S. Total Bond Index Master Portfolio | | | 27 | |
iShares Core MSCI Total International Stock ETF | | | 25 | |
iShares TIPS Bond ETF | | | 6 | |
iShares Developed Real Estate Index Fund — Class K | | | 3 | |
Master Small Cap Index Series | | | 3 | |
LifePath® Index 2035 Master Portfolio
PORTFOLIO COMPOSITION
| | | | |
| Asset Type | | Percent of
Net Assets | |
Equity Funds | | | 78 | % |
Fixed Income Funds | | | 22 | |
Short-Term Securities | | | 1 | |
Liabilities in Excess of Other Assets | | | (1 | ) |
TEN LARGEST HOLDINGS
| | | | |
| Holdings | | Percent of
Net Assets | |
Large Cap Index Master Portfolio | | | 41 | % |
iShares Core MSCI Total International Stock ETF | | | 30 | |
U.S. Total Bond Index Master Portfolio | | | 17 | |
iShares TIPS Bond ETF | | | 5 | |
iShares Developed Real Estate Index Fund — Class K | | | 4 | |
Master Small Cap Index Series | | | 2 | |
The LifePath Index Master Portfolios’ allocations and holdings listed above are current as of the report date. However, the LifePath Index Master Portfolios are regularly monitored and their composition may vary throughout various periods.
| | |
| 94 | | 2019 BLACKROCK ANNUAL REPORTTO SHAREHOLDERS |
Master Portfolio Information as of December 31, 2019 (continued)
LifePath® Index 2040 Master Portfolio
PORTFOLIO COMPOSITION
| | | | |
| Asset Type | | Percent of
Net Assets | |
Equity Funds | | | 88 | % |
Fixed Income Funds | | | 12 | |
TEN LARGEST HOLDINGS
| | | | |
| Holdings | | Percent of
Net Assets | |
Large Cap Index Master Portfolio | | | 47 | % |
iShares Core MSCI Total International Stock ETF | | | 35 | |
U.S. Total Bond Index Master Portfolio | | | 8 | |
iShares Developed Real Estate Index Fund — Class K | | | 4 | |
iShares TIPS Bond ETF | | | 3 | |
Master Small Cap Index Series | | | 2 | |
LifePath® Index 2045 Master Portfolio
PORTFOLIO COMPOSITION
| | | | |
| Asset Type | | Percent of
Net Assets | |
Equity Funds | | | 95 | % |
Fixed Income Funds | | | 4 | |
Short-Term Securities | | | 1 | |
TEN LARGEST HOLDINGS
| | | | |
| Holdings | | Percent of
Net Assets | |
Large Cap Index Master Portfolio | | | 50 | % |
iShares Core MSCI Total International Stock ETF | | | 38 | |
iShares Developed Real Estate Index Fund — Class K | | | 5 | |
U.S. Total Bond Index Master Portfolio | | | 3 | |
Master Small Cap Index Series | | | 2 | |
iShares TIPS Bond ETF | | | 1 | |
LifePath® Index 2050 Master Portfolio
PORTFOLIO COMPOSITION
| | | | |
| Asset Type | | Percent of
Net Assets | |
Equity Funds | | | 98 | % |
Fixed Income Funds | | | 1 | |
Short-Term Securities | | | 1 | |
TEN LARGEST HOLDINGS
| | | | |
| Holdings | | Percent of
Net Assets | |
Large Cap Index Master Portfolio | | | 52 | % |
iShares Core MSCI Total International Stock ETF | | | 40 | |
iShares Developed Real Estate Index Fund — Class K | | | 5 | |
Master Small Cap Index Series | | | 2 | |
U.S. Total Bond Index Master Portfolio | | | 1 | |
LifePath® Index 2055 Master Portfolio
PORTFOLIO COMPOSITION
| | | | |
| Asset Type | | Percent of
Net Assets | |
Equity Funds | | | 99 | % |
Fixed Income Funds | | | 1 | |
TEN LARGEST HOLDINGS
| | | | |
| Holdings | | Percent of
Net Assets | |
Large Cap Index Master Portfolio | | | 52 | % |
iShares Core MSCI Total International Stock ETF | | | 40 | |
iShares Developed Real Estate Index Fund — Class K | | | 5 | |
Master Small Cap Index Series | | | 2 | |
U.S. Total Bond Index Master Portfolio | | | 1 | |
The LifePath Index Master Portfolios’ allocations and holdings listed above are current as of the report date. However, the LifePath Index Master Portfolios are regularly monitored and their composition may vary throughout various periods.
| | | | |
| MASTER PORTFOLIO INFORMATION | | | 95 | |
Master Portfolio Information as of December 31, 2019 (continued)
LifePath® Index 2060 Master Portfolio
PORTFOLIO COMPOSITION
| | | | |
| Asset Type | | Percent of
Net Assets | |
Equity Funds | | | 99 | % |
Fixed Income Funds | | | 1 | |
Short-Term Securities | | | 1 | |
Liabilities in Excess of Other Assets | | | (1 | ) |
TEN LARGEST HOLDINGS
| | | | |
| Holdings | | Percent of
Net Assets | |
Large Cap Index Master Portfolio | | | 52 | % |
iShares Core MSCI Total International Stock ETF | | | 40 | |
iShares Developed Real Estate Index Fund — Class K | | | 5 | |
Master Small Cap Index Series | | | 2 | |
U.S. Total Bond Index Master Portfolio | | | 1 | |
LifePath® Index 2065 Master Portfolio
PORTFOLIO COMPOSITION
| | | | |
| Asset Type | | Percent of
Net Assets | |
Equity Funds | | | 98 | % |
Short-Term Securities | | | 5 | |
Fixed Income Funds | | | 1 | |
Liabilities in Excess of Other Assets | | | (4 | ) |
TEN LARGEST HOLDINGS
| | | | |
| Holdings | | Percent of
Net Assets | |
Large Cap Index Master Portfolio | | | 52 | % |
iShares Core MSCI Total International Stock ETF | | | 40 | |
iShares Developed Real Estate Index Fund — Class K | | | 5 | |
Master Small Cap Index Series | | | 2 | |
U.S. Total Bond Index Master Portfolio | | | 1 | |
The LifePath Index Master Portfolios’ allocations and holdings listed above are current as of the report date. However, the LifePath Index Master Portfolios are regularly monitored and their composition may vary throughout various periods.
| | |
| 96 | | 2019 BLACKROCK ANNUAL REPORTTO SHAREHOLDERS |
| | |
Schedule of Investments December 31, 2019 | | LifePath® Index Retirement Master Portfolio (Percentages shown are based on Net Assets) |
| | | | | | | | |
| Security | | Shares | | | Value | |
Affiliated Investment Companies(b) — 100.0% | |
|
| Equity Funds — 40.1% | |
iShares Core MSCI Total International Stock ETF | | | 15,808,802 | | | $ | 978,564,844 | |
iShares Developed Real Estate Index Fund — Class K | | | 15,414,657 | | | | 169,252,930 | |
| | |
| | | Investment
Value | | | | |
Large Cap Index Master Portfolio | | $ | 1,737,789,980 | | | | 1,737,789,980 | |
Master Small Cap Index Series | | | 265,071,806 | | | | 265,071,806 | |
| | | | | | | | |
| | | | 3,150,679,560 | |
| | |
| | | Shares | | | | |
|
| Fixed Income Funds — 59.7% | |
iShares TIPS Bond ETF | | | 5,337,745 | | | | 622,220,935 | |
| | |
| | | Investment
Value | | | | |
U.S. Total Bond Index Master Portfolio | | $ | 4,063,455,945 | | | | 4,063,455,945 | |
| | | | | | | | |
| | | | 4,685,676,880 | |
| | | | | | | | |
| Security | | Shares | | | Value | |
|
| Short-Term Securities — 0.2% | |
BlackRock Cash Funds: Treasury,
SL Agency Shares, | | | | | | | | |
1.55%(a)(b) | | | 13,511,588 | | | $ | 13,511,588 | |
| | | | | | | | |
| |
Total Affiliated Investment Companies — 100.0%
(Cost — $7,007,261,984) | | | | 7,849,868,028 | |
| |
Other Assets Less Liabilities — 0.0% | | | | 2,251,400 | |
| | | | | | | | |
| |
Net Assets — 100.0% | | | $ | 7,852,119,428 | |
| | | | | | | | |
| (a) | Annualized7-day yield as of period end. |
| (b) | During the year ended December 31, 2019, investments in issuers considered to be an affiliate/affiliates of the LifePath Index Master Portfolio for purposes of Section 2(a)(3) of the Investment Company Act of 1940, as amended, and/or related parties of the LifePath Index Master Portfolio were as follows: |
| | | | | | | | | | | | | | | | | | | | | | | | | | | | | | | | |
| Affiliated Persons and/or Related Parties | | Share/
Investment
Value Held at
12/31/18 | | | Share/
Investment
Value
Purchased | | | Share/
Investment
Value Sold | | | Share/
Investment
Value Held at
12/31/19 | | | Value at
12/31/19 | | | Income | | | Net
Realized
Gain (Loss) (a) | | | Change in
Unrealized
Appreciation
(Depreciation) | |
BlackRock Cash Funds: Institutional,
SL Agency Shares(b) | | | — | | | | — | | | | — | | | | — | | | $ | — | | | $ | 25,713 | (c) | | $ | 10,165 | | | $ | — | |
BlackRock Cash Funds: Treasury,
SL Agency Shares | | | 1,590,845 | | | | 11,920,743 | (d) | | | — | | | | 13,511,588 | | | | 13,511,588 | | | | 114,801 | | | | — | | | | — | |
iShares Core MSCI Total International Stock ETF | | | 5,943,594 | | | | 11,230,086 | | | | (1,364,878 | ) | | | 15,808,802 | | | | 978,564,844 | | | | 20,735,847 | | | | (1,383,732 | ) | | | 71,607,937 | |
iShares Developed Real Estate Index Fund —Class K | | | 1,198,043 | | | | 14,351,682 | | | | (135,068 | ) | | | 15,414,657 | | | | 169,252,930 | | | | 7,079,246 | | | | (41,905 | ) | | | (634,281 | ) |
iShares TIPS Bond ETF | | | 1,868,876 | | | | 3,667,632 | | | | (198,763 | ) | | | 5,337,745 | | | | 622,220,935 | | | | 4,447,133 | | | | (233,512 | ) | | | 15,905,295 | |
Large Cap Index Master Portfolio | | $ | 512,645,381 | | | $ | 1,225,144,599 | (d) | | $ | — | | | $ | 1,737,789,980 | | | | 1,737,789,980 | | | | 13,743,145 | | | | 2,783,947 | | | | 283,057,280 | |
Master Small Cap Index Series | | $ | 82,325,044 | | | $ | 182,746,762 | (d) | | $ | — | | | $ | 265,071,806 | | | | 265,071,806 | | | | 1,714,252 | | | | 5,799,083 | | | | 36,271,503 | |
U.S. Total Bond Index Master Portfolio(d) | | $ | 1,175,114,516 | | | $ | 2,888,341,429 | (d) | | $ | — | | | $ | 4,063,455,945 | | | | 4,063,455,945 | | | | 48,499,630 | | | | 7,017,303 | | | | (53,603,868 | ) |
| | | | | | | | | | | | | | | | | | | | | | | | | | | | | | | | |
| | | $ | 7,849,868,028 | | | $ | 96,359,767 | | | $ | 13,951,349 | | | $ | 352,603,866 | |
| | | | | | | | | | | | | | | | | |
| | (a) | Includes net capital gain distributions, if applicable. | |
| | (b) | As of period end, the entity is no longer held by the LifePath Index Master Portfolio. | |
| | (c) | Represents securities lending income earned from the reinvestment of cash collateral from loaned securities, net of fees and collateral investment expenses, and other payments to and from borrowers of securities. | |
| | (d) | Represents net shares/investment value purchased (sold). | |
Fair Value Hierarchy as of Period End
Various inputs are used in determining the fair value of investments. For information about the LifePath Index Master Portfolio’s policy regarding valuation of investments, refer to the Notes to Financial Statements.
The following table summarizes the LifePath Index Master Portfolio’s investments categorized in the disclosure hierarchy:
| | | | | | | | | | | | | | | | |
| | | Level 1 | | | Level 2 | | | Level 3 | | | Total | |
Assets: | |
Investments: | |
Affiliated Investment Companies | | $ | 1,770,038,709 | | | $ | — | | | $ | — | | | $ | 1,770,038,709 | |
Short-Term Securities | | | 13,511,588 | | | | — | | | | — | | | | 13,511,588 | |
| | | | | | | | | | | | | | | | |
Subtotal | | $ | 1,783,550,297 | | | $ | — | | | $ | — | | | $ | 1,783,550,297 | |
| | | | | | | | | | | | | | | | |
Investments Valued at NAV(a) | | | | | | | | | | | | | | | 6,066,317,731 | |
| | | | | | | | | | | | | | | | |
Total Investment | | | | | | | | | | | | | | $ | 7,849,868,028 | |
| | | | | | | | | | | | | | | | |
| | (a) | Certain investments of the LifePath Index Master Portfolio were fair valued using NAV per share as no quoted market value is available and therefore have been excluded from the fair value hierarchy. | |
See notes to financial statements.
| | | | |
| SCHEDULES OF INVESTMENTS | | | 97 | |
| | |
Schedule of Investments December 31, 2019 | | LifePath® Index 2025 Master Portfolio (Percentages shown are based on Net Assets) |
| | | | | | | | |
| Security | | Shares | | | Value | |
|
Affiliated Investment Companies(d) — 100.4% | |
|
| Equity Funds — 54.2% | |
iShares Core MSCI Total International Stock ETF(a) | | | 14,073,602 | | | $ | 871,155,964 | |
iShares Developed Real Estate Index Fund — Class K | | | 10,216,687 | | | | 112,179,226 | |
| | |
| | | Investment
Value | | | | |
Large Cap Index Master Portfolio | | $ | 1,325,331,185 | | | | 1,325,331,185 | |
Master Small Cap Index Series | | | 139,303,151 | | | | 139,303,151 | |
| | | | | | | | |
| | | | 2,447,969,526 | |
| | |
| | | Shares | | | | |
|
| Fixed Income Funds — 45.5% | |
iShares TIPS Bond ETF | | | 2,753,755 | | | | 321,005,220 | |
| | |
| | | Investment
Value | | | | |
U.S. Total Bond Index Master Portfolio | | $ | 1,735,817,461 | | | | 1,735,817,461 | |
| | | | | | | | |
| | | | 2,056,822,681 | |
| | | | | | | | |
| Security | | Shares | | | Value | |
|
| Short-Term Securities — 0.7% | |
BlackRock Cash Funds: Institutional,
SL Agency Shares, | | | | | | | | |
1.87%(b)(c) | | | 16,280,625 | | | $ | 16,287,137 | |
BlackRock Cash Funds: Treasury,
SL Agency Shares, | | | | | | | | |
1.55%(b) | | | 17,412,435 | | | | 17,412,435 | |
| | | | | | | | |
| | | | 33,699,572 | |
| | | | | | | | |
| |
Total Affiliated Investment Companies — 100.4%
(Cost — $3,993,576,891) | | | | 4,538,491,779 | |
| |
Liabilities in Excess of Other Assets — (0.4)% | | | | (19,787,892 | ) |
| | | | | | | | |
| |
Net Assets — 100.0% | | | $ | 4,518,703,887 | |
| | | | | | | | |
| (a) | Security, or a portion of the security, is on loan. |
| (b) | Annualized7-day yield as of period end. |
| (c) | Security was purchased with the cash collateral from loaned securities. |
| (d) | During the year ended December 31, 2019, investments in issuers considered to be an affiliate/affiliates of the LifePath Index Master Portfolio for purposes of Section 2(a)(3) of the Investment Company Act of 1940, as amended, and/or related parties of the LifePath Index Master Portfolio were as follows: |
| | | | | | | | | | | | | | | | | | | | | | | | | | | | | | | | |
| Affiliated Persons and/or Related Parties | | Shares/
Investment
Value Held at
12/31/18 | | | Shares/
Investment
Value
Purchased | | | Shares/
Investment
Value Sold | | | Shares/
Investment
Value Held at
12/31/19 | | | Value at
12/31/19 | | | Income | | | Net Realized
Gain (Loss) (a) | | | Change in
Unrealized
Appreciation
(Depreciation) | |
BlackRock Cash Funds: Institutional,
SL Agency Shares | | | 100,607,389 | | | | — | | | | (84,326,764 | )(b) | | | 16,280,625 | | | $ | 16,287,137 | | | $ | 51,640 | (c) | | $ | 3,219 | | | $ | — | |
BlackRock Cash Funds: Treasury,
SL Agency Shares | | | 4,824,684 | | | | 12,587,751 | (b) | | | — | | | | 17,412,435 | | | | 17,412,435 | | | | 204,462 | | | | — | | | | — | |
iShares Core MSCI Total International Stock ETF | | | 10,828,697 | | | | 4,399,405 | | | | (1,154,500 | ) | | | 14,073,602 | | | | 871,155,964 | | | | 25,355,422 | | | | (5,254,327 | ) | | | 123,127,282 | |
iShares Developed Real Estate Index Fund — Class K | | | 13,695,574 | | | | 2,852,270 | | | | (6,331,157 | ) | | | 10,216,687 | | | | 112,179,226 | | | | 7,674,855 | | | | 4,058,400 | | | | 15,640,738 | |
iShares TIPS Bond ETF | | | 1,656,912 | | | | 1,104,543 | | | | (7,700 | ) | | | 2,753,755 | | | | 321,005,220 | | | | 4,497,152 | | | | (52,665 | ) | | | 13,714,131 | |
Large Cap Index Master Portfolio | | $ | 921,599,026 | | | $ | 403,732,159 | (b) | | $ | — | | | $ | 1,325,331,185 | | | | 1,325,331,185 | | | | 21,886,176 | | | | 6,622,138 | | | | 278,873,532 | |
Master Small Cap Index Series | | $ | 85,646,564 | | | $ | 53,656,587 | (b) | | $ | — | | | $ | 139,303,151 | | | | 139,303,151 | | | | 1,673,908 | | | | 7,393,989 | | | | 20,231,915 | |
Total International ex U.S. Index Master Portfolio(d) | | $ | — | | | $ | — | (b) | | $ | — | | | $ | — | | | | — | | | | — | | | | 6,622,987 | | | | — | |
U.S. Total Bond Index Master Portfolio | | $ | 1,104,362,670 | | | $ | 631,454,791 | (b) | | $ | — | | | $ | 1,735,817,461 | | | | 1,735,817,461 | | | | 41,283,366 | | | | 864,330 | | | | 58,560,679 | |
| | | | | | | | | | | | | | | | | | | | | | | | | | | | | | | | |
| | | $ | 4,538,491,779 | | | $ | 102,626,981 | | | $ | 20,258,071 | | | $ | 510,148,277 | |
| | | | | | | | | | | | | | | | | |
| | (a) | Includes net capital gain distributions, if applicable. | |
| | (b) | Represents net shares/investment value purchased (sold). | |
| | (c) | All or a portion represents securities lending income earned from the reinvestment of cash collateral from loaned securities, net of fees and collateral investment expenses, and other payments to and from borrowers of securities. | |
| | (d) | As of period end, the entity is no longer held by the LifePath Index Master Portfolio. | |
| | |
| 98 | | 2019 BLACKROCK ANNUAL REPORTTO SHAREHOLDERS |
| | |
Schedule of Investments (continued) December 31, 2019 | | LifePath® Index 2025 Master Portfolio |
Fair Value Hierarchy as of Period End
Various inputs are used in determining the fair value of investments. For information about the LifePath Index Master Portfolio’s policy regarding valuation of investments, refer to the Notes to Financial Statements.
The following table summarizes the LifePath Index Master Portfolio’s investments categorized in the disclosure hierarchy:
| | | | | | | | | | | | | | | | |
| | | Level 1 | | | Level 2 | | | Level 3 | | | Total | |
Assets: | |
Investments: | |
Affiliated Investment Companies | | $ | 1,304,340,410 | | | $ | — | | | $ | — | | | $ | 1,304,340,410 | |
Short-Term Securities | | | 33,699,572 | | | | — | | | | — | | | | 33,699,572 | |
| | | | | | | | | | | | | | | | |
Subtotal | | $ | 1,338,039,982 | | | $ | — | | | $ | — | | | $ | 1,338,039,982 | |
| | | | | | | | | | | | | | | | |
Investments Valued at NAV(a) | | | | | | | | | | | | | | | 3,200,451,797 | |
| | | | | | | | | | | | | | | | |
Total Investments | | | | | | | | | | | | | | $ | 4,538,491,779 | |
| | | | | | | | | | | | | | | | |
| | (a) | Certain investments of the LifePath Index Master Portfolio’s were fair valued using NAV per share as no quoted market value is available and therefore have been excluded from the fair value hierarchy. | |
See notes to financial statements.
| | | | |
| SCHEDULES OF INVESTMENTS | | | 99 | |
| | |
Schedule of Investments December 31, 2019 | | LifePath® Index 2030 Master Portfolio (Percentages shown are based on Net Assets) |
| | | | | | | | |
| Security | | Shares | | | Value | |
Affiliated Investment Companies(d) — 100.6% | |
|
| Equity Funds — 66.5% | |
iShares Core MSCI Total International Stock ETF(a) | | | 31,562,193 | | | $ | 1,953,699,747 | |
iShares Developed Real Estate Index Fund — Class K | | | 21,819,496 | | | | 239,578,070 | |
| | |
| | | Investment
Value | | | | |
Large Cap Index Master Portfolio | | $ | 2,782,798,842 | | | | 2,782,798,842 | |
Master Small Cap Index Series | | | 215,331,988 | | | | 215,331,988 | |
| | | | | | | | |
| | | | 5,191,408,647 | |
| | |
| | | Shares | | | | |
|
| Fixed Income Funds — 33.2% | |
iShares TIPS Bond ETF(a) | | | 4,056,402 | | | | 472,854,781 | |
| | |
| | | Investment
Value | | | | |
U.S. Total Bond Index Master Portfolio | | $ | 2,122,135,033 | | | | 2,122,135,033 | |
| | | | | | | | |
| | | | 2,594,989,814 | |
| | | | | | | | |
| Security | | Shares | | | Value | |
|
| Short-Term Securities — 0.9% | |
BlackRock Cash Funds: Institutional,
SL Agency Shares, | | | | | | | | |
1.87%(b)(c)(d) | | | 44,319,895 | | | $ | 44,337,623 | |
BlackRock Cash Funds: Treasury,
SL Agency Shares, | | | | | | | | |
1.55%(b)(d) | | | 23,229,450 | | | | 23,229,450 | |
| | | | | | | | |
| | | | 67,567,073 | |
| | | | | | | | |
| |
Total Affiliated Investment Companies — 100.6%
(Cost — $6,844,175,403) | | | | 7,853,965,534 | |
| |
Liabilities in Excess of Other Assets — (0.6)% | | | | (48,187,592 | ) |
| | | | | | | | |
| |
Net Assets — 100.0% | | | $ | 7,805,777,942 | |
| | | | | | | | |
| (a) | Security, or a portion of the security, is on loan. |
| (b) | Annualized7-day yield as of period end. |
| (c) | Security was purchased with the cash collateral from loaned securities. |
| (d) | During the year ended December 31, 2019, investments in issuers considered to be an affiliate/affiliates of the LifePath Index Master Portfolio for purposes of Section 2(a)(3) of the Investment Company Act of 1940, as amended, and/or related parties of the LifePath Index Master Portfolio were as follows: |
| | | | | | | | | | | | | | | | | | | | | | | | | | | | | | | | |
| Affiliated Persons and/or Related Parties | | Shares /investment
value held at
12/31/18 | | | Shares/ Investment value
Purchased | | | Shares/ Investment value Sold | | | Shares/ investment
Held at
12/31/19 | | | Value at
12/31/19 | | |
Income | | | Net
Realized
Gain (Loss) (a) | | | Change in
Unrealized
Appreciation
(Depreciation) | |
BlackRock Cash Funds: Institutional,
SL Agency Shares | | | 55,372,313 | | | | — | | | | (11,052,418 | )(b) | | | 44,319,895 | | | $ | 44,337,623 | | | $ | 74,451 | (c) | | $ | (5,577 | ) | | $ | — | |
BlackRock Cash Funds: Treasury,
SL Agency Shares | | | 6,015,670 | | | | 17,213,780 | (b) | | | — | | | | 23,229,450 | | | | 23,229,450 | | | | 342,935 | | | | — | | | | — | |
iShares Core MSCI Total International Stock ETF | | | 24,193,550 | | | | 8,919,319 | | | | (1,550,676 | ) | | | 31,562,193 | | | | 1,953,699,747 | | | | 56,451,333 | | | | (7,482,606 | ) | | | 267,743,496 | |
iShares Developed Real Estate Index Fund —Class K | | | 43,086,305 | | | | 4,559,529 | | | | (25,826,338 | ) | | | 21,819,496 | | | | 239,578,070 | | | | 18,131,518 | | | | 20,527,385 | | | | 38,924,908 | |
iShares TIPS Bond ETF | | | 2,270,994 | | | | 1,803,108 | | | | (17,700 | ) | | | 4,056,402 | | | | 472,854,781 | | | | 6,536,529 | | | | (133,708 | ) | | | 19,036,213 | |
Large Cap Index Master Portfolio | | $ | 2,075,075,786 | | | | 707,723,056 | (b) | | $ | — | | | $ | 2,782,798,842 | | | | 2,782,798,842 | | | | 46,947,122 | | | | 4,220,097 | | | | 812,760,192 | |
Master Small Cap Index Series | | $ | 136,355,981 | | | | 78,976,007 | (b) | | $ | — | | | $ | 215,331,988 | | | | 215,331,988 | | | | 2,676,072 | | | | 7,158,959 | | | | 34,858,393 | |
Total International ex U.S. Index Master Portfolio(d) | | $ | 9,822,080 | | | | — | | | $ | (9,822,080 | )(b) | | $ | — | | | | — | | | | 6,860 | | | | 11,068,593 | | | | (10,194,029 | ) |
U.S. Total Bond Index Master Portfolio | | $ | 1,572,076,760 | | | | 550,058,273 | (b) | | $ | — | | | $ | 2,122,135,033 | | | | 2,122,135,033 | | | | 53,569,240 | | | | 8,787,461 | | | | (120,008,748 | ) |
| | | | | | | | | | | | | | | | | | | | | | | | | | | | | | | | |
| | | | | | | | | | | | | | | | | | $ | 7,853,965,534 | | | $ | 184,736,060 | | | $ | 44,140,604 | | | $ | 1,043,120,425 | |
| | | | | | | | | | | | | | | | | | | | | | | | | | | | | | | | |
| | (a) | Includes net capital gain distributions, if applicable. | |
| | (b) | Represents net shares/investment value purchased/(sold). | |
| | (c) | All or a portion represents securities lending income earned from the reinvestment of cash collateral from loaned securities, net of fees and collateral investment expenses, and other payments to and from borrowers of securities. | |
| | (d) | As of period end, the entity is no longer held by the LifePath Index Master Portfolio. | |
| | |
| 100 | | 2019 BLACKROCK ANNUAL REPORTTO SHAREHOLDERS |
| | |
Schedule of Investments (continued) December 31, 2019 | | LifePath® Index 2030 Master Portfolio |
Fair Value Hierarchy as of Period End
Various inputs are used in determining the fair value of investments. For information about the LifePath Index Master Portfolio’s policy regarding valuation of investments, refer to the Notes to Financial Statements.
The following table summarizes the LifePath Index Master Portfolio’s investments categorized in the disclosure hierarchy:
| | | | | | | | | | | | | | | | |
| | | Level 1 | | | Level 2 | | | Level 3 | | | Total | |
Assets: | |
Investments: | |
Affiliated Investment Companies | | $ | 2,666,132,598 | | | $ | — | | | $ | — | | | $ | 2,666,132,598 | |
Short-Term Securities | | | 67,567,073 | | | | — | | | | — | | | | 67,567,073 | |
| | | | | | | | | | | | | | | | |
Subtotal | | $ | 2,733,699,671 | | | $ | — | | | $ | — | | | $ | 2,733,699,671 | |
| | | | | | | | | | | | | | | | |
Investments Valued at NAV(a) | | | | | | | | | | | | | | | 5,120,265,863 | |
| | | | | | | | | | | | | | | | |
Total Investments | | | | | | | | | | $ | 7,853,965,534 | |
| | | | | | | | | | | | | | | | |
| | (a) | Certain investments of the LifePath Index Master Portfolio were fair valued using NAV per share or its equivalent as no quoted market value is available and therefore have been excluded from the fair value hierarchy. | |
See notes to financial statements.
| | | | |
| SCHEDULES OF INVESTMENTS | | | 101 | |
| | |
Schedule of Investments December 31, 2019 | | LifePath® Index 2035 Master Portfolio (Percentages shown are based on Net Assets) |
| | | | | | | | |
| Security | | Shares | | | Value | |
|
Affiliated Investment Companies(d) — 100.5% | |
|
| Equity Funds — 77.8% | |
iShares Core MSCI Total International Stock ETF(a) | | | 19,972,829 | | | $ | 1,236,318,116 | |
iShares Developed Real Estate Index Fund — Class K | | | 13,541,220 | | | | 148,682,591 | |
| | |
| | | Investment
Value | | | | |
Large Cap Index Master Portfolio | | $ | 1,691,016,615 | | | | 1,691,016,615 | |
Master Small Cap Index Series | | | 100,199,137 | | | | 100,199,137 | |
| | | | | | | | |
| | | | 3,176,216,459 | |
| | |
| | | Shares | | | | |
|
| Fixed Income Funds — 21.9% | |
iShares TIPS Bond ETF | | | 1,633,849 | | | | 190,457,778 | |
| | |
| | | Investment
Value | | | | |
U.S. Total Bond Index Master Portfolio | | $ | 703,226,470 | | | | 703,226,470 | |
| | | | | | | | |
| | | | 893,684,248 | |
| | | | | | | | |
| Security | | Shares | | | Value | |
|
| Short-Term Securities — 0.8% | |
BlackRock Cash Funds: Institutional,
SL Agency Shares, | | | | | | | | |
1.87%(b)(c) | | | 21,576,681 | | | $ | 21,585,312 | |
BlackRock Cash Funds: Treasury,
SL Agency Shares, | | | | | | | | |
1.55%(c) | | | 11,982,921 | | | | 11,982,921 | |
| | | | | | | | |
| | | | 33,568,233 | |
| | | | | | | | |
| |
Total Affiliated Investment Companies — 100.5%
(Cost — $3,512,600,472) | | | | 4,103,468,940 | |
| |
Liabilities in Excess of Other Assets — (0.5)% | | | | (21,672,316 | ) |
| | | | | | | | |
| |
Net Assets — 100.0% | | | $ | 4,081,796,624 | |
| | | | | | | | |
| (a) | Security, or a portion of the security, is on loan. |
| (b) | Annualized7-day yield as of period end. |
| (c) | Security was purchased with the cash collateral from loaned securities. |
| (d) | During the year ended December 31, 2019, investments in issuers considered to be an affiliate/affiliates of the LifePath Index Master Portfolio for purposes of Section 2(a)(3) of the Investment Company Act of 1940, as amended, and/or related parties of the LifePath Index Master Portfolio were as follows: |
| | | | | | | | | | | | | | | | | | | | | | | | | | | | | | | | |
| Affiliated Persons and/or Related Parties | | Share/
Investment
Value Held at
12/31/18 | | | Share/
Investment
Value
Purchased | | | Share/
Investment
Value Sold | | | Share/
Investment
Value Held at
12/31/19 | | | Value at
12/31/19 | | | Income | | | Net
Realized
Gain (Loss) (a) | | | Change in
Unrealized
Appreciation
(Depreciation) | |
BlackRock Cash Funds: Institutional,
SL Agency Shares | | | — | | | | 21,576,681 | (b) | | | — | | | | 21,576,681 | | | $ | 21,585,312 | | | $ | 73,622 | (c) | | $ | 12,968 | | | $ | — | |
BlackRock Cash Funds: Treasury,
SL Agency Shares | | | 6,598,067 | | | | 5,384,854 | (b) | | | — | | | | 11,982,921 | | | | 11,982,921 | | | | 207,108 | | | | — | | | | — | |
iShares Core MSCI Total International Stock ETF | | | 12,341,347 | | | | 8,065,679 | | | | (434,197 | ) | | | 19,972,829 | | | | 1,236,318,116 | | | | 34,093,385 | | | | (2,207,384 | ) | | | 150,838,573 | |
iShares Developed Real Estate Index Fund — Class K | | | 26,571,467 | | | | 5,277,492 | | | | (18,307,739 | ) | | | 13,541,220 | | | | 148,682,591 | | | | 11,362,015 | | | | 11,790,036 | | | | 25,616,774 | |
iShares TIPS Bond ETF | | | 658,134 | | | | 977,515 | | | | (1,800 | ) | | | 1,633,849 | | | | 190,457,778 | | | | 2,397,629 | | | | (12,316 | ) | | | 6,261,132 | |
Large Cap Index Master Portfolio | | $ | 1,067,319,615 | | | $ | 623,697,000 | (b) | | $ | — | | | $ | 1,691,016,615 | | | | 1,691,016,615 | | | | 26,644,524 | | | | 3,984,956 | | | | 416,055,700 | |
Master Small Cap Index Series | | $ | 49,503,645 | | | $ | 50,695,492 | (b) | | $ | — | | | $ | 100,199,137 | | | | 100,199,137 | | | | 1,177,595 | | | | 2,986,626 | | | | 11,757,300 | |
Total International ex U.S. Index Master
Portfolio(d) | | $ | 10,368,490 | | | $ | — | | | $ | (10,368,490 | )(b) | | $ | — | | | | — | | | | 6,791 | | | | 6,383,056 | | | | (6,262,382 | ) |
U.S. Total Bond Index Master Portfolio | | $ | 481,658,994 | | | $ | 221,567,476 | (b) | | $ | — | | | $ | 703,226,470 | | | | 703,226,470 | | | | 17,201,146 | | | | 1,469,414 | | | | (45,530,009 | ) |
| | | | | | | | | | | | | | | | | | | | | | | | | | | | | | | | |
| | | $ | 4,103,468,940 | | | $ | 93,163,815 | | | $ | 24,407,356 | | | $ | 558,737,088 | |
| | | | | | | | | | | | | | | | | | | | | | | | | | | | | | | | |
| | (a) | Includes net capital gain distributions, if applicable. | |
| | (b) | Represents net shares/investment value purchased (sold). | |
| | (c) | All or a portion represents securities lending income earned from the reinvestment of cash collateral from loaned securities, net of fees and collateral investment expenses, and other payments to and from borrowers of securities. | |
| | (d) | As of period end, the entity is no longer held by the LifePath Index Master Portfolio. | |
| | |
| 102 | | 2019 BLACKROCK ANNUAL REPORTTO SHAREHOLDERS |
| | |
Schedule of Investments (continued) December 31, 2019 | | LifePath® Index 2035 Master Portfolio |
Fair Value Hierarchy as of Period End
Various inputs are used in determining the fair value of investments. For information about the LifePath Index Master Portfolio’s policy regarding valuation of investments, refer to the Notes to Financial Statements.
The following table summarizes the LifePath Index Master Portfolio’s investments categorized in the disclosure hierarchy:
| | | | | | | | | | | | | | | | |
| | | Level 1 | | | Level 2 | | | Level 3 | | | Total | |
Assets: | |
Investments: | |
Affiliated Investment Companies | | $ | 1,575,458,485 | | | $ | — | | | $ | — | | | $ | 1,575,458,485 | |
Short-Term Securities | | | 33,568,233 | | | | — | | | | — | | | | 33,568,233 | |
| | | | | | | | | | | | | | | | |
Subtotal | | $ | 1,609,026,718 | | | $ | — | | | $ | — | | | $ | 1,609,026,718 | |
| | | | | | | | | | | | | | | | |
Investments Valued at NAV(a) | | | | | | | | | | | | | | | 2,494,442,222 | |
| | | | | | | | | | | | | | | | |
Total Investments | | | | | | | | | | | | | | $ | 4,103,468,940 | |
| | | | | | | | | | | | | | | | |
| | (a) | Certain investments of the LifePath Index Master Portfolio were fair valued using NAV per share as no quoted market value is available and therefore have been excluded from the fair value hierarchy. | |
See notes to financial statements.
| | | | |
| SCHEDULES OF INVESTMENTS | | | 103 | |
| | |
Schedule of Investments December 31, 2019 | | LifePath® Index 2040 Master Portfolio (Percentages shown are based on Net Assets) |
| | | | | | | | |
| Security | |
Shares | | | Value | |
|
Affiliated Investment Companies(b) — 100.1% | |
|
| Equity Funds — 88.3% | |
iShares Core MSCI Total International Stock ETF | | | 35,066,941 | | | $ | 2,170,643,648 | |
iShares Developed Real Estate Index Fund — Class K | | | 23,378,698 | | | | 256,698,100 | |
| | |
| | | Investment
Value | | | | |
Large Cap Index Master Portfolio | | $ | 2,885,481,089 | | | $ | 2,885,481,089 | |
Master Small Cap Index Series | | | 135,100,281 | | | | 135,100,281 | |
| | | | | | | | |
| | | | 5,447,923,118 | |
| | |
| | | Shares | | | | |
|
| Fixed Income Funds — 11.5% | |
iShares TIPS Bond ETF | | | 1,608,347 | | | | 187,485,010 | |
| | | | | | | | |
| Security | | Investment
Value | | | Value | |
|
| Fixed Income Funds (continued) | |
U.S. Total Bond Index Master Portfolio | | $ | 521,851,101 | | | $ | 521,851,101 | |
| | | | | | | | |
| | | | 709,336,111 | |
| | |
| | | Shares | | | | |
|
| Short-Term Securities — 0.3% | |
BlackRock Cash Funds: Treasury,
SL Agency Shares, | | | | | | | | |
1.55%(a) | | | 18,155,509 | | | | 18,155,509 | |
| | | | | | | | |
| |
Total Affiliated Investment Companies — 100.1%
(Cost — $5,253,564,457) | | | | 6,175,414,738 | |
| |
Liabilities in Excess of Other Assets — (0.1)% | | | | (5,366,052 | ) |
| | | | | | | | |
| |
Net Assets — 100.0% | | | $ | 6,170,048,686 | |
| | | | | | | | |
| (a) | Annualized7-day yield as of period end. |
| (b) | During the year ended December 31, 2019, investments in issuers considered to be an affiliate/affiliates of the LifePath Index Master Portfolio for purposes of Section 2(a)(3) of the Investment Company Act of 1940, as amended, and/or related parties of the LifePath Index Master Portfolio were as follows: |
| | | | | | | | | | | | | | | | | | | | | | | | | | | | | | | | |
| Affiliated Persons and/or Related Parties | | Shares/
Investment
Held at
12/31/18 | | | Shares/
Investment
Purchased | | | Shares/
Investment
Sold | | | Shares/
Investment
Held at
12/31/19 | | | Value at
12/31/19 | | | Income | | | Net
Realized
Gain (Loss) (a) | | | Change in
Unrealized
Appreciation
(Depreciation) | |
BlackRock Cash Funds: Institutional,
SL Agency Shares | | | 27,557,510 | | | | — | | | | (27,557,510 | )(b) | | | — | | | $ | — | | | $ | 70,719 | (c) | | $ | 12,047 | | | $ | — | |
BlackRock Cash Funds: Treasury,
SL Agency Shares | | | 12,692,339 | | | | 5,463,170 | (b) | | | — | | | | 18,155,509 | | | | 18,155,509 | | | | 285,474 | | | | — | | | | — | |
iShares Core MSCI Total International Stock ETF | | | 23,629,833 | | | | 12,016,708 | | | | (579,600 | ) | | | 35,066,941 | | | | 2,170,643,648 | | | | 60,511,510 | | | | (3,213,825 | ) | | | 271,021,013 | |
iShares Developed Real Estate Index Fund —Class K | | | 55,923,183 | | | | 6,156,313 | | | | (38,700,798 | ) | | | 23,378,698 | | | | 256,698,100 | | | | 20,726,917 | | | | 30,107,088 | | | | 46,563,295 | |
iShares TIPS Bond ETF | | | 553,430 | | | | 1,060,817 | | | | (5,900 | ) | | | 1,608,347 | | | | 187,485,010 | | | | 2,279,870 | | | | (40,653 | ) | | | 5,509,450 | |
Large Cap Index Master Portfolio | | $ | 2,009,602,477 | | | $ | 875,878,612 | (b) | | $ | — | | | $ | 2,885,481,089 | | | | 2,885,481,089 | | | | 47,127,484 | | | | 2,238,078 | | | | 676,853,904 | |
Master Small Cap Index Series | | $ | 64,274,485 | | | $ | 70,825,796 | (b) | | $ | — | | | $ | 135,100,281 | | | | 135,100,281 | | | | 1,629,819 | | | | 3,748,082 | | | | 12,135,396 | |
Total International ex U.S. Index Master Portfolio(d) | | $ | 3,378,402 | | | $ | — | | | $ | (3,378,402 | )(b) | | $ | — | | | | — | | | | — | | | | 6,563,588 | | | | (5,217,377 | ) |
U.S. Total Bond Index Master Portfolio | | $ | 461,970,519 | | | $ | 59,880,582 | (b) | | $ | — | | | $ | 521,851,101 | | | | 521,851,101 | | | | 14,126,004 | | | | 2,674,250 | | | | (39,643,334 | ) |
| | | | | | | | | | | | | | | | | | | | | | | | | | | | | | | | |
| | | $ | 6,175,414,738 | | | $ | 146,757,797 | | | $ | 42,088,655 | | | $ | 967,222,347 | |
| | | | | | | | | | | | | | | | | | | | | | | | | | | | | | | | |
| | (a) | Includes net capital gain distributions, if applicable. | |
| | (b) | Represents net shares/investment value purchased (sold). | |
| | (c) | Represents securities lending income earned from the reinvestment of cash collateral from loaned securities, net of fees and collateral investment expenses, and other payments to and from borrowers of securities | |
| | (d) | As of period end, the entity is no longer held by the LifePath Index Master Portfolio | |
| | |
| 104 | | 2019 BLACKROCK ANNUAL REPORTTO SHAREHOLDERS |
| | |
Schedule of Investments (continued) December 31, 2019 | | LifePath® Index 2040 Master Portfolio |
Fair Value Hierarchy as of Period End
Various inputs are used in determining the fair value of investments. For information about the LifePath Index Master Portfolio’s policy regarding valuation of investments, refer to the Notes to Financial Statements.
The following table summarizes the LifePath Index Master Portfolio’s investments categorized in the disclosure hierarchy:
| | | | | | | | | | | | | | | | |
| | | Level 1 | | | Level 2 | | | Level 3 | | | Total | |
Assets: | |
Investments: | |
Affiliated Investment Companies | | $ | 2,614,826,758 | | | $ | — | | | $ | — | | | $ | 2,614,826,758 | |
Short-Term Securities | | | 18,155,509 | | | | — | | | | — | | | | 18,155,509 | |
| | | | | | | | | | | | | | | | |
Subtotal | | $ | 2,632,982,267 | | | $ | — | | | $ | — | | | $ | 2,632,982,267 | |
| | | | | | | | | | | | | | | | |
Investments Valued at NAV(a) | | | | | | | | | | | | | | | 3,542,432,471 | |
| | | | | | | | | | | | | | | | |
Total Investment | | | | | | | | | | | | | | $ | 6,175,414,738 | |
| | | | | | | | | | | | | | | | |
| | (a) | Certain investments of the LifePath Index Master Portfolio were fair valued using NAV per share as no quoted market value is available and therefore have been excluded from the fair value hierarchy. | |
See notes to financial statements.
| | | | |
| SCHEDULES OF INVESTMENTS | | | 105 | |
| | |
Schedule of Investments December 31, 2019 | | LifePath® Index 2045 Master Portfolio (Percentages shown are based on Net Assets) |
| | | | | | | | |
| Security | |
Shares | | | Value | |
|
Affiliated Investment Companies(b) — 100.2% | |
|
| Equity Funds — 95.4% | |
iShares Core MSCI Total International Stock ETF | | | 18,405,622 | | | $ | 1,139,308,002 | |
iShares Developed Real Estate Index Fund — Class K | | | 12,244,120 | | | | 134,440,438 | |
| | |
| | | Investment
Value | | | | |
Large Cap Index Master Portfolio | | $ | 1,493,424,773 | | | | 1,493,424,773 | |
Master Small Cap Index Series | | | 59,573,564 | | | | 59,573,564 | |
| | | | | | | | |
| | | | 2,826,746,777 | |
| | |
| | | Shares | | | | |
|
| Fixed Income Funds — 4.4% | |
iShares TIPS Bond ETF | | | 356,972 | | | | 41,612,226 | |
| | | | | | | | |
| Security | | Investment
Value | | | Value | |
|
| Fixed Income Funds (continued) | |
U.S. Total Bond Index Master Portfolio | | $ | 88,557,698 | | | $ | 88,557,698 | |
| | | | | | | | |
| | | | 130,169,924 | |
| | |
| | | Shares | | | | |
|
| Short-Term Securities — 0.4% | |
BlackRock Cash Funds: Treasury,
SL Agency Shares, | | | | | | | | |
1.55%(a) | | | 12,785,343 | | | | 12,785,343 | |
| | | | | | | | |
| |
Total Affiliated Investment Companies — 100.2%
(Cost — $2,515,939,960) | | | | 2,969,702,044 | |
| |
Liabilities in Excess of Other Assets — (0.2)% | | | | (6,110,283 | ) |
| | | | | | | | |
| |
Net Assets — 100.0% | | | $ | 2,963,591,761 | |
| | | | | | | | |
| (a) | Annualized7-day yield as of period end. |
| (b) | During the year ended December 31, 2019, investments in issuers considered to be an affiliate/affiliates of the LifePath Index Master Portfolio for purposes of Section 2(a)(3) of the Investment Company Act of 1940, as amended, and/or related parties of the LifePath Index Master Portfolio were as follows: |
| | | | | | | | | | | | | | | | | | | | | | | | | | | | | | | | |
| Affiliated Persons and/or Related Parties | | Shares/ Investment
Value Held at
12/31/18 | | | Shares/
Investment
Value
Purchased | | | Shares/
Investment
Value Sold | | | Shares/
Investment
Value Held at
12/31/19 | | | Value at
12/31/19 | | | Income | | | Net
Realized
Gain (Loss) (a) | | | Change in
Unrealized
Appreciation
(Depreciation) | |
BlackRock Cash Funds: Institutional,
SL Agency Shares(b) | | | 7,144,245 | | | | — | | | | (7,144,245 | )(c) | | | — | | | $ | — | | | $ | 8,972 | (d) | | $ | 3,092 | | | $ | — | |
BlackRock Cash Funds: Treasury,
SL Agency Shares | | | 8,688,018 | | | | 4,097,325 | (c) | | | — | | | | 12,785,343 | | | | 12,785,343 | | | | 155,564 | | | | — | | | | — | |
iShares Core MSCI Total International Stock ETF | | | 10,546,905 | | | | 7,938,917 | | | | (80,200 | ) | | | 18,405,622 | | | | 1,139,308,002 | | | | 30,466,991 | | | | (388,595 | ) | | | 130,170,684 | |
iShares Developed Real Estate Index Fund — Class K | | | 25,740,641 | | | | 5,489,113 | | | | (18,985,634 | ) | | | 12,244,120 | | | | 134,440,438 | | | | 10,378,078 | | | | 11,928,147 | | | | 24,031,302 | |
iShares TIPS Bond ETF | | | 64,637 | | | | 292,335 | | | | — | | | | 356,972 | | | | 41,612,226 | | | | 421,844 | | | | — | | | | 841,629 | |
Large Cap Index Master Portfolio | | $ | 867,916,532 | | | $ | 625,508,241 | (c) | | $ | — | | | $ | 1,493,424,773 | | | | 1,493,424,773 | | | | 22,420,494 | | | | 1,980,647 | | | | 297,488,199 | |
Master Small Cap Index Series | | $ | 26,311,368 | | | $ | 33,262,196 | (c) | | $ | — | | | $ | 59,573,564 | | | | 59,573,564 | | | | 722,222 | | | | 1,925,229 | | | | 4,593,246 | |
Total International ex U.S. Index Master
Portfolio(b) | | $ | 2,769,805 | | | $ | — | | | $ | (2,769,805 | )(c) | | $ | — | | | | — | | | | — | | | | 3,994,462 | | | | (3,328,076 | ) |
U.S. Total Bond Index Master Portfolio | | $ | 72,763,207 | | | $ | 15,794,491 | (c) | | $ | — | | | $ | 88,557,698 | | | | 88,557,698 | | | | 2,308,507 | | | | 253,622 | | | | (5,754,050 | ) |
| | | | | | | | | | | | | | | | | | | | | | | | | | | | | | | | |
| | | $ | 2,969,702,044 | | | $ | 66,882,672 | | | $ | 19,696,604 | | | $ | 448,042,934 | |
| | | | | | | | | | | | | | | | | | | | | | | | | | | | | | | | |
| | (a) | Includes net capital gain distributions, if applicable. | |
| | (b) | As of period end, the entity is no longer held by the LifePath Index Master Portfolio. | |
| | (c) | Represents net shares/investment value purchased (sold). | |
| | (d) | Represents securities lending income earned from the reinvestment of cash collateral from loaned securities, net of fees and collateral investment expenses, and other payments to and from borrowers of securities. | |
| | |
| 106 | | 2019 BLACKROCK ANNUAL REPORTTO SHAREHOLDERS |
| | |
Schedule of Investments (continued) December 31, 2019 | | LifePath® Index 2045 Master Portfolio |
Fair Value Hierarchy as of Period End
Various inputs are used in determining the fair value of investments. For information about the LifePath Index Master Portfolio’s policy regarding valuation of investments, refer to the Notes to Financial Statements.
The following table summarizes the LifePath Index Master Portfolio’s investments categorized in the disclosure hierarchy:
| | | | | | | | | | | | | | | | |
| | | Level 1 | | | Level 2 | | | Level 3 | | | Total | |
Assets: | |
Investments: | |
Affiliated Investment Companies | | $ | 1,315,360,666 | | | $ | — | | | $ | — | | | $ | 1,315,360,666 | |
Short-Term Securities | | | 12,785,343 | | | | — | | | | — | | | | 12,785,343 | |
| | | | | | | | | | | | | | | | |
Subtotal | | $ | 1,328,146,009 | | | $ | — | | | $ | — | | | $ | 1,328,146,009 | |
| | | | | | | | | | | | | | | | |
Investments Valued at NAV(a) | | | | | | | | | | | | | | | 1,641,556,035 | |
| | | | | | | | | | | | | | | | |
Total Investments | | | | | | | | | | | | | | $ | 2,969,702,044 | |
| | | | | | | | | | | | | | | | |
| | (a) | Certain investments of the LifePath Index Master Portfolio were fair valued using NAV per share as no quoted market value is available and therefore have been excluded from the fair value hierarchy. | |
See notes to financial statements.
| | | | |
| SCHEDULES OF INVESTMENTS | | | 107 | |
| | |
Schedule of Investments December 31, 2019 | | LifePath® Index 2050 Master Portfolio (Percentages shown are based on Net Assets) |
| | | | | | | | |
| Security | | Shares | | | Value | |
|
Affiliated Investment Companies(d) — 100.1% | |
|
| Equity Funds — 98.4% | |
iShares Core MSCI Total International Stock ETF(a) | | | 20,144,706 | | | $ | 1,246,957,301 | |
iShares Developed Real Estate Index Fund — Class K | | | 13,362,044 | | | | 146,715,238 | |
| | |
| | | Investment
Value | | | | |
Large Cap Index Master Portfolio | | $ | 1,610,527,305 | | | | 1,610,527,305 | |
Master Small Cap Index Series | | | 60,417,493 | | | | 60,417,493 | |
| | | | | | | | |
| | | | 3,064,617,337 | |
| | |
| | | Shares | | | | |
|
| Fixed Income Funds — 1.3% | |
iShares TIPS Bond ETF | | | 98,379 | | | | 11,468,040 | |
| | |
| | | Investment
Value | | | | |
U.S. Total Bond Index Master Portfolio | | $ | 29,761,016 | | | | 29,761,016 | |
| | | | | | | | |
| | | | 41,229,056 | |
| | | | | | | | |
| Security | | Shares | | | Value | |
|
| Short-Term Securities — 0.4% | |
BlackRock Cash Funds: Institutional,
SL Agency Shares, | | | | | | | | |
1.87%(b)(c) | | | 43,440 | | | $ | 43,457 | |
BlackRock Cash Funds: Treasury,
SL Agency Shares, | | | | | | | | |
1.55%(c) | | | 10,519,363 | | | | 10,519,363 | |
| | | | | | | | |
| | | | 10,562,820 | |
| | | | | | | | |
| |
Total Affiliated Investment Companies — 100.1%
(Cost — $2,641,300,860) | | | | 3,116,409,213 | |
| |
Liabilities in Excess of Other Assets — (0.1)% | | | | (2,849,095 | ) |
| | | | | | | | |
| |
Net Assets — 100.0% | | | $ | 3,113,560,118 | |
| | | | | | | | |
| (a) | Security, or a portion of the security, is on loan. |
| (b) | Annualized7-day yield as of period end. |
| (c) | Security was purchased with the cash collateral from loaned securities. |
| (d) | During the year ended December 31, 2019, investments in issuers considered to be affiliates of the LifePath Index Master Portfolio for purposes of Section 2(a)(3) of the Investment Company Act of 1940, as amended, and/or related parties of the LifePath Index Master Portfolio were as follows: |
| | | | | | | | | | | | | | | | | | | | | | | | | | | | | | | | |
| Affiliated Persons and/or Related Parties | | Shares/
Investment
Value Held at
12/31/18 | | | Shares/
Investment
Value
Purchased | | | Shares/ Investment
Value Sold | | | Shares/ Investment Value Held at
12/31/19 | | | Value at
12/31/19 | | | Income | | | Net Realized
Gain (Loss) (a) | | | Change in
Unrealized
Appreciation
(Depreciation) | |
BlackRock Cash Funds: Institutional, SL Agency Shares | | | 13,908,609 | | | | — | | | | (13,865,169 | )(b) | | | 43,440 | | | $ | 43,457 | | | $ | 15,943 | (c) | | $ | 1,236 | | | $ | — | |
BlackRock Cash Funds: Treasury, SL Agency Shares | | | 6,544,214 | | | | 3,975,149 | (b) | | | — | | | | 10,519,363 | | | | 10,519,363 | | | | 152,941 | | | | — | | | | — | |
iShares Core MSCI Total International Stock ETF | | | 12,229,231 | | | | 7,987,775 | | | | (72,300 | ) | | | 20,144,706 | | | | 1,246,957,301 | | | | 33,641,215 | | | | (771,413 | ) | | | 145,984,477 | |
iShares Developed Real Estate Index Fund — Class K | | | 29,349,060 | | | | 5,839,273 | | | | (21,826,289 | ) | | | 13,362,044 | | | | 146,715,238 | | | | 11,459,172 | | | | 15,260,502 | | | | 25,435,166 | |
iShares TIPS Bond ETF | | | — | | | | 98,379 | | | | — | | | | 98,379 | | | | 11,468,040 | | | | 93,874 | | | | — | | | | 134,626 | |
Large Cap Index Master Portfolio | | $ | 980,500,343 | | | $ | 630,026,962 | (b) | | $ | — | | | $ | 1,610,527,305 | | | | 1,610,527,305 | | | | 24,587,326 | | | | 1,057,764 | | | | 320,772,486 | |
Master Small Cap Index Series | | $ | 30,806,723 | | | $ | 29,610,770 | (b) | | $ | — | | | $ | 60,417,493 | | | | 60,417,493 | | | | 793,565 | | | | 2,323,828 | | | | 5,234,036 | |
Total International ex U.S. Index Master Portfolio(d) | | $ | 2,283,108 | | | $ | — | | | $ | (2,283,108 | )(b) | | $ | — | | | | — | | | | — | | | | 4,261,237 | | | | (3,525,437 | ) |
U.S. Total Bond Index Master Portfolio | | $ | 24,413,124 | | | $ | 5,347,892 | (b) | | $ | — | | | $ | 29,761,016 | | | | 29,761,016 | | | | 783,856 | | | | 111,069 | | | | (2,513,674 | ) |
| | | | | | | | | | | | | | | | | | | | | | | | | | | | | | | | |
| | | $ | 3,116,409,213 | | | $ | 71,527,892 | | | $ | 22,244,223 | | | $ | 491,521,680 | |
| | | | | | | | | | | | | | | | | | | | | | | | | | | | | | | | |
| | (a) | Includes net capital gain distributions, if applicable. | |
| | (b) | Represents net shares/investment value purchased (sold). | |
| | (c) | All or a portion represents securities lending income earned from the reinvestment of cash collateral from loaned securities, net of fees and collateral investment expenses, and other payments to and from borrowers of securities. | |
| | (d) | As of period end, the entity is no longer held by the LifePath Index Master Portfolio. | |
| | |
| 108 | | 2019 BLACKROCK ANNUAL REPORTTO SHAREHOLDERS |
| | |
Schedule of Investments (continued) December 31, 2019 | | LifePath® Index 2050 Master Portfolio |
Fair Value Hierarchy as of Period End
Various inputs are used in determining the fair value of investments. For information about the LifePath Index Master Portfolio’s policy regarding valuation of investments, refer to the Notes to Financial Statements.
The following table summarizes the LifePath Index Master Portfolio’s investments categorized in the disclosure hierarchy:
| | | | | | | | | | | | | | | | |
| | | Level 1 | | | Level 2 | | | Level 3 | | | Total | |
Assets: | |
Investments: | |
Affiliated Investment Companies | | $ | 1,405,140,579 | | | $ | — | | | $ | — | | | $ | 1,405,140,579 | |
Short-Term Securities | | | 10,562,820 | | | | — | | | | — | | | | 10,562,820 | |
| | | | | | | | | | | | | | | | |
Subtotal | | $ | 1,415,703,399 | | | $ | — | | | $ | — | | | $ | 1,415,703,399 | |
| | | | | | | | | | | | | | | | |
Investments Valued at NAV(a) | | | | | | | | | | | | | | | 1,700,705,814 | |
| | | | | | | | | | | | | | | | |
Total Investments | | | | | | | | | | | | | | $ | 3,116,409,213 | |
| | | | | | | | | | | | | | | | |
| | (a) | Certain investments of the LifePath Index Master Portfolio were fair valued using NAV per share as no quoted market value is available and therefore have been excluded from the fair value hierarchy. | |
See notes to financial statements.
| | | | |
| SCHEDULES OF INVESTMENTS | | | 109 | |
| | |
Schedule of Investments December 31, 2019 | | LifePath® Index 2055 Master Portfolio (Percentages shown are based on Net Assets) |
| | | | | | | | |
| Security | | Shares | | | Value | |
|
Affiliated Investment Companies(b) — 100.3% | |
|
| Equity Funds — 98.8% | |
iShares Core MSCI Total International Stock ETF | | | 9,782,091 | | | $ | 605,511,433 | |
iShares Developed Real Estate Index Fund — Class K | | | 6,459,044 | | | | 70,920,307 | |
| | |
| | | Investment
Value | | | | |
Large Cap Index Master Portfolio | | $ | 778,003,891 | | | | 778,003,891 | |
Master Small Cap Index Series | | | 30,254,393 | | | | 30,254,393 | |
| | | | | | | | |
| | | | 1,484,690,024 | |
| | |
| | | Shares | | | | |
|
| Fixed Income Funds — 1.0% | |
iShares TIPS Bond ETF | | | 23,081 | | | | 2,690,552 | |
| | |
| | | Investment
Value | | | | |
U.S. Total Bond Index Master Portfolio | | $ | 12,709,718 | | | | 12,709,718 | |
| | | | | | | | |
| | | | 15,400,270 | |
| | | | | | | | |
| Security | | Shares | | | Value | |
|
| Short-Term Securities — 0.5% | |
BlackRock Cash Funds: Treasury,
SL Agency Shares, | | | | | | | | |
1.55%(a)(b) | | | 6,740,780 | | | $ | 6,740,780 | |
| | | | | | | | |
| |
Total Affiliated Investment Companies — 100.3%
(Cost — $1,288,079,040) | | | | 1,506,831,074 | |
| |
Liabilities in Excess of Other Assets — (0.3)% | | | | (4,158,642 | ) |
| | | | | | | | |
| |
Net Assets — 100.0% | | | $ | 1,502,672,432 | |
| | | | | | | | |
| (a) | Annualized7-day yield as of period end. |
| (b) | During the year ended December 31, 2019, investments in issuers considered to be affiliates of the LifePath Index Master Portfolio for purposes of Section 2(a)(3) of the Investment Company Act of 1940, as amended, and/or related parties of the LifePath Index Master Portfolio were as follows: |
| | | | | | | | | | | | | | | | | | | | | | | | | | | | | | | | |
| Affiliated Persons and/or Related Parties | | Shares/ Investment
Value Held at
12/31/18 | | | Shares/ Investment Value Purchased | | | Shares/ Investment Value Sold | | | Shares/ Investment Value Held at
12/31/19 | | | Value at
12/31/19 | | | Income | | | Net
Realized
Gain (Loss) (a) | | | Change in
Unrealized
Appreciation
(Depreciation) | |
BlackRock Cash Funds: Institutional,
SL Agency Shares(b) | | | — | | | | — | | | | — | | | | — | | | $ | — | | | $ | 8,965 | (c) | | $ | 1,493 | | | $ | — | |
BlackRock Cash Funds: Treasury,
SL Agency Shares | | | 5,011,411 | | | | 1,729,369 | (d) | | | — | | | | 6,740,780 | | | | 6,740,780 | | | | 86,619 | | | | — | | | | — | |
iShares Core MSCI Total International
Stock ETF | | | 5,140,080 | | | | 4,783,975 | | | | (141,964 | ) | | | 9,782,091 | | | | 605,511,433 | | | | 15,868,308 | | | | (1,090,793 | ) | | | 66,734,213 | |
iShares Developed Real Estate
Index Fund — Class K | | | 12,234,789 | | | | 3,883,530 | | | | (9,659,275 | ) | | | 6,459,044 | | | | 70,920,307 | | | | 5,318,284 | | | | 5,451,491 | | | | 11,945,710 | |
iShares TIPS Bond ETF | | | — | | | | 23,284 | | | | (203 | ) | | | 23,081 | | | | 2,690,552 | | | | 24,130 | | | | (94 | ) | | | 34,367 | |
Large Cap Index Master Portfolio | | $ | 407,783,797 | | | $ | 370,220,094 | (d) | | $ | — | | | $ | 778,003,891 | | | $ | 778,003,891 | | | | 11,227,814 | | | | 200,767 | | | | 144,911,969 | |
Master Small Cap Index Series | | $ | 13,560,244 | | | $ | 16,694,149 | (d) | | $ | — | | | $ | 30,254,393 | | | $ | 30,254,393 | | | | 371,048 | | | | 786,205 | | | | 2,807,937 | |
U.S. Total Bond Index Master Portfolio | | $ | 8,708,048 | | | $ | 4,001,670 | (d) | | $ | — | | | $ | 12,709,718 | | | $ | 12,709,718 | | | | 327,862 | | | | 32,115 | | | | (885,727 | ) |
| | | | | | | | | | | | | | | | | | | | | | | | | | | | | | | | |
| | | $ | 1,506,831,074 | | | $ | 33,233,030 | | | $ | 5,381,184 | | | $ | 225,548,469 | |
| | | | | | | | | | | | | | | | | |
| | (a) | Includes net capital gain distributions, if applicable. | |
| | (b) | As of period end, the entity is no longer held by the LifePath Index Master Portfolio. | |
| | (c) | Represents securities lending income earned from the reinvestment of cash collateral from loaned securities, net of fees and collateral investment expenses, and other payments to and from borrowers of securities. | |
| | (d) | Represents net shares/investment value purchased (sold). | |
| | |
| 110 | | 2019 BLACKROCK ANNUAL REPORTTO SHAREHOLDERS |
| | |
Schedule of Investments (continued) December 31, 2019 | | LifePath® Index 2055 Master Portfolio |
Fair Value Hierarchy as of Period End
Various inputs are used in determining the fair value of investments. For information about the LifePath Index Master Portfolio’s policy regarding valuation of investments, refer to the Notes to Financial Statements.
The following table summarizes the LifePath Index Master Portfolio’s investments categorized in the disclosure hierarchy:
| | | | | | | | | | | | | | | | |
| | | Level 1 | | | Level 2 | | | Level 3 | | | Total | |
Assets: | |
Investments: | |
Affiliated Investment Companies | | $ | 679,122,292 | | | $ | — | | | $ | — | | | $ | 679,122,292 | |
Short-Term Securities | | | 6,740,780 | | | | — | | | | — | | | | 6,740,780 | |
| | | | | | | | | | | | | | | | |
Subtotal | | $ | 685,863,072 | | | $ | — | | | $ | — | | | $ | 685,863,072 | |
| | | | | | | | | | | | | | | | |
Investments Valued at NAV(a) | | | | | | | | | | | | | | | 820,968,002 | |
| | | | | | | | | | | | | | | | |
Total Investments | | | | | | | | | | | | | | $ | 1,506,831,074 | |
| | | | | | | | | | | | | | | | |
| | (a) | Certain investments of the LifePath Index Master Portfolio were fair valued using NAV per share as no quoted market value is available and therefore have been excluded from the fair value hierarchy. | |
See notes to financial statements.
| | | | |
| SCHEDULES OF INVESTMENTS | | | 111 | |
| | |
Schedule of Investments December 31, 2019 | | LifePath® Index 2060 Master Portfolio (Percentages shown are based on Net Assets) |
| | | | | | | | |
| Security | | Shares | | | Value | |
|
Affiliated Investment Companies(b) — 100.4% | |
|
| Equity Funds — 98.7% | |
iShares Core MSCI Total International Stock ETF | | | 2,657,796 | | | $ | 164,517,572 | |
iShares Developed Real Estate Index Fund — Class K | | | 1,790,976 | | | | 19,664,912 | |
| | |
| | | Investment
Value | | | | |
Large Cap Index Master Portfolio | | $ | 212,867,819 | | | | 212,867,819 | |
Master Small Cap Index Series | | | 8,336,954 | | | | 8,336,954 | |
| | | | | | | | |
| | | | 405,387,257 | |
| | |
| | | Shares | | | | |
|
| Fixed Income Funds — 1.0% | |
iShares TIPS Bond ETF | | | 3,326 | | | | 387,712 | |
| | |
| | | Investment
Value | | | | |
U.S. Total Bond Index Master Portfolio | | $ | 3,797,256 | | | | 3,797,256 | |
| | | | | | | | |
| | | | 4,184,968 | |
| | | | | | | | |
| Security | | Shares | | | Value | |
|
| Short-Term Securities — 0.7% | |
BlackRock Cash Funds: Treasury,
SL Agency Shares, | | | | | | | | |
1.55%(a) | | | 3,011,432 | | | $ | 3,011,432 | |
| | | | | | | | |
| |
Total Affiliated Investment Companies — 100.4%
(Cost — $366,614,604) | | | | 412,583,657 | |
| |
Liabilities in Excess of Other Assets — (0.4)% | | | | (1,685,775 | ) |
| | | | | | | | |
| |
Net Assets — 100.0% | | | $ | 410,897,882 | |
| | | | | | | | |
| (a) | Annualized 7-day yield as of period end. |
| (b) | During the year ended December 31, 2019, investments in issuers considered to be an affiliate/affiliates of the LifePath Index Master Portfolio for purposes of Section 2(a)(3) of the Investment Company Act of 1940, as amended, and/or related parties of the LifePath Index Master Portfolio were as follows: |
| | | | | | | | | | | | | | | | | | | | | | | | | | | | | | | | |
| Affiliated Persons and/or Related Parties | | Shares/
Investment
Value Held at
12/31/18 | | | Shares/
Investment
Value
Purchased | | | Shares/
Investment
Value Sold | | | Shares/
Investment
Value Held at
12/31/19 | | | Value at
12/31/19 | | |
Income | | | Net
Realized
Gain (Loss) (a) | | | Change in
Unrealized
Appreciation
(Depreciation) | |
BlackRock Cash Funds: Treasury,
SL Agency Shares | | | 1,569,939 | | | | 1,441,493 | (b) | | | — | | | | 3,011,432 | | | $ | 3,011,432 | | | $ | 26,615 | | | $ | — | | | $ | — | |
iShares Core MSCI Total International Stock ETF | | | 978,078 | | | | 1,703,851 | | | | (24,133 | ) | | | 2,657,796 | | | | 164,517,572 | | | | 3,959,811 | | | | (136,576 | ) | | | 15,424,342 | |
iShares Developed Real Estate Index Fund — Class K | | | 2,310,322 | | | | 1,566,871 | | | | (2,086,217 | ) | | | 1,790,976 | | | | 19,664,912 | | | | 1,304,910 | | | | 722,428 | | | | 2,708,239 | |
iShares TIPS Bond ETF | | | — | | | | 3,333 | | | | (7 | ) | | | 3,326 | | | | 387,712 | | | | 4,158 | | | | 1 | | | | 6,721 | |
Large Cap Index Master Portfolio | | $ | 78,349,885 | | | $ | 134,517,934 | (b) | | $ | — | | | $ | 212,867,819 | | | | 212,867,819 | | | | 2,602,532 | | | | (224,801 | ) | | | 33,392,521 | |
Master Small Cap Index Series | | $ | 2,594,055 | | | $ | 5,742,899 | (b) | | $ | — | | | $ | 8,336,954 | | | | 8,336,954 | | | | 86,085 | | | | 87,047 | | | | 824,531 | |
U.S. Total Bond Index Master Portfolio | | $ | 1,743,848 | | | $ | 2,053,408 | (b) | | $ | — | | | $ | 3,797,256 | | | | 3,797,256 | | | | 78,335 | | | | 9,115 | | | | (238,622 | ) |
| | | | | | | | | | | | | | | | | | | | | | | | | | | | | | | | |
| | | $ | 412,583,657 | | | $ | 8,062,446 | | | $ | 457,214 | | | $ | 52,117,732 | |
| | | | | | | | | | | | | | | | | |
| | (a) | Includes net capital gain distributions, if applicable. | |
| | (b) | Represents net shares/investment value purchased (sold). | |
Fair Value Hierarchy as of Period End
Various inputs are used in determining the fair value of investments. For information about the LifePath Index Master Portfolio’s policy regarding valuation of investments, refer to the Notes to Financial Statements.
The following table summarizes the LifePath Index Master Portfolio’s investments categorized in the disclosure hierarchy:
| | | | | | | | | | | | | | | | |
| | | Level 1 | | | Level 2 | | | Level 3 | | | Total | |
Assets: | |
Investments: | |
Affiliated Investment Companies | | $ | 184,570,196 | | | $ | — | | | $ | — | | | $ | 184,570,196 | |
Short-Term Securities | | | 3,011,432 | | | | — | | | | — | | | | 3,011,432 | |
| | | | | | | | | | | | | | | | |
Subtotal | | $ | 187,581,628 | | | $ | — | | | $ | — | | | $ | 187,581,628 | |
| | | | | | | | | | | | | | | | |
Investments Valued at NAV(a) | | | | | | | | | | | | | | | 225,002,029 | |
| | | | | | | | | | | | | | | | |
Total Investments | | | | | | | | | | | | | | $ | 412,583,657 | |
| | | | | | | | | | | | | | | | |
| | (a) | Certain investments of the LifePath Index Master Portfolio were fair valued using NAV per share as no quoted market value is available and therefore have been excluded from the fair value hierarchy. | |
See notes to financial statements.
| | |
| 112 | | 2019 BLACKROCK ANNUAL REPORTTO SHAREHOLDERS |
| | |
Schedule of Investments December 31, 2019 | | LifePath® Index 2065 Master Portfolio (Percentages shown are based on Net Assets) |
| | | | | | | | |
| Security | | Shares | | | Value | |
|
Affiliated Investment Companies(b) — 99.3% | |
|
| Equity Funds — 98.3% | |
iShares Core MSCI Total International Stock ETF | | | 13,406 | | | $ | 829,831 | |
iShares Developed Real Estate Index Fund — Class K | | | 9,022 | | | | 99,060 | |
| | |
| | | Investment
Value | | | | |
Large Cap Index Master Portfolio | | $ | 1,073,900 | | | | 1,073,900 | |
Master Small Cap Index Series | | | 42,271 | | | | 42,271 | |
| | | | | | | | |
| | | | 2,045,062 | |
|
| Fixed Income Fund — 1.0% | |
U.S. Total Bond Index Master Portfolio | | | 21,234 | | | | 21,234 | |
| | | | | | | | |
| | | | | | | | |
| Security | | Shares | | | Value | |
|
| Short-Term Securities — 4.5% | |
BlackRock Cash Funds: Treasury, SL Agency Shares, | | | | | | | | |
1.55%(a)(b) | | | 94,009 | | | $ | 94,009 | |
| | | | | | | | |
| |
Total Affiliated Investment Companies — 103.8%
(Cost — $2,087,193) | | | | 2,160,305 | |
| |
Liabilities in Excess of Other Assets — (3.8)% | | | | (79,586 | ) |
| | | | | | | | |
| |
Net Assets — 100.0% | | | $ | 2,080,719 | |
| | | | | | | | |
| (a) | Annualized 7-day yield as of period end. |
| (b) | During the period ended December 31, 2019, investments in issuers considered to be an affiliate/affiliates of the LifePath Index Master Portfolio for purposes of Section 2(a)(3) of the Investment Company Act of 1940, as amended, and/or related parties of the LifePath Index Master Portfolio were as follows: |
| | | | | | | | | | | | | | | | | | | | | | | | | | | | | | | | |
| Affiliated Persons and/or Related Parties | | Shares/
Investment
Value Held at
12/31/18 | | | Shares/
Investment
Value
Purchased | | | Shares/
Investment
Value Sold | | | Shares/
Investment
Value Held at
12/31/19 | | | Value at
12/31/19 | | | Income | | | Net
Realized
Gain (Loss) (a) | | | Change in
Unrealized
Appreciation
(Depreciation) | |
BlackRock Cash Funds: Treasury,
SL Agency Shares | | | — | | | | 94,009 | (b) | | | — | | | | 94,009 | | | $ | 94,009 | | | $ | 900 | | | $ | — | | | $ | — | |
iShares Core MSCI Total International Stock ETF | | | — | | | | 13,556 | | | | (150 | ) | | | 13,406 | | | | 829,831 | | | | 11,661 | | | | (56 | ) | | | 23,818 | |
iShares Developed Real Estate Index Fund — Class K | | | — | | | | 9,022 | | | | — | | | | 9,022 | | | | 99,060 | | | | 3,065 | | | | — | | | | (2,477 | ) |
Large Cap Index Master Portfolio | | $ | — | | | $ | 1,073,900 | (b) | | $ | — | | | $ | 1,073,900 | | | | 1,073,900 | | | | 3,021 | | | | (3,763 | ) | | | 50,459 | |
Master Small Cap Index Series | | $ | — | | | $ | 42,271 | (b) | | $ | — | | | $ | 42,271 | | | | 42,271 | | | | 76 | | | | (91 | ) | | | 2,207 | |
U.S. Total Bond Index Master Portfolio | | $ | — | | | $ | 21,234 | (b) | | $ | — | | | $ | 21,234 | | | | 21,234 | | | | 88 | | | | (5 | ) | | | (895 | ) |
| | | | | | | | | | | | | | | | | | | | | | | | | | | | | | | | |
| | | $ | 2,160,305 | | | $ | 18,811 | | | $ | (3,915 | ) | | $ | 73,112 | |
| | | | | | | | | | | | | | | | | |
| | (a) | Includes net capital gain distributions, if applicable. | |
| | (b) | Represents net shares/investment value purchased (sold). | |
Fair Value Hierarchy as of Period End
Various inputs are used in determining the fair value of investments. For information about the LifePath Index Master Portfolio’s policy regarding valuation of investments, refer to the Notes to Financial Statements.
The following table summarizes the LifePath Index Master Portfolio’s investments categorized in the disclosure hierarchy:
| | | | | | | | | | | | | | | | |
| | | Level 1 | | | Level 2 | | | Level 3 | | | Total | |
Assets: | |
Investments: | |
Affiliated Investment Companies | | $ | 928,891 | | | $ | — | | | $ | — | | | $ | 928,891 | |
Short-Term Securities | | | 94,009 | | | | — | | | | — | | | | 94,009 | |
| | | | | | | | | | | | | | | | |
Subtotal | | $ | 1,022,900 | | | $ | — | | | $ | — | | | $ | 1,022,900 | |
| | | | | | | | | | | | | | | | |
Investments Valued at NAV(a) | | | | | | | | | | | | | | | 1,137,405 | |
| | | | | | | | | | | | | | | | |
Total Investments | | | | | | | | | | | | | | $ | 2,160,305 | |
| | | | | | | | | | | | | | | | |
| | (a) | Certain investments of the LifePath Index Master Portfolio’s were fair valued using NAV per share as no quoted market value is available and therefore have been excluded from the fair value hierarchy. | |
See notes to financial statements.
| | | | |
| SCHEDULES OF INVESTMENTS | | | 113 | |
Statements of Assets and Liabilities
December 31, 2019
| | | | | | | | | | | | | | | | | | | | |
| | | LifePath Index
Retirement Master
Portfolio | | | LifePath Index
2025 Master
Portfolio | | | LifePath Index
2030 Master
Portfolio | | | LifePath Index
2035 Master
Portfolio | | | LifePath Index
2040 Master
Portfolio | |
| | | | | |
ASSETS | | | | | | | | | | | | | | | | | | | | |
Investments at value — affiliated(a)(b) | | $ | 7,849,868,028 | | | $ | 4,538,491,779 | | | $ | 7,853,965,534 | | | $ | 4,103,468,940 | | | $ | 6,175,414,738 | |
Cash | | | 57,527 | | | | — | | | | — | | | | — | | | | — | |
Receivables: | | | | | | | | | | | | | | | | | | | | |
Investments sold | | | 58,054,683 | | | | 62,035,206 | | | | 97,115,701 | | | | 36,844,371 | | | | 41,152,899 | |
Securities lending income — affiliated | | | 1 | | | | 5,115 | | | | 6,182 | | | | 3,424 | | | | 2,660 | |
Contributions from investors | | | 561,348 | | | | 12,506,895 | | | | 7,012,072 | | | | 5,197,382 | | | | 702,314 | |
Dividends — affiliated | | | 14,787 | | | | 18,096 | | | | 34,105 | | | | 18,370 | | | | 27,424 | |
Prepaid expenses | | | 24,929 | | | | 11,839 | | | | 33,519 | | | | 10,431 | | | | 17,292 | |
| | | | | | | | | | | | | | | | | | | | |
Total assets | | | 7,908,581,303 | | | | 4,613,068,930 | | | | 7,958,167,113 | | | | 4,145,542,918 | | | | 6,217,317,327 | |
| | | | | | | | | | | | | | | | | | | | |
| | | | | |
LIABILITIES | | | | | | | | | | | | | | | | | | | | |
Bank overdraft | | | — | | | | 3,028,343 | | | | 1,479,000 | | | | 519,277 | | | | 1,795,000 | |
Cash collateral on securities loaned at value | | | — | | | | 16,291,800 | | | | 44,344,350 | | | | 21,585,312 | | | | — | |
Payables: | | | | | | | | | | | | | | | | | | | | |
Investments purchased | | | 55,869,644 | | | | 74,711,920 | | | | 105,951,949 | | | | 41,409,116 | | | | 45,133,635 | |
Custodian fees | | | 12,206 | | | | 7,353 | | | | — | | | | 9,356 | | | | — | |
Investment advisory fees | | | 482,806 | | | | 264,564 | | | | 465,286 | | | | 169,212 | | | | 269,838 | |
Trustees’ fees | | | 21,927 | | | | 15,631 | | | | 27,429 | | | | 14,168 | | | | 17,348 | |
Other accrued expenses | | | 15,927 | | | | 10,543 | | | | 81,621 | | | | 9,410 | | | | 14,099 | |
Printing fees | | | 1,678 | | | | 891 | | | | 871 | | | | 876 | | | | 894 | |
Professional fees | | | 57,687 | | | | 33,998 | | | | 38,665 | | | | 29,567 | | | | 37,827 | |
| | | | | | | | | | | | | | | | | | | | |
Total liabilities | | | 56,461,875 | | | | 94,365,043 | | | | 152,389,171 | | | | 63,746,294 | | | | 47,268,641 | |
| | | | | | | | | | | | | | | | | | | | |
| | | | | |
NET ASSETS | | $ | 7,852,119,428 | | | $ | 4,518,703,887 | | | $ | 7,805,777,942 | | | $ | 4,081,796,624 | | | $ | 6,170,048,686 | |
| | | | | | | | | | | | | | | | | | | | |
| | | | | |
NET ASSETS CONSIST OF | | | | | | | | | | | | | | | | | | | | |
Investors’ capital | | $ | 7,009,513,384 | | | $ | 3,973,788,999 | | | $ | 6,795,987,811 | | | $ | 3,490,928,156 | | | $ | 5,248,198,405 | |
Net unrealized appreciation | | | 842,606,044 | | | | 544,914,888 | | | | 1,009,790,131 | | | | 590,868,468 | | | | 921,850,281 | |
| | | | | | | | | | | | | | | | | | | | |
NET ASSETS | | $ | 7,852,119,428 | | | $ | 4,518,703,887 | | | $ | 7,805,777,942 | | | $ | 4,081,796,624 | | | $ | 6,170,048,686 | |
| | | | | | | | | | | | | | | | | | | | |
| | | | | |
(a) Investments at cost — affiliated | | $ | 7,007,261,984 | | | $ | 3,993,576,891 | | | $ | 6,844,175,403 | | | $ | 3,512,600,472 | | | $ | 5,253,564,457 | |
(b) Securities loaned at value | | $ | — | | | $ | 16,007,340 | | | $ | 43,569,964 | | | $ | 21,208,426 | | | $ | — | |
See notes to financial statements.
| | |
| 114 | | 2019 BLACKROCK ANNUAL REPORTTO SHAREHOLDERS |
Statements of Assets and Liabilities (continued)
December 31, 2019
| | | | | | | | | | | | | | | | | | | | |
| | | LifePath Index
2045 Master
Portfolio | | | LifePath Index
2050 Master
Portfolio | | | LifePath Index
2055 Master
Portfolio | | | LifePath Index
2060 Master
Portfolio | | | LifePath Index
2065 Master
Portfolio | |
|
ASSETS | |
Investments at value — affiliated(a)(b) | | $ | 2,969,702,044 | | | $ | 3,116,409,213 | | | $ | 1,506,831,074 | | | $ | 412,583,657 | | | $ | 2,160,305 | |
Receivables: | |
Investments sold | | | 4,967,204 | | | | — | | | | 365,418 | | | | 780,384 | | | | 11,776 | |
Securities lending income — affiliated | | | 62 | | | | 836 | | | | 10 | | | | — | | | | — | |
Contributions from investors | | | 922,775 | | | | 1,704,871 | | | | — | | | | 994,385 | | | | 14,154 | |
Dividends — affiliated | | | 13,073 | | | | 12,934 | | | | 6,574 | | | | 2,717 | | | | 299 | |
From the Manager | | | — | | | | — | | | | — | | | | 8,305 | | | | 16,923 | |
Prepaid expenses | | | 7,243 | | | | 7,897 | | | | 3,387 | | | | 668 | | | | — | |
| | | | | | | | | | | | | | | | | | | | |
Total assets | | | 2,975,612,401 | | | | 3,118,135,751 | | | | 1,507,206,463 | | | | 414,370,116 | | | | 2,203,457 | |
| | | | | | | | | | | | | | | | | | | | |
| | | | | |
LIABILITIES | | | | | | | | | | | | | | | | | | | | |
Bank overdraft | | | 1,996,859 | | | | 2,713,298 | | | | 2,539,225 | | | | 1,565,338 | | | | 47,872 | |
Cash collateral on securities loaned at value | | | — | | | | 44,100 | | | | — | | | | — | | | | — | |
Payables: | |
Investments purchased | | | 9,841,851 | | | | 1,606,989 | | | | 1,568,173 | | | | 1,843,318 | | | | 57,315 | |
Custodian fees | | | 17,527 | | | | 16,391 | | | | 21,235 | | | | 32,471 | | | | 1,798 | |
Investment advisory fees | | | 117,829 | | | | 123,550 | | | | 28,982 | | | | — | | | | — | |
Trustees’ fees | | | 10,602 | | | | 11,111 | | | | 6,234 | | | | 3,042 | | | | 1,984 | |
Other accrued expenses | | | 6,661 | | | | 28,536 | | | | 3,290 | | | | 692 | | | | 175 | |
Printing fees | | | 888 | | | | 888 | | | | 888 | | | | 885 | | | | 496 | |
Professional fees | | | 28,423 | | | | 30,770 | | | | 27,054 | | | | 26,488 | | | | 13,098 | |
Withdrawals to investors | | | — | | | | — | | | | 338,950 | | | | — | | | | — | |
| | | | | | | | | | | | | | | | | | | | |
Total liabilities | | | 12,020,640 | | | | 4,575,633 | | | | 4,534,031 | | | | 3,472,234 | | | | 122,738 | |
| | | | | | | | | | | | | | | | | | | | |
| | | | | |
NET ASSETS | | $ | 2,963,591,761 | | | $ | 3,113,560,118 | | | $ | 1,502,672,432 | | | $ | 410,897,882 | | | $ | 2,080,719 | |
| | | | | | | | | | | | | | | | | | | | |
|
NET ASSETS CONSIST OF | |
Investors’ capital | | $ | 2,509,829,677 | | | $ | 2,638,451,765 | | | $ | 1,283,920,398 | | | $ | 364,928,829 | | | $ | 2,007,607 | |
Net unrealized appreciation | | | 453,762,084 | | | | 475,108,353 | | | | 218,752,034 | | | | 45,969,053 | | | | 73,112 | |
| | | | | | | | | | | | | | | | | | | | |
NET ASSETS | | $ | 2,963,591,761 | | | $ | 3,113,560,118 | | | $ | 1,502,672,432 | | | $ | 410,897,882 | | | $ | 2,080,719 | |
| �� | | | | | | | | | | | | | | | | | | | |
| | | | | |
(a) Investments at cost — affiliated | | $ | 2,515,939,960 | | | $ | 2,641,300,860 | | | $ | 1,288,079,040 | | | $ | 366,614,604 | | | $ | 2,087,193 | |
(b) Securities loaned at value | | $ | — | | | $ | 43,330 | | | $ | — | | | $ | — | | | $ | — | |
See notes to financial statements.
Statements of Operations
Year Ended December 31, 2019
| | | | | | | | | | | | | | | | | | | | |
| | | LifePath Index
Retirement Master
Portfolio | | | LifePath Index
2025 Master
Portfolio | | | LifePath Index
2030 Master
Portfolio | | | LifePath Index
2035 Master
Portfolio | | | LifePath Index
2040 Master
Portfolio | |
|
INVESTMENT INCOME | |
Dividends — affiliated | | $ | 32,377,027 | | | $ | 37,731,891 | | | $ | 81,462,315 | | | $ | 48,060,137 | | | $ | 83,803,771 | |
Securities lending income — affiliated — net | | | 25,713 | | | | 51,640 | | | | 74,451 | | | | 73,622 | | | | 70,719 | |
Net investment income allocated from the applicable Underlying Master Portfolios: | |
Dividends — affiliated | | | 15,146,548 | | | | 23,143,778 | | | | 48,818,778 | | | | 27,393,420 | | | | 47,949,476 | |
Interest — affiliated | | | 49,640,846 | | | | 42,584,209 | | | | 55,849,757 | | | | 18,310,514 | | | | 15,924,465 | |
Expenses | | | (980,454 | ) | | | (1,017,624 | ) | | | (1,654,071 | ) | | | (741,336 | ) | | | (1,057,900 | ) |
Fees waived | | | 150,087 | | | | 133,087 | | | | 184,830 | | | | 67,458 | | | | 67,266 | |
| | | | | | | | | | | | | | | | | | | | |
Total investment income | | | 96,359,767 | | | | 102,626,981 | | | | 184,736,060 | | | | 93,163,815 | | | | 146,757,797 | |
| | | | | | | | | | | | | | | | | | | | |
|
EXPENSES | |
Investment advisory | | | 1,592,495 | | | | 1,878,644 | | | | 3,379,535 | | | | 1,673,242 | | | | 2,644,949 | |
Independent Trustees | | | 50,918 | | | | 60,657 | | | | 125,115 | | | | 55,027 | | | | 85,847 | |
Professional | | | 38,675 | | | | 37,273 | | | | 50,551 | | | | 39,544 | | | | 46,640 | |
Accounting services | | | 26,937 | | | | 22,535 | | | | 17,023 | | | | 25,737 | | | | 23,326 | |
Printing | | | 761 | | | | 729 | | | | 698 | | | | 700 | | | | 729 | |
Miscellaneous | | | 29,107 | | | | 38,665 | | | | 72,376 | | | | 34,277 | | | | 56,472 | |
| | | | | | | | | | | | | | | | | | | | |
Total expenses | | | 1,738,893 | | | | 2,038,503 | | | | 3,645,298 | | | | 1,828,527 | | | | 2,857,963 | |
Less fees waived and/or reimbursed by the Manager | | | (388,225 | ) | | | (535,853 | ) | | | (943,424 | ) | | | (728,816 | ) | | | (1,271,989 | ) |
| | | | | | | | | | | | | | | | | | | | |
Total expenses after fees waived and/or reimbursed | | | 1,350,668 | | | | 1,502,650 | | | | 2,701,874 | | | | 1,099,711 | | | | 1,585,974 | |
| | | | | | | | | | | | | | | | | | | | |
Net investment income | | | 95,009,099 | | | | 101,124,331 | | | | 182,034,186 | | | | 92,064,104 | | | | 145,171,823 | |
| | | | | | | | | | | | | | | | | | | | |
|
REALIZED AND UNREALIZED GAIN (LOSS) | |
Net realized gain (loss) from: | |
Allocated from the applicable Underlying Master Portfolios | | | 15,600,333 | | | | 21,503,444 | | | | 31,235,110 | | | | 14,824,052 | | | | 15,223,998 | |
Investments — affiliated | | | (1,648,984 | ) | | | (1,245,373 | ) | | | 12,905,494 | | | | 9,583,304 | | | | 26,864,657 | |
| | | | | | | | | | | | | | | | | | | | |
| | | 13,951,349 | | | | 20,258,071 | | | | 44,140,604 | | | | 24,407,356 | | | | 42,088,655 | |
| | | | | | | | | | | | | | | | | | | | |
Net change in unrealized appreciation (depreciation) on: | | | | | | | | | | | | | | | | | | | | |
Allocated from the applicable Underlying Master Portfolios | | | 265,724,915 | | | | 357,666,126 | | | | 717,415,808 | | | | 376,020,609 | | | | 644,128,589 | |
Investments — affiliated | | | 86,878,951 | | | | 152,482,151 | | | | 325,704,617 | | | | 182,716,479 | | | | 323,093,758 | |
| | | | | | | | | | | | | | | | | | | | |
| | | 352,603,866 | | | | 510,148,277 | | | | 1,043,120,425 | | | | 558,737,088 | | | | 967,222,347 | |
| | | | | | | | | | | | | | | | | | | | |
Net realized and unrealized gain | | | 366,555,215 | | | | 530,406,348 | | | | 1,087,261,029 | | | | 583,144,444 | | | | 1,009,311,002 | |
| | | | | | | | | | | | | | | | | | | | |
NET INCREASE IN NET ASSETS RESULTING FROM OPERATIONS | | $ | 461,564,314 | | | $ | 631,530,679 | | | $ | 1,269,295,215 | | | $ | 675,208,548 | | | $ | 1,154,482,825 | |
| | | | | | | | | | | | | | | | | | | | |
See notes to financial statements.
| | |
| 116 | | 2019 BLACKROCK ANNUAL REPORTTO SHAREHOLDERS |
Statements of Operations (continued)
Year Ended December 31, 2019
| | | | | | | | | | | | | | | | | | | | |
| | | LifePath Index
2045 Master
Portfolio | | | LifePath Index
2050 Master
Portfolio | | | LifePath Index
2055 Master
Portfolio | | | LifePath Index
2060 Master
Portfolio | | | LifePath Index
2065 Master
Portfolio (a) | |
|
INVESTMENT INCOME | |
Dividends — affiliated | | $ | 41,422,477 | | | $ | 45,347,202 | | | $ | 21,297,341 | | | $ | 5,295,494 | | | $ | 15,626 | |
Securities lending income — affiliated — net | | | 8,972 | | | | 15,943 | | | | 8,965 | | | | — | | | | — | |
Net investment income allocated from the applicable Underlying Master Portfolios: | |
Dividends — affiliated | | | 22,799,655 | | | | 25,006,001 | | | | 11,426,044 | | | | 2,647,934 | | | | 3,066 | |
Interest — affiliated | | | 3,070,686 | | | | 1,597,849 | | | | 701,117 | | | | 165,612 | | | | 166 | |
Expenses | | | (438,341 | ) | | | (455,178 | ) | | | (207,702 | ) | | | (48,290 | ) | | | (49 | ) |
Fees waived | | | 19,223 | | | | 16,075 | | | | 7,265 | | | | 1,696 | | | | 2 | |
| | | | | | | | | | | | | | | | | | | | |
Total investment income | | | 66,882,672 | | | | 71,527,892 | | | | 33,233,030 | | | | 8,062,446 | | | | 18,811 | |
| | | | | | | | | | | | | | | | | | | | |
|
EXPENSES | |
Investment advisory | | | 1,181,157 | | | | 1,266,341 | | | | 578,624 | | | | 134,221 | | | | 132 | |
Independent Trustees | | | 41,239 | | | | 45,596 | | | | 25,022 | | | | 14,376 | | | | 1,984 | |
Professional | | | 36,129 | | | | 38,400 | | | | 32,734 | | | | 31,587 | | | | 13,098 | |
Accounting services | | | 29,588 | | | | 29,296 | | | | 26,473 | | | | 36,255 | | | | 1,798 | |
Printing | | | 729 | | | | 729 | | | | 729 | | | | 727 | | | | 496 | |
Miscellaneous | | | 24,028 | | | | 26,286 | | | | 11,695 | | | | 2,499 | | | | 176 | |
| | | | | | | | | | | | | | | | | | | | |
Total expenses | | | 1,312,870 | | | | 1,406,648 | | | | 675,277 | | | | 219,665 | | | | 17,684 | |
Less fees waived and/or reimbursed by the Manager | | | (604,294 | ) | | | (647,182 | ) | | | (443,889 | ) | | | (165,982 | ) | | | (17,577 | ) |
| | | | | | | | | | | | | | | | | | | | |
Total expenses after fees waived and/or reimbursed | | | 708,576 | | | | 759,466 | | | | 231,388 | | | | 53,683 | | | | 107 | |
| | | | | | | | | | | | | | | | | | | | |
Net investment income | | | 66,174,096 | | | | 70,768,426 | | | | 33,001,642 | | | | 8,008,763 | | | | 18,704 | |
| | | | | | | | | | | | | | | | | | | | |
|
REALIZED AND UNREALIZED GAIN (LOSS) | |
Net realized gain (loss) from: | |
Allocated from the applicable Underlying Master Portfolios | | | 8,153,960 | | | | 7,753,898 | | | | 1,019,087 | | | | (128,639 | ) | | | (3,859 | ) |
Investments — affiliated | | | 11,542,644 | | | | 14,490,325 | | | | 4,362,097 | | | | 585,853 | | | | (56 | ) |
| | | | | | | | | | | | | | | | | | | | |
| | | 19,696,604 | | | | 22,244,223 | | | | 5,381,184 | | | | 457,214 | | | | (3,915 | ) |
| | | | | | | | | | | | | | | | | | | | |
Net change in unrealized appreciation (depreciation) on: | | | | | | | | | | | | | | | | | | | | |
Allocated from the applicable Underlying Master Portfolios | | | 292,999,319 | | | | 319,967,411 | | | | 146,834,179 | | | | 33,978,430 | | | | 51,771 | |
Investments — affiliated | | | 155,043,615 | | | | 171,554,269 | | | | 78,714,290 | | | | 18,139,302 | | | | 21,341 | |
| | | | | | | | | | | | | | | | | | | | |
| | | 448,042,934 | | | | 491,521,680 | | | | 225,548,469 | | | | 52,117,732 | | | | 73,112 | |
| | | | | | | | | | | | | | | | | | | | |
Net realized and unrealized gain | | | 467,739,538 | | | | 513,765,903 | | | | 230,929,653 | | | | 52,574,946 | | | | 69,197 | |
| | | | | | | | | | | | | | | | | | | | |
NET INCREASE IN NET ASSETS RESULTING FROM OPERATIONS | | $ | 533,913,634 | | | $ | 584,534,329 | | | $ | 263,931,295 | | | $ | 60,583,709 | | | $ | 87,901 | |
| | | | | | | | | | | | | | | | | | | | |
| (a) | Commenced operations on October 30, 2019. |
See notes to financial statements.
Statements of Changes in Net Assets
| | | | | | | | | | | | | | | | | | | | |
| | | LifePath Index Retirement Master Portfolio | | | | | | LifePath Index 2025 Master Portfolio | |
| | | Year Ended December 31, | | | | | | Year Ended December 31, | |
| | | 2019 | | | 2018 | | | | | | 2019 | | | 2018 | |
| | | |
INCREASE (DECREASE) IN NET ASSETS | | | | | | | | | | | | | |
| | | |
OPERATIONS | | | | | | | | | | | | | |
Net investment income | | $ | 95,009,099 | | | $ | 36,934,207 | | | | | | | $ | 101,124,331 | | | $ | 71,450,752 | |
Net realized gain (loss) | | | 13,951,349 | | | | (5,296,875 | ) | | | | | | | 20,258,071 | | | | (5,158,624 | ) |
Net change in unrealized appreciation (depreciation) | | | 352,603,866 | | | | (99,347,684 | ) | | | | | | | 510,148,277 | | | | (218,832,818 | ) |
| | | | | | | | | | | | | | | | | | | | |
Net increase (decrease) in net assets resulting from operations | | | 461,564,314 | | | | (67,710,352 | ) | | | | | | | 631,530,679 | | | | (152,540,690 | ) |
| | | | | | | | | | | | | | | | | | | | |
| | | |
CAPITAL TRANSACTIONS | | | | | | | | | | | | | |
Proceeds from contributions | | | 5,808,830,397 | | | | 1,624,418,216 | | | | | | | | 1,459,626,583 | | | | 1,222,992,191 | |
Value of withdrawals | | | (719,462,379 | ) | | | (490,793,648 | ) | | | | | | | (578,018,093 | ) | | | (566,013,216 | ) |
| | | | | | | | | | | | | | | | | | | | |
Net increase in net assets derived from capital transactions | | | 5,089,368,018 | | | | 1,133,624,568 | | | | | | | | 881,608,490 | | | | 656,978,975 | |
| | | | | | | | | | | | | | | | | | | | |
| | | |
NET ASSETS | | | | | | | | | | | | | |
Total increase in net assets | | | 5,550,932,332 | | | | 1,065,914,216 | | | | | | | | 1,513,139,169 | | | | 504,438,285 | |
Beginning of year | | | 2,301,187,096 | | | | 1,235,272,880 | | | | | | | | 3,005,564,718 | | | | 2,501,126,433 | |
| | | | | | | | | | | | | | | | | | | | |
End of year | | $ | 7,852,119,428 | | | $ | 2,301,187,096 | | | | | | | $ | 4,518,703,887 | | | $ | 3,005,564,718 | |
| | | | | | | | | | | | | | | | | | | | |
See notes to financial statements.
| | |
| 118 | | 2019 BLACKROCK ANNUAL REPORTTO SHAREHOLDERS |
Statements of Changes in Net Assets (continued)
| | | | | | | | | | | | | | | | | | | | |
| | | LifePath Index 2030 Master Portfolio | | | | | | LifePath Index 2035 Master Portfolio | |
| | | Year Ended December 31, | | | | | | Year Ended December 31, | |
| | | 2019 | | | 2018 | | | | | | 2019 | | | 2018 | |
| | | |
INCREASE (DECREASE) IN NET ASSETS | | | | | | | | | | | | | |
| | | |
OPERATIONS | | | | | | | | | | | | | |
Net investment income | | $ | 182,034,186 | | | $ | 101,551,134 | | | | | | | $ | 92,064,104 | | | $ | 62,998,763 | |
Net realized gain (loss) | | | 44,140,604 | | | | (8,829,578 | ) | | | | | | | 24,407,356 | | | | (3,348,497 | ) |
Net change in unrealized appreciation (depreciation) | | | 1,043,120,425 | | | | (402,682,633 | ) | | | | | | | 558,737,088 | | | | (238,977,954 | ) |
| | | | | | | | | | | | | | | | | | | | |
Net increase (decrease) in net assets resulting from operations | | | 1,269,295,215 | | | | (309,961,077 | ) | | | | | | | 675,208,548 | | | | (179,327,688 | ) |
| | | | | | | | | | | | | | | | | | | | |
| | | |
CAPITAL TRANSACTIONS | | | | | | | | | | | | | |
Proceeds from contributions | | | 1,730,629,400 | | | | 3,545,583,649 | | | | | | | | 1,258,917,701 | | | | 1,118,507,170 | |
Value of withdrawals | | | (925,822,783 | ) | | | (635,558,851 | ) | | | | | | | (445,579,573 | ) | | | (463,080,975 | ) |
| | | | | | | | | | | | | | | | | | | | |
Net increase in net assets derived from capital transactions | | | 804,806,617 | | | | 2,910,024,798 | | | | | | | | 813,338,128 | | | | 655,426,195 | |
| | | | | | | | | | | | | | | | | | | | |
| | | |
NET ASSETS | | | | | | | | | | | | | |
Total increase in net assets | | | 2,074,101,832 | | | | 2,600,063,721 | | | | | | | | 1,488,546,676 | | | | 476,098,507 | |
Beginning of year | | | 5,731,676,110 | | | | 3,131,612,389 | | | | | | | | 2,593,249,948 | | | | 2,117,151,441 | |
| | | | | | | | | | | | | | | | | | | | |
End of year | | $ | 7,805,777,942 | | | $ | 5,731,676,110 | | | | | | | $ | 4,081,796,624 | | | $ | 2,593,249,948 | |
| | | | | | | | | | | | | | | | | | | | |
See notes to financial statements.
Statements of Changes in Net Assets (continued)
| | | | | | | | | | | | | | | | | | | | |
| | | LifePath Index 2040 Master Portfolio | | | | | | LifePath Index 2045 Master Portfolio | |
| | | Year Ended December 31, | | | | | | Year Ended December 31, | |
| | | 2019 | | | 2018 | | | | | | 2019 | | | 2018 | |
| | | |
INCREASE (DECREASE) IN NET ASSETS | | | | | | | | | | | | | |
| | | |
OPERATIONS | | | | | | | | | | | | | |
Net investment income | | $ | 145,171,823 | | | $ | 80,455,559 | | | | | | | $ | 66,174,096 | | | $ | 43,994,459 | |
Net realized gain (loss) | | | 42,088,655 | | | | (17,780,766 | ) | | | | | | | 19,696,604 | | | | (4,469,865 | ) |
Net change in unrealized appreciation (depreciation) | | | 967,222,347 | | | | (373,951,604 | ) | | | | | | | 448,042,934 | | | | (188,693,692 | ) |
| | | | | | | | | | | | | | | | | | | | |
Net increase (decrease) in net assets resulting from operations | | | 1,154,482,825 | | | | (311,276,811 | ) | | | | | | | 533,913,634 | | | | (149,169,098 | ) |
| | | | | | | | | | | | | | | | | | | | |
| | | |
CAPITAL TRANSACTIONS | | | | | | | | | | | | | |
Proceeds from contributions | | | 1,324,730,298 | | | | 2,836,983,022 | | | | | | | | 933,746,980 | | | | 827,067,280 | |
Value of withdrawals | | | (695,682,756 | ) | | | (473,972,015 | ) | | | | | | | (286,294,861 | ) | | | (281,954,182 | ) |
| | | | | | | | | | | | | | | | | | | | |
Net increase in net assets derived from capital transactions | | | 629,047,542 | | | | 2,363,011,007 | | | | | | | | 647,452,119 | | | | 545,113,098 | |
| | | | | | | | | | | | | | | | | | | | |
| | | |
NET ASSETS | | | | | | | | | | | | | |
Total increase in net assets | | | 1,783,530,367 | | | | 2,051,734,196 | | | | | | | | 1,181,365,753 | | | | 395,944,000 | |
Beginning of year | | | 4,386,518,319 | | | | 2,334,784,123 | | | | | | | | 1,782,226,008 | | | | 1,386,282,008 | |
| | | | | | | | | | | | | | | | | | | | |
End of year | | $ | 6,170,048,686 | | | $ | 4,386,518,319 | | | | | | | $ | 2,963,591,761 | | | $ | 1,782,226,008 | |
| | | | | | | | | | | | | | | | | | | | |
See notes to financial statements.
| | |
| 120 | | 2019 BLACKROCK ANNUAL REPORTTO SHAREHOLDERS |
Statements of Changes in Net Assets (continued)
| | | | | | | | | | | | | | | | | | | | |
| | | LifePath Index 2050 Master Portfolio | | | | | | LifePath Index 2055 Master Portfolio | |
| | | Year Ended December 31, | | | | | | Year Ended December 31, | |
| | | 2019 | | | 2018 | | | | | | 2019 | | | 2018 | |
| | | |
INCREASE (DECREASE) IN NET ASSETS | | | | | | | | | | | | | |
| | | |
OPERATIONS | | | | | | | | | | | | | |
Net investment income | | $ | 70,768,426 | | | $ | 42,251,113 | | | | | | | $ | 33,001,642 | | | $ | 19,496,949 | |
Net realized gain (loss) | | | 22,244,223 | | | | (9,594,937 | ) | | | | | | | 5,381,184 | | | | (5,508,249 | ) |
Net change in unrealized appreciation (depreciation) | | | 491,521,680 | | | | (196,331,936 | ) | | | | | | | 225,548,469 | | | | (84,814,819 | ) |
| | | | | | | | | | | | | | | | | | | | |
Net increase (decrease) in net assets resulting from operations | | | 584,534,329 | | | | (163,675,760 | ) | | | | | | | 263,931,295 | | | | (70,826,119 | ) |
| | | | | | | | | | | | | | | | | | | | |
| | | |
CAPITAL TRANSACTIONS | | | | | | | | | | | | | |
Proceeds from contributions | | | 919,520,436 | | | | 1,149,459,414 | | | | | | | | 614,250,728 | | | | 453,603,905 | |
Value of withdrawals | | | (356,780,583 | ) | | | (271,773,739 | ) | | | | | | | (195,511,565 | ) | | | (140,974,188 | ) |
| | | | | | | | | | | | | | | | | | | | |
Net increase in net assets derived from capital transactions | | | 562,739,853 | | | | 877,685,675 | | | | | | | | 418,739,163 | | | | 312,629,717 | |
| | | | | | | | | | | | | | | | | | | | |
| | | |
NET ASSETS | | | | | | | | | | | | | |
Total increase in net assets | | | 1,147,274,182 | | | | 714,009,915 | | | | | | | | 682,670,458 | | | | 241,803,598 | |
Beginning of year | | | 1,966,285,936 | | | | 1,252,276,021 | | | | | | | | 820,001,974 | | | | 578,198,376 | |
| | | | | | | | | | | | | | | | | | | | |
End of year | | $ | 3,113,560,118 | | | $ | 1,966,285,936 | | | | | | | $ | 1,502,672,432 | | | $ | 820,001,974 | |
| | | | | | | | | | | | | | | | | | | | |
See notes to financial statements.
Statements of Changes in Net Assets (continued)
| | | | | | | | | | | | | | | | |
| | | LifePath Index 2060 Master Portfolio | | | | | | LifePath Index 2065
Master Portfolio | |
| | | Year Ended December 31, | | | | | | Period from
10/30/19 (a)
to 12/31/19 | |
| | | 2019 | | | 2018 | | | | |
| | |
INCREASE (DECREASE) IN NET ASSETS | | | | | | | | | |
| | |
OPERATIONS | | | | | | | | | |
Net investment income | | $ | 8,008,763 | | | $ | 3,235,945 | | | | | | | $ | 18,704 | |
Net realized gain (loss) | | | 457,214 | | | | (4,524,755 | ) | | | | | | | (3,915 | ) |
Net change in unrealized appreciation (depreciation) | | | 52,117,732 | | | | (12,241,518 | ) | | | | | | | 73,112 | |
| | | | | | | | | | | | | | | | |
Net increase (decrease) in net assets resulting from operations | | | 60,583,709 | | | | (13,530,328 | ) | | | | | | | 87,901 | |
| | | | | | | | | | | | | | | | |
| | |
CAPITAL TRANSACTIONS | | | | | | | | | |
Proceeds from contributions | | | 247,464,321 | | | | 137,223,566 | | | | | | | | 2,020,067 | |
Value of withdrawals | | | (54,753,913 | ) | | | (40,647,163 | ) | | | | | | | (27,249 | ) |
| | | | | | | | | | | | | | | | |
Net increase in net assets derived from capital transactions | | | 192,710,408 | | | | 96,576,403 | | | | | | | | 1,992,818 | |
| | | | | | | | | | | | | | | | |
| | |
NET ASSETS | | | | | | | | | |
Total increase in net assets | | | 253,294,117 | | | | 83,046,075 | | | | | | | | 2,080,719 | |
Beginning of period | | | 157,603,765 | | | | 74,557,690 | | | | | | | | — | |
| | | | | | | | | | | | | | | | |
End of period | | $ | 410,897,882 | | | $ | 157,603,765 | | | | | | | $ | 2,080,719 | |
| | | | | | | | | | | | | | | | |
| (a) | Commencement of operations. |
See notes to financial statements.
| | |
| 122 | | 2019 BLACKROCK ANNUAL REPORTTO SHAREHOLDERS |
Financial Highlights
| | | | | | | | | | | | | | | | | | | | |
| | | LifePath Index Retirement Master Portfolio | |
| |
| | | Year Ended December 31, | |
| | | 2019 | | | 2018 | | | 2017 | | | 2016 | | | 2015 | |
| | | | | |
Total Return | | | | | | | | | | | | | | | | | | | | |
Total return | | | 15.90 | % | | | (3.51 | )% | | | 10.75 | % | | | 5.82 | % | | | (0.31 | )% |
| | | | | | | | | | | | | | | | | | | | |
| | | | | |
Ratios to Average Net Assets(a) | | | | | | | | | | | | | | | | | | | | |
Total expenses | | | 0.08 | % | | | 0.08 | % | | | 0.08 | % | | | 0.09 | % | | | 0.10 | % |
| | | | | | | | | | | | | | | | | | | | |
Total expenses after fees waived and/or reimbursed | | | 0.07 | % | | | 0.08 | % | | | 0.08 | % | | | 0.08 | % | | | 0.09 | % |
| | | | | | | | | | | | | | | | | | | | |
Net investment income | | | 2.98 | % | | | 2.55 | % | | | 2.16 | % | | | 2.05 | % | | | 1.84 | % |
| | | | | | | | | | | | | | | | | | | | |
| | | | | |
Supplemental Data | | | | | | | | | | | | | | | | | | | | |
Net assets, end of year (000) | | $ | 7,852,119 | | | $ | 2,301,187 | | | $ | 1,235,273 | | | $ | 810,507 | | | $ | 499,749 | |
| | | | | | | | | | | | | | | | | | | | |
Portfolio turnover rate(b) | | | 13 | % | | | 25 | % | | | 10 | % | | | 13 | % | | | 25 | % |
| | | | | | | | | | | | | | | | | | | | |
| (a) | Includes the LifePath Index Master Portfolio’s pro rata portion of expenses and share of the allocated net investment income from Large Cap Index Master Portfolio, Master Small Cap Index Series, Total International ex U.S. Index Master Portfolio and U.S. Total Bond Index Master Portfolio (collectively, the “Underlying Master Portfolios”). These ratios do not reflect any expenses incurred indirectly as a result of investments in BlackRock Cash Funds: Institutional, BlackRock Cash Funds: Treasury, and iShares exchange-traded funds. |
Includes the LifePath Index Master Portfolio’s share of the Underlying Master Portfolios’ allocated fees waived and excludes expenses incurred indirectly as a result of investments in underlying funds as follows:
| | | | | | | | | | | | | | | | | | | | |
| | | Year Ended December 31, | |
| | | 2019 | | | 2018 | | | 2017 | | | 2016 | | | 2015 | |
Allocated fees waived | | | 0.00 | % | | | 0.00 | % | | | 0.01 | % | | | 0.01 | % | | | 0.01 | % |
Investments in underlying funds | | | 0.03 | % | | | 0.03 | % | | | 0.03 | % | | | 0.03 | % | | | 0.03 | % |
| | | | | | | | | | | | | | | | | | | | |
| (b) | Includes the purchases and sales of the underlying funds and the Underlying Master Portfolios. |
See notes to financial statements.
Financial Highlights (continued)
| | | | | | | | | | | | | | | | | | | | |
| | | LifePath Index 2025 Master Portfolio | |
| |
| | | Year Ended December 31, | |
| | | 2019 | | | 2018 | | | 2017 | | | 2016 | | | 2015 | |
| | | | | |
Total Return | | | | | | | | | | | | | | | | | | | | |
Total return | | | 18.98 | % | | | (4.78 | )% | | | 14.43 | % | | | 6.87 | % | | | (0.45 | )% |
| | | | | | | | | | | | | | | | | | | | |
| | | | | |
Ratios to Average Net Assets(a) | | | | | | | | | | | | | | | | | | | | |
Total expenses | | | 0.08 | % | | | 0.08 | % | | | 0.08 | % | | | 0.09 | % | | | 0.10 | % |
| | | | | | | | | | | | | | | | | | | | |
Total expenses after fees waived and/or reimbursed | | | 0.06 | % | | | 0.07 | % | | | 0.07 | % | | | 0.08 | % | | | 0.09 | % |
| | | | | | | | | | | | | | | | | | | | |
Net investment income | | | 2.69 | % | | | 2.46 | % | | | 2.34 | % | | | 2.19 | % | | | 2.06 | % |
| | | | | | | | | | | | | | | | | | | | |
| | | | | |
Supplemental Data | | | | | | | | | | | | | | | | | | | | |
Net assets, end of year (000) | | $ | 4,518,704 | | | $ | 3,005,565 | | | $ | 2,501,126 | | | $ | 1,435,857 | | | $ | 776,535 | |
| | | | | | | | | | | | | | | | | | | | |
Portfolio turnover rate(b) | | | 11 | % | | | 11 | % | | | 8 | % | | | 16 | % | | | 12 | % |
| | | | | | | | | | | | | | | | | | | | |
| (a) | Includes the LifePath Index Master Portfolio’s pro rata portion of expenses and share of the allocated net investment income from Large Cap Index Master Portfolio, Master Small Cap Index Series, Total International ex U.S. Index Master Portfolio and U.S. Total Bond Index Master Portfolio (collectively, the “Underlying Master Portfolios”). These ratios do not reflect any expenses incurred indirectly as a result of investments in BlackRock Cash Funds: Institutional, BlackRock Cash Funds: Treasury, and iShares exchange-traded funds. |
Includes the LifePath Index Master Portfolio’s share of the Underlying Master Portfolios’ allocated fees waived and excludes expenses incurred indirectly as a result of investments in underlying funds as follows:
| | | | | | | | | | | | | | | | | | | | |
| | | Year Ended December 31, | |
| | | 2019 | | | 2018 | | | 2017 | | | 2016 | | | 2015 | |
Allocated fees waived | | | 0.00 | % | | | 0.00 | % | | | 0.01 | % | | | 0.01 | % | | | 0.00 | % |
Investments in underlying funds | | | 0.04 | % | | | 0.04 | % | | | 0.04 | % | | | 0.06 | % | | | 0.05 | % |
| | | | | | | | | | | | | | | | | | | | |
| (b) | Includes the purchases and sales of the underlying funds and the Underlying Master Portfolios. |
See notes to financial statements.
| | |
| 124 | | 2019 BLACKROCK ANNUAL REPORTTO SHAREHOLDERS |
Financial Highlights (continued)
| | | | | | | | | | | | | | | | | | | | |
| | | LifePath Index 2030 Master Portfolio | |
| |
| | | Year Ended December 31, | |
| | | 2019 | | | 2018 | | | 2017 | | | 2016 | | | 2015 | |
| | | | | |
Total Return | | | | | | | | | | | | | | | | | | | | |
Total return | | | 21.08 | % | | | (5.56 | )% | | | 16.36 | % | | | 7.29 | % | | | (0.50 | )% |
| | | | | | | | | | | | | | | | | | | | |
| | | | | |
Ratios to Average Net Assets(a) | | | | | | | | | | | | | | | | | | | | |
Total expenses | | | 0.08 | % | | | 0.08 | % | | | 0.08 | % | | | 0.09 | % | | | 0.10 | % |
| | | | | | | | | | | | | | | | | | | | |
Total expenses after fees waived and/or reimbursed | | | 0.06 | % | | | 0.06 | % | | | 0.07 | % | | | 0.08 | % | | | 0.09 | % |
| | | | | | | | | | | | | | | | | | | | |
Net investment income | | | 2.69 | % | | | 2.65 | % | | | 2.43 | % | | | 2.26 | % | | | 2.15 | % |
| | | | | | | | | | | | | | | | | | | | |
| | | | | |
Supplemental Data | | | | | | | | | | | | | | | | | | | | |
Net assets, end of year (000) | | $ | 7,805,778 | | | $ | 5,731,676 | | | $ | 3,131,612 | | | $ | 1,911,138 | | | $ | 1,076,681 | |
| | | | | | | | | | | | | | | | | | | | |
Portfolio turnover rate(b) | | | 14 | % | | | 15 | % | | | 7 | % | | | 19 | % | | | 12 | % |
| | | | | | | | | | | | | | | | | | | | |
| (a) | Includes the LifePath Index Master Portfolio’s pro rata portion of expenses and share of the allocated net investment income from Large Cap Index Master Portfolio, Master Small Cap Index Series, Total International ex U.S. Index Master Portfolio and U.S. Total Bond Index Master Portfolio (collectively, the “Underlying Master Portfolios”). These ratios do not reflect any expenses incurred indirectly as a result of investments in BlackRock Cash Funds: Institutional, BlackRock Cash Funds: Treasury, and iShares exchange-traded funds. |
Includes the LifePath Index Master Portfolio’s share of the Underlying Master Portfolios’ allocated fees waived and excludes expenses incurred indirectly as a result of investments in underlying funds as follows:
| | | | | | | | | | | | | | | | | | | | |
| | | Year Ended December 31 | |
| | | 2019 | | | 2018 | | | 2017 | | | 2016 | | | 2015 | |
Allocated fees waived | | | 0.00 | % | | | 0.00 | % | | | 0.00 | % | | | 0.00 | % | | | 0.01 | % |
Investments in underlying funds | | | 0.04 | % | | | 0.04 | % | | | 0.05 | % | | | 0.07 | % | | | 0.06 | % |
| | | | | | | | | | | | | | | | | | | | |
| (b) | Includes the purchases and sales of the underlying funds and the Underlying Master Portfolios. |
See notes to financial statements.
Financial Highlights (continued)
| | | | | | | | | | | | | | | | | | | | |
| | | LifePath Index 2035 Master Portfolio | |
| |
| | | Year Ended December 31, | |
| | | 2019 | | | 2018 | | | 2017 | | | 2016 | | | 2015 | |
| | | | | |
Total Return | | | | | | | | | | | | | | | | | | | | |
Total return | | | 23.08 | % | | | (6.36 | )% | | | 18.29 | % | | | 7.74 | % | | | (0.56 | )% |
| | | | | | | | | | | | | | | | | | | | |
| | | | | |
Ratios to Average Net Assets(a) | | | | | | | | | | | | | | | | | | | | |
Total expenses | | | 0.07 | % | | | 0.08 | % | | | 0.08 | % | | | 0.09 | % | | | 0.10 | % |
| | | | | | | | | | | | | | | | | | | | |
Total expenses after fees waived and/or reimbursed | | | 0.05 | % | | | 0.06 | % | | | 0.06 | % | | | 0.07 | % | | | 0.08 | % |
| | | | | | | | | | | | | | | | | | | | |
Net investment income | | | 2.74 | % | | | 2.50 | % | | | 2.54 | % | | | 2.34 | % | | | 2.26 | % |
| | | | | | | | | | | | | | | | | | | | |
| | | | | |
Supplemental Data | | | | | | | | | | | | | | | | | | | | |
Net assets, end of year (000) | | $ | 4,081,797 | | | $ | 2,593,250 | | | $ | 2,117,151 | | | $ | 1,169,918 | | | $ | 609,572 | |
| | | | | | | | | | | | | | | | | | | | |
Portfolio turnover rate(b) | | | 13 | % | | | 10 | % | | | 6 | % | | | 22 | % | | | 10 | % |
| | | | | | | | | | | | | | | | | | | | |
| (a) | Includes the LifePath Index Master Portfolio’s pro rata portion of expenses and share of the allocated net investment income from Large Cap Index Master Portfolio, Master Small Cap Index Series, Total International ex U.S. Index Master Portfolio and U.S. Total Bond Index Master Portfolio (collectively, the “Underlying Master Portfolios”). These ratios do not reflect any expenses incurred indirectly as a result of investments in BlackRock Cash Funds: Institutional, BlackRock Cash Funds: Treasury, and iShares exchange-traded funds. |
Includes the LifePath Index Master Portfolio’s share of the Underlying Master Portfolios’ allocated fees waived and excludes expenses incurred indirectly as a result of investments in underlying funds as follows:
| | | | | | | | | | | | | | | | | | | | |
| | | Year Ended December 31, | |
| | | 2019 | | | 2018 | | | 2017 | | | 2016 | | | 2015 | |
Allocated fees waived | | | 0.00 | % | | | 0.00 | % | | | 0.00 | % | | | 0.00 | % | | | 0.00 | % |
Investments in underlying funds | | | 0.05 | % | | | 0.05 | % | | | 0.05 | % | | | 0.08 | % | | | 0.07 | % |
| | | | | | | | | | | | | | | | | | | | |
| (b) | Includes the purchases and sales of the underlying funds and the Underlying Master Portfolios. |
See notes to financial statements.
| | |
| 126 | | 2019 BLACKROCK ANNUAL REPORTTO SHAREHOLDERS |
Financial Highlights (continued)
| | | | | | | | | | | | | | | | | | | | |
| | | LifePath Index 2040 Master Portfolio | |
| |
| | | Year Ended December 31, | |
| | | 2019 | | | 2018 | | | 2017 | | | 2016 | | | 2015 | |
| | | | | |
Total Return | | | | | | | | | | | | | | | | | | | | |
Total return | | | 25.01 | % | | | (7.08 | )% | | | 19.95 | % | | | 8.10 | % | | | (0.56 | )% |
| | | | | | | | | | | | | | | | | | | | |
| | | | | |
Ratios to Average Net Assets(a) | | | | | | | | | | | | | | | | | | | | |
Total expenses | | | 0.07 | % | | | 0.08 | % | | | 0.08 | % | | | 0.09 | % | | | 0.10 | % |
| | | | | | | | | | | | | | | | | | | | |
Total expenses after fees waived and/or reimbursed | | | 0.05 | % | | | 0.05 | % | | | 0.06 | % | | | 0.07 | % | | | 0.08 | % |
| | | | | | | | | | | | | | | | | | | | |
Net investment income | | | 2.74 | % | | | 2.75 | % | | | 2.63 | % | | | 2.39 | % | | | 2.33 | % |
| | | | | | | | | | | | | | | | | | | | |
| | | | | |
Supplemental Data | | | | | | | | | | | | | | | | | | | | |
Net assets, end of year (000) | | $ | 6,170,049 | | | $ | 4,386,518 | | | $ | 2,334,784 | | | $ | 1,354,894 | | | $ | 751,306 | |
| | | | | | | | | | | | | | | | | | | | |
Portfolio turnover rate(b) | | | 14 | % | | | 12 | % | | | 6 | % | | | 26 | % | | | 11 | % |
| | | | | | | | | | | | | | | | | | | | |
| (a) | Includes the LifePath Index Master Portfolio’s pro rata portion of expenses and share of the allocated net investment income from Large Cap Index Master Portfolio, Master Small Cap Index Series, Total International ex U.S. Index Master Portfolio and U.S. Total Bond Index Master Portfolio (collectively, the “Underlying Master Portfolios”). These ratios do not reflect any expenses incurred indirectly as a result of investments in BlackRock Cash Funds: Institutional, BlackRock Cash Funds: Treasury, and iShares exchange-traded funds. |
Includes the LifePath Index Master Portfolio’s share of the Underlying Master Portfolios’ allocated fees waived and excludes expenses incurred indirectly as a result of investments in underlying funds as follows:
| | | | | | | | | | | | | | | | | | | | |
| | | Year Ended December 31, | |
| | | 2019 | | | 2018 | | | 2017 | | | 2016 | | | 2015 | |
Allocated fees waived | | | 0.00 | % | | | 0.00 | % | | | 0.00 | % | | | 0.00 | % | | | 0.00 | % |
Investments in underlying funds | | | 0.05 | % | | | 0.05 | % | | | 0.06 | % | | | 0.09 | % | | | 0.07 | % |
| | | | | | | | | | | | | | | | | | | | |
| (b) | Includes the purchases and sales of the underlying funds and the Underlying Master Portfolios. |
See notes to financial statements.
Financial Highlights (continued)
| | | | | | | | | | | | | | | | | | | | |
| | | LifePath Index 2045 Master Portfolio | |
| |
| | | Year Ended December 31, | |
| | | 2019 | | | 2018 | | | 2017 | | | 2016 | | | 2015 | |
| | | | | |
Total Return | | | | | | | | | | | | | | | | | | | | |
Total return | | | 26.25 | % | | | (7.50 | )% | | | 21.07 | % | | | 8.28 | % | | | (0.64 | )% |
| | | | | | | | | | | | | | | | | | | | |
| | | | | |
Ratios to Average Net Assets(a) | | | | | | | | | | | | | | | | | | | | |
Total expenses | | | 0.07 | % | | | 0.08 | % | | | 0.08 | % | | | 0.09 | % | | | 0.11 | % |
| | | | | | | | | | | | | | | | | | | | |
Total expenses after fees waived and/or reimbursed | | | 0.05 | % | | | 0.05 | % | | | 0.05 | % | | | 0.06 | % | | | 0.07 | % |
| | | | | | | | | | | | | | | | | | | | |
Net investment income | | | 2.80 | % | | | 2.54 | % | | | 2.74 | % | | | 2.44 | % | | | 2.39 | % |
| | | | | | | | | | | | | | | | | | | | |
| | | | | |
Supplemental Data | | | | | | | | | | | | | | | | | | | | |
Net assets, end of year (000) | | $ | 2,963,592 | | | $ | 1,782,226 | | | $ | 1,386,282 | | | $ | 691,641 | | | $ | 341,230 | |
| | | | | | | | | | | | | | | | | | | | |
Portfolio turnover rate(b) | | | 12 | % | | | 8 | % | | | 6 | % | | | 26 | % | | | 10 | % |
| | | | | | | | | | | | | | | | | | | | |
| (a) | Includes the LifePath Index Master Portfolio’s pro rata portion of expenses and share of the allocated net investment income from Large Cap Index Master Portfolio, Master Small Cap Index Series, Total International ex U.S. Index Master Portfolio and U.S. Total Bond Index Master Portfolio (collectively, the “Underlying Master Portfolios”). These ratios do not reflect any expenses incurred indirectly as a result of investments in BlackRock Cash Funds: Institutional, BlackRock Cash Funds: Treasury, and iShares exchange-traded funds. |
Includes the LifePath Index Master Portfolio’s share of the Underlying Master Portfolios’ allocated fees waived and excludes expenses incurred indirectly as a result of investments in underlying funds as follows:
| | | | | | | | | | | | | | | | | | | | |
| | | Year Ended December 31, | |
| | | 2019 | | | 2018 | | | 2017 | | | 2016 | | | 2015 | |
Allocated fees waived | | | 0.00 | % | | | 0.00 | % | | | 0.00 | % | | | 0.00 | % | | | 0.00 | % |
Investments in underlying funds | | | 0.05 | % | | | 0.06 | % | | | 0.06 | % | | | 0.10 | % | | | 0.08 | % |
| | | | | | | | | | | | | | | | | | | | |
| (b) | Includes the purchases and sales of the underlying funds and the Underlying Master Portfolios. |
See notes to financial statements.
| | |
| 128 | | 2019 BLACKROCK ANNUAL REPORTTO SHAREHOLDERS |
Financial Highlights (continued)
| | | | | | | | | | | | | | | | | | | | |
| | | LifePath Index 2050 Master Portfolio | |
| |
| | | Year Ended December 31, | |
| | | 2019 | | | 2018 | | | 2017 | | | 2016 | | | 2015 | |
| | | | | |
Total Return | | | | | | | | | | | | | | | | | | | | |
Total return | | | 26.77 | % | | | (7.82 | )% | | | 21.43 | % | | | 8.41 | % | | | (0.67 | )% |
| | | | | | | | | | | | | | | | | | | | |
| | | | | |
Ratios to Average Net Assets(a) | | | | | | | | | | | | | | | | | | | | |
Total expenses | | | 0.07 | % | | | 0.08 | % | | | 0.08 | % | | | 0.09 | % | | | 0.11 | % |
| | | | | | | | | | | | | | | | | | | | |
Total expenses after fees waived and/or reimbursed | | | 0.05 | % | | | 0.05 | % | | | 0.05 | % | | | 0.06 | % | | | 0.07 | % |
| | | | | | | | | | | | | | | | | | | | |
Net investment income | | | 2.79 | % | | | 2.67 | % | | | 2.76 | % | | | 2.44 | % | | | 2.39 | % |
| | | | | | | | | | | | | | | | | | | | |
| | | | | |
Supplemental Data | | | | | | | | | | | | | | | | | | | | |
Net assets, end of year (000) | | $ | 3,113,560 | | | $ | 1,966,286 | | | $ | 1,252,276 | | | $ | 649,862 | | | $ | 337,064 | |
| | | | | | | | | | | | | | | | | | | | |
Portfolio turnover rate(b) | | | 12 | % | | | 11 | % | | | 5 | % | | | 28 | % | | | 14 | % |
| | | | | | | | | | | | | | | | | | | | |
| (a) | Includes the LifePath Index Master Portfolio’s pro rata portion of expenses and share of the allocated net investment income from Large Cap Index Master Portfolio, Master Small Cap Index Series, Total International ex U.S. Index Master Portfolio and U.S. Total Bond Index Master Portfolio (collectively, the “Underlying Master Portfolios”). These ratios do not reflect any expenses incurred indirectly as a result of investments in BlackRock Cash Funds: Institutional, BlackRock Cash Funds: Prime and iShares exchange-traded funds. |
Includes the LifePath Index Master Portfolio’s share of the Underlying Master Portfolio’s allocated fees waived and excludes expenses incurred indirectly as a result of investments in underlying funds as follows:
| | | | | | | | | | | | | | | | | | | | |
| | | Year Ended December 31, | |
| | | 2019 | | | 2018 | | | 2017 | | | 2016 | | | 2015 | |
Allocated fees waived | | | 0.00 | % | | | 0.00 | % | | | 0.00 | % | | | 0.00 | % | | | 0.00 | % |
Investments in underlying funds | | | 0.05 | % | | | 0.06 | % | | | 0.06 | % | | | 0.10 | % | | | 0.09 | % |
| | | | | | | | | | | | | | | | | | | | |
| (b) | Includes the purchases and sales of the underlying funds and the Underlying Master Portfolios. |
See notes to financial statements.
Financial Highlights (continued)
| | | | | | | | | | | | | | | | | | | | |
| | | LifePath Index 2055 Master Portfolio | |
| |
| | | Year Ended December 31, | |
| | | 2019 | | | 2018 | | | 2017 | | | 2016 | | | 2015 | |
| | | | | |
Total Return | | | | | | | | | | | | | | | | | | | | |
Total return | | | 26.89 | % | | | (7.79 | )% | | | 21.43 | % | | | 8.37 | % | | | (0.60 | )% |
| | | | | | | | | | | | | | | | | | | | |
| | | | | |
Ratios to Average Net Assets(a) | | | | | | | | | | | | | | | | | | | | |
Total expenses | | | 0.08 | % | | | 0.08 | % | | | 0.08 | % | | | 0.11 | % | | | 0.14 | % |
| | | | | | | | | | | | | | | | | | | | |
Total expenses after fees waived and/or reimbursed | | | 0.04 | % | | | 0.04 | % | | | 0.04 | % | | | 0.04 | % | | | 0.06 | % |
| | | | | | | | | | | | | | | | | | | | |
Net investment income | | | 2.85 | % | | | 2.59 | % | | | 2.82 | % | | | 2.50 | % | | | 2.44 | % |
| | | | | | | | | | | | | | | | | | | | |
| | | | | |
Supplemental Data | | | | | | | | | | | | | | | | | | | | |
Net assets, end of year (000) | | $ | 1,502,672 | | | $ | 820,002 | | | $ | 578,198 | | | $ | 251,028 | | | $ | 107,004 | |
| | | | | | | | | | | | | | | | | | | | |
Portfolio turnover rate(b) | | | 12 | % | | | 8 | % | | | 5 | % | | | 33 | % | | | 17 | % |
| | | | | | | | | | | | | | | | | | | | |
| (a) | Includes the LifePath Index Master Portfolio’s pro rata portion of expenses and share of the allocated net investment income from Large Cap Index Master Portfolio, Master Small Cap Index Series, Total International ex U.S. Index Master Portfolio and U.S. Total Bond Index Master Portfolio (collectively, the “Underlying Master Portfolios”). These ratios do not reflect any expenses incurred indirectly as a result of investments in BlackRock Cash Funds: Institutional, BlackRock Cash Funds: Treasury, and iShares exchange-traded funds. |
Includes the LifePath Index Master Portfolio’s share of the Underlying Master Portfolios’ allocated fees waived and excludes expenses incurred indirectly as a result of investments in underlying funds as follows:
| | | | | | | | | | | | | | | | | | | | |
| | | Year Ended December 31, | |
| | | 2019 | | | 2018 | | | 2017 | | | 2016 | | | 2015 | |
Allocated fees waived | | | 0.00 | % | | | 0.00 | % | | | 0.00 | % | | | 0.00 | % | | | 0.00 | % |
Investments in underlying funds | | | 0.05 | % | | | 0.06 | % | | | 0.07 | % | | | 0.11 | % | | | 0.09 | % |
| | | | | | | | | | | | | | | | | | | | |
| (b) | Includes the purchases and sales of the underlying funds and the Underlying Master Portfolios. |
See notes to financial statements.
| | |
| 130 | | 2019 BLACKROCK ANNUAL REPORTTO SHAREHOLDERS |
Financial Highlights (continued)
| | | | | | | | | | | | | | | | |
| | | LifePath Index 2060 Master Portfolio | |
| | |
| | | Year Ended December 31, | | | Period from 02/29/16 (a) to 12/31/16 | |
| | | 2019 | | | 2018 | | | 2017 | |
| | | | |
Total Return | | | | | | | | | | | | | | | | |
Total return | | | 26.92 | % | | | (7.84 | )% | | | 21.51 | % | | | 15.54 | %(b) |
| | | | | | | | | | | | | | | | |
| | | | |
Ratios to Average Net Assets(c) | | | | | | | | | | | | | | | | |
Total expenses | | | 0.10 | % | | | 0.11 | % | | | 0.15 | % | | | 1.40 | %(d)(e) |
| | | | | | | | | | | | | | | | |
Total expenses after fees waived and/or reimbursed | | | 0.04 | % | | | 0.04 | % | | | 0.04 | % | | | 0.04 | %(d) |
| | | | | | | | | | | | | | | | |
Net investment income | | | 2.98 | % | | | 2.71 | % | | | 3.22 | % | | | 2.74 | %(d) |
| | | | | | | | | | | | | | | | |
| | | | |
Supplemental Data | | | | | | | | | | | | | | | | |
Net assets, end of period (000) | | $ | 410,898 | | | $ | 157,604 | | | $ | 74,558 | | | $ | 10,755 | |
| | | | | | | | | | | | | | | | |
Portfolio turnover rate(f) | | | 11 | % | | | 13 | % | | | 1 | % | | | 71 | % |
| | | | | | | | | | | | | | | | |
| (a) | Commencement of operations. |
| (b) | Aggregate total return. |
| (c) | Includes the LifePath Index Master Portfolio’s pro rata portion of expenses and share of the allocated net investment income from Large Cap Index Master Portfolio, Master Small Cap Index Series, Total International ex U.S. Index Master Portfolio and U.S. Total Bond Index Master Portfolio (collectively, the “Underlying Master Portfolios”). These ratios do not reflect any expenses incurred indirectly as a result of investments in BlackRock Cash Funds: Institutional, BlackRock Cash Funds: Treasury, and iShares exchange-traded funds. |
Includes the LifePath Index Master Portfolio’s share of the Underlying Master Portfolios’ allocated fees waived and excludes expenses incurred indirectly as a result of investments in underlying funds as follows:
| | | | | | | | | | | | | | | | |
| | |
| | | Year Ended December 31, | | | Period from
02/29/16 (a) to 12/31/16 | |
| | | 2019 | | | 2018 | | | 2017 | |
Allocated fees waived | | | 0.00 | % | | | 0.00 | % | | | 0.00 | % | | | 0.00 | % |
Investments in underlying funds | | | 0.05 | % | | | 0.06 | % | | | 0.07 | % | | | 0.12 | % |
| | | | | | | | | | | | | | | | |
| (e) | Audit costs were not annualized in the calculation of the expense ratios. If these expenses were annualized, the total expenses would have been 1.54%. |
| (f) | Includes the purchases and sales of the underlying funds and the Underlying Master Portfolios. |
See notes to financial statements.
Financial Highlights (continued)
| | | | |
| | | LifePath Index 2065
Master Portfolio | |
| | | Period from
10/30/19 (a) to 12/31/19 | |
Total Return | | | | |
Total return | | | 5.72 | %(b) |
| | | | |
| |
Ratios to Average Net Assets(c)(d) | | | | |
Total expenses | | | 3.06 | %(e) |
| | | | |
Total expenses after fees waived and/or reimbursed | | | 0.06 | % |
| | | | |
Net investment income | | | 7.07 | % |
| | | | |
| |
Supplemental Data | | | | |
Net assets, end of period (000) | | $ | 2,081 | |
| | | | |
Portfolio turnover rate(f) | | | 1 | % |
| | | | |
| (a) | Commencement of operations. |
| (b) | Aggregate total return. |
| (c) | Includes the LifePath Index Master Portfolio’s pro rata portion of expenses and share of the allocated net investment income from Large Cap Index Master Portfolio, Master Small Cap Index Series, Total International ex U.S. Index Master Portfolio and U.S. Total Bond Index Master Portfolio (collectively, the “Underlying Master Portfolios”). These ratios do not reflect any expenses incurred indirectly as a result of investments in BlackRock Cash Funds: Institutional, BlackRock Cash Funds: Treasury, and iShares exchange-traded funds. |
Includes the LifePath Index Master Portfolio’s share of the Underlying Master Portfolios’ allocated fees waived of 0.00%. Excludes expenses incurred indirectly as a result of investments in underlying funds of 0.11%.
| (e) | Audit, offering and organization costs were not annualized in the calculation of expense ratios. If these expenses were annualized, the total expenses would have been 6.70%. |
| (f) | Includes the purchases and sales of the underlying funds and the Underlying Master Portfolios. |
| See | | notes to financial statements. |
| | |
| 132 | | 2019 BLACKROCK ANNUAL REPORTTO SHAREHOLDERS |
Notes to Financial Statements
Master Investment Portfolio (“MIP”) is registered under the Investment Company Act of 1940, as amended (the “1940 Act”), as anopen-end management investment company. MIP is organized as a Delaware statutory trust. The financial statements and these accompanying notes relate to ten series of MIP: LifePath® Index Retirement Master Portfolio, LifePath® Index 2025 Master Portfolio, LifePath® Index 2030 Master Portfolio, LifePath® Index 2035 Master Portfolio, LifePath® Index 2040 Master Portfolio, LifePath® Index 2045 Master Portfolio, LifePath® Index 2050 Master Portfolio, LifePath® Index 2055 Master Portfolio, LifePath® Index 2060 Master Portfolio and LifePath® Index 2065 Master Portfolio (each, a “LifePath Index Master Portfolio” and together, the “LifePath Index Master Portfolios”). Each LifePath Index Master Portfolio is classified as diversified.
As of period end, the investment of LifePath Index Retirement Master Portfolio, LifePath Index 2025 Master Portfolio, LifePath Index 2030 Master Portfolio, LifePath Index 2035 Master Portfolio, LifePath Index 2040 Master Portfolio, LifePath Index 2045 Master Portfolio, LifePath Index 2050 Maser Portfolio, LifePath Index 2055 Master Portfolio, LifePath Index 2060 Master Portfolio and LifePath Index 2065 Master Portfolio in Large Cap Index Master Portfolio represented 22.1%, 29.3%, 35.7%, 41.4%, 46.8%, 50.4%, 51.7%, 51.8%, 51.8% and 51.6%, respectively, of net assets. The investment of LifePath Index Retirement Master Portfolio, LifePath Index 2025 Master Portfolio, LifePath Index 2030 Master Portfolio, LifePath Index 2035 Master Portfolio, LifePath Index 2040 Master Portfolio, LifePath Index 2045 Master Portfolio, LifePath Index 2050 Master Portfolio, LifePath Index 2055 Master Portfolio, LifePath Index 2060 Master Portfolio and LifePath Index 2065 Master Portfolio in U.S. Total Bond Index Master Portfolio represented 51.7%, 38.4%, 27.2%, 17.2%, 8.5%, 3.0%, 1.0%, 0.8%, 0.9% and 1.0%, respectively, of net assets. As such, financial statements of Large Cap Index Master Portfolio and U.S. Total Bond Index Master Portfolio, including the Schedules of Investments, should be read in conjunction with each respective LifePath Index Master Portfolio’s financial statements. Large Cap Index Master Portfolio’s and U.S. Total Bond Index Master Portfolio’s financial statements, which are included in filings by MIP, and Master Small Cap Index Series’ financial statements, which are included in filings by Quantitative Master Series LLC, are available, without charge, on the U.S. Securities and Exchange Commission’s (“SEC”) website atsec.gov.
The LifePath Index Master Portfolios will generally invest in other registered investment companies (each, an “Underlying Fund” and collectively, the “Underlying Funds”) that are managed by subsidiaries of BlackRock, Inc. (“BlackRock”), which are its affiliates and affiliates of the LifePath Index Master Portfolios. The LifePath Index Master Portfolios may also invest in other master portfolios (“Underlying Master Portfolios”) that are managed by subsidiaries of BlackRock.
The value of a LifePath Index Master Portfolio’s investment in each of Large Cap Index Master Portfolio, Master Small Cap Index Series and U.S. Total Bond Index Master Portfolio reflects that LifePath Index Master Portfolio’s proportionate interest in the net assets of that Underlying Master Portfolio. As of period end, the LifePath Index Master Portfolios held interests in Underlying Master Portfolios as follows:
| | | | | | | | | | | | |
| | | Large Cap Index Master Portfolio | | | Master Small Cap Index Series | | | U.S. Total Bond Index Master Portfolio | |
LifePath Index Retirement Master Portfolio | | | 11.5 | % | | | 8.0 | % | | | 36.3 | % |
LifePath Index 2025 Master Portfolio | | | 8.8 | | | | 4.2 | | | | 15.5 | |
LifePath Index 2030 Master Portfolio | | | 18.4 | | | | 6.5 | | | | 19.0 | |
LifePath Index 2035 Master Portfolio | | | 11.2 | | | | 3.0 | | | | 6.3 | |
LifePath Index 2040 Master Portfolio | | | 19.1 | | | | 4.1 | | | | 4.7 | |
LifePath Index 2045 Master Portfolio | | | 9.9 | | | | 1.8 | | | | 0.8 | |
LifePath Index 2050 Master Portfolio | | | 10.6 | | | | 1.8 | | | | 0.3 | |
LifePath Index 2055 Master Portfolio | | | 5.1 | | | | 0.9 | | | | 0.1 | |
LifePath Index 2060 Master Portfolio | | | 1.4 | | | | 0.3 | | | | 0.0 | |
LifePath Index 2065 Master Portfolio | | | 0.0 | | | | 0.0 | | | | 0.0 | |
The LifePath Index Master Portfolios, together with certain other registered investment companies advised by BlackRock Fund Advisors (“BFA” or the “Manager”) or its affiliates, are included in a complex of equity, multi-asset, index and money market funds referred to as the BlackRock Multi-Asset Complex.
On November 12-13, 2019, the Board approved a proposal pursuant to which each “feeder” fund will cease to invest in its corresponding LifePath Index Master Portfolio as part of a “master-feeder” structure and instead each “feeder” fund will operate as a stand-alone fund. These changes are expected to be effective on or about March 2, 2020.
Reorganization: The Board of Trustees of MIP approved the reorganization of LifePath® Index 2020 Master Portfolio (the “Target Master Portfolio”) into the LifePath Index Retirement Master Portfolio. As a result, the LifePath Index Retirement Master Portfolio acquired substantially all of the assets and assumed substantially all of the liabilities of the Target Master Portfolio in exchange for an equal aggregate value of newly-issued interests of the LifePath Index Retirement Master Portfolio.
On November 18, 2019, all of the portfolio securities previously held by the Target Master Portfolio were subsequently contributed by the LifePath Index Retirement Fund to the LifePath Index Master Portfolio in exchange for an investment in the LifePath Index Master Portfolio.
For financial reporting purposes, assets received and shares issued by the LifePath Index Retirement Master Portfolio were recorded at fair value. However, the cost basis of the investments received from the Target Master Portfolio was carried forward to align ongoing reporting of the LifePath Index Retirement Master Portfolio’s realized and unrealized gains and losses with amounts distributable to shareholders for tax purposes.
The Target Master Portfolio’s net assets and composition of net assets on November 15, 2019, the valuation date of the reorganization were as follows:
| | | | |
| | | Target
Master Portfolio | |
Net assets | | $ | 4,549,694,392 | |
Investors’ capital | | | 4,050,151,651 | |
Net unrealized appreciation | | | 499,542,741 | |
| | | | |
| NOTESTO FINANCIAL STATEMENTS | | | 133 | |
Notes to Financial Statements (continued)
The net assets of the LifePath Index Retirement Master Portfolio before the reorganization were $3,192,140,985. The aggregate net assets of the LifePath Index Retirement Master Portfolio immediately after the reorganization amounted to $7,741,835,377. The Target Master Portfolio’s fair value and cost of investments prior to the reorganization were as follows:
| | | | | | | | |
| Target Master Portfolio | | Fair Value of Investments | | | Cost of
Investments | |
LifePath Index 2020 Master Portfolio | | $ | 4,547,571,848 | | | $ | 4,048,029,107 | |
The purpose of these transactions was to combine two funds managed by the Manager with substantially similar (but not identical) investment objectives, investment policies, strategies, risks and restrictions. The reorganization was atax-free event and was effective on November 18, 2019.
Assuming the reorganization had been completed on January 1, 2019, the beginning of the fiscal reporting period of the LifePath Index Master Portfolio, the pro forma results of operations for the year ended December 31, 2019, are as follows:
| | • | | Net investment income: $191,533,781 |
| | • | | Net realized and change in unrealized gain on investments: $281,782,536 |
| | • | | Net increase in net assets resulting from operations: $473,316,317 |
Because the combined investment portfolios have been managed as a single integrated portfolio since the reorganization was completed, it is not practicable to separate the amounts of revenue and earnings of the Target Master Portfolio that have been included in the LifePath Index Retirement Master Portfolio’s Statement of Operations since November 18, 2019.
Prior Year Reorganization: The Board of Trustees of the Trust and the Board of Trustees of State Farm Mutual Fund Trust and the shareholders of State Farm LifePath Retirement Fund, State Farm LifePath 2020 Fund, State Farm LifePath 2030 Fund, State Farm LifePath 2040 Fund and State Farm LifePath 2050 Fund (individually, a “State Farm Fund” and collectively the “State Farm Funds”) approved the reorganization of the State Farm Funds into LifePath Index Retirement Fund, LifePath Index 2020 Fund, LifePath Index 2030 Fund, LifePath Index 2040 Fund and LifePath Index 2050 Fund, respectively. As a result, the applicable LifePath Index Funds acquired all of the assets and assumed certain stated liabilities of the State Farm Funds in exchange for an equal aggregate value of newly-issued shares of the LifePath Index Funds.
On November 19, 2018, all of the portfolio securities previously held by the State Farm Funds were subsequently contributed by the LifePath Index Funds to the LifePath Index Master Portfolios in exchange for an investment in the LifePath Index Master Portfolios.
For financial reporting purposes, assets received and shares issued by the LifePath Index Funds were recorded at fair value. However, the cost basis of the investments received from the State Farm Funds were carried forward by the LifePath Index Master Portfolios to align ongoing reporting of the LifePath Index Funds’ realized and unrealized gains and losses with amounts distributable to shareholders for tax purposes.
The State Farm Funds’ fair value and cost of investments prior to the reorganization were as follows:
| | | | | | | | |
| | | Fair Value of Investments | | | Cost of Investments | |
State Farm LifePath Retirement Fund | | $ | 1,060,853,760 | | | $ | 1,064,814,227 | |
State Farm LifePath 2020 Fund | | | 1,876,177,923 | | | | 1,879,869,831 | |
State Farm LifePath 2030 Fund | | | 2,221,557,497 | | | | 2,227,161,576 | |
State Farm LifePath 2040 Fund | | | 1,751,947,113 | | | | 1,757,351,755 | |
State Farm LifePath 2050 Fund | | | 427,090,360 | | | | 428,381,738 | |
| 2. | SIGNIFICANT ACCOUNTING POLICIES |
The financial statements are prepared in conformity with accounting principles generally accepted in the United States of America (“U.S. GAAP”), which may require management to make estimates and assumptions that affect the reported amounts of assets and liabilities in the financial statements, disclosure of contingent assets and liabilities at the date of the financial statements and the reported amounts of increases and decreases in net assets from operations during the reporting period. Actual results could differ from those estimates. Each LifePath Index Master Portfolio is considered an investment company under U.S. GAAP and follows the accounting and reporting guidance applicable to investment companies. Below is a summary of significant accounting policies:
Investment Transactions and Income Recognition:For financial reporting purposes, investment transactions are recorded on the dates the transactions are executed. Realized gains and losses on investment transactions are determined on the identified cost basis. Dividend income is recorded on theex-dividend date. Dividends from foreign securities where theex-dividend date may have passed are subsequently recorded when the LifePath Index Master Portfolios are informed of theex-dividend date. Under the applicable foreign tax laws, a withholding tax at various rates may be imposed on capital gains, dividends and interest. Upon notification from issuers, a portion of the dividend income received from a real estate investment trust may be redesignated as a reduction of cost of the related investment and/or realized gain. Interest income, including amortization and accretion of premiums and discounts on debt securities, is recognized on an accrual basis.
Each LifePath Index Master Portfolio records daily its proportionate share of the Underlying Master Portfolios’ income, expenses and realized and unrealized gains and losses.
| | |
| 134 | | 2019 BLACKROCK ANNUAL REPORTTO SHAREHOLDERS |
Notes to Financial Statements (continued)
Indemnifications:In the normal course of business, a LifePath Index Master Portfolio enters into contracts that contain a variety of representations that provide general indemnification. A LifePath Index Master Portfolio’s maximum exposure under these arrangements is unknown because it involves future potential claims against a LifePath Index Master Portfolio, which cannot be predicted with any certainty.
Other: Expenses directly related to a LifePath Index Master Portfolio are charged to that LifePath Index Master Portfolio. Other operating expenses shared by several funds, including other funds managed by the Manager, are prorated among those funds on the basis of relative net assets or other appropriate methods.
| 3. | INVESTMENT VALUATION AND FAIR VALUE MEASUREMENTS |
Investment Valuation Policies: The LifePath Index Master Portfolios’ investments are valued at fair value (also referred to as “market value” within the financial statements) as of the close of trading on the New York Stock Exchange (“NYSE”) (generally 4:00 p.m., Eastern time). U.S. GAAP defines fair value as the price the LifePath Index Master Portfolios would receive to sell an asset or pay to transfer a liability in an orderly transaction between market participants at the measurement date. The LifePath Index Master Portfolios determine the fair values of their financial instruments using various independent dealers or pricing services under policies approved by the Board of Trustees of MIP (the “Board”). The BlackRock Global Valuation Methodologies Committee (the “Global Valuation Committee”) is the committee formed by management to develop global pricing policies and procedures and to oversee the pricing function for all financial instruments.
Fair Value Inputs and Methodologies: The following methods and inputs are used to establish the fair value of each LifePath Index Master Portfolio’s assets and liabilities:
| | • | | Exchange-traded funds (“ETFs”) traded on a recognized securities exchange are valued at the official closing price each day, if available. For ETFs traded on more than one exchange, the official closing price on the exchange where the ETF is primarily traded is used. ETFs traded on a recognized exchange for which there were no sales on that day may be valued at the last available bid (long positions) or ask (short positions) price. |
| | • | | Investments inopen-end U.S. mutual funds are valued at net asset value, (“NAV”) each business day. |
| | • | | The LifePath Index Master Portfolios record their proportionate investment in the Underlying Master Portfolios at fair value, which is based upon their pro rata ownership in the net assets of the Underlying Master Portfolios. |
If events (e.g., a company announcement, market volatility or a natural disaster) occur that are expected to materially affect the value of such investments, or in the event that the application of these methods of valuation results in a price for an investment that is deemed not to be representative of the market value of such investment, or if a price is not available, the investment will be valued by the Global Valuation Committee, or its delegate, in accordance with a policy approved by the Board as reflecting fair value (“Fair Valued Investments”). The fair valuation approaches that may be used by the Global Valuation Committee will include market approach, income approach and cost approach. Valuation techniques such as discounted cash flow, use of market comparables and matrix pricing are types of valuation approaches and are typically used in determining fair value. When determining the price for Fair Valued Investments, the Global Valuation Committee, or its delegate, seeks to determine the price that each LifePath Index Master Portfolio might reasonably expect to receive or pay from the current sale or purchase of that asset or liability in anarm’s-length transaction. Fair value determinations shall be based upon all available factors that the Global Valuation Committee, or its delegate, deems relevant and consistent with the principles of fair value measurement. The pricing of all Fair Valued Investments is subsequently reported to the Board or a committee thereof on a quarterly basis.
Fair Value Hierarchy: Various inputs are used in determining the fair value of investments. These inputs to valuation techniques are categorized into a fair value hierarchy consisting of three broad levels for financial statement purposes as follows:
| | • | | Level 1 — Unadjusted price quotations in active markets/exchanges for identical assets or liabilities that each LifePath Index Master Portfolio has the ability to access |
| | • | | Level 2 — Other observable inputs (including, but not limited to, quoted prices for similar assets or liabilities in markets that are active, quoted prices for identical or similar assets or liabilities in markets that are not active, inputs other than quoted prices that are observable for the assets or liabilities (such as interest rates, yield curves, volatilities, prepayment speeds, loss severities, credit risks and default rates) or other market–corroborated inputs) |
| | • | | Level 3 — Unobservable inputs based on the best information available in the circumstances, to the extent observable inputs are not available (including the Global Valuation Committee’s assumptions used in determining the fair value of investments) |
The hierarchy gives the highest priority to unadjusted quoted prices in active markets for identical assets or liabilities (Level 1 measurements) and the lowest priority to unobservable inputs (Level 3 measurements). Accordingly, the degree of judgment exercised in determining fair value is greatest for instruments categorized in Level 3. The inputs used to measure fair value may fall into different levels of the fair value hierarchy. In such cases, for disclosure purposes, the fair value hierarchy classification is determined based on the lowest level input that is significant to the fair value measurement in its entirety. Investments classified within Level 3 have significant unobservable inputs used by the Global Valuation Committee in determining the price for Fair Valued Investments. Level 3 investments include equity or debt issued by privately held companies or funds. There may not be a secondary market, and/or there are a limited number of investors. The categorization of a value determined for investments is based on the pricing transparency of the investments and is not necessarily an indication of the risks associated with investing in those securities.
As of December 31, 2019, certain investments of the LifePath Index Master Portfolios were valued using NAV as no quoted market value is available and therefore have been excluded from the fair value hierarchy.
| 4. | SECURITIES AND OTHER INVESTMENTS |
Securities Lending:Certain LifePath Index Master Portfolios may lend their securities to approved borrowers, such as brokers, dealers and other financial institutions. The borrower pledges and maintains with the LifePath Index Master Portfolios collateral consisting of cash, an irrevocable letter of credit issued by a bank, or securities
| | | | |
| NOTESTO FINANCIAL STATEMENTS | | | 135 | |
Notes to Financial Statements (continued)
issued or guaranteed by the U.S. Government. The initial collateral received by each LifePath Index Master Portfolio is required to have a value of at least 102% of the current value of the loaned securities for securities traded on U.S. exchanges and a value of at least 105% for all other securities. The collateral is maintained thereafter at a value equal to at least 100% of the current market value of the securities on loan. The market value of the loaned securities is determined at the close of each business day of the LifePath Index Master Portfolio and any additional required collateral is delivered to the LifePath Index Master Portfolio, or excess collateral returned by the LifePath Index Master Portfolio, on the next business day. During the term of the loan, the LifePath Index Master Portfolios are entitled to all distributions made on or in respect of the loaned securities, but do not receive interest income on securities received as collateral. Loans of securities are terminable at any time and the borrower, after notice, is required to return borrowed securities within the standard time period for settlement of securities transactions.
The market value of any securities on loan, all of which were classified as investment companies in the LifePath Index Master Portfolios’ Schedules of Investments, and the value of any related collateral are shown separately in the Statements of Assets and Liabilities as a component of investments at value-unaffiliated, and collateral on securities loaned at value, respectively. As of period end, any securities on loan were collateralized by cash and/or U.S. Government obligations. Cash collateral invested by the securities lending agent, BlackRock Institutional Trust Company, N.A. (“BTC”), if any, is disclosed in the Schedules of Investments.
Securities lending transactions are entered into by the LifePath Index Master Portfolios under Master Securities Lending Agreements (each, an “MSLA”), which provide the right, in the event of default (including bankruptcy or insolvency), for thenon-defaulting party to liquidate the collateral and calculate a net exposure to the defaulting party or request additional collateral. In the event that a borrower defaults, the LifePath Index Master Portfolios, as lender, would offset the market value of the collateral received against the market value of the securities loaned. When the value of the collateral is greater than that of the market value of the securities loaned, the lender is left with a net amount payable to the defaulting party. However, bankruptcy or insolvency laws of a particular jurisdiction may impose restrictions on or prohibitions against such a right of offset in the event of an MSLA counterparty’s bankruptcy or insolvency. Under the MSLA, absent an event of default, the borrower can resell orre-pledge the loaned securities, and a LifePath Index Master Portfolio can reinvest cash collateral received in connection with loaned securities. Upon an event of default, the parties’ obligations to return the securities or collateral to the other party are extinguished, and the parties can resell orre-pledge the loaned securities or the collateral received in connection with the loaned securities in order to satisfy the defaulting party’s net payment obligation for all transactions under the MSLA. The defaulting party remains liable for any deficiency.
As of period end, the following table is a summary of the LifePath Index Master Portfolios’ securities lending agreements by counterparty which are subject to offset under an MSLA:
| | | | | | | | | | | | |
| Counterparty | | Securities
Loaned at Value | | | Cash Collateral
Received (a) | | | Net
Amount | |
LifePath Index 2025 Master Portfolio | | | | | | | | | | | | |
RBC Capital Markets LLC | | $ | 15,840,210 | | | $ | (15,840,210 | ) | | $ | — | |
Virtu Americas, LLC | | | 167,130 | | | | (167,130 | ) | | | — | |
| | | | | | | | | | | | |
| | $ | 16,007,340 | | | $ | (16,007,340 | ) | | | — | |
| | | | | | | | | | | | |
LifePath Index 2030 Master Portfolio | | | | | | | | | | | | |
Bank of America Securities N.A. | | $ | 43,429,040 | | | $ | (43,429,040 | ) | | $ | — | |
Deutsche Bank Securities INC | | | 117,610 | | | | (117,610 | ) | | | — | |
Wells Fargo Bank, National Association | | | 23,314 | | | | (23,314 | ) | | | — | |
| | | | | | | | | | | | |
| | $ | 43,569,964 | | | $ | (43,569,964 | ) | | | — | |
| | | | | | | | | | | | |
LifePath Index 2035 Master Portfolio | | | | | | | | | | | | |
Credit Suisse Securities (USA) LLC | | $ | 44,816 | | | $ | (44,816 | ) | | $ | — | |
J.P. Morgan Securities LLC | | | 43,330 | | | | (43,330 | ) | | | — | |
RBC Capital Markets LLC | | | 21,120,280 | | | | (21,120,280 | ) | | | — | |
| | | | | | | | | | | | |
| | $ | 21,208,426 | | | $ | (21,208,426 | ) | | $ | — | |
| | | | | | | | | | | | |
LifePath Index 2050 Master Portfolio | | | | | | | | | | | | |
J.P. Morgan Securities LLC | | $ | 43,330 | | | $ | (43,330 | ) | | $ | — | |
| | | | | | | | | | | | |
| | (a) | Collateral received in excess of the market value of securities on loan is not presented in this table. The total cash collateral received by each LifePath Index Master Portfolio is disclosed in the LifePath Index Master Portfolios’ Statements of Assets and Liabilities. | |
The risks of securities lending include the risk that the borrower may not provide additional collateral when required or may not return the securities when due. To mitigate these risks, the LifePath Index Master Portfolios benefit from a borrower default indemnity provided by BlackRock.BlackRock’s indemnity allows for full replacement of the securities loaned to the extent the collateral received does not cover the value on the securities loaned in the event of borrower default. Each LifePath Index Master Portfolio could incur a loss if the value of an investment purchased with cash collateral falls below the market value of loaned securities or if the value of an investment purchased with cash collateral falls below the value of the original cash collateral received. Such losses are borne entirely by the LifePath Index Master Portfolios.
| 5. | INVESTMENT ADVISORY AGREEMENT AND OTHER TRANSACTIONS WITH AFFILIATES |
Investment Advisory:MIP, on behalf of the LifePath Index Master Portfolios, entered into an Investment Advisory Agreement with BFA, the LifePath Index Master Portfolios’ investment adviser and an indirect, wholly-owned subsidiary of BlackRock, to provide investment advisory services. The Manager is responsible for the management of each LifePath Index Master Portfolio’s portfolio and provides the personnel, facilities, equipment and certain other services necessary to the operations of each LifePath Index Master Portfolio.
For such services, each LifePath Index Master Portfolio pays the Manager a monthly fee at an annual rate equal to 0.05% of the average daily value of each LifePath Index Master Portfolio’s net assets.
| | |
| 136 | | 2019 BLACKROCK ANNUAL REPORTTO SHAREHOLDERS |
Notes to Financial Statements (continued)
Administration: MIP, on behalf of the LifePath Index Master Portfolios, entered into an Administration Agreement with BlackRock Advisors, LLC (“BAL”), which has agreed to provide general administrative services (other than investment advice and related portfolio activities).
BAL is not entitled to compensation for providing administrative services to the LifePath Index Master Portfolios, for so long as BAL (or an affiliate) is entitled to compensation for providing administrative services to corresponding feeder funds that invest substantially all of their assets in the LifePath Index Master Portfolios, or BAL (or an affiliate) receives investment advisory fees from the LifePath Index Master Portfolios.
Expense Limitations and Waivers:With respect to each LifePath Index Master Portfolio, the Manager voluntarily agreed to waive its investment advisory fees by the amount of investment advisory fees each LifePath Index Master Portfolio pays to the Manager indirectly through its investment in affiliated money market funds (the “affiliated money market fund waiver”). These amounts are included in fees waived and/or reimbursed by the Manager in the Statements of Operations. However, the Manager does not waive its investment advisory fees by the amount of investment advisory fees paid in connection with each LifePath Index Master Portfolio’s investments in other affiliated investment companies, if any. For the year ended December 31, 2019, the amounts waived were as follows:
| | | | |
| | | Amounts Waived | |
LifePath Index Retirement Master Portfolio | | $ | 4,148 | |
LifePath Index 2025 Master Portfolio | | | 6,794 | |
LifePath Index 2030 Master Portfolio | | | 11,400 | |
LifePath Index 2035 Master Portfolio | | | 6,856 | |
LifePath Index 2040 Master Portfolio | | | 9,407 | |
LifePath Index 2045 Master Portfolio | | | 5,175 | |
LifePath Index 2050 Master Portfolio | | | 5,052 | |
LifePath Index 2055 Master Portfolio | | | 2,878 | |
LifePath Index 2060 Master Portfolio | | | 770 | |
LifePath Index 2065 Master Portfolio | | | 89 | |
Securities Lending: The SEC has issued an exemptive order which permits BTC, an affiliate of the Manager, to serve as securities lending agent for the LifePath Index Master Portfolios, subject to applicable conditions. As securities lending agent, BTC bears all operational costs directly related to securities lending. The LifePath Index Master Portfolios are responsible for fees in connection with the investment of cash collateral received for securities on loan (the “collateral investment fees”). The cash collateral is invested in a money market fund managed by the Manager or its affiliates. However, BTC has agreed to reduce the amount of securities lending income it receives in order to effectively limit the collateral investment fees the LifePath Index Master Portfolios bear to an annual rate of 0.04%. The shares of such money market fund will not be subject to a sales load, distribution fee or service fee. The money market fund in which the cash collateral has been invested may, under certain circumstances, impose a liquidity fee of up to 2% of the value redeemed or temporarily restrict redemptions for up to 10 business days during a 90 day period, in the event that the money market fund’s weekly liquid assets fall below certain thresholds.
Securities lending income is equal to the total of income earned from the reinvestment of cash collateral, net of fees and other payments to and from borrowers of securities, and less the collateral investment fees. Each LifePath Index Master Portfolio retains a portion of securities lending income and remits a remaining portion to BTC as compensation for its services as securities lending agent.
Pursuant to the current securities lending agreement, each LifePath Index Master Portfolio retains 82% of securities lending income (which excludes collateral investment fees), and this amount retained can never be less than 70% of the total of securities lending income plus the collateral investment fees.
In addition, commencing the business day following the date that the aggregate securities lending income earned across the BlackRock Multi-Asset Complex in a calendar year exceeds a specified threshold, each LifePath Index Master Portfolio, pursuant to the securities lending agreement, will retain for the remainder of that calendar year securities lending income in an amount equal to 85% of securities lending income (which excludes collateral investment fees), and this amount retained can never be less than 70% of the total of securities lending income plus the collateral investment fees.
The share of securities lending income earned by each LifePath Index Master Portfolio is shown as securities lending income — affiliated — net in the Statements of Operations. For the year ended December 31, 2019, each LifePath Index Master Portfolio paid BTC the following amounts in total for securities lending agent services:
| | | | |
| | | Amounts | |
LifePath Index Retirement Master Portfolio | | $ | 5,644 | |
LifePath Index 2025 Master Portfolio | | | 10,882 | |
LifePath Index 2030 Master Portfolio | | | 15,150 | |
LifePath Index 2035 Master Portfolio | | | 15,862 | |
LifePath Index 2040 Master Portfolio | | | 15,400 | |
LifePath Index 2045 Master Portfolio | | | 1,967 | |
LifePath Index 2050 Master Portfolio | | | 3,440 | |
LifePath Index 2055 Master Portfolio | | | 1,965 | |
Interfund Lending: In accordance with an exemptive order (the “Order”) from the SEC, each LifePath Index Master Portfolio may participate in a joint lending and borrowing facility for temporary purposes (the “Interfund Lending Program”), subject to compliance with the terms and conditions of the Order, and to the extent permitted by each LifePath Index Master Portfolio’s investment policies and restrictions. Each LifePath Index Master Portfolio is currently permitted to borrow and lend under the Interfund Lending Program.
A lending BlackRock fund may lend in aggregate up to 15% of its net assets, but may not lend more than 5% of its net assets to any one borrowing fund through the Interfund Lending Program. A borrowing BlackRock fund may not borrow through the Interfund Lending Program or from any other source more than 33 1/3% of its total
| | | | |
| NOTESTO FINANCIAL STATEMENTS | | | 137 | |
Notes to Financial Statements (continued)
assets (or any lower threshold provided for by the fund’s investment restrictions). If a borrowing BlackRock fund’s total outstanding borrowings exceed 10% of its total assets, each of its outstanding interfund loans will be subject to collateralization of at least 102% of the outstanding principal value of the loan. All interfund loans are for temporary or emergency purposes and the interest rate to be charged will be the average of the highest current overnight repurchase agreement rate available to a lending fund and the bank loan rate, as calculated according to a formula established by the Board.
During the year ended December 31, 2019, the LifePath Index Master Portfolios did not participate in the Interfund Lending Program.
Trustees and Officers: Certain trustees and/or officers of MIP are directors and/or officers of BlackRock or its affiliates.
Other Transactions: Each LifePath Index Master Portfolio may invest its positive cash balances in certain money market funds managed by the Manager or an affiliate. The income earned on these temporary cash investments is shown as income-affiliated in the Statements of Operations.
The LifePath Index Master Portfolios may purchase securities from, or sell securities to, an affiliated fund provided the affiliation is due solely to having a common investment adviser, common officers, or common trustees. For the year ended December 31, 2019, the purchase and sale transactions and any net realized gains (losses) with affiliated funds in compliance with Rule17a-7 under the 1940 Act were as follows:
| | | | | | | | | | | | |
| | | Purchases | | | Sales | | | Net Realized Gain (Loss) | |
LifePath Index Retirement Master Portfolio | | $ | — | | | $ | 16,401,603 | | | $ | (129,066 | ) |
LifePath Index 2030 Master Portfolio | | | 7,728,515 | | | | — | | | | — | |
LifePath Index 2035 Master Portfolio | | | 6,112,404 | | | | — | | | | — | |
LifePath Index 2040 Master Portfolio | | | 15,017,229 | | | | — | | | | — | |
LifePath Index 2045 Master Portfolio | | | 10,358,790 | | | | — | | | | — | |
LifePath Index 2050 Master Portfolio | | | 7,778,444 | | | | — | | | | — | |
LifePath Index 2055 Master Portfolio | | | 3,998,790 | | | | — | | | | — | |
LifePath Index 2060 Master Portfolio | | | 715,417 | | | | — | | | | — | |
For the year ended December 31, 2019, purchases and sales of investments in the Underlying Funds and Underlying Master Portfolios and excluding short-term securities, were as follows:
| | | | | | | | | | | | | | | | | | | | |
| | | LifePath Index
Retirement Master
Portfolio | | | LifePath Index
2025 Master
Portfolio | | | LifePath Index
2030 Master
Portfolio | | | LifePath Index
2035 Master
Portfolio | | | LifePath Index
2040 Master
Portfolio | |
Purchases | | $ | 987,227,538 | | | $ | 1,342,293,017 | | | $ | 1,790,830,559 | | | $ | 1,282,999,730 | | | $ | 1,453,577,089 | |
Sales | | | 427,396,800 | | | | 425,976,084 | | | | 921,009,971 | | | | 425,294,876 | | | | 745,910,524 | |
| | | | | | | | | | | | | | | | | | | | |
| | | | | | | | | | | | | | | | | | | | |
| | | LifePath Index
2045 Master
Portfolio | | | LifePath Index
2050 Master
Portfolio | | | LifePath Index
2055 Master
Portfolio | | | LifePath Index
2060 Master
Portfolio | | | LifePath Index
2065 Master
Portfolio | |
Purchases | | $ | 957,144,286 | | | $ | 910,753,000 | | | $ | 579,501,465 | | | $ | 227,159,925 | | | $ | 2,014,735 | |
Sales | | | 271,136,228 | | | | 306,698,297 | | | | 139,658,167 | | | | 29,151,811 | | | | 20,821 | |
Each LifePath Index Master Portfolio, except for LifePath Index 2065 Master Portfolio, is classified as a partnership for U.S. federal income tax purposes. As such, each investor in the LifePath Index Master Portfolios is treated as the owner of its proportionate share of net assets, income, expenses and realized and unrealized gains and losses of the LifePath Index Master Portfolios. Therefore, no U.S. federal income tax provision is required. It is intended that the LifePath Index Master Portfolios’ assets will be managed so an investor in each LifePath Index Master Portfolio can satisfy the requirements of Subchapter M of the Internal Revenue Code of 1986, as amended.
The LifePath Index 2065 Master Portfolio is disregarded as an entity separate from its owner for tax purposes. As such, the owner of the LifePath Index 2065 Master Portfolio is treated as the owner of the net assets, income, expenses and realized and unrealized gains and losses of the Master Portfolio. Therefore, no U.S. federal income tax provision is required.
Each LifePath Index Master Portfolio, except for LifePath Index 2065 Master Portfolio, files U.S. federal and various state and local tax returns. No income tax returns are currently under examination. The statute of limitations on each LifePath Index Master Portfolio’s U.S. federal tax returns generally remains open for each of the four years ended December 31, 2019, except for LifePath Index 2060 Master Portfolio, which remains open for the years ended December 31, 2019, December 31, 2018, December 31, 2017 and the period ended December 31, 2016. The statutes of limitations on each LifePath Index Master Portfolio’s, except for LifePath Index 2065 Master Portfolio state and local tax returns may remain open for an additional year depending upon the jurisdiction.
Management has analyzed tax laws and regulations and their application to the LifePath Index Master Portfolios as of December 31, 2019, inclusive of the open tax return years, and does not believe that there are any uncertain tax positions that require recognition of a tax liability in the LifePath Index Master Portfolios’ financial statements.
| | |
| 138 | | 2019 BLACKROCK ANNUAL REPORTTO SHAREHOLDERS |
Notes to Financial Statements (continued)
As of December 31, 2019, gross unrealized appreciation and depreciation for investments based on cost for U.S. federal income tax purposes were as follows:
| | | | | | | | | | | | | | | | | | | | |
| | | LifePath Index
Retirement Master
Portfolio | | | LifePath Index
2025 Master
Portfolio | | | LifePath Index
2030 Master
Portfolio | | | LifePath Index
2035 Master
Portfolio | | | LifePath Index
2040 Master
Portfolio | |
Tax cost | | $ | 7,016,648,260 | | | $ | 3,993,746,241 | | | $ | 6,875,968,756 | | | $ | 3,512,040,959 | | | $ | 5,298,804,791 | |
| | | | | | | | | | | | | | | | | | | | |
Gross unrealized appreciation | | $ | 833,219,768 | | | $ | 571,968,380 | | | $ | 1,175,297,557 | | | $ | 686,971,294 | | | $ | 938,353,532 | |
Gross unrealized depreciation | | | — | | | | (27,066,064 | ) | | | (197,109,109 | ) | | | (95,479,798 | ) | | | (61,696,451 | ) |
| | | | | | | | | | | | | | | | | | | | |
Net unrealized appreciation | | $ | 833,219,768 | | | $ | 544,902,316 | | | $ | 978,188,448 | | | $ | 591,491,496 | | | $ | 876,657,081 | |
| | | | | | | | | | | | | | | | | | | | |
| | | | | | | | | | | | | | | | | | | | |
| | | LifePath Index
2045 Master
Portfolio | | | LifePath Index
2050 Master
Portfolio | | | LifePath Index
2055 Master
Portfolio | | | LifePath Index
2060 Master
Portfolio | | | LifePath Index
2065 Master
Portfolio | |
Tax cost | | $ | 2,518,115,089 | | | $ | 2,656,577,606 | | | $ | 1,295,098,674 | | | $ | 368,568,599 | | | $ | 2,089,255 | |
| | | | | | | | | | | | | | | | | | | | |
Gross unrealized appreciation | | $ | 464,282,763 | | | $ | 463,438,807 | | | $ | 213,066,863 | | | $ | 44,213,330 | | | $ | 74,422 | |
Gross unrealized depreciation | | | (12,687,810 | ) | | | (3,604,512 | ) | | | (1,333,315 | ) | | | (197,929 | ) | | | (3,372 | ) |
| | | | | | | | | | | | | | | | | | | | |
Net unrealized appreciation | | $ | 451,594,953 | | | $ | 459,834,295 | | | $ | 211,733,548 | | | $ | 44,015,401 | | | $ | 71,050 | |
| | | | | | | | | | | | | | | | | | | | |
MIP, on behalf of the LifePath Index Master Portfolios, along with certain other funds managed by the Manager and its affiliates (“Participating Funds”), is a party to a364-day, $2.25 billion credit agreement with a group of lenders. Under this agreement, the LifePath Index Master Portfolios may borrow to fund shareholder redemptions. Excluding commitments designated for certain individual funds, the Participating Funds, including the LifePath Index Master Portfolios, can borrow up to an aggregate commitment amount of $1.75 billion at any time outstanding, subject to asset coverage and other limitations as specified in the agreement. The credit agreement has the following terms: a fee of 0.10% per annum on unused commitment amounts and interest at a rate equal to the higher of(a) one-month LIBOR (but, in any event, not less than 0.00%) on the date the loan is made plus 0.80% per annum or (b) the Fed Funds rate (but, in any event, not less than 0.00%) in effect from time to time plus 0.80% per annum on amounts borrowed. The agreement expires in April 2020 unless extended or renewed. Prior to April 18, 2019, Participating Funds paid an upfront commitment fee of 0.02% on the total commitment amounts, in addition to administration, legal and arrangement fees, which are included in miscellaneous expenses in the Statements of Operations. These fees were allocated among such funds based upon portions of the aggregate commitment available to them and relative net assets of Participating Funds. During the year ended December 31, 2019, the LifePath Index Master Portfolios did not borrow under the credit agreement.
In the normal course of business, certain LifePath Index Master Portfolios invest in securities or other instruments and may enter into certain transactions, and such activities subject each LifePath Index Master Portfolio to various risks, including among others, fluctuations in the market (market risk) or failure of an issuer to meet all of its obligations. The value of securities or other instruments may also be affected by various factors, including, without limitation: (i) the general economy; (ii) the overall market as well as local, regional or global political and/or social instability; (iii) regulation, taxation or international tax treaties between various countries; or (iv) currency, interest rate and price fluctuations. Each LifePath Index Master Portfolio’s prospectus provides details of the risks to which each LifePath Index Master Portfolio is subject.
The LifePath Index Master Portfolios may be exposed to additional risks when reinvesting cash collateral in money market funds that do not seek to maintain a stable NAV per share of $1.00, which may be subject to redemption gates or liquidity fees under certain circumstances.
Counterparty Credit Risk:The LifePath Index Master Portfolios may be exposed to counterparty credit risk, or the risk that an entity may fail to or be unable to perform on its commitments related to unsettled or open transactions. The LifePath Index Master Portfolios manage counterparty credit risk by entering into transactions only with counterparties that the Manager believes have the financial resources to honor their obligations and by monitoring the financial stability of those counterparties. Financial assets, which potentially expose the LifePath Index Master Portfolios to market, issuer and counterparty credit risks, consist principally of financial instruments and receivables due from counterparties. The extent of the LifePath Index Master Portfolios’ exposure to market, issuer and counterparty credit risks with respect to these financial assets is approximately their value recorded in the Statements of Assets and Liabilities, less any collateral held by the LifePath Index Master Portfolios.
Management has evaluated the impact of all subsequent events on the LifePath Index Master Portfolios through the date the financial statements were issued and has determined that there were no subsequent events requiring adjustment or additional disclosure in the financial statements.
| | | | |
| NOTESTO FINANCIAL STATEMENTS | | | 139 | |
| | |
| Report of Independent Registered Public Accounting Firm | | Master Investment Portfolio |
To the Board of Trustees of
Master Investment Portfolio and Investors of each of the ten series listed in the table below
Opinions on the Financial Statements
We have audited the accompanying statements of assets and liabilities, including the schedules of investments, of each of the series listed in the table below (ten of the series constituting Master Investment Portfolio, hereafter collectively referred to as the “Master Portfolios”) as of December 31, 2019, the related statements of operations and of changes in net assets for each of the periods indicated in the table below, including the related notes, and the financial highlights for each of the periods indicated in the table below (collectively referred to as the “financial statements”). In our opinion, the financial statements present fairly, in all material respects, the financial position of each of the Master Portfolios as of December 31, 2019, the results of each of their operations, the changes in each of their net assets, and each of the financial highlights for each of the periods indicated in the table below, in conformity with accounting principles generally accepted in the United States of America.
| | | | | | |
| Master Portfolio | | Statement of operations | | Statement of changes in net assets | | Financial highlights |
LifePath® Index Retirement Master Portfolio LifePath® Index 2025 Master Portfolio LifePath® Index 2030 Master Portfolio LifePath® Index 2035 Master Portfolio LifePath® Index 2040 Master Portfolio LifePath® Index 2045 Master Portfolio LifePath® Index 2050 Master Portfolio LifePath® Index 2055 Master Portfolio LifePath® Index 2060 Master Portfolio | | For the year ended December 31, 2019 | | For the years ended December 31, 2019 and 2018 | | For each of the periods indicated therein |
LifePath® Index 2065 Master Portfolio | | For the period October 30, 2019 (commencement of operations) through December 31, 2019 |
Basis for Opinions
These financial statements are the responsibility of the Master Portfolios’ management. Our responsibility is to express an opinion on the Master Portfolios’ financial statements based on our audits. We are a public accounting firm registered with the Public Company Accounting Oversight Board (United States) (“PCAOB”) and are required to be independent with respect to the Master Portfolios in accordance with the U.S. federal securities laws and the applicable rules and regulations of the Securities and Exchange Commission and the PCAOB.
We conducted our audits of these financial statements in accordance with the standards of the PCAOB. Those standards require that we plan and perform the audit to obtain reasonable assurance about whether the financial statements are free of material misstatement, whether due to error or fraud.
Our audits included performing procedures to assess the risks of material misstatement of the financial statements, whether due to error or fraud, and performing procedures that respond to those risks. Such procedures included examining, on a test basis, evidence regarding the amounts and disclosures in the financial statements. Our audits also included evaluating the accounting principles used and significant estimates made by management, as well as evaluating the overall presentation of the financial statements. Our procedures included confirmation of securities owned as of December 31, 2019 by correspondence with the custodian, administrator of the Master Portfolios, transfer agents and brokers; when replies were not received from brokers, we performed other auditing procedures. We believe that our audits provide a reasonable basis for our opinions.
/s/PricewaterhouseCoopers LLP
Philadelphia, Pennsylvania
February 27, 2020
We have served as the auditor of one or more BlackRock investment companies since 2000.
| | |
| 140 | | 2019 BLACKROCK ANNUAL REPORTTO SHAREHOLDERS |
Disclosure of Investment Advisory Agreement
The Board of Trustees of Master Investment Portfolio (the “Master Fund”) met in person on May14-15, 2019 (the “Organizational Meeting) to consider the approval of the proposed investment advisory agreement (the “Agreement”) between the Master Fund, on behalf LifePath Index 2065 Master Portfolio (the “Master Portfolio”), a series of the Master Fund, and BlackRock Fund Advisors (the “Manager” or “BlackRock”), the Master Fund’s investment advisor. BlackRock LifePath Index 2065 Fund (the “Portfolio”), a series of BlackRock Funds III (the “Fund”), is a “feeder” fund that invests all of its investable assets in the Master Portfolio. Accordingly, the Board of Trustees of the Fund also considered the approval of the proposed Agreement with respect to the Master Portfolio. The Agreement was the same agreement that had been previously approved by the Board of Trustees of the Master Fund with respect to certain other master portfolios of the Master Fund. For simplicity: (a) the Board of Trustees of the Master Fund and the Board of Trustees of the Fund are referred to herein collectively as the “Board,” and the members are referred to as “Board Members;” and (b) the shareholders of the Portfolio and the interest holders of the Master Portfolio are referred to as “shareholders.” The Master Portfolio and the Portfolio each commenced operations in October, 2019.
Activities and Composition of the Board
On the date of the Organizational Meeting, the Board consisted of fifteen individuals, thirteen of whom were not “interested persons” of the Master Fund or the Fund as defined in the Investment Company Act of 1940, as amended (the “1940 Act”) (the “Independent Board Members”). The Board Members are responsible for the oversight of the operations of the Master Fund or Fund, as pertinent, and perform the various duties imposed on the directors of investment companies by the 1940 Act. The Independent Board Members have retained independent legal counsel to assist them in connection with their duties. The Chair of the Board is an Independent Board Member. The Board has established five standing committees: an Audit Committee, a Governance and Nominating Committee, a Compliance Committee, a Performance Oversight Committee and an Ad Hoc Topics Committee, each of which is chaired by an Independent Board Member and composed of Independent Board Members (except for the Ad Hoc Topics Committee, which also has one interested Board Member).
The Agreement
Consistent with the requirements of the 1940 Act, the Board of the Master Fund is required to consider the initial approval of the Agreement. In connection with this deliberative process, the Board assessed, among other things, the nature, extent and quality of the services to be provided to the Master Portfolio and the Portfolio by BlackRock, BlackRock’s personnel and affiliates, including (as applicable): investment management; accounting, administrative and shareholder services; oversight of the Master Portfolio and Portfolio service providers; risk management and oversight; legal and compliance services; and ability to meet applicable legal and regulatory requirements.
Board Considerations in Approving the Agreement
The Approval Process: At the Organizational Meeting, the Board reviewed materials relating to its consideration of the proposed Agreement. The Board considered all factors it believed relevant with respect to the Master Portfolio and the Portfolio, including, among other things: (a) the nature, extent and quality of the services to be provided by BlackRock; (b) the investment performance of BlackRock portfolio management; (c) the advisory fee and the estimated cost of the services and estimated profits to be realized by BlackRock and its affiliates from their relationship with the Master Portfolio and the Portfolio; (d) the sharing of potential economies of scale;(e) fall-out benefits to BlackRock and its affiliates as a result of BlackRock’s relationship with the Master Portfolio and the Portfolio; (f) possible alternatives to the proposed Agreement; (g) the policies and practices of BlackRock with respect to portfolio transactions for the Master Portfolio; (h) BlackRock’s portfolio compliance systems and capabilities; and (i) other factors deemed relevant by the Board Members.
In considering approval of the Agreement, the Board met with the relevant investment advisory personnel from BlackRock and considered all information it deemed reasonably necessary to evaluate the terms of the Agreement. The Board received materials in advance of the Organizational Meeting relating to its consideration of the Agreement, including (a) information independently compiled and prepared by Broadridge Financial Solutions, Inc. (“Broadridge”) regarding the Portfolio’s fees and estimated expense ratio as compared with a peer group of funds as determined by Broadridge (“Expense Peers”); (b) information regarding BlackRock’s economic outlook for the Master Portfolio and the Portfolio and its general investment outlook for the markets; (c) information regarding fees paid to service providers that are affiliates of BlackRock; and (d) information outlining the legal duties of the Board under the 1940 Act with respect to the consideration and approval of the Agreement. The Board also noted information received at prior Board meetings concerning compliance records and regulatory matters relating to BlackRock.
The Board also considered other matters it deemed important to the approval process, such as other payments made to BlackRock or its affiliates relating to securities lending and cash management and BlackRock’s services related to the valuation and pricing of the portfolio holdings of the Master Portfolio. The Board noted the willingness of BlackRock personnel to engage in open, candid discussions with the Board. The Board did not identify any particular information as determinative, and each Board Member may have attributed different weights to the various items considered.
A. Nature, Extent and Quality of the Services Provided by BlackRock: The Board, including the Independent Board Members, reviewed the nature, extent and quality of services to be provided by BlackRock, including the investment advisory services to be provided to the Master Portfolio. The Board received information concerning the investment philosophy and investment process to be used by BlackRock in managing the Master Portfolio, as well as a description of the capabilities, personnel and services of BlackRock. The Board considered the scope of the services provided by BlackRock to the Master Portfolio and the Portfolio under the Agreement relative to services typically provided by third parties to other funds. The Board noted that the standard of care applicable under the Agreement was comparable to that found generally in investment company advisory agreements. The Board concluded that the scope of BlackRock’s services to be provided to the Master Portfolio and the Portfolio was consistent with the Master Portfolio’s and the Portfolio’s operational requirements, including, in addition to seeking to meet the Master Portfolio’s investment objective(s), compliance with investment restrictions, tax and reporting requirements and related shareholder services.
The Board, including the Independent Board Members, also considered the quality of the administrative and othernon-investment advisory services to be provided by BlackRock and its affiliates to the Master Portfolio and the Portfolio. The Board evaluated the procedures of BlackRock designed to fulfill its fiduciary duty to the Master Portfolio and the Portfolio with respect to possible conflicts of interest, including BlackRock’s code of ethics (regulating the personal trading of BlackRock’s officers and
| | | | |
| DISCLOSUREOF INVESTMENT ADVISORY AGREEMENT | | | 141 | |
Disclosure of Investment Advisory Agreement (continued)
employees), the procedures by which BlackRock allocates trades among its various investment advisory clients, the integrity of the systems in place to ensure compliance with the foregoing and the record of BlackRock in these matters. The Board also noted information received at prior Board meetings concerning standards of BlackRock with respect to the execution of portfolio transactions.
The Board considered, among other factors, with respect to BlackRock: the number, education and experience of investment personnel generally and the Master Portfolio’s portfolio management team; BlackRock’s research capabilities; investments by portfolio managers in the funds they manage; portfolio trading capabilities; use of technology; commitment to compliance; credit analysis capabilities; risk analysis and oversight capabilities; and the approach to training and retaining portfolio managers and other research, advisory and management personnel. The Board also considered BlackRock’s overall risk management program, including the continued efforts of BlackRock and its affiliates to address cybersecurity risks and the role of BlackRock’s Risk & Quantitative Analysis Group. The Board engaged in a review of BlackRock’s compensation structure with respect to the Master Portfolio’s portfolio management team and BlackRock’s ability to attract and retain high-quality talent and create performance incentives. The Board also considered the business reputation of BlackRock and its financial resources and concluded that BlackRock would be able to meet any reasonably foreseeable obligation under the Agreement.
In addition to investment advisory services, the Board considered the nature and quality of the administrative and othernon-investment advisory services to be provided to the Master Portfolio and the Portfolio. The Board considered that BlackRock and its affiliates will provide the Master Portfolio and the Portfolio with certain administrative, shareholder and other services (in addition to any such services provided to the Master Portfolio and the Portfolio by third parties) and officers and other personnel as are necessary for the operations of the Master Portfolio and the Portfolio. In particular, BlackRock and its affiliates will provide the Master Portfolio and the Portfolio with administrative services, including, among others: (i) responsibility for disclosure documents, such as the prospectus, the summary prospectus (as applicable), the statement of additional information and periodic shareholder reports; (ii) oversight of daily accounting and pricing; (iii) responsibility for periodic filings with regulators; (iv) overseeing and coordinating the activities of other service providers, including, among others, the custodian, fund accountant, transfer agent, and auditor for the Master Portfolio and Portfolio, as applicable; (v) organizing Board meetings and preparing the materials for such Board meetings; (vi) providing legal and compliance support; (vii) furnishing analytical and other support to assist the Board in its consideration of strategic issues such as the merger, consolidation or repurposing of certainopen-end funds; and (viii) performing other administrative functions necessary for the operation of the Master Portfolio and the Portfolio, such as tax reporting, expense management, fulfilling regulatory filing requirements, overseeing the Portfolio’s distribution partners, and shareholder call center and other services. The Board reviewed the structure and duties of BlackRock’s fund administration, shareholder services, and legal & compliance departments and considered BlackRock’s policies and procedures for assuring compliance with applicable laws and regulations.
B. The Investment Performance of the Master Portfolio, the Portfolio and BlackRock: The Board, including the Independent Board Members, previously received and considered information about BlackRock’s investment performance for other funds. The Board, however, did not consider the performance history of the Master Portfolio and the Portfolio because the Master Portfolio and the Portfolio had not yet commenced operations as of the date of the Organizational Meeting.
C. Consideration of the Advisory/Management Fees and the Estimated Cost of the Services to be Provided and Estimated Profits to be Realized by BlackRock and its Affiliates from their Relationship with the Master Portfolio and the Portfolio: In connection with the initial approval of the Agreement, the Board, including the Independent Board Members, reviewed the Master Portfolio’s/Portfolio’s contractual management fee rate compared with those of the Portfolio’s Expense Peers. The contractual management fee rate represents a combination of the advisory fee and any administrative fees, before taking into account any reimbursements or fee waivers. The Board also compared the Portfolio’s estimated total expense ratio, as well as the Master Portfolio’s/Portfolio’s estimated actual management fee rate, to those of the Portfolio’s Expense Peers. The total expense ratio represents a fund’s total net operating expenses, including any12b-1 or non12b-1 service fees. The total expense ratio gives effect to any expense reimbursements or fee waivers that benefit a fund, and the actual management fee rate gives effect to any management fee reimbursements or waivers that benefit a fund. Additionally, the Board noted information received at prior Board meetings concerning the services provided and the fees charged by BlackRock and its affiliates to other types of clients with similar investment mandates, as applicable, including institutional accounts andsub-advised mutual funds (including mutual funds sponsored by third parties).
The Board noted that the varying fee structures for fund of funds can limit the value of management fee comparisons. The Board noted that the Master Portfolio’s/Portfolio’s contractual management fee rate and estimated total expense ratio each ranked in the first quartile, and that the estimated actual management fee rate ranked in the second quartile, relative to the Portfolio’s Expense Peers. The Board also noted that BlackRock and the Board have contractually agreed to a cap on the Portfolio’s total expenses as a percentage of the Portfolio’s average daily net assets on aclass-by-class basis.
Following consideration of this information, the Board, including the independent Board Members, concluded that the fees to be paid pursuant to the Agreement were fair and reasonable in light of the services provided.
As the Master Portfolio and Portfolio had not commenced operations as of the date of the Organizational Meeting, BlackRock was not able to provide the Board with specific information concerning the expected profits to be realized by BlackRock and its affiliates from their relationships with the Master Portfolio and the Portfolio. BlackRock, however, will provide the Board with such information at future meetings.
D. Economies of Scale: The Board, including the Independent Board Members, considered the extent to which economies of scale might be realized as the assets of the Master Portfolio and Portfolio increase, including the existence of fee waivers and/or expense caps, as applicable, noting that any contractual fee waivers and expense caps had been approved by the Board.
E. Other Factors Deemed Relevant by the Board Members: The Board, including a majority of the Independent Board Members, also took into account other ancillary or“fall-out” benefits that BlackRock or its affiliates may derive from BlackRock’s respective relationships with the Master Portfolio and the Portfolio, both tangible and intangible, such as BlackRock’s ability to leverage its investment professionals who manage other portfolios and risk management personnel, an increase in BlackRock’s profile in the investment advisory community, and the engagement of BlackRock’s affiliates as service providers to the Master Portfolio and the Portfolio, including for administrative, distribution, securities lending and cash management services. The Board also considered BlackRock’s overall operations and its efforts to expand the scale of, and improve the quality of, its operations. The Board also noted that, subject to applicable law, BlackRock may use and benefit from third party research obtained by soft dollars generated by certain registered fund transactions to assist in managing all or a number of its other client accounts.
| | |
| 142 | | 2019 BLACKROCK ANNUAL REPORTTO SHAREHOLDERS |
Disclosure of Investment Advisory Agreement (continued)
In connection with its consideration of the Agreement, the Board also considered information regarding BlackRock’s brokerage and soft dollar practices and reports from BlackRock which included information on brokerage commissions and trade execution practices that it had received at prior Board meetings.
The Board noted the competitive nature of theopen-end fund marketplace, and that shareholders are able to redeem their Portfolio shares if they believe that the Portfolio’s and/or the Master Portfolio’s fees and expenses are too high or if they are dissatisfied with the performance of the Portfolio.
Conclusion
All the Board Members of the Master Fund present at the Organizational Meeting, including all the Independent Board Members present, approved the Agreement between the Manager and the Master Fund, with respect to the Master Portfolio, for atwo-year term beginning on the effective date of the Agreement. Based upon its evaluation of all of the aforementioned factors in their totality, as well as other information, the Board of the Master Fund, including a majority of the Independent Board Members, was satisfied that the terms of the Agreement were fair and reasonable and in the best interest of the Master Portfolio and its interest holders. The Board of the Fund, including the Independent Board Members, also considered the approval of the Agreement with respect to the Master Portfolio and found the Agreement to be satisfactory. In arriving at its decision to approve the Agreement, the Board of the Master Fund did not identify any single factor or group of factors asall-important or controlling, but considered all factors together, and different Board Members may have attributed different weights to the various factors considered. The Independent Board Members were also assisted by the advice of independent legal counsel in making this determination.
| | | | |
| DISCLOSUREOF INVESTMENT ADVISORY AGREEMENT | | | 143 | |
Statement Regarding Liquidity Risk Management Program
The Securities and Exchange Commission adopted Rule 22e-4 under the Investment Company Act of 1940, as amended (the “Liquidity Rule”) to promote effective liquidity risk management throughout the open-end investment company industry, thereby reducing the risk that funds will be unable to meet their redemption obligations and mitigating dilution of the interests of fund shareholders.
The Board of Trustees (the “Board”) of BlackRock Funds III, on behalf of BlackRock LifePath® Index Retirement Fund, BlackRock LifePath® Index 2025 Fund, BlackRock LifePath® Index 2030 Fund, BlackRock LifePath® Index 2035 Fund, BlackRock LifePath® Index 2040 Fund, BlackRock LifePath® Index 2045 Fund, BlackRock LifePath® Index 2050 Fund, BlackRock LifePath® Index 2055 Fund, BlackRock LifePath® Index 2060 Fund and BlackRock LifePath® Index 2065 Fund, and MIP, on behalf of LifePath® Index Retirement Master Portfolio, LifePath® Index 2025 Master Portfolio, LifePath® Index 2030 Master Portfolio, LifePath® Index 2035 Master Portfolio, LifePath® Index 2040 Master Portfolio, LifePath® Index 2045 Master Portfolio, LifePath® Index 2050 Master Portfolio, LifePath® Index 2055 Master Portfolio, LifePath® Index 2060 Master Portfolio and LifePath® Index 2065 Master Portfolio, met on November 12-13, 2019 (the “Meeting”) to review the liquidity risk management program (the “Program”) applicable to the BlackRock open-end funds, excluding money market funds (each, a “Fund”), pursuant to the Liquidity Rule. The Board has appointed BlackRock Advisors, LLC or BlackRock Fund Advisors (“BlackRock”), each an investment adviser to certain Funds, as the program administrator for each Fund’s Program, as applicable. BlackRock has delegated oversight of the Program to the 40 Act Liquidity Risk Management Committee (the “Committee”). At the Meeting, the Committee, on behalf of BlackRock, provided the Board with a report that addressed the operation of the Program and assessed its adequacy and effectiveness of implementation, including the operation of each Fund’s Highly Liquid Investment Minimum (“HLIM”) where applicable, and any material changes to the Program (the “Report”). The Report covered the period from December 1, 2018 through September 30, 2019 (the “Program Reporting Period”).
The Report described the Program’s liquidity classification methodology for categorizing a Fund’s investments (including derivative transactions) into one of four liquidity buckets. It also described BlackRock’s methodology in establishing a Fund’s HLIM and noted that the Committee reviews and ratifies the HLIM assigned to each Fund no less frequently than annually.
The Report noted that the Program complied with the key factors for consideration under the Liquidity Rule for assessing, managing and periodically reviewing a Fund’s liquidity risk, as follows:
A. The Fund’s investment strategy and liquidity of portfolio investments during both normal and reasonably foreseeable stressed conditions: During the Program Reporting Period, the Committee reviewed whether each Fund’s strategy is appropriate for an open-end fund structure with a focus on Funds with more significant and consistent holdings of less liquid and illiquid assets. The Committee also factored a Fund’s concentration in an issuer into the liquidity classification methodology by taking issuer position sizes into account. Where a Fund participated in borrowings for investment purposes (such as tender option bonds and reverse repurchase agreements), such borrowings were factored into the Program’s calculation of a Fund’s liquidity bucketing. Derivative exposure was also considered in such calculation.
B. Short-term and long-term cash flow projections during both normal and reasonably foreseeable stressed conditions: During the Program Reporting Period, the Committee reviewed historical net redemption activity and used this information as a component to establish each Fund’s reasonably anticipated trading size (“RATS”). Each Fund has adopted an in-kind redemption policy which may be utilized to meet larger redemption requests. The Committee may also take into consideration a Fund’s shareholder ownership concentration (which, depending on product type and distribution channel, may or may not be available), a Fund’s distribution channels, and the degree of certainty associated with a Fund’s short-term and long-term cash flow projections.
C. Holdings of cash and cash equivalents, as well as borrowing arrangements: The Committee considered the terms of the credit facility applicable to the Funds, the financial health of the institution providing the facility and the fact that the credit facility is shared among multiple Funds (including that a portion of the aggregate commitment amount is specifically designated for BlackRock Floating Rate Income Portfolio and BlackRock Credit Strategies Income Fund, each a series of BlackRock Funds V). The Committee also considered other types of borrowing available to the Funds, such as the ability to use reverse repurchase agreements and interfund lending, as applicable.
There were no material changes to the Program during the Program Reporting Period. The Report provided to the Board stated that the Committee concluded that based on the operation of the functions, as described in the Report, the Program is operating as intended and is effective in implementing the requirements of the Liquidity Rule.
| | |
| 144 | | 2019 BLACKROCK ANNUAL REPORTTO SHAREHOLDERS |
Trustee and Officer Information
| | | | | | | | |
| Independent Trustees (a) |
| | | | | |
Name
Year of Birth (b) | | Position(s) Held
(Length of Service) (c) | | Principal Occupation(s) During Past Five Years | | Number of BlackRock-Advised
Registered Investment Companies
(“RICs”) Consisting of
Investment Portfolios
(“Portfolios”) Overseen | | Public Company and
Other Investment Company
Directorships Held During
Past Five Years |
Mark Stalnecker 1951 | | Chair of the Board (Since 2019) and Trustee
(Since 2015) | | Chief Investment Officer, University of Delaware from 1999 to 2013; Trustee and Chair of the Finance and Investment Committees, Winterthur Museum and Country Estate from 2005 to 2016; Member of the Investment Committee, Delaware Public Employees’ Retirement System since 2002; Member of the Investment Committee, Christiana Care Health System from 2009 to 2017; Member of the Investment Committee, Delaware Community Foundation from 2013 to 2014; Director and Chair of the Audit Committee, SEI Private Trust Co. from 2001 to 2014. | | 37 RICs consisting of 177 Portfolios | | None |
Bruce R. Bond 1946 | | Trustee
(Since 2019) | | Board Member, Amsphere Limited (software) since 2018; Trustee and Member of the Governance Committee, State Street Research Mutual Funds from 1997 to 2005; Board Member of Governance, Audit and Finance Committee, Avaya Inc. (computer equipment) from 2003 to 2007. | | 37 RICs consisting of 177 Portfolios | | None |
Susan J. Carter 1956 | | Trustee
(Since 2016) | | Director, Pacific Pension Institute from 2014 to 2018; Advisory Board Member, Center for Private Equity and Entrepreneurship at Tuck School of Business since 1997; Senior Advisor, Commonfund Capital, Inc. (“CCI”) (investment adviser) in 2015; Chief Executive Officer, CCI from 2013 to 2014; President & Chief Executive Officer, CCI from 1997 to 2013; Advisory Board Member, Girls Who Invest from 2015 to 2018 and Board Member thereof since 2018; Advisory Board Member, Bridges Fund Management since 2016; Trustee, Financial Accounting Foundation since 2017; Practitioner Advisory Board Member, Private Capital Research Institute (“PCRI”) since 2017. | | 37 RICs consisting of 177 Portfolios | | None |
Collette Chilton 1958 | | Trustee
(Since 2015) | | Chief Investment Officer, Williams College since 2006; Chief Investment Officer, Lucent Asset Management Corporation from 1998 to 2006. | | 37 RICs consisting of 177 Portfolios | | None |
Neil A. Cotty 1954 | | Trustee
(Since 2016) | | Bank of America Corporation from 1996 to 2015, serving in various senior finance leadership roles, including Chief Accounting Officer from 2009 to 2015, Chief Financial Officer of Global Banking, Markets and Wealth Management from 2008 to 2009, Chief Accounting Officer from 2004 to 2008, Chief Financial Officer of Consumer Bank from 2003 to 2004, Chief Financial Officer of Global Corporate Investment Bank from 1999 to 2002. | | 37 RICs consisting of 177 Portfolios | | None |
Lena G. Goldberg 1949 | | Trustee
(Since 2019) | | Senior Lecturer, Harvard Business School, since 2008; Director, Charles Stark Draper Laboratory, Inc. since 2013; FMR LLC/Fidelity Investments (financial services) from 1996 to 2008, serving in various senior roles including Executive Vice President — Strategic Corporate Initiatives and Executive Vice President and General Counsel; Partner, Sullivan & Worcester LLP from 1985 to 1996 and Associate thereof from 1979 to 1985. | | 37 RICs consisting of 177 Portfolios | | None |
| | | | |
| TRUSTEEAND OFFICER INFORMATION | | | 145 | |
Trustee and Officer Information (continued)
| | | | | | | | |
| Independent Trustees (a)(continued) |
| | | | | |
Name
Year of Birth (b) | | Position(s) Held
(Length of Service) (c) | | Principal Occupation(s) During Past Five Years | | Number of BlackRock-Advised
Registered Investment Companies
(“RICs”) Consisting of
Investment Portfolios
(“Portfolios”) Overseen | | Public Company and
Other Investment Company
Directorships Held During
Past Five Years |
Robert M. Hernandez 1944 | | Trustee
(Since 2019) | | Director, Vice Chairman and Chief Financial Officer of USX Corporation (energy and steel business) from 1991 to 2001; Director andnon-executive Chairman, RTI International Metals, Inc. from 1990 to 2015; Director, TE Connectivity (electronics) from 2006 to 2012. | | 37 RICs consisting of 177 Portfolios | | Chubb Limited (insurance company); Eastman Chemical Company
|
Henry R. Keizer 1956 | | Trustee
(Since 2019) | | Director, Park Indemnity Ltd. (captive insurer) since 2010; Director, MUFG Americas Holdings Corporation and MUFG Union Bank, N.A. (financial and bank holding company) from 2014 to 2016; Director, American Institute of Certified Public Accountants from 2009 to 2011; Director, KPMG LLP (audit, tax and advisory services) from 2004 to 2005 and 2010 to 2012; Director, KPMG International in 2012, Deputy Chairman and Chief Operating Officer thereof from 2010 to 2012 and U.S. Vice Chairman of Audit thereof from 2005 to 2010; Global Head of Audit, KPMGI (consortium of KPMG firms) from 2006 to 2010; Director, YMCA of Greater New York from 2006 to 2010. | | 37 RICs consisting of 177 Portfolios | | Hertz Global Holdings (car rental); Montpelier Re Holdings, Ltd. (publicly held property and casualty reinsurance) from 2013 until 2015; Sealed Air Corp. (packaging); WABCO (commercial vehicle safety systems) |
Cynthia A. Montgomery 1952 | | Trustee
(Since 2009) | | Professor, Harvard Business School since 1989. | | 37 RICs consisting of 177 Portfolios | | Newell Rubbermaid, Inc. (manufacturing) |
Donald C. Opatrny 1952 | | Trustee
(Since 2019) | | Trustee, Vice Chair, Member of the Executive Committee and Chair of the Investment Committee, Cornell University since 2004; President, Trustee and Member of the Investment Committee, The Aldrich Contemporary Art Museum from 2007 to 2014; Member of the Board and Investment Committee, University School from 2007 to 2018; Member of the Investment Committee, Mellon Foundation from 2009 to 2015; Trustee, Artstor (a Mellon Foundation affiliate) from 2010 to 2015; President and Trustee, the Center for the Arts, Jackson Hole from 2011 to 2018; Director, Athena Capital Advisors LLC (investment management firm) since 2013; Trustee and Chair of the Investment Committee, Community Foundation of Jackson Hole since 2014; Member of Affordable Housing Supply Board of Jackson, Wyoming since 2018; Member, Investment Funds Committee, State of Wyoming since 2017; Trustee, Phoenix Art Museum since 2018. | | 37 RICs consisting of 177 Portfolios | | None |
Joseph P. Platt 1947 | | Trustee
(Since 2009) | | General Partner, Thorn Partners, LP (private investments) since 1998; Director, WQED Multi-Media (public broadcastingnot-for-profit) since 2001; Chair, Basic Health International(non-profit) since 2015. | | 37 RICs consisting of 177 Portfolios | | Greenlight Capital Re, Ltd. (reinsurance company); Consol Energy Inc. |
| | |
| 146 | | 2019 BLACKROCK ANNUAL REPORTTO SHAREHOLDERS |
Trustee and Officer Information (continued)
| | | | | | | | |
| Independent Trustees (a)(continued) |
| | | | | |
Name
Year of Birth (b) | | Position(s) Held
(Length of Service) (c) | | Principal Occupation(s) During Past Five Years | | Number of BlackRock-Advised
Registered Investment Companies
(“RICs”) Consisting of
Investment Portfolios
(“Portfolios”) Overseen | | Public Company and
Other Investment Company
Directorships Held During
Past Five Years |
Kenneth L. Urish 1951 | | Trustee
(Since 2009) | | Managing Partner, Urish Popeck & Co., LLC (certified public accountants and consultants) since 1976; Past-Chairman of the Professional Ethics Committee of the Pennsylvania Institute of Certified Public Accountants and Committee Member thereof since 2007; Member of External Advisory Board, The Pennsylvania State University Accounting Department since founding in 2001; Principal, UP Strategic Wealth Investment Advisors, LLC since 2013; Trustee, The Holy Family Institute from 2001 to 2010; President and Trustee, Pittsburgh Catholic Publishing Associates from 2003 to 2008; Director,Inter-Tel from 2006 to 2007. | | 37 RICs consisting of 177 Portfolios | | None |
Claire A. Walton 1957 | | Trustee
(Since 2016) | | Chief Operating Officer and Chief Financial Officer of Liberty Square Asset Management, LP from 1998 to 2015; General Partner of Neon Liberty Capital Management, LLC since 2003; Director, Boston Hedge Fund Group from 2009 to 2018; Director, Woodstock Ski Runners since 2013; Director, Massachusetts Council on Economic Education from 2013 to 2015. | | 37 RICs consisting of 177 Portfolios | | None |
|
| Interested Trustees (a)(d) |
| | | | | |
Name
Year of Birth (b) | | Position(s) Held
(Length of Service) (c) | | Principal Occupation(s) During Past Five Years | | Number of BlackRock-Advised
Registered Investment Companies
(“RICs”) Consisting of
Investment Portfolios
(“Portfolios”) Overseen | | Public Company and
Other Investment Company
Directorships Held During
Past Five Years |
Robert Fairbairn 1965 | | Trustee
(Since 2018) | | Vice Chairman of BlackRock, Inc. since 2019; Member of BlackRock’s Global Executive and Global Operating Committees;Co-Chair of BlackRock’s Human Capital Committee; Senior Managing Director of BlackRock, Inc. from 2010 to 2019; oversaw BlackRock’s Strategic Partner Program and Strategic Product Management Group from 2012 to 2019; Member of the Board of Managers of BlackRock Investments, LLC from 2011 to 2018; Global Head of BlackRock’s Retail and iShares® businesses from 2012 to 2016. | | 123 RICs consisting of 287 Portfolios | | None |
John M. Perlowski (e) 1964 | | Trustee
(Since 2015) President and Chief Executive Officer
(Since 2010) | | Managing Director of BlackRock, Inc. since 2009; Head of BlackRock Global Accounting and Product Services since 2009; Advisory Director of Family Resource Network (charitable foundation) since 2009. | | 124 RICs consisting of 288 Portfolios | | None |
(a) The address of each Trustee is c/o BlackRock, Inc.,55 East 52nd Street, New York, New York 10055. |
(b) Independent Trustees serve until their resignation, retirement, removal or death, or until December 31 of the year in which they turn 75. The Board may determine to extend the terms of Independent Trustees on acase-by-case basis, as appropriate. |
(c) In connection with the acquisition of Barclays Global Investors by BlackRock, Inc. in December 2009, certain Independent Trustees were elected to the Board. Furthermore, effective January 1, 2019, three BlackRock Fund Complexes were realigned and consolidated into two BlackRock Fund Complexes. As a result, although the chart shows the year that each Independent Trustee joined the Board, certain Independent Trustees first became members of the boards of other BlackRock-advised Funds or legacy BlackRock funds as follows: Bruce R. Bond, 2005; Robert M. Hernandez, 1996; Cynthia A. Montgomery, 1994; Joseph P. Platt, 1999; Kenneth L. Urish, 1999; Lena G. Goldberg, 2016; Henry R. Keizer, 2016; Donald C. Opatrny, 2015. |
(d) Mr. Fairbairn and Mr. Perlowski are both “interested persons,” as defined in the 1940 Act, of the Trust/MIP based on their positions with BlackRock, Inc. and its affiliates. Mr. Fairbairn and Mr. Perlowski are also board members of the BlackRock Fixed-Income Complex. |
(e) Mr. Perlowski is also a trustee of the BlackRock Credit Strategies Fund. |
| | | | |
| TRUSTEEAND OFFICER INFORMATION | | | 147 | |
Trustee and Officer Information (continued)
| | | | | | |
| Officers Who Are Not Trustees (a) |
| | | | |
Name
Year of Birth (b) | | Position(s) Held
(Length of Service) | | Principal Occupation(s) During Past Five Years | | |
Thomas Callahan 1968 | | Vice President
(Since 2016) | | Managing Director of BlackRock, Inc. since 2013; Member of the Board of Managers of BlackRock Investments, LLC (principal underwriter) since 2019 and Managing Director thereof since 2017; Head of BlackRock’s Global Cash Management Business since 2016;Co-Head of the Global Cash Management Business from 2014 to 2016; Deputy Head of the Global Cash Management Business from 2013 to 2014; Member of the Cash Management Group Executive Committee since 2013; Chief Executive Officer of NYSE Liffe U.S. from 2008 to 2013. | | |
Jennifer McGovern 1977 | | Vice President
(Since 2014) | | Managing Director of BlackRock, Inc. since 2016; Director of BlackRock, Inc. from 2011 to 2015; Head of Product Development and Oversight for BlackRock’s Strategic Product Management Group since 2019; Head of Product Structure and Oversight for BlackRock’s U.S. Wealth Advisory Group from 2013 to 2019. | | |
Neal J. Andrews 1966 | | Chief Financial Officer
(Since 2009) | | Chief Financial Officer of the iShares® exchange traded funds since 2019; Managing Director of BlackRock, Inc. since 2006. | | |
Jay M. Fife 1970 | | Treasurer
(Since 2009) | | Managing Director of BlackRock, Inc. since 2007. | | |
Charles Park 1967 | | Chief Compliance Officer
(Since 2014) | | Anti-Money Laundering Compliance Officer for certain BlackRock-advised Funds from 2014 to 2015; Chief Compliance Officer of BlackRock Advisors, LLC and the BlackRock-advised Funds in the BlackRock Multi-Asset Complex and the BlackRock Fixed-Income Complex since 2014; Principal of and Chief Compliance Officer for iShares® Delaware Trust Sponsor LLC since 2012 and BlackRock Fund Advisors (“BFA”) since 2006; Chief Compliance Officer for theBFA-advised iShares® exchange traded funds since 2006; Chief Compliance Officer for BlackRock Asset Management International Inc. since 2012. | | |
Lisa Belle 1968 | | Anti-Money Laundering Compliance Officer
(Since 2019) | | Managing Director of BlackRock, Inc. since 2019; Global Financial Crime Head for Asset and Wealth Management of JP Morgan from 2013 to 2019; Managing Director of RBS Securities from 2012 to 2013; Head of Financial Crimes for Barclays Wealth Americas from 2010 to 2012. | | |
Janey Ahn 1975 | | Secretary
(Since 2019) | | Managing Director of BlackRock, Inc. since 2018; Director of BlackRock, Inc. from 2009 to 2017. | | |
(a) The address of each Officer is c/o BlackRock, Inc., 55 East 52nd Street, New York, New York 10055. | | |
(b) Officers of the Trust/MIP serve at the pleasure of the Board. | | |
Further information about the Trust’s/MIP’s Trustees and Officers is available in the Trust’s/MIP’s Statement of Additional Information, which can be obtained without charge by calling(800) 441-7762.
Effective September 19, 2019, Lisa Belle replaced John MacKessy as the Anti-Money Laundering Compliance Officer of the Trust/MIP.
Effective September 19, 2019, Janey Ahn replaced Benjamin Archibald as the Secretary of the Trust/MIP.
Effective December 31, 2019, Robert M. Hernandez retired as Trustee of the Trust/MIP.
Investment Adviser
BlackRock Fund Advisors
San Francisco, CA 94105
Administrator
BlackRock Advisors, LLC
Wilmington, DE 19809
Accounting Agent and Custodian
State Street Bank and Trust Company
Boston, MA 02111
Transfer Agent
BNY Mellon Investment Servicing (US) Inc.
Wilmington, DE 19809
Distributor
BlackRock Investments, LLC
New York, NY 10022
Independent Registered Public Accounting Firm
PricewaterhouseCoopers LLP
Philadelphia, PA 19103
Legal Counsel
Sidley Austin LLP
New York, NY 10019
Address of the Trust/MIP
400 Howard Street
San Francisco, CA 94105
| | |
| 148 | | 2019 BLACKROCK ANNUAL REPORTTO SHAREHOLDERS |
Additional Information
General Information
Householding
The LifePath Index Funds will mail only one copy of shareholder documents, including prospectuses, annual and semi-annual reports and proxy statements, to shareholders with multiple accounts at the same address. This practice is commonly called “householding” and is intended to reduce expenses and eliminate duplicate mailings of shareholder documents. Mailings of your shareholder documents may be householded indefinitely unless you instruct us otherwise. If you do not want the mailing of these documents to be combined with those for other members of your household, please call the LifePath Index Funds at (800) 441-7762.
Availability of Quarterly Schedule of Investments
The LifePath Index Funds/LifePath Index Master Portfolios file their complete schedule of portfolio holdings with the SEC for the first and third quarters of each fiscal year as an exhibit to its reports on Form N-PORT, and for reporting periods ended prior to March 31, 2019, filed such information on Form N-Q. The LifePath Index Funds’/LifePath Index Master Portfolios’ Forms N-PORT and N-Q are available on the SEC’s website at sec.gov. The LifePath Index Funds’/LifePath Index Master Portfolios’ Forms N-PORT may also be obtained upon request and without charge by calling (800) 441-7762.
Availability of Proxy Voting Policies and Procedures
A description of the policies and procedures that the LifePath Index Funds/LifePath Index Master Portfolios use to determine how to vote proxies relating to portfolio securities is available upon request and without charge (1) by calling (800) 441-7762; (2) atblackrock.com; and (3) on the SEC’s website at sec.gov.
Availability of Proxy Voting Record
Information about how the LifePath Index Funds/LifePath Index Master Portfolios voted proxies relating to securities held in the LifePath Index Funds’/LifePath Index Master Portfolios’ portfolios during the most recent 12-month period ended June 30 is available upon request and without charge (1) atblackrock.com; or by calling(800) 441-7762 and (2) on the SEC’s website at sec.gov.
BlackRock’s Mutual Fund Family
BlackRock offers a diverse lineup of open-end mutual funds crossing all investment styles and managed by experts in equity, fixed-income and tax-exempt investing. Visitblackrock.com for more information.
Shareholder Privileges
Account Information
Call us at (800) 441-7762 from 8:00 AM to 6:00 PM ET on any business day to get information about your account balances, recent transactions and share prices. You can also visitblackrock.com for more information.
Automatic Investment Plans
Investor class shareholders who want to invest regularly can arrange to have $50 or more automatically deducted from their checking or savings account and invested in any of the BlackRock funds.
Systematic Withdrawal Plans
Investor class shareholders can establish a systematic withdrawal plan and receive periodic payments of $50 or more from their BlackRock funds, as long as their account balance is at least $10,000.
Retirement Plans
Shareholders may make investments in conjunction with Traditional, Rollover, Roth, Coverdell, Simple IRAs, SEP IRAs and 403(b) Plans.
| | | | |
| ADDITIONAL INFORMATION | | | 149 | |
Additional Information (continued)
BlackRock Privacy Principles
BlackRock is committed to maintaining the privacy of its current and former fund investors and individual clients (collectively, “Clients”) and to safeguarding their non-public personal information. The following information is provided to help you understand what personal information BlackRock collects, how we protect that information and why in certain cases we share such information with select parties.
If you are located in a jurisdiction where specific laws, rules or regulations require BlackRock to provide you with additional or different privacy-related rights beyond what is set forth below, then BlackRock will comply with those specific laws, rules or regulations.
BlackRock obtains or verifies personal non-public information from and about you from different sources, including the following: (i) information we receive from you or, if applicable, your financial intermediary, on applications, forms or other documents; (ii) information about your transactions with us, our affiliates, or others; (iii) information we receive from a consumer reporting agency; and (iv) from visits to our websites.
BlackRock does not sell or disclose to non-affiliated third parties any non-public personal information about its Clients, except as permitted by law or as is necessary to respond to regulatory requests or to service Client accounts. These non-affiliated third parties are required to protect the confidentiality and security of this information and to use it only for its intended purpose.
We may share information with our affiliates to service your account or to provide you with information about other BlackRock products or services that may be of interest to you. In addition, BlackRock restricts access to non-public personal information about its Clients to those BlackRock employees with a legitimate business need for the information. BlackRock maintains physical, electronic and procedural safeguards that are designed to protect the non-public personal information of its Clients, including procedures relating to the proper storage and disposal of such information.
| | |
| 150 | | 2019 BLACKROCK ANNUAL REPORTTO SHAREHOLDERS |
Want to know more?
blackrock.com | 877-275-1255 (1-877-ASK-1BLK)
This report is intended for current holders. It is not authorized for use as an offer of sale or a solicitation of an offer to buy shares of a LifePath Index Fund unless preceded or accompanied by the LifePath Index Fund’s current prospectus. Past performance results shown in this report should not be considered a representation of future performance. Investment returns and principal value of shares will fluctuate so that shares, when redeemed, may be worth more or less than their original cost. Statements and other information herein are as dated and are subject to change.
LPindex-12/19-AR
| Item 2 – | Code of Ethics – Each registrant (or each, a “Fund”) has adopted a code of ethics, as of the end of the period covered by this report, applicable to the registrants’ principal executive officer, principal financial officer, principal accounting officer or controller, or persons performing similar functions. During the period covered by this report, the code of ethics was amended to update certain information and to make othernon-material changes. During the period covered by this report, there have been no waivers granted under the code of ethics. The registrants undertake to provide a copy of the code of ethics to any person upon request, without charge, who calls1-800-441-7762. |
| Item 3 – | Audit Committee Financial Expert – Each registrant’s board of directors (the “board of directors”), has determined that (i) the registrant has the following audit committee financial expert serving on its audit committee and (ii) each audit committee financial expert is independent: |
Neil A. Cotty
Robert M. Hernandez
Henry R. Keizer
Kenneth L. Urish
Claire A. Walton
Under applicable securities laws, a person determined to be an audit committee financial expert will not be deemed an “expert” for any purpose, including without limitation for the purposes of Section 11 of the Securities Act of 1933, as a result of being designated or identified as an audit committee financial expert. The designation or identification of a person as an audit committee financial expert does not impose on such person any duties, obligations, or liabilities greater than the duties, obligations, and liabilities imposed on such person as a member of the audit committee and board of directors in the absence of such designation or identification. The designation or identification of a person as an audit committee financial expert does not affect the duties, obligations, or liability of any other member of the audit committee or board of directors.
| Item 4 – | Principal Accountant Fees and Services |
The following table presents fees billed by PricewaterhouseCoopers LLP (“PwC”) in each of the last two fiscal years for the services rendered to the Funds:
| | | | | | | | | | | | | | | | | | | | | | | | | | | | | | | | |
| | | (a) Audit Fees | | | (b) Audit-Related Fees1 | | | (c) Tax Fees2 | | | (d) All Other Fees | |
Entity Name | | Current
Fiscal Year
End | | | Previous
Fiscal Year
End | | | Current
Fiscal
Year End | | | Previous
Fiscal
Year End | | | Current
Fiscal
Year End | | | Previous
Fiscal
Year End | | | Current
Fiscal
Year End | | | Previous
Fiscal
Year End | |
BlackRock LifePath Index Retirement Fund | | $ | 12,200 | | | $ | 11,000 | | | $ | 0 | | | $ | 400 | | | $ | 8,100 | | | $ | 8,100 | | | $ | 0 | | | $ | 0 | |
BlackRock LifePath Index 2025 Fund | | $ | 12,200 | | | $ | 11,000 | | | $ | 0 | | | $ | 400 | | | $ | 8,100 | | | $ | 8,100 | | | $ | 0 | | | $ | 0 | |
BlackRock LifePath Index 2030 Fund | | $ | 12,200 | | | $ | 11,100 | | | $ | 0 | | | $ | 400 | | | $ | 8,100 | | | $ | 8,100 | | | $ | 0 | | | $ | 0 | |
BlackRock LifePath Index 2035 Fund | | $ | 12,200 | | | $ | 11,100 | | | $ | 0 | | | $ | 400 | | | $ | 8,100 | | | $ | 8,100 | | | $ | 0 | | | $ | 0 | |
BlackRock LifePath Index 2040 Fund | | $ | 12,200 | | | $ | 11,100 | | | $ | 0 | | | $ | 400 | | | $ | 8,100 | | | $ | 8,100 | | | $ | 0 | | | $ | 0 | |
BlackRock LifePath Index 2045 Fund | | $ | 12,200 | | | $ | 11,100 | | | $ | 0 | | | $ | 400 | | | $ | 8,100 | | | $ | 8,100 | | | $ | 0 | | | $ | 0 | |
BlackRock LifePath Index 2050 Fund | | $ | 12,200 | | | $ | 11,100 | | | $ | 0 | | | $ | 400 | | | $ | 8,100 | | | $ | 8,100 | | | $ | 0 | | | $ | 0 | |
BlackRock LifePath Index 2055 Fund | | $ | 12,200 | | | $ | 11,100 | | | $ | 0 | | | $ | 400 | | | $ | 8,100 | | | $ | 8,100 | | | $ | 0 | | | $ | 0 | |
BlackRock LifePath Index 2060 Fund | | $ | 12,200 | | | $ | 11,100 | | | $ | 0 | | | $ | 400 | | | $ | 8,100 | | | $ | 8,100 | | | $ | 0 | | | $ | 0 | |
2
| | | | | | | | | | | | | | | | | | | | | | | | | | | | | | | | |
BlackRock LifePath Index 2065 Fund | | $ | 10,980 | | | | N/A | | | $ | 0 | | | | N/A | | | $ | 12,200 | | | | N/A | | | $ | 0 | | | | N/A | |
LifePath Index Retirement Master Portfolio | | $ | 12,900 | | | $ | 12,900 | | | $ | 0 | | | $ | 0 | | | $ | 13,600 | | | $ | 13,600 | | | $ | 0 | | | $ | 0 | |
LifePath Index 2025 Master Portfolio | | $ | 12,900 | | | $ | 12,900 | | | $ | 0 | | | $ | 0 | | | $ | 13,600 | | | $ | 13,600 | | | $ | 0 | | | $ | 0 | |
LifePath Index 2030 Master Portfolio | | $ | 12,900 | | | $ | 12,900 | | | $ | 0 | | | $ | 0 | | | $ | 13,600 | | | $ | 13,600 | | | $ | 0 | | | $ | 0 | |
LifePath Index 2035 Master Portfolio | | $ | 12,900 | | | $ | 12,900 | | | $ | 0 | | | $ | 0 | | | $ | 13,600 | | | $ | 13,600 | | | $ | 0 | | | $ | 0 | |
LifePath Index 2040 Master Portfolio | | $ | 12,900 | | | $ | 12,900 | | | $ | 0 | | | $ | 0 | | | $ | 13,600 | | | $ | 13,600 | | | $ | 0 | | | $ | 0 | |
LifePath Index 2045 Master Portfolio | | $ | 12,900 | | | $ | 12,900 | | | $ | 0 | | | $ | 0 | | | $ | 13,600 | | | $ | 13,600 | | | $ | 0 | | | $ | 0 | |
LifePath Index 2050 Master Portfolio | | $ | 12,900 | | | $ | 12,900 | | | $ | 0 | | | $ | 0 | | | $ | 13,600 | | | $ | 13,600 | | | $ | 0 | | | $ | 0 | |
LifePath Index 2055 Master Portfolio | | $ | 12,900 | | | $ | 12,900 | | | $ | 0 | | | $ | 0 | | | $ | 13,600 | | | $ | 13,600 | | | $ | 0 | | | $ | 0 | |
LifePath Index 2060 Master Portfolio | | $ | 12,900 | | | $ | 12,900 | | | $ | 0 | | | $ | 0 | | | $ | 13,600 | | | $ | 13,600 | | | $ | 0 | | | $ | 0 | |
LifePath Index 2060 Master Portfolio | | $ | 11,610 | | | | N/A | | | $ | 0 | | | | N/A | | | $ | 0 | | | | N/A | | | $ | 0 | | | | N/A | |
The following table presents fees billed by PwC that were required to be approved by each registrant’s audit committee (each a “Committee”) for services that relate directly to the operations or financial reporting of each Fund and that are rendered on behalf of BlackRock Advisors, LLC (the “investment adviser” or “BlackRock”)and entities controlling, controlled by, or under common control with BlackRock (not including anysub-adviser whose role is primarily portfolio management and is subcontracted with or overseen by another investment adviser) that provide ongoing services to each Fund (“Affiliated Service Providers”):
| | | | | | | | |
| | | Current Fiscal Year End | | | Previous Fiscal Year End | |
(b) Audit-Related Fees1 | | $ | 0 | | | $ | 0 | |
(c) Tax Fees2 | | $ | 0 | | | $ | 0 | |
(d) All Other Fees3 | | $ | 0 | | | $ | 0 | |
| 1 | The nature of the services includes assurance and related services reasonably related to the performance of the audit or review of financial statements not included in Audit Fees, including accounting consultations, agreed-upon procedure reports, attestation reports, comfort letters,out-of-pocket expenses and internal control reviews not required by regulators. |
| 2 | The nature of the services includes tax compliance and/or tax preparation, including services relating to the filing or amendment of federal, state or local income tax returns, regulated investment company qualification reviews, taxable income and tax distribution calculations. |
| 3 | Aggregate fees borne by BlackRock in connection with the review of compliance procedures and attestation thereto performed by PwC with respect to all of the registeredclosed-end funds and some of the registeredopen-end funds advised by BlackRock. |
(e)(1) Audit CommitteePre-Approval Policies and Procedures:
Each Committee has adopted policies and procedures with regard to thepre-approval of services. Audit, audit-related and tax compliance services provided to the registrant on an annual basis require specificpre-approval by the registrant’s Committee. The Committee also must approve othernon-audit services provided to the registrant and thosenon-audit services provided to the Investment Adviser and Affiliated Service Providers that relate directly to the operations and the financial reporting of the registrant. Certain of thesenon-audit services that the Committee believes are (a) consistent with the SEC’s auditor independence rules and (b) routine and recurring services that will not impair the independence of the independent accountants may be approved by the Committee without consideration on a specificcase-by-case basis (“generalpre-approval”). The term of any generalpre-approval is 12 months from the date of thepre-approval, unless the Committee provides for a different period. Tax or othernon-audit services provided to the registrant which have a direct impact on the operations or financial reporting of the registrant will only be deemedpre-approved provided that any individual project does not exceed $10,000 attributable to the registrant or $50,000 per project. For this purpose, multiple projects will be aggregated to determine if they exceed the previously mentioned cost levels.
Any proposed services exceeding thepre-approved cost levels will require specificpre-approval by the registrant’s Committee, as will any other services not subject to generalpre-approval (e.g., unanticipated but
3
permissible services). The Committee is informed of each service approved subject to generalpre-approval at the next regularly scheduledin-person board meeting. At this meeting, an analysis of such services is presented to the Committee for ratification. The Committee may delegate to the Committee Chairman the authority to approve the provision of and fees for any specific engagement of permittednon-audit services, including services exceedingpre-approved cost levels.
(e)(2) None of the services described in each of Items 4(b) through (d) were approved by either Committee pursuant to the de minimus exception in paragraph (c)(7)(i)(C) of Rule2-01 of RegulationS-X.
(f) Not Applicable
(g) The aggregatenon-audit fees, defined as the sum of the fees shown under “Audit-Related Fees,” “Tax Fees” and “All Other Fees,” paid to the accountant for services rendered by the accountant to the registrant, the Investment Adviser and the Affiliated Service Providers were:
| | | | | | | | |
Entity Name | | Current
Fiscal
Year End | | | Previous
Fiscal Year
End | |
LifePath Index Retirement Fund | | $ | 8,100 | | | $ | 8,500 | |
LifePath Index 2025 Fund | | $ | 8,100 | | | $ | 8,500 | |
LifePath Index 2030 Fund | | $ | 8,100 | | | $ | 8,500 | |
LifePath Index 2035 Fund | | $ | 8,100 | | | $ | 8,500 | |
LifePath Index 2040 Fund | | $ | 8,100 | | | $ | 8,500 | |
LifePath Index 2045 Fund | | $ | 8,100 | | | $ | 8,500 | |
LifePath Index 2050 Fund | | $ | 8,100 | | | $ | 8,500 | |
LifePath Index 2055 Fund | | $ | 8,100 | | | $ | 8,500 | |
LlifePath Index 2060 Fund | | $ | 8,100 | | | $ | 8,500 | |
LlifePath Index 2065 Fund | | $ | 12,200 | | | | N/A | |
LifePath Index Retirement Master Portfolio | | $ | 13,600 | | | $ | 13,600 | |
LifePath Index 2025 Master Portfolio | | $ | 13,600 | | | $ | 13,600 | |
LifePath Index 2030 Master Portfolio | | $ | 13,600 | | | $ | 13,600 | |
LifePath Index 2035 Master Portfolio | | $ | 13,600 | | | $ | 13,600 | |
LifePath Index 2040 Master Portfolio | | $ | 13,600 | | | $ | 13,600 | |
LifePath Index 2045 Master Portfolio | | $ | 13,600 | | | $ | 13,600 | |
LifePath Index 2050 Master Portfolio | | $ | 13,600 | | | $ | 13,600 | |
LifePath Index 2055 Master Portfolio | | $ | 13,600 | | | $ | 13,600 | |
LifePath Index 2060 Master Portfolio | | $ | 13,600 | | | $ | 13,600 | |
LifePath Index 2065 Master Portfolio | | $ | 0 | | | | N/A | |
(h) Each Committee has considered and determined that the provision ofnon-audit services that were rendered to the Investment Adviser and the Affiliated Service Providers that were notpre-approved pursuant to paragraph (c)(7)(ii) of Rule2-01 of RegulationS-X is compatible with maintaining the principal accountant’s independence.
| Item 5 – | Audit Committee of Listed Registrants – Not Applicable |
(a) The registrants’ Schedules of Investments are included as part of the Report to Stockholders filed under Item 1 of this Form.
4
(b) Not Applicable due to no such divestments during the semi-annual period covered since the previous FormN-CSR filing.
| Item 7 – | Disclosure of Proxy Voting Policies and Procedures forClosed-End Management Investment Companies – Not Applicable |
| Item 8 – | Portfolio Managers ofClosed-End Management Investment Companies – Not Applicable |
| Item 9 – | Purchases of Equity Securities byClosed-End Management Investment Company and Affiliated Purchasers – Not Applicable |
| Item 10 – | Submission of Matters to a Vote of Security Holders – There have been no material changes to these procedures. |
| Item 11 – | Controls and Procedures |
(a) – The registrants’ principal executive and principal financial officers, or persons performing similar functions, have concluded that the registrants’ disclosure controls and procedures (as defined in Rule30a-3(c) under the Investment Company Act of 1940, as amended (the “1940 Act”)) are effective as of a date within 90 days of the filing of this report based on the evaluation of these controls and procedures required by Rule30a-3(b) under the 1940 Act and Rule 15(d)-15(b) under the Securities Exchange Act of 1934, as amended.
(b) – There were no changes in the registrants’ internal control over financial reporting (as defined in Rule30a-3(d) under the 1940 Act) that occurred during the period covered by this report that have materially affected, or are reasonably likely to materially affect, the registrants’ internal control over financial reporting.
| Item 12 – | Disclosure of Securities Lending Activities forClosed-End Management Investment Companies – Not Applicable to the registrants. |
| Item 13 – | Exhibits attached hereto |
(a)(1) Code of Ethics – See Item 2
(a)(2) Certifications – Attached hereto
(a)(3) Not Applicable
(a)(4) Not Applicable
(b) Certifications – Attached hereto
5
Pursuant to the requirements of the Securities Exchange Act of 1934 and the Investment Company Act of 1940, each registrant has duly caused this report to be signed on its behalf by the undersigned, thereunto duly authorized.
| | |
| BlackRock Funds III and Master Investment Portfolio |
| |
| By: | | /s/ John M. Perlowski |
| | John M. Perlowski |
| | Chief Executive Officer (principal executive officer) of |
| | BlackRock Funds III and Master Investment Portfolio |
Date: February 28, 2020
Pursuant to the requirements of the Securities Exchange Act of 1934 and the Investment Company Act of 1940, this report has been signed below by the following persons on behalf of each registrant and in the capacities and on the dates indicated.
| | |
| By: | | /s/ John M. Perlowski |
| | John M. Perlowski |
| | Chief Executive Officer (principal executive officer) of |
| | BlackRock Funds III and Master Investment Portfolio |
Date: February 28, 2020
| | |
| By: | | /s/ Neal J. Andrews |
| | Neal J. Andrews |
| | Chief Financial Officer (principal financial officer) of |
| | BlackRock Funds III and Master Investment Portfolio |
Date: February 28, 2020
6