UNITED STATES
SECURITIES AND EXCHANGE COMMISSION
Washington, D.C. 20549
FORMN-CSR
CERTIFIED SHAREHOLDER REPORT OF REGISTERED MANAGEMENT INVESTMENT
COMPANIES
Investment Company Act file number:811-07332 and811-08162
Name of Fund: BlackRock Funds III
BlackRock Cash Funds: Institutional
BlackRock Cash Funds: Treasury
BlackRock LifePath® Dynamic Retirement Fund
BlackRock LifePath® Dynamic 2025 Fund
BlackRock LifePath® Dynamic 2030 Fund
BlackRock LifePath® Dynamic 2035 Fund
BlackRock LifePath® Dynamic 2040 Fund
BlackRock LifePath® Dynamic 2045 Fund
BlackRock LifePath® Dynamic 2050 Fund
BlackRock LifePath® Dynamic 2055 Fund
BlackRock LifePath® Dynamic 2060 Fund
BlackRock LifePath® Dynamic 2065 Fund
iShares MSCI Total International Index Fund
iShares Russell 1000Large-Cap Index Fund
iShares S&P 500 Index Fund
iShares U.S. Aggregate Bond Index Fund
Master Investment Portfolio
Active Stock Master Portfolio
International Tilts Master Portfolio
Large Cap Index Master Portfolio
LifePath® Dynamic Retirement Master Portfolio
LifePath® Dynamic 2025 Master Portfolio
LifePath® Dynamic 2030 Master Portfolio
LifePath® Dynamic 2035 Master Portfolio
LifePath® Dynamic 2040 Master Portfolio
LifePath® Dynamic 2045 Master Portfolio
LifePath® Dynamic 2050 Master Portfolio
LifePath® Dynamic 2055 Master Portfolio
LifePath® Dynamic 2060 Master Portfolio
LifePath® Dynamic 2065 Master Portfolio
Money Market Master Portfolio
S&P 500 Index Master Portfolio
Total International ex U.S. Index Master Portfolio
Treasury Money Market Master Portfolio
U.S. Total Bond Index Master Portfolio
Fund Address: 100 Bellevue Parkway, Wilmington, DE 19809
Name and address of agent for service: John M. Perlowski, Chief Executive Officer, BlackRock Funds III and Master Investment Portfolio, 55 East 52nd Street, New York, NY 10055
Registrants’ telephone number, including area code: (800)537-4942
Date of fiscal year end: 12/31/2019
Date of reporting period: 12/31/2019
Item 1 – Report to Stockholders
2
| | |
 | | DECEMBER 31, 2019 |
BlackRock Funds III
| · | | BlackRock Cash Funds: Institutional |
| · | | BlackRock Cash Funds: Treasury |
Beginning on January 1, 2021, as permitted by regulations adopted by the Securities and Exchange Commission, paper copies of each Fund’s shareholder reports will no longer be sent by mail, unless you specifically request paper copies of the reports from BlackRock or from your financial intermediary, such as a broker-dealer or bank. Instead, the reports will be made available on a website, and you will be notified by mail each time a report is posted and provided with a website link to access the report.
You may elect to receive all future reports in paper free of charge. If you hold accounts directly with BlackRock, you can call(888) 204-3956 to inform BlackRock that you wish to continue receiving paper copies of your shareholder reports. If you hold accounts through a financial intermediary, you can follow the instructions included with this disclosure, if applicable, or contact your financial intermediary to request that you continue to receive paper copies of your shareholder reports. Please note that not all financial intermediaries may offer this service. Your election to receive reports in paper will apply to all funds advised by BlackRock Advisors, LLC, BlackRock Fund Advisors or their affiliates, or all funds held with your financial intermediary, as applicable.
If you already elected to receive shareholder reports electronically, you will not be affected by this change and you need not take any action. You may elect to receive electronic delivery of shareholder reports and other communications by: contacting your financial intermediary, if you hold accounts through a financial intermediary. Please note that not all financial intermediaries may offer this service.
|
| Not FDIC Insured • May Lose Value • No Bank Guarantee |
The Markets in Review
Dear Shareholder,
U.S. equities and bonds finished the last year of the decade with impressive returns, putting an exclamation point on a decade of strong performance despite the fears and doubts about the economy that were ultimately laid to rest with unprecedented monetary stimulus and a sluggish yet resolute performance from the U.S. economy. In many ways, it was fitting that the themes of 2019 — geopolitical uncertainty, fears of recession, and decisive monetary stimulus — put the capstone on a decade that was defined by grappling with these competing forces.
Equity and bond markets posted solid returns, particularly in the second half of the year, as investors began to realize that the U.S. economy was maintaining the modest yet steady growth that has characterized this economic cycle. U.S. large cap equities advanced the most, while equities at the high end of the risk spectrum — emerging markets and U.S. small cap — lagged while still posting solid returns.
Fixed-income securities played an important role in diversified portfolios by delivering strong returns amid economic uncertainty, as interest rates declined (and bond prices rose). Long-term bonds, particularly long-term Treasuries, generally posted the strongest returns, as inflation remained low. Investment-grade and high-yield corporate bonds also posted solid returns, as the credit fundamentals in corporate markets remained relatively solid.
As equity performance faltered in late 2018 and global economic growth slowed, the U.S. Federal Reserve (the “Fed”) shifted away from policies designed to decrease inflation in favor of renewed efforts to stimulate economic activity. The Fed left interest rates unchanged in January 2019, then reduced interest rates three times thereafter, starting in July 2019. Similarly, the Fed took measures to support liquidity in short-term lending markets. Following in the Fed’s footsteps, the European Central Bank announced aggressive economic stimulus measures, including lower interest rates and the return of its bond purchasing program. The Bank of Japan signaled a continuation of accommodative monetary policy, while China committed to looser credit conditions and an increase in fiscal spending.
The outpouring of global economic stimulus led to a sharp rally in risk assets throughout the world despite the headwind of rising geopolitical and trade tensions. Hopes continued to remain high as the current economic expansion became the longest in U.S. history.
Looking ahead, we believe U.S. economic growth will stabilize and gradually improve in 2020. The primary drivers of recent market performance — trade and monetary policies — could take a back seat to a nascent expansion in manufacturing and a recent uptick in global growth. The headwinds of policy uncertainty in 2019 could become tailwinds in 2020 due topro-cyclical policy shifts.
Overall, we favor increasing investment risk to benefit from the brighter outlook. In addition to having a positive view for equities overall, we favor emerging market equities over developed market equities. Increasing cyclical exposure through value-style investing and maintaining a meaningful emphasis on high-quality companies through quality factors also makes sense for diversified investors. In fixed income, government bonds continue to be important portfolio stabilizers, while emerging market bonds, particularly local currency bonds, offer relatively attractive income opportunities.
In this environment, investors need to think globally, extend their scope across a broad array of asset classes, and be nimble as market conditions change. We encourage you to talk with your financial advisor and visitblackrock.com for further insight about investing in today’s markets.
Sincerely,

Rob Kapito
President, BlackRock Advisors, LLC

Rob Kapito
President, BlackRock Advisors, LLC
| | | | |
| Total Returns as of December 31, 2019 |
| | | 6-month | | 12-month |
U.S. large cap equities
(S&P 500® Index) | | 10.92% | | 31.49% |
U.S. small cap equities
(Russell 2000® Index) | | 7.30 | | 25.52 |
International equities
(MSCI Europe, Australasia, Far East Index) | | 7.01 | | 22.01 |
Emerging market equities
(MSCI Emerging Markets Index) | | 7.09 | | 18.42 |
3-month Treasury bills
(ICE BofAML3-Month U.S. Treasury Bill Index) | | 1.03 | | 2.28 |
U.S. Treasury securities
(ICE BofAML10-Year U.S. Treasury Index) | | 1.36 | | 8.91 |
U.S. investment grade bonds
(Bloomberg Barclays U.S. Aggregate Bond Index) | | 2.45 | | 8.72 |
Tax-exempt municipal bonds
(S&P Municipal Bond Index) | | 2.21 | | 7.26 |
U.S. high yield bonds
(Bloomberg Barclays U.S. Corporate High Yield 2% Issuer Capped Index) | | 3.98 | | 14.32 |
| Past performance is no guarantee of future results. Index performance is shown for illustrative purposes only. You cannot invest directly in an index. |
| | |
| 2 | | THIS PAGEISNOT PARTOF YOUR FUND REPORT |
Table of Contents

Money Market Overview For the 12-Month Period Ended December 31, 2019
2019 is officially in the books — as the year progressed, investors witnessed a pivot from the Fed hiking rates in 2018 to delivering 0.25% cuts in July, September and October to the Federal Funds target rate, which ended the year in a range of 1.50%-1.75%. Prompting these cuts, in our view, were concerns about slowing global growth amid uncertainties associated with geopolitical events, including U.S.-China trade tensions, and muted inflation. We believe such concerns were also reflected in the slope of the U.S. Treasury yield curve between three months and 10 years, which was periodically inverted during 2019. However, even as the U.S. economy began to exhibit signs of softness, a strong labor market and rising consumer spending helped keep the economic expansion intact, with the support of the Fed’s more accommodative policy. The future path for the Federal Funds rate looks to be stable for the foreseeable future as the Fed has acknowledged, in our opinion, a relatively high bar for further policy action.
Another notable event this year was the bout of temporary excessive volatility in the repurchase agreement (“repo”) market inmid-September, which was due in part to a prior contraction in excess reserves in the banking system and outsized deposit flow activity related to corporate tax payments and the settlement of Treasury obligations. This situation prompted the Fed to inject a substantial amount of liquidity into the financial system during the balance of the year. Specifically, the Fed conducted regular overnight and term repo operations (known as temporary open market operations), and also began purchasing Treasury bills beginning at a rate of $60 billion per month in order to support the flow of funds and help maintain control over short-term interest rates. The dislocations in the repo market highlighted, in our opinion, the need for the Fed to determine the appropriate level of excess reserves in the post financial crisis regulatory environment.
In July, the U.S. debt ceiling was again suspended, and net new Treasury bill issuance exceeded $250 billion in 2019. That said, the expanded footprint by the Fed in the Treasury bill market, in our view, contributed to a reduction in investable supply available to the public and, in part, caused a contraction in the relative value of such instruments during the latter part of the year.
Another important development in 2019 included the government-sponsored agencies, having been guided by regulatory agencies, issuing floating rate notes indexed to the Secured Overnight Financing Rate (“SOFR”), a broad measure of the cost of borrowing cash overnight collateralized by Treasury securities, and the reference rate generally expected to replace the London Interbank Offered Rate (“LIBOR”). In addition to the agency notes referenced to SOFR, some large financial institutions also issued certificates of deposit and commercial paper linked to this index, and demand for such obligations was generally strong. Sticking on the topic of demand, asset flows into money market mutual funds and short duration bond funds were strong while primary market investment grade issuance was reportedly down rather markedly. This technical backdrop supported spreads in credit instruments during the year, and we believe this dynamic should continue to play out in 2020. Similar to 2018, we witnessed seasonal spread widening of the three-month LIBOR overnight-indexed swap spread, a general proxy for bank funding stress. In our opinion, issuers appeared willing to pay up in terms of additional yield spread to secure their funding needs over stress periods such as corporate tax payment days and balance sheet reporting dates, including most importantly year end, as investors paid close attention to the funding markets for clues to monetary system pressures.
With the market pricing in little action for further interest rate cuts, the Fed providing liquidity to the market during stress periods, assets continuing to flow into money market funds, and tentative optimism over the near-term outlook for global trade, we consider 2019 historic in many ways.
Looking ahead, as of the end of December, futures contracts were priced for less than one rate cut during 2020, with recent Fed comments reinforcing that policy is in a good place. We believe this market pricing to be slightly overdone, and we do not expect a further cut to the federal funds rate at this time — barring any adverse economic events.
In our opinion, we expect publicly available investable Treasury bill supply will remain negative into the first few months of 2020 as the Fed is expected to remain an active buyer of Treasury bills and potentially Treasury coupons in 2020. We also expect that investment grade corporate bond issuance will be flat to down for the year ahead as issuers may have already taken advantage of aflat-to-inverted yield curve in 2019. Finally, we look for the three-month LIBOR overnight-indexed swap spread to return to the historical average range of around 0.19%-0.25% as credit instruments, in our view, appear more attractive relative to short-dated Treasuries. Furthermore, we expect LIBOR to reset lower over the turn of the new year.
Past performance is no guarantee of future results. Index performance is shown for illustrative purposes only. You cannot invest directly in an index.
| | |
| 4 | | 2019 BLACKROCK ANNUAL REPORTTO SHAREHOLDERS |
| | |
| Fund Information as of December 31, 2019 | | |
BlackRock Cash Funds: Institutional
BlackRock Cash Funds: Institutional’s (the “Fund”) investment objective is to seek a high level of income consistent with liquidity and the preservation of capital.
| | | | | | | | |
| | | 7-Day
SEC Yield | | | 7-Day
Yield | |
SL Agency | | | 1.87 | % | | | 1.87 | % |
BlackRock Cash Funds: Treasury
BlackRock Cash Funds: Treasury’s (the “Fund”) investment objective is to seek current income consistent with liquidity and stability of principal.
| | | | | | | | |
| | | 7-Day
SEC Yield | | | 7-Day
Yield | |
Institutional | | | 1.52 | % | | | 1.52 | % |
SL Agency | | | 1.55 | | | | 1.55 | |
The7-Day SEC Yields may differ from the7-Day Yields shown due to the fact that the7-Day SEC Yields exclude distributed capital gains.
Past performance is not indicative of future results.
Disclosure of Expenses
Shareholders of the Funds may incur the following charges: (a) transactional expenses; and (b) operating expenses, including administration fees, service and distribution fees, and other fund expenses. The expense examples shown below (which are based on a hypothetical investment of $1,000 invested on July 1, 2019 and held through December 31, 2019) are intended to assist shareholders both in calculating expenses based on an investment in each Fund and in comparing these expenses with similar costs of investing in other mutual funds.
The expense examples provide information about actual account values and actual expenses. In order to estimate the expenses a shareholder paid during the period covered by this report, shareholders can divide their account value by $1,000 and then multiply the result by the number corresponding to their Fund and share class under the heading entitled “Expenses Paid During the Period.”
The expense examples also provide information about hypothetical account values and hypothetical expenses based on a Fund’s actual expense ratio and an assumed rate of return of 5% per year before expenses. In order to assist shareholders in comparing the ongoing expenses of investing in these Funds and other funds, compare the 5% hypothetical examples with the 5% hypothetical examples that appear in shareholder reports of other funds.
The expenses shown in the expense examples are intended to highlight shareholders’ ongoing costs only and do not reflect any transactional expenses, such as sales charges, if any. Therefore, the hypothetical examples are useful in comparing ongoing expenses only, and will not help shareholders determine the relative total expenses of owning different funds. If these transactional expenses were included, shareholder expenses would have been higher.
Expense Examples
| | | | | | | | | | | | | | | | | | | | | | | | | | | | | | | | |
| | | Actual | | | | | | Hypothetical (b) | | | | |
| BlackRock Cash Funds: Institutional | | Beginning
Account Value
(07/01/19) | | | Ending
Account Value
(12/31/19) | | | Expenses
Paid During
the Period (a) | | | | | | Beginning
Account Value
(07/01/19) | | | Ending
Account Value
(12/31/19) | | | Expenses
Paid During
the Period (a) | | | Annualized
Expense
Ratio | |
SL Agency | | $ | 1,000.00 | | | $ | 1,010.80 | | | $ | 0.46 | | | | | | | $ | 1,000.00 | | | $ | 1,024.75 | | | $ | 0.46 | | | | 0.09 | % |
| | | | | | | |
| BlackRock Cash Funds: Treasury | | | | | | | | | | | | | | | | | | | | | | |
Institutional | | $ | 1,000.00 | | | $ | 1,009.50 | | | $ | 0.61 | | | | | | | $ | 1,000.00 | | | $ | 1,024.60 | | | $ | 0.61 | | | | 0.12 | % |
SL Agency | | | 1,000.00 | | | | 1,009.70 | | | | 0.46 | | | | | | | | 1,000.00 | | | | 1,024.75 | | | | 0.46 | | | | 0.09 | |
| | (a) | For each class of a Fund, expenses are equal to the annualized net expense ratio for the class, multiplied by the average account value over the period, multiplied by 184/365 (to reflect theone-half year period shown). Because each Fund invests all of its assets in its corresponding Master Portfolio, the expense examples reflect the net expenses of both the Fund and the Master Portfolio in which it invests. | |
| | (b) | Hypothetical 5% annual return before expenses is calculated by prorating the number of days in the most recent fiscal half year divided by 365. | |
| | | | |
| FUND INFORMATION / DISCLOSUREOF EXPENSES | | | 5 | |
Statements of Assets and Liabilities
December 31, 2019
| | | | | | | | |
| | | BlackRock
Cash Funds:
Institutional | | | BlackRock
Cash Funds:
Treasury | |
|
ASSETS | |
Investments at value — from the applicable Master Portfolio(a) | | $ | 54,443,685,717 | | | $ | 12,444,049,436 | |
| | | | | | | | |
|
LIABILITIES | |
Payables: | |
Administration fees | | | 1,049,241 | | | | 398,902 | |
Income dividend distributions | | | 84,806,557 | | | | 10,239,751 | |
Other accrued expenses | | | 10,992 | | | | 10,998 | |
| | | | | | | | |
Total liabilities | | | 85,866,790 | | | | 10,649,651 | |
| | | | | | | | |
| | |
NET ASSETS | | $ | 54,357,818,927 | | | $ | 12,433,399,785 | |
| | | | | | | | |
|
NET ASSETS CONSIST OF | |
Paid-in capital | | $ | 54,340,060,752 | | | $ | 12,431,933,855 | |
Accumulated earnings | | | 17,758,175 | | | | 1,465,930 | |
| | | | | | | | |
NET ASSETS | | $ | 54,357,818,927 | | | $ | 12,433,399,785 | |
| | | | | | | | |
|
| Institutional: | |
Net assets | | $ | — | | | $ | 1,813,190,758 | |
| | | | | | | | |
Shares outstanding(b) | | | — | | | | 1,812,977,156 | |
| | | | | | | | |
Net asset value | | $ | — | | | $ | 1.00 | |
| | | | | | | | |
|
| SL Agency: | |
Net assets | | $ | 54,357,818,927 | | | $ | 10,620,209,027 | |
| | | | | | | | |
Shares outstanding(b) | | | 54,334,687,432 | | | | 10,618,956,701 | |
| | | | | | | | |
Net asset value | | $ | 1.0004 | | | $ | 1.00 | |
| | | | | | | | |
| (a) | Money Market Master Portfolio and Treasury Money Market Master Portfolio (each, a “Master Portfolio”), respectively. |
| (b) | Unlimited number of shares authorized, no par value. |
See notes to financial statements.
| | |
| 6 | | 2019 BLACKROCK ANNUAL REPORTTO SHAREHOLDERS |
Statements of Operations
Year Ended December 31, 2019
| | | | | | | | |
| | | BlackRock
Cash Funds:
Institutional | | | BlackRock
Cash Funds:
Treasury | |
|
INVESTMENT INCOME | |
Net investment income allocated from the applicable Master Portfolio: | |
Interest — unaffiliated | | $ | 1,254,372,445 | | | $ | 200,666,792 | |
Expenses | | | (51,790,348 | ) | | | (9,354,314 | ) |
Fees waived | | | 15,929,900 | | | | 2,920,982 | |
| | | | | | | | |
Total investment income | | | 1,218,511,997 | | | | 194,233,460 | |
| | | | | | | | |
|
FUND EXPENSES | |
Administration — class specific | | | 10,210,480 | | | | 2,278,056 | |
Professional | | | 10,975 | | | | 11,003 | |
Miscellaneous | | | 11,249 | | | | 3,500 | |
| | | | | | | | |
Total expenses | | | 10,232,704 | | | | 2,292,559 | |
Less fees waived and/or reimbursed by the Administrator | | | (10,975 | ) | | | (11,003 | ) |
| | | | | | | | |
Total expenses after fees waived and/or reimbursed | | | 10,221,729 | | | | 2,281,556 | |
| | | | | | | | |
Net investment income | | | 1,208,290,268 | | | | 191,951,904 | |
| | | | | | | | |
|
REALIZED AND UNREALIZED GAIN (LOSS) ALLOCATED FROM THE MASTER PORTFOLIOS | |
Net realized gain from investments | | | 658,671 | | | | 1,024,511 | |
Net change in unrealized appreciation (depreciation) on investments | | | 14,197,832 | | | | — | |
| | | | | | | | |
Net realized and unrealized gain | | | 14,856,503 | | | | 1,024,511 | |
| | | | | | | | |
NET INCREASE IN NET ASSETS RESULTING FROM OPERATIONS | | $ | 1,223,146,771 | | | $ | 192,976,415 | |
| | | | | | | | |
See notes to financial statements.
Statements of Changes in Net Assets
| | | | | | | | | | | | | | | | | | | | |
| | | BlackRock Cash Funds: Institutional | | | | | | BlackRock Cash Funds: Treasury | |
| | | Year Ended December 31, | | | | | | Year Ended December 31, | |
| | | 2019 | | | 2018 | | | | | | 2019 | | | 2018 | |
| | | | | |
INCREASE (DECREASE) IN NET ASSETS | | | | | | | | | | | | | | | | | | | | |
| | | |
OPERATIONS | | | | | | | | | | | | | |
Net investment income | | $ | 1,208,290,268 | | | $ | 1,050,588,852 | | | | | | | $ | 191,951,904 | | | $ | 107,354,661 | |
Net realized gain | | | 658,671 | | | | 2,218,840 | | | | | | | | 1,024,511 | | | | 134,531 | |
Net change in unrealized appreciation (depreciation) | | | 14,197,832 | | | | (1,677,441 | ) | | | | | | | — | | | | — | |
| | | | | | | | | | | | | | | | | | | | |
Net increase in net assets resulting from operations | | | 1,223,146,771 | | | | 1,051,130,251 | | | | | | | | 192,976,415 | | | | 107,489,192 | |
| | | | | | | | | | | | | | | | | | | | |
| | | |
DISTRIBUTIONS TO SHAREHOLDERS(a) | | | | | | | | | | | | | |
Institutional | | | — | | | | — | | | | | | | | (30,289,823 | ) | | | (15,006,463 | ) |
SL Agency | | | (1,208,290,268 | ) | | | (1,050,588,852 | ) | | | | | | | (161,662,081 | ) | | | (92,348,198 | ) |
| | | | | | | | | | | | | | | | | | | | |
Decrease in net assets resulting from distributions to shareholders | | | (1,208,290,268 | ) | | | (1,050,588,852 | ) | | | | | | | (191,951,904 | ) | | | (107,354,661 | ) |
| | | | | | | | | | | | | | | | | | | | |
| | | |
CAPITAL SHARE TRANSACTIONS | | | | | | | | | | | | | |
Net increase (decrease) in net assets derived from capital share transactions | | | 7,104,807,686 | | | | (8,828,149,128 | ) | | | | | | | 5,850,717,969 | | | | 1,909,166,929 | |
| | | | | | | | | | | | | | | | | | | | |
| | | |
NET ASSETS | | | | | | | | | | | | | |
Total increase (decrease) in net assets | | | 7,119,664,189 | | | | (8,827,607,729 | ) | | | | | | | 5,851,742,480 | | | | 1,909,301,460 | |
Beginning of year | | | 47,238,154,738 | | | | 56,065,762,467 | | | | | | | | 6,581,657,305 | | | | 4,672,355,845 | |
| | | | | | | | | | | | | | | | | | | | |
End of year | | $ | 54,357,818,927 | | | $ | 47,238,154,738 | | | | | | | $ | 12,433,399,785 | | | $ | 6,581,657,305 | |
| | | | | | | | | | | | | | | | | | | | |
| (a) | Distributions for annual periods determined in accordance with U.S. federal income tax regulations. |
See notes to financial statements.
| | |
| 8 | | 2019 BLACKROCK ANNUAL REPORTTO SHAREHOLDERS |
Financial Highlights
(For a share outstanding throughout each period)
| | | | | | | | | | | | | | | | | | | | |
| | | BlackRock Cash Funds: Institutional | |
| |
| | | SL Agency | |
| |
| | | Year Ended December 31, | |
| | | 2019 | | | 2018 | | | 2017 | | | 2016 | | | 2015 | |
| | | | | |
Net asset value, beginning of year | | $ | 1.0001 | | | $ | 1.0001 | | | $ | 1.0002 | | | $ | 1.00 | | | $ | 1.00 | |
| | | | | | | | | | | | | | | | | | | | |
Net investment income | | | 0.0238 | | | | 0.0206 | | | | 0.0121 | | | | 0.0058 | | | | 0.0019 | |
Net realized and unrealized gain (loss) | | | 0.0003 | | | | 0.0000 | (a) | | | (0.0001 | ) | | | 0.0003 | | | | 0.0000 | (a) |
| | | | | | | | | | | | | | | | | | | | |
Net increase from investment operations | | | 0.0241 | | | | 0.0206 | | | | 0.0120 | | | | 0.0061 | | | | 0.0019 | |
| | | | | | | | | | | | | | | | | | | | |
|
Distributions(b) | |
From net investment income | | | (0.0238 | ) | | | (0.0206 | ) | | | (0.0121 | ) | | | (0.0058 | ) | | | (0.0019 | ) |
From net realized gain | | | — | | | | — | | | | (0.0000 | )(c) | | | (0.0001 | ) | | | (0.0000 | )(c) |
| | | | | | | | | | | | | | | | | | | | |
Total distributions | | | (0.0238 | ) | | | (0.0206 | ) | | | (0.0121 | ) | | | (0.0059 | ) | | | (0.0019 | ) |
| | | | | | | | | | | | | | | | | | | | |
| | | | | |
Net asset value, end of year | | $ | 1.0004 | | | $ | 1.0001 | | | $ | 1.0001 | | | $ | 1.0002 | | | $ | 1.00 | |
| | | | | | | | | | | | | | | | | | | | |
|
Total Return(d) | |
Based on net asset value | | | 2.43 | % | | | 2.08 | % | | | 1.21 | % | | | 0.61 | % | | | 0.19 | % |
| | | | | | | | | | | | | | | | | | | | |
|
Ratios to Average Net Assets(e)(f) | |
Total expenses | | | 0.09 | % | | | 0.09 | % | | | 0.09 | % | | | 0.09 | % | | | 0.09 | % |
| | | | | | | | | | | | | | | | | | | | |
Total expenses after fees waived and/or reimbursed | | | 0.09 | % | | | 0.09 | % | | | 0.09 | % | | | 0.09 | % | | | 0.09 | % |
| | | | | | | | | | | | | | | | | | | | |
Net investment income | | | 2.36 | % | | | 2.05 | % | | | 1.23 | % | | | 0.58 | % | | | 0.19 | % |
| | | | | | | | | | | | | | | | | | | | |
|
Supplemental Data | |
Net assets, end of year (000) | | $ | 54,357,819 | | | $ | 47,238,155 | | | $ | 56,065,762 | | | $ | 41,189,027 | | | $ | 40,443,595 | |
| | | | | | | | | | | | | | | | | | | | |
| (a) | Amount is less than $0.00005 per share. |
| (b) | Distributions for annual periods determined in accordance with U.S. federal income tax regulations. |
| (c) | Amount is greater than $(0.00005) per share. |
| (d) | Where applicable, assumes the reinvestment of distributions. |
| (e) | Includes the Fund’s share of the Master Portfolio’s allocated net expenses and/or net investment income. |
| (f) | Includes the Fund’s share of the Master Portfolio’s allocated fees waived, the expense ratios were as follows: |
| | | | | | | | | | | | | | | | | | | | |
| | | Year Ended December 31, | |
| | | 2019 | | | 2018 | | | 2017 | | | 2016 | | | 2015 | |
| | | | | | | | | | | | | | | | | | | | |
Expense ratios | | | 0.03 | % | | | 0.03 | % | | | 0.03 | % | | | 0.03 | % | | | 0.03 | % |
| | | | | | | | | | | | | | | | | | | | |
See notes to financial statements.
Financial Highlights (continued)
(For a share outstanding throughout each period)
| | | | | | | | | | | | | | | | | | | | | | | | |
| | | BlackRock Cash Funds: Treasury | |
| |
| | | Institutional | |
| | | | |
| | | Year Ended December 31, | | | | | | Period from
06/06/16 (a)
to 12/31/16 | | | Period from
01/01/15
to 12/31/15 (b) | |
| | | 2019 | | | 2018 | | | 2017 | | | | |
| | | | | | |
Net asset value, beginning of period | | $ | 1.00 | | | $ | 1.00 | | | $ | 1.00 | | | | | | | $ | 1.00 | | | $ | 1.00 | |
| | | | | | | | | | | | | | | | | | | | | | | | |
Net investment income | | | 0.0210 | | | | 0.0175 | | | | 0.0079 | | | | | | | | 0.0015 | | | | 0.0000 | (c) |
Net realized gain | | | 0.0000 | (c) | | | 0.0000 | (c) | | | 0.0000 | (c) | | | | | | | 0.0001 | | | | 0.0000 | (c) |
| | | | | | | | | | | | | | | | | | | | | | | | |
Net increase from investment operations | | | 0.0210 | | | | 0.0175 | | | | 0.0079 | | | | | | | | 0.0016 | | | | 0.0000 | |
| | | | | | | | | | | | | | | | | | | | | | | | |
|
Distributions(d) | |
From net investment income | | | (0.0210 | ) | | | (0.0175 | ) | | | (0.0079 | ) | | | | | | | (0.0015 | ) | | | (0.0000 | )(e) |
From net realized gain | | | (0.0000 | )(e) | | | — | | | | (0.0000 | )(e) | | | | | | | (0.0001 | ) | | | (0.0000 | )(e) |
| | | | | | | | | | | | | | | | | | | | | | | | |
Total distributions | | | (0.0210 | ) | | | (0.0175 | ) | | | (0.0079 | ) | | | | | | | (0.0016 | ) | | | (0.0000 | ) |
| | | | | | | | | | | | | | | | | | | | | | | | |
| | | | | | |
Net asset value, end of period | | $ | 1.00 | | | $ | 1.00 | | | $ | 1.00 | | | | | | | $ | 1.00 | | | $ | 1.00 | |
| | | | | | | | | | | | | | | | | | | | | | | | |
|
Total Return(f) | |
Based on net asset value | | | 2.12 | % | | | 1.76 | % | | | 0.79 | % | | | | | | | 0.16 | %(g) | | | 0.00 | % |
| | | | | | | | | | | | | | | | | | | | | | | | |
|
Ratios to Average Net Assets(h)(i) | |
Total expenses | | | 0.12 | % | | | 0.12 | % | | | 0.12 | % | | | | | | | 0.12 | %(j) | | | 0.12 | % |
| | | | | | | | | | | | | | | | | | | | | | | | |
Total expenses after fees waived and/or reimbursed | | | 0.12 | % | | | 0.12 | % | | | 0.12 | % | | | | | | | 0.12 | %(j) | | | 0.11 | % |
| | | | | | | | | | | | | | | | | | | | | | | | |
Net investment income | | | 2.06 | % | | | 1.76 | % | | | 0.93 | % | | | | | | | 0.29 | %(j) | | | 0.01 | % |
| | | | | | | | | | | | | | | | | | | | | | | | |
|
Supplemental Data | |
Net assets, end of period (000) | | $ | 1,813,191 | | | $ | 1,182,627 | | | $ | 467,589 | | | | | | | $ | 80,257 | | | $ | — | (b) |
| | | | | | | | | | | | | | | | | | | | | | | | |
| (a) | Recommencement of operations. |
| (b) | There were no Institutional shares outstanding as of the year ended December 31, 2015. |
| (c) | Amount is less than $0.00005 per share. |
| (d) | Distributions for annual periods determined in accordance with U.S. federal income tax regulations. |
| (e) | Amount is greater than $(0.00005) per share. |
| (f) | Where applicable, assumes the reinvestment of distributions. |
| (g) | Aggregate total return. |
| (h) | Includes the Fund’s share of the Master Portfolio’s allocated expenses and/or net investment income. |
| (i) | Includes the Fund’s share of the Master Portfolio’s allocated fees waived, the expense ratios were as follows: |
| | | | | | | | | | | | | | | | | | | | | | | | |
| | | Year Ended December 31, | | | | | | Period from
06/06/16 (a) to 12/31/16 | | | Period from 01/01/15 to 12/31/15 (b) | |
| | | 2019 | | | 2018 | | | 2017 | |
Expense ratios | | | 0.03 | % | | | 0.03 | % | | | 0.03 | % | | | | | | | 0.03 | % | | | 0.03 | % |
| | | | | | | | | | | | | | | | | | | | | | | | |
See notes to financial statements.
| | |
| 10 | | 2019 BLACKROCK ANNUAL REPORTTO SHAREHOLDERS |
Financial Highlights (continued)
(For a share outstanding throughout each period)
| | | | | | | | | | | | | | | | | | | | |
| | | BlackRock Cash Funds: Treasury (continued) | |
| |
| | | SL Agency | |
| |
| | | Year Ended December 31, | |
| | | 2019 | | | 2018 | | | 2017 | | | 2016 | | | 2015 | |
| | | | | |
Net asset value, beginning of year | | $ | 1.00 | | | $ | 1.00 | | | $ | 1.00 | | | $ | 1.00 | | | $ | 1.00 | |
| | | | | | | | | | | | | | | | | | | | |
Net investment income | | | 0.0213 | | | | 0.0178 | | | | 0.0082 | | | | 0.0029 | | | | 0.0003 | |
Net realized gain | | | 0.0000 | (a) | | | 0.0000 | (a) | | | 0.0000 | (a) | | | 0.0001 | | | | 0.0000 | (a) |
| | | | | | | | | | | | | | | | | | | | |
Net increase from investment operations | | | 0.0213 | | | | 0.0178 | | | | 0.0082 | | | | 0.0030 | | | | 0.0003 | |
| | | | | | | | | | | | | | | | | | | | |
|
Distributions(b) | |
From net investment income | | | (0.0213 | ) | | | (0.0178 | ) | | | (0.0082 | ) | | | (0.0029 | ) | | | (0.0003 | ) |
From net realized gain | | | (0.0000 | )(c) | | | — | | | | (0.0000 | )(c) | | | (0.0001 | ) | | | (0.0000 | )(c) |
| | | | | | | | | | | | | | | | | | | | |
Total distributions | | | (0.0213 | ) | | | (0.0178 | ) | | | (0.0082 | ) | | | (0.0030 | ) | | | (0.0003 | ) |
| | | | | | | | | | | | | | | | | | | | |
| | | | | |
Net asset value, end of year | | $ | 1.00 | | | $ | 1.00 | | | $ | 1.00 | | | $ | 1.00 | | | $ | 1.00 | |
| | | | | | | | | | | | | | | | | | | | |
|
Total Return(d) | |
Based on net asset value | | | 2.15 | % | | | 1.79 | % | | | 0.82 | % | | | 0.30 | % | | | 0.03 | % |
| | | | | | | | | | | | | | | | | | | | |
|
Ratios to Average Net Assets(e)(f) | |
Total expenses | | | 0.09 | % | | | 0.09 | % | | | 0.09 | % | | | 0.09 | % | | | 0.09 | % |
| | | | | | | | | | | | | | | | | | | | |
Total expenses after fees waived and/or reimbursed | | | 0.09 | % | | | 0.09 | % | | | 0.09 | % | | | 0.09 | % | | | 0.09 | % |
| | | | | | | | | | | | | | | | | | | | |
Net investment income | | | 2.10 | % | | | 1.78 | % | | | 0.85 | % | | | 0.29 | % | | | 0.03 | % |
| | | | | | | | | | | | | | | | | | | | |
|
Supplemental Data | |
Net assets, end of year (000) | | $ | 10,620,209 | | | $ | 5,399,030 | | | $ | 4,204,767 | | | $ | 3,570,576 | | | $ | 2,154,574 | |
| | | | | | | | | | | | | | | | | | | | |
| (a) | Amount is less than $0.00005 per share. |
| (b) | Distributions for annual periods determined in accordance with U.S. federal income tax regulations. |
| (c) | Amount is greater than $(0.00005) per share. |
| (d) | Where applicable, assumes the reinvestment of distributions. |
| (e) | Includes the Fund’s share of the Master Portfolio’s allocated expenses and/or net investment income. |
| (f) | Includes the Fund’s share of the Master Portfolio’s allocated fees waived, the expense ratios were as follows: |
| | | | | | | | | | | | | | | | | | | | |
| | | Year Ended December 31, | |
| | | 2019 | | | 2018 | | | 2017 | | | 2016 | | | 2015 | |
Expense ratios | | | 0.03 | % | | | 0.03 | % | | | 0.03 | % | | | 0.03 | % | | | 0.03 | % |
| | | | | | | | | | | | | | | | | | | | |
See notes to financial statements.
Notes to Financial Statements
BlackRock Funds III (the “Trust”) is registered under the Investment Company Act of 1940, as amended (the “1940 Act”), as anopen-end management investment company. The Trust is organized as a Delaware statutory trust. The following, each of which is a series of the Trust, are referred to herein collectively as the “Funds” or individually as a “Fund”:
| | | | |
| Fund Name | | Herein Referred To As | | Diversification
Classification |
BlackRock Cash Funds: Institutional | | Institutional | | Diversified |
BlackRock Cash Funds: Treasury | | Treasury | | Diversified |
Each Fund seeks to achieve its investment objective by investing all of its assets in a corresponding series of Master Investment Portfolio (“MIP”): Money Market Master Portfolio and Treasury Money Market Master Portfolio (each, a “Master Portfolio” and together, the “Master Portfolios”). MIP is an affiliate of the Trust. Each Master Portfolio has the same investment objective and strategies as its corresponding Fund. The value of each Fund’s investment in its corresponding Master Portfolio reflects the Fund’s proportionate interest in the net assets of the Master Portfolio. The performance of each Fund is directly affected by the performance of the Master Portfolios. At December 31, 2019, the percentage of each Master Portfolio owned by its corresponding Fund was 100% for Institutional and 91% for Treasury. The financial statements of the Master Portfolios, including the Schedules of Investments, are included elsewhere in this report and should be read in conjunction with the Funds’ financial statements.
Institutional only offers SL Agency share class and is only available for certain eligible investors. Treasury offers multiple classes of shares. Institutional, Select, SL Agency, Capital, Premium and Trust Shares are sold without a sales charge and only to certain eligible investors. All classes of shares have identical voting, dividend, liquidation and other rights and are subject to the same terms and conditions, and differ principally with respect to administration fees. The Board of Trustees of the Trust and Board of Directors of MIP are referred to throughout this report as the “Board of Trustees” or the “Board” and the members are referred to as “Trustees.”
Treasury operates as a “government money market fund” under Rule2a-7 under the 1940 Act. The Fund is not subject to liquidity fees or temporary suspensions of redemptions due to declines in the Fund’s weekly liquid assets.
With respect to Institutional, the Board is permitted to impose a liquidity fee of up to 2% on the value redeemed or temporarily restrict redemptions from Institutional for up to 10 business days during a 90 day period, in the event that Institutional’s weekly liquid assets fall below certain thresholds.
The Funds, together with certain other affiliated registered investment companies are included in a complex of equity, multi-asset, index and money market funds referred to as the BlackRock Multi-Asset Complex.
| 2. | SIGNIFICANT ACCOUNTING POLICIES |
The financial statements are prepared in conformity with accounting principles generally accepted in the United States of America (“U.S. GAAP”), which may require management to make estimates and assumptions that affect the reported amounts of assets and liabilities in the financial statements, disclosure of contingent assets and liabilities at the date of the financial statements and the reported amounts of increases and decreases in net assets from operations during the reporting period. Actual results could differ from those estimates. Each Fund is considered an investment company under U.S. GAAP and follows the accounting and reporting guidance applicable to investment companies. Below is a summary of significant accounting policies:
Investment Transactions and Income Recognition:For financial reporting purposes, contributions to and withdrawals from the Master Portfolios are accounted for on a trade date basis. The Funds record their proportionate share of the Master Portfolios’ income, expenses and realized and unrealized gains and losses on a daily basis. In addition, the Funds accrue their own expenses. Income, expenses and realized and unrealized gains and losses are allocated daily to each class based on its relative net assets.
Distributions: Distributions from net investment income are declared daily and paid monthly. Distributions of capital gains are distributed at least annually and are recorded on theex-dividend dates. The character and timing of distributions are determined in accordance with U.S. federal income tax regulations, which may differ from U.S. GAAP.
Liquidity Fees: Any liquidity fees imposed on the value of shares redeemed in the event that Institutional’s weekly liquid assets fall below certain thresholds are recorded aspaid-in-capital. The liquidity fees are collected and retained by Institutional for the benefit of Institutional’s remaining shareholders.
Indemnifications:In the normal course of business, a Fund enters into contracts that contain a variety of representations that provide general indemnification. A Fund’s maximum exposure under these arrangements is unknown because it involves future potential claims against a Fund, which cannot be predicted with any certainty.
Other: Expenses directly related to a Fund or its classes are charged to that Fund or the applicable class. Other operating expenses shared by several funds, including other funds managed by the BlackRock Advisors, LLC (the “Administrator”), are prorated among those funds on the basis of relative net assets or other appropriate methods. Expenses directly related to the Funds and other shared expenses prorated to the Funds are allocated daily to each class based on their relative net assets or other appropriate methods.
| 3. | INVESTMENT VALUATION AND FAIR VALUE MEASUREMENTS |
Investment Valuation Policies:Each Fund’s policy is to value its financial instruments at fair value. Each Fund records its investment in the Master Portfolio at fair value based on the Funds’ proportionate interest in the net assets of the Master Portfolio. Valuation of securities held by the Master Portfolio is discussed in Note 3 of the Master Portfolios’ Notes to Financial Statements, which are included elsewhere in this report.
| | |
| 12 | | 2019 BLACKROCK ANNUAL REPORTTO SHAREHOLDERS |
Notes to Financial Statements (continued)
| 4. | ADMINISTRATION AGREEMENT AND OTHER TRANSACTIONS WITH AFFILIATES |
Administration:The Trust, on behalf of the Funds, entered into an Administration Agreement with BlackRock Advisors, LLC (“BAL”), which has agreed to provide general administrative services (other than investment advice and related portfolio activities). BAL, has agreed to bear all of the Funds’ ordinary operating expenses, excluding, generally, investment advisory fees, distribution fees, brokerage and other expenses related to the execution of portfolio transactions, extraordinary expenses and certain other expenses which are borne by the Funds. BAL is entitled to receive for these administrative services an annual fee based on the average daily net assets of each Fund as follows:
| | | | | | | | |
| | | Institutional | | | Treasury | |
Capital | | | N/A | | | | 0.07 | (a) |
Institutional | | | N/A | | | | 0.05 | |
Premium | | | N/A | | | | 0.10 | (a) |
Select | | | N/A | | | | 0.15 | (a) |
SL Agency | | | 0.02 | % | | | 0.02 | |
Trust | | | N/A | | | | 0.38 | (a) |
| | (a) | No shares outstanding as of December 31, 2019. | |
From time to time, BAL may waive such fees in whole or in part. Any such waiver will reduce the expenses of the Funds and, accordingly, have a favorable impact on their performance. BAL may delegate certain of its administration duties tosub-administrators.
For the year ended December 31, 2019, the following table shows the class specific administration fees borne directly by each class of each Fund:
| | | | | | | | |
| | | Institutional | | | Treasury | |
Capital | | | N/A | | | $ | — | (a) |
Institutional | | | N/A | | | | 735,070 | |
Premium | | | N/A | | | | — | (a) |
Select | | | N/A | | | | — | (a) |
SL Agency | | $ | 10,210,480 | | | | 1,542,986 | |
Trust | | | N/A | | | | — | (a) |
| | | | | | | | |
| | $ | 10,210,480 | | | $ | 2,278,056 | |
| | | | | | | | |
| | (a) | No shares outstanding as of December 31, 2019. | |
As of December 31, 2019, the only investors for the SL Agency Shares of Institutional are investment companies for which (i) BFA, BlackRock Institutional Trust Company, N.A. (“BTC”), or an affiliate provides investment advisory or administration services, or (ii) BTC acts as securities lending agent and which have directed BTC on their behalf to invest securities lending cash collateral in SL Agency Shares of Institutional. Affiliated shareholders in the SL Agency Shares of the Funds represent a significant portion of the outstanding shares and net assets of Institutional and Treasury.
Distribution Fees:The Trust, on behalf of the Funds, entered into a Distribution Agreement and a Distribution Plan with BlackRock Investments, LLC (“BRIL”), an affiliate of the Administrator. Shareholders of Capital, Institutional, Premium, Select, SL Agency and Trust Shares of the Funds do not pay any fees for distribution services.
Expense Waivers and Reimbursements:BAL contractually agreed to waive a portion of its administration fees equal to the annual rate of 0.02% of Select Shares average daily net assets through April 30, 2020.
The fees and expenses of the Funds’ Independent Trustees who are not “interested persons” of the Trust, as defined in the 1940 Act (“Independent Trustees”), counsel to the Independent Trustees and the Trust’s independent registered public accounting firm (together, the “independent expenses”) are paid directly by the Funds. BAL has contractually agreed to reimburse the Funds or provide an offsetting credit against the administration fees paid by the Funds in an amount equal to these independent expenses through April 30, 2020. For the year ended December 31, 2019, the amounts waived and/or reimbursed were as follows:
| | | | |
Institutional | | $ | 10,975 | |
Treasury | | | 11,033 | |
Interfund Lending: In accordance with an exemptive order (the “Order”) from the U.S. Securities and Exchange Commission (“SEC”), each Fund may participate in a joint lending and borrowing facility for temporary purposes (the “Interfund Lending Program”), subject to compliance with the terms and conditions of the Order, and to the extent permitted by each Fund’s investment policies and restrictions. Each Fund is currently permitted to borrow and lend under the Interfund Lending Program.
A lending BlackRock fund may lend in aggregate up to 15% of its net assets, but may not lend more than 5% of its net assets to any one borrowing fund through the Interfund Lending Program. A borrowing BlackRock fund may not borrow through the Interfund Lending Program or from any other source more than 33 1/3% of its total assets (or any lower threshold provided for by the fund’s investment restrictions). If a borrowing BlackRock fund’s total outstanding borrowings exceed 10% of its total assets, each of its outstanding interfund loans will be subject to collateralization of at least 102% of the outstanding principal value of the loan. All interfund loans are for temporary or emergency purposes and the interest rate to be charged will be the average of the highest current overnight repurchase agreement rate available to a lending fund and the bank loan rate, as calculated according to a formula established by the Board.
During the year ended December 31, 2019, the Funds did not participate in the Interfund Lending Program.
Trustees and Officers:Certain trustees and/or officers of the Trust are directors and/or officers of BlackRock or its affiliates.
| | | | |
| NOTESTO FINANCIAL STATEMENTS | | | 13 | |
Notes to Financial Statements (continued)
It is each Fund’s policy to comply with the requirements of the Internal Revenue Code of 1986, as amended, applicable to regulated investment companies, and to distribute substantially all of its taxable income to its shareholders. Therefore, no U.S. federal income tax provision is required.
Each Fund files U.S. federal and various state and local tax returns. No income tax returns are currently under examination. The statute of limitations on each Fund’s U.S. federal tax returns generally remains open for each of the four years ended December 31, 2019. The statutes of limitations on each Fund’s state and local tax returns may remain open for an additional year depending upon the jurisdiction.
Management has analyzed tax laws and regulations and their application to the Funds as of December 31, 2019, inclusive of the open tax return years, and does not believe that there are any uncertain tax positions that require recognition of a tax liability in the Funds’ financial statements.
The tax character of distributions paid was as follows:
| | | | | | | | |
| | | Institutional | | | Treasury | |
Ordinary income | | | | | | | | |
12/31/19 | | $ | 1,208,290,268 | | | $ | 191,951,904 | |
12/31/18 | | | 1,050,588,852 | | | | 107,354,661 | |
| | | | | | | | |
12/31/19 | | $ | 1,208,290,268 | | | $ | 191,951,904 | |
| | | | | | | | |
12/31/18 | | $ | 1,050,588,852 | | | $ | 107,354,661 | |
| | | | | | | | |
As of December 31, 2019, the tax components of accumulated earnings were as follows:
| | | | | | | | |
| | | Institutional | | | Treasury | |
Undistributed ordinary income | | $ | 4,174,593 | | | $ | 1,459,632 | |
Net unrealized gains (losses) | | | 13,583,582 | | | | — | |
Undistributed capital gains | | | — | | | | 6,298 | |
| | | | | | | | |
| | $ | 17,758,175 | | | $ | 1,465,930 | |
| | | | | | | | |
| 6. | CAPITAL SHARE TRANSACTIONS |
Transactions in capital shares for each class of Institutional were as follows:
| | | | | | | | | | | | | | | | |
| | | Year Ended
12/31/19 | | | Year Ended
12/31/18 | |
| Institutional | | Shares | | | Amount | | | Shares | | | Amount | |
SL Agency | | | | | | | | | | | | | | | | |
Shares sold | | | 235,025,468,617 | | | $ | 235,125,900,276 | | | | 203,052,501,589 | | | $ | 203,087,934,988 | |
Shares issued in reinvestment of distributions | | | — | | | | — | | | | — | | | | — | |
Shares redeemed | | | (227,923,910,156 | ) | | | (228,021,092,590) | | | | (211,878,989,332 | ) | | | (211,916,084,116 | ) |
| | | | | | | | | | | | | | | | |
Net increase (decrease) | | | 7,101,558,461 | | | $ | 7,104,807,686 | | | | (8,826,487,743 | ) | | $ | (8,828,149,128 | ) |
| | | | | | | | | | | | | | | | |
Total Net Increase (Decrease) | | | 7,101,558,461 | | | $ | 7,104,807,686 | | | | (8,826,487,743 | ) | | $ | (8,828,149,128 | ) |
| | | | | | | | | | | | | | | | |
The number of shares sold, reinvested and redeemed corresponds to the net proceeds from the sale of shares, reinvestment of all distributions and cost of shares redeemed, respectively, since shares are sold and redeemed at $1.00 per share for Treasury.
Transactions in capital shares for each class of Treasury were as follows:
| | | | | | | | |
| Treasury | | Year Ended 12/31/19 | | | Year Ended 12/31/18 | |
Institutional | | | | | | | | |
Shares sold | | | 9,317,651,619 | | | | 5,279,725,471 | |
Shares issued in reinvestment of distributions | | | 14,519,118 | | | | 8,579,680 | |
Shares redeemed | | | (8,701,741,219 | ) | | | (4,573,315,565 | ) |
| | | | | | | | |
Net increase | | | 630,429,518 | | | | 714,989,586 | |
| | | | | | | | |
| | |
SL Agency | | | | | | | | |
Shares sold | | | 199,887,588,923 | | | | 116,642,630,716 | |
Shares issued in reinvestment of distributions | | | 6,379,009 | | | | 2,789,720 | |
Shares redeemed | | | (194,673,679,481 | ) | | | (115,451,243,093 | ) |
| | | | | | | | |
Net increase | | | 5,220,288,451 | | | | 1,194,177,343 | |
| | | | | | | | |
Total Net Increase | | | 5,850,717,969 | | | | 1,909,166,929 | |
| | | | | | | | |
| | |
| 14 | | 2019 BLACKROCK ANNUAL REPORTTO SHAREHOLDERS |
Notes to Financial Statements (continued)
Management has evaluated the impact of all subsequent events on the Funds through the date the financial statements were issued and has determined that there were no subsequent events requiring adjustment or additional disclosure in the financial statements.
| | | | |
| NOTESTO FINANCIAL STATEMENTS | | | 15 | |
Report of Independent Registered Public Accounting Firm
To the Board of Trustees of
BlackRock Funds III and Shareholders of BlackRock Cash Funds: Institutional and BlackRock Cash Funds: Treasury
Opinions on the Financial Statements
We have audited the accompanying statements of assets and liabilities of BlackRock Cash Funds: Institutional and BlackRock Cash Funds: Treasury (two of the series constituting BlackRock Funds III, hereafter collectively referred to as the “Funds”) as of December 31, 2019, the related statements of operations for the year ended December 31, 2019, the statements of changes in net assets for each of the two years in the period ended December 31, 2019, including the related notes, and the financial highlights for each of the periods indicated therein (collectively referred to as the “financial statements”). In our opinion, the financial statements present fairly, in all material respects, the financial position of each of the Funds as of December 31, 2019, the results of each of their operations for the year then ended, the changes in each of their net assets for each of the two years in the period ended December 31, 2019 and each of the financial highlights for each of the periods indicated therein in conformity with accounting principles generally accepted in the United States of America.
Basis for Opinions
These financial statements are the responsibility of the Funds’ management. Our responsibility is to express an opinion on the Funds’ financial statements based on our audits. We are a public accounting firm registered with the Public Company Accounting Oversight Board (United States) (“PCAOB”) and are required to be independent with respect to the Funds in accordance with the U.S. federal securities laws and the applicable rules and regulations of the Securities and Exchange Commission and the PCAOB.
We conducted our audits of these financial statements in accordance with the standards of the PCAOB. Those standards require that we plan and perform the audit to obtain reasonable assurance about whether the financial statements are free of material misstatement, whether due to error or fraud.
Our audits included performing procedures to assess the risks of material misstatement of the financial statements, whether due to error or fraud, and performing procedures that respond to those risks. Such procedures included examining, on a test basis, evidence regarding the amounts and disclosures in the financial statements. Our audits also included evaluating the accounting principles used and significant estimates made by management, as well as evaluating the overall presentation of the financial statements. Our procedures included confirmation of securities owned as of December 31, 2019 by correspondence with the administrator of the Master Portfolios. We believe that our audits provide a reasonable basis for our opinions.
/s/PricewaterhouseCoopers LLP
Philadelphia, Pennsylvania
February 14, 2020
We have served as the auditor of one or more BlackRock investment companies since 2000.
Important Tax Information (Unaudited)
The following information is provided with respect to the ordinary income distributions paid by Institutional and Treasury for the taxable year ended December 31, 2019:
| | |
| Interest-Related Dividends and Qualified Short-Term Capital Gains for Non-U.S. Residents (a) |
| | | Months Paid |
| | | January — December 2019 |
Institutional | | 85.35% |
Treasury | | 100.00 |
| | |
| Federal Obligation Interest (b) |
Institutional | | 0.86% |
Treasury | | 46.02 |
| | (a) | Represents the portion of the taxable ordinary dividends eligible for exemption from U.S. withholding tax for nonresident aliens and foreign corporations. | |
| | (b) | The law varies in each state as to whether and what percentage of dividend income attributable to Federal obligations is exempt from state income tax. We recommend that you consult your tax advisor to determine if any of the dividends you received is exempt from state income taxes. | |
| | |
| 16 | | 2019 BLACKROCK ANNUAL REPORTTO SHAREHOLDERS |
Master Portfolio Information as of December 31, 2019
Portfolio Composition
| | | | |
| Money Market Master Portfolio | | Percent of
Net Assets | |
Certificates of Deposit | | | 33 | % |
Repurchase Agreements | | | 29 | |
Commercial Paper | | | 23 | |
Time Deposits | | | 8 | |
U.S. Treasury Obligations | | | 4 | |
Municipal Bonds | | | 2 | |
Corporate Bonds | | | 1 | |
Other Assets and Liabilities | | | — | (a) |
| | (a) | Represents less than 1%. | |
| | | | |
| Treasury Money Market Master Portfolio | | Percent of
Net Assets | |
Repurchase Agreements | | | 53 | % |
U.S. Treasury Obligations | | | 48 | |
Other Assets and Liabilities | | | (1 | ) |
| | | | |
| MASTER PORTFOLIO INFORMATION | | | 17 | |
| | |
Schedule of Investments December 31, 2019 | | Money Market Master Portfolio (Percentages shown are based on Net Assets) |
| | | | | | | | |
| Security | | Par
(000) | | | Value | |
|
Certificates of Deposit — 33.2% | |
|
Domestic — 3.0% | |
Bank of America NA, 1.83%, 03/16/20(a) | | | USD 236,000 | | | $ | 236,000,000 | |
Goldman Sachs Bank USA(b): | | | | | | | | |
(SOFR + 0.25%), 1.79%, 06/11/20 | | | 100,000 | | | | 99,924,466 | |
(SOFR + 0.25%), 1.79%, 06/25/20 | | | 46,000 | | | | 46,001,019 | |
(SOFR + 0.25%), 1.79%, 06/29/20 | | | 174,000 | | | | 173,999,783 | |
(SOFR + 0.40%), 1.93%, 11/05/20 | | | 50,000 | | | | 49,991,172 | |
HSBC Bank USA NA(b): | | | | | | | | |
(3 mo. LIBOR US + 0.12%), 2.04%, 08/26/20 | | | 101,500 | | | | 101,512,733 | |
(3 mo. LIBOR US + 0.22%), 2.13%, 12/04/20 | | | 155,000 | | | | 155,000,000 | |
Wells Fargo Bank NA(b): | | | | | | | | |
(3 mo. LIBOR US + 0.21%), 2.24%, 02/07/20 | | | 278,500 | | | | 278,562,651 | |
(1 mo. LIBOR US + 0.22%), 1.96%, 07/15/20 | | | 484,500 | | | | 484,562,496 | |
| | | | | | | | |
| |
Total Domestic — 3.0%
(Cost — $1,625,500,000) | | | | 1,625,554,320 | |
| | | | | | | | |
|
Euro — 3.0% | |
Bank of Montreal, London: | | | | | | | | |
0.01%, 01/02/20 | | | 400,000 | | | | 400,000,000 | |
2.00%, 01/06/20 | | | 200,000 | | | | 200,000,000 | |
Credit Industriel et Commercial, London: | | | | | | | | |
0.01%, 02/10/20 | | | 250,000 | | | | 249,553,785 | |
0.01%, 03/13/20 | | | 400,000 | | | | 398,633,100 | |
Nationwide Building Society, 2.01%, 01/07/20 | | | 345,000 | | | | 345,000,000 | |
Sumitomo Trust & Banking Co. Ltd., London, 2.18%, 03/26/20(c) | | | 65,000 | | | | 64,703,997 | |
| | | | | | | | |
| |
Total Euro — 3.0%
(Cost — $1,657,044,589) | | | | 1,657,890,882 | |
| | | | | | | | |
|
| Yankee(d) — 27.2% | |
Australia & New Zealand Banking Group Ltd., New York, 2.70%, 03/31/20 | | | 109,250 | | | | 109,469,679 | |
Banco Santander SA, New York: | | | | | | | | |
(1 mo. LIBOR US + 0.24%), 1.95%, 01/06/20(b) | | | 200,000 | | | | 200,014,032 | |
1.91%, 02/14/20 | | | 250,000 | | | | 250,046,967 | |
Bank of Montreal, Chicago: | | | | | | | | |
2.10%, 01/03/20 | | | 110,000 | | | | 110,004,644 | |
(1 mo. LIBOR US + 0.42%), 2.16%, 01/17/20(b) | | | 349,000 | | | | 349,078,874 | |
(Fed Funds Rate + 0.35%), 1.90%, 08/05/20(b) | | | 100,000 | | | | 100,034,952 | |
(3 mo. LIBOR US + 0.14%), 2.04%, 11/18/20(b) | | | 75,000 | | | | 75,027,746 | |
(3 mo. LIBOR US + 0.13%), 2.03%, 01/04/21(b) | | | 150,000 | | | | 149,998,599 | |
Barclays Bank PLC, New York: | | | | | | | | |
2.10%, 05/01/20 | | | 394,100 | | | | 394,341,477 | |
2.05%, 06/22/20 | | | 322,000 | | | | 322,134,119 | |
Bayerische Landesbank, New York: | | | | | | | | |
2.00%, 01/02/20 | | | 400,000 | | | | 399,999,040 | |
2.12%, 02/19/20 | | | 250,000 | | | | 250,088,455 | |
BNP Paribas SA, New York(b): | | | | | | | | |
(3 mo. LIBOR US + 0.20%), 2.21%, 10/09/20 | | | 327,750 | | | | 327,824,301 | |
(3 mo. LIBOR US + 0.19%), 2.19%, 10/16/20 | | | 200,000 | | | | 200,030,918 | |
Credit Agricole CIB, New York: | | | | | | | | |
2.76%, 03/18/20 | | | 244,750 | | | | 245,197,166 | |
(3 mo. LIBOR US + 0.13%), 2.04%, 03/20/20(b) | | | 306,500 | | | | 306,577,354 | |
(1 mo. LIBOR US + 0.25%), 2.05%, 05/29/20(b) | | | 200,000 | | | | 200,016,706 | |
Credit Industriel et Commercial, New York, (3 mo. LIBOR US + 0.14%), 2.04%, 12/04/20(b) | | | 246,000 | | | | 246,000,000 | |
Credit Suisse AG, New York: | | | | | | | | |
(SOFR + 0.38%), 1.92%, 03/06/20(b) | | | 59,000 | | | | 59,021,105 | |
2.70%, 05/01/20 | | | 308,500 | | | | 309,248,264 | |
(SOFR + 0.37%), 1.91%, 05/22/20(b) | | | 150,000 | | | | 150,046,152 | |
(SOFR + 0.26%), 1.80%, 06/12/20(b) | | | 62,000 | | | | 61,977,745 | |
(SOFR + 0.30%), 1.84%, 06/19/20 | | | 125,000 | | | | 125,005,726 | |
| | | | | | | | |
| Security | | Par
(000) | | | Value | |
|
| Yankee(d) (continued) | |
Credit Suisse AG, New York (continued): | | | | | | | | |
(SOFR + 0.48%), 2.02%, 10/02/20(b) | | | USD 200,000 | | | $ | 200,105,846 | |
(3 mo. LIBOR US + 0.23%), 2.12%, 12/30/20(b) | | | 200,000 | | | | 199,998,686 | |
Landesbank Baden-Wurttemberg, New York, 2.00%, 01/02/20 | | | 500,000 | | | | 499,999,080 | |
Lloyds Bank Corporate Markets PLC, New York: | | | | | | | | |
2.30%, 01/21/20 | | | 200,000 | | | | 200,058,938 | |
(3 mo. LIBOR US + 0.17%), 2.17%, 04/17/20(b) | | | 171,500 | | | | 171,534,194 | |
(3 mo. LIBOR US + 0.17%), 2.17%, 04/30/20(b) | | | 250,000 | | | | 250,000,000 | |
2.00%, 05/01/20 | | | 142,000 | | | | 142,053,754 | |
(3 mo. LIBOR US + 0.14%), 2.05%, 05/06/20(b) | | | 150,000 | | | | 150,000,000 | |
Mitsubishi UFJ Trust & Banking Corp., New York, (3 mo. LIBOR US + 0.08%), 2.00%, 05/27/20(b) | | | 98,000 | | | | 98,011,308 | |
Mizuho Bank Ltd., New York, (3 mo. LIBOR US + 0.10%), 2.04%, 10/01/20(b) | | | 300,000 | | | | 300,000,000 | |
MUFG Bank Ltd., New York: | | | | | | | | |
(3 mo. LIBOR US + 0.18%), 2.09%, 02/24/20(b) | | | 351,000 | | | | 351,078,687 | |
2.72%, 02/24/20 | | | 419,500 | | | | 420,064,546 | |
(3 mo. LIBOR US + 0.18%), 2.10%, 02/27/20(b) | | | 250,000 | | | | 250,059,355 | |
2.66%, 04/23/20 | | | 196,750 | | | | 197,214,546 | |
(3 mo. LIBOR US + 0.14%), 2.04%, 05/11/20(b) | | | 168,000 | | | | 168,053,369 | |
1.95%, 10/15/20 | | | 100,000 | | | | 100,049,963 | |
Natixis SA, New York: | | | | | | | | |
2.72%, 04/03/20 | | | 368,500 | | | | 369,197,935 | |
(1 mo. LIBOR US + 0.26%), 2.00%, 05/15/20(b) | | | 144,000 | | | | 144,035,089 | |
(1 mo. LIBOR US + 0.26%), 1.97%, 05/29/20(b) | | | 400,000 | | | | 400,117,680 | |
Nordea Bank AB, New York, 2.35%, 06/03/20 | | | 247,000 | | | | 247,522,464 | |
Nordea Bank Abp, New York(b): | | | | | | | | |
(3 mo. LIBOR US + 0.14%), 2.10%, 09/28/20 | | | 300,000 | | | | 300,087,915 | |
(3 mo. LIBOR US + 0.16%), 2.16%, 10/16/20 | | | 70,000 | | | | 70,027,116 | |
Norinchukin Bank, New York: | | | | | | | | |
2.27%, 01/21/20 | | | 230,000 | | | | 230,065,212 | |
2.20%, 01/29/20 | | | 125,000 | | | | 125,035,358 | |
1.94%, 04/29/20 | | | 125,000 | | | | 125,018,046 | |
Oversea-Chinese Banking Corp. Ltd., New York, 1.95%, 04/16/20 | | | 100,000 | | | | 100,003,266 | |
Skandinaviska Enskilda Banken AB, New York(b): | | | | | | | | |
(3 mo. LIBOR US + 0.15%), 2.24%, 10/02/20 | | | 25,000 | | | | 25,009,275 | |
(3 mo. LIBOR US + 0.15%), 2.24%, 10/05/20 | | | 200,000 | | | | 200,075,224 | |
Standard Chartered Bank, New York: | | | | | | | | |
1.94%, 02/18/20 | | | 190,000 | | | | 190,028,245 | |
(Fed Funds Rate + 0.35%), 1.90%, 02/21/20(b) | | | 145,000 | | | | 145,014,928 | |
1.99%, 05/01/20 | | | 264,000 | | | | 264,083,046 | |
Sumitomo Mitsui Banking Corp, New York, (3 mo. LIBOR US + 0.07%), 2.03%, 06/30/20(b) | | | 367,500 | | | | 367,499,761 | |
Sumitomo Mitsui Trust Bank Ltd., New York(b): | | | | | | | | |
(3 mo. LIBOR US + 0.24%), 2.24%, 01/15/20 | | | 418,000 | | | | 418,028,658 | |
(3 mo. LIBOR US + 0.19%), 2.10%, 02/25/20 | | | 525,000 | | | | 525,127,643 | |
(3 mo. LIBOR US + 0.20%), 2.10%, 05/18/20 | | | 245,000 | | | | 245,137,124 | |
(3 mo. LIBOR US + 0.17%), 2.11%, 07/27/20 | | | 151,400 | | | | 151,433,774 | |
Svenska Handelsbanken, New York, (3 mo. LIBOR US + 0.15%), 2.24%, 10/02/20(b) | | | 200,000 | | | | 200,074,196 | |
Toronto-Dominion Bank, New York: | | | | | | | | |
(Fed Funds Rate + 0.30%), 1.85%, 02/27/20(b) | | | 204,000 | | | | 204,011,351 | |
2.17%, 07/29/20 | | | 265,000 | | | | 265,434,237 | |
(Fed Funds Rate + 0.35%), 1.90%, 08/06/20(b) | | | 50,000 | | | | 50,011,656 | |
(3 mo. LIBOR US + 0.19%), 2.14%, 09/28/20(b) | | | 589,000 | | | | 589,428,786 | |
Westpac Banking Corp., New York, (3 mo. LIBOR US + 0.15%), 2.04%, 12/09/20(b) | | | 200,000 | | | | 200,017,886 | |
| | | | | | | | |
| |
Total Yankee — 27.2%
(Cost — $14,784,026,078) | | | | 14,790,992,164 | |
| | | | | | | | |
| |
Total Certificates of Deposit — 33.2%
(Cost — $18,066,570,667) | | | | 18,074,437,366 | |
| | | | | | | | |
| | |
| 18 | | 2019 BLACKROCK ANNUAL REPORTTO SHAREHOLDERS |
| | |
Schedule of Investments (continued) December 31, 2019 | | Money Market Master Portfolio (Percentages shown are based on Net Assets) |
| | | | | | | | |
| Security | | Par
(000) | | | Value | |
|
| Commercial Paper — 23.3% | |
Alpine Securitization LLC, (1 mo. LIBOR US + 0.17%), 1.96%, 06/25/20(b)(e) | | $ | 55,250 | | | $ | 55,249,976 | |
Antalis SA, 2.29%, 01/22/20(c) | | | 97,000 | | | | 96,892,530 | |
Atlantic Asset Securitization LLC, 2.06%, 01/17/20(c) | | | 100,000 | | | | 99,916,936 | |
Banco Santander SA, 1.98%, 06/26/20(c) | | | 248,500 | | | | 246,240,432 | |
Banque ET Caisse, 2.22%, 04/14/20(c) | | | 100,000 | | | | 99,477,917 | |
Bennington Sark Cap Co., 2.00%, 01/02/20(c) | | | 883,000 | | | | 882,910,181 | |
BPCE(c): | | | | | | | | |
1.94%, 07/31/20 | | | 197,000 | | | | 194,750,424 | |
2.04%, 12/23/20 | | | 456,250 | | | | 447,493,294 | |
Canadian Imperial Bank of Commerce: | | | | | | | | |
2.00%, 01/02/20(c) | | | 290,000 | | | | 289,972,804 | |
(1 mo. LIBOR US + 0.25%), 2.05%, 12/31/20(b) | | | 100,000 | | | | 100,000,000 | |
Cancara Asset Securitisation LLC, 1.95%, 06/09/20(c) | �� | | 65,600 | | | | 65,063,118 | |
Chesham Finance Ltd., 1.60%, 01/07/20(c) | | | 250,000 | | | | 249,944,445 | |
Collateralized Commercial Paper Co. LLC, 2.00%, 01/06/20(c) | | | 175,000 | | | | 174,949,075 | |
Collateralized Commercial Paper Flex Co. LLC, (3 mo. LIBOR US + 0.27%), 2.28%, 01/10/20(b)(e) | | | 173,000 | | | | 173,000,000 | |
Commonwealth Bank of Australia, (3 mo. LIBOR US + 0.15%), 2.09%, 09/21/20(b)(e) | | | 248,000 | | | | 248,000,000 | |
Crown Point Capital Co. LLC(b)(e): | | | | | | | | |
(1 mo. LIBOR US + 0.25%), 1.96%, 02/06/20 | | | 570,000 | | | | 570,000,000 | |
(1 mo. LIBOR US + 0.38%), 2.18%, 08/28/20 | | | 90,000 | | | | 90,055,239 | |
Enbridge, Inc., 2.21%, 01/30/20(c) | | | 252,000 | | | | 251,571,600 | |
Exelon Generation Co. LLC, 1.85%, 01/06/20(c) | | | 70,000 | | | | 69,976,958 | |
Glencove Funding LLC,(1-Week LIBOR + 0.12%), 1.72%, 06/11/20(b)(e) | | | 225,000 | | | | 225,000,000 | |
HSBC Bank PLC(b)(e): | | | | | | | | |
(3 mo. LIBOR US + 0.09%), 1.98%, 05/07/20 | | | 100,000 | | | | 100,013,497 | |
(1 mo. LIBOR US + 0.38%), 2.17%, 09/21/20 | | | 142,000 | | | | 142,050,995 | |
(1 mo. LIBOR US + 0.40%), 2.11%, 10/06/20 | | | 233,000 | | | | 233,085,061 | |
(3 mo. LIBOR US + 0.24%), 2.27%, 10/06/20 | | | 50,000 | | | | 50,041,262 | |
(3 mo. LIBOR US + 0.23%), 2.23%, 10/13/20 | | | 284,000 | | | | 284,218,214 | |
(3 mo. LIBOR US + 0.19%), 2.10%, 12/01/20 | | | 400,000 | | | | 400,143,272 | |
ING US Funding LLC(b)(e): | | | | | | | | |
(3 mo. LIBOR US + 0.09%), 2.19%, 04/01/20 | | | 278,000 | | | | 278,027,283 | |
(3 mo. LIBOR US + 0.17%), 2.10%, 09/23/20 | | | 441,000 | | | | 441,031,139 | |
(3 mo. LIBOR US + 0.20%), 2.17%, 10/19/20 | | | 274,000 | | | | 274,064,417 | |
Kells Funding LLC, 2.06%, 03/04/20(c) | | | 96,000 | | | | 95,691,947 | |
Landesbank Baden-Wurttemberg, New York, 1.95%, 01/03/20(c) | | | 107,800 | | | | 107,786,183 | |
Lexington Parker Capital Co. LLC, 2.00%, 01/02/20(c) | | | 330,000 | | | | 329,968,082 | |
Macquarie Bank Ltd.(b)(e): | | | | | | | | |
(3 mo. LIBOR US + 0.12%), 2.01%, 05/07/20 | | | 131,000 | | | | 131,031,241 | |
(3 mo. LIBOR US + 0.13%), 2.03%, 05/08/20 | | | 200,000 | | | | 200,000,000 | |
(3 mo. LIBOR US + 0.20%), 2.10%, 12/04/20 | | | 248,000 | | | | 248,000,000 | |
National Security Clearing Corp., 3.09%, 01/02/20(c) | | | 250,000 | | | | 249,978,903 | |
Nationwide Building Society(c): | | | | | | | | |
2.02%, 04/01/20(e) | | | 169,000 | | | | 168,162,135 | |
1.96%, 05/26/20 | | | 100,000 | | | | 99,200,483 | |
Nissan Motor Acceptance Corp., 2.00%, 01/07/20(c) | | | 242,000 | | | | 241,914,359 | |
Nordea Bank AB(c): | | | | | | | | |
2.68%, 04/27/20 | | | 131,000 | | | | 130,227,100 | |
2.68%, 04/29/20 | | | 300,000 | | | | 298,200,000 | |
Oversea-Chinese Banking Corp. Ltd., 1.94%, 10/19/20(c) | | | 171,000 | | | | 168,422,479 | |
Ridgefield Funding Co. LLC(c): | | | | | | | | |
2.05%, 02/20/20 | | | 237,000 | | | | 236,378,863 | |
2.07%, 02/24/20 | | | 35,382 | | | | 35,281,997 | |
Royal Bank of Canada(b)(e): | | | | | | | | |
(3 mo. LIBOR US + 0.21%), 2.25%, 01/07/20 | | | 96,000 | | | | 96,002,564 | |
(SOFR + 0.51%), 2.05%, 01/09/20 | | | 283,500 | | | | 283,535,508 | |
(Fed Funds Rate + 0.30%), 1.85%, 03/16/20 | | | 125,000 | | | | 125,012,539 | |
| | | | | | | | |
| Security | | Par
(000) | | | Value | |
|
| Commercial Paper (continued) | |
Royal Bank of Canada (continued): | | | | | | | | |
(Fed Funds Rate + 0.28%), 1.83%, 06/12/20 | | $ | 438,000 | | | $ | 438,018,322 | |
Shell International Finance BV(c): | | | | | | | | |
2.09%, 06/25/20 | | | 40,750 | | | | 40,389,363 | |
2.09%, 06/30/20 | | | 43,000 | | | | 42,608,482 | |
Toyota Credit Canada, Inc.(b): | | | | | | | | |
(1 mo. LIBOR US + 0.17%), 1.87%, 02/20/20 | | | 50,000 | | | | 50,000,000 | |
(1 mo. LIBOR US + 0.17%), 1.87%, 02/28/20 | | | 100,000 | | | | 100,000,000 | |
Toyota Motor Credit Corp.(b): | | | | | | | | |
(3 mo. LIBOR US + 0.03%), 2.03%, 01/07/20 | | | 41,500 | | | | 41,500,050 | |
(3 mo. LIBOR US + 0.03%), 2.03%, 01/08/20 | | | 200,000 | | | | 200,000,000 | |
(1 mo. LIBOR US + 0.17%), 1.87%, 02/27/20 | | | 231,000 | | | | 231,043,899 | |
(1 mo. LIBOR US + 0.21%), 1.92%, 05/05/20 | | | 46,000 | | | | 46,000,000 | |
UBS AG: | | | | | | | | |
2.32%, 04/24/20(c) | | | 241,500 | | | | 240,092,089 | |
(3 mo. LIBOR US + 0.09%), 2.00%, 05/28/20(b)(e) | | | 200,000 | | | | 200,000,000 | |
VW Credit, Inc., 1.97%, 01/07/20(c) | | | 193,000 | | | | 192,931,699 | |
Westpac Banking Corp.(b)(e): | | | | | | | | |
(3 mo. LIBOR US + 0.15%), 2.16%, 01/10/20 | | | 224,000 | | | | 224,007,439 | |
(Fed Funds Rate + 0.26%), 1.81%, 06/08/20 | | | 182,000 | | | | 182,007,471 | |
(3 mo. LIBOR US + 0.15%), 2.04%, 11/25/20 | | | 400,000 | | | | 400,141,196 | |
| | | | | | | | |
| |
Total Commercial Paper — 23.3%
(Cost — $12,703,402,535) | | | | 12,706,674,462 | |
| | | | | |
|
Corporate Bonds — 1.0% | |
|
Auto Components — 0.2% | |
American Honda Finance Corp, (3 mo. LIBOR US + 0.09%), 1.99%, 05/13/20(b) | | | 131,000 | | | | 131,008,715 | |
| | | | | | | | |
|
| Banks — 0.1% | |
Citibank NA, 2.10%, 06/12/20 | | | 64,805 | | | | 64,837,058 | |
| | | | | | | | |
|
| Capital Markets — 0.2% | |
CPPIB Capital, Inc, (SOFR + 0.32%), 1.86%, 12/10/20(b)(e) | | | 92,750 | | | | 92,760,816 | |
| | | | | | | | |
|
| Consumer Finance — 0.2% | |
Caterpillar Financial Services Corp, (3 mo. LIBOR US + 0.10%), 2.00%, 06/19/20(b) | | | 79,000 | | | | 79,007,198 | |
| | | | | | | | |
|
| Diversified Financial Services — 0.1% | |
UBS AG, Stamford, 2.35%, 03/26/20 | | | 50,000 | | | | 50,055,017 | |
| | | | | | | | |
|
| Industrial Conglomerates — 0.2% | |
Siemens Financieringsmaatschappij NV, (3 mo. LIBOR US + 0.34%), 2.23%, 03/16/20(b)(e) | | | 108,145 | | | | 108,194,972 | |
| | | | | | | | |
| |
Total Corporate Bonds — 1.0%
(Cost — $525,678,003) | | | | 525,863,776 | |
| | | | | |
|
Municipal Bonds — 1.6% | |
| | |
Delaware — 0.0% | | | | | | | | |
Rib Floater Trust Various States, RB, Series19-W, 2.15%, 02/04/20(e)(f) | | | 17,095 | | | | 17,095,000 | |
| | | | | | | | |
| | |
| Florida — 0.1% | | | | | | |
Taxable Municipal Funding Trust, RB, VRDN, 1.71%, 01/07/20(e)(f) | | | 30,480 | | | | 30,480,000 | |
| | | | | | | | |
| | |
| Maine — 0.1% | | | | | | |
Maine State Housing Authority, Refunding RB, VRDN, 1.71%, 01/07/20(f) | | | 51,000 | | | | 51,000,000 | |
| | | | | | | | |
| | |
| Minnesota — 0.1% | | | | | | |
Taxable Municipal Funding Trust, RB, VRDN, 2.15%, 01/07/20(e)(f) | | | 33,995 | | | | 33,995,000 | |
| | | | | | | | |
| | | | |
| SCHEDULES OF INVESTMENTS | | | 19 | |
| | |
Schedule of Investments (continued) December 31, 2019 | | Money Market Master Portfolio (Percentages shown are based on Net Assets) |
| | | | | | | | |
| Security | | Par
(000) | | | Value | |
| | |
| New Hampshire — 0.0% | | | | | | |
New Hampshire Business Finance Authority, RB, DrawDown-CJ FMB, Series A, 1.92%, 01/07/20(e)(f) | | $ | 12,500 | | | $ | 12,500,000 | |
| | | | | | | | |
| | |
| New Jersey — 0.5% | | | | | | |
Taxable Municipal Funding Trust, Refunding RB, VRDN(e)(f): | | | | | | | | |
1.71%, 01/07/20 | | | 17,470 | | | | 17,470,000 | |
Taxable, Series2019-014, 2.15%, 01/07/20 | | | 242,515 | | | | 242,515,000 | |
| | | | | | | | |
| | | | | | | 259,985,000 | |
|
| New York — 0.7% | |
Jets Stadium Development LLC(e)(f): | | | | | | | | |
1.85%, 01/07/20 | | | 39,855 | | | | 39,855,000 | |
1.85%, 01/07/20 | | | 29,600 | | | | 29,600,000 | |
VRDN, SeriesA-4B, 1.85%, 01/07/20 | | | 2,500 | | | | 2,500,000 | |
Jets Stadium Finance Secured, 1.85%, 01/07/20(e)(f) | | | 121,295 | | | | 121,295,000 | |
Rib Floater Trust Various States, RB, VRDN, 2.15%, 02/04/20(e)(f) | | | 18,705 | | | | 18,705,000 | |
Taxable Municipal Funding Trust, RB(e)(f): | | | | | | | | |
(AGM), VRDN, 1.71%, 01/07/20 | | | 33,080 | | | | 33,080,000 | |
VRDN, 2.15%, 02/04/20 | | | 61,585 | | | | 61,585,000 | |
VRDN, 2.15%, 02/04/20 | | | 6,300 | | | | 6,300,000 | |
VRDN, 2.15%, 01/07/20 | | | 70,915 | | | | 70,915,000 | |
Taxable Municipal Funding Trust, Refunding RB, VRDN, Taxable, Series2019-008, 2.15%, 01/07/20(e)(f): | | | 7,140 | | | | 7,140,000 | |
| | | | | | | | |
| | | | | | | 390,975,000 | |
| | |
| Texas — 0.0% | | | | | | |
Taxable Municipal Funding Trust, RB, Series2018-001, 1.71%, 01/07/20(e)(f): | | | 18,880 | | | | 18,880,000 | |
| | | | | | | | |
| | |
| West Virginia — 0.1% | | | | | | |
Taxable Municipal Funding Trust, RB, VRDN, 1.71%, 01/07/20(e)(f): | | | 47,840 | | | | 47,840,000 | |
| | | | | | | | |
| |
Total Municipal Bonds — 1.6%
(Cost — $862,750,000) | | | | 862,750,000 | |
| | | | | |
|
Time Deposits — 7.7% | |
Bank of Nova Scotia: | | | | | | | | |
1.70%, 01/02/20 | | | 1,000,000 | | | | 1,000,000,000 | |
1.60%, 01/07/20 | | | 275,000 | | | | 275,000,000 | |
Credit Agricole CIB, New York: | | | | | | | | |
1.53%, 01/02/20 | | | 126,000 | | | | 126,000,000 | |
1.75%, 01/03/20 | | | 550,000 | | | | 550,000,000 | |
Landesbank Hessen-Thueringen Girozentrale, 1.55%, 01/02/20 | | | 84,000 | | | | 84,000,000 | |
Mizuho Bank Ltd., New York, 1.58%, 01/02/20 | | | 880,000 | | | | 880,000,000 | |
National Bank of Canada, 1.70%, 01/03/20 | | | 300,000 | | | | 300,000,000 | |
Natixis, SA, 1.53%, 01/02/20 | | | 100,000 | | | | 100,000,000 | |
Royal Bank of Canada, New York: | | | | | | | | |
1.45%, 01/02/20 | | | 126,000 | | | | 126,000,000 | |
1.55%, 01/02/20 | | | 775,000 | | | | 775,000,000 | |
| | | | | | | | |
| |
Total Time Deposits — 7.7%
(Cost — $4,216,000,000) | | | | 4,216,000,000 | |
| | | | | |
|
| U.S. Treasury Obligations — 3.8% | |
U.S. Treasury Bills(c): | | | | | | | | |
1.61%, 01/21/20 | | | 250,000 | | | | 249,806,680 | |
1.87%, 03/12/20 | | | 270,000 | | | | 269,218,536 | |
U.S. Treasury Notes(b): | | | | | | | | |
(3 mo.Treasury money market yield + 0.22%), 1.75%, 07/31/21 | | | 280,000 | | | | 280,119,826 | |
| | | | | | | | |
| Security | | Par
(000) | | | Value | |
|
| U.S. Treasury Obligations (continued) | |
(3 mo.Treasury money market yield + 0.30%), 1.83%, 10/31/21 | | $ | 1,276,000 | | | $ | 1,278,260,141 | |
| | | | | | | | |
| |
Total U.S. Treasury Obligations — 3.8%
(Cost — $2,075,146,000) | | | | 2,077,405,183 | |
| | | | | |
| |
Total Repurchase Agreements — 29.0%
(Cost — $15,777,500,751) | | | | 15,777,500,751 | |
| | | | | |
| |
Total Investments — 99.6%
(Cost — $54,227,047,956)* | | | | 54,240,631,538 | |
| |
Other Assets Less Liabilities — 0.4% | | | | 203,054,179 | |
| | | | | |
| |
Net Assets — 100.0% | | | $ | 54,443,685,717 | |
| | | | | |
| * | Cost for U.S. federal income tax purposes. |
| (a) | Variable or floating rate security, which interest rate adjusts periodically based on changes in current interest rates and prepayments on the underlying pool of assets. Rate shown is the rate in effect as of period end. |
| (b) | Variable rate security. Rate shown is the rate in effect as of period end. |
| (c) | Rates are discount rates or a range of discount rates as of period end. |
| (d) | Issuer is a U.S. branch of a foreign domiciled bank. |
| (e) | Security exempt from registration pursuant to Rule 144A under the Securities Act of 1933, as amended. These securities may be resold in transactions exempt from registration to qualified institutional investors. |
| (f) | Variable rate security. Rate as of period end and maturity is the date the principal owed can be recovered through demand. |
| | |
| 20 | | 2019 BLACKROCK ANNUAL REPORTTO SHAREHOLDERS |
| | |
Schedule of Investments (continued) December 31, 2019 | | Money Market Master Portfolio |
Repurchase Agreements
| | | | | | | | | | | | | | | | | | | | | | | | | | | | | | | | | | | | |
| | | Repurchase Agreements | | | | | Collateral | |
| Counterparty | | Coupon
Rate | | | Purchase
Date | | | Maturity
Date | | | Par
(000) | | | At Value
(000) | | | Proceeds
Including
Interest | | | | | Position | | Original Par | | | Position
Received
At Value | |
Barclays Capital, Inc. | | | 1.66 | %(a) | | | 12/31/19 | | | | 01/02/20 | | | $ | 144,000 | | | $ | 144,000 | | | $ | 44,013,280 | | | | | Corporate Debt/Obligation, 0.00% to 9.00%, due 1/07/21 to 6/01/67 | | $ | 137,855,000 | | | $ | 151,200,585 | |
| | | 1.69 | (a) | | | 12/31/19 | | | | 01/02/20 | | | | 109,000 | | | | 109,000 | | | | 109,010,234 | | | | | Corporate Debt/Obligation, 2.13% to 7.50%, due 11/03/20 to 12/31/49 | | | 105,307,573 | | | | 114,450,000 | |
| | | 1.89 | (a) | | | 12/31/19 | | | | 01/02/20 | | | | 137,000 | | | | 137,000 | | | | 137,014,385 | | | | | Corporate Debt/Obligation, 2.89% to 9.38%, due 4/15/20 to 3/01/50 | | | 157,149,205 | | | | 153,356,543 | |
| | | 1.99 | (a) | | | 12/31/19 | | | | 04/04/20 | | | | 135,000 | | | | 135,000 | | | | 135,708,938 | | | | | Corporate Debt/Obligation, 2.60% to 5.75%, due 9/01/20 to 9/23/49 | | | 132,441,332 | | | | 141,750,000 | |
| | | | | | | | | | | | | | | | | | | | | | | | | | | | | | | | | | | | |
Total Barclays Capital, Inc. | | | $ | 525,000 | | | | | | | $ | 560,757,128 | |
| | | | | | | | | | | | | | | | | | | | | | | | | | | | | | | | | | | | |
BNP Paribas Securities Corp. | | | 1.64 | (a) | | | 12/31/19 | | | | 01/02/20 | | | | 355,000 | | | | 355,000 | | | | 355,032,344 | | | | | U.S. Treasury Obligation, 0.00% to 7.88%,
due 2/07/20 to 2/25/68 | | | 373,632,033 | | | | 372,024,147 | |
| | | 2.21 | (a) | | | 12/31/19 | | | | 04/04/20 | | | | 100,000 | | | | 100,000 | | | | 100,583,194 | | | | | Corporate Debt/Obligation, 2.08% to 11.50%,
due 7/16/20 to 12/31/49 | | | 109,063,726 | | | | 112,698,330 | |
| | | | | | | | | | | | | | | | | | | | | | | | | | | | | | | | | | | | |
Total BNP Paribas Securities Corp. | | | $ | 455,000 | | | | | | | $ | 484,722,477 | |
| | | | | | | | | | | | | | | | | | | | | | | | | | | | | | | | | | | | |
Citigroup Global Markets, Inc. | | | 1.55 | (b) | | | 12/31/19 | | | | 01/02/20 | | | | 13,000 | | | | 13,000 | | | | 13,001,119 | | | | | U.S. Treasury Obligation, 0.63% to 3.63%,
due 2/15/43 to 8/15/44 | | | 10,870,429 | | | | 13,295,954 | |
| | | 1.57 | | | | 12/31/19 | | | | 01/02/20 | | | | 97,000 | | | | 97,000 | | | | 97,008,461 | | | | | U.S. Government Sponsored Agency Obligation,
0.00% to 8.00%,
due 2/15/28 to 1/25/41 | | | 321,543,576 | | | | 100,078,043 | |
| | | 1.59 | (a) | | | 12/31/19 | | | | 01/02/20 | | | | 100,000 | | | | 100,000 | | | | 100,008,833 | | | | | U.S. Treasury Obligation, 0.00% to 2.88%,
due 1/02/20 to 8/15/28 | | | 99,783,000 | | | | 103,045,911 | |
| | | 2.30 | (a) | | | 12/31/19 | | | | 04/01/20 | | | | 209,000 | | | | 209,000 | | | | 210,228,456 | | | | | Corporate Debt/Obligation, 0.00% to 7.20%,
due 1/17/20 to 12/01/96 | | | 1,213,075,614 | | | | 220,571,231 | |
| | | | | | | | | | | | | | | | | | | | | | | | | | | | | | | | | | | | |
Total Citigroup Global Markets, Inc. | | | $ | 419,000 | | | | | | | $ | 436,991,139 | |
| | | | | | | | | | | | | | | | | | | | | | | | | | | | | | | | | | | | |
Credit Agricole Corp.(g) | | | 1.55 | (b) | | | 12/31/19 | | | | 01/02/20 | | | | 189,000 | | | | 189,000 | | | | 189,016,275 | | | | | U.S. Treasury Obligation, 1.25% to 2.25%,
due 3/31/21 to 11/15/27 | | | 190,940,872 | | | | 192,780,019 | |
Credit Suisse Securities (USA) LLC | | | 2.21 | (a) | | | 12/31/19 | | | | 02/04/20 | | | | 100,000 | | | | 100,000 | | | | 100,214,861 | | | | | Corporate Debt/Obligation, 1.03% to 10.88%, due 8/15/20 to 10/25/59 | | | 300,875,650 | | | | 108,302,266 | |
| | | 2.21 | (a) | | | 12/31/19 | | | | 02/04/20 | | | | 482,000 | | | | 482,000 | | | | 483,035,631 | | | | | Corporate Debt/Obligation, 0.00% to 14.54%,
due 8/15/20 to 10/25/59 | | | 9,608,191,365 | | | | 555,687,897 | |
| | | | | | | | | | | | | | | | | | | | | | | | | | | | | | | | | | | | |
Total Credit Suisse Securities (USA) LLC | | | $ | 582,000 | | | | | | | $ | 663,990,163 | |
| | | | | | | | | | | | | | | | | | | | | | | | | | | | | | | | | | | | |
Deutsche Bank Securities, Inc. | | | 1.46 | | | | 12/31/19 | | | | 01/02/20 | | | | 115,000 | | | | 115,000 | | | | 115,009,328 | | | | | U.S. Treasury Obligation, 0.00%, due 2/15/31 | | | 145,331,600 | | | | 117,300,041 | |
| | | 1.57 | | | | 12/31/19 | | | | 01/02/20 | | | | 1,300,000 | | | | 1,300,000 | | | | 1,300,113,389 | | | | | U.S. Government Sponsored Agency Obligation,
0.13% to 4.50%,
due 4/15/20 to 1/01/50 | | | 1,512,074,758 | | | | 1,337,132,375 | |
| | | | | | | | | | | | | | | | | | | | | | | | | | | | | | | | | | | | |
Total Deutsche Bank Securities, Inc. | | | $ | 1,415,000 | | | | | | | $ | 1,454,432,416 | |
| | | | | | | | | | | | | | | | | | | | | | | | | | | | | | | | | | | | |
Federal Reserve Bank of New York | | | 1.45 | | | | 12/31/19 | | | | 01/02/20 | | | | 1,600,000 | | | | 1,600,000 | | | | 1,600,128,889 | | | | | U.S. Treasury Obligation, 2.25% to 2.75%,
due 4/30/23 to 11/15/27 | | | 1,542,019,900 | | | | 1,600,128,982 | |
| | | | |
| SCHEDULES OF INVESTMENTS | | | 21 | |
| | |
Schedule of Investments (continued) December 31, 2019 | | Money Market Master Portfolio |
Repurchase Agreements (continued)
| | | | | | | | | | | | | | | | | | | | | | | | | | | | | | | | | | | | |
| | | Repurchase Agreements | | | | | Collateral | |
| Counterparty | | Coupon
Rate | | | Purchase
Date | | | Maturity
Date | | | Par
(000) | | | At Value
(000) | | | Proceeds
Including
Interest | | | | | Position | | Original Par | | | Position
Received
At Value | |
HSBC Securities (USA), Inc. | | | 1.66 | %(a) | | | 12/31/19 | | | | 01/02/20 | | | $ | 67,000 | | | $ | 67,000 | | | $ | 67,006,179 | | | | | Corporate Debt/Obligation,
0.13% to 6.90%,
due 2/14/20 to 1/15/87 | | $ | 68,785,927 | | | $ | 70,264,128 | |
| | | 1.74 | (a) | | | 12/31/19 | | | | 01/02/20 | | | | 89,500 | | | | 89,500 | | | | 89,508,652 | | | | | Corporate Debt/Obligation, 2.22% to 7.30%, due 4/15/23 to 12/31/49 | | | 96,007,252 | | | | 98,106,478 | |
| | | | | | | | | | | | | | | | | | | | | | | | | | | | | | | | | | | | |
Total HSBC Securities (USA), Inc. | | | $ | 156,500 | | | | | | | $ | 168,370,606 | |
| | | | | | | | | | | | | | | | | | | | | | | | | | | | | | | | | | | | |
J.P. Morgan Securities LLC | | | 1.55 | | | | 12/31/19 | | | | 01/02/20 | | | | 502,000 | | | | 502,000 | | | | 502,043,228 | | | | | U.S. Treasury Obligation,
0.13% to 3.00%,
due 1/15/23 to 2/15/47 | | | 453,230,800 | | | | 512,040,097 | |
| | | 1.57 | | | | 12/31/19 | | | | 01/02/20 | | | | 435,000 | | | | 435,000 | | | | 435,037,942 | | | | | U.S. Government Sponsored Agency Obligation,
2.50% to 7.00%,
due 10/20/24 to 9/01/69 | | | 1,008,758,307 | | | | 443,700,000 | |
| | | 1.58 | | | | 12/31/19 | | | | 01/02/20 | | | | 74,448 | | | | 74,448 | | | | 74,455,064 | | | | | U.S. Treasury Obligation,
1.88%, due 7/31/26 | | | 75,000,000 | | | | 75,937,500 | |
| | | 1.58 | | | | 12/31/19 | | | | 01/02/20 | | | | 874,088 | | | | 874,088 | | | | 874,164,766 | | | | | U.S. Treasury Obligation,
2.88%, due 8/15/28 | | | 817,017,000 | | | | 891,569,801 | |
| | | 1.58 | | | | 12/31/19 | | | | 01/02/20 | | | | 270,010 | | | | 270,010 | | | | 270,033,872 | | | | | U.S. Treasury Obligation,
2.13%, due 5/31/26 | | | 269,350,000 | | | | 275,410,375 | |
| | | 1.58 | | | | 12/31/19 | | | | 01/02/20 | | | | 24,663 | | | | 24,663 | | | | 24,665,155 | | | | | U.S. Treasury Obligation,
1.88%, due 6/30/26 | | | 25,000,000 | | | | 25,156,250 | |
| | | 1.58 | | | | 12/31/19 | | | | 01/02/20 | | | | 580,335 | | | | 580,335 | | | | 580,386,437 | | | | | U.S. Treasury Obligation,
3.13%, due 11/15/28 | | | 535,089,000 | | | | 591,942,206 | |
| | | 1.58 | | | | 12/31/19 | | | | 01/02/20 | | | | 9,033 | | | | 9,033 | | | | 9,033,881 | | | | | U.S. Treasury Obligation,
2.13%, due 5/15/25 | | | 9,000,000 | | | | 9,213,750 | |
| | | 1.58 | | | | 12/31/19 | | | | 01/02/20 | | | | 395,221 | | | | 395,221 | | | | 395,255,280 | | | | | U.S. Treasury Obligation,
3.00%, due 10/31/25 | | | 375,000,000 | | | | 403,125,000 | |
| | | 1.58 | | | | 12/31/19 | | | | 01/02/20 | | | | 26,287 | | | | 26,287 | | | | 26,289,072 | | | | | U.S. Treasury Obligation,
2.88%, due 7/31/25 | | | 25,000,000 | | | | 26,812,500 | |
| | | 1.58 | | | | 12/31/19 | | | | 01/02/20 | | | | 656,693 | | | | 656,693 | | | | 656,750,290 | | | | | U.S. Treasury Obligation,
2.63%, due 12/31/25 | | | 637,930,000 | | | | 669,826,500 | |
| | | 1.58 | | | | 12/31/19 | | | | 01/02/20 | | | | 221,769 | | | | 221,769 | | | | 221,788,094 | | | | | U.S. Treasury Obligation,
2.63%, due 1/31/26 | | | 213,400,000 | | | | 226,204,000 | |
| | | 1.58 | | | | 12/31/19 | | | | 01/02/20 | | | | 33,572 | | | | 33,572 | | | | 33,574,822 | | | | | U.S. Treasury Obligation,
2.88%, due 5/31/25 | | | 32,229,000 | | | | 34,243,313 | |
| | | 1.58 | | | | 12/31/19 | | | | 01/02/20 | | | | 129,602 | | | | 129,602 | | | | 129,612,939 | | | | | U.S. Treasury Obligation,
1.63%, due 9/30/26 | | | 133,025,000 | | | | 132,193,594 | |
| | | 1.58 | | | | 12/31/19 | | | | 01/02/20 | | | | 431,280 | | | | 431,280 | | | | 431,318,028 | | | | | U.S. Treasury Obligation,
1.63%, due 5/15/26 | | | 443,230,000 | | | | 439,905,775 | |
| | | 1.64 | (a) | | | 12/31/19 | | | | 01/02/20 | | | | 285,000 | | | | 285,000 | | | | 285,025,967 | | | | | U.S. Government Sponsored Agency Obligation,
0.00% to 7.50%,
due 6/02/20 to 6/16/61 | | | 5,907,672,708 | | | | 297,322,915 | |
| | | 1.66 | (a) | | | 12/31/19 | | | | 01/02/20 | | | | 116,000 | | | | 116,000 | | | | 116,010,698 | | | | | Corporate Debt/Obligation,
0.00% to 7.00%,
due 1/09/20 to 9/16/58 | | | 3,898,908,581 | | | | 120,978,710 | |
| | | 1.72 | (a) | | | 12/31/19 | | | | 01/02/20 | | | | 90,000 | | | | 90,000 | | | | 90,008,600 | | | | | Corporate Debt/Obligation,
0.08% to 7.93%,
due 12/21/30 to 12/16/72 | | | 841,433,328 | | | | 96,300,000 | |
| | | 1.89 | (a) | | | 12/31/19 | | | | 01/02/20 | | | | 90,000 | | | | 90,000 | | | | 90,009,450 | | | | | Corporate Debt/Obligation,
1.00% to 11.00%,
due 5/15/21 to 12/31/2500 | | | 523,109,875 | | | | 97,260,995 | |
| | | 3.25 | | | | 12/27/19 | | | | 01/02/20 | | | | 180,075 | | | | 180,075 | | | | 180,173,004 | | | | | U.S. Treasury Obligation,
3.00%, due 11/15/44 | | | 162,726,000 | | | | 183,676,973 | |
| | | 3.25 | | | | 12/27/19 | | | | 01/02/20 | | | | 125,766 | | | | 125,766 | | | | 125,834,055 | | | | | U.S. Treasury Obligation,
2.13%, due 9/30/24 | | | 125,000,000 | | | | 128,281,250 | |
| | | 3.25 | | | | 12/27/19 | | | | 01/02/20 | | | | 351,437 | | | | 351,437 | | | | 351,627,597 | | | | | U.S. Treasury Obligation,
2.25%, due 12/31/24 | | | 348,875,000 | | | | 358,465,980 | |
| | | 3.25 | | | | 12/27/19 | | | | 01/02/20 | | | | 42,722 | | | | 42,722 | | | | 42,744,709 | | | | | U.S. Treasury Obligation,
2.50%, due 2/15/45 | | | 41,900,000 | | | | 43,576,000 | |
| | |
| 22 | | 2019 BLACKROCK ANNUAL REPORTTO SHAREHOLDERS |
| | |
Schedule of Investments (continued) December 31, 2019 | | Money Market Master Portfolio |
Repurchase Agreements (continued)
| | | | | | | | | | | | | | | | | | | | | | | | | | | | | | | | | | | | |
| | | Repurchase Agreements | | | | | Collateral | |
| Counterparty | | Coupon
Rate | | | Purchase
Date | | | Maturity
Date | | | Par
(000) | | | At Value
(000) | | | Proceeds
Including
Interest | | | | | Position | | Original Par | | | Position
Received
At Value | |
J.P. Morgan Securities LLC | | | 1.76 | %(a) | | | 12/31/19 | | | | 01/07/20 | | | $ | 498,000 | | | $ | 498,000 | | | $ | 498,170,427 | | | | | U.S. Government Sponsored Agency Obligation,
0.04% to 7.00%,
due 8/25/22 to 9/16/61 | | $ | 2,695,946,129 | | | $ | 509,805,563 | |
| | | 1.84 | (a) | | | 12/31/19 | | | | 01/07/20 | | | | 755,000 | | | | 755,000 | | | | 755,270,122 | | | | | Corporate Debt/Obligation,
0.00% to 9.75%,
due 5/15/20 to 12/17/59 | | | 3,118,665,470 | | | | 811,860,801 | |
| | | 2.21 | (a) | | | 12/31/19 | | | | 03/31/20 | | | | 175,000 | | | | 175,000 | | | | 175,977,618 | | | | | Corporate Debt/Obligation,
0.00% to 7.50%,
due 9/15/20 to 11/15/61 | | | 356,960,625 | | | | 189,006,132 | |
| | | 2.26 | (a) | | | 12/31/19 | | | | 03/31/20 | | | | 320,000 | | | | 320,000 | | | | 321,828,089 | | | | | Corporate Debt/Obligation,
0.00% to 8.09%,
due 3/18/21 to 3/01/78 | | | 779,663,772 | | | | 344,775,558 | |
| | | 2.31 | (a) | | | 12/31/19 | | | | 03/31/20 | | | | 205,000 | | | | 205,000 | | | | 206,197,029 | | | | | Corporate Debt/Obligation,
2.30% to 8.43%,
due 11/02/20 to 6/25/59 | | | 270,313,540 | | | | 220,728,784 | |
| | | | | | | | | | | | | | | | | | | | | | | | | | | | | | | | | | | | |
Total J.P. Morgan Securities LLC | | | $ | 7,898,001 | | | | | | | $ | 8,159,320,322 | |
| | | | | | | | | | | | | | | | | | | | | | | | | | | | | | | | | | | | |
Merrill Lynch, Pierce, Fenner & Smith, Inc. | | | 1.45 | | | | 12/31/19 | | | | 01/02/20 | | | | 300,000 | | | | 300,000 | | | | 300,024,167 | | | | | U.S. Treasury Obligation,
2.00%, due 4/30/24 | | | 300,861,100 | | | | 306,000,003 | |
| | | 1.55 | | | | 12/31/19 | | | | 01/02/20 | | | | 400,000 | | | | 400,000 | | | | 400,034,444 | | | | | U.S. Treasury Obligation,
1.25% to 2.63%,
due 10/31/21 to 12/31/25 | | | 402,336,600 | | | | 408,000,036 | |
| | | 1.57 | | | | 12/31/19 | | | | 01/02/20 | | | | 120,000 | | | | 120,000 | | | | 120,010,467 | | | | | U.S. Government Sponsored Agency Obligation,
2.75% to 3.00%,
due 1/25/43 to 2/20/46 | | | 127,630,397 | | | | 126,000,000 | |
| | | 1.64 | (a) | | | 12/31/19 | | | | 01/02/20 | | | | 115,000 | | | | 115,000 | | | | 115,010,478 | | | | | U.S. Government Sponsored Agency Obligation,
3.00%, due 1/01/50 | | | 116,470,507 | | | | 118,450,001 | |
| | | 1.94 | (a) | | | 12/31/19 | | | | 02/04/20 | | | | 65,000 | | | | 65,000 | | | | 65,122,597 | | | | | Corporate Debt/Obligation,
3.25% to 7.38%,
due 3/15/24 to 6/25/48 | | | 58,766,121 | | | | 68,250,000 | |
| | | 2.24 | (a) | | | 12/31/19 | | | | 03/05/20 | | | | 240,000 | | | | 240,000 | | | | 240,970,667 | | | | | Corporate Debt/Obligation,
5.54% to 7.49%,
due 4/25/28 to 4/25/49 | | | 287,062,356 | | | | 288,000,001 | |
| | | | | | | | | | | | | | | | | | | | | | | | | | | | | | | | | | | | |
Total Merrill Lynch, Pierce, Fenner & Smith, Inc. | | | $ | 1,240,000 | | | | | | | $ | 1,314,700,041 | |
| | | | | | | | | | | | | | | | | | | | | | | | | | | | | | | | | | | | |
Mizuho Security USA, Inc. | | | 1.69 | (a) | | | 12/31/19 | | | | 01/02/20 | | | | 45,000 | | | | 45,000 | | | | 45,004,225 | | | | | Corporate Debt/Obligation,
2.45% to 4.00%,
due 6/01/34 to 9/15/69 | | | 46,325,643 | | | | 48,150,001 | |
| | | 1.84 | (a) | | | 12/31/19 | | | | 01/02/20 | | | | 30,000 | | | | 30,000 | | | | 30,003,067 | | | | | Corporate Debt/Obligation,
4.00%, due 6/15/35 | | | 29,247,079 | | | | 32,100,001 | |
| | | 2.35 | (a) | | | 12/31/19 | | | | 02/04/20 | | | | 44,000 | | | | 44,000 | | | | 44,100,528 | | | | | Corporate Debt/Obligation,
3.79% to 5.16%,
due 4/10/28 to 9/15/58 | | | 46,624,935 | | | | 47,080,001 | |
| | | | | | | | | | | | | | | | | | | | | | | | | | | | | | | | | | | | |
Total Mizuho Security USA, Inc. | | | $ | 119,000 | | | | | | | $ | 127,330,003 | |
| | | | | | | | | | | | | |
TD Securities (USA) LLC | | | 1.66 | (a) | | | 12/31/19 | | | | 01/02/20 | | | | 75,000 | | | | 75,000 | | | | 75,006,917 | | | | | Corporate Debt/Obligation,
1.65% to 5.40%,
due 3/22/21 to 1/15/49 | | | 76,450,125 | | | | 78,750,573 | |
Wells Fargo Securities LLC | | | 1.57 | | | | 12/31/19 | | | | 01/02/20 | | | | 75,000 | | | | 75,000 | | | | 75,006,542 | | | | | U.S. Government Sponsored Agency Obligation,
2.50% to 5.00%,
due 1/01/32 to 3/01/49 | | | 102,748,097 | | | | 77,250,000 | |
| | | | |
| SCHEDULES OF INVESTMENTS | | | 23 | |
| | |
Schedule of Investments (continued) December 31, 2019 | | Money Market Master Portfolio |
Repurchase Agreements (continued)
| | | | | | | | | | | | | | | | | | | | | | | | | | | | | | | | | | | | |
| | | Repurchase Agreements | | | | | Collateral | |
| Counterparty | | Coupon
Rate | | | Purchase
Date | | | Maturity
Date | | | Par
(000) | | | At Value
(000) | | | Proceeds
Including
Interest | | | | | Position | | Original Par | | | Position
Received
At Value | |
Wells Fargo Securities LLC | | | 1.64 | % | | | 12/31/19 | | | | 01/02/20 | | | $ | 200,000 | | | $ | 200,000 | | | $ | 200,018,222 | | | | | U.S. Treasury Obligation,
0.00%, due 1/06/20 | | $ | 210,225,486 | | | $ | 210,000,000 | |
| | | 1.64 | (a) | | | 12/31/19 | | | | 01/02/20 | | | | 100,000 | | | | 100,000 | | | | 100,009,111 | | | | | Corporate Debt/Obligation,
0.00%, due 1/30/20 | | | 105,243,275 | | | | 105,000,000 | |
| | | 1.66 | (a) | | | 12/31/19 | | | | 01/02/20 | | | | 530,000 | | | | 530,000 | | | | 530,048,878 | | | | | Corporate Debt/Obligation,
0.00% to 6.46%,
due 2/24/20 to 5/15/62 | | | 725,037,470 | | | | 559,654,023 | |
| | | 1.69 | | | | 12/26/19 | | | | 01/02/20 | | | | 70,000 | | | | 70,000 | | | | 70,023,003 | | | | | Corporate Debt/Obligation,
0.00%, due 1/27/20 | | | 72,717,103 | | | | 72,342,296 | |
| | | 1.69 | | | | 12/27/19 | | | | 01/03/20 | | | | 71,000 | | | | 71,000 | | | | 71,023,331 | | | | | Corporate Debt/Obligation,
0.00%, due 1/21/20 | | | 74,717,968 | | | | 74,478,346 | |
| | | 2.13 | | | | 12/20/19 | | | | 03/20/20 | | | | 58,000 | | | | 58,000 | | | | 58,312,282 | | | | | Corporate Debt/Obligation,
2.75%, due 3/15/23 | | | 58,507,577 | | | | 60,900,001 | |
| | | | | | | | | | | | | | | | | | | | | | | | | | | | | | | | | | | | |
Total Wells Fargo Securities LLC | | | $ | 1,104,000 | | | | | | | $ | 1,159,624,666 | |
| | | | | | | | | | | | | | | | | | | | | | | | | | | | | | | | | | | | |
| | | $ | 15,777,501 | | | | | | | $ | 16,342,156,538 | |
| | | | | | | | | | | | | | | | | | | | | | | | | | | | | | | | | | | | |
| | (a) | Variable rate security. Rate as of period end and maturity is the date the principal owed can be recovered through demand. | |
| | (b) | Traded in a joint account. | |
Fair Value Hierarchy as of Period End
Various inputs are used in determining the fair value of investments. For information about the Master Portfolio’s policy regarding valuation of investments, refer to the Notes to Financial Statements.
The following table summarizes the Master Portfolio’s investments categorized in the disclosure hierarchy:
| | | | | | | | | | | | | | | | |
| | | Level 1 | | | Level 2 | | | Level 3 | | | Total | |
Assets: | |
Investments: | |
Short-Term Securities(a) | | $ | — | | | $ | 54,240,631,538 | | | $ | — | | | $ | 54,240,631,538 | |
| | | | | | | | | | | | | | | | |
| | (a) | See above Schedule of Investments for values in each security type. | |
See notes to financial statements.
| | |
| 24 | | 2019 BLACKROCK ANNUAL REPORTTO SHAREHOLDERS |
| | |
Schedule of Investments December 31, 2019 | | Treasury Money Market Master Portfolio (Percentages shown are based on Net Assets) |
| | | | | | | | |
| Security | | Par
(000) | | | Value | |
|
| U.S. Treasury Obligations — 47.8% | |
U.S. Treasury Bills(a): | | | | | | | | |
1.87%, 01/02/20 | | $ | 50,610 | | | $ | 50,610,000 | |
1.56%, 01/07/20 | | | 138,290 | | | | 138,254,736 | |
1.77%, 01/09/20 | | | 243,780 | | | | 243,686,194 | |
2.03%, 01/23/20 | | | 117,305 | | | | 117,163,083 | |
1.77%, 01/30/20 | | | 276,755 | | | | 276,368,175 | |
1.89%, 02/20/20 | | | 107,580 | | | | 107,304,968 | |
1.58%, 02/25/20 | | | 211,710 | | | | 211,208,598 | |
1.89%, 02/27/20 | | | 475,885 | | | | 474,498,588 | |
1.56%, 03/12/20 | | | 14,260 | | | | 14,216,970 | |
1.91%, 03/26/20 | | | 99,500 | | | | 99,063,029 | |
1.56%, 04/02/20 | | | 85,055 | | | | 84,723,498 | |
1.66%, 04/16/20 | | | 41,690 | | | | 41,491,139 | |
1.98%, 04/23/20 | | | 395,265 | | | | 392,875,002 | |
1.65%, 04/30/20 | | | 125,000 | | | | 124,329,167 | |
1.57%, 05/07/20 | | | 105,210 | | | | 104,640,273 | |
1.59%, 05/14/20 | | | 113,050 | | | | 112,397,764 | |
1.61%, 05/28/20 | | | 225,000 | | | | 223,546,453 | |
1.60%, 06/25/20 | | | 230,000 | | | | 228,244,180 | |
1.79%, 09/10/20 | | | 25,295 | | | | 24,985,684 | |
U.S. Treasury Notes: | | | | | | | | |
1.25% - 2.00%, 01/31/20(b) | | | 834,190 | | | | 834,169,855 | |
1.25% - 1.38%, 02/29/20 | | | 138,445 | | | | 138,272,787 | |
1.38%, 03/31/20 | | | 16,790 | | | | 16,762,654 | |
1.13% - 2.38%, 04/30/20 | | | 150,435 | | | | 150,395,931 | |
(3 mo. Treasury money market yield + 0.03%), 1.56%, 04/30/20(c) | | | 146,470 | | | | 146,475,245 | |
1.50% - 3.50%, 05/15/20 | | | 54,890 | | | | 54,898,256 | |
1.38% - 1.50%, 05/31/20 | | | 42,985 | | | | 42,929,473 | |
1.63%, 06/30/20 | | | 2,480 | | | | 2,477,160 | |
| | | | | | | | |
| Security | | Par
(000) | | | Value | |
|
| U.S. Treasury Obligations (continued) | |
(3 mo. Treasury money market yield + 0.04%), 1.57%, 07/31/20(c) | | $ | 250,395 | | | $ | 250,281,645 | |
1.38% - 2.63%, 08/31/20 | | | 87,230 | | | | 87,213,015 | |
2.75%, 09/30/20 | | | 75,000 | | | | 75,621,746 | |
1.63%, 10/15/20 | | | 136,130 | | | | 136,139,630 | |
(3 mo. Treasury money market yield + 0.05%), 1.57%, 10/31/20(c) | | | 50,000 | | | | 49,956,639 | |
2.63%, 11/15/20 | | | 360,055 | | | | 363,163,616 | |
1.63% - 2.00%, 11/30/20 | | | 100,990 | | | | 101,266,525 | |
2.38% - 2.50%, 12/31/20 | | | 25,220 | | | | 25,419,714 | |
(3 mo. Treasury money market yield + 0.12%), 1.64%, 01/31/21(c) | | | 301,250 | | | | 301,128,748 | |
(3 mo. Treasury money market yield + 0.14%), 1.66%, 04/30/21(c) | | | 183,440 | | | | 183,427,687 | |
(3 mo. Treasury money market yield + 0.22%), 1.75%, 07/31/21(c) | | | 495,000 | | | | 494,882,452 | |
(3 mo. Treasury money market yield + 0.30%), 1.83%, 10/31/21(c) | | | 33,945 | | | | 33,981,966 | |
| | | | | | | | |
| |
Total U.S. Treasury Obligations — 47.8%
(Cost — $6,558,472,245) | | | | 6,558,472,245 | |
| | | | | | | | |
| |
Total Repurchase Agreements — 52.7%
(Cost — $7,214,989,999) | | | | 7,214,989,999 | |
| | | | | | | | |
| |
Total Investments — 100.5%
(Cost — $13,773,462,244*) | | | | 13,773,462,244 | |
| |
Liabilities in Excess of Other Assets — (0.5)% | | | | (74,212,970 | ) |
| | | | | |
| |
Net Assets — 100.0% | | | $ | 13,699,249,274 | |
| | | | | |
| * | Cost for U.S. federal income tax purposes. |
| (a) | Rates are discount rates or a range of discount rates as of period end. |
| (b) | Variable or floating rate security, which interest rate adjusts periodically based on changes in current interest rates and prepayments on the underlying pool of assets. Rate shown is the rate in effect as of period end. |
| (c) | Variable rate security. Rate shown is the rate in effect as of period end. |
Repurchase Agreements
| | | | | | | | | | | | | | | | | | | | | | | | | | | | | | | | | | | | |
| | | Repurchase Agreements | | | | | Collateral | |
| Counterparty | | Coupon
Rate | | | Purchase
Date | | | Maturity
Date | | | Par
(000) | | | At Value
(000) | | | Proceeds
Including
Interest | | | | | Position | | Original Par | | | Position
Received At
Value | |
Bank of Nova Scotia | | | 1.55 | % | | | 12/31/19 | | | | 01/02/20 | | | $ | 140,989 | | | $ | 140,989 | | | $ | 141,001,141 | | | | | U.S. Treasury Obligation, 0.13% to 4.25%, due 4/15/20 to 2/15/49 | | $ | 128,653,900 | | | $ | 143,821,204 | |
Barclays Capital, Inc. | | | 1.55 | | | | 12/31/19 | | | | 01/02/20 | | | | 50,000 | | | | 50,000 | | | | 50,004,306 | | | | | U.S. Treasury Obligation, 2.13%, due 5/31/26 | | | 49,912,600 | | | | 51,000,089 | |
BNP Paribas Securities Corp. | | | 1.56 | | | | 12/31/19 | | | | 01/02/20 | | | | 50,000 | | | | 50,000 | | | | 50,004,333 | | | | | U.S. Treasury Obligation,
0.00% to 2.50%,
due 2/27/20 to 8/15/48 | | | 45,148,237 | | | | 51,000,000 | |
Citigroup Global Markets, Inc. | | | 1.55 | (a) | | | 12/31/19 | | | | 01/02/20 | | | | 262,000 | | | | 262,000 | | | | 262,022,561 | | | | | U.S. Treasury Obligation,
0.63% to 3.63%,
due 2/15/43 to 8/15/44 | | | 219,080,971 | | | | 267,964,599 | |
| | | 1.55 | | | | 12/31/19 | | | | 01/02/20 | | | | 265,000 | | | | 265,000 | | | | 265,022,819 | | | | | U.S. Treasury Obligation,
3.00% to 3.38%,
due 8/15/48 to 11/15/48 | | | 221,485,300 | | | | 270,300,062 | |
| | | | | | | | | | | | | | | | | | | | | | | | | | | | | | | | | | | | |
Total Citigroup Global Markets, Inc. | | | $ | 527,000 | | | | | | | $ | 538,264,661 | |
| | | | | | | | | | | | | | | | | | | | | | | | | | | | | | | | | | | | |
Credit Agricole Corp.(c) | | | 1.55 | (a) | | | 12/31/19 | | | | 01/02/20 | | | | 411,000 | | | | 411,000 | | | | 411,035,392 | | | | | U.S. Treasury Obligation,
1.25% to 2.25%,
due 3/31/21 to 11/15/27 | | | 415,220,629 | | | | 419,220,041 | |
Fixed Income Clearing Corporation — SSB | | | 3.50 | | | | 12/03/19 | | | | 01/02/20 | | | | 50,000 | | | | 50,000 | | | | 50,145,833 | | | | | U.S. Treasury Obligation,
3.50%, due 01/02/20 | | | 46,460,000 | | | | 51,002,487 | |
| | | | |
| SCHEDULES OF INVESTMENTS | | | 25 | |
| | |
Schedule of Investments (continued) December 31, 2019 | | Treasury Money Market Master Portfolio |
Repurchase Agreements (continued)
| | | | | | | | | | | | | | | | | | | | | | | | | | | | | | | | | | | | |
| | | Repurchase Agreements | | | | | Collateral | |
| Counterparty | | Coupon
Rate | | | Purchase
Date | | | Maturity
Date | | | Par
(000) | | | At Value
(000) | | | Proceeds
Including
Interest | | | | | Position | | Original Par | | | Position
Received At
Value | |
HSBC Securities (USA), Inc. | | | 1.55 | % | | | 12/31/19 | | | | 01/02/20 | | | $ | 169,000 | | | $ | 169,000 | | | $ | 169,014,553 | | | | | U.S. Treasury Obligation,
0.00% to 2.75%,
due 2/29/20 to 8/15/43 | | $ | 175,220,800 | | | $ | 172,380,043 | |
. | | | 1.55 | (b) | | | 12/31/19 | | | | 01/02/20 | | | | 225,000 | | | | 225,000 | | | | 225,019,375 | | | | | U.S. Treasury Obligation,
1.57% to 2.75%,
due 7/31/20 to 2/15/45 | | | 226,970,700 | | | | 229,500,013 | |
| | | | | | | | | | | | | | | | | | | | | | | | | | | | | | | | | | | | |
Total HSBC Securities (USA), Inc. | | | $ | 394,000 | | | | | | | $ | 401,880,056 | |
| | | | | | | | | | | | | |
J.P. Morgan Securities LLC | | | 1.55 | | | | 12/31/19 | | | | 01/02/20 | | | | 1,075,000 | | | | 1,075,000 | | | | 1,075,092,569 | | | | | U.S. Treasury Obligation,
0.00% to 7.50%,
due 4/30/20 to 11/15/49 | | | 1,059,584,100 | | | | 1,096,500,093 | |
| | | 1.58 | | | | 12/31/19 | | | | 01/02/20 | | | | 216,661 | | | | 216,661 | | | | 216,679,864 | | | | | U.S. Treasury Obligation,
2.25%, due 8/15/27 | | | 212,750,000 | | | | 220,994,063 | |
| | | 1.58 | | | | 12/31/19 | | | | 01/02/20 | | | | 247,508 | | | | 247,508 | | | | 247,529,814 | | | | | U.S. Treasury Obligation,
2.75%, due 2/15/28 | | | 234,300,000 | | | | 252,458,250 | |
| | | 1.58 | | | | 12/31/19 | | | | 01/02/20 | | | | 376,643 | | | | 376,643 | | | | 376,676,098 | | | | | U.S. Treasury Obligation,
1.88%, due 3/31/22 | | | 379,902,000 | | | | 384,175,898 | |
| | | 1.58 | | | | 12/31/19 | | | | 01/02/20 | | | | 686,684 | | | | 686,684 | | | | 686,743,915 | | | | | U.S. Treasury Obligation,
2.25%, due 11/15/27 | | | 677,550,000 | | | | 700,417,313 | |
| | | 1.58 | | | | 12/31/19 | | | | 01/02/20 | | | | 204,412 | | | | 204,412 | | | | 204,429,708 | | | | | U.S. Treasury Obligation,
2.38%, due 5/15/27 | | | 200,000,000 | | | | 208,500,000 | |
| | | 1.58 | | | | 12/31/19 | | | | 01/02/20 | | | | 304,798 | | | | 304,798 | | | | 304,824,794 | | | | | U.S. Treasury Obligation,
2.88%, due 5/15/28 | | | 287,200,000 | | | | 310,894,000 | |
| | | 1.58 | | | | 12/31/19 | | | | 01/02/20 | | | | 103,560 | | | | 103,560 | | | | 103,568,465 | | | | | U.S. Treasury Obligation,
2.88%, due 5/31/25 | | | 99,417,000 | | | | 105,630,563 | |
| | | 1.58 | | | | 12/31/19 | | | | 01/02/20 | | | | 84,735 | | | | 84,735 | | | | 84,742,732 | | | | | U.S. Treasury Obligation,
1.83%, due 10/31/21 | | | 86,000,000 | | | | 86,430,000 | |
| | | 3.20 | | | | 11/27/19 | | | | 01/02/20 | | | | 50,000 | | | | 50,000 | | | | 50,160,306 | | | | | U.S. Treasury Obligation,
3.00%, due 11/15/44 | | | 45,183,000 | | | | 51,000,311 | |
| | | 3.30 | | | | 12/03/19 | | | | 01/02/20 | | | | 50,000 | | | | 50,000 | | | | 50,137,806 | | | | | U.S. Treasury Obligation,
3.00%, due 11/15/44 | | | 45,183,000 | | | | 51,000,311 | |
| | | 3.50 | | | | 12/17/19 | | | | 01/02/20 | | | | 50,000 | | | | 50,000 | | | | 50,078,083 | | | | | U.S. Treasury Obligation,
3.00%, due 11/15/44 | | | 45,183,000 | | | | 51,000,311 | |
| | | | | | | | | | | | | | | | | | | | | | | | | | | | | | | | | | | | |
Total J.P. Morgan Securities LLC | | | $ | 3,450,001 | | | | | | | $ | 3,519,001,113 | |
| | | | | | | | | | | | | |
Merrill Lynch, Pierce, Fenner & Smith, Inc. | | | 1.55 | | | | 12/31/19 | | | | 01/02/20 | | | | 17,000 | | | | 17,000 | | | | 17,001,464 | | | | | U.S. Treasury Obligation,
1.88% to 2.00%,
due 5/31/22 to 10/31/22 | | | 17,170,200 | | | | 17,340,071 | |
Mufg Securities Americas Inc. | | | 1.55 | | | | 12/31/19 | | | | 01/02/20 | | | | 211,000 | | | | 211,000 | | | | 211,018,169 | | | | | U.S. Treasury Obligation,
1.25% to 3.75%,
due 8/31/20 to 8/15/41 | | | 211,169,100 | | | | 215,220,039 | |
Natixis SA | | | 1.55 | % | | | 12/31/19 | | | | 01/02/20 | | | | 575,000 | | | | 575,000 | | | | 575,049,514 | | | | | U.S. Treasury Obligation,
0.13% to 6.38%,
due 7/15/20 to 2/15/49 | | | 538,674,100 | | | | 586,500,079 | |
| | | 1.55 | (b) | | | 12/31/19 | | | | 01/02/20 | | | | 290,000 | | | | 290,000 | | | | 290,024,972 | | | | | U.S. Treasury Obligation,
0.75% to 6.38%,
due 5/15/21 to 2/15/46 | | | 228,046,100 | | | | 295,800,007 | |
| | | | | | | | | | | | | | | | | | | | | | | | | | | | | | | | | | | | |
Total Natixis SA | | | $ | 865,000 | | | | | | | | | | | | | | | $ | 882,300,086 | |
| | | | | | | | | | | | | |
SG Americas Securities LLC | | | 1.55 | | | | 12/31/19 | | | | 01/02/20 | | | | 430,000 | | | | 430,000 | | | | 430,037,028 | | | | | U.S. Treasury Obligation,
0.00%, due 5/15/23 | | | 557,044,812 | | | | 438,600,000 | |
TD Securities (USA) LLC | | | 1.55 | | | | 12/31/19 | | | | 01/02/20 | | | | 190,000 | | | | 190,000 | | | | 190,016,361 | | | | | U.S. Treasury Obligation,
1.75% to 2.13%,
due 11/30/24 to 12/31/26 | | | 191,644,800 | | | | 193,800,058 | |
Wells Fargo Securities LLC | | | 1.55 | | | | 12/31/19 | | | | 01/02/20 | | | | 429,000 | | | | 429,000 | | | | 429,036,942 | | | | | U.S. Treasury Obligation,
0.13% to 2.88%,
due 4/15/22 to 1/31/26 | | | 411,764,600 | | | | 437,580,041 | |
| | | | | | | | | | | | | | | | | | | | | | | | | | | | | | | | | | | | |
Total | | | $ | 7,214,990 | | | | | | | $ | 7,360,029,946 | |
| | | | | | | | | | | | | |
| | (a) | Traded in a joint account. | |
| | (b) | Variable rate security. Rate as of period end and maturity is the date the principal owed can be recovered through demand. | |
| | |
| 26 | | 2019 BLACKROCK ANNUAL REPORTTO SHAREHOLDERS |
| | |
Schedule of Investments (continued) December 31, 2019 | | Treasury Money Market Master Portfolio |
Fair Value Hierarchy as of Period End
Various inputs are used in determining the fair value of investments. For information about the Master Portfolio’s policy regarding valuation of investments, refer to the Notes to Financial Statements.
The following table summarizes the Master Portfolio’s investments categorized in the disclosure hierarchy:
| | | | | | | | | | | | | | | | |
| | | Level 1 | | | Level 2 | | | Level 3 | | | Total | |
Assets: | |
Investments: | |
Short-Term Securities(a) | | $ | — | | | $ | 13,773,462,244 | | | $ | — | | | $ | 13,773,462,244 | |
| | | | | | | | | | | | | | | | |
| | (a) | See above Schedule of Investments for values in each security type. | |
See notes to financial statements.
| | | | |
| SCHEDULES OF INVESTMENTS | | | 27 | |
Statements of Assets and Liabilities
December 31, 2019
| | | | | | | | |
| | | Money Market
Master Portfolio | | | Treasury Money
Market Master
Portfolio | |
|
ASSETS | |
Investments at value — unaffiliated(a) | | $ | 38,463,130,787 | | | $ | 6,558,472,245 | |
Repurchase agreements at value(b) | | | 15,777,500,751 | | | | 7,214,989,999 | |
Cash | | | 101,546,825 | | | | 44,769 | |
Receivables: | |
Investments sold — unaffiliated | | | — | | | | 5,887,297 | |
Interest — unaffiliated | | | 105,245,492 | | | | 11,724,302 | |
| | | | | | | | |
Total assets | | | 54,447,423,855 | | | | 13,791,118,612 | |
| | | | | | | | |
|
LIABILITIES | |
Payables: | |
Investments purchased | | | — | | | | 90,614,058 | |
Investment advisory fees | | | 3,534,719 | | | | 1,176,477 | |
Trustees’ fees | | | 103,017 | | | | 48,208 | |
Other accrued expenses | | | 100,402 | | | | 30,595 | |
| | | | | | | | |
Total liabilities | | | 3,738,138 | | | | 91,869,338 | |
| | | | | | | | |
| | |
NET ASSETS | | $ | 54,443,685,717 | | | $ | 13,699,249,274 | |
| | | | | | | | |
|
NET ASSETS CONSIST OF | |
Investors’ capital | | $ | 54,430,102,135 | | | $ | 13,699,249,274 | |
Net unrealized appreciation (depreciation) | | | 13,583,582 | | | | — | |
| | | | | | | | |
NET ASSETS | | $ | 54,443,685,717 | | | $ | 13,699,249,274 | |
| | | | | | | | |
| | |
(a) Investments at cost — unaffiliated | | $ | 38,449,547,205 | | | $ | 6,558,472,245 | |
(b) Repurchase agreements at cost — unaffiliated | | $ | 15,777,500,751 | | | $ | 7,214,989,999 | |
See notes to financial statements.
| | |
| 28 | | 2019 BLACKROCK ANNUAL REPORTTO SHAREHOLDERS |
Statements of Operations
Year Ended December 31, 2019
| | | | | | | | |
| | | Money Market
Master Portfolio | | | Treasury Money
Market Master
Portfolio | |
|
INVESTMENT INCOME | |
Interest — unaffiliated | | $ | 1,254,372,445 | | | $ | 237,062,858 | |
|
EXPENSES | |
Investment advisory | | | 51,229,211 | | | | 10,816,874 | |
Independent Trustees | | | 420,426 | | | | 150,003 | |
Professional | | | 140,711 | | | | 40,504 | |
| | | | | | | | |
Total expenses | | | 51,790,348 | | | | 11,007,381 | |
Less fees waived and/or reimbursed by the Manager | | | (15,929,900 | ) | | | (3,435,569 | ) |
| | | | | | | | |
Total expenses after fees waived and/or reimbursed | | | 35,860,448 | | | | 7,571,812 | |
| | | | | | | | |
Net investment income | | | 1,218,511,997 | | | | 229,491,046 | |
| | | | | | | | |
|
REALIZED AND UNREALIZED GAIN (LOSS) | |
Net realized gain from investments | | | 658,671 | | | | 1,208,116 | |
Net change in unrealized appreciation (depreciation) on investments | | | 14,197,832 | | | | — | |
| | | | | | | | |
Net realized and unrealized gain | | | 14,856,503 | | | | 1,208,116 | |
| | | | | | | | |
NET INCREASE IN NET ASSETS RESULTING FROM OPERATIONS | | $ | 1,233,368,500 | | | $ | 230,699,162 | |
| | | | | | | | |
See notes to financial statements.
Statements of Changes in Net Assets
| | | | | | | | | | | | | | | | | | | | |
| | | Money Market Master Portfolio | | | | | | Treasury Money Market Master Portfolio | |
| | | Year Ended December 31, | | | | | | Year Ended December 31, | |
| | | 2019 | | | 2018 | | | | | | 2019 | | | 2018 | |
| | | |
INCREASE (DECREASE) IN NET ASSETS | | | | | | | | | | | | | |
| | | |
OPERATIONS | | | | | | | | | | | | | |
Net investment income | | $ | 1,218,511,997 | | | $ | 1,060,900,668 | | | | | | | $ | 229,491,046 | | | $ | 152,172,022 | |
Net realized gain | | | 658,671 | | | | 2,218,840 | | | | | | | | 1,208,116 | | | | 181,799 | |
Net change in unrealized appreciation (depreciation) | | | 14,197,832 | | | | (1,677,441 | ) | | | | | | | — | | | | — | |
| | | | | | | | | | | | | | | | | | | | |
Net increase in net assets resulting from operations | | | 1,233,368,500 | | | | 1,061,442,067 | | | | | | | | 230,699,162 | | | | 152,353,821 | |
| | | | | | | | | | | | | | | | | | | | |
| | | |
CAPITAL TRANSACTIONS | | | | | | | | | | | | | |
Proceeds from contributions | | | 235,125,900,281 | | | | 203,087,934,988 | | | | | | | | 215,732,811,573 | | | | 130,455,316,898 | |
Value of withdrawals | | | (229,255,796,451 | ) | | | (212,943,735,070 | ) | | | | | | | (210,316,698,539 | ) | | | (131,903,567,464 | ) |
| | | | | | | | | | | | | | | | | | | | |
Net increase (decrease) in net assets derived from capital transactions | | | 5,870,103,830 | | | | (9,855,800,082 | ) | | | | | | | 5,416,113,034 | | | | (1,448,250,566 | ) |
| | | | | | | | | | | | | | | | | | | | |
| | | |
NET ASSETS | | | | | | | | | | | | | |
Total increase (decrease) in net assets | | | 7,103,472,330 | | | | (8,794,358,015 | ) | | | | | | | 5,646,812,196 | | | | (1,295,896,745 | ) |
Beginning of year | | | 47,340,213,387 | | | | 56,134,571,402 | | | | | | | | 8,052,437,078 | | | | 9,348,333,823 | |
| | | | | | | | | | | | | | | | | | | | |
End of year | | $ | 54,443,685,717 | | | $ | 47,340,213,387 | | | | | | | $ | 13,699,249,274 | | | $ | 8,052,437,078 | |
| | | | | | | | | | | | | | | | | | | | |
See notes to financial statements.
| | |
| 30 | | 2019 BLACKROCK ANNUAL REPORTTO SHAREHOLDERS |
Financial Highlights
| | | | | | | | | | | | | | | | | | | | |
| | | Money Market Master Portfolio | |
| |
| | | Year Ended December 31, | |
| | | 2019 | | | 2018 | | | 2017 | | | 2016 | | | 2015 | |
|
Total Return | |
Total return | | | 2.45 | % | | | 2.10 | % | | | 1.23 | % | | | 0.63 | % | | | 0.21 | % |
| | | | | | | | | | | | | | | | | | | | |
|
Ratios to Average Net Assets | |
Total expenses | | | 0.10 | % | | | 0.10 | % | | | 0.10 | % | | | 0.10 | % | | | 0.10 | % |
| | | | | | | | | | | | | | | | | | | | |
Total expenses after fees waived and/or reimbursed | | | 0.07 | % | | | 0.07 | % | | | 0.07 | % | | | 0.07 | % | | | 0.07 | % |
| | | | | | | | | | | | | | | | | | | | |
Net investment income | | | 2.38 | % | | | 2.06 | % | | | 1.25 | % | | | 0.60 | % | | | 0.21 | % |
| | | | | | | | | | | | | | | | | | | | |
|
Supplemental Data | |
Net assets, end of year (000) | | $ | 54,443,686 | | | $ | 47,340,213 | | | $ | 56,134,571 | | | $ | 41,223,924 | | | $ | 43,289,154 | |
| | | | | | | | | | | | | | | | | | | | |
See notes to financial statements.
Financial Highlights (continued)
| | | | | | | | | | | | | | | | | | | | |
| | | Treasury Money Market Master Portfolio | |
| |
| | | Year Ended December 31, | |
| | | 2019 | | | 2018 | | | 2017 | | | 2016 | | | 2015 | |
|
Total Return | |
Total return | | | 2.17 | % | | | 1.81 | % | | | 0.84 | % | | | 0.32 | % | | | 0.03 | % |
| | | | | | | | | | | | | | | | | | | | |
|
Ratios to Average Net Assets | |
Total expenses | | | 0.10 | % | | | 0.10 | % | | | 0.10 | % | | | 0.10 | % | | | 0.10 | % |
| | | | | | | | | | | | | | | | | | | | |
Total expenses after fees waived and/or reimbursed | | | 0.07 | % | | | 0.07 | % | | | 0.07 | % | | | 0.07 | % | | | 0.07 | % |
| | | | | | | | | | | | | | | | | | | | |
Net investment income | | | 2.12 | % | | | 1.76 | % | | | 0.87 | % | | | 0.31 | % | | | 0.04 | % |
| | | | | | | | | | | | | | | | | | | | |
|
Supplemental Data | |
Net assets, end of year (000) | | $ | 13,699,249 | | | $ | 8,052,437 | | | $ | 9,348,334 | | | $ | 6,067,065 | | | $ | 3,450,181 | |
| | | | | | | | | | | | | | | | | | | | |
See notes to financial statements.
| | |
| 32 | | 2019 BLACKROCK ANNUAL REPORTTO SHAREHOLDERS |
Notes to Financial Statements
Master Investment Portfolio (“MIP”) is registered under the Investment Company Act of 1940, as amended (the “1940 Act”), as anopen-end management investment company. MIP is organized as a Delaware statutory trust. The financial statements and these accompanying notes relate to two series of MIP. Money Market Master Portfolio and Treasury Money Market Master Portfolio (each, a “ Master Portfolio” and together, the “Master Portfolios”). Each Master Portfolio is classified as diversified.
Treasury Money Market Master Portfolio operates as a “government money market fund” under Rule2a-7 under the 1940 Act. The Master Portfolio is not subject to liquidity fees or temporary suspensions of redemptions due to declines in the Master Portfolio’s weekly liquid assets.
BlackRock Cash Funds: Institutional, the sole feeder fund into Money Market Master Portfolio, prices and transacts its shares at a NAV per share calculated to four decimal places, reflecting market-based values of its portfolio holdings (i.e., at a “floating” NAV).
With respect to Money Market Master Portfolio, the Board of Trustees of MIP (the “Board”) is permitted to impose a liquidity fee of up to 2% of the value of shares redeemed or temporarily restrict redemptions from Money Market Master Portfolio for up to 10 business days during a 90 day period, in the event that such Money Market Master Portfolio’s weekly liquid assets fall below certain thresholds.
The Master Portfolios, together with certain other registered investment companies advised by BlackRock Fund Advisors (“BFA” or the “Manager”) or its affiliates, are included in a complex of equity, multi-asset, index and money market funds referred to as the BlackRock Multi-Asset Complex.
| 2. | SIGNIFICANT ACCOUNTING POLICIES |
The financial statements are prepared in conformity with accounting principles generally accepted in the United States of America (“U.S. GAAP”), which may require management to make estimates and assumptions that affect the reported amounts of assets and liabilities in the financial statements, disclosure of contingent assets and liabilities at the date of the financial statements and the reported amounts of increases and decreases in net assets from operations during the reporting period. Actual results could differ from those estimates. Each Master Portfolio is considered an investment company under U.S. GAAP and follows the accounting and reporting guidance applicable to investment companies. Below is a summary of significant accounting policies:
Investment Transactions and Income Recognition:For financial reporting purposes, investment transactions are recorded on the dates the transactions are executed. Realized gains and losses on investment transactions are determined on the identified cost basis. Interest income, including amortization and accretion of premiums and discounts on debt securities, is recognized on an accrual basis.
Liquidity Fees:Any liquidity fees imposed on the value of shares redeemed in the event that the Money Market Master Portfolio’s weekly liquid assets fall below certain thresholds are recorded aspaid-in-capital. The liquidity fees are collected and retained by the Money Market Master Portfolio for the benefit of the Money Market Master Portfolio’s remaining shareholders.
Indemnifications:In the normal course of business, a Master Portfolio enters into contracts that contain a variety of representations that provide general indemnification. A Master Portfolio’s maximum exposure under these arrangements is unknown because it involves future potential claims against a Master Portfolio, which cannot be predicted with any certainty.
Other:Expenses directly related to a Master Portfolio are charged to that Master Portfolio. Other operating expenses shared by several funds, including other funds managed by the Manager, are prorated among those funds on the basis of relative net assets or other appropriate methods.
| 3. | INVESTMENT VALUATION AND FAIR VALUE MEASUREMENTS |
Investment Valuation Policies (Money Market Master Portfolio): The Master Portfolio’s investments are valued at fair value (also referred to as “market value” within the financial statements) as of the close of trading on the New York Stock Exchange (“NYSE”) (generally 3:00 p.m., Eastern time). U.S. GAAP defines fair value as the price the Master Portfolio would receive to sell an asset or pay to transfer a liability in an orderly transaction between market participants at the measurement date. The Master Portfolio determines the fair values of its financial instruments using various independent dealers or pricing services under policies approved by the Board. The BlackRock Global Valuation Methodologies Committee (the “Global Valuation Committee”) is the committee formed by management to develop global pricing policies and procedures and to oversee the pricing function for all financial instruments.
Investment Valuation Policies(Treasury Money Market Master Portfolio): U.S. GAAP defines fair value as the price the Master Portfolio would receive to sell an asset or pay to transfer a liability in an orderly transaction between market participants at the measurement date. The Master Portfolio’s investments are valued under the amortized cost method which approximates current market value in accordance with Rule2a-7 under the 1940 Act. Under this method, investments are valued at cost when purchased and, thereafter, a constant proportionate accretion of discounts and amortization of premiums are recorded until the maturity of the security. The Master Portfolio seeks to maintain the NAV per share of its feeder funds at $1.00, although there is no assurance that it will be able to do so on a continuing basis.
Fair Value Inputs and Methodologies: The following methods and inputs are used to establish the fair value of the Money Market Master Portfolio’s assets and liabilities:
| | • | | Fixed-income securities for which market quotations are readily available are generally valued using the last available bid prices or current market quotations provided by independent dealers or third party pricing services. Floating rate loan interests are valued at the mean of the bid prices from one or more independent brokers or dealers as obtained from a third party pricing service. Pricing services generally value fixed-income securities assuming orderly transactions of an institutional round lot size, but a fund may hold or transact in such securities in smaller, odd lot sizes. Odd lots may trade at lower prices than institutional round lots. The pricing services may use matrix pricing or valuation models that utilize certain inputs and assumptions to derive values, including transaction data (e.g., recent representative bids and offers), credit quality information, perceived market movements, news, and other relevant information. Certain fixed-income |
| | | | |
| NOTESTO FINANCIAL STATEMENTS | | | 33 | |
Notes to Financial Statements (continued)
| | securities, including asset-backed and mortgage related securities may be valued based on valuation models that consider the estimated cash flows of each tranche of the entity, establish a benchmark yield and develop an estimated tranche specific spread to the benchmark yield based on the unique attributes of the tranche. The amortized cost method of valuation may be used with respect to debt obligations with sixty days or less remaining to maturity unless the Manager determines such method does not represent fair value. |
| | • | | Investments are valued on the basis of prices provided by dealers or pricing services. In determining the value of a particular investment, pricing services may use certain information with respect to transactions in such investments, quotations from dealers, pricing matrixes, market transactions in comparable investments and information with respect to various relationships between investments. |
| | • | | Municipal investments (including commitments to purchase such investments on a “when-issued” basis) are valued on the basis of prices provided by dealers or pricing services. In determining the value of a particular investment, pricing services may use certain information with respect to transactions in such investments, quotations from dealers, pricing matrixes, market transactions in comparable investments and information with respect to various relationships between investments. |
Fair Value Hierarchy: Various inputs are used in determining the fair value of investments. These inputs to valuation techniques are categorized into a fair value hierarchy consisting of three broad levels for financial statement purposes as follows:
| | • | | Level 1 — Unadjusted price quotations in active markets/exchanges for identical assets or liabilities that each Master Portfolio has the ability to access |
| | • | | Level 2 — Other observable inputs (including, but not limited to, quoted prices for similar assets or liabilities in markets that are active, quoted prices for identical or similar assets or liabilities in markets that are not active, inputs other than quoted prices that are observable for the assets or liabilities (such as interest rates, yield curves, volatilities, prepayment speeds, loss severities, credit risks and default rates) or other market–corroborated inputs) |
| | • | | Level 3 — Unobservable inputs based on the best information available in the circumstances, to the extent observable inputs are not available (including the Global Valuation Committee’s assumptions used in determining the fair value of investments) |
The hierarchy gives the highest priority to unadjusted quoted prices in active markets for identical assets or liabilities (Level 1 measurements) and the lowest priority to unobservable inputs (Level 3 measurements). Accordingly, the degree of judgment exercised in determining fair value is greatest for instruments categorized in Level 3. The inputs used to measure fair value may fall into different levels of the fair value hierarchy. In such cases, for disclosure purposes, the fair value hierarchy classification is determined based on the lowest level input that is significant to the fair value measurement in its entirety. The categorization of a value determined for investments is based on the pricing transparency of the investments and is not necessarily an indication of the risks associated with investing in those securities.
| 4. | SECURITIES AND OTHER INVESTMENTS |
Repurchase Agreements: Repurchase agreements are commitments to purchase a security from a counterparty who agrees to repurchase the same security at a mutually agreed upon date and price. On a daily basis, the counterparty is required to maintain eligible collateral subject to the agreement and in value no less than the agreed upon repurchase amount. Repurchase agreements may be traded bilaterally, in atri-party arrangement or may be centrally cleared through a sponsoring agent. Subject to the custodial undertaking associated with atri-party repurchase arrangement and for centrally cleared repurchase agreements, a third party custodian maintains accounts to hold collateral for a fund and its counterparties. Typically, a fund and counterparty are not permitted to sell,re-pledge or use the collateral absent a default by the counterparty or a fund, respectively. A fund, along with other registered investment companies advised by the Manager, may transfer uninvested cash into a single joint trading account which is then invested in one or more repurchase agreements.
In the event the counterparty defaults and the fair value of the collateral declines, a fund could experience losses, delays and costs in liquidating the collateral.
Repurchase agreements are entered into by a fund under Master Repurchase Agreements (each, an “MRA”). The MRA permits a fund, under certain circumstances including an event of default (such as bankruptcy or insolvency), to offset payables and/or receivables with collateral held by and/or posted to the counterparty. As a result, one single net payment is created. Bankruptcy or insolvency laws of a particular jurisdiction may impose restrictions on or prohibitions against such a right of offset in the event of the MRA counterparty’s bankruptcy or insolvency. Based on the terms of the MRA, a fund receives securities as collateral with a market value in excess of the repurchase price at maturity. Upon a bankruptcy or insolvency of the MRA counterparty, a fund would recognize a liability with respect to such excess collateral. The liability reflects a fund’s obligation under bankruptcy law to return the excess to the counterparty.
| 5. | INVESTMENT ADVISORY AGREEMENT AND OTHER TRANSACTIONS WITH AFFILIATES |
Investment Advisory:MIP, on behalf of the Master Portfolios, entered into an Investment Advisory Agreement with the Manager, the Master Portfolios’ investment adviser and an indirect, wholly-owned subsidiary of BlackRock, Inc. (“BlackRock”), to provide investment advisory services. The Manager is responsible for the management of each Master Portfolio’s portfolio and provides the personnel, facilities, equipment and certain other services necessary to the operations of each Master Portfolio.
For such services, each Master Portfolio pays the Manager a monthly fee at an annual rate equal to 0.10% of the average daily value of each Master Portfolio’s net assets.
Administration: MIP, on behalf of the Master Portfolios, entered into an Administration Agreement with BlackRock Advisors, LLC (“BAL”), which has agreed to provide general administrative services (other than investment advice and related portfolio activities). BAL has agreed to bear all of the Master Portfolios’ ordinary operating expenses, excluding, generally, investment advisory fees, distribution fees, brokerage and other expenses related to the execution of portfolio transactions, extraordinary expenses and certain other expenses which are borne by the Master Portfolios.
| | |
| 34 | | 2019 BLACKROCK ANNUAL REPORTTO SHAREHOLDERS |
Notes to Financial Statements (continued)
BAL is not entitled to compensation for providing administration services to the Master Portfolios, for so long as BAL is entitled to compensation for providing administration services to corresponding feeder funds that invest substantially all of their assets in the Master Portfolios, or BAL (or an affiliate) receives investment advisory fees from the Master Portfolios.
Expense Waivers and Reimbursements: The Manager contractually agreed to waive a portion of its investment advisory fees equal to the annual rate of 0.03% of the average daily value of each Master Portfolio’s net assets through April 30, 2020. These amounts are included in fees waived and/or reimbursed by the Manager in the Statements of Operations. For the year ended December 31, 2019, the amounts waived were as follows:
| | | | |
Money Market Master Portfolio | | $ | 15,368,763 | |
Treasury Money Market Master Portfolio | | | 3,245,062 | |
The Manager has also voluntarily agreed to waive a portion of their respective investment advisory fees to enable the feeders that invest in the Master Portfolios to maintain minimum levels of daily net investment income if applicable. The Manager may discontinue the voluntary waiver at any time. For the year ended December 31, 2019, there were no fees waived and/or reimbursed by the Manager under this agreement.
The fees and expenses of MIP’s Trustees who are not “interested persons” of MIP, as defined in the 1940 Act (“Independent Trustees”), counsel to the Independent Trustees and the Master Portfolios’ independent registered public accounting firm (together, the “independent expenses”) are paid directly by the Master Portfolios. BAL has contractually agreed to reimburse the Master Portfolios or provide an offsetting credit against the administration fees paid by the Master Portfolios in an amount equal to these independent expenses through April 30, 2020. These amounts are included in fees waived and/or reimbursed by the Manager in the Statements of Operations. For the year ended December 31, 2019, the amounts waived were as follows:
| | | | |
Money Market Master Portfolio | | $ | 561,137 | |
Treasury Money Market Master Portfolio | | | 190,507 | |
Interfund Lending: In accordance with an exemptive order (the “Order”) from the U.S. Securities and Exchange Commission (“SEC”), each Master Portfolio may participate in a joint lending and borrowing facility for temporary purposes (the “Interfund Lending Program”), subject to compliance with the terms and conditions of the Order, and to the extent permitted by each Master Portfolio’s investment policies and restrictions. Each Master Portfolio is currently permitted to borrow and lend under the Interfund Lending Program.
A lending BlackRock fund may lend in aggregate up to 15% of its net assets, but may not lend more than 5% of its net assets to any one borrowing fund through the Interfund Lending Program. A borrowing BlackRock fund may not borrow through the Interfund Lending Program or from any other source more than 33 1/3% of its total assets (or any lower threshold provided for by the fund’s investment restrictions). If a borrowing BlackRock fund’s total outstanding borrowings exceed 10% of its total assets, each of its outstanding interfund loans will be subject to collateralization of at least 102% of the outstanding principal value of the loan. All interfund loans are for temporary or emergency purposes and the interest rate to be charged will be the average of the highest current overnight repurchase agreement rate available to a lending fund and the bank loan rate, as calculated according to a formula established by the Board.
During the year ended December 31, 2019, the Master Portfolios did not participate in the Interfund Lending Program.
Trustees and Officers:Certain Trustees and/or officers of MIP are directors and/or officers of BlackRock or its affiliates.
Other Transactions:The Master Portfolios may purchase securities from, or sell securities to, an affiliated fund provided the affiliation is due solely to having a common investment adviser, common officers, or common trustees. For the year ended December 31, 2019, the purchase and sale transactions and any net realized gains (losses) with an affiliated fund in compliance with Rule17a-7 under the 1940 Act were as follows:
| | | | | | | | | | | | |
| | | Purchases | | | Sales | | | Realized Gain (Loss) | |
Money Market Master Portfolio | | $ | — | | | $ | 120,731,729 | | | $ | — | |
Treasury Money Market Master Portfolio is classified as a partnership for U.S. federal income tax purposes. As such, each investor in the Master Portfolio is treated as the owner of its proportionate share of net assets, income, expenses and realized and unrealized gains and losses of the Master Portfolio. Therefore, no U.S. federal income tax provision is required. It is intended that the Master Portfolio’s assets will be managed so an investor in the Master Portfolio can satisfy the requirements of Subchapter M of the Internal Revenue Code of 1986, as amended. Treasury Money Market Master Portfolio files U.S. federal and various state and local tax returns. No income tax returns are currently under examination. The statute of limitations on the Master Portfolio’s U.S. federal tax returns generally remains open for each of the four years ended December 31, 2019. The statutes of limitations on the Master Portfolio’s state and local tax returns may remain open for an additional year depending upon the jurisdiction.
Management has analyzed tax laws and regulations and their application to the Treasury Money Market Master Portfolio as of December 31, 2019, inclusive of the open tax return years, and does not believe that there are any uncertain tax positions that require recognition of a tax liability in the Master Portfolio’s financial statements.
Money Market Master Portfolio is disregarded as an entity separate from its owner for tax purposes. As such, the owner of the Master Portfolio is treated as the owner of the net assets, income, expenses and realized and unrealized gains and losses of the Master Portfolio. Therefore, no U.S. federal income tax provision is required. It is intended that the Master Portfolio’s assets will be managed so the owner of the Master Portfolio can satisfy the requirements of Subchapter M of the Internal Revenue Code of 1986, as amended.
| | | | |
| NOTESTO FINANCIAL STATEMENTS | | | 35 | |
Notes to Financial Statements (continued)
Many municipalities insure repayment of their bonds, which may reduce the potential for loss due to credit risk. The market value of these bonds may fluctuate for other reasons, including market perception of the value of such insurance, and there is no guarantee that the insurer will meet its obligation.
Inventories of municipal bonds held by brokers and dealers may decrease, which would lessen their ability to make a market in these securities. Such a reduction in market making capacity could potentially decrease a Master Portfolio’s ability to buy or sell bonds. As a result, a Master Portfolio may sell a security at a lower price, sell other securities to raise cash, or give up an investment opportunity, any of which could have a negative impact on performance. If a Master Portfolio needed to sell large blocks of bonds, those sales could further reduce the bonds’ prices and impact performance.
In the normal course of business, certain Master Portfolios invest in securities or other instruments and may enter into certain transactions, and such activities subject each Master Portfolio to various risks, including among others, fluctuations in the market (market risk) or failure of an issuer to meet all of its obligations. The value of securities or other instruments may also be affected by various factors, including, without limitation: (i) the general economy; (ii) the overall market as well as local, regional or global political and/or social instability; (iii) regulation, taxation or international tax treaties between various countries; or (iv) currency, interest rate and price fluctuations. Each Master Portfolio’s prospectus provides details of the risks to which each Master Portfolio is subject.
Certain obligations held by the Money Market Master Portfolio have a credit enhancement or liquidity feature that may, under certain circumstances, provide for repayment of principal and interest on the obligation when due. These enhancements, which may include letters of credit,stand-by bond purchase agreements and/or third party insurance, are issued by financial institutions. The value of the obligations may be affected by changes in creditworthiness of the entities that provide the credit enhancements or liquidity features. The Money Market Master Portfolio monitors its exposure by reviewing the creditworthiness of the issuers, as well as the financial institutions issuing the credit enhancements and by limiting the amount of holdings with credit enhancements from one financial institution.
Certain affiliates indirectly invest in the Master Portfolios through the SL Agency Shares of BlackRock Cash Funds. As of period end, these affiliated investors represent a significant portion of the net assets of Money Market Master Portfolio and Treasury Money Market Master Portfolio.
Counterparty Credit Risk:The Master Portfolios may be exposed to counterparty credit risk, or the risk that an entity may fail to or be unable to perform on its commitments related to unsettled or open transactions. The Master Portfolios manage counterparty credit risk by entering into transactions only with counterparties that the Manager believes have the financial resources to honor their obligations and by monitoring the financial stability of those counterparties. Financial assets, which potentially expose the Master Portfolios to market, issuer and counterparty credit risks, consist principally of financial instruments and receivables due from counterparties. The extent of the Master Portfolios’ exposure to market, issuer and counterparty credit risks with respect to these financial assets is approximately their value recorded in the Statements of Assets and Liabilities, less any collateral held by the Master Portfolios.
Management has evaluated the impact of all subsequent events on the Master Portfolios through the date the financial statements were issued and has determined that there were no subsequent events requiring adjustment or additional disclosure in the financial statements.
| | |
| 36 | | 2019 BLACKROCK ANNUAL REPORTTO SHAREHOLDERS |
Report of Independent Registered Public Accounting Firm
To the Board of Trustees of
Master Investment Portfolio and Investors of Money Market Master Portfolio and Treasury Money Market Master Portfolio
Opinions on the Financial Statements
We have audited the accompanying statements of assets and liabilities, including the schedules of investments, of Money Market Master Portfolio and Treasury Money Market Master Portfolio (two of the series constituting Master Investment Portfolio, hereafter collectively referred to as the “Master Portfolios”) as of December 31, 2019, the related statements of operations for the year ended December 31, 2019, the statements of changes in net assets for each of the two years in the period ended December 31, 2019, including the related notes, and the financial highlights for each of the five years in the period ended December 31, 2019 (collectively referred to as the “financial statements”). In our opinion, the financial statements present fairly, in all material respects, the financial position of each of the Master Portfolios as of December 31, 2019, the results of each of their operations for the year then ended, the changes in each of their net assets for each of the two years in the period ended December 31, 2019 and each of the financial highlights for each of the five years in the period ended December 31, 2019 in conformity with accounting principles generally accepted in the United States of America.
Basis for Opinions
These financial statements are the responsibility of the Master Portfolios’ management. Our responsibility is to express an opinion on the Master Portfolios’ financial statements based on our audits. We are a public accounting firm registered with the Public Company Accounting Oversight Board (United States) (“PCAOB”) and are required to be independent with respect to the Master Portfolios in accordance with the U.S. federal securities laws and the applicable rules and regulations of the Securities and Exchange Commission and the PCAOB.
We conducted our audits of these financial statements in accordance with the standards of the PCAOB. Those standards require that we plan and perform the audit to obtain reasonable assurance about whether the financial statements are free of material misstatement, whether due to error or fraud.
Our audits included performing procedures to assess the risks of material misstatement of the financial statements, whether due to error or fraud, and performing procedures that respond to those risks. Such procedures included examining, on a test basis, evidence regarding the amounts and disclosures in the financial statements. Our audits also included evaluating the accounting principles used and significant estimates made by management, as well as evaluating the overall presentation of the financial statements. Our procedures included confirmation of securities owned as of December 31, 2019 by correspondence with the custodian and brokers; when replies were not received from brokers, we performed other auditing procedures. We believe that our audits provide a reasonable basis for our opinions.
/s/PricewaterhouseCoopers LLP
Philadelphia, Pennsylvania
February 14, 2020
We have served as the auditor of one or more BlackRock investment companies since 2000.
| | | | |
| REPORTOF INDEPENDENT REGISTERED PUBLIC ACCOUNTING FIRM | | | 37 | |
Trustee and Officer Information
| | | | | | | | |
Independent Trustees (a) |
| | | | | |
Name
Year of Birth (b) | | Position(s) Held
(Length of Service) (c) | | Principal Occupation(s) During Past Five Years | | Number of BlackRock-Advised
Registered Investment Companies
(“RICs”) Consisting of
Investment Portfolios
(“Portfolios”) Overseen | | Public Company and
Other Investment Company
Directorships Held During
Past Five Years |
Mark Stalnecker 1951 | | Chair of the Board (Since 2019 and Trustee (Since 2015) | | Chief Investment Officer, University of Delaware from 1999 to 2013; Trustee and Chair of the Finance and Investment Committees, Winterthur Museum and Country Estate from 2005 to 2016; Member of the Investment Committee, Delaware Public Employees’ Retirement System since 2002; Member of the Investment Committee, Christiana Care Health System from 2009 to 2017; Member of the Investment Committee, Delaware Community Foundation from 2013 to 2014; Director and Chair of the Audit Committee, SEI Private Trust Co. from 2001 to 2014. | | 37 RICs consisting of 177 Portfolios | | None |
Bruce R. Bond 1946 | | Trustee (Since 2019) | | Board Member, Amsphere Limited (software) since 2018; Trustee and Member of the Governance Committee, State Street Research Mutual Funds from 1997 to 2005; Board Member of Governance, Audit and Finance Committee, Avaya Inc. (computer equipment) from 2003 to 2007. | | 37 RICs consisting of 177 Portfolios | | None |
Susan J. Carter 1956 | | Trustee (Since 2016) | | Director, Pacific Pension Institute from 2014 to 2018; Advisory Board Member, Center for Private Equity and Entrepreneurship at Tuck School of Business since 1997; Senior Advisor, Commonfund Capital, Inc. (“CCI”) (investment adviser) in 2015; Chief Executive Officer, CCI from 2013 to 2014; President & Chief Executive Officer, CCI from 1997 to 2013; Advisory Board Member, Girls Who Invest from 2015 to 2018 and Board Member thereof since 2018; Advisory Board Member, Bridges Fund Management since 2016; Trustee, Financial Accounting Foundation since 2017; Practitioner Advisory Board Member, Private Capital Research Institute (“PCRI”) since 2017. | | 37 RICs consisting of 177 Portfolios | | None |
Collette Chilton 1958 | | Trustee (Since 2015) | | Chief Investment Officer, Williams College since 2006; Chief Investment Officer, Lucent Asset Management Corporation from 1998 to 2006. | | 37 RICs consisting of 177 Portfolios | | None |
Neil A. Cotty 1954 | | Trustee (Since 2016) | | Bank of America Corporation from 1996 to 2015, serving in various senior finance leadership roles, including Chief Accounting Officer from 2009 to 2015, Chief Financial Officer of Global Banking, Markets and Wealth Management from 2008 to 2009, Chief Accounting Officer from 2004 to 2008, Chief Financial Officer of Consumer Bank from 2003 to 2004, Chief Financial Officer of Global Corporate Investment Bank from 1999 to 2002. | | 37 RICs consisting of 177 Portfolios | | None |
Lena G. Goldberg 1949 | | Trustee (Since 2019) | | Senior Lecturer, Harvard Business School, since 2008; Director, Charles Stark Draper Laboratory, Inc. since 2013; FMR LLC/Fidelity Investments (financial services) from 1996 to 2008, serving in various senior roles including Executive Vice President — Strategic Corporate Initiatives and Executive Vice President and General Counsel; Partner, Sullivan & Worcester LLP from 1985 to 1996 and Associate thereof from 1979 to 1985. | | 37 RICs consisting of 177 Portfolios | | None |
Robert M. Hernandez 1944 | | Trustee (Since 2019) | | Director, Vice Chairman and Chief Financial Officer of USX Corporation (energy and steel business) from 1991 to 2001; Director andnon-executive Chairman, RTI International Metals, Inc. from 1990 to 2015; Director, TE Connectivity (electronics) from 2006 to 2012. | | 37 RICs consisting of 177 Portfolios | | Chubb Limited (insurance company); Eastman Chemical Company |
| | |
| 38 | | 2019 BLACKROCK ANNUAL REPORTTO SHAREHOLDERS |
Trustee and Officer Information (continued)
| | | | | | | | |
Independent Trustees (a)(continued) |
| | | | | |
Name
Year of Birth (b) | | Position(s) Held
(Length of Service) (c) | | Principal Occupation(s) During Past Five Years | | Number of BlackRock-Advised
Registered Investment Companies
(“RICs”) Consisting of
Investment Portfolios
(“Portfolios”) Overseen | | Public Company and
Other Investment Company
Directorships Held During
Past Five Years |
Henry R. Keizer 1956 | | Trustee (Since 2019) | | Director, Park Indemnity Ltd. (captive insurer) since 2010; Director, MUFG Americas Holdings Corporation and MUFG Union Bank, N.A. (financial and bank holding company) from 2014 to 2016; Director, American Institute of Certified Public Accountants from 2009 to 2011; Director, KPMG LLP (audit, tax and advisory services) from 2004 to 2005 and 2010 to 2012; Director, KPMG International in 2012, Deputy Chairman and Chief Operating Officer thereof from 2010 to 2012 and U.S. Vice Chairman of Audit thereof from 2005 to 2010; Global Head of Audit, KPMGI (consortium of KPMG firms) from 2006 to 2010; Director, YMCA of Greater New York from 2006 to 2010. | | 37 RICs consisting of 177 Portfolios | | Hertz Global Holdings (car rental); Montpelier Re Holdings, Ltd. (publicly held property and casualty reinsurance) from 2013 until 2015; Sealed Air Corp. (packaging); WABCO (commercial vehicle safety systems) |
Cynthia A. Montgomery 1952 | | Trustee (Since 2009) | | Professor, Harvard Business School since 1989. | | 37 RICs consisting of 177 Portfolios | | Newell Rubbermaid, Inc. (manufacturing) |
Donald C. Opatrny 1952 | | Trustee (Since 2019) | | Trustee, Vice Chair, Member of the Executive Committee and Chair of the Investment Committee, Cornell University since 2004; President, Trustee and Member of the Investment Committee, The Aldrich Contemporary Art Museum from 2007 to 2014; Member of the Board and Investment Committee, University School from 2007 to 2018; Member of the Investment Committee, Mellon Foundation from 2009 to 2015; Trustee, Artstor (a Mellon Foundation affiliate) from 2010 to 2015; President and Trustee, the Center for the Arts, Jackson Hole from 2011 to 2018; Director, Athena Capital Advisors LLC (investment management firm) since 2013; Trustee and Chair of the Investment Committee, Community Foundation of Jackson Hole since 2014; Member of Affordable Housing Supply Board of Jackson, Wyoming since 2018; Member, Investment Funds Committee, State of Wyoming since 2017; Trustee, Phoenix Art Museum since 2018. | | 37 RICs consisting of 177 Portfolios | | None |
Joseph P. Platt 1947 | | Trustee (Since 2009) | | General Partner, Thorn Partners, LP (private investments) since 1998; Director, WQED Multi-Media (public broadcastingnot-for-profit) since 2001; Chair, Basic Health International(non-profit) since 2015. | | 37 RICs consisting of 177 Portfolios | | Greenlight Capital Re, Ltd. (reinsurance company); Consol Energy Inc. |
Kenneth L. Urish 1951 | | Trustee (Since 2009) | | Managing Partner, Urish Popeck & Co., LLC (certified public accountants and consultants) since 1976; Past-Chairman of the Professional Ethics Committee of the Pennsylvania Institute of Certified Public Accountants and Committee Member thereof since 2007; Member of External Advisory Board, The Pennsylvania State University Accounting Department since founding in 2001; Principal, UP Strategic Wealth Investment Advisors, LLC since 2013; Trustee, The Holy Family Institute from 2001 to 2010; President and Trustee, Pittsburgh Catholic Publishing Associates from 2003 to 2008; Director,Inter-Tel from 2006 to 2007. | | 37 RICs consisting of 177 Portfolios | | None |
Claire A. Walton 1957 | | Trustee (Since 2016) | | Chief Operating Officer and Chief Financial Officer of Liberty Square Asset Management, LP from 1998 to 2015; General Partner of Neon Liberty Capital Management, LLC since 2003; Director, Boston Hedge Fund Group from 2009 to 2018; Director, Woodstock Ski Runners since 2013; Director, Massachusetts Council on Economic Education from 2013 to 2015. | | 37 RICs consisting of 177 Portfolios | | None |
| | | | |
| TRUSTEEAND OFFICER INFORMATION | | | 39 | |
Trustee and Officer Information (continued)
| | | | | | | | |
Interested Trustees (a)(d) |
| | | | | |
Name
Year of Birth (b) | | Position(s) Held
(Length of Service) (c) | | Principal Occupation(s) During Past Five Years | | Number of BlackRock-Advised
Registered Investment Companies
(“RICs”) Consisting of
Investment Portfolios
(“Portfolios”) Overseen | | Public Company and
Other Investment Company
Directorships Held During
Past Five Years |
Robert Fairbairn 1965 | | Trustee (Since 2018) | | Vice Chairman of BlackRock, Inc. since 2019; Member of BlackRock’s Global Executive and Global Operating Committees;Co-Chair of BlackRock’s Human Capital Committee; Senior Managing Director of BlackRock, Inc. from 2010 to 2019; oversaw BlackRock’s Strategic Partner Program and Strategic Product Management Group from 2012 to 2019; Member of the Board of Managers of BlackRock Investments, LLC from 2011 to 2018; Global Head of BlackRock’s Retail and iShares® businesses from 2012 to 2016. | | 123 RICs consisting of 287 Portfolios | | None |
John M. Perlowski (e) 1964 | | Trustee (Since 2015); President and Chief Executive Officer (Since 2010) | | Managing Director of BlackRock, Inc. since 2009; Head of BlackRock Global Accounting and Product Services since 2009; Advisory Director of Family Resource Network (charitable foundation) since 2009. | | 124 RICs consisting of 288 Portfolios | | None |
(a) The address of each Trustee is c/o BlackRock, Inc., 55 East 52nd Street, New York, New York 10055. (b) Independent Trustees serve until their resignation, retirement, removal or death, or until December 31 of the year in which they turn 75. The Board may determine to extend the terms of Independent Trustees on acase-by-case basis, as appropriate. (c) In connection with the acquisition of Barclays Global Investors by BlackRock, Inc. in December 2009, certain Independent Trustees were elected to the Board. Furthermore, effective January 1, 2019, three BlackRock Fund Complexes were realigned and consolidated into two BlackRock Fund Complexes. As a result, although the chart shows the year that each Independent Trustee joined the Board, certain Independent Trustees first became members of the boards of other BlackRock-advised Funds or legacy BlackRock funds as follows: Bruce R. Bond, 2005; Robert M. Hernandez, 1996; Cynthia A. Montgomery, 1994; Joseph P. Platt, 1999; Kenneth L. Urish, 1999; Lena G. Goldberg, 2016; Henry R. Keizer, 2016; Donald C. Opatrny, 2015. (d) Mr. Fairbairn and Mr. Perlowski are both “interested persons,” as defined in the 1940 Act, of the Trust/MIP based on their positions with BlackRock, Inc. and its affiliates. Mr. Fairbairn and Mr. Perlowski are also board members of the BlackRock Fixed-Income Complex. (e) Mr. Perlowski is also a trustee of the BlackRock Credit Strategies Fund. |
| | |
| 40 | | 2019 BLACKROCK ANNUAL REPORTTO SHAREHOLDERS |
Trustee and Officer Information (continued)
| | | | |
Officers Who Are Not Trustees (a) |
| | | |
Name
Year of Birth (b) | | Position(s) Held
(Length of Service) | | Principal Occupation(s) During Past Five Years |
Thomas Callahan 1968 | | Vice President (Since 2016) | | Managing Director of BlackRock, Inc. since 2013; Member of the Board of Managers of BlackRock Investments, LLC (principal underwriter) since 2019 and Managing Director thereof since 2017; Head of BlackRock’s Global Cash Management Business since 2016;Co-Head of the Global Cash Management Business from 2014 to 2016; Deputy Head of the Global Cash Management Business from 2013 to 2014; Member of the Cash Management Group Executive Committee since 2013; Chief Executive Officer of NYSE Liffe U.S. from 2008 to 2013. |
Jennifer McGovern 1977 | | Vice President (Since 2014) | | Managing Director of BlackRock, Inc. since 2016; Director of BlackRock, Inc. from 2011 to 2015; Head of Product Development and Oversight for BlackRock’s Strategic Product Management Group since 2019; Head of Product Structure and Oversight for BlackRock’s U.S. Wealth Advisory Group from 2013 to 2019. |
Neal J. Andrews 1966 | | Chief Financial Officer (Since 2009) | | Chief Financial Officer of the iShares® exchange traded funds since 2019; Managing Director of BlackRock, Inc. since 2006. |
Jay M. Fife 1970 | | Treasurer (Since 2009) | | Managing Director of BlackRock, Inc. since 2007. |
Charles Park 1967 | | Chief Compliance Officer (Since 2014) | | Anti-Money Laundering Compliance Officer for certain BlackRock-advised Funds from 2014 to 2015; Chief Compliance Officer of BlackRock Advisors, LLC and the BlackRock-advised Funds in the BlackRock Multi-Asset Complex and the BlackRock Fixed-Income Complex since 2014; Principal of and Chief Compliance Officer for iShares® Delaware Trust Sponsor LLC since 2012 and BlackRock Fund Advisors (“BFA”) since 2006; Chief Compliance Officer for theBFA-advised iShares® exchange traded funds since 2006; Chief Compliance Officer for BlackRock Asset Management International Inc. since 2012. |
Lisa Belle 1968 | | Anti-Money Laundering Compliance Officer (Since 2019) | | Managing Director of BlackRock, Inc. since 2019; Global Financial Crime Head for Asset and Wealth Management of JP Morgan from 2013 to 2019; Managing Director of RBS Securities from 2012 to 2013; Head of Financial Crimes for Barclays Wealth Americas from 2010 to 2012. |
Janey Ahn 1975 | | Secretary (Since 2019) | | Managing Director of BlackRock, Inc. since 2018; Director of BlackRock, Inc. from 2009 to 2017. |
(a) The address of each Officer is c/o BlackRock, Inc., 55 East 52nd Street, New York, New York 10055. (b) Officers of the Trust/MIP serve at the pleasure of the Board. |
Further information about the Trust’s/MIP’s Trustees and Officers is available in the Trust’s/MIP’s Statement of Additional Information, which can be obtained without charge by calling(800) 441-7762.
Effective September 19, 2019, Lisa Belle replaced John MacKessy as the Anti-Money Laundering Compliance Officer of the Trust/MIP.
Effective September 19, 2019, Janey Ahn replaced Benjamin Archibald as the Secretary of the Trust/MIP.
Effective December 31, 2019, Robert M. Hernandez retired as Trustee of the Trust/MIP.
Investment Adviser
BlackRock Fund Advisors
San Francisco, CA 94105
Administrator
BlackRock Advisors LLC
Wilmington, DE 19809
Custodian and Accounting Agent
State Street Bank and Trust Company
Boston, MA 02111
Transfer Agent
State Street Bank and Trust Company
North Quincy, MA 02171
Independent Registered Public Accounting Firm
PricewaterhouseCoopers LLP
Philadelphia, PA 19103
Distributor
BlackRock Investments, LLC
New York, NY 10022
Legal Counsel
Sidley Austin LLP
New York, NY 10019
Address of the Trust/MIP
400 Howard Street
San Francisco, CA 94105
| | | | |
| TRUSTEEAND OFFICER INFORMATION | | | 41 | |
Additional Information
General Information
Householding
The Funds will mail only one copy of shareholder documents, including prospectuses, annual and semi-annual reports and proxy statements, to shareholders with multiple accounts at the same address. This practice is commonly called “householding” and is intended to reduce expenses and eliminate duplicate mailings of shareholder documents. Mailings of your shareholder documents may be householded indefinitely unless you instruct us otherwise. If you do not want the mailing of these documents to be combined with those for other members of your household, please call the Transfer Agent at (888) 204-3956.
Availability of Quarterly Schedule of Investments
The Funds/Master Portfolios file their complete schedule of portfolio holdings with the SEC each month on Forms N-MFP. The Funds’/Master Portfolios’ reports on Forms N-MFP are available on the SEC’s website at sec.gov. Each Fund/Master Portfolio makes portfolio holdings available to shareholders/interest holders on its website at blackrock.com.
Availability of Proxy Voting Policies and Procedures
A description of the policies and procedures that the Funds/Master Portfolios use to determine how to vote proxies relating to portfolio securities is available upon request and without charge (1) by calling (800) 626-1960; (2) atblackrock.com; and (3) on the SEC’s website at sec.gov.
Availability of Proxy Voting Record
Information about how the Funds/Master Portfolios voted proxies relating to securities held in the Funds’/Master Portfolios’ portfolios during the most recent12-month period ended June 30 is available upon request and without charge (1) atblackrock.com, or by calling (800) 626-1960; and (2) on the SEC’s website at sec.gov.
BlackRock Privacy Principles
BlackRock is committed to maintaining the privacy of its current and former fund investors and individual clients (collectively, “Clients”) and to safeguarding theirnon-public personal information. The following information is provided to help you understand what personal information BlackRock collects, how we protect that information and why in certain cases we share such information with select parties.
If you are located in a jurisdiction where specific laws, rules or regulations require BlackRock to provide you with additional or different privacy-related rights beyond what is set forth below, then BlackRock will comply with those specific laws, rules or regulations.
BlackRock obtains or verifies personalnon-public information from and about you from different sources, including the following: (i) information we receive from you or, if applicable, your financial intermediary, on applications, forms or other documents; (ii) information about your transactions with us, our affiliates, or others; (iii) information we receive from a consumer reporting agency; and (iv) from visits to our websites.
BlackRock does not sell or disclose tonon-affiliated third parties anynon-public personal information about its Clients, except as permitted by law or as is necessary to respond to regulatory requests or to service Client accounts. Thesenon-affiliated third parties are required to protect the confidentiality and security of this information and to use it only for its intended purpose.
We may share information with our affiliates to service your account or to provide you with information about other BlackRock products or services that may be of interest to you. In addition, BlackRock restricts access tonon-public personal information about its Clients to those BlackRock employees with a legitimate business need for the information. BlackRock maintains physical, electronic and procedural safeguards that are designed to protect thenon-public personal information of its Clients, including procedures relating to the proper storage and disposal of such information.
| | |
| 42 | | 2019 BLACKROCK ANNUAL REPORTTO SHAREHOLDERS |
Glossary of Terms Used in this Report
| | |
| Portfolio Abbreviations |
| |
| AGM | | Assured Guaranty Municipal Corp. |
| |
| LIBOR | | London Inter-bank Offered Rate |
| |
| RB | | Revenue Bonds |
| |
| SOFR | | Secured Overnight Financing Rate |
| |
| VRDN | | Variable Rate Demand Notes |
Important Fund Information
The following applies to BlackRock Cash Funds: Institutional and its corresponding Master Portfolio: This report is intended for current holders. It is not authorized for use as an offer of sale or a solicitation of an offer to buy shares of the Fund unless preceded or accompanied by the Fund’s current prospectus. You could lose money by investing in the Fund. Because the share price of the Fund will fluctuate, when you sell your shares they may be worth more or less than what you originally paid for them. The Fund may impose a fee upon sale of your shares or may temporarily suspend your ability to sell shares if the Fund’s liquidity falls below required minimums because of market conditions or other factors. An investment in the Fund is not insured or guaranteed by the Federal Deposit Insurance Corporation or any other government agency. The Fund’s sponsor has no legal obligation to provide financial support to the Fund at any time. Performance data quoted represents past performance and does not guarantee future results. Total return information assumes reinvestment of all distributions. Current performance may be higher or lower than the performance data quoted. For current month-end performance information, call(800) 626-1960. The Fund’s current 7-day yield more closely reflects the current earnings of the Fund than the total returns quoted. Statements and other information herein are as dated and are subject to change.
The following applies to BlackRock Cash Funds: Treasury and its corresponding Master Portfolio: This report is intended for current holders. It is not authorized for use as an offer of sale or a solicitation of an offer to buy shares of the Fund unless preceded or accompanied by the Fund’s current prospectus. You could lose money by investing in the Fund. Although the Fund seeks to preserve the value of your investment at $1.00 per share, it cannot guarantee it will do so. An investment in the Fund is not insured or guaranteed by the Federal Deposit Insurance Corporation or any other government agency. The Fund’s sponsor has no legal obligation to provide financial support to the Fund at any time. Performance data quoted represents past performance and does not guarantee future results. Total return information assumes reinvestment of all distributions. Current performance may be higher or lower than the performance data quoted. For current month-end performance information, call(800) 626-1960. The Fund’s current7-day yield more closely reflects the current earnings of the Fund than the total returns quoted. Statements and other information herein are as dated and are subject to change.
| | | | |
| GLOSSARYOF TERMS USEDINTHIS REPORT / IMPORTANT FUND INFORMATION | | | 43 | |
Want to know more?
blackrock.com | 877-275-1255 (1-877-ASK-1BLK)
MMF3-12/19-AR
| | |
 | | DECEMBER 31, 2019 |
BlackRock Funds III
| · | | BlackRock LifePath® Dynamic Retirement Fund |
| · | | BlackRock LifePath® Dynamic 2030 Fund |
| · | | BlackRock LifePath® Dynamic 2040 Fund |
| · | | BlackRock LifePath® Dynamic 2050 Fund |
| · | | BlackRock LifePath® Dynamic 2060 Fund |
Beginning on January 1, 2021, as permitted by regulations adopted by the Securities and Exchange Commission, paper copies of each Fund’s shareholder reports will no longer be sent by mail, unless you specifically request paper copies of the reports from BlackRock or from your financial intermediary, such as a broker-dealer or bank. Instead, the reports will be made available on a website, and you will be notified by mail each time a report is posted and provided with a website link to access the report.
You may elect to receive all future reports in paper free of charge. If you hold accounts directly with BlackRock, you can call(800) 441-7762 to inform BlackRock that you wish to continue receiving paper copies of your shareholder reports. If you hold accounts through a financial intermediary, you can follow the instructions included with this disclosure, if applicable, or contact your financial intermediary to request that you continue to receive paper copies of your shareholder reports. Please note that not all financial intermediaries may offer this service. Your election to receive reports in paper will apply to all funds advised by BlackRock Advisors, LLC, BlackRock Fund Advisors or their affiliates, or all funds held with your financial intermediary, as applicable.
If you already elected to receive shareholder reports electronically, you will not be affected by this change and you need not take any action. You may elect to receive electronic delivery of shareholder reports and other communications by: (i) accessing the BlackRock website at www.blackrock.com/edelivery and logging into your accounts, if you hold accounts directly with BlackRock, or (ii) contacting your financial intermediary, if you hold accounts through a financial intermediary. Please note that not all financial intermediaries may offer this service.
|
| Not FDIC Insured • May Lose Value • No Bank Guarantee |
The Markets in Review
Dear Shareholder,
U.S. equities and bonds finished the last year of the decade with impressive returns, putting an exclamation point on a decade of strong performance despite the fears and doubts about the economy that were ultimately laid to rest with unprecedented monetary stimulus and a sluggish yet resolute performance from the U.S. economy. In many ways, it was fitting that the themes of 2019 — geopolitical uncertainty, fears of recession, and decisive monetary stimulus — put the capstone on a decade that was defined by grappling with these competing forces.
Equity and bond markets posted solid returns, particularly in the second half of the year, as investors began to realize that the U.S. economy was maintaining the modest yet steady growth that has characterized this economic cycle. U.S. large cap equities advanced the most, while equities at the high end of the risk spectrum — emerging markets and U.S. small cap — lagged while still posting solid returns.
Fixed-income securities played an important role in diversified portfolios by delivering strong returns amid economic uncertainty, as interest rates declined (and bond prices rose). Long-term bonds, particularly long-term Treasuries, generally posted the strongest returns, as inflation remained low. Investment-grade and high-yield corporate bonds also posted solid returns, as the credit fundamentals in corporate markets remained relatively solid.
As equity performance faltered in late 2018 and global economic growth slowed, the U.S. Federal Reserve (the “Fed”) shifted away from policies designed to decrease inflation in favor of renewed efforts to stimulate economic activity. The Fed left interest rates unchanged in January 2019, then reduced interest rates three times thereafter, starting in July 2019. Similarly, the Fed took measures to support liquidity in short-term lending markets. Following in the Fed’s footsteps, the European Central Bank announced aggressive economic stimulus measures, including lower interest rates and the return of its bond purchasing program. The Bank of Japan signaled a continuation of accommodative monetary policy, while China committed to looser credit conditions and an increase in fiscal spending.
The outpouring of global economic stimulus led to a sharp rally in risk assets throughout the world despite the headwind of rising geopolitical and trade tensions. Hopes continued to remain high as the current economic expansion became the longest in U.S. history.
Looking ahead, we believe U.S. economic growth will stabilize and gradually improve in 2020. The primary drivers of recent market performance — trade and monetary policies — could take a back seat to a nascent expansion in manufacturing and a recent uptick in global growth. The headwinds of policy uncertainty in 2019 could become tailwinds in 2020 due topro-cyclical policy shifts.
Overall, we favor increasing investment risk to benefit from the brighter outlook. In addition to having a positive view for equities overall, we favor emerging market equities over developed market equities. Increasing cyclical exposure through value-style investing and maintaining a meaningful emphasis on high-quality companies through quality factors also makes sense for diversified investors. In fixed income, government bonds continue to be important portfolio stabilizers, while emerging market bonds, particularly local currency bonds, offer relatively attractive income opportunities.
In this environment, investors need to think globally, extend their scope across a broad array of asset classes, and be nimble as market conditions change. We encourage you to talk with your financial advisor and visitblackrock.com for further insight about investing in today’s markets.
Sincerely,
Rob Kapito
President, BlackRock Advisors, LLC
Rob Kapito
President, BlackRock Advisors, LLC
| | | | |
| Total Returns as of December 31, 2019 |
| | | 6-month | | 12-month |
U.S. large cap equities
(S&P 500® Index) | | 10.92% | | 31.49% |
U.S. small cap equities
(Russell 2000® Index) | | 7.30 | | 25.52 |
International equities
(MSCI Europe, Australasia, Far East Index) | | 7.01 | | 22.01 |
Emerging market equities
(MSCI Emerging Markets Index) | | 7.09 | | 18.42 |
3-month Treasury bills
(ICE BofAML3-Month U.S. Treasury Bill Index) | | 1.03 | | 2.28 |
U.S. Treasury securities
(ICE BofAML10-Year U.S. Treasury Index) | | 1.36 | | 8.91 |
U.S. investment grade bonds
(Bloomberg Barclays U.S. Aggregate Bond Index) | | 2.45 | | 8.72 |
Tax-exempt municipal bonds
(S&P Municipal Bond Index) | | 2.21 | | 7.26 |
U.S. high yield bonds
(Bloomberg Barclays U.S. Corporate High Yield 2% Issuer Capped Index) | | 3.98 | | 14.32 |
| Past performance is no guarantee of future results. Index performance is shown for illustrative purposes only. You cannot invest directly in an index. |
| | |
| 2 | | THIS PAGEISNOT PARTOF YOUR FUND REPORT |
Table of Contents

| | |
| Fund Summary as of December 31, 2019 | | BlackRock LifePath® Dynamic Funds |
Portfolio Management Commentary
How did each Fund perform?
The BlackRock LifePath® Dynamic Funds with target dates of 2030, 2040, 2050 and 2060 and the BlackRock LifePath® Dynamic Retirement Fund (together, the “LifePath Dynamic Funds”) invest in their respective LifePath® Dynamic Master Portfolio.
For the12-month period ended December 31, 2019, the BlackRock LifePath® Dynamic Retirement Fund and the LifePath Dynamic Funds with target dates of 2030 and 2040 outperformed their respective custom benchmarks, with the exception of the Investor C Shares, which underperformed their respective custom benchmarks. For the same period, the LifePath Dynamic Funds with target dates of 2050 and 2060 each underperformed their respective custom benchmarks. The returns for the LifePath Dynamic Funds include fund expenses. The custom benchmarks have no expenses associated with performance.
What factors influenced performance?
BlackRock Advantage Emerging Markets Fund (an equity strategy) and BlackRock Tactical Opportunities Fund (a global tactical asset allocation strategy) detracted from the LifePath Dynamic Funds’ returns as they lagged their respective benchmarks. In terms of macro themes, active currency positioning weighed on returns over the period, and an underweight to U.S.10- and30-year bond futures also modestly detracted.
At an investment strategy level, underlying actively managed strategies were generally the largest positive contributors to active returns, while macro themes also contributed in the nearer-dated vintages. Specifically, CoreAlpha Bond Master Portfolio (a domestic fixed-income strategy), Active Stock Master Portfolio (a diversified equity strategy) and active real estate strategies contributed to returns. With regard to the LifePath Dynamic Funds’ macro themes, an overweight to U.S. equities was the largest contributor to returns for the period.
As part of their investment strategy, the LifePath Dynamic Funds may use derivatives to achieve exposure to a market or to manage risk. At times during the period, the LifePath Dynamic Funds had elevated cash positions that were primarily due to collateral posted against these derivatives. The LifePath Dynamic Funds’ cash balances had no material impact on their respective performance.
Describe recent portfolio activity.
Each LifePath Dynamic Fund has its own time horizon, which affects its acceptable level of risk and, in turn, the strategic allocation of its holdings across asset classes. On a quarterly basis, the strategic allocation of each LifePath Dynamic Fund is systematically adjusted to reflect the shareholders’ remaining investment time horizon.
The LifePath Dynamic Funds entered the period with tactical overweights to U.S. and Japanese equities as expressions of the investment adviser’s macro theme of Global Reflation. As markets rebounded strongly from December 2018 lows, the investment adviser reduced holdings in some of the domestic exposure and all the Japanese exposure. Concurrently, the investment adviser introduced an overweight tofar-dated U.S. bonds (via30-year bond futures) as part of a new theme called U.S. Macro Moderation. This exposure was maintained through the first three quarters of 2019, based on the investment adviser’s belief that the U.S. economy was in a state of relative moderation with limited risk of overheating or falling into deep recession.
As pricing moved in line with expectations, the LifePath Dynamic Funds’ overweight tofar-dated U.S. bonds was removed early in the fourth quarter of 2019. The LifePath Dynamic Funds maintained an overweight to U.S. equities throughout the period and introduced underweights to U.S.10-year and U.S.30-year bond futures in April and May 2019, respectively, as expressions of Global Reflation. This fixed-income positioning reflected the investment adviser’s view that despite the notable slowing in global activity data and dovish shift in global central bank tones, price levels for U.S. bonds had risen to levels inconsistent with fundamentals. These three positions were maintained for the rest of the period, although they were trimmed in the fourth quarter. The LifePath Dynamic Funds entered the period with an overweight to the euro, which was increased near the middle of the period, before being modestly trimmed in the latter half of the period as pricing moved in line with expectations. September’s European Central Bank (“ECB”) policy meeting gave the investment adviser increased conviction that the ECB was reaching the limits of both its willingness and its ability to proactively ease policy. Even as challenges to financial stability linger, the investment adviser expects trends in growth, inflation and policy between the Eurozone and the United States to converge over the coming months, and as such expect this to be supportive of a euro overweight position. The LifePath Dynamic Funds closed an overweight to the Australian dollar toward the middle of the period. With an escalation in global trade tensions weighing on the export-oriented economy, expectations of a rate cut from the Reserve Bank of Australia increased, leaving the theme with limited upside potential.
Describe portfolio positioning at period end.
At period end, each of the LifePath Dynamic Funds was invested according to its respective strategic allocation benchmark within tolerance limits.
The views expressed reflect the opinions of BlackRock as of the date of this report and are subject to change based on changes in market, economic or other conditions. These views are not intended to be a forecast of future events and are no guarantee of future results.
| | |
| 4 | | 2019 BLACKROCK ANNUAL REPORTTO SHAREHOLDERS |
| | |
| Fund Summary as of December 31, 2019 (continued) | | BlackRock LifePath® Dynamic Funds |
Glide Path Evolution
Under normal circumstances, the asset allocation of each LifePath Dynamic Fund will change over time according to a “glide path” as each LifePath Dynamic Fund approaches its respective target date. The glide path represents the shifting of asset classes over time. Each LifePath Dynamic Fund’s asset mix becomes more conservative — prior to retirement — as time elapses. This reflects the need for reduced investment risks as retirement approaches and the need for lower volatility of each LifePath Dynamic Fund, which may be a primary source of income after retirement. As each LifePath Dynamic Fund approaches its target date, its asset allocation will shift so that it invests a greater percentage of its assets in fixed-income funds. The asset allocation targets are established by the portfolio managers. The investment team, including the portfolio managers, meets regularly to assess market conditions, review the asset allocation targets of each LifePath Dynamic Fund, and determine whether any changes are required to enable each LifePath Dynamic Fund to achieve its investment objective. Because the BlackRock LifePath® Dynamic Retirement Fund is in its most conservative phase, its allocation generally does not become more conservative over time, although its allocation may change to maintain its risk profile.
Although the asset allocation targets listed for the glide path are general, long-term targets, BlackRock Fund Advisors (“BFA” or the “Manager”) may adjust the allocation to equity and fixed-income in each LifePath Dynamic Fund, based on an assessment of the current market conditions and the potential contribution of each asset class to the expected risk and return characteristics of each LifePath Dynamic Fund. In general, the adjustments will be limited to +/- 10% relative to the target allocations. BFA may determine, in light of market conditions or other factors, that a greater variation is warranted to protect the LifePath Dynamic Fund or achieve its investment objective.
| | |
| Fund Summary as of December 31, 2019 | | BlackRock LifePath® Dynamic Retirement Fund |
Investment Objective
The investment objective ofBlackRock LifePath® Dynamic Retirement Fund (“LifePath Dynamic Retirement Fund” or the “LifePath Dynamic Fund”) is to seek to provide for retirement outcomes based on quantitatively measured risk. In pursuit of this objective, LifePath Dynamic Retirement Fund will be broadly diversified across global asset classes.
At a meeting held on May 15, 2019, the Board of Trustees of BlackRock Funds III, on behalf of the LifePath Dynamic Fund, approved a reorganization (the “Reorganization”) of BlackRock LifePath® Dynamic 2020 Fund (the “Target Fund”), with and into the LifePath Dynamic Fund. Shareholders of the Target Fund or LifePath Dynamic Fund were not required to approve the Reorganization. The Reorganization closed on November 18, 2019.
TOTAL RETURN BASED ON A $10,000 INVESTMENT
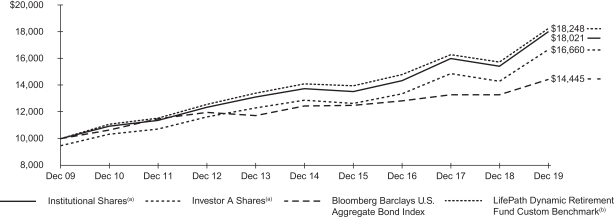
| (a) | Assuming maximum sales charges, transaction costs and other operating expenses, including advisory fees, if any. Institutional Shares do not have a sales charge. |
| (b) | The LifePath Dynamic Fund compares its performance to that of a customized weighted index (the “LifePath Dynamic Retirement Fund Custom Benchmark”) comprised of the indexes indicated below, which reflects the investment adviser’s changes to the benchmark’s weightings over time. The investment adviser adjusts the weightings of these indexes periodically based upon its evaluation and adjustment of the LifePath Dynamic Fund’s asset allocation strategy. The weightings are presented annually but they are adjusted quarterly. |
The LifePath Dynamic Fund’s custom benchmark consists of the following:
| | | | | | | | | | | | | | | | | | | | | | | | | | | | | | | | | | | | | | | | |
| Period | | Bloomberg
Barclays U.S.
Aggregate
Bond
Index | | | Bloomberg
Barclays U.S.
Treasury
Inflation
Protected
Securities
(TIPS) Index
(Series L) | | | Bloomberg
Commodity
Index (a) | | | FTSE
EPRA
Nareit
Developed
Index | | | MSCI
ACWI
ex USA IMI
Index | | | Russell
1000®
Index | | | Russell
2000®
Index | | | S&P
MidCap
400®
Index | | | S&P
500®
Index | | | S&P
SmallCap
600®
Index | |
01/01/09 to 12/31/09 | | | 52.9 | % | | | 9.1 | % | | | N/A | | | | 1.6 | % | | | 10.8 | % | | | N/A | | | | N/A | | | | 4.7 | % | | | 18.7 | % | | | 2.2 | % |
01/01/10 to 12/31/10 | | | 52.9 | | | | 9.1 | | | | N/A | | | | 1.1 | | | | 10.8 | | | | N/A | | | | N/A | | | | 5.0 | | | | 18.9 | | | | 2.2 | |
01/01/11 to 12/31/11 | | | 52.9 | | | | 9.1 | | | | N/A | | | | 0.8 | | | | 11.3 | | | | 8.6 | % | | | 1.7 | % | | | 2.8 | | | | 11.6 | | | | 1.2 | |
01/01/12 to 12/31/12 | | | 52.9 | | | | 9.1 | | | | 1.0 | % | | | 0.3 | | | | 11.3 | | | | 21.2 | | | | 4.2 | | | | N/A | | | | N/A | | | | N/A | |
01/01/13 to 12/31/13 | | | 52.9 | | | | 9.1 | | | | 3.7 | | | | 0.1 | | | | 10.1 | | | | 19.7 | | | | 4.4 | | | | N/A | | | | N/A | | | | N/A | |
01/01/14 to 12/31/14 | | | 52.6 | | | | 9.0 | | | | 3.8 | | | | 0.2 | | | | 10.2 | | | | 19.9 | | | | 4.3 | | | | N/A | | | | N/A | | | | N/A | |
01/01/15 to 12/31/15 | | | 51.1 | | | | 8.8 | | | | 3.8 | | | | 0.5 | | | | 11.0 | | | | 21.0 | | | | 3.8 | | | | N/A | | | | N/A | | | | N/A | |
01/01/16 to 12/31/16 | | | 51.1 | | | | 8.8 | | | | 3.7 | | | | 0.5 | | | | 11.3 | | | | 20.9 | | | | 3.7 | | | | N/A | | | | N/A | | | | N/A | |
01/01/17 to 12/31/17 | | | 51.2 | | | | 8.8 | | | | 3.7 | | | | 0.5 | | | | 11.3 | | | | 20.3 | | | | 4.2 | | | | N/A | | | | N/A | | | | N/A | |
01/01/18 to 12/31/18 | | | 51.2 | | | | 8.8 | | | | N/A | | | | 0.5 | | | | 13.7 | | | | 21.8 | | | | 4.0 | | | | N/A | | | | N/A | | | | N/A | |
01/01/19 to 12/31/19 | | | 52.0 | | | | 8.0 | | | | N/A | | | | 2.3 | | | | 12.3 | | | | 22.1 | | | | 3.3 | | | | N/A | | | | N/A | | | | N/A | |
| | (a) | Prior to July 1, 2014, the Bloomberg Commodity Index was known as the Dow Jones-UBS Commodity Index. | |
See “About Fund Performance” on page 16 for descriptions of the indexes.
| | |
| 6 | | 2019 BLACKROCK ANNUAL REPORTTO SHAREHOLDERS |
| | |
| Fund Summary as of December 31, 2019 (continued) | | BlackRock LifePath® Dynamic Retirement Fund |
Performance Summary for the Period Ended December 31, 2019
| | | | | | | | | | | | | | | | | | | | | | | | | | | | | | | | | | | | | | | | |
| | | | | | | | | Average Annual Total Returns (a) | |
| | | | | | | | | 1 Year | | | | | | 5 Years | | | | | | 10 Years | |
| | | 6-Month
Total Returns | | | | | | w/o sales
charge | | | w/sales
charge | | | | | | w/o sales
charge | | | w/sales
charge | | | | | | w/o sales
charge | | | w/sales
charge | |
Institutional | | | 4.73 | % | | | | | | | 16.91 | % | | | N/A | | | | | | | | 5.57 | % | | | N/A | | | | | | | | 6.07 | % | | | N/A | |
Investor A | | | 4.59 | | | | | | | | 16.56 | | | | 10.44 | % | | | | | | | 5.30 | | | | 4.17 | % | | | | | | | 5.81 | | | | 5.24 | % |
Investor C | | | 4.16 | | | | | | | | 15.54 | | | | 14.54 | | | | | | | | 4.47 | | | | 4.47 | | | | | | | | 4.94 | | | | 4.94 | |
Class K | | | 4.84 | | | | | | | | 17.07 | | | | N/A | | | | | | | | 5.80 | | | | N/A | | | | | | | | 6.38 | | | | N/A | |
Class R | | | 4.39 | | | | | | | | 16.24 | | | | N/A | | | | | | | | 5.06 | | | | N/A | | | | | | | | 5.51 | | | | N/A | |
LifePath Dynamic Retirement Fund Custom Benchmark | | | 5.08 | | | | | | | | 16.06 | | | | N/A | | | | | | | | 5.29 | | | | N/A | | | | | | | | 6.20 | | | | N/A | |
Bloomberg Barclays U.S. Aggregate Bond Index | | | 2.45 | | | | | | | | 8.72 | | | | N/A | | | | | | | | 3.05 | | | | N/A | | | | | | | | 3.75 | | | | N/A | |
Bloomberg Barclays U.S. TIPS Index (Series L) | | | 2.15 | | | | | | | | 8.43 | | | | N/A | | | | | | | | 2.62 | | | | N/A | | | | | | | | 3.36 | | | | N/A | |
FTSE EPRA Nareit Developed Index | | | 6.46 | | | | | | | | 21.91 | | | | N/A | | | | | | | | 5.56 | | | | N/A | | | | | | | | 8.37 | | | | N/A | |
MSCI ACWI ex USA IMI Index | | | 7.33 | | | | | | | | 21.63 | | | | N/A | | | | | | | | 5.71 | | | | N/A | | | | | | | | 5.21 | | | | N/A | |
Russell 1000® Index | | | 10.59 | | | | | | | | 31.43 | | | | N/A | | | | | | | | 11.48 | | | | N/A | | | | | | | | 13.54 | | | | N/A | |
Russell 2000® Index | | | 7.30 | | | | | | | | 25.52 | | | | N/A | | | | | | | | 8.23 | | | | N/A | | | | | | | | 11.83 | | | | N/A | |
| | (a) | Assuming maximum sales charges, if any. Average annual total returns with and without sales charges reflect reductions for distributions and service fees. See “About Fund Performance” on page 16 for a detailed description of share classes, including any related sales charges and fees, and how performance was calculated for certain share classes. LifePath Dynamic Retirement Fund’s returns prior to March 31, 2018 are the returns of LifePath Dynamic Retirement Fund when its assets could be allocated to underlying funds that invest primarily in commodities. LifePath Dynamic Retirement Fund’s returns between December 14, 2015 and November 7, 2016 are the returns of LifePath Dynamic Retirement Fund when it incorporated different allocations in its glidepath and had a different investment strategy. LifePath Dynamic Retirement Fund’s returns prior to December 14, 2015 are the returns of LifePath Dynamic Retirement Fund under a different investment strategy. LifePath Dynamic Retirement Fund’s returns prior to November 28, 2014 are the returns of LifePath Dynamic Retirement Fund when it had a different target asset allocation. | |
N/A — Not applicable as share class and index do not have a sales charge.
Past performance is not indicative of future results.
Performance results may include adjustments made for financial reporting purposes in accordance with U.S. generally accepted accounting principles.
| | |
| Fund Summary as of December 31, 2019 | | BlackRock LifePath® Dynamic 2030 Fund |
Investment Objective
The investment objective ofBlackRock LifePath® Dynamic 2030 Fund (“LifePath Dynamic 2030 Fund” or the “LifePath Dynamic Fund”) is to seek to provide for retirement outcomes based on quantitatively measured risk. In pursuit of this objective, LifePath Dynamic 2030 Fund will be broadly diversified across global asset classes, with asset allocations becoming more conservative over time.
TOTAL RETURN BASED ON A $10,000 INVESTMENT
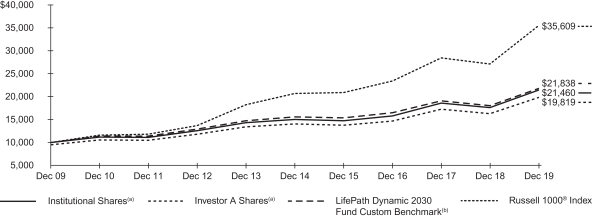
| (a) | Assuming maximum sales charges, transaction costs and other operating expenses, including advisory fees, if any. Institutional Shares do not have a sales charge. |
| (b) | The LifePath Dynamic Fund compares its performance to that of a customized weighted index (the “LifePath Dynamic 2030 Fund Custom Benchmark”) comprised of the indexes indicated below, which reflects the investment adviser’s changes to the benchmark’s weightings over time. The investment adviser adjusts the weightings of these indexes periodically based upon its evaluation and adjustment of the LifePath Dynamic Fund’s asset allocation strategy. The weightings are presented annually but they are adjusted quarterly. |
The LifePath Dynamic Fund’s custom benchmark consists of the following:
| | | | | | | | | | | | | | | | | | | | | | | | | | | | | | | | | | | | | | | | |
| Period | | Bloomberg
Barclays U.S.
Aggregate
Bond
Index | | | Bloomberg
Barclays U.S.
Treasury
Inflation
Protected
Securities
(TIPS) Index
(Series L) | | | Bloomberg
Commodity
Index (a) | | | FTSE
EPRA
Nareit
Developed
Index | | | MSCI
ACWI
ex USA IMI
Index | | | Russell
1000®
Index | | | Russell
2000®
Index | | | S&P
MidCap
400®
Index | | | S&P
500®
Index | | | S&P
SmallCap
600®
Index | |
01/01/09 to 12/31/09 | | | 21.0 | % | | | 3.1 | % | | | N/A | | | | 7.0 | % | | | 21.0 | % | | | N/A | | | | N/A | | | | 6.6 | % | | | 38.2 | % | | | 3.1 | % |
01/01/10 to 12/31/10 | | | 22.0 | | | | 3.2 | | | | N/A | | | | 6.3 | | | | 20.7 | | | | N/A | | | | N/A | | | | 6.4 | | | | 38.6 | | | | 2.8 | |
01/01/11 to 12/31/11 | | | 23.5 | | | | 3.4 | | | | N/A | | | | 6.0 | | | | 20.9 | | | | 17.0 | % | | | 1.3 | % | | | 3.7 | | | | 22.6 | | | | 1.6 | |
01/01/12 to 12/31/12 | | | 25.8 | | | | 3.8 | | | | 1.0 | % | | | 6.0 | | | | 20.2 | | | | 40.2 | | | | 3.0 | | | | N/A | | | | N/A | | | | N/A | |
01/01/13 to 12/31/13 | | | 27.6 | | | | 4.0 | | | | 3.9 | | | | 5.7 | | | | 19.3 | | | | 36.6 | | | | 2.9 | | | | N/A | | | | N/A | | | | N/A | |
01/01/14 to 12/31/14 | | | 27.5 | | | | 4.0 | | | | 3.9 | | | | 6.1 | | | | 19.8 | | | | 35.8 | | | | 2.9 | | | | N/A | | | | N/A | | | | N/A | |
01/01/15 to 12/31/15 | | | 21.8 | | | | 3.4 | | | | 3.9 | | | | 7.7 | | | | 22.2 | | | | 38.5 | | | | 2.5 | | | | N/A | | | | N/A | | | | N/A | |
01/01/16 to 12/31/16 | | | 24.5 | | | | 3.6 | | | | 3.9 | | | | 7.6 | | | | 21.9 | | | | 36.0 | | | | 2.5 | | | | N/A | | | | N/A | | | | N/A | |
01/01/17 to 12/31/17 | | | 25.9 | | | | 4.0 | | | | 3.9 | | | | 7.4 | | | | 21.4 | | | | 35.0 | | | | 2.4 | | | | N/A | | | | N/A | | | | N/A | |
01/01/18 to 12/31/18 | | | 27.1 | | | | 4.2 | | | | N/A | | | | 7.5 | | | | 22.5 | | | | 36.2 | | | | 2.5 | | | | N/A | | | | N/A | | | | N/A | |
01/01/19 to 12/31/19 | | | 27.0 | | | | 6.0 | | | | N/A | | | | 3.1 | | | | 25.2 | | | | 36.0 | | | | 2.7 | | | | N/A | | | | N/A | | | | N/A | |
| | (a) | Prior to July 1, 2014, the Bloomberg Commodity Index was known as the Dow Jones-UBS Commodity Index. | |
See “About Fund Performance” on page 16 for descriptions of the indexes.
| | |
| 8 | | 2019 BLACKROCK ANNUAL REPORTTO SHAREHOLDERS |
| | |
| Fund Summary as of December 31, 2019 (continued) | | BlackRock LifePath® Dynamic 2030 Fund |
Performance Summary for the Period Ended December 31, 2019
| | | | | | | | | | | | | | | | | | | | | | | | | | | | | | | | | | | | | | | | |
| | | | | | | | | Average Annual Total Returns (a) | |
| | | | | | | | | 1 Year | | | | | | 5 Years | | | | | | 10 Years | |
| | | 6-Month
Total Returns | | | | | | w/o sales
charge | | | w/sales
charge | | | | | | w/o sales
charge | | | w/sales
charge | | | | | | w/o sales
charge | | | w/sales
charge | |
Institutional | | | 6.71 | % | | | | | | | 22.07 | % | | | N/A | | | | | | | | 7.36 | % | | | N/A | | | | | | | | 7.93 | % | | | N/A | |
Investor A | | | 6.57 | | | | | | | | 21.72 | | | | 15.33 | % | | | | | | | 7.10 | | | | 5.95 | % | | | | | | | 7.66 | | | | 7.08 | % |
Investor C | | | 6.11 | | | | | | | | 20.76 | | | | 19.76 | | | | | | | | 6.23 | | | | 6.23 | | | | | | | | 6.75 | | | | 6.75 | |
Class K | | | 6.77 | | | | | | | | 22.27 | | | | N/A | | | | | | | | 7.61 | | | | N/A | | | | | | | | 8.26 | | | | N/A | |
Class R | | | 6.39 | | | | | | | | 21.44 | | | | N/A | | | | | | | | 6.86 | | | | N/A | | | | | | | | 7.32 | | | | N/A | |
LifePath Dynamic 2030 Fund Custom Benchmark | | | 6.94 | | | | | | | | 21.16 | | | | N/A | | | | | | | | 6.96 | | | | N/A | | | | | | | | 8.14 | | | | N/A | |
Bloomberg Barclays U.S. Aggregate Bond Index | | | 2.45 | | | | | | | | 8.72 | | | | N/A | | | | | | | | 3.05 | | | | N/A | | | | | | | | 3.75 | | | | N/A | |
Bloomberg Barclays U.S. TIPS Index (Series L) | | | 2.15 | | | | | | | | 8.43 | | | | N/A | | | | | | | | 2.62 | | | | N/A | | | | | | | | 3.36 | | | | N/A | |
FTSE EPRA Nareit Developed Index | | | 6.46 | | | | | | | | 21.91 | | | | N/A | | | | | | | | 5.56 | | | | N/A | | | | | | | | 8.37 | | | | N/A | |
MSCI ACWI ex USA IMI Index | | | 7.33 | | | | | | | | 21.63 | | | | N/A | | | | | | | | 5.71 | | | | N/A | | | | | | | | 5.21 | | | | N/A | |
Russell 1000® Index | | | 10.59 | | | | | | | | 31.43 | | | | N/A | | | | | | | | 11.48 | | | | N/A | | | | | | | | 13.54 | | | | N/A | |
Russell 2000® Index | | | 7.30 | | | | | | | | 25.52 | | | | N/A | | | | | | | | 8.23 | | | | N/A | | | | | | | | 11.83 | | | | N/A | |
| | (a) | Assuming maximum sales charges, if any. Average annual total returns with and without sales charges reflect reductions for distributions and service fees. See “About Fund Performance” on page 16 for a detailed description of share classes, including any related sales charges and fees, and how performance was calculated for certain share classes. LifePath Dynamic 2030 Fund’s returns prior to March 31, 2018 are the returns of LifePath Dynamic 2030 Fund when its assets could be allocated to underlying funds that invest primarily in commodities. LifePath Dynamic 2030 Fund’s returns between December 14, 2015 and November 7, 2016 are the returns of LifePath Dynamic 2030 Fund when it incorporated different allocations in its glidepath and had a different investment strategy. LifePath Dynamic 2030 Fund’s returns prior to December 14, 2015 are the returns of LifePath Dynamic 2030 Fund under a different investment strategy. LifePath Dynamic 2030 Fund’s returns prior to November 28, 2014 are the returns of LifePath Dynamic 2030 Fund when it had a different glidepath and target asset allocation. | |
N/A — Not applicable as share class and index do not have a sales charge.
Past performance is not indicative of future results.
Performance results may include adjustments made for financial reporting purposes in accordance with U.S. generally accepted accounting principles.
| | |
| Fund Summary as of December 31, 2019 | | BlackRock LifePath® Dynamic 2040 Fund |
Investment Objective
The investment objective ofBlackRock LifePath® Dynamic 2040 Fund (“LifePath Dynamic 2040 Fund” or the “LifePath Dynamic Fund”) is to seek to provide for retirement outcomes based on quantitatively measured risk. In pursuit of this objective, LifePath Dynamic 2040 Fund will be broadly diversified across global asset classes, with asset allocations becoming more conservative over time.
TOTAL RETURN BASED ON A $10,000 INVESTMENT
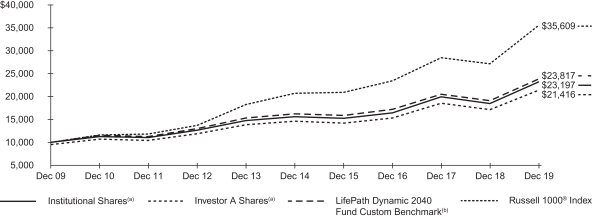
| (a) | Assuming maximum sales charges, transaction costs and other operating expenses, including advisory fees, if any. Institutional Shares do not have a sales charge. |
| (b) | The LifePath Dynamic Fund compares its performance to that of a customized weighted index (the “LifePath Dynamic 2040 Fund Custom Benchmark”) comprised of the indexes indicated below, which reflects the investment adviser’s changes to the benchmark’s weightings over time. The investment adviser adjusts the weightings of these indexes periodically based upon its evaluation and adjustment of the LifePath Dynamic Fund’s asset allocation strategy. The weightings are presented annually but they are adjusted quarterly. |
The LifePath Dynamic Fund’s custom benchmark consists of the following:
| | | | | | | | | | | | | | | | | | | | | | | | | | | | | | | | | | | | | | | | |
| Period | | Bloomberg
Barclays U.S.
Aggregate
Bond
Index | | | Bloomberg
Barclays U.S.
Treasury
Inflation
Protected
Securities
(TIPS) Index
(Series L) | | | Bloomberg
Commodity
Index (a) | | | FTSE
EPRA
Nareit
Developed
Index | | | MSCI
ACWI
ex USA IMI
Index | | | Russell
1000®
Index | | | Russell
2000®
Index | | | S&P
MidCap
400®
Index | | | S&P
500®
Index | | | S&P
SmallCap
600®
Index | |
01/01/09 to 12/31/09 | | | 10.4 | % | | | 1.1 | % | | | N/A | | | | 8.8 | % | | | 24.5 | % | | | N/A | | | | N/A | | | | 7.2 | % | | | 44.6 | % | | | 3.4 | % |
01/01/10 to 12/31/10 | | | 11.2 | | | | 1.1 | | | | N/A | | | | 8.1 | | | | 24.2 | | | | N/A | | | | N/A | | | | 6.9 | | | | 45.5 | | | | 3.0 | |
01/01/11 to 12/31/11 | | | 12.7 | | | | 1.3 | | | | N/A | | | | 7.9 | | | | 24.5 | | | | 20.1 | % | | | 1.2 | % | | | 4.0 | | | | 26.6 | | | | 1.7 | |
01/01/12 to 12/31/12 | | | 15.3 | | | | 1.6 | | | | 1.0 | % | | | 8.2 | | | | 23.7 | | | | 47.7 | | | | 2.5 | | | | N/A | | | | N/A | | | | N/A | |
01/01/13 to 12/31/13 | | | 17.3 | | | | 1.7 | | | | 3.9 | | | | 8.1 | | | | 23.1 | | | | 43.6 | | | | 2.3 | | | | N/A | | | | N/A | | | | N/A | |
01/01/14 to 12/31/14 | | | 16.1 | | | | 1.6 | | | | 3.9 | | | | 9.0 | | | | 24.2 | | | | 42.9 | | | | 2.3 | | | | N/A | | | | N/A | | | | N/A | |
01/01/15 to 12/31/15 | | | 5.7 | | | | 0.7 | | | | 4.1 | | | | 12.1 | | | | 28.1 | | | | 47.3 | | | | 2.0 | | | | N/A | | | | N/A | | | | N/A | |
01/01/16 to 12/31/16 | | | 8.4 | | | | 0.9 | | | | 4.1 | | | | 12.1 | | | | 28.0 | | | | 44.0 | | | | 2.5 | | | | N/A | | | | N/A | | | | N/A | |
01/01/17 to 12/31/17 | | | 9.2 | | | | 1.2 | | | | 4.1 | | | | 12.3 | | | | 27.6 | | | | 44.5 | | | | 1.2 | | | | N/A | | | | N/A | | | | N/A | |
01/01/18 to 12/31/18 | | | 10.3 | | | | 1.4 | | | | N/A | | | | 12.8 | | | | 28.2 | | | | 46.0 | | | | 1.3 | | | | N/A | | | | N/A | | | | N/A | |
01/01/19 to 12/31/19 | | | 8.4 | | | | 3.0 | | | | N/A | | | | 4.2 | | | | 35.2 | | | | 47.0 | | | | 2.2 | | | | N/A | | | | N/A | | | | N/A | |
| | (a) | Prior to July 1, 2014, the Bloomberg Commodity Index was known as the Dow Jones-UBS Commodity Index. | |
See “About Fund Performance” on page 16 for descriptions of the indexes.
| | |
| 10 | | 2019 BLACKROCK ANNUAL REPORTTO SHAREHOLDERS |
| | |
| Fund Summary as of December 31, 2019 (continued) | | BlackRock LifePath® Dynamic 2040 Fund |
Performance Summary for the Period Ended December 31, 2019
| | | | | | | | | | | | | | | | | | | | | | | | | | | | | | | | | | | | | | | | |
| | | | | | | | | Average Annual Total Returns (a) | |
| | | | | | | | | 1 Year | | | | | | 5 Years | | | | | | 10 Years | |
| | | 6-Month
Total Returns | | | | | | w/o sales
charge | | | w/sales
charge | | | | | | w/o sales
charge | | | w/sales
charge | | | | | | w/o sales
charge | | | w/sales
charge | |
Institutional | | | 8.10 | % | | | | | | | 25.72 | % | | | N/A | | | | | | | | 8.30 | % | | | N/A | | | | | | | | 8.78 | % | | | N/A | |
Investor A | | | 7.86 | | | | | | | | 25.29 | | | | 18.71 | % | | | | | | | 8.01 | | | | 6.86 | % | | | | | | | 8.50 | | | | 7.91 | % |
Investor C | | | 7.50 | | | | | | | | 24.35 | | | | 23.35 | | | | | | | | 7.17 | | | | 7.17 | | | | | | | | 7.57 | | | | 7.57 | |
Class K | | | 8.17 | | | | | | | | 25.96 | | | | N/A | | | | | | | | 8.54 | | | | N/A | | | | | | | | 9.11 | | | | N/A | |
Class R | | | 7.82 | | | | | | | | 25.10 | | | | N/A | | | | | | | | 7.79 | | | | N/A | | | | | | | | 8.14 | | | | N/A | |
LifePath Dynamic 2040 Fund Custom Benchmark | | | 8.43 | | | | | | | | 25.01 | | | | N/A | | | | | | | | 8.01 | | | | N/A | | | | | | | | 9.09 | | | | N/A | |
Bloomberg Barclays U.S. Aggregate Bond Index | | | 2.45 | | | | | | | | 8.72 | | | | N/A | | | | | | | | 3.05 | | | | N/A | | | | | | | | 3.75 | | | | N/A | |
Bloomberg Barclays U.S. TIPS Index (Series L) | | | 2.15 | | | | | | | | 8.43 | | | | N/A | | | | | | | | 2.62 | | | | N/A | | | | | | | | 3.36 | | | | N/A | |
FTSE EPRA Nareit Developed Index | | | 6.46 | | | | | | | | 21.91 | | | | N/A | | | | | | | | 5.56 | | | | N/A | | | | | | | | 8.37 | | | | N/A | |
MSCI ACWI ex USA IMI Index | | | 7.33 | | | | | | | | 21.63 | | | | N/A | | | | | | | | 5.71 | | | | N/A | | | | | | | | 5.21 | | | | N/A | |
Russell 1000® Index | | | 10.59 | | | | | | | | 31.43 | | | | N/A | | | | | | | | 11.48 | | | | N/A | | | | | | | | 13.54 | | | | N/A | |
Russell 2000® Index | | | 7.30 | | | | | | | | 25.52 | | | | N/A | | | | | | | | 8.23 | | | | N/A | | | | | | | | 11.83 | | | | N/A | |
| | (a) | Assuming maximum sales charges, if any. Average annual total returns with and without sales charges reflect reductions for distributions and service fees. See “About Fund Performance” on page 16 for a detailed description of share classes, including any related sales charges and fees, and how performance was calculated for certain share classes. LifePath Dynamic 2040 Fund’s returns prior to March 31, 2018 are the returns of LifePath Dynamic 2040 Fund when its assets could be allocated to underlying funds that invest primarily in commodities. LifePath Dynamic 2040 Fund’s returns between December 14, 2015 and November 7, 2016 are the returns of LifePath Dynamic 2040 Fund when it incorporated different allocations in its glidepath and had a different investment strategy. LifePath Dynamic 2040 Fund’s returns prior to December 14, 2015 are the returns of LifePath Dynamic 2040 Fund under a different investment strategy. LifePath Dynamic 2040 Fund’s returns prior to November 28, 2014 are the returns of LifePath Dynamic 2040 Fund when it had a different glidepath and target asset allocation. | |
N/A — Not applicable as share class and index do not have a sales charge.
Past performance is not indicative of future results.
Performance results may include adjustments made for financial reporting purposes in accordance with U.S. generally accepted accounting principles.
| | |
| Fund Summary as of December 31, 2019 | | BlackRock LifePath® Dynamic 2050 Fund |
Investment Objective
The investment objective ofBlackRock LifePath® Dynamic 2050 Fund (“LifePath Dynamic 2050 Fund” or the “LifePath Dynamic Fund”) is to seek to provide for retirement outcomes based on quantitatively measured risk. In pursuit of this objective, LifePath Dynamic 2050 Fund will be broadly diversified across global asset classes, with asset allocations becoming more conservative over time.
TOTAL RETURN BASED ON A $10,000 INVESTMENT
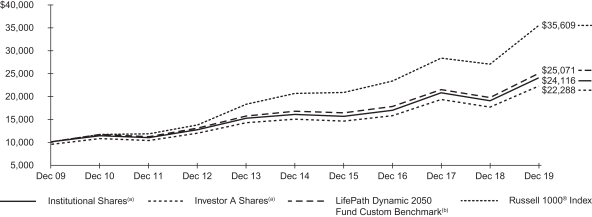
| (a) | Assuming maximum sales charges, transaction costs and other operating expenses, including advisory fees, if any. Institutional Shares do not have a sales charge. |
| (b) | The LifePath Dynamic Fund compares its performance to that of a customized weighted index (the “LifePath Dynamic 2050 Fund Custom Benchmark”) comprised of the indexes indicated below, which reflects the investment adviser’s changes to the benchmark’s weightings over time. The investment adviser adjusts the weightings of these indexes periodically based upon its evaluation and adjustment of the LifePath Dynamic Fund’s asset allocation strategy. The weightings are presented annually but they are adjusted quarterly. |
The LifePath Dynamic Fund’s custom benchmark consists of the following:
| | | | | | | | | | | | | | | | | | | | | | | | | | | | | | | | | | | | | | | | |
| Period | | Bloomberg
Barclays U.S.
Aggregate
Bond
Index | | | Bloomberg
Barclays U.S.
Treasury
Inflation
Protected
Securities
(TIPS) Index
(Series L) | | | Bloomberg
Commodity
Index (a) | | | FTSE
EPRA
Nareit
Developed
Index | | | MSCI
ACWI
ex USA IMI
Index | | | Russell
1000®
Index | | | Russell
2000®
Index | | | S&P
MidCap
400®
Index | | | S&P
500®
Index | | | S&P
SmallCap
600®
Index | |
01/01/09 to 12/31/09 | | | 1.0 | % | | | N/A | | | | N/A | | | | 9.1 | % | | | 28.3 | % | | | N/A | | | | N/A | | | | 9.5 | % | | | 47.5 | % | | | 4.6 | % |
01/01/10 to 12/31/10 | | | 1.1 | | | | N/A | | | | N/A | | | | 9.8 | | | | 27.4 | | | | N/A | | | | N/A | | | | 7.6 | | | | 50.7 | | | | 3.4 | |
01/01/11 to 12/31/11 | | | 2.7 | | | | N/A | | | | N/A | | | | 9.7 | | | | 27.6 | | | | 22.8 | % | | | 1.1 | % | | | 4.4 | | | | 29.9 | | | | 1.8 | |
01/01/12 to 12/31/12 | | | 5.9 | | | | N/A | | | | 1.0 | % | | | 10.2 | | | | 26.8 | | | | 54.0 | | | | 2.1 | | | | N/A | | | | N/A | | | | N/A | |
01/01/13 to 12/31/13 | | | 8.2 | | | | N/A | | | | 4.0 | | | | 10.1 | | | | 26.3 | | | | 49.6 | | | | 1.8 | | | | N/A | | | | N/A | | | | N/A | |
01/01/14 to 12/31/14 | | | 8.2 | | | | N/A | | | | 3.9 | | | | 11.0 | | | | 27.3 | | | | 47.8 | | | | 1.8 | | | | N/A | | | | N/A | | | | N/A | |
01/01/15 to 12/31/15 | | | 1.0 | | | | N/A | | | | 4.2 | | | | 13.7 | | | | 29.9 | | | | 49.2 | | | | 2.0 | | | | N/A | | | | N/A | | | | N/A | |
01/01/16 to 12/31/16 | | | 1.0 | | | | N/A | | | | 4.4 | | | | 14.1 | | | | 30.3 | | | | 48.4 | | | | 1.8 | | | | N/A | | | | N/A | | | | N/A | |
01/01/17 to 12/31/17 | | | 1.0 | | | | N/A | | | | 4.3 | | | | 15.3 | | | | 30.9 | | | | 47.5 | | | | 1.0 | | | | N/A | | | | N/A | | | | N/A | |
01/01/18 to 12/31/18 | | | 1.2 | | | | N/A | | | | N/A | | | | 16.0 | | | | 31.7 | | | | 50.1 | | | | 1.0 | | | | N/A | | | | N/A | | | | N/A | |
01/01/19 to 12/31/19 | | | 1.0 | | | | 0.4 | % | | | N/A | | | | 4.8 | | | | 39.9 | | | | 52.0 | | | | 1.9 | | | | N/A | | | | N/A | | | | N/A | |
| | (a) | Prior to July 1, 2014, the Bloomberg Commodity Index was known as the Dow Jones-UBS Commodity Index. | |
See “About Fund Performance” on page 16 for descriptions of the indexes.
| | |
| 12 | | 2019 BLACKROCK ANNUAL REPORTTO SHAREHOLDERS |
| | |
| Fund Summary as of December 31, 2019 (continued) | | BlackRock LifePath® Dynamic 2050 Fund |
Performance Summary for the Period Ended December 31, 2019
| | | | | | | | | | | | | | | | | | | | | | | | | | | | | | | | | | | | | | | | |
| | | | | | | | | Average Annual Total Returns (a) | |
| | | | | | | | | 1 Year | | | | | | 5 Years | | | | | | 10 Years | |
| | | 6-Month
Total Returns | | | | | | w/o sales
charge | | | w/sales
charge | | | | | | w/o sales
charge | | | w/sales
charge | | | | | | w/o sales
charge | | | w/sales
charge | |
Institutional | | | 8.49 | % | | | | | | | 26.38 | % | | | N/A | | | | | | | | 8.49 | % | | | N/A | | | | | | | | 9.20 | % | | | N/A | |
Investor A | | | 8.37 | | | | | | | | 26.11 | | | | 19.49 | % | | | | | | | 8.23 | | | | 7.07 | % | | | | | | | 8.93 | | | | 8.34 | % |
Investor C | | | 7.92 | | | | | | | | 25.10 | | | | 24.10 | | | | | | | | 7.37 | | | | 7.37 | | | | | | | | 7.98 | | | | 7.98 | |
Class K | | | 8.63 | | | | | | | | 26.67 | | | | N/A | | | | | | | | 8.74 | | | | N/A | | | | | | | | 9.52 | | | | N/A | |
Class R | | | 8.29 | | | | | | | | 25.92 | | | | N/A | | | | | | | | 8.00 | | | | N/A | | | | | | | | 8.57 | | | | N/A | |
LifePath Dynamic 2050 Fund Custom Benchmark | | | 9.08 | | | | | | | | 26.88 | | | | N/A | | | | | | | | 8.41 | | | | N/A | | | | | | | | 9.63 | | | | N/A | |
Bloomberg Barclays U.S. Aggregate Bond Index | | | 2.45 | | | | | | | | 8.72 | | | | N/A | | | | | | | | 3.05 | | | | N/A | | | | | | | | 3.75 | | | | N/A | |
Bloomberg Barclays U.S. TIPS Index (Series L) | | | 2.15 | | | | | | | | 8.43 | | | | N/A | | | | | | | | 2.62 | | | | N/A | | | | | | | | 3.36 | | | | N/A | |
FTSE EPRA Nareit Developed Index | | | 6.46 | | | | | | | | 21.91 | | | | N/A | | | | | | | | 5.56 | | | | N/A | | | | | | | | 8.37 | | | | N/A | |
MSCI ACWI ex USA IMI Index | | | 7.33 | | | | | | | | 21.63 | | | | N/A | | | | | | | | 5.71 | | | | N/A | | | | | | | | 5.21 | | | | N/A | |
Russell 1000® Index | | | 10.59 | | | | | | | | 31.43 | | | | N/A | | | | | | | | 11.48 | | | | N/A | | | | | | | | 13.54 | | | | N/A | |
Russell 2000® Index | | | 7.30 | | | | | | | | 25.52 | | | | N/A | | | | | | | | 8.23 | | | | N/A | | | | | | | | 11.83 | | | | N/A | |
| | (a) | Assuming maximum sales charges, if any. Average annual total returns with and without sales charges reflect reductions for distributions and service fees. See “About Fund Performance” on page 16 for a detailed description of share classes, including any related sales charges and fees, and how performance was calculated for certain share classes. LifePath Dynamic 2050 Fund’s returns prior to March 31, 2018 are the returns of LifePath Dynamic 2050 Fund when its assets could be allocated to underlying funds that invest primarily in commodities. LifePath Dynamic 2050 Fund’s returns between December 14, 2015 and November 7, 2016 are the returns of LifePath Dynamic 2050 Fund when it incorporated different allocations in its glidepath and had a different investment strategy. LifePath Dynamic 2050 Fund’s returns prior to December 14, 2015 are the returns of LifePath Dynamic 2050 Fund under a different investment strategy. LifePath Dynamic 2050 Fund’s returns prior to November 28, 2014 are the returns of LifePath Dynamic 2050 Fund when it had a different glidepath and target asset allocation. | |
N/A — Not applicable as share class and index do not have a sales charge.
Past performance is not indicative of future results.
Performance results may include adjustments made for financial reporting purposes in accordance with U.S. generally accepted accounting principles.
| | |
| Fund Summary as of December 31, 2019 | | BlackRock LifePath® Dynamic 2060 Fund |
Investment Objective
The investment objective ofBlackRock LifePath® Dynamic 2060 Fund (“LifePath Dynamic 2060 Fund” or the “LifePath Dynamic Fund”) is to seek to provide for retirement outcomes based on quantitatively measured risk. In pursuit of this objective, LifePath Dynamic 2060 Fund will be broadly diversified across global asset classes, with asset allocations becoming more conservative over time.
TOTAL RETURN BASED ON A $10,000 INVESTMENT
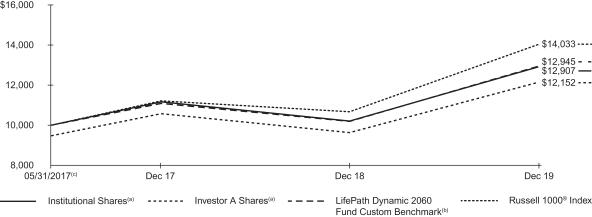
| (a) | Assuming maximum sales charges, transaction costs and other operating expenses, including advisory fees, if any. Institutional Shares do not have a sales charge. |
| (b) | The LifePath Dynamic Fund compares its performance to that of a customized weighted index (the “LifePath Dynamic 2060 Fund Custom Benchmark”) comprised of the indexes indicated below, which reflects the investment adviser’s changes to the benchmark’s weightings over time. The investment adviser adjusts the weightings of these indexes periodically based upon its evaluation and adjustment of the LifePath Dynamic Fund’s asset allocation strategy. The weightings are presented annually but they are adjusted quarterly. |
| (c) | Commencement of operations. |
The LifePath Dynamic Fund’s custom benchmark consists of the following:
| | | | | | | | | | | | | | | | | | | | | | | | | | | | |
| Period | | Bloomberg
Barclays
U.S. Aggregate
Bond Index | | | Bloomberg Barclays
U.S. Treasury Inflation
Protected Securities
(TIPS) Index (Series L) | | | Bloomberg
Commodity
Index | | | FTSE
EPRA Nareit
Developed
Index | | | MSCI
ACWI ex USA
IMI Index | | | Russell
1000®
Index | | | Russell
2000®
Index | |
05/31/17(a) to 12/31/17 | | | 1.0 | % | | | N/A | | | | 4.3 | % | | | 15.3 | % | | | 30.9 | % | | | 47.5 | % | | | 1.0 | % |
01/01/18 to 12/31/18 | | | 1.0 | | | | N/A | | | | N/A | | | | 16.1 | | | | 31.8 | | | | 50.1 | | | | 1.0 | |
01/01/19 to 12/31/19 | | | 1.0 | | | | 0.1 | % | | | N/A | | | | 4.8 | | | | 40.1 | | | | 52.0 | | | | 2.0 | |
| | (a) | Commencement of operations. | |
See “About Fund Performance” on page 16 for descriptions of the indexes.
| | |
| 14 | | 2019 BLACKROCK ANNUAL REPORTTO SHAREHOLDERS |
| | |
| Fund Summary as of December 31, 2019 (continued) | | BlackRock LifePath® Dynamic 2060 Fund |
Performance Summary for the Period Ended December 31, 2019
| | | | | | | | | | | | | | | | | | | | | | | | | | | | |
| | | | | | | | | Average Annual Total Returns (a) | |
| | | | | | | | | 1 Year | | | | | | Since Inception (b) | |
| | | 6-Month
Total Returns | | | | | | w/o sales
charge | | | w/sales
charge | | | | | | w/o sales
charge | | | w/sales
charge | |
Institutional | | | 8.54 | % | | | | | | | 26.47 | % | | | N/A | | | | | | | | 10.36 | % | | | N/A | |
Investor A | | | 8.34 | | | | | | | | 26.20 | | | | 19.58 | % | | | | | | | 10.09 | | | | 7.82 | % |
Investor C | | | 7.95 | | | | | | | | 25.09 | | | | 24.09 | | | | | | | | 9.20 | | | | 9.20 | |
Class K | | | 8.62 | | | | | | | | 26.74 | | | | N/A | | | | | | | | 10.58 | | | | N/A | |
Class R | | | 8.32 | | | | | | | | 25.92 | | | | N/A | | | | | | | | 9.87 | | | | N/A | |
LifePath Dynamic 2060 Fund Custom Benchmark | | | 9.11 | | | | | | | | 26.95 | | | | N/A | | | | | | | | 10.51 | | | | N/A | |
Bloomberg Barclays U.S. Aggregate Bond Index | | | 2.45 | | | | | | | | 8.72 | | | | N/A | | | | | | | | 3.74 | | | | N/A | |
Bloomberg Barclays U.S. TIPS Index (Series L) | | | 2.15 | | | | | | | | 8.43 | | | | N/A | | | | | | | | 3.14 | | | | N/A | |
FTSE EPRA Nareit Developed Index | | | 6.46 | | | | | | | | 21.91 | | | | N/A | | | | | | | | 7.99 | | | | N/A | |
MSCI ACWI ex USA IMI Index | | | 7.33 | | | | | | | | 21.63 | | | | N/A | | | | | | | | 6.02 | | | | N/A | |
Russell 1000® Index | | | 10.59 | | | | | | | | 31.43 | | | | N/A | | | | | | | | 14.00 | | | | N/A | |
Russell 2000® Index | | | 7.30 | | | | | | | | 25.52 | | | | N/A | | | | | | | | 9.41 | | | | N/A | |
| | (a) | Assuming maximum sales charges, if any. Average annual total returns with and without sales charges reflect reductions for distributions and service fees. See “About Fund Performance” on page 16 for a detailed description of share classes, including any related sales charges and fees, and how performance was calculated for certain share classes. LifePath Dynamic 2060 Fund’s returns prior to March 31, 2018 are the returns of LifePath Dynamic 2060 Fund when its assets could be allocated to underlying funds that invest primarily in commodities. | |
| | (b) | The LifePath Dynamic Fund commenced operations on May 31, 2017. | |
N/A — Not applicable as share class and index do not have a sales charge.
Past performance is not indicative of future results.
Performance results may include adjustments made for financial reporting purposes in accordance with U.S. generally accepted accounting principles.
About Fund Performance
Institutional and Class K Shares are not subject to any sales charge. These shares bear no ongoing distribution or service fees and are available only to certain eligible investors.
Investor A Shares are subject to a maximum initial sales charge(front-end load) of 5.25% and a service fee of 0.25% per year (but no distribution fee). Certain redemptions of these shares may be subject to a contingent deferred sales charge (“CDSC”) where no initial sales charge was paid at the time of purchase. These shares are generally available through financial intermediaries.
Investor C Shares are subject to a 1.00% CDSC if redeemed within one year of purchase. In addition, these shares are subject to a distribution fee of 0.75% per year and a service fee of 0.25% per year. These shares are generally available through financial intermediaries. These shares automatically convert to Investor A Shares after approximately ten years. Except with respect to LifePath Dynamic 2060 Fund, Investor C Shares performance shown prior to the Investor C Shares inception date of May 3, 2010 is that of Institutional Shares (which have no distribution or service fees) and was restated to reflect Investor C Shares fees.
Class R Shares are not subject to any sales charge. These shares are subject to a distribution fee of 0.25% per year and a service fee of 0.25% per year. These shares are available only to certain employer-sponsored retirement plans. Except with respect to LifePath Dynamic 2060 Fund, Class R Shares performance shown prior to the Class R Shares inception date of May 3, 2010 is that of Institutional Shares (which have no distribution or service fees) and was restated to reflect Class R Shares fees.
Performance information reflects past performance and does not guarantee future results. Current performance may be lower or higher than the performance data quoted. Refer toblackrock.com to obtain performance data current to the most recent month-end. Performance results do not reflect the deduction of taxes that a shareholder would pay on fund distributions or the redemption of fund shares. Figures shown in the performance tables on the previous pages assume reinvestment of all distributions, if any, at net asset value (“NAV”) on the ex-dividend date. Investment return and principal value of shares will fluctuate so that shares, when redeemed, may be worth more or less than their original cost. Distributions paid to each class of shares will vary because of the different levels of service, distribution and transfer agency fees applicable to each class, which are deducted from the income available to be paid to shareholders.
BlackRock Advisors, LLC (“BAL” or the “Administrator”), each LifePath Dynamic Fund’s administrator, has contractually agreed to waive and/or reimburse a portion of each LifePath Dynamic Fund’s expenses. Without such waiver and/or reimbursement, each LifePath Dynamic Fund’s performance would have been lower. With respect to each Fund’s contractual waiver, the Administrator is under no obligation to continue waiving and/or reimbursing its fees after the applicable termination date of such agreement. See Note 4 of the Notes to Financial Statements for additional information on waivers and/or reimbursements.
The LifePath Dynamic Funds’ custom benchmarks are hypothetical representations of the performance of the respective LifePath Dynamic Fund’s asset classes according to their weightings as of the most recent quarter-end. The weightings of the various indexes that are included in the LifePath Dynamic Funds’ custom benchmarks are adjusted quarterly to reflect the LifePath Dynamic Funds’ changing asset allocations over time. As of December 31, 2019, the following indexes are used to calculate the LifePath Dynamic Funds’ custom benchmarks: Bloomberg Barclays U.S. Aggregate Bond Index, Bloomberg Barclays U.S. Treasury Inflation Protected Securities (TIPS) Index (Series L), FTSE EPRA Nareit Developed Index, MSCI ACWI ex USA IMI Index, Russell 1000® Index and Russell 2000® Index, as applicable.
The Bloomberg Barclays U.S. Aggregate Bond Index is a widely recognized unmanaged market-weighted index, comprised of investment-grade corporate bonds rated BBB or better, mortgages and U.S. Treasury and U.S. Government agency issues with at least one year to maturity. The Bloomberg Barclays U.S. Treasury Inflation Protected Securities (TIPS) Index (Series L) is an unmanaged index that measures the performance of the inflation-protected public obligations of the U.S. Treasury. The FTSE EPRA Nareit Developed Index is a global market capitalization weighted index composed of listed real estate securities from developed market countries in North America, Europe, and Asia. The MSCI ACWI ex USA IMI Index is a free float-adjusted market capitalization weighted index that measures the equity market performance of the developed (excluding the U.S.) and emerging investable market universe. The Russell 1000® Index is an index that measures the performance of the large-cap segment of the U.S. equity universe. It is a subset of the Russell 3000® Index and includes approximately 1,000 of the largest securities based on a combination of their market capitalization and current index membership. The Russell 1000® Index represents approximately 92% of the total market capitalization of the Russell 3000® Index. The Russell 2000® Index is an unmanaged index that is a subset of the Russell 3000® Index representing approximately 10% of the total market capitalization of that index. It includes approximately 2000 of the smallest securities based on a combination of their market cap and current index membership.
| | |
| 16 | | 2019 BLACKROCK ANNUAL REPORTTO SHAREHOLDERS |
Shareholders of each LifePath Dynamic Fund may incur the following charges: (a) transactional expenses, such as sales charges; and (b) operating expenses, including administration fees, service and distribution fees, including 12b-1 fees, acquired fund fees and expenses, and other fund expenses. The expense examples shown below (which are based on a hypothetical investment of $1,000 invested on July 1, 2019 and held through December 31, 2019) are intended to assist shareholders both in calculating expenses based on an investment in each LifePath Dynamic Fund and in comparing these expenses with similar costs of investing in other mutual funds.
The expense examples provide information about actual account values and actual expenses. In order to estimate the expenses a shareholder paid during the period covered by this report, shareholders can divide their account value by $1,000 and then multiply the result by the number corresponding to their LifePath Dynamic Fund and share class under the heading entitled “Expenses Paid During the Period.”
The expense examples also provide information about hypothetical account values and hypothetical expenses based on a LifePath Dynamic Fund’s actual expense ratio and an assumed rate of return of 5% per year before expenses. In order to assist shareholders in comparing the ongoing expenses of investing in a LifePath Dynamic Fund and other funds, compare the 5% hypothetical examples with the 5% hypothetical examples that appear in shareholder reports of other funds.
The expenses shown in the expense examples are intended to highlight shareholders’ ongoing costs only and do not reflect transactional expenses, such as sales charges, if any. Therefore, the hypothetical examples are useful in comparing ongoing expenses only, and will not help shareholders determine the relative total expenses of owning different funds. If these transactional expenses were included, shareholder expenses would have been higher.
Expense Examples
| | | | | | | | | | | | | | | | | | | | | | | | | | | | | | | | |
| | | Actual | | | | | | Hypothetical (b) | | | | |
| | | Beginning
Account Value
(07/01/19) | | | Ending
Account Value
(12/31/19) | | | Expenses
Paid During
the Period (a) | | | | | | Beginning
Account Value
(07/01/19) | | | Ending
Account Value
(12/31/19) | | | Expenses
Paid During
the Period (a) | | | Annualized
Expense
Ratio | |
| LifePath Dynamic Retirement Fund | | | | | |
Institutional | | $ | 1,000.00 | | | $ | 1,047.30 | | | $ | 2.79 | | | | | | | $ | 1,000.00 | | | $ | 1,022.48 | | | $ | 2.75 | | | | 0.54 | % |
Investor A | | | 1,000.00 | | | | 1,045.90 | | | | 4.02 | | | | | | | | 1,000.00 | | | | 1,021.27 | | | | 3.97 | | | | 0.78 | |
Investor C | | | 1,000.00 | | | | 1,041.60 | | | | 8.03 | | | | | | | | 1,000.00 | | | | 1,017.34 | | | | 7.93 | | | | 1.56 | |
Class K | | | 1,000.00 | | | | 1,048.40 | | | | 1.70 | | | | | | | | 1,000.00 | | | | 1,023.54 | | | | 1.68 | | | | 0.33 | |
Class R | | | 1,000.00 | | | | 1,043.90 | | | | 5.10 | | | | | | | | 1,000.00 | | | | 1,020.21 | | | | 5.04 | | | | 0.99 | |
| | | | | | | | | | | | | | | | | | | | | | | | | | | | | | | | | |
| LifePath Dynamic 2030 Fund | | | | | | | | | | | | | | | | | | | | | | | | | | | | | |
Institutional | | $ | 1,000.00 | | | $ | 1,067.10 | | | $ | 2.81 | | | | | | | $ | 1,000.00 | | | $ | 1,022.48 | | | $ | 2.75 | | | | 0.54 | % |
Investor A | | | 1,000.00 | | | | 1,065.70 | | | | 4.11 | | | | | | | | 1,000.00 | | | | 1,021.22 | | | | 4.02 | | | | 0.79 | |
Investor C | | | 1,000.00 | | | | 1,061.10 | | | | 8.26 | | | | | | | | 1,000.00 | | | | 1,017.19 | | | | 8.08 | | | | 1.59 | |
Class K | | | 1,000.00 | | | | 1,067.70 | | | | 1.82 | | | | | | | | 1,000.00 | | | | 1,023.44 | | | | 1.79 | | | | 0.35 | |
Class R | | | 1,000.00 | | | | 1,063.90 | | | | 5.20 | | | | | | | | 1,000.00 | | | | 1,020.16 | | | | 5.09 | | | | 1.00 | |
| | | | | | | | | | | | | | | | | | | | | | | | | | | | | | | | | |
| LifePath Dynamic 2040 Fund | | | | | | | | | | | | | | | | | | | | | | | | | | | | | |
Institutional | | $ | 1,000.00 | | | $ | 1,081.00 | | | $ | 2.83 | | | | | | | $ | 1,000.00 | | | $ | 1,022.48 | | | $ | 2.75 | | | | 0.54 | % |
Investor A | | | 1,000.00 | | | | 1,078.60 | | | | 4.14 | | | | | | | | 1,000.00 | | | | 1,021.22 | | | | 4.02 | | | | 0.79 | |
Investor C | | | 1,000.00 | | | | 1,075.00 | | | | 8.32 | | | | | | | | 1,000.00 | | | | 1,017.19 | | | | 8.08 | | | | 1.59 | |
Class K | | | 1,000.00 | | | | 1,081.70 | | | | 1.78 | | | | | | | | 1,000.00 | | | | 1,023.49 | | | | 1.73 | | | | 0.34 | |
Class R | | | 1,000.00 | | | | 1,078.20 | | | | 5.24 | | | | | | | | 1,000.00 | | | | 1,020.16 | | | | 5.09 | | | | 1.00 | |
| | | | | | | | | | | | | | | | | | | | | | | | | | | | | | | | | |
| LifePath Dynamic 2050 Fund | | | | | | | | | | | | | | | | | | | | | | | | | | | | | |
Institutional | | $ | 1,000.00 | | | $ | 1,084.90 | | | $ | 2.84 | | | | | | | $ | 1,000.00 | | | $ | 1,022.48 | | | $ | 2.75 | | | | 0.54 | % |
Investor A | | | 1,000.00 | | | | 1,083.70 | | | | 4.15 | | | | | | | | 1,000.00 | | | | 1,021.22 | | | | 4.02 | | | | 0.79 | |
Investor C | | | 1,000.00 | | | | 1,079.20 | | | | 8.33 | | | | | | | | 1,000.00 | | | | 1,017.19 | | | | 8.08 | | | | 1.59 | |
Class K | | | 1,000.00 | | | | 1,086.30 | | | | 1.79 | | | | | | | | 1,000.00 | | | | 1,023.49 | | | | 1.73 | | | | 0.34 | |
Class R | | | 1,000.00 | | | | 1,082.90 | | | | 5.25 | | | | | | | | 1,000.00 | | | | 1,020.16 | | | | 5.09 | | | | 1.00 | |
| | | | | | | | | | | | | | | | | | | | | | | | | | | | | | | | | |
| LifePath Dynamic 2060 Fund | | | | | | | | | | | | | | | | | | | | | | | | | | | | | |
Institutional | | $ | 1,000.00 | | | $ | 1,085.40 | | | $ | 2.84 | | | | | | | $ | 1,000.00 | | | $ | 1,022.48 | | | $ | 2.75 | | | | 0.54 | % |
Investor A | | | 1,000.00 | | | | 1,083.40 | | | | 4.15 | | | | | | | | 1,000.00 | | | | 1,021.22 | | | | 4.02 | | | | 0.79 | |
Investor C | | | 1,000.00 | | | | 1,079.50 | | | | 8.44 | | | | | | | | 1,000.00 | | | | 1,017.09 | | | | 8.19 | | | | 1.61 | |
Class K | | | 1,000.00 | | | | 1,086.20 | | | | 1.89 | | | | | | | | 1,000.00 | | | | 1,023.39 | | | | 1.84 | | | | 0.36 | |
Class R | | | 1,000.00 | | | | 1,083.20 | | | | 5.20 | | | | | | | | 1,000.00 | | | | 1,020.21 | | | | 5.04 | | | | 0.99 | |
| | (a) | For each class of the LifePath Dynamic Funds, expenses are equal to the annualized net expense ratio for the class, multiplied by the average account value over the period, multiplied by 184/365 (to reflect the one-half year period shown). Because each LifePath Dynamic Fund invests all of its assets in a LifePath Dynamic Master Portfolio, the expense examples reflect the net expenses of both the LifePath Dynamic Fund and the LifePath Dynamic Master Portfolio in which it invests. | |
| | (b) | Hypothetical 5% annual return before expenses is calculated by prorating the number of days in the most recent fiscal half year divided by 365. | |
| | | | |
| DISCLOSURE OF EXPENSES | | | 17 | |
Derivative Financial Instruments
The LifePath Dynamic Master Portfolios may invest in various derivative financial instruments. These instruments are used to obtain exposure to a security, commodity, index, market, and/or other assets without owning or taking physical custody of securities, commodities and/or other referenced assets or to manage market, equity, credit, interest rate, foreign currency exchange rate, commodity and/or other risks. Derivative financial instruments may give rise to a form of economic leverage and involve risks, including the imperfect correlation between the value of a derivative financial instrument and the underlying asset, possible default of the counterparty to the transaction or illiquidity of the instrument. The LifePath Dynamic Master Portfolios’ successful use of a derivative financial instrument depends on the investment adviser’s ability to predict pertinent market movements accurately, which cannot be assured. The use of these instruments may result in losses greater than if they had not been used, may limit the amount of appreciation a LifePath Dynamic Master Portfolio can realize on an investment and/or may result in lower distributions paid to shareholders. The LifePath Dynamic Master Portfolios’ investments in these instruments, if any, are discussed in detail in the Notes to Financial Statements.
| | |
| 18 | | 2019 BLACKROCK ANNUAL REPORTTO SHAREHOLDERS |
Statements of Assets and Liabilities
December 31, 2019
| | | | | | | | | | | | | | | | | | | | |
| | | BlackRock LifePath
Dynamic Retirement
Fund | | | BlackRock LifePath
Dynamic 2030
Fund | | | BlackRock LifePath
Dynamic 2040
Fund | | | BlackRock LifePath
Dynamic 2050
Fund | | | BlackRock LifePath
Dynamic 2060
Fund | |
|
ASSETS | |
Investments at value — from the applicable LifePath Dynamic Master Portfolio | | $ | 408,508,193 | | | $ | 350,827,109 | | | $ | 289,474,849 | | | $ | 113,818,194 | | | $ | 4,285,474 | |
Receivables: | |
Capital shares sold | | | 392,908 | | | | 751,934 | | | | 583,514 | | | | 479,675 | | | | 3,820 | |
Withdrawals from the LifePath Dynamic Master Portfolio | | | 3,578,186 | | | | 1,701,113 | | | | 1,762,152 | | | | 952,725 | | | | — | |
Prepaid expenses | | | — | | | | — | | | | — | | | | — | | | | 632 | |
| | | | | | | | | | | | | | | | | | | | |
Total assets | | | 412,479,287 | | | | 353,280,156 | | | | 291,820,515 | | | | 115,250,594 | | | | 4,289,926 | |
| | | | | | | | | | | | | | | | | | | | |
|
LIABILITIES | |
Payables: | |
Administration fees | | | 215,046 | | | | 183,133 | | | | 149,497 | | | | 58,671 | | | | — | |
Capital gains distributions | | | 96,333 | | | | 318,806 | | | | 322,319 | | | | 127,179 | | | | 23,780 | |
Capital shares redeemed | | | 3,971,094 | | | | 2,453,047 | | | | 2,345,666 | | | | 1,432,400 | | | | — | |
Contributions to the LifePath Dynamic Master Portfolio | | | — | | | | — | | | | — | | | | — | | | | 3,820 | |
Income dividend distributions | | | 63,358 | | | | 73,507 | | | | 71,802 | | | | 31,002 | | | | 22,757 | |
Professional fees | | | 20,617 | | | | 11,007 | | | | 11,002 | | | | 11,004 | | | | 10,993 | |
Service and distribution fees | | | 56,587 | | | | 50,427 | | | | 41,281 | | | | 18,742 | | | | 177 | |
| | | | | | | | | | | | | | | | | | | | |
Total liabilities | | | 4,423,035 | | | | 3,089,927 | | | | 2,941,567 | | | | 1,678,998 | | | | 61,527 | |
| | | | | | | | | | | | | | | | | | | | |
| | | | | |
NET ASSETS | | $ | 408,056,252 | | | $ | 350,190,229 | | | $ | 288,878,948 | | | $ | 113,571,596 | | | $ | 4,228,399 | |
| | | | | | | | | | | | | | | | | | | | |
|
NET ASSETS CONSIST OF | |
Paid-in capital | | $ | 301,184,954 | | | $ | 320,978,236 | | | $ | 223,128,625 | | | $ | 91,924,742 | | | $ | 3,823,364 | |
Accumulated earnings | | | 106,871,298 | | | | 29,211,993 | | | | 65,750,323 | | | | 21,646,854 | | | | 405,035 | |
| | | | | | | | | | | | | | | | | | | | |
NET ASSETS | | $ | 408,056,252 | | | $ | 350,190,229 | | | $ | 288,878,948 | | | $ | 113,571,596 | | | $ | 4,228,399 | |
| | | | | | | | | | | | | | | | | | | | |
|
NET ASSET VALUE | |
|
| Institutional | |
Net assets | | $ | 99,249,012 | | | $ | 73,529,998 | | | $ | 60,508,460 | | | $ | 16,870,031 | | | $ | 236,623 | |
| | | | | | | | | | | | | | | | | | | | |
Shares outstanding(a) | | | 8,993,923 | | | | 5,388,381 | | | | 3,514,717 | | | | 827,277 | | | | 20,627 | |
| | | | | | | | | | | | | | | | | | | | |
Net asset value | | $ | 11.04 | | | $ | 13.65 | | | $ | 17.22 | | | $ | 20.39 | | | $ | 11.47 | |
| | | | | | | | | | | | | | | | | | | | |
|
| Investor A | |
Net assets | | $ | 234,757,219 | | | $ | 212,100,301 | | | $ | 173,102,939 | | | $ | 75,985,618 | | | $ | 389,938 | |
| | | | | | | | | | | | | | | | | | | | |
Shares outstanding(a) | | | 24,515,825 | | | | 16,295,895 | | | | 11,208,551 | | | | 3,740,690 | | | | 34,022 | |
| | | | | | | | | | | | | | | | | | | | |
Net asset value | | $ | 9.58 | | | $ | 13.02 | | | $ | 15.44 | | | $ | 20.31 | | | $ | 11.46 | |
| | | | | | | | | | | | | | | | | | | | |
|
| Investor C | |
Net assets | | $ | 3,846,438 | | | $ | 3,745,629 | | | $ | 3,275,879 | | | $ | 1,774,294 | | | $ | 32,860 | |
| | | | | | | | | | | | | | | | | | | | |
Shares outstanding(a) | | | 353,884 | | | | 280,781 | | | | 193,994 | | | | 88,616 | | | | 2,869 | |
| | | | | | | | | | | | | | | | | | | | |
Net asset value | | $ | 10.87 | | | $ | 13.34 | | | $ | 16.89 | | | $ | 20.02 | | | $ | 11.45 | |
| | | | | | | | | | | | | | | | | | | | |
|
| Class K | |
Net assets | | $ | 64,912,912 | | | $ | 56,168,281 | | | $ | 47,987,029 | | | $ | 16,383,278 | | | $ | 3,384,022 | |
| | | | | | | | | | | | | | | | | | | | |
Shares outstanding(a) | | | 5,907,680 | | | | 4,125,404 | | | | 2,771,140 | | | | 800,620 | | | | 294,755 | |
| | | | | | | | | | | | | | | | | | | | |
Net asset value | | $ | 10.99 | | | $ | 13.62 | | | $ | 17.32 | | | $ | 20.46 | | | $ | 11.48 | |
| | | | | | | �� | | | | | | | | | | | | | |
|
| Class R | |
Net assets | | $ | 5,290,671 | | | $ | 4,646,020 | | | $ | 4,004,641 | | | $ | 2,558,375 | | | $ | 184,956 | |
| | | | | | | | | | | | | | | | | | | | |
Shares outstanding(a) | | | 484,766 | | | | 345,163 | | | | 235,317 | | | | 126,490 | | | | 16,137 | |
| | | | | | | | | | | | | | | | | | | | |
Net asset value | | $ | 10.91 | | | $ | 13.46 | | | $ | 17.02 | | | $ | 20.23 | | | $ | 11.46 | |
| | | | | | | | | | | | | | | | | | | | |
| (a) | Unlimited number of shares authorized, no par value. |
See notes to financial statements.
Statements of Operations
Year Ended December 31, 2019
| | | | | | | | | | | | | | | | | | | | |
| | | BlackRock LifePath
Dynamic Retirement
Fund | | | BlackRock LifePath
Dynamic 2030
Fund | | | BlackRock LifePath
Dynamic 2040
Fund | | | BlackRock LifePath
Dynamic 2050
Fund | | | BlackRock LifePath
Dynamic 2060
Fund | |
|
INVESTMENT INCOME | |
Net investment income allocated from the applicable LifePath Dynamic Master Portfolio: | | | | | | | | | | | | | | | | | | | | |
Dividends — affiliated | | $ | 2,597,163 | | | $ | 5,865,075 | | | $ | 5,814,217 | | | $ | 2,361,673 | | | $ | 66,117 | |
Interest — affiliated | | | 2,492,411 | | | | 2,942,446 | | | | 1,001,227 | | | | 165,374 | | | | 4,349 | |
Dividends — unaffiliated | | | 4,876 | | | | 302,607 | | | | 394,145 | | | | 174,671 | | | | 5,812 | |
Securities lending income — affiliated — net | | | 5,928 | | | | 19,704 | | | | 20,632 | | | | 10,126 | | | | — | |
Foreign taxes withheld | | | (1,619 | ) | | | (26,446 | ) | | | (36,781 | ) | | | (15,511 | ) | | | (414 | ) |
Expenses | | | (931,741 | ) | | | (2,041,505 | ) | | | (1,697,797 | ) | | | (673,237 | ) | | | (42,764 | ) |
Fees waived | | | 615,805 | | | | 1,361,335 | | | | 1,154,375 | | | | 463,682 | | | | 37,240 | |
| | | | | | | | | | | | | | | | | | | | |
Total investment income | | | 4,782,823 | | | | 8,423,216 | | | | 6,650,018 | | | | 2,486,778 | | | | 70,340 | |
| | | | | | | | | | | | | | | | | | | | |
|
FUND EXPENSES | |
Administration — class specific | | | 511,026 | | | | 1,093,849 | | | | 886,226 | | | | 347,385 | | | | 4,758 | |
Reorganization costs | | | 20,750 | | | | — | | | | — | | | | — | | | | — | |
Service and distribution — class specific | | | 247,560 | | | | 608,194 | | | | 489,252 | | | | 220,913 | | | | 902 | |
Professional | | | 11,001 | | | | 11,000 | | | | 11,000 | | | | 11,000 | | | | 10,981 | |
Miscellaneous | | | 1,142 | | | | 2,143 | | | | 543 | | | | 400 | | | | 57 | |
| | | | �� | | | | | | | | | | | | | | | | |
Total expenses | | | 791,479 | | | | 1,715,186 | | | | 1,387,021 | | | | 579,698 | | | | 16,698 | |
Less fees waived and/or reimbursed by the Administrator/Manager | | | (31,751 | ) | | | (11,000 | ) | | | (11,000 | ) | | | (11,000 | ) | | | (10,981 | ) |
| | | | | | | | | | | | | | | | | | | | |
Total expenses after fees waived and/or reimbursed | | | 759,728 | | | | 1,704,186 | | | | 1,376,021 | | | | 568,698 | | | | 5,717 | |
| | | | | | | | | | | | | | | | | | | | |
Net investment income | | | 4,023,095 | | | | 6,719,030 | | | | 5,273,997 | | | | 1,918,080 | | | | 64,623 | |
| | | | | | | | | | | | | | | | | | | | |
| | | | | |
REALIZED AND UNREALIZED GAIN ALLOCATED FROM THE APPLICABLE LIFEPATH DYNAMIC MASTER PORTFOLIO | | | | | | | | | | | | | | | | | | | | |
Net realized gain from investments, futures contracts, forward foreign currency exchange contracts, foreign currency transactions and payment from affiliate | | | 7,324,884 | | | | 23,238,353 | | | | 22,572,490 | | | | 8,239,144 | | | | 153,586 | |
Net change in unrealized appreciation (depreciation) on investments, futures contracts, forward foreign currency exchange contracts and foreign currency translations | | | 12,174,336 | | | | 35,508,869 | | | | 33,542,118 | | | | 13,666,366 | | | | 449,266 | |
| | | | | | | | | | | | | | | | | | | | |
Net realized and unrealized gain | | | 19,499,220 | | | | 58,747,222 | | | | 56,114,608 | | | | 21,905,510 | | | | 602,852 | |
| | | | | | | | | | | | | | | | | | | | |
NET INCREASE IN NET ASSETS RESULTING FROM OPERATIONS | | $ | 23,522,315 | | | $ | 65,466,252 | | | $ | 61,388,605 | | | $ | 23,823,590 | | | $ | 667,475 | |
| | | | | | | | | | | | | | | | | | | | |
See notes to financial statements.
| | |
| 20 | | 2019 BLACKROCK ANNUAL REPORTTO SHAREHOLDERS |
Statements of Changes in Net Assets
| | | | | | | | | | | | | | | | | | | | |
| | | BlackRock LifePath
Dynamic Retirement Fund | | | | | | BlackRock LifePath
Dynamic 2030 Fund | |
| | | Year Ended December 31, | | | | | | Year Ended December 31, | |
| | | 2019 | | | 2018 | | | | | | 2019 | | | 2018 | |
| | | | | |
INCREASE (DECREASE) IN NET ASSETS | | | | | | | | | | | | | | | | | | | | |
| | | | | |
OPERATIONS | | | | | | | | | | | | | | | | | | | | |
Net investment income | | $ | 4,023,095 | | | $ | 2,702,904 | | | | | | | $ | 6,719,030 | | | $ | 6,847,085 | |
Net realized gain | | | 7,324,884 | | | | 3,307,468 | | | | | | | | 23,238,353 | | | | 19,220,309 | |
Net change in unrealized appreciation (depreciation) | | | 12,174,336 | | | | (9,880,327 | ) | | | | | | | 35,508,869 | | | | (44,082,511 | ) |
| | | | | | | | | | | | | | | | | | | | |
Net increase (decrease) in net assets resulting from operations | | | 23,522,315 | | | | (3,869,955 | ) | | | | | | | 65,466,252 | | | | (18,015,117 | ) |
| | | | | | | | | | | | | | | | | | | | |
| | | | | |
DISTRIBUTIONS(a) | | | | | | | | | | | | | | | | | | | | |
Institutional | | | (1,832,284 | ) | | | (2,406,882 | ) | | | | | | | (4,440,293 | ) | | | (8,118,699 | ) |
Investor A | | | (4,663,112 | ) | | | (6,584,642 | ) | | | | | | | (13,286,373 | ) | | | (27,107,204 | ) |
Investor C | | | (53,190 | ) | | | (57,097 | ) | | | | | | | (196,209 | ) | | | (446,801 | ) |
Class K | | | (1,145,772 | ) | | | (1,355,265 | ) | | | | | | | (3,252,332 | ) | | | (3,444,124 | ) |
Class R | | | (87,526 | ) | | | (89,635 | ) | | | | | | | (251,450 | ) | | | (293,206 | ) |
| | | | | | | | | | | | | | | | | | | | |
Decrease in net assets resulting from distributions to shareholders | | | (7,781,884 | ) | | | (10,493,521 | ) | | | | | | | (21,426,657 | ) | | | (39,410,034 | ) |
| | | | | | | | | | | | | | | | | | | | |
| | | | | |
CAPITAL SHARE TRANSACTIONS | | | | | | | | | | | | | | | | | | | | |
Net increase (decrease) in net assets derived from capital share transactions | | | 284,854,744 | | | | (16,360,203 | ) | | | | | | | (461,025 | ) | | | (31,919,120 | ) |
| | | | | | | | | | | | | | | | | | | | |
| | | | | |
NET ASSETS | | | | | | | | | | | | | | | | | | | | |
Total increase (decrease) in net assets | | | 300,595,175 | | | | (30,723,679 | ) | | | | | | | 43,578,570 | | | | (89,344,271 | ) |
Beginning of year | | | 107,461,077 | | | | 138,184,756 | | | | | | | | 306,611,659 | | | | 395,955,930 | |
| | | | | | | | | | | | | | | | | | | | |
End of year | | $ | 408,056,252 | | | $ | 107,461,077 | | | | | | | $ | 350,190,229 | | | $ | 306,611,659 | |
| | | | | | | | | | | | | | | | | | | | |
| (a) | Distributions for annual periods determined in accordance with U.S. federal income tax regulations. |
See notes to financial statements.
Statements of Changes in Net Assets (continued)
| | | | | | | | | | | | | | | | | | | | |
| | | BlackRock LifePath
Dynamic 2040 Fund | | | | | | BlackRock LifePath
Dynamic 2050 Fund | |
| | | Year Ended December 31, | | | | | | Year Ended December 31, | |
| | | 2019 | | | 2018 | | | | | | 2019 | | | 2018 | |
| | | | | |
INCREASE (DECREASE) IN NET ASSETS | | | | | | | | | | | | | | | | | | | | |
| | | | | |
OPERATIONS | | | | | | | | | | | | | | | | | | | | |
Net investment income | | $ | 5,273,997 | | | $ | 5,150,084 | | | | | | | $ | 1,918,080 | | | $ | 1,599,726 | |
Net realized gain | | | 22,572,490 | | | | 17,885,075 | | | | | | | | 8,239,144 | | | | 6,552,689 | |
Net change in unrealized appreciation (depreciation) | | | 33,542,118 | | | | (43,537,526 | ) | | | | | | | 13,666,366 | | | | (16,388,946 | ) |
| | | | | | | | | | | | | | | | | | | | |
Net increase (decrease) in net assets resulting from operations | | | 61,388,605 | | | | (20,502,367 | ) | | | | | | | 23,823,590 | | | | (8,236,531 | ) |
| | | | | | | | | | | | | | | | | | | | |
| | | | | |
DISTRIBUTIONS(a) | | | | | | | | | | | | | | | | | | | | |
Institutional | | | (3,800,345 | ) | | | (6,790,780 | ) | | | | | | | (968,990 | ) | | | (1,828,736 | ) |
Investor A | | | (12,069,597 | ) | | | (24,073,191 | ) | | | | | | | (4,381,579 | ) | | | (9,761,167 | ) |
Investor C | | | (178,940 | ) | | | (308,963 | ) | | | | | | | (89,702 | ) | | | (168,958 | ) |
Class K | | | (2,914,363 | ) | | | (3,709,835 | ) | | | | | | | (867,152 | ) | | | (614,153 | ) |
Class R | | | (233,267 | ) | | | (277,484 | ) | | | | | | | (139,113 | ) | | | (222,605 | ) |
| | | | | | | | | | | | | | | | | | | | |
Decrease in net assets resulting from distributions to shareholders | | | (19,196,512 | ) | | | (35,160,253 | ) | | | | | | | (6,446,536 | ) | | | (12,595,619 | ) |
| | | | | | | | | | | | | | | | | | | | |
| | | | | |
CAPITAL SHARE TRANSACTIONS | | | | | | | | | | | | | | | | | | | | |
Net increase (decrease) in net assets derived from capital share transactions | | | (2,960,737 | ) | | | (12,925,013 | ) | | | | | | | 7,213,616 | | | | (11,756,039 | ) |
| | | | | | | | | | | | | | | | | | | | |
| | | | | |
NET ASSETS | | | | | | | | | | | | | | | | | | | | |
Total increase (decrease) in net assets | | | 39,231,356 | | | | (68,587,633 | ) | | | | | | | 24,590,670 | | | | (32,588,189 | ) |
Beginning of year | | | 249,647,592 | | | | 318,235,225 | | | | | | | | 88,980,926 | | | | 121,569,115 | |
| | | | | | | | | | | | | | | | | | | | |
End of year | | $ | 288,878,948 | | | $ | 249,647,592 | | | | | | | $ | 113,571,596 | | | $ | 88,980,926 | |
| | | | | | | | | | | | | | | | | | | | |
| (a) | Distributions for annual periods determined in accordance with U.S. federal income tax regulations. |
See notes to financial statements.
| | |
| 22 | | 2019 BLACKROCK ANNUAL REPORTTO SHAREHOLDERS |
Statements of Changes in Net Assets (continued)
| | | | | | | | |
| | | BlackRock LifePath
Dynamic 2060 Fund | |
| | | Year Ended December 31, | |
| | | 2019 | | | 2018 | |
|
INCREASE (DECREASE) IN NET ASSETS | |
|
OPERATIONS | |
Net investment income | | $ | 64,623 | | | $ | 43,578 | |
Net realized gain | | | 153,586 | | | | 6,701 | |
Net change in unrealized appreciation (depreciation) | | | 449,266 | | | | (246,243 | ) |
| | | | | | | | |
Net increase (decrease) in net assets resulting from operations | | | 667,475 | | | | (195,964 | ) |
| | | | | | | | |
|
DISTRIBUTIONS(a) | |
Institutional | | | (5,909 | ) | | | (1,528 | ) |
Investor A | | | (8,512 | ) | | | (4,804 | ) |
Investor C | | | (653 | ) | | | (1,642 | ) |
Class K | | | (91,308 | ) | | | (152,339 | ) |
Class R | | | (3,748 | ) | | | (1,407 | ) |
| | | | | | | | |
Decrease in net assets resulting from distributions to shareholders | | | (110,130 | ) | | | (161,720 | ) |
| | | | | | | | |
|
CAPITAL SHARE TRANSACTIONS | |
Net increase in net assets derived from capital share transactions | | | 1,671,724 | | | | 135,001 | |
| | | | | | | | |
|
NET ASSETS | |
Total increase (decrease) in net assets | | | 2,229,069 | | | | (222,683 | ) |
Beginning of year | | | 1,999,330 | | | | 2,222,013 | |
| | | | | | | | |
End of year | | $ | 4,228,399 | | | $ | 1,999,330 | |
| | | | | | | | |
| (a) | Distributions for annual periods determined in accordance with U.S. federal income tax regulations. |
See notes to financial statements.
Financial Highlights
(For a share outstanding throughout each period)
| | | | | | | | | | | | | | | | | | | | |
| | | BlackRock LifePath Dynamic Retirement Fund | |
| |
| | | Institutional | |
| |
| | | Year Ended December 31, | |
| | | 2019 | | | 2018 | | | 2017 | | | 2016 | | | 2015 | |
| | | | | |
Net asset value, beginning of year | | $ | 9.69 | | | $ | 11.00 | | | $ | 10.78 | | | $ | 10.33 | | | $ | 11.07 | |
| | | | | | | | | | | | | | | | | | | | |
Net investment income(a) | | | 0.28 | | | | 0.25 | | | | 0.19 | | | | 0.18 | | | | 0.16 | |
Net realized and unrealized gain (loss) | | | 1.35 | | | | (0.64 | ) | | | 1.05 | | | | 0.43 | | | | (0.33 | ) |
| | | | | | | | | | | | | | | | | | | | |
Net increase (decrease) from investment operations | | | 1.63 | | | | (0.39 | ) | | | 1.24 | | | | 0.61 | | | | (0.17 | ) |
| | | | | | | | | | | | | | | | | | | | |
|
Distributions(b) | |
From net investment income | | | (0.19 | ) | | | (0.27 | ) | | | (0.15 | ) | | | (0.16 | ) | | | (0.20 | ) |
From net realized gain | | | (0.09 | ) | | | (0.65 | ) | | | (0.87 | ) | | | (0.00 | )(c) | | | (0.36 | ) |
From return of capital | | | — | | | | — | | | | — | | | | — | | | | (0.01 | ) |
| | | | | | | | | | | | | | | | | | | | |
Total distributions | | | (0.28 | ) | | | (0.92 | ) | | | (1.02 | ) | | | (0.16 | ) | | | (0.57 | ) |
| | | | | | | | | | | | | | | | | | | | |
| | | | | |
Net asset value, end of year | | $ | 11.04 | | | $ | 9.69 | | | $ | 11.00 | | | $ | 10.78 | | | $ | 10.33 | |
| | | | | | | | | | | | | | | | | | | | |
|
Total Return(d) | |
Based on net asset value | | | 16.91 | % | | | (3.68 | )% | | | 11.68 | % | | | 5.91 | % | | | (1.52 | )% |
| | | | | | | | | | | | | | | | | | | | |
|
Ratios to Average Net Assets(e)(f) | |
Total expenses | | | 0.57 | % | | | 0.58 | % | | | 0.57 | % | | | 0.58 | % | | | 0.75 | % |
| | | | | | | | | | | | | | | | | | | | |
Total expenses after fees waived and/or reimbursed | | | 0.55 | % | | | 0.57 | % | | | 0.56 | % | | | 0.58 | % | | | 0.70 | % |
| | | | | | | | | | | | | | | | | | | | |
Net investment income | | | 2.61 | % | | | 2.26 | % | | | 1.66 | % | | | 1.66 | % | | | 1.48 | % |
| | | | | | | | | | | | | | | | | | | | |
|
Supplemental Data | |
Net assets, end of year (000) | | $ | 99,249 | | | $ | 25,343 | | | $ | 38,119 | | | $ | 60,166 | | | $ | 141,034 | |
| | | | | | | | | | | | | | | | | | | | |
Portfolio turnover rate of the LifePath Dynamic Master Portfolio(g) | | | 35 | % | | | 38 | % | | | 6 | % | | | 37 | % | | | 21 | % |
| | | | | | | | | | | | | | | | | | | | |
| (a) | Based on average shares outstanding. |
| (b) | Distributions for annual periods determined in accordance with U.S. federal income tax regulations. |
| (c) | Amount is greater than $(0.005) per share. |
| (d) | Where applicable, assumes the reinvestment of distributions. |
| (e) | Includes the LifePath Dynamic Fund’s share of its corresponding LifePath Dynamic Master Portfolio’s allocated net expenses and/or net investment income. |
| (f) | Includes the LifePath Dynamic Fund’s share of its corresponding LifePath Dynamic Master Portfolio’s allocated fees waived and expenses and/or net investment income. Excludes expenses incurred indirectly as a result of the LifePath Dynamic Master Portfolio’s investments in underlying funds as follows: |
| | | | | | | | | | | | | | | | | | | | |
| | | Year Ended December 31, | |
| | | 2019 | | | 2018 | | | 2017 | | | 2016 | | | 2015 | |
Allocated fees waived | | | 0.39 | % | | | 0.37 | % | | | 0.38 | % | | | 0.35 | % | | | 0.31 | % |
Investments in underlying funds | | | 0.08 | % | | | 0.09 | % | | | 0.12 | % | | | 0.10 | % | | | 0.09 | % |
| | | | | | | | | | | | | | | | | | | | |
| (g) | Includes the LifePath Dynamic Master Portfolio’s purchases and sales of the underlying funds and Active Stock Master Portfolio, CoreAlpha Bond Master Portfolio, International Tilts Master Portfolio and Master Total Return Portfolio. |
See notes to financial statements.
| | |
| 24 | | 2019 BLACKROCK ANNUAL REPORTTO SHAREHOLDERS |
Financial Highlights (continued)
(For a share outstanding throughout each period)
| | | | | | | | | | | | | | | | | | | | |
| | | BlackRock LifePath Dynamic Retirement Fund (continued) | |
| |
| | | Investor A | |
| |
| | | Year Ended December 31, | |
| | | 2019 | | | 2018 | | | 2017 | | | 2016 | | | 2015 | |
| | | | | |
Net asset value, beginning of year | | $ | 8.45 | | | $ | 9.72 | | | $ | 9.64 | | | $ | 9.25 | | | $ | 9.99 | |
| | | | | | | | | | | | | | | | | | | | |
Net investment income(a) | | | 0.23 | | | | 0.20 | | | | 0.14 | | | | 0.14 | | | | 0.12 | |
Net realized and unrealized gain (loss) | | | 1.16 | | | | (0.57 | ) | | | 0.94 | | | | 0.39 | | | | (0.30 | ) |
| | | | | | | | | | | | | | | | | | | | |
Net increase (decrease) from investment operations | | | 1.39 | | | | (0.37 | ) | | | 1.08 | | | | 0.53 | | | | (0.18 | ) |
| | | | | | | | | | | | | | | | | | | | |
|
Distributions(b) | |
From net investment income | | | (0.17 | ) | | | (0.25 | ) | | | (0.13 | ) | | | (0.14 | ) | | | (0.19 | ) |
From net realized gain | | | (0.09 | ) | | | (0.65 | ) | | | (0.87 | ) | | | (0.00 | )(c) | | | (0.36 | ) |
From return of capital | | | — | | | | — | | | | — | | | | — | | | | (0.01 | ) |
| | | | | | | | | | | | | | | | | | | | |
Total distributions | | | (0.26 | ) | | | (0.90 | ) | | | (1.00 | ) | | | (0.14 | ) | | | (0.56 | ) |
| | | | | | | | | | | | | | | | | | | | |
| | | | | |
Net asset value, end of year | | $ | 9.58 | | | $ | 8.45 | | | $ | 9.72 | | | $ | 9.64 | | | $ | 9.25 | |
| | | | | | | | | | | | | | | | | | | | |
|
Total Return(d) | |
Based on net asset value | | | 16.56 | % | | | (3.93 | )% | | | 11.40 | % | | | 5.78 | % | | | (1.89 | )% |
| | | | | | | | | | | | | | | | | | | | |
|
Ratios to Average Net Assets(e)(f) | |
Total expenses | | | 0.82 | % | | | 0.83 | % | | | 0.82 | % | | | 0.84 | % | | | 1.00 | % |
| | | | | | | | | | | | | | | | | | | | |
Total expenses after fees waived and/or reimbursed | | | 0.80 | % | | | 0.82 | % | | | 0.82 | % | | | 0.83 | % | | | 0.95 | % |
| | | | | | | | | | | | | | | | | | | | |
Net investment income | | | 2.43 | % | | | 2.05 | % | | | 1.46 | % | | | 1.49 | % | | | 1.25 | % |
| | | | | | | | | | | | | | | | | | | | |
|
Supplemental Data | |
Net assets, end of year (000) | | $ | 234,757 | | | $ | 65,509 | | | $ | 81,900 | | | $ | 81,929 | | | $ | 102,207 | |
| | | | | | | | | | | | | | | | | | | | |
Portfolio turnover rate of the LifePath Dynamic Master Portfolio(g) | | | 35 | % | | | 38 | % | | | 6 | % | | | 37 | % | | | 21 | % |
| | | | | | | | | | | | | | | | | | | | |
| (a) | Based on average shares outstanding. |
| (b) | Distributions for annual periods determined in accordance with U.S. federal income tax regulations. |
| (c) | Amount is greater than $(0.005) per share. |
| (d) | Where applicable, excludes the effects of any sales charges and assumes the reinvestment of distributions. |
| (e) | Includes the LifePath Dynamic Fund’s share of its corresponding LifePath Dynamic Master Portfolio’s allocated net expenses and/or net investment income. |
| (f) | Includes the LifePath Dynamic Fund’s share of its corresponding LifePath Dynamic Master Portfolio’s allocated fees waived and expenses and/or net investment income. Excludes expenses incurred indirectly as a result of the LifePath Dynamic Master Portfolio’s investments in underlying funds as follows: |
| | | | | | | | | | | | | | | | | | | | |
| | | Year Ended December 31, | |
| | | 2019 | | | 2018 | | | 2017 | | | 2016 | | | 2015 | |
Allocated fees waived | | | 0.39 | % | | | 0.37 | % | | | 0.37 | % | | | 0.35 | % | | | 0.31 | % |
Investments in underlying funds | | | 0.08 | % | | | 0.09 | % | | | 0.12 | % | | | 0.10 | % | | | 0.09 | % |
| | | | | | | | | | | | | | | | | | | | |
| (g) | Includes the LifePath Dynamic Master Portfolio’s purchases and sales of the underlying funds and Active Stock Master Portfolio, CoreAlpha Bond Master Portfolio, International Tilts Master Portfolio and Master Total Return Portfolio. |
See notes to financial statements.
Financial Highlights (continued)
(For a share outstanding throughout each period)
| | | | | | | | | | | | | | | | | | | | |
| | | BlackRock LifePath Dynamic Retirement Fund (continued) | |
| |
| | | Investor C | |
| |
| | | Year Ended December 31, | |
| | | 2019 | | | 2018 | | | 2017 | | | 2016 | | | 2015 | |
| | | | | |
Net asset value, beginning of year | | $ | 9.57 | | | $ | 10.87 | | | $ | 10.67 | | | $ | 10.22 | | | $ | 10.97 | |
| | | | | | | | | | | | | | | | | | | | |
Net investment income(a) | | | 0.18 | | | | 0.13 | | | | 0.07 | | | | 0.07 | | | | 0.06 | |
Net realized and unrealized gain (loss) | | | 1.30 | | | | (0.63 | ) | | | 1.03 | | | | 0.44 | | | | (0.34 | ) |
| | | | | | | | | | | | | | | | | | | | |
Net increase (decrease) from investment operations | | | 1.48 | | | | (0.50 | ) | | | 1.10 | | | | 0.51 | | | | (0.28 | ) |
| | | | | | | | | | | | | | | | | | | | |
|
Distributions(b) | |
From net investment income | | | (0.09 | ) | | | (0.15 | ) | | | (0.04 | ) | | | (0.06 | ) | | | (0.10 | ) |
From net realized gain | | | (0.09 | ) | | | (0.65 | ) | | | (0.86 | ) | | | (0.00 | )(c) | | | (0.36 | ) |
From return of capital | | | — | | | | — | | | | — | | | | — | | | | (0.01 | ) |
| | | | | | | | | | | | | | | | | | | | |
Total distributions | | | (0.18 | ) | | | (0.80 | ) | | | (0.90 | ) | | | (0.06 | ) | | | (0.47 | ) |
| | | | | | | | | | | | | | | | | | | | |
| | | | | |
Net asset value, end of year | | $ | 10.87 | | | $ | 9.57 | | | $ | 10.87 | | | $ | 10.67 | | | $ | 10.22 | |
| | | | | | | | | | | | | | | | | | | | |
|
Total Return(d) | |
Based on net asset value | | | 15.54 | % | | | (4.67 | )% | | | 10.47 | % | | | 4.97 | % | | | (2.56 | )% |
| | | | | | | | | | | | | | | | | | | | |
|
Ratios to Average Net Assets(e)(f) | |
Total expenses | | | 1.62 | % | | | 1.63 | % | | | 1.62 | % | | | 1.63 | % | | | 1.76 | % |
| | | | | | | | | | | | | | | | | | | | |
Total expenses after fees waived and/or reimbursed | | | 1.60 | % | | | 1.62 | % | | | 1.62 | % | | | 1.63 | % | | | 1.70 | % |
| | | | | | | | | | | | | | | | | | | | |
Net investment income | | | 1.66 | % | | | 1.20 | % | | | 0.65 | % | | | 0.66 | % | | | 0.56 | % |
| | | | | | | | | | | | | | | | | | | | |
|
Supplemental Data | |
Net assets, end of year (000) | | $ | 3,846 | | | $ | 672 | | | $ | 1,034 | | | $ | 1,068 | | | $ | 1,573 | |
| | | | | | | | | | | | | | | | | | | | |
Portfolio turnover rate of the LifePath Dynamic Master Portfolio(g) | | | 35 | % | | | 38 | % | | | 6 | % | | | 37 | % | | | 21 | % |
| | | | | | | | | | | | | | | | | | | | |
| (a) | Based on average shares outstanding. |
| (b) | Distributions for annual periods determined in accordance with U.S. federal income tax regulations. |
| (c) | Amount is greater than $(0.005) per share. |
| (d) | Where applicable, excludes the effects of any sales charges and assumes the reinvestment of distributions. |
| (e) | Includes the LifePath Dynamic Fund’s share of its corresponding LifePath Dynamic Master Portfolio’s allocated net expenses and/or net investment income. |
| (f) | Includes the LifePath Dynamic Fund’s share of its corresponding LifePath Dynamic Master Portfolio’s allocated fees waived and expenses and/or net investment income. Excludes expenses incurred indirectly as a result of the LifePath Dynamic Master Portfolio’s investments in underlying funds as follows: |
| | | | | | | | | | | | | | | | | | | | |
| | | Year Ended December 31, | |
| | | 2019 | | | 2018 | | | 2017 | | | 2016 | | | 2015 | |
Allocated fees waived | | | 0.39 | % | | | 0.37 | % | | | 0.38 | % | | | 0.35 | % | | | 0.31 | % |
Investments in underlying funds | | | 0.08 | % | | | 0.09 | % | | | 0.12 | % | | | 0.10 | % | | | 0.09 | % |
| | | | | | | | | | | | | | | | | | | | |
| (g) | Includes the LifePath Dynamic Master Portfolio’s purchases and sales of the underlying funds and Active Stock Master Portfolio, CoreAlpha Bond Master Portfolio, International Tilts Master Portfolio and Master Total Return Portfolio. |
See notes to financial statements.
| | |
| 26 | | 2019 BLACKROCK ANNUAL REPORTTO SHAREHOLDERS |
Financial Highlights (continued)
(For a share outstanding throughout each period)
| | | | | | | | | | | | | | | | | | | | |
| | | BlackRock LifePath Dynamic Retirement Fund (continued) | |
| |
| | | Class K | |
| |
| | | Year Ended December 31, | |
| | | 2019 | | | 2018 | | | 2017 | | | 2016 | | | 2015 | |
| | | | | |
Net asset value, beginning of year | | $ | 9.65 | | | $ | 10.96 | | | $ | 10.75 | | | $ | 10.30 | | | $ | 11.05 | |
| | | | | | | | | | | | | | | | | | | | |
Net investment income(a) | | | 0.32 | | | | 0.27 | | | | 0.22 | | | | 0.21 | | | | 0.21 | |
Net realized and unrealized gain (loss) | | | 1.32 | | | | (0.64 | ) | | | 1.03 | | | | 0.43 | | | | (0.35 | ) |
| | | | | | | | | | | | | | | | | | | | |
Net increase (decrease) from investment operations | | | 1.64 | | | | (0.37 | ) | | | 1.25 | | | | 0.64 | | | | (0.14 | ) |
| | | | | | | | | | | | | | | | | | | | |
|
Distributions(b) | |
From net investment income | | | (0.21 | ) | | | (0.29 | ) | | | (0.17 | ) | | | (0.19 | ) | | | (0.24 | ) |
From net realized gain | | | (0.09 | ) | | | (0.65 | ) | | | (0.87 | ) | | | (0.00 | )(c) | | | (0.36 | ) |
From return of capital | | | — | | | | — | | | | — | | | | — | | | | (0.01 | ) |
| | | | | | | | | | | | | | | | | | | | |
Total distributions | | | (0.30 | ) | | | (0.94 | ) | | | (1.04 | ) | | | (0.19 | ) | | | (0.61 | ) |
| | | | | | | | | | | | | | | | | | | | |
| | | | | |
Net asset value, end of year | | $ | 10.99 | | | $ | 9.65 | | | $ | 10.96 | | | $ | 10.75 | | | $ | 10.30 | |
| | | | | | | | | | | | | | | | | | | | |
|
Total Return(d) | |
Based on net asset value | | | 17.07 | % | | | (3.47 | )% | | | 11.87 | % | | | 6.20 | % | | | (1.28 | )% |
| | | | | | | | | | | | | | | | | | | | |
|
Ratios to Average Net Assets(e)(f) | |
Total expenses | | | 0.37 | % | | | 0.38 | % | | | 0.37 | % | | | 0.39 | % | | | 0.42 | % |
| | | | | | | | | | | | | | | | | | | | |
Total expenses after fees waived and/or reimbursed | | | 0.35 | % | | | 0.37 | % | | | 0.36 | % | | | 0.38 | % | | | 0.42 | % |
| | | | | | | | | | | | | | | | | | | | |
Net investment income | | | 2.99 | % | | | 2.54 | % | | | 1.93 | % | | | 2.02 | % | | | 1.96 | % |
| | | | | | | | | | | | | | | | | | | | |
|
Supplemental Data | |
Net assets, end of year (000) | | $ | 64,913 | | | $ | 14,901 | | | $ | 15,965 | | | $ | 11,571 | | | $ | 8,577 | |
| | | | | | | | | | | | | | | | | | | | |
Portfolio turnover rate of the LifePath Dynamic Master Portfolio(g) | | | 35 | % | | | 38 | % | | | 6 | % | | | 37 | % | | | 21 | % |
| | | | | | | | | | | | | | | | | | | | |
| (a) | Based on average shares outstanding. |
| (b) | Distributions for annual periods determined in accordance with U.S. federal income tax regulations. |
| (c) | Amount is greater than $(0.005) per share. |
| (d) | Where applicable, assumes the reinvestment of distributions. |
| (e) | Includes the LifePath Dynamic Fund’s share of its corresponding LifePath Dynamic Master Portfolio’s allocated net expenses and/or net investment income. |
| (f) | Includes the LifePath Dynamic Fund’s share of its corresponding LifePath Dynamic Master Portfolio’s allocated fees waived and expenses and/or net investment income. Excludes expenses incurred indirectly as a result of the LifePath Dynamic Master Portfolio’s investments in underlying funds as follows: |
| | | | | | | | | | | | | | | | | | | | |
| | | Year Ended December 31, | |
| | | 2019 | | | 2018 | | | 2017 | | | 2016 | | | 2015 | |
Allocated fees waived | | | 0.39 | % | | | 0.37 | % | | | 0.38 | % | | | 0.34 | % | | | 0.30 | % |
Investments in underlying funds | | | 0.08 | % | | | 0.09 | % | | | 0.12 | % | | | 0.10 | % | | | 0.09 | % |
| | | | | | | | | | | | | | | | | | | | |
| (g) | Includes the LifePath Dynamic Master Portfolio’s purchases and sales of the underlying funds and Active Stock Master Portfolio, CoreAlpha Bond Master Portfolio, International Tilts Master Portfolio and Master Total Return Portfolio. |
See notes to financial statements.
Financial Highlights (continued)
(For a share outstanding throughout each period)
| | | | | | | | | | | | | | | | | | | | |
| | | BlackRock LifePath Dynamic Retirement Fund (continued) | |
| |
| | | Class R | |
| |
| | | Year Ended December 31, | |
| | | 2019 | | | 2018 | | | 2017 | | | 2016 | | | 2015 | |
| | | | | |
Net asset value, beginning of year | | $ | 9.60 | | | $ | 10.91 | | | $ | 10.71 | | | $ | 10.26 | | | $ | 11.01 | |
| | | | | | | | | | | | | | | | | | | | |
Net investment income(a) | | | 0.23 | | | | 0.20 | | | | 0.14 | | | | 0.15 | | | | 0.10 | |
Net realized and unrealized gain (loss) | | | 1.32 | | | | (0.64 | ) | | | 1.03 | | | | 0.42 | | | | (0.33 | ) |
| | | | | | | | | | | | | | | | | | | | |
Net increase (decrease) from investment operations | | | 1.55 | | | | (0.44 | ) | | | 1.17 | | | | 0.57 | | | | (0.23 | ) |
| | | | | | | | | | | | | | | | | | | | |
|
Distributions(b) | |
From net investment income | | | (0.15 | ) | | | (0.22 | ) | | | (0.10 | ) | | | (0.12 | ) | | | (0.15 | ) |
From net realized gain | | | (0.09 | ) | | | (0.65 | ) | | | (0.87 | ) | | | (0.00 | )(c) | | | (0.36 | ) |
From return of capital | | | — | | | | — | | | | — | | | | — | | | | (0.01 | ) |
| | | | | | | | | | | | | | | | | | | | |
Total distributions | | | (0.24 | ) | | | (0.87 | ) | | | (0.97 | ) | | | (0.12 | ) | | | (0.52 | ) |
| | | | | | | | | | | | | | | | | | | | |
| | | | | |
Net asset value, end of year | | $ | 10.91 | | | $ | 9.60 | | | $ | 10.91 | | | $ | 10.71 | | | $ | 10.26 | |
| | | | | | | | | | | | | | | | | | | | |
|
Total Return(d) | |
Based on net asset value | | | 16.24 | % | | | (4.11 | )% | | | 11.11 | % | | | 5.59 | % | | | (2.10 | )% |
| | | | | | | | | | | | | | | | | | | | |
|
Ratios to Average Net Assets(e)(f) | |
Total expenses | | | 1.02 | % | | | 1.03 | % | | | 1.02 | % | | | 1.04 | % | | | 1.25 | % |
| | | | | | | | | | | | | | | | | | | | |
Total expenses after fees waived and/or reimbursed | | | 1.00 | % | | | 1.02 | % | | | 1.02 | % | | | 1.04 | % | | | 1.19 | % |
| | | | | | | | | | | | | | | | | | | | |
Net investment income | | | 2.19 | % | | | 1.87 | % | | | 1.27 | % | | | 1.40 | % | | | 0.99 | % |
| | | | | | | | | | | | | | | | | | | | |
|
Supplemental Data | |
Net assets, end of year (000) | | $ | 5,291 | | | $ | 1,036 | | | $ | 1,167 | | | $ | 928 | | | $ | 656 | |
| | | | | | | | | | | | | | | | | | | | |
Portfolio turnover rate of the LifePath Dynamic Master Portfolio(g) | | | 35 | % | | | 38 | % | | | 6 | % | | | 37 | % | | | 21 | % |
| | | | | | | | | | | | | | | | | | | | |
| (a) | Based on average shares outstanding. |
| (b) | Distributions for annual periods determined in accordance with U.S. federal income tax regulations. |
| (c) | Amount is greater than $(0.005) per share. |
| (d) | Where applicable, assumes the reinvestment of distributions. |
| (e) | Includes the LifePath Dynamic Fund’s share of its corresponding LifePath Dynamic Master Portfolio’s allocated net expenses and/or net investment income. |
| (f) | Includes the LifePath Dynamic Fund’s share of its corresponding LifePath Dynamic Master Portfolio’s allocated fees waived and expenses and/or net investment income. Excludes expenses incurred indirectly as a result of the LifePath Dynamic Master Portfolio’s investments in underlying funds as follows: |
| | | | | | | | | | | | | | | | | | | | |
| | | Year Ended December 31, | |
| | | 2019 | | | 2018 | | | 2017 | | | 2016 | | | 2015 | |
Allocated fees waived | | | 0.39 | % | | | 0.37 | % | | | 0.38 | % | | | 0.35 | % | | | 0.31 | % |
Investments in underlying funds | | | 0.08 | % | | | 0.09 | % | | | 0.12 | % | | | 0.10 | % | | | 0.09 | % |
| | | | | | | | | | | | | | | | | | | | |
| (g) | Includes the LifePath Dynamic Master Portfolio’s purchases and sales of the underlying funds and Active Stock Master Portfolio, CoreAlpha Bond Master Portfolio, International Tilts Master Portfolio and Master Total Return Portfolio. |
See notes to financial statements.
| | |
| 28 | | 2019 BLACKROCK ANNUAL REPORTTO SHAREHOLDERS |
Financial Highlights (continued)
(For a share outstanding throughout each period)
| | | | | | | | | | | | | | | | | | | | |
| | | BlackRock LifePath Dynamic 2030 Fund | |
| |
| | | Institutional | |
| |
| | | Year Ended December 31, | |
| | | 2019 | | | 2018 | | | 2017 | | | 2016 | | | 2015 | |
| | | | | |
Net asset value, beginning of year | | $ | 11.90 | | | $ | 14.26 | | | $ | 13.79 | | | $ | 13.20 | | | $ | 14.71 | |
| | | | | | | | | | | | | | | | | | | | |
Net investment income(a) | | | 0.29 | | | | 0.29 | | | | 0.24 | | | | 0.23 | | | | 0.22 | |
Net realized and unrealized gain (loss) | | | 2.32 | | | | (1.04 | ) | | | 2.13 | | | | 0.72 | | | | (0.51 | ) |
| | | | | | | | | | | | | | | | | | | | |
Net increase (decrease) from investment operations | | | 2.61 | | | | (0.75 | ) | | | 2.37 | | | | 0.95 | | | | (0.29 | ) |
| | | | | | | | | | | | | | | | | | | | |
|
Distributions(b) | |
From net investment income | | | (0.30 | ) | | | (0.31 | ) | | | (0.25 | ) | | | (0.25 | ) | | | (0.25 | ) |
From net realized gain | | | (0.56 | ) | | | (1.30 | ) | | | (1.65 | ) | | | (0.11 | ) | | | (0.96 | ) |
From return of capital | | | — | | | | — | | | | — | | | | — | | | | (0.01 | ) |
| | | | | | | | | | | | | | | | | | | | |
Total distributions | | | (0.86 | ) | | | (1.61 | ) | | | (1.90 | ) | | | (0.36 | ) | | | (1.22 | ) |
| | | | | | | | | | | | | | | | | | | | |
| | | | | |
Net asset value, end of year | | $ | 13.65 | | | $ | 11.90 | | | $ | 14.26 | | | $ | 13.79 | | | $ | 13.20 | |
| | | | | | | | | | | | | | | | | | | | |
|
Total Return(c) | |
Based on net asset value | | | 22.07 | % | | | (5.48 | )% | | | 17.67 | % | | | 7.24 | % | | | (2.05 | )% |
| | | | | | | | | | | | | | | | | | | | |
|
Ratios to Average Net Assets(d)(e) | |
Total expenses | | | 0.56 | % | | | 0.56 | % | | | 0.55 | % | | | 0.56 | % | | | 0.70 | % |
| | | | | | | | | | | | | | | | | | | | |
Total expenses after fees waived and/or reimbursed | | | 0.55 | % | | | 0.56 | % | | | 0.55 | % | | | 0.56 | % | | | 0.70 | % |
| | | | | | | | | | | | | | | | | | | | |
Net investment income | | | 2.18 | % | | | 2.01 | % | | | 1.64 | % | | | 1.73 | % | | | 1.46 | % |
| | | | | | | | | | | | | | | | | | | | |
|
Supplemental Data | |
Net assets, end of year (000) | | $ | 73,530 | | | $ | 59,749 | | | $ | 90,086 | | | $ | 141,217 | | | $ | 222,491 | |
| | | | | | | | | | | | | | | | | | | | |
Portfolio turnover rate of the LifePath Dynamic Master Portfolio(f) | | | 32 | % | | | 29 | % | | | 21 | % | | | 61 | % | | | 21 | % |
| | | | | | | | | | | | | | | | | | | | |
| (a) | Based on average shares outstanding. |
| (b) | Distributions for annual periods determined in accordance with U.S. federal income tax regulations. |
| (c) | Where applicable, assumes the reinvestment of distributions. |
| (d) | Includes the LifePath Dynamic Fund’s share of its corresponding LifePath Dynamic Master Portfolio’s allocated net expenses and/or net investment income. |
| (e) | Includes the LifePath Dynamic Fund’s share of its corresponding LifePath Dynamic Master Portfolio’s allocated fees waived and expenses and/or net investment income. Excludes expenses incurred indirectly as a result of the LifePath Dynamic Master Portfolio’s investments in underlying funds as follows: |
| | | | | | | | | | | | | | | | | | | | |
| | | Year Ended December 31, | |
| | | 2019 | | | 2018 | | | 2017 | | | 2016 | | | 2015 | |
Allocated fees waived | | | 0.41 | % | | | 0.39 | % | | | 0.39 | % | | | 0.37 | % | | | 0.37 | % |
Investments in underlying funds | | | 0.10 | % | | | 0.11 | % | | | 0.14 | % | | | 0.12 | % | | | 0.14 | % |
| | | | | | | | | | | | | | | | | | | | |
| (f) | Includes the LifePath Dynamic Master Portfolio’s purchases and sales of the underlying funds and Active Stock Master Portfolio, CoreAlpha Bond Master Portfolio, International Tilts Master Portfolio and Master Total Return Portfolio. |
See notes to financial statements.
Financial Highlights (continued)
(For a share outstanding throughout each period)
| | | | | | | | | | | | | | | | | | | | |
| | | BlackRock LifePath Dynamic 2030 Fund (continued) | |
| |
| | | Investor A | |
| |
| | | Year Ended December 31, | |
| | | 2019 | | | 2018 | | | 2017 | | | 2016 | | | 2015 | |
| | | | | |
Net asset value, beginning of year | | $ | 11.39 | | | $ | 13.72 | | | $ | 13.33 | | | $ | 12.78 | | | $ | 14.28 | |
| | | | | | | | | | | | | | | | | | | | |
Net investment income(a) | | | 0.24 | | | | 0.25 | | | | 0.20 | | | | 0.20 | | | | 0.18 | |
Net realized and unrealized gain (loss) | | | 2.22 | | | | (1.00 | ) | | | 2.06 | | | | 0.68 | | | | (0.49 | ) |
| | | | | | | | | | | | | | | | | | | | |
Net increase (decrease) from investment operations | | | 2.46 | | | | (0.75 | ) | | | 2.26 | | | | 0.88 | | | | (0.31 | ) |
| | | | | | | | | | | | | | | | | | | | |
|
Distributions(b) | |
From net investment income | | | (0.27 | ) | | | (0.28 | ) | | | (0.22 | ) | | | (0.22 | ) | | | (0.22 | ) |
From net realized gain | | | (0.56 | ) | | | (1.30 | ) | | | (1.65 | ) | | | (0.11 | ) | | | (0.96 | ) |
From return of capital | | | — | | | | — | | | | — | | | | — | | | | (0.01 | ) |
| | | | | | | | | | | | | | | | | | | | |
Total distributions | | | (0.83 | ) | | | (1.58 | ) | | | (1.87 | ) | | | (0.33 | ) | | | (1.19 | ) |
| | | | | | | | | | | | | | | | | | | | |
| | | | | |
Net asset value, end of year | | $ | 13.02 | | | $ | 11.39 | | | $ | 13.72 | | | $ | 13.33 | | | $ | 12.78 | |
| | | | | | | | | | | | | | | | | | | | |
|
Total Return(c) | |
Based on net asset value | | | 21.72 | % | | | (5.69 | )% | | | 17.43 | % | | | 6.93 | % | | | (2.25 | )% |
| | | | | | | | | | | | | | | | | | | | |
|
Ratios to Average Net Assets(d)(e) | |
Total expenses | | | 0.81 | % | | | 0.81 | % | | | 0.80 | % | | | 0.81 | % | | | 0.95 | % |
| | | | | | | | | | | | | | | | | | | | |
Total expenses after fees waived and/or reimbursed | | | 0.80 | % | | | 0.81 | % | | | 0.80 | % | | | 0.81 | % | | | 0.95 | % |
| | | | | | | | | | | | | | | | | | | | |
Net investment income | | | 1.89 | % | | | 1.80 | % | | | 1.44 | % | | | 1.53 | % | | | 1.28 | % |
| | | | | | | | | | | | | | | | | | | | |
|
Supplemental Data | |
Net assets, end of year (000) | | $ | 212,100 | | | $ | 212,050 | | | $ | 265,932 | | | $ | 271,354 | | | $ | 298,579 | |
| | | | | | | | | | | | | | | | | | | | |
Portfolio turnover rate of the LifePath Dynamic Master Portfolio(f) | | | 32 | % | | | 29 | % | | | 21 | % | | | 61 | % | | | 21 | % |
| | | | | | | | | | | | | | | | | | | | |
| (a) | Based on average shares outstanding. |
| (b) | Distributions for annual periods determined in accordance with U.S. federal income tax regulations. |
| (c) | Where applicable, excludes the effects of any sales charges and assumes the reinvestment of distributions. |
| (d) | Includes the LifePath Dynamic Fund’s share of its corresponding LifePath Dynamic Master Portfolio’s allocated net expenses and/or net investment income. |
| (e) | Includes the LifePath Dynamic Fund’s share of its corresponding LifePath Dynamic Master Portfolio’s allocated fees waived and expenses and/or net investment income. Excludes expenses incurred indirectly as a result of the LifePath Dynamic Master Portfolio’s investments in underlying funds as follows: |
| | | | | | | | | | | | | | | | | | | | |
| | | Year Ended December 31, | |
| | | 2019 | | | 2018 | | | 2017 | | | 2016 | | | 2015 | |
Allocated fees waived | | | 0.41 | % | | | 0.39 | % | | | 0.39 | % | | | 0.37 | % | | | 0.36 | % |
Investments in underlying funds | | | 0.10 | % | | | 0.11 | % | | | 0.14 | % | | | 0.12 | % | | | 0.14 | % |
| | | | | | | | | | | | | | | | | | | | |
| (f) | Includes the LifePath Dynamic Master Portfolio’s purchases and sales of the underlying funds and Active Stock Master Portfolio, CoreAlpha Bond Master Portfolio, International Tilts Master Portfolio and Master Total Return Portfolio. |
See notes to financial statements.
| | |
| 30 | | 2019 BLACKROCK ANNUAL REPORTTO SHAREHOLDERS |
Financial Highlights (continued)
(For a share outstanding throughout each period)
| | | | | | | | | | | | | | | | | | | | |
| | | BlackRock LifePath Dynamic 2030 Fund (continued) | |
| |
| | | Investor C | |
| |
| | | Year Ended December 31, | |
| | | 2019 | | | 2018 | | | 2017 | | | 2016 | | | 2015 | |
| | | | | |
Net asset value, beginning of year | | $ | 11.65 | | | $ | 14.01 | | | $ | 13.58 | | | $ | 13.01 | | | $ | 14.52 | |
| | | | | | | | | | | | | | | | | | | | |
Net investment income(a) | | | 0.14 | | | | 0.15 | | | | 0.10 | | | | 0.10 | | | | 0.08 | |
Net realized and unrealized gain (loss) | | | 2.27 | | | | (1.04 | ) | | | 2.08 | | | | 0.69 | | | | (0.51 | ) |
| | | | | | | | | | | | | | | | | | | | |
Net increase (decrease) from investment operations | | | 2.41 | | | | (0.89 | ) | | | 2.18 | | | | 0.79 | | | | (0.43 | ) |
| | | | | | | | | | | | | | | | | | | | |
| | | | | |
Distributions(b) | | | | | | | | | | | | | | | | | | | | |
From net investment income | | | (0.16 | ) | | | (0.17 | ) | | | (0.10 | ) | | | (0.11 | ) | | | (0.11 | ) |
From net realized gain | | | (0.56 | ) | | | (1.30 | ) | | | (1.65 | ) | | | (0.11 | ) | | | (0.96 | ) |
From return of capital | | | — | | | | — | | | | — | | | | — | | | | (0.01 | ) |
| | | | | | | | | | | | | | | | | | | | |
Total distributions | | | (0.72 | ) | | | (1.47 | ) | | | (1.75 | ) | | | (0.22 | ) | | | (1.08 | ) |
| | | | | | | | | | | | | | | | | | | | |
| | | | | |
Net asset value, end of year | | $ | 13.34 | | | $ | 11.65 | | | $ | 14.01 | | | $ | 13.58 | | | $ | 13.01 | |
| | | | | | | | | | | | | | | | | | | | |
| | | | | |
Total Return(c) | | | | | | | | | | | | | | | | | | | | |
Based on net asset value | | | 20.76 | % | | | (6.53 | )% | | | 16.48 | % | | | 6.12 | % | | | (3.01 | )% |
| | | | | | | | | | | | | | | | | | | | |
| | | | | |
Ratios to Average Net Assets(d)(e) | | | | | | | | | | | | | | | | | | | | |
Total expenses | | | 1.61 | % | | | 1.61 | % | | | 1.60 | % | | | 1.61 | % | | | 1.71 | % |
| | | | | | | | | | | | | | | | | | | | |
Total expenses after fees waived and/or reimbursed | | | 1.60 | % | | | 1.61 | % | | | 1.60 | % | | | 1.61 | % | | | 1.71 | % |
| | | | | | | | | | | | | | | | | | | | |
Net investment income | | | 1.08 | % | | | 1.05 | % | | | 0.67 | % | | | 0.74 | % | | | 0.56 | % |
| | | | | | | | | | | | | | | | | | | | |
| | | | | |
Supplemental Data | | | | | | | | | | | | | | | | | | | | |
Net assets, end of year (000) | | $ | 3,746 | | | $ | 4,117 | | | $ | 3,888 | | | $ | 3,217 | | | $ | 3,173 | |
| | | | | | | | | | | | | | | | | | | | |
Portfolio turnover rate of the LifePath Dynamic Master Portfolio(f) | | | 32 | % | | | 29 | % | | | 21 | % | | | 61 | % | | | 21 | % |
| | | | | | | | | | | | | | | | | | | | |
| (a) | Based on average shares outstanding. |
| (b) | Distributions for annual periods determined in accordance with U.S. federal income tax regulations. |
| (c) | Where applicable, excludes the effects of any sales charges and assumes the reinvestment of distributions. |
| (d) | Includes the LifePath Dynamic Fund’s share of its corresponding LifePath Dynamic Master Portfolio’s allocated net expenses and/or net investment income. |
| (e) | Includes the LifePath Dynamic Fund’s share of its corresponding LifePath Dynamic Master Portfolio’s allocated fees waived and expenses and/or net investment income. Excludes expenses incurred indirectly as a result of the LifePath Dynamic Master Portfolio’s investments in underlying funds as follows: |
| | | | | | | | | | | | | | | | | | | | |
| | | Year Ended December 31, | |
| | | 2019 | | | 2018 | | | 2017 | | | 2016 | | | 2015 | |
Allocated fees waived | | | 0.41 | % | | | 0.37 | % | | | 0.38 | % | | | 0.35 | % | | | 0.31 | % |
Investments in underlying funds | | | 0.10 | % | | | 0.09 | % | | | 0.12 | % | | | 0.10 | % | | | 0.09 | % |
| | | | | | | | | | | | | | | | | | | | |
| (f) | Includes the LifePath Dynamic Master Portfolio’s purchases and sales of the underlying funds and Active Stock Master Portfolio, CoreAlpha Bond Master Portfolio, International Tilts Master Portfolio and Master Total Return Portfolio. |
See notes to financial statements.
Financial Highlights (continued)
(For a share outstanding throughout each period)
| | | | | | | | | | | | | | | | | | | | |
| | | BlackRock LifePath Dynamic 2030 Fund (continued) | |
| |
| | | Class K | |
| |
| | | Year Ended December 31, | |
| | | 2019 | | | 2018 | | | 2017 | | | 2016 | | | 2015 | |
| | | | | |
Net asset value, beginning of year | | $ | 11.88 | | | $ | 14.24 | | | $ | 13.77 | | | $ | 13.19 | | | $ | 14.70 | |
| | | | | | | | | | | | | | | | | | | | |
Net investment income(a) | | | 0.34 | | | | 0.32 | | | | 0.28 | | | | 0.28 | | | | 0.29 | |
Net realized and unrealized gain (loss) | | | 2.29 | | | | (1.04 | ) | | | 2.12 | | | | 0.69 | | | | (0.52 | ) |
| | | | | | | | | | | | | | | | | | | | |
Net increase (decrease) from investment operations | | | 2.63 | | | | (0.72 | ) | | | 2.40 | | | | 0.97 | | | | (0.23 | ) |
| | | | | | | | | | | | | | | | | | | | |
| | | | | |
Distributions(b) | | | | | | | | | | | | | | | | | | | | |
From net investment income | | | (0.33 | ) | | | (0.34 | ) | | | (0.28 | ) | | | (0.28 | ) | | | (0.31 | ) |
From net realized gain | | | (0.56 | ) | | | (1.30 | ) | | | (1.65 | ) | | | (0.11 | ) | | | (0.96 | ) |
From return of capital | | | — | | | | — | | | | — | | | | — | | | | (0.01 | ) |
| | | | | | | | | | | | | | | | | | | | |
Total distributions | | | (0.89 | ) | | | (1.64 | ) | | | (1.93 | ) | | | (0.39 | ) | | | (1.28 | ) |
| | | | | | | | | | | | | | | | | | | | |
| | | | | |
Net asset value, end of year | | $ | 13.62 | | | $ | 11.88 | | | $ | 14.24 | | | $ | 13.77 | | | $ | 13.19 | |
| | | | | | | | | | | | | | | | | | | | |
| | | | | |
Total Return(c) | | | | | | | | | | | | | | | | | | | | |
Based on net asset value | | | 22.27 | % | | | (5.28 | )% | | | 17.96 | % | | | 7.42 | % | | | (1.66 | )% |
| | | | | | | | | | | | | | | | | | | | |
| | | | | |
Ratios to Average Net Assets(d)(e) | | | | | | | | | | | | | | | | | | | | |
Total expenses | | | 0.36 | % | | | 0.36 | % | | | 0.35 | % | | | 0.36 | % | | | 0.37 | % |
| | | | | | | | | | | | | | | | | | | | |
Total expenses after fees waived and/or reimbursed | | | 0.36 | % | | | 0.36 | % | | | 0.35 | % | | | 0.36 | % | | | 0.37 | % |
| | | | | | | | | | | | | | | | | | | | |
Net investment income | | | 2.52 | % | | | 2.27 | % | | | 1.91 | % | | | 2.04 | % | | | 2.01 | % |
| | | | | | | | | | | | | | | | | | | | |
| | | | | |
Supplemental Data | | | | | | | | | | | | | | | | | | | | |
Net assets, end of year (000) | | $ | 56,168 | | | $ | 28,121 | | | $ | 33,881 | | | $ | 29,419 | | | $ | 16,171 | |
| | | | | | | | | | | | | | | | | | | | |
Portfolio turnover rate of the LifePath Dynamic Master Portfolio(f) | | | 32 | % | | | 29 | % | | | 21 | % | | | 61 | % | | | 21 | % |
| | | | | | | | | | | | | | | | | | | | |
| (a) | Based on average shares outstanding. |
| (b) | Distributions for annual periods determined in accordance with U.S. federal income tax regulations. |
| (c) | Where applicable, assumes the reinvestment of distributions. |
| (d) | Includes the LifePath Dynamic Fund’s share of its corresponding LifePath Dynamic Master Portfolio’s allocated net expenses and/or net investment income. |
| (e) | Includes the LifePath Dynamic Fund’s share of its corresponding LifePath Dynamic Master Portfolio’s allocated fees waived and expenses and/or net investment income. Excludes expenses incurred indirectly as a result of the LifePath Dynamic Master Portfolio’s investments in underlying funds as follows: |
| | | | | | | | | | | | | | | | | | | | |
| | | Year Ended December 31, | |
| | | 2019 | | | 2018 | | | 2017 | | | 2016 | | | 2015 | |
Allocated fees waived | | | 0.41 | % | | | 0.39 | % | | | 0.39 | % | | | 0.37 | % | | | 0.36 | % |
Investments in underlying funds | | | 0.10 | % | | | 0.11 | % | | | 0.14 | % | | | 0.12 | % | | | 0.14 | % |
| | | | | | | | | | | | | | | | | | | | |
| (f) | Includes the LifePath Dynamic Master Portfolio’s purchases and sales of the underlying funds and Active Stock Master Portfolio, CoreAlpha Bond Master Portfolio, International Tilts Master Portfolio and Master Total Return Portfolio. |
See notes to financial statements.
| | |
| 32 | | 2019 BLACKROCK ANNUAL REPORTTO SHAREHOLDERS |
Financial Highlights (continued)
(For a share outstanding throughout each period)
| | | | | | | | | | | | | | | | | | | | |
| | | BlackRock LifePath Dynamic 2030 Fund (continued) | |
| |
| | | Class R | |
| |
| | | Year Ended December 31, | |
| | | 2019 | | | 2018 | | | 2017 | | | 2016 | | | 2015 | |
| | | | | |
Net asset value, beginning of year | | $ | 11.76 | | | $ | 14.12 | | | $ | 13.67 | | | $ | 13.09 | | | $ | 14.60 | |
| | | | | | | | | | | | | | | | | | | | |
Net investment income(a) | | | 0.24 | | | | 0.24 | | | | 0.18 | | | | 0.17 | | | | 0.15 | |
Net realized and unrealized gain (loss) | | | 2.27 | | | | (1.05 | ) | | | 2.10 | | | | 0.71 | | | | (0.50 | ) |
| | | | | | | | | | | | | | | | | | | | |
Net increase (decrease) from investment operations | | | 2.51 | | | | (0.81 | ) | | | 2.28 | | | | 0.88 | | | | (0.35 | ) |
| | | | | | | | | | | | | | | | | | | | |
| | | | | |
Distributions(b) | | | | | | | | | | | | | | | | | | | | |
From net investment income | | | (0.25 | ) | | | (0.25 | ) | | | (0.18 | ) | | | (0.19 | ) | | | (0.19 | ) |
From net realized gain | | | (0.56 | ) | | | (1.30 | ) | | | (1.65 | ) | | | (0.11 | ) | | | (0.96 | ) |
From return of capital | | | — | | | | — | | | | — | | | | — | | | | (0.01 | ) |
| | | | | | | | | | | | | | | | | | | | |
Total distributions | | | (0.81 | ) | | | (1.55 | ) | | | (1.83 | ) | | | (0.30 | ) | | | (1.16 | ) |
| | | | | | | | | | | | | | | | | | | | |
| | | | | |
Net asset value, end of year | | $ | 13.46 | | | $ | 11.76 | | | $ | 14.12 | | | $ | 13.67 | | | $ | 13.09 | |
| | | | | | | | | | | | | | | | | | | | |
| | | | | |
Total Return(c) | | | | | | | | | | | | | | | | | | | | |
Based on net asset value | | | 21.44 | % | | | (5.92 | )% | | | 17.16 | % | | | 6.74 | % | | | (2.50 | )% |
| | | | | | | | | | | | | | | | | | | | |
| | | | | |
Ratios to Average Net Assets(d)(e) | | | | | | | | | | | | | | | | | | | | |
Total expenses | | | 1.01 | % | | | 1.01 | % | | | 1.00 | % | | | 1.01 | % | | | 1.20 | % |
| | | | | | | | | | | | | | | | | | | | |
Total expenses after fees waived and/or reimbursed | | | 1.01 | % | | | 1.01 | % | | | 0.99 | % | | | 1.01 | % | | | 1.20 | % |
| | | | | | | | | | | | | | | | | | | | |
Net investment income | | | 1.78 | % | | | 1.70 | % | | | 1.21 | % | | | 1.30 | % | | | 1.07 | % |
| | | | | | | | | | | | | | | | | | | | |
| | | | | |
Supplemental Data | | | | | | | | | | | | | | | | | | | | |
Net assets, end of year (000) | | $ | 4,646 | | | $ | 2,575 | | | $ | 2,169 | | | $ | 2,751 | | | $ | 3,178 | |
| | | | | | | | | | | | | | | | | | | | |
Portfolio turnover rate of the LifePath Dynamic Master Portfolio(f) | | | 32 | % | | | 29 | % | | | 21 | % | | | 61 | % | | | 21 | % |
| | | | | | | | | | | | | | | | | | | | |
| (a) | Based on average shares outstanding. |
| (b) | Distributions for annual periods determined in accordance with U.S. federal income tax regulations. |
| (c) | Where applicable, assumes the reinvestment of distributions. |
| (d) | Includes the LifePath Dynamic Fund’s share of its corresponding LifePath Dynamic Master Portfolio’s allocated net expenses and/or net investment income. |
| (e) | Includes the LifePath Dynamic Fund’s share of its corresponding LifePath Dynamic Master Portfolio’s allocated fees waived and expenses and/or net investment income. Excludes expenses incurred indirectly as a result of the LifePath Dynamic Master Portfolio’s investments in underlying funds as follows: |
| | | | | | | | | | | | | | | | | | | | |
| | | Year Ended December 31, | |
| | | 2019 | | | 2018 | | | 2017 | | | 2016 | | | 2015 | |
Allocated fees waived | | | 0.41 | % | | | 0.39 | % | | | 0.39 | % | | | 0.37 | % | | | 0.36 | % |
Investments in underlying funds | | | 0.10 | % | | | 0.14 | % | | | 0.14 | % | | | 0.12 | % | | | 0.14 | % |
| | | | | | | | | | | | | | | | | | | | |
| (f) | Includes the LifePath Dynamic Master Portfolio’s purchases and sales of the underlying funds and Active Stock Master Portfolio, CoreAlpha Bond Master Portfolio, International Tilts Master Portfolio and Master Total Return Portfolio. |
See notes to financial statements.
Financial Highlights (continued)
(For a share outstanding throughout each period)
| | | | | | | | | | | | | | | | | | | | |
| | | BlackRock LifePath Dynamic 2040 Fund | |
| |
| | | Institutional | |
| |
| | | Year Ended December 31, | |
| | | 2019 | | | 2018 | | | 2017 | | | 2016 | | | 2015 | |
| | | | | |
Net asset value, beginning of year | | $ | 14.62 | | | $ | 18.04 | | | $ | 17.15 | | | $ | 16.24 | | | $ | 18.37 | |
| | | | | | | | | | | | | | | | | | | | |
Net investment income(a) | | | 0.35 | | | | 0.34 | | | | 0.29 | | | | 0.29 | | | | 0.27 | |
Net realized and unrealized gain (loss) | | | 3.39 | | | | (1.65 | ) | | | 3.27 | | | | 1.00 | | | | (0.67 | ) |
| | | | | | | | | | | | | | | | | | | | |
Net increase (decrease) from investment operations | | | 3.74 | | | | (1.31 | ) | | | 3.56 | | | | 1.29 | | | | (0.40 | ) |
| | | | | | | | | | | | | | | | | | | | |
| | | | | |
Distributions(b) | | | | | | | | | | | | | | | | | | | | |
From net investment income | | | (0.37 | ) | | | (0.33 | ) | | | (0.36 | ) | | | (0.32 | ) | | | (0.30 | ) |
From net realized gain | | | (0.77 | ) | | | (1.78 | ) | | | (2.31 | ) | | | (0.06 | ) | | | (1.43 | ) |
| | | | | | | | | | | | | | | | | | | | |
Total distributions | | | (1.14 | ) | | | (2.11 | ) | | | (2.67 | ) | | | (0.38 | ) | | | (1.73 | ) |
| | | | | | | | | | | | | | | | | | | | |
| | | | | |
Net asset value, end of year | | $ | 17.22 | | | $ | 14.62 | | | $ | 18.04 | | | $ | 17.15 | | | $ | 16.24 | |
| | | | | | | | | | | | | | | | | | | | |
| | | | | |
Total Return(c) | | | | | | | | | | | | | | | | | | | | |
Based on net asset value | | | 25.72 | % | | | (7.49 | )% | | | 21.44 | % | | | 7.97 | % | | | (2.29 | )% |
| | | | | | | | | | | | | | | | | | | | |
| | | | | |
Ratios to Average Net Assets(d)(e) | | | | | | | | | | | | | | | | | | | | |
Total expenses | | | 0.55 | % | | | 0.55 | % | | | 0.54 | % | | | 0.54 | % | | | 0.67 | % |
| | | | | | | | | | | | | | | | | | | | |
Total expenses after fees waived and/or reimbursed | | | 0.55 | % | | | 0.55 | % | | | 0.54 | % | | | 0.54 | % | | | 0.67 | % |
| | | | | | | | | | | | | | | | | | | | |
Net investment income | | | 2.10 | % | | | 1.87 | % | | | 1.57 | % | | | 1.74 | % | | | 1.46 | % |
| | | | | | | | | | | | | | | | | | | | |
| | | | | |
Supplemental Data | | | | | | | | | | | | | | | | | | | | |
Net assets, end of year (000) | | $ | 60,508 | | | $ | 48,056 | | | $ | 67,358 | | | $ | 121,623 | | | $ | 186,357 | |
| | | | | | | | | | | | | | | | | | | | |
Portfolio turnover rate of the LifePath Dynamic Master Portfolio(f) | | | 35 | % | | | 39 | % | | | 30 | % | | | 77 | % | | | 19 | % |
| | | | | | | | | | | | | | | | | | | | |
| (a) | Based on average shares outstanding. |
| (b) | Distributions for annual periods determined in accordance with U.S. federal income tax regulations. |
| (c) | Where applicable, assumes the reinvestment of distributions. |
| (d) | Includes the LifePath Dynamic Fund’s share of its corresponding LifePath Dynamic Master Portfolio’s allocated net expenses and/or net investment income. |
| (e) | Includes the LifePath Dynamic Fund’s share of its corresponding LifePath Dynamic Master Portfolio’s allocated fees waived and expenses and/or net investment income. Excludes expenses incurred indirectly as a result of the LifePath Dynamic Master Portfolio’s investments in underlying funds as follows: |
| | | | | | | | | | | | | | | | | | | | |
| | | Year Ended December 31, | |
| | | 2019 | | | 2018 | | | 2017 | | | 2016 | | | 2015 | |
Allocated fees waived | | | 0.42 | % | | | 0.40 | % | | | 0.41 | % | | | 0.38 | % | | | 0.39 | % |
Investments in underlying funds | | | 0.12 | % | | | 0.13 | % | | | 0.16 | % | | | 0.14 | % | | | 0.17 | % |
| | | | | | | | | | | | | | | | | | | | |
| (f) | Includes the LifePath Dynamic Master Portfolio’s purchases and sales of the underlying funds and Active Stock Master Portfolio, CoreAlpha Bond Master Portfolio, International Tilts Master Portfolio, Large Cap Index Master Portfolio, Master SmallCap Index Series and Master Total Return Portfolio. |
See notes to financial statements.
| | |
| 34 | | 2019 BLACKROCK ANNUAL REPORTTO SHAREHOLDERS |
Financial Highlights (continued)
(For a share outstanding throughout each period)
| | | | | | | | | | | | | | | | | | | | |
| | | BlackRock LifePath Dynamic 2040 Fund (continued) | |
| |
| | | Investor A | |
| |
| | | Year Ended December 31, | |
| | | 2019 | | | 2018 | | | 2017 | | | 2016 | | | 2015 | |
| | | | | |
Net asset value, beginning of year | | $ | 13.22 | | | $ | 16.53 | | | $ | 15.91 | | | $ | 15.10 | | | $ | 17.22 | |
| | | | | | | | | | | | | | | | | | | | |
Net investment income(a) | | | 0.27 | | | | 0.27 | | | | 0.24 | | | | 0.24 | | | | 0.23 | |
Net realized and unrealized gain (loss) | | | 3.06 | | | | (1.50 | ) | | | 3.01 | | | | 0.92 | | | | (0.65 | ) |
| | | | | | | | | | | | | | | | | | | | |
Net increase (decrease) from investment operations | | | 3.33 | | | | (1.23 | ) | | | 3.25 | | | | 1.16 | | | | (0.42 | ) |
| | | | | | | | | | | | | | | | | | | | |
| | | | | |
Distributions(b) | | | | | | | | | | | | | | | | | | | | |
From net investment income | | | (0.34 | ) | | | (0.30 | ) | | | (0.32 | ) | | | (0.29 | ) | | | (0.27 | ) |
From net realized gain | | | (0.77 | ) | | | (1.78 | ) | | | (2.31 | ) | | | (0.06 | ) | | | (1.43 | ) |
| | | | | | | | | | | | | | | | | | | | |
Total distributions | | | (1.11 | ) | | | (2.08 | ) | | | (2.63 | ) | | | (0.35 | ) | | | (1.70 | ) |
| | | | | | | | | | | | | | | | | | | | |
| | | | | |
Net asset value, end of year | | $ | 15.44 | | | $ | 13.22 | | | $ | 16.53 | | | $ | 15.91 | | | $ | 15.10 | |
| | | | | | | | | | | | | | | | | | | | |
| | | | | |
Total Return(c) | | | | | | | | | | | | | | | | | | | | |
Based on net asset value | | | 25.29 | % | | | (7.70 | )% | | | 21.17 | % | | | 7.69 | % | | | (2.57 | )% |
| | | | | | | | | | | | | | | | | | | | |
| | | | | |
Ratios to Average Net Assets(d)(e) | | | | | | | | | | | | | | | | | | | | |
Total expenses | | | 0.80 | % | | | 0.80 | % | | | 0.79 | % | | | 0.79 | % | | | 0.93 | % |
| | | | | | | | | | | | | | | | | | | | |
Total expenses after fees waived and/or reimbursed | | | 0.80 | % | | | 0.80 | % | | | 0.79 | % | | | 0.79 | % | | | 0.92 | % |
| | | | | | | | | | | | | | | | | | | | |
Net investment income | | | 1.81 | % | | | 1.66 | % | | | 1.41 | % | | | 1.55 | % | | | 1.31 | % |
| | | | | | | | | | | | | | | | | | | | |
| | | | | |
Supplemental Data | | | | | | | | | | | | | | | | | | | | |
Net assets, end of year (000) | | $ | 173,103 | | | $ | 168,678 | | | $ | 204,321 | | | $ | 201,118 | | | $ | 221,048 | |
| | | | | | | | | | | | | | | | | | | | |
Portfolio turnover rate of the LifePath Dynamic Master Portfolio(f) | | | 35 | % | | | 39 | % | | | 30 | % | | | 77 | % | | | 19 | % |
| | | | | | | | | | | | | | | | | | | | |
| (a) | Based on average shares outstanding. |
| (b) | Distributions for annual periods determined in accordance with U.S. federal income tax regulations. |
| (c) | Where applicable, excludes the effects of any sales charges and assumes the reinvestment of distributions. |
| (d) | Includes the LifePath Dynamic Fund’s share of its corresponding LifePath Dynamic Master Portfolio’s allocated net expenses and/or net investment income. |
| (e) | Includes the LifePath Dynamic Fund’s share of its corresponding LifePath Dynamic Master Portfolio’s allocated fees waived and expenses and/or net investment income. Excludes expenses incurred indirectly as a result of the LifePath Dynamic Master Portfolio’s investments in underlying funds as follows: |
| | | | | | | | | | | | | | | | | | | | |
| | | Year Ended December 31, | |
| | | 2019 | | | 2018 | | | 2017 | | | 2016 | | | 2015 | |
Allocated fees waived | | | 0.42 | % | | | 0.40 | % | | | 0.41 | % | | | 0.38 | % | | | 0.38 | % |
Investments in underlying funds | | | 0.12 | % | | | 0.13 | % | | | 0.16 | % | | | 0.14 | % | | | 0.17 | % |
| | | | | | | | | | | | | | | | | | | | |
| (f) | Includes the LifePath Dynamic Master Portfolio’s purchases and sales of the underlying funds and Active Stock Master Portfolio, CoreAlpha Bond Master Portfolio, International Tilts Master Portfolio, Large Cap Index Master Portfolio, Master SmallCap Index Series and Master Total Return Portfolio. |
See notes to financial statements.
Financial Highlights (continued)
(For a share outstanding throughout each period)
| | | | | | | | | | | | | | | | | | | | |
| | | BlackRock LifePath Dynamic 2040 Fund (continued) | |
| |
| | | Investor C | |
| |
| | | Year Ended December 31, | |
| | | 2019 | | | 2018 | | | 2017 | | | 2016 | | | 2015 | |
| | | | | |
Net asset value, beginning of year | | $ | 14.37 | | | $ | 17.77 | | | $ | 16.93 | | | $ | 16.05 | | | $ | 18.19 | |
| | | | | | | | | | | | | | | | | | | | |
Net investment income(a) | | | 0.17 | | | | 0.15 | | | | 0.11 | | | | 0.13 | | | | 0.11 | |
Net realized and unrealized gain (loss) | | | 3.32 | | | | (1.62 | ) | | | 3.21 | | | | 0.96 | | | | (0.69 | ) |
| | | | | | | | | | | | | | | | | | | | |
Net increase (decrease) from investment operations | | | 3.49 | | | | (1.47 | ) | | | 3.32 | | | | 1.09 | | | | (0.58 | ) |
| | | | | | | | | | | | | | | | | | | | |
| | | | | |
Distributions(b) | | | | | | | | | | | | | | | | | | | | |
From net investment income | | | (0.20 | ) | | | (0.15 | ) | | | (0.17 | ) | | | (0.15 | ) | | | (0.13 | ) |
From net realized gain | | | (0.77 | ) | | | (1.78 | ) | | | (2.31 | ) | | | (0.06 | ) | | | (1.43 | ) |
| | | | | | | | | | | | | | | | | | | | |
Total distributions | | | (0.97 | ) | | | (1.93 | ) | | | (2.48 | ) | | | (0.21 | ) | | | (1.56 | ) |
| | | | | | | | | | | | | | | | | | | | |
| | | | | |
Net asset value, end of year | | $ | 16.89 | | | $ | 14.37 | | | $ | 17.77 | | | $ | 16.93 | | | $ | 16.05 | |
| | | | | | | | | | | | | | | | | | | | |
| | | | | |
Total Return(c) | | | | | | | | | | | | | | | | | | | | |
Based on net asset value | | | 24.35 | % | | | (8.47 | )% | | | 20.21 | % | | | 6.82 | % | | | (3.28 | )% |
| | | | | | | | | | | | | | | | | | | | |
| | | | | |
Ratios to Average Net Assets(d)(e) | | | | | | | | | | | | | | | | | | | | |
Total expenses | | | 1.60 | % | | | 1.60 | % | | | 1.59 | % | | | 1.60 | % | | | 1.68 | % |
| | | | | | | | | | | | | | | | | | | | |
Total expenses after fees waived and/or reimbursed | | | 1.60 | % | | | 1.60 | % | | | 1.59 | % | | | 1.59 | % | | | 1.68 | % |
| | | | | | | | | | | | | | | | | | | | |
Net investment income | | | 1.05 | % | | | 0.86 | % | | | 0.62 | % | | | 0.78 | % | | | 0.61 | % |
| | | | | | | | | | | | | | | | | | | | |
| | | | | |
Supplemental Data | | | | | | | | | | | | | | | | | | | | |
Net assets, end of year (000) | | $ | 3,276 | | | $ | 2,541 | | | $ | 3,017 | | | $ | 2,567 | | | $ | 2,492 | |
| | | | | | | | | | | | | | | | | | | | |
Portfolio turnover rate of the LifePath Dynamic Master Portfolio(f) | | | 35 | % | | | 39 | % | | | 30 | % | | | 77 | % | | | 19 | % |
| | | | | | | | | | | | | | | | | | | | |
| (a) | Based on average shares outstanding. |
| (b) | Distributions for annual periods determined in accordance with U.S. federal income tax regulations. |
| (c) | Where applicable, excludes the effects of any sales charges and assumes the reinvestment of distributions. |
| (d) | Includes the LifePath Dynamic Fund’s share of its corresponding LifePath Dynamic Master Portfolio’s allocated net expenses and/or net investment income. |
| (e) | Includes the LifePath Dynamic Fund’s share of its corresponding LifePath Dynamic Master Portfolio’s allocated fees waived and expenses and/or net investment income. Excludes expenses incurred indirectly as a result of the LifePath Dynamic Master Portfolio’s investments in underlying funds as follows: |
| | | | | | | | | | | | | | | | | | | | |
| | | Year Ended December 31, | |
| | | 2019 | | | 2018 | | | 2017 | | | 2016 | | | 2015 | |
Allocated fees waived | | | 0.42 | % | | | 0.40 | % | | | 0.41 | % | | | 0.38 | % | | | 0.38 | % |
Investments in underlying funds | | | 0.12 | % | | | 0.13 | % | | | 0.16 | % | | | 0.14 | % | | | 0.17 | % |
| | | | | | | | | | | | | | | | | | | | |
| (f) | Includes the LifePath Dynamic Master Portfolio’s purchases and sales of the underlying funds and Active Stock Master Portfolio, CoreAlpha Bond Master Portfolio, International Tilts Master Portfolio, Large Cap Index Master Portfolio, Master SmallCap Index Series and Master Total Return Portfolio. |
See notes to financial statements.
| | |
| 36 | | 2019 BLACKROCK ANNUAL REPORTTO SHAREHOLDERS |
Financial Highlights (continued)
(For a share outstanding throughout each period)
| | | | | | | | | | | | | | | | | | | | |
| | | BlackRock LifePath Dynamic 2040 Fund (continued) | |
| |
| | | Class K | |
| |
| | | Year Ended December 31, | |
| | | 2019 | | | 2018 | | | 2017 | | | 2016 | | | 2015 | |
| | | | | |
Net asset value, beginning of year | | $ | 14.70 | | | $ | 18.13 | | | $ | 17.23 | | | $ | 16.32 | | | $ | 18.47 | |
| | | | | | | | | | | | | | | | | | | | |
Net investment income(a) | | | 0.41 | | | | 0.38 | | | | 0.35 | | | | 0.34 | | | | 0.40 | |
Net realized and unrealized gain (loss) | | | 3.38 | | | | (1.66 | ) | | | 3.26 | | | | 0.99 | | | | (0.75 | ) |
| | | | | | | | | | | | | | | | | | | | |
Net increase (decrease) from investment operations | | | 3.79 | | | | (1.28 | ) | | | 3.61 | | | | 1.33 | | | | (0.35 | ) |
| | | | | | | | | | | | | | | | | | | | |
| | | | | |
Distributions(b) | | | | | | | | | | | | | | | | | | | | |
From net investment income | | | (0.40 | ) | | | (0.37 | ) | | | (0.40 | ) | | | (0.36 | ) | | | (0.37 | ) |
From net realized gain | | | (0.77 | ) | | | (1.78 | ) | | | (2.31 | ) | | | (0.06 | ) | | | (1.43 | ) |
| | | | | | | | | | | | | | | | | | | | |
Total distributions | | | (1.17 | ) | | | (2.15 | ) | | | (2.71 | ) | | | (0.42 | ) | | | (1.80 | ) |
| | | | | | | | | | | | | | | | | | | | |
| | | | | |
Net asset value, end of year | | $ | 17.32 | | | $ | 14.70 | | | $ | 18.13 | | | $ | 17.23 | | | $ | 16.32 | |
| | | | | | | | | | | | | | | | | | | | |
| | | | | |
Total Return(c) | | | | | | | | | | | | | | | | | | | | |
Based on net asset value | | | 25.96 | % | | | (7.31 | )% | | | 21.66 | % | | | 8.19 | % | | | (1.98 | )% |
| | | | | | | | | | | | | | | | | | | | |
| | | | | |
Ratios to Average Net Assets(d)(e) | | | | | | | | | | | | | | | | | | | | |
Total expenses | | | 0.35 | % | | | 0.35 | % | | | 0.34 | % | | | 0.34 | % | | | 0.36 | % |
| | | | | | | | | | | | | | | | | | | | |
Total expenses after fees waived and/or reimbursed | | | 0.35 | % | | | 0.35 | % | | | 0.34 | % | | | 0.34 | % | | | 0.35 | % |
| | | | | | | | | | | | | | | | | | | | |
Net investment income | | | 2.42 | % | | | 2.09 | % | | | 1.87 | % | | | 2.07 | % | | | 2.21 | % |
| | | | | | | | | | | | | | | | | | | | |
| | | | | |
Supplemental Data | | | | | | | | | | | | | | | | | | | | |
Net assets, end of year (000) | | $ | 47,987 | | | $ | 28,294 | | | $ | 40,407 | | | $ | 33,644 | | | $ | 14,470 | |
| | | | | | | | | | | | | | | | | | | | |
Portfolio turnover rate of the LifePath Dynamic Master Portfolio(f) | | | 35 | % | | | 39 | % | | | 30 | % | | | 77 | % | | | 19 | % |
| | | | | | | | | | | | | | | | | | | | |
| (a) | Based on average shares outstanding. |
| (b) | Distributions for annual periods determined in accordance with U.S. federal income tax regulations. |
| (c) | Where applicable, assumes the reinvestment of distributions. |
| (d) | Includes the LifePath Dynamic Fund’s share of its corresponding LifePath Dynamic Master Portfolio’s allocated net expenses and/or net investment income. |
| (e) | Includes the LifePath Dynamic Fund’s share of its corresponding LifePath Dynamic Master Portfolio’s allocated fees waived and expenses and/or net investment income. Excludes expenses incurred indirectly as a result of the LifePath Dynamic Master Portfolio’s investments in underlying funds as follows: |
| | | | | | | | | | | | | | | | | | | | |
| | | Year Ended December 31, | |
| | | 2019 | | | 2018 | | | 2017 | | | 2016 | | | 2015 | |
Allocated fees waived | | | 0.42 | % | | | 0.40 | % | | | 0.41 | % | | | 0.38 | % | | | 0.38 | % |
Investments in underlying funds | | | 0.12 | % | | | 0.13 | % | | | 0.16 | % | | | 0.14 | % | | | 0.17 | % |
| | | | | | | | | | | | | | | | | | | | |
| (f) | Includes the LifePath Dynamic Master Portfolio’s purchases and sales of the underlying funds and Active Stock Master Portfolio, CoreAlpha Bond Master Portfolio, International Tilts Master Portfolio, Large Cap Index Master Portfolio, Master SmallCap Index Series and Master Total Return Portfolio. |
See notes to financial statements.
Financial Highlights (continued)
(For a share outstanding throughout each period)
| | | | | | | | | | | | | | | | | | | | |
| | | BlackRock LifePath Dynamic 2040 Fund (continued) | |
| |
| | | Class R | |
| |
| | | Year Ended December 31, | |
| | | 2019 | | | 2018 | | | 2017 | | | 2016 | | | 2015 | |
| | | | | |
Net asset value, beginning of year | | $ | 14.48 | | | $ | 17.89 | | | $ | 17.04 | | | $ | 16.15 | | | $ | 18.29 | |
| | | | | | | | | | | | | | | | | | | | |
Net investment income(a) | | | 0.28 | | | | 0.25 | | | | 0.22 | | | | 0.23 | | | | 0.21 | |
Net realized and unrealized gain (loss) | | | 3.34 | | | | (1.63 | ) | | | 3.22 | | | | 0.98 | | | | (0.69 | ) |
| | | | | | | | | | | | | | | | | | | | |
Net increase (decrease) from investment operations | | | 3.62 | | | | (1.38 | ) | | | 3.44 | | | | 1.21 | | | | (0.48 | ) |
| | | | | | | | | | | | | | | | | | | | |
| | | | | |
Distributions(b) | | | | | | | | | | | | | | | | | | | | |
From net investment income | | | (0.31 | ) | | | (0.25 | ) | | | (0.28 | ) | | | (0.26 | ) | | | (0.23 | ) |
From net realized gain | | | (0.77 | ) | | | (1.78 | ) | | | (2.31 | ) | | | (0.06 | ) | | | (1.43 | ) |
| | | | | | | | | | | | | | | | | | | | |
Total distributions | | | (1.08 | ) | | | (2.03 | ) | | | (2.59 | ) | | | (0.32 | ) | | | (1.66 | ) |
| | | | | | | | | | | | | | | | | | | | |
| | | | | |
Net asset value, end of year | | $ | 17.02 | | | $ | 14.48 | | | $ | 17.89 | | | $ | 17.04 | | | $ | 16.15 | |
| | | | | | | | | | | | | | | | | | | | |
| | | | | |
Total Return(c) | | | | | | | | | | | | | | | | | | | | |
Based on net asset value | | | 25.10 | % | | | (7.92 | )% | | | 20.86 | % | | | 7.50 | % | | | (2.75 | )% |
| | | | | | | | | | | | | | | | | | | | |
| | | | | |
Ratios to Average Net Assets(d)(e) | | | | | | | | | | | | | | | | | | | | |
Total expenses | | | 1.01 | % | | | 1.00 | % | | | 0.99 | % | | | 1.00 | % | | | 1.17 | % |
| | | | | | | | | | | | | | | | | | | | |
Total expenses after fees waived and/or reimbursed | | | 1.00 | % | | | 1.00 | % | | | 0.99 | % | | | 0.99 | % | | | 1.17 | % |
| | | | | | | | | | | | | | | | | | | | |
Net investment income | | | 1.70 | % | | | 1.41 | % | | | 1.22 | % | | | 1.40 | % | | | 1.13 | % |
| | | | | | | | | | | | | | | | | | | | |
| | | | | |
Supplemental Data | | | | | | | | | | | | | | | | | | | | |
Net assets, end of year (000) | | $ | 4,005 | | | $ | 2,078 | | | $ | 3,132 | | | $ | 2,190 | | | $ | 1,389 | |
| | | | | | | | | | | | | | | | | | | | |
Portfolio turnover rate of the LifePath Dynamic Master Portfolio(f) | | | 35 | % | | | 39 | % | | | 30 | % | | | 77 | % | | | 19 | % |
| | | | | | | | | | | | | | | | | | | | |
| (a) | Based on average shares outstanding. |
| (b) | Distributions for annual periods determined in accordance with U.S. federal income tax regulations. |
| (c) | Where applicable, assumes the reinvestment of distributions. |
| (d) | Includes the LifePath Dynamic Fund’s share of its corresponding LifePath Dynamic Master Portfolio’s allocated net expenses and/or net investment income. |
| (e) | Includes the LifePath Dynamic Fund’s share of its corresponding LifePath Dynamic Master Portfolio’s allocated fees waived and expenses and/or net investment income. Excludes expenses incurred indirectly as a result of the LifePath Dynamic Master Portfolio’s investments in underlying funds as follows: |
| | | | | | | | | | | | | | | | | | | | |
| | | Year Ended December 31, | |
| | | 2019 | | | 2018 | | | 2017 | | | 2016 | | | 2015 | |
Allocated fees waived | | | 0.42 | % | | | 0.40 | % | | | 0.41 | % | | | 0.38 | % | | | 0.38 | % |
Investments in underlying funds | | | 0.12 | % | | | 0.13 | % | | | 0.16 | % | | | 0.14 | % | | | 0.17 | % |
| | | | | | | | | | | | | | | | | | | | |
| (f) | Includes the LifePath Dynamic Master Portfolio’s purchases and sales of the underlying funds and Active Stock Master Portfolio, CoreAlpha Bond Master Portfolio, International Tilts Master Portfolio, Large Cap Index Master Portfolio, Master SmallCap Index Series and Master Total Return Portfolio. |
See notes to financial statements.
| | |
| 38 | | 2019 BLACKROCK ANNUAL REPORTTO SHAREHOLDERS |
Financial Highlights (continued)
(For a share outstanding throughout each period)
| | | | | | | | | | | | | | | | | | | | |
| | | BlackRock LifePath Dynamic 2050 Fund | |
| |
| | | Institutional | |
| |
| | | Year Ended December 31, | |
| | | 2019 | | | 2018 | | | 2017 | | | 2016 | | | 2015 | |
| | | | | |
Net asset value, beginning of year | | $ | 17.13 | | | $ | 21.54 | | | $ | 18.58 | | | $ | 17.53 | | | $ | 19.59 | |
| | | | | | | | | | | | | | | | | | | | |
Net investment income(a) | | | 0.41 | | | | 0.36 | | | | 0.33 | | | | 0.31 | | | | 0.28 | |
Net realized and unrealized gain (loss) | | | 4.09 | | | | (2.07 | ) | | | 3.89 | | | | 1.12 | | | | (0.74 | ) |
| | | | | | | | | | | | | | | | | | | | |
Net increase (decrease) from investment operations | | | 4.50 | | | | (1.71 | ) | | | 4.22 | | | | 1.43 | | | | (0.46 | ) |
| | | | | | | | | | | | | | | | | | | | |
| | | | | |
Distributions(b) | | | | | | | | | | | | | | | | | | | | |
From net investment income | | | (0.42 | ) | | | (0.42 | ) | | | (0.40 | ) | | | (0.38 | ) | | | (0.30 | ) |
From net realized gain | | | (0.82 | ) | | | (2.28 | ) | | | (0.86 | ) | | | — | | | | (1.30 | ) |
| | | | | | | | | | | | | | | | | | | | |
Total distributions | | | (1.24 | ) | | | (2.70 | ) | | | (1.26 | ) | | | (0.38 | ) | | | (1.60 | ) |
| | | | | | | | | | | | | | | | | | | | |
| | | | | |
Net asset value, end of year | | $ | 20.39 | | | $ | 17.13 | | | $ | 21.54 | | | $ | 18.58 | | | $ | 17.53 | |
| | | | | | | | | | | | | | | | | | | | |
| | | | | |
Total Return(c) | | | | | | | | | | | | | | | | | | | | |
Based on net asset value | | | 26.38 | % | | | (8.27 | )% | | | 22.85 | % | | | 8.19 | % | | | (2.46 | )% |
| | | | | | | | | | | | | | | | | | | | |
| | | | | |
Ratios to Average Net Assets(d)(e) | | | | | | | | | | | | | | | | | | | | |
Total expenses | | | 0.56 | % | | | 0.56 | % | | | 0.54 | % | | | 0.55 | % | | | 0.66 | % |
| | | | | | | | | | | | | | | | | | | | |
Total expenses after fees waived and/or reimbursed | | | 0.55 | % | | | 0.55 | % | | | 0.53 | % | | | 0.54 | % | | | 0.65 | % |
| | | | | | | | | | | | | | | | | | | | |
Net investment income | | | 2.07 | % | | | 1.68 | % | | | 1.59 | % | | | 1.71 | % | | | 1.42 | % |
| | | | | | | | | | | | | | | | | | | | |
| | | | | |
Supplemental Data | | | | | | | | | | | | | | | | | | | | |
Net assets, end of year (000) | | $ | 16,870 | | | $ | 11,376 | | | $ | 18,804 | | | $ | 31,857 | | | $ | 40,444 | |
| | | | | | | | | | | | | | | | | | | | |
Portfolio turnover rate of the LifePath Dynamic Master Portfolio(f) | | | 42 | % | | | 43 | % | | | 35 | % | | | 70 | % | | | 36 | % |
| | | | | | | | | | | | | | | | | | | | |
| (a) | Based on average shares outstanding. |
| (b) | Distributions for annual periods determined in accordance with U.S. federal income tax regulations. |
| (c) | Where applicable, assumes the reinvestment of distributions. |
| (d) | Includes the LifePath Dynamic Fund’s share of its corresponding LifePath Dynamic Master Portfolio’s allocated net expenses and/or net investment income. |
| (e) | Includes the LifePath Dynamic Fund’s share of its corresponding LifePath Dynamic Master Portfolio’s allocated fees waived and expenses and/or net investment income. Excludes expenses incurred indirectly as a result of the LifePath Dynamic Master Portfolio’s investments in underlying funds as follows: |
| | | | | | | | | | | | | | | | | | | | |
| | | Year Ended December 31, | |
| | | 2019 | | | 2018 | | | 2017 | | | 2016 | | | 2015 | |
Allocated fees waived | | | 0.45 | % | | | 0.42 | % | | | 0.42 | % | | | 0.40 | % | | | 0.42 | % |
Investments in underlying funds | | | 0.12 | % | | | 0.12 | % | | | 0.16 | % | | | 0.15 | % | | | 0.19 | % |
| | | | | | | | | | | | | | | | | | | | |
| (f) | Includes the LifePath Dynamic Master Portfolio’s purchases and sales of the underlying funds and Active Stock Master Portfolio, CoreAlpha Bond Master Portfolio, International Tilts Master Portfolio, LargeCap Index Master Portfolio, Master SmallCap Index Series and Master Total Return Portfolio. |
See notes to financial statements.
Financial Highlights (continued)
(For a share outstanding throughout each period)
| | | | | | | | | | | | | | | | | | | | |
| | | BlackRock LifePath Dynamic 2050 Fund (continued) | |
| |
| | | Investor A | |
| |
| | | Year Ended December 31, | |
| | | 2019 | | | 2018 | | | 2017 | | | 2016 | | | 2015 | |
| | | | | |
Net asset value, beginning of year | | $ | 17.06 | | | $ | 21.47 | | | $ | 18.54 | | | $ | 17.49 | | | $ | 19.56 | |
| | | | | | | | | | | | | | | | | | | | |
Net investment income(a) | | | 0.34 | | | | 0.31 | | | | 0.29 | | | | 0.27 | | | | 0.27 | |
Net realized and unrealized gain (loss) | | | 4.10 | | | | (2.07 | ) | | | 3.86 | | | | 1.11 | | | | (0.77 | ) |
| | | | | | | | | | | | | | | | | | | | |
Net increase (decrease) from investment operations | | | 4.44 | | | | (1.76 | ) | | | 4.15 | | | | 1.38 | | | | (0.50 | ) |
| | | | | | | | | | | | | | | | | | | | |
| | | | | |
Distributions(b) | | | | | | | | | | | | | | | | | | | | |
From net investment income | | | (0.37 | ) | | | (0.37 | ) | | | (0.36 | ) | | | (0.33 | ) | | | (0.27 | ) |
From net realized gain | | | (0.82 | ) | | | (2.28 | ) | | | (0.86 | ) | | | — | | | | (1.30 | ) |
| | | | | | | | | | | | | | | | | | | | |
Total distributions | | | (1.19 | ) | | | (2.65 | ) | | | (1.22 | ) | | | (0.33 | ) | | | (1.57 | ) |
| | | | | | | | | | | | | | | | | | | | |
| | | | | |
Net asset value, end of year | | $ | 20.31 | | | $ | 17.06 | | | $ | 21.47 | | | $ | 18.54 | | | $ | 17.49 | |
| | | | | | | | | | | | | | | | | | | | |
| | | | | |
Total Return(c) | | | | | | | | | | | | | | | | | | | | |
Based on net asset value | | | 26.11 | % | | | (8.51 | )% | | | 22.48 | % | | | 7.95 | % | | | (2.65 | )% |
| | | | | | | | | | | | | | | | | | | | |
| | | | | |
Ratios to Average Net Assets(d)(e) | | | | | | | | | | | | | | | | | | | | |
Total expenses | | | 0.81 | % | | | 0.81 | % | | | 0.79 | % | | | 0.80 | % | | | 0.92 | % |
| | | | | | | | | | | | | | | | | | | | |
Total expenses after fees waived and/or reimbursed | | | 0.80 | % | | | 0.80 | % | | | 0.78 | % | | | 0.79 | % | | | 0.91 | % |
| | | | | | | | | | | | | | | | | | | | |
Net investment income | | | 1.76 | % | | | 1.47 | % | | | 1.43 | % | | | 1.51 | % | | | 1.38 | % |
| | | | | | | | | | | | | | | | | | | | |
| | | | | |
Supplemental Data | | | | | | | | | | | | | | | | | | | | |
Net assets, end of year (000) | | $ | 75,986 | | | $ | 70,181 | | | $ | 82,949 | | | $ | 69,168 | | | $ | 70,473 | |
| | | | | | | | | | | | | | | | | | | | |
Portfolio turnover rate of the LifePath Dynamic Master Portfolio(f) | | | 42 | % | | | 43 | % | | | 35 | % | | | 70 | % | | | 36 | % |
| | | | | | | | | | | | | | | | | | | | |
| (a) | Based on average shares outstanding. |
| (b) | Distributions for annual periods determined in accordance with U.S. federal income tax regulations. |
| (c) | Where applicable, excludes the effects of any sales charges and assumes the reinvestment of distributions. |
| (d) | Includes the LifePath Dynamic Fund’s share of its corresponding LifePath Dynamic Master Portfolio’s allocated net expenses and/or net investment income. |
| (e) | Includes the LifePath Dynamic Fund’s share of its corresponding LifePath Dynamic Master Portfolio’s allocated fees waived and expenses and/or net investment income. Excludes expenses incurred indirectly as a result of the LifePath Dynamic Master Portfolio’s investments in underlying funds as follows: |
| | | | | | | | | | | | | | | | | | | | |
| | | Year Ended December 31, | |
| | | 2019 | | | 2018 | | | 2017 | | | 2016 | | | 2015 | |
Allocated fees waived | | | 0.45 | % | | | 0.42 | % | | | 0.42 | % | | | 0.40 | % | | | 0.40 | % |
Investments in underlying funds | | | 0.12 | % | | | 0.12 | % | | | 0.16 | % | | | 0.15 | % | | | 0.19 | % |
| | | | | | | | | | | | | | | | | | | | |
| (f) | Includes the LifePath Dynamic Master Portfolio’s purchases and sales of the underlying funds and Active Stock Master Portfolio, CoreAlpha Bond Master Portfolio, International Tilts Master Portfolio, LargeCap Index Master Portfolio, Master SmallCap Index Series and Master Total Return Portfolio. |
See notes to financial statements.
| | |
| 40 | | 2019 BLACKROCK ANNUAL REPORTTO SHAREHOLDERS |
Financial Highlights (continued)
(For a share outstanding throughout each period)
| | | | | | | | | | | | | | | | | | | | |
| | | BlackRock LifePath Dynamic 2050 Fund (continued) | |
| |
| | | Investor C | |
| |
| | | Year Ended December 31, | |
| | | 2019 | | | 2018 | | | 2017 | | | 2016 | | | 2015 | |
| | | | | |
Net asset value, beginning of year | | $ | 16.86 | | | $ | 21.26 | | | $ | 18.38 | | | $ | 17.35 | | | $ | 19.43 | |
| | | | | | | | | | | | | | | | | | | | |
Net investment income(a) | | | 0.20 | | | | 0.14 | | | | 0.14 | | | | 0.13 | | | | 0.13 | |
Net realized and unrealized gain (loss) | | | 4.02 | | | | (2.05 | ) | | | 3.81 | | | | 1.09 | | | | (0.77 | ) |
| | | | | | | | | | | | | | | | | | | | |
Net increase (decrease) from investment operations | | | 4.22 | | | | (1.91 | ) | | | 3.95 | | | | 1.22 | | | | (0.64 | ) |
| | | | | | | | | | | | | | | | | | | | |
| | | | | |
Distributions(b) | | | | | | | | | | | | | | | | | | | | |
From net investment income | | | (0.24 | ) | | | (0.21 | ) | | | (0.21 | ) | | | (0.19 | ) | | | (0.14 | ) |
From net realized gain | | | (0.82 | ) | | | (2.28 | ) | | | (0.86 | ) | | | — | | | | (1.30 | ) |
| | | | | | | | | | | | | | | | | | | | |
Total distributions | | | (1.06 | ) | | | (2.49 | ) | | | (1.07 | ) | | | (0.19 | ) | | | (1.44 | ) |
| | | | | | | | | | | | | | | | | | | | |
| | | | | |
Net asset value, end of year | | $ | 20.02 | | | $ | 16.86 | | | $ | 21.26 | | | $ | 18.38 | | | $ | 17.35 | |
| | | | | | | | | | | | | | | | | | | | |
| | | | | |
Total Return(c) | | | | | | | | | | | | | | | | | | | | |
Based on net asset value | | | 25.10 | % | | | (9.25 | )% | | | 21.53 | % | | | 7.08 | % | | | (3.41 | )% |
| | | | | | | | | | | | | | | | | | | | |
| | | | | |
Ratios to Average Net Assets(d)(e) | | | | | | | | | | | | | | | | | | | | |
Total expenses | | | 1.61 | % | | | 1.61 | % | | | 1.59 | % | | | 1.60 | % | | | 1.68 | % |
| | | | | | | | | | | | | | | | | | | | |
Total expenses after fees waived and/or reimbursed | | | 1.60 | % | | | 1.60 | % | | | 1.58 | % | | | 1.59 | % | | | 1.67 | % |
| | | | | | | | | | | | | | | | | | | | |
Net investment income | | | 1.01 | % | | | 0.68 | % | | | 0.66 | % | | | 0.72 | % | | | 0.66 | % |
| | | | | | | | | | | | | | | | | | | | |
| | | | | |
Supplemental Data | | | | | | | | | | | | | | | | | | | | |
Net assets, end of year (000) | | $ | 1,774 | | | $ | 1,299 | | | $ | 1,211 | | | $ | 744 | | | $ | 717 | |
| | | | | | | | | | | | | | | | | | | | |
Portfolio turnover rate of the LifePath Dynamic Master Portfolio(f) | | | 42 | % | | | 43 | % | | | 35 | % | | | 70 | % | | | 36 | % |
| | | | | | | | | | | | | | | | | | | | |
| (a) | Based on average shares outstanding. |
| (b) | Distributions for annual periods determined in accordance with U.S. federal income tax regulations. |
| (c) | Where applicable, excludes the effects of any sales charges and assumes the reinvestment of distributions. |
| (d) | Includes the LifePath Dynamic Fund’s share of its corresponding LifePath Dynamic Master Portfolio’s allocated net expenses and/or net investment income. |
| (e) | Includes the LifePath Dynamic Fund’s share of its corresponding LifePath Dynamic Master Portfolio’s allocated fees waived and expenses and/or net investment income. Excludes expenses incurred indirectly as a result of the LifePath Dynamic Master Portfolio’s investments in underlying funds as follows: |
| | | | | | | | | | | | | | | | | | | | |
| | | Year Ended December 31, | |
| | | 2019 | | | 2018 | | | 2017 | | | 2016 | | | 2015 | |
Allocated fees waived | | | 0.45 | % | | | 0.42 | % | | | 0.42 | % | | | 0.40 | % | | | 0.40 | % |
Investments in underlying funds | | | 0.12 | % | | | 0.12 | % | | | 0.16 | % | | | 0.15 | % | | | 0.19 | % |
| | | | | | | | | | | | | | | | | | | | |
| (f) | Includes the LifePath Dynamic Master Portfolio’s purchases and sales of the underlying funds and Active Stock Master Portfolio, CoreAlpha Bond Master Portfolio, International Tilts Master Portfolio, LargeCap Index Master Portfolio, Master SmallCap Index Series and Master Total Return Portfolio. |
See notes to financial statements.
Financial Highlights (continued)
(For a share outstanding throughout each period)
| | | | | | | | | | | | | | | | | | | | |
| | | BlackRock LifePath Dynamic 2050 Fund (continued) | |
| |
| | | Class K | |
| |
| | | Year Ended December 31, | |
| | | 2019 | | | 2018 | | | 2017 | | | 2016 | | | 2015 | |
| | | | | |
Net asset value, beginning of year | | $ | 17.18 | | | $ | 21.59 | | | $ | 18.63 | | | $ | 17.58 | | | $ | 19.66 | |
| | | | | | | | | | | | | | | | | | | | |
Net investment income(a) | | | 0.50 | | | | 0.37 | | | | 0.39 | | | | 0.36 | | | | 0.39 | |
Net realized and unrealized gain (loss) | | | 4.06 | | | | (2.05 | ) | | | 3.88 | | | | 1.11 | | | | (0.78 | ) |
| | | | | | | | | | | | | | | | | | | | |
Net increase (decrease) from investment operations | | | 4.56 | | | | (1.68 | ) | | | 4.27 | | | | 1.47 | | | | (0.39 | ) |
| | | | | | | | | | | | | | | | | | | | |
| | | | | |
Distributions(b) | | | | | | | | | | | | | | | | | | | | |
From net investment income | | | (0.46 | ) | | | (0.45 | ) | | | (0.45 | ) | | | (0.42 | ) | | | (0.39 | ) |
From net realized gain | | | (0.82 | ) | | | (2.28 | ) | | | (0.86 | ) | | | — | | | | (1.30 | ) |
| | | | | | | | | | | | | | | | | | | | |
Total distributions | | | (1.28 | ) | | | (2.73 | ) | | | (1.31 | ) | | | (0.42 | ) | | | (1.69 | ) |
| | | | | | | | | | | | | | | | | | | | |
| | | | | |
Net asset value, end of year | | $ | 20.46 | | | $ | 17.18 | | | $ | 21.59 | | | $ | 18.63 | | | $ | 17.58 | |
| | | | | | | | | | | | | | | | | | | | |
| | | | | |
Total Return(c) | | | | | | | | | | | | | | | | | | | | |
Based on net asset value | | | 26.67 | % | | | (8.11 | )% | | | 23.07 | % | | | 8.43 | % | | | (2.10 | )% |
| | | | | | | | | | | | | | | | | | | | |
| | | | | |
Ratios to Average Net Assets(d)(e) | | | | | | | | | | | | | | | | | | | | |
Total expenses | | | 0.36 | % | | | 0.36 | % | | | 0.34 | % | | | 0.34 | % | | | 0.34 | % |
| | | | | | | | | | | | | | | | | | | | |
Total expenses after fees waived and/or reimbursed | | | 0.35 | % | | | 0.35 | % | | | 0.33 | % | | | 0.33 | % | | | 0.33 | % |
| | | | | | | | | | | | | | | | | | | | |
Net investment income | | | 2.54 | % | | | 1.69 | % | | | 1.89 | % | | | 2.00 | % | | | 2.01 | % |
| | | | | | | | | | | | | | | | | | | | |
| | | | | |
Supplemental Data | | | | | | | | | | | | | | | | | | | | |
Net assets, end of year (000) | | $ | 16,383 | | | $ | 4,504 | | | $ | 17,057 | | | $ | 13,388 | | | $ | 1,647 | |
| | | | | | | | | | | | | | | | | | | | |
Portfolio turnover rate of the LifePath Dynamic Master Portfolio(f) | | | 42 | % | | | 43 | % | | | 35 | % | | | 70 | % | | | 36 | % |
| | | | | | | | | | | | | | | | | | | | |
| (a) | Based on average shares outstanding. |
| (b) | Distributions for annual periods determined in accordance with U.S. federal income tax regulations. |
| (c) | Where applicable, assumes the reinvestment of distributions. |
| (d) | Includes the LifePath Dynamic Fund’s share of its corresponding LifePath Dynamic Master Portfolio’s allocated net expenses and/or net investment income. |
| (e) | Includes the LifePath Dynamic Fund’s share of its corresponding LifePath Dynamic Master Portfolio’s allocated expenses and/or net investment income. Excludes expenses incurred indirectly as a result of the LifePath Dynamic Master Portfolio’s investments in underlying funds as follows: |
| | | | | | | | | | | | | | | | | | | | |
| | | Year Ended December 31, | |
| | | 2019 | | | 2018 | | | 2017 | | | 2016 | | | 2015 | |
Allocated fees waived | | | 0.45 | % | | | 0.42 | % | | | 0.42 | % | | | 0.40 | % | | | 0.40 | % |
Investments in underlying funds | | | 0.12 | % | | | 0.12 | % | | | 0.16 | % | | | 0.15 | % | | | 0.19 | % |
| | | | | | | | | | | | | | | | | | | | |
| (f) | Includes the LifePath Dynamic Master Portfolio’s purchases and sales of the underlying funds and Active Stock Master Portfolio, CoreAlpha Bond Master Portfolio, International Tilts Master Portfolio, LargeCap Index Master Portfolio, Master SmallCap Index Series and Master Total Return Portfolio. |
See notes to financial statements.
| | |
| 42 | | 2019 BLACKROCK ANNUAL REPORTTO SHAREHOLDERS |
Financial Highlights (continued)
(For a share outstanding throughout each period)
| | | | | | | | | | | | | | | | | | | | |
| | | BlackRock LifePath Dynamic 2050 Fund (continued) | |
| |
| | | Class R | |
| |
| | | Year Ended December 31, | |
| | | 2019 | | | 2018 | | | 2017 | | | 2016 | | | 2015 | |
| | | | | |
Net asset value, beginning of year | | $ | 17.00 | | | $ | 21.42 | | | $ | 18.50 | | | $ | 17.45 | | | $ | 19.53 | |
| | | | | | | | | | | | | | | | | | | | |
Net investment income(a) | | | 0.31 | | | | 0.27 | | | | 0.25 | | | | 0.23 | | | | 0.23 | |
Net realized and unrealized gain (loss) | | | 4.08 | | | | (2.08 | ) | | | 3.85 | | | | 1.11 | | | | (0.78 | ) |
| | | | | | | | | | | | | | | | | | | | |
Net increase (decrease) from investment operations | | | 4.39 | | | | (1.81 | ) | | | 4.10 | | | | 1.34 | | | | (0.55 | ) |
| | | | | | | | | | | | | | | | | | | | |
| | | | | |
Distributions(b) | | | | | | | | | | | | | | | | | | | | |
From net investment income | | | (0.34 | ) | | | (0.33 | ) | | | (0.32 | ) | | | (0.29 | ) | | | (0.23 | ) |
From net realized gain | | | (0.82 | ) | | | (2.28 | ) | | | (0.86 | ) | | | — | | | | (1.30 | ) |
| | | | | | | | | | | | | | | | | | | | |
Total distributions | | | (1.16 | ) | | | (2.61 | ) | | | (1.18 | ) | | | (0.29 | ) | | | (1.53 | ) |
| | | | | | | | | | | | | | | | | | | | |
| | | | | |
Net asset value, end of year | | $ | 20.23 | | | $ | 17.00 | | | $ | 21.42 | | | $ | 18.50 | | | $ | 17.45 | |
| | | | | | | | | | | | | | | | | | | | |
| | | | | |
Total Return(c) | | | | | | | | | | | | | | | | | | | | |
Based on net asset value | | | 25.92 | % | | | (8.74 | )% | | | 22.24 | % | | | 7.75 | % | | | (2.92 | )% |
| | | | | | | | | | | | | | | | | | | | |
| | | | | |
Ratios to Average Net Assets(d)(e) | | | | | | | | | | | | | | | | | | | | |
Total expenses | | | 1.01 | % | | | 1.01 | % | | | 0.99 | % | | | 1.00 | % | | | 1.17 | % |
| | | | | | | | | | | | | | | | | | | | |
Total expenses after fees waived and/or reimbursed | | | 1.00 | % | | | 1.00 | % | | | 0.98 | % | | | 0.99 | % | | | 1.16 | % |
| | | | | | | | | | | | | | | | | | | | |
Net investment income | | | 1.57 | % | | | 1.29 | % | | | 1.22 | % | | | 1.31 | % | | | 1.20 | % |
| | | | | | | | | | | | | | | | | | | | |
| | | | | |
Supplemental Data | | | | | | | | | | | | | | | | | | | | |
Net assets, end of year (000) | | $ | 2,558 | | | $ | 1,620 | | | $ | 1,548 | | | $ | 1,324 | | | $ | 1,550 | |
| | | | | | | | | | | | | | | | | | | | |
Portfolio turnover rate of the LifePath Dynamic Master Portfolio(f) | | | 42 | % | | | 43 | % | | | 35 | % | | | 70 | % | | | 36 | % |
| | | | | | | | | | | | | | | | | | | | |
| (a) | Based on average shares outstanding. |
| (b) | Distributions for annual periods determined in accordance with U.S. federal income tax regulations. |
| (c) | Where applicable, assumes the reinvestment of distributions. |
| (d) | Includes the LifePath Dynamic Fund’s share of its corresponding LifePath Dynamic Master Portfolio’s allocated net expenses and/or net investment income. |
| (e) | Includes the LifePath Dynamic Fund’s share of its corresponding LifePath Dynamic Master Portfolio’s allocated fees waived and expenses and/or net investment income. Excludes expenses incurred indirectly as a result of the LifePath Dynamic Master Portfolio’s investments in underlying funds as follows: |
| | | | | | | | | | | | | | | | | | | | |
| | | Year Ended December 31, | |
| | | 2019 | | | 2018 | | | 2017 | | | 2016 | | | 2015 | |
Allocated fees waived | | | 0.45 | % | | | 0.42 | % | | | 0.42 | % | | | 0.40 | % | | | 0.40 | % |
Investments in underlying funds | | | 0.12 | % | | | 0.12 | % | | | 0.16 | % | | | 0.15 | % | | | 0.19 | % |
| | | | | | | | | | | | | | | | | | | | |
| (f) | Includes the LifePath Dynamic Master Portfolio’s purchases and sales of the underlying funds and Active Stock Master Portfolio, CoreAlpha Bond Master Portfolio, International Tilts Master Portfolio, LargeCap Index Master Portfolio, Master SmallCap Index Series and Master Total Return Portfolio. |
See notes to financial statements.
Financial Highlights (continued)
(For a share outstanding throughout each period)
| | | | | | | | | | | | | | | | |
| | | BlackRock LifePath
Dynamic 2060 Fund | |
| |
| | | Institutional | |
| | | |
| | | Year Ended
December 31, | | | | | | Period from
05/31/17 (a) to 12/31/17 | |
| | | 2019 | | | 2018 | |
| | | | | |
Net asset value, beginning of period | | $ | 9.34 | | | $ | 11.02 | | | | | | | $ | 10.00 | |
| | | | | | | | | | | | | | | | |
Net investment income(b) | | | 0.26 | | | | 0.19 | | | | | | | | 0.13 | |
Net realized and unrealized gain (loss) | | | 2.20 | | | | (1.13 | ) | | | | | | | 1.04 | |
| | | | | | | | | | | | | | | | |
Net increase (decrease) from investment operations | | | 2.46 | | | | (0.94 | ) | | | | | | | 1.17 | |
| | | | | | | | | | | | | | | | |
| | | | |
Distributions(c) | | | | | | | | | | | | | | | | |
From net investment income | | | (0.21 | ) | | | (0.24 | ) | | | | | | | (0.15 | ) |
From net realized gain | | | (0.12 | ) | | | (0.50 | ) | | | | | | | — | |
| | | | | | | | | | | | | | | | |
Total distributions | | | (0.33 | ) | | | (0.74 | ) | | | | | | | (0.15 | ) |
| | | | | | | | | | | | | | | | |
| | | | |
Net asset value, end of period | | $ | 11.47 | | | $ | 9.34 | | | | | | | $ | 11.02 | |
| | | | | | | | | | | | | | | | |
| | | | |
Total Return(d) | | | | | | | | | | | | | | | | |
Based on net asset value | | | 26.47 | %(e) | | | (8.64 | )% | | | | | | | 11.71 | %(f) |
| | | | | | | | | | | | | | | | |
| | | | |
Ratios to Average Net Assets(g)(h) | | | | | | | | | | | | | | | | |
Total expenses | | | 0.92 | % | | | 1.10 | % | | | | | | | 1.03 | %(i)(j) |
| | | | | | | | | | | | | | | | |
Total expenses after fees waived and/or reimbursed | | | 0.54 | % | | | 0.55 | % | | | | | | | 0.56 | %(i) |
| | | | | | | | | | | | | | | | |
Net investment income | | | 2.39 | % | | | 1.73 | % | | | | | | | 2.07 | %(i) |
| | | | | | | | | | | | | | | | |
| | | | |
Supplemental Data | | | | | | | | | | | | | | | | |
Net assets, end of period (000) | | $ | 237 | | | $ | 19 | | | | | | | $ | 27 | |
| | | | | | | | | | | | | | | | |
Portfolio turnover rate of the LifePath Dynamic Master Portfolio(k) | | | 44 | % | | | 58 | % | | | | | | | 35 | % |
| | | | | | | | | | | | | | | | |
| (a) | Commencement of operations. |
| (b) | Based on average shares outstanding. |
| (c) | Distributions for annual periods determined in accordance with U.S. federal income tax regulations. |
| (d) | Where applicable, assumes the reinvestment of distributions. |
| (e) | Includes payment received from an affiliate, which impacted the Fund’s total return. Excluding the payment from an affiliate, the Fund’s total return is 26.36%. |
| (f) | Aggregate total return. |
| (g) | Includes the LifePath Dynamic Fund’s share of its corresponding LifePath Dynamic Master Portfolio’s allocated net expenses and/or net investment income. |
| (h) | Includes the LifePath Dynamic Fund’s share of its corresponding LifePath Dynamic Master Portfolio’s allocated expenses and/or net investment income. Excludes expenses incurred indirectly as a result of the LifePath Dynamic Master Portfolio’s investments in underlying funds as follows: |
| | | | | | | | | | | | | | | | |
| | | Year Ended
December 31, | | | | | | Period from
05/31/17 (a) to 12/31/17 | |
| | | 2019 | | | 2018 | | | | |
Allocated fees waived | | | 1.37 | % | | | 1.50 | % | | | | | | | 1.88 | % |
Investments in underlying funds | | | 0.13 | % | | | 0.14 | % | | | | | | | 0.23 | % |
| | | | | | | | | | | | | | | | |
| (j) | Audit costs were not annualized in the calculation of the expense ratio. If these expenses were annualized, the total expenses would have been 1.37%. |
| (k) | Includes the LifePath Dynamic Master Portfolio’s purchases and sales of the underlying funds and Active Stock Master Portfolio, CoreAlpha Bond Master Portfolio, International Tilts Master Portfolio and Master Total Return Portfolio. |
See notes to financial statements.
| | |
| 44 | | 2019 BLACKROCK ANNUAL REPORTTO SHAREHOLDERS |
Financial Highlights (continued)
(For a share outstanding throughout each period)
| | | | | | | | | | | | | | | | |
| | | BlackRock LifePath
Dynamic 2060 Fund (continued) | |
| |
| | | Investor A | |
| | | |
| | | Year Ended
December 31, | | | | | | Period from
05/31/17 (a) to 12/31/17 | |
| | | 2019 | | | 2018 | |
| | | | | |
Net asset value, beginning of period | | $ | 9.33 | | | $ | 11.02 | | | | | | | $ | 10.00 | |
| | | | | | | | | | | | | | | | |
Net investment income(b) | | | 0.23 | | | | 0.17 | | | | | | | | 0.11 | |
Net realized and unrealized gain (loss) | | | 2.21 | | | | (1.13 | ) | | | | | | | 1.04 | |
| | | | | | | | | | | | | | | | |
Net increase (decrease) from investment operations | | | 2.44 | | | | (0.96 | ) | | | | | | | 1.15 | |
| | | | | | | | | | | | | | | | |
| | | | |
Distributions(c) | | | | | | | | | | | | | | | | |
From net investment income | | | (0.19 | ) | | | (0.23 | ) | | | | | | | (0.13 | ) |
From net realized gain | | | (0.12 | ) | | | (0.50 | ) | | | | | | | — | |
| | | | | | | | | | | | | | | | |
Total distributions | | | (0.31 | ) | | | (0.73 | ) | | | | | | | (0.13 | ) |
| | | | | | | | | | | | | | | | |
| | | | |
Net asset value, end of period | | $ | 11.46 | | | $ | 9.33 | | | | | | | $ | 11.02 | |
| | | | | | | | | | | | | | | | |
| | | | |
Total Return(d) | | | | | | | | | | | | | | | | |
Based on net asset value | | | 26.20 | %(e) | | | (8.90 | )% | | | | | | | 11.56 | %(f) |
| | | | | | | | | | | | | | | | |
| | | | |
Ratios to Average Net Assets(g)(h) | | | | | | | | | | | | | | | | |
Total expenses | | | 1.17 | % | | | 1.36 | % | | | | | | | 1.29 | %(i)(j) |
| | | | | | | | | | | | | | | | |
Total expenses after fees waived and/or reimbursed | | | 0.79 | % | | | 0.80 | % | | | | | | | 0.82 | %(i) |
| | | | | | | | | | | | | | | | |
Net investment income | | | 2.11 | % | | | 1.61 | % | | | | | | | 1.76 | %(i) |
| | | | | | | | | | | | | | | | |
| | | | |
Supplemental Data | | | | | | | | | | | | | | | | |
Net assets, end of period (000) | | $ | 390 | | | $ | 75 | | | | | | | $ | 28 | |
| | | | | | | | | | | | | | | | |
Portfolio turnover rate of the LifePath Dynamic Master Portfolio(k) | | | 44 | % | | | 58 | % | | | | | | | 35 | % |
| | | | | | | | | | | | | | | | |
| (a) | Commencement of operations. |
| (b) | Based on average shares outstanding. |
| (c) | Distributions for annual periods determined in accordance with U.S. federal income tax regulations. |
| (d) | Where applicable, excludes the effects of any sales charges and assumes the reinvestment of distributions. |
| (e) | Includes payment received from an affiliate, which impacted the Fund’s total return. Excluding the payment from an affiliate, the Fund’s total return is 26.09%. |
| (f) | Aggregate total return. |
| (g) | Includes the LifePath Dynamic Fund’s share of its corresponding LifePath Dynamic Master Portfolio’s allocated net expenses and/or net investment income. |
| (h) | Includes the LifePath Dynamic Fund’s share of its corresponding LifePath Dynamic Master Portfolio’s allocated expenses and/or net investment income. Excludes expenses incurred indirectly as a result of the LifePath Dynamic Master Portfolio’s investments in underlying funds as follows: |
| | | | | | | | | | | | | | | | |
| | | Year Ended
December 31, | | | | | | Period from
05/31/17 (a) to 12/31/17 | |
| | | 2019 | | | 2018 | | | | |
Allocated fees waived | | | 1.37 | % | | | 1.50 | % | | | | | | | 1.88 | % |
Investments in underlying funds | | | 0.13 | % | | | 0.14 | % | | | | | | | 0.23 | % |
| | | | | | | | | | | | | | | | |
| (j) | Audit costs were not annualized in the calculation of the expense ratio. If these expenses were annualized, the total expenses would have been 1.62%. |
| (k) | Includes the LifePath Dynamic Master Portfolio’s purchases and sales of the underlying funds and Active Stock Master Portfolio, CoreAlpha Bond Master Portfolio, International Tilts Master Portfolio and Master Total Return Portfolio. |
See notes to financial statements.
Financial Highlights (continued)
(For a share outstanding throughout each period)
| | | | | | | | | | | | | | | | |
| | | BlackRock LifePath
Dynamic 2060 Fund (continued) | |
| |
| | | Investor C | |
| | | |
| | | Year Ended
December 31, | | | | | | Period from
05/31/17 (a) to 12/31/17 | |
| | | 2019 | | | 2018 | |
| | | | | |
Net asset value, beginning of period | | $ | 9.34 | | | $ | 11.02 | | | | | | | $ | 10.00 | |
| | | | | | | | | | | | | | | | |
Net investment income(b) | | | 0.11 | | | | 0.08 | | | | | | | | 0.06 | |
Net realized and unrealized gain (loss) | | | 2.23 | | | | (1.13 | ) | | | | | | | 1.05 | |
| | | | | | | | | | | | | | | | |
Net increase (decrease) from investment operations | | | 2.34 | | | | (1.05 | ) | | | | | | | 1.11 | |
| | | | | | | | | | | | | | | | |
| | | | |
Distributions(c) | | | | | | | | | | | | | | | | |
From net investment income | | | (0.11 | ) | | | (0.13 | ) | | | | | | | (0.09 | ) |
From net realized gain | | | (0.12 | ) | | | (0.50 | ) | | | | | | | — | |
| | | | | | | | | | | | | | | | |
Total distributions | | | (0.23 | ) | | | (0.63 | ) | | | | | | | (0.09 | ) |
| | | | | | | | | | | | | | | | |
| | | | |
Net asset value, end of period | | $ | 11.45 | | | $ | 9.34 | | | | | | | $ | 11.02 | |
| | | | | | | | | | | | | | | | |
| | | | |
Total Return(d) | | | | | | | | | | | | | | | | |
Based on net asset value | | | 25.09 | %(e) | | | (9.60 | )% | | | | | | | 11.07 | %(f) |
| | | | | | | | | | | | | | | | |
| | | | |
Ratios to Average Net Assets(g)(h) | | | | | | | | | | | | | | | | |
Total expenses | | | 2.03 | % | | | 2.16 | % | | | | | | | 2.08 | %(i)(j) |
| | | | | | | | | | | | | | | | |
Total expenses after fees waived and/or reimbursed | | | 1.61 | % | | | 1.60 | % | | | | | | | 1.61 | %(i) |
| | | | | | | | | | | | | | | | |
Net investment income | | | 1.07 | % | | | 0.71 | % | | | | | | | 0.94 | %(i) |
| | | | | | | | | | | | | | | | |
| | | | |
Supplemental Data | | | | | | | | | | | | | | | | |
Net assets, end of period (000) | | $ | 33 | | | $ | 25 | | | | | | | $ | 28 | |
| | | | | | | | | | | | | | | | |
Portfolio turnover rate of the LifePath Dynamic Master Portfolio(k) | | | 44 | % | | | 58 | % | | | | | | | 35 | % |
| | | | | | | | | | | | | | | | |
| (a) | Commencement of operations. |
| (b) | Based on average shares outstanding. |
| (c) | Distributions for annual periods determined in accordance with U.S. federal income tax regulations. |
| (d) | Where applicable, excludes the effects of any sales charges and assumes the reinvestment of distributions. |
| (e) | Includes payment received from an affiliate, which had no impact on the Fund’s total return. |
| (f) | Aggregate total return. |
| (g) | Includes the LifePath Dynamic Fund’s share of its corresponding LifePath Dynamic Master Portfolio’s allocated net expenses and/or net investment income. |
| (h) | Includes the LifePath Dynamic Fund’s share of its corresponding LifePath Dynamic Master Portfolio’s allocated expenses and/or net investment income. Excludes expenses incurred indirectly as a result of the LifePath Dynamic Master Portfolio’s investments in underlying funds as follows: |
| | | | | | | | | | | | | | | | |
| | | Year Ended
December 31, | | | | | | Period from
05/31/17 (a) to 12/31/17 | |
| | | 2019 | | | 2018 | | | | |
Allocated fees waived | | | 1.37 | % | | | 1.50 | % | | | | | | | 1.88 | % |
Investments in underlying funds | | | 0.13 | % | | | 0.14 | % | | | | | | | 0.23 | % |
| | | | | | | | | | | | | | | | |
| (j) | Audit costs were not annualized in the calculation of the expense ratio. If these expenses were annualized, the total expenses would have been 2.41%. |
| (k) | Includes the LifePath Dynamic Master Portfolio’s purchases and sales of the underlying funds and Active Stock Master Portfolio, CoreAlpha Bond Master Portfolio, International Tilts Master Portfolio and Master Total Return Portfolio. |
See notes to financial statements.
| | |
| 46 | | 2019 BLACKROCK ANNUAL REPORTTO SHAREHOLDERS |
Financial Highlights (continued)
(For a share outstanding throughout each period)
| | | | | | | | | | | | | | | | |
| | | BlackRock LifePath
Dynamic 2060 Fund (continued) | |
| |
| | | Class K | |
| | | |
| | | Year Ended
December 31, | | | | | | Period from
05/31/2017 (a) to 12/31/17 | |
| | | 2019 | | | 2018 | |
| | | | | |
Net asset value, beginning of period | | $ | 9.34 | | | $ | 11.02 | | | | | | | $ | 10.00 | |
| | | | | | | | | | | | | | | | |
Net investment income(b) | | | 0.26 | | | | 0.22 | | | | | | | | 0.13 | |
Net realized and unrealized gain (loss) | | | 2.23 | | | | (1.13 | ) | | | | | | | 1.05 | |
| | | | | | | | | | | | | | | | |
Net increase (decrease) from investment operations | | | 2.49 | | | | (0.91 | ) | | | | | | | 1.18 | |
| | | | | | | | | | | | | | | | |
| | | | |
Distributions(c) | | | | | | | | | | | | | | | | |
From net investment income | | | (0.23 | ) | | | (0.27 | ) | | | | | | | (0.16 | ) |
From net realized gain | | | (0.12 | ) | | | (0.50 | ) | | | | | | | — | |
| | | | | | | | | | | | | | | | |
Total distributions | | | (0.35 | ) | | | (0.77 | ) | | | | | | | (0.16 | ) |
| | | | | | | | | | | | | | | | |
| | | | |
Net asset value, end of period | | $ | 11.48 | | | $ | 9.34 | | | | | | | $ | 11.02 | |
| | | | | | | | | | | | | | | | |
| | | | |
Total Return(d) | | | | | | | | | | | | | | | | |
Based on net asset value | | | 26.74 | %(e) | | | (8.45 | )% | | | | | | | 11.82 | %(f) |
| | | | | | | | | | | | | | | | |
| | | | |
Ratios to Average Net Assets(g)(h) | | | | | | | | | | | | | | | | |
Total expenses | | | 0.77 | % | | | 0.90 | %(h) | | | | | | | 0.82 | %(i)(j) |
| | | | | | | | | | | | | | | | |
Total expenses after fees waived and/or reimbursed | | | 0.36 | % | | | 0.35 | %(h) | | | | | | | 0.35 | %(i) |
| | | | | | | | | | | | | | | | |
Net investment income | | | 2.40 | % | | | 1.96 | %(h) | | | | | | | 2.11 | %(i) |
| | | | | | | | | | | | | | | | |
| | | | |
Supplemental Data | | | | | | | | | | | | | | | | |
Net assets, end of period (000) | | $ | 3,384 | | | $ | 1,862 | | | | | | | $ | 2,116 | |
| | | | | | | | | | | | | | | | |
Portfolio turnover rate of the LifePath Dynamic Master Portfolio(k) | | | 44 | % | | | 58 | % | | | | | | | 35 | % |
| | | | | | | | | | | | | | | | |
| (a) | Commencement of operations. |
| (b) | Based on average shares outstanding. |
| (c) | Distributions for annual periods determined in accordance with U.S. federal income tax regulations. |
| (d) | Where applicable, assumes the reinvestment of distributions. |
| (e) | Includes payment received from an affiliate, which impacted the Fund’s total return. Excluding the payment from an affiliate, the Fund’s total return is 26.64%. |
| (f) | Aggregate total return. |
| (g) | Includes the LifePath Dynamic Fund’s share of its corresponding LifePath Dynamic Master Portfolio’s allocated net expenses and/or net investment income. |
| (h) | Includes the LifePath Dynamic Fund’s share of its corresponding LifePath Dynamic Master Portfolio’s allocated expenses and/or net investment income. Excludes expenses incurred indirectly as a result of the LifePath Dynamic Master Portfolio’s investments in underlying funds as follows: |
| | | | | | | | | | | | | | | | |
| | | Year Ended
December 31, | | | | | | Period from
05/31/2017 (a) to 12/31/17 | |
| | | 2019 | | | 2018 | | | | |
Allocated fees waived | | | 1.37 | % | | | 1.50 | % | | | | | | | 1.88 | % |
Investments in underlying funds | | | 0.13 | % | | | 0.14 | % | | | | | | | 0.23 | % |
| | | | | | | | | | | | | | | | |
| (j) | Audit costs were not annualized in the calculation of the expense ratio. If these expenses were annualized, the total expenses would have been 1.15%. |
| (k) | Includes the LifePath Dynamic Master Portfolio’s purchases and sales of the underlying funds and Active Stock Master Portfolio, CoreAlpha Bond Master Portfolio, International Tilts Master Portfolio and Master Total Return Portfolio. |
See notes to financial statements.
Financial Highlights (continued)
(For a share outstanding throughout each period)
| | | | | | | | | | | | | | | | |
| | | BlackRock LifePath
Dynamic 2060 Fund (continued) | |
| |
| | | Class R | |
| | | |
| | | Year Ended
December 31, | | | | | | Period from
05/31/17 (a) to 12/31/17 | |
| | | 2019 | | | 2018 | |
| | | | | |
Net asset value, beginning of period | | $ | 9.34 | | | $ | 11.02 | | | | | | | $ | 10.00 | |
| | | | | | | | | | | | | | | | |
Net investment income(b) | | | 0.40 | | | | 0.15 | | | | | | | | 0.10 | |
Net realized and unrealized gain (loss) | | | 2.02 | | | | (1.13 | ) | | | | | | | 1.04 | |
| | | | | | | | | | | | | | | | |
Net increase (decrease) from investment operations | | | 2.42 | | | | (0.98 | ) | | | | | | | 1.14 | |
| | | | | | | | | | | | | | | | |
| | | | |
Distributions(c) | | | | | | | | | | | | | | | | |
From net investment income | | | (0.18 | ) | | | (0.20 | ) | | | | | | | (0.12 | ) |
From net realized gain | | | (0.12 | ) | | | (0.50 | ) | | | | | | | — | |
| | | | | | | | | | | | | | | | |
Total distributions | | | (0.30 | ) | | | (0.70 | ) | | | | | | | (0.12 | ) |
| | | | | | | | | | | | | | | | |
| | | | |
Net asset value, end of period | | $ | 11.46 | | | $ | 9.34 | | | | | | | $ | 11.02 | |
| | | | | | | | | | | | | | | | |
| | | | |
Total Return(d) | | | | | | | | | | | | | | | | |
Based on net asset value | | | 25.92 | %(e) | | | (9.05 | )% | | | | | | | 11.40 | %(f) |
| | | | | | | | | | | | | | | | |
| | | | |
Ratios to Average Net Assets(g)(h) | | | | | | | | | | | | | | | | |
Total expenses | | | 1.37 | % | | | 1.55 | % | | | | | | | 1.49 | %(i)(j) |
| | | | | | | | | | | | | | | | |
Total expenses after fees waived and/or reimbursed | | | 0.99 | % | | | 1.00 | % | | | | | | | 1.01 | %(i) |
| | | | | | | | | | | | | | | | |
Net investment income | | | 3.67 | % | | | 1.30 | % | | | | | | | 1.55 | %(i) |
| | | | | | | | | | | | | | | | |
| | | | |
Supplemental Data | | | | | | | | | | | | | | | | |
Net assets, end of period (000) | | $ | 185 | | | $ | 19 | | | | | | | $ | 22 | |
| | | | | | | | | | | | | | | | |
Portfolio turnover rate of the LifePath Dynamic Master Portfolio(k) | | | 44 | % | | | 58 | % | | | | | | | 35 | % |
| | | | | | | | | | | | | | | | |
| (a) | Commencement of operations. |
| (b) | Based on average shares outstanding. |
| (c) | Distributions for annual periods determined in accordance with U.S. federal income tax regulations. |
| (d) | Where applicable, assumes the reinvestment of distributions. |
| (e) | Includes payment received from an affiliate, which impacted the Fund’s total return. Excluding the payment from an affiliate, the Fund’s total return is 25.81%. |
| (f) | Aggregate total return. |
| (g) | Includes the LifePath Dynamic Fund’s share of its corresponding LifePath Dynamic Master Portfolio’s allocated net expenses and/or net investment income. |
| (h) | Includes the LifePath Dynamic Fund’s share of its corresponding LifePath Dynamic Master Portfolio’s allocated expenses and/or net investment income. Excludes expenses incurred indirectly as a result of the LifePath Dynamic Master Portfolio’s investments in underlying funds as follows: |
| | | | | | | | | | | | | | | | |
| | | Year Ended
December 31, | | | | | | Period from
05/31/17 (a) to 12/31/17 | |
| | | 2019 | | | 2018 | | | | |
Allocated fees waived | | | 1.37 | % | | | 1.50 | % | | | | | | | 1.88 | % |
Investments in underlying funds | | | 0.13 | % | | | 0.14 | % | | | | | | | 0.23 | % |
| | | | | | | | | | | | | | | | |
| (j) | Audit costs were not annualized in the calculation of the expense ratio. If these expenses were annualized, the total expenses would have been 1.82%. |
| (k) | Includes the LifePath Dynamic Master Portfolio’s purchases and sales of the underlying funds and Active Stock Master Portfolio, CoreAlpha Bond Master Portfolio, International Tilts Master Portfolio and Master Total Return Portfolio. |
See notes to financial statements.
| | |
| 48 | | 2019 BLACKROCK ANNUAL REPORTTO SHAREHOLDERS |
Notes to Financial Statements
BlackRock Funds III (the “Trust”) is registered under the Investment Company Act of 1940, as amended (the “1940 Act”), as anopen-end management investment company. The Trust is organized as a Delaware statutory trust. The following, each of which is a series of the Trust, are referred to herein collectively as the “LifePath Dynamic Funds” or individually as a “LifePath Dynamic Fund”:
| | | | |
| Fund Name | | Herein Referred To As | | Diversification
Classification |
BlackRock LifePath® Dynamic Retirement Fund | | LifePath Dynamic Retirement Fund | | Diversified |
BlackRock LifePath® Dynamic 2030 Fund | | LifePath Dynamic 2030 Fund | | Diversified |
BlackRock LifePath® Dynamic 2040 Fund | | LifePath Dynamic 2040 Fund | | Diversified |
BlackRock LifePath® Dynamic 2050 Fund | | LifePath Dynamic 2050 Fund | | Diversified |
BlackRock LifePath® Dynamic 2060 Fund | | LifePath Dynamic 2060 Fund | | Diversified |
Each LifePath Dynamic Fund seeks to achieve its investment objective by investing all of its assets in a corresponding series of Master Investment Portfolio (“MIP”): LifePath® Dynamic Retirement Master Portfolio, LifePath® Dynamic 2030 Master Portfolio, LifePath® Dynamic 2040 Master Portfolio, LifePath® Dynamic 2050 Master Portfolio and LifePath® Dynamic 2060 Master Portfolio (each, a “LifePath Dynamic Master Portfolio” and together, the “LifePath Dynamic Master Portfolios”). MIP is an affiliate of the Trust. Each LifePath Dynamic Master Portfolio has the same investment objective and strategies as its corresponding LifePath Dynamic Fund. The value of each LifePath Dynamic Fund’s investment in its corresponding LifePath Dynamic Master Portfolio reflects the LifePath Dynamic Fund’s proportionate interest in the net assets of the LifePath Dynamic Master Portfolio. The performance of each LifePath Dynamic Fund is directly affected by the performance of the LifePath Dynamic Master Portfolios. At December 31, 2019, the percentage of each LifePath Dynamic Master Portfolio owned by the corresponding LifePath Dynamic Fund was approximately 100% for each of the LifePath Dynamic Funds, respectively. The financial statements of the LifePath Dynamic Master Portfolios, including the Schedules of Investments, are included elsewhere in this report and should be read in conjunction with the LifePath Dynamic Funds’ financial statements.
Each LifePath Dynamic Fund offers multiple classes of shares. All classes of shares have identical voting, dividend, liquidation and other rights and are subject to the same terms and conditions, except that certain classes bear expenses related to the shareholder servicing and distribution of such shares. Institutional and Class K Shares are sold without a sales charge and only to certain eligible investors. Investor A and Investor C Shares are generally available through financial intermediaries. Class R Shares are sold without a sales charge and only to certain employer-sponsored retirement plans. Investor A, Investor C, and Class R Shares bear certain expenses related to shareholder servicing of such shares, and Investor C and Class R Shares also bear certain expenses related to the distribution of such shares. Each class has exclusive voting rights with respect to matters relating to its shareholder servicing and distribution expenditures (except that Investor C shareholders may vote on material changes to the Investor A Shares distribution and service plan). The Board of Trustees of the Trust and Board of Trustees of MIP are referred to throughout this report as the “Board of Trustees” or the “Board” and the members are referred to as “Trustees.”
| | | | | | | | |
| Share Class | | Initial Sales Charge | | CDSC | | | Conversion Privilege |
Institutional, Class K and Class R Shares | | No | | | No | | | None |
Investor A Shares | | Yes | | | No | (a) | | None |
Investor C Shares | | No | | | Yes | (b) | | To Investor A Shares after approximately 10 years |
| | (a) | Investor A Shares may be subject to a contingent deferred sales charge (“CDSC”) for certain redemptions where no initial sales charge was paid at the time of purchase. | |
| | (b) | A CDSC of 1.00% is assessed on certain redemptions of Investor C Shares made within one year after purchase. | |
The LifePath Dynamic Funds, together with certain other registered investment companies advised by BlackRock Fund Advisors (“BFA” or the “Manager”) or its affiliates, are included in a complex of equity, multi-asset, index and money market funds referred to as the BlackRock Multi-Asset Complex.
On November 12-13, 2019, the Board approved a proposal pursuant to which each LifePath Dynamic Fund will cease to invest in its corresponding LifePath Dynamic Master Portfolio as part of a “master-feeder” structure and instead operate as a stand-alone fund. In connection with this change, the Trust, on behalf of each LifePath Dynamic Fund, will enter into a management agreement with BFA, the terms of which will be substantially the same as the current management agreement between BFA and each corresponding LifePath Dynamic Master Portfolio, including the management fee rate. The change into a stand-alone structure will not create a taxable event for the LifePath Dynamic Funds or their shareholders. These changes are expected to be effective on or about March 9, 2020.
Reorganization: The Board of the Trust approved the reorganization of the BlackRock LifePath® Dynamic 2020 Fund (the “Target Fund” or “LifePath Dynamic 2020 Fund”) into LifePath Dynamic Retirement Fund. As a result, LifePath Dynamic Retirement Fund acquired substantially all of the assets and assumed substantially all of the liabilities of the Target Fund in exchange for an equal aggregate value of newly-issued shares of LifePath Dynamic Retirement Fund.
Each shareholder of the Target Fund received shares of LifePath Dynamic Retirement Fund in an amount equal to the aggregate net asset value (“NAV”) of such shareholder’s Target Fund shares, as determined at the close of business on November 15, 2019, less the costs of the Target Fund’s reorganization.
| | | | |
| NOTESTO FINANCIAL STATEMENTS | | | 49 | |
Notes to Financial Statements (continued)
The reorganization was accomplished by atax-free exchange of shares of LifePath Dynamic Retirement Fund in the following amounts and at the following conversion ratios:
| | | | | | | | |
| Target Fund’s Share Class | | Shares Prior to Reorganization | | Conversion Ratio | | LifePath Dynamic Retirement Fund’s
Share Class | | Shares of the LifePath Dynamic
Retirement Fund |
Institutional | | 2,487,549 | | 1.36476524 | | Institutional | | 3,394,920 |
Investor A | | 12,752,524 | | 1.42279915 | | Investor A | | 18,144,280 |
Investor C | | 226,655 | | 1.36270095 | | Investor C | | 308,863 |
Class K | | 2,538,644 | | 1.36311365 | | Class K | | 3,460,460 |
Class R | | 205,044 | | 1.36914646 | | Class R | | 280,735 |
The Target Fund’s net assets and composition of net assets on November 15, 2019, the valuation date of the reorganization were as follows:
| | | | |
| | | Target Fund | |
Net assets | | $ | 255,264,099 | |
Paid-in-capital | | | 180,125,770 | |
Accumulated earnings | | | 75,138,329 | |
For financial reporting purposes, assets received and shares issued by LifePath Dynamic Retirement Fund were recorded at fair value. However, the cost basis of the investments received from the Target Fund was carried forward to align ongoing reporting of LifePath Dynamic Retirement Fund’s realized and unrealized gains and losses with amounts distributable to shareholders for tax purposes.
The net assets of LifePath Dynamic Retirement Fund before the reorganization were $147,849,209. The aggregate net assets of LifePath Dynamic Retirement Fund immediately after the reorganization amounted to $403,113,308. The Target Fund’s fair value and cost of investments prior to the reorganization was as follows:
| | | | |
| Target Fund | | Fair Value of Investments | |
LifePath® Dynamic 2020 Fund | | $ | 255,395,569 | |
The purpose of these transactions was to combine two funds managed by the Manager with substantially similar (but not identical) investment objectives, investment policies, strategies, risks and restrictions. The reorganization was atax-free event and was effective on November 18, 2019.
Assuming the reorganization had been completed on January 1, 2019, the beginning of the fiscal reporting period of LifePath Dynamic Retirement Fund, the pro forma results of operations for the year ended December 31, 2019, are as follows:
| | • | | Net investment income: $7,845,164 |
| | • | | Net realized and change in unrealized gain on investments: $72,886,892 |
| | • | | Net increase in net assets resulting from operations: $80,732,056 |
Because the combined investment portfolios have been managed as a single integrated portfolio since the reorganization was completed, it is not practicable to separate the amounts of revenue and earnings of the Target Fund that have been included in LifePath Dynamic Retirement Fund’s Statements of Operations since November 18, 2019.
The Manager reimbursed the LifePath Dynamic Retirement Fund $20,750, which is included in fees waived and/or reimbursed by the Administrator/Manager in the Statements of Operations.
| 2. | SIGNIFICANT ACCOUNTING POLICIES |
The financial statements are prepared in conformity with accounting principles generally accepted in the United States of America (“U.S. GAAP”), which may require management to make estimates and assumptions that affect the reported amounts of assets and liabilities in the financial statements, disclosure of contingent assets and liabilities at the date of the financial statements and the reported amounts of increases and decreases in net assets from operations during the reporting period. Actual results could differ from those estimates. Each LifePath Dynamic Fund is considered an investment company under U.S. GAAP and follows the accounting and reporting guidance applicable to investment companies. Below is a summary of significant accounting policies:
Investment Transactions and Income Recognition:For financial reporting purposes, contributions to and withdrawals from each LifePath Dynamic Master Portfolio are accounted for on a trade date basis. Each LifePath Dynamic Fund records its proportionate share of LifePath Dynamic Master Portfolio’s income, expenses and realized and unrealized gains and losses on a daily basis. Realized and unrealized gains and losses are adjusted utilizing partnership tax allocation rules. In addition, the LifePath Dynamic Funds accrue their own expenses. Income, expenses and realized and unrealized gains and losses are allocated daily to each class based on its relative net assets.
Distributions: Distributions from net investment income are declared and paid quarterly. Distributions of capital gains are recorded on theex-dividend date and made at least annually. The portion of distributions, if any, that exceeds a fund’s current and accumulated earnings and profits, as measured on a tax basis, constitute anon-taxable return of capital. The character and timing of distributions are determined in accordance with U.S. federal income tax regulations, which may differ from U.S. GAAP.
| | |
| 50 | | 2019 BLACKROCK ANNUAL REPORTTO SHAREHOLDERS |
Notes to Financial Statements (continued)
Indemnifications:In the normal course of business, a LifePath Dynamic Fund enters into contracts that contain a variety of representations that provide general indemnification. A LifePath Dynamic Fund’s maximum exposure under these arrangements is unknown because it involves future potential claims against a LifePath Dynamic Fund, which cannot be predicted with any certainty.
Other: Expenses directly related to a LifePath Dynamic Fund or its classes are charged to that LifePath Dynamic Fund or the applicable class. Other operating expenses shared by several funds, including other funds managed by the Manager, are prorated among those funds on the basis of relative net assets or other appropriate methods. Expenses directly related to the LifePath Dynamic Funds and other shared expenses prorated to the LifePath Dynamic Funds are allocated daily to each class based on their relative net assets or other appropriate methods.
| 3. | INVESTMENT VALUATION AND FAIR VALUE MEASUREMENTS |
Investment Valuation Policies: Each LifePath Dynamic Fund’s policy is to value its financial instruments at fair value. Each LifePath Dynamic Fund records its investment in its corresponding LifePath Dynamic Master Portfolio at fair value based on each LifePath Dynamic Fund’s proportionate interest in the net assets of its corresponding LifePath Dynamic Master Portfolio. Valuation of securities held by the LifePath Dynamic Master Portfolios is discussed in Note 3 of the LifePath Dynamic Master Portfolios’ Notes to Financial Statements, which are included elsewhere in this report.
| 4. | ADMINISTRATION AGREEMENT AND OTHER TRANSACTIONS WITH AFFILIATES |
Administration: The Trust, on behalf of the LifePath Dynamic Funds, entered into an Administration Agreement with BlackRock Advisors, LLC (“BAL” or the “Administrator”), which has agreed to provide general administrative services (other than investment advice and related portfolio activities). BAL has agreed to bear all of the LifePath Dynamic Funds’ ordinary operating expenses, excluding, generally, investment advisory fees, distribution fees, brokerage and other expenses related to the execution of portfolio transactions, extraordinary expenses and certain other expenses which are borne by the LifePath Dynamic Funds. BAL is entitled to receive for these administrative services an annual fee of 0.35% based on the average daily net assets of each LifePath Dynamic Funds’ Institutional and Investor A Shares, 0.40% of the average daily net assets of Investor C Shares, 0.15% of the average daily net assets of Class K Shares and 0.30% of the average daily net assets of Class R Shares.
From time to time, BAL may waive such fees in whole or in part. Any such waiver will reduce the expenses of the LifePath Dynamic Funds and, accordingly, have a favorable impact on its performance. BAL may delegate certain of its administration duties tosub-administrators.
For the year ended December 31, 2019, the following table shows the class specific administration fees borne directly by each share class of each LifePath Dynamic Fund:
| | | | | | | | | | | | | | | | | | | | | | | | |
| | | Institutional | | | Investor A | | | Investor C | | | Class K | | | Class R | | | Total | |
LifePath Dynamic Retirement Fund | | | 153,781 | | | | 315,110 | | | | 4,430 | | | | 30,894 | | | | 6,811 | | | | 511,026 | |
LifePath Dynamic 2030 Fund | | | 240,801 | | | | 771,468 | | | | 15,785 | | | | 55,310 | | | | 10,485 | | | | 1,093,849 | |
LifePath Dynamic 2040 Fund | | | 192,215 | | | | 623,999 | | | | 11,641 | | | | 49,836 | | | | 8,535 | | | | 886,226 | |
LifePath Dynamic 2050 Fund | | | 50,672 | | | | 273,014 | | | | 6,063 | | | | 11,308 | | | | 6,328 | | | | 347,385 | |
LifePath Dynamic 2060 Fund | | | 391 | | | | 600 | | | | 117 | | | | 3,541 | | | | 109 | | | | 4,758 | |
Service and Distribution Fees: The Trust, on behalf of the LifePath Dynamic Funds, entered into a Distribution Agreement and a Distribution and Service Plan with BlackRock Investments, LLC (“BRIL”), an affiliate of the Administrator. Pursuant to the Distribution and Service Plan and in accordance with Rule12b-1 under the 1940 Act, each LifePath Dynamic Fund pays BRIL ongoing service and distribution fees. The fees are accrued daily and paid monthly at annual rates based upon the average daily net assets of the relevant share class of each LifePath Dynamic Fund as follows:
| | | | | | | | |
| | | Service Fees | | | Distribution Fees | |
Investor A | | | 0.25 | % | | | — | % |
Investor C | | | 0.25 | | | | 0.75 | |
Class R | | | 0.25 | | | | 0.25 | |
BRIL and broker-dealers, pursuant tosub-agreements with BRIL, provide shareholder servicing and distribution services to the LifePath Dynamic Funds. The ongoing service and/or distribution fee compensates/reimburses BRIL and each broker-dealer for providing shareholder servicing and/or distribution related services to shareholders.
For the year ended December 31, 2019, the following table shows the class specific service and distribution fees borne directly by each share class of each LifePath Dynamic Fund:
| | | | | | | | | | | | | | | | |
| Service and Distribution Fees | | Investor A | | | Investor C | | | Class R | | | Total | |
LifePath Dynamic Retirement Fund | | | 225,103 | | | | 11,077 | | | | 11,380 | | | | 247,560 | |
LifePath Dynamic 2030 Fund | | | 551,140 | | | | 39,475 | | | | 17,579 | | | | 608,194 | |
LifePath Dynamic 2040 Fund | | | 445,806 | | | | 29,124 | | | | 14,322 | | | | 489,252 | |
LifePath Dynamic 2050 Fund | | | 195,138 | | | | 15,177 | | | | 10,598 | | | | 220,913 | |
LifePath Dynamic 2060 Fund | | | 428 | | | | 292 | | | | 182 | | | | 902 | |
Other Fees: For the year ended December 31, 2019, affiliates earned underwriting discounts, direct commissions and dealer concessions on sales of each LifePath Dynamic Fund’s Investor A Shares as follows:
| | | | | | | | | | | | | | | | | | | | |
| | | LifePath Dynamic
Retirement Fund | | | LifePath Dynamic 2030 Fund | | | LifePath Dynamic 2040 Fund | | | LifePath Dynamic 2050 Fund | | | LifePath Dynamic 2060 Fund | |
Investor A | | $ | 896 | | | $ | 1,654 | | | $ | 1,503 | | | $ | 390 | | | $ | 129 | |
| | | | |
| NOTESTO FINANCIAL STATEMENTS | | | 51 | |
Notes to Financial Statements (continued)
For the year ended December 31, 2019, affiliates received CDSCs as follows:
| | | | | | | | | | | | | | | | | | | | |
| | | LifePath Dynamic
Retirement Fund | | | LifePath Dynamic 2030 Fund | | | LifePath Dynamic 2040 Fund | | | LifePath Dynamic 2050 Fund | | | LifePath Dynamic 2060 Fund | |
Investor C | | $ | 2 | | | $ | 114 | | | $ | 5 | | | $ | 83 | | | $ | — | |
Expense Limitations, Waivers and Reimbursements:The fees and expenses of the Trust’s trustees who are not “interested persons” of the Trust, as defined in the 1940 Act (“Independent Trustees”), counsel to the Independent Trustees and the LifePath Dynamic Funds’ independent registered public accounting firm (together, the “independent expenses”) are paid directly by the LifePath Dynamic Funds. BAL has contractually agreed to reimburse the LifePath Dynamic Funds or provide an offsetting credit against the administration fees paid by the LifePath Dynamic Funds in an amount equal to these independent expenses through April 30, 2029 for each LifePath Dynamic Fund other than the LifePath Dynamic Retirement Fund (for which the contractual arrangement is in effect through April 30, 2030). These amounts are included in fees waived and/or reimbursed by the Administrator/Manager in the Statements of Operations. For the year ended December 31, 2019, the LifePath Dynamic Funds waived the following amounts:
| | | | |
| | | Amounts Waived | |
LifePath Dynamic Retirement Fund | | $ | 11,001 | |
LifePath Dynamic 2030 Fund | | | 11,000 | |
LifePath Dynamic 2040 Fund | | | 11,000 | |
LifePath Dynamic 2050 Fund | | | 11,000 | |
LifePath Dynamic 2060 Fund | | | 10,981 | |
Interfund Lending: In accordance with an exemptive order (the “Order”) from the U.S. Securities and Exchange Commission (“SEC”), each LifePath Dynamic Fund may participate in a joint lending and borrowing facility for temporary purposes (the “Interfund Lending Program”), subject to compliance with the terms and conditions of the Order, and to the extent permitted by each LifePath Dynamic Fund’s investment policies and restrictions. Each LifePath Dynamic Fund is currently permitted to borrow and lend under the Interfund Lending Program.
A lending BlackRock fund may lend in aggregate up to 15% of its net assets, but may not lend more than 5% of its net assets to any one borrowing fund through the Interfund Lending Program. A borrowing BlackRock fund may not borrow through the Interfund Lending Program or from any other source more than 33 1/3% of its total assets (or any lower threshold provided for by the fund’s investment restrictions). If a borrowing BlackRock fund’s total outstanding borrowings exceed 10% of its total assets, each of its outstanding interfund loans will be subject to collateralization of at least 102% of the outstanding principal value of the loan. All interfund loans are for temporary or emergency purposes and the interest rate to be charged will be the average of the highest current overnight repurchase agreement rate available to a lending fund and the bank loan rate, as calculated according to a formula established by the Board.
During the year ended December 31, 2019, the LifePath Dynamic Funds did not participate in the Interfund Lending Program.
Trustees and Officers:Certain trustees and/or officers of the LifePath Dynamic Funds are directors and/or officers of BlackRock, Inc. or its affiliates.
It is each LifePath Dynamic Fund’s policy to comply with the requirements of the Internal Revenue Code of 1986, as amended, applicable to regulated investment companies, and to distribute substantially all of its taxable income to its shareholders. Therefore, no U.S. federal income tax provision is required.
Each LifePath Dynamic Fund files U.S. federal and various state and local tax returns. No income tax returns are currently under examination. The statute of limitations on each LifePath Dynamic Fund’s U.S. federal tax returns generally remains open for each of the four years ended December 31, 2019 except for LifePath Dynamic 2060 Fund, which remains open for the period ended December 31, 2017 through the year ended December 31, 2019. The statutes of limitations on each LifePath Dynamic Fund’s state and local tax returns may remain open for an additional year depending upon the jurisdiction.
Management has analyzed tax laws and regulations and their application to the LifePath Dynamic Funds as of December 31, 2019, inclusive of the open tax return years, and does not believe that there are any uncertain tax positions that require recognition of a tax liability in the LifePath Dynamic Funds’ financial statements.
The tax character of distributions paid was as follows:
| | | | | | | | | | | | | | | | | | | | |
| | | LifePath Dynamic
Retirement Fund | | | LifePath Dynamic 2030 Fund | | | LifePath Dynamic 2040 Fund | | | LifePath Dynamic 2050 Fund | | | LifePath Dynamic 2060 Fund | |
Ordinary income | | | | | | | | | | | | | | | | | | | | |
12/31/19 | | $ | 4,972,523 | | | $ | 10,145,955 | | | $ | 7,378,388 | | | $ | 2,117,634 | | | $ | 66,758 | |
12/31/18 | | | 5,599,775 | | | | 22,280,914 | | | | 19,166,944 | | | | 6,643,719 | | | | 111,385 | |
Long-term capital gains | | | | | | | | | | | | | | | | | | | | |
12/31/19 | | | 2,809,361 | | | | 11,280,702 | | | | 11,818,124 | | | | 4,328,902 | | | | 43,372 | |
12/31/18 | | | 4,893,746 | | | | 17,129,120 | | | | 15,993,309 | | | | 5,951,900 | | | | 50,335 | |
| | | | | | | | | | | | | | | | | | | | |
12/31/19 | | $ | 7,781,884 | | | $ | 21,426,657 | | | $ | 19,196,512 | | | $ | 6,446,536 | | | $ | 110,130 | |
| | | | | | | | | | | | | | | | | | | | |
12/31/18 | | $ | 10,493,521 | | | $ | 39,410,034 | | | $ | 35,160,253 | | | $ | 12,595,619 | | | $ | 161,720 | |
| | | | | | | | | | | | | | | | | | | | |
| | |
| 52 | | 2019 BLACKROCK ANNUAL REPORTTO SHAREHOLDERS |
Notes to Financial Statements (continued)
As of period end, the tax components of accumulated earnings (loss) were as follows:
| | | | | | | | | | | | | | | | | | | | |
| | | LifePath Dynamic
Retirement Fund | | | LifePath Dynamic 2030 Fund | | | LifePath Dynamic 2040 Fund | | | LifePath Dynamic 2050 Fund | | | LifePath Dynamic 2060 Fund | |
Undistributed ordinary income | | $ | 1,544,335 | | | $ | 2,365,609 | | | $ | 2,347,361 | | | $ | 918,961 | | | $ | 1,820 | |
Undistributed long-term capital gains | | | 1,411,916 | | | | 2,059,455 | | | | 2,002,590 | | | | 725,240 | | | | 34,726 | |
Net unrealized gains (losses)(a) | | | 103,915,047 | | | | 24,786,929 | | | | 61,400,372 | | | | 20,002,653 | | | | 368,489 | |
| | | | | | | | | | | | | | | | | | | | |
| | $ | 106,871,298 | | | $ | 29,211,993 | | | $ | 65,750,323 | | | $ | 21,646,854 | | | $ | 405,035 | |
| | | | | | | | | | | | | | | | | | | | |
| | (a) | The difference between book-basis andtax-basis net unrealized gains were attributable primarily to the timing and recognition of partnership income. | |
| 6. | CAPITAL SHARE TRANSACTIONS |
Transactions in capital shares for each class were as follows:
| | | | | | | | | | | | | | | | |
| | | Year Ended
12/31/19 | | | Year Ended
12/31/18 | |
| LifePath Dynamic Retirement Fund | | Shares | | | Amount | | | Shares | | | Amount | |
Institutional | |
Shares sold | | | 3,863,406 | | | $ | 41,070,163 | | | | 2,866,473 | | | $ | 31,024,293 | |
Shares issued in reinvestment of distributions | | | 167,180 | | | | 1,831,558 | | | | 239,094 | | | | 2,405,195 | |
Shares issued resulting from reorganization | | | 3,394,920 | | | | 37,345,777 | | | | — | | | | — | |
Shares redeemed | | | (1,046,012 | ) | | | (10,953,828 | ) | | | (3,956,542 | ) | | | (43,163,858 | ) |
| | | | | | | | | | | | | | | | |
Net increase (decrease) | | | 6,379,494 | | | $ | 69,293,670 | | | | (850,975 | ) | | $ | (9,734,370 | ) |
| | | | | | | | | | | | | | | | |
| | | | |
Investor A | | | | | | | | | | | | | | | | |
Shares sold and automatic conversion of shares | | | 987,245 | | | $ | 9,095,344 | | | | 894,821 | | | $ | 8,574,231 | |
Shares issued in reinvestment of distributions | | | 480,070 | | | | 4,663,053 | | | | 751,052 | | | | 6,584,641 | |
Shares issued resulting from reorganization | | | 18,144,280 | | | | 173,602,186 | | | | — | | | | — | |
Shares redeemed | | | (2,848,090 | ) | | | (26,762,487 | ) | | | (2,322,442 | ) | | | (22,315,745 | ) |
| | | | | | | | | | | | | | | | |
Net increase (decrease) | | | 16,763,505 | | | $ | 160,598,096 | | | | (676,569 | ) | | $ | (7,156,873 | ) |
| | | | | | | | | | | | | | | | |
| | | | |
Investor C | | | | | | | | | | | | | | | | |
Shares sold | | | 14,242 | | | $ | 150,018 | | | | 33,013 | | | $ | 355,463 | |
Shares issued in reinvestment of distributions | | | 4,903 | | | | 53,190 | | | | 5,764 | | | | 56,977 | |
Shares issued resulting from reorganization | | | 308,863 | | | | 3,346,906 | | | | — | | | | — | |
Shares redeemed and automatic conversion of shares | | | (44,329 | ) | | | (474,374 | ) | | | (63,695 | ) | | | (685,852 | ) |
| | | | | | | | | | | | | | | | |
Net increase (decrease) | | | 283,679 | | | $ | 3,075,740 | | | | (24,918 | ) | | $ | (273,412 | ) |
| | | | | | | | | | | | | | | | |
| | | | |
Class K | | | | | | | | | | | | | | | | |
Shares sold | | | 1,693,814 | | | $ | 18,113,468 | | | | 454,171 | | | $ | 4,912,038 | |
Shares issued in reinvestment of distributions | | | 104,860 | | | | 1,145,771 | | | | 135,646 | | | | 1,355,266 | |
Shares issued resulting from reorganization | | | 3,460,460 | | | | 37,915,971 | | | | — | | | | — | |
Shares redeemed | | | (895,505 | ) | | | (9,335,172 | ) | | | (502,455 | ) | | | (5,464,385 | ) |
| | | | | | | | | | | | | | | | |
Net increase | | | 4,363,629 | | | $ | 47,840,038 | | | | 87,362 | | | $ | 802,919 | |
| | | | | | | | | | | | | | | | |
| | | | |
Class R | | | | | | | | | | | | | | | | |
Shares sold | | | 234,424 | | | $ | 2,490,823 | | | | 58,956 | | | $ | 635,653 | |
Shares issued in reinvestment of distributions | | | 8,070 | | | | 87,526 | | | | 9,034 | | | | 89,585 | |
Shares issued resulting from reorganization | | | 280,735 | | | | 3,053,259 | | | | — | | | | — | |
Shares redeemed | | | (146,362 | ) | | | (1,584,408 | ) | | | (67,070 | ) | | | (723,705 | ) |
| | | | | | | | | | | | | | | | |
Net increase | | | 376,867 | | | $ | 4,047,200 | | | | 920 | | | $ | 1,533 | |
| | | | | | | | | | | | | | | | |
Total Net Increase (Decrease) | | | 28,167,174 | | | $ | 284,854,744 | | | | (1,464,180 | ) | | $ | (16,360,203 | ) |
| | | | | | | | | | | | | | | | |
| | | | | | | | | | | | | | | | |
| | | Year Ended
12/31/19 | | | Year Ended
12/31/18 | |
| LifePath Dynamic 2030 Fund | | Shares | | | Amount | | | Shares | | | Amount | |
Institutional | |
Shares sold | | | 1,142,794 | | | $ | 14,866,930 | | | | 1,415,872 | | | $ | 20,180,716 | |
Shares issued in reinvestment of distributions | | | 319,164 | | | | 4,437,150 | | | | 646,592 | | | | 8,092,824 | |
Shares redeemed | | | (1,092,964 | ) | | | (14,418,701 | ) | | | (3,358,711 | ) | | | (47,018,732 | ) |
| | | | | | | | | | | | | | | | |
Net increase (decrease) | | | 368,994 | | | $ | 4,885,379 | | | | (1,296,247 | ) | | $ | (18,745,192 | ) |
| | | | | | | | | | | | | | | | |
| | | | |
| NOTESTO FINANCIAL STATEMENTS | | | 53 | |
Notes to Financial Statements (continued)
| | | | | | | | | | | | | | | | |
| | | Year Ended
12/31/19 | | | Year Ended
12/31/18 | |
| LifePath Dynamic 2030 Fund | | Shares | | | Amount | | | Shares | | | Amount | |
Investor A | | | | | | | | | | | | | | | | |
Shares sold and automatic conversion of shares | | | 1,485,272 | | | $ | 18,789,169 | | | | 1,005,027 | | | $ | 13,682,162 | |
Shares issued in reinvestment of distributions | | | 1,011,486 | | | | 13,286,087 | | | | 2,277,646 | | | | 27,106,662 | |
Shares redeemed | | | (4,821,546 | ) | | | (61,812,220 | ) | | | (4,043,458 | ) | | | (54,971,534 | ) |
| | | | | | | | | | | | | | | | |
Net decrease | | | (2,324,788 | ) | | $ | (29,736,964 | ) | | | (760,785 | ) | | $ | (14,182,710 | ) |
| | | | | | | | | | | | | | | | |
| | | | |
Investor C | | | | | | | | | | | | | | | | |
Shares sold | | | 85,912 | | | $ | 1,117,954 | | | | 98,595 | | | $ | 1,338,702 | |
Shares issued in reinvestment of distributions | | | 14,678 | | | | 195,494 | | | | 36,989 | | | | 445,397 | |
Shares redeemed and automatic conversion of shares | | | (173,128 | ) | | | (2,232,664 | ) | | | (59,841 | ) | | | (831,518 | ) |
| | | | | | | | | | | | | | | | |
Net increase (decrease) | | | (72,538 | ) | | $ | (919,216 | ) | | | 75,743 | | | $ | 952,581 | |
| | | | | | | | | | | | | | | | |
| | | | |
Class K | | | | | | | | | | | | | | | | |
Shares sold | | | 2,347,274 | | | $ | 31,269,292 | | | | 623,568 | | | $ | 8,810,189 | |
Shares issued in reinvestment of distributions | | | 239,426 | | | | 3,252,332 | | | | 278,123 | | | | 3,444,124 | |
Shares redeemed | | | (828,822 | ) | | | (10,903,875 | ) | | | (913,582 | ) | | | (13,052,294 | ) |
| | | | | | | | | | | | | | | | |
Net increase (decrease) | | | 1,757,878 | | | $ | 23,617,749 | | | | (11,891 | ) | | $ | (797,981 | ) |
| | | | | | | | | | | | | | | | |
| | | | |
Class R | | | | | | | | | | | | | | | | |
Shares sold | | | 311,393 | | | $ | 4,143,690 | | | | 90,948 | | | $ | 1,251,160 | |
Shares issued in reinvestment of distributions | | | 18,720 | | | | 251,388 | | | | 24,097 | | | | 293,087 | |
Shares redeemed | | | (203,907 | ) | | | (2,703,051 | ) | | | (49,651 | ) | | | (690,065 | ) |
| | | | | | | | | | | | | | | | |
Net increase | | | 126,206 | | | $ | 1,692,027 | | | | 65,394 | | | $ | 854,182 | |
| | | | | | | | | | | | | | | | |
Total Net Decrease | | | (144,248 | ) | | $ | (461,025 | ) | | | (1,927,786 | ) | | $ | (31,919,120 | ) |
| | | | | | | | | | | | | | | | |
| | | | | | | | | | | | | | | | |
| | | Year Ended
12/31/19 | | | Year Ended
12/31/18 | |
| LifePath Dynamic 2040 Fund | | Shares | | | Amount | | | Shares | | | Amount | |
Institutional | |
Shares sold | | | 586,053 | | | $ | 9,610,563 | | | | 736,859 | | | $ | 13,313,279 | |
Shares issued in reinvestment of distributions | | | 221,734 | | | | 3,800,103 | | | | 441,045 | | | | 6,790,331 | |
Shares redeemed | | | (579,744 | ) | | | (9,404,448 | ) | | | (1,624,875 | ) | | | (28,589,557 | ) |
| | | | | | | | | | | | | | | | |
Net increase (decrease) | | | 228,043 | | | $ | 4,006,218 | | | | (446,971 | ) | | $ | (8,485,947 | ) |
| | | | | | | | | | | | | | | | |
| | | | |
Investor A | | | | | | | | | | | | | | | | |
Shares sold and automatic conversion of shares | | | 946,617 | | | $ | 14,240,480 | | | | 932,113 | | | $ | 15,239,536 | |
Shares issued in reinvestment of distributions | | | 784,498 | | | | 12,069,407 | | | | 1,734,381 | | | | 24,072,835 | |
Shares redeemed | | | (3,286,059 | ) | | | (49,628,617 | ) | | | (2,265,572 | ) | | | (36,934,464 | ) |
| | | | | | | | | | | | | | | | |
Net increase (decrease) | | | (1,554,944 | ) | | $ | (23,318,730 | ) | | | 400,922 | | | $ | 2,377,907 | |
| | | | | | | | | | | | | | | | |
| | | | |
Investor C | | | | | | | | | | | | | | | | |
Shares sold | | | 45,702 | | | $ | 695,462 | | | | 43,535 | | | $ | 769,794 | |
Shares issued in reinvestment of distributions | | | 7,369 | | | | 178,593 | | | | 20,621 | | | | 307,900 | |
Shares redeemed and automatic conversion of shares | | | (35,941 | ) | | | (583,383 | ) | | | (57,089 | ) | | | (1,002,122 | ) |
| | | | | | | | | | | | | | | | |
Net increase | | | 17,130 | | | $ | 290,672 | | | | 7,067 | | | $ | 75,572 | |
| | | | | | | | | | | | | | | | |
| | | | |
Class K | | | | | | | | | | | | | | | | |
Shares sold | | | 1,265,420 | | | $ | 21,335,365 | | | | 578,699 | | | $ | 10,437,852 | |
Shares issued in reinvestment of distributions | | | 168,918 | | | | 2,914,364 | | | | 240,641 | | | | 3,709,834 | |
Shares redeemed | | | (587,810 | ) | | | (9,775,123 | ) | | | (1,123,506 | ) | | | (20,424,291 | ) |
| | | | | | | | | | | | | | | | |
Net increase (decrease) | | | 846,528 | | | $ | 14,474,606 | | | | (304,166 | ) | | $ | (6,276,605 | ) |
| | | | | | | | | | | | | | | | |
| | | | |
Class R | | | | | | | | | | | | | | | | |
Shares sold | | | 245,587 | | | $ | 4,035,332 | | | | 68,773 | | | $ | 1,204,701 | |
Shares issued in reinvestment of distributions | | | 8,406 | | | | 232,497 | | | | 18,201 | | | | 277,328 | |
Shares redeemed | | | (162,180 | ) | | | (2,681,332 | ) | | | (118,530 | ) | | | (2,097,969 | ) |
| | | | | | | | | | | | | | | | |
Net increase (decrease) | | | 91,813 | | | $ | 1,586,497 | | | | (31,556 | ) | | $ | (615,940 | ) |
| | | | | | | | | | | | | | | | |
Total Net Decrease | | | (371,430 | ) | | $ | (2,960,737 | ) | | | (374,704 | ) | | $ | (12,925,013 | ) |
| | | | | | | | | | | | | | | | |
| | |
| 54 | | 2019 BLACKROCK ANNUAL REPORTTO SHAREHOLDERS |
Notes to Financial Statements (continued)
| | | | | | | | | | | | | | | | |
| | | Year Ended
12/31/19 | | | Year Ended
12/31/18 | |
| LifePath Dynamic 2050 Fund | | Shares | | | Amount | | | Shares | | | Amount | |
Institutional | |
Shares sold | | | 255,731 | | | $ | 4,925,072 | | | | 283,749 | | | $ | 6,079,668 | |
Shares issued in reinvestment of distributions | | | 47,746 | | | | 968,338 | | | | 100,332 | | | | 1,827,322 | |
Shares redeemed | | | (140,480 | ) | | | (2,701,199 | ) | | | (592,884 | ) | | | (12,398,432 | ) |
| | | | | | | | | | | | | | | | |
Net increase (decrease) | | | 162,997 | | | $ | 3,192,211 | | | | (208,803 | ) | | $ | (4,491,442 | ) |
| | | | | | | | | | | | | | | | |
| | | | |
Investor A | | | | | | | | | | | | | | | | |
Shares sold and automatic conversion of shares | | | 579,158 | | | $ | 11,247,472 | | | | 441,499 | | | $ | 9,429,787 | |
Shares issued in reinvestment of distributions | | | 216,845 | | | | 4,381,579 | | | | 544,631 | | | | 9,761,145 | |
Shares redeemed | | | (1,169,044 | ) | | | (23,085,853 | ) | | | (735,442 | ) | | | (15,732,745 | ) |
| | | | | | | | | | | | | | | | |
Net increase (decrease) | | | (373,041 | ) | | $ | (7,456,802 | ) | | | 250,688 | | | $ | 3,458,187 | |
| | | | | | | | | | | | | | | | |
| | | | |
Investor C | | | | | | | | | | | | | | | | |
Shares sold | | | 28,365 | | | $ | 546,659 | | | | 31,288 | | | $ | 658,114 | |
Shares issued in reinvestment of distributions | | | 4,490 | | | | 89,702 | | | | 9,619 | | | | 168,958 | |
Shares redeemed and automatic conversion of shares | | | (21,314 | ) | | | (408,361 | ) | | | (20,782 | ) | | | (439,221 | ) |
| | | | | | | | | | | | | | | | |
Net increase | | | 11,541 | | | $ | 228,000 | | | | 20,125 | | | $ | 387,851 | |
| | | | | | | | | | | | | | | | |
| | | | |
Class K | | | | | | | | | | | | | | | | |
Shares sold | | | 587,117 | | | $ | 11,539,516 | | | | 133,927 | | | $ | 2,888,969 | |
Shares issued in reinvestment of distributions | | | 42,498 | | | | 867,152 | | | | 34,151 | | | | 614,153 | |
Shares redeemed | | | (91,192 | ) | | | (1,785,230 | ) | | | (696,001 | ) | | | (15,056,171 | ) |
| | | | | | | | | | | | | | | | |
Net increase (decrease) | | | 538,423 | | | $ | 10,621,438 | | | | (527,923 | ) | | $ | (11,553,049 | ) |
| | | | | | | | | | | | | | | | |
| | | | |
Class R | | | | | | | | | | | | | | | | |
Shares sold | | | 125,657 | | | $ | 2,481,279 | | | | 45,804 | | | $ | 967,469 | |
Shares issued in reinvestment of distributions | | | 6,906 | | | | 139,113 | | | | 12,473 | | | | 222,600 | |
Shares redeemed | | | (101,357 | ) | | | (1,991,623 | ) | | | (35,285 | ) | | | (747,655 | ) |
| | | | | | | | | | | | | | | | |
Net increase | | | 31,206 | | | $ | 628,769 | | | | 22,992 | | | $ | 442,414 | |
| | | | | | | | | | | | | | | | |
Total Net Increase (Decrease) | | | 371,126 | | | $ | 7,213,616 | | | | (442,921 | ) | | $ | (11,756,039 | ) |
| | | | | | | | | | | | | | | | |
| | | | | | | | | | | | | | | | |
| | | Year Ended
12/31/19 | | | Year Ended
12/31/18 | |
| LifePath Dynamic 2060 Fund | | Shares | | | Amount | | | Shares | | | Amount | |
Institutional | |
Shares sold | | | 30,550 | | | $ | 331,568 | | | | 113 | | | $ | 1,272 | |
Shares issued in reinvestment of distributions | | | 463 | | | | 5,243 | | | | 3 | | | | 32 | |
Shares redeemed | | | (12,433 | ) | | | (134,847 | ) | | | (542 | ) | | | (6,118 | ) |
| | | | | | | | | | | | | | | | |
Net increase (decrease) | | | 18,580 | | | $ | 201,964 | | | | (426 | ) | | $ | (4,814 | ) |
| | | | | | | | | | | | | | | | |
| | | | |
Investor A | | | | | | | | | | | | | | | | |
Shares sold and automatic conversion of shares | | | 25,986 | | | $ | 278,403 | | | | 5,197 | | | $ | 57,903 | |
Shares issued in reinvestment of distributions | | | 695 | | | | 7,898 | | | | 354 | | | | 3,346 | |
Shares redeemed | | | (695 | ) | | | (7,596 | ) | | | (94 | ) | | | (927 | ) |
| | | | | | | | | | | | | | | | |
Net increase | | | 25,986 | | | $ | 278,705 | | | | 5,457 | | | $ | 60,322 | |
| | | | | | | | | | | | | | | | |
| | | | |
Investor C | | | | | | | | | | | | | | | | |
Shares sold | | | 215 | | | $ | 2,327 | | | | 96 | | | $ | 1,000 | |
Shares issued in reinvestment of distributions | | | 17 | | | | 193 | | | | 39 | | | | 372 | |
Shares redeemed and automatic conversion of shares | | | (1 | ) | | | (15 | ) | | | (11 | ) | | | (103 | ) |
| | | | | | | | | | | | | | | | |
Net increase | | | 231 | | | $ | 2,505 | | | | 124 | | | $ | 1,269 | |
| | | | | | | | | | | | | | | | |
| | | | |
Class K | | | | | | | | | | | | | | | | |
Shares sold | | | 98,722 | | | $ | 1,063,779 | | | | 7,352 | | | $ | 79,112 | |
Shares issued in reinvestment of distributions | | | 2,151 | | | | 24,617 | | | | 449 | | | | 4,279 | |
Shares redeemed | | | (5,436 | ) | | | (59,386 | ) | | | (493 | ) | | | (5,174 | ) |
| | | | | | | | | | | | | | | | |
Net increase | | | 95,437 | | | $ | 1,029,010 | | | | 7,308 | | | $ | 78,217 | |
| | | | | | | | | | | | | | | | |
| | | | |
| NOTESTO FINANCIAL STATEMENTS | | | 55 | |
Notes to Financial Statements (continued)
| | | | | | | | | | | | | | | | |
| | | Year Ended
12/31/19 | | | Year Ended
12/31/18 | |
| LifePath Dynamic 2060 Fund | | Shares | | | Amount | | | Shares | | | Amount | |
Class R | | | | | | | | | | | | | | | | |
Shares sold | | | 15,961 | | | $ | 180,750 | | | | — | | | $ | — | |
Shares issued in reinvestment of distributions | | | 276 | | | | 3,157 | | | | 1 | | | | 7 | |
Shares redeemed | | | (2,111 | ) | | | (24,367 | ) | | | — | | | | — | |
| | | | | | | | | | | | | | | | |
Net increase | | | 14,126 | | | $ | 159,540 | | | | 1 | | | $ | 7 | |
| | | | | | | | | | | | | | | | |
Total Net Increase | | | 154,360 | | | $ | 1,671,724 | | | | 12,464 | | | $ | 135,001 | |
| | | | | | | | | | | | | | | | |
As of December 31, 2019, shares of the LifePath Dynamic Funds owned by BlackRock HoldCo 2, Inc., an affiliate of the LifePath Dynamic Funds, were as follows:
| | | | |
| | | LifePath Dynamic 2060 Fund | |
Institutional | | | 2,000 | |
Investor A | | | 2,000 | |
Investor C | | | 2,000 | |
Class K | | | 192,000 | |
Class R | | | 2,000 | |
Management has evaluated the impact of all subsequent events on the LifePath Dynamic Funds through the date the financial statements were issued and has determined that there were no subsequent events requiring adjustment or additional disclosure in the financial statements.
| | |
| 56 | | 2019 BLACKROCK ANNUAL REPORTTO SHAREHOLDERS |
| | |
| Report of Independent Registered Public Accounting Firm | | BlackRock Funds III |
To the Board of Trustees of
BlackRock Funds III and Shareholders of BlackRock LifePath® Dynamic Retirement Fund, BlackRock LifePath® Dynamic 2030 Fund, BlackRock LifePath® Dynamic 2040 Fund, BlackRock LifePath® Dynamic 2050 Fund and BlackRock LifePath® Dynamic 2060 Fund
Opinions on the Financial Statements
We have audited the accompanying statements of assets and liabilities of BlackRock LifePath® Dynamic Retirement Fund, BlackRock LifePath® Dynamic 2030 Fund, BlackRock LifePath® Dynamic 2040 Fund, BlackRock LifePath® Dynamic 2050 Fund and BlackRock LifePath® Dynamic 2060 Fund (five of the series constituting BlackRock Funds III, hereafter collectively referred to as the “Funds”) as of December 31, 2019, the related statements of operations for the year ended December 31, 2019, the statements of changes in net assets for each of the two years in the period ended December 31, 2019, including the related notes, and the financial highlights for each of the periods indicated therein (collectively referred to as the “financial statements”). In our opinion, the financial statements present fairly, in all material respects, the financial position of each of the Funds as of December 31, 2019, the results of each of their operations for the year then ended, the changes in each of their net assets for each of the two years in the period ended December 31, 2019 and each of the financial highlights for each of the periods indicated therein in conformity with accounting principles generally accepted in the United States of America.
Basis for Opinions
These financial statements are the responsibility of the Funds’ management. Our responsibility is to express an opinion on the Funds’ financial statements based on our audits. We are a public accounting firm registered with the Public Company Accounting Oversight Board (United States) (“PCAOB”) and are required to be independent with respect to the Funds in accordance with the U.S. federal securities laws and the applicable rules and regulations of the Securities and Exchange Commission and the PCAOB.
We conducted our audits of these financial statements in accordance with the standards of the PCAOB. Those standards require that we plan and perform the audit to obtain reasonable assurance about whether the financial statements are free of material misstatement, whether due to error or fraud.
Our audits included performing procedures to assess the risks of material misstatement of the financial statements, whether due to error or fraud, and performing procedures that respond to those risks. Such procedures included examining, on a test basis, evidence regarding the amounts and disclosures in the financial statements. Our audits also included evaluating the accounting principles used and significant estimates made by management, as well as evaluating the overall presentation of the financial statements. Our procedures included confirmation of securities owned as of December 31, 2019 by correspondence with the administrator of the Master Portfolios. We believe that our audits provide a reasonable basis for our opinions.
/s/PricewaterhouseCoopers LLP
Philadelphia, Pennsylvania
February 27, 2020
We have served as the auditor of one or more BlackRock investment companies since 2000.
Important Tax Information (unaudited)
The following information is provided with respect to the ordinary income distributions paid during the tax year ended December 31, 2018.
| | | | | | | | | | | | | | | | | | | | | | | | | | |
| | | Payable Dates | | LifePath
Dynamic
Retirement
Fund | | | LifePath
Dynamic
2020
Fund (a) | | | LifePath
Dynamic
2030
Fund | | | LifePath
Dynamic
2040
Fund | | | LifePath
Dynamic
2050
Fund | | | LifePath
Dynamic
2060
Fund | |
Qualified Dividend Income for Individuals(b) | | Quarterly | | | 26.84 | % | | | 19.06 | % | | | 40.00 | % | | | 58.13 | % | | | 85.77 | % | | | 78.10 | % |
Qualified Business Income(b) | | | | | 0.16 | | | | 0.48 | | | | 3.55 | | | | 6.75 | | | | 10.59 | | | | 7.53 | |
Dividends Qualifying for the Dividend Received Deduction for Corporations(b) | | Quarterly | | | 8.56 | | | | 7.15 | | | | 12.61 | | | | 17.49 | | | | 24.62 | | | | 21.31 | |
Federal Obligation Interest(c) | | Quarterly | | | 6.65 | | | | 5.27 | | | | 4.53 | | | | 3.60 | | | | 3.23 | | | | 2.36 | |
Interest Related Dividends and Short-Term Capital Gains forNon-U.S. Residents(d) | | Quarterly | | | 58.88 | | | | 72.04 | | | | 50.29 | | | | 29.91 | | | | 12.17 | | | | 6.50 | |
| | (a) | Effective November 18, 2019, LifePath® Dynamic 2020 Fund reorganized into LifePath Dynamic Retirement Fund. | |
| | (b) | The LifePath Dynamic Funds hereby designate the percentages indicated above or the maximum amount allowable by law. | |
| | (c) | The law varies in each state as to whether and what percentage of dividend income attributable to federal obligations is exempt from state income tax. We recommend that you consult your tax advisor to determine if any portion of the dividends you received is exempt from state income taxes. | |
| | (d) | Represents the portion of the taxable ordinary income dividends eligible for exemption from U.S. withholding tax for nonresident aliens and foreign corporations. | |
Additionally, the LifePath Dynamic Funds distributed long-term capital gains per share to shareholders of record as follows:
| | | | | | | | | | | | | | | | | | | | | | | | | | |
| | | Record Dates | | LifePath
Dynamic
Retirement
Fund | | | LifePath
Dynamic
2020
Fund (a) | | | LifePath
Dynamic
2030 Fund | | | LifePath
Dynamic
2040 Fund | | | LifePath
Dynamic
2050 Fund | | | LifePath Dynamic
2060
Fund | |
Long-Term Capital Gains Per Share | | 11/12/2019 | | $ | — | | | $ | 0.4764330 | | | $ | — | | | $ | — | | | $ | — | | | $ | — | |
| | | 12/30/2019 | | | 0.070219 | | | | — | | | | 0.446555 | | | | 0.693051 | | | | 0.806609 | | | | 0.118900 | |
| | | | |
| REPORT OF INDEPENDENT REGISTERED PUBLIC ACCOUNTING FIRM / IMPORTANT TAX INFORMATION | | | 57 | |
| | |
| Master Portfolio Information as of December 31, 2019 | | |
LifePath® Dynamic Retirement Master Portfolio
PORTFOLIO COMPOSITION
| | | | |
| Asset Type | | Percent of
Net Assets | |
Fixed Income Funds | | | 55 | % |
Equity Funds | | | 37 | |
Short-Term Securities | | | 9 | |
Liabilities in Excess of Other Assets | | | (1 | ) |
TEN LARGEST HOLDINGS
| | | | |
| Holdings | | Percent of
Net Assets | |
CoreAlpha Bond Master Portfolio | | | 39 | % |
Active Stock Master Portfolio | | | 22 | |
iShares TIPS Bond ETF | | | 8 | |
Master Total Return Portfolio | | | 8 | |
International Tilts Master Portfolio | | | 5 | |
BlackRock Advantage Emerging Markets Fund — Class K | | | 3 | |
BlackRock Tactical Opportunities Fund — Class K | | | 3 | |
iShares Developed Real Estate Index Fund — Class K | | | 2 | |
iShares MSCI EAFESmall-Cap ETF | | | 1 | |
LifePath® Dynamic 2030 Master Portfolio
PORTFOLIO COMPOSITION
| | | | |
| Asset Type | | Percent of
Net Assets | |
Equity Funds | | | 61 | % |
Fixed Income Funds | | | 31 | |
Short-Term Securities | | | 8 | |
TEN LARGEST HOLDINGS
| | | | |
| Holdings | | Percent of
Net Assets | |
Active Stock Master Portfolio | | | 36 | % |
CoreAlpha Bond Master Portfolio | | | 21 | |
International Master Portfolio | | | 11 | |
BlackRock Advantage Emerging Markets Fund — Class K | | | 6 | |
iShares TIPS Bond ETF | | | 6 | |
Master Total Return Portfolio | | | 4 | |
iShares Developed Real Estate Index Fund — Class K | | | 3 | |
BlackRock Tactical Opportunities Fund — Class K | | | 3 | |
iShares MSCI EAFESmall-Cap ETF | | | 3 | |
LifePath® Dynamic 2040 Master Portfolio
PORTFOLIO COMPOSITION
| | | | |
| Asset Type | | Percent of
Net Assets | |
Equity Funds | | | 82 | % |
Fixed Income Funds | | | 11 | |
Short-Term Securities | | | 8 | |
Liabilities in Excess of Other Assets | | | (1 | ) |
TEN LARGEST HOLDINGS
| | | | |
| Holdings | | Percent of
Net Assets | |
Active Stock Master Portfolio | | | 47 | % |
International Tilts Master Portfolio | | | 15 | |
BlackRock Advantage Emerging Markets Fund — Class K | | | 9 | |
CoreAlpha Bond Master Portfolio | | | 7 | |
iShares Developed Real Estate Index Fund — Class K | | | 4 | |
iShares MSCI EAFESmall-Cap ETF | | | 4 | |
iShares TIPS Bond ETF | | | 3 | |
BlackRock Tactical Opportunities Fund — Class K | | | 3 | |
Master Total Return Portfolio | | | 1 | |
The LifePath Dynamic Master Portfolios’ allocations and holdings listed above are current as of the report date. However, the LifePath Dynamic Master Portfolios are regularly monitored and their composition may vary throughout various periods.
| | |
| 58 | | 2019 BLACKROCK ANNUAL REPORTTO SHAREHOLDERS |
| | |
| Master Portfolio Information as of December 31, 2019 (continued) | | |
LifePath® Dynamic 2050 Master Portfolio
PORTFOLIO COMPOSITION
| | | | |
| Asset Type | | Percent of
Net Assets | |
Equity Funds | | | 89 | % |
Short-Term Securities | | | 12 | |
Fixed Income Funds | | | 1 | |
Liabilities in Excess of Other Assets | | | (2 | ) |
TEN LARGEST HOLDINGS
| | | | |
| Holdings | | Percent of
Net Assets | |
Active Stock Master Portfolio | | | 52 | % |
International Tilts Master Portfolio | | | 18 | |
BlackRock Advantage Emerging Markets Fund — Class K | | | 10 | |
iShares Developed Real Estate Index Fund — Class K | | | 5 | |
iShares MSCI EAFESmall-Cap ETF | | | 4 | |
CoreAlpha Bond Master Portfolio | | | 1 | |
LifePath® Dynamic 2060 Master Portfolio
PORTFOLIO COMPOSITION
| | | | |
| Asset Type | | Percent of
Net Assets | |
Equity Funds | | | 94 | % |
Short-Term Securities | | | 5 | |
Fixed Income Funds | | | 1 | |
TEN LARGEST HOLDINGS
| | | | |
| Holdings | | Percent of
Net Assets | |
Active Stock Master Portfolio | | | 52 | % |
International Tilts Master Portfolio | | | 19 | |
BlackRock Advantage Emerging Markets Fund — Class K | | | 10 | |
iShares Developed Real Estate Index Fund — Class K | | | 5 | |
iShares MSCI EAFESmall-Cap ETF | | | 4 | |
iShares MSCI Canada ETF | | | 3 | |
iShares Russell 2000 ETF | | | 2 | |
CoreAlpha Bond Master Portfolio | | | 1 | |
The LifePath Dynamic Master Portfolios’ allocations and holdings listed above are current as of the report date. However, the LifePath Dynamic Master Portfolios are regularly monitored and their composition may vary throughout various periods.
| | | | |
| MASTER PORTFOLIO INFORMATION | | | 59 | |
| | |
Schedule of Investments December 31, 2019 | | LifePath Dynamic Retirement Master Portfolio (Percentages shown are based on Net Assets) |
| | | | | | | | |
| Security | | Shares/
Investment
Value | | | Value | |
|
Affiliated Investment Companies(d) — 100.9% | |
|
| Equity Funds — 36.9% | |
Active Stock Master Portfolio | | $ | 90,865,442 | | | $ | 90,865,442 | |
BlackRock Advantage Emerging Markets Fund — Class K | | | 1,182,456 | | | | 12,900,594 | |
BlackRock Tactical Opportunities Fund — Class K | | | 921,851 | | | | 12,380,456 | |
International Tilts Master Portfolio | | $ | 20,140,491 | | | | 20,140,491 | |
iShares Developed Real Estate Index Fund — Class K | | | 828,024 | | | | 9,091,707 | |
iShares MSCI EAFESmall-Cap ETF(a) | | | 83,346 | | | | 5,190,789 | |
| | | | | | | | |
| | | | 150,569,479 | |
|
| Fixed Income Funds — 55.2% | |
CoreAlpha Bond Master Portfolio | | $ | 160,689,142 | | | | 160,689,142 | |
iShares TIPS Bond ETF | | | 281,657 | | | | 32,832,756 | |
Master Total Return Portfolio | | $ | 31,906,371 | | | | 31,906,371 | |
| | | | | | | | |
| | | | 225,428,269 | |
| | | | | | | | |
| Security | |
Shares | | | Value | |
|
| Short-Term Securities — 8.8% | |
BlackRock Cash Funds: Institutional,
SL Agency Shares, | | | | | | | | |
1.87%(b)(c) | | | 252,847 | | | $ | 252,948 | |
BlackRock Cash Funds: Treasury,
SL Agency Shares, | | | | | | | | |
1.55%(c) | | | 35,793,498 | | | | 35,793,498 | |
| | | | | | | | |
| | | | 36,046,446 | |
| | | | | |
| |
Total Affiliated Investment Companies — 100.9%
(Cost — $318,350,676) | | | | 412,044,194 | |
| |
Liabilities in Excess of Other Assets — (0.9)% | | | | (3,522,634 | ) |
| | | | | | | | |
| |
Net Assets — 100.0% | | | $ | 408,521,560 | |
| | | | | | | | |
| (a) | Security, or a portion of the security, is on loan. |
| (b) | All or a portion of the security was purchased with the cash collateral from loaned securities. |
| (c) | Annualized7-day yield as of period end. |
| (d) | During the year ended December 31, 2019, investments in issuers considered to be an affiliate/affiliates of the LifePath Dynamic Master Portfolio for purposes of Section 2(a)(3) of the Investment Company Act of 1940, as amended, and/or related parties of the LifePath Dynamic Master Portfolio were as follows: |
| | | | | | | | | | | | | | | | | | | | | | | | | | | | | | | | |
| Affiliated Persons and/or Related Parties | |
| Shares/
Investment
Value Held at
12/31/18 |
| |
| Shares/
Investment
Value
Purchased |
| |
| Shares/
Investment
Value Sold |
| |
| Shares/
Investment
Value Held at
12/31/19 |
| |
| Value at
12/31/19 |
| | | Income | | |
| Net
Realized
Gain (Loss) |
(a) | |
| Change in
Unrealized
Appreciation
(Depreciation) |
|
Active Stock Master Portfolio | | $ | 26,264,955 | | | $ | 64,600,487 | (b) | | $ | — | | | $ | 90,865,442 | | | $ | 90,865,442 | | | $ | 658,366 | | | $ | 4,370,424 | | | $ | 6,855,495 | |
BlackRock Advantage Emerging Markets Fund — Class K | | | 392,861 | | | | 1,011,259 | | | | (221,664 | ) | | | 1,182,456 | | | | 12,900,594 | | | | 287,315 | | | | (113,099 | ) | | | 1,075,150 | |
BlackRock Cash Funds: Institutional,
SL Agency Shares | | | 1,293,646 | | | | — | | | | (1,040,799 | )(b) | | | 252,847 | | | | 252,948 | | | | 5,929 | (c) | | | 187 | | | | 1 | |
BlackRock Cash Funds: Treasury,
SL Agency Shares | | | 3,984,522 | | | | 31,808,976 | (b) | | | — | | | | 35,793,498 | | | | 35,793,498 | | | | 187,537 | | | | — | | | | — | |
BlackRock Tactical Opportunities Fund — Class K | | | 259,496 | | | | 695,228 | | | | (32,873 | ) | | | 921,851 | | | | 12,380,456 | | | | 408,216 | | | | 8,319 | | | | (364,738 | ) |
CoreAlpha Bond Master Portfolio | | $ | 44,525,554 | | | $ | 116,163,588 | (b) | | $ | — | | | $ | 160,689,142 | | | | 160,689,142 | | | | 1,842,961 | | | | 750,998 | | | | 783,614 | |
International Tilts Master Portfolio | | $ | 7,798,563 | | | $ | 12,341,928 | (b) | | $ | — | | | $ | 20,140,491 | | | | 20,140,491 | | | | 259,796 | | | | 476,903 | | | | 2,492,794 | |
iShares Developed Real Estate Index Fund — Class K | | | — | | | | 831,759 | | | | (3,735 | ) | | | 828,024 | | | | 9,091,707 | | | | 354,026 | | | | (336 | ) | | | (212,801 | ) |
iShares Edge MSCI Multifactor International ETF(d) | | | 46,405 | | | | 13,064 | | | | (59,469 | ) | | | — | | | | — | | | | 24,168 | | | | 74,826 | | | | 38,627 | |
iShares Edge MSCI Multifactor USA ETF(d) | | | 15,620 | | | | 30,123 | | | | (45,743 | ) | | | — | | | | — | | | | 11,969 | | | | 117,024 | | | | (11,444 | ) |
iShares International Developed Real Estate ETF(d) | | | — | | | | 18,763 | | | | (18,763 | ) | | | — | | | | — | | | | 3,786 | | | | (3,550 | ) | | | — | |
iShares MSCI EAFESmall-Cap ETF | | | 24,473 | | | | 63,927 | | | | (5,054 | ) | | | 83,346 | | | | 5,190,789 | | | | 127,249 | | | | (25,564 | ) | | | 423,293 | |
iShares TIPS Bond ETF | | | 85,948 | | | | 215,274 | | | | (19,565 | ) | | | 281,657 | | | | 32,832,756 | | | | 215,490 | | | | 64,182 | | | | 690,321 | |
iShares U.S. Real Estate ETF(d) | | | — | | | | 9,011 | | | | (9,011 | ) | | | — | | | | — | | | | — | | | | (809 | ) | | | — | |
Master Total Return Portfolio | | $ | 6,685,677 | | | $ | 25,220,694 | (b) | | $ | — | | | $ | 31,906,371 | | | | 31,906,371 | | | | 465,200 | | | | 187,677 | | | | (1,188,220 | ) |
| | | | | | | | | | | | | | | | | | | | | | | | | | | | | | | | |
| | | | | | | | | | | | | | | | | | | $412,044,194 | | | $ | 4,852,008 | | | $ | 5,907,182 | | | $ | 10,582,092 | |
| | | | | | | | | | | | | | | | | |
| | (a) | Includes net capital gain distributions, if applicable. | |
| | (b) | Represents net shares/investment value purchased (sold). | |
| | (c) | All or a portion represents securities lending income earned from the reinvestment of cash collateral from loaned securities, net of fees and collateral investment expenses, and other payments to and from borrowers of securities. | |
| | (d) | As of period end, the entity is no longer held by the LifePath Dynamic Master Portfolio. | |
| | |
| 60 | | 2019 BLACKROCK ANNUAL REPORTTO SHAREHOLDERS |
| | |
Schedule of Investments (continued) December 31, 2019 | | LifePath Dynamic Retirement Master Portfolio |
Derivative Financial Instruments Outstanding as of Period End
Futures Contracts
| | | | | | | | | | | | | | | | |
| Description | | Number of
Contracts | | | Expiration
Date | | | Notional
Amount (000) | | | Value/
Unrealized
Appreciation
(Depreciation) | |
Long Contracts | | | | | | | | | | | | | | | | |
S&P/TSX 60 Index | | | 23 | | | | 03/19/20 | | | $ | 3,586 | | | $ | 17,195 | |
10-Year U.S. Treasury Note | | | 38 | | | | 03/20/20 | | | | 4,880 | | | | (42,313 | ) |
E-Mini MSCI EAFE Index | | | 92 | | | | 03/20/20 | | | | 9,368 | | | | 249,479 | |
Russell 2000E-Mini Index | | | 166 | | | | 03/20/20 | | | | 13,866 | | | | 285,249 | |
S&P 500E-Mini Index | | | 19 | | | | 03/20/20 | | | | 3,070 | | | | 87,756 | |
| | | | | | | | | | | | | | | | |
| | | | | | | | | | | | | | | 597,366 | |
| | | | | | | | | | | | | | | | |
Short Contracts | | | | | | | | | | | | | | | | |
U.S. Treasury Ultra Bond | | | 23 | | | | 03/20/20 | | | | 4,178 | | | | 134,368 | |
| | | | | | | | | | | | | | | | |
| | | | | | | | | | | | | | $ | 731,734 | |
| | | | | | | | | | | | | | | | |
Forward Foreign Currency Exchange Contracts
| | | | | | | | | | | | | | | | | | | | |
Currency
Purchased | | | Currency
Sold | | | Counterparty | | Settlement Date | | | Unrealized
Appreciation
(Depreciation) | |
| CAD | | | 3,836,636 | | | USD | | | 2,894,357 | | | Morgan Stanley & Co. International PLC | | | 03/18/20 | | | $ | 60,986 | |
| EUR | | | 19,614,880 | | | USD | | | 21,861,568 | | | Bank of America N.A. | | | 03/18/20 | | | | 243,778 | |
| | | | | | | | | | | | | | | | | | | | |
| | | Net unrealized appreciation | | | $ | 304,764 | |
| | | | | | | | | | | | | | | | | | | | |
Derivative Financial Instruments Categorized by Risk Exposure
As of period end, the fair values of derivative financial instruments located in the Statements of Assets and Liabilities were as follows:
| | | | | | | | | | | | | | | | | | | | | | | | | | | | |
| | | Commodity
Contracts | | | Credit
Contracts | | | Equity
Contracts | | | Foreign
Currency
Exchange
Contracts | | | Interest
Rate
Contracts | | | Other
Contracts | | | Total | |
Assets — Derivative Financial Instrument | |
Futures contracts | |
Unrealized appreciation on futures contracts(a) | | $ | — | | | $ | — | | | $ | 639,679 | | | $ | — | | | $ | 134,368 | | | $ | — | | | $ | 774,047 | |
Forward foreign currency exchange contracts | |
Unrealized appreciation on forward foreign currency exchange contracts | | | — | | | | — | | | | — | | | | 304,764 | | | | — | | | | — | | | | 304,764 | |
| | | | | | | | | | | | | | | | | | | | | | | | | | | | |
| | $ | — | | | $ | — | | | $ | 639,679 | | | $ | 304,764 | | | $ | 134,368 | | | $ | — | | | $ | 1,078,811 | |
| | | | | | | | | | | | | | | | | | | | | | | | | | | | |
Liabilities — Derivative Financial Instrument | |
Futures contracts | | | | | | | | | | | | | | | | | | | | | | | | | | | | |
Unrealized depreciation on futures contracts(a) | | $ | — | | | $ | — | | | $ | — | | | $ | — | | | $ | 42,313 | | | $ | — | | | $ | 42,313 | |
| | | | | | | | | | | | | | | | | | | | | | | | | | | | |
| | (a) | Net cumulative unrealized appreciation (depreciation) on futures contracts and centrally cleared swaps, if any, are reported in the Schedule of Investments. In the Statements of Assets and Liabilities, only current day’s variation margin is reported in receivables or payables and the net cumulative unrealized appreciation (depreciation) is included in accumulated earnings (loss). | |
For the year ended December 31, 2019, the effect of derivative financial instruments in the Statements of Operations was as follows:
| | | | | | | | | | | | | | | | | | | | | | | | | | | | |
| | | Commodity
Contracts | | | Credit
Contracts | | | Equity
Contracts | | | Foreign
Currency
Exchange
Contracts | | | Interest
Rate
Contracts | | | Other
Contracts | | | Total | |
Net Realized Gain (Loss) from: | | | | | | | | | | | | | | | | | | | | | | | | | | | | |
Futures contracts | | $ | — | | | $ | — | | | $ | 1,656,921 | | | $ | — | | | $ | 36,475 | | | $ | — | | | $ | 1,693,396 | |
Forward foreign currency exchange contracts | | | — | | | | — | | | | — | | | | (436,137 | ) | | | — | | | | — | | | | (436,137 | ) |
| | | | | | | | | | | | | | | | | | | | | | | | | | | | |
| | $ | — | | | $ | — | | | $ | 1,656,921 | | | $ | (436,137 | ) | | $ | 36,475 | | | $ | — | | | $ | 1,257,259 | |
| | | | | | | | | | | | | | | | | | | | | | | | | | | | |
| | | | | | | |
| Net Change in Unrealized Appreciation (Depreciation) on: | | | | | | | | | | | | | | | | | | | | | |
Futures contracts | | $ | — | | | $ | — | | | $ | 1,135,662 | | | $ | — | | | $ | 26,480 | | | $ | — | | | $ | 1,162,142 | |
Forward foreign currency exchange contracts | | | — | | | | — | | | | — | | | | 401,980 | | | | — | | | | — | | | | 401,980 | |
| | | | | | | | | | | | | | | | | | | | | | | | | | | | |
| | $ | — | | | $ | — | | | $ | 1,135,662 | | | $ | 401,980 | | | $ | 26,480 | | | $ | — | | | $ | 1,564,122 | |
| | | | | | | | | | | | | | | | | | | | | | | | | | | | |
| | | | |
| SCHEDULES OF INVESTMENTS | | | 61 | |
| | |
Schedule of Investments (continued) December 31, 2019 | | LifePath Dynamic Retirement Master Portfolio |
Average Quarterly Balances of Outstanding Derivative Financial Instruments
| | | | |
Futures contracts: | |
Average notional value of contracts — long | | $ | 17,499,138 | |
Average notional value of contracts — short | | $ | 3,538,125 | |
Forward foreign currency exchange contracts: | |
Average amounts purchased — in USD | | $ | 2,021,639 | |
Average amounts sold — USD | | $ | 14,145,827 | |
For more information about the LifePath Dynamic Master Portfolio’s Investment risks regarding derivative financial instruments, refer to the Notes to Financial Statements
Derivative Financial Instruments — Offsetting as of Period End
The Fund’s derivative assets and liabilities (by type) were as follows:
| | | | | | | | |
| | | Assets | | | Liabilities | |
Derivative Financial Instruments: | | | | | | | | |
Futures contracts | | $ | 99,089 | | | $ | 10,181 | |
Forward foreign currency exchange contracts | | | 304,764 | | | | — | |
| | | | | | | | |
Total derivative assets and liabilities in the Statements of Assets and Liabilities | | $ | 403,853 | | | $ | 10,181 | |
Derivatives not subject to a Master Netting Agreement or similar agreement (“MNA”) | | | (99,089 | ) | | | (10,181 | ) |
| | | | | | | | |
Total derivative assets and liabilities subject to an MNA | | $ | 304,764 | | | $ | — | |
| | | | | | | | |
The following table presents the LifePath Dynamic Master Portfolio‘s derivative assets by counterparty net of amounts available for offset under an MNA and net of the related collateral received by the LifePath Dynamic Master Portfolio:
| | | | | | | | | | | | | | | | | | | | |
| Counterparty | | Derivative
Assets
Subject to
an MNA by
Counterparty | | | Derivatives
Available
for Offset | | | Non-cash
Collateral
Received | | | Cash
Collateral
Received | | | Net Amount
of Derivative
Assets (a)(b) | |
Bank of America N.A. | | $ | 243,778 | | | $ | — | | | $ | — | | | $ | — | | | $ | 243,778 | |
Morgan Stanley & Co. International PLC | | | 60,986 | | | | — | | | | — | | | | — | | | | 60,986 | |
| | | | | | | | | | | | | | | | | | | | |
| | $ | 304,764 | | | $ | — | | | $ | — | | | $ | — | | | $ | 304,764 | |
| | | | | | | | | | | | | | | | | | | | |
| | (a) | Net amount represents the net amount receivable from the counterparty in the event of default. | |
| | (b) | Net amount may also include forward foreign currency exchange contracts that are not required to be collateralized. | |
Fair Value Hierarchy as of Period End
Various inputs are used in determining the fair value of investments and derivative financial instruments. For information about the LifePath Dynamic Master Portfolio’s policy regarding valuation of investments and derivative financial instruments, refer to the Notes to Financial Statements.
The following tables summarize the LifePath Dynamic Master Portfolio’s investments and derivative financial instruments categorized in the disclosure hierarchy:
| | | | | | | | | | | | | | | | |
| | | Level 1 | | | Level 2 | | | Level 3 | | | Total | |
Assets: | |
Investments: | |
Affiliated Investment Companies | | | | | | | | | | | | | | | | |
Equity Funds | | $ | 39,563,546 | | | $ | — | | | $ | — | | | $ | 39,563,546 | |
Fixed Income Funds | | | 32,832,756 | | | | — | | | | — | | | | 32,832,756 | |
Short-Term Securities | | | 36,046,446 | | | | — | | | | — | | | | 36,046,446 | |
| | | | | | | | | | | | | | | | |
Subtotal | | $ | 108,442,748 | | | $ | — | | | $ | — | | | $ | 108,442,748 | |
| | | | | | | | | | | | | | | | |
Investments Valued at NAV(a) | | | | | | | | | | | | | | | 303,601,446 | |
| | | | | | | | | | | | | | | | |
Total Investments | | | | | | | | | | | | | | $ | 412,044,194 | |
| | | | | | | | | | | | | | | | |
Derivative Financial Instruments(b) | |
Assets: | |
Equity contracts | | $ | 639,679 | | | $ | — | | | $ | — | | | $ | 639,679 | |
Forward foreign currency contracts | | | — | | | | 304,764 | | | | — | | | | 304,764 | |
Interest rate contracts | | | 134,368 | | | | — | | | | — | | | | 134,368 | |
Liabilities: | |
Interest rate contracts | | | (42,313 | ) | | | — | | | | — | | | | (42,313 | ) |
| | | | | | | | | | | | | | | | |
| | $ | 731,734 | | | $ | 304,764 | | | $ | | | | $ | 1,036,498 | |
| | | | | | | | | | | | | | | | |
| | (a) | Certain investments of the LifePath Dynamic Master Portfolio were fair valued using NAV per share or its equivalent as no quoted market value is available and therefore have been excluded from the fair value hierarchy. | |
| | (b) | Derivative financial instruments are futures contracts and forward foreign currency exchange contracts. Futures contracts and forward foreign currency exchange contracts are valued at the unrealized appreciation (depreciation) on the instrument. | |
See notes to financial statements.
| | |
| 62 | | 2019 BLACKROCK ANNUAL REPORTTO SHAREHOLDERS |
| | |
Schedule of Investments December 31, 2019 | | LifePath Dynamic 2030 Master Portfolio (Percentages shown are based on Net Assets) |
| | | | | | | | |
| Security | | Investment Value | | | Value | |
|
Affiliated Investment Companies(d) — 99.9% | |
|
| Equity Funds — 61.4% | |
Active Stock Master Portfolio | | $ | 125,478,627 | | | $ | 125,478,627 | |
BlackRock Advantage Emerging Markets Fund — Class K | | | 2,044,794 | | | | 22,308,701 | |
BlackRock Tactical Opportunities Fund — Class K | | | 788,141 | | | | 10,584,730 | |
International Tilts Master Portfolio | | $ | 37,353,587 | | | | 37,353,587 | |
iShares Developed Real Estate Index Fund — Class K | | | 990,451 | | | | 10,875,154 | |
iShares MSCI EAFESmall-Cap ETF(a) | | | 144,419 | | | | 8,994,415 | |
| | | | | | | | |
| | | | 215,595,214 | |
|
| Fixed Income Funds — 30.8% | |
CoreAlpha Bond Master Portfolio | | $ | 72,562,515 | | | | 72,562,515 | |
iShares TIPS Bond ETF(a) | | | 184,763 | | | | 21,537,823 | |
Master Total Return Portfolio | | $ | 13,956,441 | | | | 13,956,441 | |
| | | | | | | | |
| | | | 108,056,779 | |
| | | | | | | | |
| Security | | Investment Value | | | Value | |
|
| Short-Term Securities — 7.7% | |
BlackRock Cash Funds: Institutional,
SL Agency Shares, | | | | | | | | |
1.87%(b)(c) | | $ | 1,083,754 | | | $ | 1,084,188 | |
BlackRock Cash Funds: Treasury,
SL Agency Shares, | | | | | | | | |
1.55%(b) | | | 25,813,659 | | | | 25,813,659 | |
| | | | | | | | |
| | | | 26,897,847 | |
| | | | | |
| |
Total Affiliated Investment Companies — 99.9%
(Cost — $320,913,529) | | | | 350,549,840 | |
| |
Other Assets Less Liabilities — 0.1% | | | | 291,762 | |
| | | | | |
| |
Net Assets — 100.0% | | | $ | 350,841,602 | |
| | | | | |
| (a) | Security, or a portion of the security, is on loan. |
| (b) | Annualized7-day yield as of period end. |
| (c) | All or a portion of the security was purchased with the cash collateral from loaned securities. |
| (d) | During the year ended December 31, 2019, investments in issuers considered to be an affiliate/affiliates of the LifePath Dynamic Master Portfolio for purposes of Section 2(a)(3) of the Investment Company Act of 1940, as amended, and/or related parties of the LifePath Dynamic Master Portfolio were as follows: |
| | | | | | | | | | | | | | | | | | | | | | | | | | | | | | | | |
| Affiliated Persons and/or Related Parties | |
| Shares/
Investment
Value Held at
12/31/18 |
| |
| Shares/
Investment
Value
Purchased |
| |
| Shares/
Investment
Value Sold |
| |
| Shares/
Investment
Value at
12/31/19 |
| |
| Value at
12/31/19 |
| | | Income | | |
| Net
Realized
Gain (Loss) |
(a) | |
| Change in
Unrealized
Appreciation
(Depreciation) |
|
Active Stock Master Portfolio | | $ | 116,921,680 | | | $ | 8,556,947 | (b) | | $ | — | | | $ | 125,478,627 | | | $ | 125,478,627 | | | $ | 2,247,992 | | | $ | 12,642,750 | | | $ | 18,986,434 | |
BlackRock Advantage Emerging Markets Fund — Class K | | | 1,841,392 | | | | 694,056 | | | | (490,654 | ) | | | 2,044,794 | | | | 22,308,701 | | | | 505,151 | | | | (249,507 | ) | | | 3,160,089 | |
BlackRock Cash Funds: Institutional,
SL Agency Shares | | | 7,025,957 | | | | — | | | | (5,942,203 | )(b) | | | 1,083,754 | | | | 1,084,188 | | | | 19,704 | (c) | | | 4,859 | | | | — | |
BlackRock Cash Funds: Treasury,
SL Agency Shares | | | 927,237 | | | | 24,886,422 | (b) | | | — | | | | 25,813,659 | | | | 25,813,659 | | | | 259,146 | | | | — | | | | — | |
BlackRock Tactical Opportunities Fund — Class K | | | 745,753 | | | | 103,602 | | | | (61,214 | ) | | | 788,141 | | | | 10,584,730 | | | | 343,416 | | | | 13,639 | | | | (158,906 | ) |
CoreAlpha Bond Master Portfolio | | $ | 64,489,702 | | | $ | 8,072,813 | (b) | | $ | — | | | $ | 72,562,515 | | | | 72,562,515 | | | | 2,036,075 | | | | 1,839,600 | | | | (1,012,625 | ) |
International Tilts Master Portfolio | | $ | 33,994,754 | | | $ | 3,358,833 | (b) | | $ | — | | | $ | 37,353,587 | | | | 37,353,587 | | | | 1,165,977 | | | | 1,078,449 | | | | 10,458,745 | |
iShares Developed Real Estate Index Fund — Class K | | | — | | | | 1,366,863 | | | | (376,412 | ) | | | 990,451 | | | | 10,875,154 | | | | 470,267 | | | | (5,178 | ) | | | (232,953 | ) |
iShares Edge MSCI Multifactor International ETF | | | 278,178 | | | | — | | | | (278,178 | ) | | | — | | | | — | | | | 113,832 | | | | 734,761 | | | | (168,724 | ) |
iShares Edge MSCI Multifactor USA ETF | | | 142,679 | | | | 16,341 | | | | (159,020 | ) | | | — | | | | — | | | | 49,273 | | | | 587,137 | | | | (29,917 | ) |
iShares MSCI EAFESmall-Cap ETF | | | 132,778 | | | | 16,613 | | | | (4,972 | ) | | | 144,419 | | | | 8,994,415 | | | | 305,391 | | | | (21,169 | ) | | | 1,471,194 | |
iShares TIPS Bond ETF | | | 120,087 | | | | 85,090 | | | | (20,414 | ) | | | 184,763 | | | | 21,537,823 | | | | 314,731 | | | | 22,479 | | | | 941,233 | |
Master Total Return Portfolio | | $ | 10,741,999 | | | $ | 3,214,442 | (b) | | $ | — | | | $ | 13,956,441 | | | | 13,956,441 | | | | 474,074 | | | | 284,526 | | | | (793,502 | ) |
| | | | | | | | | | | | | | | | | | | | | | | | | | | | | | | | |
| | | | | | | | | | | $ | 350,549,840 | | | $ | 8,305,029 | | | $ | 16,932,346 | | | $ | 32,621,068 | |
| | | | | | | | | | | | | | | | | | | | | | | | | | | | | | | | |
| | (a) | Includes net capital gain distributions, if applicable. | |
| | (b) | Represents net shares/ investment value purchased (sold). | |
| | (c) | All or a portion represents securities lending income earned from the reinvestment of cash collateral from loaned securities, net of fees and collateral investment expenses, and other payments to and from borrowers of securities. | |
| | | | |
| SCHEDULES OF INVESTMENTS | | | 63 | |
| | |
Schedule of Investments (continued) December 31, 2019 | | LifePath Dynamic 2030 Master Portfolio |
Derivative Financial Instruments Outstanding as of Period End
Futures Contracts
| | | | | | | | | | | | | | | | |
| Description | | Number of
Contracts | | | Expiration
Date | | | Notional
Amount (000) | | | Value/
Unrealized
Appreciation
(Depreciation) | |
Long Contracts | | | | | | | | | | | | | | | | |
S&P/TSX 60 Index | | | 39 | | | | 03/19/20 | | | $ | 6,081 | | | $ | 29,156 | |
E-Mini MSCI EAFE Index | | | 126 | | | | 03/20/20 | | | | 12,830 | | | | 341,678 | |
Russell 2000E-Mini Index | | | 116 | | | | 03/20/20 | | | | 9,689 | | | | 199,330 | |
S&P 500E-Mini Index | | | 17 | | | | 03/20/20 | | | | 2,746 | | | | 78,519 | |
| | | | | | | | | | | | | | | | |
| | | | | | | | | | | | | | | 648,683 | |
| | | | | | | | | | | | | | | | |
Short Contracts | | | | | | | | | | | | | | | | |
10-Year U.S. Treasury Note | | | 32 | | | | 03/20/20 | | | | 4,110 | | | | 35,956 | |
U.S. Treasury Ultra Bond | | | 20 | | | | 03/20/20 | | | | 3,633 | | | | 116,842 | |
| | | | | | | | | | | | | | | | |
| | | | | | | | | | | | | | | 152,798 | |
| | | | | | | | | | | | | | | | |
| | | | | | | | | | | | | | $ | 801,481 | |
| | | | | | | | | | | | | | | | |
Forward Foreign Currency Exchange Contracts
| | | | | | | | | | | | | | | | | | | | |
Currency
Purchased | | | Currency
Sold | | | Counterparty | | Settlement Date | | | Unrealized
Appreciation
(Depreciation) | |
| CAD | | | 7,030,413 | | | USD | | | 5,303,789 | | | Morgan Stanley & Co. International PLC | | | 03/18/20 | | | $ | 111,706 | |
| EUR | | | 631,000 | | | USD | | | 703,989 | | | Bank of America N.A. | | | 03/18/20 | | | | 7,128 | |
| EUR | | | 16,185,713 | | | USD | | | 18,038,977 | | | Deutsche Bank AG | | | 03/18/20 | | | | 201,807 | |
| | | | | | | | | | | | | | | | | | | | |
| | | Net unrealized appreciation | | | $ | 320,641 | |
| | | | | | | | | | | | | | | | | | | | |
Derivative Financial Instruments Categorized by Risk Exposure
As of period end, the fair values of derivative financial instruments located in the Statements of Assets and Liabilities were as follows:
| | | | | | | | | | | | | | | | | | | | | | | | | | | | |
| | | Commodity
Contracts | | | Credit
Contracts | | | Equity
Contracts | | | Foreign
Currency
Exchange
Contracts | | | Interest
Rate
Contracts | | | Other
Contracts | | | Total | |
Assets — Derivative Financial Instrument | | | | | | | | | | | | | | | | | | | | | | | | | | | | |
Futures contracts | | | | | | | | | | | | | | | | | | | | | | | | | | | | |
Unrealized appreciation on futures contracts(a) | | $ | — | | | $ | — | | | $ | 648,683 | | | $ | — | | | $ | 152,798 | | | $ | — | | | $ | 801,481 | |
Forward foreign currency exchange contracts | | | | | | | | | | | | | | | | | | | | | | | | | | | | |
Unrealized appreciation on forward foreign currency exchange contracts | | | — | | | | — | | | | — | | | | 320,641 | | | | — | | | | — | | | | 320,641 | |
| | | | | | | | | | | | | | | | | | | | | | | | | | | | |
| | $ | — | | | $ | — | | | $ | 648,683 | | | $ | 320,641 | | | $ | 152,798 | | | $ | — | | | $ | 1,122,122 | |
| | | | | | | | | | | | | | | | | �� | | | | | | | | | | | |
| | (a) | Net cumulative unrealized appreciation (depreciation) on futures contracts and centrally cleared swaps, if any, are reported in the Schedule of Investments. In the Statements of Assets and Liabilities, only current day’s variation margin is reported in receivables or payables and the net cumulative unrealized appreciation (depreciation) is included in accumulated earnings (loss). | |
For the year ended December 31, 2019, the effect of derivative financial instruments in the Statements of Operations was as follows:
| | | | | | | | | | | | | | | | | | | | | | | | | | | | |
| | | Commodity
Contracts | | | Credit
Contracts | | | Equity
Contracts | | | Foreign
Currency
Exchange
Contracts | | | Interest
Rate
Contracts | | | Other
Contracts | | | Total | |
Net Realized Gain (Loss) from: | | | | | | | | | | | | | | | | | | | | | | | | | | | | |
Futures contracts | | $ | — | | | $ | — | | | $ | 3,425,587 | | | $ | — | | | $ | 487,881 | | | $ | — | | | $ | 3,913,468 | |
Forward foreign currency exchange contracts | | | — | | | | — | | | | — | | | | (1,093,641 | ) | | | — | | | | — | | | | (1,093,641 | ) |
| | | | | | | | | | | | | | | | | | | | | | | | | | | | |
| | $ | — | | | $ | — | | | $ | 3,425,587 | | | $ | (1,093,641 | ) | | $ | 487,881 | | | $ | — | | | $ | 2,819,827 | |
| | | | | | | | | | | | | | | | | | | | | | | | | | | | |
| | | | | | | |
| Net Change in Unrealized Appreciation (Depreciation) on: | | | | | | | | | | | | | | | | | | | | | |
Futures contracts | | $ | — | | | $ | — | | | $ | 1,692,277 | | | $ | — | | | $ | (26,820 | ) | | $ | — | | | $ | 1,665,457 | |
Forward foreign currency exchange contracts | | | — | | | | — | | | | | | | | 658,514 | | | | — | | | | — | | | | 658,514 | |
| | | | | | | | | | | | | | | | | | | | | | | | | | | | |
| | $ | — | | | $ | — | | | $ | 1,692,277 | | | $ | 658,514 | | | $ | (26,820 | ) | | $ | — | | | $ | 2,323,971 | |
| | | | | | | | | | | | | | | | | | | | | | | | | | | | |
| | |
| 64 | | 2019 BLACKROCK ANNUAL REPORTTO SHAREHOLDERS |
| | |
Schedule of Investments (continued) December 31, 2019 | | LifePath Dynamic 2030 Master Portfolio |
Average Quarterly Balances of Outstanding Derivative Financial Instruments
| | | | |
Futures contracts: | |
Average notional value of contracts — long | | $ | 35,246,607 | |
Average notional value of contracts — short | | $ | 9,996,844 | |
Forward foreign currency exchange contracts: | |
Average USD amounts purchased | | $ | 8,074,860 | |
Average USD amounts sold | | $ | 30,442,292 | |
For more information about the LifePath Dynamic Master Portfolio’s Investment risks regarding derivative financial instruments, refer to the Notes to Financial Statements
Derivative Financial Instruments — Offsetting as of Period End
The Fund’s derivative assets and liabilities (by type) were as follows:
| | | | | | | | |
| | | Assets | | | Liabilities | |
Derivative Financial Instruments: | | | | | | | | |
Futures contracts | | $ | 110,190 | | | $ | 10,211 | |
Forward foreign currency exchange contracts | | | 320,641 | | | | — | |
| | | | | | | | |
Total derivative assets and liabilities in the Statements of Assets and Liabilities | | $ | 430,831 | | | $ | 10,211 | |
Derivatives not subject to a Master Netting Agreement or similar agreement (“MNA”) | | | (110,190 | ) | | | (10,211 | ) |
| | | | | | | | |
Total derivative assets and liabilities subject to an MNA | | $ | 320,641 | | | $ | — | |
| | | | | | | | |
The following table presents the LifePath Dynamic Master Portfolio‘s derivative assets by counterparty net of amounts available for offset under an MNA and net of the related collateral received by the LifePath Dynamic Master Portfolio:
| | | | | | | | | | | | | | | | | | | | |
| Counterparty | |
| Derivative
Assets
Subject to
an MNA by
Counterparty |
| |
| Derivatives
Available
for Offset |
| |
| Non-cash
Collateral
Received |
| |
| Cash
Collateral
Received |
| |
| Net Amount
of Derivative
Assets |
(a)(b) |
Bank of America N.A. | | $ | 7,128 | | | $ | — | | | $ | — | | | $ | — | | | $ | 7,128 | |
Deutsche Bank AG | | | 201,807 | | | | — | | | | — | | | | — | | | | 201,807 | |
Morgan Stanley & Co. International PLC | | | 111,706 | | | | — | | | | — | | | | — | | | | 111,706 | |
| | | | | | | | | | | | | | | | | | | | |
| | $ | 320,641 | | | $ | — | | | $ | — | | | $ | — | | | $ | 320,641 | |
| | | | | | | | | | | | | | | | | | | | |
| | (a) | Net amount represents the net amount receivable from the counterparty in the event of default. | |
| | (b) | Net amount may also include forward foreign currency exchange contracts that are not required to be collateralized. | |
Fair Value Hierarchy as of Period End
Various inputs are used in determining the fair value of investments and derivative financial instruments. For information about the LifePath Dynamic Master Portfolio’s policy regarding valuation of investments and derivative financial instruments, refer to the Notes to Financial Statements.
The following tables summarize the LifePath Dynamic Master Portfolio’s investments and derivative financial instruments categorized in the disclosure hierarchy:
| | | | | | | | | | | | | | | | |
| | | Level 1 | | | Level 2 | | | Level 3 | | | Total | |
Assets: | |
Investments: | |
Affiliated Investments Companies | | | | | | | | | | | | | | | | |
Equity Funds | | $ | 52,763,000 | | | $ | — | | | $ | — | | | $ | 52,763,000 | |
Fixed Income Funds | | | 21,537,823 | | | | — | | | | — | | | | 21,537,823 | |
Short-Term Securities | | | 26,897,847 | | | | — | | | | — | | | | 26,897,847 | |
| | | | | | | | | | | | | | | | |
Subtotal | | $ | 101,198,670 | | | $ | — | | | $ | — | | | $ | 101,198,670 | |
| | | | | | | | | | | | | | | | |
Investments Valued at NAV(a) | | | | | | | | | | | | | | | 249,351,170 | |
| | | | | | | | | | | | | | | | |
Total Investments | | | | | | | | | | | | | | $ | 350,549,840 | |
| | | | | | | | | | | | | | | | |
Derivative Financial Instruments(b) | |
Assets: | |
Equity contracts | | $ | 648,683 | | | $ | — | | | $ | — | | | $ | 648,683 | |
Forward foreign currency contracts | | | — | | | | 320,641 | | | | — | | | | 320,641 | |
Interest rate contracts | | | 152,798 | | | | — | | | | — | | | | 152,798 | |
| | | | | | | | | | | | | | | | |
| | $ | 801,481 | | | $ | 320,641 | | | $ | — | | | $ | 1,122,122 | |
| | | | | | | | | | | | | | | | |
| | (a) | Certain investments of the LifePath Dynamic Master Portfolio were fair valued using NAV per share or its equivalent as no quoted market value is available and therefore and have been excluded from the fair value hierarchy. | |
| | (b) | Derivative financial instruments are futures contracts and forward foreign currency exchange contracts. Futures contracts and forward foreign currency exchange contracts are valued at the unrealized appreciation (depreciation) on the instrument. | |
See notes to financial statements.
| | | | |
| SCHEDULES OF INVESTMENTS | | | 65 | |
| | |
Schedule of Investments December 31, 2019 | | LifePath Dynamic 2040 Master Portfolio (Percentages shown are based on Net Assets) |
| | | | | | | | |
| Security | | Shares/ Investment
Value | | | Value | |
|
Affiliated Investment Companies(d) — 100.8% | |
|
| Equity Funds — 81.9% | |
Active Stock Master Portfolio | | $ | 136,236,751 | | | $ | 136,236,751 | |
BlackRock Advantage Emerging Markets Fund — Class K | | | 2,388,194 | | | | 26,055,202 | |
BlackRock Tactical Opportunities Fund — Class K | | | 652,282 | | | | 8,760,150 | |
International Tilts Master Portfolio | | $ | 43,485,982 | | | | 43,485,982 | |
iShares Developed Real Estate Index Fund — Class K | | | 1,110,007 | | | | 12,187,882 | |
iShares MSCI EAFESmall-Cap ETF(a) | | | 166,112 | | | | 10,345,455 | |
| | | | | | | | |
| | | | 237,071,422 | |
|
| Fixed Income Funds — 10.9% | |
CoreAlpha Bond Master Portfolio | | $ | 18,948,856 | | | | 18,948,856 | |
iShares TIPS Bond ETF | | | 76,765 | | | | 8,948,496 | |
Master Total Return Portfolio | | $ | 3,560,921 | | | | 3,560,921 | |
| | | | | | | | |
| | | | 31,458,273 | |
| | | | | | | | |
| Security | |
Shares | | | Value | |
|
| Short-Term Securities — 8.0% | |
BlackRock Cash Funds: Institutional,
SL Agency Shares, | | | | | | | | |
1.87%(b)(c) | | | 3,670,132 | | | $ | 3,671,600 | |
BlackRock Cash Funds: Treasury,
SL Agency Shares, | | | | | | | | |
1.55%(c) | | | 19,567,093 | | | | 19,567,093 | |
| | | | | | | | |
| | | | 23,238,693 | |
| | | | | |
| |
Total Affiliated Investment Companies — 100.8%
(Cost — $248,170,295) | | | | 291,768,388 | |
| |
Liabilities in Excess of Other Assets — (0.8)% | | | | (2,278,385 | ) |
| | | | | | | | |
| |
Net Assets — 100.0% | | | $ | 289,490,003 | |
| | | | | | | | |
| (a) | Security, or a portion of the security, is on loan. |
| (b) | Security was purchased with the cash collateral from loaned securities. |
| (c) | Annualized7-day yield as of period end. |
| (d) | During the year ended December 31, 2019, investments in issuers considered to be an affiliate/affiliates of the LifePath Dynamic Master Portfolio for purposes of Section 2(a)(3) of the Investment Company Act of 1940, as amended, and/or related parties of the LifePath Dynamic Master Portfolio were as follows: |
| | | | | | | | | | | | | | | | | | | | | | | | | | | | | | | | |
| Affiliated Persons and/or Related Parties | | Shares/ Investment
Value Held at
12/31/18 | | | Shares/ Investment
Value
Purchased | | | Shares/ Investment
Value Sold | | | Shares/ Investment
Value Held at
12/31/19 | | | Value at
12/31/19 | | | Income | | | Net
Realized
Gain (Loss) (a) | | | Change in
Unrealized
Appreciation
(Depreciation) | |
Active Stock Master Portfolio | | $ | 113,277,653 | | | $ | 22,959,098 | (b) | | $ | — | | | $ | 136,236,751 | | | $ | 136,236,751 | | | $ | 2,245,908 | | | $ | 11,752,906 | | | $ | 17,335,596 | |
BlackRock Advantage Emerging Markets Fund — Class K | | | 1,896,578 | | | | 864,439 | | | | (372,823 | ) | | | 2,388,194 | | | | 26,055,202 | | | | 585,782 | | | | (230,840 | ) | | | 3,304,943 | |
BlackRock Cash Funds: Institutional,
SL Agency Shares | | | 8,282,344 | | | | — | | | | (4,612,212 | )(b) | | | 3,670,132 | | | | 3,671,600 | | | | 20,633 | (c) | | | 3,500 | | | | — | |
BlackRock Cash Funds: Treasury,
SL Agency Shares | | | 4,091,592 | | | | 15,475,501 | (b) | | | — | | | | 19,567,093 | | | | 19,567,093 | | | | 231,344 | | | | — | | | | — | |
BlackRock Tactical Opportunities Fund — Class K | | | 607,477 | | | | 102,176 | | | | (57,371 | ) | | | 652,282 | | | | 8,760,150 | | | | 283,911 | | | | 10,495 | | | | (133,172 | ) |
CoreAlpha Bond Master Portfolio | | $ | 16,279,448 | | | $ | 2,669,408 | (b) | | $ | — | | | $ | 18,948,856 | | | | 18,948,856 | | | | 512,303 | | | | 504,094 | | | | (808,319 | ) |
International Tilts Master Portfolio | | $ | 34,811,321 | | | $ | 8,674,661 | (b) | | $ | — | | | $ | 43,485,982 | | | | 43,485,982 | | | | 1,240,879 | | | | 1,113,602 | | | | 9,928,925 | |
iShares Developed Real Estate Index Fund — Class K | | | — | | | | 1,719,542 | | | | (609,535 | ) | | | 1,110,007 | | | | 12,187,882 | | | | 527,310 | | | | (7,989 | ) | | | (255,271 | ) |
iShares Edge MSCI Multifactor International ETF(d) | | | 287,336 | | | | — | | | | (287,336 | ) | | | — | | | | — | | | | 117,002 | | | | 748,905 | | | | (187,855 | ) |
iShares Edge MSCI Multifactor USA ETF(d) | | | 242,674 | | | | 7,861 | | | | (250,535 | ) | | | — | | | | — | | | | 71,763 | | | | 1,402,501 | | | | (396,162 | ) |
iShares MSCI EAFESmall-Cap ETF | | | 141,321 | | | | 32,904 | | | | (8,113 | ) | | | 166,112 | | | | 10,345,455 | | | | 340,639 | | | | (34,777 | ) | | | 1,642,926 | |
iShares TIPS Bond ETF | | | 32,193 | | | | 51,569 | | | | (6,997 | ) | | | 76,765 | | | | 8,948,496 | | | | 111,572 | | | | 9,903 | | | | 279,136 | |
Master Total Return Portfolio | | $ | 2,502,333 | | | $ | 1,058,588 | (b) | | $ | — | | | $ | 3,560,921 | | | | 3,560,921 | | | | 132,128 | | | | 87,212 | | | | 17,994 | |
| | | | | | | | | | | | | | | | | | | | | | | | | | | | | | | | |
| | | | | | | | | | | $ | 291,768, 388 | | | $ | 6,421,174 | | | $ | 15,359,512 | | | $ | 30,728,741 | |
| | | | | | | | | | | | | | | | | | | | | | | | | | | | | | | | |
| | (a) | Includes net capital gain distributions, if applicable. | |
| | (b) | Represents net of shares/investment value purchased (sold). | |
| | (c) | All or a portion represents securities lending income earned from the reinvestment of cash collateral from loaned securities, net of fees and collateral investment expenses, and other payments to and from borrowers of securities. | |
| | (d) | As of period end, the entity is no longer held by the LifePath Dynamic Master Portfolio. | |
| | |
| 66 | | 2019 BLACKROCK ANNUAL REPORTTO SHAREHOLDERS |
| | |
Schedule of Investments (continued) December 31, 2019 | | LifePath Dynamic 2040 Master Portfolio |
Derivative Financial Instruments Outstanding as of Period End
Futures Contracts
| | | | | | | | | | | | | | | | |
| Description | | Number of
Contracts | | | Expiration
Date | | | Notional
Amount (000) | | | Value/
Unrealized
Appreciation
(Depreciation) | |
Long Contracts | | | | | | | | | | | | | | | | |
S&P/TSX 60 Index | | | 53 | | | | 03/19/20 | | | $ | 8,264 | | | $ | 39,623 | |
E-Mini MSCI EAFE Index | | | 137 | | | | 03/20/20 | | | | 13,950 | | | | 352,487 | |
Russell 2000E-Mini Index | | | 77 | | | | 03/20/20 | | | | 6,432 | | | | 132,314 | |
S&P 500E-Mini Index | | | 14 | | | | 03/20/20 | | | | 2,262 | | | | 64,662 | |
| | | | | | | | | | | | | | | | |
| | | | 589,086 | |
| | | | | | | | | | | | | | | | |
Short Contracts | | | | | | | | | | | | | | | | |
10-Year U.S. Treasury Note | | | 66 | | | | 03/20/20 | | | | 8,476 | | | | 72,279 | |
U.S. Treasury Ultra Bond | | | 16 | | | | 03/20/20 | | | | 2,907 | | | | 93,473 | |
| | | | | | | | | | | | | | | | |
| | | | | | | | | | | | | | | 165,752 | |
| | | | | | | | | | | | | | | | |
| | | | | | | | | | | | | | $ | 754,838 | |
| | | | | | | | | | | | | | | | |
Forward Foreign Currency Exchange Contracts
| | | | | | | | | | | | | | | | | | | | |
Currency
Purchased | | | Currency
Sold | | | Counterparty | | Settlement Date | | | Unrealized
Appreciation
(Depreciation) | |
| CAD | | | 8,015,278 | | | USD | | | 6,046,724 | | | Morgan Stanley & Co. International PLC | | | 03/18/20 | | | $ | 127,409 | |
| EUR | | | 224,589 | | | USD | | | 250,313 | | | Bank of America N.A. | | | 03/18/20 | | | | 2,791 | |
| EUR | | | 770,000 | | | USD | | | 859,067 | | | Bank of America N.A. | | | 03/18/20 | | | | 8,698 | |
| EUR | | | 12,885,730 | | | USD | | | 14,360,760 | | | Bank of America N.A. | | | 03/18/20 | | | | 161,049 | |
| | | | | | | | | | | | | | | | | | | | |
| | | Net unrealized appreciation | | | $ | 299,947 | |
| | | | | | | | | | | | | | | | | | | | |
Derivative Financial Instruments Categorized by Risk Exposure
As of period end, the fair values of derivative financial instruments located in the Statements of Assets and Liabilities were as follows:
| | | | | | | | | | | | | | | | | | | | | | | | | | | | |
| | | Commodity
Contracts | | | Credit Contracts | | | Equity
Contracts | | | Foreign
Currency
Exchange
Contracts | | | Interest
Rate
Contracts | | | Other Contracts | | | Total | |
Assets — Derivative Financial Instruments | | | | | | | | | | | | | | | | | | | | | | | | | | | | |
Futures contracts | | | | | | | | | | | | | | | | | | | | | | | | | | | | |
Unrealized appreciation on futures contracts(a) | | $ | — | | | $ | — | | | $ | 589,086 | | | $ | — | | | $ | 165,752 | | | $ | — | | | $ | 754,838 | |
Forward foreign currency exchange contracts | |
Unrealized appreciation on forward foreign currency exchange contracts | | | — | | | | — | | | | — | | | | 299,947 | | | | — | | | | — | | | | 299,947 | |
| | | | | | | | | | | | | | | | | | | | | | | | | | | | |
| | $ | — | | | $ | — | | | $ | 589,086 | | | $ | 299,947 | | | $ | 165,752 | | | $ | — | | | $ | 1,054,785 | |
| | | | | | | | | | | | | | | | | | | | | | | | | | | | |
| | (a) | Net cumulative unrealized appreciation (depreciation) on futures contracts and centrally cleared swaps, if any, are reported in the Schedule of Investments. In the Statements of Assets and Liabilities, only current day’s variation margin is reported in receivables or payables and the net cumulative unrealized appreciation (depreciation) is included in accumulated earnings (loss). | |
For the year ended December 31, 2019, the effect of derivative financial instruments in the Statements of Operations was as follows:
| | | | | | | | | | | | | | | | | | | | | | | | | | | | |
| | | Commodity
Contracts | | | Credit
Contracts | | | Equity
Contracts | | | Foreign
Currency
Exchange
Contracts | | | Interest
Rate
Contracts | | | Other Contracts | | | Total | |
Net Realized Gain (Loss) from: | | | | | | | | | | | | | | | | | | | | | | | | | | | | |
Futures contracts | | $ | — | | | $ | — | | | $ | 3,100,333 | | | $ | — | | | $ | 370,686 | | | $ | — | | | $ | 3,471,019 | |
Forward foreign currency exchange contracts | | | — | | | | — | | | | — | | | | (911,714 | ) | | | — | | | | — | | | | (911,714 | ) |
| | | | | | | | | | | | | | | | | | | | | | | | | | | | |
| | $ | — | | | $ | — | | | $ | 3,100,333 | | | $ | (911,714 | ) | | $ | 370,686 | | | $ | — | | | $ | 2,559,305 | |
| | | | | | | | | | | | | | | | | | | | | | | | | | | | |
Net Change in Unrealized Appreciation (Depreciation) on: | | | | | | | | | | | | | | | | | | | | | | | | | | | | |
Futures contracts | | $ | — | | | $ | — | | | $ | 1,415,759 | | | $ | — | | | $ | (2,462 | ) | | $ | — | | | $ | 1,413,297 | |
Forward foreign currency exchange contracts | | | — | | | | — | | | | — | | | | 604,664 | | | | — | | | | — | | | | 604,664 | |
| | | | | | | | | | | | | | | | | | | | | | | | | | | | |
| | $ | — | | | $ | — | | | $ | 1,415,759 | | | $ | 604,664 | | | $ | (2,462 | ) | | $ | — | | | $ | 2,017,961 | |
| | | | | | | | | | | | | | | | | | | | | | | | | | | | |
| | | | |
| SCHEDULES OF INVESTMENTS | | | 67 | |
| | |
Schedule of Investments (continued) December 31, 2019 | | LifePath Dynamic 2040 Master Portfolio |
Average Quarterly Balances of Outstanding Derivative Financial Instruments
| | | | |
Futures contracts: | |
Average notional value of contracts — long | | $ | 33,750,027 | |
Average notional value of contracts — short | | $ | 11,741,188 | |
Forward foreign currency exchange contracts: | |
Average amounts purchased — in USD | | $ | 9,034,346 | |
Average amounts sold — in USD | | $ | 27,861,476 | |
For more information about the LifePath Dynamic Master Portfolio’s investment risks regarding derivative financial instruments, refer to the Notes to Financial Statements.
Derivative Financial Instruments — Offsetting as of Period End
The Fund’s derivative assets and liabilities (by type) were as follows:
| | | | | | | | |
| | | Assets | | | Liabilities | |
Derivative Financial Instruments: | | | | | | | | |
Futures contracts | | $ | 105,841 | | | $ | 13,834 | |
Forward foreign currency exchange contracts | | | 299,947 | | | | — | |
| | | | | | | | |
Total derivative assets and liabilities in the Statements of Assets and Liabilities | | $ | 405,788 | | | $ | 13,834 | |
Derivatives not subject to a Master Netting Agreement or similar agreement (“MNA”) | | | (105,841 | ) | | | (13,834 | ) |
| | | | | | | | |
Total derivative assets and liabilities subject to an MNA | | $ | 299,947 | | | $ | — | |
| | | | | | | | |
The following table presents the LifePath Dynamic Master Portfolio’s derivative assets by counterparty net of amounts available for offset under an MNA and net of the related collateral received by the LifePath Dynamic Master Portfolio:
| | | | | | | | | | | | | | | | | | | | |
| Counterparty | | Derivative
Assets
Subject to
an MNA by Counterparty | | | Derivatives
Available
for Offset | | | Non-cash
Collateral
Received | | | Cash
Collateral
Received | | | Net Amount
of Derivative
Assets (a)(b) | |
Bank of America N.A. | | $ | 172,538 | | | $ | — | | | $ | — | | | $ | — | | | $ | 172,538 | |
Morgan Stanley & Co. International PLC | | | 127,409 | | | | — | | | | — | | | | — | | | | 127,409 | |
| | | | | | | | | | | | | | | | | | | | |
| | $ | 299,947 | | | $ | — | | | $ | — | | | $ | — | | | $ | 299,947 | |
| | | | | | | | | | | | | | | | | | | | |
| | (a) | Net amount represents the net amount receivable from the counterparty in the event of default. | |
| | (b) | Net amount may also include forward foreign currency exchange contracts that are not required to be collateralized. | |
Fair Value Hierarchy as of Period End
Various inputs are used in determining the fair value of investments and derivative financial instruments. For information about the LifePath Dynamic Master Portfolio’s policy regarding valuation of investments and derivative financial instruments, refer to the Notes to Financial Statements.
The following tables summarize the LifePath Dynamic Master Portfolio’s investments and derivative financial instruments categorized in the disclosure hierarchy:
| | | | | | | | | | | | | | | | |
| | | Level 1 | | | Level 2 | | | Level 3 | | | Total | |
Assets: | |
Investments: | |
Affiliated Investment Companies | | | | | | | | | | | | | | | | |
Equity Funds | | $ | 57,348,689 | | | $ | — | | | $ | — | | | $ | 57,348,689 | |
Fixed Income Funds | | | 8,948,496 | | | | — | | | | — | | | | 8,948,496 | |
Short-Term Securities | | | 23,238,693 | | | | — | | | | — | | | | 23,238,693 | |
| | | | | | | | | | | | | | | | |
Subtotal | | $ | 89,535,878 | | | $ | — | | | $ | — | | | $ | 89,535,878 | |
| | | | | | | | | | | | | | | | |
Investments Valued at NAV(a) | | | | | | | | | | | | | | | 202,232,510 | |
| | | | | | | | | | | | | | | | |
Total Investments | | | | | | | | | | | | | | $ | 291,768,388 | |
| | | | | | | | | | | | | | | | |
Derivative Financial Instruments(b) | |
Assets: | |
Forward foreign currency contracts | | $ | — | | | $ | 299,947 | | | $ | — | | | $ | 299,947 | |
Interest rate contracts | | | 165,752 | | | | — | | | | — | | | | 165,752 | |
Equity contracts | | | 589,086 | | | | — | | | | — | | | | 589,086 | |
| | | | | | | | | | | | | | | | |
| | $ | 754,838 | | | $ | 299,947 | | | $ | — | | | $ | 1,054,785 | |
| | | | | | | | | | | | | | | | |
| | (a) | Certain investments of the LifePath Dynamic Master Portfolio were fair valued using NAV per share or its equivalent as no quoted market value is available and therefore have been excluded from the fair value hierarchy. | |
| | (b) | Derivative financial instruments are futures contracts and forward foreign currency exchange contracts. Futures contracts and forward foreign currency exchange contracts are valued at the unrealized appreciation (depreciation) on the instrument. | |
See notes to financial statements.
| | |
| 68 | | 2019 BLACKROCK ANNUAL REPORTTO SHAREHOLDERS |
| | |
Schedule of Investments December 31, 2019 | | LifePath Dynamic 2050 Master Portfolio (Percentages shown are based on Net Assets) |
| | | | | | | | |
| Security | | Shares/ Investment Value | | | Value | |
|
Affiliated Investment Companies(d) — 102.3% | |
|
| Equity Funds — 89.3% | |
Active Stock Master Portfolio | | $ | 59,597,236 | | | $ | 59,597,236 | |
BlackRock Advantage Emerging Markets Fund — Class K | | | 1,068,663 | | | | 11,659,112 | |
International Tilts Master Portfolio | | $ | 20,296,393 | | | | 20,296,393 | |
iShares Developed Real Estate Index Fund — Class K | | | 494,249 | | | | 5,426,849 | |
iShares MSCI EAFESmall-Cap ETF(a) | | | 74,791 | | | | 4,657,983 | |
| | | | | | | | |
| | | | 101,637,573 | |
|
| Fixed Income Funds — 1.1% | |
CoreAlpha Bond Master Portfolio | | $ | 882,431 | | | | 882,431 | |
iShares TIPS Bond ETF | | | 3,279 | | | | 382,233 | |
Master Total Return Portfolio | | $ | 10 | | | | 133 | |
| | | | | | | | |
| | | | 1,264,797 | |
| | | | | | | | |
| Security | |
Shares | | | Value | |
|
| Short-Term Securities — 11.9% | |
BlackRock Cash Funds: Institutional,
SL Agency Shares, | |
1.87%(b)(c) | | | 2,902,014 | | | $ | 2,903,175 | |
BlackRock Cash Funds: Treasury,
SL Agency Shares, | | | | | | | | |
1.55%(c) | | | 10,682,760 | | | | 10,682,760 | |
| | | | | | | | |
| | | | 13,585,935 | |
| | | | | |
| |
Total Affiliated Investment Companies — 102.3%
(Cost — $90,671,865) | | | | 116,488,305 | |
| |
Liabilities in Excess of Other Assets — (2.3)% | | | | (2,654,797 | ) |
| | | | | |
| |
Net Assets — 100.0% | | | $ | 113,833,508 | |
| | | | | |
| (a) | Security, or a portion of the security, is on loan. |
| (b) | Security was purchased with the cash collateral from loaned securities. |
| (c) | Annualized7-day yield as of period end. |
| (d) | During the year ended December 31, 2019, investments in issuers considered to be an affiliate/affiliates of the LifePath Dynamic Master Portfolio for purposes of Section 2(a)(3) of the Investment Company Act of 1940, as amended, and/or related parties of the LifePath Dynamic Master Portfolio were as follows: |
| | | | | | | | | | | | | | | | | | | | | | | | | | | | | | | | |
| Affiliated Persons and/or Related Parties | | Shares/ Investment Value Held at 12/31/18 | | | Shares/ Investment Value Purchased | | | Shares/
Investment
Value Sold | | | Shares/ Investment Value Held at 12/31/19 | | | Value at
12/31/19 | | | Income | | | Net
Realized
Gain (Loss) (a) | | | Change in
Unrealized
Appreciation
(Depreciation) | |
Active Stock Master Portfolio | | $ | 42,401,895 | | | $ | 17,195,341 | (b) | | $ | — | | | $ | 59,597,236 | | | $ | 59,597,236 | | | $ | 915,997 | | | $ | 4,294,520 | | | $ | 7,202,786 | |
BlackRock Advantage Emerging Markets Fund — Class K | | | 780,716 | | | | 458,648 | | | | (170,701 | ) | | | 1,068,663 | | | | 11,659,112 | | | | 260,485 | | | | (86,370 | ) | | | 1,442,742 | |
BlackRock Cash Funds: Institutional,
SL Agency Shares | | | 2,695,486 | | | | 206,528 | (b) | | | — | | | | 2,902,014 | | | | 2,903,175 | | | | 10,127 | (c) | | | 1,133 | | | | — | |
BlackRock Cash Funds: Treasury,
SL Agency Shares | | | 576,483 | | | | 10,106,277 | (b) | | | — | | | | 10,682,760 | | | | 10,682,760 | | | | 119,810 | | | | — | | | | — | |
CoreAlpha Bond Master Portfolio | | $ | 1,274,579 | | | $ | — | | | $ | (392,148 | )(b) | | $ | 882,431 | | | | 882,431 | | | | 36,969 | | | | 40,665 | | | | (79,699 | ) |
International Tilts Master Portfolio | | $ | 14,660,636 | | | $ | 5,635,757 | (b) | | $ | — | | | $ | 20,296,393 | | | | 20,296,393 | | | | 544,318 | | | | 529,626 | | | | 4,066,673 | |
iShares Developed Real Estate Index Fund — Class K | | | — | | | | 767,477 | | | | (273,228 | ) | | | 494,249 | | | | 5,426,849 | | | | 235,195 | | | | (540 | ) | | | (113,832 | ) |
iShares Edge MSCI Multifactor International ETF(d) | | | 122,251 | | | | 1,146 | | | | (123,397 | ) | | | — | | | | — | | | | 65,356 | | | | 329,556 | | | | (98,647 | ) |
iShares Edge MSCI Multifactor USA ETF(d) | | | 127,245 | | | | 374 | | | | (127,619 | ) | | | — | | | | — | | | | 43,921 | | | | 737,511 | | | | (214,998 | ) |
iShares MSCI EAFESmall-Cap ETF | | | 49,839 | | | | 27,395 | | | | (2,443 | ) | | | 74,791 | | | | 4,657,983 | | | | 148,813 | | | | (6,827 | ) | | | 670,044 | |
iShares TIPS Bond ETF | | | — | | | | 3,279 | | | | — | | | | 3,279 | | | | 382,233 | | | | 3,825 | | | | — | | | | 3,935 | |
Master Total Return Portfolio | | $ | — | | | $ | 10 | (b) | | $ | — | | | $ | 10 | | | | 133 | | | | 1 | | | | — | | | | — | |
| | | | | | | | | | | | | | | | | | | | | | | | | | | | | | | | |
| | | $ | 116,488,305 | | | $ | 2,384,817 | | | $ | 5,839,274 | | | $ | 12,879,004 | |
| | | | | | | | | | | | | | | | | |
| | (a) | Includes net capital gain distributions, if applicable. | |
| | (b) | Represents net of shares/investment value purchased (sold). | |
| | (c) | All or a portion represents securities lending income earned from the reinvestment of cash collateral from loaned securities, net of fees and collateral investment expenses, and other payments to and from borrowers of securities. | |
| | (d) | As of period end, the entity is no longer held by the LifePath Dynamic Master Portfolio. | |
| | | | |
| SCHEDULES OF INVESTMENTS | | | 69 | |
| | |
Schedule of Investments (continued) December 31, 2019 | | LifePath Dynamic 2050 Master Portfolio |
Derivative Financial Instruments Outstanding as of Period End
Futures Contracts
| | | | | | | | | | | | | | | | |
| Description | | Number of
Contracts | | | Expiration
Date | | | Notional
Amount (000) | | | Value/
Unrealized
Appreciation
(Depreciation) | |
Long Contracts | | | | | | | | | | | | | | | | |
S&P/TSX 60 Index | | | 20 | | | | 03/19/20 | | | $ | 3,119 | | | $ | 14,952 | |
10-Year U.S. Treasury Note | | | 1 | | | | 03/20/20 | | | | 128 | | | | (1,054 | ) |
E-Mini MSCI EAFE Index | | | 58 | | | | 03/20/20 | | | | 5,906 | | | | 146,412 | |
Russell 2000E-Mini Index | | | 27 | | | | 03/20/20 | | | | 2,255 | | | | 46,396 | |
| | | | | | | | | | | | | | | | |
| | | | | | | | | | | | | | $ | 206,706 | |
| | | | | | | | | | | | | | | | |
Forward Foreign Currency Exchange Contracts
| | | | | | | | | | | | | | | | | | | | |
Currency
Purchased | | | Currency
Sold | | | Counterparty | | Settlement Date | | | Unrealized
Appreciation
(Depreciation) | |
| CAD | | | 3,979,020 | | | USD | | | 3,001,799 | | | Morgan Stanley & Co. International PLC | | | 03/18/20 | | | $ | 63,222 | |
| EUR | | | 145,003 | | | USD | | | 161,601 | | | Bank of America N.A. | | | 03/18/20 | | | | 1,812 | |
| EUR | | | 350,000 | | | USD | | | 390,485 | | | Bank of America N.A. | | | 03/18/20 | | | | 3,954 | |
| EUR | | | 4,981,172 | | | USD | | | 5,551,715 | | | Bank of America N.A. | | | 03/18/20 | | | | 61,907 | |
| | | | | | | | | | | | | | | | | | | | |
| | | Net unrealized appreciation | | | $ | 130,895 | |
| | | | | |
Derivative Financial Instruments Categorized by Risk Exposure
As of period end, the fair values of derivative financial instruments located in the Statements of Assets and Liabilities were as follows:
| | | | | | | | | | | | | | | | | | | | | | | | | | | | |
| | | Commodity
Contracts | | | Credit
Contracts | | | Equity
Contracts | | | Foreign
Currency
Exchange
Contracts | | | Interest
Rate
Contracts | | | Other Contracts | | | Total | |
Assets — Derivative Financial Instruments | | | | | | | | | | | | | | | | | | | | | | | | | | | | |
Futures contracts | | | | | | | | | | | | | | | | | | | | | | | | | | | | |
Unrealized appreciation on future contracts(a) | | $ | — | | | $ | — | | | $ | 207,760 | | | $ | — | | | $ | — | | | $ | — | | | $ | 207,760 | |
Forward foreign currency exchange contracts | |
Unrealized appreciation on forward foreign currency exchange contracts | | | — | | | | — | | | | — | | | | 130,895 | | | | — | | | | — | | | | 130,895 | |
| | | | | | | | | | | | | | | | | | | | | | | | | | | | |
| | $ | — | | | $ | — | | | $ | 207,760 | | | $ | 130,895 | | | $ | — | | | $ | — | | | $ | 338,655 | |
| | | | | | | | | | | | | | | | | | | | | | | | | | | | |
Liabilities — Derivative Financial Instruments | | | | | | | | | | | | | | | | | | | | | | | | | | | | |
Futures contracts | | | | | | | | | | | | | | | | | | | | | | | | | | | | |
Unrealized depreciation on future contracts(a) | | $ | — | | | $ | — | | | $ | — | | | $ | — | | | $ | 1,054 | | | $ | — | | | $ | 1,054 | |
| | | | | | | | | | | | | | | | | | | | | | | | | | | | |
| | (a) | Net cumulative unrealized appreciation (depreciation) on futures contracts and centrally cleared swaps, if any, are reported in the Schedule of Investments. In the Statements of Assets and Liabilities, only current day’s variation margin is reported in receivables or payables and the net cumulative unrealized appreciation (depreciation) is included in accumulated earnings (loss). | |
For the year ended December 31, 2019, the effect of derivative financial instruments in the Statements of Operations was as follows:
| | | | | | | | | | | | | | | | | | | | | | | | | | | | |
| | | Commodity
Contracts | | | Credit
Contracts | | | Equity
Contracts | | | Foreign
Currency
Exchange
Contracts | | | Interest
Rate
Contracts | | | Other Contracts | | | Total | |
Net Realized Gain (Loss) from: | | | | | | | | | | | | | | | | | | | | | | | | | | | | |
Futures contracts | | $ | — | | | $ | — | | | $ | 681,542 | | | $ | — | | | $ | (904 | ) | | $ | — | | | $ | 680,638 | |
Forward foreign currency exchange contracts | | | — | | | | — | | | | — | | | | (333,486 | ) | | | — | | | | — | | | | (333,486 | ) |
| | | | | | | | | | | | | | | | | | | | | | | | | | | | |
| | $ | — | | | $ | — | | | $ | 681,542 | | | $ | (333,486 | ) | | $ | (904 | ) | | $ | — | | | $ | 347,152 | |
| | | | | | | | | | | | | | | | | | | | | | | | | | | | |
Net Change in Unrealized Appreciation (Depreciation) on: | | | | | | | | | | | | | | | | | | | | | | | | | | | | |
Futures contracts | | $ | — | | | $ | — | | | $ | 254,658 | | | $ | — | | | $ | (1054 | ) | | $ | — | | | $ | 253,604 | |
Forward foreign currency exchange contracts | | | — | | | | — | | | | — | | | | 247,280 | | | | — | | | | — | | | | 247,280 | |
| | | | | | | | | | | | | | | | | | | | | | | | | | | | |
| | $ | — | | | $ | — | | | $ | 254,658 | | | $ | 247,280 | | | $ | (1054 | ) | | $ | — | | | $ | 500,884 | |
| | | | | | | | | | | | | | | | | | | | | | | | | | | | |
| | |
| 70 | | 2019 BLACKROCK ANNUAL REPORTTO SHAREHOLDERS |
| | |
Schedule of Investments (continued) December 31, 2019 | | LifePath Dynamic 2050 Master Portfolio |
Average Quarterly Balances of Outstanding Derivative Financial Instruments
| | | | |
Futures contracts: | | | | |
Average notional value of contracts — long | | $ | 8,623,154 | |
Average notional value of contracts — short | | $ | 106,418 | |
Forward foreign currency exchange contracts: | | | | |
Average amounts purchased — in USD | | $ | 3,646,349 | |
Average amounts sold — in USD | | $ | 11,052,887 | |
For more information about the LifePath Dynamic Master Portfolio’s investment risks regarding derivative financial instruments, refer to the Notes to Financial Statements.
Derivative Financial Instruments — Offsetting as of Period End
The Fund’s derivative assets and liabilities (by type) were as follows:
| | | | | | | | |
| | | Assets | | | Liabilities | |
Derivative Financial Instruments: | | | | | | | | |
Futures contracts | | $ | 30,489 | | | $ | 5,348 | |
Forward foreign currency exchange contracts | | | 130,895 | | | | — | |
| | | | | | | | |
Total derivative assets and liabilities in the Statements of Assets and Liabilities | | $ | 161,384 | | | $ | 5,348 | |
Derivatives not subject to a Master Netting Agreement or similar agreement (“MNA”) | | | (30,489 | ) | | | (5,348 | ) |
| | | | | | | | |
Total derivative assets and liabilities subject to an MNA | | $ | 130,895 | | | $ | — | |
| | | | | | | | |
The following table presents the LifePath Dynamic Master Portfolio’s derivative assets by counterparty net of amounts available for offset under a MNA and net of the related collateral received by the LifePath Dynamic Master Portfolio:
| | | | | | | | | | | | | | | | | | | | |
| Counterparty | | Derivative Assets
Subject to an MNA by
Counterparty | | | Derivatives
Available for Offset | | | Non-cash Collateral
Received | | | Cash Collateral
Received | | | Net Amount
of Derivative
Assets (a)(b) | |
Bank of America N.A. | | $ | 67,673 | | | $ | — | | | $ | — | | | $ | — | | | $ | 67,673 | |
Morgan Stanley & Co. International PLC | | | 63,222 | | | | — | | | | — | | | | — | | | | 63,222 | |
| | | | | | | | | | | | | | | | | | | | |
| | $ | 130,895 | | | $ | — | | | $ | — | | | $ | — | | | $ | 130,895 | |
| | | | | | | | | | | | | | | | | | | | |
| | (a) | Net amount represents the net amount receivable from the counterparty in the event of default. | |
| | (b) | Net amount may also include forward foreign currency exchange contracts that are not required to be collateralized. | |
Fair Value Hierarchy as of Period End
Various inputs are used in determining the fair value of investments and derivative financial instruments. For information about the LifePath Dynamic Master Portfolio’s policy regarding valuation of investments and derivative financial instruments, refer to the Notes to Financial Statements.
The following tables summarize the LifePath Dynamic Master Portfolio’s investments and derivative financial instruments categorized in the disclosure hierarchy:
| | | | | | | | | | | | | | | | |
| | | Level 1 | | | Level 2 | | | Level 3 | | | Total | |
Assets: | |
Investments: | |
Affiliated Investment Companies | | | | | | | | | | | | | | | | |
Equity Funds | | $ | 21,743,944 | | | $ | — | | | $ | — | | | $ | 21,743,944 | |
Fixed Income Funds | | | 382,233 | | | | — | | | | — | | | | 382,233 | |
Short-Term Securities | | | 13,585,935 | | | | — | | | | — | | | | 13,585,935 | |
| | | | | | | | | | | | | | | | |
Subtotal | | $ | 35,712,112 | | | $ | — | | | $ | — | | | $ | 35,712,112 | |
| | | | | | | | | | | | | | | | |
Investments Valued at NAV(a) | | | | | | | | | | | | | | | 80,776,193 | |
| | | | | | | | | | | | | | | | |
Total Investments | | | | | | | | | | | | | | $ | 116,488,305 | |
| | | | | | | | | | | | | | | | |
Derivative Financial Instruments(b) | |
Assets: | |
Forward foreign currency contracts | | $ | — | | | $ | 130,895 | | | $ | — | | | $ | 130,895 | |
Interest rate contracts | | | 207,760 | | | | — | | | | — | | | | 207,760 | |
Liabilities: | | | | | | | | | | | | | |
Interest rate contracts | | | (1,054 | ) | | | — | | | | — | | | | (1,054 | ) |
| | | | | | | | | | | | | | | | |
| | $ | 206,706 | | | $ | 130,895 | | | $ | — | | | $ | 337,601 | |
| | | | | | | | | | | | | | | | |
| | (a) | Certain investments of the LifePath Dynamic Master Portfolio were fair valued using NAV per share or its equivalent as no quoted market value is available and therefore have been excluded from the fair value hierarchy. | |
| | (b) | Derivative financial instruments are futures contracts and forward foreign currency exchange contracts. Futures contracts and forward foreign currency exchange contracts are valued at the unrealized appreciation (depreciation) on the instrument. | |
See notes to financial statements.
| | | | |
| SCHEDULES OF INVESTMENTS | | | 71 | |
| | |
Schedule of Investments December 31, 2019 | | LifePath Dynamic 2060 Master Portfolio (Percentages shown are based on Net Assets) |
| | | | | | | | |
| Security | | Shares/ Investment
Value | | | Value | |
|
Affiliated Investment Companies(b) — 99.8% | |
|
| Equity Funds — 94.0% | |
Active Stock Master Portfolio | | $ | 2,237,253 | | | $ | 2,237,253 | |
BlackRock Advantage Emerging Markets Fund — Class K | | | 40,417 | | | | 440,954 | |
International Tilts Master Portfolio | | $ | 797,387 | | | | 797,387 | |
iShares Developed Real Estate Index Fund — Class K | | | 17,965 | | | | 197,252 | |
iShares MSCI Canada ETF | | | 3,747 | | | | 111,998 | |
iShares MSCI EAFESmall-Cap ETF | | | 2,705 | | | | 168,467 | |
iShares Russell 2000 ETF | | | 514 | | | | 85,154 | |
| | | | | | | | |
| | | | 4,038,465 | |
|
| Fixed Income Funds — 0.9% | |
CoreAlpha Bond Master Portfolio | | $ | 37,326 | | | | 37,326 | |
iShares TIPS Bond ETF | | | 26 | | | | 3,031 | |
Master Total Return Portfolio | | $ | 10 | | | | 133 | |
| | | | | | | | |
| | | | 40,490 | |
| | | | | | | | |
| Security | |
Shares | | | Value | |
|
| Short-Term Securities — 4.9% | |
BlackRock Cash Funds: Treasury,
SL Agency Shares, | |
1.55%(a) | | | 211,018 | | | $ | 211,018 | |
| | | | | | | | |
| |
Total Affiliated Investment Companies — 99.8%
(Cost — $3,903,909) | | | | 4,289,973 | |
| |
Other Assets Less Liabilities — 0.2% | | | | 8,519 | |
| | | | | | | | |
| |
Net Assets — 100.0% | | | $ | 4,298,492 | |
| | | | | | | | |
| (a) | Annualized7-day yield as of period end. |
| (b) | During the year ended December 31, 2019, investments in issuers considered to be an affiliate/affiliates of the Lifepath Dynamic Master Portfolio for purposes of Section 2(a)(3) of the Investment Company Act of 1940, as amended, and/or related parties of the Lifepath Dynamic Master Portfolio were as follows: |
| | | | | | | | | | | | | | | | | | | | | | | | | | | | | | | | |
| Affiliated Persons and/or Related Parties | | Shares/ Investment Value Held at 12/31/18 | | | Shares/ Investment Value Purchased | | | Shares/ Investment Value Sold | | | Shares/
Investment Value at
12/31/19 | | | Value at
12/31/19 | | | Income | | | Net Realized
Gain (Loss) (a) | | | Change in
Unrealized
Appreciation
(Depreciation) | |
Active Stock Master Portfolio | | $ | 953,734 | | | $ | 1,283,519 | (b) | | $ | — | | | $ | 2,237,253 | | | $ | 2,237,253 | | | $ | 23,528 | | | $ | 93,189 | | | $ | 231,572 | |
BlackRock Advantage Emerging Markets Fund — Class K | | | 18,738 | | | | 24,242 | | | | (2,563 | ) | | | 40,417 | | | | 440,954 | | | | 7,504 | | | | (1,399 | ) | | | 43,954 | |
BlackRock Cash Funds: Treasury,
SL Agency Shares | | | 21,770 | | | | 189,248 | (b) | | | — | | | | 211,018 | | | | 211,018 | | | | 1,916 | | | | — | | | | — | |
CoreAlpha Bond Master Portfolio | | $ | 24,059 | | | $ | 13,267 | (b) | | $ | — | | | $ | 37,326 | | | | 37,326 | | | | 823 | | | | 540 | | | | 462 | |
International Tilts Master Portfolio | | $ | 362,496 | | | $ | 434,891 | (b) | | $ | — | | | $ | 797,387 | | | | 797,387 | | | | 13,962 | | | | 13,223 | | | | 102,756 | |
iShares Developed Real Estate Index Fund — Class K | | | — | | | | 23,551 | | | | (5,586 | ) | | | 17,965 | | | | 197,252 | | | | 8,300 | | | | (56 | ) | | | (4,652 | ) |
iShares Edge MSCI Multifactor International ETF(c) | | | 2,725 | | | | 224 | | | | (2,949 | ) | | | — | | | | — | | | | 1,431 | | | | (3,016 | ) | | | 8,076 | |
iShares Edge MSCI Multifactor USA ETF(c) | | | 3,935 | | | | 190 | | | | (4,125 | ) | | | — | | | | — | | | | 1,314 | | | | 10,900 | | | | 3,892 | |
iShares International Developed Real Estate ETF(c) | | | — | | | | 1,580 | | | | (1,580 | ) | | | — | | | | — | | | | 326 | | | | (412 | ) | | | — | |
iShares MSCI Canada ETF | | | 1,571 | | | | 2,388 | | | | (212 | ) | | | 3,747 | | | | 111,998 | | | | 1,820 | | | | (829 | ) | | | 11,371 | |
iShares MSCI EAFESmall-Cap ETF | | | 1,115 | | | | 1,649 | | | | (59 | ) | | | 2,705 | | | | 168,467 | | | | 4,680 | | | | (799 | ) | | | 20,025 | |
iShares Russell 2000 ETF | | | 266 | | | | 352 | | | | (104 | ) | | | 514 | | | | 85,154 | | | | 796 | | | | (806 | ) | | | 12,034 | |
iShares TIPS Bond ETF | | | — | | | | 26 | | | | — | | | | 26 | | | | 3,031 | | | | 10 | | | | — | | | | 11 | |
iShares U.S. Real Estate ETF | | | — | | | | 750 | | | | (750 | ) | | | — | | | | — | | | | — | | | | (67 | ) | | | — | |
Master Total Return Portfolio | | $ | — | | | $ | 10 | (b) | | $ | — | | | $ | 10 | | | | 133 | | | | 1 | | | | — | | | | — | |
| | | | | | | | | | | | | | | | | | | | | | | | | | | | | | | | |
| | | $ | 4,289,973 | | | $ | 66,411 | | | $ | 110,468 | | | $ | 429,501 | |
| | | | | | | | | | | | | | | | | |
| | (a) | Includes net capital gain distributions, if applicable. | |
| | (b) | Represents net shares/ investment value purchased (sold). | |
| | (c) | As of period end, the entity is no longer held by the LifePath Dynamic Master Portfolio. | |
Derivative Financial Instruments Outstanding as of Period End
Futures Contracts
| | | | | | | | | | | | | | | | |
| Description | | Number of
Contracts | | | Expiration
Date | | | Notional
Amount (000) | | | Value/
Unrealized
Appreciation
(Depreciation) | |
Long Contracts | | | | | | | | | | | | | | | | |
E-Mini MSCI EAFE Index | | | 2 | | | | 03/20/20 | | | $ | 204 | | | $ | 5,423 | |
| | | | | | | | | | | | | | | | |
| | |
| 72 | | 2019 BLACKROCK ANNUAL REPORTTO SHAREHOLDERS |
| | |
Schedule of Investments (continued) December 31, 2019 | | LifePath Dynamic 2060 Master Portfolio |
Forward Foreign Currency Exchange Contracts
| | | | | | | | | | | | | | | | | | | | |
Currency
Purchased | | | Currency
Sold | | | Counterparty | | Settlement Date | | | Unrealized
Appreciation
(Depreciation) | |
| CAD | | | 2,304 | | | USD | | | 1,738 | | | Morgan Stanley & Co. International PLC | | | 03/18/20 | | | $ | 37 | |
| EUR | | | 168,461 | | | USD | | | 187,757 | | | Bank of America N.A. | | | 03/18/20 | | | | 2,094 | |
| EUR | | | 27,125 | | | USD | | | 30,231 | | | Deutsche Bank AG | | | 03/18/20 | | | | 338 | |
| EUR | | | 10,000 | | | USD | | | 11,157 | | | Standard Chartered Bank | | | 03/18/20 | | | | 113 | |
| | | | | | | | | | | | | | | | | | | | |
| | | Net unrealized appreciation | | | $ | 2,582 | |
| | | | | | | | | | | | | | | | | | | | |
Derivative Financial Instruments Categorized by Risk Exposure
As of period end, the fair values of derivative financial instruments located in the Statements of Assets and Liabilities were as follows:
| | | | | | | | | | | | | | | | | | | | | | | | | | | | |
| | | Commodity
Contracts | | | Credit
Contracts | | | Equity
Contracts | | | Foreign
Currency
Exchange
Contracts | | | Interest
Rate
Contracts | | | Other
Contracts | | | Total | |
Assets — Derivative Financial Instrument | |
Futures contracts | | | | | | | | | | | | | | | | | | | | | | | | | | | | |
Unrealized appreciation on futures contracts(a) | | $ | — | | | $ | — | | | $ | 5,423 | | | $ | — | | | $ | — | | | $ | — | | | $ | 5,423 | |
Forward foreign currency exchange contracts | | | | | | | | | | | | | | | | | | | | | | | | | | | | |
Unrealized appreciation on forward foreign currency exchange contracts | | | — | | | | — | | | | — | | | | 2,582 | | | | — | | | | — | | | | 2,582 | |
| | | | | | | | | | | | | | | | | | | | | | | | | | | | |
| | $ | — | | | $ | — | | | $ | 5,423 | | | $ | 2,582 | | | $ | — | | | $ | — | | | $ | 8,005 | |
| | | | | | | | | | | | | | | | | | | | | | | | | | | | |
| | (a) | Net cumulative unrealized appreciation (depreciation) on futures contracts and centrally cleared swaps, if any, are reported in the Schedule of Investments. In the Statements of Assets and Liabilities, only current day’s variation margin is reported in receivables or payables and the net cumulative unrealized appreciation (depreciation) is included in accumulated earnings (loss). | |
For the year ended December 31, 2019, the effect of derivative financial instruments in the Statements of Operations was as follows:
| | | | | | | | | | | | | | | | | | | | | | | | | | | | |
| | | Commodity
Contracts | | | Credit
Contracts | | | Equity
Contracts | | | Foreign
Currency
Exchange
Contracts | | | Interest
Rate
Contracts | | | Other
Contracts | | | Total | |
Net Realized Gain (Loss) from: | | | | | | | | | | | | | | | | | | | | | | | | | | | | |
Futures contracts | | $ | — | | | $ | — | | | $ | 6,390 | | | $ | — | | | $ | — | | | $ | — | | | $ | 6,390 | |
Forward foreign currency exchange contracts | | | — | | | | — | | | | — | | | | (8,706 | ) | | | — | | | | — | | | | (8,706 | ) |
| | | | | | | | | | | | | | | | | | | | | | | | | | | | |
| | $ | — | | | $ | — | | | $ | 6,390 | | | $ | (8,706 | ) | | $ | — | | | $ | — | | | $ | (2,316 | ) |
| | | | | | | | | | | | | | | | | | | | | | | | | | | | |
| | | | | | | |
| Net Change in Unrealized Appreciation (Depreciation) on: | | | | | | | | | | | | | | | | | | | | | |
Futures contracts | | $ | — | | | $ | — | | | $ | 5,423 | | | $ | — | | | $ | — | | | $ | — | | | $ | 5,423 | |
Forward foreign currency exchange contracts | | | — | | | | — | | | | | | | | 5,129 | | | | — | | | | — | | | | 5,129 | |
| | | | | | | | | | | | | | | | | | | | | | | | | | | | |
| | $ | — | | | $ | — | | | $ | 5,423 | | | $ | 5,129 | | | $ | — | | | $ | — | | | $ | 10,552 | |
| | | | | | | | | | | | | | | | | | | | | | | | | | | | |
Average Quarterly Balances of Outstanding Derivative Financial Instruments
| | | | |
Futures contracts: | |
Average notional value of contracts long | | $ | 122,725 | |
Forward foreign currency exchange contracts: | |
Average USD amounts purchased | | $ | 83,091 | |
Average USD amounts sold | | $ | 240,598 | |
For more information about the LifePath Dynamic Master Portfolio’s Investment risks regarding derivative financial instruments, refer to the Notes to Financial Statements
| | | | |
| SCHEDULES OF INVESTMENTS | | | 73 | |
| | |
Schedule of Investments (continued) December 31, 2019 | | LifePath Dynamic 2060 Master Portfolio |
Derivative Financial Instruments — Offsetting as of Period End
The LifePath Dynamic Master Portfolio’s derivative assets and liabilities (by type) were as follows:
| | | | | | | | |
| | | Assets | | | Liabilities | |
Derivative Financial Instruments: | | | | | | | | |
Futures contracts | | $ | 1,020 | | | $ | — | |
Forward foreign currency exchange contracts | | | 2,582 | | | | — | |
| | | | | | | | |
Total derivative assets and liabilities in the Statements of Assets and Liabilities | | $ | 3,602 | | | $ | — | |
Derivatives not subject to a Master Netting Agreement or similar agreement (“MNA”) | | | (1,020 | ) | | | — | |
| | | | | | | | |
Total derivative assets and liabilities subject to an MNA | | $ | 2,582 | | | $ | — | |
| | | | | | | | |
The following table presents the Fund’s derivative assets by counterparty net of amounts available for offset under an MNA and net of the related collateral received by the LifePath Dynamic Master Portfolio:
| | | | | | | | | | | | | | | | | | | | |
| Counterparty | | Derivative
Assets
Subject to
an MNA by
Counterparty | | | Derivatives
Available
for Offset | | | Non-cash
Collateral
Received | | | Cash
Collateral
Received | | | Net Amount
of Derivative
Assets (a)(b) | |
Bank of America N.A. | | $ | 2,094 | | | $ | — | | | $ | — | | | $ | — | | | $ | 2,094 | |
Deutsche Bank AG | | | 338 | | | | — | | | | — | | | | — | | | | 338 | |
Morgan Stanley & Co. International PLC | | | 37 | | | | — | | | | — | | | | — | | | | 37 | |
Standard Chartered Bank | | | 113 | | | | — | | | | — | | | | — | | | | 113 | |
| | | | | | | | | | | | | | | | | | | | |
| | $ | 2,582 | | | $ | — | | | $ | — | | | $ | — | | | $ | 2,582 | |
| | | | | | | | | | | | | | | | | | | | |
| | (a) | Net amount represents the net amount receivable from the counterparty in the event of default. | |
| | (b) | Net amount may also include forward foreign currency exchange contracts that are not required to be collateralized. | |
Fair Value Hierarchy as of Period End
Various inputs are used in determining the fair value of investments and derivative financial instruments. For information about the LifePath Dynamic Master Portfolio’s policy regarding valuation of investments and derivative financial instruments, refer to the Notes to Financial Statements.
The following tables summarize the LifePath Dynamic Master Portfolio’s investments and derivative financial instruments categorized in the disclosure hierarchy:
| | | | | | | | | | | | | | | | |
| | | Level 1 | | | Level 2 | | | Level 3 | | | Total | |
Assets: | |
Investments: | |
Affiliated Investments Companies | | | | | | | | | | | | | | | | |
Equity Funds | | $ | 1,003,825 | | | $ | — | | | $ | — | | | $ | 1,003,825 | |
Fixed Income Funds | | | 3,031 | | | | — | | | | — | | | | 3,031 | |
Short-Term Securities | | | 211,018 | | | | — | | | | — | | | | 211,018 | |
| | | | | | | | | | | | | | | | |
Subtotal | | $ | 1,217,874 | | | $ | — | | | $ | — | | | $ | 1,217,874 | |
| | | | | | | | | | | | | | | | |
Investments Valued at NAV(a) | | | | | | | | | | | | | | | 3,072,099 | |
| | | | | | | | | | | | | | | | |
Total Investments | | | | | | | | | | | | | | $ | 4,289,973 | |
| | | | | | | | | | | | | | | | |
Derivative Financial Instruments(b) | |
Assets: | |
Forward foreign currency contracts | | $ | — | | | $ | 2,582 | | | $ | — | | | $ | 2,582 | |
Equity contracts | | | 5,423 | | | | — | | | | — | | | | 5,423 | |
| | | | | | | | | | | | | | | | |
| | $ | 5,423 | | | $ | 2,582 | | | $ | — | | | $ | 8,005 | |
| | | | | | | | | | | | | | | | |
| | (a) | Certain investments of the LifePath Dynamic Master Portfolio were fair valued using NAV per share or its equivalent as no quoted market value is available and therefore have been excluded from the fair value hierarchy. | |
| | (b) | Derivative financial instruments are futures contracts and forward foreign currency exchange contracts. Futures contracts and forward foreign currency exchange contracts are valued at the unrealized appreciation (depreciation) on the instrument. | |
See notes to financial statements.
| | |
| 74 | | 2019 BLACKROCK ANNUAL REPORTTO SHAREHOLDERS |
Statements of Assets and Liabilities
December 31, 2019
| | | | | | | | | | | | | | | | | | | | |
| | | LifePath Dynamic
Retirement Master Portfolio | | | LifePath Dynamic
2030 Master
Portfolio | | | LifePath Dynamic
2040 Master
Portfolio | | | LifePath Dynamic
2050 Master
Portfolio | | | LifePath Dynamic
2060 Master
Portfolio | |
| | | | | |
ASSETS | | | | | | | | | | | | | | | | | | | | |
Investments at value — affiliated(a)(b) | | $ | 412,044,194 | | | $ | 350,549,840 | | | $ | 291,768,388 | | | $ | 116,488,305 | | | $ | 4,289,973 | |
Cash | | | — | | | | — | | | | — | | | | — | | | | 1,754 | |
Cash pledged for futures contracts | | | 1,242,000 | | | | 1,375,000 | | | | 1,357,000 | | | | 441,000 | | | | 10,000 | |
Foreign currency at value(c) | | | 674,431 | | | | 846,310 | | | | 845,078 | | | | 325,765 | | | | 94 | |
Receivables: | | | | | | | | | | | | | | | | | | | | |
Investments sold | | | 2,918,608 | | | | 4,496,042 | | | | 1,890,666 | | | | 537,611 | | | | 24,036 | |
Securities lending income — affiliated | | | 869 | | | | 1,008 | | | | 1,663 | | | | 1,095 | | | | — | |
Contributions from investors | | | — | | | | — | | | | — | | | | — | | | | 3,820 | |
Dividends — affiliated | | | 49,579 | | | | 32,699 | | | | 24,933 | | | | 13,083 | | | | 283 | |
Variation margin on futures contracts | | | 99,089 | | | | 110,190 | | | | 105,841 | | | | 30,489 | | | | 1,020 | |
Unrealized appreciation on forward foreign currency exchange contracts | | | 304,764 | | | | 320,641 | | | | 299,947 | | | | 130,895 | | | | 2,582 | |
Prepaid expenses | | | — | | | | — | | | | — | | | | — | | | | 4,014 | |
| | | | | | | | | | | | | | | | | | | | |
Total assets | | | 417,333,534 | | | | 357,731,730 | | | | 296,293,516 | | | | 117,968,243 | | | | 4,337,576 | |
| | | | | | | | | | | | | | | | | | | | |
| | | | | |
LIABILITIES | | | | | | | | | | | | | | | | | | | | |
Cash collateral on securities loaned at value | | | 253,000 | | | | 1,084,850 | | | | 3,671,599 | | | | 2,903,175 | | | | — | |
Payables: | | | | | | | | | | | | | | | | | | | | |
Investments purchased | | | 4,912,948 | | | | 4,053,469 | | | | 1,319,883 | | | | 251,620 | | | | 21,372 | |
Investment advisory fees | | | 23,809 | | | | 21,286 | | | | 17,119 | | | | 3,900 | | | | 308 | |
Trustees’ fees | | | 4,674 | | | | 3,301 | | | | 3,061 | | | | 2,476 | | | | 2,101 | |
Professional fees | | | 29,176 | | | | 15,898 | | | | 15,865 | | | | 15,491 | | | | 15,303 | |
Variation margin on futures contracts | | | 10,181 | | | | 10,211 | | | | 13,834 | | | | 5,348 | | | | — | |
Withdrawals to investors | | | 3,578,186 | | | | 1,701,113 | | | | 1,762,152 | | | | 952,725 | | | | — | |
| | | | | | | | | | | | | | | | | | | | |
Total liabilities | | | 8,811,974 | | | | 6,890,128 | | | | 6,803,513 | | | | 4,134,735 | | | | 39,084 | |
| | | | | | | | | | | | | | | | | | | | |
| | | | | |
NET ASSETS | | $ | 408,521,560 | | | $ | 350,841,602 | | | $ | 289,490,003 | | | $ | 113,833,508 | | | $ | 4,298,492 | |
| | | | | | | | | | | | | | | | | | | | |
|
NET ASSETS CONSIST OF | |
Investors’ capital | | $ | 314,828,042 | | | $ | 320,067,772 | | | $ | 244,821,745 | | | $ | 87,673,683 | | | $ | 3,904,410 | |
Net unrealized appreciation | | | 93,693,518 | | | | 30,773,830 | | | | 44,668,258 | | | | 26,159,825 | | | | 394,082 | |
| | | | | | | | | | | | | | | | | | | | |
NET ASSETS | | $ | 408,521,560 | | | $ | 350,841,602 | | | $ | 289,490,003 | | | $ | 113,833,508 | | | $ | 4,298,492 | |
| | | | | | | | | | | | | | | | | | | | |
| | | | | |
(a) Investments at cost — affiliated | | $ | 318,350,676 | | | $ | 320,913,529 | | | $ | 248,170,295 | | | $ | 90,671,865 | | | $ | 3,903,909 | |
(b) Securities loaned at value | | $ | 249,120 | | | $ | 1,061,914 | | | $ | 3,615,291 | | | $ | 2,858,652 | | | $ | — | |
(c) Foreign currency at cost | | $ | 660,842 | | | $ | 831,765 | | | $ | 830,836 | | | $ | 320,500 | | | $ | 93 | |
See notes to financial statements.
Statements of Operations
Year Ended December 31, 2019
| | | | | | | | | | | | | | | | | | | | |
| | | LifePath Dynamic
Retirement Master
Portfolio | | | LifePath Dynamic
2030 Master
Portfolio | | | LifePath Dynamic
2040 Master
Portfolio | | | LifePath Dynamic
2050 Master
Portfolio | | | LifePath Dynamic
2060 Master
Portfolio | |
| | | | | |
INVESTMENT INCOME | | | | | | | | | | | | | | | | | | | | |
Dividends — affiliated | | $ | 1,619,756 | | | $ | 2,361,207 | | | $ | 2,269,323 | | | $ | 877,405 | | | $ | 28,097 | |
Dividends — unaffiliated | | | 5,185 | | | | 302,704 | | | | 394,168 | | | | 165,499 | | | | 5,933 | |
Securities lending income — affiliated — net | | | 5,929 | | | | 19,704 | | | | 20,633 | | | | 10,127 | | | | — | |
Foreign taxes withheld | | | (1,619 | ) | | | (26,447 | ) | | | (36,783 | ) | | | (15,514 | ) | | | (416 | ) |
Net investment income allocated from the applicable Underlying Master Portfolios: | | | | |
Interest — affiliated | | | 2,492,423 | | | | 2,942,573 | | | | 1,001,277 | | | | 174,709 | | | | 4,357 | |
Dividends — affiliated | | | 977,447 | | | | 3,504,011 | | | | 3,545,188 | | | | 1,484,465 | | | | 38,207 | |
Expenses | | | (350,361 | ) | | | (841,088 | ) | | | (713,407 | ) | | | (282,324 | ) | | | (7,371 | ) |
Fees waived | | | 106,814 | | | | 318,622 | | | | 298,160 | | | | 120,435 | | | | 3,121 | |
| | | | | | | | | | | | | | | | | | | | |
Total investment income | | | 4,855,574 | | | | 8,581,286 | | | | 6,778,559 | | | | 2,534,802 | | | | 71,928 | |
| | | | | | | | | | | | | | | | | | | | |
|
EXPENSES | |
Investment advisory | | | 553,328 | | | | 1,168,697 | | | | 953,787 | | | | 363,240 | | | | 9,553 | |
Professional | | | 15,584 | | | | 16,174 | | | | 16,001 | | | | 15,577 | | | | 15,305 | |
Trustees | | | 12,545 | | | | 15,627 | | | | 14,688 | | | | 12,186 | | | | 10,726 | |
| | | | | | | | | | | | | | | | | | | | |
Total expenses | | | 581,457 | | | | 1,200,498 | | | | 984,476 | | | | 391,003 | | | | 35,584 | |
Less fees waived and/or reimbursed by the Manager | | | (509,041 | ) | | | (1,042,766 | ) | | | (856,273 | ) | | | (343,308 | ) | | | (34,286 | ) |
| | | | | | | | | | | | | | | | | | | | |
Total expenses after fees waived and/or reimbursed | | | 72,416 | | | | 157,732 | | | | 128,203 | | | | 47,695 | | | | 1,298 | |
| | | | | | | | | | | | | | | | | | | | |
Net investment income | | | 4,783,158 | | | | 8,423,554 | | | | 6,650,356 | | | | 2,487,107 | | | | 70,630 | |
| | | | | | | | | | | | | | | | | | | | |
|
REALIZED AND UNREALIZED GAIN (LOSS) | |
Net realized gain (loss) from: | |
Allocation from the applicable Underlying Master Portfolios from investments, futures, forward foreign currency exchange contracts and foreign currency transactions | | | 5,786,002 | | | | 15,845,325 | | | | 13,457,814 | | | | 4,864,811 | | | | 106,952 | |
Futures contracts | | | 1,693,396 | | | | 3,913,468 | | | | 3,471,019 | | | | 680,638 | | | | 6,390 | |
Forward foreign currency exchange contracts | | | (436,137 | ) | | | (1,093,641 | ) | | | (911,714 | ) | | | (333,486 | ) | | | (8,706 | ) |
Foreign currency transactions | | | 6,361 | | | | 29,793 | | | | 3,897 | | | | (3,925 | ) | | | (231 | ) |
Investments — unaffiliated | | | 154,848 | | | | 3,457,207 | | | | 4,650,851 | | | | 2,057,647 | | | | 44,005 | |
Investments — affiliated | | | 121,180 | | | | 1,087,021 | | | | 1,901,698 | | | | 974,463 | | | | 3,516 | |
Payment from affiliate(a) | | | — | | | | — | | | | — | | | | — | | | | 2,603 | |
| | | | | | | | | | | | | | | | | | | | |
| | | 7,325,650 | | | | 23,239,173 | | | | 22,573,565 | | | | 8,240,148 | | | | 154,529 | |
| | | | | | | | | | | | | | | | | | | | |
Net change in unrealized appreciation (depreciation) on: | | | | | | | | | | | | | | | | | | | | |
Allocation from the applicable Underlying Master Portfolios from investments, futures, forward foreign currency exchange contracts and foreign currency transactions | | | 8,943,683 | | | | 27,639,052 | | | | 26,474,196 | | | | 11,189,760 | | | | 334,790 | |
Futures contracts | | | 1,162,142 | | | | 1,665,457 | | | | 1,413,297 | | | | 253,604 | | | | 5,423 | |
Forward foreign currency exchange contracts | | | 401,980 | | | | 658,514 | | | | 604,664 | | | | 247,280 | | | | 5,129 | |
Foreign currency translations | | | 13,502 | | | | 6,283 | | | | 15,076 | | | | 3,827 | | | | (32 | ) |
Investments — unaffiliated | | | 15,522 | | | | 559,043 | | | | 782,061 | | | | 284,559 | | | | 10,765 | |
Investments — affiliated | | | 1,638,409 | | | | 4,982,016 | | | | 4,254,545 | | | | 1,689,244 | | | | 94,711 | |
| | | | | | | | | | | | | | | | | | | | |
| | | 12,175,238 | | | | 35,510,365 | | | | 33,543,839 | | | | 13,668,274 | | | | 450,786 | |
| | | | | | | | | | | | | | | | | | | | |
Net realized and unrealized gain | | | 19,500,888 | | | | 58,749,538 | | | | 56,117,404 | | | | 21,908,422 | | | | 605,315 | |
| | | | | | | | | | | | | | | | | | | | |
NET INCREASE IN NET ASSETS RESULTING FROM OPERATIONS | | $ | 24,284,046 | | | $ | 67,173,092 | | | $ | 62,767,760 | | | $ | 24,395,529 | | | $ | 675,945 | |
| | | | | | | | | | | | | | | | | | | | |
| (a) | Includes a payment by an affiliate of $2,603 to compensate for a trade operating event. |
See notes to financial statements.
| | |
| 76 | | 2019 BLACKROCK ANNUAL REPORTTO SHAREHOLDERS |
Statements of Changes in Net Assets
| | | | | | | | | | | | | | | | | | | | |
| | | LifePath Dynamic Retirement
Master Portfolio | | | | | | LifePath Dynamic 2030
Master Portfolio | |
| | | Year Ended December 31, | | | | | | Year Ended December 31, | |
| | | 2019 | | | 2018 | | | | | | 2019 | | | 2018 | |
| | | | | |
INCREASE (DECREASE) IN NET ASSETS | | | | | | | | | | | | | | | | | | | | |
| | | | | |
OPERATIONS | | | | | | | | | | | | | | | | | | | | |
Net investment income | | $ | 4,783,158 | | | $ | 3,306,592 | | | | | | | $ | 8,423,554 | | | $ | 8,727,235 | |
Net realized gain | | | 7,325,650 | | | | 3,307,624 | | | | | | | | 23,239,173 | | | | 19,220,681 | |
Net change in unrealized appreciation (depreciation) | | | 12,175,238 | | | | (9,881,188 | ) | | | | | | | 35,510,365 | | | | (44,083,828 | ) |
| | | | | | | | | | | | | | | | | | | | |
Net increase (decrease) in net assets resulting from operations | | | 24,284,046 | | | | (3,266,972 | ) | | | | | | | 67,173,092 | | | | (16,135,912 | ) |
| | | | | | | | | | | | | | | | | | | | |
| | | | | |
CAPITAL TRANSACTIONS | | | | | | | | | | | | | | | | | | | | |
Proceeds from contributions | | | 326,183,915 | | | | 45,501,676 | | | | | | | | 70,186,697 | | | | 45,262,945 | |
Value of withdrawals | | | (49,589,761 | ) | | | (73,015,545 | ) | | | | | | | (93,945,766 | ) | | | (118,606,130 | ) |
| | | | | | | | | | | | | | | | | | | | |
Net increase (decrease) in net assets derived from capital transactions | | | 276,594,154 | | | | (27,513,869 | ) | | | | | | | (23,759,069 | ) | | | (73,343,185 | ) |
| | | | | | | | | | | | | | | | | | | | |
| | | | | |
NET ASSETS | | | | | | | | | | | | | | | | | | | | |
Total increase (decrease) in net assets | | | 300,878,200 | | | | (30,780,841 | ) | | | | | | | 43,414,023 | | | | (89,479,097 | ) |
Beginning of year | | | 107,643,360 | | | | 138,424,201 | | | | | | | | 307,427,579 | | | | 396,906,676 | |
| | | | | | | | | | | | | | | | | | | | |
End of year | | $ | 408,521,560 | | | $ | 107,643,360 | | | | | | | $ | 350,841,602 | | | $ | 307,427,579 | |
| | | | | | | | | | | | | | | | | | | | |
See notes to financial statements.
Statements of Changes in Net Assets (continued)
| | | | | | | | | | | | | | | | | | | | |
| | | LifePath Dynamic 2040
Master Portfolio | | | | | | LifePath Dynamic 2050
Master Portfolio | |
| | | Year Ended December 31, | | | | | | Year Ended December 31, | |
| | | 2019 | | | 2018 | | | | | | 2019 | | | 2018 | |
| | | |
INCREASE (DECREASE) IN NET ASSETS | | | | | | | | | | | | | |
| | | |
OPERATIONS | | | | | | | | | | | | | |
Net investment income | | $ | 6,650,356 | | | $ | 6,646,019 | | | | | | | $ | 2,487,107 | | | $ | 2,179,736 | |
Net realized gain | | | 22,573,565 | | | | 17,885,406 | | | | | | | | 8,240,148 | | | | 6,553,196 | |
Net change in unrealized appreciation (depreciation) | | | 33,543,839 | | | | (43,539,079 | ) | | | | | | | 13,668,274 | | | | (16,390,777 | ) |
| | | | | | | | | | | | | | | | | | | | |
Net increase (decrease) in net assets resulting from operations | | | 62,767,760 | | | | (19,007,654 | ) | | | | | | | 24,395,529 | | | | (7,657,845 | ) |
| | | | | | | | | | | | | | | | | | | | |
| | | |
CAPITAL TRANSACTIONS | | | | | | | | | | | | | |
Proceeds from contributions | | | 49,917,186 | | | | 40,965,197 | | | | | | | | 30,739,999 | | | | 20,024,006 | |
Value of withdrawals | | | (73,367,892 | ) | | | (90,655,654 | ) | | | | | | | (30,540,395 | ) | | | (44,881,949 | ) |
| | | | | | | | | | | | | | | | | | | | |
Net increase (decrease) in net assets derived from capital transactions | | | (23,450,706 | ) | | | (49,690,457 | ) | | | | | | | 199,604 | | | | (24,857,943 | ) |
| | | | | | | | | | | | | | | | | | | | |
| | | |
NET ASSETS | | | | | | | | | | | | | |
Total increase (decrease) in net assets | | | 39,317,054 | | | | (68,698,111 | ) | | | | | | | 24,595,133 | | | | (32,515,788 | ) |
Beginning of year | | | 250,172,949 | | | | 318,871,060 | | | | | | | | 89,238,375 | | | | 121,754,163 | |
| | | | | | | | | | | | | | | | | | | | |
End of year | | $ | 289,490,003 | | | $ | 250,172,949 | | | | | | | $ | 113,833,508 | | | $ | 89,238,375 | |
| | | | | | | | | | | | | | | | | | | | |
See notes to financial statements.
| | |
| 78 | | 2019 BLACKROCK ANNUAL REPORTTO SHAREHOLDERS |
Statements of Changes in Net Assets (continued)
| | | | | | | | |
| | | LifePath Dynamic 2060
Master Portfolio | |
| | | Year Ended December 31, | |
| | | 2019 | | | 2018 | |
|
INCREASE (DECREASE) IN NET ASSETS | |
|
OPERATIONS | |
Net investment income | | $ | 70,630 | | | $ | 48,027 | |
Net realized gain | | | 154,529 | | | | 7,257 | |
Net change in unrealized appreciation (depreciation) | | | 450,786 | | | | (247,964 | ) |
| | | | | | | | |
Net increase (decrease) in net assets resulting from operations | | | 675,945 | | | | (192,680 | ) |
| | | | | | | | |
|
CAPITAL TRANSACTIONS | |
Proceeds from contributions | | | 1,856,825 | | | | 139,290 | |
Value of withdrawals | | | (361,963 | ) | | | (81,792 | ) |
| | | | | | | | |
Net increase in net assets derived from capital transactions | | | 1,494,862 | | | | 57,498 | |
| | | | | | | | |
|
NET ASSETS | |
Total increase (decrease) in net assets | | | 2,170,807 | | | | (135,182 | ) |
Beginning of year | | | 2,127,685 | | | | 2,262,867 | |
| | | | | | | | |
End of year | | $ | 4,298,492 | | | $ | 2,127,685 | |
| | | | | | | | |
See notes to financial statements.
Financial Highlights
| | | | | | | | | | | | | | | | | | | | |
| | | LifePath Dynamic Retirement Master Portfolio | |
| |
| | | Year Ended December 31, | |
| | | 2019 | | | 2018 | | | 2017 | | | 2016 | | | 2015 | |
| | | | | |
| Total Return | | | | | | | | | | | | | | | |
Total return | | | 17.32 | % | | | (3.35 | )% | | | 12.06 | % | | | 6.28 | % | | | (1.02 | )% |
| | | | | | | | | | | | | | | | | | | | |
| | | | | |
Ratios to Average Net Assets(a) | | | | | | | | | | | | | | | | | | | | |
Total expenses | | | 0.52 | % | | | 0.54 | % | | | 0.54 | % | | | 0.54 | % | | | 0.54 | % |
| | | | | | | | | | | | | | | | | | | | |
Total expenses after fees waived and/or reimbursed | | | 0.20 | % | | | 0.22 | % | | | 0.21 | % | | | 0.23 | % | | | 0.26 | % |
| | | | | | | | | | | | | | | | | | | | |
Net investment income | | | 3.03 | % | | | 2.65 | % | | | 2.05 | % | | | 2.06 | % | | | 1.88 | % |
| | | | | | | | | | | | | | | | | | | | |
| | | | | |
Supplemental Data | | | | | | | | | | | | | | | | | | | | |
Net assets, end of year (000) | | $ | 408,522 | | | $ | 107,643 | | | $ | 138,424 | | | $ | 155,750 | | | $ | 254,167 | |
| | | | | | | | | | | | | | | | | | | | |
Portfolio turnover rate(b) | | | 35 | % | | | 38 | % | | | 6 | % | | | 37 | % | | | 21 | % |
| | | | | | | | | | | | | | | | | | | | |
| (a) | Includes the LifePath Dynamic Master Portfolio’s pro rata portion of expenses and share of the allocated net investment income from the following master portfolios (collectively, the “Underlying Master Portfolios”): |
| | | | |
| | | Range of Periods | |
Active Stock Master Portfolio | | | 2015 — 2019 | |
CoreAlpha Bond Master Portfolio | | | 2015 — 2019 | |
International Tilts Master Portfolio | | | 2015 — 2019 | |
| | | | |
| | | Range of Periods | |
Large Cap Index Master Portfolio | | | 2015 | |
Master Small Cap Index Series | | | 2015 — 2018 | |
Master Total Return Portfolio | | | 2016 — 2019 | |
Includes the LifePath Dynamic Master Portfolio’s share of the Underlying Master Portfolios’ allocated fees waived and excludes expenses incurred indirectly as a result of investments in underlying funds:
| | | | | | | | | | | | | | | | | | | | | | | | | | | | | | | | | | | | | | | | |
| | | Year Ended December 31, | | | | |
| | | 2019 | | | | | | 2018 | | | | | | 2017 | | | | | | 2016 | | | | | | 2015 | | | | |
Allocated fees waived | | | 0.07 | % | | | | | | | 0.05 | % | | | | | | | 0.06 | % | | | | | | | 0.04 | % | | | | | | | 0.03 | % | | | | |
Investments in underlying funds | | | 0.08 | % | | | | | | | 0.09 | % | | | | | | | 0.12 | % | | | | | | | 0.10 | % | | | | | | | 0.09 | % | | | | |
| | | | | | | | | | | | | | | | | | | | | | | | | | | | | | | | | | | | | | | | |
The ratios do not reflect any expenses incurred indirectly as a result of investments in the following underlying funds:
| | | | |
| | | Range of Periods | |
BlackRock Cash Funds: Institutional | | | 2015 — 2019 | |
BlackRock Cash Funds: Prime | | | 2015 | |
BlackRock Cash Funds: Treasury | | | 2016 — 2019 | |
BlackRock Commodity Strategies Fund | | | 2015 — 2018 | |
| | | | |
| | | Range of Periods | |
BlackRock Advantage Emerging Markets Fund | | | 2015 — 2019 | |
BlackRock Tactical Opportunities Fund | | | 2016 — 2019 | |
iShares exchange-traded funds | | | 2015 — 2019 | |
iShares Developed Real Estate Index Fund | | | 2019 | |
| (b) | Includes the purchases and sales of the underlying funds and the Underlying Master Portfolios. |
See notes to financial statements.
| | |
| 80 | | 2019 BLACKROCK ANNUAL REPORTTO SHAREHOLDERS |
Financial Highlights (continued)
| | | | | | | | | | | | | | | | | | | | |
| | | LifePath Dynamic 2030 Master Portfolio | |
| |
| | | Year Ended December 31, | |
| | | 2019 | | | 2018 | | | 2017 | | | 2016 | | | 2015 | |
|
Total Return | |
Total return | | | 22.50 | % | | | (5.15 | )% | | | 18.08 | % | | | 7.61 | % | | | (1.55 | )% |
| | | | | | | | | | | | | | | | | | | | |
|
Ratios to Average Net Assets(a) | |
Total expenses | | | 0.52 | % | | | 0.52 | % | | | 0.50 | % | | | 0.52 | % | | | 0.52 | % |
| | | | | | | | | | | | | | | | | | | | |
Total expenses after fees waived and/or reimbursed | | | 0.20 | % | | | 0.21 | % | | | 0.20 | % | | | 0.21 | % | | | 0.21 | % |
| | | | | | | | | | | | | | | | | | | | |
Net investment income | | | 2.52 | % | | | 2.40 | % | | | 2.04 | % | | | 2.11 | % | | | 1.93 | % |
| | | | | | | | | | | | | | | | | | | | |
|
Supplemental Data | |
Net assets, end of year (000) | | $ | 350,842 | | | $ | 307,428 | | | $ | 396,907 | | | $ | 448,317 | | | $ | 543,847 | |
| | | | | | | | | | | | | | | | | | | | |
Portfolio turnover rate(b) | | | 32 | % | | | 29 | % | | | 21 | % | | | 61 | % | | | 21 | % |
| | | | | | | | | | | | | | | | | | | | |
| (a) | Includes the LifePath Dynamic Master Portfolio’s pro rata portion of expenses and share of the allocated net investment income from the following master portfolios (collectively, the “Underlying Master Portfolios”): |
| | | | |
| | | Range of Periods | |
Active Stock Master Portfolio | | | 2015 — 2019 | |
CoreAlpha Bond Master Portfolio | | | 2015 — 2019 | |
International Tilts Master Portfolio | | | 2015 — 2019 | |
| | | | |
| | | Range of Periods | |
Large Cap Index Master Portfolio | | | 2015 — 2015 | |
Master Small Cap Index Series | | | 2015 — 2018 | |
Master Total Return Portfolio | | | 2016 — 2019 | |
Includes the LifePath Dynamic Master Portfolio’s share of the Underlying Master Portfolios’ allocated fees waived and excludes expenses incurred indirectly as a result of investments in underlying funds:
| | | | | | | | | | | | | | | | | | | | | | | | | | | | | | | | | | | | | | | | |
| | | Year Ended December 31, | | | | |
| | | 2019 | | | | | | 2018 | | | | | | 2017 | | | | | | 2016 | | | | | | 2015 | | | | |
Allocated fees waived | | | 0.10 | % | | | | | | | 0.08 | % | | | | | | | 0.08 | % | | | | | | | 0.06 | % | | | | | | | 0.05 | % | | | | |
Investments in underlying funds | | | 0.10 | % | | | | | | | 0.11 | % | | | | | | | 0.14 | % | | | | | | | 0.12 | % | | | | | | | 0.14 | % | | | | |
| | | | | | | | | | | | | | | | | | | | | | | | | | | | | | | | | | | | | | | | |
The ratios do not reflect any expenses incurred indirectly as a result of investments in the following underlying funds:
| | | | |
| | | Range of Periods | |
BlackRock Cash Funds: Institutional | | | 2015 — 2019 | |
BlackRock Cash Funds: Prime | | | 2015 | |
BlackRock Cash Funds: Treasury | | | 2016 — 2019 | |
BlackRock Commodity Strategies Fund | | | 2015 — 2018 | |
| | | | |
| | | Range of Periods | |
BlackRock Advantage Emerging Markets Fund | | | 2015 — 2019 | |
BlackRock Tactical Opportunities Fund | | | 2016 — 2019 | |
iShares exchange-traded funds | | | 2015 — 2019 | |
iShares Developed Real Estate Index Fund | | | 2019 | |
| (b) | Includes the purchases and sales of the underlying funds and the Underlying Master Portfolios. |
See notes to financial statements.
Financial Highlights (continued)
| | | | | | | | | | | | | | | | | | | | |
| | | LifePath Dynamic 2040 Master Portfolio | |
| |
| | | Year Ended December 31, | |
| | | 2019 | | | 2018 | | | 2017 | | | 2016 | | | 2015 | |
| | | | | |
| Total Return | | | | | | | | | | | | | | | |
Total return | | | 26.15 | % | | | (7.16 | )% | | | 21.86 | % | | | 8.35 | % | | | (1.79 | )% |
| | | | | | | | | | | | | | | | | | | | |
| | | | | |
Ratios to Average Net Assets(a) | | | | | | | | | | | | | | | | | | | | |
Total expenses | | | 0.51 | % | | | 0.51 | % | | | 0.50 | % | | | 0.50 | % | | | 0.50 | % |
| | | | | | | | | | | | | | | | | | | | |
Total expenses after fees waived and/or reimbursed | | | 0.20 | % | | | 0.20 | % | | | 0.19 | % | | | 0.19 | % | | | 0.18 | % |
| | | | | | | | | | | | | | | | | | | | |
Net investment income | | | 2.44 | % | | | 2.25 | % | | | 1.99 | % | | | 2.13 | % | | | 1.94 | % |
| | | | | | | | | | | | | | | | | | | | |
| | | | | |
Supplemental Data | | | | | | | | | | | | | | | | | | | | |
Net assets, end of year (000) | | $ | 289,490 | | | $ | 250,173 | | | $ | 318,871 | | | $ | 361,343 | | | $ | 425,956 | |
| | | | | | | | | | | | | | | | | | | | |
Portfolio turnover rate(b) | | | 35 | % | | | 39 | % | | | 30 | % | | | 77 | % | | | 19 | % |
| | | | | | | | | | | | | | | | | | | | |
| (a) | Includes the LifePath Dynamic Master Portfolio’s pro rata portion of expenses and share of the allocated net investment income from the following master portfolios (collectively, the “Underlying Master Portfolios”): |
| | | | |
| | | Range of Periods | |
Active Stock Master Portfolio | | | 2015 — 2019 | |
CoreAlpha Bond Master Portfolio | | | 2015 — 2019 | |
International Tilts Master Portfolio | | | 2015 — 2019 | |
| | | | |
| | | Range of Periods | |
Large Cap Index Master Portfolio | | | 2015 | |
Master Small Cap Index Series | | | 2015 — 2018 | |
Master Total Return Portfolio | | | 2015 — 2019 | |
Includes the LifePath Dynamic Master Portfolio’s share of the Underlying Master Portfolios’ allocated fees waived and excludes expenses incurred indirectly as a result of investments in underlying funds:
| | | | | | | | | | | | | | | | | | | | | | | | | | | | | | | | | | | | | | | | |
| | | Year Ended December 31, | | | | |
| | | 2019 | | | | | | 2018 | | | | | | 2017 | | | | | | 2016 | | | | | | 2015 | | | | |
Allocated fees waived | | | 0.11 | % | | | | | | | 0.09 | % | | | | | | | 0.10 | % | | | | | | | 0.07 | % | | | | | | | 0.06 | % | | | | |
Investments in underlying funds | | | 0.12 | % | | | | | | | 0.13 | % | | | | | | | 0.16 | % | | | | | | | 0.14 | % | | | | | | | 0.17 | % | | | | |
| | | | | | | | | | | | | | | | | | | | | | | | | | | | | | | | | | | | | | | | |
The ratios do not reflect any expenses incurred indirectly as a result of investments in the following underlying funds:
| | | | |
| | | Range of Periods | |
BlackRock Cash Funds: Institutional | | | 2015 — 2019 | |
BlackRock Cash Funds: Prime | | | 2015 | |
BlackRock Cash Funds: Treasury | | | 2016 — 2019 | |
BlackRock Commodity Strategies Fund | | | 2015 — 2018 | |
| | | | |
| | | Range of Periods | |
BlackRock Advantage Emerging Markets Fund | | | 2015 — 2019 | |
BlackRock Tactical Opportunities Fund | | | 2016 — 2019 | |
iShares exchange-traded funds | | | 2015 — 2019 | |
iShares Developed Real Estate Index Fund | | | 2019 | |
| (b) | Includes the purchases and sales of the underlying funds and the Underlying Master Portfolios. |
See notes to financial statements.
| | |
| 82 | | 2019 BLACKROCK ANNUAL REPORTTO SHAREHOLDERS |
Financial Highlights (continued)
| | | | | | | | | | | | | | | | | | | | |
| | | LifePath Dynamic 2050 Master Portfolio | |
| |
| | | Year Ended December 31, | |
| | | 2019 | | | 2018 | | | 2017 | | | 2016 | | | 2015 | |
| | | | | |
Total Return | | | | | | | | | | | | | | | | | | | | |
Total return | | | 26.82 | % | | | (7.95 | )% | | | 23.28 | % | | | 8.57 | % | | | (1.96 | )% |
| | | | | | | | | | | | | | | | | | | | |
| | | | | |
Ratios to Average Net Assets(a) | | | | | | | | | | | | | | | | | | | | |
Total expenses | | | 0.53 | % | | | 0.53 | % | | | 0.51 | % | | | 0.51 | % | | | 0.51 | % |
| | | | | | | | | | | | | | | | | | | | |
Total expenses after fees waived and/or reimbursed | | | 0.20 | % | | | 0.20 | % | | | 0.18 | % | | | 0.19 | % | | | 0.17 | % |
| | | | | | | | | | | | | | | | | | | | |
Net investment income | | | 2.39 | % | | | 2.05 | % | | | 2.02 | % | | | 2.09 | % | | | 1.94 | % |
| | | | | | | | | | | | | | | | | | | | |
| | | | | |
Supplemental Data | | | | | | | | | | | | | | | | | | | | |
Net assets, end of year (000) | | $ | 113,834 | | | $ | 89,238 | | | $ | 121,754 | | | $ | 116,568 | | | $ | 114,904 | |
| | | | | | | | | | | | | | | | | | | | |
Portfolio turnover rate(b) | | | 42 | % | | | 43 | % | | | 35 | % | | | 70 | % | | | 36 | % |
| | | | | | | | | | | | | | | | | | | | |
| (a) | Includes the LifePath Dynamic Master Portfolio’s pro rata portion of expenses and share of the allocated net investment income from the following master portfolios (collectively, the “Underlying Master Portfolios”): |
| | | | |
| | | Range of Periods | |
Active Stock Master Portfolio | | | 2015 — 2019 | |
CoreAlpha Bond Master Portfolio | | | 2015 — 2019 | |
International Tilts Master Portfolio | | | 2015 — 2019 | |
| | | | |
| | | Range of Periods | |
Large Cap Index Master Portfolio | | | 2015 | |
Master Small Cap Index Series | | | 2015 — 2018 | |
Master Total Return Portfolio | | | 2019 | |
Includes the LifePath Dynamic Master Portfolio’s share of the Underlying Master Portfolios’ allocated fees waived and excludes expenses incurred indirectly as a result of investments in underlying funds:
| | | | | | | | | | | | | | | | | | | | |
| | | Year Ended December 31, | |
| | | 2019 | | | 2018 | | | 2017 | | | 2016 | | | 2015 | |
Allocated fees waived | | | 0.12 | % | | | 0.09 | % | | | 0.09 | % | | | 0.07 | % | | | 0.07 | % |
Investments in underlying funds | | | 0.12 | % | | | 0.12 | % | | | 0.16 | % | | | 0.19 | % | | | 0.17 | % |
| | | | | | | | | | | | | | | | | | | | |
The ratios do not reflect any expenses incurred indirectly as a result of investments in the following underlying funds:
| | | | |
| | | Range of Periods | |
BlackRock Cash Funds: Institutional | | | 2015 — 2019 | |
BlackRock Cash Funds: Prime | | | 2015 | |
BlackRock Cash Funds: Treasury | | | 2016 — 2019 | |
BlackRock Commodity Strategies Fund | | | 2015 — 2018 | |
| | | | |
| | | Range of Periods | |
BlackRock Advantage Emerging Markets Fund | | | 2015 — 2019 | |
BlackRock Tactical Opportunities Fund | | | 2016 — 2019 | |
iShares exchange-traded funds | | | 2015 — 2019 | |
iShares Developed Real Estate Index Fund | | | 2019 | |
(b) Includes the purchases and sales of the underlying funds and the Underlying Master Portfolios.
See notes to financial statements.
Financial Highlights (continued)
| | | | | | | | | | | | | | | | |
| | | LifePath Dynamic 2060 Master Portfolio | |
| | | |
| | | Year Ended
December 31, | | | | | | Period from
05/31/17 (a)
to 12/31/17 | |
| | | 2019 | | | 2018 | | | | |
|
Total Return | |
Total return | | | 26.91 | %(b) | | | (8.32 | )% | | | | | | | 11.93 | %(c) |
| | | | | | | | | | | | | | | | |
|
Ratios to Average Net Assets(d) | |
Total expenses | | | 1.46 | % | | | 1.62 | % | | | | | | | 1.54 | %(e)(f) |
| | | | | | | | | | | | | | | | |
Total expenses after fees waived and/or reimbursed | | | 0.20 | % | | | 0.19 | % | | | | | | | 0.20 | %(e) |
| | | | | | | | | | | | | | | | |
Net investment income | | | 2.58 | % | | | 2.11 | % | | | | | | | 2.27 | %(e) |
| | | | | | | | | | | | | | | | |
|
Supplemental Data | |
Net assets, end of period (000) | | $ | 4,298 | | | $ | 2,128 | | | | | | | $ | 2,263 | |
| | | | | | | | | | | | | | | | |
Portfolio turnover rate(g) | | | 44 | % | | | 58 | % | | | | | | | 35 | % |
| | | | | | | | | | | | | | | | |
| (a) | Commencement of operations. |
| (b) | Includes payment received from an affiliate, which impacted the Fund’s total return. Excluding the payment from an affiliate, the Fund’s total return is 26.80%. |
| (c) | Aggregate total return. |
| (d) | Includes the LifePath Dynamic Master Portfolio’s pro rata portion of expenses and share of the allocated net investment income from the following master portfolios (collectively, the “Underlying Master Portfolios”): |
| | | | |
| | | Range of Periods | |
Active Stock Master Portfolio | | | 2017 — 2019 | |
CoreAlpha Bond Master Portfolio | | | 2017 — 2019 | |
| | | | |
| | | Range of Periods | |
International Tilts Master Portfolio | | | 2017 — 2019 | |
Master Total Return Portfolio | | | 2019 | |
Includes the LifePath Dynamic Master Portfolio’s share of the Underlying Master Portfolios’ allocated fees waived and excludes expenses incurred indirectly as a result of investments in underlying funds:
| | | | | | | | | | | | | | | | |
| | | Year Ended
December 31, | | | | | | Period from
05/31/17 (a)
to 12/31/17 | |
| | | 2019 | | | 2018 | | | | |
Allocated fees waived | | | 0.11 | % | | | 0.08 | % | | | | | | | 0.09 | % |
Investments in underlying funds | | | 0.13 | % | | | 0.14 | % | | | | | | | 0.23 | % |
| | | | | | | | | | | | | | | | |
The ratios do not reflect any expenses incurred indirectly as a result of investments in the following underlying funds:
| | | | |
| | | Range of Periods | |
BlackRock Cash Funds: Treasury | | | 2017 — 2019 | |
BlackRock Commodity Strategies Fund | | | 2017 — 2019 | |
| | | | |
| | | Range of Periods | |
BlackRock Advantage Emerging Markets Fund | | | 2017 — 2019 | |
iShares exchange-traded funds | | | 2017 — 2019 | |
| (f) | Audit costs were not annualized in the calculation of the expense ratios. If these expenses were annualized, the total expenses would have been 2.00%. |
| (g) | Includes the purchases and sales of the underlying funds and the Underlying Master Portfolios. |
See notes to financial statements.
| | |
| 84 | | 2019 BLACKROCK ANNUAL REPORTTO SHAREHOLDERS |
Notes to Financial Statements
Master Investment Portfolio (“MIP”) is registered under the Investment Company Act of 1940, as amended (the “1940 Act”), as anopen-end management investment company. MIP is organized as a Delaware statutory trust. The financial statements and these accompanying notes relate to five series of MIP: LifePath® Dynamic Retirement Master Portfolio, LifePath® Dynamic 2030 Master Portfolio, LifePath® Dynamic 2040 Master Portfolio, LifePath® Dynamic 2050 Master Portfolio and LifePath® Dynamic 2060 Master Portfolio (each, a “LifePath Dynamic Master Portfolio” and together, the “LifePath Dynamic Master Portfolios”). Each LifePath Dynamic Master Portfolio is classified as diversified.
As of period end, the investment of LifePath Dynamic Retirement Master Portfolio, LifePath Dynamic 2030 Master Portfolio, LifePath Dynamic 2040 Master Portfolio, LifePath Dynamic 2050 Master Portfolio and LifePath Dynamic 2060 Master Portfolio in Active Stock Master Portfolio represented 22.2%, 35.8%, 47.1%, 52.4% and 52.0%, respectively, of net assets. The investment of LifePath Dynamic Retirement Master Portfolio, LifePath Dynamic 2030 Master Portfolio, LifePath Dynamic 2040 Master Portfolio, LifePath Dynamic 2050 Master Portfolio and LifePath Dynamic 2060 Master Portfolio in CoreAlpha Bond Master Portfolio represented 39.3%, 20.7%, 6.5%, 0.8% and 0.9%, respectively, of net assets. As such, financial statements of the Active Stock Master Portfolio and CoreAlpha Bond Master Portfolio, including the Schedules of Investments, should be read in conjunction with each respective LifePath Dynamic Master Portfolio’s financial statements. Active Stock Master Portfolio’s and CoreAlpha Bond Master Portfolio’s financial statements are available, without charge, on the U.S. Securities and Exchange Commission’s (“SEC’s”) website at sec.gov.
The LifePath Dynamic Master Portfolios will generally invest in other registered investment companies (each, an “Underlying Fund” and collectively, the “Underlying Funds”) that are managed by subsidiaries of BlackRock, Inc. (“BlackRock”) and its affiliates, which are affiliates of the LifePath Dynamic Master Portfolios. The LifePath Dynamic Master Portfolios may also invest in other master portfolios (“Underlying Master Portfolios”) that are managed by subsidiaries of BlackRock.
The value of a LifePath Dynamic Master Portfolio’s investment in each of Active Stock Master Portfolio, CoreAlpha Bond Master Portfolio, International Tilts Master Portfolio and Master Total Return Portfolio reflects that LifePath Dynamic Master Portfolio’s proportionate interest in the net assets of that Underlying Master Portfolio. As of period end, the LifePath Dynamic Master Portfolios held interests in Underlying Master Portfolios as follows:
| | | | | | | | | | | | | | | | |
| | | Active Stock Master Portfolio | | | CoreAlpha Bond Master Portfolio | | | International Tilts Master Portfolio | | | Master Total Return Portfolio | |
LifePath Dynamic Retirement Master Portfolio | | | 17.9 | % | | | 8.3 | % | | | 11.4 | % | | | 0.19 | % |
LifePath Dynamic 2030 Master Portfolio | | | 24.7 | | | | 3.7 | | | | 21.2 | | | | 0.08 | |
LifePath Dynamic 2040 Master Portfolio | | | 26.9 | | | | 1.0 | | | | 24.7 | | | | 0.02 | |
LifePath Dynamic 2050 Master Portfolio | | | 11.8 | | | | 0.0 | | | | 11.5 | | | | 0.0 | |
LifePath Dynamic 2060 Master Portfolio | | | 0.4 | | | | 0.0 | | | | 0.5 | | | | 0.0 | |
The LifePath Dynamic Master Portfolios, together with certain other registered investment companies advised by BlackRock Fund Advisors (“BFA” or the “Manager”) or its affiliates, are included in a complex of equity, multi-asset, index and money market funds referred to as the BlackRock Multi-Asset Complex.
On November 12-13, 2019, the Board of Trustees of MIP (the “Board”) approved a proposal pursuant to which each “feeder” fund will cease to invest in its corresponding LifePath Dynamic Master Portfolio as part of a “master-feeder” structure and instead each “feeder” fund will operate as a stand-alone fund. These changes are expected to be effective on or about March 9, 2020.
Reorganization: The Board of Trustees of MIP approved the reorganization of LifePath Dynamic 2020 Master Portfolio (the “Target Master Portfolio”) into LifePath Dynamic Retirement Master Portfolio. As a result, the LifePath Dynamic Retirement Master Portfolio acquired substantially all of the assets and assumed substantially all of the liabilities of the Target Master Portfolio in exchange for an equal aggregate value of newly-issued interests of the LifePath Dynamic Retirement Master Portfolio.
On November 18, 2019, all of the portfolio securities previously held by the Target Master Portfolio were subsequently contributed to the LifePath Dynamic Retirement Master Portfolio in exchange for an investment in LifePath Dynamic Retirement Master Portfolio.
For financial reporting purposes, assets received by LifePath Dynamic Retirement Master Portfolio were recorded at fair value. However, the cost basis of the investments received from the Target Master Portfolio was carried forward to align ongoing reporting of the LifePath Dynamic Retirement Master Portfolio’s realized and unrealized gains and losses with amounts distributable to shareholders of BlackRock LifePath Dynamic Retirement Fund for tax purposes.
The Target Master Portfolio’s net assets and composition of net assets on November 15, 2019, the valuation date of the reorganization were as follows:
| | | | |
| | | Target Master
Portfolio | |
Net assets | | $ | 255,409,896 | |
Investors’ Capital | | | 201,044,365 | |
Net Unrealized Appreciation | | | 54,365,531 | |
The net assets of LifePath Dynamic Retirement Master Portfolio before the reorganization were $147,936,865. The aggregate net assets of LifePath Dynamic Retirement Master Portfolio immediately after the reorganization amounted to $403,346,761. The Target Master Portfolio’s fair value and cost of investments and derivative financial instruments prior to the reorganization were as follows:
| | | | | | | | |
| Target Master Portfolio | | Fair Value of Investments | | | Cost of Investments | |
LifePath Dynamic 2020 Master Portfolio | | $ | 231,779,407 | | | $ | 177,413,876 | |
| | | | |
| NOTESTO FINANCIAL STATEMENTS | | | 85 | |
Notes to Financial Statements (continued)
The purpose of these transactions was to combine two funds managed by the Manager with substantially similar (but not identical) investment objectives, investment policies, strategies, risks and restrictions. The reorganization was atax-free event and was effective on November 18, 2019.
Assuming the reorganization had been completed on January 1, 2019, the beginning of the fiscal reporting period of the LifePath Dynamic Retirement Master Portfolio, the pro forma results of operations for the year ended December 31, 2019, are as follows:
| | • | | Net investment income: $9,865,049 |
| | • | | Net realized and change in unrealized gain on investments: $46,792,653 |
| | • | | Net increase in net assets resulting from operations: $56,657,702 |
Because the combined investment portfolios have been managed as a single integrated portfolio since the reorganization was completed, it is not practicable to separate the amounts of revenue and earnings of the Target Master Portfolio that have been included in LifePath Dynamic Retirement Master Portfolio’s Statements of Operations since November 18, 2019.
Reorganization costs incurred by LifePath Dynamic Retirement Master Portfolio in connection with the reorganization were expensed by LifePath Dynamic Retirement Master Portfolio.
| 2. | SIGNIFICANT ACCOUNTING POLICIES |
The financial statements are prepared in conformity with accounting principles generally accepted in the United States of America (“U.S. GAAP”), which may require management to make estimates and assumptions that affect the reported amounts of assets and liabilities in the financial statements, disclosure of contingent assets and liabilities at the date of the financial statements and the reported amounts of increases and decreases in net assets from operations during the reporting period. Actual results could differ from those estimates. Each LifePath Dynamic Master Portfolio is considered an investment company under U.S. GAAP and follows the accounting and reporting guidance applicable to investment companies. Below is a summary of significant accounting policies:
Investment Transactions and Income Recognition:For financial reporting purposes, investment transactions are recorded on the dates the transactions are executed. Realized gains and losses on investment transactions are determined on the identified cost basis. Dividend income is recorded on theex-dividend date. Dividends from foreign securities where theex-dividend date may have passed are subsequently recorded when the LifePath Dynamic Master Portfolios are informed of theex-dividend date. Under the applicable foreign tax laws, a withholding tax at various rates may be imposed on capital gains, dividends and interest. Upon notification from issuers, a portion of the dividend income received from a real estate investment trust may be redesignated as a reduction of cost of the related investment and/or realized gain.
Each LifePath Dynamic Master Portfolio records daily its proportionate share of the Underlying Master Portfolios’ income, expenses and realized and unrealized gains and losses.
Foreign Currency Translation:Each LifePath Dynamic Master Portfolio’s books and records are maintained in U.S. dollars. Securities and other assets and liabilities denominated in foreign currencies are translated into U.S. dollars using exchange rates determined as of the close of trading on the New York Stock Exchange (“NYSE”). Purchases and sales of investments are recorded at the rates of exchange prevailing on the respective dates of such transactions. Generally, when the U.S. dollar rises in value against a foreign currency, the investments denominated in that currency will lose value; the opposite effect occurs if the U.S. dollar falls in relative value.
Each LifePath Dynamic Master Portfolio does not isolate the portion of the results of operations arising as a result of changes in the exchange rates from the changes in the market prices of investments held or sold for financial reporting purposes. Accordingly, the effects of changes in exchange rates on investments are not segregated in the Statements of Operations from the effects of changes in market prices of those investments, but are included as a component of net realized and unrealized gain (loss) from investments. Each LifePath Dynamic Master Portfolio reports realized currency gains (losses) on foreign currency related transactions as components of net realized gain (loss) for financial reporting purposes, whereas such components are generally treated as ordinary income for U.S. federal income tax purposes.
Segregation and Collateralization:In cases where a LifePath Dynamic Master Portfolio enters into certain investments (e.g., futures contracts and forward foreign currency exchange contracts) that would be treated as “senior securities” for 1940 Act purposes, a LifePath Dynamic Master Portfolio may segregate or designate on its books and records cash or liquid assets having a market value at least equal to the amount of its future obligations under such investments. Doing so allows the investment or borrowings to be excluded from treatment as a “senior security.” Furthermore, if required by an exchange or counterparty agreement, the LifePath Dynamic Master Portfolios may be required to deliver/deposit cash and/or securities to/with an exchange, or broker-dealer or custodian as collateral for certain investments or obligations.
Indemnifications:In the normal course of business, a LifePath Dynamic Master Portfolio enters into contracts that contain a variety of representations that provide general indemnification. A LifePath Dynamic Master Portfolio’s maximum exposure under these arrangements is unknown because it involves future potential claims against a LifePath Dynamic Master Portfolio, which cannot be predicted with any certainty.
Other:Expenses directly related to a LifePath Dynamic Master Portfolio are charged to that LifePath Dynamic Master Portfolio. Other operating expenses shared by several funds, including other funds managed by the Manager, are prorated among those funds on the basis of relative net assets or other appropriate methods.
| 3. | INVESTMENT VALUATION AND FAIR VALUE MEASUREMENTS |
Investment Valuation Policies:The LifePath Dynamic Master Portfolios’ investments are valued at fair value (also referred to as “market value” within the financial statements) as of the close of trading on the NYSE (generally 4:00 p.m., Eastern time). U.S. GAAP defines fair value as the price the LifePath Dynamic Master Portfolios would receive to sell an asset or pay to transfer a liability in an orderly transaction between market participants at the measurement date. The LifePath Dynamic Master
| | |
| 86 | | 2019 BLACKROCK ANNUAL REPORTTO SHAREHOLDERS |
Notes to Financial Statements (continued)
Portfolios determine the fair values of their financial instruments using various independent dealers or pricing services under policies approved by the Board. The BlackRock Global Valuation Methodologies Committee (the “Global Valuation Committee”) is the committee formed by management to develop global pricing policies and procedures and to oversee the pricing function for all financial instruments.
Fair Value Inputs and Methodologies:The following methods and inputs are used to establish the fair value of each LifePath Dynamic Master Portfolio’s assets and liabilities:
| | • | | Equity investments traded on a recognized securities exchange are valued at the official closing price each day, if available. For equity investments traded on more than one exchange, the official closing price on the exchange where the stock is primarily traded is used. Equity investments traded on a recognized exchange for which there were no sales on that day may be valued at the last available bid (long positions) or ask (short positions) price. |
Generally, trading in foreign instruments is substantially completed each day at various times prior to the close of trading on the NYSE. Occasionally, events affecting the values of such instruments may occur between the foreign market close and the close of trading on the NYSE that may not be reflected in the computation of the LifePath Dynamic Master Portfolios’ net assets. Each business day, the LifePath Dynamic Master Portfolios use a pricing service to assist with the valuation of certain foreign exchange-traded equity securities and foreign exchange-traded andover-the-counter (“OTC”) options (the “Systematic Fair Value Price”). Using current market factors, the Systematic Fair Value Price is designed to value such foreign securities and foreign options at fair value as of the close of trading on the NYSE, which follows the close of the local markets.
| | • | | Investments inopen-end U.S. mutual funds are valued at net asset value (“NAV”) each business day. |
| | • | | Futures contracts traded on exchanges are valued at their last sale price. |
| | • | | Forward foreign currency exchange contracts are valued at the mean between the bid and ask prices and are determined as of the close of trading on the NYSE based on that day’s prevailing forward exchange rate for the underlying currencies. Interpolated values are derived when the settlement date of the contract is an interim date for which quotations are not available. |
If events (e.g., a company announcement, market volatility or a natural disaster) occur that are expected to materially affect the value of such investments, or in the event that the application of these methods of valuation results in a price for an investment that is deemed not to be representative of the market value of such investment, or if a price is not available, the investment will be valued by the Global Valuation Committee, or its delegate, in accordance with a policy approved by the Board as reflecting fair value (“Fair Valued Investments”). The fair valuation approaches that may be used by the Global Valuation Committee will include market approach, income approach and cost approach. Valuation techniques such as discounted cash flow, use of market comparables and matrix pricing are types of valuation approaches and are typically used in determining fair value. When determining the price for Fair Valued Investments, the Global Valuation Committee, or its delegate, seeks to determine the price that each LifePath Dynamic Master Portfolio might reasonably expect to receive or pay from the current sale or purchase of that asset or liability in anarm’s-length transaction. Fair value determinations shall be based upon all available factors that the Global Valuation Committee, or its delegate, deems relevant and consistent with the principles of fair value measurement. The pricing of all Fair Valued Investments is subsequently reported to the Board or a committee thereof on a quarterly basis.
Fair Value Hierarchy:Various inputs are used in determining the fair value of investments and derivative financial instruments. These inputs to valuation techniques are categorized into a fair value hierarchy consisting of three broad levels for financial statement purposes as follows:
| | • | | Level 1 — Unadjusted price quotations in active markets/exchanges for identical assets or liabilities that each LifePath Dynamic Master Portfolio has the ability to access |
| | • | | Level 2 — Other observable inputs (including, but not limited to, quoted prices for similar assets or liabilities in markets that are active, quoted prices for identical or similar assets or liabilities in markets that are not active, inputs other than quoted prices that are observable for the assets or liabilities (such as interest rates, yield curves, volatilities, prepayment speeds, loss severities, credit risks and default rates) or other market–corroborated inputs) |
| | • | | Level 3 — Unobservable inputs based on the best information available in the circumstances, to the extent observable inputs are not available (including the Global Valuation Committee’s assumptions used in determining the fair value of investments and derivative financial instruments) |
The hierarchy gives the highest priority to unadjusted quoted prices in active markets for identical assets or liabilities (Level 1 measurements) and the lowest priority to unobservable inputs (Level 3 measurements). Accordingly, the degree of judgment exercised in determining fair value is greatest for instruments categorized in Level 3. The inputs used to measure fair value may fall into different levels of the fair value hierarchy. In such cases, for disclosure purposes, the fair value hierarchy classification is determined based on the lowest level input that is significant to the fair value measurement in its entirety. Investments classified within Level 3 have significant unobservable inputs used by the Global Valuation Committee in determining the price for Fair Valued Investments. Level 3 investments include equity or debt issued by privately held companies or funds. There may not be a secondary market, and/or there are a limited number of investors. The categorization of a value determined for investments and derivative financial instruments is based on the pricing transparency of the investments and derivative financial instruments and is not necessarily an indication of the risks associated with investing in those securities.
As of December 31, 2019, certain investments of the LifePath Dynamic Master Portfolios were valued using NAV as no quoted market value is available and therefore have been excluded from the fair value hierarchy.
| 4. | SECURITIES AND OTHER INVESTMENTS |
Securities Lending:Certain LifePath Dynamic Master Portfolios may lend their securities to approved borrowers, such as brokers, dealers and other financial institutions. The borrower pledges and maintains with the LifePath Dynamic Master Portfolios collateral consisting of cash, an irrevocable letter of credit issued by a bank, or securities issued or guaranteed by the U.S. Government. The initial collateral received by each LifePath Dynamic Master Portfolio is required to have a value of at least 102% of the current value of the loaned securities for securities traded on U.S. exchanges and a value of at least 105% for all other securities. The collateral is maintained thereafter at
| | | | |
| NOTESTO FINANCIAL STATEMENTS | | | 87 | |
Notes to Financial Statements (continued)
a value equal to at least 100% of the current market value of the securities on loan. The market value of the loaned securities is determined at the close of each business day of the LifePath Dynamic Master Portfolio and any additional required collateral is delivered to the LifePath Dynamic Master Portfolio, or excess collateral returned by the LifePath Dynamic Master Portfolio, on the next business day. During the term of the loan, the LifePath Dynamic Master Portfolios are entitled to all distributions made on or in respect of the loaned securities, but do not receive interest income on securities received as collateral. Loans of securities are terminable at any time and the borrower, after notice, is required to return borrowed securities within the standard time period for settlement of securities transactions.
The market value of any securities on loan, all of which were classified as investment companies in the LifePath Dynamic Master Portfolios’ Schedules of Investments, and the value of any related collateral are shown separately in the Statements of Assets and Liabilities as a component of investments at value — unaffiliated, and collateral on securities loaned at value, respectively. As of period end, any securities on loan were collateralized by cash and/or U.S. Government obligations. Cash collateral invested by the securities lending agent, BlackRock Institutional Trust Company, N.A. (“BTC”), if any, is disclosed in the Schedules of Investments.
Securities lending transactions are entered into by the LifePath Dynamic Master Portfolios under Master Securities Lending Agreements (each, an “MSLA”), which provide the right, in the event of default (including bankruptcy or insolvency), for thenon-defaulting party to liquidate the collateral and calculate a net exposure to the defaulting party or request additional collateral. In the event that a borrower defaults, the LifePath Dynamic Master Portfolios, as lender, would offset the market value of the collateral received against the market value of the securities loaned. When the value of the collateral is greater than that of the market value of the securities loaned, the lender is left with a net amount payable to the defaulting party. However, bankruptcy or insolvency laws of a particular jurisdiction may impose restrictions on or prohibitions against such a right of offset in the event of an MSLA counterparty’s bankruptcy or insolvency. Under the MSLA, absent an event of default, the borrower can resell orre-pledge the loaned securities, and a LifePath Dynamic Master Portfolio can reinvest cash collateral received in connection with loaned securities. Upon an event of default, the parties’ obligations to return the securities or collateral to the other party are extinguished, and the parties can resell orre-pledge the loaned securities or the collateral received in connection with the loaned securities in order to satisfy the defaulting party’s net payment obligation for all transactions under the MSLA. The defaulting party remains liable for any deficiency.
As of period end, the following table is a summary of the LifePath Dynamic Master Portfolios’ securities lending agreements by counterparty which are subject to offset under an MSLA:
| | | | | | | | | | | | |
| Counterparty | | Securities
Loaned at Value | | | Cash Collateral
Received (a) | | | Net
Amount | |
LifePath Dynamic Retirement Master Portfolio | | | | | | | | | | | | |
Morgan Stanley & Co. LLC | | $ | 180,612 | | | $ | (180,612 | ) | | $ | — | |
Scotia Capital (USA), Inc. | | | 68,508 | | | | (68,508 | ) | | | — | |
| | | | | | | | | | | | |
| | $ | 249,120 | | | $ | (249,120 | ) | | $ | — | |
| | | | | | | | | | | | |
LifePath Dynamic 2030 Master Portfolio | | | | | | | | | | | | |
Bank of America N.A. | | $ | 862,618 | | | $ | (862,618 | ) | | $ | — | |
Scotia Capital (USA), Inc. | | | 105,876 | | | | (105,876 | ) | | | — | |
Virtu Americas, LLC | | | 37,368 | | | | (37,368 | ) | | | — | |
Wells Fargo Securities, LLC | | | 56,052 | | | | (56,052 | ) | | | — | |
| | | | | | | | | | | | |
| | $ | 1,061,914 | | | $ | (1,061,914 | ) | | $ | — | |
| | | | | | | | | | | | |
LifePath Dynamic 2040 Master Portfolio | | | | | | | | | | | | |
Bank of America N.A. | | $ | 3,615,291 | | | $ | (3,615,291 | ) | | $ | — | |
| | | | | | | | | | | | |
LifePath Dynamic 2050 Master Portfolio | | | | | | | | | | | | |
Bank of America N.A. | | $ | 2,858,652 | | | $ | (2,858,652 | ) | | $ | — | |
| | | | | | | | | | | | |
| | (a) | Collateral received in excess of the market value of securities on loan is not presented in this table. The total cash collateral received by each LifePath Dynamic Master Portfolio is disclosed in the LifePath Dynamic Master Portfolio‘s Statements of Assets and Liabilities. | |
The risks of securities lending include the risk that the borrower may not provide additional collateral when required or may not return the securities when due. To mitigate these risks, the LifePath Dynamic Master Portfolios benefit from a borrower default indemnity provided by BlackRock.BlackRock’s indemnity allows for full replacement of the securities loaned to the extent the collateral received does not cover the value on the securities loaned in the event of borrower default. Each LifePath Dynamic Master Portfolio could incur a loss if the value of an investment purchased with cash collateral falls below the market value of loaned securities or if the value of an investment purchased with cash collateral falls below the value of the original cash collateral received. Such losses are borne entirely by the LifePath Dynamic Master Portfolios.
| 5. | DERIVATIVE FINANCIAL INSTRUMENTS |
The LifePath Dynamic Master Portfolios engage in various portfolio investment strategies using derivative contracts both to increase the returns of the LifePath Dynamic Master Portfolios and/or to manage their exposure to certain risks such as credit risk, equity risk, interest rate risk, foreign currency exchange rate risk, commodity price risk or other risks (e.g., inflation risk). Derivative financial instruments categorized by risk exposure are included in the Schedules of Investments. These contracts may be transacted on an exchange or OTC.
Futures Contracts:Futures contracts are purchased or sold to gain exposure to, or manage exposure to, changes in interest rates (interest rate risk) and changes in the value of equity securities (equity risk) or foreign currencies (foreign currency exchange rate risk).
Futures contracts are agreements between the LifePath Dynamic Master Portfolios and a counterparty to buy or sell a specific quantity of an underlying instrument at a specified price and on a specified date. Depending on the terms of a contract, it is settled either through physical delivery of the underlying instrument on the settlement date or by payment of a cash amount on the settlement date. Upon entering into a futures contract, the LifePath Dynamic Master Portfolios are required to deposit initial
| | |
| 88 | | 2019 BLACKROCK ANNUAL REPORTTO SHAREHOLDERS |
Notes to Financial Statements (continued)
margin with the broker in the form of cash or securities in an amount that varies depending on a contract’s size and risk profile. The initial margin deposit must then be maintained at an established level over the life of the contract. Amounts pledged, which are considered restricted, are included in cash pledged for futures contracts in the Statements of Assets and Liabilities.
Securities deposited as initial margin are designated in the Schedules of Investments and cash deposited, if any, are shown as cash pledged for futures contracts in the Statements of Assets and Liabilities. Pursuant to the contract, the LifePath Dynamic Master Portfolios agree to receive from or pay to the broker an amount of cash equal to the daily fluctuation in market value of the contract (“variation margin”). Variation margin is recorded as unrealized appreciation (depreciation) and, if any, shown as variation margin receivable (or payable) on futures contracts in the Statements of Assets and Liabilities. When the contract is closed, a realized gain or loss is recorded in the Statements of Operations equal to the difference between the notional amount of the contract at the time it was opened and the notional amount at the time it was closed. The use of futures contracts involves the risk of an imperfect correlation in the movements in the price of futures contracts and interest, foreign currency exchange rates or underlying assets.
Forward Foreign Currency Exchange Contracts:Forward foreign currency exchange contracts are entered into to gain or reduce exposure to foreign currencies (foreign currency exchange rate risk).
A forward foreign currency exchange contract is an agreement between two parties to buy and sell a currency at a set exchange rate on a specified date. These contracts help to manage the overall exposure to the currencies in which some of the investments held by the LifePath Dynamic Master Portfolios are denominated and in some cases, may be used to obtain exposure to a particular market.
The contract ismarked-to-market daily and the change in market value is recorded as unrealized appreciation (depreciation) in the Statements of Assets and Liabilities. When a contract is closed, a realized gain or loss is recorded in the Statements of Operations equal to the difference between the value at the time it was opened and the value at the time it was closed.Non-deliverable forward foreign currency exchange contracts are settled with the counterparty in cash without the delivery of foreign currency. The use of forward foreign currency exchange contracts involves the risk that the value of a forward foreign currency exchange contract changes unfavorably due to movements in the value of the referenced foreign currencies, and such value may exceed the amounts reflected in the Statements of Assets and Liabilities. Cash amounts pledged for forward foreign currency exchange contracts are considered restricted and are included in cash pledged as collateral for OTC derivatives in the Statements of Assets and Liabilities.
Master Netting Arrangements: In order to define their contractual rights and to secure rights that will help mitigate their counterparty risk, the LifePath Dynamic Master Portfolios may enter into an International Swaps and Derivatives Association, Inc. Master Agreement (“ISDA Master Agreement”) or similar agreement with their counterparties. An ISDA Master Agreement is a bilateral agreement between each LifePath Dynamic Master Portfolio and a counterparty that governs certain OTC derivatives and typically contains, among other things, collateral posting terms and netting provisions in the event of a default and/or termination event. Under an ISDA Master Agreement, each LifePath Dynamic Master Portfolio may, under certain circumstances, offset with the counterparty certain derivative financial instruments’ payables and/or receivables with collateral held and/or posted and create one single net payment. The provisions of the ISDA Master Agreement typically permit a single net payment in the event of default including the bankruptcy or insolvency of the counterparty. Bankruptcy or insolvency laws of a particular jurisdiction may restrict or prohibit the right of offset in bankruptcy, insolvency or other events.
Collateral Requirements:For derivatives traded under an ISDA Master Agreement, the collateral requirements are typically calculated by netting themark-to-market amount for each transaction under such agreement and comparing that amount to the value of any collateral currently pledged by the LifePath Dynamic Master Portfolio and the counterparty.
Cash collateral that has been pledged to cover obligations of the LifePath Dynamic Master Portfolios and cash collateral received from the counterparty, if any, is reported separately in the Statements of Assets and Liabilities as cash pledged as collateral and cash received as collateral, respectively.Non-cash collateral pledged by the LifePath Dynamic Master Portfolios, if any, is noted in the Schedules of Investments. Generally, the amount of collateral due from or to a counterparty is subject to a certain minimum transfer amount threshold before a transfer is required, which is determined at the close of business of the LifePath Dynamic Master Portfolios. Any additional required collateral is delivered to/pledged by the LifePath Dynamic Master Portfolios on the next business day. Typically, the counterparty is not permitted to sell,re-pledge or use cash andnon-cash collateral it receives. A LifePath Dynamic Master Portfolio generally agrees not to usenon-cash collateral that it receives but may, absent default or certain other circumstances defined in the underlying ISDA Master Agreement, be permitted to use cash collateral received. In such cases, interest may be paid pursuant to the collateral arrangement with the counterparty. To the extent amounts due to the LifePath Dynamic Master Portfolios from their counterparties are not fully collateralized, they bear the risk of loss from counterpartynon-performance. Likewise, to the extent the LifePath Dynamic Master Portfolios have delivered collateral to a counterparty and stand ready to perform under the terms of their agreement with such counterparty, they bear the risk of loss from a counterparty in the amount of the value of the collateral in the event the counterparty fails to return such collateral. Based on the terms of agreements, collateral may not be required for all derivative contracts.
For financial reporting purposes, the LifePath Dynamic Master Portfolios do not offset derivative assets and derivative liabilities that are subject to netting arrangements, if any, in the Statements of Assets and Liabilities.
| 6. | INVESTMENT ADVISORY AGREEMENT AND OTHER TRANSACTIONS WITH AFFILIATES |
Investment Advisory: MIP, on behalf of the LifePath Dynamic Master Portfolios, entered into an Investment Advisory Agreement with the Manager, the LifePath Dynamic Master Portfolios’ investment adviser and an indirect, wholly-owned subsidiary of BlackRock, to provide investment advisory services. The Manager is responsible for the management of each LifePath Dynamic Master Portfolio’s portfolio and provides the personnel, facilities, equipment and certain other services necessary to the operations of each LifePath Dynamic Master Portfolio.
For such services, each LifePath Dynamic Master Portfolio pays the Manager a monthly fee at an annual rate equal to 0.35% of the average daily value of each LifePath Dynamic Master Portfolio’s net assets.
| | | | |
| NOTESTO FINANCIAL STATEMENTS | | | 89 | |
Notes to Financial Statements (continued)
With respect to each LifePath Dynamic Master Portfolio, the Manager entered into separatesub-advisory agreements with BlackRock International Limited (“BIL”) and BlackRock (Singapore) Limited (“BRS”) (collectively, the“Sub-Advisers”), each an affiliate of the Manager. The Manager pays eachSub-Adviser for services it provides for that portion of each LifePath Dynamic Master Portfolio for which it acts assub-adviser, a monthly fee that is equal to a percentage of the investment advisory fees paid by each LifePath Dynamic Master Portfolio to the Manager.
Administration:MIP, on behalf of the LifePath Dynamic Master Portfolios, entered into an Administration Agreement with BlackRock Advisors, LLC (“BAL”), which has agreed to provide general administrative services (other than investment advice and related portfolio activities). BAL has agreed to bear all of the LifePath Dynamic Master Portfolios’ ordinary operating expenses, excluding, generally, investment advisory fees, distribution fees, brokerage and other expenses related to the execution of portfolio transactions, extraordinary expenses and certain other expenses which are borne by the LifePath Dynamic Master Portfolios. BAL may delegate certain of its administration duties tosub-administrators.
BAL is not entitled to compensation for providing administrative services to the LifePath Dynamic Master Portfolios, for so long as BAL (or an affiliate) is entitled to compensation for providing administrative services to corresponding feeder funds that invest substantially all of their assets in the LifePath Dynamic Master Portfolios, or BAL (or an affiliate) receives investment advisory fees from the LifePath Dynamic Master Portfolios.
Expense Limitations and Waivers: BFA, with respect to each LifePath Dynamic Master Portfolio, has contractually agreed to waive 0.30% of its investment advisory fees through April 30, 2020 for each LifePath Dynamic Master Portfolio other than the LifePath Dynamic Retirement Master Portfolio (for which the contractual waiver is in effect through April 30, 2021). These amounts are included in fees waived and/or reimbursed by the Manager in the Statements of Operations. For the year ended December 31, 2019, the amounts waived and/or reimbursed were as follows:
| | | | |
| | | Amounts Waived | |
LifePath Dynamic Retirement Master Portfolio | | $ | 474,281 | |
LifePath Dynamic 2030 Master Portfolio | | | 1,001,741 | |
LifePath Dynamic 2040 Master Portfolio | | | 817,531 | |
LifePath Dynamic 2050 Master Portfolio | | | 311,349 | |
LifePath Dynamic 2060 Master Portfolio | | | 8,188 | |
With respect to each LifePath Dynamic Master Portfolio, the Manager voluntarily agreed to waive its investment advisory fees by the amount of investment advisory fees each LifePath Dynamic Master Portfolio pays to the Manager indirectly through its investment in affiliated money market funds (the “affiliated money market fund waiver”). However, the Manager does not waive its investment advisory fees by the amount of investment advisory fees paid in connection with each LifePath Dynamic Master Portfolio’s investments in other affiliated investment companies, if any. For the year ended December 31, 2019, the amounts waived were as follows:
| | | | |
| | | Amounts Waived | |
LifePath Dynamic Retirement Master Portfolio | | $ | 6,631 | |
LifePath Dynamic 2030 Master Portfolio | | | 9,224 | |
LifePath Dynamic 2040 Master Portfolio | | | 8,053 | |
LifePath Dynamic 2050 Master Portfolio | | | 4,196 | |
LifePath Dynamic 2060 Master Portfolio | | | 67 | |
The fees and expenses of MIP’s trustees who are not “interested persons” of MIP, as defined in the 1940 Act (“Independent Trustees”), counsel to the Independent Trustees and MIP’s independent registered public accounting firm (together, the “independent expenses”) are paid directly by the LifePath Dynamic Master Portfolios. BAL and BFA have contractually agreed to reimburse the LifePath Dynamic Master Portfolios or provide an offsetting credit against the investment advisory fees paid by the LifePath Dynamic Master Portfolios in an amount equal to these independent expenses through April 30, 2029 for each LifePath Dynamic Master Portfolio other than the LifePath Dynamic Retirement Master Portfolio (for which the contractual arrangement is in effect through April 30, 2030). If the LifePath Dynamic Master Portfolios do not pay administration fees, BAL and BFA agree to cap the expenses of each LifePath Dynamic Master Portfolio at the rate at which it pays an investment advisory fee to BFA. These amounts are included in fees waived and/or reimbursed by the Manager in the Statements of Operations. For the year ended December 31, 2019, the amounts waived were as follows:
| | | | |
| | | Amounts Waived | |
LifePath Dynamic Retirement Master Portfolio | | $ | 28,129 | |
LifePath Dynamic 2030 Master Portfolio | | | 31,801 | |
LifePath Dynamic 2040 Master Portfolio | | | 30,689 | |
LifePath Dynamic 2050 Master Portfolio | | | 27,763 | |
LifePath Dynamic 2060 Master Portfolio | | | 26,031 | |
Securities Lending: The U.S. Securities and Exchange Commission (“SEC”) has issued an exemptive order which permits BTC, an affiliate of the Manager, to serve as securities lending agent for the LifePath Dynamic Master Portfolios, subject to applicable conditions. As securities lending agent, BTC bears all operational costs directly related to securities lending. The LifePath Dynamic Master Portfolios are responsible for fees in connection with the investment of cash collateral received for securities on loan (the “collateral investment fees”). The cash collateral is invested in a money market fund managed by the Manager or its affiliates. However, BTC has agreed to reduce the amount of securities lending income it receives in order to effectively limit the collateral investment fees the LifePath Dynamic Master Portfolios bear to an annual rate of 0.04%. The shares of such money market fund will not be subject to a sales load, distribution fee or service fee. The money market fund in which the cash collateral has been invested may, under certain circumstances, impose a liquidity fee of up to 2% of the value redeemed or temporarily restrict redemptions for up to 10 business days during a90-day period, in the event that the money market fund’s weekly liquid assets fall below certain thresholds.
| | |
| 90 | | 2019 BLACKROCK ANNUAL REPORTTO SHAREHOLDERS |
Notes to Financial Statements (continued)
Securities lending income is equal to the total of income earned from the reinvestment of cash collateral, net of fees and other payments to and from borrowers of securities, and less the collateral investment fees. Each LifePath Dynamic Master Portfolio retains a portion of securities lending income and remits a remaining portion to BTC as compensation for its services as securities lending agent.
Pursuant to the current securities lending agreement, each LifePath Dynamic Master Portfolio retains 82% of securities lending income (which excludes collateral investment fees), and this amount retained can never be less than 70% of the total of securities lending income plus the collateral investment fees.
In addition, commencing the business day following the date that the aggregate securities lending income earned across the BlackRock Multi-Asset Complex in a calendar year exceeds a specified threshold, each LifePath Dynamic Master Portfolio, pursuant to the securities lending agreement, will retain for the remainder of that calendar year securities lending income in an amount equal to 85% of securities lending income (which excludes collateral investment fees), and this amount retained can never be less than 70% of the total of securities lending income plus the collateral investment fees.
The share of securities lending income earned by each LifePath Dynamic Master Portfolio is shown as securities lending income — affiliated — net in the Statements of Operations. For the year ended December 31, 2019, each LifePath Dynamic Master Portfolio paid BTC the following amounts for securities lending agent services:
| | | | | | | | | | | | | | | | | | | | |
| | | LifePath Dynamic Retirement Master Portfolio | | | LifePath Dynamic 2030 Master Portfolio | | | LifePath Dynamic 2040 Master Portfolio | | | LifePath Dynamic 2050 Master Portfolio | | | LifePath Dynamic 2060 Master Portfolio | |
Amount | | $ | 1,226 | | | $ | 3,725 | | | $ | 3,831 | | | $ | 1,869 | | | $ | — | |
Interfund Lending: In accordance with an exemptive order (the “Order”) from the SEC, each LifePath Dynamic Master Portfolio may participate in a joint lending and borrowing facility for temporary purposes (the “Interfund Lending Program”), subject to compliance with the terms and conditions of the Order, and to the extent permitted by each LifePath Dynamic Master Portfolio’s investment policies and restrictions. Each LifePath Dynamic Master Portfolio is currently permitted to borrow and lend under the Interfund Lending Program.
A lending BlackRock fund may lend in aggregate up to 15% of its net assets, but may not lend more than 5% of its net assets to any one borrowing fund through the Interfund Lending Program. A borrowing BlackRock fund may not borrow through the Interfund Lending Program or from any other source more than 33 1/3% of its total assets (or any lower threshold provided for by the fund’s investment restrictions). If a borrowing BlackRock fund’s total outstanding borrowings exceed 10% of its total assets, each of its outstanding interfund loans will be subject to collateralization of at least 102% of the outstanding principal value of the loan. All interfund loans are for temporary or emergency purposes and the interest rate to be charged will be the average of the highest current overnight repurchase agreement rate available to a lending fund and the bank loan rate, as calculated according to a formula established by the Board.
During the year ended December 31, 2019, the LifePath Dynamic Master Portfolios did not participate in the Interfund Lending Program.
Trustees and Officers: Certain trustees and/or officers of MIP are directors and/or officers of BlackRock or its affiliates.
Each LifePath Dynamic Master Portfolio may invest its positive cash balances in certain money market funds managed by the Manager or an affiliate. The income earned on these temporary cash investments is shown as income-affiliated in the Statements of Operations.
Other Transactions: During the year ended December 31, 2019, LifePath Dynamic 2060 Master Portfolio received a reimbursement of $2,603 from an affiliate, which is included in payment from affiliate in the Statements of Operations, related to an operating event.
For the year ended December 31, 2019, purchases and sales of investments in the Underlying Funds and Underlying Master Portfolios, and excluding short-term securities, were as follows:
| | | | | | | | | | | | | | | | | | | | |
| | | LifePath Dynamic Retirement Master Portfolio | | | LifePath Dynamic 2030 Master Portfolio | | | LifePath Dynamic 2040 Master Portfolio | | | LifePath Dynamic 2050 Master Portfolio | | | LifePath Dynamic 2060 Master Portfolio | |
Purchases | | $ | 73,117,367 | | | $ | 102,261,929 | | | $ | 91,765,479 | | | $ | 40,570,243 | | | $ | 2,481,827 | |
Sales | | | 53,596,780 | | | | 144,068,770 | | | | 126,405,271 | | | | 47,416,345 | | | | 1,161,812 | |
Each LifePath Dynamic Master Portfolio is classified as a partnership for U.S. federal income tax purposes. As such, each investor in the LifePath Dynamic Master Portfolios is treated as the owner of its proportionate share of net assets, income, expenses and realized and unrealized gains and losses of the LifePath Dynamic Master Portfolios. Therefore, no U.S. federal income tax provision is required. It is intended that the LifePath Dynamic Master Portfolios’ assets will be managed so an investor in the LifePath Dynamic Master Portfolios can satisfy the requirements of Subchapter M of the Internal Revenue Code of 1986, as amended.
Each LifePath Dynamic Master Portfolio files U.S. federal and various state and local tax returns. No income tax returns are currently under examination. The statute of limitations on each LifePath Dynamic Master Portfolio’s U.S. federal tax returns generally remains open for each of the four years ended December 31, 2019 except for LifePath Dynamic 2060 Master Portfolio, which remains open for the period ended December 31, 2017 through the year ended December 31, 2019. The statutes of limitations on each LifePath Dynamic Master Portfolio’s state and local tax returns may remain open for an additional year depending upon the jurisdiction.
| | | | |
| NOTESTO FINANCIAL STATEMENTS | | | 91 | |
Notes to Financial Statements (continued)
Management has analyzed tax laws and regulations and their application to the LifePath Dynamic Master Portfolios as of December 31, 2019, inclusive of the open tax return years, and does not believe that there are any uncertain tax positions that require recognition of a tax liability in the LifePath Dynamic Master Portfolios’ financial statements.
As of December 31, 2019, gross unrealized appreciation and depreciation for investments and derivatives based on cost for U.S. federal income tax purposes were as follows:
| | | | | | | | | | | | | | | | | | | | |
| | | LifePath Dynamic Retirement Master Portfolio | | | LifePath Dynamic 2030 Master Portfolio | | | LifePath Dynamic 2040 Master Portfolio | | | LifePath Dynamic 2050 Master Portfolio | | | LifePath Dynamic 2060 Master Portfolio | |
Tax cost | | $ | 319,362,495 | | | $ | 318,785,567 | | | $ | 246,561,954 | | | $ | 97,716,908 | | | $ | 3,921,373 | |
| | | | | | | | | | | | | | | | | | | | |
Gross unrealized appreciation | | $ | 93,108,010 | | | $ | 46,435,224 | | | $ | 49,989,188 | | | $ | 18,901,265 | | | $ | 373,247 | |
Gross unrealized depreciation | | | (409,116 | ) | | | (14,639,425 | ) | | | (4,742,512 | ) | | | (114,887 | ) | | | (4,653 | ) |
| | | | | | | | | | | | | | | | | | | | |
Net unrealized appreciation | | $ | 92,698,894 | | | $ | 31,795,799 | | | $ | 45,246,676 | | | $ | 18,786,378 | | | $ | 368,594 | |
| | | | | | | | | | | | | | | | | | | | |
MIP, on behalf of the LifePath Dynamic Master Portfolios, along with certain other funds managed by the Manager and its affiliates (“Participating Funds”), is a party to a364-day, $2.25 billion credit agreement with a group of lenders. Under this agreement, the LifePath Dynamic Master Portfolios may borrow to fund shareholder redemptions. Excluding commitments designated for certain individual funds, the Participating Funds, including the LifePath Dynamic Master Portfolios, can borrow up to an aggregate commitment amount of $1.75 billion at any time outstanding, subject to asset coverage and other limitations as specified in the agreement. The credit agreement has the following terms: a fee of 0.10% per annum on unused commitment amounts and interest at a rate equal to the higher of(a) one-month LIBOR (but, in any event, not less than 0.00%) on the date the loan is made plus 0.80% per annum or (b) the Fed Funds rate (but, in any event, not less than 0.00%) in effect from time to time plus 0.80% per annum on amounts borrowed. The agreement expires in April 2020 unless extended or renewed. Prior to April 18, 2019, Participating Funds paid an upfront commitment fee of 0.02% on the total commitment amounts, in addition to administration, legal and arrangement fees, which are included in miscellaneous expenses in the Statements of Operations. These fees were allocated among such funds based upon portions of the aggregate commitment available to them and relative net assets of Participating Funds. During the year ended December 31, 2019, the LifePath Dynamic Master Portfolios did not borrow under the credit agreement.
In the normal course of business, certain LifePath Dynamic Master Portfolios invest in securities or other instruments and may enter into certain transactions, and such activities subject each LifePath Dynamic Master Portfolio to various risks, including among others, fluctuations in the market (market risk) or failure of an issuer to meet all of its obligations. The value of securities or other instruments may also be affected by various factors, including, without limitation: (i) the general economy; (ii) the overall market as well as local, regional or global political and/or social instability; (iii) regulation, taxation or international tax treaties between various countries; or (iv) currency, interest rate and price fluctuations. Each LifePath Dynamic Master Portfolio’s prospectus provides details of the risks to which each LifePath Dynamic Master Portfolio is subject.
The LifePath Dynamic Master Portfolios may be exposed to additional risks when reinvesting cash collateral in money market funds that do not seek to maintain a stable NAV per share of $1.00, which may be subject to redemption gates or liquidity fees under certain circumstances.
Valuation Risk:The market values of equities, such as common stocks and preferred securities or equity related investments, such as futures and options, may decline due to general market conditions which are not specifically related to a particular company. They may also decline due to factors which affect a particular industry or industries. A LifePath Dynamic Master Portfolio may invest in illiquid investments. An illiquid investment is any investment that a LifePath Dynamic Master Portfolio reasonably expects cannot be sold or disposed of in current market conditions in seven calendar days or less without the sale or disposition significantly changing the market value of the investment. A LifePath Dynamic Master Portfolio may experience difficulty in selling illiquid investments in a timely manner at the price that it believes the investments are worth. Prices may fluctuate widely over short or extended periods in response to company, market or economic news. Markets also tend to move in cycles, with periods of rising and falling prices. This volatility may cause each LifePath Dynamic Master Portfolio’s NAV to experience significant increases or decreases over short periods of time. If there is a general decline in the securities and other markets, the NAV of a LifePath Dynamic Master Portfolio may lose value, regardless of the individual results of the securities and other instruments in which a LifePath Dynamic Master Portfolio invests.
Counterparty Credit Risk:The LifePath Dynamic Master Portfolios may be exposed to counterparty credit risk, or the risk that an entity may fail to or be unable to perform on its commitments related to unsettled or open transactions. The LifePath Dynamic Master Portfolios manage counterparty credit risk by entering into transactions only with counterparties that the Manager believes have the financial resources to honor their obligations and by monitoring the financial stability of those counterparties. Financial assets, which potentially expose the LifePath Dynamic Master Portfolios to market, issuer and counterparty credit risks, consist principally of financial instruments and receivables due from counterparties. The extent of the LifePath Dynamic Master Portfolios’ exposure to market, issuer and counterparty credit risks with respect to these financial assets is approximately their value recorded in the Statements of Assets and Liabilities, less any collateral held by the LifePath Dynamic Master Portfolios.
A derivative contract may suffer amark-to-market loss if the value of the contract decreases due to an unfavorable change in the market rates or values of the underlying instrument. Losses can also occur if the counterparty does not perform under the contract.
A LifePath Dynamic Master Portfolio’s risk of loss from counterparty credit risk on OTC derivatives is generally limited to the aggregate unrealized gain less the value of any collateral held by such LifePath Dynamic Master Portfolio.
| | |
| 92 | | 2019 BLACKROCK ANNUAL REPORTTO SHAREHOLDERS |
Notes to Financial Statements (continued)
With exchange-traded futures, there is less counterparty credit risk to the LifePath Dynamic Master Portfolios since the exchange or clearinghouse, as counterparty to such instruments, guarantees against a possible default. The clearinghouse stands between the buyer and the seller of the contract; therefore, credit risk is limited to failure of the clearinghouse. While offset rights may exist under applicable law, a LifePath Dynamic Master Portfolio does not have a contractual right of offset against a clearing broker or clearinghouse in the event of a default (including the bankruptcy or insolvency). Additionally, credit risk exists in exchange-traded futures with respect to initial and variation margin that is held in a clearing broker’s customer accounts. While clearing brokers are required to segregate customer margin from their own assets, in the event that a clearing broker becomes insolvent or goes into bankruptcy and at that time there is a shortfall in the aggregate amount of margin held by the clearing broker for all its clients, typically the shortfall would be allocated on a pro rata basis across all the clearing broker’s customers, potentially resulting in losses to the LifePath Dynamic Master Portfolios.
Concentration Risk: Certain Funds invest a significant portion of their assets in fixed-income securities and/or use derivatives tied to the fixed-income markets. Changes in market interest rates or economic conditions may affect the value and/or liquidity of such investments. Interest rate risk is the risk that prices of bonds and other fixed-income securities will increase as interest rates fall and decrease as interest rates rise. The Funds may be subject to a greater risk of rising interest rates due to the current period of historically low rates.
Management has evaluated the impact of all subsequent events on the LifePath Dynamic Master Portfolios through the date the financial statements were issued and has determined that there were no subsequent events requiring adjustment or additional disclosure in the financial statements.
| | | | |
| NOTESTO FINANCIAL STATEMENTS | | | 93 | |
| | |
| Report of Independent Registered Public Accounting Firm | | Master Investment Portfolio |
To the Board of Trustees of
Master Investment Portfolio and Investors of LifePath® Dynamic Retirement Master Portfolio, LifePath® Dynamic 2030 Master Portfolio, LifePath® Dynamic 2040 Master Portfolio, LifePath® Dynamic 2050 Master Portfolio and LifePath® Dynamic 2060 Master Portfolio
Opinions on the Financial Statements
We have audited the accompanying statements of assets and liabilities, including the schedules of investments, of LifePath® Dynamic Retirement Master Portfolio, LifePath® Dynamic 2030 Master Portfolio, LifePath® Dynamic 2040 Master Portfolio, LifePath® Dynamic 2050 Master Portfolio and LifePath® Dynamic 2060 Master Portfolio (five of the series constituting Master Investment Portfolio, hereafter collectively referred to as the “Master Portfolios”) as of December 31, 2019, the related statements of operations for the year ended December 31, 2019, the statements of changes in net assets for each of the two years in the period ended December 31, 2019, including the related notes, and the financial highlights for each of the periods indicated therein (collectively referred to as the “financial statements”). In our opinion, the financial statements present fairly, in all material respects, the financial position of each of the Master Portfolios as of December 31, 2019, the results of each of their operations for the year then ended, the changes in each of their net assets for each of the two years in the period ended December 31, 2019 and each of the financial highlights for each of the periods indicated therein in conformity with accounting principles generally accepted in the United States of America.
Basis for Opinions
These financial statements are the responsibility of the Master Portfolios’ management. Our responsibility is to express an opinion on the Master Portfolios’ financial statements based on our audits. We are a public accounting firm registered with the Public Company Accounting Oversight Board (United States) (“PCAOB”) and are required to be independent with respect to the Master Portfolios in accordance with the U.S. federal securities laws and the applicable rules and regulations of the Securities and Exchange Commission and the PCAOB.
We conducted our audits of these financial statements in accordance with the standards of the PCAOB. Those standards require that we plan and perform the audit to obtain reasonable assurance about whether the financial statements are free of material misstatement, whether due to error or fraud.
Our audits included performing procedures to assess the risks of material misstatement of the financial statements, whether due to error or fraud, and performing procedures that respond to those risks. Such procedures included examining, on a test basis, evidence regarding the amounts and disclosures in the financial statements. Our audits also included evaluating the accounting principles used and significant estimates made by management, as well as evaluating the overall presentation of the financial statements. Our procedures included confirmation of securities owned as of December 31, 2019 by correspondence with the custodian, administrator of the Master Portfolios, transfer agents and brokers; when replies were not received from brokers, we performed other auditing procedures. We believe that our audits provide a reasonable basis for our opinions.
/s/PricewaterhouseCoopers LLP
Philadelphia, Pennsylvania
February 27, 2020
We have served as the auditor of one or more BlackRock investment companies since 2000.
| | |
| 94 | | 2019 BLACKROCK ANNUAL REPORTTO SHAREHOLDERS |
Statement Regarding Liquidity Risk Management Program
The Securities and Exchange Commission adopted Rule 22e-4 under the Investment Company Act of 1940, as amended (the “Liquidity Rule”) to promote effective liquidity risk management throughout the open-end investment company industry, thereby reducing the risk that funds will be unable to meet their redemption obligations and mitigating dilution of the interests of fund shareholders.
The Board of Trustees (the “Board”) of BlackRock Funds III, on behalf of BlackRock LifePath® Dynamic Retirement Fund, BlackRock LifePath® Dynamic 2030 Fund, BlackRock LifePath® Dynamic 2040 Fund, BlackRock LifePath® Dynamic 2050 Fund and BlackRock LifePath® Dynamic 2060 Fund, and MIP, on behalf of LifePath® Dynamic Retirement Master Portfolio, LifePath® Dynamic 2030 Master Portfolio, LifePath® Dynamic 2040 Master Portfolio, LifePath® Dynamic 2050 Master Portfolio, and LifePath® Dynamic 2060 Master Portfolio, met on November 12-13, 2019 (the “Meeting”) to review the liquidity risk management program (the “Program”) applicable to the BlackRock open-end funds, excluding money market funds (each, a “Fund”), pursuant to the Liquidity Rule. The Board has appointed BlackRock Advisors, LLC or BlackRock Fund Advisors (“BlackRock”), each an investment adviser to certain Funds, as the program administrator for each Fund’s Program, as applicable. BlackRock has delegated oversight of the Program to the 40 Act Liquidity Risk Management Committee (the “Committee”). At the Meeting, the Committee, on behalf of BlackRock, provided the Board with a report that addressed the operation of the Program and assessed its adequacy and effectiveness of implementation, including the operation of each Fund’s Highly Liquid Investment Minimum (“HLIM”) where applicable, and any material changes to the Program (the “Report”). The Report covered the period from December 1, 2018 through September 30, 2019 (the “Program Reporting Period”).
The Report described the Program’s liquidity classification methodology for categorizing a Fund’s investments (including derivative transactions) into one of four liquidity buckets. It also described BlackRock’s methodology in establishing a Fund’s HLIM and noted that the Committee reviews and ratifies the HLIM assigned to each Fund no less frequently than annually.
The Report noted that the Program complied with the key factors for consideration under the Liquidity Rule for assessing, managing and periodically reviewing a Fund’s liquidity risk, as follows:
A. The Fund’s investment strategy and liquidity of portfolio investments during both normal and reasonably foreseeable stressed conditions: During the Program Reporting Period, the Committee reviewed whether each Fund’s strategy is appropriate for an open-end fund structure with a focus on Funds with more significant and consistent holdings of less liquid and illiquid assets. The Committee also factored a Fund’s concentration in an issuer into the Program’s liquidity classification methodology by taking issuer position sizes into account. Where a Fund participated in borrowings for investment purposes (such as tender option bonds and reverse repurchase agreements), such borrowings were factored into the Program’s calculation of a Fund’s liquidity bucketing. Derivative exposure was also considered in such calculation.
B. Short-term and long-term cash flow projections during both normal and reasonably foreseeable stressed conditions: During the Program Reporting Period, the Committee reviewed historical net redemption activity and used this information as a component to establish each Fund’s reasonably anticipated trading size (“RATS”). Each Fund has adopted an in-kind redemption policy which may be utilized to meet larger redemption requests. The Committee may also take into consideration a Fund’s shareholder ownership concentration (which, depending on product type and distribution channel, may or may not be available), a Fund’s distribution channels, and the degree of certainty associated with a Fund’s short-term and long-term cash flow projections.
C. Holdings of cash and cash equivalents, as well as borrowing arrangements: The Committee considered the terms of the credit facility applicable to the Funds, the financial health of the institution providing the facility and the fact that the credit facility is shared among multiple Funds (including that a portion of the aggregate commitment amount is specifically designated for BlackRock Floating Rate Income Portfolio and BlackRock Credit Strategies Income Fund, each a series of BlackRock Funds V). The Committee also considered other types of borrowing available to the Funds, such as the ability to use reverse repurchase agreements and interfund lending, as applicable.
There were no material changes to the Program during the Program Reporting Period. The Report provided to the Board stated that the Committee concluded that based on the operation of the functions, as described in the Report, the Program is operating as intended and is effective in implementing the requirements of the Liquidity Rule.
| | | | |
| STATEMENT REGARDING LIQUIDITY RISK MANAGEMENT PROGRAM | | | 95 | |
Trustee and Officer Information
| | | | | | | | |
| Independent Trustees (a) |
| | | | | |
Name
Year of Birth (b) | | Position(s) Held
(Length of Service) (c) | | Principal Occupation(s)
During Past Five Years | | Number of BlackRock-Advised
Registered Investment Companies
(“RICs”) Consisting of
Investment Portfolios
(“Portfolios”) Overseen | | Public Company and
Other Investment Company
Directorships Held During
Past Five Years |
Mark Stalnecker 1951 | | Chair of the Board
(Since 2019) and Trustee
(Since 2015) | | Chief Investment Officer, University of Delaware from 1999 to 2013; Trustee and Chair of the Finance and Investment Committees, Winterthur Museum and Country Estate from 2005 to 2016; Member of the Investment Committee, Delaware Public Employees’ Retirement System since 2002; Member of the Investment Committee, Christiana Care Health System from 2009 to 2017; Member of the Investment Committee, Delaware Community Foundation from 2013 to 2014; Director and Chair of the Audit Committee, SEI Private Trust Co. from 2001 to 2014. | | 37 RICs consisting of 177 Portfolios | | None |
Bruce R. Bond 1946 | | Trustee
(Since 2019) | | Board Member, Amsphere Limited (software) since 2018; Trustee and Member of the Governance Committee, State Street Research Mutual Funds from 1997 to 2005; Board Member of Governance, Audit and Finance Committee, Avaya Inc. (computer equipment) from 2003 to 2007. | | 37 RICs consisting of 177 Portfolios | | None |
Susan J. Carter 1956 | | Trustee
(Since 2016) | | Director, Pacific Pension Institute from 2014 to 2018; Advisory Board Member, Center for Private Equity and Entrepreneurship at Tuck School of Business since 1997; Senior Advisor, Commonfund Capital, Inc. (“CCI”) (investment adviser) in 2015; Chief Executive Officer, CCI from 2013 to 2014; President & Chief Executive Officer, CCI from 1997 to 2013; Advisory Board Member, Girls Who Invest from 2015 to 2018 and Board Member thereof since 2018; Advisory Board Member, Bridges Fund Management since 2016; Trustee, Financial Accounting Foundation since 2017; Practitioner Advisory Board Member, Private Capital Research Institute (“PCRI”) since 2017. | | 37 RICs consisting of 177 Portfolios | | None |
Collette Chilton 1958 | | Trustee
(Since 2015) | | Chief Investment Officer, Williams College since 2006; Chief Investment Officer, Lucent Asset Management Corporation from 1998 to 2006. | | 37 RICs consisting of 177 Portfolios | | None |
Neil A. Cotty 1954 | | Trustee
(Since 2016) | | Bank of America Corporation from 1996 to 2015, serving in various senior finance leadership roles, including Chief Accounting Officer from 2009 to 2015, Chief Financial Officer of Global Banking, Markets and Wealth Management from 2008 to 2009, Chief Accounting Officer from 2004 to 2008, Chief Financial Officer of Consumer Bank from 2003 to 2004, Chief Financial Officer of Global Corporate Investment Bank from 1999 to 2002. | | 37 RICs consisting of 177 Portfolios | | None |
Lena G. Goldberg 1949 | | Trustee
(Since 2019) | | Senior Lecturer, Harvard Business School, since 2008; Director, Charles Stark Draper Laboratory, Inc. since 2013; FMR LLC/Fidelity Investments (financial services) from 1996 to 2008, serving in various senior roles including Executive Vice President — Strategic Corporate Initiatives and Executive Vice President and General Counsel; Partner, Sullivan & Worcester LLP from 1985 to 1996 and Associate thereof from 1979 to 1985. | | 37 RICs consisting of 177 Portfolios | | None |
| | |
| 96 | | 2019 BLACKROCK ANNUAL REPORTTO SHAREHOLDERS |
Trustee and Officer Information (continued)
| | | | | | | | |
| Independent Trustees (a)(continued) |
| | | | | |
Name
Year of Birth (b) | | Position(s) Held
(Length of Service) (c) | | Principal Occupation(s)
During Past Five Years | | Number of BlackRock-Advised
Registered Investment Companies
(“RICs”) Consisting of
Investment Portfolios
(“Portfolios”) Overseen | | Public Company and
Other Investment Company
Directorships Held During
Past Five Years |
Robert M. Hernandez 1944 | | Trustee
(Since 2019) | | Director, Vice Chairman and Chief Financial Officer of USX Corporation (energy and steel business) from 1991 to 2001; Director andnon-executive Chairman, RTI International Metals, Inc. from 1990 to 2015; Director, TE Connectivity (electronics) from 2006 to 2012. | | 37 RICs consisting of 177 Portfolios | | Chubb Limited (insurance company); Eastman Chemical Company
|
Henry R. Keizer 1956 | | Trustee
(Since 2019) | | Director, Park Indemnity Ltd. (captive insurer) since 2010; Director, MUFG Americas Holdings Corporation and MUFG Union Bank, N.A. (financial and bank holding company) from 2014 to 2016; Director, American Institute of Certified Public Accountants from 2009 to 2011; Director, KPMG LLP (audit, tax and advisory services) from 2004 to 2005 and 2010 to 2012; Director, KPMG International in 2012, Deputy Chairman and Chief Operating Officer thereof from 2010 to 2012 and U.S. Vice Chairman of Audit thereof from 2005 to 2010; Global Head of Audit, KPMGI (consortium of KPMG firms) from 2006 to 2010; Director, YMCA of Greater New York from 2006 to 2010. | | 37 RICs consisting of 177 Portfolios | | Hertz Global Holdings (car rental); Montpelier Re Holdings, Ltd. (publicly held property and casualty reinsurance) from 2013 until 2015; Sealed Air Corp. (packaging); WABCO (commercial vehicle safety systems) |
Cynthia A. Montgomery 1952 | | Trustee
(Since 2009) | | Professor, Harvard Business School since 1989. | | 37 RICs consisting of 177 Portfolios | | Newell Rubbermaid, Inc. (manufacturing) |
Donald C. Opatrny 1952 | | Trustee
(Since 2019) | | Trustee, Vice Chair, Member of the Executive Committee and Chair of the Investment Committee, Cornell University since 2004; President, Trustee and Member of the Investment Committee, The Aldrich Contemporary Art Museum from 2007 to 2014; Member of the Board and Investment Committee, University School from 2007 to 2018; Member of the Investment Committee, Mellon Foundation from 2009 to 2015; Trustee, Artstor (a Mellon Foundation affiliate) from 2010 to 2015; President and Trustee, the Center for the Arts, Jackson Hole from 2011 to 2018; Director, Athena Capital Advisors LLC (investment management firm) since 2013; Trustee and Chair of the Investment Committee, Community Foundation of Jackson Hole since 2014; Member of Affordable Housing Supply Board of Jackson, Wyoming since 2018; Member, Investment Funds Committee, State of Wyoming since 2017; Trustee, Phoenix Art Museum since 2018. | | 37 RICs consisting of 177 Portfolios | | None |
Joseph P. Platt 1947 | | Trustee
(Since 2009) | | General Partner, Thorn Partners, LP (private investments) since 1998; Director, WQED Multi-Media (public broadcastingnot-for-profit) since 2001; Chair, Basic Health International(non-profit) since 2015. | | 37 RICs consisting of 177 Portfolios | | Greenlight Capital Re, Ltd. (reinsurance company); Consol Energy Inc. |
| | | | |
| TRUSTEEAND OFFICER INFORMATION | | | 97 | |
Trustee and Officer Information (continued)
| | | | | | | | |
| Independent Trustees (a)(continued) |
| | | | | |
Name
Year of Birth (b) | | Position(s) Held
(Length of Service) (c) | | Principal Occupation(s)
During Past Five Years | | Number of BlackRock-Advised
Registered Investment Companies
(“RICs”) Consisting of
Investment Portfolios
(“Portfolios”) Overseen | | Public Company and
Other Investment Company
Directorships Held During
Past Five Years |
Kenneth L. Urish 1951 | | Trustee
(Since 2009) | | Managing Partner, Urish Popeck & Co., LLC (certified public accountants and consultants) since 1976; Past-Chairman of the Professional Ethics Committee of the Pennsylvania Institute of Certified Public Accountants and Committee Member thereof since 2007; Member of External Advisory Board, The Pennsylvania State University Accounting Department since founding in 2001; Principal, UP Strategic Wealth Investment Advisors, LLC since 2013; Trustee, The Holy Family Institute from 2001 to 2010; President and Trustee, Pittsburgh Catholic Publishing Associates from 2003 to 2008; Director,Inter-Tel from 2006 to 2007. | | 37 RICs consisting of 177 Portfolios | | None |
Claire A. Walton 1957 | | Trustee
(Since 2016) | | Chief Operating Officer and Chief Financial Officer of Liberty Square Asset Management, LP from 1998 to 2015; General Partner of Neon Liberty Capital Management, LLC since 2003; Director, Boston Hedge Fund Group from 2009 to 2018; Director, Woodstock Ski Runners since 2013; Director, Massachusetts Council on Economic Education from 2013 to 2015. | | 37 RICs consisting of 177 Portfolios | | None |
|
| Interested Trustees (a)(d) |
| | | | | |
Name
Year of Birth (b) | | Position(s) Held
(Length of Service) (c) | | Principal Occupation(s)
During Past Five Years | | Number of BlackRock-Advised
Registered Investment Companies
(“RICs”) Consisting of
Investment Portfolios
(“Portfolios”) Overseen | | Public Company and
Other Investment Company
Directorships Held During
Past Five Years |
Robert Fairbairn 1965 | | Trustee
(Since 2018) | | Vice Chairman of BlackRock, Inc. since 2019; Member of BlackRock’s Global Executive and Global Operating Committees;Co-Chair of BlackRock’s Human Capital Committee; Senior Managing Director of BlackRock, Inc. from 2010 to 2019; oversaw BlackRock’s Strategic Partner Program and Strategic Product Management Group from 2012 to 2019; Member of the Board of Managers of BlackRock Investments, LLC from 2011 to 2018; Global Head of BlackRock’s Retail and iShares® businesses from 2012 to 2016. | | 123 RICs consisting of 287 Portfolios | | None |
John M. Perlowski (e) 1964 | | Trustee
(Since 2015)
President and Chief Executive Officer
(Since 2010) | | Managing Director of BlackRock, Inc. since 2009; Head of BlackRock Global Accounting and Product Services since 2009; Advisory Director of Family Resource Network (charitable foundation) since 2009. | | 124 RICs consisting of 288 Portfolios | | None |
(a) The address of each Trustee is c/o BlackRock, Inc., 55 East 52nd Street, New York, New York 10055. |
(b) Independent Trustees serve until their resignation, retirement, removal or death, or until December 31 of the year in which they turn 75. The Board may determine to extend the terms of Independent Trustees on acase-by-case basis, as appropriate. |
(c) In connection with the acquisition of Barclays Global Investors by BlackRock, Inc. in December 2009, certain Independent Trustees were elected to the Board. Furthermore, effective January 1, 2019, three BlackRock Fund Complexes were realigned and consolidated into two BlackRock Fund Complexes. As a result, although the chart shows the year that each Independent Trustee joined the Board, certain Independent Trustees first became members of the boards of other BlackRock-advised Funds or legacy BlackRock funds as follows: Bruce R. Bond, 2005; Robert M. Hernandez, 1996; Cynthia A. Montgomery, 1994; Joseph P. Platt, 1999; Kenneth L. Urish, 1999; Lena G. Goldberg, 2016; Henry R. Keizer, 2016; Donald C. Opatrny, 2015. |
(d) Mr. Fairbairn and Mr. Perlowski are both “interested persons,” as defined in the 1940 Act, of the Trust/MIP based on their positions with BlackRock, Inc. and its affiliates. Mr. Fairbairn and Mr. Perlowski are also board members of the BlackRock Fixed-Income Complex. |
(e) Mr. Perlowski is also a trustee of the BlackRock Credit Strategies Fund. |
| | |
| 98 | | 2019 BLACKROCK ANNUAL REPORTTO SHAREHOLDERS |
Trustee and Officer Information (continued)
| | | | |
| Officers Who Are Not Trustees (a) |
| | | |
Name
Year of Birth (b) | | Position(s) Held
(Length of Service) | | Principal Occupation(s) During Past Five Years |
Thomas Callahan 1968 | | Vice President
(Since 2016) | | Managing Director of BlackRock, Inc. since 2013; Member of the Board of Managers of BlackRock Investments, LLC (principal underwriter) since 2019 and Managing Director thereof since 2017; Head of BlackRock’s Global Cash Management Business since 2016;Co-Head of the Global Cash Management Business from 2014 to 2016; Deputy Head of the Global Cash Management Business from 2013 to 2014; Member of the Cash Management Group Executive Committee since 2013; Chief Executive Officer of NYSE Liffe U.S. from 2008 to 2013. |
Jennifer McGovern 1977 | | Vice President
(Since 2014) | | Managing Director of BlackRock, Inc. since 2016; Director of BlackRock, Inc. from 2011 to 2015; Head of Product Development and Oversight for BlackRock’s Strategic Product Management Group since 2019; Head of Product Structure and Oversight for BlackRock’s U.S. Wealth Advisory Group from 2013 to 2019. |
Neal J. Andrews 1966 | | Chief Financial Officer
(Since 2009) | | Chief Financial Officer of the iShares® exchange traded funds since 2019; Managing Director of BlackRock, Inc. since 2006. |
Jay M. Fife 1970 | | Treasurer
(Since 2009) | | Managing Director of BlackRock, Inc. since 2007. |
Charles Park 1967 | | Chief Compliance Officer
(Since 2014) | | Anti-Money Laundering Compliance Officer for certain BlackRock-advised Funds from 2014 to 2015; Chief Compliance Officer of BlackRock Advisors, LLC and the BlackRock-advised Funds in the BlackRock Multi-Asset Complex and the BlackRock Fixed-Income Complex since 2014; Principal of and Chief Compliance Officer for iShares® Delaware Trust Sponsor LLC since 2012 and BlackRock Fund Advisors (“BFA”) since 2006; Chief Compliance Officer for theBFA-advised iShares® exchange traded funds since 2006; Chief Compliance Officer for BlackRock Asset Management International Inc. since 2012. |
Lisa Belle 1968 | | Anti-Money Laundering Compliance Officer
(Since 2019) | | Managing Director of BlackRock, Inc. since 2019; Global Financial Crime Head for Asset and Wealth Management of JP Morgan from 2013 to 2019; Managing Director of RBS Securities from 2012 to 2013; Head of Financial Crimes for Barclays Wealth Americas from 2010 to 2012. |
Janey Ahn 1975 | | Secretary
(Since 2019) | | Managing Director of BlackRock, Inc. since 2018; Director of BlackRock, Inc. from 2009 to 2017. |
(a) The address of each Officer is c/o BlackRock, Inc., 55 East 52nd Street, New York, New York 10055. |
(b) Officers of the Trust/MIP serve at the pleasure of the Board. |
Further information about the Trust’s/MIP’s Trustees and Officers is available in the Trust’s/MIP’s Statement of Additional Information, which can be obtained without charge by calling(800) 441-7762.
Effective September 19, 2019, Lisa Belle replaced John MacKessy as the Anti-Money Laundering Compliance Officer of the Trust/MIP.
Effective September 19, 2019, Janey Ahn replaced Benjamin Archibald as the Secretary of the Trust/MIP.
Effective December 31, 2019, Robert M. Hernandez retired as Trustee of the Trust/MIP.
Investment Adviser
BlackRock Fund Advisors
San Francisco, CA 94105
Sub-Advisers
BlackRock International Limited
Edinburgh EH3 8BL, United Kingdom
BlackRock (Singapore) Limited
079912 Singapore
Administrator
BlackRock Advisors, LLC
Wilmington, DE 19809
Accounting Agent and Custodian
State Street Bank and Trust Company
Boston, MA 02111
Transfer Agent
BNY Mellon Investment Servicing (US) Inc.
Wilmington, DE 19809
Distributor
BlackRock Investments, LLC
New York, NY 10022
Independent Registered Public Accounting Firm
PricewaterhouseCoopers LLP
Philadelphia, PA 19103
Legal Counsel
Sidley Austin LLP
New York, NY 10019
Address of the Trust/MIP
400 Howard Street
San Francisco, CA 94105
| | | | |
| TRUSTEEAND OFFICER INFORMATION | | | 99 | |
Additional Information
General Information
Householding
The LifePath Dynamic Funds will mail only one copy of shareholder documents, including prospectuses, annual and semi-annual reports and proxy statements, to shareholders with multiple accounts at the same address. This practice is commonly called “householding” and is intended to reduce expenses and eliminate duplicate mailings of shareholder documents. Mailings of your shareholder documents may be householded indefinitely unless you instruct us otherwise. If you do not want the mailing of these documents to be combined with those for other members of your household, please call the LifePath Dynamic Funds at (800) 441-7762.
Availability of Quarterly Schedule of Investments
The LifePath Dynamic Funds/LifePath Dynamic Master Portfolios file their complete schedule of portfolio holdings with the SEC for the first and third quarters of each fiscal year as an exhibit to its reports on Form N-PORT, and for reporting periods ended prior to March 31, 2019, filed such information on Form N-Q. The LifePath Dynamic Funds’/LifePath Dynamic Master Portfolios’ Forms N-PORT and N-Q are available on the SEC’s website at sec.gov. The LifePath Dynamic Funds’/LifePath Dynamic Master Portfolios’ FormsN-Q may also be obtained upon request and without charge by calling (800) 441-7762.
Availability of Proxy Voting Policies and Procedures
A description of the policies and procedures that the LifePath Dynamic Funds/LifePath Dynamic Master Portfolios use to determine how to vote proxies relating to portfolio securities is available upon request and without charge (1) by calling (800) 441-7762; (2) atblackrock.com; and (3) on the SEC’s website at sec.gov.
Availability of Proxy Voting Record
Information about how the LifePath Dynamic Funds/LifePath Dynamic Master Portfolios voted proxies relating to securities held in the LifePath Dynamic Funds’/LifePath Dynamic Master Portfolios’ portfolios during the most recent 12-month period ended June 30 is available upon request and without charge (1) atblackrock.com; or by calling (800) 441-7762 and (2) on the SEC’s website at sec.gov.
BlackRock’s Mutual Fund Family
BlackRock offers a diverse lineup of open-end mutual funds crossing all investment styles and managed by experts in equity, fixed-income and tax-exempt investing. Visitblackrock.com for more information.
Shareholder Privileges
Account Information
Call us at (800) 441-7762 from 8:00 AM to 6:00 PM ET on any business day to get information about your account balances, recent transactions and share prices. You can also visitblackrock.com for more information.
Automatic Investment Plans
Investor class shareholders who want to invest regularly can arrange to have $50 or more automatically deducted from their checking or savings account and invested in any of the BlackRock funds.
Systematic Withdrawal Plans
Investor class shareholders can establish a systematic withdrawal plan and receive periodic payments of $50 or more from their BlackRock funds, as long as their account balance is at least $10,000.
Retirement Plans
Shareholders may make investments in conjunction with Traditional, Rollover, Roth, Coverdell, Simple IRAs, SEP IRAs and 403(b) Plans.
| | |
| 100 | | 2019 BLACKROCK ANNUAL REPORTTO SHAREHOLDERS |
Additional Information (continued)
BlackRock Privacy Principles
BlackRock is committed to maintaining the privacy of its current and former fund investors and individual clients (collectively, “Clients”) and to safeguarding their non-public personal information. The following information is provided to help you understand what personal information BlackRock collects, how we protect that information and why in certain cases we share such information with select parties.
If you are located in a jurisdiction where specific laws, rules or regulations require BlackRock to provide you with additional or different privacy-related rights beyond what is set forth below, then BlackRock will comply with those specific laws, rules or regulations.
BlackRock obtains or verifies personal non-public information from and about you from different sources, including the following: (i) information we receive from you or, if applicable, your financial intermediary, on applications, forms or other documents; (ii) information about your transactions with us, our affiliates, or others; (iii) information we receive from a consumer reporting agency; and (iv) from visits to our websites.
BlackRock does not sell or disclose to non-affiliated third parties any non-public personal information about its Clients, except as permitted by law or as is necessary to respond to regulatory requests or to service Client accounts. These non-affiliated third parties are required to protect the confidentiality and security of this information and to use it only for its intended purpose.
We may share information with our affiliates to service your account or to provide you with information about other BlackRock products or services that may be of interest to you. In addition, BlackRock restricts access to non-public personal information about its Clients to those BlackRock employees with a legitimate business need for the information. BlackRock maintains physical, electronic and procedural safeguards that are designed to protect the non-public personal information of its Clients, including procedures relating to the proper storage and disposal of such information.
Glossary of Terms Used in this Report
| | |
| Currency |
| |
| CAD | | Canadian Dollar |
| |
| EUR | | Euro |
| |
| USD | | United States Dollar |
| | |
| Portfolio Abbreviations |
| |
| ETF | | Exchange-Traded Fund |
| |
| MSCI | | Morgan Stanley Capital International |
| |
| S&P | | Standard and Poor’s |
| | | | |
| ADDITIONAL INFORMATION | | | 101 | |
Want to know more?
blackrock.com | 877-275-1255 (1-877-ASK-1BLK)
This report is intended for current holders. It is not authorized for use as an offer of sale or a solicitation of an offer to buy shares of a LifePath Dynamic Fund unless preceded or accompanied by the LifePath Dynamic Funds’ current prospectus. Past performance results shown in this report should not be considered a representation of future performance. Investment returns and principal value of shares will fluctuate so that shares, when redeemed, may be worth more or less than their original cost. Statements and other information herein are as dated and are subject to change.
LifePath-12/19-AR
| | |
 | | DECEMBER 31, 2019 |
BlackRock Funds III
| · | | BlackRock LifePath® Dynamic 2025 Fund |
| · | | BlackRock LifePath® Dynamic 2035 Fund |
| · | | BlackRock LifePath® Dynamic 2045 Fund |
| · | | BlackRock LifePath® Dynamic 2055 Fund |
| · | | BlackRock LifePath® Dynamic 2065 Fund |
Beginning on January 1, 2021, as permitted by regulations adopted by the Securities and Exchange Commission, paper copies of each Fund’s shareholder reports will no longer be sent by mail, unless you specifically request paper copies of the reports from BlackRock or from your financial intermediary, such as a broker-dealer or bank. Instead, the reports will be made available on a website, and you will be notified by mail each time a report is posted and provided with a website link to access the report.
You may elect to receive all future reports in paper free of charge. If you hold accounts directly with BlackRock, you can call(800) 441-7762 to inform BlackRock that you wish to continue receiving paper copies of your shareholder reports. If you hold accounts through a financial intermediary, you can follow the instructions included with this disclosure, if applicable, or contact your financial intermediary to request that you continue to receive paper copies of your shareholder reports. Please note that not all financial intermediaries may offer this service. Your election to receive reports in paper will apply to all funds advised by BlackRock Advisors, LLC, BlackRock Fund Advisors or their affiliates, or all funds held with your financial intermediary, as applicable.
If you already elected to receive shareholder reports electronically, you will not be affected by this change and you need not take any action. You may elect to receive electronic delivery of shareholder reports and other communications by: (i) accessing the BlackRock website at blackrock.com/edelivery and logging into your accounts, if you hold accounts directly with BlackRock, or (ii) contacting your financial intermediary, if you hold accounts through a financial intermediary. Please note that not all financial intermediaries may offer this service.
|
| Not FDIC Insured • May Lose Value • No Bank Guarantee |
The Markets in Review
Dear Shareholder,
U.S. equities and bonds finished the last year of the decade with impressive returns, putting an exclamation point on a decade of strong performance despite the fears and doubts about the economy that were ultimately laid to rest with unprecedented monetary stimulus and a sluggish yet resolute performance from the U.S. economy. In many ways, it was fitting that the themes of 2019 — geopolitical uncertainty, fears of recession, and decisive monetary stimulus — put the capstone on a decade that was defined by grappling with these competing forces.
Equity and bond markets posted solid returns, particularly in the second half of the year, as investors began to realize that the U.S. economy was maintaining the modest yet steady growth that has characterized this economic cycle. U.S. large cap equities advanced the most, while equities at the high end of the risk spectrum — emerging markets and U.S. small cap — lagged while still posting solid returns.
Fixed-income securities played an important role in diversified portfolios by delivering strong returns amid economic uncertainty, as interest rates declined (and bond prices rose). Long-term bonds, particularly long-term Treasuries, generally posted the strongest returns, as inflation remained low. Investment-grade and high-yield corporate bonds also posted solid returns, as the credit fundamentals in corporate markets remained relatively solid.
As equity performance faltered in late 2018 and global economic growth slowed, the U.S. Federal Reserve (the “Fed”) shifted away from policies designed to decrease inflation in favor of renewed efforts to stimulate economic activity. The Fed left interest rates unchanged in January 2019, then reduced interest rates three times thereafter, starting in July 2019. Similarly, the Fed took measures to support liquidity in short-term lending markets. Following in the Fed’s footsteps, the European Central Bank announced aggressive economic stimulus measures, including lower interest rates and the return of its bond purchasing program. The Bank of Japan signaled a continuation of accommodative monetary policy, while China committed to looser credit conditions and an increase in fiscal spending.
The outpouring of global economic stimulus led to a sharp rally in risk assets throughout the world despite the headwind of rising geopolitical and trade tensions. Hopes continued to remain high as the current economic expansion became the longest in U.S. history.
Looking ahead, we believe U.S. economic growth will stabilize and gradually improve in 2020. The primary drivers of recent market performance — trade and monetary policies — could take a back seat to a nascent expansion in manufacturing and a recent uptick in global growth. The headwinds of policy uncertainty in 2019 could become tailwinds in 2020 due topro-cyclical policy shifts.
Overall, we favor increasing investment risk to benefit from the brighter outlook. In addition to having a positive view for equities overall, we favor emerging market equities over developed market equities. Increasing cyclical exposure through value-style investing and maintaining a meaningful emphasis on high-quality companies through quality factors also makes sense for diversified investors. In fixed income, government bonds continue to be important portfolio stabilizers, while emerging market bonds, particularly local currency bonds, offer relatively attractive income opportunities.
In this environment, investors need to think globally, extend their scope across a broad array of asset classes, and be nimble as market conditions change. We encourage you to talk with your financial advisor and visitblackrock.com for further insight about investing in today’s markets.
Sincerely,
Rob Kapito
President, BlackRock Advisors, LLC
Rob Kapito
President, BlackRock Advisors, LLC
| | | | |
| Total Returns as of December 31, 2019 |
| | | 6-month | | 12-month |
U.S. large cap equities
(S&P 500® Index) | | 10.92% | | 31.49% |
U.S. small cap equities
(Russell 2000® Index) | | 7.30 | | 25.52 |
International equities
(MSCI Europe, Australasia, Far East Index) | | 7.01 | | 22.01 |
Emerging market equities
(MSCI Emerging Markets Index) | | 7.09 | | 18.42 |
3-month Treasury bills
(ICE BofAML3-Month U.S. Treasury Bill Index) | | 1.03 | | 2.28 |
U.S. Treasury securities
(ICE BofAML10-Year U.S. Treasury Index) | | 1.36 | | 8.91 |
U.S. investment grade bonds
(Bloomberg Barclays U.S. Aggregate Bond Index) | | 2.45 | | 8.72 |
Tax-exempt municipal bonds
(S&P Municipal Bond Index) | | 2.21 | | 7.26 |
U.S. high yield bonds
(Bloomberg Barclays U.S. Corporate High Yield 2% Issuer Capped Index) | | 3.98 | | 14.32 |
| Past performance is no guarantee of future results. Index performance is shown for illustrative purposes only. You cannot invest directly in an index. |
| | |
| 2 | | THIS PAGEISNOT PARTOF YOUR FUND REPORT |
Table of Contents

| | |
| Fund Summary as of December 31, 2019 | | BlackRock LifePath® Dynamic Funds |
Portfolio Management Commentary
How did each Fund perform?
The BlackRock LifePath® Dynamic Funds with target dates of 2025, 2035, 2045, 2055 and 2065 (together, the “LifePath Dynamic Funds”) invest in their respective LifePath® Dynamic Master Portfolio.
For the12-month period ended December 31, 2019, the LifePath Dynamic Funds with target dates of 2025 and 2035 outperformed their respective custom benchmarks with the exception of LifePath Dynamic 2025 Fund’s Investor C and Class R Shares, which underperformed, and LifePath Dynamic 2035 Fund’s Investor C Shares, which underperformed, and Class R Shares, which performed in line. For the same period, the Class K Shares of the LifePath Dynamic 2045 Fund outperformed its respective custom benchmark, while Institutional Shares, performed in line, and Investor A and Class R Shares, underperformed. The LifePath Dynamic 2055 Fund underperformed its respective custom benchmark for the same period, while the LifePath Dynamic 2065 Fund underperformed its respective custom benchmark for the period since inception (October 30, 2019) through December 31, 2019. The returns for the LifePath Dynamic Funds include fund expenses. The custom benchmarks have no expenses associated with performance.
What factors influenced performance?
BlackRock Advantage Emerging Markets Fund (an equity strategy) and BlackRock Tactical Opportunities Fund (a global tactical asset allocation strategy) detracted from the LifePath Dynamic Funds’ returns as they lagged their respective benchmarks. In terms of macro themes, active currency positioning weighed on returns over the period, and an underweight to U.S.10- and30-year bond futures also modestly detracted.
At an investment strategy level, underlying actively managed strategies were generally the largest positive contributors to active returns, while macro themes also contributed in the nearer-dated vintages. Specifically, CoreAlpha Bond Master Portfolio (a domestic fixed-income strategy), Active Stock Master Portfolio (a diversified equity strategy) and active real estate strategies contributed to returns. With regard to the LifePath Dynamic Funds’ macro themes, an overweight to U.S. equities was the largest contributor to returns for the period.
As part of their investment strategy, the LifePath Dynamic Funds may use derivatives to achieve exposure to a market or to manage risk. At times during the period, the LifePath Dynamic Funds had elevated cash positions that were primarily due to collateral posted against these derivatives. The LifePath Dynamic Funds’ cash balances had no material impact on their respective performance.
Describe recent portfolio activity.
Each LifePath Dynamic Fund has its own time horizon, which affects its acceptable level of risk and, in turn, the strategic allocation of its holdings across asset classes. On a quarterly basis, the strategic allocation of each LifePath Dynamic Fund is systematically adjusted to reflect the shareholders’ remaining investment time horizon.
The LifePath Dynamic Funds entered the period with tactical overweights to U.S. and Japanese equities as expressions of the investment adviser’s macro theme of Global Reflation. As markets rebounded strongly from December 2018 lows, the investment adviser reduced holdings in some of the domestic exposure and all the Japanese exposure. Concurrently, the investment adviser introduced an overweight tofar-dated U.S. bonds (via30-year bond futures) as part of a new theme called U.S. Macro Moderation. This exposure was maintained through the first three quarters of 2019, based on the investment adviser’s belief that the U.S. economy was in a state of relative moderation with limited risk of overheating or falling into deep recession.
As pricing moved in line with expectations, the LifePath Dynamic Funds’ overweight tofar-dated U.S. bonds was removed early in the fourth quarter of 2019. The LifePath Dynamic Funds maintained an overweight to U.S. equities throughout the period and introduced underweights to U.S.10-year and U.S.30-year bond futures in April and May 2019, respectively, as expressions of Global Reflation. This fixed-income positioning reflected the investment adviser’s view that despite the notable slowing in global activity data and dovish shift in global central bank tones, price levels for U.S. bonds had risen to levels inconsistent with fundamentals. These three positions were maintained for the rest of the period, although they were trimmed in the fourth quarter. The LifePath Dynamic Funds entered the period with an overweight to the euro, which was increased near the middle of the period, before being modestly trimmed in the latter half of the period as pricing moved in line with expectations. September’s European Central Bank (“ECB”) policy meeting gave the investment adviser increased conviction that the ECB was reaching the limits of both its willingness and its ability to proactively ease policy. Even as challenges to financial stability linger, the investment adviser expects trends in growth, inflation and policy between the Eurozone and the United States to converge over the coming months, and as such expect this to be supportive of a euro overweight position. The LifePath Dynamic Funds closed an overweight to the Australian dollar toward the middle of the period. With an escalation in global trade tensions weighing on the export-oriented economy, expectations of a rate cut from the Reserve Bank of Australia increased, leaving the theme with limited upside potential.
Describe portfolio positioning at period end.
At period end, each of the LifePath Dynamic Funds was invested according to its respective strategic allocation benchmark within tolerance limits.
The views expressed reflect the opinions of BlackRock as of the date of this report and are subject to change based on changes in market, economic or other conditions. These views are not intended to be a forecast of future events and are no guarantee of future results.
| | |
| 4 | | 2019 BLACKROCK ANNUAL REPORTTO SHAREHOLDERS |
| | |
| Fund Summary as of December 31, 2019 (continued) | | BlackRock LifePath® Dynamic Funds |
Glide Path Evolution
Under normal circumstances, the asset allocation of each LifePath Dynamic Fund will change over time according to a “glide path” as each LifePath Dynamic Fund approaches its respective target date. The glide path represents the shifting of asset classes over time. Each LifePath Dynamic Fund’s asset mix becomes more conservative — prior to retirement — as time elapses. This reflects the need for reduced investment risks as retirement approaches and the need for lower volatility of each LifePath Dynamic Fund, which may be a primary source of income after retirement. As each LifePath Dynamic Fund approaches its target date, its asset allocation will shift so that it invests a greater percentage of its assets in fixed-income funds. The asset allocation targets are established by the portfolio managers. The investment team, including the portfolio managers, meets regularly to assess market conditions, review the asset allocation targets of each LifePath Dynamic Fund, and determine whether any changes are required to enable each LifePath Dynamic Fund to achieve its investment objective.
Although the asset allocation targets listed for the glide path are general, long-term targets, BlackRock Fund Advisors (“BFA” or the “Manager”) may adjust the allocation to equity and fixed-income in each LifePath Dynamic Fund, based on an assessment of the current market conditions and the potential contribution of each asset class to the expected risk and return characteristics of each LifePath Dynamic Fund. In general, the adjustments will be limited to +/- 10% relative to the target allocations. BFA may determine, in light of market conditions or other factors, that a greater variation is warranted to protect the LifePath Dynamic Fund or achieve its investment objective.
| | |
| Fund Summary as of December 31, 2019 | | BlackRock LifePath® Dynamic 2025 Fund |
Investment Objective
The investment objective ofBlackRock LifePath Dynamic 2025 Fund (“LifePath® Dynamic 2025 Fund” or the “LifePath Dynamic Fund”) is to seek to provide for retirement outcomes based on quantitatively measured risk. In pursuit of this objective, LifePath Dynamic 2025 Fund will be broadly diversified across global asset classes, with asset allocations becoming more conservative over time.
TOTAL RETURN BASED ON A $10,000 INVESTMENT
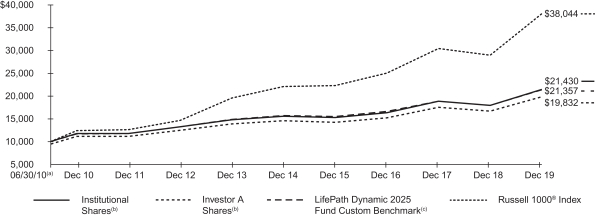
| (a) | Commencement of operations. |
| (b) | Assuming maximum sales charges, transaction costs and other operating expenses, including advisory fees, if any. Institutional Shares do not have a sales charge. |
| (c) | The LifePath Dynamic Fund compares its performance to that of a customized weighted index (the “LifePath Dynamic 2025 Fund Custom Benchmark”) comprised of the indexes indicated below, which reflects the investment adviser’s changes to the benchmark’s weightings over time. The investment adviser adjusts the weightings of these indexes periodically based upon its evaluation and adjustment of the LifePath Dynamic Fund’s asset allocation strategy. The weightings are presented annually but they are adjusted quarterly. |
The LifePath Dynamic Fund’s custom benchmark consists of the following:
| | | | | | | | | | | | | | | | | | | | | | | | | | | | | | | | | | | | | | | | |
| Period | | Bloomberg
Barclays
U.S. Aggregate
Bond Index | | | Bloomberg
Barclays
U.S. Treasury
Inflation
Protected
Securities (TIPS) Index
(Series L) | | | Bloomberg
Commodity
Index (a) | | | FTSE
EPRA Nareit
Developed
Index | | | MSCI
ACWI ex USA
IMI Index | | | Russell
1000®
Index | | | Russell
2000®
Index | | | S&P
MidCap
400® Index | | | S&P 500®
Index | | | S&P
SmallCap
600® Index | |
06/30/10 to 12/31/10 | | | 28.5 | % | | | 4.4 | % | | | N/A | | | | 4.9 | % | | | 18.8 | % | | | N/A | | | | N/A | | | | 5.9 | % | | | 34.9 | % | | | 2.6 | % |
01/01/11 to 12/31/11 | | | 29.8 | | | | 4.6 | | | | N/A | | | | 4.8 | | | | 18.9 | | | | 15.2 | % | | | 1.4 | % | | | 3.5 | | | | 20.3 | | | | 1.5 | |
01/01/12 to 12/31/12 | | | 31.9 | | | | 5.0 | | | | 1.0 | % | | | 4.7 | | | | 18.2 | | | | 35.9 | | | | 3.3 | | | | N/A | | | | N/A | | | | N/A | |
01/01/13 to 12/31/13 | | | 33.7 | | | | 5.2 | | | | 3.8 | | | | 4.3 | | | | 17.1 | | | | 32.6 | | | | 3.3 | | | | N/A | | | | N/A | | | | N/A | |
01/01/14 to 12/31/14 | | | 34.3 | | | | 5.3 | | | | 3.8 | | | | 4.5 | | | | 17.3 | | | | 31.5 | | | | 3.3 | | | | N/A | | | | N/A | | | | N/A | |
01/01/15 to 12/31/15 | | | 31.0 | | | | 5.0 | | | | 3.8 | | | | 5.3 | | | | 18.8 | | | | 33.1 | | | | 3.0 | | | | N/A | | | | N/A | | | | N/A | |
01/01/16 to 12/31/16 | | | 32.4 | | | | 5.2 | | | | 3.8 | | | | 5.2 | | | | 18.5 | | | | 31.9 | | | | 2.9 | | | | N/A | | | | N/A | | | | N/A | |
01/01/17 to 12/31/17 | | | 34.9 | | | | 5.7 | | | | 3.8 | | | | 4.7 | | | | 18.0 | | | | 29.8 | | | | 3.1 | | | | N/A | | | | N/A | | | | N/A | |
01/01/18 to 12/31/18 | | | 36.5 | | | | 5.9 | | | | N/A | | | | 4.5 | | | | 19.3 | | | | 30.7 | | | | 3.1 | | | | N/A | | | | N/A | | | | N/A | |
01/01/19 to 12/31/19 | | | 38.1 | | | | 7.1 | | | | N/A | | | | 2.5 | | | | 19.5 | | | | 29.8 | | | | 3.0 | | | | N/A | | | | N/A | | | | N/A | |
| | (a) | Prior to July 1, 2014, the Bloomberg Commodity Index was known as the Dow Jones-UBS Commodity Index. | |
See “About Fund Performance” on page 15 for descriptions of the indexes.
| | |
| 6 | | 2019 BLACKROCK ANNUAL REPORTTO SHAREHOLDERS |
| | |
| Fund Summary as of December 31, 2019 (continued) | | BlackRock LifePath® Dynamic 2025 Fund |
Performance Summary for the Period Ended December 31, 2019
| | | | | | | | | | | | | | | | | | | | | | | | | | | | | | | | | | | | | | | | |
| | | | | | | | | Average Annual Total Returns (a)(b) | |
| | | | | | | | | 1 Year | | | | | | 5 Years | | | | | | Since Inception (c) | |
| | | 6-Month
Total Returns | | | | | | w/o sales
charge | | | w/sales
charge | | | | | | w/o sales
charge | | | w/sales
charge | | | | | | w/o sales
charge | | | w/sales
charge | |
Institutional | | | 5.64 | % | | | | | | | 19.46 | % | | | N/A | | | | | | | | 6.61 | % | | | N/A | | | | | | | | 8.35 | % | | | N/A | |
Investor A | | | 5.55 | | | | | | | | 19.16 | | | | 12.90 | % | | | | | | | 6.36 | | | | 5.22 | % | | | | | | | 8.08 | | | | 7.47 | % |
Investor C | | | 5.05 | | | | | | | | 18.25 | | | | 17.25 | | | | | | | | 5.53 | | | | 5.53 | | | | | | | | 7.25 | | | | 7.25 | |
Class K | | | 5.73 | | | | | | | | 19.72 | | | | N/A | | | | | | | | 6.87 | | | | N/A | | | | | | | | 8.58 | | | | N/A | |
Class R | | | 5.34 | | | | | | | | 18.91 | | | | N/A | | | | | | | | 6.14 | | | | N/A | | | | | | | | 7.83 | | | | N/A | |
LifePath® Dynamic 2025 Fund Custom Benchmark | | | 6.09 | | | | | | | | 19.02 | | | | N/A | | | | | | | | 6.36 | | | | N/A | | | | | | | | 8.31 | | | | N/A | |
Bloomberg Barclays U.S. Aggregate Bond Index | | | 2.45 | | | | | | | | 8.72 | | | | N/A | | | | | | | | 3.05 | | | | N/A | | | | | | | | 3.38 | | | | N/A | |
Bloomberg Barclays U.S. TIPS Index (Series L) | | | 2.15 | | | | | | | | 8.43 | | | | N/A | | | | | | | | 2.62 | | | | N/A | | | | | | | | 3.07 | | | | N/A | |
FTSE EPRA Nareit Developed Index | | | 6.46 | | | | | | | | 21.91 | | | | N/A | | | | | | | | 5.56 | | | | N/A | | | | | | | | 9.37 | | | | N/A | |
MSCI ACWI ex USA IMI Index | | | 7.33 | | | | | | | | 21.63 | | | | N/A | | | | | | | | 5.71 | | | | N/A | | | | | | | | 6.71 | | | | N/A | |
Russell 1000® Index | | | 10.59 | | | | | | | | 31.43 | | | | N/A | | | | | | | | 11.48 | | | | N/A | | | | | | | | 15.10 | | | | N/A | |
Russell 2000® Index | | | 7.30 | | | | | | | | 25.52 | | | | N/A | | | | | | | | 8.23 | | | | N/A | | | | | | | | 12.71 | | | | N/A | |
| | (a) | Assuming maximum sales charges, if any. Average annual total returns with and without sales charges reflect reductions for distributions and service fees. See “About Fund Performance” on page 15 for a detailed description of share classes, including any related sales charges and fees. | |
| | (b) | Effective November 7, 2016, LifePath Dynamic Fund changed its investment strategy to (i) incorporate a Global Tactical Asset Allocation into its glidepath, (ii) increase the flexibility of its equity allocations and (iii) diversify its fixed-income strategies. Performance for the periods shown between December 14, 2015 and November 7, 2016 is based on the prior investment strategy. Effective December 14, 2015, LifePath Dynamic Fund changed its investment strategy to (i) incorporate a dynamic glidepath and (ii) invest directly in securities and derivatives, as well as in underlying funds. Performance for the periods shown prior to December 14, 2015 is based on the prior investment strategy. Effective November 28, 2014, the Fund changed its glide path and target asset allocation to target higher levels of equity exposure for LifePath Dynamic Fund throughout the glide path. Performance for the periods shown prior to November 28, 2014 is based on the prior glide path and target asset allocation. | |
| | (c) | The LifePath Dynamic Fund commenced operations on June 30, 2010. | |
N/A — Not applicable as share class and index do not have a sales charge.
Past performance is not indicative of future results.
Performance results may include adjustments made for financial reporting purposes in accordance with U.S. generally accepted accounting principles.
| | |
| Fund Summary as of December 31, 2019 | | BlackRock LifePath® Dynamic 2035 Fund |
Investment Objective
The investment objective ofBlackRock LifePath® Dynamic 2035 Fund (“LifePath Dynamic 2035 Fund” or the “LifePath Dynamic Fund”) is to seek to provide for retirement outcomes based on quantitatively measured risk. In pursuit of this objective, LifePath Dynamic 2035 Fund will be broadly diversified across global asset classes, with asset allocations becoming more conservative over time.
TOTAL RETURN BASED ON A $10,000 INVESTMENT
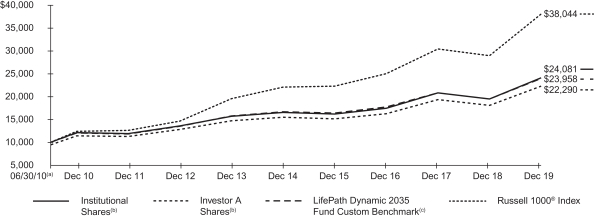
| (a) | Commencement of operations. |
| (b) | Assuming maximum sales charges, transaction costs and other operating expenses, including advisory fees, if any. Institutional Shares do not have a sales charge. |
| (c) | The LifePath Dynamic Fund compares its performance to that of a customized weighted index (the “LifePath Dynamic 2035 Fund Custom Benchmark”) comprised of the indexes indicated below, which reflects the investment adviser’s changes to the benchmark’s weightings over time. The investment adviser adjusts the weightings of these indexes periodically based upon its evaluation and adjustment of the LifePath Dynamic Fund’s asset allocation strategy. The weightings are presented annually but they are adjusted quarterly. |
The LifePath Dynamic Fund’s custom benchmark consists of the following:
| | | | | | | | | | | | | | | | | | | | | | | | | | | | | | | | | | | | | | | | |
| Period | | Bloomberg
Barclays
U.S. Aggregate
Bond Index | | | Bloomberg
Barclays
U.S. Treasury
Inflation
Protected
Securities (TIPS) Index
(Series L) | | | Bloomberg
Commodity
Index (a) | | | FTSE
EPRA Nareit
Developed
Index | | | MSCI
ACWI ex USA
IMI Index | | | Russell
1000®
Index | | | Russell
2000®
Index | | | S&P
MidCap
400® Index | | | S&P 500®
Index | | | S&P
SmallCap
600® Index | |
06/30/10 to 12/31/10 | | | 16.6 | % | | | 2.2 | % | | | N/A | | | | 6.8 | % | | | 22.7 | % | | | N/A | | | | N/A | | | | 6.4 | % | | | 42.5 | % | | | 2.8 | % |
01/01/11 to 12/31/11 | | | 17.8 | | | | 2.3 | | | | N/A | | | | 7.0 | | | | 22.8 | | | | 18.6 | % | | | 1.2 | % | | | 3.9 | | | | 24.7 | | | | 1.7 | |
01/01/12 to 12/31/12 | | | 20.3 | | | | 2.6 | | | | 1.0 | % | | | 7.2 | | | | 21.1 | | | | 44.1 | | | | 2.7 | | | | N/A | | | | N/A | | | | N/A | |
01/01/13 to 12/31/13 | | | 22.1 | | | | 2.9 | | | | 3.9 | | | | 6.9 | | | | 21.3 | | | | 40.3 | | | | 2.6 | | | | N/A | | | | N/A | | | | N/A | |
01/01/14 to 12/31/14 | | | 21.4 | | | | 2.8 | | | | 3.9 | | | | 7.6 | | | | 22.2 | | | | 39.6 | | | | 2.5 | | | | N/A | | | | N/A | | | | N/A | |
01/01/15 to 12/31/15 | | | 13.2 | | | | 1.9 | | | | 3.9 | | | | 9.8 | | | | 25.4 | | | | 43.6 | | | | 2.2 | | | | N/A | | | | N/A | | | | N/A | |
01/01/16 to 12/31/16 | | | 14.7 | | | | 2.2 | | | | 3.9 | | | | 9.9 | | | | 25.1 | | | | 42.1 | | | | 2.1 | | | | N/A | | | | N/A | | | | N/A | |
01/01/17 to 12/31/17 | | | 17.1 | | | | 2.5 | | | | 4.0 | | | | 10.0 | | | | 24.6 | | | | 40.1 | | | | 1.7 | | | | N/A | | | | N/A | | | | N/A | |
01/01/18 to 12/31/18 | | | 18.4 | | | | 2.7 | | | | N/A | | | | 10.3 | | | | 25.5 | | | | 41.3 | | | | 1.8 | | | | N/A | | | | N/A | | | | N/A | |
01/01/19 to 12/31/19 | | | 17.1 | | | | 4.6 | | | | N/A | | | | 3.7 | | | | 30.4 | | | | 41.8 | | | | 2.4 | | | | N/A | | | | N/A | | | | N/A | |
| | (a) | Prior to July 1, 2014, the Bloomberg Commodity Index was known as the Dow Jones-UBS Commodity Index. | |
See “About Fund Performance” on page 15 for descriptions of the indexes.
| | |
| 8 | | 2019 BLACKROCK ANNUAL REPORTTO SHAREHOLDERS |
| | |
| Fund Summary as of December 31, 2019 (continued) | | BlackRock LifePath® Dynamic 2035 Fund |
Performance Summary for the Period Ended December 31, 2019
| | | | | | | | | | | | | | | | | | | | | | | | | | | | | | | | | | | | | | | | |
| | | | | | | | | Average Annual Total Returns (a)(b) | |
| | | | | | | | | 1 Year | | | | | | 5 Years | | | | | | Since Inception (c) | |
| | | 6-Month
Total Returns | | | | | | w/o sales
charge | | | w/sales
charge | | | | | | w/o sales
charge | | | w/sales
charge | | | | | | w/o sales
charge | | | w/sales
charge | |
Institutional | | | 7.31 | % | | | | | | | 23.66 | % | | | N/A | | | | | | | | 7.81 | % | | | N/A | | | | | | | | 9.69 | % | | | N/A | |
Investor A | | | 7.12 | | | | | | | | 23.37 | | | | 16.89 | % | | | | | | | 7.55 | | | | 6.40 | % | | | | | | | 9.42 | | | | 8.80 | % |
Investor C | | | 6.77 | | | | | | | | 22.43 | | | | 21.43 | | | | | | | | 6.70 | | | | 6.70 | | | | | | | | 8.57 | | | | 8.57 | |
Class K | | | 7.40 | | | | | | | | 23.92 | | | | N/A | | | | | | | | 8.05 | | | | N/A | | | | | | | | 10.05 | | | | N/A | |
Class R | | | 7.09 | | | | | | | | 23.15 | | | | N/A | | | | | | | | 7.32 | | | | N/A | | | | | | | | 9.17 | | | | N/A | |
LifePath® Dynamic 2035 Fund Custom Benchmark | | | 7.72 | | | | | | | | 23.18 | | | | N/A | | | | | | | | 7.53 | | | | N/A | | | | | | | | 9.64 | | | | N/A | |
Bloomberg Barclays U.S. Aggregate Bond Index | | | 2.45 | | | | | | | | 8.72 | | | | N/A | | | | | | | | 3.05 | | | | N/A | | | | | | | | 3.38 | | | | N/A | |
Bloomberg Barclays U.S. TIPS Index (Series L) | | | 2.15 | | | | | | | | 8.43 | | | | N/A | | | | | | | | 2.62 | | | | N/A | | | | | | | | 3.07 | | | | N/A | |
FTSE EPRA Nareit Developed Index | | | 6.46 | | | | | | | | 21.91 | | | | N/A | | | | | | | | 5.56 | | | | N/A | | | | | | | | 9.37 | | | | N/A | |
MSCI ACWI ex USA IMI Index | | | 7.33 | | | | | | | | 21.63 | | | | N/A | | | | | | | | 5.71 | | | | N/A | | | | | | | | 6.71 | | | | N/A | |
Russell 1000® Index | | | 10.59 | | | | | | | | 31.43 | | | | N/A | | | | | | | | 11.48 | | | | N/A | | | | | | | | 15.10 | | | | N/A | |
Russell 2000® Index | | | 7.30 | | | | | | | | 25.52 | | | | N/A | | | | | | | | 8.23 | | | | N/A | | | | | | | | 12.71 | | | | N/A | |
| | (a) | Assuming maximum sales charges, if any. Average annual total returns with and without sales charges reflect reductions for distributions and service fees. See “About Fund Performance” on page 15 for a detailed description of share classes, including any related sales charges and fees. | |
| | (b) | Effective November 7, 2016, LifePath Dynamic Fund changed its investment strategy to (i) incorporate a Global Tactical Asset Allocation into its glidepath, (ii) increase the flexibility of its equity allocations and (iii) diversify its fixed-income strategies. Performance for the periods shown between December 14, 2015 and November 7, 2016 is based on the prior investment strategy. Effective December 14, 2015, LifePath Dynamic Fund changed its investment strategy to (i) incorporate a dynamic glidepath and (ii) invest directly in securities and derivatives, as well as in underlying funds. Performance for the periods shown prior to December 14, 2015 is based on the prior investment strategy. Effective November 28, 2014, the Fund changed its glide path and target asset allocation to target higher levels of equity exposure for LifePath Dynamic Fund throughout the glide path. Performance for the periods shown prior to November 28, 2014 is based on the prior glide path and target asset allocation. | |
| | (c) | The LifePath Dynamic Fund commenced operations on June 30, 2010. | |
N/A — Not applicable as share class and index do not have a sales charge.
Past performance is not indicative of future results.
Performance results may include adjustments made for financial reporting purposes in accordance with U.S. generally accepted accounting principles.
| | |
| Fund Summary as of December 31, 2019 | | BlackRock LifePath® Dynamic 2045 Fund |
Investment Objective
The investment objective ofBlackRock LifePath® Dynamic 2045 Fund (“LifePath Dynamic 2045 Fund” or the “LifePath Dynamic Fund”) is to seek to provide for retirement outcomes based on quantitatively measured risk. In pursuit of this objective, LifePath Dynamic 2045 Fund will be broadly diversified across global asset classes, with asset allocations becoming more conservative over time.
TOTAL RETURN BASED ON A $10,000 INVESTMENT
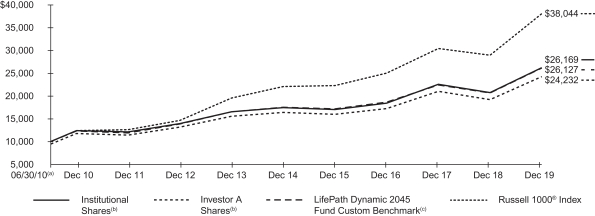
| (a) | Commencement of operations. |
| (b) | Assuming maximum sales charges, transaction costs and other operating expenses, including advisory fees, if any. Institutional Shares do not have a sales charge. |
| (c) | The LifePath Dynamic Fund compares its performance to that of a customized weighted index (the “LifePath Dynamic 2045 Fund Custom Benchmark”) comprised of the indexes indicated below, which reflects the investment adviser’s changes to the benchmark’s weightings over time. The investment adviser adjusts the weightings of these indexes periodically based upon its evaluation and adjustment of the LifePath Dynamic Fund’s asset allocation strategy. The weightings are presented annually but they are adjusted quarterly. |
The LifePath Dynamic Fund’s custom benchmark consists of the following:
| | | | | | | | | | | | | | | | | | | | | | | | | | | | | | | | | | | | | | | | |
| Period | | Bloomberg
Barclays
U.S. Aggregate
Bond Index | | | Bloomberg
Barclays
U.S. Treasury
Inflation
Protected
Securities (TIPS) Index
(Series L) | | | Bloomberg
Commodity
Index (a) | | | FTSE
EPRA Nareit
Developed
Index | | | MSCI
ACWI ex USA
IMI Index | | | Russell
1000®
Index | | | Russell
2000®
Index | | | S&P
MidCap
400® Index | | | S&P 500®
Index | | | S&P
SmallCap
600® Index | |
06/30/10 to 12/31/10 | | | 6.8 | % | | | N/A | | | | N/A | | | | 8.5 | % | | | 25.9 | % | | | N/A | | | | N/A | | | | 6.8 | % | | | 49.0 | % | | | 3.0 | % |
01/01/11 to 12/31/11 | | | 8.2 | | | | N/A | | | | N/A | | | | 8.7 | | | | 26.1 | | | | 21.5 | % | | | 1.1 | % | | | 4.2 | | | | 28.4 | | | | 1.8 | |
01/01/12 to 12/31/12 | | | 11.2 | | | | N/A | | | | 1.0 | % | | | 9.2 | | | | 25.3 | | | | 51.0 | | | | 2.3 | | | | N/A | | | | N/A | | | | N/A | |
01/01/13 to 12/31/13 | | | 13.5 | | | | N/A | | | | 3.9 | | | | 9.1 | | | | 24.8 | | | | 46.7 | | | | 2.0 | | | | N/A | | | | N/A | | | | N/A | |
01/01/14 to 12/31/14 | | | 12.5 | | | | N/A | | | | 3.9 | | | | 10.1 | | | | 25.9 | | | | 45.6 | | | | 2.0 | | | | N/A | | | | N/A | | | | N/A | |
01/01/15 to 12/31/15 | | | 1.8 | | | | 0.2 | % | | | 4.2 | | | | 13.4 | | | | 29.6 | | | | 48.8 | | | | 2.0 | | | | N/A | | | | N/A | | | | N/A | |
01/01/16 to 12/31/16 | | | 2.3 | | | | 0.2 | | | | 4.3 | | | | 13.6 | | | | 29.8 | | | | 47.8 | | | | 1.8 | | | | N/A | | | | N/A | | | | N/A | |
01/01/17 to 12/31/17 | | | 3.4 | | | | 0.3 | | | | 4.3 | | | | 14.4 | | | | 29.9 | | | | 46.7 | | | | 1.0 | | | | N/A | | | | N/A | | | | N/A | |
01/01/18 to 12/31/18 | | | 4.0 | | | | 0.4 | | | | N/A | | | | 15.0 | | | | 30.6 | | | | 48.9 | | | | 1.1 | | | | N/A | | | | N/A | | | | N/A | |
01/01/19 to 12/31/19 | | | 3.0 | | | | 1.4 | | | | N/A | | | | 4.6 | | | | 38.5 | | | | 50.5 | | | | 2.0 | | | | N/A | | | | N/A | | | | N/A | |
| | (a) | Prior to July 1, 2014, the Bloomberg Commodity Index was known as the Dow Jones-UBS Commodity Index. | |
See “About Fund Performance” on page 15 for descriptions of the indexes.
| | |
| 10 | | 2019 BLACKROCK ANNUAL REPORTTO SHAREHOLDERS |
| | |
| Fund Summary as of December 31, 2019 (continued) | | BlackRock LifePath® Dynamic 2045 Fund |
Performance Summary for the Period Ended December 31, 2019
| | | | | | | | | | | | | | | | | | | | | | | | | | | | | | | | | | | | | | | | |
| | | | | | | | | Average Annual Total Returns (a)(b) | |
| | | | | | | | | 1 Year | | | | | | 5 Years | | | | | | Since Inception (c) | |
| | | 6-Month
Total Returns | | | | | | w/o sales
charge | | | w/sales
charge | | | | | | w/o sales
charge | | | w/sales
charge | | | | | | w/o sales
charge | | | w/sales
charge | |
Institutional | | | 8.23 | % | | | | | | | 26.38 | % | | | N/A | | | | | | | | 8.42 | % | | | N/A | | | | | | | | 10.65 | % | | | N/A | |
Investor A | | | 8.10 | | | | | | | | 26.05 | | | | 19.43 | % | | | | | | | 8.16 | | | | 7.00 | % | | | | | | | 10.38 | | | | 9.76 | % |
Investor C | | | 7.69 | | | | | | | | 25.07 | | | | 24.07 | | | | | | | | 7.31 | | | | 7.31 | | | | | | | | 9.53 | | | | 9.53 | |
Class K | | | 8.39 | | | | | | | | 26.67 | | | | N/A | | | | | | | | 8.69 | | | | N/A | | | | | | | | 10.97 | | | | N/A | |
Class R | | | 8.00 | | | | | | | | 25.83 | | | | N/A | | | | | | | | 7.94 | | | | N/A | | | | | | | | 10.13 | | | | N/A | |
LifePath® Dynamic 2045 Fund Custom Benchmark | | | 8.89 | | | | | | | | 26.33 | | | | N/A | | | | | | | | 8.30 | | | | N/A | | | | | | | | 10.64 | | | | N/A | |
Bloomberg Barclays U.S. Aggregate Bond Index | | | 2.45 | | | | | | | | 8.72 | | | | N/A | | | | | | | | 3.05 | | | | N/A | | | | | | | | 3.38 | | | | N/A | |
Bloomberg Barclays U.S. TIPS Index (Series L) | | | 2.15 | | | | | | | | 8.43 | | | | N/A | | | | | | | | 2.62 | | | | N/A | | | | | | | | 3.07 | | | | N/A | |
FTSE EPRA Nareit Developed Index | | | 6.46 | | | | | | | | 21.91 | | | | N/A | | | | | | | | 5.56 | | | | N/A | | | | | | | | 9.37 | | | | N/A | |
MSCI ACWI ex USA IMI Index | | | 7.33 | | | | | | | | 21.63 | | | | N/A | | | | | | | | 5.71 | | | | N/A | | | | | | | | 6.71 | | | | N/A | |
Russell 1000® Index | | | 10.59 | | | | | | | | 31.43 | | | | N/A | | | | | | | | 11.48 | | | | N/A | | | | | | | | 15.10 | | | | N/A | |
Russell 2000® Index | | | 7.30 | | | | | | | | 25.52 | | | | N/A | | | | | | | | 8.23 | | | | N/A | | | | | | | | 12.71 | | | | N/A | |
| | (a) | Assuming maximum sales charges, if any. Average annual total returns with and without sales charges reflect reductions for distributions and service fees. See “About Fund Performance” on page 15 for a detailed description of share classes, including any related sales charges and fees. | |
| | (b) | Effective November 7, 2016, LifePath Dynamic Fund changed its investment strategy to (i) incorporate a Global Tactical Asset Allocation into its glidepath, (ii) increase the flexibility of its equity allocations and (iii) diversify its fixed-income strategies. Performance for the periods shown between December 14, 2015 and November 7, 2016 is based on the prior investment strategy. Effective December 14, 2015, LifePath Dynamic Fund changed its investment strategy to (i) incorporate a dynamic glidepath and (ii) invest directly in securities and derivatives, as well as in underlying funds. Performance for the periods shown prior to December 14, 2015 is based on the prior investment strategy. Effective November 28, 2014, the Fund changed its glide path and target asset allocation to target higher levels of equity exposure for LifePath Dynamic Fund throughout the glide path. Performance for the periods shown prior to November 28, 2014 is based on the prior glide path and target asset allocation. | |
| | (c) | The LifePath Dynamic Fund commenced operations on June 30, 2010. | |
N/A — Not applicable as share class and index do not have a sales charge.
Past performance is not indicative of future results.
Performance results may include adjustments made for financial reporting purposes in accordance with U.S. generally accepted accounting principles.
| | |
| Fund Summary as of December 31, 2019 | | BlackRock LifePath® Dynamic 2055 Fund |
Investment Objective
The investment objective ofBlackRock LifePath® Dynamic 2055 Fund (“LifePath Dynamic 2055 Fund” or the “LifePath Dynamic Fund”) is to seek to provide for retirement outcomes based on quantitatively measured risk. In pursuit of this objective, LifePath Dynamic 2055 Fund will be broadly diversified across global asset classes, with asset allocations becoming more conservative over time.
TOTAL RETURN BASED ON A $10,000 INVESTMENT
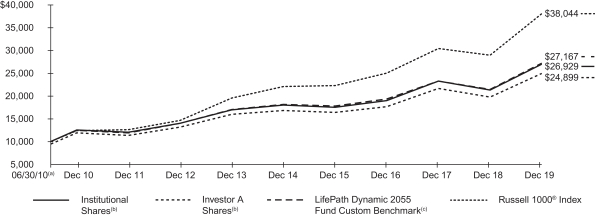
| (a) | Commencement of operations. |
| (b) | Assuming maximum sales charges, transaction costs and other operating expenses, including advisory fees, if any. Institutional Shares do not have a sales charge. |
| (c) | The LifePath Dynamic Fund compares its performance to that of a customized weighted index (the “LifePath Dynamic 2055 Fund Custom Benchmark”) comprised of the indexes indicated below, which reflects the investment adviser’s changes to the benchmark’s weightings over time. The investment adviser adjusts the weightings of these indexes periodically based upon its evaluation and adjustment of the LifePath Dynamic Fund’s asset allocation strategy. The weightings are presented annually but they are adjusted quarterly. |
The LifePath Dynamic Fund’s custom benchmark consists of the following:
| | | | | | | | | | | | | | | | | | | | | | | | | | | | | | | | | | | | | | | | |
| Period | | Bloomberg
Barclays
U.S. Aggregate
Bond Index | | | Bloomberg
Barclays
U.S. Treasury
Inflation
Protected
Securities
(TIPS) Index
(Series L) | | | Bloomberg
Commodity
Index (a) | | | FTSE
EPRA Nareit
Developed
Index | | | MSCI
ACWI ex USA
IMI Index | | | Russell
1000®
Index | | | Russell
2000®
Index | | | S&P
MidCap
400® Index | | | S&P 500®
Index | | | S&P
SmallCap
600® Index | |
06/30/10 to 12/31/10 | | | 1.0 | % | | | N/A | | | | N/A | | | | 9.0 | % | | | 28.2 | % | | | N/A | | | | N/A | | | | 8.1 | % | | | 50.1 | % | | | 3.6 | % |
01/01/11 to 12/31/11 | | | 1.0 | | | | N/A | | | | N/A | | | | 9.7 | | | | 28.8 | | | | 22.0 | % | | | 2.0 | % | | | 4.9 | | | | 29.5 | | | | 2.1 | |
01/01/12 to 12/31/12 | | | 1.3 | | | | N/A | | | | 1.0 | % | | | 11.3 | | | | 28.6 | | | | 54.5 | | | | 3.3 | | | | N/A | | | | N/A | | | | N/A | |
01/01/13 to 12/31/13 | | | 3.1 | | | | N/A | | | | 4.1 | | | | 11.5 | | | | 27.8 | | | | 51.7 | | | | 1.8 | | | | N/A | | | | N/A | | | | N/A | |
01/01/14 to 12/31/14 | | | 4.0 | | | | N/A | | | | 4.0 | | | | 12.2 | | | | 28.6 | | | | 49.4 | | | | 1.8 | | | | N/A | | | | N/A | | | | N/A | |
01/01/15 to 12/31/15 | | | 1.0 | | | | N/A | | | | 4.2 | | | | 13.7 | | | | 29.9 | | | | 49.2 | | | | 2.0 | | | | N/A | | | | N/A | | | | N/A | |
01/01/16 to 12/31/16 | | | 1.0 | | | | N/A | | | | 4.4 | | | | 14.1 | | | | 30.4 | | | | 48.3 | | | | 1.8 | | | | N/A | | | | N/A | | | | N/A | |
01/01/17 to 12/31/17 | | | 1.0 | | | | N/A | | | | 4.3 | | | | 15.3 | | | | 30.9 | | | | 47.5 | | | | 1.0 | | | | N/A | | | | N/A | | | | N/A | |
01/01/18 to 12/31/18 | | | 1.0 | | | | N/A | | | | N/A | | | | 16.1 | | | | 31.8 | | | | 50.1 | | | | 1.0 | | | | N/A | | | | N/A | | | | N/A | |
01/01/19 to 12/31/19 | | | 0.8 | | | | 0.2 | % | | | N/A | | | | 4.8 | | | | 40.2 | | | | 52.0 | | | | 2.0 | | | | N/A | | | | N/A | | | | N/A | |
| | (a) | Prior to July 1, 2014, the Bloomberg Commodity Index was known as the Dow Jones-UBS Commodity Index. | |
See “About Fund Performance” on page 15 for descriptions of the indexes.
| | |
| 12 | | 2019 BLACKROCK ANNUAL REPORTTO SHAREHOLDERS |
| | |
| Fund Summary as of December 31, 2019 (continued) | | BlackRock LifePath® Dynamic 2055 Fund |
Performance Summary for the Period Ended December 31, 2019
| | | | | | | | | | | | | | | | | | | | | | | | | | | | | | | | | | | | | | | | |
| | | | | | | | | Average Annual Total Returns (a)(b) | |
| | | | | | | | | 1 Year | | | | | | 5 Years | | | | | | Since Inception (c) | |
| | | 6-Month
Total Returns | | | | | | w/o sales
charge | | | w/sales
charge | | | | | | w/o sales
charge | | | w/sales
charge | | | | | | w/o sales
charge | | | w/sales
charge | |
Institutional | | | 8.58 | % | | | | | | | 26.48 | % | | | N/A | | | | | | | | 8.41 | % | | | N/A | | | | | | | | 10.98 | % | | | N/A | |
Investor A | | | 8.47 | | | | | | | | 26.12 | | | | 19.50 | % | | | | | | | 8.15 | | | | 6.99 | % | | | | | | | 10.70 | | | | 10.07 | % |
Investor C | | | 8.03 | | | | | | | | 25.17 | | | | 24.17 | | | | | | | | 7.28 | | | | 7.28 | | | | | | | | 9.85 | | | | 9.85 | |
Class K | | | 8.78 | | | | | | | | 26.75 | | | | N/A | | | | | | | | 8.67 | | | | N/A | | | | | | | | 11.33 | | | | N/A | |
Class R | | | 8.37 | | | | | | | | 25.89 | | | | N/A | | | | | | | | 7.90 | | | | N/A | | | | | | | | 10.44 | | | | N/A | |
LifePath® Dynamic 2055 Fund Custom Benchmark | | | 9.11 | | | | | | | | 26.95 | | | | N/A | | | | | | | | 8.41 | | | | N/A | | | | | | | | 11.09 | | | | N/A | |
Bloomberg Barclays U.S. Aggregate Bond Index | | | 2.45 | | | | | | | | 8.72 | | | | N/A | | | | | | | | 3.05 | | | | N/A | | | | | | | | 3.38 | | | | N/A | |
Bloomberg Barclays U.S. TIPS Index (Series L) | | | 2.15 | | | | | | | | 8.43 | | | | N/A | | | | | | | | 2.62 | | | | N/A | | | | | | | | 3.07 | | | | N/A | |
FTSE EPRA Nareit Developed Index | | | 6.46 | | | | | | | | 21.91 | | | | N/A | | | | | | | | 5.56 | | | | N/A | | | | | | | | 9.37 | | | | N/A | |
MSCI ACWI ex USA IMI Index | | | 7.33 | | | | | | | | 21.63 | | | | N/A | | | | | | | | 5.71 | | | | N/A | | | | | | | | 6.71 | | | | N/A | |
Russell 1000® Index | | | 10.59 | | | | | | | | 31.43 | | | | N/A | | | | | | | | 11.48 | | | | N/A | | | | | | | | 15.10 | | | | N/A | |
Russell 2000® Index | | | 7.30 | | | | | | | | 25.52 | | | | N/A | | | | | | | | 8.23 | | | | N/A | | | | | | | | 12.71 | | | | N/A | |
| | (a) | Assuming maximum sales charges, if any. Average annual total returns with and without sales charges reflect reductions for distributions and service fees. See “About Fund Performance” on page 15 for a detailed description of share classes, including any related sales charges and fees. | |
| | (b) | Effective November 7, 2016, LifePath Dynamic Fund changed its investment strategy to (i) incorporate a Global Tactical Asset Allocation into its glidepath, (ii) increase the flexibility of its equity allocations and (iii) diversify its fixed-income strategies. Performance for the periods shown between December 14, 2015 and November 7, 2016 is based on the prior investment strategy. Effective December 14, 2015, LifePath Dynamic Fund changed its investment strategy to (i) incorporate a dynamic glidepath and (ii) invest directly in securities and derivatives, as well as in underlying funds. Performance for the periods shown prior to December 14, 2015 is based on the prior investment strategy. Performance for the periods shown prior to November 28, 2014 is based on the prior glide path and target asset allocation. | |
| | (c) | The LifePath Dynamic Fund commenced operations on June 30, 2010. | |
N/A — Not applicable as share class and index do not have a sales charge.
Past performance is not indicative of future results.
Performance results may include adjustments made for financial reporting purposes in accordance with U.S. generally accepted accounting principles.
| | |
| Fund Summary as of December 31, 2019 | | BlackRock LifePath® Dynamic 2065 Fund |
Investment Objective
The investment objective ofBlackRock LifePath® Dynamic 2065 Fund (“LifePath Dynamic 2065 Fund” or the “LifePath Dynamic Fund”) is to seek to provide for retirement outcomes based on quantitatively measured risk. In pursuit of this objective, LifePath Dynamic 2065 Fund will be broadly diversified across global asset classes, with asset allocations becoming more conservative over time.
The LifePath Dynamic Fund’s custom benchmark consists of the following:
| | | | | | | | | | | | | | | | | | | | | | | | |
| Period | | Bloomberg
Barclays
U.S. Aggregate
Bond Index | | | Bloomberg
Barclays
U.S. Treasury
Inflation
Protected
Securities (TIPS) Index
(Series L) | | | FTSE
EPRA Nareit
Developed
Index | | | MSCI
ACWI ex USA
IMI Index | | | Russell
1000®
Index | | | Russell
2000®
Index | |
10/30/19 to 12/31/19 | | | 1.0 | | | | 0.0 | | | | 4.8 | | | | 40.2 | | | | 52.0 | | | | 2.0 | |
See “About Fund Performance” on page 15 for descriptions of the indexes.
Performance Summary for the Period Ended December 31, 2019
| | | | | | | | |
| | | Total Returns (a)(b) | |
| | | Since Inception (c) | |
| | | w/o sales
charge | | | w/sales
charge | |
Institutional | | | 5.36 | % | | | N/A | |
Investor A | | | 5.32 | | | | (0.21 | )% |
Investor C | | | 5.18 | | | | 4.18 | |
Class K | | | 5.49 | | | | N/A | |
Class R | | | 5.28 | | | | N/A | |
LifePath® Dynamic 2065 Fund Custom Benchmark | | | 5.69 | | | | N/A | |
Bloomberg Barclays U.S. Aggregate Bond Index | | | 0.41 | | | | N/A | |
Bloomberg Barclays U.S. TIPS Index (Series L) | | | 1.08 | | | | N/A | |
FTSE EPRA Nareit Developed Index | | | (0.52 | ) | | | N/A | |
MSCI ACWI ex USA IMI Index | | | 5.56 | | | | N/A | |
Russell 1000® Index | | | 6.42 | | | | N/A | |
Russell 2000® Index | | | 6.42 | | | | N/A | |
| | (a) | Assuming maximum sales charges, if any. Aggregate total returns with and without sales charges reflect reductions for distributions and service fees. See “About Fund Performance” on page 15 for a detailed description of share classes, including any related sales charges and fees. | |
| | (b) | The LifePath Dynamic Fund compares its performance to that of a customized weighted index (the “LifePath Dynamic 2065 Fund Custom Benchmark”) comprised of the indexes indicated above, which reflects the investment adviser’s changes to the benchmark’s weightings over time. The investment adviser adjusts the weightings of these indexes periodically based upon its evaluation and adjustment of the LifePath Dynamic Fund’s asset allocation strategy. The weightings are presented annually but they are adjusted quarterly. | |
| | (c) | The LifePath Dynamic Fund commenced operations on October 30, 2019. | |
N/A — Not applicable as share class and index do not have a sales charge.
Past performance is not indicative of future results.
Performance results may include adjustments made for financial reporting purposes in accordance with U.S. generally accepted accounting principles.
| | |
| 14 | | 2019 BLACKROCK ANNUAL REPORTTO SHAREHOLDERS |
About Fund Performance
Institutional and Class K Shares are not subject to any sales charge. These shares bear no ongoing distribution or service fees and are available only to certain eligible investors.
Investor A Shares are subject to a maximum initial sales charge (front-end load) of 5.25% and a service fee of 0.25% per year (but no distribution fee). Certain redemptions of these shares may be subject to a contingent deferred sales charge (“CDSC”) where no initial sales charge was paid at the time of purchase. These shares are generally available through financial intermediaries.
Investor C Shares are subject to a 1.00% CDSC if redeemed within one year of purchase. In addition, these shares are subject to a distribution fee of 0.75% per year and a service fee of 0.25% per year. These shares are generally available through financial intermediaries. These shares automatically convert to Investor A Shares after approximately ten years.
Class R Shares are not subject to any sales charge. These shares are subject to a distribution fee of 0.25% per year and a service fee of 0.25% per year. These shares are available only to certain employer-sponsored retirement plans.
Performance information reflects past performance and does not guarantee future results. Current performance may be lower or higher than the performance data quoted. Refer toblackrock.com to obtain performance data current to the most recent month-end. Performance results do not reflect the deduction of taxes that a shareholder would pay on LifePath Dynamic Fund distributions or the redemption of LifePath Dynamic Fund shares. Figures shown in each of the performance tables on the previous pages assume reinvestment of all distributions, if any, at net asset value (“NAV”) on the ex-dividend date. Investment return and principal value of shares will fluctuate so that shares, when redeemed, may be worth more or less than their original cost. Distributions paid to each class of shares will vary because of the different levels of service, distribution and transfer agency fees applicable to each class, which are deducted from the income available to be paid to shareholders.
BlackRock Advisors, LLC (“BAL” or the “Administrator”), each LifePath Dynamic Fund’s administrator, has contractually agreed to waive and/or reimburse a portion of each LifePath Dynamic Fund’s expenses. Without such waiver and/or reimbursement, each LifePath Dynamic Fund’s performance would have been lower. With respect to each Fund’s contractual waiver, the Administrator is under no obligation to continue waiving and/or reimbursing its fees after the applicable termination date of such agreement. See Note 4 of the Notes to Financial Statements for additional information on waivers and/or reimbursements.
The LifePath Dynamic Funds’ custom benchmarks are hypothetical representations of the performance of the respective LifePath Dynamic Fund’s asset classes according to their weightings as of the most recent quarter-end. The weightings of the various indexes that are included in the LifePath Dynamic Funds’ custom benchmarks are adjusted quarterly to reflect the LifePath Dynamic Funds’ changing asset allocations over time. As of December 31, 2019, the following indexes are used to calculate the LifePath Dynamic Funds’ custom benchmarks: Bloomberg Barclays U.S. Aggregate Bond Index, Bloomberg Barclays U.S. Treasury Inflation Protected Securities (TIPS) Index (Series L), FTSE EPRA Nareit Developed Index, MSCI ACWI ex USA IMI Index, Russell 1000® Index and Russell 2000® Index, as applicable.
The Bloomberg Barclays U.S. Aggregate Bond Index is a widely recognized unmanaged market-weighted index, comprised of investment-grade corporate bonds rated BBB or better, mortgages and U.S. Treasury and U.S. Government agency issues with at least one year to maturity. The Bloomberg Barclays U.S. Treasury Inflation Protected Securities (TIPS) Index (Series L) is an unmanaged index that measures the performance of the inflation-protected public obligations of the U.S. Treasury. The FTSE EPRA Nareit Developed Index is a global market capitalization weighted index composed of listed real estate securities from developed market countries in North America, Europe and Asia. The MSCI ACWI ex USA IMI Index is a free float-adjusted market capitalization weighted index that measures the equity market performance of the developed (excluding the U.S.) and emerging investable market universe. The Russell 1000® Index is an index that measures the performance of the large-cap segment of the U.S. equity universe. It is a subset of the Russell 3000® Index and includes approximately 1,000 of the largest securities based on a combination of their market capitalization and current index membership. The Russell 1000® Index represents approximately 92% of the total market capitalization of the Russell 3000® Index. The Russell 2000® Index is an unmanaged index that is a subset of the Russell 3000® Index representing approximately 10% of the total market capitalization of that index. It includes approximately 2000 of the smallest securities based on a combination of their market cap and current index membership.
| | | | |
| ABOUT FUND PERFORMANCE | | | 15 | |
Disclosure of Expenses
Shareholders of each LifePath® Dynamic Fund may incur the following charges: (a) transactional expenses, such as sales charges; and (b) operating expenses, including administration fees, service and distribution fees, including 12b-1 fees, acquired fund fees and expenses, and other fund expenses. The expense examples shown below (which are based on a hypothetical investment of $1,000 invested on July 1, 2019 and held through December 31, 2019, except with respect to LifePath® Dynamic 2065 Fund’s Shares which are based on a hypothetical investment of $1,000 on October 30, 2019 (commencement of operations) and held through December 31, 2019) are intended to assist shareholders both in calculating expenses based on an investment in each LifePath® Dynamic Fund and in comparing these expenses with similar costs of investing in other mutual funds.
The expense examples provide information about actual account values and actual expenses. In order to estimate the expenses a shareholder paid during the period covered by this report, shareholders can divide their account value by $1,000 and then multiply the result by the number corresponding to their LifePath® Dynamic Fund and share class under the heading entitled “Expenses Paid During the Period.”
The expense examples also provide information about hypothetical account values and hypothetical expenses based on a LifePath® Dynamic Fund’s actual expense ratio and an assumed rate of return of 5% per year before expenses. In order to assist shareholders in comparing the ongoing expenses of investing in a LifePath® Dynamic Fund and other funds, compare the 5% hypothetical examples with the 5% hypothetical examples that appear in shareholder reports of other funds.
The expenses shown in the expense examples are intended to highlight shareholders’ ongoing costs only and do not reflect transactional expenses, such as sales charges, if any. Therefore, the hypothetical examples are useful in comparing ongoing expenses only, and will not help shareholders determine the relative total expenses of owning different funds. If these transactional expenses were included, shareholder expenses would have been higher.
Expense Examples
| | | | | | | | | | | | | | | | | | | | | | | | | | | | | | | | |
| | | Actual | | | | | | Hypothetical (b) | | | | |
| | | Beginning
Account Value (07/01/19) | | | Ending
Account Value
(12/31/19) | | | Expenses
Paid During
the Period (a) | | | | | | Beginning
Account Value
(07/01/19) | | | Ending
Account Value
(12/31/19) | | | Expenses
Paid During
the Period (a) | | | Annualized
Expense
Ratio | |
| LifePath® Dynamic 2025 Fund | | | | | | | | | | | | | | | | | | | | | | | | | | | | | | | | |
Institutional | | $ | 1,000.00 | | | $ | 1,056.40 | | | $ | 2.80 | | | | | | | $ | 1,000.00 | | | $ | 1,022.48 | | | $ | 2.75 | | | | 0.54 | % |
Investor A | | | 1,000.00 | | | | 1,055.50 | | | | 4.09 | | | | | | | | 1,000.00 | | | | 1,021.22 | | | | 4.02 | | | | 0.79 | |
Investor C | | | 1,000.00 | | | | 1,050.50 | | | | 8.22 | | | | | | | | 1,000.00 | | | | 1,017.19 | | | | 8.08 | | | | 1.59 | |
Class K | | | 1,000.00 | | | | 1,057.30 | | | | 1.81 | | | | | | | | 1,000.00 | | | | 1,023.44 | | | | 1.79 | | | | 0.35 | |
Class R | | | 1,000.00 | | | | 1,053.40 | | | | 5.18 | | | | | | | | 1,000.00 | | | | 1,020.16 | | | | 5.09 | | | | 1.00 | |
| LifePath® Dynamic 2035 Fund | | | | | | | | | | | | | | | | | | | | | | | | | | | | | | | | |
Institutional | | $ | 1,000.00 | | | $ | 1,073.10 | | | $ | 2.82 | | | | | | | $ | 1,000.00 | | | $ | 1,022.48 | | | $ | 2.75 | | | | 0.54 | % |
Investor A | | | 1,000.00 | | | | 1,071.20 | | | | 4.12 | | | | | | | | 1,000.00 | | | | 1,021.22 | | | | 4.02 | | | | 0.79 | |
Investor C | | | 1,000.00 | | | | 1,067.70 | | | | 8.29 | | | | | | | | 1,000.00 | | | | 1,017.19 | | | | 8.08 | | | | 1.59 | |
Class K | | | 1,000.00 | | | | 1,074.00 | | | | 1.78 | | | | | | | | 1,000.00 | | | | 1,023.49 | | | | 1.73 | | | | 0.34 | |
Class R | | | 1,000.00 | | | | 1,070.90 | | | | 5.17 | | | | | | | | 1,000.00 | | | | 1,020.12 | | | | 5.04 | | | | 0.99 | |
| LifePath® Dynamic 2045 Fund | | | | | | | | | | | | | | | | | | | | | | | | | | | | | | | | |
Institutional | | $ | 1,000.00 | | | $ | 1,082.30 | | | $ | 2.83 | | | | | | | $ | 1,000.00 | | | $ | 1,022.48 | | | $ | 2.75 | | | | 0.54 | % |
Investor A | | | 1,000.00 | | | | 1,081.00 | | | | 4.20 | | | | | | | | 1,000.00 | | | | 1,021.17 | | | | 4.08 | | | | 0.80 | |
Investor C | | | 1,000.00 | | | | 1,076.90 | | | | 8.32 | | | | | | | | 1,000.00 | | | | 1,017.19 | | | | 8.08 | | | | 1.59 | |
Class K | | | 1,000.00 | | | | 1,083.90 | | | | 1.73 | | | | | | | | 1,000.00 | | | | 1,023.54 | | | | 1.68 | | | | 0.33 | |
Class R | | | 1,000.00 | | | | 1,080.00 | | | | 5.24 | | | | | | | | 1,000.00 | | | | 1,020.16 | | | | 5.09 | | | | 1.00 | |
| LifePath® Dynamic 2055 Fund | | | | | | | | | | | | | | | | | | | | | | | | | | | | | | | | |
Institutional | | $ | 1,000.00 | | | $ | 1,085.80 | | | $ | 2.79 | | | | | | | $ | 1,000.00 | | | $ | 1,022.53 | | | $ | 2.70 | | | | 0.53 | % |
Investor A | | | 1,000.00 | | | | 1,084.70 | | | | 4.15 | | | | | | | | 1,000.00 | | | | 1,021.22 | | | | 4.02 | | | | 0.79 | |
Investor C | | | 1,000.00 | | | | 1,080.30 | | | | 8.34 | | | | | | | | 1,000.00 | | | | 1,017.19 | | | | 8.08 | | | | 1.59 | |
Class K | | | 1,000.00 | | | | 1,087.80 | | | | 1.74 | | | | | | | | 1,000.00 | | | | 1,023.54 | | | | 1.68 | | | | 0.33 | |
Class R | | | 1,000.00 | | | | 1,083.70 | | | | 5.20 | | | | | | | | 1,000.00 | | | | 1,020.21 | | | | 5.04 | | | | 0.99 | |
| LifePath® Dynamic 2065 Fund | | | | | | | | | | | | | | | | | | | | | | | | | | | | | | | | |
Institutional | | $ | 1,000.00 | | | $ | 1,053.60 | | | $ | 0.98 | | | | | | | $ | 1,000.00 | | | $ | 1,023.19 | | | $ | 2.04 | | | | 0.56 | % |
Investor A | | | 1,000.00 | | | | 1,053.20 | | | | 1.41 | | | | | | | | 1,000.00 | | | | 1,021.12 | | | | 4.13 | | | | 0.81 | |
Investor C | | | 1,000.00 | | | | 1,058.10 | | | | 2.81 | | | | | | | | 1,000.00 | | | | 1,017.09 | | | | 8.19 | | | | 1.61 | |
Class K | | | 1,000.00 | | | | 1,054.90 | | | | 0.63 | | | | | | | | 1,000.00 | | | | 1,023.39 | | | | 1.84 | | | | 0.36 | |
Class R | | | 1,000.00 | | | | 1,052.80 | | | | 1.76 | | | | | | | | 1,000.00 | | | | 1,020.11 | | | | 5.14 | | | | 1.01 | |
| | (a) | Expenses for each LifePath® Dynamic Fund are equal to the annualized expense ratio for the class, multiplied by the average account value over the period, multiplied by 184/365 (to reflect the one-half year period shown), except LifePath Dynamic 2065 Fund which is multiplied by 62/365 (to reflect the period since inception date of October 30, 2019). Because each LifePath® Dynamic Fund invests all of its assets in a LifePath® Dynamic Master Portfolio, the expense examples reflect the net expenses of both the LifePath® Dynamic Fund and the LifePath® Dynamic Master Portfolio in which it invests. | |
| | (b) | Hypothetical 5% return before expenses is calculated by prorating the number of days in the most recent fiscal half year divided by 365. | |
| | |
| 16 | | 2019 BLACKROCK ANNUAL REPORTTO SHAREHOLDERS |
Derivative Financial Instruments
The LifePath® Dynamic Master Portfolios may invest in various derivative financial instruments. These instruments are used to obtain exposure to a security, commodity, index, market, and/or other assets without owning or taking physical custody of securities, commodities and/or other referenced assets or to manage market, equity, credit, interest rate, foreign currency exchange rate, commodity and/or other risks. Derivative financial instruments may give rise to a form of economic leverage and involve risks, including the imperfect correlation between the value of a derivative financial instrument and the underlying asset, possible default of the counterparty to the transaction or illiquidity of the instrument. The LifePath® Dynamic Master Portfolios’ successful use of a derivative financial instrument depends on the investment adviser’s ability to predict pertinent market movements accurately, which cannot be assured. The use of these instruments may result in losses greater than if they had not been used, may limit the amount of appreciation a LifePath® Dynamic Master Portfolio can realize on an investment and/or may result in lower distributions paid to shareholders. The LifePath® Dynamic Master Portfolios’ investments in these instruments, if any, are discussed in detail in the Notes to Financial Statements.
| | | | |
| DERIVATIVE FINANCIAL INSTRUMENTS | | | 17 | |
Statements of Assets and Liabilities
December 31, 2019
| | | | | | | | | | | | | | | | | | | | |
| | | BlackRock LifePath
Dynamic 2025
Fund | | | BlackRock LifePath
Dynamic 2035
Fund | | | BlackRock LifePath
Dynamic 2045
Fund | | | BlackRock LifePath
Dynamic 2055
Fund | | | BlackRock LifePath
Dynamic 2065
Fund | |
|
ASSETS | |
Investments at value — from the applicable LifePath Dynamic Master Portfolio | | $ | 69,400,926 | | | $ | 69,357,383 | | | $ | 50,475,083 | | | $ | 27,464,171 | | | $ | 4,218,303 | |
Receivables: | |
Capital shares sold | | | 321,994 | | | | 384,869 | | | | 361,876 | | | | 135,016 | | | | — | |
Withdrawals from the Master Portfolio | | | 2,934,225 | | | | 1,010,443 | | | | 145,041 | | | | 230,046 | | | | — | |
Prepaid expenses | | | — | | | | — | | | | — | | | | — | | | | 9,235 | |
| | | | | | | | | | | | | | | | | | | | |
Total assets | | | 72,657,145 | | | | 70,752,695 | | | | 50,982,000 | | | | 27,829,233 | | | | 4,227,538 | |
| | | | | | | | | | | | | | | | | | | | |
|
LIABILITIES | |
Payables: | |
Administration fees | | | 27,628 | | | | 28,399 | | | | — | | | | 11,227 | | | | — | |
Capital gains distributions | | | 178,058 | | | | 166,561 | | | | 154,439 | | | | 66,784 | | | | — | |
Capital shares redeemed | | | 3,256,219 | | | | 1,395,312 | | | | 506,917 | | | | 365,062 | | | | — | |
Income dividend distributions | | | 44,711 | | | | 47,132 | | | | 43,264 | | | | 20,719 | | | | 25,978 | |
Professional fees | | | 11,010 | | | | 11,013 | | | | 30,609 | | | | 11,005 | | | | 10,989 | |
Service and distribution fees | | | 10,872 | | | | 11,252 | | | | 7,212 | | | | 4,779 | | | | 597 | |
| | | | | | | | | | | | | | | | | | | | |
Total liabilities | | | 3,528,498 | | | | 1,659,669 | | | | 742,441 | | | | 479,576 | | | | 37,564 | |
| | | | | | | | | | | | | | | | | | | | |
| | | | | |
NET ASSETS | | $ | 69,128,647 | | | $ | 69,093,026 | | | $ | 50,239,559 | | | $ | 27,349,657 | | | $ | 4,189,974 | |
| | | | | | | | | | | | | | | | | | | | |
|
NET ASSETS CONSIST OF | |
Paid-in capital | | $ | 63,649,870 | | | $ | 62,564,386 | | | $ | 44,738,696 | | | $ | 24,333,248 | | | $ | 4,000,000 | |
Accumulated earnings | | | 5,478,777 | | | | 6,528,640 | | | | 5,500,863 | | | | 3,016,409 | | | | 189,974 | |
| | | | | | | | | | | | | | | | | | | | |
NET ASSETS | | $ | 69,128,647 | | | $ | 69,093,026 | | | $ | 50,239,559 | | | $ | 27,349,657 | | | $ | 4,189,974 | |
| | | | | | | | | | | | | | | | | | | | |
|
NET ASSET VALUE | |
|
| Institutional | |
Net assets | | $ | 2,907,979 | | | $ | 4,003,611 | | | $ | 4,656,350 | | | $ | 3,461,278 | | | $ | 418,999 | |
| | | | | | | | | | | | | | | | | | | | |
Shares outstanding(a) | | | 216,618 | | | | 279,227 | | | | 304,113 | | | | 217,660 | | | | 40,000 | |
| | | | | | | | | | | | | | | | | | | | |
Net asset value | | $ | 13.42 | | | $ | 14.34 | | | $ | 15.31 | | | $ | 15.90 | | | $ | 10.47 | |
| | | | | | | | | | | | | | | | | | | | |
|
| Investor A | |
Net assets | | $ | 23,298,349 | | | $ | 28,656,161 | | | $ | 18,811,040 | | | $ | 13,347,174 | | | $ | 418,993 | |
| | | | | | | | | | | | | | | | | | | | |
Shares outstanding(a) | | | 1,752,914 | | | | 2,008,164 | | | | 1,231,546 | | | | 843,606 | | | | 40,000 | |
| | | | | | | | | | | | | | | | | | | | |
Net asset value | | $ | 13.29 | | | $ | 14.27 | | | $ | 15.27 | | | $ | 15.82 | | | $ | 10.47 | |
| | | | | | | | | | | | | | | | | | | | |
| | | | | |
| Investor C | | | | | | | | | | | | | | | |
Net assets | | $ | 3,416,166 | | | $ | 3,172,888 | | | $ | 1,732,352 | | | $ | 1,212,390 | | | $ | 418,978 | |
| | | | | | | | | | | | | | | | | | | | |
Shares outstanding(a) | | | 258,720 | | | | 224,902 | | | | 115,218 | | | | 77,815 | | | | 40,000 | |
| | | | | | | | | | | | | | | | | | | | |
Net asset value | | $ | 13.20 | | | $ | 14.11 | | | $ | 15.04 | | | $ | 15.58 | | | $ | 10.47 | |
| | | | | | | | | | | | | | | | | | | | |
| | | | | |
| Class K | | | | | | | | | | | | | | | |
Net assets | | $ | 34,027,347 | | | $ | 27,719,565 | | | $ | 20,936,164 | | | $ | 7,240,331 | | | $ | 2,514,014 | |
| | | | | | | | | | | | | | | | | | | | |
Shares outstanding(a) | | | 2,561,958 | | | | 1,907,711 | | | | 1,352,596 | | | | 449,248 | | | | 240,000 | |
| | | | | | | | | | | | | | | | | | | | |
Net asset value | | $ | 13.28 | | | $ | 14.53 | | | $ | 15.48 | | | $ | 16.12 | | | $ | 10.48 | |
| | | | | | | | | | | | | | | | | | | | |
| | | | | |
| Class R | | | | | | | | | | | | | | | |
Net assets | | $ | 5,478,806 | | | $ | 5,540,801 | | | $ | 4,103,653 | | | $ | 2,088,484 | | | $ | 418,990 | |
| | | | | | | | | | | | | | | | | | | | |
Shares outstanding(a) | | | 413,031 | | | | 388,682 | | | | 269,516 | | | | 132,352 | | | | 40,000 | |
| | | | | | | | | | | | | | | | | | | | |
Net asset value | | $ | 13.26 | | | $ | 14.26 | | | $ | 15.23 | | | $ | 15.78 | | | $ | 10.47 | |
| | | | | | | | | | | | | | | | | | | | |
| (a) | Unlimited number of shares authorized, no par value. |
See notes to financial statements.
| | |
| 18 | | 2019 BLACKROCK ANNUAL REPORTTO SHAREHOLDERS |
Statements of Operations
Year Ended December 31, 2019
| | | | | | | | | | | | | | | | | | | | |
| | | BlackRock LifePath
Dynamic 2025
Fund | | | BlackRock LifePath
Dynamic 2035
Fund | | | BlackRock LifePath
Dynamic 2045
Fund | | | BlackRock LifePath
Dynamic 2055
Fund | | | BlackRock LifePath
Dynamic 2065
Fund (a) | |
| | | | | |
INVESTMENT INCOME | | | | | | | | | | | | | | | | | | | | |
| Net investment income allocated from the applicable LifePath Dynamic Master Portfolio: | | | | | | | | | | | | | | | | | | | | |
Dividends — affiliated | | $ | 924,554 | | | $ | 1,091,475 | | | $ | 885,365 | | | $ | 526,690 | | | $ | 32,295 | |
Dividends — unaffiliated | | | 31,303 | | | | 55,712 | | | | 52,983 | | | | 32,331 | | | | 6 | |
Interest — affiliated | | | 694,453 | | | | 329,189 | | | | 87,300 | | | | 34,881 | | | | 1,038 | |
Securities lending income — affiliated — net | | | 3,369 | | | | 4,768 | | | | 3,219 | | | | 2,125 | | | | 32 | |
Foreign taxes withheld | | | (3,008 | ) | | | (5,618 | ) | | | (5,504 | ) | | | (3,295 | ) | | | — | |
Expenses | | | (364,985 | ) | | | (350,529 | ) | | | (260,915 | ) | | | (162,287 | ) | | | (21,894 | ) |
Fees waived | | | 249,390 | | | | 244,506 | | | | 184,527 | | | | 119,205 | | | | 20,435 | |
| | | | | | | | | | | | | | | | | | | | |
Total investment income | | | 1,535,076 | | | | 1,369,503 | | | | 946,975 | | | | 549,650 | | | | 31,912 | |
| | | | | | | | | | | | | | | | | | | | |
| | | | | |
FUND EXPENSES | | | | | | | | | | | | | | | | | | | | |
Administration — class specific | | | 160,831 | | | | 162,412 | | | | 113,455 | | | | 70,932 | | | | 1,601 | |
Service and distribution — class specific | | | 123,276 | | | | 129,319 | | | | 83,953 | | | | 52,529 | | | | 1,218 | |
Professional | | | 11,000 | | | | 11,000 | | | | 11,001 | | | | 11,000 | | | | 10,988 | |
Miscellaneous | | | 400 | | | | 400 | | | | 171 | | | | 57 | | | | 1 | |
| | | | | | | | | | | | | | | | | | | | |
Total expenses | | | 295,507 | | | | 303,131 | | | | 208,580 | | | | 134,518 | | | | 13,808 | |
Less fees waived and/or reimbursed by the Administrator/Manager | | | (11,000 | ) | | | (11,000 | ) | | | (11,001 | ) | | | (11,000 | ) | | | (10,988 | ) |
| | | | | | | | | | | | | | | | | | | | |
Total expenses after fees waived and/or reimbursed | | | 284,507 | | | | 292,131 | | | | 197,579 | | | | 123,518 | | | | 2,820 | |
| | | | | | | | | | | | | | | | | | | | |
Net investment income | | | 1,250,569 | | | | 1,077,372 | | | | 749,396 | | | | 426,132 | | | | 29,092 | |
| | | | | | | | | | | | | | | | | | | | |
| | | | | |
REALIZED AND UNREALIZED GAIN (LOSS) ALLOCATED FROM THE APPLICABLE LIFEPATH DYNAMIC MASTER PORTFOLIO | | | | | | | | | | | | | | | | | | | | |
Net realized gain (loss) from investments, futures contracts, forward foreign currency exchange contracts and foreign currency transactions | | | 3,266,564 | | | | 3,684,815 | | | | 2,917,559 | | | | 1,582,032 | | | | (5,094 | ) |
Net change in unrealized appreciation (depreciation) on investments, futures contracts, forward foreign currency exchange contracts and foreign currency transactions | | | 5,432,682 | | | | 6,518,973 | | | | 5,336,792 | | | | 2,993,610 | | | | 191,955 | |
| | | | | | | | | | | | | | | | | | | | |
Net realized and unrealized gain | | | 8,699,246 | | | | 10,203,788 | | | | 8,254,351 | | | | 4,575,642 | | | | 186,861 | |
| | | | | | | | | | | | | | | | | | | | |
NET INCREASE IN NET ASSETS RESULTING FROM OPERATIONS | | $ | 9,949,815 | | | $ | 11,281,160 | | | $ | 9,003,747 | | | $ | 5,001,774 | | | $ | 215,953 | |
| | | | | | | | | | | | | | | | | | | | |
| (a) | Commenced operations on October 30, 2019. |
See notes to financial statements.
Statements of Changes in Net Assets
| | | | | | | | | | | | | | | | | | | | |
| | | BlackRock LifePath
Dynamic 2025 Fund
| | | | | | BlackRock LifePath
Dynamic 2035 Fund | |
| | | Year Ended December 31, | | | | | | Year Ended December 31, | |
| | | 2019 | | | 2018 | | | | | | 2019 | | | 2018 | |
| | | |
INCREASE (DECREASE) IN NET ASSETS | | | | | | | | | | | | | |
| | | |
OPERATIONS | | | | | | | | | | | | | |
Net investment income | | $ | 1,250,569 | | | $ | 1,239,429 | | | | | | | $ | 1,077,372 | | | $ | 976,179 | |
Net realized gain | | | 3,266,564 | | | | 1,648,991 | | | | | | | | 3,684,815 | | | | 2,055,236 | |
Net change in unrealized appreciation (depreciation) | | | 5,432,682 | | | | (5,135,830 | ) | | | | | | | 6,518,973 | | | | (6,158,085 | ) |
| | | | | | | | | | | | | | | | | | | | |
Net increase (decrease) in net assets resulting from operations | | | 9,949,815 | | | | (2,247,410 | ) | | | | | | | 11,281,160 | | | | (3,126,670 | ) |
| | | | | | | | | | | | | | | | | | | | |
| | | |
DISTRIBUTIONS(a) | | | | | | | | | | | | | |
Institutional | | | (137,717 | ) | | | (558,096 | ) | | | | | | | (193,339 | ) | | | (461,901 | ) |
Investor A | | | (1,256,631 | ) | | | (2,457,257 | ) | | | | | | | (1,468,527 | ) | | | (2,937,914 | ) |
Investor C | | | (135,798 | ) | | | (205,437 | ) | | | | | | | (131,352 | ) | | | (249,689 | ) |
Class K | | | (1,545,875 | ) | | | (863,497 | ) | | | | | | | (1,218,744 | ) | | | (696,327 | ) |
Class R | | | (264,445 | ) | | | (435,198 | ) | | | | | | | (257,255 | ) | | | (319,829 | ) |
| | | | | | | | | | | | | | | | | | | | |
Decrease in net assets resulting from distributions to shareholders | | | (3,340,466 | ) | | | (4,519,485 | ) | | | | | | | (3,269,217 | ) | | | (4,665,660 | ) |
| | | | | | | | | | | | | | | | | | | | |
| | | |
CAPITAL SHARE TRANSACTIONS | | | | | | | | | | | | | |
Net increase (decrease) in net assets derived from capital share transactions | | | 18,562,231 | | | | (14,612,544 | ) | | | | | | | 18,501,665 | | | | (4,777,641 | ) |
| | | | | | | | | | | | | | | | | | | | |
| | | |
NET ASSETS | | | | | | | | | | | | | |
Total increase (decrease) in net assets | | | 25,171,580 | | | | (21,379,439 | ) | | | | | | | 26,513,608 | | | | (12,569,971 | ) |
Beginning of year | | | 43,957,067 | | | | 65,336,506 | | | | | | | | 42,579,418 | | | | 55,149,389 | |
| | | | | | | | | | | | | | | | | | | | |
End of year | | $ | 69,128,647 | | | $ | 43,957,067 | | | | | | | $ | 69,093,026 | | | $ | 42,579,418 | |
| | | | | | | | | | | | | | | | | | | | |
| (a) | Distributions for annual periods determined in accordance with U.S. federal income tax regulations. |
See notes to financial statements.
| | |
| 20 | | 2019 BLACKROCK ANNUAL REPORTTO SHAREHOLDERS |
Statements of Changes in Net Assets (continued)
| | | | | | | | | | | | | | | | | | | | |
| | | BlackRock LifePath
Dynamic 2045 Fund | | | | | | BlackRock LifePath
Dynamic 2055 Fund | |
| | | Year Ended December 31, | | | | | | Year Ended December 31, | |
| | | 2019 | | | 2018 | | | | | | 2019 | | | 2018 | |
| | | | | |
INCREASE (DECREASE) IN NET ASSETS | | | | | | | | | | | | | | | | | | | | |
| | | | | |
OPERATIONS | | | | | | | | | | | | | | | | | | | | |
Net investment income | | $ | 749,396 | | | $ | 593,819 | | | | | | | $ | 426,132 | | | $ | 321,733 | |
Net realized gain | | | 2,917,559 | | | | 1,228,479 | | | | | | | | 1,582,032 | | | | 528,522 | |
Net change in unrealized appreciation (depreciation) | | | 5,336,792 | | | | (4,585,218 | ) | | | | | | | 2,993,610 | | | | (2,494,402 | ) |
| | | | | | | | | | | | | | | | | | | | |
Net increase (decrease) in net assets resulting from operations | | | 9,003,747 | | | | (2,762,920 | ) | | | | | | | 5,001,774 | | | | (1,644,147 | ) |
| | | | | | | | | | | | | | | | | | | | |
| | | |
DISTRIBUTIONS(a) | | | | | | | | | | | | | |
Institutional | | | (225,986 | ) | | | (460,490 | ) | | | | | | | (155,902 | ) | | | (253,416 | ) |
Investor A | | | (933,152 | ) | | | (1,819,866 | ) | | | | | | | (622,770 | ) | | | (1,096,533 | ) |
Investor C | | | (71,164 | ) | | | (146,766 | ) | | | | | | | (46,497 | ) | | | (75,457 | ) |
Class K | | | (902,351 | ) | | | (464,820 | ) | | | | | | | (298,269 | ) | | | (183,243 | ) |
Class R | | | (190,658 | ) | | | (314,270 | ) | | | | | | | (92,006 | ) | | | (80,950 | ) |
| | | | | | | | | | | | | | | | | | | | |
Decrease in net assets resulting from distributions to shareholders | | | (2,323,311 | ) | | | (3,206,212 | ) | | | | | | | (1,215,444 | ) | | | (1,689,599 | ) |
| | | | | | | | | | | | | | | | | | | | |
| | | |
CAPITAL SHARE TRANSACTIONS | | | | | | | | | | | | | |
Net increase (decrease) in net assets derived from capital share transactions | | | 13,648,807 | | | | (339,644 | ) | | | | | | | 6,591,286 | | | | 1,104,216 | |
| | | | | | | | | | | | | | | | | | | | |
| | | |
NET ASSETS | | | | | | | | | | | | | |
Total increase (decrease) in net assets | | | 20,329,243 | | | | (6,308,776 | ) | | | | | | | 10,377,616 | | | | (2,229,530 | ) |
Beginning of year | | | 29,910,316 | | | | 36,219,092 | | | | | | | | 16,972,041 | | | | 19,201,571 | |
| | | | | | | | | | | | | | | | | | | | |
End of year | | $ | 50,239,559 | | | $ | 29,910,316 | | | | | | | $ | 27,349,657 | | | $ | 16,972,041 | |
| | | | | | | | | | | | | | | | | | | | |
| (a) | Distributions for annual periods determined in accordance with U.S. federal income tax regulations. |
See notes to financial statements.
Statements of Changes in Net Assets (continued)
| | | | |
| | | BlackRock LifePath
Dynamic 2065 Fund | |
| | | Period from 10/30/19 (a) to 12/31/19 | |
| |
INCREASE (DECREASE) IN NET ASSETS | | | | |
| |
OPERATIONS | | | | |
Net investment income | | $ | 29,092 | |
Net realized loss | | | (5,094 | ) |
Net change in unrealized appreciation (depreciation) | | | 191,955 | |
| | | | |
Net increase in net assets resulting from operations | | | 215,953 | |
| | | | |
|
DISTRIBUTIONS(b) | |
Institutional | | | (2,636 | ) |
Investor A | | | (2,462 | ) |
Investor C | | | (1,906 | ) |
Class K | | | (16,652 | ) |
Class R | | | (2,323 | ) |
| | | | |
Decrease in net assets resulting from distributions to shareholders | | | (25,979 | ) |
| | | | |
|
CAPITAL SHARE TRANSACTIONS | |
Net increase in net assets derived from capital share transactions | | | 4,000,000 | |
| | | | |
|
NET ASSETS | |
Total increase in net assets | | | 4,189,974 | |
Beginning of period | | | — | |
| | | | |
End of period | | $ | 4,189,974 | |
| | | | |
| (a) | Commencement of operations. |
| (b) | Distributions for annual periods determined in accordance with U.S. federal income tax regulations. |
See notes to financial statements.
| | |
| 22 | | 2019 BLACKROCK ANNUAL REPORTTO SHAREHOLDERS |
Financial Highlights
(For a share outstanding throughout each period)
| | | | | | | | | | | | | | | | | | | | |
| | | BlackRock LifePath Dynamic 2025 Fund | |
| |
| | | Institutional | |
| |
| | | Year Ended December 31, | |
| | | 2019 | | | 2018 | | | 2017 | | | 2016 | | | 2015 | |
| | | | | |
Net asset value, beginning of year | | $ | 11.81 | | | $ | 13.52 | | | $ | 12.66 | | | $ | 12.05 | | | $ | 12.80 | |
| | | | | | | | | | | | | | | | | | | | |
Net investment income(a) | | | 0.30 | | | | 0.25 | | | | 0.22 | | | | 0.21 | | | | 0.19 | |
Net realized and unrealized gain (loss) | | | 1.99 | | | | (0.87 | ) | | | 1.71 | | | | 0.61 | | | | (0.44 | ) |
| | | | | | | | | | | | | | | | | | | | |
Net increase (decrease) from investment operations | | | 2.29 | | | | (0.62 | ) | | | 1.93 | | | | 0.82 | | | | (0.25 | ) |
| | | | | | | | | | | | | | | | | | | | |
|
Distributions(b) | |
From net investment income | | | (0.27 | ) | | | (0.24 | ) | | | (0.21 | ) | | | (0.21 | ) | | | (0.21 | ) |
From net realized gain | | | (0.41 | ) | | | (0.85 | ) | | | (0.86 | ) | | | (0.00 | )(c) | | | (0.28 | ) |
From return of capital | | | — | | | | — | | | | — | | | | — | | | | (0.01 | ) |
| | | | | | | | | | | | | | | | | | | | |
Total distributions | | | (0.68 | ) | | | (1.09 | ) | | | (1.07 | ) | | | (0.21 | ) | | | (0.50 | ) |
| | | | | | | | | | | | | | | | | | | | |
| | | | | |
Net asset value, end of year | | $ | 13.42 | | | $ | 11.81 | | | $ | 13.52 | | | $ | 12.66 | | | $ | 12.05 | |
| | | | | | | | | | | | | | | | | | | | |
|
Total Return(d) | |
Based on net asset value | | | 19.46 | % | | | (4.66 | )% | | | 15.45 | % | | | 6.88 | % | | | (1.92 | )% |
| | | | | | | | | | | | | | | | | | | | |
|
Ratios to Average Net Assets(e)(f) | |
Total expenses | | | 0.57 | % | | | 0.57 | % | | | 0.56 | % | | | 0.58 | % | | | 0.74 | % |
| | | | | | | | | | | | | | | | | | | | |
Total expenses after fees waived and/or reimbursed | | | 0.55 | % | | | 0.55 | % | | | 0.54 | % | | | 0.57 | % | | | 0.71 | % |
| | | | | | | | | | | | | | | | | | | | |
Net investment income | | | 2.32 | % | | | 1.87 | % | | | 1.66 | % | | | 1.74 | % | | | 1.51 | % |
| | | | | | | | | | | | | | | | | | | | |
|
Supplemental Data | |
Net assets, end of year (000) | | $ | 2,908 | | | $ | 1,519 | | | $ | 19,134 | | | $ | 26,146 | | | $ | 27,821 | |
| | | | | | | | | | | | | | | | | | | | |
Portfolio turnover rate of the LifePath Dynamic Master Portfolio | | | 35 | %(g) | | | 38 | %(g) | | | 32 | %(g) | | | 54 | %(g) | | | 51 | %(h) |
| | | | | | | | | | | | | | | | | | | | |
| (a) | Based on average shares outstanding. |
| (b) | Distributions for annual periods determined in accordance with U.S. federal income tax regulations. |
| (c) | Amount is greater than $(0.005) per share. |
| (d) | Where applicable, assumes the reinvestment of distributions. |
| (e) | Includes the LifePath Dynamic Fund’s share of its corresponding LifePath Dynamic Master Portfolio’s allocated net expenses and/or net investment income. |
| (f) | Includes the LifePath Dynamic Fund’s share of its corresponding LifePath Dynamic Master Portfolio’s allocated fees waived and expenses and/or net investment income. Excludes expenses incurred indirectly as a result of the LifePath Dynamic Master Portfolio’s investments in underlying funds as follows: |
| | | | | | | | | | | | | | | | | | | | |
| | | Year Ended December 31, | |
| | | 2019 | | | 2018 | | | 2017 | | | 2016 | | | 2015 | |
Allocated fees waived | | | 0.43 | % | | | 0.41 | % | | | 0.41 | % | | | 0.40 | % | | | 0.40 | % |
Investments in underlying funds | | | 0.10 | % | | | 0.10 | % | | | 0.14 | % | | | 0.11 | % | | | 0.13 | % |
| | | | | | | | | | | | | | | | | | | | |
| (g) | Includes the LifePath Dynamic Master Portfolio’s purchases and sales of the underlying funds and Active Stock Master Portfolio, CoreAlpha Bond Master Portfolio, International Tilts Master Portfolio, Large Cap Index Master Portfolio, Master Small Cap Index Series and Master Total Return Portfolio. |
| (h) | Includes the LifePath Dynamic Master Portfolio’s purchases and sales of the underlying funds and Active Stock Master Portfolio, CoreAlpha Bond Master Portfolio, International Tilts Master Portfolio, Large Cap Index Master Portfolio and Master Small Cap Index Series. |
See notes to financial statements.
Financial Highlights (continued)
(For a share outstanding throughout each period)
| | | | | | | | | | | | | | | | | | | | |
| | | BlackRock LifePath Dynamic 2025 Fund (continued) | |
| |
| | | Investor A | |
| |
| | | Year Ended December 31, | |
| | | 2019 | | | 2018 | | | 2017 | | | 2016 | | | 2015 | |
| | | | | |
Net asset value, beginning of year | | $ | 11.70 | | | $ | 13.50 | | | $ | 12.64 | | | $ | 12.04 | | | $ | 12.78 | |
| | | | | | | | | | | | | | | | | | | | |
Net investment income(a) | | | 0.26 | | | | 0.26 | | | | 0.20 | | | | 0.18 | | | | 0.16 | |
Net realized and unrealized gain (loss) | | | 1.98 | | | | (0.91 | ) | | | 1.70 | | | | 0.60 | | | | (0.43 | ) |
| | | | | | | | | | | | | | | | | | | | |
Net increase (decrease) from investment operations | | | 2.24 | | | | (0.65 | ) | | | 1.90 | | | | 0.78 | | | | (0.27 | ) |
| | | | | | | | | | | | | | | | | | | | |
| | | | | |
Distributions(b) | | | | | | | | | | | | | | | | | | | | |
From net investment income | | | (0.24 | ) | | | (0.30 | ) | | | (0.18 | ) | | | (0.18 | ) | | | (0.18 | ) |
From net realized gain | | | (0.41 | ) | | | (0.85 | ) | | | (0.86 | ) | | | (0.00 | )(c) | | | (0.28 | ) |
From return of capital | | | — | | | | — | | | | — | | | | — | | | | (0.01 | ) |
| | | | | | | | | | | | | | | | | | | | |
Total distributions | | | (0.65 | ) | | | (1.15 | ) | | | (1.04 | ) | | | (0.18 | ) | | | (0.47 | ) |
| | | | | | | | | | | | | | | | | | | | |
| | | | | |
Net asset value, end of year | | $ | 13.29 | | | $ | 11.70 | | | $ | 13.50 | | | $ | 12.64 | | | $ | 12.04 | |
| | | | | | | | | | | | | | | | | | | | |
|
Total Return(d) | |
Based on net asset value | | | 19.16 | % | | | (4.87 | )% | | | 15.21 | % | | | 6.54 | % | | | (2.17 | )% |
| | | | | | | | | | | | | | | | | | | | |
|
Ratios to Average Net Assets(e)(f) | |
Total expenses | | | 0.82 | % | | | 0.83 | % | | | 0.81 | % | | | 0.83 | % | | | 0.99 | % |
| | | | | | | | | | | | | | | | | | | | |
Total expenses after fees waived and/or reimbursed | | | 0.80 | % | | | 0.81 | % | | | 0.79 | % | | | 0.82 | % | | | 0.96 | % |
| | | | | | | | | | | | | | | | | | | | |
Net investment income | | | 1.97 | % | | | 1.94 | % | | | 1.45 | % | | | 1.50 | % | | | 1.26 | % |
| | | | | | | | | | | | | | | | | | | | |
|
Supplemental Data | |
Net assets, end of year (000) | | $ | 23,298 | | | $ | 25,940 | | | $ | 31,393 | | | $ | 28,135 | | | $ | 30,373 | |
| | | | | | | | | | | | | | | | | | | | |
Portfolio turnover rate of the LifePath Dynamic Master Portfolio | | | 35 | %(g) | | | 38 | %(g) | | | 32 | %(g) | | | 54 | %(g) | | | 51 | %(h) |
| | | | | | | | | | | | | | | | | | | | |
| (a) | Based on average shares outstanding. |
| (b) | Distributions for annual periods determined in accordance with U.S. federal income tax regulations. |
| (c) | Amount is greater than $(0.005) per share. |
| (d) | Where applicable, excludes the effects of any sales charges and assumes the reinvestment of distributions. |
| (e) | Includes the LifePath Dynamic Fund’s share of its corresponding LifePath Dynamic Master Portfolio’s allocated net expenses and/or net investment income. |
| (f) | Includes the LifePath Dynamic Fund’s share of its corresponding LifePath Dynamic Master Portfolio’s allocated fees waived and expenses and/or net investment income. Excludes expenses incurred indirectly as a result of LifePath Dynamic Master Portfolio’s investments in underlying funds as follows: |
| | | | | | | | | | | | | | | | | | | | |
| | | Year Ended December 31, | |
| | | 2019 | | | 2018 | | | 2017 | | | 2016 | | | 2015 | |
Allocated fees waived | | | 0.43 | % | | | 0.41 | % | | | 0.41 | % | | | 0.40 | % | | | 0.40 | % |
Investments in underlying funds | | | 0.10 | % | | | 0.10 | % | | | 0.14 | % | | | 0.11 | % | | | 0.13 | % |
| | | | | | | | | | | | | | | | | | | | |
| (g) | Includes the LifePath Dynamic Master Portfolio’s purchases and sales of the underlying funds and Active Stock Master Portfolio, CoreAlpha Bond Master Portfolio, International Tilts Master Portfolio, Large Cap Index Master Portfolio, Master Small Cap Index Series and Master Total Return Portfolio. |
| (h) | Includes the LifePath Dynamic Master Portfolio’s purchases and sales of the underlying funds and Active Stock Master Portfolio, CoreAlpha Bond Master Portfolio, International Tilts Master Portfolio, Large Cap Index Master Portfolio and Master Small Cap Index Series. |
See notes to financial statements.
| | |
| 24 | | 2019 BLACKROCK ANNUAL REPORTTO SHAREHOLDERS |
Financial Highlights (continued)
(For a share outstanding throughout each period)
| | | | | | | | | | | | | | | | | | | | |
| | | BlackRock LifePath Dynamic 2025 Fund (continued) | |
| |
| | | Investor C | |
| |
| | | Year Ended December 31, | |
| | | 2019 | | | 2018 | | | 2017 | | | 2016 | | | 2015 | |
| | | | | |
Net asset value, beginning of year | | $ | 11.63 | | | $ | 13.44 | | | $ | 12.58 | | | $ | 11.99 | | | $ | 12.72 | |
| | | | | | | | | | | | | | | | | | | | |
Net investment income(a) | | | 0.16 | | | | 0.16 | | | | 0.09 | | | | 0.08 | | | | 0.06 | |
Net realized and unrealized gain (loss) | | | 1.96 | | | | (0.92 | ) | | | 1.70 | | | | 0.59 | | | | (0.42 | ) |
| | | | | | | | | | | | | | | | | | | | |
Net increase (decrease) from investment operations | | | 2.12 | | | | (0.76 | ) | | | 1.79 | | | | 0.67 | | | | (0.36 | ) |
| | | | | | | | | | | | | | | | | | | | |
| | | | | |
Distributions(b) | | | | | | | | | | | | | | | | | | | | |
From net investment income | | | (0.14 | ) | | | (0.20 | ) | | | (0.07 | ) | | | (0.08 | ) | | | (0.09 | ) |
From net realized gain | | | (0.41 | ) | | | (0.85 | ) | | | (0.86 | ) | | | (0.00 | )(c) | | | (0.27 | ) |
From return of capital | | | — | | | | — | | | | — | | | | — | | | | (0.01 | ) |
| | | | | | | | | | | | | | | | | | | | |
Total distributions | | | (0.55 | ) | | | (1.05 | ) | | | (0.93 | ) | | | (0.08 | ) | | | (0.37 | ) |
| | | | | | | | | | | | | | | | | | | | |
| | | | | |
Net asset value, end of year | | $ | 13.20 | | | $ | 11.63 | | | $ | 13.44 | | | $ | 12.58 | | | $ | 11.99 | |
| | | | | | | | | | | | | | | | | | | | |
|
Total Return(d) | |
Based on net asset value | | | 18.25 | % | | | (5.70 | )% | | | 14.39 | % | | | 5.61 | % | | | (2.86 | )% |
| | | | | | | | | | | | | | | | | | | | |
|
Ratios to Average Net Assets(e)(f) | |
Total expenses | | | 1.62 | % | | | 1.63 | % | | | 1.61 | % | | | 1.63 | % | | | 1.75 | % |
| | | | | | | | | | | | | | | | | | | | |
Total expenses after fees waived and/or reimbursed | | | 1.60 | % | | | 1.61 | % | | | 1.59 | % | | | 1.62 | % | | | 1.72 | % |
| | | | | | | | | | | | | | | | | | | | |
Net investment income | | | 1.25 | % | | | 1.17 | % | | | 0.66 | % | | | 0.69 | % | | | 0.51 | % |
| | | | | | | | | | | | | | | | | | | | |
|
Supplemental Data | |
Net assets, end of year (000) | | $ | 3,416 | | | $ | 2,434 | | | $ | 2,583 | | | $ | 2,339 | | | $ | 2,900 | |
| | | | | | | | | | | | | | | | | | | | |
Portfolio turnover rate of the LifePath Dynamic Master Portfolio | | | 35 | %(g) | | | 38 | %(g) | | | 32 | %(g) | | | 54 | %(g) | | | 51 | %(h) |
| | | | | | | | | | | | | | | | | | | | |
| (a) | Based on average shares outstanding. |
| (b) | Distributions for annual periods determined in accordance with U.S. federal income tax regulations. |
| (c) | Amount is greater than $(0.005) per share. |
| (d) | Where applicable, excludes the effects of any sales charges and assumes the reinvestment of distributions. |
| (e) | Includes the LifePath Dynamic Fund’s share of its corresponding LifePath Dynamic Master Portfolio’s allocated net expenses and/or net investment income. |
| (f) | Includes the LifePath Dynamic Fund’s share of its corresponding LifePath Dynamic Master Portfolio’s allocated fees waived and expenses and/or net investment income. Excludes expenses incurred indirectly as a result of the LifePath Dynamic Master Portfolio’s investments in underlying funds as follows: |
| | | | | | | | | | | | | | | | | | | | |
| | | Year Ended December 31, | |
| | | 2019 | | | 2018 | | | 2017 | | | 2016 | | | 2015 | |
Allocated fees waived | | | 0.43 | % | | | 0.41 | % | | | 0.41 | % | | | 0.40 | % | | | 0.40 | % |
Investments in underlying funds | | | 0.10 | % | | | 0.10 | % | | | 0.14 | % | | | 0.11 | % | | | 0.13 | % |
| | | | | | | | | | | | | | | | | | | | |
| (g) | Includes the LifePath Dynamic Master Portfolio’s purchases and sales of the underlying funds and Active Stock Master Portfolio, CoreAlpha Bond Master Portfolio, International Tilts Master Portfolio, Large Cap Index Master Portfolio, Master Small Cap Index Series and Master Total Return Portfolio. |
| (h) | Includes the LifePath Dynamic Master Portfolio’s purchases and sales of the underlying funds and Active Stock Master Portfolio, CoreAlpha Bond Master Portfolio, International Tilts Master Portfolio, Large Cap Index Master Portfolio and Master Small Cap Index Series. |
See notes to financial statements.
Financial Highlights (continued)
(For a share outstanding throughout each period)
| | | | | | | | | | | | | | | | | | | | |
| | | BlackRock LifePath Dynamic 2025 Fund (continued) | |
| |
| | | Class K | |
| |
| | | Year Ended December 31, | |
| | | 2019 | | | 2018 | | | 2017 | | | 2016 | | | 2015 | |
| | | | | |
Net asset value, beginning of year | | $ | 11.69 | | | $ | 13.49 | | | $ | 12.63 | | | $ | 12.03 | | | $ | 12.78 | |
| | | | | | | | | | | | | | | | | | | | |
Net investment income(a) | | | 0.34 | | | | 0.33 | | | | 0.27 | | | | 0.25 | | | | 0.25 | |
Net realized and unrealized gain (loss) | | | 1.96 | | | | (0.91 | ) | | | 1.69 | | | | 0.59 | | | | (0.45 | ) |
| | | | | | | | | | | | | | | | | | | | |
Net increase (decrease) from investment operations | | | 2.30 | | | | (0.58 | ) | | | 1.96 | | | | 0.84 | | | | (0.20 | ) |
| | | | | | | | | | | | | | | | | | | | |
| | | | | |
Distributions(b) | | | | | | | | | | | | | | | | | | | | |
From net investment income | | | (0.30 | ) | | | (0.37 | ) | | | (0.24 | ) | | | (0.24 | ) | | | (0.26 | ) |
From net realized gain | | | (0.41 | ) | | | (0.85 | ) | | | (0.86 | ) | | | (0.00 | )(c) | | | (0.28 | ) |
From return of capital | | | — | | | | — | | | | — | | | | — | | | | (0.01 | ) |
| | | | | | | | | | | | | | | | | | | | |
Total distributions | | | (0.71 | ) | | | (1.22 | ) | | | (1.10 | ) | | | (0.24 | ) | | | (0.55 | ) |
| | | | | | | | | | | | | | | | | | | | |
| | | | | |
Net asset value, end of year | | $ | 13.28 | | | $ | 11.69 | | | $ | 13.49 | | | $ | 12.63 | | | $ | 12.03 | |
| | | | | | | | | | | | | | | | | | | | |
|
Total Return(d) | |
Based on net asset value | | | 19.72 | % | | | (4.43 | )% | | | 15.75 | % | | | 7.02 | % | | | (1.64 | )% |
| | | | | | | | | | | | | | | | | | | | |
|
Ratios to Average Net Assets(e)(f) | |
Total expenses | | | 0.37 | % | | | 0.38 | % | | | 0.36 | % | | | 0.38 | % | | | 0.41 | % |
| | | | | | | | | | | | | | | | | | | | |
Total expenses after fees waived and/or reimbursed | | | 0.35 | % | | | 0.36 | % | | | 0.34 | % | | | 0.37 | % | | | 0.38 | % |
| | | | | | | | | | | | | | | | | | | | |
Net investment income | | | 2.62 | % | | | 2.44 | % | | | 2.01 | % | | | 2.02 | % | | | 2.00 | % |
| | | | | | | | | | | | | | | | | | | | |
|
Supplemental Data | |
Net assets, end of year (000) | | $ | 34,027 | | | $ | 9,062 | | | $ | 7,919 | | | $ | 2,902 | | | $ | 1,278 | |
| | | | | | | | | | | | | | | | | | | | |
Portfolio turnover rate of the LifePath Dynamic Master Portfolio | | | 35 | %(g) | | | 38 | %(g) | | | 32 | %(g) | | | 54 | %(g) | | | 51 | %(h) |
| | | | | | | | | | | | | | | | | | | | |
| (a) | Based on average shares outstanding. |
| (b) | Distributions for annual periods determined in accordance with U.S. federal income tax regulations. |
| (c) | Amount is greater than $(0.005) per share. |
| (d) | Where applicable, assumes the reinvestment of distributions. |
| (e) | Includes the LifePath Dynamic Fund’s share of its corresponding LifePath Dynamic Master Portfolio’s allocated net expenses and/or net investment income. |
| (f) | Includes the LifePath Dynamic Fund’s share of its corresponding LifePath Dynamic Master Portfolio’s allocated fees waived and expenses and/or net investment income. Excludes expenses incurred indirectly as a result of the LifePath Dynamic Master Portfolio’s investments in underlying funds as follows: |
| | | | | | | | | | | | | | | | | | | | |
| | | Year Ended December 31, | |
| | | 2019 | | | 2018 | | | 2017 | | | 2016 | | | 2015 | |
Allocated fees waived | | | 0.43 | % | | | 0.41 | % | | | 0.41 | % | | | 0.40 | % | | | 0.40 | % |
Investments in underlying funds | | | 0.10 | % | | | 0.10 | % | | | 0.14 | % | | | 0.11 | % | | | 0.13 | % |
| | | | | | | | | | | | | | | | | | | | |
| (g) | Includes the LifePath Dynamic Master Portfolio’s purchases and sales of the underlying funds and Active Stock Master Portfolio, CoreAlpha Bond Master Portfolio, International Tilts Master Portfolio, Large Cap Index Master Portfolio, Master Small Cap Index Series and Master Total Return Portfolio. |
| (h) | Includes the LifePath Dynamic Master Portfolio’s purchases and sales of the underlying funds and Active Stock Master Portfolio, CoreAlpha Bond Master Portfolio, International Tilts Master Portfolio, Large Cap Index Master Portfolio and Master Small Cap Index Series. |
See notes to financial statements.
| | |
| 26 | | 2019 BLACKROCK ANNUAL REPORTTO SHAREHOLDERS |
Financial Highlights (continued)
(For a share outstanding throughout each period)
| | | | | | | | | | | | | | | | | | | | |
| | | BlackRock LifePath Dynamic 2025 Fund (continued) | |
| |
| | | Class R | |
| |
| | | Year Ended December 31, | |
| | | 2019 | | | 2018 | | | 2017 | | | 2016 | | | 2015 | |
| | | | | |
Net asset value, beginning of year | | $ | 11.68 | | | $ | 13.49 | | | $ | 12.63 | | | $ | 12.04 | | | $ | 12.79 | |
| | | | | | | | | | | | | | | | | | | | |
Net investment income(a) | | | 0.24 | | | | 0.24 | | | | 0.17 | | | | 0.16 | | | | 0.13 | |
Net realized and unrealized gain (loss) | | | 1.97 | | | | (0.92 | ) | | | 1.71 | | | | 0.59 | | | | (0.43 | ) |
| | | | | | | | | | | | | | | | | | | | |
Net increase (decrease) from investment operations | | | 2.21 | | | | (0.68 | ) | | | 1.88 | | | | 0.75 | | | | (0.30 | ) |
| | | | | | | | | | | | | | | | | | | | |
| | | | | |
| Distributions(b) | | | | | | | | | | | | | | | |
From net investment income | | | (0.22 | ) | | | (0.28 | ) | | | (0.16 | ) | | | (0.16 | ) | | | (0.17 | ) |
From net realized gain | | | (0.41 | ) | | | (0.85 | ) | | | (0.86 | ) | | | (0.00 | )(c) | | | (0.27 | ) |
From return of capital | | | — | | | | — | | | | — | | | | — | | | | (0.01 | ) |
| | | | | | | | | | | | | | | | | | | | |
Total distributions | | | (0.63 | ) | | | (1.13 | ) | | | (1.02 | ) | | | (0.16 | ) | | | (0.45 | ) |
| | | | | | | | | | | | | | | | | | | | |
| | | | | |
Net asset value, end of year | | $ | 13.26 | | | $ | 11.68 | | | $ | 13.49 | | | $ | 12.63 | | | $ | 12.04 | |
| | | | | | | | | | | | | | | | | | | | |
| | | | | |
Total Return(d) | | | | | | | | | | | | | | | | | | | | |
Based on net asset value | | | 18.91 | % | | | (5.10 | )% | | | 15.02 | % | | | 6.28 | % | | | (2.36 | )% |
| | | | | | | | | | | | | | | | | | | | |
| | | | | |
Ratios to Average Net Assets(e)(f) | | | | | | | | | | | | | | | | | | | | |
Total expenses | | | 1.02 | % | | | 1.03 | % | | | 1.01 | % | | | 1.03 | % | | | 1.24 | % |
| | | | | | | | | | | | | | | | | | | | |
Total expenses after fees waived and/or reimbursed | | | 1.00 | % | | | 1.01 | % | | | 0.99 | % | | | 1.02 | % | | | 1.21 | % |
| | | | | | | | | | | | | | | | | | | | |
Net investment income | | | 1.82 | % | | | 1.77 | % | | | 1.27 | % | | | 1.32 | % | | | 1.06 | % |
| | | | | | | | | | | | | | | | | | | | |
| | | | | |
Supplemental Data | | | | | | | | | | | | | | | | | | | | |
Net assets, end of year (000) | | $ | 5,479 | | | $ | 5,003 | | | $ | 4,308 | | | $ | 2,967 | | | $ | 2,690 | |
| | | | | | | | | | | | | | | | | | | | |
Portfolio turnover rate of the LifePath Dynamic Master Portfolio | | | 35 | %(g) | | | 38 | %(g) | | | 32 | %(g) | | | 54 | %(g) | | | 51 | %(h) |
| | | | | | | | | | | | | | | | | | | | |
| (a) | Based on average shares outstanding. |
| (b) | Distributions for annual periods determined in accordance with U.S. federal income tax regulations. |
| (c) | Amount is greater than $(0.005) per share. |
| (d) | Where applicable, assumes the reinvestment of distributions. |
| (e) | Includes the LifePath Dynamic Fund’s share of its corresponding LifePath Dynamic Master Portfolio’s allocated net expenses and/or net investment income. |
| (f) | Includes the LifePath Dynamic Fund’s share of its corresponding LifePath Dynamic Master Portfolio’s allocated fees waived and expenses and/or net investment income. Excludes expenses incurred indirectly as a result of the LifePath Dynamic Master Portfolio’s investments in underlying funds as follows: |
| | | | | | | | | | | | | | | | | | | | |
| | | Year Ended December 31, | |
| | | 2019 | | | 2018 | | | 2017 | | | 2016 | | | 2015 | |
Allocated fees waived | | | 0.43 | % | | | 0.41 | % | | | 0.41 | % | | | 0.40 | % | | | 0.40 | % |
Investments in underlying funds | | | 0.10 | % | | | 0.10 | % | | | 0.14 | % | | | 0.11 | % | | | 0.13 | % |
| | | | | | | | | | | | | | | | | | | | |
| (g) | Includes the LifePath Dynamic Master Portfolio’s purchases and sales of the underlying funds and Active Stock Master Portfolio, CoreAlpha Bond Master Portfolio, International Tilts Master Portfolio, Large Cap Index Master Portfolio, Master Small Cap Index Series and Master Total Return Portfolio. |
| (h) | Includes the LifePath Dynamic Master Portfolio’s purchases and sales of the underlying funds and Active Stock Master Portfolio, CoreAlpha Bond Master Portfolio, International Tilts Master Portfolio, Large Cap Index Master Portfolio and Master Small Cap Index Series. |
See notes to financial statements.
Financial Highlights (continued)
(For a share outstanding throughout each period)
| | | | | | | | | | | | | | | | | | | | |
| | | BlackRock LifePath Dynamic 2035 Fund | |
| |
| | | Institutional | |
| |
| | | Year Ended December 31, | |
| | | 2019 | | | 2018 | | | 2017 | | | 2016 | | | 2015 | |
| | | | | |
Net asset value, beginning of year | | $ | 12.21 | | | $ | 14.48 | | | $ | 13.28 | | | $ | 12.58 | | | $ | 13.43 | |
| | | | | | | | | | | | | | | | | | | | |
Net investment income(a) | | | 0.30 | | | | 0.25 | | | | 0.22 | | | | 0.23 | | | | 0.21 | |
Net realized and unrealized gain (loss) | | | 2.58 | | | | (1.15 | ) | | | 2.34 | | | | 0.72 | | | | (0.49 | ) |
| | | | | | | | | | | | | | | | | | | | |
Net increase (decrease) from investment operations | | | 2.88 | | | | (0.90 | ) | | | 2.56 | | | | 0.95 | | | | (0.28 | ) |
| | | | | | | | | | | | | | | | | | | | |
| | | | | |
Distributions(b) | | | | | | | | | | | | | | | | | | | | |
From net investment income | | | (0.30 | ) | | | (0.27 | ) | | | (0.26 | ) | | | (0.25 | ) | | | (0.22 | ) |
From net realized gain | | | (0.45 | ) | | | (1.10 | ) | | | (1.10 | ) | | | — | | | | (0.35 | ) |
From return of capital | | | — | | | | — | | | | — | | | | — | | | | (0.00 | )(c) |
| | | | | | | | | | | | | | | | | | | | |
Total distributions | | | (0.75 | ) | | | (1.37 | ) | | | (1.36 | ) | | | (0.25 | ) | | | (0.57 | ) |
| | | | | | | | | | | | | | | | | | | | |
| | | | | |
Net asset value, end of year | | $ | 14.34 | | | $ | 12.21 | | | $ | 14.48 | | | $ | 13.28 | | | $ | 12.58 | |
| | | | | | | | | | | | | | | | | | | | |
| | | | | |
Total Return(d) | | | | | | | | | | | | | | | | | | | | |
Based on net asset value | | | 23.66 | % | | | (6.42 | )% | | | 19.51 | % | | | 7.61 | % | | | (2.15 | )% |
| | | | | | | | | | | | | | | | | | | | |
| | | | | |
Ratios to Average Net Assets(e)(f) | | | | | | | | | | | | | | | | | | | | |
Total expenses | | | 0.57 | % | | | 0.57 | % | | | 0.56 | % | | | 0.57 | % | | | 0.72 | % |
| | | | | | | | | | | | | | | | | | | | |
Total expenses after fees waived and/or reimbursed | | | 0.55 | % | | | 0.55 | % | | | 0.53 | % | | | 0.55 | % | | | 0.68 | % |
| | | | | | | | | | | | | | | | | | | | |
Net investment income | | | 2.20 | % | | | 1.71 | % | | | 1.54 | % | | | 1.77 | % | | | 1.54 | % |
| | | | | | | | | | | | | | | | | | | | |
| | | | | |
Supplemental Data | | | | | | | | | | | | | | | | | | | | |
Net assets, end of year (000) | | $ | 4,004 | | | $ | 2,231 | | | $ | 10,965 | | | $ | 19,650 | | | $ | 22,071 | |
| | | | | | | | | | | | | | | | | | | | |
Portfolio turnover rate of the LifePath Dynamic Master Portfolio | | | 42 | %(g) | | | 40 | %(g) | | | 35 | %(g) | | | 76 | %(g) | | | 44 | %(h) |
| | | | | | | | | | | | | | | | | | | | |
| (a) | Based on average shares outstanding. |
| (b) | Distributions for annual periods determined in accordance with U.S. federal income tax regulations. |
| (c) | Amount is greater than $(0.005) per share. |
| (d) | Where applicable, assumes the reinvestment of distributions. |
| (e) | Includes the LifePath Dynamic Fund’s share of its corresponding LifePath Dynamic Master Portfolio’s allocated net expenses and/or net investment income. |
| (f) | Includes the LifePath Dynamic Fund’s share of its corresponding LifePath Dynamic Master Portfolio’s allocated fees waived and expenses and/or net investment income. Excludes expenses incurred indirectly as a result of the LifePath Dynamic Master Portfolio’s investments in underlying funds as follows: |
| | | | | | | | | | | | | | | | | | | | |
| | | Year Ended December 31, | |
| | | 2019 | | | 2018 | | | 2017 | | | 2016 | | | 2015 | |
Allocated fees waived | | | 0.45 | % | | | 0.43 | % | | | 0.44 | % | | | 0.41 | % | | | 0.43 | % |
Investments in underlying funds | | | 0.12 | % | | | 0.12 | % | | | 0.16 | % | | | 0.13 | % | | | 0.16 | % |
| | | | | | | | | | | | | | | | | | | | |
| (g) | Includes the LifePath Dynamic Master Portfolio’s purchases and sales of the underlying funds and Active Stock Master Portfolio, CoreAlpha Bond Master Portfolio, International Tilts Master Portfolio, Large Cap Index Master Portfolio, Master Small Cap Index Series and Master Total Return Portfolio. |
| (h) | Includes the purchases and sales of the underlying funds and Active Stock Master Portfolio, CoreAlpha Bond Master Portfolio, International Tilts Master Portfolio, Large Cap Index Master Portfolio and Master Small Cap Index Series. |
See notes to financial statements.
| | |
| 28 | | 2019 BLACKROCK ANNUAL REPORTTO SHAREHOLDERS |
Financial Highlights (continued)
(For a share outstanding throughout each period)
| | | | | | | | | | | | | | | | | | | | |
| | | BlackRock LifePath Dynamic 2035 Fund (continued) | |
| |
| | | Investor A | |
| |
| | | Year Ended December 31, | |
| | | 2019 | | | 2018 | | | 2017 | | | 2016 | | | 2015 | |
| | | | | |
Net asset value, beginning of year | | $ | 12.15 | | | $ | 14.46 | | | $ | 13.26 | | | $ | 12.56 | | | $ | 13.41 | |
| | | | | | | | | | | | | | | | | | | | |
Net investment income(a) | | | 0.25 | | | | 0.25 | | | | 0.20 | | | | 0.19 | | | | 0.17 | |
Net realized and unrealized gain (loss) | | | 2.58 | | | | (1.19 | ) | | | 2.33 | | | | 0.73 | | | | (0.48 | ) |
| | | | | | | | | | | | | | | | | | | | |
Net increase (decrease) from investment operations | | | 2.83 | | | | (0.94 | ) | | | 2.53 | | | | 0.92 | | | | (0.31 | ) |
| | | | | | | | | | | | | | | | | | | | |
| | | | | |
Distributions(b) | | | | | | | | | | | | | | | | | | | | |
From net investment income | | | (0.26 | ) | | | (0.27 | ) | | | (0.23 | ) | | | (0.22 | ) | | | (0.19 | ) |
From net realized gain | | | (0.45 | ) | | | (1.10 | ) | | | (1.10 | ) | | | — | | | | (0.35 | ) |
From return of capital | | | — | | | | — | | | | — | | | | — | | | | (0.00 | )(c) |
| | | | | | | | | | | | | | | | | | | | |
Total distributions | | | (0.71 | ) | | | (1.37 | ) | | | (1.33 | ) | | | (0.22 | ) | | | (0.54 | ) |
| | | | | | | | | | | | | | | | | | | | |
| | | | | |
Net asset value, end of year | | $ | 14.27 | | | $ | 12.15 | | | $ | 14.46 | | | $ | 13.26 | | | $ | 12.56 | |
| | | | | | | | | | | | | | | | | �� | | | |
| | | | | |
Total Return(d) | | | | | | | | | | | | | | | | | | | | |
Based on net asset value | | | 23.37 | % | | | (6.69 | )% | | | 19.29 | % | | | 7.37 | % | | | (2.40 | )% |
| | | | | | | | | | | | | | | | | | | | |
| | | | | |
Ratios to Average Net Assets(e)(f) | | | | | | | | | | | | | | | | | | | | |
Total expenses | | | 0.82 | % | | | 0.82 | % | | | 0.81 | % | | | 0.82 | % | | | 0.97 | % |
| | | | | | | | | | | | | | | | | | | | |
Total expenses after fees waived and/or reimbursed | | | 0.80 | % | | | 0.80 | % | | | 0.79 | % | | | 0.80 | % | | | 0.93 | % |
| | | | | | | | | | | | | | | | | | | | |
Net investment income | | | 1.85 | % | | | 1.75 | % | | | 1.38 | % | | | 1.52 | % | | | 1.30 | % |
| | | | | | | | | | | | | | | | | | | | |
| | | | | |
Supplemental Data | | | | | | | | | | | | | | | | | | | | |
Net assets, end of year (000) | | $ | 28,656 | | | $ | 27,982 | | | $ | 32,083 | | | $ | 29,768 | | | $ | 30,359 | |
| | | | | | | | | | | | | | | | | | | | |
Portfolio turnover rate of the LifePath Dynamic Master Portfolio | | | 42 | %(g) | | | 40 | %(g) | | | 35 | %(g) | | | 76 | %(g) | | | 44 | %(h) |
| | | | | | | | | | | | | | | | | | | | |
| (a) | Based on average shares outstanding. |
| (b) | Distributions for annual periods determined in accordance with U.S. federal income tax regulations. |
| (c) | Amount is greater than $(0.005) per share. |
| (d) | Where applicable, excludes the effects of any sales charges and assumes the reinvestment of distributions. |
| (e) | Includes the LifePath Dynamic Fund’s share of its corresponding LifePath Dynamic Master Portfolio’s allocated net expenses and/or net investment income. |
| (f) | Includes the LifePath Dynamic Fund’s share of its corresponding LifePath Dynamic Master Portfolio’s allocated fees waived and expenses and/or net investment income. Excludes expenses incurred indirectly as a result of the LifePath Dynamic Master Portfolio’s investments in underlying funds as follows: |
| | | | | | | | | | | | | | | | | | | | |
| | | Year Ended December 31, | |
| | | 2019 | | | 2018 | | | 2017 | | | 2016 | | | 2015 | |
Allocated fees waived | | | 0.45 | % | | | 0.43 | % | | | 0.44 | % | | | 0.41 | % | | | 0.43 | % |
Investments in underlying funds | | | 0.12 | % | | | 0.12 | % | | | 0.16 | % | | | 0.13 | % | | | 0.16 | % |
| | | | | | | | | | | | | | | | | | | | |
| (g) | Includes the LifePath Dynamic Master Portfolio’s purchases and sales of the underlying funds and Active Stock Master Portfolio, CoreAlpha Bond Master Portfolio, International Tilts Master Portfolio, Large Cap Index Master Portfolio, Master Small Cap Index Series and Master Total Return Portfolio. |
| (h) | Includes the purchases and sales of the underlying funds and Active Stock Master Portfolio, CoreAlpha Bond Master Portfolio, International Tilts Master Portfolio, Large Cap Index Master Portfolio and Master Small Cap Index Series. |
See notes to financial statements.
Financial Highlights (continued)
(For a share outstanding throughout each period)
| | | | | | | | | | | | | | | | | | | | |
| | | BlackRock LifePath Dynamic 2035 Fund (continued) | |
| |
| | | Investor C | |
| |
| | | Year Ended December 31, | |
| | | 2019 | | | 2018 | | | 2017 | | | 2016 | | | 2015 | |
| | | | | |
Net asset value, beginning of year | | $ | 12.02 | | | $ | 14.33 | | | $ | 13.15 | | | $ | 12.47 | | | $ | 13.32 | |
| | | | | | | | | | | | | | | | | | | | |
Net investment income(a) | | | 0.14 | | | | 0.14 | | | | 0.08 | | | | 0.09 | | | | 0.07 | |
Net realized and unrealized gain (loss) | | | 2.56 | | | | (1.19 | ) | | | 2.32 | | | | 0.71 | | | | (0.48 | ) |
| | | | | | | | | | | | | | | | | | | | |
Net increase (decrease) from investment operations | | | 2.70 | | | | (1.05 | ) | | | 2.40 | | | | 0.80 | | | | (0.41 | ) |
| | | | | | | | | | | | | | | | | | | | |
| | | | | |
Distributions(b) | | | | | | | | | | | | | | | | | | | | |
From net investment income | | | (0.16 | ) | | | (0.16 | ) | | | (0.12 | ) | | | (0.12 | ) | | | (0.09 | ) |
From net realized gain | | | (0.45 | ) | | | (1.10 | ) | | | (1.10 | ) | | | — | | | | (0.35 | ) |
From return of capital | | | — | | | | — | | | | — | | | | — | | | | (0.00 | )(c) |
| | | | | | | | | | | | | | | | | | | | |
Total distributions | | | (0.61 | ) | | | (1.26 | ) | | | (1.22 | ) | | | (0.12 | ) | | | (0.44 | ) |
| | | | | | | | | | | | | | | | | | | | |
| | | | | |
Net asset value, end of year | | $ | 14.11 | | | $ | 12.02 | | | $ | 14.33 | | | $ | 13.15 | | | $ | 12.47 | |
| | | | | | | | | | | | | | | | | | | | |
| | | | | |
Total Return(d) | | | | | | | | | | | | | | | | | | | | |
Based on net asset value | | | 22.43 | % | | | (7.47 | )% | | | 18.41 | % | | | 6.42 | % | | | (3.13 | )% |
| | | | | | | | | | | | | | | | | | | | |
| | | | | |
Ratios to Average Net Assets(e)(f) | | | | | | | | | | | | | | | | | | | | |
Total expenses | | | 1.62 | % | | | 1.62 | % | | | 1.61 | % | | | 1.62 | % | | | 1.72 | % |
| | | | | | | | | | | | | | | | | | | | |
Total expenses after fees waived and/or reimbursed | | | 1.60 | % | | | 1.60 | % | | | 1.59 | % | | | 1.60 | % | | | 1.69 | % |
| | | | | | | | | | | | | | | | | | | | |
Net investment income | | | 1.07 | % | | | 0.99 | % | | | 0.60 | % | | | 0.74 | % | | | 0.55 | % |
| | | | | | | | | | | | | | | | | | | | |
| | | | | |
Supplemental Data | | | | | | | | | | | | | | | | | | | | |
Net assets, end of year (000) | | $ | 3,173 | | | $ | 2,609 | | | $ | 2,436 | | | $ | 2,112 | | | $ | 2,007 | |
| | | | | | | | | | | | | | | | | | | | |
Portfolio turnover rate of the LifePath Dynamic Master Portfolio | | | 42 | %(g) | | | 40 | %(g) | | | 35 | %(g) | | | 76 | %(g) | | | 44 | %(h) |
| | | | | | | | | | | | | | | | | | | | |
| (a) | Based on average shares outstanding. |
| (b) | Distributions for annual periods determined in accordance with U.S. federal income tax regulations. |
| (c) | Amount is greater than $(0.005) per share. |
| (d) | Where applicable, excludes the effects of any sales charges and assumes the reinvestment of distributions. |
| (e) | Includes the LifePath Dynamic Fund’s share of its corresponding LifePath Dynamic Master Portfolio’s allocated net expenses and/or net investment income. |
| (f) | Includes the LifePath Dynamic Fund’s share of its corresponding LifePath Dynamic Master Portfolio’s allocated fees waived and expenses and/or net investment income. Excludes expenses incurred indirectly as a result of the LifePath Dynamic Master Portfolio’s investments in underlying funds as follows: |
| | | | | | | | | | | | | | | | | | | | |
| | | Year Ended December 31, | |
| | | 2019 | | | 2018 | | | 2017 | | | 2016 | | | 2015 | |
Allocated fees waived | | | 0.45 | % | | | 0.43 | % | | | 0.44 | % | | | 0.41 | % | | | 0.43 | % |
Investments in underlying funds | | | 0.12 | % | | | 0.12 | % | | | 0.16 | % | | | 0.13 | % | | | 0.16 | % |
| | | | | | | | | | | | | | | | | | | | |
| (g) | Includes the LifePath Dynamic Master Portfolio’s purchases and sales of the underlying funds and Active Stock Master Portfolio, CoreAlpha Bond Master Portfolio, International Tilts Master Portfolio, Large Cap Index Master Portfolio, Master Small Cap Index Series and Master Total Return Portfolio. |
| (h) | Includes the purchases and sales of the underlying funds and Active Stock Master Portfolio, CoreAlpha Bond Master Portfolio, International Tilts Master Portfolio, Large Cap Index Master Portfolio and Master Small Cap Index Series. |
See notes to financial statements.
| | |
| 30 | | 2019 BLACKROCK ANNUAL REPORTTO SHAREHOLDERS |
Financial Highlights (continued)
(For a share outstanding throughout each period)
| | | | | | | | | | | | | | | | | | | | |
| | | BlackRock LifePath Dynamic 2035 Fund (continued) | |
| |
| | | Class K | |
| |
| | | Year Ended December 31, | |
| | | 2019 | | | 2018 | | | 2017 | | | 2016 | | | 2015 | |
| | | | | |
Net asset value, beginning of year | | $ | 12.36 | | | $ | 14.68 | | | $ | 13.45 | | | $ | 12.74 | | | $ | 13.60 | |
| | | | | | | | | | | | | | | | | | | | |
Net investment income(a) | | | 0.37 | | | | 0.33 | | | | 0.28 | | | | 0.27 | | | | 0.30 | |
Net realized and unrealized gain (loss) | | | 2.58 | | | | (1.22 | ) | | | 2.34 | | | | 0.72 | | | | (0.54 | ) |
| | | | | | | | | | | | | | | | | | | | |
Net increase (decrease) from investment operations | | | 2.95 | | | | (0.89 | ) | | | 2.62 | | | | 0.99 | | | | (0.24 | ) |
| | | | | | | | | | | | | | | | | | | | |
| | | | | |
Distributions(b) | | | | | | | | | | | | | | | | | | | | |
From net investment income | | | (0.33 | ) | | | (0.33 | ) | | | (0.29 | ) | | | (0.28 | ) | | | (0.27 | ) |
From net realized gain | | | (0.45 | ) | | | (1.10 | ) | | | (1.10 | ) | | | — | | | | (0.35 | ) |
From return of capital | | | — | | | | — | | | | — | | | | — | | | | (0.00 | )(c) |
| | | | | | | | | | | | | | | | | | | | |
Total distributions | | | (0.78 | ) | | | (1.43 | ) | | | (1.39 | ) | | | (0.28 | ) | | | (0.62 | ) |
| | | | | | | | | | | | | | | | | | | | |
| | | | | |
Net asset value, end of year | | $ | 14.53 | | | $ | 12.36 | | | $ | 14.68 | | | $ | 13.45 | | | $ | 12.74 | |
| | | | | | | | | | | | | | | | | | | | |
| | | | | |
Total Return(d) | | | | | | | | | | | | | | | | | | | | |
Based on net asset value | | | 23.92 | % | | | (6.23 | )% | | | 19.76 | % | | | 7.82 | % | | | (1.83 | )% |
| | | | | | | | | | | | | | | | | | | | |
| | | | | |
Ratios to Average Net Assets(e)(f) | | | | | | | | | | | | | | | | | | | | |
Total expenses | | | 0.36 | % | | | 0.37 | % | | | 0.36 | % | | | 0.36 | % | | | 0.39 | % |
| | | | | | | | | | | | | | | | | | | | |
Total expenses after fees waived and/or reimbursed | | | 0.35 | % | | | 0.35 | % | | | 0.33 | % | | | 0.35 | % | | | 0.35 | % |
| | | | | | | | | | | | | | | | | | | | |
Net investment income | | | 2.63 | % | | | 2.25 | % | | | 1.92 | % | | | 2.07 | % | | | 2.30 | % |
| | | | | | | | | | | | | | | | | | | | |
| | | | | |
Supplemental Data | | | | | | | | | | | | | | | | | | | | |
Net assets, end of year (000) | | $ | 27,720 | | | $ | 6,627 | | | $ | 5,882 | | | $ | 2,702 | | | $ | 757 | |
| | | | | | | | | | | | | | | | | | | | |
Portfolio turnover rate of the LifePath Dynamic Master Portfolio | | | 42 | %(g) | | | 40 | %(g) | | | 35 | %(g) | | | 76 | %(g) | | | 44 | %(h) |
| | | | | | | | | | | | | | | | | | | | |
| (a) | Based on average shares outstanding. |
| (b) | Distributions for annual periods determined in accordance with U.S. federal income tax regulations. |
| (c) | Amount is greater than $(0.005) per share. |
| (d) | Where applicable, assumes the reinvestment of distributions. |
| (e) | Includes the LifePath Dynamic Fund’s share of its corresponding LifePath Dynamic Master Portfolio’s allocated net expenses and/or net investment income. |
| (f) | Includes the LifePath Dynamic Fund’s share of its corresponding LifePath Dynamic Master Portfolio’s allocated fees waived and expenses and/or net investment income. Excludes expenses incurred indirectly as a result of the LifePath Dynamic Master Portfolio’s investments in underlying funds as follows: |
| | | | | | | | | | | | | | | | | | | | |
| | | Year Ended December 31, | |
| | | 2019 | | | 2018 | | | 2017 | | | 2016 | | | 2015 | |
Allocated fees waived | | | 0.45 | % | | | 0.43 | % | | | 0.44 | % | | | 0.41 | % | | | 0.43 | % |
Investments in underlying funds | | | 0.12 | % | | | 0.12 | % | | | 0.16 | % | | | 0.13 | % | | | 0.16 | % |
| | | | | | | | | | | | | | | | | | | | |
| (g) | Includes the LifePath Dynamic Master Portfolio’s purchases and sales of the underlying funds and Active Stock Master Portfolio, CoreAlpha Bond Master Portfolio, International Tilts Master Portfolio, Large Cap Index Master Portfolio, Master Small Cap Index Series and Master Total Return Portfolio. |
| (h) | Includes the purchases and sales of the underlying funds and Active Stock Master Portfolio, CoreAlpha Bond Master Portfolio, International Tilts Master Portfolio, Large Cap Index Master Portfolio and Master Small Cap Index Series. |
See notes to financial statements.
Financial Highlights (continued)
(For a share outstanding throughout each period)
| | | | | | | | | | | | | | | | | | | | |
| | | BlackRock LifePath Dynamic 2035 Fund (continued) | |
| |
| | | Class R | |
| |
| | | Year Ended December 31, | |
| | | 2019 | | | 2018 | | | 2017 | | | 2016 | | | 2015 | |
| | | | | |
Net asset value, beginning of year | | $ | 12.15 | | | $ | 14.46 | | | $ | 13.26 | | | $ | 12.58 | | | $ | 13.44 | |
| | | | | | | | | | | | | | | | | | | | |
Net investment income(a) | | | 0.24 | | | | 0.22 | | | | 0.17 | | | | 0.18 | | | | 0.14 | |
Net realized and unrealized gain (loss) | | | 2.57 | | | | (1.19 | ) | | | 2.33 | | | | 0.71 | | | | (0.49 | ) |
| | | | | | | | | | | | | | | | | | | | |
Net increase (decrease) from investment operations | | | 2.81 | | | | (0.97 | ) | | | 2.50 | | | | 0.89 | | | | (0.35 | ) |
| | | | | | | | | | | | | | | | | | | | |
| | | | | |
Distributions(b) | | | | | | | | | | | | | | | | | | | | |
From net investment income | | | (0.25 | ) | | | (0.24 | ) | | | (0.20 | ) | | | (0.21 | ) | | | (0.16 | ) |
From net realized gain | | | (0.45 | ) | | | (1.10 | ) | | | (1.10 | ) | | | — | | | | (0.35 | ) |
From return of capital | | | — | | | | — | | | | — | | | | — | | | | (0.00 | )(c) |
| | | | | | | | | | | | | | | | | | | | |
Total distributions | | | (0.70 | ) | | | (1.34 | ) | | | (1.30 | ) | | | (0.21 | ) | | | (0.51 | ) |
| | | | | | | | | | | | | | | | | | | | |
| | | | | |
Net asset value, end of year | | $ | 14.26 | | | $ | 12.15 | | | $ | 14.46 | | | $ | 13.26 | | | $ | 12.58 | |
| | | | | | | | | | | | | | | | | | | | |
| | | | | |
Total Return(d) | | | | | | | | | | | | | | | | | | | | |
Based on net asset value | | | 23.15 | % | | | (6.87 | )% | | | 19.08 | % | | | 7.10 | % | | | (2.65 | )% |
| | | | | | | | | | | | | | | | | | | | |
| | | | | |
Ratios to Average Net Assets(e)(f) | | | | | | | | | | | | | | | | | | | | |
Total expenses | | | 1.02 | % | | | 1.02 | % | | | 1.01 | % | | | 1.02 | % | | | 1.21 | % |
| | | | | | | | | | | | | | | | | | | | |
Total expenses after fees waived and/or reimbursed | | | 1.00 | % | | | 1.00 | % | | | 0.99 | % | | | 1.00 | % | | | 1.18 | % |
| | | | | | | | | | | | | | | | | | | | |
Net investment income | | | 1.71 | % | | | 1.55 | % | | | 1.19 | % | | | 1.41 | % | | | 1.09 | % |
| | | | | | | | | | | | | | | | | | | | |
| | | | | |
Supplemental Data | | | | | | | | | | | | | | | | | | | | |
Net assets, end of year (000) | | $ | 5,541 | | | $ | 3,131 | | | $ | 3,782 | | | $ | 3,078 | | | $ | 867 | |
| | | | | | | | | | | | | | | | | | | | |
Portfolio turnover rate of the LifePath Dynamic Master Portfolio | | | 42 | %(g) | | | 40 | %(g) | | | 35 | %(g) | | | 76 | %(g) | | | 44 | %(h) |
| | | | | | | | | | | | | | | | | | | | |
| (a) | Based on average shares outstanding. |
| (b) | Distributions for annual periods determined in accordance with U.S. federal income tax regulations. |
| (c) | Amount is greater than $(0.005) per share. |
| (d) | Where applicable, assumes the reinvestment of distributions. |
| (e) | Includes the LifePath Dynamic Fund’s share of its corresponding LifePath Dynamic Master Portfolio’s allocated net expenses and/or net investment income. |
| (f) | Includes the LifePath Dynamic Fund’s share of its corresponding LifePath Dynamic Master Portfolio’s allocated fees waived and expenses and/or net investment income. Excludes expenses incurred indirectly as a result of the LifePath Dynamic Master Portfolio’s investments in underlying funds as follows: |
| | | | | | | | | | | | | | | | | | | | |
| | | Year Ended December 31, | |
| | | 2019 | | | 2018 | | | 2017 | | | 2016 | | | 2015 | |
Allocated fees waived | | | 0.45 | % | | | 0.43 | % | | | 0.44 | % | | | 0.41 | % | | | 0.43 | % |
Investments in underlying funds | | | 0.12 | % | | | 0.12 | % | | | 0.16 | % | | | 0.13 | % | | | 0.16 | % |
| | | | | | | | | | �� | | | | | | | | | | |
| (g) | Includes the LifePath Dynamic Master Portfolio’s purchases and sales of the underlying funds and Active Stock Master Portfolio, CoreAlpha Bond Master Portfolio, International Tilts Master Portfolio, Large Cap Index Master Portfolio, Master Small Cap Index Series and Master Total Return Portfolio. |
| (h) | Includes the purchases and sales of the underlying funds and Active Stock Master Portfolio, CoreAlpha Bond Master Portfolio, International Tilts Master Portfolio, Large Cap Index Master Portfolio and Master Small Cap Index Series. |
See notes to financial statements.
| | |
| 32 | | 2019 BLACKROCK ANNUAL REPORTTO SHAREHOLDERS |
Financial Highlights (continued)
(For a share outstanding throughout each period)
| | | | | | | | | | | | | | | | | | | | |
| | | BlackRock LifePath Dynamic 2045 Fund | |
| |
| | | Institutional | |
| |
| | | Year Ended December 31, | |
| | | 2019 | | | 2018 | | | 2017 | | | 2016 | | | 2015 | |
| | | | | |
Net asset value, beginning of year | | $ | 12.75 | | | $ | 15.41 | | | $ | 13.88 | | | $ | 13.10 | | | $ | 14.05 | |
| | | | | | | | | | | | | | | | | | | | |
Net investment income(a) | | | 0.31 | | | | 0.26 | | | | 0.23 | | | | 0.23 | | | | 0.21 | |
Net realized and unrealized gain (loss) | | | 3.04 | | | | (1.47 | ) | | | 2.83 | | | | 0.83 | | | | (0.54 | ) |
| | | | | | | | | | | | | | | | | | | | |
Net increase (decrease) from investment operations | | | 3.35 | | | | (1.21 | ) | | | 3.06 | | | | 1.06 | | | | (0.33 | ) |
| | | | | | | | | | | | | | | | | | | | |
| | | | | |
Distributions(b) | | | | | | | | | | | | | | | | | | | | |
From net investment income | | | (0.31 | ) | | | (0.29 | ) | | | (0.29 | ) | | | (0.28 | ) | | | (0.21 | ) |
From net realized gain | | | (0.48 | ) | | | (1.16 | ) | | | (1.24 | ) | | | — | | | | (0.41 | ) |
| | | | | | | | | | | | | | | | | | | | |
Total distributions | | | (0.79 | ) | | | (1.45 | ) | | | (1.53 | ) | | | (0.28 | ) | | | (0.62 | ) |
| | | | | | | | | | | | | | | | | | | | |
| | | | | |
Net asset value, end of year | | $ | 15.31 | | | $ | 12.75 | | | $ | 15.41 | | | $ | 13.88 | | | $ | 13.10 | |
| | | | | | | | | | | | | | | | | | | | |
| | | | | |
Total Return(c) | | | | | | | | | | | | | | | | | | | | |
Based on net asset value | | | 26.38 | % | | | (8.18 | )% | | | 22.29 | % | | | 8.14 | % | | | (2.37 | )% |
| | | | | | | | | | | | | | | | | | | | |
| | | | | |
Ratios to Average Net Assets(d)(e) | | | | | | | | | | | | | | | | | | | | |
Total expenses | | | 0.58 | % | | | 0.58 | % | | | 0.56 | % | | | 0.56 | % | | | 0.71 | % |
| | | | | | | | | | | | | | | | | | | | |
Total expenses after fees waived and/or reimbursed | | | 0.56 | % | | | 0.55 | % | | | 0.53 | % | | | 0.53 | % | | | 0.66 | % |
| | | | | | | | | | | | | | | | | | | | |
Net investment income | | | 2.13 | % | | | 1.68 | % | | | 1.54 | % | | | 1.76 | % | | | 1.53 | % |
| | | | | | | | | | | | | | | | | | | | |
| | | | | |
Supplemental Data | | | | | | | | | | | | | | | | | | | | |
Net assets, end of year (000) | | $ | 4,656 | | | $ | 2,967 | | | $ | 8,267 | | | $ | 14,864 | | | $ | 15,105 | |
| | | | | | | | | | | | | | | | | | | | |
Portfolio turnover rate of the LifePath Dynamic Master Portfolio(f) | | | 49 | % | | | 47 | % | | | 46 | % | | | 75 | % | | | 50 | % |
| | | | | | | | | | | | | | | | | | | | |
| (a) | Based on average shares outstanding. |
| (b) | Distributions for annual periods determined in accordance with U.S. federal income tax regulations. |
| (c) | Where applicable, assumes the reinvestment of distributions. |
| (d) | Includes the LifePath Dynamic Fund’s share of its corresponding LifePath Dynamic Master Portfolio’s allocated net expenses and/or net investment income. |
| (e) | Includes the LifePath Dynamic Fund’s share of its corresponding LifePath Dynamic Master Portfolio’s allocated fees waived and expenses and/or net investment income. Excludes expenses incurred indirectly as a result of the LifePath Dynamic Master Portfolio’s investments in underlying funds as follows: |
| | | | | | | | | | | | | | | | | | | | |
| | | Year Ended December 31, | |
| | | 2019 | | | 2018 | | | 2017 | | | 2016 | | | 2015 | |
Allocated fees waived | | | 0.49 | % | | | 0.46 | % | | | 0.47 | % | | | 0.44 | % | | | 0.48 | % |
Investments in underlying funds | | | 0.12 | % | | | 0.12 | % | | | 0.17 | % | | | 0.15 | % | | | 0.18 | % |
| | | | | | | | | | | | | | | | | | | | |
| (f) | Includes the LifePath Dynamic Master Portfolio’s purchases and sales of the underlying funds and Active Stock Master Portfolio, CoreAlpha Bond Master Portfolio, International Tilts Master Portfolio, Large Cap Index Master Portfolio, Master Small Cap Index Series and Master Total Return Portfolio. |
See notes to financial statements.
Financial Highlights (continued)
(For a share outstanding throughout each period)
| | | | | | | | | | | | | | | | | | | | |
| | | BlackRock LifePath Dynamic 2045 Fund (continued) | |
| |
| | | Investor A | |
| |
| | | Year Ended December 31, | |
| | | 2019 | | | 2018 | | | 2017 | | | 2016 | | | 2015 | |
| | | | | |
Net asset value, beginning of year | | $ | 12.72 | | | $ | 15.40 | | | $ | 13.87 | | | $ | 13.09 | | | $ | 14.04 | |
| | | | | | | | | | | | | | | | | | | | |
Net investment income(a) | | | 0.26 | | | | 0.24 | | | | 0.21 | | | | 0.20 | | | | 0.18 | |
Net realized and unrealized gain (loss) | | | 3.05 | | | | (1.50 | ) | | | 2.82 | | | | 0.83 | | | | (0.54 | ) |
| | | | | | | | | | | | | | | | | | | | |
Net increase (decrease) from investment operations | | | 3.31 | | | | (1.26 | ) | | | 3.03 | | | | 1.03 | | | | (0.36 | ) |
| | | | | | | | | | | | | | | | | | | | |
| | | | | |
Distributions(b) | | | | | | | | | | | | | | | | | | | | |
From net investment income | | | (0.28 | ) | | | (0.26 | ) | | | (0.26 | ) | | | (0.25 | ) | | | (0.18 | ) |
From net realized gain | | | (0.48 | ) | | | (1.16 | ) | | | (1.24 | ) | | | — | | | | (0.41 | ) |
| | | | | | | | | | | | | | | | | | | | |
Total distributions | | | (0.76 | ) | | | (1.42 | ) | | | (1.50 | ) | | | (0.25 | ) | | | (0.59 | ) |
| | | | | | | | | | | | | | | | | | | | |
| | | | | |
Net asset value, end of year | | $ | 15.27 | | | $ | 12.72 | | | $ | 15.40 | | | $ | 13.87 | | | $ | 13.09 | |
| | | | | | | | | | | | | | | | | | | | |
| | | | | |
Total Return(c) | | | | | | | | | | | | | | | | | | | | |
Based on net asset value | | | 26.05 | % | | | (8.44 | )% | | | 22.05 | % | | | 7.90 | % | | | (2.61 | )% |
| | | | | | | | | | | | | | | | | | | | |
| | | | | |
Ratios to Average Net Assets(d)(e) | | | | | | | | | | | | | | | | | | | | |
Total expenses | | | 0.84 | % | | | 0.83 | % | | | 0.82 | % | | | 0.81 | % | | | 0.96 | % |
| | | | | | | | | | | | | | | | | | | | |
Total expenses after fees waived and/or reimbursed | | | 0.81 | % | | | 0.80 | % | | | 0.78 | % | | | 0.78 | % | | | 0.91 | % |
| | | | | | | | | | | | | | | | | | | | |
Net investment income | | | 1.82 | % | | | 1.56 | % | | | 1.38 | % | | | 1.52 | % | | | 1.28 | % |
| | | | | | | | | | | | | | | | | | | | |
| | | | | |
Supplemental Data | | | | | | | | | | | | | | | | | | | | |
Net assets, end of year (000) | | $ | 18,811 | | | $ | 17,742 | | | $ | 20,152 | | | $ | 17,206 | | | $ | 16,744 | |
| | | | | | | | | | | | | | | | | | | | |
Portfolio turnover rate of the LifePath Dynamic Master Portfolio(f) | | | 49 | % | | | 47 | % | | | 46 | % | | | 75 | % | | | 50 | % |
| | | | | | | | | | | | | | | | | | | | |
| (a) | Based on average shares outstanding. |
| (b) | Distributions for annual periods determined in accordance with U.S. federal income tax regulations. |
| (c) | Where applicable, excludes the effects of any sales charges and assumes the reinvestment of distributions. |
| (d) | Includes the LifePath Dynamic Fund’s share of its corresponding LifePath Dynamic Master Portfolio’s allocated net expenses and/or net investment income. |
| (e) | Includes the LifePath Dynamic Fund’s share of its corresponding LifePath Dynamic Master Portfolio’s allocated fees waived and expenses and/or net investment income. Excludes expenses incurred indirectly as a result of the LifePath Dynamic Master Portfolio’s investments in underlying funds as follows: |
| | | | | | | | | | | | | | | | | | | | |
| | | Year Ended December 31, | |
| | | 2019 | | | 2018 | | | 2017 | | | 2016 | | | 2015 | |
Allocated fees waived | | | 0.49 | % | | | 0.46 | % | | | 0.47 | % | | | 0.44 | % | | | 0.48 | % |
Investments in underlying funds | | | 0.12 | % | | | 0.12 | % | | | 0.17 | % | | | 0.15 | % | | | 0.18 | % |
| | | | | | | | | | | | | | | | | | | | |
| (f) | Includes the LifePath Dynamic Master Portfolio’s purchases and sales of the underlying funds and Active Stock Master Portfolio, CoreAlpha Bond Master Portfolio, International Tilts Master Portfolio, Large Cap Index Master Portfolio, Master Small Cap Index Series and Master Total Return Portfolio. |
See notes to financial statements.
| | |
| 34 | | 2019 BLACKROCK ANNUAL REPORTTO SHAREHOLDERS |
Financial Highlights (continued)
(For a share outstanding throughout each period)
| | | | | | | | | | | | | | | | | | | | |
| | | BlackRock LifePath Dynamic 2045 Fund (continued) | |
| |
| | | Investor C | |
| |
| | | Year Ended December 31, | |
| | | 2019 | | | 2018 | | | 2017 | | | 2016 | | | 2015 | |
| | | | | |
Net asset value, beginning of year | | $ | 12.54 | | | $ | 15.20 | | | $ | 13.71 | | | $ | 12.94 | | | $ | 13.90 | |
| | | | | | | | | | | | | | | | | | | | |
Net investment income(a) | | | 0.15 | | | | 0.12 | | | | 0.08 | | | | 0.09 | | | | 0.07 | |
Net realized and unrealized gain (loss) | | | 2.99 | | | | (1.47 | ) | | | 2.79 | | | | 0.82 | | | | (0.54 | ) |
| | | | | | | | | | | | | | | | | | | | |
Net increase (decrease) from investment operations | | | 3.14 | | | | (1.35 | ) | | | 2.87 | | | | 0.91 | | | | (0.47 | ) |
| | | | | | | | | | | | | | | | | | | | |
| | | | | |
Distributions(b) | | | | | | | | | | | | | | | | | | | | |
From net investment income | | | (0.16 | ) | | | (0.15 | ) | | | (0.14 | ) | | | (0.14 | ) | | | (0.08 | ) |
From net realized gain | | | (0.48 | ) | | | (1.16 | ) | | | (1.24 | ) | | | — | | | | (0.41 | ) |
| | | | | | | | | | | | | | | | | | | | |
Total distributions | | | (0.64 | ) | | | (1.31 | ) | | | (1.38 | ) | | | (0.14 | ) | | | (0.49 | ) |
| | | | | | | | | | | | | | | | | | | | |
| | | | | |
Net asset value, end of year | | $ | 15.04 | | | $ | 12.54 | | | $ | 15.20 | | | $ | 13.71 | | | $ | 12.94 | |
| | | | | | | | | | | | | | | | | | | | |
| | | | | |
Total Return(c) | | | | | | | | | | | | | | | | | | | | |
Based on net asset value | | | 25.07 | % | | | (9.13 | )% | | | 21.10 | % | | | 7.04 | % | | | (3.43 | )% |
| | | | | | | | | | | | | | | | | | | | |
| | | | | |
Ratios to Average Net Assets(d)(e) | | | | | | | | | | | | | | | | | | | | |
Total expenses | | | 1.64 | % | | | 1.63 | % | | | 1.62 | % | | | 1.61 | % | | | 1.72 | % |
| | | | | | | | | | | | | | | | | | | | |
Total expenses after fees waived and/or reimbursed | | | 1.61 | % | | | 1.60 | % | | | 1.58 | % | | | 1.58 | % | | | 1.67 | % |
| | | | | | | | | | | | | | | | | | | | |
Net investment income | | | 1.04 | % | | | 0.78 | % | | | 0.56 | % | | | 0.70 | % | | | 0.53 | % |
| | | | | | | | | | | | | | | | | | | | |
| | | | | |
Supplemental Data | | | | | | | | | | | | | | | | | | | | |
Net assets, end of year (000) | | $ | 1,732 | | | $ | 1,535 | | | $ | 1,375 | | | $ | 1,247 | | | $ | 1,420 | |
| | | | | | | | | | | | | | | | | | | | |
Portfolio turnover rate of the LifePath Dynamic Master Portfolio(f) | | | 49 | % | | | 47 | % | | | 46 | % | | | 75 | % | | | 50 | % |
| | | | | | | | | | | | | | | | | | | | |
| (a) | Based on average shares outstanding. |
| (b) | Distributions for annual periods determined in accordance with U.S. federal income tax regulations. |
| (c) | Where applicable, excludes the effects of any sales charges and assumes the reinvestment of distributions. |
| (d) | Includes the LifePath Dynamic Fund’s share of its corresponding LifePath Dynamic Master Portfolio’s allocated net expenses and/or net investment income. |
| (e) | Includes the LifePath Dynamic Fund’s share of its corresponding LifePath Dynamic Master Portfolio’s allocated fees waived and expenses and/or net investment income. Excludes expenses incurred indirectly as a result of the LifePath Dynamic Master Portfolio’s investments in underlying funds as follows: |
| | | | | | | | | | | | | | | | | | | | |
| | | Year Ended December 31, | |
| |
| | | 2019 | | | 2018 | | | 2017 | | | 2016 | | | 2015 | |
Allocated fees waived | | | 0.49 | % | | | 0.46 | % | | | 0.47 | % | | | 0.44 | % | | | 0.48 | % |
Investments in underlying funds | | | 0.12 | % | | | 0.12 | % | | | 0.17 | % | | | 0.15 | % | | | 0.18 | % |
| | | | | | | | | | | | | | | | | | | | |
| (f) | Includes the LifePath Dynamic Master Portfolio’s purchases and sales of the underlying funds and Active Stock Master Portfolio, CoreAlpha Bond Master Portfolio, International Tilts Master Portfolio, Large Cap Index Master Portfolio, Master Small Cap Index Series and Master Total Return Portfolio. |
See notes to financial statements.
Financial Highlights (continued)
(For a share outstanding throughout each period)
| | | | | | | | | | | | | | | | | | | | |
| | | BlackRock LifePath Dynamic 2045 Fund (continued) | |
| |
| | | Class K | |
| |
| | | Year Ended December 31, | |
| | | 2019 | | | 2018 | | | 2017 | | | 2016 | | | 2015 | |
| | | | | |
Net asset value, beginning of year | | $ | 12.88 | | | $ | 15.57 | | | $ | 14.01 | | | $ | 13.22 | | | $ | 14.18 | |
| | | | | | | | | | | | | | | | | | | | |
Net investment income(a) | | | 0.39 | | | | 0.32 | | | | 0.29 | | | | 0.27 | | | | 0.40 | |
Net realized and unrealized gain (loss) | | | 3.03 | | | | (1.52 | ) | | | 2.84 | | | | 0.83 | | | | (0.68 | ) |
| | | | | | | | | | | | | | | | | | | | |
Net increase (decrease) from investment operations | | | 3.42 | | | | (1.20 | ) | | | 3.13 | | | | 1.10 | | | | (0.28 | ) |
| | | | | | | | | | | | | | | | | | | | |
|
Distributions(b) | |
From net investment income | | | (0.34 | ) | | | (0.33 | ) | | | (0.33 | ) | | | (0.31 | ) | | | (0.27 | ) |
From net realized gain | | | (0.48 | ) | | | (1.16 | ) | | | (1.24 | ) | | | — | | | | (0.41 | ) |
| | | | | | | | | | | | | | | | | | | | |
Total distributions | | | (0.82 | ) | | | (1.49 | ) | | | (1.57 | ) | | | (0.31 | ) | | | (0.68 | ) |
| | | | | | | | | | | | | | | | | | | | |
| | | | | |
Net asset value, end of year | | $ | 15.48 | | | $ | 12.88 | | | $ | 15.57 | | | $ | 14.01 | | | $ | 13.22 | |
| | | | | | | | | | | | | | | | | | | | |
| | | | | |
Total Return(c) | | | | | | | | | | | | | | | | | | | | |
Based on net asset value | | | 26.67 | % | | | (7.99 | )% | | | 22.58 | % | | | 8.38 | % | | | (2.04 | )% |
| | | | | | | | | | | | | | | | | | | | |
| | | | | |
Ratios to Average Net Assets(d)(e) | | | | | | | | | | | | | | | | | | | | |
Total expenses | | | 0.37 | % | | | 0.38 | % | | | 0.37 | % | | | 0.36 | % | | | 0.40 | % |
| | | | | | | | | | | | | | | | | | | | |
Total expenses after fees waived and/or reimbursed | | | 0.34 | % | | | 0.35 | % | | | 0.33 | % | | | 0.33 | % | | | 0.34 | % |
| | | | | | | | | | | | | | | | | | | | |
Net investment income | | | 2.60 | % | | | 2.04 | % | | | 1.90 | % | | | 2.02 | % | | | 3.08 | % |
| | | | | | | | | | | | | | | | | | | | |
| | | | | |
Supplemental Data | | | | | | | | | | | | | | | | | | | | |
Net assets, end of year (000) | | $ | 20,936 | | | $ | 4,471 | | | $ | 3,385 | | | $ | 1,271 | | | $ | 524 | |
| | | | | | | | | | | | | | | | | | | | |
Portfolio turnover rate of the LifePath Dynamic Master Portfolio(f) | | | 49 | % | | | 47 | % | | | 46 | % | | | 75 | % | | | 50 | % |
| | | | | | | | | | | | | | | | | | | | |
| (a) | Based on average shares outstanding. |
| (b) | Distributions for annual periods determined in accordance with U.S. federal income tax regulations. |
| (c) | Where applicable, assumes the reinvestment of distributions. |
| (d) | Includes the LifePath Dynamic Fund’s share of its corresponding LifePath Dynamic Master Portfolio’s allocated net expenses and/or net investment income. |
| (e) | Includes the LifePath Dynamic Fund’s share of its corresponding LifePath Dynamic Master Portfolio’s allocated fees waived and expenses and/or net investment income. Excludes expenses incurred indirectly as a result of the LifePath Dynamic Master Portfolio’s investments in underlying funds as follows: |
| | | | | | | | | | | | | | | | | | | | |
| | | Year Ended December 31, | |
| | 2019 | | | 2018 | | | 2017 | | | 2016 | | | 2015 | |
Allocated fees waived | | | 0.49 | % | | | 0.46 | % | | | 0.47 | % | | | 0.44 | % | | | 0.48 | % |
Investments in underlying funds | | | 0.12 | % | | | 0.12 | % | | | 0.17 | % | | | 0.15 | % | | | 0.18 | % |
| | | | | | | | | | | | | | | | | | | | |
| (f) | Includes the LifePath Dynamic Master Portfolio’s purchases and sales of the underlying funds and Active Stock Master Portfolio, CoreAlpha Bond Master Portfolio, International Tilts Master Portfolio, Large Cap Index Master Portfolio, Master Small Cap Index Series and Master Total Return Portfolio. |
See notes to financial statements.
| | |
| 36 | | 2019 BLACKROCK ANNUAL REPORTTO SHAREHOLDERS |
Financial Highlights (continued)
(For a share outstanding throughout each period)
| | | | | | | | | | | | | | | | | | | | |
| | | BlackRock LifePath Dynamic 2045 Fund (continued) | |
| |
| | | Class R | |
| |
| | | Year Ended December 31, | |
| | | 2019 | | | 2018 | | | 2017 | | | 2016 | | | 2015 | |
| | | | | |
Net asset value, beginning of year | | $ | 12.69 | | | $ | 15.37 | | | $ | 13.85 | | | $ | 13.09 | | | $ | 14.04 | |
| | | | | | | | | | | | | | | | | | | | |
Net investment income(a) | | | 0.24 | | | | 0.21 | | | | 0.19 | | | | 0.19 | | | | 0.15 | |
Net realized and unrealized gain (loss) | | | 3.03 | | | | (1.49 | ) | | | 2.80 | | | | 0.80 | | | | (0.53 | ) |
| | | | | | | | | | | | | | | | | | | | |
Net increase (decrease) from investment operations | | | 3.27 | | | | (1.28 | ) | | | 2.99 | | | | 0.99 | | | | (0.38 | ) |
| | | | | | | | | | | | | | | | | | | | |
| | | | | |
Distributions(b) | | | | | | | | | | | | | | | | | | | | |
From net investment income | | | (0.25 | ) | | | (0.24 | ) | | | (0.23 | ) | | | (0.23 | ) | | | (0.16 | ) |
From net realized gain | | | (0.48 | ) | | | (1.16 | ) | | | (1.24 | ) | | | — | | | | (0.41 | ) |
| | | | | | | | | | | | | | | | | | | | |
Total distributions | | | (0.73 | ) | | | (1.40 | ) | | | (1.47 | ) | | | (0.23 | ) | | | (0.57 | ) |
| | | | | | | | | | | | | | | | | | | | |
| | | | | |
Net asset value, end of year | | $ | 15.23 | | | $ | 12.69 | | | $ | 15.37 | | | $ | 13.85 | | | $ | 13.09 | |
| | | | | | | | | | | | | | | | | | | | |
| | | | | |
Total Return(c) | | | | | | | | | | | | | | | | | | | | |
Based on net asset value | | | 25.83 | % | | | (8.63 | )% | | | 21.81 | % | | | 7.64 | % | | | (2.80 | )% |
| | | | | | | | | | | | | | | | | | | | |
| | | | | |
Ratios to Average Net Assets(d)(e) | | | | | | | | | | | | | | | | | | | | |
Total expenses | | | 1.04 | % | | | 1.03 | % | | | 1.02 | % | | | 1.01 | % | | | 1.21 | % |
| | | | | | | | | | | | | | | | | | | | |
Total expenses after fees waived and/or reimbursed | | | 1.01 | % | | | 1.00 | % | | | 0.98 | % | | | 0.99 | % | | | 1.15 | % |
| | | | | | | | | | | | | | | | | | | | |
Net investment income | | | 1.65 | % | | | 1.38 | % | | | 1.24 | % | | | 1.39 | % | | | 1.09 | % |
| | | | | | | | | | | | | | | | | | | | |
| | | | | |
Supplemental Data | | | | | | | | | | | | | | | | | | | | |
Net assets, end of year (000) | | $ | 4,104 | | | $ | 3,196 | | | $ | 3,039 | | | $ | 1,780 | | | $ | 693 | |
| | | | | | | | | | | | | | | | | | | | |
Portfolio turnover rate of the LifePath Dynamic Master Portfolio(f) | | | 49 | % | | | 47 | % | | | 46 | % | | | 75 | % | | | 50 | % |
| | | | | | | | | | | | | | | | | | | | |
| (a) | Based on average shares outstanding. |
| (b) | Distributions for annual periods determined in accordance with U.S. federal income tax regulations. |
| (c) | Where applicable, assumes the reinvestment of distributions. |
| (d) | Includes the LifePath Dynamic Fund’s share of its corresponding LifePath Dynamic Master Portfolio’s allocated net expenses and/or net investment income. |
| (e) | Includes the LifePath Dynamic Fund’s share of its corresponding LifePath Dynamic Master Portfolio’s allocated fees waived and expenses and/or net investment income. Excludes expenses incurred indirectly as a result of the LifePath Dynamic Master Portfolio’s investments in underlying funds as follows: |
| | | | | | | | | | | | | | | | | | | | |
| | | Year Ended December 31, | |
| | | 2019 | | | 2018 | | | 2017 | | | 2016 | | | 2015 | |
Allocated fees waived | | | 0.49 | % | | | 0.46 | % | | | 0.47 | % | | | 0.44 | % | | | 0.48 | % |
Investments in underlying funds | | | 0.12 | % | | | 0.12 | % | | | 0.17 | % | | | 0.15 | % | | | 0.18 | % |
| | | | | | | | | | | | | | | | | | | | |
| (f) | Includes the LifePath Dynamic Master Portfolio’s purchases and sales of the underlying funds and Active Stock Master Portfolio, CoreAlpha Bond Master Portfolio, International Tilts Master Portfolio, Large Cap Index Master Portfolio, Master Small Cap Index Series and Master Total Return Portfolio. |
See notes to financial statements.
Financial Highlights (continued)
(For a share outstanding throughout each period)
| | | | | | | | | | | | | | | | | | | | |
| | | BlackRock LifePath Dynamic 2055 Fund | |
| |
| | | Institutional | |
| |
| | | Year Ended December 31, | |
| | | 2019 | | | 2018 | | | 2017 | | | 2016 | | | 2015 | |
| | | | | |
Net asset value, beginning of year | | $ | 13.19 | | | $ | 15.86 | | | $ | 14.28 | | | $ | 13.46 | | | $ | 14.33 | |
| | | | | | | | | | | | | | | | | | | | |
Net investment income(a) | | | 0.32 | | | | 0.26 | | | | 0.24 | | | | 0.24 | | | | 0.22 | |
Net realized and unrealized gain (loss) | | | 3.16 | | | | (1.56 | ) | | | 2.93 | | | | 0.86 | | | | (0.57 | ) |
| | | | | | | | | | | | | | | | | | | | |
Net increase (decrease) from investment operations | | | 3.48 | | | | (1.30 | ) | | | 3.17 | | | | 1.10 | | | | (0.35 | ) |
| | | | | | | | | | | | | | | | | | | | |
| | | | | |
Distributions(b) | | | | | | | | | | | | | | | | | | | | |
From net investment income | | | (0.31 | ) | | | (0.29 | ) | | | (0.29 | ) | | | (0.28 | ) | | | (0.21 | ) |
From net realized gain | | | (0.46 | ) | | | (1.08 | ) | | | (1.30 | ) | | | — | | | | (0.31 | ) |
| | | | | | | | | | | | | | | | | | | | |
Total distributions | | | (0.77 | ) | | | (1.37 | ) | | | (1.59 | ) | | | (0.28 | ) | | | (0.52 | ) |
| | | | | | | | | | | | | | | | | | | | |
| | | | | |
Net asset value, end of year | | $ | 15.90 | | | $ | 13.19 | | | $ | 15.86 | | | $ | 14.28 | | | $ | 13.46 | |
| | | | | | | | | | | | | | | | | | | | |
| | | | | |
Total Return(c) | | | | | | | | | | | | | | | | | | | | |
Based on net asset value | | | 26.48 | % | | | (8.43 | )% | | | 22.57 | % | | | 8.20 | % | | | (2.52 | )% |
| | | | | | | | | | | | | | | | | | | | |
| | | | | |
Ratios to Average Net Assets(d)(e) | | | | | | | | | | | | | | | | | | | | |
Total expenses | | | 0.59 | % | | | 0.61 | % | | | 0.59 | % | | | 0.59 | % | | | 0.79 | % |
| | | | | | | | | | | | | | | | | | | | |
Total expenses after fees waived and/or reimbursed | | | 0.54 | % | | | 0.55 | % | | | 0.52 | % | | | 0.54 | % | | | 0.66 | % |
| | | | | | | | | | | | | | | | | | | | |
Net investment income | | | 2.14 | % | | | 1.65 | % | | | 1.54 | % | | | 1.73 | % | | | 1.53 | % |
| | | | | | | | | | | | | | | | | | | | |
| | | | | |
Supplemental Data | | | | | | | | | | | | | | | | | | | | |
Net assets, end of year (000) | | $ | 3,461 | | | $ | 1,748 | | | $ | 4,863 | | | $ | 8,626 | | | $ | 7,381 | |
| | | | | | | | | | | | | | | | | | | | |
Portfolio turnover rate of the LifePath Dynamic Master Portfolio(f) | | | 54 | % | | | 57 | % | | | 59 | % | | | 80 | % | | | 49 | % |
| | | | | | | | | | | | | | | | | | | | |
| (a) | Based on average shares outstanding. |
| (b) | Distributions for annual periods determined in accordance with U.S. federal income tax regulations. |
| (c) | Where applicable, assumes the reinvestment of distributions. |
| (d) | Includes the LifePath Dynamic Fund’s share of its corresponding LifePath Dynamic Master Portfolio’s allocated net expenses and/or net investment income. |
| (e) | Includes the LifePath Dynamic Fund’s share of its corresponding LifePath Dynamic Master Portfolio’s allocated fees waived and expenses and/or net investment income. Excludes expenses incurred indirectly as a result of the LifePath Dynamic Master Portfolio’s investments in underlying funds as follows: |
| | | | | | | | | | | | | | | | | | | | |
| | | Year Ended December 31, | |
| | 2019 | | | 2018 | | | 2017 | | | 2016 | | | 2015 | |
Allocated fees waived | | | 0.54 | % | | | 0.51 | % | | | 0.54 | % | | | 0.52 | % | | | 0.62 | % |
Investments in underlying funds | | | 0.13 | % | | | 0.12 | % | | | 0.17 | % | | | 0.15 | % | | | 0.18 | % |
| | | | | | | | | | | | | | | | | | | | |
| (f) | Includes the LifePath Dynamic Master Portfolio’s purchases and sales of the underlying funds and Active Stock Master Portfolio, CoreAlpha Bond Master Portfolio, International Tilts Master Portfolio, Large Cap Index Master Portfolio, Master Small Cap Index Series and Master Total Return Portfolio. |
See notes to financial statements.
| | |
| 38 | | 2019 BLACKROCK ANNUAL REPORTTO SHAREHOLDERS |
Financial Highlights (continued)
(For a share outstanding throughout each period)
| | | | | | | | | | | | | | | | | | | | |
| | | BlackRock LifePath Dynamic 2055 Fund (continued) | |
| |
| | | Investor A | |
| |
| | | Year Ended December 31, | |
| | | 2019 | | | 2018 | | | 2017 | | | 2016 | | | 2015 | |
| | | | | |
Net asset value, beginning of year | | $ | 13.13 | | | $ | 15.81 | | | $ | 14.25 | | | $ | 13.44 | | | $ | 14.30 | |
| | | | | | | | | | | | | | | | | | | | |
Net investment income(a) | | | 0.27 | | | | 0.24 | | | | 0.22 | | | | 0.20 | | | | 0.19 | |
Net realized and unrealized gain (loss) | | | 3.15 | | | | (1.57 | ) | | | 2.90 | | | | 0.85 | | | | (0.56 | ) |
| | | | | | | | | | | | | | | | | | | | |
Net increase (decrease) from investment operations | | | 3.42 | | | | (1.33 | ) | | | 3.12 | | | | 1.05 | | | | (0.37 | ) |
| | | | | | | | | | | | | | | | | | | | |
| | | | | |
Distributions(b) | | | | | | | | | | | | | | | | | | | | |
From net investment income | | | (0.27 | ) | | | (0.27 | ) | | | (0.26 | ) | | | (0.24 | ) | | | (0.18 | ) |
From net realized gain | | | (0.46 | ) | | | (1.08 | ) | | | (1.30 | ) | | | — | | | | (0.31 | ) |
| | | | | | | | | | | | | | | | | | | | |
Total distributions | | | (0.73 | ) | | | (1.35 | ) | | | (1.56 | ) | | | (0.24 | ) | | | (0.49 | ) |
| | | | | | | | | | | | | | | | | | | | |
| | | | | |
Net asset value, end of year | | $ | 15.82 | | | $ | 13.13 | | | $ | 15.81 | | | $ | 14.25 | | | $ | 13.44 | |
| | | | | | | | | | | | | | | | | | | | |
| | | | | |
Total Return(c) | | | | | | | | | | | | | | | | | | | | |
Based on net asset value | | | 26.12 | % | | | (8.63 | )% | | | 22.24 | % | | | 7.90 | % | | | (2.67 | )% |
| | | | | | | | | | | | | | | | | | | | |
| | | | | |
Ratios to Average Net Assets(d)(e) | | | | | | | | | | | | | | | | | | | | |
Total expenses | | | 0.85 | % | | | 0.86 | % | | | 0.85 | % | | | 0.84 | % | | | 1.04 | % |
| | | | | | | | | | | | | | | | | | | | |
Total expenses after fees waived and/or reimbursed | | | 0.80 | % | | | 0.80 | % | | | 0.78 | % | | | 0.79 | % | | | 0.91 | % |
| | | | | | | | | | | | | | | | | | | | |
Net investment income | | | 1.81 | % | | | 1.53 | % | | | 1.39 | % | | | 1.49 | % | | | 1.30 | % |
| | | | | | | | | | | | | | | | | | | | |
| | | | | |
Supplemental Data | | | | | | | | | | | | | | | | | | | | |
Net assets, end of year (000) | | $ | 13,347 | | | $ | 11,583 | | | $ | 11,416 | | | $ | 9,317 | | | $ | 7,561 | |
| | | | | | | | | | | | | | | | | | | | |
Portfolio turnover rate of the LifePath Dynamic Master Portfolio(f) | | | 54 | % | | | 57 | % | | | 59 | % | | | 80 | % | | | 49 | % |
| | | | | | | | | | | | | | | | | | | | |
| (a) | Based on average shares outstanding. |
| (b) | Distributions for annual periods determined in accordance with U.S. federal income tax regulations. |
| (c) | Where applicable, excludes the effects of any sales charges and assumes the reinvestment of distributions. |
| (d) | Includes the LifePath Dynamic Fund’s share of its corresponding LifePath Dynamic Master Portfolio’s allocated net expenses and/or net investment income. |
| (e) | Includes the LifePath Dynamic Fund’s share of its corresponding LifePath Dynamic Master Portfolio’s allocated fees waived and expenses and/or net investment income. Excludes expenses incurred indirectly as a result of the LifePath Dynamic Master Portfolio’s investments in underlying funds as follows: |
| | | | | | | | | | | | | | | | | | | | |
| | | Year Ended December 31, | |
| | | 2019 | | | 2018 | | | 2017 | | | 2016 | | | 2015 | |
Allocated fees waived | | | 0.54 | % | | | 0.51 | % | | | 0.54 | % | | | 0.52 | % | | | 0.62 | % |
Investments in underlying funds | | | 0.13 | % | | | 0.12 | % | | | 0.17 | % | | | 0.15 | % | | | 0.18 | % |
| | | | | | | | | | | | | | | | | | | | |
| (f) | Includes the LifePath Dynamic Master Portfolio’s purchases and sales of the underlying funds and Active Stock Master Portfolio, CoreAlpha Bond Master Portfolio, International Tilts Master Portfolio, Large Cap Index Master Portfolio, Master Small Cap Index Series and Master Total Return Portfolio. |
See notes to financial statements.
Financial Highlights (continued)
(For a share outstanding throughout each period)
| | | | | | | | | | | | | | | | | | | | |
| | | BlackRock LifePath Dynamic 2055 Fund (continued) | |
| |
| | | Investor C | |
| |
| | | Year Ended December 31, | |
| | | 2019 | | | 2018 | | | 2017 | | | 2016 | | | 2015 | |
| | | | | |
Net asset value, beginning of year | | $ | 12.95 | | | $ | 15.62 | | | $ | 14.11 | | | $ | 13.31 | | | $ | 14.18 | |
| | | | | | | | | | | | | | | | | | | | |
Net investment income(a) | | | 0.16 | | | | 0.12 | | | | 0.10 | | | | 0.09 | | | | 0.08 | |
Net realized and unrealized gain (loss) | | | 3.10 | | | | (1.56 | ) | | | 2.86 | | | | 0.85 | | | | (0.56 | ) |
| | | | | | | | | | | | | | | | | | | | |
Net increase (decrease) from investment operations | | | 3.26 | | | | (1.44 | ) | | | 2.96 | | | | 0.94 | | | | (0.48 | ) |
| | | | | | | | | | | | | | | | | | | | |
| | | | | |
Distributions(b) | | | | | | | | | | | | | | | | | | | | |
From net investment income | | | (0.17 | ) | | | (0.15 | ) | | | (0.15 | ) | | | (0.14 | ) | | | (0.08 | ) |
From net realized gain | | | (0.46 | ) | | | (1.08 | ) | | | (1.30 | ) | | | — | | | | (0.31 | ) |
| | | | | | | | | | | | | | | | | | | | |
Total distributions | | | (0.63 | ) | | | (1.23 | ) | | | (1.45 | ) | | | (0.14 | ) | | | (0.39 | ) |
| | | | | | | | | | | | | | | | | | | | |
| | | | | |
Net asset value, end of year | | $ | 15.58 | | | $ | 12.95 | | | $ | 15.62 | | | $ | 14.11 | | | $ | 13.31 | |
| | | | | | | | | | | | | | | | | | | | |
| | | | | |
Total Return(c) | | | | | | | | | | | | | | | | | | | | |
Based on net asset value | | | 25.17 | % | | | (9.36 | )% | | | 21.24 | % | | | 7.05 | % | | | (3.48 | )% |
| | | | | | | | | | | | | | | | | | | | |
| | | | | |
Ratios to Average Net Assets(d)(e) | | | | | | | | | | | | | | | | | | | | |
Total expenses | | | 1.65 | % | | | 1.66 | % | | | 1.65 | % | | | 1.65 | % | | | 1.80 | % |
| | | | | | | | | | | | | | | | | | | | |
Total expenses after fees waived and/or reimbursed | | | 1.60 | % | | | 1.60 | % | | | 1.58 | % | | | 1.59 | % | | | 1.67 | % |
| | | | | | | | | | | | | | | | | | | | |
Net investment income | | | 1.08 | % | | | 0.75 | % | | | 0.62 | % | | | 0.70 | % | | | 0.54 | % |
| | | | | | | | | | | | | | | | | | | | |
| | | | | |
Supplemental Data | | | | | | | | | | | | | | | | | | | | |
Net assets, end of year (000) | | $ | 1,212 | | | $ | 862 | | | $ | 729 | | | $ | 499 | | | $ | 543 | |
| | | | | | | | | | | | | | | | | | | | |
Portfolio turnover rate of the LifePath Dynamic Master Portfolio(f) | | | 54 | % | | | 57 | % | | | 59 | % | | | 80 | % | | | 49 | % |
| | | | | | | | | | | | | | | | | | | | |
| (a) | Based on average shares outstanding. |
| (b) | Distributions for annual periods determined in accordance with U.S. federal income tax regulations. |
| (c) | Where applicable, excludes the effects of any sales charges and assumes the reinvestment of distributions. |
| (d) | Includes the LifePath Dynamic Fund’s share of its corresponding LifePath Dynamic Master Portfolio’s allocated net expenses and/or net investment income. |
| (e) | Includes the LifePath Dynamic Fund’s share of its corresponding LifePath Dynamic Master Portfolio’s allocated fees waived and expenses and/or net investment income. Excludes expenses incurred indirectly as a result of the LifePath Dynamic Master Portfolio’s investments in underlying funds as follows: |
| | | | | | | | | | | | | | | | | | | | |
| | | Year Ended December 31, | |
| | | 2019 | | | 2018 | | | 2017 | | | 2016 | | | 2015 | |
Allocated fees waived | | | 0.54 | % | | | 0.51 | % | | | 0.54 | % | | | 0.52 | % | | | 0.62 | % |
Investments in underlying funds | | | 0.13 | % | | | 0.12 | % | | | 0.17 | % | | | 0.15 | % | | | 0.18 | % |
| | | | | | | | | | | | | | | | | | | | |
| (f) | Includes the LifePath Dynamic Master Portfolio’s purchases and sales of the underlying funds and Active Stock Master Portfolio, CoreAlpha Bond Master Portfolio, International Tilts Master Portfolio, Large Cap Index Master Portfolio, Master Small Cap Index Series and Master Total Return Portfolio. |
See notes to financial statements.
| | |
| 40 | | 2019 BLACKROCK ANNUAL REPORTTO SHAREHOLDERS |
Financial Highlights (continued)
(For a share outstanding throughout each period)
| | | | | | | | | | | | | | | | | | | | |
| | | BlackRock LifePath Dynamic 2055 Fund (continued) | |
| |
| | | Class K | |
| |
| | | Year Ended December 31, | |
| | | 2019 | | | 2018 | | | 2017 | | | 2016 | | | 2015 | |
| | | | | |
Net asset value, beginning of year | | $ | 13.36 | | | $ | 16.06 | | | $ | 14.45 | | | $ | 13.62 | | | $ | 14.49 | |
| | | | | | | | | | | | | | | | | | | | |
Net investment income(a) | | | 0.40 | | | | 0.32 | | | | 0.30 | | | | 0.28 | | | | 0.28 | |
Net realized and unrealized gain (loss) | | | 3.16 | | | | (1.60 | ) | | | 2.94 | | | | 0.86 | | | | (0.58 | ) |
| | | | | | | | | | | | | | | | | | | | |
Net increase (decrease) from investment operations | | | 3.56 | | | | (1.28 | ) | | | 3.24 | | | | 1.14 | | | | (0.30 | ) |
| | | | | | | | | | | | | | | | | | | | |
| | | | | |
Distributions(b) | | | | | | | | | | | | | | | | | | | | |
From net investment income | | | (0.34 | ) | | | (0.34 | ) | | | (0.33 | ) | | | (0.31 | ) | | | (0.26 | ) |
From net realized gain | | | (0.46 | ) | | | (1.08 | ) | | | (1.30 | ) | | | — | | | | (0.31 | ) |
| | | | | | | | | | | | | | | | | | | | |
Total distributions | | | (0.80 | ) | | | (1.42 | ) | | | (1.63 | ) | | | (0.31 | ) | | | (0.57 | ) |
| | | | | | | | | | | | | | | | | | | | |
| | | | | |
Net asset value, end of year | | $ | 16.12 | | | $ | 13.36 | | | $ | 16.06 | | | $ | 14.45 | | | $ | 13.62 | |
| | | | | | | | | | | | | | | | | | | | |
| | | | | |
Total Return(c) | | | | | | | | | | | | | | | | | | | | |
Based on net asset value | | | 26.75 | % | | | (8.21 | )% | | | 22.79 | % | | | 8.42 | % | | | (2.15 | )% |
| | | | | | | | | | | | | | | | | | | | |
| | | | | |
Ratios to Average Net Assets(d)(e) | | | | | | | | | | | | | | | | | | | | |
Total expenses | | | 0.39 | % | | | 0.41 | % | | | 0.40 | % | | | 0.37 | % | | | 0.46 | % |
| | | | | | | | | | | | | | | | | | | | |
Total expenses after fees waived and/or reimbursed | | | 0.34 | % | | | 0.35 | % | | | 0.33 | % | | | 0.33 | % | | | 0.32 | % |
| | | | | | | | | | | | | | | | | | | | |
Net investment income | | | 2.58 | % | | | 1.99 | % | | | 1.88 | % | | | 2.01 | % | | | 1.97 | % |
| | | | | | | | | | | | | | | | | | | | |
| | | | | |
Supplemental Data | | | | | | | | | | | | | | | | | | | | |
Net assets, end of year (000) | | $ | 7,240 | | | $ | 1,920 | | | $ | 1,426 | | | $ | 425 | | | $ | 52 | |
| | | | | | | | | | | | | | | | | | | | |
Portfolio turnover rate of the LifePath Dynamic Master Portfolio(f) | | | 54 | % | | | 57 | % | | | 59 | % | | | 80 | % | | | 49 | % |
| | | | | | | | | | | | | | | | | | | | |
| (a) | Based on average shares outstanding. |
| (b) | Distributions for annual periods determined in accordance with U.S. federal income tax regulations. |
| (c) | Where applicable, assumes the reinvestment of distributions. |
| (d) | Includes the LifePath Dynamic Fund’s share of its corresponding LifePath Dynamic Master Portfolio’s allocated net expenses and/or net investment income. |
| (e) | Includes the LifePath Dynamic Fund’s share of its corresponding LifePath Dynamic Master Portfolio’s allocated fees waived and expenses and/or net investment income. Excludes expenses incurred indirectly as a result of the LifePath Dynamic Master Portfolio’s investments in underlying funds as follows: |
| | | | | | | | | | | | | | | | | | | | |
| | | Year Ended December 31, | |
| | | 2019 | | | 2018 | | | 2017 | | | 2016 | | | 2015 | |
Allocated fees waived | | | 0.54 | % | | | 0.51 | % | | | 0.54 | % | | | 0.52 | % | | | 0.62 | % |
Investments in underlying funds | | | 0.13 | % | | | 0.12 | % | | | 0.17 | % | | | 0.15 | % | | | 0.18 | % |
| | | | | | | | | | | | | | | | | | | | |
| (f) | Includes the LifePath Dynamic Master Portfolio’s purchases and sales of the underlying funds and Active Stock Master Portfolio, CoreAlpha Bond Master Portfolio, International Tilts Master Portfolio, Large Cap Index Master Portfolio, Master Small Cap Index Series and Master Total Return Portfolio. |
See notes to financial statements.
Financial Highlights (continued)
(For a share outstanding throughout each period)
| | | | | | | | | | | | | | | | | | | | |
| | | BlackRock LifePath Dynamic 2055 Fund (continued) | |
| |
| | | Class R | |
| |
| | | Year Ended December 31, | |
| | | 2019 | | | 2018 | | | 2017 | | | 2016 | | | 2015 | |
| | | | | |
Net asset value, beginning of year | | $ | 13.11 | | | $ | 15.80 | | | $ | 14.25 | | | $ | 13.44 | | | $ | 14.32 | |
| | | | | | | | | | | | | | | | | | | | |
Net investment income(a) | | | 0.24 | | | | 0.21 | | | | 0.19 | | | | 0.18 | | | | 0.15 | |
Net realized and unrealized gain (loss) | | | 3.15 | | | | (1.58 | ) | | | 2.89 | | | | 0.85 | | | | (0.57 | ) |
| | | | | | | | | | | | | | | | | | | | |
Net increase (decrease) from investment operations | | | 3.39 | | | | (1.37 | ) | | | 3.08 | | | | 1.03 | | | | (0.42 | ) |
| | | | | | | | | | | | | | | | | | | | |
| | | | | |
Distributions(b) | | | | | | | | | | | | | | | | | | | | |
From net investment income | | | (0.26 | ) | | | (0.24 | ) | | | (0.23 | ) | | | (0.22 | ) | | | (0.15 | ) |
From net realized gain | | | (0.46 | ) | | | (1.08 | ) | | | (1.30 | ) | | | — | | | | (0.31 | ) |
| | | | | | | | | | | | | | | | | | | | |
Total distributions | | | (0.72 | ) | | | (1.32 | ) | | | (1.53 | ) | | | (0.22 | ) | | | (0.46 | ) |
| | | | | | | | | | | | | | | | | | | | |
| | | | | |
Net asset value, end of year | | $ | 15.78 | | | $ | 13.11 | | | $ | 15.80 | | | $ | 14.25 | | | $ | 13.44 | |
| | | | | | | | | | | | | | | | | | | | |
| | | | | |
Total Return(c) | | | | | | | | | | | | | | | | | | | | |
Based on net asset value | | | 25.89 | % | | | (8.87 | )% | | | 21.95 | % | | | 7.74 | % | | | (3.00 | )% |
| | | | | | | | | | | | | | | | | | | | |
| | | | | |
Ratios to Average Net Assets(d)(e) | | | | | | | | | | | | | | | | | | | | |
Total expenses | | | 1.04 | % | | | 1.06 | % | | | 1.05 | % | | | 1.04 | % | | | 1.29 | % |
| | | | | | | | | | | | | | | | | | | | |
Total expenses after fees waived and/or reimbursed | | | 1.00 | % | | | 1.00 | % | | | 0.98 | % | | | 0.99 | % | | | 1.15 | % |
| | | | | | | | | | | | | | | | | | | | |
Net investment income | | | 1.59 | % | | | 1.34 | % | | | 1.20 | % | | | 1.30 | % | | | 1.07 | % |
| | | | | | | | | | | | | | | | | | | | |
| | | | | |
Supplemental Data | | | | | | | | | | | | | | | | | | | | |
Net assets, end of year (000) | | $ | 2,088 | | | $ | 859 | | | $ | 768 | | | $ | 483 | | | $ | 292 | |
| | | | | | | | | | | | | | | | | | | | |
Portfolio turnover rate of the LifePath Dynamic Master Portfolio(f) | | | 54 | % | | | 57 | % | | | 59 | % | | | 80 | % | | | 49 | % |
| | | | | | | | | | | | | | | | | | | | |
| (a) | Based on average shares outstanding. |
| (b) | Distributions for annual periods determined in accordance with U.S. federal income tax regulations. |
| (c) | Where applicable, assumes the reinvestment of distributions. |
| (d) | Includes the LifePath Dynamic Fund’s share of its corresponding LifePath Dynamic Master Portfolio’s allocated net expenses and/or net investment income. |
| (e) | Includes the LifePath Dynamic Fund’s share of its corresponding LifePath Dynamic Master Portfolio’s allocated fees waived and expenses and/or net investment income. Excludes expenses incurred indirectly as a result of the LifePath Dynamic Master Portfolio’s investments in underlying funds as follows: |
| | | | | | | | | | | | | | | | | | | | |
| | | Year Ended December 31, | |
| | | 2019 | | | 2018 | | | 2017 | | | 2016 | | | 2015 | |
Allocated fees waived | | | 0.54 | % | | | 0.51 | % | | | 0.54 | % | | | 0.52 | % | | | 0.62 | % |
Investments in underlying funds | | | 0.13 | % | | | 0.12 | % | | | 0.17 | % | | | 0.15 | % | | | 0.18 | % |
| | | | | | | | | | | | | | | | | | | | |
| (f) | Includes the LifePath Dynamic Master Portfolio’s purchases and sales of the underlying funds and Active Stock Master Portfolio, CoreAlpha Bond Master Portfolio, International Tilts Master Portfolio, Large Cap Index Master Portfolio, Master Small Cap Index Series and Master Total Return Portfolio. |
See notes to financial statements.
| | |
| 42 | | 2019 BLACKROCK ANNUAL REPORTTO SHAREHOLDERS |
Financial Highlights (continued)
(For a share outstanding throughout each period)
| | | | |
| | | BlackRock LifePath
Dynamic 2065 Fund | |
| |
| | | Institutional | |
| | | Period from
10/30/19 (a)
to 12/31/19 | |
| |
Net asset value, beginning of period | | $ | 10.00 | |
| | | | |
Net investment income(b) | | | 0.07 | |
Net realized and unrealized gain | | | 0.47 | |
| | | | |
Net increase from investment operations | | | 0.54 | |
| | | | |
Distributions from net investment income(c) | | | (0.07 | ) |
| | | | |
| |
Net asset value, end of period | | $ | 10.47 | |
| | | | |
| |
Total Return(d) | | | | |
Based on net asset value | | | 5.36 | %(e) |
| | | | |
| |
Ratios to Average Net Assets(f)(g) | | | | |
Total expenses | | | 0.83 | %(h)(i) |
| | | | |
Total expenses after fees waived and/or reimbursed | | | 0.56 | %(h) |
| | | | |
Net investment income | | | 4.23 | %(h) |
| | | | |
| |
Supplemental Data | | | | |
Net assets, end of period (000) | | $ | 419 | |
| | | | |
Portfolio turnover rate of the LifePath Dynamic Master Portfolio(j) | | | 3 | % |
| | | | |
| (a) | Commencement of operations. |
| (b) | Based on average shares outstanding. |
| (c) | Distributions for annual periods determined in accordance with U.S. federal income tax regulations. |
| (d) | Where applicable, assumes the reinvestment of distributions. |
| (e) | Aggregate total return. |
| (f) | Includes the LifePath Dynamic Fund’s share of its corresponding LifePath Dynamic Master Portfolio’s allocated net expenses and/or net investment income. |
| (g) | Includes the LifePath Dynamic Fund’s share of its corresponding LifePath Dynamic Master Portfolio’s allocated fees waived and expenses and/or net investment income of 2.93%. Excludes expenses incurred indirectly as a result of the LifePath Dynamic Master Portfolio’s investments in underlying funds of 0.13%. |
| (i) | Audit fees were not annualized in the calculation of expense ratios. If this expense was annualized, the total expenses would have been 2.14%. |
| (j) | Includes the LifePath Dynamic Master Portfolio’s purchases and sales of the underlying funds and Active Stock Master Portfolio, CoreAlpha Bond Master Portfolio, International Tilts Master Portfolio and Master Total Return Portfolio. |
See notes to financial statements.
Financial Highlights (continued)
(For a share outstanding throughout each period)
| | | | |
| | | BlackRock LifePath
Dynamic 2065 Fund
(continued) | |
| |
| | | Investor A | |
| | | Period from 10/30/19 (a) to 12/31/19 | |
| |
Net asset value, beginning of period | | $ | 10.00 | |
| | | | |
Net investment income(b) | | | 0.07 | |
Net realized and unrealized gain | | | 0.46 | |
| | | | |
Net increase from investment operations | | | 0.53 | |
| | | | |
Distributions from net investment income(c) | | | (0.06 | ) |
| | | | |
| |
Net asset value, end of period | | $ | 10.47 | |
| | | | |
| |
Total Return(d) | | | | |
Based on net asset value | | | 5.32 | %(e) |
| | | | |
| |
Ratios to Average Net Assets(f)(g) | | | | |
Total expenses | | | 1.08 | %(h)(i) |
| | | | |
Total expenses after fees waived and/or reimbursed | | | 0.81 | %(h) |
| | | | |
Net investment income | | | 3.98 | %(h) |
| | | | |
| |
Supplemental Data | | | | |
Net assets, end of period (000) | | $ | 419 | |
| | | | |
Portfolio turnover rate of the LifePath Dynamic Master Portfolio(j) | | | 3 | % |
| | | | |
| (a) | Commencement of operations. |
| (b) | Based on average shares outstanding. |
| (c) | Distributions for annual periods determined in accordance with U.S. federal income tax regulations. |
| (d) | Where applicable, excludes the effects of any sales charges and assumes the reinvestment of distributions. |
| (e) | Aggregate total return. |
| (f) | Includes the LifePath Dynamic Fund’s share of its corresponding LifePath Dynamic Master Portfolio’s allocated net expenses and/or net investment income. |
| (g) | Includes the LifePath Dynamic Fund’s share of its corresponding LifePath Dynamic Master Portfolio’s allocated fees waived and expenses and/or net investment income of 2.93%. Excludes expenses incurred indirectly as a result of the LifePath Dynamic Master Portfolio’s investments in underlying funds of 0.13%. |
| (i) | Audit fees were not annualized in the calculation of expense ratios. If this expense was annualized, the total expenses would have been 2.39%. |
| (j) | Includes the LifePath Dynamic Master Portfolio’s purchases and sales of the underlying funds and Active Stock Master Portfolio, CoreAlpha Bond Master Portfolio, International Tilts Master Portfolio and Master Total Return Portfolio. |
See notes to financial statements.
| | |
| 44 | | 2019 BLACKROCK ANNUAL REPORTTO SHAREHOLDERS |
Financial Highlights (continued)
(For a share outstanding throughout each period)
| | | | |
| | | BlackRock LifePath
Dynamic 2065 Fund
(continued) | |
| |
| | | Investor C | |
| | | Period from
10/30/19 (a) to 12/31/19 | |
| |
Net asset value, beginning of period | | $ | 10.00 | |
| | | | |
Net investment income(b) | | | 0.05 | |
Net realized and unrealized gain | | | 0.47 | |
| | | | |
Net increase from investment operations | | | 0.52 | |
| | | | |
Distributions from net investment income(c) | | | (0.05 | ) |
| | | | |
| |
Net asset value, end of period | | $ | 10.47 | |
| | | | |
| |
Total Return(d) | | | | |
Based on net asset value | | | 5.18 | %(e) |
| | | | |
| |
Ratios to Average Net Assets(f)(g) | | | | |
Total expenses | | | 1.88 | %(h)(i) |
| | | | |
Total expenses after fees waived and/or reimbursed | | | 1.61 | %(h) |
| | | | |
Net investment income | | | 3.13 | %(h) |
| | | | |
| |
Supplemental Data | | | | |
Net assets, end of period (000) | | $ | 419 | |
| | | | |
Portfolio turnover rate of the LifePath Dynamic Master Portfolio(j) | | | 3 | % |
| | | | |
| (a) | Commencement of operations. |
| (b) | Based on average shares outstanding. |
| (c) | Distributions for annual periods determined in accordance with U.S. federal income tax regulations. |
| (d) | Where applicable, excludes the effects of any sales charges and assumes the reinvestment of distributions. |
| (e) | Aggregate total return. |
| (f) | Includes the LifePath Dynamic Fund’s share of its corresponding LifePath Dynamic Master Portfolio’s allocated net expenses and/or net investment income. |
| (g) | Includes the LifePath Dynamic Fund’s share of its corresponding LifePath Dynamic Master Portfolio’s allocated fees waived and expenses and/or net investment income of 2.93%. Excludes expenses incurred indirectly as a result of the LifePath Dynamic Master Portfolio’s investments in underlying funds of 0.13%. |
| (i) | Audit fees were not annualized in the calculation of expense ratios. If this expense was annualized, the total expenses would have been 3.19%. |
| (j) | Includes the LifePath Dynamic Master Portfolio’s purchases and sales of the underlying funds and Active Stock Master Portfolio, CoreAlpha Bond Master Portfolio, International Tilts Master Portfolio and Master Total Return Portfolio. |
See notes to financial statements.
Financial Highlights (continued)
(For a share outstanding throughout each period)
| | | | |
| | | BlackRock LifePath
Dynamic 2065 Fund
(continued) | |
| |
| | | Class K | |
| | | Period from
10/30/19 (a) to 12/31/19 | |
| |
Net asset value, beginning of period | | $ | 10.00 | |
| | | | |
Net investment income(b) | | | 0.08 | |
Net realized and unrealized gain | | | 0.47 | |
| | | | |
Net increase from investment operations | | | 0.55 | |
| | | | |
Distributions from net investment income(c) | | | (0.07 | ) |
| | | | |
| |
Net asset value, end of period | | $ | 10.48 | |
| | | | |
| |
Total Return(d) | | | | |
Based on net asset value | | | 5.49 | %(e) |
| | | | |
| |
Ratios to Average Net Assets(f)(g) | | | | |
Total expenses | | | 0.63 | %(h)(i) |
| | | | |
Total expenses after fees waived and/or reimbursed | | | 0.36 | %(h) |
| | | | |
Net investment income | | | 4.43 | %(h) |
| | | | |
| |
Supplemental Data | | | | |
Net assets, end of period (000) | | $ | 2,514 | |
| | | | |
Portfolio turnover rate of the LifePath Dynamic Master Portfolio(j) | | | 3 | % |
| | | | |
| (a) | Commencement of operations. |
| (b) | Based on average shares outstanding. |
| (c) | Distributions for annual periods determined in accordance with U.S. federal income tax regulations. |
| (d) | Where applicable, assumes the reinvestment of distributions. |
| (e) | Aggregate total return. |
| (f) | Includes the LifePath Dynamic Fund’s share of its corresponding LifePath Dynamic Master Portfolio’s allocated net expenses and/or net investment income. |
| (g) | Includes the LifePath Dynamic Fund’s share of its corresponding LifePath Dynamic Master Portfolio’s allocated fees waived and expenses and/or net investment income of 2.93%. Excludes expenses incurred indirectly as a result of the LifePath Dynamic Master Portfolio’s investments in underlying funds of 0.13%. |
| (i) | Audit fees were not annualized in the calculation of expense ratios. If this expense was annualized, the total expenses would have been 1.94%. |
| (j) | Includes the LifePath Dynamic Master Portfolio’s purchases and sales of the underlying funds and Active Stock Master Portfolio, CoreAlpha Bond Master Portfolio, International Tilts Master Portfolio and Master Total Return Portfolio. |
See notes to financial statements.
| | |
| 46 | | 2019 BLACKROCK ANNUAL REPORTTO SHAREHOLDERS |
Financial Highlights (continued)
(For a share outstanding throughout each period)
| | | | |
| | | BlackRock LifePath
Dynamic 2065 Fund
(continued) | |
| |
| | | Class R | |
| | | Period from 10/30/19 (a) to 12/31/19 | |
| |
Net asset value, beginning of period | | $ | 10.00 | |
| | | | |
Net investment income(b) | | | 0.07 | |
Net realized and unrealized gain | | | 0.46 | |
| | | | |
Net increase from investment operations | | | 0.53 | |
| | | | |
Distributions from net investment income(c) | | | (0.06 | ) |
| | | | |
| |
Net asset value, end of period | | $ | 10.47 | |
| | | | |
| |
Total Return(d) | | | | |
Based on net asset value | | | 5.28 | %(e) |
| | | | |
| |
Ratios to Average Net Assets(f)(g) | | | | |
Total expenses | | | 1.28 | %(h)(i) |
| | | | |
Total expenses after fees waived and/or reimbursed | | | 1.01 | %(h) |
| | | | |
Net investment income | | | 3.78 | %(h) |
| | | | |
| |
Supplemental Data | | | | |
Net assets, end of period (000) | | $ | 419 | |
| | | | |
Portfolio turnover rate of the LifePath Dynamic Master Portfolio(j) | | | 3 | % |
| | | | |
| (a) | Commencement of operations. |
| (b) | Based on average shares outstanding. |
| (c) | Distributions for annual periods determined in accordance with U.S. federal income tax regulations. |
| (d) | Where applicable, assumes the reinvestment of distributions. |
| (e) | Aggregate total return. |
| (f) | Includes the LifePath Dynamic Fund’s share of its corresponding LifePath Dynamic Master Portfolio’s allocated net expenses and/or net investment income. |
| (g) | Includes the LifePath Dynamic Fund’s share of its corresponding LifePath Dynamic Master Portfolio’s allocated fees waived and expenses and/or net investment income of 2.93%. Excludes expenses incurred indirectly as a result of the LifePath Dynamic Master Portfolio’s investments in underlying funds of 0.13%. |
| (i) | Audit fees were not annualized in the calculation of expense ratios. If this expense was annualized, the total expenses would have been 2.59%. |
| (j) | Includes the LifePath Dynamic Master Portfolio’s purchases and sales of the underlying funds and Active Stock Master Portfolio, CoreAlpha Bond Master Portfolio, International Tilts Master Portfolio and Master Total Return Portfolio. |
See notes to financial statements.
Notes to Financial Statements
BlackRock Funds III (the “Trust”) is registered under the Investment Company Act of 1940, as amended (the “1940 Act”), as anopen-end management investment company. The Trust is organized as a Delaware statutory trust. The following, each of which is a series of the Trust, are referred to herein collectively as the “LifePath Dynamic Funds” or individually as a “LifePath Dynamic Fund”:
| | | | |
| LifePath Dynamic Fund Name | | Herein Referred To As | | Diversification
Classification |
BlackRock LifePath® Dynamic 2025 Fund | | LifePath Dynamic 2025 Fund | | Diversified |
BlackRock LifePath® Dynamic 2035 Fund | | LifePath Dynamic 2035 Fund | | Diversified |
BlackRock LifePath® Dynamic 2045 Fund | | LifePath Dynamic 2045 Fund | | Diversified |
BlackRock LifePath® Dynamic 2055 Fund | | LifePath Dynamic 2055 Fund | | Diversified |
BlackRock LifePath® Dynamic 2065 Fund | | LifePath Dynamic 2065 Fund | | Diversified |
Each LifePath Dynamic Fund seeks to achieve its investment objective by investing all of its assets in a corresponding series of Master Investment Portfolio (“MIP”): LifePath Dynamic 2025 Master Portfolio, LifePath Dynamic 2035 Master Portfolio, LifePath Dynamic 2045 Master Portfolio, LifePath Dynamic 2055 Master Portfolio and LifePath Dynamic 2065 Master Portfolio (each, a “LifePath Dynamic Master Portfolio” and together, the “LifePath Dynamic Master Portfolios”). MIP is an affiliate of the Trust. Each LifePath Dynamic Master Portfolio has the same investment objective and strategies as its corresponding LifePath Dynamic Fund. The value of each LifePath Dynamic Fund’s investment in its corresponding LifePath Dynamic Master Portfolio reflects the LifePath Dynamic Fund’s proportionate interest in the net assets of the LifePath Dynamic Master Portfolio. The performance of the LifePath Dynamic Funds is directly affected by the performance of the LifePath Dynamic Master Portfolios. At December 31, 2019, the percentage of each LifePath Dynamic Master Portfolio owned by its corresponding LifePath Dynamic Fund was approximately 100%. The financial statements of the LifePath Dynamic Master Portfolios, including the Schedules of Investments, are included elsewhere in this report and should be read in conjunction with the LifePath Dynamic Funds’ financial statements.
Each LifePath Dynamic Fund offers multiple classes of shares. All classes of shares have identical voting, dividend, liquidation and other rights and are subject to the same terms and conditions, except that certain classes bear expenses related to the shareholder servicing and distribution of such shares. Institutional and Class K Shares are sold without a sales charge and only to certain eligible investors. Class R Shares are sold without a sales charge and only to certain employer-sponsored retirement plans. Investor A and Investor C Shares are generally available through financial intermediaries. Investor A, Investor C, and Class R Shares bear certain expenses related to shareholder servicing of such shares, and Investor C and Class R Shares also bear certain expenses related to the distribution of such shares. Each class has exclusive voting rights with respect to matters relating to its shareholder servicing and distribution expenditures (except that Investor C shareholders may vote on material changes to the Investor A Shares distribution and service plan). The Board of Trustees of the Trust and Board of Trustees of MIP are referred to throughout this report as the “Board of Trustees” or the “Board” and the members are referred to as “Trustees.”
| | | | | | | | |
| Share Class | | Initial Sales Charge | | CDSC | | | Conversion Privilege |
Institutional, Class K and Class R Shares | | No | | | No | | | None |
Investor A Shares | | Yes | | | No | (a) | | None |
Investor C Shares | | No | | | Yes | (b) | | To Investor A Shares after approximately 10 years |
| | (a) | Investor A Shares may be subject to a contingent deferred sales charge (“CDSC”) for certain redemptions where no initial sales charge was paid at the time of purchase. | |
| | (b) | A CDSC of 1.00% is assessed on certain redemptions of Investor C Shares made within one year after purchase. | |
The LifePath Dynamic Funds, together with certain other registered investment companies advised by BlackRock Advisors, LLC (“BAL” or the “Administrator”) or its affiliates, are included in a complex equity, multi-asset, index and money market funds referred to as the BlackRock Multi-Asset Complex.
On November 12-13, 2019, the Board approved a proposal pursuant to which each LifePath Dynamic Fund will cease to invest in its corresponding “master” portfolio as part of a “master-feeder” structure and instead operate as a stand-alone fund. In connection with this change, the Trust, on behalf of each Fund, will enter into a management agreement with BAL, the terms of which will be substantially the same as the current management agreement between BAL and each corresponding LifePath Dynamic Master Portfolio, including the management fee rate. The change into a stand-alone structure will not create a taxable event for the LifePath Dynamic Funds or their shareholders. These changes are expected to be effective on or about March 9, 2020.
| 2. | SIGNIFICANT ACCOUNTING POLICIES |
The financial statements are prepared in conformity with accounting principles generally accepted in the United States of America (“U.S. GAAP”), which may require management to make estimates and assumptions that affect the reported amounts of assets and liabilities in the financial statements, disclosure of contingent assets and liabilities at the date of the financial statements and the reported amounts of increases and decreases in net assets from operations during the reporting period. Actual results could differ from those estimates. Each LifePath Dynamic Fund is considered an investment company under U.S. GAAP and follows the accounting and reporting guidance applicable to investment companies. Below is a summary of significant accounting policies:
Investment Transactions and Income Recognition:For financial reporting purposes, contributions to and withdrawals from each LifePath Dynamic Master Portfolio are accounted for on a trade date basis. Each LifePath Dynamic Fund records its proportionate share of LifePath Dynamic Master Portfolio’s income, expenses and realized and unrealized gains and losses on a daily basis. Realized and unrealized gains and losses are adjusted utilizing partnership tax allocation rules. In addition, the LifePath Dynamic Funds accrue their own expenses. Income, expenses and realized and unrealized gains and losses are allocated daily to each class based on its relative net assets.
Distributions: Distributions from net investment income are declared and paid quarterly. Distributions of capital gains are recorded on theex-dividend date and made at least annually. The character and timing of distributions are determined in accordance with U.S. federal income tax regulations, which may differ from U.S. GAAP.
| | |
| 48 | | 2019 BLACKROCK ANNUAL REPORTTO SHAREHOLDERS |
Notes to Financial Statements (continued)
Indemnifications:In the normal course of business, a LifePath Dynamic Fund enters into contracts that contain a variety of representations that provide general indemnification. A LifePath Dynamic Fund’s maximum exposure under these arrangements is unknown because it involves future potential claims against a LifePath Dynamic Fund, which cannot be predicted with any certainty.
Other: Expenses directly related to a LifePath Dynamic Fund or its classes are charged to that LifePath Dynamic Fund or the applicable class. Other operating expenses shared by several funds, including other funds managed by the Manager, are prorated among those funds on the basis of relative net assets or other appropriate methods. Expenses directly related to the LifePath Dynamic Funds and other shared expenses prorated to the LifePath Dynamic Funds are allocated daily to each class based on their relative net assets or other appropriate methods.
| 3. | INVESTMENT VALUATION AND FAIR VALUE MEASUREMENTS |
Investment Valuation Policies: Each LifePath Dynamic Fund’s policy is to value its financial instruments at fair value. Each LifePath Dynamic Fund records its investment in its corresponding LifePath Dynamic Master Portfolio at fair value based on each LifePath Dynamic Fund’s proportionate interest in the net assets of its corresponding LifePath Dynamic Master Portfolio. Valuation of securities held by the LifePath Dynamic Master Portfolios is discussed in Note 3 of the LifePath Dynamic Master Portfolios’ Notes to Financial Statements, which are included elsewhere in this report.
| 4. | ADMINISTRATION AGREEMENT AND OTHER TRANSACTIONS WITH AFFILIATES |
Administration: The Trust, on behalf of the LifePath Dynamic Funds, entered into an Administration Agreement with BlackRock Advisors, LLC (“BAL” or the “Administrator”), which has agreed to provide general administrative services (other than investment advice and related portfolio activities). BAL has agreed to bear all of the LifePath Dynamic Funds’ ordinary operating expenses, excluding, generally, investment advisory fees, distribution fees, brokerage and other expenses related to the execution of portfolio transactions, extraordinary expenses and certain other expenses which are borne by the LifePath Dynamic Funds. BAL is entitled to receive for these administrative services an annual fee of 0.35% based on the average daily net assets of each LifePath Dynamic Fund’s Institutional and Investor A Shares, 0.40% of the average daily net assets of Investor C Shares, 0.15% of the average daily net assets of Class K Shares and 0.30% of the average daily net assets of Class R Shares.
From time to time, BAL may waive such fees in whole or in part. Any such waiver will reduce the expenses of the LifePath Dynamic Funds and, accordingly, have a favorable impact on its performance. BAL may delegate certain of its administration duties tosub-administrators.
For the year ended December 31, 2019, the following table shows the class specific administration fees borne directly by each share class of each LifePath Dynamic Fund:
| | | | | | | | | | | | | | | | | | | | | | | | |
| | | Institutional | | | Investor A | | | Investor C | | | Class K | | | Class R | | | Total | |
LifePath Dynamic 2025 Fund | | $ | 8,411 | | | $ | 95,264 | | | $ | 11,358 | | | $ | 29,812 | | | $ | 15,986 | | | $ | 160,831 | |
LifePath Dynamic 2035 Fund | | | 11,086 | | | | 106,820 | | | | 12,211 | | | | 18,910 | | | | 13,385 | | | | 162,412 | |
LifePath Dynamic 2045 Fund | | | 14,002 | | | | 68,808 | | | | 6,702 | | | | 13,175 | | | | 10,768 | | | | 113,455 | |
LifePath Dynamic 2055 Fund | | | 9,206 | | | | 48,103 | | | | 4,133 | | | | 4,862 | | | | 4,628 | | | | 70,932 | |
LifePath Dynamic 2065 Fund | | | 244 | | | | 244 | | | | 278 | | | | 626 | | | | 209 | | | | 1,601 | |
Service and Distribution Fees: The Trust, on behalf of the LifePath Dynamic Funds, entered into a Distribution Agreement and a Distribution and Service Plan with BlackRock Investments, LLC (“BRIL”), an affiliate of the Administrator. Pursuant to the Distribution and Service Plan and in accordance with Rule12b-1 under the 1940 Act, each LifePath Dynamic Fund pays BRIL ongoing service and distribution fees. The fees are accrued daily and paid monthly at annual rates based upon the average daily net assets of the relevant share class of each LifePath Dynamic Fund as follows:
| | | | | | | | |
| | | Service Fees | | | Distribution Fees | |
Investor A | | | 0.25 | % | | | — | % |
Investor C | | | 0.25 | | | | 0.75 | |
Class R | | | 0.25 | | | | 0.25 | |
BRIL and broker-dealers, pursuant tosub-agreements with BRIL, provide shareholder servicing and distribution services to the LifePath Dynamic Funds. The ongoing service and/or distribution fee compensates BRIL and each broker-dealer for providing shareholder servicing and/or distribution related services to shareholders.
For the year ended December 31, 2019, the following table shows the class specific service and distribution fees borne directly by each share class of each LifePath Dynamic Fund:
| | | | | | | | | | | | | | | | |
| Service and Distribution Fees | | Investor A | | | Investor C | | | Class R | | | Total | |
LifePath Dynamic 2025 Fund | | $ | 68,062 | | | $ | 28,418 | | | $ | 26,796 | | | $ | 123,276 | |
LifePath Dynamic 2035 Fund | | | 76,304 | | | | 30,558 | | | | 22,457 | | | | 129,319 | |
LifePath Dynamic 2045 Fund | | | 49,182 | | | | 16,762 | | | | 18,009 | | | | 83,953 | |
LifePath Dynamic 2055 Fund | | | 34,399 | | | | 10,342 | | | | 7,788 | | | | 52,529 | |
LifePath Dynamic 2065 Fund | | | 174 | | | | 696 | | | | 348 | | | | 1,218 | |
Other Fees: For the year ended December 31, 2019, affiliates earned underwriting discounts, direct commissions and dealer concessions on sales of each LifePath Dynamic Fund’s Investor A Shares as follows:
| | | | | | | | | | | | | | | | | | | | |
| | | LifePath
Dynamic 2025 Fund | | | LifePath
Dynamic 2035 Fund | | | LifePath
Dynamic 2045 Fund | | | LifePath
Dynamic 2055 Fund | | | LifePath
Dynamic 2065 Fund | |
Investor A | | $ | 1,194 | | | $ | 308 | | | $ | 1,656 | | | $ | 578 | | | $ | — | |
| | | | |
| NOTESTO FINANCIAL STATEMENTS | | | 49 | |
Notes to Financial Statements (continued)
For the year ended December 31, 2019, affiliates received CDSCs as follows:
| | | | | | | | | | | | | | | | | | | | |
| | | LifePath
Dynamic 2025 Fund | | | LifePath
Dynamic 2035 Fund | | | LifePath
Dynamic 2045 Fund | | | LifePath
Dynamic 2055 Fund | | | LifePath
Dynamic 2065 Fund | |
Investor A | | $ | — | | | $ | 32 | | | $ | 427 | | | $ | — | | | $ | — | |
Investor C | | | 173 | | | | 188 | | | | 360 | | | | 19 | | | | — | |
Expense Waivers and Reimbursements:The fees and expenses of the Trust’s trustees who are not “interested persons” of the Trust, as defined in the 1940 Act (“Independent Trustees”), counsel to the Independent Trustees and the LifePath Dynamic Funds’ independent registered public accounting firm (together, the “independent expenses”) are paid directly by the LifePath Dynamic Funds. BAL has contractually agreed to reimburse the LifePath Dynamic Funds or provide an offsetting credit against the administration fees paid by the LifePath Dynamic Funds in an amount equal to these independent expenses through April 30, 2029. These amounts are included in fees waived and/or reimbursed by the Administrator/Manager in the Statements of Operations. For the year ended year ended December 31, 2019, the LifePath Dynamic Funds waived the following amounts:
| | | | | | | | | | | | | | | | | | | | |
| | | LifePath
Dynamic 2025 Fund | | | LifePath
Dynamic 2035 Fund | | | LifePath
Dynamic 2045 Fund | | | LifePath
Dynamic 2055 Fund | | | LifePath
Dynamic 2065 Fund | |
Amounts waived | | $ | 11,000 | | | $ | 11,000 | | | $ | 11,001 | | | $ | 11,000 | | | $ | 10,988 | |
Interfund Lending: In accordance with an exemptive order (the “Order”) from the SEC, each LifePath Dynamic Fund may participate in a joint lending and borrowing facility for temporary purposes (the “Interfund Lending Program”), subject to compliance with the terms and conditions of the Order, and to the extent permitted by each LifePath Dynamic Funds’ investment policies and restrictions. Each LifePath Dynamic Fund is currently permitted to borrow and lend under the Interfund Lending Program.
A lending BlackRock fund may lend in aggregate up to 15% of its net assets, but may not lend more than 5% of its net assets to any one borrowing fund through the Interfund Lending Program. A borrowing BlackRock fund may not borrow through the Interfund Lending Program or from any other source more than 33 1/3% of its total assets (or any lower threshold provided for by the fund’s investment restrictions). If a borrowing BlackRock fund’s total outstanding borrowings exceed 10% of its total assets, each of its outstanding interfund loans will be subject to collateralization of at least 102% of the outstanding principal value of the loan. All interfund loans are for temporary or emergency purposes and the interest rate to be charged will be the average of the highest current overnight repurchase agreement rate available to a lending fund and the bank loan rate, as calculated according to a formula established by the Board.
During the year ended December 31, 2019, the LifePath Dynamic Funds did not participate in the Interfund Lending Program.
Trustees and Officers: Certain trustees and/or officers of the Trust are directors and/or officers of BlackRock, Inc. or its affiliates.
The LifePath Dynamic Fund’s policyto comply with the requirements of the Internal Revenue Code of 1986, as amended, applicable to regulated investment companies, and to distribute substantially all of its taxable income to its shareholders. Therefore, no U.S. federal income tax provision is required.
Each LifePath Dynamic Fund files U.S. federal and various state and local tax returns. No income tax returns are currently under examination. Except for LifePath Dynamic 2065 Fund, the statute of limitations on each LifePath Dynamic Fund’s U.S. federal tax returns generally remains open for each of the four years ended December 31, 2019. The statute of limitations on LifePath Dynamic 2065 Fund’s U.S. federal tax returns generally remains open for the period ended December 31, 2019. The statutes of limitations on each LifePath Dynamic Fund’s state and local tax returns may remain open for an additional year depending upon the jurisdiction.
Management has analyzed tax laws and regulations and their application to the LifePath Dynamic Funds as of December 31, 2019, inclusive of the open tax return years, and does not believe that there are any uncertain tax positions that require recognition of a tax liability in the LifePath Dynamic Funds’ financial statements.
The tax character of distributions paid was as follows:
| | | | | | | | | | | | | | | | | | | | |
| | | LifePath
Dynamic 2025 Fund | | | LifePath
Dynamic 2035 Fund | | | LifePath
Dynamic 2045 Fund | | | LifePath
Dynamic 2055 Fund | | | LifePath
Dynamic 2065 Fund | |
Ordinary income | | | | | | | | | | | | | | | | | | | | |
12/31/19 | | $ | 1,696,885 | | | $ | 1,313,415 | | | $ | 816,299 | | | $ | 452,442 | | | $ | 25,979 | |
12/31/18 | | | 2,975,989 | (a) | | | 2,935,232 | (a) | | | 1,995,328 | | | | 1,044,261 | | | | — | |
Long-term capital gains | | | | | | | | | | | | | | | | | | | | |
12/31/19 | | | 1,643,581 | | | | 1,955,802 | | | | 1,507,012 | | | | 763,002 | | | | — | |
12/31/18 | | | 1,561,818 | | | | 1,736,862 | | | | 1,210,884 | | | | 645,338 | | | | — | |
| | | | | | | | | | | | | | | | | | | | |
Total | | | | | | | | | | | | | | | | | | | | |
12/31/19 | | $ | 3,340,466 | | | $ | 3,269,217 | | | $ | 2,323,311 | | | $ | 1,215,444 | | | $ | 25,979 | |
| | | | | | | | | | | | | | | | | | | | |
12/31/18 | | $ | 4,537,807 | | | $ | 4,672,094 | | | $ | 3,206,212 | | | $ | 1,689,599 | | | | — | |
| | | | | | | | | | | | | | | | | | | | |
| | (a) | Distribution amounts may include a portion of the proceeds from redeemed shares. | |
| | |
| 50 | | 2019 BLACKROCK ANNUAL REPORTTO SHAREHOLDERS |
Notes to Financial Statements (continued)
As of period end, the tax components of accumulated net earnings (losses) were as follows:
| | | | | | | | | | | | | | | | | | | | |
| | | LifePath
Dynamic 2025 Fund | | | LifePath
Dynamic 2035 Fund | | | LifePath
Dynamic 2045 Fund | | | LifePath
Dynamic 2055 Fund | | | LifePath
Dynamic 2065 Fund | |
Undistributed ordinary income | | $ | 281,279 | | | $ | 404,747 | | | $ | 317,357 | | | $ | 79,158 | | | $ | 4,394 | |
Undistributed long-term capital gains | | | 307,003 | | | | 374,136 | | | | 365,007 | | | | 269,418 | | | | — | |
Non-expiring Capital loss carryforwards(a) | | | — | | | | — | | | | — | | | | — | | | | (9,127 | ) |
Net unrealized gains (losses)(b) | | | 4,890,495 | | | | 5,749,757 | | | | 4,818,499 | | | | 2,667,833 | | | | 194,707 | |
| | | | | | | | | | | | | | | | | | | | |
| | $ | 5,478,777 | | | $ | 6,528,640 | | | $ | 5,500,863 | | | $ | 3,016,409 | | | $ | 189,974 | |
| | | | | | | | | | | | | | | | | | | | |
| | (a) | Amounts available to offset future realized capital gains. | |
| | (b) | The difference between book-basis andtax-basis net unrealized gains were attributable primarily to the timing and recognition of partnership income, the tax deferral of losses on wash sales and the realization for tax purposes of unrealized gains/losses on certain futures and foreign currency contracts. | |
| 6. | CAPITAL SHARE TRANSACTIONS |
Transactions in capital shares for each class were as follows:
| | | | | | | | | | | | | | | | |
| | | Year Ended
12/31/19 | | | Year Ended
12/31/18 | |
| LifePath Dynamic 2025 Fund | | Shares | | | Amount | | | Shares | | | Amount | |
Institutional | |
Shares sold | | | 145,686 | | | $ | 1,886,939 | | | | 489,610 | | | $ | 6,605,422 | |
Shares issued in reinvestment of distributions | | | 10,305 | | | | 137,716 | | | | 42,602 | | | | 558,096 | |
Shares redeemed | | | (68,009 | ) | | | (887,130 | ) | | | (1,818,550 | ) | | | (24,057,969 | ) |
| | | | | | | | | | | | | | | | |
Net increase (decrease) | | | 87,982 | | | $ | 1,137,525 | | | | (1,286,338 | ) | | $ | (16,894,451 | ) |
| | | | | | | | | | | | | | | | |
| | | | |
Investor A | | | | | | | | | | | | | | | | |
Shares sold | | | 450,949 | | | $ | 5,854,201 | | | | 440,495 | | | $ | 5,864,901 | |
Shares issued in reinvestment of distributions | | | 94,968 | | | | 1,256,631 | | | | 202,587 | | | | 2,457,256 | |
Shares redeemed | | | (1,010,908 | ) | | | (13,197,354 | ) | | | (750,728 | ) | | | (10,048,972 | ) |
| | | | | | | | | | | | | | | | |
Net decrease | | | (464,991 | ) | | $ | (6,086,522 | ) | | | (107,646 | ) | | $ | (1,726,815 | ) |
| | | | | | | | | | | | | | | | |
| | | | |
Investor C | | | | | | | | | | | | | | | | |
Shares sold | | | 78,990 | | | $ | 1,027,278 | | | | 63,587 | | | $ | 851,659 | |
Shares issued in reinvestment of distributions | | | 10,304 | | | | 135,798 | | | | 17,187 | | | | 205,438 | |
Shares redeemed | | | (39,874 | ) | | | (514,450 | ) | | | (63,741 | ) | | | (848,835 | ) |
| | | | | | | | | | | | | | | | |
Net increase | | | 49,420 | | | $ | 648,626 | | | | 17,033 | | | $ | 208,262 | |
| | | | | | | | | | | | | | | | |
| | | | |
Class K | | | | | | | | | | | | | | | | |
Shares sold | | | 2,102,462 | | | $ | 27,097,520 | | | | 255,977 | | | $ | 3,460,475 | |
Shares issued in reinvestment of distributions | | | 116,758 | | | | 1,545,874 | | | | 71,296 | | | | 863,497 | |
Shares redeemed | | | (432,577 | ) | | | (5,624,969 | ) | | | (138,864 | ) | | | (1,868,666 | ) |
| | | | | | | | | | | | | | | | |
Net increase | | | 1,786,643 | | | $ | 23,018,425 | | | | 188,409 | | | $ | 2,455,306 | |
| | | | | | | | | | | | | | | | |
| | | | |
Class R | | | | | | | | | | | | | | | | |
Shares sold | | | 363,664 | | | $ | 4,788,863 | | | | 135,645 | | | $ | 1,748,415 | |
Shares issued in reinvestment of distributions | | | 19,801 | | | | 261,740 | | | | 35,815 | | | | 430,247 | |
Shares redeemed | | | (398,789 | ) | | | (5,206,426 | ) | | | (62,477 | ) | | | (833,508 | ) |
| | | | | | | | | | | | | | | | |
Net increase (decrease) | | | (15,324 | ) | | $ | (155,823 | ) | | | 108,983 | | | $ | 1,345,154 | |
| | | | | | | | | | | | | | | | |
Total Net Increase (Decrease) | | | 1,443,730 | | | $ | 18,562,231 | | | | (1,079,559 | ) | | $ | (14,612,544 | ) |
| | | | | | | | | | | | | | | | |
| | | | |
| NOTESTO FINANCIAL STATEMENTS | | | 51 | |
Notes to Financial Statements (continued)
| | | | | | | | | | | | | | | | |
| | | Year Ended
12/31/19 | | | Year Ended
12/31/18 | |
| LifePath Dynamic 2035 Fund | | Shares | | | Amount | | | Shares | | | Amount | |
Institutional | |
Shares sold | | | 152,746 | | | $ | 2,104,437 | | | | 264,562 | | | $ | 3,852,104 | |
Shares issued in reinvestment of distributions | | | 13,570 | | | | 193,338 | | | | 34,223 | | | | 461,900 | |
Shares redeemed | | | (69,828 | ) | | | (967,536 | ) | | | (873,258 | ) | | | (12,371,104 | ) |
| | | | | | | | | | | | | | | | |
Net increase (decrease) | | | 96,488 | | | $ | 1,330,239 | | | | (574,473 | ) | | $ | (8,057,100 | ) |
| | | | | | | | | | | | | | | | |
| | | | |
Investor A | | | | | | | | | | | | | | | | |
Shares sold | | | 445,966 | | | $ | 6,179,054 | | | | 341,803 | | | $ | 4,898,137 | |
Shares issued in reinvestment of distributions | | | 103,630 | | | | 1,468,415 | | | | 232,227 | | | | 2,937,697 | |
Shares redeemed | | | (844,234 | ) | | | (11,720,338 | ) | | | (490,579 | ) | | | (6,976,676 | ) |
| | | | | | | | | | | | | | | | |
Net increase (decrease) | | | (294,638 | ) | | $ | (4,072,869 | ) | | | 83,451 | | | $ | 859,158 | |
| | | | | | | | | | | | | | | | |
| | | | |
Investor C | | | | | | | | | | | | | | | | |
Shares sold | | | 62,286 | | | $ | 841,570 | | | | 78,177 | | | $ | 1,111,289 | |
Shares issued in reinvestment of distributions | | | 9,307 | | | | 130,917 | | | | 20,065 | | | | 248,781 | |
Shares redeemed | | | (63,644 | ) | | | (872,735 | ) | | | (51,344 | ) | | | (730,860 | ) |
| | | | | | | | | | | | | | | | |
Net increase | | | 7,949 | | | $ | 99,752 | | | | 46,898 | | | $ | 629,210 | |
| | | | | | | | | | | | | | | | |
| | | | |
Class K | | | | | | | | | | | | | | | | |
Shares sold | | | 1,464,322 | | | $ | 20,534,910 | | | | 124,283 | | | $ | 1,822,958 | |
Shares issued in reinvestment of distributions | | | 84,177 | | | | 1,218,744 | | | | 54,096 | | | | 696,327 | |
Shares redeemed | | | (176,844 | ) | | | (2,480,509 | ) | | | (42,967 | ) | | | (621,229 | ) |
| | | | | | | | | | | | | | | | |
Net increase | | | 1,371,655 | | | $ | 19,273,145 | | | | 135,412 | | | $ | 1,898,056 | |
| | | | | | | | | | | | | | | | |
| | | | |
Class R | | | | | | | | | | | | | | | | |
Shares sold | | | 387,779 | | | $ | 5,403,856 | | | | 59,883 | | | $ | 858,849 | |
Shares issued in reinvestment of distributions | | | 17,770 | | | | 251,907 | | | | 25,185 | | | | 317,943 | |
Shares redeemed | | | (274,592 | ) | | | (3,784,365 | ) | | | (88,925 | ) | | | (1,283,757 | ) |
| | | | | | | | | | | | | | | | |
Net increase (decrease) | | | 130,957 | | | $ | 1,871,398 | | | | (3,857 | ) | | $ | (106,965 | ) |
| | | | | | | | | | | | | | | | |
Total Net Increase (Decrease) | | | 1,312,411 | | | $ | 18,501,665 | | | | (312,569 | ) | | $ | (4,777,641 | ) |
| | | | | | | | | | | | | | | | |
| | | Year Ended
12/31/19 | | | Year Ended
12/31/18 | |
| LifePath Dynamic 2045 Fund | | Shares | | | Amount | | | Shares | | | Amount | |
Institutional | |
Shares sold | | | 126,649 | | | $ | 1,801,837 | | | | 178,525 | | | $ | 2,736,810 | |
Shares issued in reinvestment of distributions | | | 14,884 | | | | 225,986 | | | | 32,974 | | | | 460,490 | |
Shares redeemed | | | (70,053 | ) | | | (1,017,500 | ) | | | (515,232 | ) | | | (7,743,615 | ) |
| | | | | | | | | | | | | | | | |
Net increase (decrease) | | | 71,480 | | | $ | 1,010,323 | | | | (303,733 | ) | | $ | (4,546,315 | ) |
| | | | | | | | | | | | | | | | |
| | | | |
Investor A | | | | | | | | | | | | | | | | |
Shares sold | | | 255,882 | | | $ | 3,710,591 | | | | 261,383 | | | $ | 3,961,941 | |
Shares issued in reinvestment of distributions | | | 61,642 | | | | 933,153 | | | | 136,045 | | | | 1,819,866 | |
Shares redeemed | | | (480,543 | ) | | | (7,046,358 | ) | | | (311,698 | ) | | | (4,780,156 | ) |
| | | | | | | | | | | | | | | | |
Net increase (decrease) | | | (163,019 | ) | | $ | (2,402,614 | ) | | | 85,730 | | | $ | 1,001,651 | |
| | | | | | | | | | | | | | | | |
| | | | |
Investor C | | | | | | | | | | | | | | | | |
Shares sold | | | 43,427 | | | $ | 623,790 | | | | 56,674 | | | $ | 858,315 | |
Shares issued in reinvestment of distributions | | | 4,748 | | | | 71,162 | | | | 11,223 | | | | 146,758 | |
Shares redeemed | | | (55,389 | ) | | | (795,393 | ) | | | (35,947 | ) | | | (544,148 | ) |
| | | | | | | | | | | | | | | | |
Net increase (decrease) | | | (7,214 | ) | | $ | (100,441 | ) | | | 31,950 | | | $ | 460,925 | |
| | | | | | | | | | | | | | | | |
| | | | |
Class K | | | | | | | | | | | | | | | | |
Shares sold | | | 1,066,982 | | | $ | 15,664,635 | | | | 139,803 | | | $ | 2,184,070 | |
Shares issued in reinvestment of distributions | | | 58,405 | | | | 900,712 | | | | 34,106 | | | | 461,838 | |
Shares redeemed | | | (119,834 | ) | | | (1,760,033 | ) | | | (44,264 | ) | | | (677,975 | ) |
| | | | | | | | | | | | | | | | |
Net increase | | | 1,005,553 | | | $ | 14,805,314 | | | | 129,645 | | | $ | 1,967,933 | |
| | | | | | | | | | | | | | | | |
| | | | |
Class R | | | | | | | | | | | | | | | | |
Shares sold | | | 172,411 | | | $ | 2,543,252 | | | | 61,622 | | | $ | 935,397 | |
Shares issued in reinvestment of distributions | | | 12,607 | | | | 190,657 | | | | 23,659 | | | | 314,270 | |
Shares redeemed | | | (167,375 | ) | | | (2,397,684 | ) | | | (31,151 | ) | | | (473,505 | ) |
| | | | | | | | | | | | | | | | |
Net increase | | | 17,643 | | | $ | 336,225 | | | | 54,130 | | | $ | 776,162 | |
| | | | | | | | | | | | | | | | |
Total Net Increase (Decrease) | | | 924,443 | | | $ | 13,648,807 | | | | (2,278 | ) | | $ | (339,644 | ) |
| | | | | | | | | | | | | | | | |
| | |
| 52 | | 2019 BLACKROCK ANNUAL REPORTTO SHAREHOLDERS |
Notes to Financial Statements (continued)
| | | | | | | | | | | | | | | | |
| | | Year Ended
12/31/19 | | | Year Ended
12/31/18 | |
| LifePath Dynamic 2055 Fund | | Shares | | | Amount | | | Shares | | | Amount | |
Institutional | |
Shares sold | | | 109,862 | | | $ | 1,655,918 | | | | 147,737 | | | $ | 2,339,289 | |
Shares issued in reinvestment of distributions | | | 9,887 | | | | 155,902 | | | | 17,583 | | | | 253,415 | |
Shares redeemed | | | (34,573 | ) | | | (519,889 | ) | | | (339,454 | ) | | | (5,267,062 | ) |
| | | | | | | | | | | | | | | | |
Net increase (decrease) | | | 85,176 | | | $ | 1,291,931 | | | | (174,134 | ) | | $ | (2,674,358 | ) |
| | | | | | | | | | | | | | | | |
| | | | |
Investor A | | | | | | | | | | | | | | | | |
Shares sold | | | 267,843 | | | $ | 4,016,695 | | | | 220,170 | | | $ | 3,454,479 | |
Shares issued in reinvestment of distributions | | | 39,725 | | | | 622,770 | | | | 79,904 | | | | 1,096,534 | |
Shares redeemed | | | (346,288 | ) | | | (5,263,361 | ) | | | (139,976 | ) | | | (2,183,477 | ) |
| | | | | | | | | | | | | | | | |
Net increase (decrease) | | | (38,720 | ) | | $ | (623,896 | ) | | | 160,098 | | | $ | 2,367,536 | |
| | | | | | | | | | | | | | | | |
| | | | |
Investor C | | | | | | | | | | | | | | | | |
Shares sold | | | 29,384 | | | $ | 437,909 | | | | 34,855 | | | $ | 540,249 | |
Shares issued in reinvestment of distributions | | | 2,994 | | | | 46,497 | | | | 5,620 | | | | 75,457 | |
Shares redeemed | | | (21,106 | ) | | | (315,539 | ) | | | (20,564 | ) | | | (314,579 | ) |
| | | | | | | | | | | | | | | | |
Net increase | | | 11,272 | | | $ | 168,867 | | | | 19,911 | | | $ | 301,127 | |
| | | | | | | | | | | | | | | | |
| | | | |
Class K | | | | | | | | | | | | | | | | |
Shares sold | | | 348,229 | | | $ | 5,361,096 | | | | 103,655 | | | $ | 1,663,652 | |
Shares issued in reinvestment of distributions | | | 18,491 | | | | 296,673 | | | | 12,891 | | | | 180,399 | |
Shares redeemed | | | (61,171 | ) | | | (932,877 | ) | | | (61,632 | ) | | | (991,964 | ) |
| | | | | | | | | | | | | | | | |
Net increase | | | 305,549 | | | $ | 4,724,892 | | | | 54,914 | | | $ | 852,087 | |
| | | | | | | | | | | | | | | | |
| | | | |
Class R | | | | | | | | | | | | | | | | |
Shares sold | | | 166,958 | | | $ | 2,553,228 | | | | 38,030 | | | $ | 593,449 | |
Shares issued in reinvestment of distributions | | | 5,785 | | | | 90,577 | | | | 5,706 | | | | 78,303 | |
Shares redeemed | | | (105,917 | ) | | | (1,614,313 | ) | | | (26,846 | ) | | | (413,928 | ) |
| | | | | | | | | | | | | | | | |
Net increase | | | 66,826 | | | $ | 1,029,492 | | | | 16,890 | | | $ | 257,824 | |
| | | | | | | | | | | | | | | | |
Total Net Increase | | | 430,103 | | | $ | 6,591,286 | | | | 77,679 | | | $ | 1,104,216 | |
| | | | | | | | | | | | | | | | |
| | | Period from
10/30/19 (a)
to 12/31/19 | | | | | | | |
| LifePath Dynamic 2065 Fund | | Shares | | | Amount | | | | | | | |
Institutional | | | | | | | | | |
Shares sold | | | 40,001 | | | $ | 400,010 | | | | | | | | | |
Shares issued in reinvestment of distributions | | | — | | | | — | | | | | | | | | |
Shares redeemed | | | (1 | ) | | | (10 | ) | | | | | | | | |
| | | | | | | | | | | | | | | | |
Net increase | | | 40,000 | | | $ | 400,000 | | | | | | | | | |
| | | | | | | | | | | | | | | | |
| | | | |
Investor A | | | | | | | | | | | | | | | | |
Shares sold | | | 40,001 | | | $ | 400,010 | | | | | | | | | |
Shares issued in reinvestment of distributions | | | — | | | | — | | | | | | | | | |
Shares redeemed | | | (1 | ) | | | (10 | ) | | | | | | | | |
| | | | | | | | | | | | | | | | |
Net increase | | | 40,000 | | | $ | 400,000 | | | | | | | | | |
| | | | | | | | | | | | | | | | |
| | | | |
Investor C | | | | | | | | | | | | | | | | |
Shares sold | | | 40,001 | | | $ | 400,010 | | | | | | | | | |
Shares issued in reinvestment of distributions | | | — | | | | — | | | | | | | | | |
Shares redeemed | | | (1 | ) | | | (10 | ) | | | | | | | | |
| | | | | | | | | | | | | | | | |
Net increase | | | 40,000 | | | $ | 400,000 | | | | | | | | | |
| | | | | | | | | | | | | | | | |
| | | | |
Class K | | | | | | | | | | | | | | | | |
Shares sold | | | 240,001 | | | $ | 2,400,010 | | | | | | | | | |
Shares issued in reinvestment of distributions | | | — | | | | — | | | | | | | | | |
Shares redeemed | | | (1 | ) | | | (10 | ) | | | | | | | | |
| | | | | | | | | | | | | | | | |
Net increase | | | 240,000 | | | $ | 2,400,000 | | | | | | | | | |
| | | | | | | | | | | | | | | | |
| | | | |
Class R | | | | | | | | | | | | | | | | |
Shares sold | | | 40,001 | | | $ | 400,010 | | | | | | | | | |
Shares issued in reinvestment of distributions | | | — | | | | — | | | | | | | | | |
Shares redeemed | | | (1 | ) | | | (10 | ) | | | | | | | | |
| | | | | | | | | | | | | | | | |
Net increase | | | 40,000 | | | $ | 400,000 | | | | | | | | | |
| | | | | | | | | | | | | | | | |
Total Net Increase | | | 400,000 | | | $ | 4,000,000 | | | | | | | | | |
| | | | | | | | | | | | | | | | |
| | (a) | Commencement of operations. | |
| | | | |
| NOTESTO FINANCIAL STATEMENTS | | | 53 | |
Notes to Financial Statements (continued)
As of December 31, 2019, shares of the LifePath Dynamic Funds owned by BlackRock HoldCo 2, Inc., an affiliate of the LifePath Dynamic Funds, were as follows:
| | | | | | | | |
| | | LifePath Dynamic 2045 Fund | | | LifePath Dynamic 2055 Fund | |
Institutional | | | — | | | | — | |
Investor A | | | — | | | | — | |
Investor C | | | — | | | | — | |
Class K | | | 2,003 | | | | 2,001 | |
Class R | | | — | | | | 2,000 | |
As of December 31, 2019, shares of the LifePath Dynamic Funds owned by BlackRock Financial Management, Inc., an affiliate of the LifePath Dynamic Funds, were as follows:
| | | | |
| | | LifePath Dynamic 2065 Fund | |
Institutional | | | 40,000 | |
Investor A | | | 40,000 | |
Investor C | | | 40,000 | |
Class K | | | 240,000 | |
Class R | | | 40,000 | |
Management has evaluated the impact of all subsequent events on the LifePath Dynamic Funds through the date the financial statements were issued and has determined that there were no subsequent events requiring adjustment or additional disclosure in the financial statements.
| | |
| 54 | | 2019 BLACKROCK ANNUAL REPORTTO SHAREHOLDERS |
| | |
| Report of Independent Registered Public Accounting Firm | | BlackRock Funds III |
To the Board of Trustees of
BlackRock Funds III and Shareholders of each of the five series listed in the table below
Opinions on the Financial Statements
We have audited the accompanying statements of assets and liabilities of each of the series listed in the table below (five of the series constituting BlackRock Funds III, hereafter collectively referred to as the “Funds”) as of December 31, 2019, the related statements of operations and of changes in net assets for each of the periods indicated in the table below, including the related notes, and the financial highlights for each of the periods indicated in the table below (collectively referred to as the “financial statements”). In our opinion, the financial statements present fairly, in all material respects, the financial position of each of the Funds as of December 31, 2019, the results of each of their operations, the changes in each of their net assets, and each of the financial highlights for each of the periods indicated in the table below, in conformity with accounting principles generally accepted in the United States of America.
| | | | | | |
| Fund | | Statement of operations | | Statement of changes in net assets | | Financial highlights |
BlackRock LifePath® Dynamic 2025 Fund BlackRock LifePath® Dynamic 2035 Fund BlackRock LifePath® Dynamic 2045 Fund BlackRock LifePath® Dynamic 2055 Fund | | For the year ended December 31, 2019 | | For the years ended December 31, 2019 and 2018 | | For the years ended December 31, 2019, 2018, 2017, 2016 and 2015 |
BlackRock LifePath® Dynamic 2065 Fund | | For the period October 30, 2019 (commencement of operations) through December 31, 2019 |
Basis for Opinions
These financial statements are the responsibility of the Funds’ management. Our responsibility is to express an opinion on the Funds’ financial statements based on our audits. We are a public accounting firm registered with the Public Company Accounting Oversight Board (United States) (“PCAOB”) and are required to be independent with respect to the Funds in accordance with the U.S. federal securities laws and the applicable rules and regulations of the Securities and Exchange Commission and the PCAOB.
We conducted our audits of these financial statements in accordance with the standards of the PCAOB. Those standards require that we plan and perform the audit to obtain reasonable assurance about whether the financial statements are free of material misstatement, whether due to error or fraud.
Our audits included performing procedures to assess the risks of material misstatement of the financial statements, whether due to error or fraud, and performing procedures that respond to those risks. Such procedures included examining, on a test basis, evidence regarding the amounts and disclosures in the financial statements. Our audits also included evaluating the accounting principles used and significant estimates made by management, as well as evaluating the overall presentation of the financial statements. Our procedures included confirmation of securities owned as of December 31, 2019 by correspondence with the administrator of the Master Portfolios. We believe that our audits provide a reasonable basis for our opinions.
/s/PricewaterhouseCoopers LLP
Philadelphia, Pennsylvania
February 27, 2020
We have served as the auditor of one or more BlackRock investment companies since 2000.
| | | | |
| REPORTOF INDEPENDENT REGISTERED PUBLIC ACCOUNTING FIRM | | | 55 | |
Important Tax Information (unaudited)
The following information is provided with respect to the ordinary income distributions paid during the taxable year ended December 31, 2019:
| | | | | | | | | | | | | | | | | | | | | | |
| | | Payable Date | | LifePath
Dynamic
2025
Fund | | | LifePath
Dynamic
2035
Fund | | | LifePath
Dynamic
2045
Fund | | | LifePath
Dynamic
2055
Fund | | | LifePath
Dynamic
2065
Fund | |
Qualified Dividend Income for Individuals(a) | | Quarterly | | | 34.81 | % | | | 58.53 | % | | | 79.55 | % | | | 85.78 | % | | | 82.83 | % |
Qualified Business Income(a) | | Quarterly | | | 2.17 | | | | 5.55 | | | | 8.61 | | | | 9.09 | | | | — | |
Dividends Qualifying for the Dividend Received Deduction for
Corporations(a) | | Quarterly | | | 10.81 | | | | 17.57 | | | | 22.75 | | | | 24.93 | | | | 16.89 | |
Federal Obligation Interest(b) | | Quarterly | | | 5.27 | | | | 4.65 | | | | 4.39 | | | | 4.25 | | | | 0.74 | |
Interest-Related Dividends and Qualified Short-Term Capital Gains for Non-U.S. Residents(c) | | Quarterly | | | 58.00 | | | | 29.67 | | | | 12.17 | | | | 10.86 | | | | 1.71 | |
| | (a) | The LifePath Dynamic Funds hereby designate the percentage indicated above or the maximum amount allowable by law. | |
| | (b) | The law varies in each state as to whether and what percentage of dividend income attributable to federal obligations is exempt from state income tax. We recommend that you consult your tax advisor to determine if any portion of the dividends you received is exempt from state income taxes. | |
| | (c) | Represents the portion of the taxable ordinary income dividends eligible for exemption from U.S. withholding tax for nonresident aliens and foreign corporations. | |
Additionally, the LifePath Dynamic Funds distributed long-term capital gains per share to shareholders of record as follows:
| | | | | | | | | | | | | | | | | | |
| | | Record Date | | LifePath
Dynamic
2025
Fund | | | LifePath
Dynamic
2035
Fund | | | LifePath
Dynamic
2045
Fund | | | LifePath
Dynamic
2055
Fund | |
Long-Term Capital Gains Per Share | | 12/30/2019 | | $ | 0.313971 | | | $ | 0.415922 | | | $ | 0.475882 | | | $ | 0.455113 | |
| | |
| 56 | | 2019 BLACKROCK ANNUAL REPORTTO SHAREHOLDERS |
Master Portfolio Information as of December 31, 2019
LifePath® Dynamic 2025 Master Portfolio
PORTFOLIO COMPOSITION
| | | | |
| Asset Type | | Percent of
Net Assets | |
Equity Funds | | | 52 | % |
Fixed Income Funds | | | 43 | |
Short-Term Securities | | | 12 | |
Liabilities in Excess of Other Assets | | | (7 | ) |
TEN LARGEST HOLDINGS
| | | | |
| Holdings | | Percent of
Net Assets | |
Active Stock Master Portfolio | | | 31 | % |
CoreAlpha Bond Master Portfolio | | | 30 | |
International Tilts Master Portfolio | | | 8 | |
iShares TIPS Bond ETF | | | 7 | |
Master Total Return Portfolio | | | 6 | |
BlackRock Advantage Emerging Markets Fund — Class K | | | 5 | |
BlackRock Tactical Opportunities Fund — Class K | | | 3 | |
iShares Developed Real Estate Index Fund — Class K | | | 2 | |
iShares MSCI EAFESmall-Cap ETF | | | 2 | |
LifePath® Dynamic 2035 Master Portfolio
PORTFOLIO COMPOSITION
| | | | |
| Asset Type | | Percent of
Net Assets | |
Equity Funds | | | 73 | % |
Fixed Income Funds | | | 21 | |
Short-Term Securities | | | 12 | |
Liabilities in Excess of Other Assets | | | (6 | ) |
TEN LARGEST HOLDINGS
| | | | |
| Holdings | | Percent of
Net Assets | |
Active Stock Master Portfolio | | | 42 | % |
CoreAlpha Bond Master Portfolio | | | 13 | |
International Tilts Master Portfolio | | | 13 | |
BlackRock Advantage Emerging Markets Fund — Class K | | | 8 | |
iShares TIPS Bond ETF | | | 5 | |
iShares Developed Real Estate Index Fund — Class K | | | 4 | |
BlackRock Tactical Opportunities Fund — Class K | | | 3 | |
iShares MSCI EAFESmall-Cap ETF | | | 3 | |
Master Total Return Portfolio | | | 2 | |
LifePath® Dynamic 2045 Master Portfolio
PORTFOLIO COMPOSITION
| | | | |
| Asset Type | | Percent of Net Assets | |
Equity Funds | | | 87 | % |
Short-Term Securities | | | 11 | |
Fixed Income Funds | | | 4 | |
Liabilities in Excess of Other Assets | | | (2 | ) |
TEN LARGEST HOLDINGS
| | | | |
| Holdings | | Percent of Net Assets | |
Active Stock Master Portfolio | | | 51 | % |
International Tilts Master Portfolio | | | 17 | |
BlackRock Advantage Emerging Markets Fund — Class K | | | 10 | |
iShares Developed Real Estate Index Fund — Class K | | | 4 | |
iShares MSCI EAFESmall-Cap ETF | | | 4 | |
CoreAlpha Bond Master Portfolio | | | 2 | |
iShares TIPS Bond ETF | | | 1 | |
BlackRock Tactical Opportunities Fund — Class K | | | 1 | |
Master Total Return Portfolio | | | 1 | |
The LifePath® Dynamic Master Portfolios’ allocations and holdings listed above are current as of the report date. However, the LifePath® Dynamic Master Portfolios are regularly monitored and their composition may vary throughout various periods.
| | | | |
| MASTER PORTFOLIO INFORMATION | | | 57 | |
Master Portfolio Information as of December 31, 2019(continued)
LifePath® Dynamic 2055 Master Portfolio
PORTFOLIO COMPOSITION
| | | | |
| Asset Type | | Percent of
Net Assets | |
Equity Funds | | | 89 | % |
Short-Term Securities | | | 10 | |
Fixed Income Funds | | | 1 | |
TEN LARGEST HOLDINGS
| | | | |
| Holdings | | Percent of
Net Assets | |
Active Stock Master Portfolio | | | 52 | % |
International Tilts Master Portfolio | | | 18 | |
BlackRock Advantage Emerging Markets Fund — Class K | | | 10 | |
iShares Developed Real Estate Index Fund — Class K | |
| 5
|
|
iShares MSCI EAFESmall-Cap ETF | | | 4 | |
CoreAlpha Bond Master Portfolio | | | 1 | |
LifePath® Dynamic 2065 Master Portfolio
PORTFOLIO COMPOSITION
| | | | |
| Asset Type | | Percent of
Total Net Assets | |
Equity Funds | | | 94 | % |
Short-Term Securities | | | 9 | |
Fixed Income Funds | | | 1 | |
Liabilities in Excess of Other Assets | | | (4 | ) |
TEN LARGEST HOLDINGS
| | | | |
| Holdings | | Percent of
Total Net Assets | |
Active Stock Master Portfolio | | | 52 | % |
International Tilts Master Portfolio | | | 19 | |
BlackRock Advantage Emerging Markets Fund — Class K | | | 10 | |
iShares Developed Real Estate Index Fund — Class K | | | 5 | |
iShares MSCI EAFESmall-Cap ETF | | | 4 | |
iShares MSCI Canada ETF | | | 3 | |
iShares Russell 2000 ETF | | | 2 | |
CoreAlpha Bond Master Portfolio | | | 1 | |
The LifePath® Dynamic Master Portfolios’ allocations and holdings listed above are current as of the report date. However, the LifePath® Dynamic Master Portfolios are regularly monitored and their composition may vary throughout various periods.
| | |
| 58 | | 2019 BLACKROCK ANNUAL REPORTTO SHAREHOLDERS |
| | |
Schedule of Investments December 31, 2019 | | LifePath® Dynamic 2025 Master Portfolio (Percentages shown are based on Net Assets) |
| | | | | | | | |
| Security | | Shares/
Investment
Value | | | Value | |
|
Affiliated Investment Companies(d) — 107.1% | |
|
Equity Funds — 51.8% | |
Active Stock Master Portfolio | | $ | 21,308,306 | | | $ | 21,308,306 | |
BlackRock Advantage Emerging Markets Fund — Class K | | | 324,716 | | | | 3,542,655 | |
BlackRock Tactical Opportunities Fund — Class K | | | 161,827 | | | | 2,173,336 | |
International Tilts Master Portfolio | | $ | 5,807,694 | | | | 5,807,694 | |
iShares Developed Real Estate Index Fund — Class K | | | 157,568 | | | | 1,730,092 | |
iShares MSCI EAFESmall-Cap ETF(a) | | | 22,178 | | | | 1,381,246 | |
| | | | | | | | |
| | | | 35,943,329 | |
|
| Fixed Income Funds — 43.3% | |
CoreAlpha Bond Master Portfolio | | $ | 20,975,583 | | | | 20,975,583 | |
iShares TIPS Bond ETF | | | 44,433 | | | | 5,179,555 | |
Master Total Return Portfolio | | $ | 3,944,897 | | | | 3,944,897 | |
| | | | | | | | |
| | | | 30,100,035 | |
| | | | | | | | |
| Security | | Shares/
Investment
Value | | | Value | |
|
| Short-Term Securities — 12.0% | |
BlackRock Cash Funds: Institutional, | | | | | | | | |
SL Agency Shares,
1.87%(b)(c) | | $ | 972,906 | | | $ | 973,295 | |
BlackRock Cash Funds: Treasury, | | | | | | | | |
SL Agency Shares,
1.55%(b) | | | 7,339,296 | | | | 7,339,296 | |
| | | | | | | | |
| | | | 8,312,591 | |
| | | | | | | | |
| |
Total Affiliated Investment Companies — 107.1%
(Cost — $69,256,257) | | | | 74,355,955 | |
| | | | | | | | |
| |
Liabilities in Excess of Other Assets — (7.1) % | | | | (4,932,786 | ) |
| | | | | | | | |
| |
Net Assets — 100.0% | | | $ | 69,423,169 | |
| | | | | | | | |
| (a) | Security, or a portion of the security, is on loan. |
| (b) | Annualized7-day yield as of period end. |
| (c) | All portion of the security was purchased with the cash collateral from loaned securities. |
| (d) | During the year ended December 31, 2019, investments in issuers considered to be an affiliate/affiliates of the LifePath Dynamic Master Portfolio for purposes of Section 2(a)(3) of the Investment Company Act of 1940, as amended, and/or related parties of the LifePath Dynamic Master Portfolio were as follows: |
| | | | | | | | | | | | | | | | | | | | | | | | | | | | | | | | |
| Affiliated Persons and/or Related Parties | | Shares/
Investment
Value Held at
12/31/18 | | | Shares/
Investment Value
Purchased | | | Shares/
Investment
Value Sold | | | Shares/
Investment
Value Held at
12/31/19 | | | Value at
12/31/19 | | |
Income | | | Net
Realized
Gain (Loss) (a) | | | Change in
Unrealized
Appreciation
(Depreciation) | |
Active Stock Master Portfolio(b) | | $ | 13,605,797 | | | $ | 7,702,509 | | | $ | — | | | $ | 21,308,306 | | | $ | 21,308,306 | | | $ | 311,616 | | | $ | 1,681,222 | | | $ | 3,010,406 | |
BlackRock Advantage Emerging Markets Fund — Class K | | | 223,206 | | | | 168,306 | | | | (66,796 | ) | | | 324,716 | | | | 3,542,655 | | | | 80,960 | | | | (41,795 | ) | | | 454,136 | |
BlackRock Cash Funds: Institutional,
SL Agency Shares(b) | | | 951,508 | | | | 21,398 | | | | — | | | | 972,906 | | | | 973,295 | | | | 3,370 | (c) | | | 393 | | | | — | |
BlackRock Cash Funds: Treasury, SL Agency Shares(b) | | | 1,351,614 | | | | 5,987,682 | | | | — | | | | 7,339,296 | | | | 7,339,296 | | | | 56,572 | | | | — | | | | — | |
BlackRock Tactical Opportunities Fund — Class K | | | 105,669 | | | | 76,152 | | | | (19,994 | ) | | | 161,827 | | | | 2,173,336 | | | | 71,081 | | | | (283 | ) | | | (40,493 | ) |
CoreAlpha Bond Master Portfolio(b) | | $ | 13,093,963 | | | $ | 7,881,620 | | | $ | — | | | $ | 20,975,583 | | | | 20,975,583 | | | | 481,149 | | | | 333,707 | | | | (253,642 | ) |
International Tilts Master Portfolio(b) | | $ | 4,077,323 | | | $ | 1,730,371 | | | $ | — | | | $ | 5,807,694 | | | | 5,807,694 | | | | 170,723 | | | | 150,818 | | | | 1,305,468 | |
iShares Developed Real Estate Index Fund — Class K | | | — | | | | 195,284 | | | | (37,716 | ) | | | 157,568 | | | | 1,730,092 | | | | 73,751 | | | | (772 | ) | | | (38,892 | ) |
iShares Edge MSCI Multifactor International ETF(d) | | | 35,488 | | | | 7,882 | | | | (43,370 | ) | | | — | | | | — | | | | 16,739 | | | | 109,108 | | | | (37,132 | ) |
iShares Edge MSCI Multifactor USA ETF(d) | | | 17,069 | | | | 15,710 | | | | (32,779 | ) | | | — | | | | — | | | | 8,034 | | | | 90,615 | | | | (22,379 | ) |
iShares International Developed Real Estate ETF(d) | | | — | | | | 12,690 | | | | (12,690 | ) | | | — | | | | — | | | | 2,056 | | | | (2,306 | ) | | | — | |
iShares MSCI EAFESmall-Cap ETF | | | 17,282 | | | | 5,713 | | | | (817 | ) | | | 22,178 | | | | 1,381,246 | | | | 46,113 | | | | (4,280 | ) | | | 215,555 | |
iShares TIPS Bond ETF | | | 23,792 | | | | 24,643 | | | | (4,002 | ) | | | 44,433 | | | | 5,179,555 | | | | 68,623 | | | | 5,327 | | | | 208,431 | |
iShares U.S. Real Estate ETF(d) | | | — | | | | 6,737 | | | | (6,737 | ) | | | — | | | | — | | | | — | | | | (605 | ) | | | — | |
Master Total Return Portfolio(b) | | $ | 2,398,817 | | | $ | 1,546,080 | | | $ | — | | | $ | 3,944,897 | | | | 3,944,897 | | | | 143,280 | | | | 96,452 | | | | 169,859 | |
| | | | | | | | | | | | | | | | | | | | | | | | | | | | | | | | |
| | | $ | 74,355,955 | | | $ | 1,534,067 | | | $ | 2,417,601 | | | $ | 4,971,317 | |
| | | | | | | | | | | | | | | | | |
| | (a) | Includes net capital gain distributions, if applicable. | |
| | (b) | Represents net shares/investment value purchased (sold). | |
| | (c) | Represents securities lending income earned from the reinvestment of cash collateral from loaned securities, net of fees and collateral investment expenses, and other payments to and from borrowers of securities. | |
| | (d) | As of period end, the entity is no longer held by the LifePath Dynamic Master Portfolio. | |
| | | | |
| SCHEDULES OF INVESTMENTS | | | 59 | |
| | |
Schedule of Investments (continued) December 31, 2019 | | LifePath® Dynamic 2025 Master Portfolio |
Derivative Financial Instruments Outstanding as of Period End
Futures Contracts
| | | | | | | | | | | | | | | | |
| Description | | Number of
Contracts | | | Expiration
Date | | | Notional
Amount (000) | | | Value/
Unrealized
Appreciation
(Depreciation) | |
Long Contracts | |
S&P/TSX 60 Index | | | 6 | | | | 03/19/20 | | | $ | 936 | | | $ | 4,486 | |
E-Mini MSCI EAFE Index | | | 21 | | | | 03/20/20 | | | | 2,138 | | | | 56,946 | |
Russell 2000E-Mini Index | | | 26 | | | | 03/20/20 | | | | 2,172 | | | | 44,678 | |
S&P 500E-Mini Index | | | 3 | | | | 03/20/20 | | | | 485 | | | | 13,856 | |
| | | | | | | | | | | | | | | | |
| | | | | | | | | | | | | | | 119,966 | |
| | | | | | | | | | | | | | | | |
Short Contracts | |
U.S. Treasury Ultra Bond | | | 4 | | | | 03/20/20 | | | | 727 | | | | 23,368 | |
| | | | | | | | | | | | | | | | |
| | | | | | | $ | 143,334 | |
| | | | | | | | | |
| | | | | | | | | | | | | | | | | | | | |
Forward Foreign Currency Exchange Contracts | |
Currency
Purchased | | | Currency
Sold | | | Counterparty | | Settlement Date | | | Unrealized
Appreciation
(Depreciation) | |
| CAD | | | 977,113 | | | USD | | | 737,140 | | | Morgan Stanley & Co. International PLC | | | 03/18/20 | | | $ | 15,525 | |
| EUR | | | 300,000 | | | USD | | | 334,702 | | | Bank of America N.A. | | | 03/18/20 | | | | 3,389 | |
| EUR | | | 3,136,903 | | | USD | | | 3,495,984 | | | Bank of America N.A. | | | 03/18/20 | | | | 39,206 | |
| | | | | | | | | | | | | | | | | | | | |
| | | Net unrealized appreciation | | | | 58,120 | |
| | | | | | | | | | | | | | | | | | | | |
Derivative Financial Instruments Categorized by Risk Exposure
As of period end, the fair values of derivative financial instruments located in the Statements of Assets and Liabilities were as follows:
| | | | | | | | | | | | | | | | | | | | | | | | | | | | |
| | | Commodity
Contracts | | | Credit
Contracts | | | Equity
Contracts | | | Foreign
Currency
Exchange
Contracts | | | Interest
Rate
Contracts | | | Other
Contracts | | | Total | |
Assets — Derivative Financial Instruments | | | | | | | | | | | | | | | | | | | | | | | | | | | | |
Future contracts | | | | | | | | | | | | | | | | | | | | | | | | | | | | |
Unrealized appreciation on future contracts(a) | | $ | — | | | $ | — | | | $ | 119,966 | | | $ | — | | | $ | 23,368 | | | $ | — | | | $ | 143,334 | |
Forward foreign currency exchange contracts | | | | | | | | | | | | | | | | | | | | | | | | | | | | |
Unrealized appreciation on forward foreign currency exchange contracts | | | — | | | | — | | | | — | | | | 58,120 | | | | — | | | | — | | | | 58,120 | |
| | | | | | | | | | | | | | | | | | | | | | | | | | | | |
| | $ | — | | | $ | — | | | $ | 119,966 | | | $ | 58,120 | | | $ | 23,368 | | | $— | | | | $ | 201,454 | |
| | | | | | | | | | | | | | | | | | | | | | | | | | | | |
| | (a) | Net cumulative unrealized appreciation (depreciation) on futures contracts and centrally cleared swaps, if any, are reported in the Schedule of Investments. In the Statements of Assets and Liabilities, only current day’s variation margin is reported in receivables or payables and the net cumulative unrealized appreciation (depreciation) is included in accumulated earnings (loss). | |
| | |
| 60 | | 2019 BLACKROCK ANNUAL REPORTTO SHAREHOLDERS |
| | |
Schedule of Investments (continued) December 31, 2019 | | LifePath® Dynamic 2025 Master Portfolio |
For the year ended December 31, 2019, the effect of derivative financial instruments in the Statements of Operations was as follows:
| | | | | | | | | | | | | | | | | | | | | | | | | | | | |
| | | Commodity
Contracts | | | Credit
Contracts | | | Equity
Contracts | | | Foreign
Currency
Exchange
Contracts | | | Interest
Rate
Contracts | | | Other
Contracts | | | Total | |
Net Realized Gain (Loss) from: | | | | | | | | | | | | | | | | | | | | | | | | | | | | |
Futures contracts | | $ | — | | | $ | — | | | $ | 677,639 | | | $ | — | | | $ | (23,220) | | | $ | — | | | $ | 654,419 | |
Forward foreign currency exchange contracts | | | — | | | | — | | | | — | | | | (174,870 | ) | | | — | | | | — | | | | (174,870 | ) |
| | | | | | | | | | | | | | | | | | | | | | | | | | | | |
| | $ | — | | | $ | — | | | $ | 677,639 | | | $ | (174,870) | | | $ | (23,220) | | | $ | — | | | $ | 479,549 | |
| | | | | | | | | | | | | | | | | | | | | | | | | | | | |
Net Change in Unrealized Appreciation (Depreciation) on: | |
Futures contracts | | $ | — | | | $ | — | | | $ | 322,312 | | | $ | — | | | $ | 14,815 | | | $ | — | | | $ | 337,127 | |
Forward foreign currency exchange contracts | | | — | | | | — | | | | — | | | | 102,158 | | | | — | | | | — | | | | 102,158 | |
| | | | | | | | | | | | | | | | | | | | | | | | | | | | |
| | $ | — | | | $ | — | | | $ | 322,312 | | | $ | 102,158 | | | $ | 14,815 | | | $ | — | | | $ | 439,285 | |
| | | | | | | | | | | | | | | | | | | | | | | | | | | | |
Average Quarterly Balances of Outstanding Derivative Financial Instruments
| | | | |
Futures contracts: | |
Average notional value of contracts — long | | $ | 6,039,458 | |
Average notional value of contracts — short | | $ | 1,696,930 | |
Forward foreign currency exchange contracts: | |
Average amounts purchased — in USD | | $ | 1,360,564 | |
Average amounts sold — in USD | | $ | 5,179,923 | |
For more information about the LifePath Dynamic Master Portfolio’s investment risks regarding derivative financial instruments, refer to the Notes to Financial Statements.
Derivative Financial Instruments — Offsetting as of Period End
The Fund’s derivative assets and liabilities (by type) were as follows:
| | | | | | | | |
| | | Assets | | | Liabilities | |
Derivative Financial Instruments: | | | | | | | | |
Futures contracts | | $ | 19,350 | | | $ | 1,571 | |
Forward foreign currency exchange contracts | | | 58,120 | | | | — | |
| | | | | | | | |
Total derivative assets and liabilities in the Statements of Assets and Liabilities | | $ | 77,470 | | | $ | 1,571 | |
Derivatives not subject to a Master Netting Agreement or similar agreement (“MNA”) | | | (19,350 | ) | | | (1,571 | ) |
| | | | | | | | |
Total derivative assets and liabilities subject to an MNA | | $ | 58,120 | | | $ | — | |
| | | | | | | | |
The following table presents the LifePath Dynamic Master Portfolio’s derivative assets by counterparty net of amounts available for offset under an MNA and net of the related collateral received by the LifePath Dynamic Master Portfolio:
| | | | | | | | | | | | | | | | | | | | |
| Counterparty | | Derivative
Assets
Subject to
an MNA by
Counterparty | | | Derivatives
Available
for Offset | | | Non-cash
Collateral
Received | | | Cash
Collateral
Received | | | Net Amount
of Derivative Assets (a)(b) | |
Bank of America N.A. | | $ | 42,595 | | | $ | — | | | $ | — | | | $ | — | | | $ | 42,595 | |
Morgan Stanley & Co. International PLC | | | 15,525 | | | | — | | | | — | | | | — | | | | 15,525 | |
| | | | | | | | | | | | | | | | | | | | |
| | $ | 58,120 | | | $ | — | | | $ | — | | | $ | — | | | $ | 58,120 | |
| | | | | | | | | | | | | | | | | | | | |
| | (a) | Net amount represents the net amount receivable from the counterparty in the event of default. | |
| | (b) | Net amount may also include forward foreign currency exchange contracts that are not required to be collateralized. | |
| | | | |
| SCHEDULES OF INVESTMENTS | | | 61 | |
| | |
Schedule of Investments (continued) December 31, 2019 | | LifePath® Dynamic 2025 Master Portfolio |
Fair Value Hierarchy as of Period End
Various inputs are used in determining the fair value of investments and derivative financial instruments. For information about the LifePath Dynamic Master Portfolio’s policy regarding valuation of investments and derivative financial instruments, refer to the Notes to Financial Statements.
The following tables summarize the LifePath Dynamic Master Portfolio’s investments and derivative financial instruments categorized in the disclosure hierarchy:
| | | | | | | | | | | | | | | | |
| | | Level 1 | | | Level 2 | | | Level 3 | | | Total | |
Assets: | | | | | | | | | | | | | | | | |
Investments: | | | | | | | | | | | | | | | | |
Affiliated Investment Companies | | | | | | | | | | | | | | | | |
Equity Funds | | $ | 8,827,329 | | | $ | — | | | $ | — | | | $ | 8,827,329 | |
Fixed Income Funds | | | 5,179,555 | | | | — | | | | — | | | | 5,179,555 | |
Short-Term Securities | | | 8,312,591 | | | | — | | | | — | | | | 8,312,591 | |
| | | | | | | | | | | | | | | | |
Subtotal | | $ | 22,319,475 | | | $ | — | | | $ | — | | | $ | 22,319,475 | |
| | | | | | | | | | | | | | | | |
Investments Valued at NAV(a) | | | | | | | | | | | | | | | 52,036,480 | |
| | | | | |
Total Investments | | | | | | | | | | | | | | $ | 74,355,955 | |
| | | | | | | | | | | | | | | | |
| | | | |
Derivative Financial Instruments (b) | | | | | | | | | | | | | | | | |
Assets: | | | | | | | | | | | | | | | | |
Equity contracts | | $ | 119,966 | | | $ | — | | | $ | — | | | $ | 119,966 | |
Forward foreign currency contracts | | | — | | | | 58,120 | | | | — | | | | 58,120 | |
Interest rate contracts | | | 23,368 | | | | — | | | | — | | | | 23,368 | |
| | | | | | | | | | | | | | | | |
| | $ | 143,334 | | | $ | 58,120 | | | $ | — | | | $ | 201,454 | |
| | | | | | | | | | | | | | | | |
| | (a) | Certain investments of the LifePath Dynamic Master Portfolio were fair valued using NAV per share or its equivalent as no quoted market value is available and therefore have been excluded from the fair value hierarchy. | |
| | (a) | Derivative financial instruments are futures contracts and forward foreign currency exchange contracts. Futures contracts and forward foreign currency exchange contracts are valued at the unrealized appreciation (depreciation) on the instrument. | |
See notes to financial statements.
| | |
| 62 | | 2019 BLACKROCK ANNUAL REPORTTO SHAREHOLDERS |
| | |
Schedule of Investments December 31, 2019 | | LifePath® Dynamic 2035 Master Portfolio (Percentages shown are based on Net Assets) |
| | | | | | | | |
| Security | | Shares/
Investment
Value | | | Value | |
|
Affiliated Investment Companies(d) — 105.6% | |
|
| Equity Funds — 72.9% | |
Active Stock Master Portfolio | | $ | 29,282,918 | | | $ | 29,282,918 | |
BlackRock Advantage Emerging Markets Fund — Class K | | | 495,913 | | | | 5,410,406 | |
BlackRock Tactical Opportunities Fund — Class K | | | 157,464 | | | | 2,114,741 | |
International Tilts Master Portfolio | | | 9,205,092 | | | | 9,205,092 | |
iShares Developed Real Estate Index Fund — Class K | | | 226,151 | | | | 2,483,142 | |
iShares MSCI EAFESmall-Cap ETF(a) | | | 33,451 | | | | 2,083,328 | |
| | | | | | | | |
| | | | | | | 50,579,627 | |
|
| Fixed Income Funds — 20.5% | |
CoreAlpha Bond Master Portfolio | | | 9,219,168 | | | | 9,219,168 | |
iShares TIPS Bond ETF(a) | | | 28,542 | | | | 3,327,141 | |
Master Total Return Portfolio | | | 1,698,948 | | | | 1,698,948 | |
| | | | | | | | |
| | | | | | | 14,245,257 | |
| | | | | | | | |
| Security | | Shares/
Investment
Value | | | Value | |
|
| Short-Term Securities — 12.2% | |
BlackRock Cash Funds: Institutional,
SL Agency Shares, | | | | | | | | |
1.87%(b)(c) | | $ | 2,150,636 | | | $ | 2,151,497 | |
BlackRock Cash Funds: Treasury,
SL Agency Shares, | | | | | | | | |
1.55%(c) | | | 6,296,905 | | | | 6,296,905 | |
| | | | | | | | |
| | | | | | | 8,448,402 | |
| | | | | | | | |
| |
Total Affiliated Investment Companies — 105.6%
(Cost — $67,208,366) | | | | 73,273,286 | |
| | | | | | | | |
| |
Liabilities in Excess of Other Assets — (5.6)% | | | | (3,890,929 | ) |
| | | | | |
| |
Net Assets — 100.0% | | | $ | 69,382,357 | |
| | | | | |
| (a) | Security, or a portion of the security, is on loan. |
| (b) | All or a portion of security was purchased with the cash collateral from loaned securities. |
| (c) | Annualized7-day yield as of period end. |
| (d) | During the year ended December 31, 2019, investments in issuers considered to be an affiliate/affiliates of the LifePath Dynamic Master Portfolio for purposes of Section 2(a)(3) of the Investment Company Act of 1940, as amended, and/or related parties of the LifePath Dynamic Master Portfolio were as follows: |
| | | | | | | | | | | | | | | | | | | | | | | | | | | | | | | | |
| Affiliated Persons and/or Related Parties | | Shares/
Investment
Value Held
at 12/31/18 | | | Shares/ Investment Value Purchased | | | Shares/ Investment Value Sold | | | Shares/ Investment
Value Held
at 12/31/19 | | | Value at
12/31/19 | | | Income | | | Net
Realized
Gain (Loss) (a) | | | Change in
Unrealized
Appreciation
(Depreciation) | |
Active Stock Master Portfolio(b) | | $ | 17,201,161 | | | $ | 12,081,757 | | | $ | — | | | $ | 29,282,918 | | | $ | 29,282,918 | | | $ | 396,428 | | | $ | 1,914,221 | | | $ | 3,700,668 | |
BlackRock Advantage Emerging Markets Fund-Class K | | | 288,485 | | | | 302,075 | | | | (94,647 | ) | | | 495,913 | | | | 5,410,406 | | | | 121,761 | | | | (63,131 | ) | | | 642,278 | |
BlackRock Cash Funds: Institutional,
SL Agency Shares(b) | | | 1,249,787 | | | | 900,849 | | | | — | | | | 2,150,636 | | | | 2,151,497 | | | | 4,770 | (c) | | | 544 | | | | (2 | ) |
BlackRock Cash Funds: Treasury, SL Agency Shares(b) | | | 467,926 | | | | 5,828,979 | | | | — | | | | 6,296,905 | | | | 6,296,905 | | | | 40,504 | | | | — | | | | — | |
BlackRock Tactical Opportunities Fund-Class K | | | 102,371 | | | | 60,735 | | | | (5,642 | ) | | | 157,464 | | | | 2,114,741 | | | | 68,072 | | | | 1,489 | | | | (37,924 | ) |
CoreAlpha Bond Master Portfolio(b) | | $ | 5,494,666 | | | $ | 3,724,502 | | | $ | — | | | $ | 9,219,168 | | | | 9,219,168 | | | | 196,282 | | | | 139,521 | | | | (224,024 | ) |
International Tilts Master Portfolio(b) | | $ | 5,050,546 | | | $ | 4,154,546 | | | $ | — | | | $ | 9,205,092 | | | | 9,205,092 | | | | 209,020 | | | | 194,543 | | | | 1,479,774 | |
iShares Developed Real Estate Index Fund-Class K | | | — | | | | 324,930 | | | | (98,779 | ) | | | 226,151 | | | | 2,483,142 | | | | 106,290 | | | | (239 | ) | | | (54,575 | ) |
iShares Edge MSCI Multifactor International ETF(d) | | | 48,587 | | | | 2,048 | | | | (50,635 | ) | | | — | | | | — | | | | 20,136 | | | | 114,833 | | | | (21,360 | ) |
iShares Edge MSCI Multifactor USA ETF(d) | | | 29,879 | | | | 3,411 | | | | (33,290 | ) | | | — | | | | — | | | | 10,959 | | | | 172,049 | | | | (45,389 | ) |
iShares International Developed Real Estate ETF(d) | | | — | | | | 21,494 | | | | (21,494 | ) | | | — | | | | — | | | | 3,582 | | | | (3,698 | ) | | | — | |
iShares MSCI Canada ETF(d) | | | 1,178 | | | | — | | | | (1,178 | ) | | | — | | | | — | | | | — | | | | (607 | ) | | | 4,244 | |
iShares MSCI EAFESmall-Cap ETF | | | 24,627 | | | | 13,777 | | | | (4,953 | ) | | | 33,451 | | | | 2,083,328 | | | | 65,577 | | | | (31,760 | ) | | | 331,220 | |
iShares TIPS Bond ETF | | | 10,594 | | | | 20,262 | | | | (2,314 | ) | | | 28,542 | | | | 3,327,141 | | | | 37,069 | | | | 2,768 | | | | 95,500 | |
iShares U.S. Real Estate ETF(d) | | | — | | | | 11,285 | | | | (11,285 | ) | | | — | | | | — | | | | — | | | | (1,013 | ) | | | — | |
Master Total Return Portfolio(b) | | $ | 1,266,978 | | | $ | 431,970 | | | $ | — | | | $ | 1,698,948 | | | | 1,698,948 | | | | 64,695 | | | | 45,336 | | | | 148,184 | |
| | | | | | | | | | | | | | | | | | | | | | | | | | | | | | | | |
| | | $ | 73,273,286 | | | $ | 1,345,145 | | | $ | 2,484,856 | | | $ | 6,018,594 | |
| | | | | | | | | | | | | | | | | |
| | (a) | Includes net capital gain distributions, if applicable. | |
| | (b) | Represents net shares/investment value purchased (sold). | |
| | (c) | Represents securities lending income earned from the reinvestment of cash collateral from loaned securities, net of fees and collateral investment expenses, and other payments to and from borrowers of securities. | |
| | (d) | As of period end, the entity is no longer held by the LifePath Dynamic Master Portfolio. | |
| | | | |
| SCHEDULES OF INVESTMENTS | | | 63 | |
| | |
Schedule of Investments (continued) December 31, 2019 | | LifePath® Dynamic 2035 Master Portfolio |
Derivative Financial Instruments Outstanding as of Period End
Futures Contracts
| | | | | | | | | | | | | | | | |
| Description | | Number of
Contracts | | | Expiration
Date | | | Notional
Amount (000) | | | Value/
Unrealized
Appreciation
(Depreciation) | |
Long Contracts | | | | | | | | | | | | | | | | |
S&P/TSX 60 Index | | | 9 | | | | 03/19/20 | | | $ | 1,403 | | | $ | 6,729 | |
E-Mini MSCI EAFE Index | | | 30 | | | | 03/20/20 | | | | 3,055 | | | | 73,201 | |
Russell 2000E-Mini Index | | | 20 | | | | 03/20/20 | | | | 1,671 | | | | 34,367 | |
S&P 500E-Mini Index | | | 3 | | | | 03/20/20 | | | | 485 | | | | 13,856 | |
| | | | | | | | | | | | | | | | |
| | | | | | | | | | | | | | | 128,153 | |
| | | | | | | | | | | | | | | | |
Short Contracts | | | | | | | | | | | | | | | | |
10-Year U.S. Treasury Note | | | 10 | | | | 03/20/20 | | | | 1,284 | | | | 11,158 | |
U.S. Treasury Ultra Bond | | | 4 | | | | 03/20/20 | | | | 727 | | | | 23,368 | |
| | | | | | | | | | | | | | | | |
| | | | | | | | | | | | | | | 34,526 | |
| | | | | | | | | | | | | | | | |
| | | | | | | | | | | | | | $ | 162,679 | |
| | | | | | | | | | | | | | | | |
Forward Foreign Currency Exchange Contracts
| | | | | | | | | | | | | | | | | | | | |
Currency
Purchased | | | Currency
Sold | | | Counterparty | | Settlement Date | | | Unrealized
Appreciation
(Depreciation) | |
| CAD | | | 1,628,104 | | | USD | | | 1,228,252 | | | Morgan Stanley & Co. International PLC | | | 03/18/20 | | | $ | 25,869 | |
| EUR | | | 350,000 | | | USD | | | 390,485 | | | Bank of America N.A. | | | 03/18/20 | | | | 3,954 | |
| EUR | | | 3,006,703 | | | USD | | | 3,350,880 | | | Bank of America N.A. | | | 03/18/20 | | | | 37,578 | |
| | | | | | | | | | | | | | | | | | | | |
Net unrealized appreciation | | | $ | 67,401 | |
| | | | | | | | |
Derivative Financial Instruments Categorized by Risk Exposure
As of period end, the fair values of derivative financial instruments located in the Statements of Assets and Liabilities were as follows:
| | | | | | | | | | | | | | | | | | | | | | | | | | | | |
| | | Commodity
Contracts | | | Credit
Contracts | | | Equity
Contracts | | | Foreign
Currency
Exchange
Contracts | | | Interest
Rate
Contracts | | | Other
Contracts | | | Total | |
Assets — Derivative Financial Instruments | | | | | | | | | | | | | | | | | | | | | | | | | | | | |
Futures contracts | | | | | | | | | | | | | | | | | | | | | | | | | | | | |
Unrealized appreciation on futures contracts(a) | | $ | — | | | $ | — | | | $ | 128,153 | | | $ | — | | | $ | 34,526 | | | $ | — | | | $ | 162,679 | |
Forward foreign currency exchange contracts | | | | | | | | | | | | | | | | | | | | | | | | | | | | |
Unrealized appreciation on forward foreign currency exchange contracts | | | — | | | | — | | | | — | | | | 67,401 | | | | — | | | | — | | | | 67,401 | |
| | | | | | | | | | | | | | | | | | | | | | | | | | | | |
| | $ | — | | | $ | — | | | $ | 128,153 | | | $ | 67,401 | | | $ | 34,526 | | | $ | — | | | $ | 230,080 | |
| | | | | | | | | | | | | | | | | | | | | | | | | | | | |
| | (a) | Net cumulative unrealized appreciation (depreciation) on futures contracts and centrally cleared swaps, if any, are reported in the Schedule of Investments. In the Statements of Assets and Liabilities, only current day’s variation margin is reported in receivables or payables and the net cumulative unrealized appreciation (depreciation) is included in accumulated earnings (loss). | |
| | |
| 64 | | 2019 BLACKROCK ANNUAL REPORTTO SHAREHOLDERS |
| | |
Schedule of Investments (continued) December 31, 2019 | | LifePath® Dynamic 2035 Master Portfolio |
Derivative Financial Instruments Categorized by Risk Exposure (continued)
For the year ended December 31, 2019, the effect of derivative financial instruments in the Statements of Operations was as follows:
| | | | | | | | | | | | | | | | | | | | | | | | | | | | |
| | | Commodity
Contracts | | | Credit
Contracts | | | Equity
Contracts | | | Foreign
Currency
Exchange
Contracts | | | Interest
Rate
Contracts | | | Other
Contracts | | | Total | |
Net Realized Gain (Loss) from: | | | | | | | | | | | | | | | | | | | | | | | | | | | | |
Futures contracts | | $ | — | | | $ | — | | | $ | 624,333 | | | $ | — | | | $ | 36,746 | | | $ | — | | | $ | 661,079 | |
Forward foreign currency exchange contracts | | | — | | | | — | | | | — | | | | (166,778 | ) | | | — | | | | | | | | (166,778 | ) |
| | | | | | | | | | | | | | | | | | | | | | | | | | | | |
| | $ | — | | | $ | — | | | $ | 624,333 | | | $ | (166,778 | ) | | $ | 36,746 | | | $ | — | | | $ | 494,301 | |
| | | | | | | | | | | | | | | | | | | | | | | | | | | | |
Net Change in Unrealized Appreciation (Depreciation) on: | |
Futures contracts | | $ | — | | | $ | — | | | $ | 295,717 | | | $ | — | | | $ | 11,718 | | | $ | — | | | $ | 307,435 | |
Forward foreign currency exchange contracts | | | — | | | | — | | | | — | | | | 119,883 | | | | — | | | | — | | | | 119,883 | |
| | | | | | | | | | | | | | | | | | | | | | | | | | | | |
| | $ | — | | | $ | — | | | $ | 295,717 | | | $ | 119,883 | | | $ | 11,718 | | | $ | — | | | $ | 427,318 | |
| | | | | | | | | | | | | | | | | | | | | | | | | | | | |
Average Quarterly Balances of Outstanding Derivative Financial Instruments
| | | | |
Futures contracts: | |
Average notional value of contracts — long | | $ | 6,519,532 | |
Average notional value of contracts — short | | $ | 2,022,672 | |
Forward foreign currency exchange contracts: | |
Average amounts purchased — in USD | | $ | 1,566,332 | |
Average amounts sold — in USD | | $ | 5,307,980 | |
For more information about the Fund’s investment risks regarding derivative financial instruments, refer to the Notes to Financial Statements.
Derivative Financial Instruments — Offsetting as of Period End
The Fund’s derivative assets and liabilities (by type) were as follows:
| | | | | | | | |
| | | Assets | | | Liabilities | |
Derivative Financial Instruments: | | | | | | | | |
Futures contracts | | $ | 22,828 | | | $ | 2,356 | |
Forward foreign currency exchange contracts | | | 67,401 | | | | — | |
| | | | | | | | |
Total derivative assets and liabilities in the Statements of Assets and Liabilities | | $ | 90,229 | | | $ | 2,356 | |
Derivatives not subject to a Master Netting Agreement or similar agreement (“MNA”) | | | (22,828 | ) | | | (2,356 | ) |
| | | | | | | | |
Total derivative assets and liabilities subject to an MNA | | $ | 67,401 | | | $ | — | |
| | | | | | | | |
The following table presents the Lifepath Dynamic Master Portfolio derivative assets by counterparty net of amounts available for offset under an MNA and net of the related collateral received by the Lifepath Dynamic Master Portfolio:
| | | | | | | | | | | | | | | | | | | | |
| Counterparty | | Derivative
Assets
Subject to
an MNA by
Counterparty | | | Derivatives
Available
for Offset | | | Non-cash
Collateral
Received | | | Cash
Collateral
Received | | | Net Amount
of Derivative
Assets (a)(b) | |
Bank of America N.A. | | $ | 41,532 | | | $ | — | | | $ | — | | | $ | — | | | $ | 41,532 | |
Morgan Stanley & Co. International PLC | | | 25,869 | | | | — | | | | — | | | | — | | | | 25,869 | |
| | | | | | | | | | | | | | | | | | | | |
| | $ | 67,401 | | | $ | — | | | $ | — | | | $ | — | | | $ | 67,401 | |
| | | | | | | | | | | | | | | | | | | | |
| | (a) | Net amount represents the net amount receivable from the counterparty in the event of default. | |
| | (b) | Net amount may also include forward foreign currency exchange contracts that are not required to be collateralized. | |
| | | | |
| SCHEDULES OF INVESTMENTS | | | 65 | |
| | |
Schedule of Investments (continued) December 31, 2019 | | LifePath® Dynamic 2035 Master Portfolio |
Fair Value Hierarchy as of Period End
Various inputs are used in determining the fair value of investments and derivative financial instruments. For information about the Lifepath Dynamic Master Portfolio’s policy regarding valuation of investments and derivative financial instruments, refer to the Notes to Financial Statements.
The following tables summarize the Lifepath Dynamic Master Portfolio’s investments and derivative financial instruments categorized in the disclosure hierarchy:
| | | | | | | | | | | | | | | | |
| | | Level 1 | | | Level 2 | | | Level 3 | | | Total | |
Assets: | |
Investments: | | | | | | | | | | | | | | | | |
Affiliated Investment Companies: | | | | | | | | | | | | | | | | |
Equity Funds | | $ | 12,091,617 | | | $ | — | | | $ | — | | | $ | 12,091,617 | |
Fixed Income Fund | | | 3,327,141 | | | | — | | | | — | | | | 3,327,141 | |
Short-Term Securities | | | 8,448,402 | | | | — | | | | — | | | | 8,448,402 | |
| | | | | | | | | | | | | | | | |
Subtotal | | $ | 23,867,160 | | | $ | — | | | $ | — | | | $ | 23,867,160 | |
| | | | | | | | | | | | | | | | |
Investments Valued at NAV(a) | | | | | | | | | | | | | | | 49,406,126 | |
| | | | | |
Total Investments | | | | | | | | | | | | | | $ | 73,273,286 | |
| | | | | | | | | | | | | | | | |
|
Derivative Financial Instruments (b) | |
Assets: | |
Forward foreign currency contracts | | $ | — | | | $ | 67,401 | | | $ | — | | | $ | 67,401 | |
Interest rate contracts | | | 34,526 | | | | — | | | | — | | | | 34,526 | |
Equity contracts | | | 128,153 | | | | — | | | | — | | | | 128,153 | |
| | | | | | | | | | | | | | | | |
| | $ | 162,679 | | | $ | 67,401 | | | $ | — | | | $ | 230,080 | |
| | | | | | | | | | | | | | | | |
| | (a) | Certain investments of the Lifepath Dynamic Master were fair valued using NAV per share or its equivalent as no quoted market value is available and therefore have been excluded from the fair value hierarchy. | |
| | (b) | Derivative financial instruments are futures contracts and forward foreign currency exchange contracts. Futures contracts and forward foreign currency exchange contracts are valued at the unrealized appreciation (depreciation) on the instrument. | |
See notes to financial statements.
| | |
| 66 | | 2019 BLACKROCK ANNUAL REPORTTO SHAREHOLDERS |
| | |
Schedule of Investments December 31, 2019 | | LifePath® Dynamic 2045 Master Portfolio (Percentages shown are based on Net Assets) |
| | | | | | | | |
| Security | | Shares/
Investment
Value | | | Value | |
|
Affiliated Investment Companies(d)— 101.2% | |
|
| Equity Funds — 86.7% | |
Active Stock Master Portfolio | | $ | 25,529,263 | | | $ | 25,529,263 | |
BlackRock Advantage Emerging Markets Fund — Class K | | | 453,125 | | | | 4,943,591 | |
BlackRock Tactical Opportunities Fund — Class K | | | 37,764 | | | | 507,176 | |
Master Total Return Portfolio | | $ | 19,004 | | | | 253,365 | |
International Tilts Master Portfolio | | $ | 8,495,927 | | | | 8,495,927 | |
iShares Developed Real Estate Index Fund — Class K | | | 199,993 | | | | 2,195,928 | |
iShares MSCI EAFESmall-Cap ETF(a) | | | 29,904 | | | | 1,862,421 | |
| | | | | | | | |
| | | | 43,787,671 | |
|
| Fixed Income Funds — 3.9% | |
CoreAlpha Bond Master Portfolio | | $ | 1,237,147 | | | | 1,237,147 | |
iShares TIPS Bond ETF(a) | | | 6,170 | | | | 719,237 | |
| | | | | | | | |
| | | | 1,956,384 | |
| | | | | | | | |
| Security | | Shares/
Investment
Value | | | Value | |
|
| Short-Term Securities — 10.6% | |
BlackRock Cash Funds: Institutional,
SL Agency Shares,
1.87%(b)(c) | | $ | 138,315 | | | $ | 138,370 | |
BlackRock Cash Funds: Treasury,
SL Agency Shares,
1.55%(b) | | | 5,240,686 | | | | 5,240,686 | |
| | | | | | | | |
| | | | 5,379,056 | |
| | | | | | | | |
| |
Total Affiliated Investment Companies — 101.2%
(Cost — $46,044,244) | | | | 51,123,111 | |
| |
Liabilities in Excess of Other Assets — (1.2)% | | | | (620,878 | ) |
| | | | | | | | |
| |
Net Assets — 100.0% | | | $ | 50,502,233 | |
| | | | | | | | |
| (a) | Security, or a portion of the security, is on loan. |
| (b) | Annualized7-day yield as of period end. |
| (c) | All or a portion of the security was purchased with the cash collateral from loaned securities. |
| (d) | During the year ended December 31, 2019, investments in issuers considered to be an affiliate/affiliates of the LifePath Dynamic Master Portfolio for purposes of Section 2(a)(3) of the Investment Company Act of 1940, as amended, and/or related parties of the LifePath Dynamic Master Portfolio were as follows: |
| | | | | | | | | | | | | | | | | | | | | | | | | | | | | | | | |
| Affiliated Persons and/or Related Parties | | Shares/
Investment
Value Held
at 12/31/18 | | | Shares/
Investment
Value
Purchased | | | Shares/
Investment
Value Sold | | | Shares/
Investment
Value Held
at 12/31/19 | | | Value at
12/31/19 | | | Income | | | Net
Realized
Gain (Loss) (a) | | | Change in
Unrealized
Appreciation
(Depreciation) | |
Active Stock Master Portfolio(b) | | $ | 14,311,152 | | | $ | 11,218,111 | | | $ | — | | | $ | 25,529,263 | | | $ | 25,529,263 | | | $ | 325,958 | | | $ | 1,467,849 | | | $ | 2,883,748 | |
BlackRock Advantage Emerging Markets Fund — Class K(b) | | | 245,996 | | | | 270,535 | | | | (63,406 | ) | | | 453,125 | | | | 4,943,591 | | | | 109,191 | | | | (36,695 | ) | | | 550,691 | |
BlackRock Cash Funds: Institutional, SL Agency Shares(b) | | | 455,840 | | | | — | | | | (317,525 | ) | | | 138,315 | | | | 138,370 | | | | 3,221 | (c) | | | 299 | | | | — | |
BlackRock Cash Funds: Treasury, SL Agency Shares(b) | | | 81,017 | | | | 5,159,669 | | | | — | | | | 5,240,686 | | | | 5,240,686 | | | | 55,010 | | | | — | | | | — | |
BlackRock Tactical Opportunities Fund — Class K | | | 23,768 | | | | 13,997 | | | | (1 | ) | | | 37,764 | | | | 507,176 | | | | 14,681 | | | | — | | | | (7,496 | ) |
Master Total Return Portfolio(b) | | $ | — | | | $ | 19,004 | | | $ | — | | | $ | 19,004 | | | | 253,365 | | | | 1 | | | | — | | | | — | |
CoreAlpha Bond Master Portfolio(b) | | $ | 1,010,090 | | | $ | 227,057 | | | $ | — | | | $ | 1,237,147 | | | | 1,237,147 | | | | 37,167 | | | | 39,300 | | | | 53,996 | |
International Tilts Master Portfolio(b) | | $ | 4,608,540 | | | $ | 3,887,387 | | | $ | — | | | $ | 8,495,927 | | | | 8,495,927 | | | | 184,047 | | | | 198,833 | | | | 1,356,846 | |
iShares Developed Real Estate Index Fund — Class K | | | — | | | | 293,578 | | | | (93,585 | ) | | | 199,993 | | | | 2,195,928 | | | | 94,464 | | | | (851 | ) | | | (47,945 | ) |
iShares Edge MSCI Multifactor International ETF | | | 31,238 | | | | 3,481 | | | | (34,719 | ) | | | — | | | | — | | | | 17,221 | | | | 92,495 | | | | (32,684 | ) |
iShares Edge MSCI Multifactor USA ETF(d) | | | 40,433 | | | | 4,726 | | | | (45,159 | ) | | | — | | | | — | | | | 11,780 | | | | 203,877 | | | | (45,050 | ) |
iShares International Developed Real Estate ETF(d) | | | — | | | | 19,540 | | | | (19,540 | ) | | | — | | | | — | | | | 3,376 | | | | (3,197 | ) | | | — | |
iShares MSCI EAFESmall-Cap ETF | | | 17,813 | | | | 17,186 | | | | (5,095 | ) | | | 29,904 | | | | 1,862,421 | | | | 55,105 | | | | (597 | ) | | | 251,337 | |
iShares TIPS Bond ETF | | | 1,192 | | | | 5,394 | | | | (416 | ) | | | 6,170 | | | | 719,237 | | | | 6,322 | | | | 6 | | | | 12,733 | |
iShares U.S. Real Estate ETF | | | — | | | | 10,106 | | | | (10,106 | ) | | | — | | | | — | | | | — | | | | (907 | ) | | | — | |
| | | | | | | | | | | | | | | | | | | | | | | | | | | | | | | | |
| | | $ | 51,123,111 | | | $ | 917,544 | | | $ | 1,960,412 | | | $ | 4,976,176 | |
| | | | | | | | | | | | | | | | | |
| | (a) | Includes net capital gain distributions, if applicable. | |
| | (b) | Represents net shares/investment value purchased (sold). | |
| | (c) | Represents securities lending income earned from the reinvestment of cash collateral from loaned securities, net of fees and collateral investment expenses, and other payments to and from borrowers of securities. | |
| | (d) | As of period end, the entity is no longer held by the LifePath Dynamic Master Portfolio. | |
| | | | |
| SCHEDULES OF INVESTMENTS | | | 67 | |
| | |
Schedule of Investments (continued) December 31, 2019 | | LifePath® Dynamic 2045 Master Portfolio |
Derivative Financial Instruments Outstanding as of Period End
Futures Contracts
| | | | | | | | | | | | | | | | |
| Description | | Number of
Contracts | | | Expiration
Date | | | Notional
Amount (000) | | | Value /
Unrealized
Appreciation
(Depreciation) | |
Long Contracts | |
S&P/TSX 60 Index | | | 8 | | | | 03/19/20 | | | $ | 1,247 | | | $ | 5,981 | |
E-Mini MSCI EAFE Index | | | 26 | | | | 03/20/20 | | | | 2,647 | | | | 65,071 | |
Russell 2000E-Mini Index | | | 12 | | | | 03/20/20 | | | | 1,002 | | | | 20,620 | |
S&P 500E-Mini Index | | | 2 | | | | 03/20/20 | | | | 323 | | | | 9,238 | |
| | | | | | | | | | | | | | | | |
| | | | | | | | | | | | | | | 100,910 | |
| | | | | | | | | | | | | | | | |
Short Contracts | |
10-Year U.S. Treasury Note | | | 13 | | | | 03/20/20 | | | | 1,669 | | | | 14,137 | |
U.S. Treasury Ultra Bond | | | 3 | | | | 03/20/20 | | | | 545 | | | | 17,526 | |
| | | | | | | | | | | | | | | | |
| | | | 31,663 | |
| | | | | | | | | | | | | | | | |
| | | | | | | | | | | | | | $ | 132,573 | |
| | | | | | | | | | | | | | | | |
Forward Foreign Currency Exchange Contracts
| | | | | | | | | | | | | | | | | | | | |
Currency
Purchased | | | Currency
Sold | | | Counterparty | | Settlement Date | | | Unrealized
Appreciation
(Depreciation) | |
| CAD | | | 1,474,637 | | | USD | | | 1,112,476 | | | Morgan Stanley & Co. International PLC | | | 03/18/20 | | | $ | 23,431 | |
| EUR | | | 39,071 | | | USD | | | 43,543 | | | Bank of America N.A. | | | 03/18/20 | | | | 488 | |
| EUR | | | 200,000 | | | USD | | | 223,134 | | | Bank of America N.A. | | | 03/18/20 | | | | 2,259 | |
| EUR | | | 2,171,104 | | | USD | | | 2,419,782 | | | Bank of America N.A. | | | 03/18/20 | | | | 26,983 | |
| | | | | | | | | | | | | | | | | | | | |
Net unrealized appreciation | | | $ | 53,161 | |
| | | | | |
Derivative Financial Instruments Categorized by Risk Exposure
As of period end, the fair values of derivative financial instruments located in the Statements of Assets and Liabilities were as follows:
| | | | | | | | | | | | | | | | | | | | | | | | | | | | |
| | | Commodity
Contracts | | | Credit
Contracts | | | Equity
Contracts | | | Foreign
Currency
Exchange
Contracts | | | Interest
Rate
Contracts | | | Other
Contracts | | | Total | |
Assets — Derivative Financial Instruments | | | | | | | | | | | | | | | | | | | | | | | | | | | | |
Futures contracts | | | | | | | | | | | | | | | | | | | | | | | | | | | | |
Unrealized appreciation on futures contracts(a) | | $ | — | | | $ | — | | | $ | 100,910 | | | $ | — | | | $ | 31,663 | | | $ | — | | | $ | 132,573 | |
Forward foreign currency exchange contracts | | | | | | | | | | | | | | | | | | | | | | | | | | | | |
Unrealized appreciation on forward foreign currency exchange contracts | | | — | | | | — | | | | — | | | | 53,161 | | | | — | | | | — | | | | 53,161 | |
| | | | | | | | | | | | | | | | | | | | | | | | | | | | |
| | $ | — | | | $ | — | | | $ | 100,910 | | | $ | 53,161 | | | $ | 31,663 | | | $ | — | | | $ | 185,734 | |
| | | | | | | | | | | | | | | | | | | | | | | | | | | | |
| | (a) | Net cumulative unrealized appreciation (depreciation) on futures contracts and centrally cleared swaps, if any, are reported in the Schedule of Investments. In the Statements of Assets and Liabilities, only current day’s variation margin is reported in receivables or payables and the net cumulative unrealized appreciation (depreciation) is included in accumulated earnings (loss). | |
For the year ended December 31, 2019, the effect of derivative financial instruments in the Statements of Operations was as follows:
| | | | | | | | | | | | | | | | | | | | | | | | | | | | |
| | | Commodity
Contracts | | | Credit
Contracts | | | Equity
Contracts | | | Foreign
Currency
Exchange
Contracts | | | Interest
Rate
Contracts | | | Other
Contracts | | | Total | |
Net Realized Gain (Loss) from: | | | | | | | | | | | | | | | | | | | | | | | | | | | | |
Futures contracts | | $ | — | | | $ | — | | | $ | 408,352 | | | $ | — | | | $ | (17,017 | ) | | $ | — | | | $ | 391,335 | |
Forward foreign currency exchange contracts | | | — | | | | — | | | | — | | | | (118,657 | ) | | | — | | | | — | | | | (118,657 | ) |
| | | | | | | | | | | | | | | | | | | | | | | | | | | | |
| | $ | — | | | $ | — | | | $ | 408,352 | | | $ | (118,657 | ) | | $ | (17,017 | ) | | $ | — | | | $ | 272,678 | |
| | | | | | | | | | | | | | | | | | | | | | | | | | | | |
Net Change in Unrealized Appreciation (Depreciation) on: | |
Futures contracts | | $ | — | | | $ | — | | | $ | 168,245 | | | $ | — | | | $ | 31,663 | | | $ | — | | | $ | 199,908 | |
Forward foreign currency exchange contracts | | | — | | | | — | | | | — | | | | 93,589 | | | | — | | | | — | | | $ | 93,589 | |
| | | | | | | | | | | | | | | | | | | | | | | | | | | | |
| | $ | — | | | $ | — | | | $ | 177,328 | | | $ | 93,589 | | | $ | 31,663 | | | $ | — | | | $ | 293,497 | |
| | | | | | | | | | | | | | | | | | | | | | | | | | | | |
| | |
| 68 | | 2019 BLACKROCK ANNUAL REPORTTO SHAREHOLDERS |
| | |
Schedule of Investments (continued) December 31, 2019 | | LifePath® Dynamic 2045 Master Portfolio |
Average Quarterly Balances of Outstanding Derivative Financial Instruments
| | | | |
Futures contracts: | |
Average notional value of contracts — long | | $ | 4,400,866 | |
Average notional value of contracts — short | | $ | 1,865,613 | |
Forward foreign currency exchange contracts: | |
Average amounts purchased — in USD | | $ | 1,310,057 | |
Average amounts sold — in USD | | $ | 4,022,513 | |
For more information about the LifePath Dynamic Master Portfolio’s investment risks regarding derivative financial instruments, refer to the Notes to Financial Statements.
Derivative Financial Instruments — Offsetting as of Period End
The Fund’s derivative assets and liabilities (by type) were as follows:
| | | | | | | | |
| | | Assets | | | Liabilities | |
Derivative Financial Instruments: | | | | | | | | |
Futures contracts | | $ | 19,210 | | | $ | 2,095 | |
Forward foreign currency exchange contracts | | | 53,161 | | | | — | |
| | | | | | | | |
Total derivative assets and liabilities in the Statements of Assets and Liabilities | | $ | 72,371 | | | $ | 2,095 | |
Derivatives not subject to a Master Netting Agreement or similar agreement (“MNA”) | | | (19,210 | ) | | | (2,095 | ) |
| | | | | | | | |
Total derivative assets and liabilities subject to an MNA | | $ | 53,161 | | | $ | — | |
| | | | | | | | |
The following table presents the LifePath Dynamic Master Portfolio’s derivative assets by counterparty net of amounts available for offset under an MNA and net of the related collateral received by the LifePath Dynamic Master Portfolio:
| | | | | | | | | | | | | | | | | | | | |
| Counterparty | | Derivative
Assets
Subject to
an MNA by
Counterparty | | | Derivatives
Available
for Offset | | | Non-cash
Collateral
Received | | | Cash
Collateral
Received | | | Net Amount
of Derivative
Assets (a)(b) | |
Bank of America N.A. | | $ | 29,730 | | | $ | — | | | $ | — | | | $ | — | | | $ | 29,730 | |
Morgan Stanley & Co. International PLC | | | 23,431 | | | | — | | | | — | | | | — | | | | 23,431 | |
| | | | | | | | | | | | | | | | | | | | |
| | $ | 53,161 | | | $ | — | | | $ | — | | | $ | — | | | $ | 53,161 | |
| | | | | | | | | | | | | | | | | | | | |
| | (a) | Net amount represents the net amount receivable from the counterparty in the event of default. | |
| | (b) | Net amount may also include forward foreign currency exchange contracts that are not required to be collateralized. | |
Fair Value Hierarchy as of Period End
Various inputs are used in determining the fair value of investments and derivative financial instruments. For information about the LifePath Dynamic Master Portfolio’s policy regarding valuation of investments and derivative financial instruments, refer to the Notes to Financial Statements.
The following tables summarize the LifePath Dynamic Master Portfolio’s investments and derivative financial instruments categorized in the disclosure hierarchy:
| | | | | | | | | | | | | | | | |
| | | Level 1 | | | Level 2 | | | Level 3 | | | Total | |
Assets: | |
Investments: | |
Affiliated Investments Companies | | | | | | | | | | | | | | | | |
Equity Funds | | $ | 9,762,481 | | | $ | — | | | $ | — | | | $ | 9,762,481 | |
Fixed Income Funds | | | 719,237 | | | | — | | | | — | | | | 719,237 | |
Short-Term Securities | | | 5,379,056 | | | | — | | | | — | | | | 5,379,056 | |
| | | | | | | | | | | | | | | | |
Subtotal | | $ | 15,860,774 | | | $ | — | | | $ | — | | | $ | 15,860,774 | |
| | | | | | | | | | | | | | | | |
Investments Valued at NAV(a) | | | | | | | | | | | | | | | 35,262,337 | |
| | | | | |
Total Investments | | | | | | | | | | | | | | $ | 51,123,111 | |
| | | | | | | | | | | | | | | | |
|
Derivative Financial Instruments (b) | |
Assets: | |
Equity contracts | | $ | 100,910 | | | $ | — | | | $ | — | | | $ | 100,910 | |
Forward foreign currency contracts | | | — | | | | 53,161 | | | | — | | | | 53,161 | |
Interest rate contracts | | | 31,663 | | | | — | | | | — | | | | 31,663 | |
| | | | | | | | | | | | | | | | |
| | $ | 132,573 | | | $ | 53,161 | | | $ | — | | | $ | 185,734 | |
| | | | | | | | | | | | | | | | |
| | (a) | Certain investments of the LifePath Dynamic Master were fair valued using NAV per share or its equivalent as no quoted market value is available and therefore have been excluded from the fair value hierarchy. | |
| | (b) | Derivative financial instruments are futures contracts and forward foreign currency exchange contracts. Futures contracts and forward foreign currency exchange contracts are valued at the unrealized appreciation (depreciation) on the instrument. | |
See notes to financial statements.
| | | | |
| SCHEDULES OF INVESTMENTS | | | 69 | |
| | |
Schedule of Investments December 31, 2019 | | LifePath® Dynamic 2055 Master Portfolio (Percentages shown are based on Net Assets) |
| | | | | | | | |
| Security | | Shares/ Investment Value | | | Value | |
|
Affiliated Investment Companies(d)— 100.1% | |
| |
| Equity Funds — 89.2% | | | | |
Active Stock Master Portfolio | | $ | 14,405,876 | | | $ | 14,405,876 | |
BlackRock Advantage Emerging Markets Fund — Class K | | | 260,340 | | | | 2,840,312 | |
Master Total Return Portfolio | | $ | 10 | | | | 133 | |
International Tilts Master Portfolio | | $ | 4,957,218 | | | | 4,957,218 | |
iShares Developed Real Estate Index Fund — Class K | | | 114,152 | | | | 1,253,383 | |
iShares MSCI EAFESmall-Cap ETF(a) | | | 16,909 | | | | 1,053,093 | |
| | | | | | | | |
| | | | | | | 24,510,015 | |
|
| Fixed Income Funds — 1.0% | |
CoreAlpha Bond Master Portfolio | | $ | 241,841 | | | | 241,841 | |
iShares TIPS Bond ETF | | | 331 | | | | 38,584 | |
| | | | | | | | |
| | | | | | | 280,425 | |
| | | | | | | | |
| Security | | Shares/ Investment Value | | | Value | |
|
| Short-Term Securities — 9.9% | |
BlackRock Cash Funds: Institutional,
SL Agency Shares,
1.87%(b)(c) | | $ | 6,266 | | | $ | 6,268 | |
BlackRock Cash Funds: Treasury,
SL Agency Shares,
1.55%(c) | | | 2,710,144 | | | | 2,710,144 | |
| | | | | | | | |
| | | | | | | 2,716,412 | |
| | | | | | | | |
| |
Total Affiliated Investment Companies — 100.1%
(Cost — $24,746,580) | | | | 27,506,852 | |
| |
Liabilities in Excess of Other Assets — (0.1)% | | | | (14,800 | ) |
| | | | | | | | |
| |
Net Assets — 100.0% | | | $ | 27,492,052 | |
| | | | | | | | |
| (a) | Security, or a portion of the security, is on loan. |
| (b) | Annualized7-day yield as of period end. |
| (c) | All or a portion of security was purchased with the cash collateral from loaned securities. |
| (d) | During the year ended December 31, 2019, investments in issuers considered to be an affiliate/affiliates of the LifePath Dynamic Master Portfolio for purposes of Section 2(a)(3) of the Investment Company Act of 1940, as amended, and/or related parties of the LifePath Dynamic Master Portfolio were as follows: |
| | | | | | | | | | | | | | | | | | | | | | | | | | | | | | | | |
| Affiliated Persons and/or Related Parties | | Shares/ Investment Value Held at 12/31/18 | | | Shares/ Investment Value Purchased | | | Shares/ Investment Value Sold | | | Shares/ Investment Value Held at
12/31/19 | | | Value at
12/31/19 | | | Income | | | Net
Realized
Gain (Loss) (a) | | | Change in
Unrealized
Appreciation
(Depreciation) | |
Active Stock Master Portfolio(b) | | $ | 7,607,800 | | | $ | 6,798,076 | | | $ | — | | | $ | 14,405,876 | | | $ | 14,405,876 | | | $ | 189,807 | | | $ | 766,642 | | | $ | 1,625,430 | |
BlackRock Advantage Emerging Markets Fund — Class K | | | 149,850 | | | | 148,171 | | | | (37,681 | ) | | | 260,340 | | | | 2,840,312 | | | | 63,204 | | | | (23,607 | ) | | | 315,006 | |
BlackRock Cash Funds: Institutional, SL Agency Shares(b) | | | 129,439 | | | | — | | | | (123,173 | ) | | | 6,266 | | | | 6,268 | | | | 2,127 | (c) | | | 299 | | | | — | |
BlackRock Cash Funds: Treasury, SL Agency Shares(b) | | | 344,109 | | | | 2,366,035 | (b) | | | — | | | | 2,710,144 | | | | 2,710,144 | | | | 41,246 | | | | — | | | | — | |
Master Total Return Portfolio(b) | | $ | — | | | $ | 10 | | | $ | — | | | $ | 10 | | | | 133 | | | | 1 | | | | — | | | | — | |
CoreAlpha Bond Master Portfolio(b) | | $ | 195,395 | | | $ | 46,446 | | | $ | — | | | $ | 241,841 | | | | 241,841 | | | | 6,599 | | | | 4,573 | | | | 15,680 | |
International Tilts Master Portfolio(b) | | $ | 2,731,807 | | | $ | 2,225,411 | | | $ | — | | | $ | 4,957,218 | | | | 4,957,218 | | | | 111,553 | | | | 106,132 | | | | 783,397 | |
iShares Developed Real Estate Index Fund — Class K | | | — | | | | 179,111 | | | | (64,959 | ) | | | 114,152 | | | | 1,253,383 | | | | 54,116 | | | | (541 | ) | | | (26,274 | ) |
iShares Edge MSCI Multifactor International ETF(d) | | | 18,468 | | | | 813 | | | | (19,281 | ) | | | — | | | | — | | | | 10,181 | | | | 53,428 | | | | (19,323 | ) |
iShares Edge MSCI Multifactor USA ETF(d) | | | 33,447 | | | | 2,601 | | | | (36,048 | ) | | | — | | | | — | | | | 13,987 | | | | 196,932 | | | | (59,418 | ) |
iShares International Developed Real Estate ETF(d) | | | — | | | | 13,908 | | | | (13,908 | ) | | | — | | | | — | | | | 2,495 | | | | — | | | | — | |
iShares MSCI Canada ETF(d) | | | 4,986 | | | | 1,249 | | | | (6,235 | ) | | | — | | | | — | | | | 1,262 | | | | 2,879 | | | | 20,750 | |
iShares MSCI EAFESmall-Cap ETF | | | 12,729 | | | | 9,338 | | | | (5,158 | ) | | | 16,909 | | | | 1,053,093 | | | | 33,759 | | | | (17,224 | ) | | | 174,557 | |
iShares TIPS Bond ETF | | | — | | | | 331 | | | | — | | | | 331 | | | | 38,584 | | | | 381 | | | | — | | | | 392 | |
| | | | | | | | | | | | | | | | | | | | | | | | | | | | | | | | |
| | | | | | | | | | | | | | | | | | $ | 27,506,852 | | | $ | 530,718 | | | $ | 1,089,513 | | | $ | 2,830,197 | |
| | | | | | | | | | | | | | | | | | | | | | | | | | | | | | | | |
| | (a) | Includes net capital gain distributions, if applicable. | |
| | (b) | Represents net shares/investment value purchased (sold). | |
| | (c) | Represents securities lending income earned from the reinvestment of cash collateral from loaned securities, net of fees and collateral investment expenses, and other payments to and from borrowers of securities. | |
| | (d) | As of period end, the entity is no longer held by the LifePath Dynamic Master Portfolio. | |
| | |
| 70 | | 2019 BLACKROCK ANNUAL REPORTTO SHAREHOLDERS |
| | |
Schedule of Investments (continued) December 31, 2019 | | LifePath® Dynamic 2055 Master Portfolio (Percentages shown are based on Net Assets) |
Derivative Financial Instruments Outstanding as of Period End
Futures Contracts
| | | | | | | | | | | | | | | | | | | | |
| Description | | Number of
Contracts | | | Expiration
Date | | | Notional
Amount (000) | | | Value/
Unrealized
Appreciation
(Depreciation) | |
Long Contracts: | |
S&P/TSX 60 Index | | | 5 | | | | 03/19/20 | | | $ | 780 | | | $ | 3,738 | |
E-Mini MSCI EAFE Index | | | 14 | | | | 03/20/20 | | | | 1,426 | | | | 35,247 | |
Russell 2000E-Mini Index | | | 7 | | | | 03/20/20 | | | | 585 | | | | 12,029 | |
| | | | | | | | | | | | | | | | | | | | |
| | | | | | $ | 51,014 | |
| | | | | | | | | | | | | | | | | | | | |
Forward Foreign Currency Exchange Contracts
| | | | | | | | | | | | | | | | | | | | |
Currency
Purchased | | | Currency
Sold | | | Counterparty | | Settlement Date | | | Unrealized
Appreciation
(Depreciation) | |
| CAD | | | 981,493 | | | USD | | | 740,445 | | | Morgan Stanley & Co. International PLC | | | 03/18/20 | | | $ | 15,595 | |
| EUR | | | 30,135 | | | USD | | | 33,585 | | | Bank of America N.A. | | | 03/18/20 | | | | 377 | |
| EUR | | | 100,000 | | | USD | | | 111,567 | | | Bank of America N.A. | | | 03/18/20 | | | | 1,129 | |
| EUR | | | 1,193,528 | | | USD | | | 1,330,220 | | | Morgan Stanley & Co. International PLC | | | 03/18/20 | | | | 14,848 | |
| | | | | | | | | | | | | | | | | | | | |
Net unrealized appreciation | | | $ | 31,949 | |
| | | | | | | | | | | | | | | | | | | | |
Derivative Financial Instruments Categorized by Risk Exposure
As of period end, the fair values of derivative financial instruments located in the Statements of Assets and Liabilities were as follows:
| | | | | | | | | | | | | | | | | | | | | | | | | | | | |
| | | Commodity Contracts | | | Credit Contracts | | | Equity Contracts | | | Foreign Currency
Exchange
Contracts | | | Interest Rate Contracts | | | Other Contracts | | | Total | |
Assets — Derivative Financial Instruments | | | | | | | | | | | | | | | | | | | | | | | | | |
Futures contracts | | | | | | | | | | | | | | | | | | | | | | | | | | | | |
Unrealized appreciation on future contracts(a) | | $ | — | | | $ | — | | | $ | 51,014 | | | $ | — | | | $ | — | | | $ | — | | | $ | 51,014 | |
Forward foreign currency exchange contracts | | | | | | | | | | | | | | | | | | | | | | | | | | | | |
Unrealized appreciation on forward foreign currency exchange contracts | | | — | | | | — | | | | — | | | | 31,949 | | | | — | | | | — | | | | 31,949 | |
| | | | | | | | | | | | | | | | | | | | | | | | | | | | |
| | $ | — | | | $ | — | | | $ | 51,014 | | | $ | 31,949 | | | $ | — | | | $ | — | | | $ | 82,963 | |
| | | | | | | | | | | | | | | | | | | | | | | | | | | | |
| | (a) | Net cumulative unrealized appreciation (depreciation) on futures contracts and centrally cleared swaps, if any, as reported in the Schedule of Investments. In the Statements of Assets and Liabilities, only current day’s variation margin is reported in receivables or payables and the net cumulative unrealized appreciation (depreciation) is included in the accumulated earnings (loss). | |
For year ended December 31, 2019, the effect of derivative financial instruments in the Statements of Operations was as follows:
| | | | | | | | | | | | | | | | | | | | | | | | | | | | |
| | | Commodity Contracts | | | Credit Contracts | | | Equity Contracts | | | Foreign Currency
Exchange
Contracts | | | Interest Rate Contracts | | | Other Contracts | | | Total | |
Net Realized Gain(Loss) from: | | | | | | | | | | | | | | | | | | | | | | | | | | | | |
Futures contracts | | $ | — | | | $ | — | | | $ | 155,681 | | | $ | — | | | $ | — | | | $ | — | | | $ | 155,681 | |
Forward foreign currency exchange contracts | | | — | | | | — | | | | — | | | | (69,417 | ) | | | — | | | | — | | | | (69,417 | ) |
| | | | | | | | | | | | | | | | | | | | | | | | | | | | |
| | $ | — | | | $ | — | | | $ | 155,681 | | | $ | (69,417 | ) | | $ | — | | | $ | — | | | $ | 86,264 | |
| | | | | | | | | | | | | | | | | | | | | | | | | | | | |
| | | | | | | |
| Net Change in Unrealized Appreciation(Depreciation) on: | | | | | | | | | | | | | | | | | | | | | |
Futures contracts | | $ | — | | | $ | — | | | $ | 70,085 | | | $ | — | | | $ | — | | | $ | — | | | $ | 70,085 | |
Forward foreign currency exchange contracts | | | — | | | | — | | | | — | | | | 50,008 | | | | — | | | | — | | | | 50,008 | |
| | | | | | | | | | | | | | | | | | | | | | | | | | | | |
| | $ | — | | | $ | — | | | $ | 70,085 | | | $ | 50,008 | | | $ | — | | | $ | — | | | $ | 120,093 | |
| | | | | | | | | | | | | | | | | | | | | | | | | | | | |
| | | | |
| SCHEDULES OF INVESTMENTS | | | 71 | |
| | |
Schedule of Investments (continued) December 31, 2019 | | LifePath® Dynamic 2055 Master Portfolio |
Average Quarterly Balances of Outstanding Derivative Financial Instruments
| | | | | | |
Futures contracts: | | | | |
Average notional value of contracts — long | | $ | 1,988,170 | |
Average notional value of contracts — Short | | $ | — | (a) |
Forward foreign currency exchange contracts: | | | | |
Average amounts purchased — in USD | | $ | 770,898 | |
Average amounts sold — in USD | | $ | 2,336,789 | |
| | (a) | Derivative not held atquarter-end. The risk exposure table serves as an indicator of activity during the period. | |
For more information about the Lifepath Dynamic Master Portfolio’s investment risks regarding derivative financial instruments, refer to the Notes to financial statements.
Derivative Financial Instruments — Offsetting as of Period End
The Fund’s derivative assets and liabilities (by type) were as follows:
| | | | | | | | |
| | | Assets | | | Liabilities | |
Derivative Financial Instruments: | | | | | | | | |
Futures contracts | | $ | 7,394 | | | $ | 1,309 | |
Forward foreign currency exchange contracts | | | 31,949 | | | | — | |
| | | | | | | | |
Total derivative assets and liabilities in the Statements of Assets and Liabilities | | $ | 39,343 | | | $ | 1,309 | |
| | | | | | | | |
Derivatives not subject to a Master Netting Agreement or similar agreement (“MNA”) | | | (7,394 | ) | | | (1,309 | ) |
| | | | | | | | |
Total derivative assets and liabilities subject to an MNA | | $ | 31,949 | | | $ | — | |
| | | | | | | | |
The following table presents the LifePath Dynamic Master Portfolio’s derivative assets by counterparty net of amounts available for offset under an MNA and net of the related collateral received by the LifePath Dynamic Master Portfolio:
| | | | | | | | | | | | | | | | | | | | |
| Counterparty | | Derivative
Assets
Subject to
an MNA by
Counterparty | | | Derivatives
Available
for Offset | | | Non-cash
Collateral
Received | | | Cash
Collateral
Received | | | Net Amount
of Derivative
Assets (a)(b) | |
Bank of America N.A. | | $ | 1,506 | | | $ | — | | | $ | — | | | $ | — | | | $ | 1,506 | |
Morgan Stanley & Co. International PLC | | | 30,443 | | | | — | | | | — | | | | — | | | | 30,443 | |
| | | | | | | | | | | | | | | | | | | | |
| | $ | 31,949 | | | $ | — | | | $ | — | | | $ | — | | | $ | 31,949 | |
| | | | | | | | | | | | | | | | | | | | |
| | (a) | Net amount represents the net amount receivable from the counterparty in the event of default. | |
| | (b) | Net amount may also include forward foreign currency exchange contracts that are not required to be collateralized. | |
Fair Value Hierarchy as of Period End
Various inputs are used in determining the fair value of investments and derivative financial instruments. For information about the LifePath Dynamic Master Portfolio’s policy regarding valuation of investments and derivative financial instruments, refer to the Notes to Financial Statements.
The following tables summarize the LifePath Dynamic Master Portfolio’s investments and derivative financial instruments categorized in the disclosure hierarchy:
| | | | | | | | | | | | | | | | |
| | | Level 1 | | | Level 2 | | | Level 3 | | | Total | |
Assets: | | | | | | | | | | | | | | | | |
Investments: | | | | | | | | | | | | | | | | |
Equity Funds | | $ | 5,146,788 | | | $ | — | | | $ | — | | | $ | 5,146,788 | |
Fixed Income Fund | | | 38,584 | | | | — | | | | — | | | | 38,584 | |
Short-Term Securities | | | 2,716,412 | | | | — | | | | — | | | | 2,716,412 | |
| | | | | | | | | | | | | | | | |
Subtotal | | $ | 7,901,784 | | | $ | — | | | $ | — | | | $ | 7,901,784 | |
| | | | | | | | | | | | | | | | |
Investments Valued at NAV(a) | | | | | | | | | | | | | | | 19,605,068 | |
| | | | | | | | | | | | | | | | |
| | | | | | | | | | | | | | $ | 27,506,852 | |
| | | | | | | | | | | | | | | | |
Derivative Financial Instruments(b) | | | | | | | | | | | | | | | | |
Assets: | | | | | | | | | | | | | | | | |
Equity contracts | | $ | 51,014 | | | $ | — | | | $ | — | | | $ | 51,014 | |
Forward foreign currency contracts | | | — | | | | 31,949 | | | | — | | | | 31,949 | |
| | | | | | | | | | | | | | | | |
| | $ | 51,014 | | | $ | 31,949 | | | $ | — | | | $ | 82,963 | |
| | | | | | | | | | | | | | | | |
| | (a) | Certain investments of the LifePath Dynamic Master Portfolio were fair valued using NAV per share or its equivalent as no quoted market value is available and therefore have been excluded from the fair value hierarchy. | |
| | (b) | Derivative financial instruments are futures contracts and forward foreign currency exchange contracts. Futures contracts and forward foreign currency exchange contracts are valued at the unrealized appreciation (depreciation) on the instrument. | |
See notes to financial statements.
| | |
| 72 | | 2019 BLACKROCK ANNUAL REPORTTO SHAREHOLDERS |
| | |
Schedule of Investments December 31, 2019 | | LifePath® Dynamic 2065 Master Portfolio (Percentages shown are based on Net Assets) |
| | | | | | | | |
| Security | | Shares/
Investment
Value | | | Value | |
|
Affiliated Investment Companies(d) — 104.3% | |
|
| Equity Funds — 94.2% | |
Active Stock Master Portfolio | | $ | 2,195,914 | | | $ | 2,195,914 | |
BlackRock Advantage Emerging Markets Fund — Class K | | | 39,679 | | | | 432,899 | |
Master Total Return Portfolio | | $ | 152 | | | | 2,021 | |
International Tilts Master Portfolio | | $ | 782,737 | | | | 782,737 | |
iShares Developed Real Estate Index Fund — Class K | | | 18,113 | | | | 198,885 | |
iShares MSCI Canada ETF(a) | | | 3,688 | | | | 110,234 | |
iShares MSCI EAFESmall-Cap ETF(a) | | | 2,687 | | | | 167,346 | |
iShares Russell 2000 ETF(a) | | | 512 | | | | 84,823 | |
| | | | | | | | |
| | | | | | | 3,974,859 | |
|
| Fixed Income Funds — 0.9% | |
CoreAlpha Bond Master Portfolio | | $ | 35,338 | | | | 35,338 | |
iShares TIPS Bond ETF | | | 35 | | | | 4,080 | |
| | | | | | | | |
| | | | | | | 39,418 | |
| | | | | | | | |
| Security | | Shares/
Investment
Value | | | Value | |
|
| Short-Term Securities — 9.2% | |
BlackRock Cash Funds: Institutional,
SL Agency Shares,
1.87%(b)(c) | | $ | 231,843 | | | $ | 231,936 | |
BlackRock Cash Funds: Treasury,
SL Agency Shares,
1.55%(b) | | | 153,506 | | | | 153,506 | |
| | | | | | | | |
| | | | | | | 385,442 | |
| | | | | | | | |
| |
Total Affiliated Investment Companies — 104.3%
(Cost — $4,215,593) | | | | 4,399,719 | |
| |
Liabilities in Excess of Other Assets — (4.3)% | | | | (181,416 | ) |
| | | | | | | | |
| |
Net Assets — 100.0% | | | $ | 4,218,303 | |
| | | | | | | | |
| (a) | Security, or a portion of the security, is on loan. |
| (b) | Annualized7-day yield as of period end. |
| (c) | Security was purchased with the cash collateral from loaned securities. |
| (d) | During the year ended December 31, 2019, investments in issuers considered to be an affiliate/affiliates of the LifePath Dynamic Master Portfolio for purposes of Section 2(a)(3) of the Investment Company Act of 1940, as amended, and/or related parties of the LifePath Dynamic Master Portfolio were as follows: |
| | | | | | | | | | | | | | | | | | | | | | | | | | | | | | | | |
| Affiliate Persons and/or Related Parties | | Shares/
Investment
Value Held at
12/31/18 | | | Shares/
Investment
Value
Purchased | | | Shares/
Investment
Value Sold | | | Shares/
Investment
Value Held at
12/31/19 | | | Value at
12/31/19 | | | Income | | | Net
Realized
Gain (Loss) (a) | | | Change in
Unrealized
Appreciation
(Depreciation) | |
Active Stock Master Portfolio(b) | | $ | — | | | $ | 2,195,914 | | | $ | — | | | $ | 2,195,914 | | | $ | 2,195,914 | | | $ | 7,027 | | | $ | (8,278 | ) | | $ | 128,640 | |
BlackRock Advantage Emerging Markets Fund — Class K | | | — | | | | 45,142 | | | | (5,463 | ) | | | 39,679 | | | | 432,899 | | | | 9,562 | | | | 801 | | | | 18,665 | |
BlackRock Cash Funds: Institutional, SL Agency Shares(b) | | | — | | | | 231,843 | | | | — | | | | 231,843 | | | | 231,936 | | | | 32 | (c) | | | — | | | | — | |
BlackRock Cash Funds: Treasury, SL Agency Shares(b) | | | — | | | | 153,506 | | | | — | | | | 153,506 | | | | 153,506 | | | | 550 | | | | — | | | | — | |
Master Total Return Portfolio(b) | | $ | — | | | $ | 152 | | | $ | — | | | $ | 152 | | | | 2,021 | | | | 15 | | | | — | | | | 22 | |
CoreAlpha Bond Master Portfolio(b) | | $ | — | | | $ | 35,338 | | | $ | — | | | $ | 35,338 | | | | 35,338 | | | | 164 | | | | (349 | ) | | | (755 | ) |
International Tilts Master Portfolio(b) | | $ | — | | | $ | 782,737 | | | $ | — | | | $ | 782,737 | | | | 782,737 | | | | 2,551 | | | | 2,914 | | | | 30,378 | |
iShares Developed Real Estate Index Fund — Class K | | | — | | | | 18,113 | | | | — | | | | 18,113 | | | | 198,885 | | | | 7,253 | | | | — | | | | (8,226 | ) |
iShares MSCI Canada ETF | | | — | | | | 3,688 | | | | — | | | | 3,688 | | | | 110,234 | | | | 1,385 | | | | — | | | | 3,773 | |
iShares MSCI EAFESmall-Cap ETF | | | — | | | | 2,687 | | | | — | | | | 2,687 | | | | 167,346 | | | | 3,378 | | | | — | | | | 6,818 | |
iShares Russell 2000 ETF | | | — | | | | 512 | | | | — | | | | 512 | | | | 84,823 | | | | 306 | | | | — | | | | 4,781 | |
iShares TIPS Bond ETF | | | — | | | | 35 | | | | — | | | | 35 | | | | 4,080 | | | | 8 | | | | — | | | | 30 | |
| | | | | | | | | | | | | | | | | | | | | | | | | | | | | | | | |
| | | | | | | | | | | | | | | | | | $ | 4,399,719 | | | $ | 32,231 | | | $ | (4,912 | ) | | $ | 184,126 | |
| | | | | | | | | | | | | | | | | | | | | | | | | | | | | | | | |
| | (a) | Includes net capital gain distributions, if applicable. | |
| | (b) | Represents net shares/investment value purchased (sold). | |
| | (c) | Represents all or a portion of securities lending income earned from the reinvestment of cash collateral from loaned securities, net of fees and collateral investment expenses, and other payments to and from borrowers of securities. | |
Derivative Financial Instruments Outstanding as of Period End
Futures Contracts
| | | | | | | | | | | | | | | | |
| Description | | Number of
Contracts | | | Expiration
Date | | | Notional
Amount (000) | | | Value/
Unrealized
Appreciation
(Depreciation) | |
Long Contracts | |
E-Mini MSCI EAFE Index | | | 2 | | | | 03/20/20 | | | $ | 204 | | | $ | 5,423 | |
| | | | | | | | | | | | | | | | |
| | | | |
| SCHEDULES OF INVESTMENTS | | | 73 | |
| | |
Schedule of Investments (continued) December 31, 2019 | | LifePath® Dynamic 2065 Master Portfolio |
Forward Foreign Currency Exchange Contracts
| | | | | | | | | | | | | | | | | | | | |
Currency
Purchased | | | Currency
Sold | | | Counterparty | | Settlement Date | | | Unrealized
Appreciation
(Depreciation) | |
| EUR | | | 192,500 | | | USD | | | 214,535 | | | Bank of America N.A. | | | 03/18/20 | | | $ | 2,406 | |
| | | | | | | | | | | | | | | | | | | | |
Net unrealized appreciation | | | $ | 2,406 | |
| | | | | | | | | | | | | | | | | | | | |
Derivative Financial Instruments Categorized by Risk Exposure
As of period end, the fair values of derivative financial instruments located in the Statements of Assets and Liabilities were as follows:
| | | | | | | | | | | | | | | | | | | | | | | | | | | | |
| | | Commodity
Contracts | | | Credit
Contracts | | | Equity Contracts | | | Foreign Currency
Exchange
Contracts | | | Interest Rate Contracts | | | Other Contracts | | | Total | |
Assets — Derivative Financial Instruments | | | | | | | | | | | | | | | | | | | | | | | | | | | | |
Futures contracts | | | | | | | | | | | | | | | | | | | | | | | | | | | | |
Unrealized appreciation on future contracts(a) | | $ | — | | | $ | — | | | $ | 5,423 | | | $ | — | | | $ | — | | | $ | — | | | $ | 5,423 | |
Forward foreign currency exchange contracts | | | | | | | | | | | | | | | | | | | | | | | | | | | | |
Unrealized appreciation on forward foreign currency exchange contracts | | | — | | | | — | | | | — | | | | 2,406 | | | | — | | | | — | | | | 2,406 | |
| | | | | | | | | | | | | | | | | | | | | | | | | | | | |
| | $ | — | | | $ | — | | | $ | 5,423 | | | $ | 2,406 | | | $ | — | | | $ | — | | | $ | 7,829 | |
| | | | | | | | | | | | | | | | | | | | | | | | | | | | |
| | (a) | Net cumulative unrealized appreciation (depreciation) on futures contracts and centrally cleared swaps, if any, as reported in the Schedule of Investments. In the Statements of Assets and Liabilities, only current day’s variation margin is reported in receivables or payables and the net cumulative unrealized appreciation (depreciation) is included in the accumulated earnings (loss). | |
For period ended December 31, 2019, the effect of derivative financial instruments in the Statements of Operations was as follows:
| | | | | | | | | | | | | | | | | | | | | | | | | | | | |
| | | Commodity
Contracts | | | Credit
Contracts | | | Equity Contracts | | | Foreign Currency
Exchange
Contracts | | | Interest Rate Contracts | | | Other Contracts | | | Total | |
Net Realized Gain (Loss) from: | | | | | | | | | | | | | | | | | | | | | | | | | | | | |
Futures contracts | | $ | — | | | $ | — | | | $ | 1,759 | | | $ | — | | | $ | — | | | $ | — | | | $ | 1,759 | |
Forward foreign currency exchange contracts | | | — | | | | — | | | | — | | | | (1,941 | ) | | | — | | | | — | | | | (1,941 | ) |
| | | | | | | | | | | | | | | | | | | | | | | | | | | | |
| | $ | — | | | $ | — | | | $ | 1,759 | | | $ | (1,941 | ) | | $ | — | | | $ | — | | | $ | (182 | ) |
| | | | | | | | | | | | | | | | | | | | | | | | | | | | |
Net Change in Unrealized Appreciation (Depreciation) on: | |
Futures contracts | | $ | — | | | $ | — | | | $ | 5,423 | | | $ | — | | | $ | — | | | $ | — | | | $ | 5,423 | |
Forward foreign currency exchange contracts | | | — | | | | — | | | | — | | | | 2,406 | | | | — | | | | — | | | | 2,406 | |
| | | | | | | | | | | | | | | | | | | | | | | | | | | | |
| | $ | — | | | $ | — | | | $ | 5,423 | | | $ | 2,406 | | | $ | — | | | $ | — | | | $ | 7,829 | |
| | | | | | | | | | | | | | | | | | | | | | | | | | | | |
Average Quarterly Balances of Outstanding Derivative Financial Instruments
| | | | |
Futures contracts: | |
Average notional value of contracts — long | | $ | 203,650 | |
Forward foreign currency exchange contracts: | |
Average amounts purchased — in USD | | $ | — | (a) |
Average amounts sold — in USD | | $ | 214,535 | |
| | (a) | Derivative not held at anyquarter-end. The risk exposure table serves as an indicator of activity during the period. | |
For more information about the Lifepath Dynamic Master Portfolio’s investment risks regarding derivative financial instruments, refer to the Notes to financial statements.
Derivative Financial Instruments — Offsetting as of Period End
The Fund’s derivative assets and liabilities (by type) were as follows:
| | | | | | | | |
| | | Assets | | | Liabilities | |
Derivative Financial Instruments: | | | | | | | | |
Futures contracts | | $ | 1,020 | | | $ | — | |
Forward foreign currency exchange contracts | | | 2,406 | | | | — | |
| | | | | | | | |
Total derivative assets and liabilities in the Statements of Assets and Liabilities | | $ | 3,426 | | | $ | — | |
| | | | | | | | |
Derivatives not subject to a Master Netting Agreement or similar agreement (“MNA”) | | | (1,020 | ) | | | — | |
| | | | | | | | |
Total derivative assets and liabilities subject to an MNA | | $ | 2,406 | | | $ | — | |
| | | | | | | | |
| | |
| 74 | | 2019 BLACKROCK ANNUAL REPORTTO SHAREHOLDERS |
| | |
Schedule of Investments (continued) December 31, 2019 | | LifePath® Dynamic 2065 Master Portfolio |
The following table presents the Fund’s derivative assets (and liabilities) by counterparty net of amounts available for offset under an MNA and net of the related collateral received by the LifePath Dynamic Master Portfolio:
| | | | | | | | | | | | | | | | | | | | |
| Counterparty | | Derivative
Assets
Subject to
an MNA by
Counterparty | | | Derivatives
Available
for Offset | | | Non-cash
Collateral
Received | | | Cash
Collateral
Received | | | Net Amount
of Derivative
Assets (a) | |
Bank of America N.A. | | $ | 2,406 | | | $ | — | | | $ | — | | | $ | — | | | $ | 2,406 | |
| | | | | | | | | | | | | | | | | | | | |
| | (a) | Net amount represents the net amount receivable from the counterparty in the event of default. | |
Fair Value Hierarchy as of Period End
Various inputs are used in determining the fair value of investments and derivative financial instruments. For information about the LifePath Dynamic Master Portfolio’s policy regarding valuation of investments and derivative financial instruments, refer to the Notes to Financial Statements.
The following tables summarize the LifePath Dynamic Master Portfolio’s investments and derivative financial instruments categorized in the disclosure hierarchy:
| | | | | | | | | | | | | | | | |
| | | Level 1 | | | Level 2 | | | Level 3 | | | Total | |
Assets: | |
Investments: | |
Affiliated Investment Companies | | | | | | | | | | | | | | | | |
Equity Funds | | $ | 996,208 | | | $ | — | | | $ | — | | | $ | 996,208 | |
Fixed Income Funds | | | 4,080 | | | | — | | | | — | | | | 4,080 | |
Short-Term Securities | | | 385,442 | | | | — | | | | — | | | | 385,442 | |
| | | | | | | | | | | | | | | | |
Subtotal | | $ | 1,385,730 | | | $ | — | | | $ | — | | | $ | 1,385,730 | |
| | | | | | | | | | | | | | | | |
Investments Valued at NAV(a) | | | | | | | | | | | | | | | 3,013,989 | |
| | | | | |
Total Investments | | | | | | | | | | | | | | $ | 4,399,719 | |
| | | | | | | | | | | | | | | | |
|
Derivative Financial Instruments(b) | |
Assets: | |
Equity contracts | | $ | 5,423 | | | $ | — | | | $ | — | | | $ | 5,423 | |
Forward foreign currency contracts | | | — | | | | 2,406 | | | | — | | | | 2,406 | |
| | | | | | | | | | | | | | | | |
| | $ | 5,423 | | | $ | 2,406 | | | $ | — | | | $ | 7,829 | |
| | | | | | | | | | | | | | | | |
| | (a) | Certain investments of the LifePath Dynamic Master Portfolio were fair valued using NAV per share or its equivalent as no quoted market value is available and therefore have been excluded from the fair value hierarchy. | |
| | (b) | Derivative financial instruments are futures contracts and forward foreign currency exchange contracts. Futures contracts and forward foreign currency exchange contracts are valued at the unrealized appreciation (depreciation) on the instrument. | |
See notes to financial statements.
| | | | |
| SCHEDULES OF INVESTMENTS | | | 75 | |
Statements of Assets and Liabilities
December 31, 2019
| | | | | | | | | | | | | | | | | | | | |
| | | LifePath Dynamic
2025 Master
Portfolio | | | LifePath Dynamic
2035 Master
Portfolio | | | LifePath Dynamic 2045 Master Portfolio | | | LifePath Dynamic
2055 Master
Portfolio | | | LifePath Dynamic
2065 Master
Portfolio | |
|
ASSETS | |
Investments at value — affiliated(a)(b) | | $ | 74,355,955 | | | $ | 73,273,286 | | | $ | 51,123,111 | | | $ | 27,506,852 | | | $ | 4,399,719 | |
Cash pledged for futures contracts | | | 245,000 | | | | 282,000 | | | | 232,000 | | | | 109,000 | | | | 10,000 | |
Foreign currency at value(c) | | | 104,847 | | | | 133,342 | | | | 125,091 | | | | 58,875 | | | | — | |
Receivables: | |
Investments sold | | | 303,101 | | | | 210,653 | | | | 176,765 | | | | 110,473 | | | | 46,890 | |
Securities lending income — affiliated | | | 257 | | | | 564 | | | | 425 | | | | 104 | | | | 32 | |
Interest — affiliated | | | 8,149 | | | | 6,323 | | | | 5,825 | | | | 3,325 | | | | 262 | |
From the Manager | | | 4,110 | | | | 4,107 | | | | 4,061 | | | | 4,028 | | | | 17,213 | |
Variation margin on futures contracts | | | 19,350 | | | | 22,828 | | | | 19,210 | | | | 7,394 | | | | 1,020 | |
Unrealized appreciation on forward foreign currency exchange contracts | | | 58,120 | | | | 67,401 | | | | 53,161 | | | | 31,949 | | | | 2,406 | |
| | | | | | | | | | | | | | | | | | | | |
Total assets | | | 75,098,889 | | | | 74,000,504 | | | | 51,739,649 | | | | 27,832,000 | | | | 4,477,542 | |
| | | | | | | | | | | | | | | | | | | | |
|
LIABILITIES | |
Cash collateral on securities loaned at value | | | 973,295 | | | | 2,151,551 | | | | 138,429 | | | | 6,325 | | | | 231,936 | |
Payables: | |
Investments purchased | | | 1,743,884 | | | | 1,431,152 | | | | 930,758 | | | | 82,832 | | | | 9,297 | |
Investment advisory fees | | | 5,049 | | | | 4,977 | | | | 3,512 | | | | 1,926 | | | | 318 | |
Trustees’ and Officer’s fees | | | 2,292 | | | | 2,275 | | | | 2,215 | | | | 2,172 | | | | — | |
Professional fees | | | 15,404 | | | | 15,393 | | | | 15,366 | | | | 15,338 | | | | 17,688 | |
Variation margin on futures contracts | | | 1,571 | | | | 2,356 | | | | 2,095 | | | | 1,309 | | | | — | |
Withdrawals to investors | | | 2,934,225 | | | | 1,010,443 | | | | 145,041 | | | | 230,046 | | | | — | |
| | | | | | | | | | | | | | | | | | | | |
Total liabilities | | | 5,675,720 | | | | 4,618,147 | | | | 1,237,416 | | | | 339,948 | | | | 259,239 | |
| | | | | | | | | | | | | | | | | | | | |
| | | | | |
NET ASSETS | | $ | 69,423,169 | | | $ | 69,382,357 | | | $ | 50,502,233 | | | $ | 27,492,052 | | | $ | 4,218,303 | |
| | | | | | | | | | | | | | | | | | | | |
|
NET ASSETS CONSIST OF | |
Investors’ capital | | $ | 64,120,172 | | | $ | 63,085,165 | | | $ | 45,235,467 | | | $ | 24,647,804 | | | $ | 4,026,348 | |
Net unrealized appreciation | | | 5,302,997 | | | | 6,297,192 | | | | 5,266,766 | | | | 2,844,248 | | | | 191,955 | |
| | | | | | | | | | | | | | | | | | | | |
NET ASSETS | | $ | 69,423,169 | | | $ | 69,382,357 | | | $ | 50,502,233 | | | $ | 27,492,052 | | | $ | 4,218,303 | |
| | | | | | | | | | | | | | | | | | | | |
| | | | | |
(a) Investments at cost — affiliated | | $ | 69,256,257 | | | $ | 67,208,366 | | | $ | 46,044,244 | | | $ | 24,746,580 | | | $ | 4,215,593 | |
(b) Securities loaned at value | | $ | 959,112 | | | $ | 2,118,299 | | | $ | 136,217 | | | $ | 6,228 | | | $ | 227,534 | |
(c) Foreign currency at cost | | $ | 103,077 | | | $ | 131,316 | | | $ | 123,079 | | | $ | 57,961 | | | $ | — | |
See notes to financial statements.
| | |
| 76 | | 2019 BLACKROCK ANNUAL REPORTTO SHAREHOLDERS |
Statements of Operations
Year Ended December 31, 2019
| | | | | | | | | | | | | | | | | | | | |
| | | LifePath Dynamic
2025 Master
Portfolio | | | LifePath Dynamic
2035 Master
Portfolio | | | LifePath Dynamic
2045 Master
Portfolio | | | LifePath Dynamic
2055 Master
Portfolio | | | LifePath Dynamic
2065 Master
Portfolio (a) | |
|
INVESTMENT INCOME | |
Dividends — affiliated | | $ | 423,929 | | | $ | 473,950 | | | $ | 367,151 | | | $ | 220,632 | | | $ | 22,442 | |
Dividends — unaffiliated | | | 31,435 | | | | 55,821 | | | | 53,204 | | | | 32,562 | | | | 6 | |
Securities lending income — affiliated — net | | | 3,370 | | | | 4,770 | | | | 3,221 | | | | 2,127 | | | | 32 | |
Foreign taxes withheld | | | (3,009 | ) | | | (5,867 | ) | | | (5,739 | ) | | | (3,299 | ) | | | — | |
Net investment income allocated from the applicable Underlying Master Portfolios: | | | | | | | | | | | | | | | | | | | | |
Dividends — affiliated | | | 500,811 | | | | 618,040 | | | | 518,789 | | | | 306,413 | | | | 9,853 | |
Interest — affiliated | | | 694,723 | | | | 329,430 | | | | 87,393 | | | | 34,966 | | | | 1,038 | |
Expenses | | | (136,004 | ) | | | (135,142 | ) | | | (102,280 | ) | | | (58,264 | ) | | | (1,960 | ) |
Fees waived | | | 47,238 | | | | 54,097 | | | | 43,270 | | | | 24,844 | | | | 826 | |
| | | | | | | | | | | | | | | | | | | | |
Total investment income | | | 1,562,493 | | | | 1,395,099 | | | | 965,009 | | | | 559,981 | | | | 32,237 | |
| | | | | | | | | | | | | | | | | | | | |
|
EXPENSES | |
Investment advisory | | | 202,091 | | | | 188,610 | | | | 132,207 | | | | 77,852 | | | | 2,438 | |
Trustees and Officer | | | 11,581 | | | | 11,489 | | | | 11,214 | | | | 10,999 | | | | 1,865 | |
Professional | | | 15,441 | | | | 15,438 | | | | 15,386 | | | | 15,355 | | | | 15,631 | |
| | | | | | | | | | | | | | | | | | | | |
Total expenses | | | 229,113 | | | | 215,537 | | | | 158,807 | | | | 104,206 | | | | 19,934 | |
Less fees waived and/or reimbursed by the Manager | | | (202,242 | ) | | | (190,513 | ) | | | (141,379 | ) | | | (94,495 | ) | | | (19,609 | ) |
| | | | | | | | | | | | | | | | | | | | |
Total expenses after fees waived and/or reimbursed | | | 26,871 | | | | 25,024 | | | | 17,428 | | | | 9,711 | | | | 325 | |
| | | | | | | | | | | | | | | | | | | | |
Net investment income | | | 1,535,622 | | | | 1,370,075 | | | | 947,581 | | | | 550,270 | | | | 31,912 | |
| | | | | | | | | | | | | | | | | | | | |
|
REALIZED AND UNREALIZED GAIN (LOSS) | |
Net realized gain (loss) from: | |
Allocation from the applicable Underlying Master Portfolios from investments, futures contracts, forward foreign currency exchange contracts and foreign currency transactions | | | 2,262,199 | | | | 2,293,621 | | | | 1,705,982 | | | | 877,347 | | | | (5,714 | ) |
Futures contracts | | | 654,419 | | | | 661,079 | | | | 391,335 | | | | 155,681 | | | | 1,759 | |
Forward foreign currency exchange contracts | | | (174,870 | ) | | | (166,778 | ) | | | (118,657 | ) | | | (69,417 | ) | | | (1,941 | ) |
Foreign currency transactions | | | (292 | ) | | | (642 | ) | | | (503 | ) | | | (820 | ) | | | — | |
Investments — affiliated | | | 155,402 | | | | 191,235 | | | | 254,430 | | | | 212,166 | | | | 802 | |
Investments — unaffiliated | | | 370,988 | | | | 708,101 | | | | 687,166 | | | | 409,419 | | | | — | |
| | | | | | | | | | | | | | | | | | | | |
| | | 3,267,846 | | | | 3,686,616 | | | | 2,919,753 | | | | 1,584,376 | | | | (5,094 | ) |
| | | | | | | | | | | | | | | | | | | | |
Net change in unrealized appreciation (depreciation) on: | |
Allocation from the applicable Underlying Master Portfolios from investments, futures contracts, forward foreign currency exchange contracts and foreign currency transactions | | | 4,232,091 | | | | 5,104,602 | | | | 4,294,590 | | | | 2,424,507 | | | | 158,285 | |
Futures contracts | | | 337,127 | | | | 307,435 | | | | 199,908 | | | | 70,085 | | | | 5,423 | |
Forward foreign currency exchange contracts | | | 102,158 | | | | 119,883 | | | | 93,589 | | | | 50,008 | | | | 2,406 | |
Foreign currency translations | | | 2,598 | | | | 1,336 | | | | 1,225 | | | | 538 | | | | — | |
Investments — affiliated | | | 739,226 | | | | 913,992 | | | | 681,586 | | | | 405,690 | | | | 25,841 | |
Investments — unaffiliated | | | 21,348 | | | | 74,196 | | | | 68,832 | | | | 45,725 | | | | — | |
| | | | | | | | | | | | | | | | | | | | |
| | | 5,434,548 | | | | 6,521,444 | | | | 5,339,730 | | | | 2,996,553 | | | | 191,955 | |
| | | | | | | | | | | | | | | | | | | | |
Net realized and unrealized gain | | | 8,702,394 | | | | 10,208,060 | | | | 8,259,483 | | | | 4,580,929 | | | | 186,861 | |
| | | | | | | | | | | | | | | | | | | | |
NET INCREASE IN NET ASSETS RESULTING FROM OPERATIONS | | $ | 10,238,016 | | | $ | 11,578,135 | | | $ | 9,207,064 | | | $ | 5,131,199 | | | $ | 218,773 | |
| | | | | | | | | | | | | | | | | | | | |
| (a) | Commenced operations on October 30, 2019. |
See notes to financial statements.
Statements of Changes in Net Assets
| | | | | | | | | | | | | | | | | | | | |
| | | LifePath Dynamic 2025
Master Portfolio
| | | | | | LifePath Dynamic 2035
Master Portfolio
| |
| | | Year Ended December 31, | | | | | | Year Ended December 31, | |
| | | 2019 | | | 2018 | | | | | | 2019 | | | 2018 | |
| | | |
INCREASE (DECREASE) IN NET ASSETS | | | | | | | | | | | | | |
| | | |
OPERATIONS | | | | | | | | | | | | | |
Net investment income | | $ | 1,535,622 | | | $ | 1,564,885 | | | | | | | $ | 1,370,075 | | | $ | 1,282,040 | |
Net realized gain | | | 3,267,846 | | | | 1,649,650 | | | | | | | | 3,686,616 | | | | 2,056,317 | |
Net change in unrealized appreciation (depreciation) | | | 5,434,548 | | | | (5,137,828 | ) | | | | | | | 6,521,444 | | | | (6,160,981 | ) |
| | | | | | | | | | | | | | | | | | | | |
Net increase (decrease) in net assets resulting from operations | | | 10,238,016 | | | | (1,923,293 | ) | | | | | | | 11,578,135 | | | | (2,822,624 | ) |
| | | | | | | | | | | | | | | | | | | | |
| | | |
CAPITAL TRANSACTIONS | | | | | | | | | | | | | |
Proceeds from contributions | | | 40,654,801 | | | | 18,530,872 | | | | | | | | 35,063,826 | | | | 12,543,337 | |
Value of withdrawals | | | (25,832,884 | ) | | | (37,906,609 | ) | | | | | | | (20,140,599 | ) | | | (22,338,088 | ) |
| | | | | | | | | | | | | | | | | | | | |
Net increase (decrease) in net assets derived from capital transactions | | | 14,821,917 | | | | (19,375,737 | ) | | | | | | | 14,923,227 | | | | (9,794,751 | ) |
| | | | | | | | | | | | | | | | | | | | |
| | | |
NET ASSETS | | | | | | | | | | | | | |
Total increase (decrease) in net assets | | | 25,059,933 | | | | (21,299,030 | ) | | | | | | | 26,501,362 | | | | (12,617,375 | ) |
Beginning of year | | | 44,363,236 | | | | 65,662,266 | | | | | | | | 42,880,995 | | | | 55,498,370 | |
| | | | | | | | | | | | | | | | | | | | |
End of year | | $ | 69,423,169 | | | $ | 44,363,236 | | | | | | | $ | 69,382,357 | | | $ | 42,880,995 | |
| | | | | | | | | | | | | | | | | | | | |
See notes to financial statements.
| | |
| 78 | | 2019 BLACKROCK ANNUAL REPORTTO SHAREHOLDERS |
Statements of Changes in Net Assets (continued)
| | | | | | | | | | | | | | | | | | | | |
| | | LifePath Dynamic 2045
Master Portfolio | | | | | | LifePath Dynamic 2055
Master Portfolio | |
| | | Year Ended December 31, | | | | | | Year Ended December 31, | |
| | | 2019 | | | 2018 | | | | | | 2019 | | | 2018 | |
| | | |
INCREASE (DECREASE) IN NET ASSETS | | | | | | | | | | | | | |
| | | |
OPERATIONS | | | | | | | | | | | | | |
Net investment income | | $ | 947,581 | | | $ | 797,042 | | | | | | | $ | 550,270 | | | $ | 435,004 | |
Net realized gain | | | 2,919,753 | | | | 1,229,751 | | | | | | | | 1,584,376 | | | | 562,245 | |
Net change in unrealized appreciation (depreciation) | | | 5,339,730 | | | | (4,588,826 | ) | | | | | | | 2,996,553 | | | | (2,530,570 | ) |
| | | | | | | | | | | | | | | | | | | | |
Net increase (decrease) in net assets resulting from operations | | | 9,207,064 | | | | (2,562,033 | ) | | | | | | | 5,131,199 | | | | (1,533,321 | ) |
| | | | | | | | | | | | | | | | | | | | |
| | | |
CAPITAL TRANSACTIONS | | | | | | | | | | | | | |
Proceeds from contributions | | | 24,344,103 | | | | 10,676,533 | | | | | | | | 14,024,845 | | | | 8,591,118 | |
Value of withdrawals | | | (13,233,618 | ) | | | (14,448,452 | ) | | | | | | | (8,767,876 | ) | | | (9,301,137 | ) |
| | | | | | | | | | | | | | | | | | | | |
Net increase (decrease) in net assets derived from capital transactions | | | 11,110,485 | | | | (3,771,919 | ) | | | | | | | 5,256,969 | | | | (710,019 | ) |
| | | | | | | | | | | | | | | | | | | | |
| | | |
NET ASSETS | | | | | | | | | | | | | |
Total increase (decrease) in net assets | | | 20,317,549 | | | | (6,333,952 | ) | | | | | | | 10,388,168 | | | | (2,243,340 | ) |
Beginning of year | | | 30,184,684 | | | | 36,518,636 | | | | | | | | 17,103,884 | | | | 19,347,224 | |
| | | | | | | | | | | | | | | | | | | | |
End of year | | $ | 50,502,233 | | | $ | 30,184,684 | | | | | | | $ | 27,492,052 | | | $ | 17,103,884 | |
| | | | | | | | | | | | | | | | | | | | |
See notes to financial statements.
Statements of Changes in Net Assets (continued)
| | | | |
| | | LifePath Dynamic 2065
Master Portfolio | |
| | | Period from 10/30/19 (a) to 12/31/19 | |
|
INCREASE (DECREASE) IN NET ASSETS | |
|
OPERATIONS | |
Net investment income | | $ | 31,912 | |
Net realized loss | | | (5,094 | ) |
Net change in unrealized appreciation (depreciation) | | | 191,955 | |
| | | | |
Net increase in net assets resulting from operations | | | 218,773 | |
| | | | |
|
CAPITAL SHARE TRANSACTIONS | |
Proceeds from contributions | | | 4,000,000 | |
Value of withdrawals | | | (470 | ) |
| | | | |
Net increase in net assets derived from capital transactions | | | 3,999,530 | |
| | | | |
|
NET ASSETS | |
Total increase in net assets | | | 4,218,303 | |
Beginning of period | | | — | |
| | | | |
End of period | | $ | 4,218,303 | |
| | | | |
| (a) | Commencement of operations. |
See notes to financial statements.
| | |
| 80 | | 2019 BLACKROCK ANNUAL REPORTTO SHAREHOLDERS |
Financial Highlights
| | | | | | | | | | | | | | | | | | | | |
| | | LifePath Dynamic 2025 Master Portfolio | |
| |
| | | Year Ended December 31, | |
| | | 2019 | | | 2018 | | | 2017 | | | 2016 | | | 2015 | |
| | | | | |
Total Return | | | | | | | | | | | | | | | | | | | | |
Total return | | | 19.88 | % | | | (4.33 | )% | | | 15.85 | % | | | 7.25 | % | | | (1.50 | )% |
| | | | | | | | | | | | | | | | | | | | |
| | | | | |
Ratios to Average Net Assets(a) | | | | | | | | | | | | | | | | | | | | |
Total expenses | | | 0.55 | % | | | 0.55 | % | | | 0.53 | % | | | 0.56 | % | | | 0.57 | % |
| | | | | | | | | | | | | | | | | | | | |
Total expenses after fees waived and/or reimbursed | | | 0.20 | % | | | 0.21 | % | | | 0.19 | % | | | 0.22 | % | | | 0.23 | % |
| | | | | | | | | | | | | | | | | | | | |
Net investment income | | | 2.65 | % | | | 2.46 | % | | | 2.05 | % | | | 2.10 | % | | | 1.98 | % |
| | | | | | | | | | | | | | | | | | | | |
| | | | | |
Supplemental Data | | | | | | | | | | | | | | | | | | | | |
Net assets, end of year (000) | | $
| 69,423
|
| | $ | 44,363 | | | $ | 65,662 | | | $ | 62,551 | | | $ | 65,105 | |
| | | | | | | | | | | | | | | | | | | | |
Portfolio turnover rate(b) | | | 35 | % | | | 38 | % | | | 32 | % | | | 54 | % | | | 51 | % |
| | | | | | | | | | | | | | | | | | | | |
| (a) | Includes the LifePath Dynamic Master Portfolio’s pro rata portion of expenses and share of the allocated net investment income from the following master portfolios (collectively, the “Underlying Master Portfolios”): |
| | | | |
| | | Range of Periods | |
Active Stock Master Portfolio | | | 2015 — 2019 | |
CoreAlpha Bond Master Portfolio | | | 2015 — 2019 | |
International Tilts Master Portfolio | | | 2015 — 2019 | |
Large Cap Index Master Portfolio | | | 2015 — 2017 | |
| | | | |
| | | Range of Periods | |
Master Small Cap Index Series | | | 2015 — 2017 | |
Master Total Return Portfolio | | | 2016 — 2019 | |
Includes the LifePath Dynamic Master Portfolio’s share of the Underlying Master Portfolios’ allocated fees waived and excludes expenses incurred indirectly as a result of investments in underlying funds:
| | | | | | | | | | | | | | | | | | | | |
| | | Year Ended December 31, | |
| | | 2019 | | | 2018 | | | 2017 | | | 2016 | | | 2015 | |
Allocated fees waived | | | 0.08 | % | | | 0.07 | % | | | 0.07 | % | | | 0.06 | % | | | 0.05 | % |
Investments in underlying funds | | | 0.10 | % | | | 0.10 | % | | | 0.14 | % | | | 0.11 | % | | | 0.13 | % |
| | | | | | | | | | | | | | | | | | | | |
The ratios do not reflect any expenses incurred indirectly as a result of investments in the following underlying funds:
| | | | |
| | | Range of Periods | |
BlackRock Cash Funds: Institutional | | | 2015 — 2019 | |
BlackRock Cash Funds: Prime | | | 2015 — 2017 | |
BlackRock Cash Funds: Treasury | | | 2016 — 2019 | |
BlackRock Commodity Strategies Fund | | | 2015 — 2017 | |
| | | | |
| | | Range of Periods | |
BlackRock Advantage Emerging Markets Fund | | | 2015 — 2019 | |
BlackRock Tactical Opportunities Fund | | | 2016 — 2019 | |
iShares Exchange-Traded Funds | | | 2015 — 2019 | |
iShares Developed Real Estate Index Fund | | | 2019 | |
| (b) | Includes the purchases and sales of the underlying funds and the Underlying Master Portfolios. |
See notes to financial statements.
Financial Highlights (continued)
| | | | | | | | | | | | | | | | | | | | |
| | | LifePath Dynamic 2035 Master Portfolio | |
| |
| | | Year Ended December 31, | |
| | | 2019 | | | 2018 | | | 2017 | | | 2016 | | | 2015 | |
| | | | | |
Total Return | | | | | | | | | | | | | | | | | | | | |
Total return | | | 24.09 | % | | | (6.09 | )% | | | 19.93 | % | | | 7.99 | % | | | (1.65 | )% |
| | | | | | | | | | | | | | | | | | | | |
| | | | | |
Ratios to Average Net Assets(a) | | | | | | | | | | | | | | | | | | | | |
Total expenses | | | 0.55 | % | | | 0.55 | % | | | 0.53 | % | | | 0.55 | % | | | 0.57 | % |
| | | | | | | | | | | | | | | | | | | | |
Total expenses after fees waived and/or reimbursed | | | 0.20 | % | | | 0.20 | % | | | 0.18 | % | | | 0.20 | % | | | 0.20 | % |
| | | | | | | | | | | | | | | | | | | | |
Net investment income | | | 2.54 | % | | | 2.30 | % | | | 1.97 | % | | | 2.13 | % | | | 2.02 | % |
| | | | | | | | | | | | | | | | | | | | |
| | | | | |
Supplemental Data | | | | | | | | | | | | | | | | | | | | |
Net assets, end of year (000) | | $ | 69,382 | | | $ | 42,881 | | | $ | 55,498 | | | $ | 57,377 | | | $ | 56,100 | |
| | | | | | | | | | | | | | | | | | | | |
Portfolio turnover rate(b) | | | 42 | % | | | 40 | % | | | 35 | % | | | 76 | % | | | 44 | % |
| | | | | | | | | | | | | | | | | | | | |
| (a) | Includes the LifePath Dynamic Master Portfolio’s pro rata portion of expenses and share of the allocated net investment income from the following master portfolios (collectively, the “Underlying Master Portfolios”): |
| | | | |
| | | Range of Periods | |
Active Stock Master Portfolio | | | 2015 — 2019 | |
CoreAlpha Bond Master Portfolio | | | 2015 — 2019 | |
International Tilts Master Portfolio | | | 2015 — 2019 | |
Large Cap Index Master Portfolio | | | 2015 — 2017 | |
| | | | |
| | | Range of Periods | |
Master Small Cap Index Series | | | 2015 — 2017 | |
Master Total Return Portfolio | | | 2016 — 2019 | |
Includes the LifePath Dynamic Master Portfolio’s share of the Underlying Master Portfolios’ allocated fees waived and excludes expenses incurred indirectly as a result of investments in underlying funds:
| | | | | | | | | | | | | | | | | | | | |
| | | Year Ended December 31, | |
| | | 2019 | | | 2018 | | | 2017 | | | 2016 | | | 2015 | |
Allocated fees waived | | | 0.10 | % | | | 0.08 | % | | | 0.09 | % | | | 0.07 | % | | | 0.06 | % |
Investments in underlying funds | | | 0.12 | % | | | 0.12 | % | | | 0.16 | % | | | 0.13 | % | | | 0.16 | % |
| | | | | | | | | | | | | | | | | | | | |
The ratios do not reflect any expenses incurred indirectly as a result of investments in the following underlying funds:
| | | | |
| | | Range of Periods | |
BlackRock Cash Funds: Institutional | | | 2015 — 2019 | |
BlackRock Cash Funds: Prime | | | 2015 — 2017 | |
BlackRock Cash Funds: Treasury | | | 2016 — 2019 | |
BlackRock Commodity Strategies Fund | | | 2015 — 2019 | |
| | | | |
| | | Range of Periods | |
BlackRock Advantage Emerging Markets Fund | | | 2015 — 2019 | |
BlackRock Tactical Opportunities Fund | | | 2016 — 2019 | |
iShares Exchange-Traded Funds | | | 2015 — 2019 | |
iShares Developed Real Estate Index Fund | | | 2019 | |
| (b) | Includes the purchases and sales of the underlying funds and the Underlying Master Portfolios. |
See notes to financial statements.
| | |
| 82 | | 2019 BLACKROCK ANNUAL REPORTTO SHAREHOLDERS |
Financial Highlights (continued)
| | | | | | | | | | | | | | | | | | | | |
| | | LifePath Dynamic 2045 Master Portfolio | |
| |
| | | Year Ended December 31, | |
| | | 2019 | | | 2018 | | | 2017 | | | 2016 | | | 2015 | |
| | | | | |
Total Return | | | | | | | | | | | | | | | | | | | | |
Total return | | | 26.82 | % | | | (7.86 | )% | | | 22.72 | % | | | 8.52 | % | | | (1.87 | )% |
| | | | | | | | | | | | | | | | | | | | |
| | | | | |
Ratios to Average Net Assets(a) | | | | | | | | | | | | | | | | | | | | |
Total expenses | | | 0.58 | % | | | 0.57 | % | | | 0.56 | % | | | 0.56 | % | | | 0.59 | % |
| | | | | | | | | | | | | | | | | | | | |
Total expenses after fees waived and/or reimbursed | | | 0.20 | % | | | 0.20 | % | | | 0.18 | % | | | 0.18 | % | | | 0.17 | % |
| | | | | | | | | | | | | | | | | | | | |
Net investment income | | | 2.50 | % | | | 2.14 | % | | | 1.97 | % | | | 2.12 | % | | | 2.02 | % |
| | | | | | | | | | | | | | | | | | | | |
| | | | | |
Supplemental Data | | | | | | | | | | | | | | | | | | | | |
Net assets, end of year (000) | | $ | 50,502 | | | $ | 30,185 | | | $ | 36,519 | | | $ | 36,423 | | | $ | 34,517 | |
| | | | | | | | | | | | | | | | | | | | |
Portfolio turnover rate(b) | | | 49 | % | | | 47 | % | | | 46 | % | | | 75 | % | | | 50 | % |
| | | | | | | | | | | | | | | | | | | | |
| (a) | Includes the LifePath Dynamic Master Portfolio’s pro rata portion of expenses and share of the allocated net investment income from the following master portfolios (collectively, the “Underlying Master Portfolios”): |
| | | | |
| | | Range of Periods | |
Active Stock Master Portfolio | | | 2015 — 2019 | |
CoreAlpha Bond Master Portfolio | | | 2015 — 2019 | |
International Tilts Master Portfolio | | | 2015 — 2019 | |
Large Cap Index Master Portfolio | | | 2015 — 2017 | |
| | | | |
| | | Range of Periods | |
Master Small Cap Index Series | | | 2015 — 2017 | |
Master Total Return Portfolio | | | 2016 — 2019 | |
Includes the LifePath Dynamic Master Portfolio’s share of the Underlying Master Portfolios’ allocated fees waived and excludes expenses incurred indirectly as a result of investments in underlying funds:
| | | | | | | | | | | | | | | | | | | | |
| | | Year Ended December 31, | |
| | | 2019 | | | 2018 | | | 2017 | | | 2016 | | | 2015 | |
Allocated fees waived | | | 0.11 | % | | | 0.09 | % | | | 0.09 | % | | | 0.07 | % | | | 0.06 | % |
Investments in underlying funds | | | 0.12 | % | | | 0.12 | % | | | 0.17 | % | | | 0.15 | % | | | 0.18 | % |
| | | | | | | | | | | | | | | | | | | | |
The ratios do not reflect any expenses incurred indirectly as a result of investments in the following underlying funds:
| | | | |
| | | Range of Periods | |
BlackRock Cash Funds: Institutional | | | 2015 — 2019 | |
BlackRock Cash Funds: Prime | | | 2015 — 2017 | |
BlackRock Cash Funds: Treasury | | | 2016 — 2019 | |
BlackRock Commodity Strategies Fund | | | 2015 — 2017 | |
| | | | |
| | | Range of Periods | |
BlackRock Advantage Emerging Markets Fund | | | 2015 — 2019 | |
BlackRock Tactical Opportunities Fund | | | 2016 — 2019 | |
iShares Exchange-Traded Funds | | | 2015 — 2019 | |
iShares Developed Real Estate Index Fund | | | 2019 | |
| (b) | Includes the purchases and sales of the underlying funds and the Underlying Master Portfolios. |
See notes to financial statements.
Financial Highlights (continued)
| | | | | | | | | | | | | | | | | | | | |
| | | LifePath Dynamic 2055 Master Portfolio | |
| |
| | | Year Ended December 31, | |
| | | 2019 | | | 2018 | | | 2017 | | | 2016 | | | 2015 | |
| | | | | |
Total Return | | | | | | | | | | | | | | | | | | | | |
Total return | | | 26.92 | % | | | (8.10 | )% | | | 23.00 | % | | | 8.58 | % | | | (2.02 | )% |
| | | | | | | | | | | | | | | | | | | | |
| | | | | |
Ratios to Average Net Assets(a) | | | | | | | | | | | | | | | | | | | | |
Total expenses | | | 0.62 | % | | | 0.62 | % | | | 0.62 | % | | | 0.63 | % | | | 0.72 | % |
| | | | | | | | | | | | | | | | | | | | |
Total expenses after fees waived and/or reimbursed | | | 0.19 | % | | | 0.19 | % | | | 0.17 | % | | | 0.19 | % | | | 0.17 | % |
| | | | | | | | | | | | | | | | | | | | |
Net investment income | | | 2.47 | % | | | 2.10 | % | | | 1.98 | % | | | 2.09 | % | | | 2.03 | % |
| | | | | | | | | | | | | | | | | | | | |
| | | | | |
Supplemental Data | | | | | | | | | | | | | | | | | | | | |
Net assets, end of year (000) | | $ | 27,492 | | | $ | 17,104 | | | $ | 19,347 | | | $ | 19,386 | | | $ | 15,850 | |
| | | | | | | | | | | | | | | | | | | | |
Portfolio turnover rate(b) | | | 54 | % | | | 57 | % | | | 59 | % | | | 80 | % | | | 49 | % |
| | | | | | | | | | | | | | | | | | | | |
| (a) | Includes the LifePath Dynamic Master Portfolio’s pro rata portion of expenses and share of the allocated net investment income from the following master portfolios (collectively, the “Underlying Master Portfolios”): |
| | | | |
| | | Range of Periods | |
Active Stock Master Portfolio | | | 2015 — 2019 | |
CoreAlpha Bond Master Portfolio | | | 2015 — 2019 | |
International Tilts Master Portfolio | | | 2015 — 2019 | |
Large Cap Index Master Portfolio | | | 2015 — 2017 | |
| | | | |
| | | Range of Periods | |
Master Small Cap Index Series | | | 2015 — 2017 | |
Master Total Return Portfolio | | | 2016 — 2019 | |
Includes the LifePath Dynamic Master Portfolio’s share of the Underlying Master Portfolios’ allocated fees waived and excludes expenses incurred indirectly as a result of investments in underlying funds:
| | | | | | | | | | | | | | | | | | | | |
| | | Year Ended December 31, | |
| | | 2019 | | | 2018 | | | 2017 | | | 2016 | | | 2015 | |
Allocated fees waived | | | 0.11 | % | | | 0.09 | % | | | 0.08 | % | | | 0.07 | % | | | 0.07 | % |
Investments in underlying funds | | | 0.13 | % | | | 0.12 | % | | | 0.15 | % | | | 0.18 | % | | | 0.18 | % |
| | | | | | | | | | | | | | | | | | | | |
The ratios do not reflect any expenses incurred indirectly as a result of investments in the following underlying funds:
| | | | |
| | | Range of Periods | |
BlackRock Cash Funds: Institutional | | | 2015 — 2019 | |
BlackRock Cash Funds: Prime | | | 2015 — 2017 | |
BlackRock Cash Funds: Treasury | | | 2016 — 2019 | |
BlackRock Commodity Strategies Fund | | | 2015 — 2017 | |
| | | | |
| | | Range of Periods | |
BlackRock Advantage Emerging Markets Fund | | | 2015 — 2019 | |
BlackRock Tactical Opportunities Fund | | | 2016 — 2019 | |
iShares Exchange-Traded Funds | | | 2015 — 2019 | |
iShares Developed Real Estate Index Fund | | | 2019 | |
| (b) | Includes the purchases and sales of the underlying funds and the Underlying Master Portfolios. |
See notes to financial statements.
| | |
| 84 | | 2019 BLACKROCK ANNUAL REPORTTO SHAREHOLDERS |
Financial Highlights (continued)
| | | | |
| | | LifePath Dynamic 2065
Master Portfolio | |
| | | Period from
10/30/19 (a)
to 12/31/19 | |
| |
Total Return | | | | |
Total return | | | 5.42 | %(b) |
| | | | |
| |
Ratios to Average Net Assets(c)(d) | | | | |
Total expenses | | | 1.16 | %(e) |
| | | | |
Total expenses after fees waived and/or reimbursed | | | 0.21 | % |
| | | | |
Net investment income | | | 4.56 | % |
| | | | |
| |
Supplemental Data | | | | |
Net assets end of period (000) | | $ | 4,218 | |
| | | | |
Portfolio turnover rate(f) | | | 3 | % |
| | | | |
| (a) | Commencement of operations. |
| (b) | Aggregate total return. |
| (d) | Includes the LifePath Dynamic Master Portfolio’s pro rata portion of expenses and share of the allocated net investment income from the following master portfolios (collectively, the “Underlying Master Portfolios”): |
| | | | |
| | | Range of Periods | |
CoreAlpha Bond Master Portfolio | | | 2019 | |
Active Stock Master Portfolio | | | 2019 | |
International Tilts Master Portfolio | | | 2019 | |
| | | | |
| | | Range of Periods | |
Master Total Return Portfolio | | | 2019 | |
Includes the LifePath Dynamic Master Portfolio’s share of the Underlying Master Portfolios’ allocated fees waived of 0.12%. Excludes expenses incurred indirectly as a result of investments in underlying funds of 0.13%.
The ratios do not reflect any expenses incurred indirectly as a result of investments in the following underlying funds:
| | | | |
| | | Range of Periods | |
BlackRock Cash Funds: Institutional | | | 2019 | |
BlackRock Cash Funds: Treasury | | | 2019 | |
BlackRock Advantage Emerging Markets Fund | | | 2019 | |
| | | | |
| | | Range of Periods | |
iShares Exchange-Traded Funds | | | 2019 | |
iShares Developed Real Estate Index Fund | | | 2019 | |
| (e) | Audit fees were not annualized in the calculation of expense ratios. If this expense was annualized, the total expenses would have been 3.02%. |
| (f) | Includes the purchases and sales of the underlying funds and the Underlying Master Portfolios. |
See notes to financial statements.
Notes to Financial Statements
Master Investment Portfolio (“MIP”) is registered under the Investment Company Act of 1940, as amended (the “1940 Act”), as anopen-end management investment company. MIP is organized as a Delaware statutory trust. The financial statements and these accompanying notes relate to five series of MIP: LifePath® Dynamic 2025 Master Portfolio, LifePath® Dynamic 2035 Master Portfolio, LifePath® Dynamic 2045 Master Portfolio, LifePath® Dynamic 2055 Master Portfolio and LifePath® Dynamic 2065 Master Portfolio (each, a “LifePath Dynamic Master Portfolio” and together, the “LifePath Dynamic Master Portfolios”). Each of the LifePath Dynamic Master Portfolios is classified as diversified.
As of period end, the investment of LifePath Dynamic 2025 Master Portfolio, LifePath Dynamic 2035 Master Portfolio, LifePath Dynamic 2045 Master Portfolio, LifePath Dynamic 2055 Master Portfolio and LifePath Dynamic 2065 Master Portfolio in the Active Stock Master Portfolio represented 30.7%, 42.2%, 50.6%, 52.4% and 52.1%, respectively, of net assets. The investment of LifePath Dynamic 2025 Master Portfolio, LifePath Dynamic 2035 Master Portfolio, LifePath Dynamic 2045 Master Portfolio, LifePath Dynamic 2055 Master Portfolio and LifePath Dynamic 2065 Master Portfolio in the CoreAlpha Bond Master Portfolio represented 30.2%, 13.3%, 2.4%, 0.9% and 0.8%, respectively, of net assets. As such, financial statements of the Active Stock Master Portfolio and CoreAlpha Bond Master Portfolio, including the Schedules of Investments, should be read in conjunction with each respective LifePath Dynamic Master Portfolio’s financial statements. Active Stock Master Portfolio’s and CoreAlpha Bond Master Portfolio’s financial statements are available, without charge, on the U.S. Securities and Exchange Commission’s (“SEC’s”) website at sec.gov.
The LifePath Dynamic Master Portfolios will generally invest in other registered investment companies (each, an “Underlying Fund” and collectively, the “Underlying Funds”) that are managed by subsidiaries of BlackRock, Inc. (“BlackRock”) and its affiliates, which are affiliates of the LifePath Dynamic Master Portfolios. The LifePath Dynamic Master Portfolios may also invest in other master portfolios (“Underlying Master Portfolios”) that are managed by subsidiaries of BlackRock.
The value of a LifePath Dynamic Master Portfolio’s investment in each of Active Stock Master Portfolio, CoreAlpha Bond Master Portfolio, International Tilts Master Portfolio and Master Total Return Portfolio reflects that LifePath Dynamic Master Portfolio’s proportionate interest in the net assets of that master portfolio. As of period end, the LifePath Dynamic Master Portfolios held interests in Underlying Master Portfolios as follows:
| | | | | | | | | | | | | | | | |
| | | Active Stock Master Portfolio | | | CoreAlpha
Bond Master Portfolio | | | International Tilts Master Portfolio | | | Master Total Return Portfolio | |
LifePath Dynamic 2025 Master Portfolio | | | 4.2 | % | | | 1.1 | % | | | 3.3 | | | | 0.02 | % |
LifePath Dynamic 2035 Master Portfolio | | | 5.8 | | | | 0.5 | | | | 5.2 | | | | 0.01 | |
LifePath Dynamic 2045 Master Portfolio | | | 5.0 | | | | 0.1 | | | | 4.8 | | | | 0.00 | |
LifePath Dynamic 2055 Master Portfolio | | | 2.8 | | | | 0.0 | | | | 2.8 | | | | 0.00 | |
LifePath Dynamic 2065 Master Portfolio | | | 0.4 | | | | 0.0 | | | | 0.4 | | | | 0.00 | |
The LifePath Dynamic Master Portfolios, together with certain other registered investment companies advised by BlackRock Fund Advisors (“BFA” or the “Manager”) or its affiliates, are included in a complex of equity, multi-asset, index and money market funds referred to as the BlackRock Multi-Asset Complex.
On November 12-13, 2019, the Board of Trustees of MIP (the “Board”) approved a proposal pursuant to which each “feeder” fund will cease to invest in its corresponding LifePath Dynamic Master Portfolio as part of a “master-feeder” structure and instead each “feeder” fund will operate as a stand-alone fund. These changes are expected to be effective on or about March 9, 2020.
| 2. | SIGNIFICANT ACCOUNTING POLICIES |
The financial statements are prepared in conformity with accounting principles generally accepted in the United States of America (“U.S. GAAP”), which may require management to make estimates and assumptions that affect the reported amounts of assets and liabilities in the financial statements, disclosure of contingent assets and liabilities at the date of the financial statements and the reported amounts of increases and decreases in net assets from operations during the reporting period. Actual results could differ from those estimates. Each LifePath Dynamic Master Portfolio is considered an investment company under U.S. GAAP and follows the accounting and reporting guidance applicable to investment companies. Below is a summary of significant accounting policies:
Investment Transactions and Income Recognition:For financial reporting purposes, investment transactions are recorded on the dates the transactions are executed. Realized gains and losses on investment transactions are determined on the identified cost basis. Dividend income is recorded on theex-dividend date. Dividends from foreign securities where theex-dividend date may have passed are subsequently recorded when the LifePath Dynamic Master Portfolios are informed of theex-dividend date. Under the applicable foreign tax laws, a withholding tax at various rates may be imposed on capital gains, dividends and interest. Upon notification from issuers, a portion of the dividend income received from a real estate investment trust may be redesignated as a reduction of cost of the related investment and/or realized gain. Interest income, including amortization and accretion of premiums and discounts on debt securities, is recognized on an accrual basis.
Each LifePath Dynamic Master Portfolio records daily its proportionate share of the Underlying Master Portfolios’ income, expenses and realized and unrealized gains and losses.
Foreign Currency Translation:Each LifePath Dynamic Master Portfolio’s books and records are maintained in U.S. dollars. Securities and other assets and liabilities denominated in foreign currencies are translated into U.S. dollars using exchange rates determined as of the close of trading on the New York Stock Exchange (“NYSE”). Purchases and sales of investments are recorded at the rates of exchange prevailing on the respective dates of such transactions. Generally, when the U.S. dollar rises in value against a foreign currency, the investments denominated in that currency will lose value; the opposite effect occurs if the U.S. dollar falls in relative value.
Each LifePath Dynamic Master Portfolio does not isolate the portion of the results of operations arising as a result of changes in the exchange rates from the changes in the market prices of investments held or sold for financial reporting purposes. Accordingly, the effects of changes in exchange rates on investments are not segregated in
| | |
| 86 | | 2019 BLACKROCK ANNUAL REPORTTO SHAREHOLDERS |
Notes to Financial Statements (continued)
the Statements of Operations from the effects of changes in market prices of those investments, but are included as a component of net realized and unrealized gain (loss) from investments. Each LifePath Dynamic Master Portfolio reports realized currency gains (losses) on foreign currency related transactions as components of net realized gain (loss) for financial reporting purposes, whereas such components are generally treated as ordinary income for U.S. federal income tax purposes.
Segregation and Collateralization:In cases where a LifePath Dynamic Master Portfolio enters into certain investments (e.g., futures contracts and forward foreign currency exchange contracts) that would be treated as “senior securities” for 1940 Act purposes, a LifePath Dynamic Master Portfolio may segregate or designate on its books and records cash or liquid assets having a market value at least equal to the amount of its future obligations under such investments. Doing so allows the investment or borrowings to be excluded from treatment as a “senior security.” Furthermore, if required by an exchange or counterparty agreement, the LifePath Dynamic Master Portfolios may be required to deliver/deposit cash and/or securities to/with an exchange, or broker-dealer or custodian as collateral for certain investments or obligations.
Indemnifications:In the normal course of business, a LifePath Dynamic Master Portfolio enters into contracts that contain a variety of representations that provide general indemnification. A LifePath Dynamic Master Portfolio’s maximum exposure under these arrangements is unknown because it involves future potential claims against a LifePath Dynamic Master Portfolio, which cannot be predicted with any certainty.
Other: Expenses directly related to a LifePath Dynamic Master Portfolio are charged to that LifePath Dynamic Master Portfolio. Other operating expenses shared by several funds, including other funds managed by the Manager, are prorated among those funds on the basis of relative net assets or other appropriate methods.
| 3. | INVESTMENT VALUATION AND FAIR VALUE MEASUREMENTS |
Investment Valuation Policies: The LifePath Dynamic Master Portfolios’ investments are valued at fair value (also referred to as “market value” within the financial statements) as of the close of trading on the NYSE (generally 4:00 p.m., Eastern time) (or if the reporting date falls on a day the NYSE is closed, investments are valued at fair value as of the period end). U.S. GAAP defines fair value as the price the LifePath Dynamic Master Portfolios would receive to sell an asset or pay to transfer a liability in an orderly transaction between market participants at the measurement date. The LifePath Dynamic Master Portfolios determine the fair values of their financial instruments using various independent dealers or pricing services under policies approved by the Board. The BlackRock Global Valuation Methodologies Committee (the “Global Valuation Committee”) is the committee formed by management to develop global pricing policies and procedures and to oversee the pricing function for all financial instruments.
Fair Value Inputs and Methodologies: The following methods and inputs are used to establish the fair value of each LifePath Dynamic Master Portfolio’s assets and liabilities:
| | • | | Equity investments traded on a recognized securities exchange are valued at the official closing price each day, if available. For equity investments traded on more than one exchange, the official closing price on the exchange where the stock is primarily traded is used. Equity investments traded on a recognized exchange for which there were no sales on that day may be valued at the last available bid (long positions) or ask (short positions) price. |
| | | Generally, trading in foreign instruments is substantially completed each day at various times prior to the close of trading on the NYSE. Occasionally, events affecting the values of such instruments may occur between the foreign market close and the close of trading on the NYSE that may not be reflected in the computation of the LifePath Dynamic Master Portfolios’ net assets. Each business day, the LifePath Dynamic Master Portfolios use a pricing service to assist with the valuation of certain foreign exchange-traded equity securities and foreign exchange-traded andover-the-counter (“OTC”) options (the “Systematic Fair Value Price”). Using current market factors, the Systematic Fair Value Price is designed to value such foreign securities and foreign options at fair value as of the close of trading on the NYSE, which follows the close of the local markets. |
| | • | | Investments inopen-end U.S. mutual funds are valued at net asset value (“NAV”) each business day. |
| | • | | Futures contracts traded on exchanges are valued at their last sale price. |
| | • | | Forward foreign currency exchange contracts are valued at the mean between the bid and ask prices and are determined as of the close of trading on the NYSE based on that day’s prevailing forward exchange rate for the underlying currencies. Interpolated values are derived when the settlement date of the contract is an interim date for which quotations are not available. |
| | • | | Swap agreements are valued utilizing quotes received daily by the LifePath Dynamic Master Portfolios’ pricing service or through brokers, which are derived using daily swap curves and models that incorporate a number of market data factors, such as discounted cash flows, trades and values of the underlying reference instruments. |
| | • | | The LifePath Dynamic Master Portfolios record their proportionate investment in the Underlying Master Portfolios at fair value, which is based upon their pro rata ownership in the net assets of the Underlying Master Portfolios. |
If events (e.g., a company announcement, market volatility or a natural disaster) occur that are expected to materially affect the value of such investments, or in the event that the application of these methods of valuation results in a price for an investment that is deemed not to be representative of the market value of such investment, or if a price is not available, the investment will be valued by the Global Valuation Committee, or its delegate, in accordance with a policy approved by the Board as reflecting fair value (“Fair Valued Investments”). The fair valuation approaches that may be used by the Global Valuation Committee will include market approach, income approach and cost approach. Valuation techniques such as discounted cash flow, use of market comparables and matrix pricing are types of valuation approaches and are typically used in determining fair value. When determining the price for Fair Valued Investments, the Global Valuation Committee, or its delegate, seeks to determine the price that each LifePath Dynamic Master Portfolio might reasonably expect to receive or pay from the current sale or purchase of that asset or liability in anarm’s-length transaction. Fair value determinations shall be based upon all available factors that the Global Valuation Committee, or its delegate, deems relevant and consistent with the principles of fair value measurement. The pricing of all Fair Valued Investments is subsequently reported to the Board or a committee thereof on a quarterly basis.
| | | | |
| NOTESTO FINANCIAL STATEMENTS | | | 87 | |
Notes to Financial Statements (continued)
Fair Value Hierarchy: Various inputs are used in determining the fair value of investments and derivative financial instruments. These inputs to valuation techniques are categorized into a fair value hierarchy consisting of three broad levels for financial statement purposes as follows:
| | • | | Level 1 — Unadjusted price quotations in active markets/exchanges for identical assets or liabilities that each LifePath Dynamic Master Portfolio has the ability to access |
| | • | | Level 2 — Other observable inputs (including, but not limited to, quoted prices for similar assets or liabilities in markets that are active, quoted prices for identical or similar assets or liabilities in markets that are not active, inputs other than quoted prices that are observable for the assets or liabilities (such as interest rates, yield curves, volatilities, prepayment speeds, loss severities, credit risks and default rates) or other market–corroborated inputs) |
| | • | | Level 3 — Unobservable inputs based on the best information available in the circumstances, to the extent observable inputs are not available (including the Global Valuation Committee’s assumptions used in determining the fair value of investments and derivative financial instruments) |
The hierarchy gives the highest priority to unadjusted quoted prices in active markets for identical assets or liabilities (Level 1 measurements) and the lowest priority to unobservable inputs (Level 3 measurements). Accordingly, the degree of judgment exercised in determining fair value is greatest for instruments categorized in Level 3. The inputs used to measure fair value may fall into different levels of the fair value hierarchy. In such cases, for disclosure purposes, the fair value hierarchy classification is determined based on the lowest level input that is significant to the fair value measurement in its entirety. Investments classified within Level 3 have significant unobservable inputs used by the Global Valuation Committee in determining the price for Fair Valued Investments. Level 3 investments include equity or debt issued by privately held companies or funds. There may not be a secondary market, and/or there are a limited number of investors. The categorization of a value determined for investments and derivative financial instruments is based on the pricing transparency of the investments and derivative financial instruments and is not necessarily an indication of the risks associated with investing in those securities.
As of December 31, 2019, certain investments of the LifePath Dynamic Master Portfolios were valued using NAV as no quoted market value is available and therefore have been excluded from the fair value hierarchy.
| 4. | SECURITIES AND OTHER INVESTMENTS |
Securities Lending:Certain LifePath Dynamic Master Portfolios may lend their securities to approved borrowers, such as brokers, dealers and other financial institutions. The borrower pledges and maintains with the LifePath Dynamic Master Portfolios collateral consisting of cash, an irrevocable letter of credit issued by a bank, or securities issued or guaranteed by the U.S. Government. The initial collateral received by each LifePath Dynamic Master Portfolio is required to have a value of at least 102% of the current value of the loaned securities for securities traded on U.S. exchanges and a value of at least 105% for all other securities. The collateral is maintained thereafter at a value equal to at least 100% of the current market value of the securities on loan. The market value of the loaned securities is determined at the close of each business day of the LifePath Dynamic Master Portfolio and any additional required collateral is delivered to the LifePath Dynamic Master Portfolio, or excess collateral returned by the LifePath Dynamic Master Portfolio, on the next business day. During the term of the loan, the LifePath Dynamic Master Portfolios are entitled to all distributions made on or in respect of the loaned securities, but do not receive interest income on securities received as collateral. Loans of securities are terminable at any time and the borrower, after notice, is required to return borrowed securities within the standard time period for settlement of securities transactions.
The market value of any securities on loan, all of which were classified as investment companies and common stocks in the LifePath Dynamic Master Portfolios’ Schedules of Investments, and the value of any related collateral are shown separately in the Statements of Assets and Liabilities as a component of investments at value-unaffiliated, and collateral on securities loaned at value, respectively. As of period end, any securities on loan were collateralized by cash and/or U.S. Government obligations. Cash collateral invested by the securities lending agent, BlackRock Institutional Trust Company, N.A. (“BTC”), if any, is disclosed in the Schedules of Investments.
Securities lending transactions are entered into by the LifePath Dynamic Master Portfolios under Master Securities Lending Agreements (each, an “MSLA”), which provide the right, in the event of default (including bankruptcy or insolvency), for thenon-defaulting party to liquidate the collateral and calculate a net exposure to the defaulting party or request additional collateral. In the event that a borrower defaults, the LifePath Dynamic Master Portfolios, as lender, would offset the market value of the collateral received against the market value of the securities loaned. When the value of the collateral is greater than that of the market value of the securities loaned, the lender is left with a net amount payable to the defaulting party. However, bankruptcy or insolvency laws of a particular jurisdiction may impose restrictions on or prohibitions against such a right of offset in the event of an MSLA counterparty’s bankruptcy or insolvency. Under the MSLA, absent an event of default, the borrower can resell orre-pledge the loaned securities, and a LifePath Dynamic Master Portfolio can reinvest cash collateral received in connection with loaned securities. Upon an event of default, the parties’ obligations to return the securities or collateral to the other party are extinguished, and the parties can resell orre-pledge the loaned securities or the collateral received in connection with the loaned securities in order to satisfy the defaulting party’s net payment obligation for all transactions under the MSLA. The defaulting party remains liable for any deficiency.
As of period end, the following table is a summary of the LifePath Dynamic Master Portfolios’ securities lending agreements by counterparty which are subject to offset under an MSLA:
| | | | | | | | | | | | |
| Counterparty | | Securities Loaned at Value | | | Cash Collateral Received (a) | | | Net Amount | |
LifePath Dynamic 2025 Master Portfolio | | | | | | | | | | | | |
Goldman Sachs & Co. | | $ | 940,428 | | | $ | (940,428 | ) | | $ | — | |
Wells Fargo Bank, National Association | | | 18,684 | | | | (18,684 | ) | | | — | |
| | | | | | | | | | | | |
| | $ | 959,112 | | | $ | (959,112 | ) | | $ | — | |
| | | | | | | | | | | | |
| | |
| 88 | | 2019 BLACKROCK ANNUAL REPORTTO SHAREHOLDERS |
Notes to Financial Statements (continued)
| | | | | | | | | | | | |
| Counterparty | | Securities Loaned at Value | | | Cash Collateral Received (a) | | | Net Amount | |
LifePath Dynamic 2035 Master Portfolio | | | | | | | | | | | | |
Bank of America N.A. | | $ | 1,989,908 | | | $ | (1,989,908 | ) | | $ | — | |
Wells Fargo Bank, National Association | | | 84,795 | | | | (84,795 | ) | | | — | |
Wells Fargo Securities LLC | | | 43,596 | | | | (43,596 | ) | | | — | |
| | | | | | | | | | | | |
| | $ | 2,118,299 | | | $ | (2,118,299 | ) | | $ | — | |
| | | | | | | | | | | | |
LifePath Dynamic 2045 Master Portfolio | | | | | | | | | | | | |
Wells Fargo Bank, National Association | | $ | 136,217 | | | $ | (136,217 | ) | | $ | — | |
| | | | | | | | | | | | |
| | $ | 136,217 | | | $ | (136,217 | ) | | $ | — | |
| | | | | | | | | | | | |
LifePath Dynamic 2055 Master Portfolio | | | | | | | | | | | | |
The Bank of Nova Scotia | | $ | 6,228 | | | $ | (6,228 | ) | | $ | — | |
| | | | | | | | | | | | |
| | $ | 6,228 | | | $ | (6,228 | ) | | $ | — | |
| | | | | | | | | | | | |
LifePath Dynamic 2065 Master Portfolio | | | | | | | | | | | | |
Citigroup Global Markets Inc. | | $ | 6,228 | | | $ | (6,228 | ) | | $ | — | |
JP Morgan Securities llc | | | 84,823 | | | | (84,823 | ) | | | — | |
Scotia Capital (USA) Inc. | | | 136,483 | | | | (136,483 | ) | | | — | |
| | | | | | | | | | | | |
| | $ | 227,534 | | | $ | (227,534 | ) | | $ | — | |
| | | | | | | | | | | | |
| | (a) | Collateral received in excess of the market value of securities on loan is not presented in this table. The total cash collateral received by each LifePath Dynamic Master Portfolio is disclosed in the LifePath Dynamic Master Portfolio’s Statements of Assets and Liabilities. | |
The risks of securities lending include the risk that the borrower may not provide additional collateral when required or may not return the securities when due. To mitigate these risks, the LifePath Dynamic Master Portfolios benefit from a borrower default indemnity provided by BlackRock, Inc. (“BlackRock”). BlackRock’s indemnity allows for full replacement of the securities loaned to the extent the collateral received does not cover the value on the securities loaned in the event of borrower default. Each LifePath Dynamic Master Portfolio could incur a loss if the value of an investment purchased with cash collateral falls below the market value of loaned securities or if the value of an investment purchased with cash collateral falls below the value of the original cash collateral received. Such losses are borne entirely by the LifePath Dynamic Master Portfolios.
| 5. | DERIVATIVE FINANCIAL INSTRUMENTS |
The LifePath Dynamic Master Portfolios engage in various portfolio investment strategies using derivative contracts both to increase the returns of the LifePath Dynamic Master Portfolios and/or to manage their exposure to certain risks such as credit risk, equity risk, interest rate risk, foreign currency exchange rate risk, commodity price risk or other risks (e.g., inflation risk). Derivative financial instruments categorized by risk exposure are included in the Schedules of Investments. These contracts may be transacted on an exchange orover-the-counter (“OTC.”).
Futures Contracts: Futures contracts are purchased or sold to gain exposure to, or manage exposure to, changes in interest rates (interest rate risk) and changes in the value of equity securities (equity risk) or foreign currencies (foreign currency exchange rate risk).
Futures contracts are agreements between the LifePath Dynamic Master Portfolios and a counterparty to buy or sell a specific quantity of an underlying instrument at a specified price and on a specified date. Depending on the terms of a contract, it is settled either through physical delivery of the underlying instrument on the settlement date or by payment of a cash amount on the settlement date. Upon entering into a futures contract, the LifePath Dynamic Master Portfolios are required to deposit initial margin with the broker in the form of cash or securities in an amount that varies depending on a contract’s size and risk profile. The initial margin deposit must then be maintained at an established level over the life of the contract. Amounts pledged, which are considered restricted, are included in cash pledged for futures contracts in the Statements of Assets and Liabilities.
Securities deposited as initial margin are designated in the Schedules of Investments and cash deposited, if any, is shown as cash pledged for futures contracts in the Statements of Assets and Liabilities. Pursuant to the contract, the LifePath Dynamic Master Portfolios agree to receive from or pay to the broker an amount of cash equal to the daily fluctuation in market value of the contract (“variation margin”). Variation margin is recorded as unrealized appreciation (depreciation) and, if any, shown as variation margin receivable (or payable) on futures contracts in the Statements of Assets and Liabilities. When the contract is closed, a realized gain or loss is recorded in the Statements of Operations equal to the difference between the notional amount of the contract at the time it was opened and the notional amount at the time it was closed. The use of futures contracts involves the risk of an imperfect correlation in the movements in the price of futures contracts and interest, foreign currency exchange rates or underlying assets.
Forward Foreign Currency Exchange Contracts: Forward foreign currency exchange contracts are entered into to gain or reduce exposure to foreign currencies (foreign currency exchange rate risk).
A forward foreign currency exchange contract is an agreement between two parties to buy and sell a currency at a set exchange rate on a specified date. These contracts help to manage the overall exposure to the currencies in which some of the investments held by the LifePath Dynamic Master Portfolios are denominated and in some cases, may be used to obtain exposure to a particular market.
The contract ismarked-to-market daily and the change in market value is recorded as unrealized appreciation (depreciation) in the Statements of Assets and Liabilities. When a contract is closed, a realized gain or loss is recorded in the Statements of Operations equal to the difference between the value at the time it was opened and the value at the time it was closed.Non-deliverable forward foreign currency exchange contracts are settled with the counterparty in cash without the delivery of foreign currency. The use of forward foreign currency exchange contracts involves the risk that the value of a forward foreign currency exchange contract changes unfavorably due to movements in the value of the referenced foreign currencies, and such value may exceed the amounts reflected in the Statements of Assets and Liabilities. Cash
| | | | |
| NOTESTO FINANCIAL STATEMENTS | | | 89 | |
Notes to Financial Statements (continued)
amounts pledged for forward foreign currency exchange contracts are considered restricted and are included in cash pledged as collateral for OTC derivatives in the Statements of Assets and Liabilities.
Master Netting Arrangements: In order to define their contractual rights and to secure rights that will help mitigate their counterparty risk, the LifePath Dynamic Master Portfolios may enter into an International Swaps and Derivatives Association, Inc. Master Agreement (“ISDA Master Agreement”) or similar agreement with their counterparties. An ISDA Master Agreement is a bilateral agreement between each LifePath Dynamic Master Portfolio and a counterparty that governs certain OTC derivatives and typically contains, among other things, collateral posting terms and netting provisions in the event of a default and/or termination event. Under an ISDA Master Agreement, each LifePath Dynamic Master Portfolio may, under certain circumstances, offset with the counterparty certain derivative financial instruments’ payables and/or receivables with collateral held and/or posted and create one single net payment. The provisions of the ISDA Master Agreement typically permit a single net payment in the event of default including the bankruptcy or insolvency of the counterparty. Bankruptcy or insolvency laws of a particular jurisdiction may restrict or prohibit the right of offset in bankruptcy, insolvency or other events.
Collateral Requirements: For derivatives traded under an ISDA Master Agreement, the collateral requirements are typically calculated by netting themark-to-market amount for each transaction under such agreement and comparing that amount to the value of any collateral currently pledged by the LifePath Dynamic Master Portfolio and the counterparty.
Cash collateral that has been pledged to cover obligations of the LifePath Dynamic Master Portfolios and cash collateral received from the counterparty, if any, is reported separately in the Statements of Assets and Liabilities as cash pledged as collateral and cash received as collateral, respectively.Non-cash collateral pledged by the LifePath Dynamic Master Portfolios, if any, is noted in the Schedules of Investments. Generally, the amount of collateral due from or to a counterparty is subject to a certain minimum transfer amount threshold before a transfer is required, which is determined at the close of business of the LifePath Dynamic Master Portfolios. Any additional required collateral is delivered to/pledged by the LifePath Dynamic Master Portfolios on the next business day. Typically, the counterparty is not permitted to sell,re-pledge or use cash andnon-cash collateral it receives. A LifePath Dynamic Master Portfolio generally agrees not to usenon-cash collateral that it receives but may, absent default or certain other circumstances defined in the underlying ISDA Master Agreement, be permitted to use cash collateral received. In such cases, interest may be paid pursuant to the collateral arrangement with the counterparty. To the extent amounts due to the LifePath Dynamic Master Portfolios from their counterparties are not fully collateralized, they bear the risk of loss from counterpartynon-performance. Likewise, to the extent the LifePath Dynamic Master Portfolios have delivered collateral to a counterparty and stand ready to perform under the terms of their agreement with such counterparty, they bear the risk of loss from a counterparty in the amount of the value of the collateral in the event the counterparty fails to return such collateral. Based on the terms of agreements, collateral may not be required for all derivative contracts.
For financial reporting purposes, the LifePath Dynamic Master Portfolios do not offset derivative assets and derivative liabilities that are subject to netting arrangements, if any, in the Statements of Assets and Liabilities.
| 6. | INVESTMENT ADVISORY AGREEMENT AND OTHER TRANSACTIONS WITH AFFILIATES |
Investment Advisory: MIP, on behalf of the LifePath Dynamic Master Portfolios, entered into an Investment Advisory Agreement with the Manager, the LifePath Dynamic Master Portfolios’ investment adviser and an indirect, wholly-owned subsidiary of BlackRock, to provide investment advisory services. The Manager is responsible for the management of each LifePath Dynamic Master Portfolio’s portfolio and provides the personnel, facilities, equipment and certain other services necessary to the operations of each LifePath Dynamic Master Portfolio.
For such services, each LifePath Dynamic Master Portfolio pays the Manager a monthly fee at an annual rate equal to 0.35% of the average daily value of each LifePath Dynamic Master Portfolio’s net assets.
With respect to each LifePath Dynamic Master Portfolio, the Manager entered into separatesub-advisory agreements with BlackRock International Limited (“BIL”), and BlackRock (Singapore) Limited (“BRS”) (collectively, the“Sub-Advisers”), each an affiliate of the Manager. The Manager pays each Sub-Advisor for services it provides for that portion of each LifePath Dynamic Master Portfolio for which it acts assub-adviser, a monthly fee that is equal to a percentage of the investment advisory fees paid by each LifePath Dynamic Master Portfolio to the Manager.
Administration: MIP, on behalf of the LifePath Dynamic Master Portfolios, entered into an Administration Agreement with BlackRock Advisors, LLC (“BAL”), which has agreed to provide general administrative services (other than investment advice and related portfolio activities). BAL has agreed to bear all of the LifePath Dynamic Master Portfolios’ ordinary operating expenses, excluding, generally, investment advisory fees, distribution fees, brokerage and other expenses related to the execution of portfolio transactions, extraordinary expenses and certain other expenses which are borne by the LifePath Dynamic Master Portfolios. BAL may delegate certain of its administration duties tosub-administrators.
BAL is not entitled to compensation for providing administrative services to the LifePath Dynamic Master Portfolios, for so long as BAL (or an affiliate) is entitled to compensation for providing administrative services to corresponding feeder funds that invest substantially all of their assets in the LifePath Dynamic Master Portfolios, or BAL (or an affiliate) receives investment advisory fees from the LifePath Dynamic Master Portfolios.
Expense Limitations and Waivers:BFA, with respect to each LifePath Dynamic Master Portfolio, has contractually agreed to waive and/or reimburse 0.30% of its investment advisory fees through April 30, 2020. These amounts are included in fees waived and/or reimbursed by the Manager in the Statements of Operations. For the year ended December 31, 2019, the amounts waived and/or reimbursed were as follows:
| | | | |
| | | Amounts Waived | |
LifePath Dynamic 2025 Master Portfolio | | $ | 173,221 | |
LifePath Dynamic 2035 Master Portfolio | | | 161,666 | |
LifePath Dynamic 2045 Master Portfolio | | | 113,321 | |
LifePath Dynamic 2055 Master Portfolio | | | 66,730 | |
LifePath Dynamic 2065 Master Portfolio | | | 2,090 | |
| | |
| 90 | | 2019 BLACKROCK ANNUAL REPORTTO SHAREHOLDERS |
Notes to Financial Statements (continued)
With respect to each LifePath Dynamic Master Portfolio, the Manager voluntarily agreed to waive its investment advisory fees by the amount of investment advisory fees each LifePath Dynamic Master Portfolio pays to the Manager indirectly through its investment in affiliated money market funds (the “affiliated money market fund waiver”). These amounts are included in fees waived and/or reimbursed by the Manager in the Statements of Operations. However, the Manager does not waive its investment advisory fees by the amount of investment advisory fees paid in connection with each LifePath Dynamic Master Portfolio’s investments in other affiliated investment companies, if any. For the year ended December 31, 2019, the amounts waived were as follows:
| | | | |
| | | Amounts Waived | |
LifePath Dynamic 2025 Master Portfolio | | $ | 1,999 | |
LifePath Dynamic 2035 Master Portfolio | | | 1,920 | |
LifePath Dynamic 2045 Master Portfolio | | | 1,458 | |
LifePath Dynamic 2055 Master Portfolio | | | 1,411 | |
LifePath Dynamic 2065 Master Portfolio | | | 24 | |
The fees and expenses of MIP’s trustees who are not “interested persons” of MIP, as defined in the 1940 Act (“Independent Trustees”), counsel to the Independent Trustees and the LifePath Dynamic Master Portfolios’ independent registered public accounting firm (together, the “independent expenses”) are paid directly by the LifePath Dynamic Master Portfolios. BAL and BFA have contractually agreed to reimburse these LifePath Dynamic Master Portfolios or provide an offsetting credit against the investment advisory fees paid by the LifePath Dynamic Master Portfolios in an amount equal to the independent expenses through April 30, 2029. These amounts are included in fees waived and/or reimbursed by the Manager in the Statements of Operations. If the LifePath Dynamic Master Portfolios do not pay administration fees, BFA agrees to cap the expenses of the LifePath Dynamic Master Portfolios at the rate at which it pays an investment advisory fee to BFA. For the year ended December 31, 2019, the amounts waived were as follows:
| | | | |
| | | Amounts Waived | |
LifePath Dynamic 2025 Master Portfolio | | $ | 27,022 | |
LifePath Dynamic 2035 Master Portfolio | | | 26,927 | |
LifePath Dynamic 2045 Master Portfolio | | | 26,600 | |
LifePath Dynamic 2055 Master Portfolio | | | 26,354 | |
LifePath Dynamic 2065 Master Portfolio | | | 17,495 | |
From time to time, BAL and BFA may waive such fees in whole or in part. Any such waiver will reduce the expenses of the LifePath Dynamic Master Portfolios and, accordingly, have a favorable impact on their performance. BAL may delegate certain of its administration duties tosub-administrators.
Securities Lending:The SEC has issued an exemptive order which permits BlackRock Institutional Trust Company, N.A. (“BTC”), an affiliate of the Manager, to serve as securities lending agent for the LifePath Dynamic Master Portfolios, subject to applicable conditions. As securities lending agent, BTC bears all operational costs directly related to securities lending. The LifePath Dynamic Master Portfolios are responsible for fees in connection with the investment of cash collateral received for securities on loan (the “collateral investment fees”). The cash collateral is invested in a money market fund managed by the Manager or its affiliates. However, BTC has agreed to reduce the amount of securities lending income it receives in order to effectively limit the collateral investment fees the LifePath Dynamic Master Portfolios bear to an annual rate of 0.04%. The shares of such money market fund will not be subject to a sales load, distribution fee or service fee. The money market fund in which the cash collateral has been invested may, under certain circumstances, impose a liquidity fee of up to 2% of the value redeemed or temporarily restrict redemptions for up to 10 business days during a90-day period, in the event that the money market fund’s weekly liquid assets fall below certain thresholds.
Securities lending income is equal to the total of income earned from the reinvestment of cash collateral, net of fees and other payments to and from borrowers of securities, and less the collateral investment fees. Each LifePath Dynamic Master Portfolio retains a portion of securities lending income and remits a remaining portion to BTC as compensation for its services as securities lending agent.
Pursuant to the current securities lending agreement, each LifePath Dynamic Master Portfolio retains 82% of securities lending income (which excludes collateral investment fees), and this amount retained can never be less than 70% of the total of securities lending income plus the collateral investment fees.
In addition, commencing the business day following the date that the aggregate securities lending income earned across the BlackRock Multi-Asset Complex in a calendar year exceeds a specified threshold, each LifePath Dynamic Master Portfolio, pursuant to the securities lending agreement, will retain for the remainder of that calendar year securities lending income in an amount equal to 85% of securities lending income (which excludes collateral investment fees), and this amount retained can never be less than 70% of the total of securities lending income plus the collateral investment fees.
The share of securities lending income earned by each LifePath Dynamic Master Portfolio is shown as securities lending income — affiliated – net in the Statements of Operations. For the year ended December 31, 2019, each LifePath Dynamic Master Portfolio paid BTC the following amounts securities lending agent services:
| | | | | | | | | | | | | | | | | | | | |
| | | LifePath Dynamic 2025 Master Portfolio | | | LifePath Dynamic 2035 Master Portfolio | | | LifePath Dynamic 2045 Master Portfolio | | | LifePath Dynamic 2055 Master Portfolio | | | LifePath Dynamic 2065 Master Portfolio | |
Amount | | $ | 669 | | | $ | 870 | | | $ | 605 | | | $ | 393 | | | $ | 6 | |
Interfund Lending: In accordance with an exemptive order (the “Order”) from the SEC, each LifePath Dynamic Master Portfolio may participate in a joint lending and borrowing facility for temporary purposes (the “Interfund Lending Program”), subject to compliance with the terms and conditions of the Order, and to the extent permitted by each LifePath Dynamic Master Portfolio’s investment policies and restrictions. Each LifePath Dynamic Master Portfolio is currently permitted to borrow and lend under the Interfund Lending Program.
| | | | |
| NOTESTO FINANCIAL STATEMENTS | | | 91 | |
Notes to Financial Statements (continued)
A lending BlackRock fund may lend in aggregate up to 15% of its net assets, but may not lend more than 5% of its net assets to any one borrowing fund through the Interfund Lending Program. A borrowing BlackRock fund may not borrow through the Interfund Lending Program or from any other source more than 33 1/3% of its total assets (or any lower threshold provided for by the fund’s investment restrictions). If a borrowing BlackRock fund’s total outstanding borrowings exceed 10% of its total assets, each of its outstanding interfund loans will be subject to collateralization of at least 102% of the outstanding principal value of the loan. All interfund loans are for temporary or emergency purposes and the interest rate to be charged will be the average of the highest current overnight repurchase agreement rate available to a lending fund and the bank loan rate, as calculated according to a formula established by the Board.
During the year ended December 31, 2019, the LifePath Dynamic Master Portfolios did not participate in the Interfund Lending Program.
Trustees and Officers: Certain trustees and/or officers of MIP are directors and/or officers of BlackRock or its affiliates.
Other Transactions: Each LifePath Dynamic Master Portfolio may invest its positive cash balances in certain money market funds managed by the Manager or an affiliate. The income earned on these temporary cash investments is shown as income-affiliated in the Statements of Operations.
For the year ended December 31, 2019, purchases and sales of investments in the Underlying Funds and Underlying Master Portfolios, and excluding short-term securities, were as follows:
| | | | | | | | | | | | | | | | | | | | |
| | | LifePath Dynamic 2025
Master Portfolio | | | LifePath Dynamic 2035
Master Portfolio | | | LifePath Dynamic 2045
Master Portfolio | | | LifePath Dynamic 2055
Master Portfolio | | | LifePath Dynamic 2065
Master Portfolio | |
Purchases | | $ | 32,809,486 | | | $ | 34,606,835 | | | $ | 25,508,888 | | | $ | 14,709,809 | | | $ | 3,945,139 | |
Sales | | | 19,020,147 | | | | 21,523,010 | | | | 17,398,504 | | | | 11,024,035 | | | | 119,833 | |
Each LifePath Dynamic Master Portfolio, except for LifePath Dynamic 2065 Master Portfolio, is classified as a partnership for U.S. federal income tax purposes. As such, each investor in the LifePath Dynamic Master Portfolios is treated as the owner of its proportionate share of net assets, income, expenses and realized and unrealized gains and losses of the LifePath Dynamic Master Portfolios. Therefore, no U.S. federal income tax provision is required. It is intended that the LifePath Dynamic Master Portfolios’ assets will be managed so an investor in the LifePath Dynamic Master Portfolios can satisfy the requirements of Subchapter M of the Internal Revenue Code of 1986, as amended.
The LifePath Dynamic 2065 Master Portfolio is disregarded as an entity separate from its owner for tax purposes. As such, the owner of the LifePath Dynamic 2065 Master Portfolio is treated as the owner of the net assets, income, expenses and realized and unrealized gains and losses of the Master Portfolio. Therefore, no U.S. federal income tax provision is required.
Each LifePath Dynamic Master Portfolio, except for LifePath Dynamic 2065 Master Portfolio, files U.S. federal and various state and local tax returns. No income tax returns are currently under examination. The statute of limitations on each LifePath Dynamic Master Portfolio’s U.S. federal tax returns generally remains open for each of the four years ended December 31, 2019. The statutes of limitations on each LifePath Dynamic Master Portfolio’s, except for LifePath Dynamic 2065 Master Portfolio state and local tax returns may remain open for an additional year depending upon the jurisdiction.
Management has analyzed tax laws and regulations and their application to the LifePath Dynamic Master Portfolios as of December 31, 2019, inclusive of the open tax return years, and does not believe that there are any uncertain tax positions that require recognition of a tax liability in the LifePath Dynamic Master Portfolios’ financial statements.
As of December 31, 2019, gross unrealized appreciation and depreciation for investments and derivatives based on cost for U.S. federal income tax purposes were as follows:
| | | | | | | | | | | | | | | | | | | | |
| | | LifePath
Dynamic 2025
Master Portfolio | | | LifePath
Dynamic 2035
Master Portfolio | | | LifePath
Dynamic 2045
Master Portfolio | | | LifePath
Dynamic 2055
Master Portfolio | | | LifePath
Dynamic 2065
Master Portfolio | |
Tax cost | | $ | 68,842,931 | | | $ | 67,241,131 | | | $ | 46,308,459 | | | $ | 24,840,061 | | | $ | 4,204,935 | |
| | | | | | | | | | | | | | | | | | | | |
Gross unrealized appreciation | | $ | 7,344,131 | | | $ | 7,479,465 | | | $ | 5,055,794 | | | $ | 2,715,236 | | | $ | 211,590 | |
Gross unrealized depreciation | | | (1,825,937 | ) | | | (1,440,280 | ) | | | (235,121 | ) | | | (44,698 | ) | | | (8,977 | ) |
| | | | | | | | | | | | | | | | | | | | |
Net unrealized appreciation | | $ | 5,518,194 | | | $ | 6,039,185 | | | $ | 4,820,673 | | | $ | 2,670,538 | | | $ | 202,613 | |
| | | | | | | | | | | | | | | | | | | | |
MIP, on behalf of the LifePath Dynamic Master Portfolios, along with certain other funds managed by the Manager and its affiliates (“Participating Funds”), is a party to a364-day, $2.25 billion credit agreement with a group of lenders. Under this agreement, the LifePath Dynamic Master Portfolios may borrow to fund shareholder redemptions. Excluding commitments designated for certain individual funds, the Participating Funds, including the LifePath Dynamic Master Portfolios, can borrow up to an aggregate commitment amount of $1.75 billion at any time outstanding, subject to asset coverage and other limitations as specified in the agreement. The credit agreement has the following terms: a fee of 0.10% per annum on unused commitment amounts and interest at a rate equal to the higher of(a) one-month LIBOR (but, in any event, not less than 0.00%) on the date the loan is made plus 0.80% per annum or (b) the Fed Funds rate (but, in any event, not less than 0.00%) in effect from time to time plus 0.80% per annum on amounts borrowed. The agreement expires in April 2020 unless extended or renewed. Prior to April 18, 2019, Participating Funds paid an
| | |
| 92 | | 2019 BLACKROCK ANNUAL REPORTTO SHAREHOLDERS |
Notes to Financial Statements (continued)
upfront commitment fee of 0.02% on the total commitment amounts, in addition to administration, legal and arrangement fees, which are included in miscellaneous expenses in the Statements of Operations. These fees were allocated among such funds based upon portions of the aggregate commitment available to them and relative net assets of Participating Funds. During the year ended December 31, 2019, the LifePath Dynamic Master Portfolios did not borrow under the credit agreement.
In the normal course of business, certain LifePath Dynamic Master Portfolios invest in securities or other instruments and may enter into certain transactions, and such activities subject each LifePath Dynamic Master Portfolio to various risks, including among others, fluctuations in the market (market risk) or failure of an issuer to meet all of its obligations. The value of securities or other instruments may also be affected by various factors, including, without limitation: (i) the general economy; (ii) the overall market as well as local, regional or global political and/or social instability; (iii) regulation, taxation or international tax treaties between various countries; or (iv) currency, interest rate and price fluctuations. Each LifePath Dynamic Master Portfolio’s prospectus provides details of the risks to which each LifePath Dynamic Master Portfolio is subject.
The LifePath Dynamic Master Portfolios may be exposed to additional risks when reinvesting cash collateral in money market funds that do not seek to maintain a stable NAV per share of $1.00, which may be subject to redemption gates or liquidity fees under certain circumstances.
Valuation Risk:The market values of equities, such as common stocks and preferred securities or equity related investments, such as futures and options, may decline due to general market conditions which are not specifically related to a particular company. They may also decline due to factors which affect a particular industry or industries. A LifePath Dynamic Master Portfolio may invest in illiquid investments. An illiquid investment is any investment that a LifePath Dynamic Master Portfolio reasonably expects cannot be sold or disposed of in current market conditions in seven calendar days or less without the sale or disposition significantly changing the market value of the investment. A LifePath Dynamic Master Portfolio may experience difficulty in selling illiquid investments in a timely manner at the price that it believes the investments are worth. Prices may fluctuate widely over short or extended periods in response to company, market or economic news. Markets also tend to move in cycles, with periods of rising and falling prices. This volatility may cause each LifePath Dynamic Master Portfolio’s NAV to experience significant increases or decreases over short periods of time. If there is a general decline in the securities and other markets, the NAV of a LifePath Dynamic Master Portfolio may lose value, regardless of the individual results of the securities and other instruments in which a LifePath Dynamic Master Portfolio invests.
Counterparty Credit Risk: The LifePath Dynamic Master Portfolios may be exposed to counterparty credit risk, or the risk that an entity may fail to or be unable to perform on its commitments related to unsettled or open transactions. The LifePath Dynamic Master Portfolios manage counterparty credit risk by entering into transactions only with counterparties that the Manager believes have the financial resources to honor their obligations and by monitoring the financial stability of those counterparties. Financial assets, which potentially expose the LifePath Dynamic Master Portfolios to market, issuer and counterparty credit risks, consist principally of financial instruments and receivables due from counterparties. The extent of the LifePath Dynamic Master Portfolios’ exposure to market, issuer and counterparty credit risks with respect to these financial assets is approximately their value recorded in the Statements of Assets and Liabilities, less any collateral held by the LifePath Dynamic Master Portfolios.
A derivative contract may suffer amark-to-market loss if the value of the contract decreases due to an unfavorable change in the market rates or values of the underlying instrument. Losses can also occur if the counterparty does not perform under the contract.
A LifePath Dynamic Master Portfolio’s risk of loss from counterparty credit risk on OTC derivatives is generally limited to the aggregate unrealized gain less the value of any collateral held by such LifePath Dynamic Master Portfolio.
With exchange-traded futures, there is less counterparty credit risk to the LifePath Dynamic Master Portfolios since the exchange or clearinghouse, as counterparty to such instruments, guarantees against a possible default. The clearinghouse stands between the buyer and the seller of the contract; therefore, credit risk is limited to failure of the clearinghouse. While offset rights may exist under applicable law, a LifePath Dynamic Master Portfolio does not have a contractual right of offset against a clearing broker or clearinghouse in the event of a default (including the bankruptcy or insolvency). Additionally, credit risk exists in exchange-traded futures with respect to initial and variation margin that is held in a clearing broker’s customer accounts. While clearing brokers are required to segregate customer margin from their own assets, in the event that a clearing broker becomes insolvent or goes into bankruptcy and at that time there is a shortfall in the aggregate amount of margin held by the clearing broker for all its clients, typically the shortfall would be allocated on a pro rata basis across all the clearing broker’s customers, potentially resulting in losses to the LifePath Dynamic Master Portfolios.
Concentration Risk:Certain Funds invest a significant portion of their assets in fixed-income securities and/or use derivatives tied to the fixed-income markets. Changes in market interest rates or economic conditions may affect the value and/or liquidity of such investments. Interest rate risk is the risk that prices of bonds and otherfixed-income securities will increase as interest rates fall and decrease as interest rates rise. The Funds may be subject to a greater risk of rising interest rates due to the current period of historically low rates.
Management has evaluated the impact of all subsequent events on the LifePath Dynamic Master Portfolios through the date the financial statements were issued and has determined that there were no subsequent events requiring adjustment or additional disclosure in the financial statements.
| | | | |
| NOTESTO FINANCIAL STATEMENTS | | | 93 | |
| | |
| Report of Independent Registered Public Accounting Firm | | Master Investment Portfolio |
To the Board of Trustees of
Master Investment Portfolio and Investors of each of the five series listed in the table below
Opinions on the Financial Statements
We have audited the accompanying statements of assets and liabilities, including the schedules of investments, of each of the series listed in the table below (five of the series constituting Master Investment Portfolio, hereafter collectively referred to as the “Master Portfolios”) as of December 31, 2019, the related statements of operations and of changes in net assets for each of the periods indicated in the table below, including the related notes, and the financial highlights for each of the periods indicated in the table below (collectively referred to as the “financial statements”). In our opinion, the financial statements present fairly, in all material respects, the financial position of each of the Master Portfolios as of December 31, 2019, the results of each of their operations, the changes in each of their net assets, and each of the financial highlights for each of the periods indicated in the table below, in conformity with accounting principles generally accepted in the United States of America.
| | | | | | |
| Master Portfolio | | Statement of operations | | Statement of changes in net assets | | Financial highlights |
LifePath® Dynamic 2025 Master Portfolio LifePath® Dynamic 2035 Master Portfolio LifePath® Dynamic 2045 Master Portfolio LifePath® Dynamic 2055 Master Portfolio | | For the year ended December 31, 2019 | | For the years ended December 31, 2019 and 2018 | | For the years ended December 31, 2019, 2018, 2017, 2016 and 2015 |
LifePath® Dynamic 2065 Master Portfolio | | For the period October 30, 2019 (commencement of operations) through December 31, 2019 |
Basis for Opinions
These financial statements are the responsibility of the Master Portfolios’ management. Our responsibility is to express an opinion on the Master Portfolios’ financial statements based on our audits. We are a public accounting firm registered with the Public Company Accounting Oversight Board (United States) (“PCAOB”) and are required to be independent with respect to the Master Portfolios in accordance with the U.S. federal securities laws and the applicable rules and regulations of the Securities and Exchange Commission and the PCAOB.
We conducted our audits of these financial statements in accordance with the standards of the PCAOB. Those standards require that we plan and perform the audit to obtain reasonable assurance about whether the financial statements are free of material misstatement, whether due to error or fraud.
Our audits included performing procedures to assess the risks of material misstatement of the financial statements, whether due to error or fraud, and performing procedures that respond to those risks. Such procedures included examining, on a test basis, evidence regarding the amounts and disclosures in the financial statements. Our audits also included evaluating the accounting principles used and significant estimates made by management, as well as evaluating the overall presentation of the financial statements. Our procedures included confirmation of securities owned as of December 31, 2019 by correspondence with the custodian, administrator of the Master Portfolios, transfer agents and brokers; when replies were not received from brokers, we performed other auditing procedures. We believe that our audits provide a reasonable basis for our opinions.
/s/PricewaterhouseCoopers LLP
Philadelphia, Pennsylvania
February 27, 2020
We have served as the auditor of one or more BlackRock investment companies since 2000.
| | |
| 94 | | 2019 BLACKROCK ANNUAL REPORTTO SHAREHOLDERS |
Disclosure of Investment Advisory Agreement
The Board of Trustees of Master Investment Portfolio (the “Master Fund”) met in person on May14-15, 2019 (the “Organizational Meeting) to consider the approval of the proposed investment advisory agreement (the “Agreement”) between the Master Fund, on behalf LifePath Dynamic 2065 Master Portfolio (the “Master Portfolio”), a series of the Master Fund, and BlackRock Fund Advisors (the “Manager” or “BlackRock”), the Master Fund’s investment advisor. BlackRock LifePath Dynamic 2065 Fund (the “Portfolio”), a series of BlackRock Funds III (the “Fund”), is a “feeder” fund that invests all of its investable assets in the Master Portfolio. Accordingly, the Board of Trustees of the Fund also considered the approval of the proposed Agreement with respect to the Master Portfolio. The Agreement was the same agreement that had been previously approved by the Board of the Master Fund with respect to certain other master portfolios of the Master Fund. For simplicity: (a) the Board of Trustees of the Master Fund and the Board of Trustees of the Fund are referred to herein collectively as the “Board,” and the members are referred to as “Board Members;” and (b) the shareholders of the Portfolio and the interest holders of the Master Portfolio are referred to as “shareholders.” The Master Portfolio and the Portfolio each commenced operations in October, 2019.
Activities and Composition of the Board
On the date of the Organizational Meeting, the Board consisted of fifteen individuals, thirteen of whom were not “interested persons” of the Master Fund or the Fund as defined in the Investment Company Act of 1940, as amended (the “1940 Act”) (the “Independent Board Members”). The Board Members are responsible for the oversight of the operations of the Master Fund or Fund, as pertinent, and perform the various duties imposed on the directors of investment companies by the 1940 Act. The Independent Board Members have retained independent legal counsel to assist them in connection with their duties. The Chair of the Board is an Independent Board Member. The Board has established five standing committees: an Audit Committee, a Governance and Nominating Committee, a Compliance Committee, a Performance Oversight Committee and an Ad Hoc Topics Committee, each of which is chaired by an Independent Board Member and composed of Independent Board Members (except for the Ad Hoc Topics Committee, which also has one interested Board Member).
The Agreement
Consistent with the requirements of the 1940 Act, the Board of the Master Fund is required to consider the initial approval of the Agreement. In connection with this deliberative process, the Board assessed, among other things, the nature, extent and quality of the services to be provided to the Master Portfolio and the Portfolio by BlackRock, BlackRock’s personnel and affiliates, including (as applicable): investment management; accounting, administrative and shareholder services; oversight of the Master Portfolio and Portfolio service providers; risk management and oversight; legal and compliance services; and ability to meet applicable legal and regulatory requirements.
Board Considerations in Approving the Agreement
The Approval Process: At the Organizational Meeting, the Board reviewed materials relating to its consideration of the proposed Agreement. The Board considered all factors it believed relevant with respect to the Master Portfolio and the Portfolio, including, among other things: (a) the nature, extent and quality of the services to be provided by BlackRock; (b) the investment performance of BlackRock portfolio management; (c) the advisory fee and the estimated cost of the services and estimated profits to be realized by BlackRock and its affiliates from their relationship with the Master Portfolio and the Portfolio; (d) the sharing of potential economies of scale;(e) fall-out benefits to BlackRock and its affiliates as a result of BlackRock’s relationship with the Master Portfolio and the Portfolio; (f) possible alternatives to the proposed Agreement; (g) the policies and practices of BlackRock with respect to portfolio transactions for the Portfolio; (h) BlackRock’s portfolio compliance systems and capabilities; and (i) other factors deemed relevant by the Board Members.
In considering approval of the Agreement, the Board met with the relevant investment advisory personnel from BlackRock and considered all information it deemed reasonably necessary to evaluate the terms of the Agreement. The Board received materials in advance of the Organizational Meeting relating to its consideration of the Agreement, including (a) information independently compiled and prepared by Broadridge Financial Solutions, Inc. (“Broadridge”) regarding the Portfolio’s fees and estimated expense ratio as compared with a peer group of funds as determined by Broadridge (“Expense Peers”); (b) information regarding BlackRock’s economic outlook for the Master Portfolio and the Portfolio and its general investment outlook for the markets; (c) information regarding fees paid to service providers that are affiliates of BlackRock; and (d) information outlining the legal duties of the Board under the 1940 Act with respect to the consideration and approval of the Agreement. The Board also noted information received at prior Board meetings concerning compliance records and regulatory matters relating to BlackRock.
The Board also considered other matters it deemed important to the approval process, such as other payments made to BlackRock or its affiliates relating to securities lending and cash management and BlackRock’s services related to the valuation and pricing of the portfolio holdings of the Master Portfolio. The Board noted the willingness of BlackRock personnel to engage in open, candid discussions with the Board. The Board did not identify any particular information as determinative, and each Board Member may have attributed different weights to the various items considered.
A. Nature, Extent and Quality of the Services Provided by BlackRock: The Board, including the Independent Board Members, reviewed the nature, extent and quality of services to be provided by BlackRock, including the investment advisory services to be provided to the Master Portfolio. The Board received information concerning the investment philosophy and investment process to be used by BlackRock in managing the Master Portfolio, as well as a description of the capabilities, personnel and services of BlackRock. The Board considered the scope of the services provided by BlackRock to the Master Portfolio and the Portfolio under the Agreement relative to services typically provided by third parties to other funds. The Board noted that the standard of care applicable under the Agreement was comparable to that found generally in investment company advisory agreements. The Board concluded that the scope of BlackRock’s services to be provided to the Master Portfolio and the Portfolio was consistent with the Master Portfolio’s and the Portfolio’s operational requirements, including, in addition to seeking to meet the Master Portfolio’s investment objective(s), compliance with investment restrictions, tax and reporting requirements and related shareholder services.
The Board, including the Independent Board Members, also considered the quality of the administrative and othernon-investment advisory services to be provided by BlackRock and its affiliates to the Master Portfolio and the Portfolio. The Board evaluated the procedures of BlackRock designed to fulfill its fiduciary duty to the Master Portfolio and the Portfolio with respect to possible conflicts of interest, including BlackRock’s code of ethics (regulating the personal trading of BlackRock’s officers and
| | | | |
| DISCLOSUREOF INVESTMENT ADVISORY AGREEMENT | | | 95 | |
Disclosure of Investment Advisory Agreement (continued)
employees), the procedures by which BlackRock allocates trades among its various investment advisory clients, the integrity of the systems in place to ensure compliance with the foregoing and the record of BlackRock in these matters. The Board also noted information received at prior Board meetings concerning standards of BlackRock with respect to the execution of portfolio transactions.
The Board considered, among other factors, with respect to BlackRock: the number, education and experience of investment personnel generally and the Master Portfolio’s portfolio management team; BlackRock’s research capabilities; investments by portfolio managers in the funds they manage; portfolio trading capabilities; use of technology; commitment to compliance; credit analysis capabilities; risk analysis and oversight capabilities; and the approach to training and retaining portfolio managers and other research, advisory and management personnel. The Board also considered BlackRock’s overall risk management program, including the continued efforts of BlackRock and its affiliates to address cybersecurity risks and the role of BlackRock’s Risk & Quantitative Analysis Group. The Board engaged in a review of BlackRock’s compensation structure with respect to the Master Portfolio’s portfolio management team and BlackRock’s ability to attract and retain high-quality talent and create performance incentives. The Board also considered the business reputation of BlackRock and its financial resources and concluded that BlackRock would be able to meet any reasonably foreseeable obligation under the Agreement.
In addition to investment advisory services, the Board considered the nature and quality of the administrative and othernon-investment advisory services to be provided to the Master Portfolio and the Portfolio. The Board considered that BlackRock and its affiliates will provide the Master Portfolio and the Portfolio with certain administrative, shareholder and other services (in addition to any such services provided to the Master Portfolio and the Portfolio by third parties) and officers and other personnel as are necessary for the operations of the Master Portfolio and the Portfolio. In particular, BlackRock and its affiliates will provide Master Portfolio and the Portfolio with administrative services, including, among others: (i) responsibility for disclosure documents, such as the prospectus, the summary prospectus (as applicable), the statement of additional information and periodic shareholder reports; (ii) oversight of daily accounting and pricing; (iii) responsibility for periodic filings with regulators; (iv) overseeing and coordinating the activities of other service providers, including, among others, the custodian, fund accountant, transfer agent, and auditor for the Master Portfolio and Portfolio; as applicable; (v) organizing Board meetings and preparing the materials for such Board meetings; (vi) providing legal and compliance support; (vii) furnishing analytical and other support to assist the Board in its consideration of strategic issues such as the merger, consolidation or repurposing of certainopen-end funds; and (viii) performing other administrative functions necessary for the operation of the Master Portfolio and the Portfolio, such as tax reporting, expense management, fulfilling regulatory filing requirements, overseeing the Fund’s distribution partners, and shareholder call center and other services. The Board reviewed the structure and duties of BlackRock’s fund administration, shareholder services, and legal & compliance departments and considered BlackRock’s policies and procedures for assuring compliance with applicable laws and regulations.
B. The Investment Performance of the Master Portfolio, the Portfolio and BlackRock: The Board, including the Independent Board Members, previously received and considered information about BlackRock’s investment performance for other funds. The Board, however, did not consider the performance history of the Master Portfolio and the Portfolio because the Master Portfolio and the Portfolio were newly organized and had not yet commenced operations as of the date of the Organizational Meeting.
C. Consideration of the Advisory/Management Fees and the Estimated Cost of the Services to be Provided and Estimated Profits to be Realized by BlackRock and its Affiliates from their Relationship with the Master Portfolio and the Portfolio: In connection with the initial approval of the Agreement, the Board, including the Independent Board Members, reviewed the Master Portfolio’s/Portfolio’s contractual advisory fee rate compared with those of its Expense Peers. The contractual advisory fee rate represents a combination of the advisory and any administrative fees, before taking into account any reimbursements or fee waivers. The Board also compared the Portfolio’s estimated total expense ratio, as well as the Master Portfolio’s/Portfolio’s estimated actual advisory fee rate, to those of the Portfolio’s Expense Peers. The total expense ratio represents a fund’s total net operating expenses, including any12b-1 or non12b-1 service fees. The total expense ratio gives effect to any expense reimbursements or fee waivers that benefit a fund, and the actual advisory fee rate gives effect to any advisory fee reimbursements or waivers that benefit a fund. Additionally, the Board noted information received at prior Board meetings concerning the services provided and the fees charged by BlackRock and its affiliates to other types of clients with similar investment mandates, as applicable, including institutional accounts andsub-advised mutual funds (including mutual funds sponsored by third parties).
The Board noted that the varying fee structures for fund of funds can limit the value of advisory fee comparisons. The Board noted that the Master Portfolio’s/Portfolio’s contractual advisory fee rate and estimated actual advisory fee rate each ranked second out of three funds, and the estimated total expense ratio ranked in the third quartile, relative to the Master Portfolio’s/Portfolio’s Expense Peers. The Board also noted that BlackRock and the Board have contractually agreed to waive a portion of the advisory fee for the Master Portfolio. Additionally, the Board noted that BlackRock and its affiliates have contractually agreed to reimburse or otherwise compensate the Master Portfolio/Portfolio for certain other fees and expenses.
Following consideration of this information, the Board, including the independent Board Members, concluded that the fees to be paid pursuant to the Agreement were fair and reasonable in light of the services provided.
As the Master Portfolio and Portfolio had not commenced operations as of the date of the Organizational Meeting, BlackRock was not able to provide the Board with specific information concerning the expected profits to be realized by BlackRock and its affiliates from their relationships with the Master Portfolio and the Portfolio. BlackRock, however, will provide the Board with such information at future meetings.
D. Economies of Scale: The Board, including the Independent Board Members, considered the extent to which economies of scale might be realized as the assets of the Master Portfolio and Portfolio increase, including the existence of fee waivers and/or expense caps, as applicable, noting that any contractual fee waivers and expense caps had been approved by the Board.
E. Other Factors Deemed Relevant by the Board Members: The Board, including a majority of the Independent Board Members, also took into account other ancillary or“fall-out” benefits that BlackRock or its affiliates may derive from BlackRock’s respective relationships with the Master Portfolio and the Portfolio, both tangible and intangible, such as BlackRock’s ability to leverage its investment professionals who manage other portfolios and risk management personnel, an increase in BlackRock’s profile in the investment advisory community, and the engagement of BlackRock’s affiliates as service providers to the Master Portfolio and the Portfolio, including for
| | |
| 96 | | 2019 BLACKROCK ANNUAL REPORTTO SHAREHOLDERS |
Disclosure of Investment Advisory Agreement (continued)
administrative, distribution, securities lending and cash management services. The Board also considered BlackRock’s overall operations and its efforts to expand the scale of, and improve the quality of, its operations. The Board also noted that, subject to applicable law, BlackRock may use and benefit from third party research obtained by soft dollars generated by certain registered fund transactions to assist in managing all or a number of its other client accounts.
In connection with its consideration of the Agreement, the Board also considered information regarding BlackRock’s brokerage and soft dollar practices and reports from BlackRock which included information on brokerage commissions and trade execution practices that it had received at prior Board meetings.
The Board noted the competitive nature of theopen-end fund marketplace, and that shareholders are able to redeem their Portfolio shares if they believe that the Portfolio Fees’s and/or the Master Portfolio’s fees and expenses are too high or if they are dissatisfied with the performance of the Portfolio.
Conclusion
All the Board Members of the Master Fund present at the Organizational Meeting, including all the Independent Board Members present, approved the Agreement between the Manager and the Master Fund, with respect to the Master Portfolio, for atwo-year term beginning on the effective date of the Agreement. Based upon its evaluation of all of the aforementioned factors in their totality, as well as other information, the Board of the Master Fund, including a majority of the Independent Board Members, was satisfied that the terms of the Agreement were fair and reasonable and in the best interest of the Master Portfolio and its interest holders. The Board of the Fund, including the Independent Board Members, also considered the approval of the Agreement with respect to the Master Portfolio and found the Agreement to be satisfactory. In arriving at its decision to approve the Agreement, the Board of the Master Fund did not identify any single factor or group of factors asall-important or controlling, but considered all factors together, and different Board Members may have attributed different weights to the various factors considered. The Independent Board Members were also assisted by the advice of independent legal counsel in making this determination.
| | | | |
| DISCLOSUREOF INVESTMENT ADVISORY AGREEMENT | | | 97 | |
Statement Regarding Liquidity Risk Management Program
The Securities and Exchange Commission adopted Rule 22e-4 under the Investment Company Act of 1940, as amended (the “Liquidity Rule”) to promote effective liquidity risk management throughout the open-end investment company industry, thereby reducing the risk that funds will be unable to meet their redemption obligations and mitigating dilution of the interests of fund shareholders.
The Board of Trustees (the “Board”) of BlackRock Funds III, on behalf of BlackRock LifePath® Dynamic 2025 Fund, BlackRock LifePath® Dynamic 2035 Fund, BlackRock LifePath® Dynamic 2045 Fund, BlackRock LifePath® Dynamic 2055 Fund and BlackRock LifePath® Dynamic 2065 Fund, and MIP on behalf of LifePath® Dynamic 2025 Master Portfolio, LifePath® Dynamic 2035 Master Portfolio, LifePath® Dynamic 2045 Master Portfolio, LifePath® Dynamic 2055 Master Portfolio and LifePath® Dynamic 2065 Master Portfolio met on November 12-13, 2019 (the “Meeting”) to review the liquidity risk management program (the “Program”) applicable to the BlackRock open-end funds, excluding money market funds (each, a “Fund”), pursuant to the Liquidity Rule. The Board has appointed BlackRock Advisors, LLC or BlackRock Fund Advisors (“BlackRock”), each an investment adviser to certain Funds, as the program administrator for each Fund’s Program, as applicable. BlackRock has delegated oversight of the Program to the 40 Act Liquidity Risk Management Committee (the “Committee”). At the Meeting, the Committee, on behalf of BlackRock, provided the Board with a report that addressed the operation of the Program and assessed its adequacy and effectiveness of implementation, including the operation of each Fund’s Highly Liquid Investment Minimum (“HLIM”) where applicable, and any material changes to the Program (the “Report”). The Report covered the period from December 1, 2018 through September 30, 2019 (the “Program Reporting Period”).
The Report described the Program’s liquidity classification methodology for categorizing a Fund’s investments (including derivative transactions) into one of four liquidity buckets. It also described BlackRock’s methodology in establishing a Fund’s HLIM and noted that the Committee reviews and ratifies the HLIM assigned to each Fund no less frequently than annually.
The Report noted that the Program complied with the key factors for consideration under the Liquidity Rule for assessing, managing and periodically reviewing a Fund’s liquidity risk, as follows:
A. The Fund’s investment strategy and liquidity of portfolio investments during both normal and reasonably foreseeable stressed conditions: During the Program Reporting Period, the Committee reviewed whether each Fund’s strategy is appropriate for an open-end fund structure with a focus on Funds with more significant and consistent holdings of less liquid and illiquid assets. The Committee also factored a Fund’s concentration in an issuer into the liquidity classification methodology by taking issuer position sizes into account. Where a Fund participated in borrowings for investment purposes (such as tender option bonds and reverse repurchase agreements), such borrowings were factored into the Program’s calculation of a Fund’s liquidity bucketing. Derivative exposure was also considered in such calculation.
B. Short-term and long-term cash flow projections during both normal and reasonably foreseeable stressed conditions: During the Program Reporting Period, the Committee reviewed historical net redemption activity and used this information as a component to establish each Fund’s reasonably anticipated trading size (“RATS”). Each Fund has adopted an in-kind redemption policy which may be utilized to meet larger redemption requests. The Committee may also take into consideration a Fund’s shareholder ownership concentration (which, depending on product type and distribution channel, may or may not be available), a Fund’s distribution channels, and the degree of certainty associated with a Fund’s short-term and long-term cash flow projections.
C. Holdings of cash and cash equivalents, as well as borrowing arrangements: The Committee considered the terms of the credit facility applicable to the Funds, the financial health of the institution providing the facility and the fact that the credit facility is shared among multiple Funds (including that a portion of the aggregate commitment amount is specifically designated for BlackRock Floating Rate Income Portfolio and BlackRock Credit Strategies Income Fund, each a series of BlackRock Funds V). The Committee also considered other types of borrowing available to the Funds, such as the ability to use reverse repurchase agreements and interfund lending, as applicable.
There were no material changes to the Program during the Program Reporting Period. The Report provided to the Board stated that the Committee concluded that based on the operation of the functions, as described in the Report, the Program is operating as intended and is effective in implementing the requirements of the Liquidity Rule.
| | |
| 98 | | 2019 BLACKROCK ANNUAL REPORTTO SHAREHOLDERS |
Trustee and Officer Information
| | | | | | | | |
| Independent Trustees (a) |
| | | | | |
Name
Year of Birth (b) | | Position(s) Held
(Length of Service) (c) | | Principal Occupation(s) During Past Five Years | | Number of BlackRock-Advised
Registered Investment Companies
(“RICs”) Consisting of
Investment Portfolios
(“Portfolios”) Overseen | | Public Company and Other
Investment Company
Directorships Held During
Past Five Years |
Mark Stalnecker 1951 | | Chair of the Board (Since 2019) and
Trustee
(Since 2015) | | Chief Investment Officer, University of Delaware from 1999 to 2013; Trustee and Chair of the Finance and Investment Committees, Winterthur Museum and Country Estate from 2005 to 2016; Member of the Investment Committee, Delaware Public Employees’ Retirement System since 2002; Member of the Investment Committee, Christiana Care Health System from 2009 to 2017; Member of the Investment Committee, Delaware Community Foundation from 2013 to 2014; Director and Chair of the Audit Committee, SEI Private Trust Co. from 2001 to 2014. | | 37 RICs consisting of 177 Portfolios | | None |
Bruce R. Bond 1946 | | Trustee
(Since 2019) | | Board Member, Amsphere Limited (software) since 2018; Trustee and Member of the Governance Committee, State Street Research Mutual Funds from 1997 to 2005; Board Member of Governance, Audit and Finance Committee, Avaya Inc. (computer equipment) from 2003 to 2007. | | 37 RICs consisting of 177 Portfolios | | None |
Susan J. Carter 1956 | | Trustee
(Since 2016) | | Director, Pacific Pension Institute from 2014 to 2018; Advisory Board Member, Center for Private Equity and Entrepreneurship at Tuck School of Business since 1997; Senior Advisor, Commonfund Capital, Inc. (“CCI”) (investment adviser) in 2015; Chief Executive Officer, CCI from 2013 to 2014; President & Chief Executive Officer, CCI from 1997 to 2013; Advisory Board Member, Girls Who Invest from 2015 to 2018 and Board Member thereof since 2018; Advisory Board Member, Bridges Fund Management since 2016; Trustee, Financial Accounting Foundation since 2017; Practitioner Advisory Board Member, Private Capital Research Institute (“PCRI”) since 2017. | | 37 RICs consisting of 177 Portfolios | | None |
Collette Chilton 1958 | | Trustee
(Since 2015) | | Chief Investment Officer, Williams College since 2006; Chief Investment Officer, Lucent Asset Management Corporation from 1998 to 2006. | | 37 RICs consisting of 177 Portfolios | | None |
Neil A. Cotty 1954 | | Trustee
(Since 2016) | | Bank of America Corporation from 1996 to 2015, serving in various senior finance leadership roles, including Chief Accounting Officer from 2009 to 2015, Chief Financial Officer of Global Banking, Markets and Wealth Management from 2008 to 2009, Chief Accounting Officer from 2004 to 2008, Chief Financial Officer of Consumer Bank from 2003 to 2004, Chief Financial Officer of Global Corporate Investment Bank from 1999 to 2002. | | 37 RICs consisting of 177 Portfolios | | None |
Lena G. Goldberg 1949 | | Trustee
(Since 2019) | | Senior Lecturer, Harvard Business School, since 2008; Director, Charles Stark Draper Laboratory, Inc. since 2013; FMR LLC/Fidelity Investments (financial services) from 1996 to 2008, serving in various senior roles including Executive Vice President — Strategic Corporate Initiatives and Executive Vice President and General Counsel; Partner, Sullivan & Worcester LLP from 1985 to 1996 and Associate thereof from 1979 to 1985. | | 37 RICs consisting of 177 Portfolios | | None |
Robert M. Hernandez 1944 | | Trustee
(Since 2019) | | Director, Vice Chairman and Chief Financial Officer of USX Corporation (energy and steel business) from 1991 to 2001; Director andnon-executive Chairman, RTI International Metals, Inc. from 1990 to 2015; Director, TE Connectivity (electronics) from 2006 to 2012. | | 37 RICs consisting of 177 Portfolios | | Chubb Limited (insurance company); Eastman Chemical Company |
| | | | |
| TRUSTEEAND OFFICER INFORMATION | | | 99 | |
Trustee and Officer Information (continued)
| | | | | | | | |
| Independent Trustees (a)(continued) |
| | | | | |
Name
Year of Birth (b) | | Position(s) Held
(Length of Service) (c) | | Principal Occupation(s) During Past Five Years | | Number of BlackRock-Advised
Registered Investment Companies
(“RICs”) Consisting of
Investment Portfolios
(“Portfolios”) Overseen | | Public Company and Other
Investment Company
Directorships Held During
Past Five Years |
Henry R. Keizer 1956 | | Trustee
(Since 2019) | | Director, Park Indemnity Ltd. (captive insurer) since 2010; Director, MUFG Americas Holdings Corporation and MUFG Union Bank, N.A. (financial and bank holding company) from 2014 to 2016; Director, American Institute of Certified Public Accountants from 2009 to 2011; Director, KPMG LLP (audit, tax and advisory services) from 2004 to 2005 and 2010 to 2012; Director, KPMG International in 2012, Deputy Chairman and Chief Operating Officer thereof from 2010 to 2012 and U.S. Vice Chairman of Audit thereof from 2005 to 2010; Global Head of Audit, KPMGI (consortium of KPMG firms) from 2006 to 2010; Director, YMCA of Greater New York from 2006 to 2010. | | 37 RICs consisting of 177 Portfolios | | Hertz Global Holdings (car rental); Montpelier Re Holdings, Ltd. (publicly held property and casualty reinsurance) from 2013 until 2015; Sealed Air Corp. (packaging); WABCO (commercial vehicle safety systems) |
Cynthia A. Montgomery 1952 | | Trustee
(Since 2009) | | Professor, Harvard Business School since 1989. | | 37 RICs consisting of 177 Portfolios | | Newell Rubbermaid, Inc. (manufacturing) |
Donald C. Opatrny 1952 | | Trustee
(Since 2019) | | Trustee, Vice Chair, Member of the Executive Committee and Chair of the Investment Committee, Cornell University since 2004; President, Trustee and Member of the Investment Committee, The Aldrich Contemporary Art Museum from 2007 to 2014; Member of the Board and Investment Committee, University School from 2007 to 2018; Member of the Investment Committee, Mellon Foundation from 2009 to 2015; Trustee, Artstor (a Mellon Foundation affiliate) from 2010 to 2015; President and Trustee, the Center for the Arts, Jackson Hole from 2011 to 2018; Director, Athena Capital Advisors LLC (investment management firm) since 2013; Trustee and Chair of the Investment Committee, Community Foundation of Jackson Hole since 2014; Member of Affordable Housing Supply Board of Jackson, Wyoming since 2018; Member, Investment Funds Committee, State of Wyoming since 2017; Trustee, Phoenix Art Museum since 2018. | | 37 RICs consisting of 177 Portfolios | | None |
Joseph P. Platt 1947 | | Trustee
(Since 2009) | | General Partner, Thorn Partners, LP (private investments) since 1998; Director, WQED Multi-Media (public broadcastingnot-for-profit) since 2001; Chair, Basic Health International(non-profit) since 2015. | | 37 RICs consisting of 177 Portfolios | | Greenlight Capital Re, Ltd. (reinsurance company); Consol Energy Inc. |
Kenneth L. Urish 1951 | | Trustee
(Since 2009) | | Managing Partner, Urish Popeck & Co., LLC (certified public accountants and consultants) since 1976; Past-Chairman of the Professional Ethics Committee of the Pennsylvania Institute of Certified Public Accountants and Committee Member thereof since 2007; Member of External Advisory Board, The Pennsylvania State University Accounting Department since founding in 2001; Principal, UP Strategic Wealth Investment Advisors, LLC since 2013; Trustee, The Holy Family Institute from 2001 to 2010; President and Trustee, Pittsburgh Catholic Publishing Associates from 2003 to 2008; Director,Inter-Tel from 2006 to 2007. | | 37 RICs consisting of 177 Portfolios | | None |
Claire A. Walton 1957 | | Trustee
(Since 2016) | | Chief Operating Officer and Chief Financial Officer of Liberty Square Asset Management, LP from 1998 to 2015; General Partner of Neon Liberty Capital Management, LLC since 2003; Director, Boston Hedge Fund Group from 2009 to 2018; Director, Woodstock Ski Runners since 2013; Director, Massachusetts Council on Economic Education from 2013 to 2015. | | 37 RICs consisting of 177 Portfolios | | None |
| | |
| 100 | | 2019 BLACKROCK ANNUAL REPORTTO SHAREHOLDERS |
Trustee and Officer Information (continued)
| | | | | | | | |
| Interested Trustees (a)(d) |
| | | | | |
Name
Year of Birth (b) | | Position(s) Held
(Length of Service) (c) | | Principal Occupation(s) During Past Five Years | | Number of BlackRock-Advised
Registered Investment Companies
(“RICs”) Consisting of
Investment Portfolios
(“Portfolios”) Overseen | | Public Company and Other
Investment Company
Directorships Held During
Past Five Years |
Robert Fairbairn 1965 | | Trustee
(Since 2018) | | Vice Chairman of BlackRock, Inc. since 2019; Member of BlackRock’s Global Executive and Global Operating Committees;Co-Chair of BlackRock’s Human Capital Committee; Senior Managing Director of BlackRock, Inc. from 2010 to 2019; oversaw BlackRock’s Strategic Partner Program and Strategic Product Management Group from 2012 to 2019; Member of the Board of Managers of BlackRock Investments, LLC from 2011 to 2018; Global Head of BlackRock’s Retail and iShares® businesses from 2012 to 2016. | | 123 RICs consisting of 287 Portfolios | | None |
John M. Perlowski (e) 1964 | | Trustee
(Since 2015)
President and Chief Executive Officer (Since 2010) | | Managing Director of BlackRock, Inc. since 2009; Head of BlackRock Global Accounting and Product Services since 2009; Advisory Director of Family Resource Network (charitable foundation) since 2009. | | 124 RICs consisting of 288 Portfolios | | None |
(a) The address of each Trustee is c/o BlackRock, Inc., 55 East 52nd Street, New York, New York 10055. |
(b) Independent Trustees serve until their resignation, retirement, removal or death, or until December 31 of the year in which they turn 75. The Board may determine to extend the terms of Independent Trustees on acase-by-case basis, as appropriate. |
(c) In connection with the acquisition of Barclays Global Investors by BlackRock, Inc. in December 2009, certain Independent Trustees were elected to the Board. Furthermore, effective January 1, 2019, three BlackRock Fund Complexes were realigned and consolidated into two BlackRock Fund Complexes. As a result, although the chart shows the year that each Independent Trustee joined the Board, certain Independent Trustees first became members of the boards of other BlackRock-advised Funds or legacy BlackRock funds as follows: Bruce R. Bond, 2005; Robert M. Hernandez, 1996; Cynthia A. Montgomery, 1994; Joseph P. Platt, 1999; Kenneth L. Urish, 1999; Lena G. Goldberg, 2016; Henry R. Keizer, 2016; Donald C. Opatrny, 2015. |
(d) Mr. Fairbairn and Mr. Perlowski are both “interested persons,” as defined in the 1940 Act, of the Trust/MIP based on their positions with BlackRock, Inc. and its affiliates. Mr. Fairbairn and Mr. Perlowski are also board members of the BlackRock Fixed-Income Complex. |
(e) Mr. Perlowski is also a trustee of the BlackRock Credit Strategies Fund. |
| | | | |
| TRUSTEEAND OFFICER INFORMATION | | | 101 | |
Trustee and Officer Information (continued)
| | | | |
| Officers Who Are Not Trustees (a) |
| | | |
Name
Year of Birth (b) | | Position(s) Held
(Length of Service) | | Principal Occupation(s) During Past Five Years |
Thomas Callahan 1968 | | Vice President
(Since 2016) | | Managing Director of BlackRock, Inc. since 2013; Member of the Board of Managers of BlackRock Investments, LLC (principal underwriter) since 2019 and Managing Director thereof since 2017; Head of BlackRock’s Global Cash Management Business since 2016;Co-Head of the Global Cash Management Business from 2014 to 2016; Deputy Head of the Global Cash Management Business from 2013 to 2014; Member of the Cash Management Group Executive Committee since 2013; Chief Executive Officer of NYSE Liffe U.S. from 2008 to 2013. |
Jennifer McGovern 1977 | | Vice President
(Since 2014) | | Managing Director of BlackRock, Inc. since 2016; Director of BlackRock, Inc. from 2011 to 2015; Head of Product Development and Oversight for BlackRock’s Strategic Product Management Group since 2019; Head of Product Structure and Oversight for BlackRock’s U.S. Wealth Advisory Group from 2013 to 2019. |
Neal J. Andrews 1966 | | Chief Financial Officer
(Since 2009) | | Chief Financial Officer of the iShares® exchange traded funds since 2019; Managing Director of BlackRock, Inc. since 2006. |
Jay M. Fife 1970 | | Treasurer
(Since 2009) | | Managing Director of BlackRock, Inc. since 2007. |
Charles Park 1967 | | Chief Compliance Officer
(Since 2014) | | Anti-Money Laundering Compliance Officer for certain BlackRock-advised Funds from 2014 to 2015; Chief Compliance Officer of BlackRock Advisors, LLC and the BlackRock-advised Funds in the BlackRock Multi-Asset Complex and the BlackRock Fixed-Income Complex since 2014; Principal of and Chief Compliance Officer for iShares® Delaware Trust Sponsor LLC since 2012 and BlackRock Fund Advisors (“BFA”) since 2006; Chief Compliance Officer for theBFA-advised iShares® exchange traded funds since 2006; Chief Compliance Officer for BlackRock Asset Management International Inc. since 2012. |
Lisa Belle 1968 | | Anti-Money Laundering Compliance Officer
(Since 2019) | | Managing Director of BlackRock, Inc. since 2019; Global Financial Crime Head for Asset and Wealth Management of JP Morgan from 2013 to 2019; Managing Director of RBS Securities from 2012 to 2013; Head of Financial Crimes for Barclays Wealth Americas from 2010 to 2012. |
Janey Ahn 1975 | | Secretary
(Since 2019) | | Managing Director of BlackRock, Inc. since 2018; Director of BlackRock, Inc. from 2009 to 2017. |
(a) The address of each Officer is c/o BlackRock, Inc., 55 East 52nd Street, New York, New York 10055. |
(b) Officers of the Trust/MIP serve at the pleasure of the Board. |
Further information about the Trust’s/MIP’s Trustees and Officers is available in the Trust’s/MIP’s Statement of Additional Information, which can be obtained without charge bycalling (800) 441-7762.
Effective September 19, 2019, Lisa Belle replaced John MacKessy as the Anti-Money Laundering Compliance Officer of the Trust/MIP.
Effective September 19, 2019, Janey Ahn replaced Benjamin Archibald as the Secretary of the Trust/MIP.
Effective December 31, 2019, Robert M. Hernandez retired as Trustee of the Trust/MIP.
Investment Adviser
BlackRock Fund Advisors
San Francisco, CA 94105
Sub-Advisers
BlackRock International Limited
Edinburgh EH3 8BL,
United Kingdom
BlackRock (Singapore) Limited
079912 Singapore
Accounting Agent and Custodian
State Street Bank and Trust Company
Boston, MA 02111
Administrator
BlackRock Advisors, LLC
Wilmington, DE 19809
Transfer Agent
BNY Mellon Investment Servicing (US) Inc.
Wilmington, DE 19809
Distributor
BlackRock Investments, LLC
New York, NY 10022
Independent Registered Public Accounting Firm
PricewaterhouseCoopers LLP
Philadelphia, PA 19103
Legal Counsel
Sidley Austin LLP
New York, NY 10019
Address of the Trust/MIP
400 Howard Street
San Francisco, CA 94105
| | |
| 102 | | 2019 BLACKROCK ANNUAL REPORTTO SHAREHOLDERS |
Additional Information
General Information
Householding
The LifePath® Dynamic Funds will mail only one copy of shareholder documents, including prospectuses, annual and semi-annual reports and proxy statements, to shareholders with multiple accounts at the same address. This practice is commonly called “householding” and is intended to reduce expenses and eliminate duplicate mailings of shareholder documents. Mailings of your shareholder documents may be householded indefinitely unless you instruct us otherwise. If you do not want the mailing of these documents to be combined with those for other members of your household, please call the LifePath® Dynamic Funds at (800) 441-7762.
Availability of Quarterly Schedule of Investments
The LifePath® Dynamic Funds/LifePath® Dynamic Master Portfolios file their complete schedule of portfolio holdings with the SEC for the first and third quarters of each fiscal year as an exhibit to its reports on Form N-PORT, and for reporting periods ended prior to March 31, 2019, filed such information on Form N-Q. The LifePath® Dynamic Funds’/LifePath® Dynamic Master Portfolios’Forms N-PORT and N-Q are available on the SEC’s website at sec.gov. The LifePath® Dynamic Funds’/LifePath® Dynamic Master Portfolios’Forms N-Q may also be obtained upon request and without charge by calling (800) 441-7762.
Availability of Proxy Voting Policies and Procedures
A description of the policies and procedures that the LifePath® Dynamic Funds/LifePath® Dynamic Master Portfolios use to determine how to vote proxies relating to portfolio securities is available upon request and without charge (1) by calling(800) 441-7762; (2) atblackrock.com; and (3) on the SEC’s website at sec.gov.
Availability of Proxy Voting Record
Information about how each LifePath® Dynamic Fund/LifePath® Dynamic Master Portfolio voted proxies relating to securities held in each LifePath® Dynamic Fund’s/LifePath® Dynamic Master Portfolio’s portfolio during the most recent 12-month period ended June 30 is available upon request and without charge (1) atblackrock.com; or by calling (800) 441-7762; and (2) on the SEC’s website at sec.gov.
BlackRock’s Mutual Fund Family
BlackRock offers a diverse lineup of open-end mutual funds crossing all investment styles and managed by experts in equity, fixed-income and tax-exempt investing. Visitblackrock.com for more information.
Shareholder Privileges
Account Information
Call us at (800) 441-7762 from 8:00 AM to 6:00 PM ET on any business day to get information about your account balances, recent transactions and share prices. You can also visitblackrock.com for more information.
Automatic Investment Plans
Investor class shareholders who want to invest regularly can arrange to have $50 or more automatically deducted from their checking or savings account and invested in any of the BlackRock funds.
Systematic Withdrawal Plans
Investor class shareholders can establish a systematic withdrawal plan and receive periodic payments of $50 or more from their BlackRock funds, as long as their account balance is at least $10,000.
Retirement Plans
Shareholders may make investments in conjunction with Traditional, Rollover, Roth, Coverdell, Simple IRAs, SEP IRAs and 403(b) Plans.
| | | | |
| ADDITIONAL INFORMATION | | | 103 | |
Additional Information (continued)
BlackRock Privacy Principles
BlackRock is committed to maintaining the privacy of its current and former fund investors and individual clients (collectively, “Clients”) and to safeguarding their non-public personal information. The following information is provided to help you understand what personal information BlackRock collects, how we protect that information and why in certain cases we share such information with select parties.
If you are located in a jurisdiction where specific laws, rules or regulations require BlackRock to provide you with additional or different privacy-related rights beyond what is set forth below, then BlackRock will comply with those specific laws, rules or regulations.
BlackRock obtains or verifies personal non-public information from and about you from different sources, including the following: (i) information we receive from you or, if applicable, your financial intermediary, on applications, forms or other documents; (ii) information about your transactions with us, our affiliates, or others; (iii) information we receive from a consumer reporting agency; and (iv) from visits to our websites.
BlackRock does not sell or disclose to non-affiliated third parties any non-public personal information about its Clients, except as permitted by law or as is necessary to respond to regulatory requests or to service Client accounts. These non-affiliated third parties are required to protect the confidentiality and security of this information and to use it only for its intended purpose.
We may share information with our affiliates to service your account or to provide you with information about other BlackRock products or services that may be of interest to you. In addition, BlackRock restricts access to non-public personal information about its Clients to those BlackRock employees with a legitimate business need for the information. BlackRock maintains physical, electronic and procedural safeguards that are designed to protect the non-public personal information of its Clients, including procedures relating to the proper storage and disposal of such information.
Glossary of Terms Used in this Report
| | |
| Currency |
| |
| CAD | | Canadian Dollar |
| |
| EUR | | Euro |
| |
| USD | | U.S. Dollar |
| | |
| Portfolio Abbreviations |
| |
| ETF | | Exchange-Traded Fund |
| |
| MSCI | | Morgan Stanley Capital International |
| |
| S&P | | Standard and Poor’s |
| | |
| 104 | | 2019 BLACKROCK ANNUAL REPORTTO SHAREHOLDERS |
Want to know more?
blackrock.com | 877-275-1255 (1-877-ASK-1BLK)
This report is intended for current holders. It is not authorized for use as an offer of sale or a solicitation of an offer to buy shares of a LifePath® Dynamic Fund unless preceded or accompanied by the LifePath® Dynamic Fund’s current prospectus. Past performance results shown in this report should not be considered a representation of future performance. Investment returns and principal value of shares will fluctuate so that shares, when redeemed, may be worth more or less than their original cost. Statements and other information herein are as dated and are subject to change.
LPincre-12/19-AR
| | |
 | | DECEMBER 31, 2019 |
BlackRock Funds III
| · | | iShares MSCI Total International Index Fund |
Beginning on January 1, 2021, as permitted by regulations adopted by the Securities and Exchange Commission, paper copies of the Fund’s shareholder reports will no longer be sent by mail, unless you specifically request paper copies of the reports from BlackRock or from your financial intermediary, such as a broker-dealer or bank. Instead, the reports will be made available on a website, and you will be notified by mail each time a report is posted and provided with a website link to access the report.
You may elect to receive all future reports in paper free of charge. If you hold accounts directly with BlackRock, you can call(800) 441-7762 to inform BlackRock that you wish to continue receiving paper copies of your shareholder reports. If you hold accounts through a financial intermediary, you can follow the instructions included with this disclosure, if applicable, or contact your financial intermediary to request that you continue to receive paper copies of your shareholder reports. Please note that not all financial intermediaries may offer this service. Your election to receive reports in paper will apply to all funds advised by BlackRock Advisors, LLC, BlackRock Fund Advisors or their affiliates, or all funds held with your financial intermediary, as applicable.
If you already elected to receive shareholder reports electronically, you will not be affected by this change and you need not take any action. You may elect to receive electronic delivery of shareholder reports and other communications by: (i) accessing the BlackRock website at blackrock.com/edelivery and logging into your accounts, if you hold accounts directly with BlackRock, or (ii) contacting your financial intermediary, if you hold accounts through a financial intermediary. Please note that not all financial intermediaries may offer this service.
|
| Not FDIC Insured • May Lose Value • No Bank Guarantee |
The Markets in Review
Dear Shareholder,
U.S. equities and bonds finished the last year of the decade with impressive returns, putting an exclamation point on a decade of strong performance despite the fears and doubts about the economy that were ultimately laid to rest with unprecedented monetary stimulus and a sluggish yet resolute performance from the U.S. economy. In many ways, it was fitting that the themes of 2019 — geopolitical uncertainty, fears of recession, and decisive monetary stimulus — put the capstone on a decade that was defined by grappling with these competing forces.
Equity and bond markets posted solid returns, particularly in the second half of the year, as investors began to realize that the U.S. economy was maintaining the modest yet steady growth that has characterized this economic cycle. U.S. large cap equities advanced the most, while equities at the high end of the risk spectrum — emerging markets and U.S. small cap — lagged while still posting solid returns.
Fixed-income securities played an important role in diversified portfolios by delivering strong returns amid economic uncertainty, as interest rates declined (and bond prices rose). Long-term bonds, particularly long-term Treasuries, generally posted the strongest returns, as inflation remained low. Investment-grade and high-yield corporate bonds also posted solid returns, as the credit fundamentals in corporate markets remained relatively solid.
As equity performance faltered in late 2018 and global economic growth slowed, the U.S. Federal Reserve (the “Fed”) shifted away from policies designed to decrease inflation in favor of renewed efforts to stimulate economic activity. The Fed left interest rates unchanged in January 2019, then reduced interest rates three times thereafter, starting in July 2019. Similarly, the Fed took measures to support liquidity in short-term lending markets. Following in the Fed’s footsteps, the European Central Bank announced aggressive economic stimulus measures, including lower interest rates and the return of its bond purchasing program. The Bank of Japan signaled a continuation of accommodative monetary policy, while China committed to looser credit conditions and an increase in fiscal spending.
The outpouring of global economic stimulus led to a sharp rally in risk assets throughout the world despite the headwind of rising geopolitical and trade tensions. Hopes continued to remain high as the current economic expansion became the longest in U.S. history.
Looking ahead, we believe U.S. economic growth will stabilize and gradually improve in 2020. The primary drivers of recent market performance — trade and monetary policies — could take a back seat to a nascent expansion in manufacturing and a recent uptick in global growth. The headwinds of policy uncertainty in 2019 could become tailwinds in 2020 due topro-cyclical policy shifts.
Overall, we favor increasing investment risk to benefit from the brighter outlook. In addition to having a positive view for equities overall, we favor emerging market equities over developed market equities. Increasing cyclical exposure through value-style investing and maintaining a meaningful emphasis on high-quality companies through quality factors also makes sense for diversified investors. In fixed income, government bonds continue to be important portfolio stabilizers, while emerging market bonds, particularly local currency bonds, offer relatively attractive income opportunities.
In this environment, investors need to think globally, extend their scope across a broad array of asset classes, and be nimble as market conditions change. We encourage you to talk with your financial advisor and visitblackrock.com for further insight about investing in today’s markets.
Sincerely,
Rob Kapito
President, BlackRock Advisors, LLC
Rob Kapito
President, BlackRock Advisors, LLC
| | | | |
| Total Returns as of December 31, 2019 |
| | | 6-month | | 12-month |
U.S. large cap equities
(S&P 500® Index) | | 10.92% | | 31.49% |
U.S. small cap equities
(Russell 2000® Index) | | 7.30 | | 25.52 |
International equities
(MSCI Europe, Australasia, Far East Index) | | 7.01 | | 22.01 |
Emerging market equities
(MSCI Emerging Markets Index) | | 7.09 | | 18.42 |
3-month Treasury bills
(ICE BofAML3-Month U.S. Treasury Bill Index) | | 1.03 | | 2.28 |
U.S. Treasury securities
(ICE BofAML10-Year U.S. Treasury Index) | | 1.36 | | 8.91 |
U.S. investment grade bonds
(Bloomberg Barclays U.S. Aggregate Bond Index) | | 2.45 | | 8.72 |
Tax-exempt municipal bonds
(S&P Municipal Bond Index) | | 2.21 | | 7.26 |
U.S. high yield bonds
(Bloomberg Barclays U.S. Corporate High Yield 2% Issuer Capped Index) | | 3.98 | | 14.32 |
| Past performance is no guarantee of future results. Index performance is shown for illustrative purposes only. You cannot invest directly in an index. |
| | |
| 2 | | THIS PAGEISNOT PARTOF YOUR FUND REPORT |
Table of Contents

| | |
| Fund Summary as of December 31, 2019 | | iShares MSCI Total International Index Fund |
Investment Objective
iShares MSCI Total International Index Fund’s (the “Fund”) investment objective is to match the performance of the MSCI All Country World Index ex USA Index (the “MSCI ACWI ex USA Index”) in U.S. dollars with net dividends as closely as possible before the deduction of Fund expenses.
Portfolio Management Commentary
How did the Fund perform?
For the12-month period ended December 31, 2019, the Fund’s Institutional Shares returned 21.18%, Investor A Shares returned 20.80% and Class K Shares returned 21.22%. The benchmark MSCI ACWI ex USA Index returned 21.51% for the same period.
The Fund invests all of its assets in Total International ex U.S. Index Master Portfolio (the “Master Portfolio”), a series of Master Investment Portfolio.
Describe the market environment.
In the first quarter of 2019, eurozone equity markets all advanced but to varying degrees as the recovery in equity market sentiment from 2018 lows occurred despite slowing economic activity across the region. Partially contributing to the bullish sentiment was the European Central Bank’s (“ECB”) reaffirmation of accommodative monetary policy and announcement of a new round of targeted longer-term refinancing operations. Within the eurozone, Germany underperformed amid continued weakness in the manufacturing and export sectors. Elsewhere in the eurozone, Italy outperformed major European countries despite two consecutive quarters of real gross domestic product contraction and political uncertainty as first quarter macro trends were relatively constructive.
In Asia-Pacific, Japan underperformed as uncertainty around U.S. trade protectionism, an upcomingsales-tax hike, and low levels of growth weighed on sentiment. Still, continued monetary support by the Bank of Japan and a globalrisk-on appetite benefited the country’s equity market. The yen fell 3.7% from intra-quarter highs, a tailwind for export names. Elsewhere, Hong Kong rallied amid a rebound in mainland Chinese sentiment.
In the second quarter of 2019, European equity markets contributed strong returns. Sentiment in the region was also supported by accommodative monetary policy, the increased expectations of further stimulus, higher than normal capacity utilization rates, and labor markets near full employment. Within the eurozone, Germany and France outperformed while Finland and Luxembourg underperformed.
Australia outperformed in the Asia-Pacific region as a decline in economic growth was driven by a June rate cut. Japan underperformed the benchmark but registered in positive territory as investors balancedrisk-on bids for the yen, trade tensions, and declining export volumes.
In the third quarter of 2019, within the eurozone, Germany underperformed while Belgium was the best-performing country in the eurozone due to an outsized gain in materials giant Umicore. Eurozone economic activity showed signs of synchronized deceleration. This prompted an aggressive response from the ECB, which announced a stimulus package that included a rate cut, resumption of quantitative easing, and atwo-tier excess liquidity system for banks. Simultaneously, the ECB cut both its growth and inflation forecasts, and lowered its forward guidance. In the United Kingdom, continued Brexit uncertainty drove volatility throughout the quarter ahead of the October 31 deadline. Parliament passed legislation that forced the government to ask for an extension if it could not reach a deal with the European Union (“EU”), which buoyed the sterling. Separately, the Bank of England remained on hold despite economic weakness.
In Asia-Pacific, Japanese equities outperformed despite deteriorating economic conditions and an impendingsales-tax hike. However, Japanese President Abe and U.S. President Donald Trump reached a limited trade agreement that removed the threat of tariffs on Japan’s auto exports for the time being. Elsewhere, Hong Kong underperformed amid mounting political unrest.
By the fourth quarter of 2019, the United Kingdom outperformed amid a dense quarter of Brexit developments. Prime Minister Boris Johnson was able to agree to a new Brexit deal with the EU in October, but the October 31 deadline was pushed back to January 31, 2020 due to a stalemate in Parliament. On continental Europe, both France and Germany performed well. Economic activity in Europe was better than in recent quarters, with the perceived easing in trade tensions — both between the United States and China, and the United States and EU — contributing to positive sentiment. Monetary policy remained accommodative, and the ECB resumed balance sheet expansion. Despite the easy monetary policy, the incremental increase in economic activity helped foster positive expectations.
In Asia-Pacific, Japan, Hong Kong and Australia recorded positive gains but ongoing tensions in Hong Kong and unimpressive growth out of China weighed on the region.
Describe recent portfolio activity.
During the12-month period, as changes were made to the composition of the MSCI ACWI ex USA Index, the Master Portfolio purchased and sold securities to maintain its objective of replicating the risks and return of the benchmark index.
Describe portfolio positioning at period end.
The Master Portfolio remains positioned to match the risk characteristics of its benchmark index, irrespective of the market’s future direction.
The views expressed reflect the opinions of BlackRock as of the date of this report and are subject to change based on changes in market, economic or other conditions. These views are not intended to be a forecast of future events and are no guarantee of future results.
| | |
| 4 | | 2019 BLACKROCK ANNUAL REPORTTO SHAREHOLDERS |
| | |
| Fund Summary as of December 31, 2019 (continued) | | iShares MSCI Total International Index Fund |
TOTAL RETURN BASED ON A $10,000 INVESTMENT
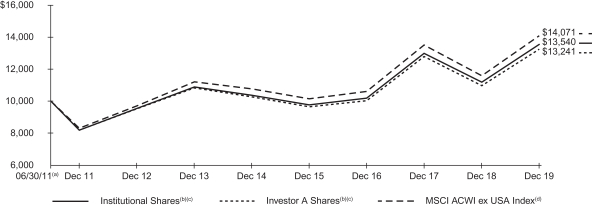
| (a) | Commencement of operations. |
| (b) | Assuming transaction costs and other operating expenses, including administration fees, if any. |
| (c) | The Fund invests all of its assets in the Master Portfolio. The Master Portfolio will be substantially invested in equity securities in the MSCI ACWI ex USA Index, and will invest, under normal circumstances, at least 80% of its assets in securities or other financial instruments that are components of or have economic characteristics similar to the securities included in the MSCI ACWI ex USA Index. |
| (d) | The index is a free float-adjusted market capitalization index designed to measure the combined equity market performance of developed and emerging market countries, excluding the United States. |
Performance Summary for the Period Ended December 31, 2019
| | | | | | | | | | | | | | | | | | | | |
| | | 6-Month
Total Returns | | | | | | Average Annual Total Returns (a) | |
| | | 1 Year | | | 5 Years | | | Since
Inception (b) | |
Institutional | | | 6.84 | % | | | | | | | 21.18 | % | | | 5.48 | % | | | 3.63 | % |
Investor A | | | 6.61 | | | | | | | | 20.80 | | | | 5.23 | | | | 3.35 | |
Class K | | | 6.77 | | | | | | | | 21.22 | | | | 5.53 | | | | 3.92 | |
MSCI ACWI ex USA Index | | | 6.96 | | | | | | | | 21.51 | | | | 5.51 | | | | 4.10 | |
| | (a) | See “About Fund Performance” on page 6 for a detailed description of share classes, including any related sales charges and fees. | |
| | (b) | The Fund commenced operations on June 30, 2011. | |
Past performance is not indicative of future results.
Performance results may include adjustments made for financial reporting purposes in accordance with U.S. generally accepted accounting principles.
Expense Example
| | | | | | | | | | | | | | | | | | | | | | | | | | | | | | | | |
| | | Actual | | | | | | Hypothetical (b) | | | | |
| | | Beginning Account Value (07/01/19) | | | Ending Account Value (12/31/19) | | | Expenses
Paid During
the Period (a) | | | | | | Beginning Account Value (07/01/19) | | | Ending Account Value
(12/31/19) | | | Expenses
Paid During
the Period (a) | | | Annualized
Expense
Ratio | |
Institutional | | $ | 1,000.00 | | | $ | 1,068.40 | | | $ | 0.83 | | | | | | | $ | 1,000.00 | | | $ | 1,024.40 | | | $ | 0.82 | | | | 0.16 | % |
Investor A | | | 1,000.00 | | | | 1,066.10 | | | | 2.14 | | | | | | | | 1,000.00 | | | | 1,023.14 | | | | 2.09 | | | | 0.41 | |
Class K | | | 1,000.00 | | | | 1,067.70 | | | | 0.57 | | | | | | | | 1,000.00 | | | | 1,024.65 | | | | 0.56 | | | | 0.11 | |
| | (a) | For each class of the Fund, expenses are equal to the annualized net expense ratio for the class, multiplied by the average account value over the period, multiplied by 184/365 (to reflect the one-half year period shown). Because the Fund invests all of its assets in the Master Portfolio, the expense example reflects the net expenses of both the Fund and the Master Portfolio in which it invests. | |
| | (b) | Hypothetical 5% annual return before expenses is calculated by prorating the number of days in the most recent fiscal half year divided by 365. | |
See “Disclosure of Expenses” on page 6 for further information on how expenses were calculated.
About Fund Performance
Institutional and Class K Shares are not subject to any sales charge. These shares bear no ongoing distribution or service fees and are available only to certain eligible investors.
Investor A Shares are not subject to any sales charge and bear no ongoing distribution fee. These shares are subject to an ongoing service fee of 0.25% per year. These shares are generally available through financial intermediaries.
Performance information reflects past performance and does not guarantee future results. Current performance may be lower or higher than the performance data quoted. Refer toblackrock.com to obtain performance data current to the most recent month-end. Performance results do not reflect the deduction of taxes that a shareholder would pay on fund distributions or the redemption of fund shares. Figures shown in the performance table on the previous page assume reinvestment of all distributions, if any, at net asset value (“NAV”) on the ex-dividend date. Investment return and principal value of shares will fluctuate so that shares, when redeemed, may be worth more or less than their original cost. Distributions paid to each class of shares will vary because of the different levels of service, distribution and transfer agency fees applicable to each class, which are deducted from the income available to be paid to shareholders.
BlackRock Advisors, LLC (the “Administrator”), the Fund’s administrator, has contractually and/or voluntarily agreed to waive and/or reimburse a portion of the Fund’s expenses. Without such waiver and/or reimbursement, the Fund’s performance would have been lower. With respect to the Fund’s voluntary waiver, the Administrator is under no obligation to waive and/or reimburse or to continue waiving and/or reimbursing its fees and such voluntary waiver may be reduced or discontinued at any time. With respect to the Fund’s contractual waiver, the Administrator is under no obligation to continue waiving and/or reimbursing its fees after the applicable termination date of such agreement. See Note 4 of the Notes to Financial Statements for additional information on waivers and/or reimbursements.
Disclosure of Expenses
Shareholders of the Fund may incur the following charges: (a) transactional expenses; and (b) operating expenses, including administration fees, service and distribution fees, including12b-1 fees, acquired fund fees and expenses, and other fund expenses. The expense example on the previous page (which is based on a hypothetical investment of $1,000 invested on July 1, 2019 and held through December 31, 2019) is intended to assist shareholders both in calculating expenses based on an investment in the Fund and in comparing these expenses with similar costs of investing in other mutual funds.
The expense example provides information about actual account values and actual expenses. In order to estimate the expenses a shareholder paid during the period covered by this report, shareholders can divide their account value by $1,000 and then multiply the result by the number corresponding to their share class under the heading entitled “Expenses Paid During the Period.”
The expense example also provides information about hypothetical account values and hypothetical expenses based on the Fund’s actual expense ratio and an assumed rate of return of 5% per year before expenses. In order to assist shareholders in comparing the ongoing expenses of investing in the Fund and other funds, compare the 5% hypothetical example with the 5% hypothetical examples that appear in shareholder reports of other funds.
The expenses shown in the expense example are intended to highlight shareholders’ ongoing costs only and do not reflect transactional expenses, such as sales charges, if any. Therefore, the hypothetical example is useful in comparing ongoing expenses only, and will not help shareholders determine the relative total expenses of owning different funds. If these transactional expenses were included, shareholder expenses would have been higher.
Derivative Financial Instruments
The Master Portfolio may invest in various derivative financial instruments. These instruments are used to obtain exposure to a security, commodity, index, market, and/or other assets without owning or taking physical custody of securities, commodities and/or other referenced assets or to manage market, equity, credit, interest rate, foreign currency exchange rate, commodity and/or other risks. Derivative financial instruments may give rise to a form of economic leverage and involve risks, including the imperfect correlation between the value of a derivative financial instrument and the underlying asset, possible default of the counterparty to the transaction or illiquidity of the instrument. The Master Portfolio’s successful use of a derivative financial instrument depends on the investment adviser’s ability to predict pertinent market movements accurately, which cannot be assured. The use of these instruments may result in losses greater than if they had not been used, may limit the amount of appreciation the Master Portfolio can realize on an investment and/or may result in lower distributions paid to shareholders. The Master Portfolio’s investments in these instruments, if any, are discussed in detail in the Notes to Financial Statements.
| | |
| 6 | | 2019 BLACKROCK ANNUAL REPORTTO SHAREHOLDERS |
Statement of Assets and Liabilities
December 31, 2019
| | | | |
| | | iShares
MSCI Total
International
Index Fund | |
|
ASSETS | |
Investments at value — Master Portfolio | | $ | 1,094,893,879 | |
Receivables: | |
Capital shares sold | | | 4,154,112 | |
From the Administrator/Manager | | | 11,224 | |
Prepaid expenses | | | 34,421 | |
| | | | |
Total assets | | | 1,099,093,636 | |
| | | | |
|
LIABILITIES | |
Payables: | |
Administration fees | | | 18,706 | |
Capital shares redeemed | | | 846,156 | |
Contributions to the Master | | | 3,307,955 | |
Officer’s fees | | | 289 | |
Other accrued expenses | | | 100,815 | |
Professional fees | | | 19,098 | |
Recoupment of past waived fees | | | 1,239 | |
Service fees | | | 70,890 | |
| | | | |
Total liabilities | | | 4,365,148 | |
| | | | |
| |
NET ASSETS | | $ | 1,094,728,488 | |
| | | | |
|
NET ASSETS CONSIST OF | |
Paid-in capital | | $ | 978,648,150 | |
Accumulated earnings | | | 116,080,338 | |
| | | | |
NET ASSETS | | $ | 1,094,728,488 | |
| | | | |
Institutional — Based on net assets of $264,844,771 and 28,327,958 shares outstanding, unlimited shares authorized, no par value | | $ | 9.35 | |
| | | | |
Investor A — Based on net assets of $341,385,257 and 36,617,661 shares outstanding, unlimited shares authorized, no par value | | $ | 9.32 | |
| | | | |
Class K — Based on net assets of $488,498,460 and 50,680,902 shares outstanding, unlimited shares authorized, no par value | | $ | 9.64 | |
| | | | |
See notes to financial statements.
Statement of Operations
Year Ended December 31, 2019
| | | | |
| | | iShares
MSCI Total
International
Index Fund | |
|
INVESTMENT INCOME | |
Net investment income allocated from the Master portfolio: | |
Dividends — affiliated | | $ | 149,053 | |
Dividends — unaffiliated | | | 29,737,742 | |
Securities lending income — affiliated — net | | | 276,400 | |
Non-cash dividends — unaffiliated | | | 2,243,962 | |
Foreign taxes withheld | | | (3,193,759 | ) |
Expenses | | | (701,942 | ) |
Fees waived | | | 4,969 | |
| | | | |
Total investment income | | | 28,516,425 | |
| | | | |
|
FUND EXPENSES | |
Service — class specific | | | 743,992 | |
Transfer agent — class specific | | | 283,841 | |
Administration | | | 89,930 | |
Registration | | | 89,012 | |
Professional | | | 73,815 | |
Printing | | | 28,138 | |
Accounting services | | | 5,088 | |
Recoupment of past fees waived and/or reimbursed | | | 1,463 | |
Recoupment of past waived and/or reimbursed fees — class specific | | | 1,239 | |
Officer | | | 408 | |
Miscellaneous | | | 9,784 | |
| | | | |
Total expenses excluding interest expense and fees | | | 1,326,710 | |
| | | | |
Total expenses | | | 1,326,710 | |
Less: | |
Fees waived and/or reimbursed by the Administrator/Manager | | | (24,859 | ) |
Transfer agent fees waived and/or reimbursed — class specific | | | (17,806 | ) |
| | | | |
Total expenses after fees waived and/or reimbursed | | | 1,284,045 | |
| | | | |
Net investment income | | | 27,232,380 | |
| | | | |
|
REALIZED AND UNREALIZED GAIN (LOSS) ALLOCATED FROM THE MASTER PORTFOLIO | |
Net realized gain (loss) from: | |
Futures contracts | | | 1,424,606 | |
Foreign currency transactions | | | (65,482 | ) |
Investments — affiliated | | | 13,030 | |
Investments — unaffiliated (including $6,808 foreign capital gain tax) | | | (6,953,793 | ) |
| | | | |
| | | (5,581,639 | ) |
| | | | |
Net change in unrealized appreciation (depreciation) on: | |
Futures contracts | | | 119,023 | |
Foreign currency translations | | | (6,982 | ) |
Investments — affiliated | | | 1,944 | |
Investments — unaffiliated (including $(39,310) foreign capital gain tax) | | | 149,109,188 | |
| | | | |
| | | 149,223,173 | |
| | | | |
Net realized and unrealized gain | | | 143,641,534 | |
| | | | |
NET INCREASE IN NET ASSETS RESULTING FROM OPERATIONS | | $ | 170,873,914 | |
| | | | |
See notes to financial statements.
| | |
| 8 | | 2019 BLACKROCK ANNUAL REPORTTO SHAREHOLDERS |
Statements of Changes in Net Assets
| | | | | | | | |
| | | iShares MSCI Total
International Index Fund | |
| | | Year Ended December 31, | |
| | | 2019 | | | 2018 | |
|
INCREASE (DECREASE) IN NET ASSETS | |
|
OPERATIONS | |
Net investment income | | $ | 27,232,380 | | | $ | 20,101,654 | |
Net realized loss | | | (5,581,639 | ) | | | (8,196,059 | ) |
Net change in unrealized appreciation (depreciation) | | | 149,223,173 | | | | (126,817,664 | ) |
| | | | | | | | |
Net increase (decrease) in net assets resulting from operations | | | 170,873,914 | | | | (114,912,069 | ) |
| | | | | | | | |
|
DISTRIBUTIONS(a) | |
From net investment income and net realized gain: | | | | | | | | |
Institutional | | | (7,053,977 | ) | | | (4,324,279 | ) |
Investor A | | | (8,998,745 | ) | | | (7,142,713 | ) |
Class K | | | (12,934,902 | ) | | | (7,792,686 | ) |
From return of capital: | | | | | | | | |
Institutional | | | — | | | | (355,156 | ) |
Investor A | | | — | | | | (586,636 | ) |
Class K | | | — | | | | (640,019 | ) |
| | | | | | | | |
Decrease in net assets resulting from distributions to shareholders | | | (28,987,624 | ) | | | (20,841,489 | ) |
| | | | | | | | |
|
CAPITAL SHARE TRANSACTIONS | |
Net increase in net assets derived from capital share transactions | | | 221,905,970 | | | | 241,322,260 | |
| | | | | | | | |
|
NET ASSETS | |
Total increase in net assets | | | 363,792,260 | | | | 105,568,702 | |
Beginning of year | | | 730,936,228 | | | | 625,367,526 | |
| | | | | | | | |
End of year | | $ | 1,094,728,488 | | | $ | 730,936,228 | |
| | | | | | | | |
| (a) | Distributions for annual periods determined in accordance with U.S. federal income tax regulations. |
See notes to financial statements.
Financial Highlights
(For a share outstanding throughout each period)
| | | | | | | | | | | | | | | | | | | | |
| | | iShares MSCI Total International Index Fund | |
| |
| | | Institutional | |
| |
| | | Year Ended December 31, | |
| | | 2019 | | | 2018 | | | 2017 | | | 2016 | | | 2015 | |
| | | | | |
Net asset value, beginning of year | | $ | 7.97 | | | $ | 9.54 | | | $ | 7.70 | | | $ | 7.65 | | | $ | 8.43 | |
| | | | | | | | | | | | | | | | | | | | |
Net investment income(a) | | | 0.27 | | | | 0.26 | | | | 0.24 | | | | 0.21 | | | | 0.21 | |
Net realized and unrealized gain (loss) | | | 1.40 | | | | (1.56 | ) | | | 1.86 | | | | 0.12 | | | | (0.69 | ) |
| | | | | | | | | | | | | | | | | | | | |
Net increase (decrease) from investment operations | | | 1.67 | | | | (1.30 | ) | | | 2.10 | | | | 0.33 | | | | (0.48 | ) |
| | | | | | | | | | | | | | | | | | | | |
|
| Distributions(b) | |
From net investment income | | | (0.29 | ) | | | (0.25 | ) | | | (0.26 | ) | | | (0.21 | ) | | | (0.17 | ) |
From net realized gain | | | — | | | | — | | | | (0.00 | )(c) | | | (0.07 | ) | | | (0.13 | ) |
From return of capital | | | — | | | | (0.02 | ) | | | — | | | | — | | | | — | |
| | | | | | | | | | | | | | | | | | | | |
Total distributions | | | (0.29 | ) | | | (0.27 | ) | | | (0.26 | ) | | | (0.28 | ) | | | (0.30 | ) |
| | | | | | | | | | | | | | | | | | | | |
| | | | | |
Net asset value, end of year | | $ | 9.35 | | | $ | 7.97 | | | $ | 9.54 | | | $ | 7.70 | | | $ | 7.65 | |
| | | | | | | | | | | | | | | | | | | | |
|
Total Return(d) | |
Based on net asset value | | | 21.18 | % | | | (13.94 | )% | | | 27.57 | % | | | 4.31 | % | | | (5.89 | )% |
| | | | | | | | | | | | | | | | | | | | |
|
Ratios to Average Net Assets(e)(f) | |
Total expenses | | | 0.16 | (g) | | | 0.17 | %(g) | | | 0.16 | % | | | 0.19 | % | | | 0.45 | % |
| | | | | | | | | | | | | | | | | | | | |
Total expenses after fees waived and/or reimbursed and paid indirectly | | | 0.16 | % | | | 0.16 | % | | | 0.16 | % | | | 0.16 | % | | | 0.17 | % |
| | | | | | | | | | | | | | | | | | | | |
Net investment income | | | 3.08 | % | | | 2.83 | % | | | 2.69 | % | | | 2.74 | % | | | 2.49 | % |
| | | | | | | | | | | | | | | | | | | | |
|
Supplemental Data | |
Net assets, end of year (000) | | $ | 264,845 | | | $ | 159,351 | | | $ | 73,405 | | | $ | 76,001 | | | $ | 40,716 | |
| | | | | | | | | | | | | | | | | | | | |
Portfolio turnover rate of the Master Portfolio | | | 5 | % | | | 40 | % | | | 57 | % | | | 15 | % | | | 6 | % |
| | | | | | | | | | | | | | | | | | | | |
| (a) | Based on average shares outstanding. |
| (b) | Distributions for annual periods determined in accordance with U.S. federal income tax regulations. |
| (c) | Amount is greater than $(0.005) per share. |
| (d) | Where applicable, assumes the reinvestment of distributions. |
| (e) | Includes the Fund’s share of the Master Portfolio’s allocated net expenses and/or net investment income. |
| (f) | Includes the Fund’s share of the Master Portfolio’s allocated fees waived of less than 0.01%. |
| (g) | Includes recoupment of past waived and/or reimbursed fees with no financial impact to the expense ratios. |
See notes to financial statements.
| | |
| 10 | | 2019 BLACKROCK ANNUAL REPORTTO SHAREHOLDERS |
Financial Highlights (continued)
(For a share outstanding throughout each period)
| | | | | | | | | | | | | | | | | | | | |
| | | iShares MSCI Total International Index Fund (continued) | |
| |
| | | Investor A | |
| |
| | | Year Ended December 31, | |
| | | 2019 | | | 2018 | | | 2017 | | | 2016 | | | 2015 | |
| | | | | |
Net asset value, beginning of year | | $ | 7.95 | | | $ | 9.52 | | | $ | 7.68 | | | $ | 7.63 | | | $ | 8.41 | |
| | | | | | | | | | | | | | | | | | | | |
Net investment income(a) | | | 0.25 | | | | 0.23 | | | | 0.22 | | | | 0.19 | | | | 0.13 | |
Net realized and unrealized gain (loss) | | | 1.39 | | | | (1.56 | ) | | | 1.86 | | | | 0.12 | | | | (0.62 | ) |
| | | | | | | | | | | | | | | | | | | | |
Net increase (decrease) from investment operations | | | 1.64 | | | | (1.33 | ) | | | 2.08 | | | | 0.31 | | | | (0.49 | ) |
| | | | | | | | | | | | | | | | | | | | |
|
| Distributions(b) | |
From net investment income | | | (0.27 | ) | | | (0.22 | ) | | | (0.24 | ) | | | (0.19 | ) | | | (0.16 | ) |
From net realized gain | | | — | | | | — | | | | (0.00 | )(c) | | | (0.07 | ) | | | (0.13 | ) |
From return of capital | | | — | | | | (0.02 | ) | | | — | | | | — | | | | — | |
| | | | | | | | | | | | | | | | | | | | |
Total distributions | | | (0.27 | ) | | | (0.24 | ) | | | (0.24 | ) | | | (0.26 | ) | | | (0.29 | ) |
| | | | | | | | | | | | | | | | | | | | |
| | | | | |
Net asset value, end of year | | $ | 9.32 | | | $ | 7.95 | | | $ | 9.52 | | | $ | 7.68 | | | $ | 7.63 | |
| | | | | | | | | | | | | | | | | | | | |
|
Total Return(d) | |
Based on net asset value | | | 20.80 | % | | | (14.19 | )% | | | 27.32 | % | | | 4.07 | % | | | (6.05 | )% |
| | | | | | | | | | | | | | | | | | | | |
|
Ratios to Average Net Assets(e)(f) | |
Total expenses | | | 0.41 | %(g) | | | 0.42 | %(g) | | | 0.41 | % | | | 0.46 | % | | | 0.43 | % |
| | | | | | | | | | | | | | | | | | | | |
Total expenses after fees waived and/or reimbursed and paid indirectly | | | 0.41 | % | | | 0.41 | % | | | 0.41 | % | | | 0.41 | % | | | 0.38 | % |
| | | | | | | | | | | | | | | | | | | | |
Net investment income | | | 2.84 | % | | | 2.55 | % | | | 2.47 | % | | | 2.48 | % | | | 1.63 | % |
| | | | | | | | | | | | | | | | | | | | |
|
Supplemental Data | |
Net assets, end of year (000) | | $ | 341,385 | | | $ | 272,066 | | | $ | 288,431 | | | $ | 247,732 | | | $ | 144,177 | |
| | | | | | | | | | | | | | | | | | | | |
Portfolio turnover rate of the Master Portfolio | | | 5 | % | | | 40 | % | | | 57 | % | | | 15 | % | | | 6 | % |
| | | | | | | | | | | | | | | | | | | | |
| (a) | Based on average shares outstanding. |
| (b) | Distributions for annual periods determined in accordance with U.S. federal income tax regulations. |
| (c) | Amount is greater than $(0.005) per share. |
| (d) | Where applicable, assumes the reinvestment of distributions. |
| (e) | Includes the Fund’s share of the Master Portfolio’s allocated net expenses and/or net investment income. |
| (f) | Includes the Fund’s share of the Master Portfolio’s allocated fees waived of less than 0.01%. |
| (g) | Includes recoupment of past waived and/or reimbursed fees with no financial impact to the expense ratios. |
See notes to financial statements.
Financial Highlights (continued)
(For a share outstanding throughout each period)
| | | | | | | | | | | | | | | | | | | | |
| | | iShares MSCI Total International Index Fund (continued) | |
| |
| | | Class K | |
| |
| | | Year Ended December 31, | |
| | | 2019 | | | 2018 | | | 2017 | | | 2016 | | | 2015 | |
| | | | | |
Net asset value, beginning of year | | $ | 8.21 | | | $ | 9.82 | | | $ | 7.92 | | | $ | 7.86 | | | $ | 8.65 | |
| | | | | | | | | | | | | | | | | | | | |
Net investment income(a) | | | 0.28 | | | | 0.27 | | | | 0.25 | | | | 0.21 | | | | 0.23 | |
Net realized and unrealized gain (loss) | | | 1.44 | | | | (1.61 | ) | | | 1.91 | | | | 0.13 | | | | (0.71 | ) |
| | | | | | | | | | | | | | | | | | | | |
Net increase (decrease) from investment operations | | | 1.72 | | | | (1.34 | ) | | | 2.16 | | | | 0.34 | | | | (0.48 | ) |
| | | | | | | | | | | | | | | | | | | | |
|
| Distributions(b) | |
From net investment income | | | (0.29 | ) | | | (0.25 | ) | | | (0.26 | ) | | | (0.21 | ) | | | (0.18 | ) |
From net realized gain | | | — | | | | — | | | | (0.00 | )(c) | | | (0.07 | ) | | | (0.13 | ) |
From return of capital | | | — | | | | (0.02 | ) | | | — | | | | — | | | | — | |
| | | | | | | | | | | | | | | | | | | | |
Total distributions | | | (0.29 | ) | | | (0.27 | ) | | | (0.26 | ) | | | (0.28 | ) | | | (0.31 | ) |
| | | | | | | | | | | | | | | | | | | | |
| | | | | |
Net asset value, end of year | | $ | 9.64 | | | $ | 8.21 | | | $ | 9.82 | | | $ | 7.92 | | | $ | 7.86 | |
| | | | | | | | | | | | | | | | | | | | |
|
Total Return(d) | |
Based on net asset value | | | 21.22 | % | | | (13.91 | )% | | | 27.62 | % | | | 4.37 | % | | | (5.83 | )% |
| | | | | | | | | | | | | | | | | | | | |
|
Ratios to Average Net Assets(e)(f) | |
Total expenses | | | 0.11 | % | | | 0.12 | %(g) | | | 0.11 | % | | | 0.14 | % | | | 0.46 | % |
| | | | | | | | | | | | | | | | | | | | |
Total expenses after fees waived and/or reimbursed and paid indirectly | | | 0.11 | % | | | 0.11 | % | | | 0.11 | % | | | 0.11 | % | | | 0.13 | % |
| | | | | | | | | | | | | | | | | | | | |
Net investment income | | | 3.15 | % | | | 2.85 | % | | | 2.75 | % | | | 2.68 | % | | | 2.71 | % |
| | | | | | | | | | | | | | | | | | | | |
|
Supplemental Data | |
Net assets, end of year (000) | | $ | 488,498 | | | $ | 299,520 | | | $ | 263,532 | | | $ | 103,498 | | | $ | 7,297 | |
| | | | | | | | | | | | | | | | | | | | |
Portfolio turnover rate of the Master Portfolio | | | 5 | % | | | 40 | % | | | 57 | % | | | 15 | % | | | 6 | % |
| | | | | | | | | | | | | | | | | | | | |
| (a) | Based on average shares outstanding. |
| (b) | Distributions for annual periods determined in accordance with U.S. federal income tax regulations. |
| (c) | Amount is greater than $(0.005) per share. |
| (d) | Where applicable, assumes the reinvestment of distributions. |
| (e) | Includes the Fund’s share of the Master Portfolio’s allocated net expenses and/or net investment income. |
| (f) | Includes the Fund’s share of the Master Portfolio’s allocated fees waived of less than 0.01%. |
| (g) | Includes recoupment of past waived and/or reimbursed fees with no financial impact to the expense ratios. |
See notes to financial statements.
| | |
| 12 | | 2019 BLACKROCK ANNUAL REPORTTO SHAREHOLDERS |
Notes to Financial Statements
BlackRock Funds III (the “Trust”) is registered under the Investment Company Act of 1940, as amended (the “1940 Act”), as anopen-end management investment company. The Trust is organized as a Delaware statutory trust. iShares MSCI Total International Index Fund (the “Fund”) is a series of the Trust. The Fund is classified as diversified.
The Fund seeks to achieve its investment objective by investing all of its assets in Total International ex U.S. Index Master Portfolio (the “Master Portfolio”), a series of Master Investment Portfolio (“MIP”), an affiliate of the Trust, which has the same investment objective and strategies as the Fund. The value of the Fund’s investment in the Master Portfolio reflects the Fund’s proportionate interest in the net assets of the Master Portfolio. The performance of the Fund is directly affected by the performance of the Master Portfolio. At December 31, 2019, the percentage of the Master Portfolio owned by the Fund was 99.9%. The financial statements of the Master Portfolio, including the Schedule of Investments, are included elsewhere in this report and should be read in conjunction with the Fund’s financial statements.
The Fund offers multiple classes of shares. All classes of shares have identical voting, dividend, liquidation and other rights and are subject to the same terms and conditions, except that Investor A Shares bear expenses related to the shareholder servicing and distribution of such shares. Institutional and Class K Shares are sold only to certain eligible investors. Investor A Shares are generally available through financial intermediaries. Each class has exclusive voting rights with respect to matters relating to its shareholder servicing and distribution expenditures.
The Board of Trustees of the Trust and Board of Trustees of MIP are referred to throughout this report as the “Board of Trustees” or the “Board” and the members are referred to as “Trustees.”
| | | | | | | | |
| Share Class | | Initial Sales Charge | | CDSC | | | Conversion Privilege |
Institutional and Class K Shares | | No | | | No | | | None |
Investor A Shares | | No | | | No | | | None |
The Fund, together with certain other registered investment companies advised by BlackRock Fund Advisors (“BFA” or the “Manager”) or its affiliates is included in a complex of equity, multi-asset, index and money market funds referred to as the BlackRock Multi-Asset Complex.
| 2. | SIGNIFICANT ACCOUNTING POLICIES |
The financial statements are prepared in conformity with accounting principles generally accepted in the United States of America (“U.S. GAAP”), which may require management to make estimates and assumptions that affect the reported amounts of assets and liabilities in the financial statements, disclosure of contingent assets and liabilities at the date of the financial statements and the reported amounts of increases and decreases in net assets from operations during the reporting period. Actual results could differ from those estimates. The Fund is considered an investment company under U.S. GAAP and follows the accounting and reporting guidance applicable to investment companies. Below is a summary of significant accounting policies:
Investment Transactions and Income Recognition:For financial reporting purposes, contributions to and withdrawals from the Master Portfolio are accounted for on a trade date basis. The Fund records its proportionate share of the Master Portfolio’s income, expenses and realized and unrealized gains and losses on a daily basis. Realized and unrealized gains and losses are adjusted utilizing partnership tax allocation rules. In addition, the Fund accrues its own expenses. Income, expenses and realized and unrealized gains and losses are allocated daily to each class based on its relative net assets.
Distributions: Distributions paid by the Fund are recorded on theex-dividend date. Distributions of capital gains are recorded on theex-dividend date and made at least annually. The character and timing of distributions are determined in accordance with U.S. federal income tax regulations, which may differ from U.S. GAAP.
Indemnifications:In the normal course of business, the Fund enters into contracts that contain a variety of representations that provide general indemnification. The Fund’s maximum exposure under these arrangements is unknown because it involves future potential claims against the Fund, which cannot be predicted with any certainty.
Other: Expenses directly related to the Fund or its classes are charged to that Fund or the applicable class. Other operating expenses shared by several funds, including other funds managed by the Administrator, are prorated among those funds on the basis of relative net assets or other appropriate methods. Expenses directly related to the Fund and other shared expenses prorated to the Fund are allocated daily to each class based on its relative net assets or other appropriate methods.
| 3. | INVESTMENT VALUATION AND FAIR VALUE MEASUREMENTS |
Investment Valuation Policies: The Fund’s policy is to value its financial instruments at fair value. The Fund records its investment in the Master Portfolio at fair value based on the Fund’s proportionate interest in the net assets of the Master Portfolio. Valuation of securities held by the Master Portfolio is discussed in Note 3 of the Master Portfolio’s Notes to Financial Statements, which are included elsewhere in this report.
| 4. | ADMINISTRATION AGREEMENT AND OTHER TRANSACTIONS WITH AFFILIATES |
Administration:The Trust, on behalf of the Fund, entered into an Administration Agreement with BlackRock Advisors, LLC (“BAL” or the “Administrator”), an indirect, wholly-owned subsidiary of BlackRock, Inc (“BlackRock”), to provide administrative services (other than investment advice and related portfolio activities). For such services, the Fund pays the Administrator a monthly fee at an annual rate of 0.01% of the average daily net assets of the Fund. The Fund does not pay an investment advisory fee or investment management fee.
| | | | |
| NOTESTO FINANCIAL STATEMENTS | | | 13 | |
Notes to Financial Statements (continued)
Service Fees:The Trust, on behalf of the Fund, entered into a Distribution Agreement and a Distribution and Service Plan with BlackRock Investments, LLC (“BRIL”), an affiliate of the Administrator. Pursuant to the Distribution and Service Plan and in accordance with Rule12b-1 under the 1940 Act, the Fund pays BRIL ongoing service fees. The fees are accrued daily and paid monthly at annual rates of 0.25% based upon the average daily net assets of Investor A Shares.
BRIL and broker-dealers, pursuant tosub-agreements with BRIL, provide shareholder servicing services to the Fund. The ongoing service fee compensates BRIL and each broker-dealer for providing shareholder servicing related services to shareholders.
For the year ended December 31, 2019, the class specific service fees borne directly by Investor A Shares was $743,992.
Transfer Agent: Pursuant to written agreements, certain financial intermediaries, some of which may be affiliates, provide the Fund withsub-accounting, recordkeeping,sub-transfer agency and other administrative services with respect to servicing of underlying investor accounts. For these services, these entities receive an asset-based fee or an annual fee per shareholder account, which will vary depending on share class and/or net assets. For the year ended December 31, 2019, the Fund did not pay any amounts to affiliates in return for these services.
The Administrator maintains a call center that is responsible for providing certain shareholder services to the Fund. Shareholder services include responding to inquiries and processing purchases and sales based upon instructions from shareholders. For the year ended December 31, 2019, the Fund reimbursed the Administrator the following amounts for costs incurred in running the call center, which are included in transfer agent — class specific in the Statement of Operations:
| | | | | | | | | | | | | | | | | | | | |
| Institutional | | | | | Investor A | | | | | Class K | | | | | Total | |
| $ | 426 | | | | | $ | 2,160 | | | | | $ | 1,205 | | | | | $ | 3,791 | |
For the year ended December 31, 2019, the following table shows the class specific transfer agent fees borne directly by each share class of the Fund:
| | | | | | | | | | | | | | | | | | | | |
| Institutional | | | | | Investor A | | | | | Class K | | | | | Total | |
| $ | 108,217 | | | | | $ | 160,379 | | | | | $ | 15,245 | | | | | $ | 283,841 | |
Expense Limitations, Waivers, Reimbursements, and Recoupments:With respect to the Fund, the Administrator/Manager contractually agreed to waive and/or reimburse fees or expenses in order to limit expenses, excluding interest expense, dividend expense, tax expense, acquired fund fees and expenses, and certain other fund expenses, which constitute extraordinary expenses not incurred in the ordinary course of the Fund’s business (“expense limitation”). The expense limitations as a percentage of average daily net assets are as follows:
| | | | | | | | | | | | | | |
| Institutional | | | | | Investor A | | | | | Class K | |
| | 0.16% | | | | | | 0.41% | | | | | | 0.11% | |
The Administrator/Manager has agreed not to reduce or discontinue these contractual expense limitations through April 30, 2020, unless approved by the Board, including a majority of the trustees who are not “interested persons” of the Trust, as defined in the 1940 Act (“Independent Trustees”), or by a vote of a majority of the outstanding voting securities of the Fund. For the year ended December 31, 2019, the Administrator/Manager waived and/or reimbursed $24,859, which is included in fees waived and/or reimbursed by the Administrator/Manager in the Statement of Operations.
These amounts waived and/or reimbursed are included in transfer agent fees waived and/or reimbursed — class specific, in the Statement of Operations. For the year ended December 31, 2019, class specific expense waivers and/or reimbursements are as follows:
| | | | | | | | | | | | | | | | | | | | |
| Institutional | | | | | Investor A | | | | | Class K | | | | | Total | |
| $ | 1,813 | | | | | $ | 7,018 | | | | | $ | 8,975 | | | | | $ | 17,806 | |
With respect to the contractual expense limitation, if during the Fund’s fiscal year the operating expenses of a share class, that at any time during the prior two fiscal years received a waiver and/or reimbursement from the Administrator/Manager, are less than the current expense limitation for that share class, the Administrator/Manager is entitled to be reimbursed by such share class up to the lesser of: (a) the amount of fees waived and/or expenses reimbursed during those prior two fiscal years under the agreement and (b) an amount not to exceed either the current expense limitation of that share class or the expense limitation of the share class in effect at the time that the share class received the applicable waiver and/or reimbursement, provided that:
(1) the Fund, of which the share class is a part, has more than $50 million in assets for the fiscal year; and
(2) BFA, BAL or an affiliate continues to serve as the Fund’s investment adviser or administrator.
This repayment applies only to the contractual expense limitation on net expenses and does not apply to any voluntary waivers that may be in effect from time to time. Effective December 1, 2019, the repayment arrangement between the Fund and the Administrator/Manager pursuant to which such Fund may be required to repay amounts waived and/or reimbursed under the Fund’s contractual caps on net expenses was terminated.
For the year ended December 31, 2019, the Administrator/Manager recouped the following fund level and class specific waivers and/or reimbursements previously recorded by the Fund:
| | | | |
Fund Level | | $ | 1,463 | |
Institutional | | | 960 | |
Investor A | | | 279 | |
| | |
| 14 | | 2019 BLACKROCK ANNUAL REPORTTO SHAREHOLDERS |
Notes to Financial Statements (continued)
The following fund level and class specific waivers and/or reimbursements previously recorded by the Fund, which were subject to recoupment by the Administrator/Manager, expired on December 1, 2019:
| | | | |
Fund Level | | $ | 71,640 | |
Institutional | | | 2,516 | |
Investor A | | | 18,418 | |
Class K | | | 16,848 | |
Interfund Lending: In accordance with an exemptive order (the “Order”) from the U.S. Securities and Exchange Commission (“SEC”), the Fund may participate in a joint lending and borrowing facility for temporary purposes (the “Interfund Lending Program”), subject to compliance with the terms and conditions of the Order, and to the extent permitted by the Fund’s investment policies and restrictions. The Fund is currently permitted to borrow and lend under the Interfund Lending Program.
A lending BlackRock fund may lend in aggregate up to 15% of its net assets, but may not lend more than 5% of its net assets to any one borrowing fund through the Interfund Lending Program. A borrowing BlackRock fund may not borrow through the Interfund Lending Program or from any other source more than 331⁄3% of its total assets (or any lower threshold provided for by the fund’s investment restrictions). If a borrowing BlackRock fund’s total outstanding borrowings exceed 10% of its total assets, each of its outstanding interfund loans will be subject to collateralization of at least 102% of the outstanding principal value of the loan. All interfund loans are for temporary or emergency purposes and the interest rate to be charged will be the average of the highest current overnight repurchase agreement rate available to a lending fund and the bank loan rate, as calculated according to a formula established by the Board.
During the year ended December 31, 2019, the Fund did not participate in the Interfund Lending Program.
Trustees and Officers:Certain trustees and/or officers of the Trust are directors and/or officers of BlackRock or its affiliates. The Fund reimburses the Administrator for a portion of the compensation paid to the Fund’s Chief Compliance Officer, which is included in Trustees and Officers in the Master Portfolio’s Statement of Operations.
It is the Fund’s policy to comply with the requirements of the Internal Revenue Code of 1986, as amended, applicable to regulated investment companies, and to distribute substantially all of its taxable income to its shareholders. Therefore, no U.S. federal income tax provision is required.
The Fund files U.S. federal and various state and local tax returns. No income tax returns are currently under examination. The statute of limitations on the Fund’s U.S. federal tax returns generally remains open for each of the four years ended December 31, 2019. The statutes of limitations on the Fund’s state and local tax returns may remain open for an additional year depending upon the jurisdiction.
Management has analyzed tax laws and regulations and their application to the Fund as of December 31, 2019, inclusive of the open tax return years, and does not believe that there are any uncertain tax positions that require recognition of a tax liability in the Fund’s financial statements.
The tax character of distributions paid was as follows:
| | | | | | | | |
| | | 12/31/19 | | | 12/31/18 | |
Ordinary income | | $ | 28,987,624 | | | $ | 19,259,678 | |
Long-term capital gains | | | — | | | | 1,581,811 | |
| | | | | | | | |
| | $ | 28,987,624 | | | $ | 20,841,489 | |
| | | | | | | | |
As of period end, the tax components of accumulated earnings were as follows:
| | | | |
Undistributed ordinary income | | $ | 784,607 | |
Non-expiring Capital loss carryforwards(a) | | | (13,184,931 | ) |
Net unrealized gains(b) | | | 128,480,662 | |
| | | | |
| | $ | 116,080,338 | |
| | | | |
| | (a) | Amounts available to offset future realized capital gains. | |
| | (b) | The difference between book-basis andtax-basis net unrealized gains (losses) was attributable primarily to the timing and recognition of partnership income. | |
| | | | |
| NOTESTO FINANCIAL STATEMENTS | | | 15 | |
Notes to Financial Statements (continued)
| 6. | CAPITAL SHARE TRANSACTIONS |
Transactions in capital shares for each class were as follows:
| | | | | | | | | | | | | | | | |
| | | Year Ended
12/31/19 | | | Year Ended
12/31/18 | |
| | | Shares | | | Amount | | | Shares | | | Amount | |
Institutional | | | | | | | | | | | | | | | | |
Shares sold | | | 13,301,414 | | | $ | 116,421,815 | | | | 14,775,372 | | | $ | 139,725,049 | |
Shares issued in reinvestment of distributions | | | 795,852 | | | | 7,052,234 | | | | 526,753 | | | | 4,679,435 | |
Shares redeemed | | | (5,760,973 | ) | | | (50,944,221 | ) | | | (3,001,136 | ) | | | (26,888,330 | ) |
| | | | | | | | | | | | | | | | |
Net increase | | | 8,336,293 | | | $ | 72,529,828 | | | | 12,300,989 | | | $ | 117,516,154 | |
| | | | | | | | | | | | | | | | |
| | | | |
Investor A | | | | | | | | | | | | | | | | |
Shares sold | | | 18,188,679 | | | $ | 160,062,788 | | | | 10,003,964 | | | $ | 90,378,609 | |
Shares issued in reinvestment of distributions | | | 1,018,406 | | | | 8,995,577 | | | | 871,034 | | | | 7,729,271 | |
Shares redeemed | | | (16,812,998 | ) | | | (147,579,863 | ) | | | (6,951,395 | ) | | | (63,361,367 | ) |
| | | | | | | | | | | | | | | | |
Net increase | | | 2,394,087 | | | $ | 21,478,502 | | | | 3,923,603 | | | $ | 34,746,513 | |
| | | | | | | | | | | | | | | | |
| | | | |
Class K | | | | | | | | | | | | | | | | |
Shares sold | | | 28,436,533 | | | $ | 256,695,981 | | | | 20,658,870 | | | $ | 190,435,209 | |
Shares issued in reinvestment of distributions | | | 1,415,561 | | | | 12,927,470 | | | | 921,785 | | | | 8,430,275 | |
Shares redeemed | | | (15,654,910 | ) | | | (141,725,811 | ) | | | (11,927,432 | ) | | | (109,805,891 | ) |
| | | | | | | | | | | | | | | | |
Net increase | | | 14,197,184 | | | $ | 127,897,640 | | | | 9,653,223 | | | $ | 89,059,593 | |
| | | | | | | | | | | | | | | | |
Total Net Increase | | | 24,927,564 | | | $ | 221,905,970 | | | | 25,877,815 | | | $ | 241,322,260 | |
| | | | | | | | | | | | | | | | |
Management has evaluated the impact of all subsequent events on the Fund through the date the financial statements were issued and has determined that there were no subsequent events requiring adjustment or additional disclosure in the financial statements.
| | |
| 16 | | 2019 BLACKROCK ANNUAL REPORTTO SHAREHOLDERS |
| | |
| Report of Independent Registered Public Accounting Firm | | iShares MSCI Total International Index Fund |
To the Board of Trustees of
BlackRock Funds III and Shareholders of iShares MSCI Total International Index Fund
Opinion on the Financial Statements
We have audited the accompanying statement of assets and liabilities of iShares MSCI Total International Index Fund (one of the series constituting BlackRock Funds III, referred to hereafter as the “Fund”) as of December 31, 2019, the related statement of operations for the year ended December 31, 2019, the statements of changes in net assets for each of the two years in the period ended December 31, 2019, including the related notes, and the financial highlights for each of the five years in the period ended December 31, 2019 (collectively referred to as the “financial statements”). In our opinion, the financial statements present fairly, in all material respects, the financial position of the Fund as of December 31, 2019, the results of its operations for the year then ended, the changes in its net assets for each of the two years in the period ended December 31, 2019 and the financial highlights for each of the five years in the period ended December 31, 2019 in conformity with accounting principles generally accepted in the United States of America.
Basis for Opinion
These financial statements are the responsibility of the Fund’s management. Our responsibility is to express an opinion on the Fund’s financial statements based on our audits. We are a public accounting firm registered with the Public Company Accounting Oversight Board (United States) (“PCAOB”) and are required to be independent with respect to the Fund in accordance with the U.S. federal securities laws and the applicable rules and regulations of the Securities and Exchange Commission and the PCAOB.
We conducted our audits of these financial statements in accordance with the standards of the PCAOB. Those standards require that we plan and perform the audit to obtain reasonable assurance about whether the financial statements are free of material misstatement, whether due to error or fraud.
Our audits included performing procedures to assess the risks of material misstatement of the financial statements, whether due to error or fraud, and performing procedures that respond to those risks. Such procedures included examining, on a test basis, evidence regarding the amounts and disclosures in the financial statements. Our audits also included evaluating the accounting principles used and significant estimates made by management, as well as evaluating the overall presentation of the financial statements. Our procedures included confirmation of securities owned as of December 31, 2019 by correspondence with the administrator of the Master Portfolio. We believe that our audits provide a reasonable basis for our opinion.
/s/PricewaterhouseCoopers LLP
Philadelphia, Pennsylvania
February 27, 2020
We have served as the auditor of one or more BlackRock investment companies since 2000.
Important Tax Information (Unaudited)
During the fiscal year ended December 31, 2019, the following information is provided with respect to the ordinary income distributions paid by the Fund:
| | | | | | |
| | | Payable Date | | | |
Qualified Dividend Income for Individuals(a)(b) | | Quarterly | | | 86.25% | |
Foreign Source Income(a)(b) | | Quarterly | | | 93.40 | |
Foreign Taxes Paid Per Share(c) | | 03/29/2019 | | $ | 0.005259 | |
| | 07/01/2019 | | | 0.009223 | |
| | 09/30/2019 | | | 0.005869 | |
| | | 12/13/2019 | | | 0.006064 | |
| | (a) | The Fund hereby designates the percentage indicated above or the maximum amount allowable by law. | |
| | (b) | Expressed as a percentage of distributions grossed-up for foreign taxes. | |
| | (c) | The foreign taxes paid represent taxes incurred by the Fund on income received by the Fund from foreign sources. Foreign taxes paid may be included in taxable income with an offsetting deduction from gross income or may be taken as a credit for taxes paid to foreign governments. You should consult your tax advisor regarding the appropriate treatment of foreign taxes paid. | |
| | | | |
| REPORT OF INDEPENDENT REGISTERED PUBLIC ACCOUNTING FIRM / IMPORTANT TAX INFORMATION | | | 17 | |
| | |
| Master Portfolio Information as of December 31, 2019 | | Total International ex U.S. Index Master Portfolio |
TEN LARGEST HOLDINGS
| | | | |
| Security | | Percent of
Net Assets | |
Alibaba Group Holding Ltd. — ADR | | | 2 | % |
Nestle SA, Registered Shares | | | 1 | |
Tencent Holdings Ltd. | | | 1 | |
Taiwan Semiconductor Manufacturing Co. Ltd. | | | 1 | |
Samsung Electronics Co. Ltd. | | | 1 | |
Roche Holding AG | | | 1 | |
Novartis AG, Registered Shares | | | 1 | |
Toyota Motor Corp. | | | 1 | |
HSBC Holdings PLC | | | 1 | |
SAP SE | | | 1 | |
GEOGRAPHIC ALLOCATION
| | | | |
| Country/Geographic Region | | Percent of
Net Assets | |
Japan | | | 16 | % |
China | | | 9 | |
United Kingdom | | | 9 | |
France | | | 7 | |
Canada | | | 7 | |
Switzerland | | | 6 | |
Germany | | | 6 | |
Australia | | | 5 | |
Taiwan | | | 3 | |
South Korea | | | 3 | |
United States | | | 3 | |
Netherlands | | | 3 | |
India | | | 2 | |
Hong Kong | | | 2 | |
Brazil | | | 2 | |
Spain | | | 2 | |
Sweden | | | 2 | |
South Africa | | | 1 | |
Italy | | | 1 | |
Denmark | | | 1 | |
Russia | | | 1 | |
Singapore | | | 1 | |
Finland | | | 1 | |
Saudi Arabia | | | 1 | |
Thailand | | | 1 | |
Belgium | | | 1 | |
Mexico | | | 1 | |
Other(a) | | | 4 | |
Liabilities in Excess of Other Assets | | | (1 | ) |
| | (a) | Others include Argentina, Austria, Chile, Colombia, Czech Republic, Egypt, Greece, Hungary, Indonesia, Ireland, Luxembourg, Macau, Malaysia, New Zealand, Norway, Pakistan, Peru, Philippines, Poland, Portugal, Qatar, Romania, Turkey, United Arab Emirates, Zambia. | |
| | |
| 18 | | 2019 BLACKROCK ANNUAL REPORTTO SHAREHOLDERS |
| | |
Schedule of Investments December 31, 2019 | | Total International ex U.S. Index Master Portfolio (Percentages shown are based on Net Assets) |
| | | | | | | | |
| Security | | Shares | | | Value | |
|
Common Stocks — 97.3% | |
|
| Argentina — 0.0% | |
Banco Macro SA — ADR(a) | | | 2,190 | | | $ | 79,387 | |
Globant SA(b) | | | 1,394 | | | | 147,834 | |
Grupo Financiero Galicia SA — ADR | | | 4,253 | | | | 69,026 | |
Telecom Argentina SA — ADR | | | 6,259 | | | | 71,040 | |
YPF SA, ADR(a) | | | 7,500 | | | | 86,850 | |
| | | | | | | | |
| | | | 454,137 | |
|
| Australia — 4.9% | |
AGL Energy Ltd.(a) | | | 29,297 | | | | 421,689 | |
Alumina Ltd. | | | 105,749 | | | | 170,806 | |
AMP Ltd.(b) | | | 199,787 | | | | 268,753 | |
APA Group(c) | | | 54,780 | | | | 426,432 | |
Aristocrat Leisure Ltd. | | | 27,117 | | | | 640,752 | |
ASX Ltd. | | | 9,515 | | | | 523,897 | |
Aurizon Holdings Ltd. | | | 84,172 | | | | 308,905 | |
AusNet Services | | | 88,260 | | | | 105,249 | |
Australia & New Zealand Banking Group Ltd. | | | 134,951 | | | | 2,327,361 | |
Bendigo & Adelaide Bank Ltd. | | | 30,340 | | | | 208,188 | |
BHP Group Ltd. | | | 140,709 | | | | 3,852,936 | |
BHP Group PLC | | | 101,435 | | | | 2,377,019 | |
BlueScope Steel Ltd. | | | 28,378 | | | | 300,568 | |
Boral Ltd. | | | 49,450 | | | | 155,574 | |
Brambles Ltd. | | | 80,108 | | | | 659,345 | |
Caltex Australia Ltd. | | | 15,374 | | | | 366,583 | |
Challenger Ltd. | | | 38,501 | | | | 219,091 | |
CIMIC Group Ltd. | | | 6,446 | | | | 149,867 | |
Coca-Cola Amatil Ltd. | | | 30,008 | | | | 233,032 | |
Cochlear Ltd. | | | 3,172 | | | | 499,926 | |
Coles Group Ltd. | | | 57,036 | | | | 593,731 | |
Commonwealth Bank of Australia | | | 84,147 | | | | 4,720,462 | |
Computershare Ltd. | | | 21,967 | | | | 258,989 | |
Crown Resorts Ltd. | | | 17,839 | | | | 150,404 | |
CSL Ltd. | | | 21,519 | | | | 4,172,148 | |
Dexus | | | 50,184 | | | | 413,104 | |
Flight Centre Travel Group Ltd. | | | 4,600 | | | | 142,278 | |
Fortescue Metals Group Ltd. | | | 62,711 | | | | 472,738 | |
Goodman Group | | | 79,850 | | | | 750,365 | |
GPT Group | | | 85,677 | | | | 337,485 | |
Harvey Norman Holdings Ltd. | | | 16,035 | | | | 45,798 | |
Incitec Pivot Ltd. | | | 66,272 | | | | 148,057 | |
Insurance Australia Group Ltd. | | | 100,648 | | | | 540,793 | |
Lendlease Group(c) | | | 31,390 | | | | 388,091 | |
Macquarie Group Ltd. | | | 15,487 | | | | 1,499,827 | |
Magellan Financial Group Ltd. | | | 5,653 | | | | 226,487 | |
Medibank Pvt Ltd. | | | 110,102 | | | | 244,010 | |
Mirvac Group | | | 177,414 | | | | 397,105 | |
National Australia Bank Ltd. | | | 139,035 | | | | 2,405,875 | |
Newcrest Mining Ltd. | | | 38,073 | | | | 804,063 | |
Oil Search Ltd. | | | 55,471 | | | | 282,849 | |
Orica Ltd. | | | 17,936 | | | | 276,582 | |
Origin Energy Ltd. | | | 88,740 | | | | 526,161 | |
Qantas Airways Ltd. | | | 30,338 | | | | 151,220 | |
QBE Insurance Group Ltd. | | | 63,379 | | | | 572,722 | |
Ramsay Health Care Ltd. | | | 6,831 | | | | 347,546 | |
REA Group Ltd. | | | 2,994 | | | | 217,504 | |
Rio Tinto Ltd. | | | 17,287 | | | | 1,223,055 | |
Rio Tinto PLC | | | 54,938 | | | | 3,252,053 | |
Santos Ltd. | | | 95,293 | | | | 548,217 | |
Scentre Group | | | 239,323 | | | | 644,079 | |
SEEK Ltd. | | | 14,013 | | | | 221,793 | |
Sonic Healthcare Ltd. | | | 18,219 | | | | 367,348 | |
South32 Ltd. | | | 233,710 | | | | 441,272 | |
Stockland | | | 120,177 | | | | 389,922 | |
| | | | | | | | |
| Security | | Shares | | | Value | |
|
| Australia (continued) | |
Suncorp Group Ltd. | | | 58,287 | | | $ | 529,469 | |
Sydney Airport(c) | | | 56,475 | | | | 343,126 | |
Tabcorp Holdings Ltd. | | | 86,499 | | | | 274,989 | |
Telstra Corp. Ltd. | | | 208,621 | | | | 518,213 | |
TPG Telecom Ltd. | | | 14,159 | | | | 66,713 | |
Transurban Group(c) | | | 127,671 | | | | 1,336,338 | |
Treasury Wine Estates Ltd. | | | 31,088 | | | | 354,115 | |
Vicinity Centres | | | 183,891 | | | | 321,637 | |
Washington H Soul Pattinson & Co. Ltd. | | | 6,150 | | | | 92,779 | |
Wesfarmers Ltd. | | | 54,217 | | | | 1,575,639 | |
Westpac Banking Corp. | | | 169,652 | | | | 2,897,102 | |
WiseTech Global Ltd.(a) | | | 7,407 | | | | 121,639 | |
Woodside Petroleum Ltd. | | | 44,033 | | | | 1,064,656 | |
Woolworths Group Ltd. | | | 59,429 | | | | 1,507,325 | |
Worley Ltd. | | | 15,561 | | | | 168,098 | |
| | | | | | | | |
| | | | 53,561,944 | |
|
| Austria — 0.2% | |
ANDRITZ AG | | | 2,807 | | | | 120,674 | |
Erste Group Bank AG(b) | | | 15,773 | | | | 592,468 | |
OMV AG | | | 7,068 | | | | 395,983 | |
Raiffeisen Bank International AG | | | 8,941 | | | | 223,788 | |
Verbund AG | | | 2,859 | | | | 143,478 | |
voestalpine AG | | | 5,074 | | | | 140,731 | |
| | | | | | | | |
| | | | 1,617,122 | |
|
| Belgium — 0.7% | |
Ageas | | | 9,147 | | | | 540,886 | |
Anheuser-Busch InBev SA | | | 36,695 | | | | 3,005,334 | |
Colruyt SA | | | 2,435 | | | | 126,953 | |
Galapagos NV(b) | | | 2,147 | | | | 447,107 | |
Groupe Bruxelles Lambert SA | | | 4,191 | | | | 442,238 | |
KBC Group NV | | | 12,684 | | | | 956,305 | |
Proximus SADP | | | 7,301 | | | | 209,201 | |
Solvay SA | | | 3,386 | | | | 394,106 | |
Telenet Group Holding NV | | | 1,636 | | | | 73,543 | |
UCB SA | | | 5,499 | | | | 437,580 | |
Umicore SA | | | 9,298 | | | | 453,129 | |
| | | | | | | | |
| | | | 7,086,382 | |
|
| Brazil — 1.3% | |
Ambev SA | | | 211,436 | | | | 981,309 | |
Atacadao SA | | | 19,425 | | | | 112,754 | |
B2W Cia Digital(b) | | | 13,505 | | | | 211,033 | |
B3 SA — Brasil Bolsa Balcao | | | 95,765 | | | | 1,022,950 | |
Banco Bradesco SA | | | 56,646 | | | | 479,760 | |
Banco BTG Pactual SA | | | 8,514 | | | | 161,128 | |
Banco do Brasil SA | | | 40,649 | | | | 533,741 | |
Banco Santander Brasil SA | | | 23,639 | | | | 290,999 | |
BB Seguridade Participacoes SA | | | 29,783 | | | | 279,121 | |
BR Malls Participacoes SA | | | 45,055 | | | | 202,275 | |
BRF SA(b) | | | 28,171 | | | | 246,506 | |
CCR SA | | | 52,990 | | | | 250,019 | |
Centrais Eletricas Brasileiras SA | | | 14,343 | | | | 134,776 | |
Centrais Eletricas Brasileiras SA(b) | | | 2,936 | | | | 27,589 | |
Cia de Saneamento Basico do Estado de Sao Paulo | | | 13,793 | | | | 207,648 | |
Cia Siderurgica Nacional SA | | | 38,838 | | | | 136,228 | |
Cielo SA | | | 56,040 | | | | 116,602 | |
Cogna Educacao | | | 73,599 | | | | 209,122 | |
Cosan SA | | | 9,178 | | | | 158,728 | |
Embraer SA(b) | | | 41,883 | | | | 205,422 | |
Energisa SA | | | 7,713 | | | | 102,637 | |
Engie Brasil Energia SA | | | 15,208 | | | | 192,052 | |
Equatorial Energia SA | | | 36,500 | | | | 206,785 | |
Hapvida Participacoes e Investimentos SA(d) | | | 11,869 | | | | 188,537 | |
Hypera SA | | | 19,300 | | | | 171,233 | |
| | | | |
| SCHEDULE OF INVESTMENTS | | | 19 | |
| | |
Schedule of Investments (continued) December 31, 2019 | | Total International ex U.S. Index Master Portfolio (Percentages shown are based on Net Assets) |
| | | | | | | | |
| Security | | Shares | | | Value | |
|
| Brazil (continued) | |
IRB Brasil Resseguros S/A | | | 30,111 | | | $ | 291,551 | |
Klabin SA | | | 43,092 | | | | 197,212 | |
Localiza Rent a Car SA | | | 21,807 | | | | 257,014 | |
Lojas Renner SA | | | 38,017 | | | | 531,030 | |
Magazine Luiza SA | | | 37,811 | | | | 448,352 | |
Multiplan Empreendimentos Imobiliarios SA | | | 14,550 | | | | 119,722 | |
Natura & Co. Holding SA | | | 16,400 | | | | 157,652 | |
Notre Dame Intermedica Participacoes SA | | | 24,443 | | | | 414,705 | |
Petrobras Distribuidora SA | | | 32,398 | | | | 242,178 | |
Petroleo Brasileiro SA | | | 142,943 | | | | 1,137,091 | |
Porto Seguro SA | | | 4,400 | | | | 68,625 | |
Raia Drogasil SA | | | 9,300 | | | | 258,098 | |
Rumo SA(b) | | | 53,100 | | | | 344,522 | |
Sul America SA | | | 10,107 | | | | 150,548 | |
Suzano SA | | | 31,864 | | | | 314,307 | |
TIM Participacoes SA | | | 41,040 | | | | 159,867 | |
Ultrapar Participacoes SA | | | 41,657 | | | | 263,858 | |
Vale SA | | | 151,827 | | | | 2,011,678 | |
WEG SA | | | 48,816 | | | | 420,604 | |
| | | | | | | | |
| | | | 14,617,568 | |
|
| Canada — 6.5% | |
Agnico Eagle Mines Ltd. | | | 11,305 | | | | 696,295 | |
Air Canada(b) | | | 5,891 | | | | 220,070 | |
Algonquin Power & Utilities Corp.(a) | | | 17,953 | | | | 253,973 | |
Alimentation Couche-Tard, Inc., Class B | | | 42,565 | | | | 1,350,817 | |
AltaGas Ltd. | | | 10,053 | | | | 153,131 | |
Atco Ltd. Class I | | | 3,829 | | | | 146,756 | |
Aurora Cannabis, Inc.(a)(b) | | | 36,707 | | | | 78,867 | |
Bank of Montreal | | | 30,963 | | | | 2,399,689 | |
Bank of Nova Scotia(a) | | | 58,510 | | | | 3,305,001 | |
Barrick Gold Corp. | | | 86,020 | | | | 1,597,784 | |
BCE, Inc. | | | 7,099 | | | | 328,887 | |
BlackBerry Ltd.(b) | | | 22,301 | | | | 143,401 | |
Bombardier, Inc., Class B(b) | | | 82,198 | | | | 122,169 | |
Brookfield Asset Management, Inc., Class A | | | 43,055 | | | | 2,487,711 | |
CAE, Inc. | | | 11,511 | | | | 304,762 | |
Cameco Corp. | | | 18,780 | | | | 166,895 | |
Canadian Apartment Properties REIT | | | 4,555 | | | | 185,946 | |
Canadian Imperial Bank of Commerce(a) | | | 21,475 | | | | 1,787,061 | |
Canadian National Railway Co. | | | 33,295 | | | | 3,011,947 | |
Canadian Natural Resources Ltd. | | | 58,176 | | | | 1,881,631 | |
Canadian Pacific Railway Ltd. | | | 6,852 | | | | 1,746,731 | |
Canadian Tire Corp. Ltd., Class A | | | 3,022 | | | | 325,228 | |
Canadian Utilities Ltd., Class A | | | 5,686 | | | | 171,515 | |
Canopy Growth Corp.(a)(b) | | | 8,564 | | | | 180,111 | |
CCL Industries, Inc., Class B | | | 6,846 | | | | 291,649 | |
Cenovus Energy, Inc. | | | 48,424 | | | | 492,239 | |
CGI, Inc.(b) | | | 12,610 | | | | 1,055,276 | |
CI Financial Corp. | | | 11,467 | | | | 191,713 | |
Constellation Software, Inc. | | | 1,002 | | | | 973,149 | |
Cronos Group, Inc.(a)(b) | | | 7,439 | | | | 57,115 | |
Dollarama, Inc. | | | 12,664 | | | | 435,250 | |
Emera, Inc. | | | 12,252 | | | | 526,386 | |
Empire Co. Ltd., Class A | | | 7,280 | | | | 170,767 | |
Enbridge, Inc. | | | 97,031 | | | | 3,857,927 | |
Encana Corp. | | | 66,055 | | | | 309,279 | |
Fairfax Financial Holdings Ltd. | | | 1,310 | | | | 615,116 | |
First Capital Real Estate Investment Trust | | | 10,928 | | | | 173,949 | |
Fortis, Inc. | | | 20,994 | | | | 871,092 | |
Franco-Nevada Corp. | | | 9,060 | | | | 935,548 | |
George Weston Ltd. | | | 4,118 | | | | 326,700 | |
Gildan Activewear, Inc. | | | 9,332 | | | | 275,889 | |
Great-West Lifeco, Inc. | | | 13,282 | | | | 340,194 | |
H&R Real Estate Investment Trust | | | 5,810 | | | | 94,406 | |
| | | | | | | | |
| Security | | Shares | | | Value | |
|
| Canada (continued) | |
Husky Energy, Inc. | | | 15,100 | | | $ | 121,167 | |
Hydro One Ltd.(d) | | | 13,242 | | | | 255,754 | |
iA Financial Corp. Inc. | | | 6,144 | | | | 337,493 | |
IGM Financial, Inc. | | | 4,062 | | | | 116,616 | |
Imperial Oil Ltd. | | | 11,421 | | | | 302,115 | |
Intact Financial Corp. | | | 6,587 | | | | 712,292 | |
Inter Pipeline Ltd.(a) | | | 18,400 | | | | 319,384 | |
Keyera Corp. | | | 8,699 | | | | 227,900 | |
Kinross Gold Corp.(b) | | | 75,016 | | | | 355,857 | |
Kirkland Lake Gold Ltd. | | | 10,192 | | | | 449,263 | |
Loblaw Cos. Ltd. | | | 8,981 | | | | 463,384 | |
Magna International, Inc. | | | 13,924 | | | | 763,458 | |
Manulife Financial Corp. | | | 95,208 | | | | 1,932,681 | |
Methanex Corp. | | | 3,599 | | | | 138,993 | |
Metro, Inc. | | | 11,614 | | | | 479,299 | |
National Bank of Canada | | | 14,884 | | | | 826,182 | |
Nutrien Ltd.(a) | | | 27,396 | | | | 1,311,624 | |
Onex Corp. | | | 4,171 | | | | 263,934 | |
Open Text Corp. | | | 14,028 | | | | 618,137 | |
Parkland Fuel Corp. | | | 7,050 | | | | 259,024 | |
Pembina Pipeline Corp.(a) | | | 25,186 | | | | 933,504 | |
Power Corp. of Canada | | | 15,897 | | | | 409,499 | |
Power Financial Corp.(a) | | | 12,359 | | | | 332,543 | |
PrairieSky Royalty Ltd. | | | 13,775 | | | | 161,560 | |
Quebecor, Inc., Class B | | | 7,073 | | | | 180,508 | |
Restaurant Brands International, Inc. | | | 13,453 | | | | 857,602 | |
RioCan Real Estate Investment Trust | | | 9,233 | | | | 190,270 | |
Rogers Communications, Inc., Class B | | | 17,858 | | | | 886,746 | |
Royal Bank of Canada | | | 67,441 | | | | 5,336,385 | |
Saputo, Inc. | | | 10,865 | | | | 336,354 | |
Shaw Communications, Inc., Class B | | | 21,778 | | | | 441,916 | |
Shopify, Inc., Class A(b) | | | 4,807 | | | | 1,911,250 | |
SmartCentres Real Estate Investment Trust | | | 4,313 | | | | 103,661 | |
Stars Group, Inc.(b) | | | 12,831 | | | | 334,868 | |
Sun Life Financial, Inc. | | | 29,672 | | | | 1,352,955 | |
Suncor Energy, Inc. | | | 75,952 | | | | 2,489,328 | |
TC Energy Corp. | | | 44,348 | | | | 2,361,948 | |
Teck Resources Ltd., Class B | | | 21,176 | | | | 367,243 | |
TELUS Corp. | | | 10,231 | | | | 396,145 | |
Thomson Reuters Corp. | | | 10,771 | | | | 770,489 | |
Toronto-Dominion Bank | | | 85,710 | | | | 4,807,100 | |
West Fraser Timber Co. Ltd. | | | 3,334 | | | | 147,065 | |
Wheaton Precious Metals Corp. | | | 19,152 | | | | 569,892 | |
WSP Global, Inc. | | | 4,270 | | | | 291,572 | |
| | | | | | | | |
| | | | 71,264,982 | |
|
| Chile — 0.2% | |
Aguas Andinas SA, Class A | | | 76,400 | | | | 32,411 | |
Antofagasta PLC | | | 18,127 | | | | 219,477 | |
Banco de Chile | | | 2,943,762 | | | | 312,012 | |
Banco de Credito e Inversiones SA | | | 2,187 | | | | 99,178 | |
Banco Santander Chile | | | 3,205,454 | | | | 183,303 | |
Cencosud SA | | | 73,021 | | | | 96,138 | |
Cia Cervecerias Unidas SA | | | 4,404 | | | | 43,164 | |
Colbun SA | | | 466,420 | | | | 74,434 | |
Empresa Nacional de Telecomunicaciones SA(b) | | | 2,032 | | | | 14,452 | |
Empresas CMPC SA | | | 65,894 | | | | 161,241 | |
Empresas COPEC SA(b) | | | 18,259 | | | | 163,905 | |
Enel Americas SA | | | 1,752,619 | | | | 389,238 | |
Enersis Chile SA | | | 1,771,049 | | | | 166,047 | |
Itau CorpBanca | | | 2,375,874 | | | | 13,776 | |
Latam Airlines Group SA | | | 10,650 | | | | 121,504 | |
Lundin Mining Corp. | | | 21,717 | | | | 129,778 | |
SACI Falabella | | | 39,547 | | | | 170,452 | |
| | | | | | | | |
| | | | 2,390,510 | |
| | |
| 20 | | 2019 BLACKROCK ANNUAL REPORTTO SHAREHOLDERS |
| | |
Schedule of Investments (continued) December 31, 2019 | | Total International ex U.S. Index Master Portfolio (Percentages shown are based on Net Assets) |
| | | | | | | | |
| Security | | Shares | | | Value | |
|
| China — 9.5% | |
3SBio, Inc.(b)(d) | | | 95,500 | | | $ | 123,721 | |
51job, Inc. — ADR(a)(b) | | | 1,550 | | | | 131,595 | |
58.com, Inc. — ADR(b) | | | 4,858 | | | | 314,458 | |
A-Living Services Co. Ltd.(d) | | | 30,250 | | | | 104,384 | |
AAC Technologies Holdings, Inc.(a) | | | 29,500 | | | | 257,535 | |
AECC Aviation Power Co. Ltd., Class A | | | 24,600 | | | | 76,716 | |
Agile Group Holdings Ltd.(a) | | | 76,000 | | | | 114,206 | |
Agricultural Bank of China Ltd., Class A | | | 289,800 | | | | 153,692 | |
Agricultural Bank of China Ltd., Class H | | | 1,123,000 | | | | 494,301 | |
Aier Eye Hospital Group Co. Ltd., Class A | | | 21,320 | | | | 121,347 | |
Air China Ltd. | | | 111,198 | | | | 155,110 | |
Air China Ltd., Class H | | | 62,000 | | | | 62,900 | |
Alibaba Group Holding Ltd. — ADR(b) | | | 80,930 | | | | 17,165,253 | |
Alibaba Health Information Technology Ltd.(b) | | | 176,000 | | | | 203,293 | |
Aluminum Corp. of China Ltd., Class H(b) | | | 164,000 | | | | 56,203 | |
Anhui Conch Cement Co. Ltd., Class A | | | 17,700 | | | | 139,446 | |
Anhui Conch Cement Co. Ltd., Class H | | | 45,500 | | | | 331,519 | |
ANTA Sports Products Ltd. | | | 55,000 | | | | 492,425 | |
Autohome, Inc. — ADR(a)(b) | | | 3,672 | | | | 293,797 | |
AviChina Industry & Technology Co. Ltd., Class H | | | 116,000 | | | | 52,273 | |
BAIC Motor Corp. Ltd., Class H(d) | | | 114,000 | | | | 64,778 | |
Baidu, Inc. — ADR(b) | | | 13,126 | | | | 1,659,126 | |
Bank of Beijing Co. Ltd., Class A | | | 100,100 | | | | 81,743 | |
Bank of China Ltd., Class A | | | 111,600 | | | | 59,192 | |
Bank of China Ltd., Class H | | | 3,803,000 | | | | 1,625,699 | |
Bank of Communications Co. Ltd., Class A | | | 130,900 | | | | 105,944 | |
Bank of Communications Co. Ltd., Class H | | | 323,700 | | | | 230,016 | |
Bank of Hangzhou Co. Ltd., Class A | | | 70,800 | | | | 93,247 | |
Bank of Jiangsu Co. Ltd., Class A | | | 79,800 | | | | 83,097 | |
Bank of Nanjing Co. Ltd., Class A | | | 142,100 | | | | 179,210 | |
Bank of Ningbo Co. Ltd., Class A | | | 25,600 | | | | 103,710 | |
Bank of Shanghai Co. Ltd., Class A | | | 76,510 | | | | 104,426 | |
Baoshan Iron & Steel Co. Ltd., Class A | | | 165,698 | | | | 136,795 | |
Baozun, Inc., ADR(b) | | | 2,062 | | | | 68,293 | |
BBMG Corp. | | | 260,700 | | | | 139,799 | |
BeiGene Ltd., ADR(a)(b) | | | 2,025 | | | | 335,664 | |
Beijing Capital International Airport Co. Ltd., Class H | | | 100,000 | | | | 96,865 | |
Beijing Enterprises Holdings Ltd. | | | 21,000 | | | | 96,360 | |
Beijing Enterprises Water Group Ltd.(b) | | | 232,000 | | | | 117,343 | |
Best, Inc., ADR(a)(b) | | | 17,452 | | | | 97,033 | |
BOC Hong Kong Holdings Ltd. | | | 186,500 | | | | 647,421 | |
BOE Technology Group Co. Ltd., Class A | | | 158,600 | | | | 103,720 | |
Brilliance China Automotive Holdings Ltd.(a) | | | 148,000 | | | | 153,603 | |
Budweiser Brewing Co. APAC Ltd.(b)(d) | | | 72,800 | | | | 245,709 | |
BYD Co. Ltd., Class A | | | 15,600 | | | | 106,925 | |
Byd Co. Ltd., Class H | | | 30,000 | | | | 149,620 | |
BYD Electronic International Co. Ltd. | | | 15,000 | | | | 28,878 | |
CGN Power Co. Ltd., Class H(d) | | | 546,000 | | | | 145,810 | |
China Agri-Industries Holdings Ltd. | | | 202,000 | | | | 106,997 | |
China Aoyuan Group Ltd. | | | 76,000 | | | | 124,012 | |
China Cinda Asset Management Co. Ltd., Class H | | | 360,000 | | | | 81,829 | |
China CITIC Bank Corp. Ltd., Class H | | | 448,000 | | | | 268,623 | |
China Coal Energy Co. Ltd., Class H | | | 250,000 | | | | 99,213 | |
China Communications Construction Co. Ltd., Class H | | | 239,000 | | | | 194,774 | |
China Communications Services Corp. Ltd., Class H | | | 138,000 | | | | 100,600 | |
China Conch Venture Holdings Ltd. | | | 92,500 | | | | 403,476 | |
China Construction Bank Corp., Class A | | | 83,600 | | | | 86,908 | |
China Construction Bank Corp., Class H | | | 4,524,000 | | | | 3,922,495 | |
China Eastern Airlines Corp. Ltd., Class H(b) | | | 176,000 | | | | 97,514 | |
China Education Group Holdings Ltd.(a) | | | 58,000 | | | | 75,954 | |
China Everbright Bank Co. Ltd., Class A | | | 215,300 | | | | 136,507 | |
China Everbright Bank Co. Ltd., Class H | | | 299,000 | | | | 138,872 | |
China Everbright International Ltd. | | | 146,629 | | | | 117,582 | |
China Everbright Ltd.(a) | | | 52,000 | | | | 97,116 | |
| | | | | | | | |
| Security | | Shares | | | Value | |
|
| China (continued) | |
China Evergrande Group | | | 103,000 | | | $ | 285,579 | |
China Fortune Land Development Co. Ltd., Class A | | | 35,000 | | | | 144,507 | |
China Galaxy Securities Co. Ltd., Class H | | | 132,500 | | | | 78,056 | |
China Gas Holdings Ltd. | | | 97,000 | | | | 363,189 | |
China Hongqiao Group Ltd. | | | 133,000 | | | | 80,210 | |
China Huarong Asset Management Co. Ltd., Class H(a)(d) | | | 320,000 | | | | 50,544 | |
China Huishan Dairy Holdings Co. Ltd.(b)(e) | | | 109,840 | | | | 211 | |
China International Capital Corp. Ltd., Class H(d) | | | 59,200 | | | | 114,141 | |
China International Travel Service Corp. Ltd., Class A | | | 7,700 | | | | 98,532 | |
China Jinmao Holdings Group Ltd. | | | 326,000 | | | | 253,788 | |
China Lesso Group Holdings Ltd. | | | 39,000 | | | | 50,038 | |
China Life Insurance Co. Ltd., Class A | | | 22,200 | | | | 111,463 | |
China Life Insurance Co. Ltd., Class H | | | 346,000 | | | | 962,453 | |
China Literature Ltd.(a)(b)(d) | | | 24,200 | | | | 100,837 | |
China Longyuan Power Group Corp. Ltd., Class H | | | 126,000 | | | | 79,681 | |
China Medical System Holdings Ltd. | | | 61,000 | | | | 87,803 | |
China Mengniu Dairy Co. Ltd.(b) | | | 137,000 | | | | 554,178 | |
China Merchants Bank Co. Ltd., Class A | | | 65,200 | | | | 352,582 | |
China Merchants Bank Co. Ltd., Class H | | | 186,578 | | | | 959,221 | |
China Merchants Port Holdings Co. Ltd. | | | 65,720 | | | | 111,200 | |
China Merchants Securities Co. Ltd., Class A | | | 46,000 | | | | 121,123 | |
China Merchants Shekou Industrial Zone Holdings Co. Ltd., Class A | | | 32,997 | | | | 94,222 | |
China Minsheng Banking Corp. Ltd., Class A(b) | | | 159,000 | | | | 144,213 | |
China Minsheng Banking Corp. Ltd., Class H | | | 367,680 | | | | 277,882 | |
China Mobile Ltd. | | | 295,000 | | | | 2,492,707 | |
China Molybdenum Co. Ltd., Class H(a) | | | 213,000 | | | | 91,390 | |
China National Building Material Co. Ltd., Class H | | | 132,000 | | | | 147,262 | |
China National Nuclear Power Co. Ltd., Class A | | | 102,500 | | | | 73,679 | |
China Oilfield Services Ltd., Class H | | | 64,000 | | | | 100,481 | |
China Overseas Land & Investment Ltd. | | | 188,000 | | | | 732,184 | |
China Pacific Insurance Group Co. Ltd., Class A | | | 15,500 | | | | 84,402 | |
China Pacific Insurance Group Co. Ltd., Class H | | | 128,800 | | | | 507,474 | |
China Petroleum & Chemical Corp., Class A | | | 90,900 | | | | 66,871 | |
China Petroleum & Chemical Corp., Class H | | | 1,228,400 | | | | 739,657 | |
China Power International Development Ltd. | | | 483,000 | | | | 103,528 | |
China Railway Construction Corp. Ltd., Class A | | | 81,100 | | | | 118,228 | |
China Railway Construction Corp. Ltd., Class H | | | 67,000 | | | | 73,379 | |
China Railway Group Ltd., Class H | | | 230,000 | | | | 141,931 | |
China Resources Beer Holdings Co. Ltd. | | | 80,000 | | | | 442,527 | |
China Resources Cement Holdings Ltd. | | | 122,000 | | | | 155,303 | |
China Resources Gas Group Ltd. | | | 48,000 | | | | 263,749 | |
China Resources Land Ltd. | | | 133,111 | | | | 662,272 | |
China Resources Pharmaceutical Group Ltd.(d) | | | 69,500 | | | | 64,430 | |
China Resources Power Holdings Co. Ltd. | | | 118,000 | | | | 165,683 | |
China Shenhua Energy Co. Ltd., Class A | | | 31,800 | | | | 83,446 | |
China Shenhua Energy Co. Ltd., Class H | | | 140,000 | | | | 292,726 | |
China Shipbuilding Industry Co. Ltd. | | | 99,699 | | | | 75,153 | |
China Southern Airlines Co. Ltd., Class H | | | 120,000 | | | | 80,686 | |
China State Construction Engineering Corp. Ltd., Class A | | | 105,700 | | | | 85,409 | |
China State Construction International Holdings Ltd. | | | 70,000 | | | | 63,554 | |
China Taiping Insurance Holdings Co. Ltd. | | | 72,672 | | | | 180,266 | |
China Telecom Corp. Ltd., Class H | | | 612,000 | | | | 252,137 | |
China Tower Corp. Ltd., Class H(d) | | | 1,824,000 | | | | 402,976 | |
China Traditional Chinese Medicine Holdings Co. Ltd. | | | 178,000 | | | | 85,901 | |
China Unicom Hong Kong Ltd. | | | 288,000 | | | | 271,187 | |
China United Network Communications Ltd., Class A | | | 118,200 | | | | 100,159 | |
China Vanke Co. Ltd., Class A | | | 21,601 | | | | 100,029 | |
China Vanke Co. Ltd., Class H | | | 83,000 | | | | 354,086 | |
China Yangtze Power Co. Ltd., Class A | | | 90,600 | | | | 239,426 | |
Chongqing Rural Commercial Bank Co. Ltd., Class H | | | 122,000 | | | | 62,322 | |
CIFI Holdings Group Co. Ltd. | | | 170,000 | | | | 143,741 | |
CITIC Ltd. | | | 220,000 | | | | 293,638 | |
CITIC Securities Co. Ltd., Class A | | | 32,100 | | | | 116,913 | |
| | | | |
| SCHEDULE OF INVESTMENTS | | | 21 | |
| | |
Schedule of Investments (continued) December 31, 2019 | | Total International ex U.S. Index Master Portfolio (Percentages shown are based on Net Assets) |
| | | | | | | | |
| Security | | Shares | | | Value | |
|
| China (continued) | |
CITIC Securities Co. Ltd., Class H(a) | | | 103,000 | | | $ | 234,987 | |
CNOOC Ltd. | | | 862,000 | | | | 1,433,359 | |
Contemporary Amperex Technology Co. Ltd. | | | 9,600 | | | | 146,931 | |
COSCO SHIPPING Energy Transportation Co. Ltd., Class H | | | 180,000 | | | | 85,017 | |
COSCO SHIPPING Holdings Co. Ltd.(b) | | | 201,698 | | | | 152,948 | |
COSCO SHIPPING Ports Ltd. | | | 134,000 | | | | 109,749 | |
Country Garden Holdings Co. Ltd. | | | 341,270 | | | | 546,210 | |
Country Garden Services Holdings Co. Ltd.(a) | | | 67,000 | | | | 225,577 | |
CRRC Corp. Ltd., Class A | | | 99,799 | | | | 102,497 | |
CRRC Corp. Ltd., Class H | | | 222,350 | | | | 162,104 | |
CSPC Pharmaceutical Group Ltd. | | | 220,000 | | | | 525,007 | |
Dali Foods Group Co. Ltd.(d) | | | 175,500 | | | | 130,020 | |
Daqin Railway Co. Ltd., Class A | | | 125,000 | | | | 147,498 | |
Dongfeng Motor Group Co. Ltd., Class H | | | 138,000 | | | | 129,828 | |
East Money Information Co. Ltd. | | | 4,500 | | | | 10,217 | |
ENN Energy Holdings Ltd. | | | 43,100 | | | | 470,876 | |
Far East Horizon Ltd. | | | 141,000 | | | | 132,122 | |
Focus Media Information Technology Co. Ltd., Class A | | | 124,100 | | | | 111,802 | |
Foshan Haitian Flavouring & Food Co. Ltd., Class A | | | 6,300 | | | | 97,464 | |
Fosun International Ltd. | | | 131,500 | | | | 191,816 | |
Fuyao Glass Industry Group Co. Ltd., Class A | | | 31,200 | | | | 107,564 | |
GD Power Development Co. Ltd., Class A | | | 234,500 | | | | 78,888 | |
GDS Holdings Ltd. — ADR(a)(b) | | | 2,591 | | | | 133,644 | |
Geely Automobile Holdings Ltd. | | | 228,000 | | | | 446,403 | |
Genscript Biotech Corp.(b) | | | 36,000 | | | | 81,800 | |
GF Securities Co. Ltd., Class H | | | 93,600 | | | | 114,003 | |
GOME Retail Holdings Ltd.(a)(b) | | | 627,000 | | | | 57,973 | |
Great Wall Motor Co. Ltd., Class H | | | 157,500 | | | | 116,535 | |
Gree Electric Appliances, Inc. of Zhuhai, Class A(b) | | | 11,300 | | | | 106,633 | |
Greenland Holdings Corp. Ltd., Class A | | | 208,399 | | | | 208,112 | |
Greentown Service Group Co. Ltd.(a) | | | 94,000 | | | | 102,610 | |
Guangdong Investment Ltd. | | | 122,000 | | | | 255,170 | |
Guangzhou Automobile Group Co. Ltd., Class H(a) | | | 134,400 | | | | 167,327 | |
Guangzhou R&F Properties Co. Ltd., Class H(a) | | | 26,000 | | | | 48,011 | |
Guotai Junan Securities Co. Ltd., Class A | | | 55,544 | | | | 147,832 | |
Haidilao International Holding Ltd.(d) | | | 20,000 | | | | 80,324 | |
Haitian International Holdings Ltd. | | | 67,000 | | | | 162,280 | |
Haitong Securities Co. Ltd., Class A | | | 100,400 | | | | 223,508 | |
Haitong Securities Co. Ltd., Class H | | | 163,200 | | | | 192,795 | |
Hangzhou Hikvision Digital Technology Co. Ltd., Class A | | | 34,899 | | | | 164,615 | |
Hansoh Pharmaceutical Group Co. Ltd.(b)(d) | | | 36,000 | | | | 119,892 | |
Hengan International Group Co. Ltd. | | | 28,000 | | | | 199,446 | |
Hua Hong Semiconductor Ltd.(a)(d) | | | 43,000 | | | | 97,944 | |
Huadian Power International Corp. Ltd., Class H | | | 208,000 | | | | 79,033 | |
Huaneng Power International, Inc., Class H | | | 192,000 | | | | 97,086 | |
Huaneng Renewables Corp. Ltd., Class H | | | 158,000 | | | | 61,440 | |
Huatai Securities Co. Ltd., Class A | | | 31,600 | | | | 92,353 | |
Huatai Securities Co. Ltd., Class H(d) | | | 68,800 | | | | 121,681 | |
Huaxia Bank Co. Ltd., Class A | | | 132,899 | | | | 146,510 | |
Huayu Automotive Systems Co. Ltd., Class A | | | 37,100 | | | | 138,633 | |
Huazhu Group Ltd., ADR(a) | | | 6,229 | | | | 249,596 | |
HUYA, Inc., ADR(b) | | | 5,331 | | | | 95,691 | |
Iflytek Co. Ltd., Class A | | | 35,000 | | | | 173,744 | |
Industrial & Commercial Bank of China Ltd., Class A | | | 231,800 | | | | 195,955 | |
Industrial & Commercial Bank of China Ltd., Class H | | | 3,143,000 | | | | 2,424,914 | |
Industrial Bank Co. Ltd., Class A | | | 73,700 | | | | 209,785 | |
Inner Mongolia BaoTou Steel Union Co. Ltd., Class A | | | 710,900 | | | | 134,948 | |
Inner Mongolia Yili Industrial Group Co. Ltd., Class A | | | 19,400 | | | | 86,361 | |
Innovent Biologics, Inc.(b)(d) | | | 41,500 | | | | 141,647 | |
iQIYI, Inc., ADR(a)(b) | | | 6,171 | | | | 130,270 | |
JD.com, Inc. — ADR(b) | | | 35,030 | | | | 1,234,107 | |
Jiangsu Expressway Co. Ltd., Class H | | | 26,000 | | | | 35,628 | |
Jiangsu Hengrui Medicine Co. Ltd., Class A | | | 14,800 | | | | 186,308 | |
| | | | | | | | |
| Security | | Shares | | | Value | |
|
| China (continued) | |
Jiangsu Yanghe Brewery Joint-Stock Co. Ltd., Class A | | | 5,200 | | | $ | 82,703 | |
Jiangxi Copper Co. Ltd., Class H | | | 36,000 | | | | 49,513 | |
JOYY, Inc., ADR(a)(b) | | | 2,186 | | | | 115,399 | |
Kaisa Group Holdings Ltd.(b) | | | 221,000 | | | | 105,500 | |
Kingboard Holdings Ltd. | | | 35,000 | | | | 111,007 | |
Kingdee International Software Group Co. Ltd.(a) | | | 100,000 | | | | 100,044 | |
Kingsoft Corp. Ltd.(b) | | | 25,000 | | | | 64,835 | |
Kunlun Energy Co. Ltd. | | | 134,000 | | | | 118,381 | |
Kweichow Moutai Co. Ltd., Class A | | | 3,716 | | | | 632,765 | |
KWG Group Holdings Ltd.(b) | | | 74,000 | | | | 103,680 | |
Lenovo Group Ltd.(a) | | | 322,000 | | | | 216,240 | |
Li Ning Co. Ltd. | | | 98,500 | | | | 295,429 | |
Logan Property Holdings Co. Ltd. | | | 72,000 | | | | 120,810 | |
Longfor Group Holdings Ltd.(d) | | | 74,500 | | | | 348,882 | |
Luxshare Precision Industry Co. Ltd., Class A | | | 24,100 | | | | 126,742 | |
Luye Pharma Group Ltd.(d) | | | 111,000 | | | | 83,220 | |
Luzhou Laojiao Co. Ltd., Class A | | | 11,300 | | | | 140,955 | |
Meituan Dianping, Class B(b) | | | 50,200 | | | | 655,920 | |
Metallurgical Corp. of China Ltd., Class A | | | 330,500 | | | | 133,064 | |
Midea Group Co. Ltd., Class A | | | 17,300 | | | | 145,136 | |
Momo, Inc., ADR(a) | | | 7,937 | | | | 265,890 | |
Muyuan Foodstuff Co. Ltd. | | | 800 | | | | 10,204 | |
NARI Technology Co. Ltd., Class A | | | 35,700 | | | | 108,763 | |
NetEase, Inc. — ADR(a) | | | 3,531 | | | | 1,082,746 | |
New China Life Insurance Co. Ltd., Class H | | | 43,200 | | | | 185,721 | |
New Oriental Education & Technology Group, Inc. — ADR(b) | | | 6,612 | | | | 801,705 | |
Nexteer Automotive Group Ltd.(a) | | | 81,000 | | | | 73,418 | |
NIO, Inc., ADR(a)(b) | | | 23,275 | | | | 93,566 | |
Noah Holdings Ltd., ADR(a)(b) | | | 1,707 | | | | 60,377 | |
People’s Insurance Co. Group of China Ltd., Class H | | | 381,000 | | | | 158,409 | |
PetroChina Co. Ltd., Class H | | | 818,000 | | | | 411,777 | |
PICC Property & Casualty Co. Ltd., Class H | | | 320,298 | | | | 386,061 | |
Pinduoduo, Inc., ADR(b) | | | 7,986 | | | | 302,031 | |
Ping An Bank Co. Ltd., Class A | | | 47,100 | | | | 111,510 | |
Ping An Healthcare and Technology Co. Ltd.(b)(d) | | | 16,800 | | | | 122,618 | |
Ping An Insurance Group Co. of China Ltd., Class A | | | 35,100 | | | | 431,608 | |
Ping An Insurance Group Co. of China Ltd., Class H | | | 269,000 | | | | 3,183,201 | |
Poly Developments and Holdings Group Co. Ltd., Class A | | | 43,000 | | | | 100,025 | |
Postal Savings Bank of China Co. Ltd., Class H(d) | | | 453,000 | | | | 308,079 | |
Prosus NV(b) | | | 23,738 | | | | 1,776,589 | |
Qingdao Haier Co. Ltd., Class A | | | 41,800 | | | | 117,289 | |
SAIC Motor Corp. Ltd., Class A | | | 30,300 | | | | 103,895 | |
Sany Heavy Industry Co. Ltd., Class A | | | 32,700 | | | | 80,277 | |
Seazen Group Ltd.(a)(b) | | | 108,000 | | | | 131,530 | |
Semiconductor Manufacturing International Corp.(b) | | | 187,600 | | | | 287,389 | |
Shaanxi Coal Industry Co. Ltd. | | | 97,600 | | | | 126,187 | |
Shandong Gold Mining Co. Ltd.(b) | | | 20,860 | | | | 96,930 | |
Shandong Weigao Group Medical Polymer Co. Ltd., Class H | | | 132,000 | | | | 158,169 | |
Shanghai Electric Group Co. Ltd., Class H | | | 104,000 | | | | 34,174 | |
Shanghai Fosun Pharmaceutical Group Co. Ltd., Class A | | | 28,962 | | | | 110,916 | |
Shanghai Fosun Pharmaceutical Group Co. Ltd., Class H | | | 21,500 | | | | 64,886 | |
Shanghai Industrial Holdings Ltd.(b) | | | 15,000 | | | | 28,876 | |
Shanghai International Airport Co. Ltd., Class A | | | 11,200 | | | | 126,957 | |
Shanghai Lujiazui Finance & Trade Zone Development Co. Ltd., Class B | | | 60,800 | | | | 58,760 | |
Shanghai Pharmaceuticals Holding Co. Ltd., Class H | | | 62,000 | | | | 120,651 | |
Shanghai Pudong Development Bank Co. Ltd., Class A | | | 94,987 | | | | 168,937 | |
Shanxi Xinghuacun Fen Wine Factory Co. Ltd. | | | 300 | | | | 3,869 | |
Shenwan Hongyuan Group Co. Ltd., Class A | | | 127,900 | | | | 94,208 | |
Shenzhen Expressway Co., Ltd. | | | 24,000 | | | | 34,439 | |
Shenzhen International Holdings Ltd. | | | 40,500 | | | | 88,975 | |
Shenzhou International Group Holdings Ltd. | | | 35,000 | | | | 511,527 | |
Shimao Property Holdings Ltd. | | | 51,000 | | | | 197,645 | |
SINA Corp.(b) | | | 2,721 | | | | 108,650 | |
| | |
| 22 | | 2019 BLACKROCK ANNUAL REPORTTO SHAREHOLDERS |
| | |
Schedule of Investments (continued) December 31, 2019 | | Total International ex U.S. Index Master Portfolio (Percentages shown are based on Net Assets) |
| | | | | | | | |
| Security | | Shares | | | Value | |
|
| China (continued) | |
Sino-Ocean Group Holding Ltd. | | | 137,000 | | | $ | 54,995 | |
Sinopec Engineering Group Co. Ltd., Class H | | | 105,500 | | | | 63,145 | |
Sinopec Shanghai Petrochemical Co. Ltd., Class H | | | 123,000 | | | | 37,131 | |
Sinopharm Group Co. Ltd., Class H | | | 48,000 | | | | 175,147 | |
Sinotruk Hong Kong Ltd. | | | 56,000 | | | | 119,520 | |
SOHO China Ltd. | | | 195,000 | | | | 73,562 | |
Sunac China Holdings Ltd. | | | 109,000 | | | | 650,733 | |
Suning.com Co. Ltd., Class A | | | 59,200 | | | | 86,067 | |
Sunny Optical Technology Group Co. Ltd. | | | 35,700 | | | | 618,542 | |
TAL Education Group — ADR(b) | | | 17,329 | | | | 835,258 | |
Tencent Holdings Ltd. | | | 274,400 | | | | 13,219,528 | |
Tencent Music Entertainment Group, ADR(b) | | | 5,966 | | | | 70,041 | |
Tingyi Cayman Islands Holding Corp. | | | 88,000 | | | | 150,193 | |
TravelSky Technology Ltd.,Class H | | | 59,000 | | | | 144,031 | |
Trip.com Group Ltd., ADR(b) | | | 23,776 | | | | 797,447 | |
Tsingtao Brewery Co. Ltd., Class H | | | 14,000 | | | | 94,054 | |
Uni-President China Holdings Ltd. | | | 82,000 | | | | 86,147 | |
Vipshop Holdings Ltd. — ADR(b) | | | 19,089 | | | | 270,491 | |
Wanhua Chemical Group Co. Ltd. | | | 14,700 | | | | 118,952 | |
Want Want China Holdings Ltd.(a) | | | 192,000 | | | | 179,340 | |
Weibo Corp. — ADR(a)(b) | | | 2,003 | | | | 92,839 | |
Weichai Power Co. Ltd., Class H | | | 96,800 | | | | 204,318 | |
Wens Foodstuffs Group Co. Ltd., Class A | | | 16,800 | | | | 81,138 | |
Wuchan Zhongda Group Co. Ltd. | | | 158,199 | | | | 119,445 | |
Wuliangye Yibin Co. Ltd., Class A | | | 9,600 | | | | 183,832 | |
WuXi AppTec Co. Ltd., Class A | | | 7,700 | | | | 101,972 | |
WuXi AppTec Co. Ltd., Class H(d) | | | 11,020 | | | | 136,629 | |
Wuxi Biologics Cayman, Inc.(b)(d) | | | 31,500 | | | | 398,961 | |
Xiaomi Corp., Class B(b)(d) | | | 353,800 | | | | 489,969 | |
Xinjiang Goldwind Science & Technology Co. Ltd., Class H | | | 69,600 | | | | 80,879 | |
Xinyi Solar Holdings Ltd. | | | 164,000 | | | | 116,525 | |
Yangzijiang Shipbuilding Holdings Ltd. | | | 94,000 | | | | 78,355 | |
Yanzhou Coal Mining Co. Ltd., Class H | | | 108,000 | | | | 97,032 | |
Yihai International Holding Ltd.(b) | | | 23,000 | | | | 135,014 | |
Yonghui Superstores Co. Ltd., Class A | | | 104,798 | | | | 113,613 | |
Yonyou Network Technology Co. Ltd., Class A | | | 6,000 | | | | 24,543 | |
Yum China Holdings, Inc.(a) | | | 16,777 | | | | 805,464 | |
Yunnan Baiyao Group Co. Ltd., Class A | | | 8,900 | | | | 114,518 | |
Zhangzhou Pientzehuang Pharmaceutical Co. Ltd., Class A | | | 7,799 | | | | 123,264 | |
Zhaojin Mining Industry Co. Ltd., Class H | | | 69,000 | | | | 75,694 | |
Zhejiang Chint Electrics Co. Ltd., Class A(b) | | | 25,000 | | | | 96,345 | |
Zhejiang Expressway Co. Ltd., Class H | | | 54,000 | | | | 49,231 | |
Zhenro Properties Group Ltd.(a) | | | 57,000 | | | | 40,959 | |
ZhongAn Online P&C Insurance Co. Ltd., Class H(b)(d) | | | 30,700 | | | | 110,766 | |
Zhongsheng Group Holdings Ltd.(a) | | | 30,000 | | | | 122,865 | |
Zhuzhou CRRC Times Electric Co. Ltd., Class H | | | 28,400 | | | | 102,754 | |
Zijin Mining Group Co. Ltd., Class H | | | 218,000 | | | | 108,274 | |
ZTE Corp., Class H(b) | | | 14,400 | | | | 44,074 | |
ZTO Express Cayman, Inc., — ADR(a) | | | 16,995 | | | | 396,833 | |
| | | | | | | | |
| | | | 103,608,333 | |
|
| Colombia — 0.1% | |
Bancolombia SA | | | 7,812 | | | | 104,565 | |
Ecopetrol SA | | | 242,372 | | | | 244,419 | |
Grupo Argos SA | | | 6,618 | | | | 35,836 | |
Grupo de Inversiones Suramericana SA | | | 15,087 | | | | 156,046 | |
Interconexion Electrica SA | | | 24,518 | | | | 146,188 | |
Millicom International Cellular SA, SDR | | | 4,663 | | | | 223,935 | |
| | | | | | | | |
| | | | 910,989 | |
|
| Czech Republic — 0.0% | |
CEZ AS | | | 9,764 | | | | 219,442 | |
Komercni Banka AS | | | 3,800 | | | | 139,162 | |
Moneta Money Bank AS(d) | | | 25,594 | | | | 96,032 | |
| | | | | | | | |
| | | | 454,636 | |
| | | | | | | | |
| Security | | Shares | | | Value | |
|
| Denmark — 1.2% | |
AP Moeller — Maersk A/S, Class B | | | 257 | | | $ | 370,656 | |
AP Moeller — Maersk A/S, Class A | | | 235 | | | | 318,538 | |
Carlsberg A/S, Class B | | | 5,272 | | | | 786,772 | |
Chr Hansen Holding A/S | | | 4,740 | | | | 376,675 | |
Coloplast A/S, Class B | | | 4,915 | | | | 609,760 | |
Danske Bank A/S | | | 33,364 | | | | 539,773 | |
Demant A/S(b) | | | 6,575 | | | | 207,065 | |
DSV PANALPINA A/S | | | 10,187 | | | | 1,174,085 | |
Genmab A/S(b) | | | 3,029 | | | | 673,660 | |
H Lundbeck A/S | | | 4,294 | | | | 164,162 | |
ISS A/S | | | 6,402 | | | | 153,615 | |
Novo Nordisk A/S, Class B | | | 84,730 | | | | 4,910,005 | |
Novozymes A/S, Class B | | | 11,276 | | | | 551,795 | |
Orsted A/S(d) | | | 9,561 | | | | 988,844 | |
Pandora A/S | | | 4,563 | | | | 198,497 | |
Tryg A/S | | | 7,189 | | | | 213,128 | |
Vestas Wind Systems A/S | | | 8,948 | | | | 903,805 | |
| | | | | | | | |
| | | | 13,140,835 | |
|
| Egypt — 0.0% | |
Commercial International Bank Egypt SAE | | | 50,357 | | | | 260,476 | |
| | | | | | | | |
|
| Finland — 0.7% | |
Elisa OYJ | | | 6,381 | | | | 352,510 | |
Fortum OYJ | | | 21,500 | | | | 530,694 | |
Kone OYJ, Class B | | | 15,943 | | | | 1,042,478 | |
Metso OYJ | | | 5,754 | | | | 227,312 | |
Neste OYJ | | | 20,322 | | | | 707,107 | |
Nokia OYJ(b) | | | 261,220 | | | | 966,218 | |
Nokian Renkaat OYJ | | | 5,359 | | | | 154,135 | |
Nordea Bank Abp | | | 158,649 | | | | 1,283,499 | |
Orion OYJ, Class B | | | 5,835 | | | | 270,228 | |
Sampo OYJ, Class A | | | 21,362 | | | | 932,731 | |
Stora Enso OYJ, Class R | | | 24,213 | | | | 352,318 | |
UPM-Kymmene OYJ | | | 26,197 | | | | 908,892 | |
Wartsila OYJ Abp | | | 20,628 | | | | 228,011 | |
| | | | | | | | |
| | | | 7,956,133 | |
|
| France — 7.2% | |
Accor SA | | | 9,457 | | | | 443,900 | |
Aeroports de Paris | | | 1,364 | | | | 270,063 | |
Air Liquide SA | | | 22,521 | | | | 3,192,819 | |
Airbus SE | | | 28,080 | | | | 4,121,165 | |
Alstom SA | | | 8,422 | | | | 400,205 | |
Amundi SA(d) | | | 3,754 | | | | 295,201 | |
Arkema SA | | | 2,951 | | | | 315,543 | |
Atos SE | | | 4,016 | | | | 335,589 | |
AXA SA | | | 92,922 | | | | 2,625,626 | |
BioMerieux | | | 1,981 | | | | 176,614 | |
BNP Paribas SA | | | 53,628 | | | | 3,187,545 | |
Bollore SA | | | 36,855 | | | | 161,053 | |
Bouygues SA | | | 11,423 | | | | 486,928 | |
Bureau Veritas SA | | | 10,607 | | | | 277,287 | |
Capgemini SE | | | 7,745 | | | | 947,251 | |
Carrefour SA | | | 28,356 | | | | 476,910 | |
Casino Guichard-Perrachon SA(b) | | | 2,868 | | | | 134,150 | |
Cie de Saint-Gobain | | | 23,735 | | | | 972,324 | |
Cie Generale des Etablissements Michelin SCA | | | 8,630 | | | | 1,062,000 | |
CNP Assurances | | | 7,565 | | | | 150,734 | |
Covivio | | | 2,326 | | | | 264,163 | |
Credit Agricole SA | | | 52,326 | | | | 761,413 | |
Danone SA | | | 29,226 | | | | 2,427,100 | |
Dassault Aviation SA | | | 127 | | | | 166,673 | |
Dassault Systemes SE | | | 6,378 | | | | 1,051,894 | |
Edenred | | | 11,567 | | | | 599,453 | |
Eiffage SA | | | 3,691 | | | | 423,457 | |
| | | | |
| SCHEDULE OF INVESTMENTS | | | 23 | |
| | |
Schedule of Investments (continued) December 31, 2019 | | Total International ex U.S. Index Master Portfolio (Percentages shown are based on Net Assets) |
| | | | | | | | |
| Security | | Shares | | | Value | |
|
| France (continued) | |
Electricite de France SA | | | 30,963 | | | $ | 345,494 | |
Engie SA | | | 84,000 | | | | 1,360,659 | |
EssilorLuxottica SA | | | 13,760 | | | | 2,103,649 | |
Eurazeo SE | | | 2,062 | | | | 141,538 | |
Eutelsat Communications SA | | | 6,653 | | | | 108,134 | |
Faurecia SE | | | 3,630 | | | | 197,064 | |
Gecina SA | | | 2,235 | | | | 400,117 | |
Getlink SE | | | 23,156 | | | | 403,722 | |
Hermes International | | | 1,529 | | | | 1,145,386 | |
ICADE | | | 1,426 | | | | 155,273 | |
Iliad SA | | | 961 | | | | 124,999 | |
Ingenico Group SA | | | 2,934 | | | | 319,155 | |
Ipsen SA | | | 1,966 | | | | 174,515 | |
JCDecaux SA | | | 5,899 | | | | 182,267 | |
Kering SA | | | 3,651 | | | | 2,405,697 | |
Klepierre SA | | | 10,451 | | | | 397,597 | |
L’Oreal SA | | | 11,973 | | | | 3,540,505 | |
Legrand SA | | | 12,821 | | | | 1,047,011 | |
LVMH Moet Hennessy Louis Vuitton SE | | | 13,284 | | | | 6,189,728 | |
Natixis SA | | | 41,329 | | | | 184,101 | |
Orange SA | | | 94,138 | | | | 1,383,471 | |
Pernod Ricard SA | | | 10,131 | | | | 1,812,816 | |
Peugeot SA | | | 27,622 | | | | 665,059 | |
Publicis Groupe SA | | | 10,028 | | | | 454,684 | |
Remy Cointreau SA | | | 958 | | | | 117,667 | |
Renault SA | | | 9,369 | | | | 444,910 | |
Safran SA | | | 15,657 | | | | 2,418,369 | |
Sanofi | | | 53,719 | | | | 5,394,861 | |
Sartorius Stedim Biotech | | | 1,419 | | | | 235,536 | |
Schneider Electric SE | | | 26,164 | | | | 2,688,082 | |
SCOR SE | | | 8,239 | | | | 346,827 | |
SEB SA | | | 1,060 | | | | 157,651 | |
Societe Generale SA | | | 38,898 | | | | 1,357,461 | |
Sodexo SA | | | 4,102 | | | | 486,118 | |
Suez | | | 20,135 | | | | 305,111 | |
Teleperformance | | | 2,820 | | | | 688,976 | |
Thales SA | | | 5,674 | | | | 590,407 | |
TOTAL SA | | | 113,358 | | | | 6,290,293 | |
UbiSoft Entertainment SA(b) | | | 3,326 | | | | 230,436 | |
Unibail-Rodamco-Westfield | | | 6,636 | | | | 1,046,943 | |
Valeo SA | | | 12,421 | | | | 440,241 | |
Veolia Environnement SA | | | 24,151 | | | | 642,618 | |
Vinci SA | | | 24,177 | | | | 2,692,679 | |
Vivendi SA | | | 44,181 | | | | 1,279,372 | |
Wendel SA | | | 1,358 | | | | 180,896 | |
Worldline SA(b)(d) | | | 4,359 | | | | 309,014 | |
| | | | | | | | |
| | | | 79,314,169 | |
|
| Germany — 5.3% | |
adidas AG | | | 8,655 | | | | 2,813,469 | |
Allianz SE, Registered Shares | | | 20,159 | | | | 4,939,515 | |
Aroundtown SA | | | 42,024 | | | | 377,450 | |
BASF SE | | | 44,016 | | | | 3,316,017 | |
Bayer AG, Registered Shares | | | 44,803 | | | | 3,642,331 | |
Bayerische Motoren Werke AG | | | 15,516 | | | | 1,270,849 | |
Beiersdorf AG | | | 4,329 | | | | 517,875 | |
Brenntag AG | | | 6,771 | | | | 367,372 | |
Carl Zeiss Meditec AG, Bearer Shares | | | 2,236 | | | | 284,262 | |
Commerzbank AG | | | 42,982 | | | | 265,458 | |
Continental AG | | | 5,218 | | | | 674,323 | |
Covestro AG(d) | | | 8,522 | | | | 396,529 | |
Daimler AG, Registered Shares | | | 42,097 | | | | 2,327,303 | |
Delivery Hero SE(b)(d) | | | 5,971 | | | | 473,257 | |
Deutsche Bank AG, Registered Shares | | | 97,089 | | | | 752,296 | |
Deutsche Boerse AG | | | 9,113 | | | | 1,429,033 | |
| | | | | | | | |
| Security | | Shares | | | Value | |
|
| Germany (continued) | |
Deutsche Lufthansa AG, Registered Shares | | | 9,239 | | | $ | 170,063 | |
Deutsche Post AG, Registered Shares | | | 47,617 | | | | 1,810,596 | |
Deutsche Telekom AG, Registered Shares | | | 157,635 | | | | 2,576,098 | |
Deutsche Wohnen SE, Bearer Shares | | | 17,911 | | | | 728,562 | |
E.ON SE | | | 108,066 | | | | 1,154,888 | |
Evonik Industries AG | | | 10,596 | | | | 323,626 | |
Fraport AG Frankfurt Airport Services Worldwide | | | 2,602 | | | | 220,871 | |
Fresenius Medical Care AG & Co. KGaA | | | 10,055 | | | | 740,328 | |
Fresenius SE & Co. KGaA | | | 19,365 | | | | 1,089,735 | |
GEA Group AG | | | 8,213 | | | | 271,585 | |
Hannover Rueck SE | | | 2,781 | | | | 536,217 | |
HeidelbergCement AG | | | 6,401 | | | | 465,128 | |
Henkel AG & Co. KGaA | | | 5,345 | | | | 502,390 | |
Hochtief AG | | | 1,191 | | | | 151,633 | |
Infineon Technologies AG | | | 58,082 | | | | 1,312,325 | |
KION Group AG | | | 3,141 | | | | 215,998 | |
Knorr-Bremse AG | | | 2,374 | | | | 241,660 | |
LANXESS AG | | | 3,663 | | | | 245,946 | |
Merck KGaA | | | 6,299 | | | | 742,613 | |
METRO AG | | | 12,460 | | | | 200,496 | |
MTU Aero Engines AG | | | 2,395 | | | | 682,397 | |
Muenchener Rueckversicherungs-Gesellschaft AG, Registered Shares | | | 6,784 | | | | 2,001,910 | |
Puma SE | | | 4,318 | | | | 331,113 | |
RWE AG | | | 29,409 | | | | 901,149 | |
SAP SE | | | 47,150 | | | | 6,346,302 | |
Siemens AG, Registered Shares | | | 36,653 | | | | 4,786,572 | |
Siemens Healthineers AG(d) | | | 6,578 | | | | 315,330 | |
Symrise AG | | | 6,068 | | | | 637,801 | |
Telefonica Deutschland Holding AG | | | 31,438 | | | | 91,122 | |
Thyssenkrupp AG(a)(b) | | | 21,457 | | | | 288,320 | |
TUI AG | | | 20,400 | | | | 257,453 | |
Uniper SE | | | 9,623 | | | | 318,056 | |
United Internet AG, Registered Shares | | | 7,997 | | | | 261,896 | |
Volkswagen AG | | | 1,862 | | | | 360,641 | |
Vonovia SE | | | 24,821 | | | | 1,333,120 | |
Wirecard AG | | | 5,813 | | | | 700,947 | |
Zalando SE(b)(d) | | | 7,207 | | | | 363,450 | |
| | | | | | | | |
| | | | 57,525,676 | |
|
| Greece — 0.1% | |
Alpha Bank AE(b) | | | 69,105 | | | | 149,279 | |
Eurobank Ergasias SA(b) | | | 107,023 | | | | 110,673 | |
FF Group(b)(e) | | | 205 | | | | 2 | |
Hellenic Telecommunications Organization SA | | | 12,770 | | | | 204,405 | |
JUMBO SA | | | 4,656 | | | | 96,880 | |
Motor Oil Hellas Corinth Refineries SA | | | 3,560 | | | | 82,396 | |
National Bank of Greece SA(b) | | | 32,926 | | | | 111,776 | |
OPAP SA | | | 10,676 | | | | 138,900 | |
| | | | | | | | |
| | | | 894,311 | |
|
| Hong Kong — 2.0% | |
AIA Group Ltd. | | | 580,800 | | | | 6,108,831 | |
Alibaba Pictures Group Ltd.(a)(b) | | | 480,000 | | | | 84,401 | |
ASM Pacific Technology Ltd. | | | 12,700 | | | | 176,281 | |
Bank of East Asia Ltd.(a) | | | 59,000 | | | | 131,725 | |
Bosideng International Holdings Ltd. | | | 258,000 | | | | 93,073 | |
China Common Rich Renewable Energy Investments Ltd.(b)(e) | | | 11,997 | | | | — | |
China Ding Yi Feng Holdings Ltd.(e) | | | 40,000 | | | | 411 | |
China First Capital Group Ltd.(b) | | | 148,000 | | | | 5,128 | |
CK Asset Holdings Ltd. | | | 121,008 | | | | 873,221 | |
CK Infrastructure Holdings Ltd. | | | 26,000 | | | | 185,034 | |
CLP Holdings Ltd. | | | 81,500 | | | | 855,539 | |
Dairy Farm International Holdings Ltd. | | | 13,100 | | | | 74,801 | |
| | |
| 24 | | 2019 BLACKROCK ANNUAL REPORTTO SHAREHOLDERS |
| | |
Schedule of Investments (continued) December 31, 2019 | | Total International ex U.S. Index Master Portfolio (Percentages shown are based on Net Assets) |
| | | | | | | | |
| Security | | Shares | | | Value | |
|
| Hong Kong (continued) | |
Haier Electronics Group Co. Ltd. | | | 48,000 | | | $ | 149,968 | |
Hang Lung Properties Ltd. | | | 70,000 | | | | 153,702 | |
Hang Seng Bank Ltd. | | | 35,000 | | | | 723,449 | |
Henderson Land Development Co. Ltd. | | | 66,800 | | | | 327,791 | |
HK Electric Investments & HK Electric Investments Ltd.(c) | | | 204,000 | | | | 201,060 | |
HKT Trust & HKT Ltd.(c) | | | 185,900 | | | | 261,986 | |
Hong Kong & China Gas Co. Ltd. | | | 478,619 | | | | 935,159 | |
Hong Kong Exchanges & Clearing Ltd. | | | 57,300 | | | | 1,861,547 | |
Hongkong Land Holdings Ltd. | | | 72,900 | | | | 419,325 | |
Hutchison China MediTech, Ltd., ADR(a)(b) | | | 3,003 | | | | 75,285 | |
Jardine Matheson Holdings Ltd. | | | 10,400 | | | | 578,736 | |
Jardine Strategic Holdings Ltd.(a) | | | 12,400 | | | | 380,284 | |
Kerry Properties Ltd. | | | 27,500 | | | | 87,342 | |
Kingboard Laminates Holdings Ltd. | | | 42,500 | | | | 52,681 | |
Link REIT | | | 98,000 | | | | 1,038,209 | |
Melco Resorts & Entertainment Ltd. — ADR | | | 11,155 | | | | 269,616 | |
MTR Corp. Ltd. | | | 83,500 | | | | 493,444 | |
New World Development Co. Ltd. | | | 280,666 | | | | 384,721 | |
Nine Dragons Paper Holdings Ltd. | | | 39,000 | | | | 40,557 | |
NWS Holdings Ltd. | | | 52,186 | | | | 73,142 | |
PCCW Ltd. | | | 135,000 | | | | 79,879 | |
Power Assets Holdings Ltd. | | | 71,500 | | | | 523,067 | |
Sino Biopharmaceutical Ltd. | | | 371,500 | | | | 519,735 | |
Sino Land Co. Ltd. | | | 130,800 | | | | 189,857 | |
SSY Group Ltd. | | | 104,000 | | | | 84,238 | |
Sun Art Retail Group Ltd. | | | 110,000 | | | | 133,474 | |
Sun Hung Kai Properties Ltd. | | | 74,500 | | | | 1,140,958 | |
Swire Pacific Ltd., Class A | | | 21,000 | | | | 195,084 | |
Swire Properties Ltd. | | | 71,600 | | | | 237,200 | |
Techtronic Industries Co. Ltd. | | | 72,000 | | | | 587,642 | |
Vitasoy International Holdings Ltd.(a) | | | 30,000 | | | | 108,828 | |
WH Group Ltd.(d) | | | 460,000 | | | | 475,628 | |
Wharf Holdings Ltd. | | | 61,000 | | | | 155,043 | |
Wharf Real Estate Investment Co. Ltd. | | | 48,000 | | | | 292,875 | |
Wheelock & Co. Ltd. | | | 34,000 | | | | 226,654 | |
Yue Yuen Industrial Holdings Ltd. | | | 28,000 | | | | 82,636 | |
| | | | | | | | |
| | | | 22,129,247 | |
|
| Hungary — 0.1% | |
MOL Hungarian Oil & Gas PLC | | | 16,294 | | | | 162,420 | |
OTP Bank Nyrt | | | 11,103 | | | | 581,353 | |
Richter Gedeon Nyrt | | | 3,096 | | | | 67,312 | |
| | | | | | | | |
| | | | 811,085 | |
|
| India — 2.4% | |
Adani Ports & Special Economic Zone Ltd. | | | 27,638 | | | | 141,773 | |
Ambuja Cements Ltd. | | | 26,422 | | | | 72,660 | |
Ashok Leyland Ltd. | | | 63,339 | | | | 72,404 | |
Asian Paints Ltd. | | | 12,475 | | | | 312,029 | |
Aurobindo Pharma Ltd. | | | 13,516 | | | | 86,508 | |
Avenue Supermarts, Ltd.(b)(d) | | | 5,577 | | | | 143,719 | |
Axis Bank Ltd. | | | 93,214 | | | | 985,355 | |
Bajaj Auto Ltd. | | | 3,300 | | | | 147,305 | |
Bajaj Finance Ltd. | | | 7,651 | | | | 454,146 | |
Bajaj Finserv Ltd. | | | 1,518 | | | | 199,860 | |
Bandhan Bank Ltd.(d) | | | 15,438 | | | | 109,969 | |
Berger Paints India Ltd. | | | 8,379 | | | | 60,520 | |
Bharat Forge Ltd. | | | 11,954 | | | | 80,960 | |
Bharat Petroleum Corp. Ltd. | | | 35,066 | | | | 241,199 | |
Bharti Airtel Ltd.(b) | | | 103,040 | | | | 657,983 | |
Bharti Infratel Ltd. | | | 35,488 | | | | 125,539 | |
Bosch Ltd. | | | 292 | | | | 62,913 | |
Britannia Industries, Ltd. | | | 2,511 | | | | 106,555 | |
Cipla Ltd. | | | 13,384 | | | | 89,681 | |
Coal India Ltd. | | | 75,173 | | | | 222,866 | |
| | | | | | | | |
| Security | | Shares | | | Value | |
|
| India (continued) | |
Colgate-Palmolive India Ltd. | | | 5,077 | | | $ | 104,093 | |
Container Corp. Of India Ltd. | | | 7,502 | | | | 60,108 | |
Dabur India Ltd. | | | 20,426 | | | | 131,233 | |
Divi’s Laboratories Ltd. | | | 3,485 | | | | 90,185 | |
DLF Ltd. | | | 33,599 | | | | 108,709 | |
Dr. Reddy’s Laboratories Ltd. | | | 1,007 | | | | 40,587 | |
Dr. Reddy’s Laboratories Ltd. — ADR(a) | | | 4,517 | | | | 183,300 | |
Eicher Motors Ltd. | | | 644 | | | | 203,373 | |
GAIL India Ltd. | | | 43,712 | | | | 74,097 | |
Godrej Consumer Products Ltd. | | | 13,857 | | | | 132,934 | |
Grasim Industries Ltd. | | | 15,713 | | | | 163,731 | |
Havells India Ltd. | | | 8,781 | | | | 79,613 | |
HCL Technologies Ltd. | | | 46,092 | | | | 366,847 | |
HDFC Asset Management Co. Ltd.(d) | | | 2,674 | | | | 119,899 | |
HDFC Standard Life Insurance Co. Ltd.(d) | | | 20,635 | | | | 181,061 | |
Hero MotoCorp Ltd. | | | 4,266 | | | | 146,048 | |
Hindalco Industries Ltd. | | | 75,665 | | | | 229,388 | |
Hindustan Petroleum Corp. Ltd. | | | 16,963 | | | | 62,743 | |
Hindustan Unilever Ltd. | | | 31,045 | | | | 836,632 | |
Housing Development Finance Corp. Ltd. | | | 79,040 | | | | 2,672,535 | |
ICICI Bank Ltd. | | | 191,508 | | | | 1,452,351 | |
ICICI Bank Ltd. — ADR(a) | | | 22,806 | | | | 344,142 | |
ICICI Lombard General Insurance Co. Ltd.(d) | | | 5,224 | | | | 101,497 | |
ICICI Prudential Life Insurance Co. Ltd.(d) | | | 12,623 | | | | 85,320 | |
Indian Oil Corp. Ltd. | | | 94,789 | | | | 166,568 | |
Info Edge India Ltd. | | | 4,063 | | | | 144,016 | |
Infosys Ltd. | | | 64,313 | | | | 662,297 | |
Infosys Ltd. — ADR(a) | | | 97,713 | | | | 1,008,398 | |
InterGlobe Aviation Ltd.(d) | | | 5,982 | | | | 111,761 | |
ITC Ltd. | | | 167,563 | | | | 558,124 | |
JSW Steel Ltd. | | | 32,800 | | | | 124,265 | |
Larsen & Toubro Ltd. | | | 5,195 | | | | 94,500 | |
Larsen & Toubro Ltd. — GDR | | | 18,237 | | | | 335,057 | |
LIC Housing Finance Ltd. | | | 17,978 | | | | 109,392 | |
Lupin Ltd. | | | 11,830 | | | | 126,613 | |
Mahindra & Mahindra Financial Services Ltd. | | | 10,804 | | | | 48,834 | |
Mahindra & Mahindra Ltd. | | | 3,897 | | | | 29,039 | |
Mahindra & Mahindra Ltd., — GDR | | | 27,036 | | | | 204,392 | |
Marico Ltd. | | | 22,064 | | | | 105,616 | |
Maruti Suzuki India Ltd. | | | 4,353 | | | | 449,453 | |
Motherson Sumi Systems Ltd. | | | 67,315 | | | | 138,337 | |
Nestle India Ltd. | | | 1,381 | | | | 286,062 | |
NTPC Ltd. | | | 151,656 | | | | 252,944 | |
Oil & Natural Gas Corp. Ltd. | | | 142,049 | | | | 256,505 | |
Page Industries Ltd. | | | 266 | | | | 87,214 | |
Petronet LNG Ltd. | | | 23,885 | | | | 89,693 | |
Pidilite Industries Ltd. | | | 5,574 | | | | 108,305 | |
Piramal Enterprises Ltd. | | | 4,721 | | | | 100,870 | |
Power Grid Corp. of India Ltd. | | | 92,096 | | | | 245,471 | |
REC Ltd. | | | 38,827 | | | | 77,864 | |
Reliance Industries Ltd. | | | 23,507 | | | | 498,633 | |
Reliance Industries Ltd., — GDR(d) | | | 54,998 | | | | 2,340,165 | |
SBI Life Insurance Co. Ltd.(d) | | | 13,281 | | | | 179,005 | |
Shree Cement Ltd. | | | 615 | | | | 175,467 | |
Shriram Transport Finance Co. Ltd. | | | 5,718 | | | | 93,815 | |
Siemens Ltd. | | | 4,979 | | | | 104,442 | |
State Bank of India(b) | | | 27,343 | | | | 127,958 | |
State Bank of India — GDR(b) | | | 5,712 | | | | 267,322 | |
Sun Pharmaceutical Industries Ltd. | | | 43,350 | | | | 262,700 | |
Tata Consultancy Services Ltd. | | | 43,804 | | | | 1,326,612 | |
Tata Motors Ltd.(b) | | | 52,939 | | | | 137,108 | |
Tata Motors Ltd. — ADR(b) | | | 6,008 | | | | 77,683 | |
Tata Power Co. Ltd. | | | 42,988 | | | | 34,039 | |
Tata Steel Ltd. | | | 11,672 | | | | 77,316 | |
| | | | |
| SCHEDULE OF INVESTMENTS | | | 25 | |
| | |
Schedule of Investments (continued) December 31, 2019 | | Total International ex U.S. Index Master Portfolio (Percentages shown are based on Net Assets) |
| | | | | | | | |
| Security | | Shares | | | Value | |
|
| India (continued) | |
Tech Mahindra Ltd. | | | 26,191 | | | $ | 279,713 | |
Titan Co. Ltd. | | | 17,951 | | | | 298,908 | |
UltraTech Cement Ltd. | | | 4,530 | | | | 256,872 | |
United Spirits Ltd.(b) | | | 18,510 | | | | 155,532 | |
UPL Ltd. | | | 26,481 | | | | 216,816 | |
Vedanta Ltd. | | | 28,074 | | | | 60,050 | |
Vedanta Ltd. — ADR(a) | | | 11,497 | | | | 99,219 | |
Wipro Ltd. | | | 54,155 | | | | 186,475 | |
Wipro Ltd. — ADR | | | 13,184 | | | | 49,440 | |
Zee Entertainment Enterprises Ltd. | | | 50,406 | | | | 206,346 | |
| | | | | | | | |
| | | | 25,777,596 | |
|
| Indonesia — 0.5% | |
Ace Hardware Indonesia Tbk PT | | | 253,400 | | | | 27,289 | |
Adaro Energy Tbk PT | | | 1,086,700 | | | | 121,440 | |
Astra International Tbk PT | | | 965,400 | | | | 480,859 | |
Bank Central Asia Tbk PT | | | 459,900 | | | | 1,106,062 | |
Bank Mandiri Persero Tbk PT | | | 892,400 | | | | 493,108 | |
Bank Negara Indonesia Persero Tbk PT | | | 405,600 | | | | 228,968 | |
Bank Rakyat Indonesia Persero Tbk PT | | | 2,771,400 | | | | 877,220 | |
Bank Tabungan Negara Persero Tbk PT | | | 473,000 | | | | 72,110 | |
Barito Pacific Tbk PT | | | 810,100 | | | | 88,017 | |
Bumi Serpong Damai Tbk PT(b) | | | 384,500 | | | | 34,653 | |
Charoen Pokphand Indonesia Tbk PT | | | 509,500 | | | | 238,280 | |
Gudang Garam Tbk PT | | | 22,300 | | | | 85,067 | |
Hanjaya Mandala Sampoerna Tbk PT | | | 483,800 | | | | 73,074 | |
Indah Kiat Pulp & Paper Corp. Tbk PT | | | 126,800 | | | | 70,176 | |
Indocement Tunggal Prakarsa Tbk PT | | | 88,600 | | | | 121,181 | |
Indofood CBP Sukses Makmur Tbk PT | | | 162,400 | | | | 130,411 | |
Indofood Sukses Makmur Tbk PT | | | 159,200 | | | | 90,773 | |
Jasa Marga Persero Tbk PT | | | 75,780 | | | | 28,211 | |
Kalbe Farma Tbk PT | | | 858,400 | | | | 100,082 | |
Pabrik Kertas Tjiwi Kimia Tbk PT | | | 78,500 | | | | 58,016 | |
Pakuwon Jati Tbk PT | | | 2,069,500 | | | | 84,710 | |
Perusahaan Gas Negara Persero Tbk PT | | | 426,200 | | | | 66,453 | |
Semen Indonesia Persero Tbk PT | | | 106,000 | | | | 91,408 | |
Telekomunikasi Indonesia Persero Tbk PT | | | 2,223,800 | | | | 637,068 | |
Unilever Indonesia Tbk PT | | | 74,900 | | | | 226,417 | |
United Tractors Tbk PT | | | 79,900 | | | | 123,709 | |
XL Axiata Tbk PT(b) | | | 131,400 | | | | 29,787 | |
| | | | | | | | |
| | | | 5,784,549 | |
|
| Ireland — 0.4% | |
AerCap Holdings NV(b) | | | 6,636 | | | | 407,915 | |
AIB Group PLC | | | 53,001 | | | | 184,656 | |
Bank of Ireland Group PLC | | | 48,092 | | | | 264,679 | |
CRH PLC(b) | | | 36,231 | | | | 1,453,186 | |
Flutter Entertainment PLC | | | 3,768 | | | | 457,948 | |
Kerry Group PLC, Class A | | | 7,704 | | | | 960,079 | |
Kingspan Group PLC | | | 7,024 | | | | 429,002 | |
Smurfit Kappa Group PLC | | | 9,784 | | | | 377,243 | |
| | | | | | | | |
| | | | 4,534,708 | |
|
| Israel — 0.4% | |
Azrieli Group Ltd. | | | 2,198 | | | | 161,008 | |
Bank Hapoalim BM | | | 59,725 | | | | 496,003 | |
Bank LeumiLe-Israel BM | | | 69,019 | | | | 503,351 | |
Check Point Software Technologies Ltd.(b) | | | 5,145 | | | | 570,889 | |
Elbit Systems Ltd. | | | 1,599 | | | | 249,146 | |
Israel Chemicals Ltd. | | | 34,017 | | | | 160,646 | |
Israel Discount Bank Ltd., Series A | | | 49,699 | | | | 230,813 | |
Mizrahi Tefahot Bank Ltd. | | | 7,034 | | | | 187,628 | |
Nice Ltd.(b) | | | 3,246 | | | | 503,322 | |
Teva Pharmaceutical Industries Ltd. — ADR(b) | | | 56,515 | | | | 553,847 | |
Wix.com Ltd.(b) | | | 2,550 | | | | 312,069 | |
| | | | | | | | |
| | | | 3,928,722 | |
| | | | | | | | |
| Security | | Shares | | | Value | |
|
| Italy — 1.3% | |
Assicurazioni Generali SpA | | | 53,781 | | | $ | 1,110,298 | |
Atlantia SpA | | | 22,697 | | | | 529,723 | |
Davide Campari-Milano SpA | | | 25,177 | | | | 230,050 | |
Enel SpA | | | 387,286 | | | | 3,076,531 | |
Eni SpA | | | 115,988 | | | | 1,801,436 | |
Ferrari NV | | | 6,282 | | | | 1,043,036 | |
FinecoBank Banca Fineco SpA | | | 23,619 | | | | 283,329 | |
Intesa Sanpaolo SpA | | | 720,632 | | | | 1,898,280 | |
Leonardo SpA | | | 15,326 | | | | 179,733 | |
Mediobanca Banca di Credito Finanziario SpA | | | 34,909 | | | | 384,367 | |
Moncler SpA | | | 8,703 | | | | 391,700 | |
Pirelli & C SpA(d) | | | 15,564 | | | | 89,830 | |
Poste Italiane SpA(d) | | | 21,934 | | | | 249,233 | |
Prysmian SpA | | | 11,451 | | | | 276,418 | |
Recordati SpA | | | 5,232 | | | | 220,553 | |
Snam SpA | | | 78,577 | | | | 413,142 | |
Telecom Italia SpA(b) | | | 415,147 | | | | 259,263 | |
Telecom Italia SpA | | | 341,957 | | | | 209,420 | |
Terna Rete Elettrica Nazionale SpA | | | 63,450 | | | | 424,348 | |
UniCredit SpA | | | 99,720 | | | | 1,457,603 | |
| | | | | | | | |
| | | | 14,528,293 | |
|
| Japan — 15.8% | |
ABC-Mart, Inc. | | | 1,700 | | | | 116,044 | |
Acom Co. Ltd. | | | 14,700 | | | | 66,696 | |
Advantest Corp. | | | 9,900 | | | | 558,341 | |
Aeon Co. Ltd. | | | 31,100 | | | | 641,792 | |
AEON Financial Service Co. Ltd. | | | 4,000 | | | | 63,026 | |
Aeon Mall Co. Ltd. | | | 5,190 | | | | 92,058 | |
AGC, Inc. | | | 10,200 | | | | 364,731 | |
Air Water, Inc. | | | 10,700 | | | | 156,130 | |
Aisin Seiki Co. Ltd. | | | 7,000 | | | | 259,278 | |
Ajinomoto Co., Inc. | | | 22,200 | | | | 369,570 | |
Alfresa Holdings Corp. | | | 8,900 | | | | 180,804 | |
Alps Alpine Co. Ltd. | | | 7,600 | | | | 172,515 | |
Amada Holdings Co. Ltd. | | | 13,600 | | | | 154,683 | |
ANA Holdings, Inc. | | | 6,300 | | | | 210,316 | |
Aozora Bank Ltd. | | | 4,500 | | | | 118,884 | |
Asahi Group Holdings Ltd. | | | 17,700 | | | | 807,483 | |
Asahi Intecc Co. Ltd. | | | 10,800 | | | | 316,237 | |
Asahi Kasei Corp. | | | 63,200 | | | | 709,635 | |
Astellas Pharma, Inc. | | | 92,300 | | | | 1,575,559 | |
Bandai Namco Holdings, Inc. | | | 9,500 | | | | 577,906 | |
Bank of Kyoto Ltd. | | | 3,000 | | | | 127,923 | |
Benesse Holdings, Inc. | | | 4,800 | | | | 126,167 | |
Bridgestone Corp. | | | 27,900 | | | | 1,036,488 | |
Brother Industries Ltd. | | | 9,200 | | | | 190,010 | |
Calbee, Inc. | | | 4,500 | | | | 146,616 | |
Canon, Inc.(a) | | | 50,200 | | | | 1,373,897 | |
Casio Computer Co. Ltd. | | | 7,800 | | | | 155,871 | |
Central Japan Railway Co. | | | 6,500 | | | | 1,306,947 | |
Chiba Bank Ltd. (The) | | | 26,100 | | | | 150,073 | |
Chubu Electric Power Co., Inc. | | | 31,400 | | | | 443,866 | |
Chugai Pharmaceutical Co. Ltd. | | | 11,100 | | | | 1,022,257 | |
Chugoku Electric Power Co., Inc. | | | 14,700 | | | | 193,233 | |
Coca-Cola Bottlers Japan Holdings, Inc. | | | 7,100 | | | | 181,407 | |
Concordia Financial Group Ltd. | | | 48,900 | | | | 200,817 | |
Credit Saison Co. Ltd. | | | 7,700 | | | | 133,547 | |
CyberAgent, Inc. | | | 5,400 | | | | 188,113 | |
Dai Nippon Printing Co. Ltd. | | | 13,300 | | | | 359,732 | |
Dai-ichi Life Holdings, Inc. | | | 53,700 | | | | 884,991 | |
Daicel Corp. | | | 11,900 | | | | 113,768 | |
Daifuku Co. Ltd. | | | 4,900 | | | | 296,131 | |
Daiichi Sankyo Co. Ltd. | | | 28,100 | | | | 1,855,843 | |
Daikin Industries Ltd. | | | 11,300 | | | | 1,594,314 | |
| | |
| 26 | | 2019 BLACKROCK ANNUAL REPORTTO SHAREHOLDERS |
| | |
Schedule of Investments (continued) December 31, 2019 | | Total International ex U.S. Index Master Portfolio (Percentages shown are based on Net Assets) |
| | | | | | | | |
| Security | | Shares | | | Value | |
|
| Japan (continued) | |
Daito Trust Construction Co. Ltd. | | | 3,400 | | | $ | 420,159 | |
Daiwa House Industry Co. Ltd. | | | 26,600 | | | | 823,452 | |
Daiwa House REIT Investment Corp. | | | 85 | | | | 222,261 | |
Daiwa Securities Group, Inc. | | | 65,000 | | | | 328,147 | |
Denso Corp. | | | 21,200 | | | | 957,441 | |
Dentsu, Inc. | | | 9,500 | | | | 327,330 | |
Disco Corp. | | | 1,400 | | | | 328,755 | |
East Japan Railway Co. | | | 14,800 | | | | 1,335,876 | |
Eisai Co. Ltd. | | | 12,200 | | | | 912,877 | |
Electric Power Development Co. Ltd. | | | 7,100 | | | | 172,335 | |
FamilyMart Co. Ltd. | | | 14,600 | | | | 349,666 | |
FANUC Corp. | | | 9,300 | | | | 1,717,383 | |
Fast Retailing Co. Ltd. | | | 2,700 | | | | 1,603,999 | |
Fuji Electric Co. Ltd. | | | 7,900 | | | | 239,981 | |
FUJIFILM Holdings Corp. | | | 17,500 | | | | 835,728 | |
Fujitsu Ltd. | | | 8,800 | | | | 827,691 | |
Fukuoka Financial Group, Inc. | | | 7,600 | | | | 145,206 | |
GMO Payment Gateway, Inc. | | | 1,500 | | | | 102,722 | |
Hakuhodo DY Holdings, Inc. | | | 14,000 | | | | 225,274 | |
Hamamatsu Photonics KK | | | 6,400 | | | | 262,275 | |
Hankyu Hanshin Holdings, Inc. | | | 11,600 | | | | 496,197 | |
Hikari Tsushin, Inc. | | | 1,000 | | | | 251,298 | |
Hino Motors Ltd. | | | 12,500 | | | | 132,194 | |
Hirose Electric Co. Ltd. | | | 1,611 | | | | 205,937 | |
Hisamitsu Pharmaceutical Co., Inc. | | | 2,900 | | | | 141,234 | |
Hitachi Chemical Co. Ltd. | | | 5,500 | | | | 230,427 | |
Hitachi Construction Machinery Co. Ltd. | | | 4,600 | | | | 137,022 | |
Hitachi High-Technologies Corp. | | | 4,000 | | | | 283,278 | |
Hitachi Ltd. | | | 47,100 | | | | 1,987,419 | |
Hitachi Metals Ltd. | | | 8,000 | | | | 117,758 | |
Honda Motor Co. Ltd. | | | 77,000 | | | | 2,179,218 | |
Hoshizaki Corp. | | | 2,500 | | | | 222,900 | |
Hoya Corp. | | | 18,200 | | | | 1,737,408 | |
Hulic Co. Ltd. | | | 20,500 | | | | 246,824 | |
Idemitsu Kosan Co. Ltd. | | | 8,649 | | | | 238,987 | |
IHI Corp. | | | 7,700 | | | | 180,188 | |
Iida Group Holdings Co. Ltd. | | | 6,800 | | | | 119,174 | |
Inpex Corp. | | | 45,900 | | | | 475,511 | |
Isetan Mitsukoshi Holdings Ltd. | | | 11,500 | | | | 103,267 | |
Isuzu Motors Ltd. | | | 24,900 | | | | 294,337 | |
ITOCHU Corp. | | | 64,300 | | | | 1,490,260 | |
Itochu Techno-Solutions Corp. | | | 7,100 | | | | 199,951 | |
J. Front Retailing Co. Ltd. | | | 11,100 | | | | 154,815 | |
Japan Airlines Co. Ltd. | | | 5,500 | | | | 171,247 | |
Japan Airport Terminal Co. Ltd. | | | 1,700 | | | | 94,325 | |
Japan Exchange Group, Inc. | | | 24,200 | | | | 426,043 | |
Japan Post Bank Co. Ltd. | | | 18,900 | | | | 181,342 | |
Japan Post Holdings Co. Ltd. | | | 78,500 | | | | 738,250 | |
Japan Post Insurance Co. Ltd. | | | 10,400 | | | | 177,284 | |
Japan Prime Realty Investment Corp. | | | 44 | | | | 193,463 | |
Japan Real Estate Investment Corp. | | | 74 | | | | 491,100 | |
Japan Retail Fund Investment Corp. | | | 107 | | | | 230,254 | |
Japan Tobacco, Inc. | | | 58,600 | | | | 1,306,578 | |
JFE Holdings, Inc. | | | 20,100 | | | | 257,912 | |
JGC Holdings Corp. | | | 10,000 | | | | 159,160 | |
JSR Corp. | | | 7,600 | | | | 139,024 | |
JTEKT Corp. | | | 6,200 | | | | 73,241 | |
JXTG Holdings, Inc. | | | 162,500 | | | | 737,519 | |
Kajima Corp. | | | 21,700 | | | | 288,505 | |
Kakaku.com, Inc. | | | 7,400 | | | | 188,945 | |
Kamigumi Co. Ltd. | | | 4,300 | | | | 94,522 | |
Kansai Electric Power Co., Inc. | | | 30,300 | | | | 351,019 | |
Kansai Paint Co. Ltd. | | | 7,600 | | | | 185,661 | |
Kao Corp. | | | 23,500 | | | | 1,938,164 | |
| | | | | | | | |
| Security | | Shares | | | Value | |
|
| Japan (continued) | |
Kawasaki Heavy Industries Ltd. | | | 5,800 | | | $ | 126,769 | |
KDDI Corp. | | | 84,600 | | | | 2,524,155 | |
Keihan Holdings Co. Ltd. | | | 4,600 | | | | 223,360 | |
Keikyu Corp. | | | 11,000 | | | | 212,069 | |
Keio Corp. | | | 5,500 | | | | 332,801 | |
Keisei Electric Railway Co. Ltd. | | | 5,400 | | | | 209,247 | |
Keyence Corp. | | | 8,680 | | | | 3,047,881 | |
Kikkoman Corp. | | | 6,100 | | | | 298,624 | |
Kintetsu Group Holdings Co. Ltd. | | | 9,000 | | | | 488,158 | |
Kirin Holdings Co. Ltd. | | | 40,600 | | | | 886,159 | |
Kobayashi Pharmaceutical Co. Ltd. | | | 2,600 | | | | 220,223 | |
Koito Manufacturing Co. Ltd. | | | 4,500 | | | | 208,377 | |
Komatsu Ltd. | | | 45,000 | | | | 1,080,065 | |
Konami Holdings Corp. | | | 5,300 | | | | 217,790 | |
Konica Minolta, Inc. | | | 25,700 | | | | 167,412 | |
Kose Corp. | | | 1,700 | | | | 247,799 | |
Kubota Corp. | | | 49,500 | | | | 777,310 | |
Kuraray Co. Ltd. | | | 13,400 | | | | 162,379 | |
Kurita Water Industries Ltd. | | | 7,400 | | | | 219,595 | |
Kyocera Corp. | | | 15,300 | | | | 1,042,782 | |
Kyowa Kirin Co. Ltd. | | | 12,600 | | | | 296,860 | |
Kyushu Electric Power Co., Inc. | | | 14,400 | | | | 124,934 | |
Kyushu Railway Co. | | | 6,700 | | | | 224,300 | |
Lawson, Inc. | | | 1,900 | | | | 107,849 | |
LINE Corp.(b) | | | 3,000 | | | | 147,397 | |
Lion Corp. | | | 11,900 | | | | 231,320 | |
LIXIL Group Corp. | | | 13,600 | | | | 234,693 | |
M3, Inc. | | | 20,300 | | | | 612,159 | |
Makita Corp. | | | 12,600 | | | | 435,139 | |
Marubeni Corp. | | | 68,200 | | | | 503,887 | |
Marui Group Co. Ltd. | | | 9,500 | | | | 231,634 | |
Maruichi Steel Tube Ltd. | | | 2,400 | | | | 67,446 | |
Mazda Motor Corp. | | | 30,300 | | | | 258,199 | |
McDonald’s Holdings Co. Japan Ltd.(a) | | | 2,300 | | | | 110,811 | |
Mebuki Financial Group, Inc. | | | 38,630 | | | | 98,489 | |
Medipal Holdings Corp. | | | 10,300 | | | | 227,325 | |
MEIJI Holdings Co. Ltd. | | | 4,900 | | | | 331,143 | |
Mercari, Inc.(b) | | | 3,200 | | | | 65,421 | |
MINEBEA MITSUMI, Inc. | | | 14,000 | | | | 289,186 | |
MISUMI Group, Inc. | | | 15,500 | | | | 383,627 | |
Mitsubishi Chemical Holdings Corp. | | | 59,500 | | | | 443,345 | |
Mitsubishi Corp. | | | 65,700 | | | | 1,740,482 | |
Mitsubishi Electric Corp. | | | 90,500 | | | | 1,232,219 | |
Mitsubishi Estate Co. Ltd. | | | 54,700 | | | | 1,046,677 | |
Mitsubishi Gas Chemical Co., Inc. | | | 9,300 | | | | 141,678 | |
Mitsubishi Heavy Industries Ltd. | | | 14,800 | | | | 573,897 | |
Mitsubishi Materials Corp. | | | 6,200 | | | | 168,266 | |
Mitsubishi Motors Corp. | | | 36,300 | | | | 151,308 | |
Mitsubishi Tanabe Pharma Corp. | | | 11,500 | | | | 210,968 | |
Mitsubishi UFJ Financial Group, Inc. | | | 595,200 | | | | 3,217,850 | |
Mitsubishi UFJ Lease & Finance Co. Ltd. | | | 15,200 | | | | 97,853 | |
Mitsui & Co. Ltd. | | | 80,400 | | | | 1,429,152 | |
Mitsui Chemicals, Inc. | | | 7,900 | | | | 192,438 | |
Mitsui Fudosan Co. Ltd. | | | 40,900 | | | | 999,593 | |
Mitsui OSK Lines Ltd. | | | 4,700 | | | | 129,252 | |
Mizuho Financial Group, Inc. | | | 1,160,200 | | | | 1,787,194 | |
MonotaRO Co Ltd. | | | 7,500 | | | | 199,657 | |
MS&AD Insurance Group Holdings, Inc. | | | 23,700 | | | | 782,305 | |
Murata Manufacturing Co. Ltd. | | | 27,000 | | | | 1,661,811 | |
Nabtesco Corp. | | | 5,000 | | | | 147,335 | |
Nagoya Railroad Co. Ltd. | | | 11,100 | | | | 344,688 | |
NEC Corp. | | | 11,200 | | | | 463,506 | |
Nexon Co. Ltd.(b) | | | 21,700 | | | | 287,857 | |
NGK Insulators Ltd. | | | 9,000 | | | | 156,564 | |
| | | | |
| SCHEDULE OF INVESTMENTS | | | 27 | |
| | |
Schedule of Investments (continued) December 31, 2019 | | Total International ex U.S. Index Master Portfolio (Percentages shown are based on Net Assets) |
| | | | | | | | |
| Security | | Shares | | | Value | |
|
| Japan (continued) | |
NGK Spark Plug Co. Ltd. | | | 8,500 | | | $ | 164,764 | |
NH Foods Ltd. | | | 4,000 | | | | 165,694 | |
Nidec Corp. | | | 10,800 | | | | 1,475,104 | |
Nikon Corp. | | | 14,700 | | | | 179,776 | |
Nintendo Co. Ltd. | | | 5,400 | | | | 2,159,784 | |
Nippon Building Fund, Inc. | | | 62 | | | | 454,475 | |
Nippon Express Co. Ltd. | | | 3,800 | | | | 222,752 | |
Nippon Paint Holdings Co. Ltd. | | | 7,500 | | | | 386,112 | |
Nippon Shinyaku Co. Ltd. | | | 1,900 | | | | 164,528 | |
Nippon Steel Corp. | | | 39,647 | | | | 597,596 | |
Nippon Telegraph & Telephone Corp. | | | 61,600 | | | | 1,556,859 | |
Nippon Yusen KK | | | 5,300 | | | | 95,525 | |
Nissan Chemical Corp. | | | 5,900 | | | | 247,079 | |
Nissan Motor Co. Ltd. | | | 120,400 | | | | 697,686 | |
Nisshin Seifun Group, Inc. | | | 9,000 | | | | 157,027 | |
Nissin Foods Holdings Co. Ltd. | | | 3,500 | | | | 259,955 | |
Nitori Holdings Co. Ltd. | | | 4,100 | | | | 647,190 | |
Nitto Denko Corp. | | | 7,300 | | | | 410,463 | |
Nomura Holdings, Inc. | | | 162,300 | | | | 835,161 | |
Nomura Real Estate Holdings, Inc. | | | 5,200 | | | | 124,723 | |
Nomura Real Estate Master Fund, Inc. | | | 232 | | | | 396,843 | |
Nomura Research Institute Ltd. | | | 14,343 | | | | 306,740 | |
NSK Ltd. | | | 14,400 | | | | 136,126 | |
NTT Data Corp. | | | 33,000 | | | | 441,341 | |
NTT DOCOMO, Inc. | | | 61,900 | | | | 1,724,294 | |
Obayashi Corp. | | | 34,800 | | | | 386,512 | |
Obic Co. Ltd. | | | 2,800 | | | | 377,162 | |
Odakyu Electric Railway Co. Ltd. | | | 16,400 | | | | 382,596 | |
Oji Holdings Corp. | | | 39,000 | | | | 210,911 | |
Olympus Corp. | | | 54,900 | | | | 846,157 | |
Omron Corp. | | | 9,100 | | | | 530,422 | |
Ono Pharmaceutical Co. Ltd. | | | 20,400 | | | | 465,738 | |
Oracle Corp. Japan | | | 2,500 | | | | 226,897 | |
Oriental Land Co. Ltd. | | | 9,600 | | | | 1,309,837 | |
ORIX Corp. | | | 60,800 | | | | 1,007,539 | |
OrixJ-REIT, Inc. | | | 142 | | | | 307,791 | |
Osaka Gas Co. Ltd. | | | 18,700 | | | | 357,603 | |
Otsuka Corp. | | | 5,800 | | | | 231,623 | |
Otsuka Holdings Co. Ltd. | | | 18,100 | | | | 806,794 | |
Pan Pacific International Holdings Corp. | | | 20,000 | | | | 331,826 | |
Panasonic Corp. | | | 112,600 | | | | 1,056,096 | |
Park24 Co. Ltd. | | | 6,400 | | | | 156,711 | |
PeptiDream, Inc.(b) | | | 3,600 | | | | 183,972 | |
Persol Holdings Co. Ltd. | | | 8,300 | | | | 155,551 | |
Pigeon Corp. | | | 7,100 | | | | 259,975 | |
Pola Orbis Holdings, Inc. | | | 5,600 | | | | 133,387 | |
Rakuten, Inc. | | | 39,300 | | | | 335,747 | |
Recruit Holdings Co. Ltd. | | | 65,200 | | | | 2,442,087 | |
Renesas Electronics Corp.(b) | | | 36,900 | | | | 252,099 | |
Resona Holdings, Inc. | | | 94,700 | | | | 412,753 | |
Ricoh Co. Ltd. | | | 28,600 | | | | 311,211 | |
Rinnai Corp. | | | 2,100 | | | | 164,113 | |
Rohm Co. Ltd. | | | 3,800 | | | | 303,198 | |
Ryohin Keikaku Co. Ltd. | | | 11,000 | | | | 256,370 | |
Sankyo Co. Ltd. | | | 2,200 | | | | 73,068 | |
Santen Pharmaceutical Co. Ltd. | | | 19,900 | | | | 378,959 | |
SBI Holdings, Inc. | | | 12,550 | | | | 264,959 | |
Secom Co. Ltd. | | | 9,600 | | | | 856,730 | |
Sega Sammy Holdings, Inc. | | | 8,800 | | | | 127,421 | |
Seibu Holdings, Inc. | | | 9,800 | | | | 161,207 | |
Seiko Epson Corp. | | | 14,900 | | | | 224,973 | |
Sekisui Chemical Co. Ltd. | | | 14,400 | | | | 249,839 | |
Sekisui House Ltd. | | | 29,600 | | | | 632,103 | |
Seven & i Holdings Co. Ltd. | | | 37,200 | | | | 1,363,581 | |
| | | | | | | | |
| Security | | Shares | | | Value | |
|
| Japan (continued) | |
Seven Bank Ltd. | | | 32,800 | | | $ | 107,456 | |
SG Holdings Co. Ltd. | | | 6,400 | | | | 144,165 | |
Sharp Corp. | | | 14,100 | | | | 215,483 | |
Shimadzu Corp. | | | 11,000 | | | | 344,005 | |
Shimamura Co. Ltd.(a) | | | 1,100 | | | | 83,626 | |
Shimano, Inc. | | | 3,300 | | | | 535,362 | |
Shimizu Corp. | | | 19,400 | | | | 197,624 | |
Shin-Etsu Chemical Co. Ltd. | | | 17,500 | | | | 1,924,528 | |
Shinsei Bank Ltd. | | | 10,800 | | | | 164,778 | |
Shionogi & Co. Ltd. | | | 12,300 | | | | 760,896 | |
Shiseido Co. Ltd. | | | 19,200 | | | | 1,363,391 | |
Shizuoka Bank Ltd. | | | 16,000 | | | | 119,012 | |
Showa Denko KK | | | 8,400 | | | | 221,386 | |
SMC Corp. | | | 2,800 | | | | 1,280,483 | |
Softbank Corp. | | | 82,300 | | | | 1,103,616 | |
SoftBank Group Corp. | | | 76,400 | | | | 3,317,060 | |
Sohgo Security Services Co. Ltd. | | | 4,200 | | | | 227,325 | |
Sompo Holdings, Inc. | | | 14,800 | | | | 581,190 | |
Sony Corp. | | | 61,100 | | | | 4,148,547 | |
Sony Financial Holdings, Inc. | | | 6,900 | | | | 165,634 | |
Square Enix Holdings Co. Ltd. | | | 4,200 | | | | 209,134 | |
Stanley Electric Co. Ltd. | | | 5,700 | | | | 164,623 | |
Subaru Corp. | | | 29,800 | | | | 738,141 | |
Sumco Corp. | | | 9,700 | | | | 160,717 | |
Sumitomo Chemical Co. Ltd. | | | 54,400 | | | | 247,007 | |
Sumitomo Corp. | | | 53,300 | | | | 791,683 | |
Sumitomo Dainippon Pharma Co. Ltd. | | | 6,600 | | | | 127,876 | |
Sumitomo Electric Industries Ltd. | | | 33,500 | | | | 503,108 | |
Sumitomo Heavy Industries Ltd. | | | 4,400 | | | | 124,981 | |
Sumitomo Metal Mining Co. Ltd. | | | 10,100 | | | | 325,220 | |
Sumitomo Mitsui Financial Group, Inc. | | | 61,900 | | | | 2,286,298 | |
Sumitomo Mitsui Trust Holdings, Inc. | | | 15,200 | | | | 600,870 | |
Sumitomo Realty & Development Co. Ltd. | | | 16,000 | | | | 558,232 | |
Sumitomo Rubber Industries Ltd. | | | 5,200 | | | | 63,407 | |
Sundrug Co. Ltd. | | | 4,000 | | | | 144,728 | |
Suntory Beverage & Food Ltd. | | | 6,300 | | | | 263,017 | |
Suzuken Co. Ltd. | | | 3,170 | | | | 129,202 | |
Suzuki Motor Corp. | | | 18,800 | | | | 784,748 | |
Sysmex Corp. | | | 9,000 | | | | 612,764 | |
T&D Holdings, Inc. | | | 24,800 | | | | 313,613 | |
Taiheiyo Cement Corp. | | | 5,900 | | | | 173,183 | |
Taisei Corp. | | | 8,800 | | | | 364,505 | |
Taisho Pharmaceutical Holdings Co. Ltd. | | | 1,300 | | | | 95,934 | |
Taiyo Nippon Sanso Corp. | | | 9,300 | | | | 205,846 | |
Takeda Pharmaceutical Co. Ltd. | | | 71,676 | | | | 2,834,943 | |
TDK Corp. | | | 5,600 | | | | 629,323 | |
Teijin Ltd. | | | 7,200 | | | | 134,511 | |
Terumo Corp. | | | 29,500 | | | | 1,046,492 | |
THK Co. Ltd. | | | 5,800 | | | | 155,720 | |
Tobu Railway Co. Ltd. | | | 8,100 | | | | 293,228 | |
Toho Co. Ltd. | | | 5,500 | | | | 229,197 | |
Toho Gas Co. Ltd. | | | 3,600 | | | | 146,996 | |
Tohoku Electric Power Co., Inc. | | | 14,800 | | | | 146,721 | |
Tokio Marine Holdings, Inc. | | | 31,000 | | | | 1,735,652 | |
Tokyo Century Corp. | | | 2,300 | | | | 122,461 | |
Tokyo Electric Power Co. Holdings, Inc.(b) | | | 84,800 | | | | 362,991 | |
Tokyo Electron Ltd. | | | 7,700 | | | | 1,681,141 | |
Tokyo Gas Co. Ltd. | | | 19,500 | | | | 473,828 | |
Tokyu Corp. | | | 26,700 | | | | 493,755 | |
Tokyu Fudosan Holdings Corp. | | | 30,800 | | | | 212,683 | |
Toppan Printing Co. Ltd. | | | 11,500 | | | | 237,570 | |
Toray Industries, Inc. | | | 70,000 | | | | 474,286 | |
Toshiba Corp. | | | 24,400 | | | | 828,178 | |
Tosoh Corp. | | | 10,700 | | | | 164,842 | |
| | |
| 28 | | 2019 BLACKROCK ANNUAL REPORTTO SHAREHOLDERS |
| | |
Schedule of Investments (continued) December 31, 2019 | | Total International ex U.S. Index Master Portfolio (Percentages shown are based on Net Assets) |
| | | | | | | | |
| Security | | Shares | | | Value | |
|
| Japan (continued) | |
TOTO Ltd. | | | 5,900 | | | $ | 249,140 | |
Toyo Seikan Group Holdings Ltd. | | | 8,500 | | | | 146,321 | |
Toyo Suisan Kaisha Ltd. | | | 5,400 | | | | 229,315 | |
Toyoda Gosei Co. Ltd. | | | 4,300 | | | | 107,368 | |
Toyota Industries Corp. | | | 8,000 | | | | 460,320 | |
Toyota Motor Corp. | | | 107,906 | | | | 7,603,215 | |
Toyota Tsusho Corp. | | | 10,200 | | | | 358,302 | |
Trend Micro, Inc.(b) | | | 5,700 | | | | 291,668 | |
Tsuruha Holdings, Inc. | | | 1,800 | | | | 231,116 | |
Unicharm Corp. | | | 18,900 | | | | 638,200 | |
United Urban Investment Corp. | | | 134 | | | | 251,660 | |
USS Co. Ltd. | | | 12,100 | | | | 228,730 | |
Welcia Holdings Co. Ltd. | | | 2,500 | | | | 158,823 | |
West Japan Railway Co. | | | 8,200 | | | | 709,247 | |
Yakult Honsha Co. Ltd. | | | 5,200 | | | | 286,585 | |
Yamada Denki Co. Ltd. | | | 22,900 | | | | 121,508 | |
Yamaha Corp. | | | 6,900 | | | | 382,560 | |
Yamaha Motor Co. Ltd. | | | 11,600 | | | | 232,382 | |
Yamato Holdings Co. Ltd. | | | 13,300 | | | | 226,760 | |
Yamazaki Baking Co. Ltd. | | | 7,000 | | | | 125,085 | |
Yaskawa Electric Corp. | | | 10,400 | | | | 391,778 | |
Yokogawa Electric Corp. | | | 9,900 | | | | 173,855 | |
Yokohama Rubber Co. Ltd. | | | 5,000 | | | | 96,975 | |
Z Holdings Corp. | | | 127,000 | | | | 536,208 | |
ZOZO, Inc. | | | 4,300 | | | | 82,237 | |
| | | | | | | | |
| | | | 173,323,483 | |
|
| Luxembourg — 0.1% | |
ArcelorMittal SA | | | 28,352 | | | | 499,553 | |
Eurofins Scientific SE(a) | | | 646 | | | | 358,106 | |
Reinet Investments SCA | | | 5,889 | | | | 116,679 | |
SES SA | | | 18,911 | | | | 265,156 | |
Tenaris SA | | | 17,350 | | | | 196,574 | |
| | | | | | | | |
| | | | 1,436,068 | |
|
| Macau — 0.2% | |
Galaxy Entertainment Group Ltd. | | | 96,000 | | | | 706,715 | |
Sands China Ltd. | | | 124,000 | | | | 662,541 | |
SJM Holdings Ltd. | | | 69,000 | | | | 78,568 | |
Wynn Macau Ltd. | | | 73,600 | | | | 181,359 | |
| | | | | | | | |
| | | | 1,629,183 | |
|
| Malaysia — 0.5% | |
AirAsia Group Bhd | | | 60,100 | | | | 24,988 | |
AMMB Holdings Bhd | | | 68,900 | | | | 65,900 | |
Axiata Group Bhd | | | 165,600 | | | | 167,740 | |
British American Tobacco Malaysia Bhd | | | 5,800 | | | | 21,397 | |
CIMB Group Holdings Bhd | | | 239,100 | | | | 301,151 | |
Dialog Group Bhd | | | 142,134 | | | | 120,132 | |
DiGi.Com Bhd | | | 144,300 | | | | 157,503 | |
Fraser & Neave Holdings BHD | | | 12,300 | | | | 104,763 | |
Gamuda Bhd(b) | | | 129,800 | | | | 123,790 | |
Genting Bhd | | | 119,100 | | | | 176,239 | |
Genting Malaysia Bhd | | | 106,100 | | | | 85,402 | |
Genting Plantations Bhd(a) | | | 10,000 | | | | 25,901 | |
Hartalega Holdings Bhd | | | 88,200 | | | | 118,260 | |
Hong Leong Bank Bhd | | | 31,140 | | | | 131,773 | |
Hong Leong Financial Group Bhd | | | 7,000 | | | | 28,921 | |
IHH Healthcare Bhd | | | 143,000 | | | | 191,459 | |
IJM Corp. Bhd | | | 126,600 | | | | 67,213 | |
IOI Corp. Bhd | | | 102,200 | | | | 115,232 | |
Kuala Lumpur Kepong Bhd | | | 17,500 | | | | 106,182 | |
Malayan Banking Bhd | | | 204,800 | | | | 432,778 | |
Malaysia Airports Holdings Bhd | | | 11,300 | | | | 21,001 | |
Maxis Bhd(a) | | | 144,000 | | | | 187,472 | |
MISC Bhd | | | 27,400 | | | | 55,983 | |
| | | | | | | | |
| Security | | Shares | | | Value | |
|
| Malaysia (continued) | |
Nestle Malaysia Bhd | | | 2,400 | | | $ | 86,299 | |
Petronas Chemicals Group Bhd | | | 122,200 | | | | 219,606 | |
Petronas Dagangan Bhd | | | 6,100 | | | | 34,448 | |
Petronas Gas Bhd | | | 34,000 | | | | 138,144 | |
PPB Group Bhd | | | 15,120 | | | | 69,677 | |
Press Metal Aluminium Holdings Bhd(a) | | | 77,800 | | | | 88,578 | |
Public Bank Bhd | | | 138,020 | | | | 656,442 | |
QL Resources Bhd | | | 53,600 | | | | 106,554 | |
RHB Bank Bhd(e) | | | 12,900 | | | | — | |
RHB Capital Bhd | | | 82,424 | | | | 116,468 | |
Sime Darby Bhd | | | 159,000 | | | | 86,307 | |
Sime Darby Plantation Bhd | | | 159,000 | | | | 211,917 | |
Telekom Malaysia Bhd | | | 55,900 | | | | 52,228 | |
Tenaga Nasional Bhd | | | 141,300 | | | | 458,307 | |
Top Glove Corp. Bhd | | | 111,900 | | | | 128,641 | |
Westports Holdings Bhd | | | 70,000 | | | | 72,122 | |
YTL Corp. Bhd | | | 115,423 | | | | 27,657 | |
| | | | | | | | |
| | | | 5,384,575 | |
|
| Mexico — 0.6% | |
Alfa SAB de CV, Series A | | | 153,472 | | | | 127,274 | |
Alsea SAB de CV(b) | | | 43,846 | | | | 115,554 | |
America Movil SAB de CV, Series L | | | 1,646,060 | | | | 1,314,584 | |
Arca Continental SAB de CV | | | 15,972 | | | | 84,457 | |
Cemex SAB de CV CPO | | | 646,337 | | | | 242,024 | |
Coca-Cola Femsa SAB de CV | | | 24,300 | | | | 147,644 | |
El Puerto de Liverpool SAB de CV, Series C1 | | | 10,900 | | | | 54,144 | |
Fibra Uno Administracion SA de CV | | | 143,017 | | | | 221,551 | |
Fomento Economico Mexicano SAB de CV | | | 96,869 | | | | 915,382 | |
Gruma SAB de CV, Class B | | | 9,959 | | | | 102,253 | |
Grupo Aeroportuario del Pacifico SAB de CV, Class B | | | 15,800 | | | | 187,745 | |
Grupo Aeroportuario del Sureste SAB de CV, Class B | | | 10,700 | | | | 200,356 | |
Grupo Bimbo SAB de CV, Series A | | | 46,764 | | | | 85,156 | |
Grupo Carso SAB de CV, Series A1 | | | 11,376 | | | | 42,008 | |
Grupo Financiero Banorte SAB de CV, Series O | | | 129,547 | | | | 723,874 | |
Grupo Financiero Inbursa SAB de CV, Series O | | | 99,700 | | | | 122,282 | |
Grupo Mexico SAB de CV, Series B | | | 177,414 | | | | 486,616 | |
Grupo Televisa SAB CPO | | | 109,894 | | | | 257,887 | |
Industrias Penoles SAB de CV | | | 7,755 | | | | 81,297 | |
Infraestructura Energetica Nova SAB de CV | | | 33,988 | | | | 159,860 | |
Kimberly-Clark de Mexico SAB de CV, Class A(b) | | | 78,500 | | | | 155,692 | |
Megacable Holdings SAB de CV CPO | | | 21,129 | | | | 86,539 | |
Orbia Advance Corp. SAB de CV | | | 36,623 | | | | 78,098 | |
Promotora y Operadora de Infraestructura SAB de CV(b) | | | 4,006 | | | | 41,006 | |
Wal-Mart de Mexico SAB de CV | | | 251,351 | | | | 719,855 | |
| | | | | | | | |
| | | | 6,753,138 | |
|
| Netherlands — 3.1% | |
ABN AMRO Group NV CVA(d) | | | 19,393 | | | | 353,463 | |
Adyen NV(b)(d) | | | 459 | | | | 377,571 | |
Aegon NV | | | 95,385 | | | | 436,635 | |
Akzo Nobel NV | | | 10,504 | | | | 1,072,710 | |
Altice Europe NV, Class A(b) | | | 33,037 | | | | 213,931 | |
ASML Holding NV | | | 20,421 | | | | 6,045,768 | |
EXOR NV | | | 5,704 | | | | 442,239 | |
Heineken Holding NV | | | 5,886 | | | | 572,075 | |
Heineken NV | | | 12,135 | | | | 1,295,142 | |
ING Groep NV | | | 187,602 | | | | 2,255,427 | |
Koninklijke Ahold Delhaize NV | | | 54,716 | | | | 1,371,861 | |
Koninklijke DSM NV | | | 8,316 | | | | 1,087,280 | |
Koninklijke KPN NV | | | 197,999 | | | | 585,954 | |
Koninklijke Philips NV | | | 42,750 | | | | 2,089,778 | |
Koninklijke Vopak NV | | | 4,260 | | | | 231,490 | |
NN Group NV | | | 13,821 | | | | 525,513 | |
NXP Semiconductors NV(a) | | | 13,246 | | | | 1,685,686 | |
| | | | |
| SCHEDULE OF INVESTMENTS | | | 29 | |
| | |
Schedule of Investments (continued) December 31, 2019 | | Total International ex U.S. Index Master Portfolio (Percentages shown are based on Net Assets) |
| | | | | | | | |
| Security | | Shares | | | Value | |
|
| Netherlands (continued) | |
QIAGEN NV(b) | | | 10,175 | | | $ | 346,696 | |
Randstad NV | | | 6,023 | | | | 369,060 | |
Royal Dutch Shell PLC, B Shares | | | 179,203 | | | | 5,319,402 | |
Royal Dutch Shell PLC, Class A | | | 205,871 | | | | 6,096,709 | |
Wolters Kluwer NV | | | 12,456 | | | | 909,481 | |
| | | | | | | | |
| | | | 33,683,871 | |
|
| New Zealand — 0.2% | |
a2 Milk Co. Ltd.(b) | | | 39,580 | | | | 400,762 | |
Auckland International Airport Ltd. | | | 55,568 | | | | 327,539 | |
Fisher & Paykel Healthcare Corp. Ltd. | | | 27,280 | | | | 408,271 | |
Fletcher Building Ltd. | | | 28,052 | | | | 96,153 | |
Mercury NZ Ltd. | | | 24,362 | | | | 82,872 | |
Meridian Energy Ltd. | | | 95,908 | | | | 323,066 | |
Ryman Healthcare Ltd. | | | 13,399 | | | | 147,263 | |
Spark New Zealand Ltd. | | | 83,974 | | | | 244,869 | |
| | | | | | | | |
| | | | 2,030,795 | |
|
| Norway — 0.4% | |
Aker BP ASA | | | 5,988 | | | | 196,528 | |
DNB ASA | | | 41,092 | | | | 768,951 | |
Equinor ASA | | | 48,719 | | | | 971,567 | |
Gjensidige Forsikring ASA | | | 10,710 | | | | 224,813 | |
Mowi ASA | | | 20,651 | | | | 536,945 | |
Norsk Hydro ASA | | | 62,662 | | | | 233,015 | |
Orkla ASA | | | 34,581 | | | | 350,679 | |
Schibsted ASA, Class B | | | 3,873 | | | | 110,679 | |
Telenor ASA | | | 37,046 | | | | 664,075 | |
Yara International ASA | | | 9,852 | | | | 410,472 | |
| | | | | | | | |
| | | | 4,467,724 | |
|
| Pakistan — 0.0% | |
Habib Bank Ltd. | | | 10,100 | | | | 10,267 | |
MCB Bank Ltd. | | | 6,700 | | | | 8,866 | |
Oil & Gas Development Co. Ltd. | | | 11,100 | | | | 10,218 | |
| | | | | | | | |
| | | | 29,351 | |
|
| Peru — 0.1% | |
Compania de Minas Buenaventura SA — ADR | | | 9,607 | | | | 145,066 | |
Credicorp Ltd. | | | 3,324 | | | | 708,444 | |
Southern Copper Corp. | | | 5,855 | | | | 248,720 | |
| | | | | | | | |
| | | | 1,102,230 | |
|
| Philippines — 0.3% | |
Aboitiz Equity Ventures, Inc. | | | 70,570 | | | | 71,646 | |
Aboitiz Power Corp. | | | 29,200 | | | | 19,718 | |
Ayala Corp. | | | 13,480 | | | | 208,795 | |
Ayala Land, Inc. | | | 317,200 | | | | 284,500 | |
Bank of the Philippine Islands | | | 26,042 | | | | 45,199 | |
BDO Unibank, Inc. | | | 93,622 | | | | 292,078 | |
Globe Telecom, Inc. | | | 845 | | | | 33,703 | |
GT Capital Holdings, Inc. | | | 3,701 | | | | 61,896 | |
International Container Terminal Services, Inc. | | | 41,800 | | | | 105,936 | |
JG Summit Holdings, Inc. | | | 156,443 | | | | 249,331 | |
Jollibee Foods Corp. | | | 12,070 | | | | 51,428 | |
Manila Electric Co. | | | 11,960 | | | | 74,861 | |
Megaworld Corp. | | | 600,000 | | | | 47,453 | |
Metro Pacific Investments Corp. | | | 584,000 | | | | 40,129 | |
Metropolitan Bank & Trust Co. | | | 96,987 | | | | 126,967 | |
PLDT, Inc. | | | 6,115 | | | | 119,941 | |
Security Bank Corp. | | | 4,290 | | | | 16,505 | |
SM Investments Corp. | | | 17,272 | | | | 355,426 | |
SM Prime Holdings, Inc. | | | 486,150 | | | | 403,509 | |
Universal Robina Corp. | | | 34,300 | | | | 98,203 | |
| | | | | | | | |
| | | | 2,707,224 | |
| | | | | | | | |
| Security | | Shares | | | Value | |
|
| Poland — 0.2% | |
Bank Millennium SA(b) | | | 13,346 | | | $ | 20,540 | |
Bank Polska Kasa Opieki SA | | | 7,442 | | | | 196,941 | |
CCC SA | | | 981 | | | | 28,442 | |
CD Projekt SA | | | 3,685 | | | | 271,731 | |
Cyfrowy Polsat SA | | | 8,953 | | | | 65,819 | |
Dino Polska SA(b)(d) | | | 1,416 | | | | 53,727 | |
Grupa Lotos SA | | | 6,134 | | | | 135,133 | |
KGHM Polska Miedz SA(b) | | | 7,250 | | | | 182,881 | |
LPP SA | | | 55 | | | | 127,863 | |
mBank SA(b) | | | 573 | | | | 58,812 | |
Orange Polska SA(b) | | | 32,359 | | | | 60,702 | |
PGE Polska Grupa Energetyczna SA(b) | | | 30,296 | | | | 63,484 | |
Polski Koncern Naftowy ORLEN SA | | | 16,199 | | | | 366,414 | |
Polskie Gornictwo Naftowe i Gazownictwo SA | | | 93,796 | | | | 106,983 | |
Powszechna Kasa Oszczednosci Bank Polski SA | | | 49,247 | | | | 447,096 | |
Powszechny Zaklad Ubezpieczen SA | | | 26,379 | | | | 278,600 | |
Santander Bank Polska SA | | | 1,611 | | | | 130,531 | |
| | | | | | | | |
| | | | 2,595,699 | |
|
| Portugal — 0.1% | |
EDP — Energias de Portugal SA | | | 122,176 | | | | 530,169 | |
Galp Energia SGPS SA | | | 24,757 | | | | 415,622 | |
Jeronimo Martins SGPS SA | | | 10,434 | | | | 171,945 | |
| | | | | | | | |
| | | | 1,117,736 | |
|
| Qatar — 0.2% | |
Barwa Real Estate Co. | | | 25,480 | | | | 24,619 | |
Commercial Bank of Qatar QSC | | | 100,850 | | | | 129,626 | |
Industries Qatar QSC | | | 97,136 | | | | 272,651 | |
Masraf Al Rayan QSC | | | 154,440 | | | | 166,989 | |
Mesaieed Petrochemical Holding Co. | | | 245,102 | | | | 167,979 | |
Ooredoo QPSC | | | 14,717 | | | | 28,438 | |
Qatar Electricity & Water Co. QSC | | | 37,230 | | | | 163,562 | |
Qatar Fuel QSC | | | 10,248 | | | | 64,078 | |
Qatar Insurance Co. SAQ | | | 130,270 | | | | 112,400 | |
Qatar International Islamic Bank QSC | | | 39,371 | | | | 104,061 | |
Qatar Islamic Bank SAQ | | | 52,150 | | | | 218,288 | |
Qatar National Bank QPSC | | | 209,500 | | | | 1,178,501 | |
| | | | | | | | |
| | | | 2,631,192 | |
|
| Romania — 0.0% | |
NEPI Rockcastle PLC | | | 21,499 | | | | 190,090 | |
| | | | | | | | |
|
| Russia — 1.1% | |
Alrosa PJSC | | | 167,262 | | | | 227,233 | |
Evraz PLC | | | 27,295 | | | | 146,160 | |
Gazprom PJSC | | | 441,970 | | | | 1,826,079 | |
Gazprom PJSC — ADR | | | 34,210 | | | | 282,353 | |
Inter RAO UES PJSC | | | 1,289,334 | | | | 104,867 | |
LUKOIL PJSC | | | 18,591 | | | | 1,845,175 | |
Magnit PJSC — GDR | | | 14,687 | | | | 177,052 | |
Magnitogorsk Iron & Steel Works PJSC | | | 206,260 | | | | 139,493 | |
MMC Norilsk Nickel PJSC | | | 3,083 | | | | 948,478 | |
Mobile TeleSystems PJSC — ADR | | | 25,223 | | | | 256,013 | |
Moscow ExchangeMICEX-RTS PJSC | | | 63,850 | | | | 110,847 | |
Novatek PJSC — GDR | | | 4,712 | | | | 956,536 | |
Novolipetsk Steel PJSC | | | 57,306 | | | | 132,813 | |
Polymetal International PLC | | | 7,461 | | | | 116,643 | |
Polyus PJSC | | | 811 | | | | 92,819 | |
Rosneft Oil Co. PJSC | | | 21,260 | | | | 154,201 | |
Rosneft Oil Co. PJSC, — GDR | | | 29,564 | | | | 214,632 | |
Sberbank of Russia PJSC | | | 398,027 | | | | 1,634,753 | |
Sberbank of Russia PJSC — ADR | | | 28,426 | | | | 468,303 | |
Severstal PJSC | | | 10,830 | | | | 163,789 | |
Surgutneftegas OJSC — ADR | | | 9,276 | | | | 75,090 | |
Surgutneftegas PJSC | | | 321,026 | | | | 261,152 | |
| | |
| 30 | | 2019 BLACKROCK ANNUAL REPORTTO SHAREHOLDERS |
| | |
Schedule of Investments (continued) December 31, 2019 | | Total International ex U.S. Index Master Portfolio (Percentages shown are based on Net Assets) |
| | | | | | | | |
| Security | | Shares | | | Value | |
|
| Russia (continued) | |
Tatneft PJSC | | | 75,164 | | | $ | 920,793 | |
VTB Bank PJSC | | | 86,510,000 | | | | 64,045 | |
VTB Bank PJSC, — GDR | | | 50,000 | | | | 73,211 | |
X5 Retail Group NV, — GDR | | | 4,498 | | | | 154,598 | |
| | | | | | | | |
| | | | 11,547,128 | |
|
| Saudi Arabia — 0.7% | |
Advanced Petrochemical Co. | | | 6,265 | | | | 82,613 | |
Al Rajhi Bank | | | 61,370 | | | | 1,070,182 | |
Alinma Bank | | | 38,749 | | | | 261,843 | |
Almarai Co. JSC | | | 14,060 | | | | 185,705 | |
Arab National Bank | | | 20,595 | | | | 150,429 | |
BankAl-Jazira | | | 25,089 | | | | 100,679 | |
Bank AlBilad | | | 11,600 | | | | 83,150 | |
Banque Saudi Fransi | | | 25,272 | | | | 255,339 | |
Co. for Cooperative Insurance(b) | | | 5,330 | | | | 109,045 | |
Dar Al Arkan Real Estate Development Co.(b) | | | 26,789 | | | | 78,614 | |
Etihad Etisalat Co.(b) | | | 14,520 | | | | 96,749 | |
Jarir Marketing Co. | | | 2,022 | | | | 89,266 | |
National Commercial Bank | | | 54,870 | | | | 720,347 | |
National Industrialization Co.(b) | | | 33,697 | | | | 122,925 | |
Rabigh Refining & Petrochemical Co.(b) | | | 18,941 | | | | 109,404 | |
Riyad Bank | | | 55,131 | | | | 352,853 | |
Sahara International Petrochemical Co. | | | 14,239 | | | | 68,172 | |
Samba Financial Group | | | 46,040 | | | | 398,326 | |
Saudi Arabian Fertilizer Co. | | | 8,326 | | | | 172,031 | |
Saudi Arabian Mining Co.(b) | | | 20,212 | | | | 239,305 | |
Saudi Arabian Oil Co.(b)(d) | | | 47,432 | | | | 445,706 | |
Saudi Basic Industries Corp. | | | 37,584 | | | | 941,522 | |
Saudi British Bank | | | 31,658 | | | | 292,747 | |
Saudi Cement Co. | | | 5,582 | | | | 104,310 | |
Saudi Electricity Co. | | | 40,008 | | | | 215,648 | |
Saudi Industrial Investment Group | | | 15,022 | | | | 96,141 | |
Saudi Kayan Petrochemical Co.(b) | | | 43,107 | | | | 127,686 | |
Saudi Telecom Co. | | | 18,560 | | | | 503,614 | |
Savola Group(b) | | | 12,960 | | | | 118,672 | |
Yanbu National Petrochemical Co. | | | 12,736 | | | | 190,073 | |
| | | | | | | | |
| | | | 7,783,096 | |
|
| Singapore — 0.8% | |
Ascendas Real Estate Investment Trust | | | 158,198 | | | | 349,515 | |
BOC Aviation Ltd.(d) | | | 12,300 | | | | 125,094 | |
CapitaLand Commercial Trust | | | 124,412 | | | | 184,254 | |
CapitaLand Ltd. | | | 111,900 | | | | 312,259 | |
CapitaLand Mall Trust | | | 134,200 | | | | 245,662 | |
City Developments Ltd. | | | 17,400 | | | | 141,616 | |
ComfortDelGro Corp. Ltd. | | | 98,300 | | | | 173,933 | |
DBS Group Holdings Ltd. | | | 86,084 | | | | 1,659,806 | |
Genting Singapore Ltd. | | | 233,000 | | | | 159,556 | |
Jardine Cycle & Carriage Ltd. | | | 4,444 | | | | 99,380 | |
Keppel Corp. Ltd.(a) | | | 63,000 | | | | 317,430 | |
Mapletree Commercial Trust | | | 114,900 | | | | 204,321 | |
Oversea-Chinese Banking Corp. Ltd. | | | 153,049 | | | | 1,252,026 | |
SATS Ltd. | | | 24,800 | | | | 93,350 | |
Sembcorp Industries Ltd.(a) | | | 40,000 | | | | 68,120 | |
Singapore Airlines Ltd.(a) | | | 28,600 | | | | 192,286 | |
Singapore Exchange Ltd. | | | 42,100 | | | | 277,276 | |
Singapore Press Holdings Ltd. | | | 37,200 | | | | 60,260 | |
Singapore Technologies Engineering Ltd. | | | 103,700 | | | | 303,700 | |
Singapore Telecommunications Ltd. | | | 382,400 | | | | 958,722 | |
Suntec Real Estate Investment Trust | | | 137,100 | | | | 187,682 | |
United Overseas Bank Ltd. | | | 56,100 | | | | 1,103,297 | |
UOL Group Ltd. | | | 22,000 | | | | 136,158 | |
Venture Corp. Ltd. | | | 11,200 | | | | 135,114 | |
Wilmar International Ltd. | | | 97,900 | | | | 299,936 | |
| | | | | | | | |
| | | | 9,040,753 | |
| | | | | | | | |
| Security | | Shares | | | Value | |
|
| South Africa — 1.4% | |
Absa Group, Ltd. | | | 38,037 | | | $ | 405,464 | |
Anglo American Platinum Ltd. | | | 2,774 | | | | 258,927 | |
Anglo American PLC | | | 52,049 | | | | 1,495,259 | |
AngloGold Ashanti Ltd. | | | 19,921 | | | | 452,522 | |
Aspen Pharmacare Holdings Ltd.(b) | | | 18,439 | | | | 157,253 | |
Bid Corp. Ltd. | | | 14,178 | | | | 334,339 | |
Bidvest Group Ltd. | | | 15,555 | | | | 227,417 | |
Capitec Bank Holdings Ltd. | | | 2,289 | | | | 236,349 | |
Clicks Group Ltd. | | | 10,206 | | | | 186,974 | |
Discovery Ltd. | | | 20,716 | | | | 178,421 | |
Exxaro Resources Ltd. | | | 14,243 | | | | 133,359 | |
FirstRand Ltd. | | | 153,955 | | | | 690,793 | |
Fortress REIT Ltd., Class A | | | 67,528 | | | | 92,859 | |
Foschini Group Ltd. | | | 6,728 | | | | 71,865 | |
Gold Fields Ltd. | | | 38,623 | | | | 263,627 | |
Growthpoint Properties Ltd. | | | 122,689 | | | | 193,678 | |
Impala Platinum Holdings Ltd.(b) | | | 38,734 | | | | 395,758 | |
Investec Ltd. | | | 7,549 | | | | 44,760 | |
Kumba Iron Ore Ltd. | | | 2,943 | | | | 87,561 | |
Liberty Holdings Ltd. | | | 1,922 | | | | 15,184 | |
Life Healthcare Group Holdings Ltd. | | | 84,544 | | | | 148,794 | |
Momentum Metropolitan Holdings | | | 20,454 | | | | 31,895 | |
Mr Price Group Ltd. | | | 10,819 | | | | 141,248 | |
MTN Group Ltd. | | | 83,776 | | | | 493,872 | |
MultiChoice Group Ltd.(b) | | | 18,030 | | | | 150,213 | |
Naspers Ltd., Class N | | | 21,024 | | | | 3,440,512 | |
Nedbank Group Ltd. | | | 20,449 | | | | 313,110 | |
Northam Platinum Ltd.(b) | | | 18,042 | | | | 159,243 | |
Old Mutual Ltd. | | | 220,791 | | | | 309,921 | |
Pepkor Holdings Ltd.(a)(d) | | | 88,345 | | | | 113,979 | |
Pick n Pay Stores Ltd. | | | 28,036 | | | | 127,889 | |
PSG Group Ltd. | | | 9,135 | | | | 152,724 | |
Rand Merchant Investment Holdings Ltd. | | | 48,390 | | | | 106,551 | |
Redefine Properties Ltd. | | | 238,334 | | | | 128,645 | |
Remgro Ltd. | | | 22,131 | | | | 308,601 | |
RMB Holdings Ltd. | | | 46,133 | | | | 265,344 | |
Sanlam Ltd. | | | 86,962 | | | | 491,325 | |
Sasol Ltd.(b) | | | 29,383 | | | | 637,483 | |
Shoprite Holdings Ltd. | | | 21,012 | | | | 188,983 | |
Sibanye Gold Ltd.(b) | | | 109,857 | | | | 280,701 | |
Spar Group Ltd.(a) | | | 4,305 | | | | 60,817 | |
Standard Bank Group Ltd. | | | 58,001 | | | | 697,634 | |
Telkom SA SOC Ltd. | | | 11,210 | | | | 27,908 | |
Tiger Brands Ltd. | | | 7,701 | | | | 115,920 | |
Vodacom Group Ltd. | | | 34,594 | | | | 284,784 | |
Woolworths Holdings Ltd. | | | 65,875 | | | | 228,913 | |
| | | | | | | | |
| | | | 15,329,378 | |
|
| South Korea — 3.0% | |
Amorepacific Corp. | | | 1,381 | | | | 237,832 | |
Amorepacific Group | | | 739 | | | | 52,794 | |
BGF retail Co. Ltd. | | | 426 | | | | 62,439 | |
BNK Financial Group, Inc. | | | 6,269 | | | | 41,437 | |
Celltrion Healthcare Co. Ltd.(b) | | | 3,330 | | | | 151,720 | |
Celltrion, Inc.(b) | | | 4,813 | | | | 750,282 | |
Cheil Worldwide, Inc. | | | 4,081 | | | | 84,870 | |
CJ CheilJedang Corp. | | | 487 | | | | 106,189 | |
CJ Corp. | | | 848 | | | | 70,708 | |
CJ ENM Co. Ltd. | | | 390 | | | | 53,766 | |
CJ Logistics Corp.(b) | | | 414 | | | | 55,403 | |
Daelim Industrial Co. Ltd. | | | 1,073 | | | | 83,940 | |
Daewoo Engineering & Construction Co. Ltd.(b) | | | 19,237 | | | | 78,796 | |
Daewoo Shipbuilding & Marine Engineering Co. Ltd.(b) | | | 3,397 | | | | 81,517 | |
DB Insurance Co. Ltd. | | | 1,949 | | | | 88,039 | |
Doosan Bobcat, Inc.(b) | | | 2,907 | | | | 86,328 | |
| | | | |
| SCHEDULE OF INVESTMENTS | | | 31 | |
| | |
Schedule of Investments (continued) December 31, 2019 | | Total International ex U.S. Index Master Portfolio (Percentages shown are based on Net Assets) |
| | | | | | | | |
| Security | | Shares | | | Value | |
|
| South Korea (continued) | |
E-MART Inc. | | | 545 | | | $ | 59,961 | |
Fila Korea Ltd. | | | 2,176 | | | | 99,430 | |
GS Engineering & Construction Corp. | | | 4,772 | | | | 127,708 | |
GS Holdings Corp. | | | 2,934 | | | | 130,897 | |
GS Retail Co. Ltd. | | | 2,671 | | | | 90,665 | |
Hana Financial Group, Inc. | | | 13,571 | | | | 431,666 | |
Hankook Tire & Technology Co. Ltd. | | | 4,552 | | | | 131,822 | |
Hanmi Pharm Co. Ltd. | | | 234 | | | | 59,813 | |
Hanon Systems | | | 14,702 | | | | 141,525 | |
Hanwha Chemical Corp. | | | 4,037 | | | | 65,629 | |
Hanwha Corp. | | | 1,508 | | | | 32,523 | |
Hanwha Life Insurance Co. Ltd. | | | 7,120 | | | | 14,192 | |
HDC Hyundai DevelopmentCo-Engineering & Construction, Class E(b) | | | 1,311 | | | | 28,988 | |
Helixmith Co. Ltd.(b) | | | 780 | | | | 62,144 | |
HLB, Inc.(b) | | | 1,313 | | | | 130,534 | |
Hotel Shilla Co. Ltd. | | | 1,174 | | | | 91,760 | |
Hyundai Department Store Co. Ltd. | | | 314 | | | | 22,517 | |
Hyundai Engineering & Construction Co. Ltd. | | | 3,298 | | | | 120,309 | |
Hyundai Glovis Co. Ltd. | | | 1,004 | | | | 123,879 | |
Hyundai Heavy Industries Holdings Co. Ltd.(b) | | | 422 | | | | 123,160 | |
Hyundai Marine & Fire Insurance Co. Ltd. | | | 4,560 | | | | 106,133 | |
Hyundai Mobis Co. Ltd. | | | 3,088 | | | | 683,191 | |
Hyundai Motor Co. | | | 7,139 | | | | 743,576 | |
Hyundai Steel Co. | | | 3,455 | | | | 93,672 | |
Industrial Bank of Korea | | | 10,461 | | | | 106,632 | |
Kakao Corp. | | | 2,067 | | | | 273,763 | |
Kangwon Land, Inc. | | | 3,796 | | | | 97,109 | |
KB Financial Group, Inc. | | | 19,323 | | | | 796,068 | |
KCC Corp. | | | 266 | | | | 51,783 | |
Kia Motors Corp. | | | 13,557 | | | | 517,749 | |
KMW Co. Ltd.(b) | | | 2,491 | | | | 109,951 | |
Korea Aerospace Industries Ltd. | | | 2,844 | | | | 83,704 | |
Korea Electric Power Corp. | | | 10,419 | | | | 249,979 | |
Korea Gas Corp. | | | 753 | | | | 24,605 | |
Korea Investment Holdings Co. Ltd. | | | 1,486 | | | | 92,803 | |
Korea Shipbuilding & Offshore Engineering Co. Ltd.(b) | | | 1,655 | | | | 180,088 | |
Korea Zinc Co. Ltd. | | | 398 | | | | 146,255 | |
Korean Air Lines Co. Ltd. | | | 4,193 | | | | 103,090 | |
KT&G Corp. | | | 6,257 | | | | 506,238 | |
Kumho Petrochemical Co. Ltd. | | | 423 | | | | 28,289 | |
LG Chem Ltd. | | | 2,257 | | | | 618,541 | |
LG Corp. | | | 4,097 | | | | 261,050 | |
LG Display Co. Ltd. | | | 10,040 | | | | 140,461 | |
LG Electronics, Inc. | | | 4,945 | | | | 307,169 | |
LG Household & Health Care Ltd. | | | 441 | | | | 479,037 | |
LG Innotek Co. Ltd. | | | 809 | | | | 97,509 | |
LG Uplus Corp. | | | 5,800 | | | | 71,139 | |
Lotte Chemical Corp. | | | 865 | | | | 167,121 | |
Lotte Corp. | | | 2,177 | | | | 73,172 | |
Lotte Shopping Co. Ltd. | | | 260 | | | | 30,418 | |
Medy-Tox, Inc. | | | 347 | | | | 90,240 | |
Meritz Securities Co. Ltd. | | | 25,240 | | | | 82,508 | |
Mirae Asset Daewoo Co. Ltd. | | | 9,107 | | | | 59,252 | |
NAVER Corp. | | | 6,346 | | | | 1,021,039 | |
NCSoft Corp. | | | 791 | | | | 369,085 | |
Netmarble Corp.(b)(d) | | | 1,516 | | | | 120,882 | |
NH Investment & Securities Co. Ltd. | | | 5,312 | | | | 58,109 | |
OCI Co. Ltd. | | | 1,017 | | | | 54,954 | |
Orange Life Insurance Ltd.(d) | | | 2,814 | | | | 68,668 | |
Orion Corp. | | | 907 | | | | 82,719 | |
Pan Ocean Co. Ltd.(b) | | | 23,834 | | | | 93,391 | |
Pearl Abyss Corp.(b) | | | 511 | | | | 81,866 | |
POSCO | | | 3,587 | | | | 729,107 | |
| | | | | | | | |
| Security | | Shares | | | Value | |
|
| South Korea (continued) | |
POSCO Chemtech Co. Ltd. | | | 1,891 | | | $ | 80,355 | |
Posco International Corp. | | | 1,160 | | | | 18,661 | |
S-1 Corp. | | | 442 | | | | 35,813 | |
S-Oil Corp. | | | 2,657 | | | | 218,224 | |
Samsung Biologics Co. Ltd.(b)(d) | | | 698 | | | | 260,479 | |
Samsung C&T Corp. | | | 4,015 | | | | 375,907 | |
Samsung Card Co. Ltd. | | | 1,210 | | | | 40,387 | |
Samsung Electro-Mechanics Co. Ltd. | | | 3,162 | | | | 340,108 | |
Samsung Electronics Co. Ltd. | | | 228,742 | | | | 11,022,355 | |
Samsung Engineering Co. Ltd.(b) | | | 6,952 | | | | 114,890 | |
Samsung Fire & Marine Insurance Co. Ltd. | | | 1,332 | | | | 280,034 | |
Samsung Heavy Industries Co. Ltd.(b) | | | 24,292 | | | | 152,120 | |
Samsung Life Insurance Co. Ltd. | | | 3,145 | | | | 202,191 | |
Samsung SDI Co. Ltd. | | | 2,894 | | | | 589,546 | |
Samsung SDS Co. Ltd. | | | 1,413 | | | | 237,137 | |
Samsung Securities Co. Ltd. | | | 2,723 | | | | 90,690 | |
Shinhan Financial Group Co. Ltd. | | | 22,963 | | | | 860,947 | |
Shinsegae Inc. | | | 335 | | | | 83,512 | |
SK Holdings Co. Ltd. | | | 2,034 | | | | 458,867 | |
SK Hynix, Inc. | | | 26,446 | | | | 2,151,058 | |
SK Innovation Co. Ltd. | | | 2,988 | | | | 386,699 | |
SK Telecom Co. Ltd. | | | 831 | | | | 171,226 | |
Woongjin Coway Co. Ltd. | | | 2,504 | | | | 201,585 | |
Woori Financial Group, Inc. | | | 13,531 | | | | 135,473 | |
Yuhan Corp. | | | 370 | | | | 75,508 | |
| | | | | | | | |
| | | | 32,911,069 | |
|
| Spain — 1.8% | |
ACS Actividades de Construccion y Servicios SA | | | 12,585 | | | | 504,836 | |
Aena SME SA(d) | | | 3,059 | | | | 586,465 | |
Amadeus IT Group SA | | | 21,424 | | | | 1,754,556 | |
AmRest Holdings SE(b) | | | 9,392 | | | | 107,192 | |
Banco Bilbao Vizcaya Argentaria SA | | | 308,392 | | | | 1,731,413 | |
Banco de Sabadell SA | | | 320,185 | | | | 374,907 | |
Banco Santander SA | | | 785,801 | | | | 3,294,244 | |
Bankia SA | | | 45,598 | | | | 97,632 | |
Bankinter SA | | | 28,922 | | | | 212,438 | |
CaixaBank SA | | | 176,221 | | | | 554,930 | |
Cellnex Telecom SA(d) | | | 11,485 | | | | 495,412 | |
Enagas SA | | | 6,964 | | | | 177,634 | |
Endesa SA | | | 16,138 | | | | 430,961 | |
Ferrovial SA | | | 25,032 | | | | 758,398 | |
Grifols SA | | | 14,947 | | | | 528,099 | |
Iberdrola SA | | | 287,241 | | | | 2,960,181 | |
Industria de Diseno Textil SA | | | 52,193 | | | | 1,844,527 | |
Mapfre SA | | | 66,978 | | | | 177,595 | |
Naturgy Energy Group SA | | | 14,485 | | | | 364,747 | |
Red Electrica Corp. SA | | | 20,753 | | | | 418,168 | |
Repsol SA | | | 67,863 | | | | 1,066,138 | |
Siemens Gamesa Renewable Energy SA | | | 10,554 | | | | 185,863 | |
Telefonica SA | | | 225,025 | | | | 1,573,623 | |
| | | | | | | | |
| | | | 20,199,959 | |
|
| Sweden — 1.6% | |
Alfa Laval AB | | | 15,879 | | | | 399,901 | |
Assa Abloy AB, Class B | | | 48,658 | | | | 1,137,403 | |
Atlas Copco AB, A Shares | | | 31,846 | | | | 1,271,154 | |
Atlas Copco AB, Class B | | | 18,943 | | | | 657,721 | |
Boliden AB | | | 15,022 | | | | 398,964 | |
Electrolux AB, Class B | | | 12,152 | | | | 298,737 | |
Epiroc AB, Class A | | | 32,873 | | | | 402,012 | |
Epiroc AB, Class B | | | 15,828 | | | | 188,111 | |
Essity AB, Class B | | | 30,180 | | | | 971,984 | |
Hennes & Mauritz AB, Class B | | | 40,736 | | | | 830,914 | |
Hexagon AB, Class B | | | 13,062 | | | | 732,142 | |
| | |
| 32 | | 2019 BLACKROCK ANNUAL REPORTTO SHAREHOLDERS |
| | |
Schedule of Investments (continued) December 31, 2019 | | Total International ex U.S. Index Master Portfolio (Percentages shown are based on Net Assets) |
| | | | | | | | |
| Security | | Shares | | | Value | |
|
| Sweden (continued) | |
Husqvarna AB, Class B | | | 14,305 | | | $ | 114,636 | |
ICA Gruppen AB | | | 4,800 | | | | 224,217 | |
Industrivarden AB, Class C | | | 8,883 | | | | 214,218 | |
Investor AB, Class B | | | 21,024 | | | | 1,147,780 | |
Kinnevik AB | | | 10,274 | | | | 251,765 | |
L E Lundbergforetagen AB, B Shares | | | 3,263 | | | | 143,241 | |
Lundin Petroleum AB | | | 9,142 | | | | 310,411 | |
Sandvik AB | | | 55,123 | | | | 1,073,650 | |
Securitas AB, Class B | | | 13,331 | | | | 229,683 | |
Skandinaviska Enskilda Banken AB, Class A | | | 81,350 | | | | 765,005 | |
Skanska AB, Class B | | | 16,387 | | | | 370,700 | |
SKF AB, Class B | | | 17,305 | | | | 350,363 | |
Svenska Handelsbanken AB, Class A | | | 73,175 | | | | 788,113 | |
Swedbank AB, Class A | | | 41,522 | | | | 617,265 | |
Swedish Match AB | | | 8,807 | | | | 453,708 | |
Tele2 AB, Class B | | | 26,650 | | | | 386,799 | |
Telefonaktiebolaget LM Ericsson, Class B | | | 142,056 | | | | 1,241,258 | |
Telia Co. AB | | | 121,784 | | | | 523,248 | |
Volvo AB, Class B | | | 65,184 | | | | 1,091,258 | |
| | | | | | | | |
| | | | 17,586,361 | |
|
| Switzerland — 6.3% | |
ABB Ltd., Registered Shares | | | 89,871 | | | | 2,167,970 | |
Adecco Group AG, Registered Shares | | | 7,309 | | | | 462,091 | |
Alcon, Inc.(b) | | | 20,166 | | | | 1,142,235 | |
Baloise Holding AG, Registered Shares | | | 2,613 | | | | 472,915 | |
Barry Callebaut AG, Registered Shares | | | 140 | | | | 309,048 | |
Chocoladefabriken Lindt & Spruengli AG | | | 47 | | | | 364,957 | |
Chocoladefabriken Lindt & Spruengli AG, Registered Shares | | | 6 | | | | 530,068 | |
Cie Financiere Richemont SA, Registered Shares | | | 25,390 | | | | 1,984,251 | |
Clariant AG, Registered Shares(b) | | | 8,166 | | | | 182,497 | |
Coca-Cola HBC AG(b) | | | 8,806 | | | | 299,316 | |
Credit Suisse Group AG, Registered Shares(b) | | | 125,552 | | | | 1,697,171 | |
Dufry AG, Registered Shares(b) | | | 1,558 | | | | 154,493 | |
EMS-Chemie Holding AG, Registered Shares | | | 450 | | | | 295,846 | |
Geberit AG, Registered Shares | | | 1,722 | | | | 966,527 | |
Givaudan SA, Registered Shares | | | 438 | | | | 1,372,252 | |
Glencore PLC(b) | | | 536,352 | | | | 1,670,048 | |
Julius Baer Group Ltd.(b) | | | 11,200 | | | | 577,393 | |
Kuehne + Nagel International AG, Registered Shares | | | 2,676 | | | | 451,352 | |
LafargeHolcim Ltd., Registered Shares(b) | | | 24,216 | | | | 1,343,442 | |
Lonza Group AG, Registered Shares(b) | | | 3,652 | | | | 1,332,276 | |
Nestle SA, Registered Shares | | | 140,804 | | | | 15,244,173 | |
Novartis AG, Registered Shares | | | 101,755 | | | | 9,635,137 | |
Pargesa Holding SA, Bearer Shares | | | 1,995 | | | | 165,747 | |
Partners Group Holding AG | | | 838 | | | | 768,050 | |
Roche Holding AG | | | 33,297 | | | | 10,821,613 | |
Schindler Holding AG, Participation Certificates | | | 2,234 | | | | 568,109 | |
Schindler Holding AG, Registered Shares | | | 757 | | | | 185,383 | |
SGS SA, Registered Shares | | | 229 | | | | 627,156 | |
Sika AG, Registered Shares | | | 6,216 | | | | 1,167,336 | |
Sonova Holding AG, Registered Shares | | | 2,722 | | | | 622,272 | |
STMicroelectronics NV | | | 35,181 | | | | 949,205 | |
Straumann Holding AG, Registered Shares | | | 478 | | | | 468,886 | |
Swatch Group AG, Bearer Shares | | | 1,402 | | | | 391,446 | |
Swatch Group AG, Registered Shares | | | 1,924 | | | | 101,779 | |
Swiss Life Holding AG, Registered Shares | | | 1,632 | | | | 818,726 | |
Swiss Prime Site AG, Registered Shares(b) | | | 3,413 | | | | 394,864 | |
Swiss Re AG | | | 13,984 | | | | 1,570,996 | |
Swisscom AG, Registered Shares | | | 1,157 | | | | 612,488 | |
Temenos AG, Registered Shares(b) | | | 3,464 | | | | 547,967 | |
UBS Group AG, Registered Shares(b) | | | 188,783 | | | | 2,382,326 | |
Vifor Pharma AG | | | 2,169 | | | | 395,854 | |
Zurich Insurance Group AG | | | 7,251 | | | | 2,974,354 | |
| | | | | | | | |
| | | | 69,190,015 | |
| | | | | | | | |
| Security | | Shares | | | Value | |
|
| Taiwan — 3.2% | |
Accton Technology Corp. | | | 27,000 | | | $ | 151,565 | |
Acer, Inc. | | | 69,504 | | | | 41,426 | |
Advantech Co. Ltd. | | | 11,873 | | | | 119,724 | |
Airtac International Group | | | 8,000 | | | | 125,048 | |
ASE Technology Holding Co. Ltd. | | | 186,343 | | | | 519,357 | |
Asia Cement Corp. | | | 94,233 | | | | 150,838 | |
Asustek Computer, Inc. | | | 38,220 | | | | 294,976 | |
AU Optronics Corp. | | | 414,000 | | | | 138,645 | |
Catcher Technology Co. Ltd. | | | 27,000 | | | | 204,509 | |
Cathay Financial Holding Co. Ltd. | | | 347,488 | | | | 493,388 | |
Chailease Holding Co. Ltd. | | | 67,423 | | | | 310,809 | |
Chang Hwa Commercial Bank Ltd. | | | 234,686 | | | | 177,840 | |
Cheng Shin Rubber Industry Co. Ltd. | | | 66,436 | | | | 92,671 | |
Chicony Electronics Co. Ltd. | | | 15,856 | | | | 47,119 | |
China Airlines Ltd. | | | 103,687 | | | | 31,339 | |
China Development Financial Holding Corp. | | | 577,765 | | | | 187,662 | |
China Life Insurance Co. Ltd.(b) | | | 132,016 | | | | 112,709 | |
China Steel Corp. | | | 580,638 | | | | 463,281 | |
Chunghwa Telecom Co. Ltd. | | | 185,000 | | | | 678,656 | |
Compal Electronics, Inc. | | | 192,000 | | | | 120,933 | |
CTBC Financial Holding Co. Ltd. | | | 820,601 | | | | 613,926 | |
Delta Electronics, Inc. | | | 86,000 | | | | 435,192 | |
E.Sun Financial Holding Co. Ltd. | | | 443,315 | | | | 413,132 | |
Eclat Textile Co. Ltd. | | | 7,303 | | | | 98,309 | |
Eva Airways Corp. | | | 83,492 | | | | 38,294 | |
Evergreen Marine Corp. Taiwan Ltd.(b) | | | 109,139 | | | | 45,225 | |
Far Eastern New Century Corp. | | | 200,607 | | | | 199,797 | |
Far EasTone Telecommunications Co. Ltd. | | | 95,000 | | | | 228,489 | |
Feng TAY Enterprise Co. Ltd. | | | 17,765 | | | | 115,624 | |
First Financial Holding Co. Ltd. | | | 484,461 | | | | 383,344 | |
Formosa Chemicals & Fibre Corp. | | | 161,360 | | | | 471,428 | |
Formosa Petrochemical Corp. | | | 50,000 | | | | 162,623 | |
Formosa Plastics Corp. | | | 225,040 | | | | 749,473 | |
Formosa Taffeta Co. Ltd. | | | 31,000 | | | | 35,364 | |
Foxconn Technology Co. Ltd. | | | 43,007 | | | | 95,081 | |
Fubon Financial Holding Co. Ltd. | | | 278,952 | | | | 431,994 | |
Giant Manufacturing Co. Ltd. | | | 10,000 | | | | 71,187 | |
Globalwafers Co. Ltd. | | | 8,000 | | | | 102,451 | |
Highwealth Construction Corp. | | | 62,400 | | | | 96,437 | |
Hiwin Technologies Corp. | | | 12,396 | | | | 116,311 | |
Hon Hai Precision Industry Co. Ltd. | | | 604,800 | | | | 1,834,669 | |
Hotai Motor Co. Ltd. | | | 13,000 | | | | 296,234 | |
Hua Nan Financial Holdings Co. Ltd. | | | 436,123 | | | | 320,331 | |
Innolux Corp. | | | 428,494 | | | | 119,318 | |
Inventec Corp. | | | 92,470 | | | | 70,571 | |
Largan Precision Co. Ltd. | | | 5,000 | | | | 835,191 | |
Lite-On Technology Corp. | | | 99,816 | | | | 164,342 | |
MediaTek, Inc. | | | 77,255 | | | | 1,144,693 | |
Mega Financial Holding Co. Ltd. | | | 505,110 | | | | 515,778 | |
Micro-Star International Co. Ltd. | | | 37,000 | | | | 106,980 | |
Nan Ya Plastics Corp. | | | 262,790 | | | | 638,619 | |
Nanya Technology Corp. | | | 50,000 | | | | 139,929 | |
Nien Made Enterprise Co. Ltd. | | | 9,000 | | | | 83,254 | |
Novatek Microelectronics Corp. | | | 23,000 | | | | 168,521 | |
Pegatron Corp. | | | 110,000 | | | | 251,560 | |
Phison Electronics Corp. | | | 4,000 | | | | 45,500 | |
Pou Chen Corp. | | | 92,000 | | | | 120,344 | |
Powertech Technology, Inc. | | | 31,100 | | | | 103,507 | |
President Chain Store Corp. | | | 26,000 | | | | 264,021 | |
Quanta Computer, Inc. | | | 138,000 | | | | 296,440 | |
Realtek Semiconductor Corp. | | | 23,240 | | | | 182,625 | |
Ruentex Development Co. Ltd.(b) | | | 34,384 | | | | 51,890 | |
Ruentex Industries Ltd.(b) | | | 10,512 | | | | 25,805 | |
Shanghai Commercial & Savings Bank Ltd. | | | 166,512 | | | | 289,414 | |
| | | | |
| SCHEDULE OF INVESTMENTS | | | 33 | |
| | |
Schedule of Investments (continued) December 31, 2019 | | Total International ex U.S. Index Master Portfolio (Percentages shown are based on Net Assets) |
| | | | | | | | |
| Security | | Shares | | | Value | |
|
| Taiwan (continued) | |
Shin Kong Financial Holding Co. Ltd.(b) | | | 620,244 | | | $ | 214,354 | |
SinoPac Financial Holdings Co. Ltd. | | | 547,741 | | | | 237,620 | |
Standard Foods Corp. | | | 7,342 | | | | 17,061 | |
Synnex Technology International Corp. | | | 58,500 | | | | 73,209 | |
Taishin Financial Holding Co. Ltd. | | | 356,976 | | | | 172,773 | |
Taiwan Business Bank | | | 285,886 | | | | 120,260 | |
Taiwan Cement Corp. | | | 243,859 | | | | 355,707 | |
Taiwan Cooperative Financial Holding Co. Ltd. | | | 447,056 | | | | 309,426 | |
Taiwan High Speed Rail Corp. | | | 142,000 | | | | 182,058 | |
Taiwan Mobile Co. Ltd. | | | 67,800 | | | | 253,314 | |
Taiwan Semiconductor Manufacturing Co. Ltd. | | | 1,180,000 | | | | 13,060,033 | |
Tatung Co. Ltd.(b) | | | 45,000 | | | | 31,609 | |
Uni-President Enterprises Corp. | | | 249,950 | | | | 619,833 | |
United Microelectronics Corp. | | | 527,000 | | | | 288,769 | |
Vanguard International Semiconductor Corp. | | | 38,000 | | | | 100,524 | |
Walsin Technology Corp. | | | 13,000 | | | | 103,768 | |
Win Semiconductors Corp. | | | 16,000 | | | | 157,656 | |
Winbond Electronics Corp. | | | 163,000 | | | | 106,524 | |
Wistron Corp. | | | 133,161 | | | | 126,067 | |
Wiwynn Corp. | | | 6,000 | | | | 126,848 | |
WPG Holdings Ltd. | | | 78,448 | | | | 102,360 | |
Yageo Corp. | | | 10,783 | | | | 157,097 | |
Yuanta Financial Holding Co. Ltd. | | | 432,260 | | | | 291,407 | |
Zhen Ding Technology Holding Ltd. | | | 37,710 | | | | 180,935 | |
| | | | | | | | |
| | | | 34,824,924 | |
|
| Thailand — 0.7% | |
Advanced Info Service PCL — NVDR | | | 62,600 | | | | 444,512 | |
Airports of Thailand PCL — NVDR | | | 214,700 | | | | 531,463 | |
B Grimm Power PCL | | | 64,900 | | | | 113,540 | |
Bangkok Bank PCL, Foreign Registered Shares | | | 25,100 | | | | 133,558 | |
Bangkok Dusit Medical Services PCL, NVDR | | | 432,400 | | | | 374,764 | |
Banpu PCL — NVDR | | | 227,900 | | | | 90,402 | |
BTS Group Holdings PCL — NVDR | | | 513,400 | | | | 225,988 | |
Bumrungrad Hospital PCL — NVDR | | | 22,400 | | | | 109,810 | |
Central Pattana PCL — NVDR | | | 102,400 | | | | 212,234 | |
Charoen Pokphand Foods PCL — NVDR | | | 204,000 | | | | 187,014 | |
CP ALL PCL — NVDR | | | 292,800 | | | | 705,522 | |
Energy Absolute PCL — NVDR | | | 98,300 | | | | 143,190 | |
Global Power Synergy PCL | | | 42,200 | | | | 120,583 | |
Home Product Center PCL — NVDR | | | 339,932 | | | | 181,293 | |
Indorama Ventures PCL — NVDR | | | 97,000 | | | | 113,052 | |
IRPC PCL — NVDR | | | 492,400 | | | | 60,370 | |
Kasikornbank PCL — NVDR | | | 35,100 | | | | 176,699 | |
Kasikornbank PCL, Foreign Registered Shares | | | 58,200 | | | | 292,324 | |
Krung Thai Bank PCL — NVDR | | | 285,275 | | | | 156,102 | |
Land & Houses PCL — NVDR | | | 601,300 | | | | 196,663 | |
Minor International PCL — NVDR | | | 146,680 | | | | 176,045 | |
Osotspa PCL | | | 81,600 | | | | 110,129 | |
PTT Exploration & Production PCL — NVDR | | | 76,522 | | | | 317,592 | |
PTT Global Chemical PCL — NVDR | | | 115,068 | | | | 218,639 | |
PTT PCL — NVDR | | | 593,200 | | | | 870,399 | |
Siam Cement PCL — NVDR | | | 42,200 | | | | 551,568 | |
Siam Commercial Bank PCL — NVDR | | | 41,800 | | | | 169,978 | |
Srisawad Corp. PCL, NVDR | | | 53,800 | | | | 122,726 | |
Thai Oil PCL — NVDR | | | 51,600 | | | | 119,941 | |
Thai Union Group PCL — NVDR | | | 231,400 | | | | 104,100 | |
TMB Bank PCL — NVDR(a) | | | 2,462,549 | | | | 137,917 | |
True Corp. PCL — NVDR | | | 783,140 | | | | 119,932 | |
| | | | | | | | |
| | | | 7,588,049 | |
|
| Turkey — 0.1% | |
Akbank TAS(b) | | | 148,211 | | | | 201,881 | |
Anadolu Efes Biracilik Ve Malt Sanayii AS | | | 14,158 | | | | 54,928 | |
Arcelik AS(b) | | | 20,968 | | | | 73,430 | |
| | | | | | | | |
| Security | | Shares | | | Value | |
|
| Turkey (continued) | |
BIM Birlesik Magazalar AS | | | 17,408 | | | $ | 136,537 | |
Eregli Demir ve Celik Fabrikalari TAS | | | 51,754 | | | | 78,599 | |
Ford Otomotiv Sanayi AS | | | 2,700 | | | | 32,147 | |
Haci Omer Sabanci Holding AS | | | 32,457 | | | | 52,056 | |
KOC Holding AS | | | 17,992 | | | | 61,488 | |
TAV Havalimanlari Holding AS | | | 2,171 | | | | 10,641 | |
Tupras Turkiye Petrol Rafinerileri AS | | | 5,076 | | | | 108,155 | |
Turk Hava Yollari AO(b) | | | 26,638 | | | | 64,708 | |
Turkcell Iletisim Hizmetleri AS | | | 33,444 | | | | 77,567 | |
Turkiye Garanti Bankasi AS(b) | | | 101,489 | | | | 190,071 | |
Turkiye Is Bankasi AS, Class C(b) | | | 88,347 | | | | 95,144 | |
| | | | | | | | |
| | | | 1,237,352 | |
|
| United Arab Emirates — 0.2% | |
Abu Dhabi Commercial Bank PJSC | | | 124,127 | | | | 267,995 | |
Aldar Properties PJSC | | | 145,452 | | | | 85,612 | |
DP World PLC | | | 10,522 | | | | 137,935 | |
Dubai Islamic Bank PJSC | | | 48,113 | | | | 72,214 | |
Emaar Malls PJSC | | | 81,000 | | | | 40,355 | |
Emaar Properties PJSC | | | 172,958 | | | | 189,494 | |
Emirates Telecommunications Group Co. PJSC | | | 97,764 | | | | 435,435 | |
First Abu Dhabi Bank PJSC | | | 142,970 | | | | 591,172 | |
NMC Health PLC(a) | | | 4,897 | | | | 114,734 | |
| | | | | | | | |
| | | | 1,934,946 | |
|
| United Kingdom — 9.3% | |
3i Group PLC | | | 50,300 | | | | 731,951 | |
Admiral Group PLC | | | 8,197 | | | | 250,487 | |
Ashtead Group PLC | | | 20,678 | | | | 661,173 | |
Associated British Foods PLC | | | 19,083 | | | | 656,472 | |
AstraZeneca PLC | | | 62,556 | | | | 6,261,351 | |
Auto Trader Group PLC(d) | | | 41,090 | | | | 324,494 | |
Aveva Group PLC | | | 2,132 | | | | 131,529 | |
Aviva PLC | | | 190,722 | | | | 1,058,611 | |
BAE Systems PLC | | | 157,882 | | | | 1,182,112 | |
Barclays PLC | | | 823,645 | | | | 1,963,960 | |
Barratt Developments PLC | | | 54,522 | | | | 539,846 | |
Berkeley Group Holdings PLC | | | 6,196 | | | | 398,789 | |
BP PLC | | | 973,780 | | | | 6,125,858 | |
British American Tobacco PLC | | | 110,286 | | | | 4,687,383 | |
British Land Co. PLC | | | 46,491 | | | | 393,386 | |
BT Group PLC | | | 402,928 | | | | 1,026,737 | |
Bunzl PLC | | | 15,074 | | | | 412,285 | |
Burberry Group PLC | | | 20,166 | | | | 588,758 | |
Centrica PLC | | | 236,230 | | | | 279,429 | |
CK Hutchison Holdings Ltd. | | | 134,508 | | | | 1,282,599 | |
CNH Industrial NV | | | 47,161 | | | | 517,823 | |
Coca-Cola European Partners PLC | | | 12,354 | | | | 628,572 | |
Compass Group PLC | | | 75,703 | | | | 1,897,251 | |
Croda International PLC | | | 7,217 | | | | 490,241 | |
DCC PLC | | | 4,703 | | | | 407,934 | |
Diageo PLC | | | 113,721 | | | | 4,791,823 | |
Direct Line Insurance Group PLC | | | 67,525 | | | | 279,388 | |
easyJet PLC | | | 9,017 | | | | 169,852 | |
Experian PLC | | | 41,837 | | | | 1,418,251 | |
Fiat Chrysler Automobiles NV | | | 50,913 | | | | 754,863 | |
G4S PLC | | | 67,608 | | | | 195,513 | |
GlaxoSmithKline PLC | | | 238,318 | | | | 5,599,764 | |
GVC Holdings PLC | | | 31,705 | | | | 371,332 | |
Halma PLC | | | 19,594 | | | | 548,684 | |
Hargreaves Lansdown PLC | | | 12,676 | | | | 325,155 | |
HSBC Holdings PLC | | | 951,477 | | | | 7,448,576 | |
Imperial Brands PLC | | | 45,774 | | | | 1,132,462 | |
Informa PLC | | | 65,336 | | | | 743,107 | |
InterContinental Hotels Group PLC | | | 8,582 | | | | 589,710 | |
| | |
| 34 | | 2019 BLACKROCK ANNUAL REPORTTO SHAREHOLDERS |
| | |
Schedule of Investments (continued) December 31, 2019 | | Total International ex U.S. Index Master Portfolio (Percentages shown are based on Net Assets) |
| | | | | | | | |
| Security | | Shares | | | Value | |
|
| United Kingdom (continued) | |
Intertek Group PLC | | | 8,502 | | | $ | 658,804 | |
ITV PLC | | | 151,643 | | | | 303,403 | |
J. Sainsbury PLC | | | 72,193 | | | | 220,134 | |
JD Sports Fashion PLC | | | 18,108 | | | | 201,136 | |
Johnson Matthey PLC | | | 7,947 | | | | 315,984 | |
Kingfisher PLC | | | 97,026 | | | | 279,311 | |
Land Securities Group PLC | | | 31,499 | | | | 413,472 | |
Legal & General Group PLC | | | 278,803 | | | | 1,119,967 | |
Lloyds Banking Group PLC | | | 3,394,391 | | | | 2,811,983 | |
London Stock Exchange Group PLC | | | 14,615 | | | | 1,502,012 | |
M&G PLC(b) | | | 113,634 | | | | 357,032 | |
Marks & Spencer Group PLC | | | 78,862 | | | | 223,610 | |
Meggitt PLC | | | 30,833 | | | | 268,554 | |
Melrose Industries PLC | | | 251,292 | | | | 800,421 | |
Micro Focus International PLC | | | 16,756 | | | | 235,181 | |
Mondi PLC | | | 20,721 | | | | 485,890 | |
National Grid PLC | | | 163,220 | | | | 2,039,787 | |
Next PLC | | | 6,073 | | | | 565,898 | |
Ocado Group PLC(b) | | | 25,479 | | | | 432,302 | |
Pearson PLC | | | 33,637 | | | | 284,169 | |
Persimmon PLC | | | 15,288 | | | | 546,074 | |
Prudential PLC | | | 123,343 | | | | 2,363,330 | |
Reckitt Benckiser Group PLC | | | 33,956 | | | | 2,758,194 | |
RELX PLC | | | 93,038 | | | | 2,348,589 | |
Rentokil Initial PLC | | | 86,686 | | | | 519,558 | |
Rolls-Royce Holdings PLC(b) | | | 77,832 | | | | 703,446 | |
Royal Bank of Scotland Group PLC | | | 228,688 | | | | 733,618 | |
RSA Insurance Group PLC | | | 43,531 | | | | 326,252 | |
Sage Group PLC | | | 45,514 | | | | 451,530 | |
Schroders PLC | | | 4,883 | | | | 215,614 | |
Segro PLC | | | 52,735 | | | | 627,940 | |
Severn Trent PLC | | | 12,635 | | | | 420,918 | |
Smith & Nephew PLC | | | 40,470 | | | | 975,357 | |
Smiths Group PLC | | | 19,423 | | | | 433,815 | |
Spirax-Sarco Engineering PLC | | | 3,836 | | | | 451,549 | |
SSE PLC | | | 50,232 | | | | 958,037 | |
St. James’s Place PLC | | | 24,806 | | | | 382,378 | |
Standard Chartered PLC | | | 130,975 | | | | 1,234,189 | |
Standard Life Aberdeen PLC | | | 123,732 | | | | 538,311 | |
Taylor Wimpey PLC | | | 136,947 | | | | 351,142 | |
Tesco PLC | | | 470,700 | | | | 1,590,793 | |
Unilever NV | | | 70,840 | | | | 4,065,555 | |
Unilever PLC | | | 54,061 | | | | 3,094,594 | |
United Utilities Group PLC | | | 36,750 | | | | 459,886 | |
Vodafone Group PLC | | | 1,279,760 | | | | 2,484,492 | |
Weir Group PLC | | | 9,549 | | | | 190,980 | |
Whitbread PLC | | | 5,907 | | | | 379,103 | |
WM Morrison Supermarkets PLC | | | 100,540 | | | | 266,084 | |
WPP PLC | | | 56,654 | | | | 797,250 | |
| | | | | | | | |
| | | | 101,455,139 | |
|
| United States — 0.3% | |
Bausch Health Cos., Inc.(b) | | | 13,560 | | | | 405,897 | |
Carnival PLC | | | 8,973 | | | | 430,107 | |
CyberArk Software Ltd.(b) | | | 1,512 | | | | 176,269 | |
Ferguson PLC | | | 11,242 | | | | 1,023,099 | |
James Hardie Industries PLC | | | 19,386 | | | | 378,889 | |
JBS SA | | | 60,731 | | | | 389,504 | |
Titan Cement International SA(b) | | | 1,660 | | | | 35,304 | |
| | | | | | | | |
| | | | 2,839,069 | |
|
| Zambia — 0.0% | |
First Quantum Minerals Ltd. | | | 29,878 | | | | 303,025 | |
| | | | | | | | |
| |
Total Common Stocks — 97.3%
(Cost — $850,277,543) | | | | 1,065,405,025 | |
| | | | | |
| | | | | | | | |
| Security | | Shares | | | Value | |
|
Preferred Stocks — 1.3% | |
|
Brazil — 0.7% | |
Banco Bradesco SA, Preference Shares, 0.00% | | | 189,154 | | | $ | 1,700,773 | |
Braskem SA, Preference ‘A’ Shares, Class A, 0.00% | | | 11,000 | | | | 81,624 | |
Centrais Eletricas Brasileiras SA, Preference ‘B’ Shares, 0.00% | | | 9,817 | | | | 93,321 | |
Cia Brasileira de Distribuicao, Preference Shares, 0.00% | | | 7,649 | | | | 166,663 | |
Cia Energetica de Minas Gerais, Preference Shares, 0.00% | | | 34,268 | | | | 117,472 | |
Gerdau SA, Preference Shares, 0.00% | | | 52,056 | | | | 258,811 | |
Itau Unibanco Holding SA, Preference Shares, 0.00% | | | 230,644 | | | | 2,127,152 | |
Itausa — Investimentos Itau SA, Preference Shares, 0.00% | | | 214,928 | | | | 752,812 | |
Lojas Americanas SA, Preference Shares, 0.00% | | | 35,184 | | | | 226,618 | |
Petroleo Brasileiro SA, Preference Shares, 0.00% | | | 199,768 | | | | 1,498,744 | |
Telefonica Brasil SA, Preference Shares, 0.00% | | | 19,455 | | | | 280,409 | |
| | | | | | | | |
| | | | 7,304,399 | |
|
| Chile — 0.0% | |
Embotelladora Andina SA, Preference ‘B’ Shares, 0.00% | | | 9,220 | | | | 26,718 | |
Sociedad Quimica y Minera de Chile SA, Preference ‘B’ Shares, 0.00% | | | 4,912 | | | | 131,365 | |
| | | | | | | | |
| | | | 158,083 | |
|
| Colombia — 0.0% | |
Bancolombia SA, Preference Shares, 0.00% | | | 21,944 | | | | 305,739 | |
Grupo Aval Acciones y Valores SA, Preference Shares, 0.00% | | | 125,734 | | | | 55,844 | |
| | | | | | | | |
| | | | 361,583 | |
|
| Germany — 0.4% | |
Bayerische Motoren Werke AG, Preference Shares, 0.00% | | | 3,454 | | | | 212,635 | |
Fuchs Petrolub SE, Preference Shares, 0.00% | | | 3,377 | | | | 167,781 | |
Henkel AG & Co. KGaA, Preference Shares, 0.00% | | | 8,690 | | | | 897,681 | |
Porsche Automobil Holding SE, Preference Shares, 0.00% | | | 7,705 | | | | 571,697 | |
Sartorius AG, Preference Shares, 0.00% | | | 1,605 | | | | 343,088 | |
Volkswagen AG, Preference Shares, 0.00% | | | 8,774 | | | | 1,727,060 | |
| | | | | | | | |
| | | | 3,919,942 | |
|
| Russia — 0.0% | |
Surgutneftegas PJSC, Preference Shares, 0.00% | | | 217,007 | | | | 132,135 | |
Transneft PJSC, Preference Shares, 0.00% | | | 32 | | | | 91,129 | |
| | | | | | | | |
| | | | 223,264 | |
|
| South Korea — 0.2% | |
Amorepacific Corp., Preference Shares, 0.00% | | | 382 | | | | 29,513 | |
Hyundai Motor Co., Preference Shares, 0.00% | | | 852 | | | | 52,770 | |
Hyundai Motor Co., Second Preference Shares, 0.00% | | | 1,756 | | | | 120,465 | |
LG Chem Ltd., Preference Shares, 0.00% | | | 179 | | | | 26,741 | |
LG Household & Health Care Ltd. Preference Shares, 0.00% | | | 151 | | | | 100,603 | |
Samsung Electronics Co. Ltd., Preference Shares, 0.00% | | | 40,382 | | | | 1,581,030 | |
| | | | | | | | |
| | | | 1,911,122 | |
| | | | | |
| |
Total Preferred Stocks — 1.3%
(Cost — $10,224,710) | | | | 13,878,393 | |
| | | | | |
|
Rights — 0.0% | |
|
Brazil — 0.0% | |
Lojas Americanas SA (Expires 02/01/20)(b) | | | 339 | | | | 792 | |
| | | | | | | | |
|
| India — 0.0% | |
Piramal Enterprises Ltd. (Expires 01/20/20) | | | 625 | | | | 1,957 | |
| | | | | | | | |
|
| Spain — 0.0% | |
Repsol SA, (Expires 01/21/20)(b) | | | 67,863 | | | | 32,200 | |
| | | | | | | | |
| |
Total Rights — 0.0%
(Cost — $32,093) | | | | 34,949 | |
| | | | | |
| | | | |
| SCHEDULE OF INVESTMENTS | | | 35 | |
| | |
Schedule of Investments (continued) December 31, 2019 | | Total International ex U.S. Index Master Portfolio (Percentages shown are based on Net Assets) |
| | | | | | | | |
| Security | | Shares | | | Value | |
|
Warrants — 0.0% | |
|
Thailand — 0.0% | |
BTS Group Holdings PCL — NVDR (Expires 02/06/21) | | | 51,340 | | | $ | — | |
| | | | | | | | |
| |
Total Warrants — 0.0%
(Cost — $—) | | | | — | |
| | | | | |
| |
Total Long-Term Investments — 98.6%
(Cost — $860,534,346) | | | | 1,079,318,367 | |
| | | | | |
|
Short-Term Securities — 2.8% | |
BlackRock Cash Funds: Institutional,
SL Agency Shares, | | | | | | | | |
1.87%(f)(g)(h) | | | 18,171,935 | | | | 18,179,204 | |
BlackRock Cash Funds: Treasury,
SL Agency Shares, | | | | | | | | |
1.55%(f)(h) | | | 13,177,912 | | | | 13,177,912 | |
| | | | | | | | |
| |
Total Short-Term Securities — 2.8%
(Cost — $31,352,898) | | | | 31,357,116 | |
| | | | | |
| |
Total Investments — 101.4%
(Cost — $891,887,244) | | | | 1,110,675,483 | |
| |
Liabilities in Excess of Other Assets — (1.4)% | | | | (15,767,966 | ) |
| | | | | |
| |
Net Assets — 100.0% | | | $ | 1,094,907,517 | |
| | | | | |
| (a) | Security, or a portion of the security, is on loan. |
| (b) | Non-income producing security. |
| (c) | A security contractually bound to one or more other securities to form a single saleable unit which cannot be sold separately. |
| (d) | Security exempt from registration pursuant to Rule 144A under the Securities Act of 1933, as amended. These securities may be resold in transactions exempt from registration to qualified institutional investors. |
| (e) | Security is valued using significant unobservable inputs and is classified as Level 3 in the fair value hierarchy. |
| (f) | Annualized7-day yield as of period end. |
| (g) | All or a portion of the security was purchased with the cash collateral from loaned securities. |
| (h) | During the year ended December 31, 2019, investments in issuers considered to be an affiliate/affiliates of the Master Portfolio for purposes of Section 2(a)(3) of the Investment Company Act of 1940, as amended, were as follows: |
| | | | | | | | | | | | | | | | | | | | | | | | | | | | |
| Affiliate | | Shares
Held at
12/31/18 | | | Net
Activity | | | Shares
Held at
12/31/19 | | | Value at
12/31/19 | | | Income | | | Net
Realized
Gain (Loss) (a) | | | Change in
Unrealized
Appreciation
(Depreciation) | |
BlackRock Cash Funds: Institutional, SL Agency Shares | | | 26,138,501 | | | | (7,966,566 | ) | | | 18,171,935 | | | $ | 18,179,204 | | | $ | 276,682 | (b) | | $ | 13,030 | | | $ | 1,944 | |
BlackRock Cash Funds: Treasury, SL Agency Shares | | | 2,472,228 | | | | 10,705,684 | | | | 13,177,912 | | | | 13,177,912 | | | | 149,167 | | | | — | | | | — | |
| | | | | | | | | | | | | | | | | | | | | | | | | | | | |
| | | | | | | | | | | | | | $ | 31,357,116 | | | $ | 425,849 | | | $ | 13,030 | | | $ | 1,944 | |
| | | | | | | | | | | | | | | | | | | | | | | | | | | | |
| | (a) | Includes net capital gain distributions, if applicable. | |
| | (b) | All or a portion represents securities lending income earned from the reinvestment of cash collateral from loaned securities, net of fees and collateral investment expenses, and other payments to and from borrowers of securities. | |
Derivative Financial Instruments Outstanding as of Period End
Futures Contracts
| | | | | | | | | | | | | | | | |
| Description | | Number of
Contracts | | | Expiration
Date | | | Notional
Amount (000) | | | Value /
Unrealized
Appreciation
(Depreciation) | |
Long Contracts | | | | | | | | | | | | | | | | |
S&P/TSX 60 Index | | | 28 | | | | 03/19/20 | | | $ | 1,091 | | | $ | (2,903 | ) |
E-Mini MSCI EAFE Index | | | 86 | | | | 03/20/20 | | | | 8,757 | | | | 22,683 | |
MSCI Emerging Markets Index | | | 38 | | | | 03/20/20 | | | | 2,128 | | | | 5,950 | |
| | | | | | | | | | | | | | | | |
| | | | | | | | | | | | | | $ | 25,730 | |
| | | | | | | | | | | | | | | | |
| | |
| 36 | | 2019 BLACKROCK ANNUAL REPORTTO SHAREHOLDERS |
| | |
Schedule of Investments (continued) December 31, 2019 | | Total International ex U.S. Index Master Portfolio |
Derivative Financial Instruments Categorized by Risk Exposure
As of period end, the fair values of derivative financial instruments located in the Statement of Assets and Liabilities were as follows:
| | | | | | | | | | | | | | | | | | | | | | | | | | | | |
| | | Commodity
Contracts | | | Credit
Contracts | | | Equity
Contracts | | | Foreign
Currency
Exchange
Contracts | | | Interest
Rate
Contracts | | | Other
Contracts | | | Total | |
Assets — Derivative Financial Instruments | | | | | | | | | | | | | | | | | | | | | | | | | | | | |
Future contracts | | | | | | | | | | | | | | | | | | | | | | | | | | | | |
Unrealized appreciation on future contracts(a) | | $ | — | | | | — | | | $ | 28,633 | | | $ | — | | | $ | — | | | $ | — | | | $ | 28,633 | |
| | | | | | | | | | | | | | | | | | | | | | | | | | | | |
| | | | | | | |
| Liabilities — Derivative Financial Instruments | | | | | | | | | | | | | | | | | | | | | |
Future contracts | | | | | | | | | | | | | | | | | | | | | | | | | | | | |
Unrealized depreciation on future contracts(a) | | $ | — | | | | — | | | $ | 2,903 | | | $ | — | | | $ | — | | | $ | — | | | $ | 2,903 | |
| | | | | | | | | | | | | | | | | | | | | | | | | | | | |
| | (a) | Includes cumulative appreciation (depreciation) on futures contracts, if any, as reported in the Schedule of Investments. Only current day’s variation margin is reported within the Statement of Assets and Liabilities. | |
For the year ended December 31, 2019, the effect of derivative financial instruments in the Statement of Operations was as follows:
| | | | | | | | | | | | | | | | | | | | | | | | | | | | |
| | | Commodity
Contracts | | | Credit
Contracts | | | Equity
Contracts | | | Foreign
Currency
Exchange
Contracts | | | Interest
Rate
Contracts | | | Other
Contracts | | | Total | |
Net Realized Gain (Loss) from: | | | | | | | | | | | | | | | | | | | | | | | | | | | | |
Future contracts | | $ | — | | | $ | — | | | $ | 1,424,955 | | | $ | — | | | $ | — | | | $ | — | | | $ | 1,424,955 | |
| | | | | | | | | | | | | | | | | | | | | | | | | | | | |
| | | | | | | |
| Net Change in Unrealized Appreciation (Depreciation) on: | | | | | | | | | | | | | | | | | | | | | |
Future contracts | | $ | — | | | $ | — | | | $ | 127,831 | | | $ | — | | | $ | — | | | $ | — | | | $ | 127,831 | |
| | | | | | | | | | | | | | | | | | | | | | | | | | | | |
Average Quarterly Balances of Outstanding Derivative Financial Instruments
| | | | |
Futures contracts: | |
Average notional value of contracts — long | | $ | 11,469,563 | |
Fair Value Hierarchy as of Period End
Various inputs are used in determining the fair value of investments and derivative financial instruments. For information about the Master Portfolio’s policy regarding valuation of investments and derivative financial instruments, refer to the Notes to Financial Statements.
The following tables summarize the Master Portfolio’s investments and derivative financial instruments categorized in the disclosure hierarchy:
| | | | | | | | | | | | | | | | |
| | | Level 1 | | | Level 2 | | | Level 3 | | | Total | |
Assets: | |
Investments: | |
Common Stocks: | |
Argentina | | $ | 454,137 | | | $ | — | | | $ | — | | | $ | 454,137 | |
Australia | | | — | | | | 53,561,944 | | | | — | | | | 53,561,944 | |
Austria | | | 143,479 | | | | 1,473,643 | | | | — | | | | 1,617,122 | |
Belgium | | | 126,952 | | | | 6,959,430 | | | | — | | | | 7,086,382 | |
Brazil | | | 14,617,568 | | | | — | | | | — | | | | 14,617,568 | |
Canada | | | 71,264,982 | | | | — | | | | — | | | | 71,264,982 | |
Chile | | | 2,049,529 | | | | 340,981 | | | | — | | | | 2,390,510 | |
China | | | 28,252,972 | | | | 75,355,150 | | | | 211 | | | | 103,608,333 | |
Colombia | | | 687,053 | | | | 223,936 | | | | — | | | | 910,989 | |
Czech Republic | | | 219,442 | | | | 235,194 | | | | — | | | | 454,636 | |
Denmark | | | 4,552,898 | | | | 8,587,937 | | | | — | | | | 13,140,835 | |
Egypt | | | 260,476 | | | | — | | | | — | | | | 260,476 | |
Finland | | | 1,059,617 | | | | 6,896,516 | | | | — | | | | 7,956,133 | |
France | | | 2,459,803 | | | | 76,854,366 | | | | — | | | | 79,314,169 | |
Germany | | | 4,806,722 | | | | 52,718,954 | | | | — | | | | 57,525,676 | |
Greece | | | 96,880 | | | | 797,429 | | | | 2 | | | | 894,311 | |
Hong Kong | | | 620,763 | | | | 21,508,073 | | | | 411 | | | | 22,129,247 | |
Hungary | | | 67,312 | | | | 743,773 | | | | — | | | | 811,085 | |
India | | | 9,515,741 | | | | 16,261,855 | | | | — | | | | 25,777,596 | |
Indonesia | | | — | | | | 5,784,549 | | | | — | | | | 5,784,549 | |
| | | | |
| SCHEDULE OF INVESTMENTS | | | 37 | |
| | |
Schedule of Investments (continued) December 31, 2019 | | Total International ex U.S. Index Master Portfolio |
| | | | | | | | | | | | | | | | |
| | | Level 1 | | | Level 2 | | | Level 3 | | | Total | |
Ireland | | $ | 2,439,600 | | | $ | 2,095,108 | | | $ | — | | | $ | 4,534,708 | |
Israel | | | 1,436,805 | | | | 2,491,917 | | | | — | | | | 3,928,722 | |
Italy | | | — | | | | 14,528,293 | | | | — | | | | 14,528,293 | |
Japan | | | — | | | | 173,323,483 | | | | — | | | | 173,323,483 | |
Luxembourg | | | 739,941 | | | | 696,127 | | | | — | | | | 1,436,068 | |
Macau | | | — | | | | 1,629,183 | | | | — | | | | 1,629,183 | |
Malaysia | | | 422,744 | | | | 4,961,831 | | | | — | | | | 5,384,575 | |
Mexico | | | 6,753,138 | | | | — | | | | — | | | | 6,753,138 | |
Netherlands | | | 1,685,686 | | | | 31,998,185 | | | | — | | | | 33,683,871 | |
New Zealand | | | — | | | | 2,030,795 | | | | — | | | | 2,030,795 | |
Norway | | | — | | | | 4,467,724 | | | | — | | | | 4,467,724 | |
Pakistan | | | 19,133 | | | | 10,218 | | | | — | | | | 29,351 | |
Peru | | | 1,102,230 | | | | — | | | | — | | | | 1,102,230 | |
Philippines | | | 792,754 | | | | 1,914,470 | | | | — | | | | 2,707,224 | |
Poland | | | 452,338 | | | | 2,143,361 | | | | — | | | | 2,595,699 | |
Portugal | | | — | | | | 1,117,736 | | | | — | | | | 1,117,736 | |
Qatar | | | 1,270,009 | | | | 1,361,183 | | | | — | | | | 2,631,192 | |
Romania | | | — | | | | 190,090 | | | | — | | | | 190,090 | |
Russia | | | 1,820,501 | | | | 9,726,627 | | | | — | | | | 11,547,128 | |
Saudi Arabia | | | 1,034,766 | | | | 6,748,330 | | | | — | | | | 7,783,096 | |
Singapore | | | — | | | | 9,040,753 | | | | — | | | | 9,040,753 | |
South Africa | | | 3,493,058 | | | | 11,836,320 | | | | — | | | | 15,329,378 | |
South Korea | | | 425,093 | | | | 32,485,976 | | | | — | | | | 32,911,069 | |
Spain | | | 373,588 | | | | 19,826,371 | | | | — | | | | 20,199,959 | |
Sweden | | | 765,005 | | | | 16,821,356 | | | | — | | | | 17,586,361 | |
Switzerland | | | 895,025 | | | | 68,294,990 | | | | — | | | | 69,190,015 | |
Taiwan | | | 253,314 | | | | 34,571,610 | | | | — | | | | 34,824,924 | |
Thailand | | | — | | | | 7,588,049 | | | | — | | | | 7,588,049 | |
Turkey | | | 191,465 | | | | 1,045,887 | | | | — | | | | 1,237,352 | |
United Arab Emirates | | | 475,790 | | | | 1,459,156 | | | | — | | | | 1,934,946 | |
United Kingdom | | | 3,115,542 | | | | 98,339,597 | | | | — | | | | 101,455,139 | |
United States | | | 1,006,974 | | | | 1,832,095 | | | | — | | | | 2,839,069 | |
Zambia | | | 303,025 | | | | — | | | | — | | | | 303,025 | |
Preferred Stocks | | | 7,915,195 | | | | 5,963,198 | | | | — | | | | 13,878,393 | |
Rights | | | 32,992 | | | | 1,957 | | | | — | | | | 34,949 | |
Short-Term Securities | | | 31,357,116 | | | | — | | | | — | | | | 31,357,116 | |
| | | | | | | | | | | | | | | | |
| | $ | 211,829,153 | | | $ | 898,845,706 | | | $ | 624 | | | $ | 1,110,675,483 | |
| | | | | | | | | | | | | | | | |
Derivative Financial Instruments(a) | |
Assets: | |
Equity contracts | | $ | 28,633 | | | $ | — | | | $ | — | | | $ | 28,633 | |
Liabilities: | |
Equity contracts | | | (2,903 | ) | | | — | | | | — | | | | (2,903 | ) |
| | | | | | | | | | | | | | | | |
| | $ | 25,730 | | | $ | — | | | $ | — | | | $ | 25,730 | |
| | | | | | | | | | | | | | | | |
| | (a) | Derivative financial instruments are futures contracts. Futures contracts are valued at the unrealized appreciation (depreciation) on the instrument. | |
| | |
| 38 | | 2019 BLACKROCK ANNUAL REPORTTO SHAREHOLDERS |
Statement of Assets and Liabilities
December 31, 2019
| | | | |
| | | Total International
ex U.S. Index
Master Portfolio | |
|
ASSETS | |
Investments at value — unaffiliated (including securities loaned at value of $16,023,002, cost — $860,534,346) | | $ | 1,079,318,367 | |
Investments at value — affiliated (cost — $31,352,898) | | | 31,357,116 | |
Cash pledged for futures contracts | | | 440,620 | |
Foreign currency at value (cost — $1,250,832) | | | 1,258,544 | |
Receivables: | |
Investments sold | | | 94,902 | |
Securities lending income — affiliated | | | 17,270 | |
Contributions from investors | | | 3,307,955 | |
Dividends — unaffiliated | | | 1,525,870 | |
Interest — unaffiliated | | | 10,974 | |
Variation margin on futures contracts | | | 48,323 | |
Prepaid expenses | | | 2,926 | |
| | | | |
Total assets | | | 1,117,382,867 | |
| | | | |
|
LIABILITIES | |
Cash collateral on securities loaned at value | | | 18,156,083 | |
Payables: | |
Investments purchased | | | 3,853,563 | |
Deferred foreign capital gain tax | | | 84,652 | |
Investment advisory fees | | | 51,732 | |
Other accrued expenses | | | 323,171 | |
Trustees’ fees | | | 5,141 | |
Variation margin on futures contracts | | | 1,008 | |
| | | | |
Total liabilities | | | 22,475,350 | |
| | | | |
| |
NET ASSETS | | $ | 1,094,907,517 | |
| | | | |
|
NET ASSETS CONSIST OF | |
Investors’ capital | | $ | 876,027,390 | |
Net unrealized appreciation (depreciation) | | | 218,880,127 | |
| | | | |
NET ASSETS | | $ | 1,094,907,517 | |
| | | | |
See notes to financial statements.
Statement of Operations
Year Ended December 31, 2019
| | | | |
| | | Total International ex U.S. Index
Master Portfolio | |
|
INVESTMENT INCOME | |
Dividends — affiliated | | $ | 149,167 | |
Dividends — unaffiliated | | | 29,752,204 | |
Securities lending income — affiliated — net | | | 276,682 | |
Non-cash dividends — unaffiliated | | | 2,245,678 | |
Foreign taxes withheld | | | (3,195,232 | ) |
| | | | |
Total investment income | | | 29,228,499 | |
| | | | |
|
EXPENSES | |
Investment advisory | | | 270,325 | |
Accounting services | | | 251,249 | |
Professional | | | 73,364 | |
Pricing | | | 72,532 | |
Trustees | | | 22,740 | |
Printing | | | 1,338 | |
Miscellaneous | | | 11,456 | |
| | | | |
Total expenses | | | 703,004 | |
Less fees waived and/or reimbursed by the Manager | | | (4,972 | ) |
| | | | |
Total expenses after fees waived and/or reimbursed | | | 698,032 | |
| | | | |
Net investment income | | | 28,530,467 | |
| | | | |
|
REALIZED AND UNREALIZED GAIN (LOSS) | |
Net realized gain (loss) from: | |
Futures contracts | | | 1,424,955 | |
Foreign currency transactions | | | (64,780 | ) |
Investments — affiliated | | | 13,030 | |
Investments — unaffiliated (including $6,808 foreign capital gain tax) | | | (6,340,051 | ) |
| | | | |
| | | (4,966,846 | ) |
| | | | |
Net change in unrealized appreciation (depreciation) on: | |
Futures contracts | | | 127,831 | |
Foreign currency translations | | | (6,982 | ) |
Investments — affiliated | | | 1,944 | |
Investments — unaffiliated (including $(39,377) foreign capital gain tax) | | | 149,488,336 | |
| | | | |
| | | 149,611,129 | |
| | | | |
Net realized and unrealized gain | | | 144,644,283 | |
| | | | |
NET INCREASE IN NET ASSETS RESULTING FROM OPERATIONS | | $ | 173,174,750 | |
| | | | |
See notes to financial statements.
| | |
| 40 | | 2019 BLACKROCK ANNUAL REPORTTO SHAREHOLDERS |
Statements of Changes in Net Assets
| | | | | | | | |
| | | Total International ex U.S. Index
Master Portfolio | |
| |
| | | Year Ended December 31, | |
| | | 2019 | | | 2018 | |
|
INCREASE (DECREASE) IN NET ASSETS | |
|
OPERATIONS | |
Net investment income | | $ | 28,530,467 | | | $ | 26,779,451 | |
Net realized gain (loss) | | | (4,966,846 | ) | | | 4,179,101 | |
Net change in unrealized appreciation (depreciation) | | | 149,611,129 | | | | (156,335,463 | ) |
| | | | | | | | |
Net increase (decrease) in net assets resulting from operations | | | 173,174,750 | | | | (125,376,911 | ) |
| | | | | | | | |
|
CAPITAL TRANSACTIONS | |
Proceeds from contributions | | | 533,180,584 | | | | 439,538,961 | |
Value of withdrawals | | | (371,145,212 | ) | | | (603,313,951 | ) |
| | | | | | | | |
Net increase (decrease) in net assets derived from capital transactions | | | 162,035,372 | | | | (163,774,990 | ) |
| | | | | | | | |
|
NET ASSETS | |
Total increase (decrease) in net assets | | | 335,210,122 | | | | (289,151,901 | ) |
Beginning of year | | | 759,697,395 | | | | 1,048,849,296 | |
| | | | | | | | |
End of year | | $ | 1,094,907,517 | | | $ | 759,697,395 | |
| | | | | | | | |
See notes to financial statements.
Financial Highlights
(For a share outstanding throughout each period)
| | | | | | | | | | | | | | | | | | | | |
| | | Total International ex U.S. Index Master Portfolio | |
| |
| | | Year Ended December 31, | |
| | | 2019 | | | 2018 | | | 2017 | | | 2016 | | | 2015 | |
|
Total Return | |
Total return | | | 21.29 | % | | | (13.87 | )% | | | 27.67 | % | | | 4.41 | % | | | (5.80 | )% |
| | | | | | | | | | | | | | | | | | | | |
|
Ratios to Average Net Assets | |
Total expenses | | | 0.08 | % | | | 0.08 | % | | | 0.07 | % | | | 0.08 | % | | | 0.08 | % |
| | | | | | | | | | | | | | | | | | | | |
Total expenses after fees waived and paid indirectly | | | 0.08 | % | | | 0.08 | % | | | 0.07 | % | | | 0.08 | % | | | 0.07 | % |
| | | | | | | | | | | | | | | | | | | | |
Net investment income | | | 3.17 | % | | | 2.87 | % | | | 2.85 | % | | | 2.90 | % | | | 2.71 | % |
| | | | | | | | | | | | | | | | | | | | |
|
Supplemental Data | |
Net assets, end of year (000) | | $ | 1,094,908 | | | $ | 759,697 | | | $ | 1,048,849 | | | $ | 1,000,386 | | | $ | 836,637 | |
| | | | | | | | | | | | | | | | | | | | |
Portfolio turnover rate | | | 5 | % | | | 40 | % | | | 57 | % | | | 15 | % | | | 6 | % |
| | | | | | | | | | | | | | | | | | | | |
See notes to financial statements.
| | |
| 42 | | 2019 BLACKROCK ANNUAL REPORTTO SHAREHOLDERS |
Notes to Financial Statements
Master Investment Portfolio (“MIP”) is registered under the Investment Company Act of 1940, as amended (the “1940 Act”), as anopen-end management investment company. MIP is organized as a Delaware statutory trust. Total International ex U.S. Index Master Portfolio (the “Master Portfolio”) is a series of MIP. The Master Portfolio is classified as diversified.
The Master Portfolio, together with certain other registered investment companies advised by BlackRock Fund Advisors (“BFA” or the “Manager”) or its affiliates, is included in a complex of equity, multi-asset, index and money market funds referred to as the BlackRock Multi-Asset Complex.
| 2. | SIGNIFICANT ACCOUNTING POLICIES |
The financial statements are prepared in conformity with accounting principles generally accepted in the United States of America (“U.S. GAAP”), which may require management to make estimates and assumptions that affect the reported amounts of assets and liabilities in the financial statements, disclosure of contingent assets and liabilities at the date of the financial statements and the reported amounts of increases and decreases in net assets from operations during the reporting period. Actual results could differ from those estimates. The Master Portfolio is considered an investment company under U.S. GAAP and follows the accounting and reporting guidance applicable to investment companies. Below is a summary of significant accounting policies:
Investment Transactions and Income Recognition:For financial reporting purposes, investment transactions are recorded on the dates the transactions are executed. Realized gains and losses on investment transactions are determined on the identified cost basis. Dividend income and non-cash dividend income are recorded on theex-dividend date. Dividends from foreign securities where theex-dividend date may have passed are subsequently recorded when the Master Portfolio is informed of theex-dividend date. Under the applicable foreign tax laws, a withholding tax at various rates may be imposed on capital gains, dividends and interest. Upon notification from issuers, a portion of the dividend income received from a real estate investment trust may be redesignated as a reduction of cost of the related investment and/or realized gain.
Foreign Currency Translation:The Master Portfolio’s books and records are maintained in U.S. dollars. Securities and other assets and liabilities denominated in foreign currencies are translated into U.S. dollars using exchange rates determined as of the close of trading on the New York Stock Exchange (“NYSE”). Purchases and sales of investments are recorded at the rates of exchange prevailing on the respective dates of such transactions. Generally, when the U.S. dollar rises in value against a foreign currency, the investments denominated in that currency will lose value; the opposite effect occurs if the U.S. dollar falls in relative value.
The Master Portfolio does not isolate the portion of the results of operations arising as a result of changes in the exchange rates from the changes in the market prices of investments held or sold for financial reporting purposes. Accordingly, the effects of changes in exchange rates on investments are not segregated in the Statement of Operations from the effects of changes in market prices of those investments, but are included as a component of net realized and unrealized gain (loss) from investments. The Master Portfolio reports realized currency gains (losses) on foreign currency related transactions as components of net realized gain (loss) for financial reporting purposes, whereas such components are generally treated as ordinary income for U.S. federal income tax purposes.
Segregation and Collateralization:In cases where the Master Portfolio enters into certain investments (e.g., futures contracts) that would be treated as “senior securities” for 1940 Act purposes, the Master Portfolio may segregate or designate on its books and records cash or liquid assets having a market value at least equal to the amount of its future obligations under such investments. Doing so allows the investment to be excluded from treatment as a “senior security.” Furthermore, if required by an exchange or counterparty agreement, the Master Portfolio may be required to deliver/deposit cash and/or securities to/with an exchange, or broker-dealer or custodian as collateral for certain investments or obligations.
Indemnifications:In the normal course of business, the Master Portfolio enters into contracts that contain a variety of representations that provide general indemnification. The Master Portfolio’s maximum exposure under these arrangements is unknown because it involves future potential claims against the Master Portfolio, which cannot be predicted with any certainty.
Other:Expenses directly related to the Master Portfolio are charged to the Master Portfolio. Other operating expenses shared by several funds, including other funds managed by the Manager, are prorated among those funds on the basis of relative net assets or other appropriate methods.
| 3. | INVESTMENT VALUATION AND FAIR VALUE MEASUREMENTS |
Investment Valuation Policies: The Master Portfolio’s investments are valued at fair value (also referred to as “market value” within the financial statements) as of the close of trading on the NYSE (generally 4:00 p.m., Eastern time). U.S. GAAP defines fair value as the price the Master Portfolio would receive to sell an asset or pay to transfer a liability in an orderly transaction between market participants at the measurement date. The Master Portfolio determines the fair values of its financial instruments using various independent dealers or pricing services under policies approved by the Board of Trustees of MIP (the “Board”). The BlackRock Global Valuation Methodologies Committee (the “Global Valuation Committee”) is the committee formed by management to develop global pricing policies and procedures and to oversee the pricing function for all financial instruments.
Fair Value Inputs and Methodologies: The following methods and inputs are used to establish the fair value of the Master Portfolio’s assets and liabilities:
| | • | | Equity investments traded on a recognized securities exchange are valued at the official closing price each day, if available. For equity investments traded on more than one exchange, the official closing price on the exchange where the stock is primarily traded is used. Equity investments traded on a recognized exchange for which there were no sales on that day may be valued at the last available bid (long positions) or ask (short positions) price. |
Generally, trading in foreign instruments is substantially completed each day at various times prior to the close of trading on the NYSE. Occasionally, events affecting the values of such instruments may occur between the foreign market close and the close of trading on the NYSE that may not be reflected in the
| | | | |
| NOTESTO FINANCIAL STATEMENTS | | | 43 | |
Notes to Financial Statements (continued)
| | computation of the Master Portfolio’s net assets. Each business day, the Master Portfolio uses a pricing service to assist with the valuation of certain foreign exchange-traded equity securities and foreign exchange-traded andover-the-counter (“OTC”) options (the “Systematic Fair Value Price”). Using current market factors, the Systematic Fair Value Price is designed to value such foreign securities and foreign options at fair value as of the close of trading on the NYSE, which follows the close of the local markets. |
| | • | | Investments inopen-end U.S. mutual funds are valued at net asset value (“NAV”) each business day. |
| | • | | Futures contracts traded on exchanges are valued at their last sale price. |
If events (e.g., a company announcement, market volatility or a natural disaster) occur that are expected to materially affect the value of such investments, or in the event that the application of these methods of valuation results in a price for an investment that is deemed not to be representative of the market value of such investment, or if a price is not available, the investment will be valued by the Global Valuation Committee, or its delegate, in accordance with a policy approved by the Board as reflecting fair value (“Fair Valued Investments”). The fair valuation approaches that may be used by the Global Valuation Committee will include market approach, income approach and cost approach. Valuation techniques such as discounted cash flow, use of market comparables and matrix pricing are types of valuation approaches and are typically used in determining fair value. When determining the price for Fair Valued Investments, the Global Valuation Committee, or its delegate, seeks to determine the price that the Master Portfolio might reasonably expect to receive or pay from the current sale or purchase of that asset or liability in anarm’s-length transaction. Fair value determinations shall be based upon all available factors that the Global Valuation Committee, or its delegate, deems relevant and consistent with the principles of fair value measurement. The pricing of all Fair Valued Investments is subsequently reported to the Board or a committee thereof on a quarterly basis.
For investments in equity or debt issued by privately held companies or funds (“Private Company” or collectively, the “Private Companies”) and other Fair Valued Investments, the fair valuation approaches that are used by the Global Valuation Committee and third party pricing services utilize one or a combination of, but not limited to, the following inputs.
| | |
| Standard Inputs Generally Considered By Third Party Pricing Services |
Market approach | | (i) recent market transactions, including subsequent rounds of financing, in the underlying investment or comparable issuers; (ii) recapitalizations and other transactions across the capital structure; and (iii) market multiples of comparable issuers. |
Income approach | | (i) future cash flows discounted to present and adjusted as appropriate for liquidity, credit, and/or market risks; (ii) quoted prices for similar investments or assets in active markets; and (iii) other risk factors, such as interest rates, yield curves, volatilities, prepayment speeds, loss severities, credit risks, recovery rates, liquidation amounts and/or default rates. |
Cost approach | | (i) audited or unaudited financial statements, investor communications and financial or operational metrics issued by the Private Company; (ii) changes in the valuation of relevant indices or publicly traded companies comparable to the Private Company; (iii) relevant news and other public sources; and (iv) known secondary market transactions in the Private Company’s interests and merger or acquisition activity in companies comparable to the Private Company. |
Investments in series of preferred stock issued by Private Companies are typically valued utilizing market approach in determining the enterprise value of the company. Such investments often contain rights and preferences that differ from other series of preferred and common stock of the same issuer. Valuation techniques such as an option pricing model (“OPM”), a probability weighted expected return model (“PWERM”) or a hybrid of those techniques are used in allocating enterprise value of the company, as deemed appropriate under the circumstances. The use of OPM and PWERM techniques involve a determination of the exit scenarios of the investment in order to appropriately allocate the enterprise value of the company among the various parts of its capital structure.
The Private Companies are not subject to the public company disclosure, timing, and reporting standards as other investments held by the Master Portfolio. Typically, the most recently available information by a Private Company is as of a date that is earlier than the date the Master Portfolio is calculating its NAV. This factor may result in a difference between the value of the investment and the price the Master Portfolio could receive upon the sale of the investment.
Fair Value Hierarchy: Various inputs are used in determining the fair value of investments and derivative financial instruments. These inputs to valuation techniques are categorized into a fair value hierarchy consisting of three broad levels for financial statement purposes as follows:
| | • | | Level 1 — Unadjusted price quotations in active markets/exchanges for identical assets or liabilities that the Master Portfolio has the ability to access |
| | • | | Level 2 — Other observable inputs (including, but not limited to, quoted prices for similar assets or liabilities in markets that are active, quoted prices for identical or similar assets or liabilities in markets that are not active, inputs other than quoted prices that are observable for the assets or liabilities (such as interest rates, yield curves, volatilities, prepayment speeds, loss severities, credit risks and default rates) or other market–corroborated inputs) |
| | • | | Level 3 — Unobservable inputs based on the best information available in the circumstances, to the extent observable inputs are not available (including the Global Valuation Committee’s assumptions used in determining the fair value of investments and derivative financial instruments) |
The hierarchy gives the highest priority to unadjusted quoted prices in active markets for identical assets or liabilities (Level 1 measurements) and the lowest priority to unobservable inputs (Level 3 measurements). Accordingly, the degree of judgment exercised in determining fair value is greatest for instruments categorized in Level 3. The inputs used to measure fair value may fall into different levels of the fair value hierarchy. In such cases, for disclosure purposes, the fair value hierarchy classification is determined based on the lowest level input that is significant to the fair value measurement in its entirety. Investments classified within Level 3 have significant unobservable inputs used by the Global Valuation Committee in determining the price for Fair Valued Investments. Level 3 investments include equity or debt issued by
| | |
| 44 | | 2019 BLACKROCK ANNUAL REPORTTO SHAREHOLDERS |
Notes to Financial Statements (continued)
Private Companies. There may not be a secondary market, and/or there are a limited number of investors. The categorization of a value determined for investments and derivative financial instruments is based on the pricing transparency of the investments and derivative financial instruments and is not necessarily an indication of the risks associated with investing in those securities.
| 4. | SECURITIES AND OTHER INVESTMENTS |
Preferred Stocks: Preferred stock has a preference over common stock in liquidation (and generally in receiving dividends as well), but is subordinated to the liabilities of the issuer in all respects. As a general rule, the market value of preferred stock with a fixed dividend rate and no conversion element varies inversely with interest rates and perceived credit risk, while the market price of convertible preferred stock generally also reflects some element of conversion value. Because preferred stock is junior to debt securities and other obligations of the issuer, deterioration in the credit quality of the issuer will cause greater changes in the value of a preferred stock than in a more senior debt security with similar stated yield characteristics. Unlike interest payments on debt securities, preferred stock dividends are payable only if declared by the issuer’s board of directors. Preferred stock also may be subject to optional or mandatory redemption provisions.
Warrants:Warrants entitle a fund to purchase a specified number of shares of common stock and are non-income producing. The purchase price and number of shares are subject to adjustment under certain conditions until the expiration date of the warrants, if any. If the price of the underlying stock does not rise above the strike price before the warrant expires, the warrant generally expires without any value and a fund will lose any amount it paid for the warrant. Thus, investments in warrants may involve more risk than investments in common stock. Warrants may trade in the same markets as their underlying stock; however, the price of the warrant does not necessarily move with the price of the underlying stock.
Securities Lending: The Master Portfolio may lend its securities to approved borrowers, such as brokers, dealers and other financial institutions. The borrower pledges and maintains with the Master Portfolio collateral consisting of cash, an irrevocable letter of credit issued by a bank, or securities issued or guaranteed by the U.S. Government. The initial collateral received by the Master Portfolio is required to have a value of at least 102% of the current value of the loaned securities for securities traded on U.S. exchanges and a value of at least 105% for all other securities. The collateral is maintained thereafter at a value equal to at least 100% of the current market value of the securities on loan. The market value of the loaned securities is determined at the close of each business day of the Master Portfolio and any additional required collateral is delivered to the Master Portfolio, or excess collateral returned by the Master Portfolio, on the next business day. During the term of the loan, the Master Portfolio is entitled to all distributions made on or in respect of the loaned securities, but does not receive interest income on securities received as collateral. Loans of securities are terminable at any time and the borrower, after notice, is required to return borrowed securities within the standard time period for settlement of securities transactions.
The market value of any securities on loan, all of which were classified as common stocks in the Master Portfolio’s Schedule of Investments, and the value of any related collateral are shown separately in the Statement of Assets and Liabilities as a component of investments at value – unaffiliated, and collateral on securities loaned at value, respectively. As of period end, any securities on loan were collateralized by cash and/or U.S. Government obligations. Cash collateral invested by the securities lending agent, BlackRock Institutional Trust Company, N.A. (“BTC”), if any, is disclosed in the Schedule of Investments.
Securities lending transactions are entered into by the Master Portfolio under Master Securities Lending Agreements (each, an “MSLA”), which provide the right, in the event of default (including bankruptcy or insolvency), for thenon-defaulting party to liquidate the collateral and calculate a net exposure to the defaulting party or request additional collateral. In the event that a borrower defaults, the Master Portfolio, as lender, would offset the market value of the collateral received against the market value of the securities loaned. When the value of the collateral is greater than that of the market value of the securities loaned, the lender is left with a net amount payable to the defaulting party. However, bankruptcy or insolvency laws of a particular jurisdiction may impose restrictions on or prohibitions against such a right of offset in the event of an MSLA counterparty’s bankruptcy or insolvency. Under the MSLA, absent an event of default, the borrower can resell orre-pledge the loaned securities, and the Master Portfolio can reinvest cash collateral received in connection with loaned securities. Upon an event of default, the parties’ obligations to return the securities or collateral to the other party are extinguished, and the parties can resell orre-pledge the loaned securities or the collateral received in connection with the loaned securities in order to satisfy the defaulting party’s net payment obligation for all transactions under the MSLA. The defaulting party remains liable for any deficiency.
As of period end, the following table is a summary of the Master Portfolio’s securities lending agreements by counterparty which are subject to offset under an MSLA:
| | | | | | | | | | | | |
| Counterparty | | Securities Loaned at Value | | | Cash Collateral Received (a) | | | Net Amount (b) | |
Barclays Capital INC. | | $ | 382,940 | | | $ | (382,940 | ) | | $ | — | |
BNP Paribas Prime Brokerage International Limited | | | 137,827 | | | | (137,827 | ) | | | — | |
Citigroup Global Markets INC. | | | 1,968,140 | | | | (1,968,140 | ) | |
| —
|
|
Credit Suisse Securities (USA) LLC | | | 880,308 | | | | (572,343 | ) | | | 307,965 | |
Goldman Sachs & Co. | | | 1,680,828 | | | | (1,680,828 | ) | | | — | |
Jefferies LLC | | | 110,418 | | | | (110,418 | ) | | | — | |
JP Morgan Securities LLC | | | 994,902 | | | | (994,902 | ) | | | — | |
Morgan Stanley & Co LLC | | | 8,253,044 | | | | (8,253,044 | ) | | | — | |
Morgan Stanley & Co. International PLC | | | 61,320 | | | | (61,320 | ) | | | — | |
Morgan Stanley & Co. LLC (US Equity Sec Lending) | | | 89,590 | | | | (89,590 | ) | | | — | |
National Financial Services LLC | | | 150,672 | | | | (150,672 | ) | | | — | |
SG Americas Securities LLC | | | 369,054 | | | | (369,054 | ) | | | — | |
State Street Bank & Trust Company | | | 96,360 | | | | (96,360 | ) | | | — | |
TD Prime Services LLC | | | 25,470 | | | | (25,470 | ) | |
| —
|
|
UBS AG | | | 56,941 | | | | (56,941 | ) | |
| —
|
|
Wells Fargo Bank, National Association | | | 765,188 | | | | (765,188 | ) | |
| —
|
|
| | | | | | | | | | | | |
| | $ | 16,023,002 | | | $ | (15,715,037 | ) | | $ | 307,965 | |
| | | | | | | | | | | | |
| | | | |
| NOTESTO FINANCIAL STATEMENTS | | | 45 | |
Notes to Financial Statements (continued)
| | (a) | Collateral received in excess of the market value of securities on loan is not presented in this table. The total cash collateral received by the Master Portfolio is disclosed in the Master Portfolio’s Statement of Assets and Liabilities. | |
| | (b) | The market value of the loaned securities is determined as of December 31, 2019. Additional collateral is delivered to the Master Portfolio on the next business day in accordance with the MSLA. The net amount would be subject to the borrower default indemnity in the event of default by the counterparty. | |
The risks of securities lending include the risk that the borrower may not provide additional collateral when required or may not return the securities when due. To mitigate these risks, the Master Portfolio benefits from a borrower default indemnity provided by BlackRock, Inc. (“BlackRock”). BlackRock’s indemnity allows for full replacement of the securities loaned to the extent the collateral received does not cover the value on the securities loaned in the event of borrower default. The Master Portfolio could incur a loss if the value of an investment purchased with cash collateral falls below the market value of loaned securities or if the value of an investment purchased with cash collateral falls below the value of the original cash collateral received. Such losses are borne entirely by the Master Portfolio.
| 5. | DERIVATIVE FINANCIAL INSTRUMENTS |
The Master Portfolio engages in various portfolio investment strategies using derivative contracts both to increase the returns of the Master Portfolio and/or to manage its exposure to certain risks such as credit risk, equity risk, interest rate risk, foreign currency exchange rate risk, commodity price risk or other risks (e.g., inflation risk). Derivative financial instruments categorized by risk exposure are included in the Schedule of Investments. These contracts may be transacted on an exchange or OTC.
Futures Contracts:Futures contracts are purchased or sold to gain exposure to, or manage exposure to, changes in interest rates (interest rate risk) and changes in the value of equity securities (equity risk) or foreign currencies (foreign currency exchange rate risk).
Futures contracts are agreements between the Master Portfolio and a counterparty to buy or sell a specific quantity of an underlying instrument at a specified price and on a specified date. Depending on the terms of a contract, it is settled either through physical delivery of the underlying instrument on the settlement date or by payment of a cash amount on the settlement date. Upon entering into a futures contract, the Master Portfolio is required to deposit initial margin with the broker in the form of cash or securities in an amount that varies depending on a contract’s size and risk profile. The initial margin deposit must then be maintained at an established level over the life of the contract. Amounts pledged, which are considered restricted, are included in cash pledged for futures contracts in the Statement of Assets and Liabilities.
Securities deposited as initial margin are designated in the Schedule of Investments and cash deposited, if any, are shown as cash pledged for futures contracts in the Statement of Assets and Liabilities. Pursuant to the contract, the Master Portfolio agrees to receive from or pay to the broker an amount of cash equal to the daily fluctuation in market value of the contract (“variation margin”). Variation margin is recorded as unrealized appreciation (depreciation) and, if any, shown as variation margin receivable (or payable) on futures contracts in the Statement of Assets and Liabilities. When the contract is closed, a realized gain or loss is recorded in the Statement of Operations equal to the difference between the notional amount of the contract at the time it was opened and the notional amount at the time it was closed. The use of futures contracts involves the risk of an imperfect correlation in the movements in the price of futures contracts and interest, foreign currency exchange rates or underlying assets.
| 6. | INVESTMENT ADVISORY AGREEMENT AND OTHER TRANSACTIONS WITH AFFILIATES |
Investment Advisory: MIP, on behalf of the Master Portfolio, entered into an Investment Advisory Agreement with the Manager, the Master Portfolio’s investment adviser and an indirect, wholly-owned subsidiary of BlackRock, to provide investment advisory services. The Manager is responsible for the management of the Master Portfolio’s portfolio and provides the personnel, facilities, equipment and certain other services necessary to the operations of the Master Portfolio.
For such services, the Master Portfolio pays the Manager a monthly fee at an annual rate equal to 0.03% of the average daily value of the Master Portfolio’s net assets.
BAL is not entitled to compensation for providing administrative services to the Master Portfolio, for so long as BAL (or an affiliate) is entitled to compensation for providing administrative services to corresponding feeder funds that invest substantially all of their assets in the Master Portfolio, or BAL (or an affiliate) receives investment advisory fees from the Master Portfolio.
Expense Limitations, Waivers, Reimbursements and Recoupments: With respect to the Master Portfolio, the Manager voluntarily agreed to waive its investment advisory fees by the amount of investment advisory fees the Master Portfolio pays to the Manager indirectly through its investment in affiliated money market funds (the “affiliated money market fund waiver”). The amount of waivers and/or reimbursements of fees and expenses made pursuant to the expense limitation described below will be reduced by the amount of the affiliated money market fund waiver. This amount is included in fees waived and/or reimbursed by the Manager in the Statement of Operations. For the year ended December 31, 2019, the amount waived and/or reimbursed was $4,972.
The Manager has contractually agreed to waive its investment advisory fee with respect to any portion of the Master Portfolio’s assets invested in affiliated equity and fixed-income mutual funds and affiliated exchange-traded funds that have a contractual management fee through April 30, 2020. The contractual agreement may be terminated upon 90 days’ notice by a majority of the Independent Trustees, or by a vote of a majority of the outstanding voting securities of the Master Portfolio. For the year ended December 31, 2019, there were no fees waived and/or reimbursed by the Manager pursuant to this arrangement.
Securities Lending: The SEC has issued an exemptive order which permits BTC, an affiliate of the Manager, to serve as securities lending agent for the Master Portfolio, subject to applicable conditions. As securities lending agent, BTC bears all operational costs directly related to securities lending. The Master Portfolio is responsible for fees in connection with the investment of cash collateral received for securities on loan (the “collateral investment fees”). The cash collateral is invested in a money market fund managed by the Manager or its affiliates. However, BTC has agreed to reduce the amount of securities lending income it receives in order to effectively limit the collateral investment fees the Master Portfolio bears to an annual rate of 0.04%. The shares of such money market fund will not be subject to a sales load, distribution fee or service fee. The money market fund in which the cash collateral has been invested may, under certain circumstances, impose a liquidity fee of up to 2% of the value redeemed or temporarily restrict redemptions for up to 10 business days during a90-day period, in the event that the money market fund’s weekly liquid assets fall below certain thresholds.
| | |
| 46 | | 2019 BLACKROCK ANNUAL REPORTTO SHAREHOLDERS |
Notes to Financial Statements (continued)
Securities lending income is equal to the total of income earned from the reinvestment of cash collateral, net of fees and other payments to and from borrowers of securities, and less the collateral investment fees. The Master Portfolio retains a portion of securities lending income and remits a remaining portion to BTC as compensation for its services as securities lending agent.
Pursuant to the current securities lending agreement, the Master Portfolio retains 82% of securities lending income (which excludes collateral investment fees), and this amount retained can never be less than 70% of the total of securities lending income plus the collateral investment fees.
In addition, commencing the business day following the date that the aggregate securities lending income earned across the BlackRock Multi-Asset Complex in a calendar year exceeds a specified threshold, the Master Portfolio, pursuant to the securities lending agreement, will retain for the remainder of that calendar year securities lending income in an amount equal to 85% of securities lending income (which excludes collateral investment fees), and this amount retained can never be less than 70% of the total of securities lending income plus the collateral investment fees.
The share of securities lending income earned by the Master Portfolio is shown as securities lending income — affiliated — net in the Statement of Operations. For the year ended December 31, 2019, the Master Portfolio paid BTC $58,631 for securities lending agent services.
Interfund Lending: In accordance with an exemptive order (the “Order”) from the SEC, the Master Portfolio may participate in a joint lending and borrowing facility for temporary purposes (the “Interfund Lending Program”), subject to compliance with the terms and conditions of the Order, and to the extent permitted by the Master Portfolio’s investment policies and restrictions. The Master Portfolio is currently permitted to borrow and lend under the Interfund Lending Program.
A lending BlackRock fund may lend in aggregate up to 15% of its net assets, but may not lend more than 5% of its net assets to any one borrowing fund through the Interfund Lending Program. A borrowing BlackRock fund may not borrow through the Interfund Lending Program or from any other source more than 331⁄3% of its total assets (or any lower threshold provided for by the fund’s investment restrictions). If a borrowing BlackRock fund’s total outstanding borrowings exceed 10% of its total assets, each of its outstanding interfund loans will be subject to collateralization of at least 102% of the outstanding principal value of the loan. All interfund loans are for temporary or emergency purposes and the interest rate to be charged will be the average of the highest current overnight repurchase agreement rate available to a lending fund and the bank loan rate, as calculated according to a formula established by the Board.
During the year ended December 31, 2019, the Master Portfolio did not participate in the Interfund Lending Program.
Trustees and Officers: Certain trustees and/or officers of MIP are directors and/or officers of BlackRock or its affiliates.
Other Transactions: The Master Portfolio may purchase securities from, or sell securities to, an affiliated fund provided the affiliation is due solely to having a common investment adviser, common officers, or common trustees. For the year ended December 31, 2019, the purchase and sale transactions and any net realized gains (losses) with affiliated funds in compliance with Rule17a-7 under the 1940 Act were as follows:
| | | | | | | | | | | | | | |
| Purchases | | | | | Sales | | | | | Net Realized Gain (Loss) | |
| $ | 8,747,849 | | | | | $ | 2,745,081 | | | | | $ | (246,438 | ) |
For the year ended December 31, 2019, purchases and sales of investments, excluding short-term securities, were $226,166,288 and $41,275,023, respectively.
The Master Portfolio is classified as a partnership for U.S. federal income tax purposes. As such, each investor in the Master Portfolio is treated as the owner of its proportionate share of net assets, income, expenses and realized and unrealized gains and losses of the Master Portfolio. Therefore, no U.S. federal income tax provision is required. It is intended that the Master Portfolio’s assets will be managed so an investor in the Master Portfolio can satisfy the requirements of Subchapter M of the Internal Revenue Code of 1986, as amended.
The Master Portfolio files U.S. federal and various state and local tax returns. No income tax returns are currently under examination. The statute of limitations on the Master Portfolio’s U.S. federal tax returns generally remains open for each of the four years ended December 31, 2019. The statutes of limitations on the Master Portfolio’s state and local tax returns may remain open for an additional year depending upon the jurisdiction.
Management has analyzed tax laws and regulations and their application to the Master Portfolio as of December 31, 2019, inclusive of the open tax return years, and does not believe that there are any uncertain tax positions that require recognition of a tax liability in the Master Portfolio’s financial statements.
As of December 31, 2019, gross unrealized appreciation and depreciation for investments and derivatives based on cost for U.S. federal income tax purposes were as follows:
| | | | |
Tax cost | | $ | 903,907,220 | |
| | | | |
Gross unrealized appreciation | | $ | 271,635,951 | |
Gross unrealized depreciation | | | (64,870,591 | ) |
| | | | |
Net unrealized appreciation | | $ | 206,765,360 | |
| | | | |
| | | | |
| NOTESTO FINANCIAL STATEMENTS | | | 47 | |
Notes to Financial Statements (continued)
MIP, on behalf of the Master Portfolio, along with certain other funds managed by the Manager and its affiliates (“Participating Funds”), is a party to a364-day, $2.25 billion credit agreement with a group of lenders. Under this agreement, the Master Portfolio may borrow to fund shareholder redemptions. Excluding commitments designated for certain individual funds, the Participating Funds, including the Master Portfolio, can borrow up to an aggregate commitment amount of $1.75 billion at any time outstanding, subject to asset coverage and other limitations as specified in the agreement. The credit agreement has the following terms: a fee of 0.10% per annum on unused commitment amounts and interest at a rate equal to the higher of(a) one-month LIBOR (but, in any event, not less than 0.00%) on the date the loan is made plus 0.80% per annum or (b) the Fed Funds rate (but, in any event, not less than 0.00%) in effect from time to time plus 0.80% per annum on amounts borrowed. The agreement expires in April 2020 unless extended or renewed. Prior to April 18, 2019, Participating Funds paid an upfront commitment fee of 0.02% on the total commitment amounts, in addition to administration, legal and arrangement fees, which are included in miscellaneous expenses in the Statement of Operations. These fees were allocated among such funds based upon portions of the aggregate commitment available to them and relative net assets of Participating Funds. During the year ended December 31, 2019, the Master Portfolio did not borrow under the credit agreement.
In the normal course of business, the Master Portfolio invests in securities or other instruments and may enter into certain transactions, and such activities subject the Master Portfolio to various risks, including among others, fluctuations in the market (market risk) or failure of an issuer to meet all of its obligations. The value of securities or other instruments may also be affected by various factors, including, without limitation: (i) the general economy; (ii) the overall market as well as local, regional or global political and/or social instability; (iii) regulation, taxation or international tax treaties between various countries; or (iv) currency, interest rate and price fluctuations. The Master Portfolio’s prospectus provides details of the risks to which the Master Portfolio is subject.
The Master Portfolio may be exposed to additional risks when reinvesting cash collateral in money market funds that do not seek to maintain a stable NAV per share of $1.00, which may be subject to redemption gates or liquidity fees under certain circumstances.
Valuation Risk:The market values of equities, such as common stocks and preferred securities or equity related investments, such as futures and options, may decline due to general market conditions which are not specifically related to a particular company. They may also decline due to factors which affect a particular industry or industries. The Master Portfolio may invest in illiquid investments. An illiquid investment is any investment that the Master Portfolio reasonably expects cannot be sold or disposed of in current market conditions in seven calendar days or less without the sale or disposition significantly changing the market value of the investment. The Master Portfolio may experience difficulty in selling illiquid investments in a timely manner at the price that it believes the investments are worth. Prices may fluctuate widely over short or extended periods in response to company, market or economic news. Markets also tend to move in cycles, with periods of rising and falling prices. This volatility may cause the Master Portfolio’s NAV to experience significant increases or decreases over short periods of time. If there is a general decline in the securities and other markets, the NAV of the Master Portfolio may lose value, regardless of the individual results of the securities and other instruments in which the Master Portfolio invests.
The price the Master Portfolio could receive upon the sale of any particular portfolio investment may differ from the Master Portfolio’s valuation of the investment, particularly for securities that trade in thin or volatile markets or that are valued using a fair valuation technique or a price provided by an independent pricing service. Changes to significant unobservable inputs and assumptions (i.e., publicly traded company multiples, growth rate, time to exit) due to the lack of observable inputs may significantly impact the resulting fair value and therefore the Master Portfolio’s results of operations. As a result, the price received upon the sale of an investment may be less than the value ascribed by the Master Portfolio, and the Master Portfolio could realize a greater than expected loss or lesser than expected gain upon the sale of the investment. The Master Portfolio’s ability to value its investments may also be impacted by technological issues and/or errors by pricing services or other third party service providers.
Counterparty Credit Risk:The Master Portfolio may be exposed to counterparty credit risk, or the risk that an entity may fail to or be unable to perform on its commitments related to unsettled or open transactions. The Master Portfolio manages counterparty credit risk by entering into transactions only with counterparties that the Manager believes have the financial resources to honor their obligations and by monitoring the financial stability of those counterparties. Financial assets, which potentially expose the Master Portfolio to market, issuer and counterparty credit risks, consist principally of financial instruments and receivables due from counterparties. The extent of the Master Portfolio’s exposure to market, issuer and counterparty credit risks with respect to these financial assets is approximately their value recorded in the Statement of Assets and Liabilities, less any collateral held by the Master Portfolio.
A derivative contract may suffer amark-to-market loss if the value of the contract decreases due to an unfavorable change in the market rates or values of the underlying instrument. Losses can also occur if the counterparty does not perform under the contract.
With exchange-traded futures, there is less counterparty credit risk to the Master Portfolio since the exchange or clearinghouse, as counterparty to such instruments, guarantees against a possible default. The clearinghouse stands between the buyer and the seller of the contract; therefore, credit risk is limited to failure of the clearinghouse. While offset rights may exist under applicable law, the Master Portfolio does not have a contractual right of offset against a clearing broker or clearinghouse in the event of a default (including the bankruptcy or insolvency). Additionally, credit risk exists in exchange-traded futures with respect to initial and variation margin that is held in a clearing broker’s customer accounts. While clearing brokers are required to segregate customer margin from their own assets, in the event that a clearing broker becomes insolvent or goes into bankruptcy and at that time there is a shortfall in the aggregate amount of margin held by the clearing broker for all its clients, typically the shortfall would be allocated on a pro rata basis across all the clearing broker’s customers, potentially resulting in losses to the Master Portfolio.
Concentration Risk:The Master Portfolio invests a significant portion of its assets in securities of issuers located in Europe or with significant exposure to European issuers or countries. The European financial markets have recently experienced volatility and adverse trends due to concerns about economic downturns in, or rising government debt levels of, several European countries. These events may spread to other countries in Europe and may affect the value and liquidity of certain of the Master Portfolio’s investments.
| | |
| 48 | | 2019 BLACKROCK ANNUAL REPORTTO SHAREHOLDERS |
Notes to Financial Statements (continued)
Responses to the financial problems by European governments, central banks and others, including austerity measures and reforms, may not work, may result in social unrest and may limit future growth and economic recovery or have other unintended consequences. Further defaults or restructurings by governments and others of their debt could have additional adverse effects on economies, financial markets and asset valuations around the world. In addition, the United Kingdom has voted to withdraw from the European Union, and one or more other countries may withdraw from the European Union and/or abandon the Euro, the common currency of the European Union. The impact of these actions, especially if they occur in a disorderly fashion, is not clear but could be significant and far reaching.
The Master Portfolio invests a significant portion of its assets in securities of issuers located in Asia or with significant exposure to Asian issuers or countries. The Asian financial markets have recently experienced volatility and adverse trends due to concerns in several Asian countries regarding monetary policy, government intervention in the markets, rising government debt levels or economic downturns. These events may spread to other countries in Asia and may affect the value and liquidity of certain of the Master Portfolio’s investments.
Management has evaluated the impact of all subsequent events on the Master Portfolio through the date the financial statements were issued and has determined that there were no subsequent events requiring adjustment or additional disclosure in the financial statements.
| | | | |
| NOTESTO FINANCIAL STATEMENTS | | | 49 | |
| | |
| Report of Independent Registered Public Accounting Firm | | Total International ex U.S. Index Master Portfolio |
To the Board of Trustees of
Master Investment Portfolio and Investors of Total International ex U.S. Index Master Portfolio
Opinion on the Financial Statements
We have audited the accompanying statement of assets and liabilities, including the schedule of investments, of Total International ex U.S. Index Master Portfolio (one of the series constituting Master Investment Portfolio, referred to hereafter as the “Master Portfolio”) as of December 31, 2019, the related statement of operations for the year ended December 31, 2019, the statements of changes in net assets for each of the two years in the period ended December 31, 2019, including the related notes, and the financial highlights for each of the five years in the period ended December 31, 2019 (collectively referred to as the “financial statements”). In our opinion, the financial statements present fairly, in all material respects, the financial position of the Master Portfolio as of December 31, 2019, the results of its operations for the year then ended, the changes in its net assets for each of the two years in the period ended December 31, 2019 and the financial highlights for each of the five years in the period ended December 31, 2019 in conformity with accounting principles generally accepted in the United States of America.
Basis for Opinion
These financial statements are the responsibility of the Master Portfolio’s management. Our responsibility is to express an opinion on the Master Portfolio’s financial statements based on our audits. We are a public accounting firm registered with the Public Company Accounting Oversight Board (United States) (“PCAOB”) and are required to be independent with respect to the Master Portfolio in accordance with the U.S. federal securities laws and the applicable rules and regulations of the Securities and Exchange Commission and the PCAOB.
We conducted our audits of these financial statements in accordance with the standards of the PCAOB. Those standards require that we plan and perform the audit to obtain reasonable assurance about whether the financial statements are free of material misstatement, whether due to error or fraud.
Our audits included performing procedures to assess the risks of material misstatement of the financial statements, whether due to error or fraud, and performing procedures that respond to those risks. Such procedures included examining, on a test basis, evidence regarding the amounts and disclosures in the financial statements. Our audits also included evaluating the accounting principles used and significant estimates made by management, as well as evaluating the overall presentation of the financial statements. Our procedures included confirmation of securities owned as of December 31, 2019 by correspondence with the custodian, transfer agent and brokers; when replies were not received from brokers, we performed other auditing procedures. We believe that our audits provide a reasonable basis for our opinion.
/s/PricewaterhouseCoopers LLP
Philadelphia, Pennsylvania
February 27, 2020
We have served as the auditor of one or more BlackRock investment companies since 2000.
| | |
| 50 | | 2019 BLACKROCK ANNUAL REPORTTO SHAREHOLDERS |
Statement Regarding Liquidity Risk Management Program
The Securities and Exchange Commission adopted Rule 22e-4 under the Investment Company Act of 1940, as amended (the “Liquidity Rule”) to promote effective liquidity risk management throughout the open-end investment company industry, thereby reducing the risk that funds will be unable to meet their redemption obligations and mitigating dilution of the interests of fund shareholders.
The Board of Trustees (the “Board”) of BlackRock Funds III and MIP, on behalf of iShares MSCI Total International Index Fund and Total International ex U.S. Index Master Portfolio, respectively, met on November 12-13, 2019 (the “Meeting”) to review the liquidity risk management program (the “Program”) applicable to the BlackRock open-end funds, excluding money market funds (each, a “Fund”), pursuant to the Liquidity Rule. The Board has appointed BlackRock Advisors, LLC or BlackRock Fund Advisors (“BlackRock”), each an investment adviser to certain Funds, as the program administrator for each Fund’s Program, as applicable. BlackRock has delegated oversight of the Program to the 40 Act Liquidity Risk Management Committee (the “Committee”). At the Meeting, the Committee, on behalf of BlackRock, provided the Board with a report that addressed the operation of the Program and assessed its adequacy and effectiveness of implementation, including the operation of each Fund’s Highly Liquid Investment Minimum (“HLIM”) where applicable, and any material changes to the Program (the “Report”). The Report covered the period from December 1, 2018 through September 30, 2019 (the “Program Reporting Period”).
The Report described the Program’s liquidity classification methodology for categorizing a Fund’s investments (including derivative transactions) into one of four liquidity buckets. It also described BlackRock’s methodology in establishing a Fund’s HLIM and noted that the Committee reviews and ratifies the HLIM assigned to each Fund no less frequently than annually.
The Report noted that the Program complied with the key factors for consideration under the Liquidity Rule for assessing, managing and periodically reviewing a Fund’s liquidity risk, as follows:
A. The Fund’s investment strategy and liquidity of portfolio investments during both normal and reasonably foreseeable stressed conditions: During the Program Reporting Period, the Committee reviewed whether each Fund’s strategy is appropriate for an open-end fund structure with a focus on Funds with more significant and consistent holdings of less liquid and illiquid assets. The Committee also factored a Fund’s concentration in an issuer into the liquidity classification methodology by taking issuer position sizes into account. Where a Fund participated in borrowings for investment purposes (such as tender option bonds and reverse repurchase agreements), such borrowings were factored into the Program’s calculation of a Fund’s liquidity bucketing. Derivative exposure was also considered in such calculation.
B. Short-term and long-term cash flow projections during both normal and reasonably foreseeable stressed conditions: During the Program Reporting Period, the Committee reviewed historical net redemption activity and used this information as a component to establish each Fund’s reasonably anticipated trading size (“RATS”). Each Fund has adopted an in-kind redemption policy which may be utilized to meet larger redemption requests. The Committee may also take into consideration a Fund’s shareholder ownership concentration (which, depending on product type and distribution channel, may or may not be available), a Fund’s distribution channels, and the degree of certainty associated with a Fund’s short-term and long-term cash flow projections.
C. Holdings of cash and cash equivalents, as well as borrowing arrangements: The Committee considered the terms of the credit facility applicable to the Funds, the financial health of the institution providing the facility and the fact that the credit facility is shared among multiple Funds (including that a portion of the aggregate commitment amount is specifically designated for BlackRock Floating Rate Income Portfolio and BlackRock Credit Strategies Income Fund, each a series of BlackRock Funds V). The Committee also considered other types of borrowing available to the Funds, such as the ability to use reverse repurchase agreements and interfund lending, as applicable.
There were no material changes to the Program during the Program Reporting Period. The Report provided to the Board stated that the Committee concluded that based on the operation of the functions, as described in the Report, the Program is operating as intended and is effective in implementing the requirements of the Liquidity Rule.
| | | | |
| STATEMENT REGARDING LIQUIDITY RISK MANAGEMENT PROGRAM | | | 51 | |
Trustee and Officer Information
| | | | | | | | |
| Independent Trustees (a) |
| | | | | |
Name
Year of Birth (b) | | Position(s) Held
(Length of Service) (c) | | Principal Occupation(s) During Past Five Years | | Number of BlackRock-Advised
Registered Investment Companies
(“RICs”) Consisting of
Investment Portfolios
(“Portfolios”) Overseen | | Public Company and
Other Investment Company
Directorships Held During
Past Five Years |
Mark Stalnecker 1951 | | Chair of the Board (Since 2019) and Trustee (Since 2015) | | Chief Investment Officer, University of Delaware from 1999 to 2013; Trustee and Chair of the Finance and Investment Committees, Winterthur Museum and Country Estate from 2005 to 2016; Member of the Investment Committee, Delaware Public Employees’ Retirement System since 2002; Member of the Investment Committee, Christiana Care Health System from 2009 to 2017; Member of the Investment Committee, Delaware Community Foundation from 2013 to 2014; Director and Chair of the Audit Committee, SEI Private Trust Co. from 2001 to 2014. | | 37 RICs consisting of 177 Portfolios | | None |
Bruce R. Bond 1946 | | Trustee (Since 2019) | | Board Member, Amsphere Limited (software) since 2018; Trustee and Member of the Governance Committee, State Street Research Mutual Funds from 1997 to 2005; Board Member of Governance, Audit and Finance Committee, Avaya Inc. (computer equipment) from 2003 to 2007. | | 37 RICs consisting of 177 Portfolios | | None |
Susan J. Carter 1956 | | Trustee (Since 2016) | | Director, Pacific Pension Institute from 2014 to 2018; Advisory Board Member, Center for Private Equity and Entrepreneurship at Tuck School of Business since 1997; Senior Advisor, Commonfund Capital, Inc. (“CCI”) (investment adviser) in 2015; Chief Executive Officer, CCI from 2013 to 2014; President & Chief Executive Officer, CCI from 1997 to 2013; Advisory Board Member, Girls Who Invest from 2015 to 2018 and Board Member thereof since 2018; Advisory Board Member, Bridges Fund Management since 2016; Trustee, Financial Accounting Foundation since 2017; Practitioner Advisory Board Member, Private Capital Research Institute (“PCRI”) since 2017. | | 37 RICs consisting of 177 Portfolios | | None |
Collette Chilton 1958 | | Trustee (Since 2015) | | Chief Investment Officer, Williams College since 2006; Chief Investment Officer, Lucent Asset Management Corporation from 1998 to 2006. | | 37 RICs consisting of 177 Portfolios | | None |
Neil A. Cotty 1954 | | Trustee (Since 2016) | | Bank of America Corporation from 1996 to 2015, serving in various senior finance leadership roles, including Chief Accounting Officer from 2009 to 2015, Chief Financial Officer of Global Banking, Markets and Wealth Management from 2008 to 2009, Chief Accounting Officer from 2004 to 2008, Chief Financial Officer of Consumer Bank from 2003 to 2004, Chief Financial Officer of Global Corporate Investment Bank from 1999 to 2002. | | 37 RICs consisting of 177 Portfolios | | None |
Lena G. Goldberg 1949 | | Trustee (Since 2019) | | Senior Lecturer, Harvard Business School, since 2008; Director, Charles Stark Draper Laboratory, Inc. since 2013; FMR LLC/Fidelity Investments (financial services) from 1996 to 2008, serving in various senior roles including Executive Vice President — Strategic Corporate Initiatives and Executive Vice President and General Counsel; Partner, Sullivan & Worcester LLP from 1985 to 1996 and Associate thereof from 1979 to 1985. | | 37 RICs consisting of 177 Portfolios | | None |
Robert M. Hernandez 1944 | | Trustee (Since 2019) | | Director, Vice Chairman and Chief Financial Officer of USX Corporation (energy and steel business) from 1991 to 2001; Director andnon-executive Chairman, RTI International Metals, Inc. from 1990 to 2015; Director, TE Connectivity (electronics) from 2006 to 2012. | | 37 RICs consisting of 177 Portfolios | | Chubb Limited (insurance company); Eastman Chemical Company |
| | |
| 52 | | 2019 BLACKROCK ANNUAL REPORTTO SHAREHOLDERS |
Trustee and Officer Information (continued)
| | | | | | | | |
| Independent Trustees (a)(continued) |
| | | | | |
Name
Year of Birth (b) | | Position(s) Held
(Length of Service) (c) | | Principal Occupation(s) During Past Five Years | | Number of BlackRock-Advised
Registered Investment Companies
(“RICs”) Consisting of
Investment Portfolios
(“Portfolios”) Overseen | | Public Company and
Other Investment Company
Directorships Held During
Past Five Years |
Henry R. Keizer 1956 | | Trustee (Since 2019) | | Director, Park Indemnity Ltd. (captive insurer) since 2010; Director, MUFG Americas Holdings Corporation and MUFG Union Bank, N.A. (financial and bank holding company) from 2014 to 2016; Director, American Institute of Certified Public Accountants from 2009 to 2011; Director, KPMG LLP (audit, tax and advisory services) from 2004 to 2005 and 2010 to 2012; Director, KPMG International in 2012, Deputy Chairman and Chief Operating Officer thereof from 2010 to 2012 and U.S. Vice Chairman of Audit thereof from 2005 to 2010; Global Head of Audit, KPMGI (consortium of KPMG firms) from 2006 to 2010; Director, YMCA of Greater New York from 2006 to 2010. | | 37 RICs consisting of 177 Portfolios | | Hertz Global Holdings (car rental); Montpelier Re Holdings, Ltd. (publicly held property and casualty reinsurance) from 2013 until 2015; Sealed Air Corp. (packaging); WABCO (commercial vehicle safety systems) |
Cynthia A. Montgomery 1952 | | Trustee (Since 2009) | | Professor, Harvard Business School since 1989. | | 37 RICs consisting of 177 Portfolios | | Newell Rubbermaid, Inc. (manufacturing) |
Donald C. Opatrny 1952 | | Trustee (Since 2019) | | Trustee, Vice Chair, Member of the Executive Committee and Chair of the Investment Committee, Cornell University since 2004; President, Trustee and Member of the Investment Committee, The Aldrich Contemporary Art Museum from 2007 to 2014; Member of the Board and Investment Committee, University School from 2007 to 2018; Member of the Investment Committee, Mellon Foundation from 2009 to 2015; Trustee, Artstor (a Mellon Foundation affiliate) from 2010 to 2015; President and Trustee, the Center for the Arts, Jackson Hole from 2011 to 2018; Director, Athena Capital Advisors LLC (investment management firm) since 2013; Trustee and Chair of the Investment Committee, Community Foundation of Jackson Hole since 2014; Member of Affordable Housing Supply Board of Jackson, Wyoming since 2018; Member, Investment Funds Committee, State of Wyoming since 2017; Trustee, Phoenix Art Museum since 2018. | | 37 RICs consisting of 177 Portfolios | | None |
Joseph P. Platt 1947 | | Trustee (Since 2009) | | General Partner, Thorn Partners, LP (private investments) since 1998; Director, WQED Multi-Media (public broadcastingnot-for-profit) since 2001; Chair, Basic Health International(non-profit) since 2015. | | 37 RICs consisting of 177 Portfolios | | Greenlight Capital Re, Ltd. (reinsurance company); Consol Energy Inc. |
Kenneth L. Urish 1951 | | Trustee (Since 2009) | | Managing Partner, Urish Popeck & Co., LLC (certified public accountants and consultants) since 1976; Past-Chairman of the Professional Ethics Committee of the Pennsylvania Institute of Certified Public Accountants and Committee Member thereof since 2007; Member of External Advisory Board, The Pennsylvania State University Accounting Department since founding in 2001; Principal, UP Strategic Wealth Investment Advisors, LLC since 2013; Trustee, The Holy Family Institute from 2001 to 2010; President and Trustee, Pittsburgh Catholic Publishing Associates from 2003 to 2008; Director,Inter-Tel from 2006 to 2007. | | 37 RICs consisting of 177 Portfolios | | None |
Claire A. Walton 1957 | | Trustee (Since 2016) | | Chief Operating Officer and Chief Financial Officer of Liberty Square Asset Management, LP from 1998 to 2015; General Partner of Neon Liberty Capital Management, LLC since 2003; Director, Boston Hedge Fund Group from 2009 to 2018; Director, Woodstock Ski Runners since 2013; Director, Massachusetts Council on Economic Education from 2013 to 2015. | | 37 RICs consisting of 177 Portfolios | | None |
| | | | |
| TRUSTEEAND OFFICER INFORMATION | | | 53 | |
Trustee and Officer Information (continued)
| | | | | | | | |
| Interested Trustees (a)(d) |
| | | | | |
Name
Year of Birth (b) | | Position(s) Held
(Length of Service) (c) | | Principal Occupation(s) During Past Five Years | | Number of BlackRock-Advised
Registered Investment Companies
(“RICs”) Consisting of
Investment Portfolios
(“Portfolios”) Overseen | | Public Company and
Other Investment Company
Directorships Held During
Past Five Years |
Robert Fairbairn 1965 | | Trustee (Since 2018) | | Vice Chairman of BlackRock, Inc. since 2019; Member of BlackRock’s Global Executive and Global Operating Committees;Co-Chair of BlackRock’s Human Capital Committee; Senior Managing Director of BlackRock, Inc. from 2010 to 2019; oversaw BlackRock’s Strategic Partner Program and Strategic Product Management Group from 2012 to 2019; Member of the Board of Managers of BlackRock Investments, LLC from 2011 to 2018; Global Head of BlackRock’s Retail and iShares® businesses from 2012 to 2016. | | 123 RICs consisting of 287 Portfolios | | None |
John M. Perlowski (e) 1964 | | Trustee (Since 2015);
President and Chief Executive Officer (Since 2010) | | Managing Director of BlackRock, Inc. since 2009; Head of BlackRock Global Accounting and Product Services since 2009; Advisory Director of Family Resource Network (charitable foundation) since 2009. | | 124 RICs consisting of 288 Portfolios | | None |
(a) The address of each Trustee is c/o BlackRock, Inc., 55 East 52nd Street, New York, New York 10055. |
(b) Independent Trustees serve until their resignation, retirement, removal or death, or until December 31 of the year in which they turn 75. The Board may determine to extend the terms of Independent Trustees on acase-by-case basis, as appropriate. |
(c) In connection with the acquisition of Barclays Global Investors by BlackRock, Inc. in December 2009, certain Independent Trustees were elected to the Board. Furthermore, effective January 1, 2019, three BlackRock Fund Complexes were realigned and consolidated into two BlackRock Fund Complexes. As a result, although the chart shows the year that each Independent Trustee joined the Board, certain Independent Trustees first became members of the boards of other BlackRock-advised Funds or legacy BlackRock funds as follows: Bruce R. Bond, 2005; Robert M. Hernandez, 1996; Cynthia A. Montgomery, 1994; Joseph P. Platt, 1999; Kenneth L. Urish, 1999; Lena G. Goldberg, 2016; Henry R. Keizer, 2016; Donald C. Opatrny, 2015. |
(d) Mr. Fairbairn and Mr. Perlowski are both “interested persons,” as defined in the 1940 Act, of the Trust/MIP based on their positions with BlackRock, Inc. and its affiliates. Mr. Fairbairn and Mr. Perlowski are also board members of the BlackRock Fixed-Income Complex. |
(e) Mr. Perlowski is also a trustee of the BlackRock Credit Strategies Fund. |
| | |
| 54 | | 2019 BLACKROCK ANNUAL REPORTTO SHAREHOLDERS |
Trustee and Officer Information (continued)
| | | | |
| Officers Who Are Not Trustees (a) |
| | | |
Name
Year of Birth (b) | | Position(s) Held
(Length of Service) | | Principal Occupation(s) During Past Five Years |
Thomas Callahan 1968 | | Vice President (Since 2016) | | Managing Director of BlackRock, Inc. since 2013; Member of the Board of Managers of BlackRock Investments, LLC (principal underwriter) since 2019 and Managing Director thereof since 2017; Head of BlackRock’s Global Cash Management Business since 2016;Co-Head of the Global Cash Management Business from 2014 to 2016; Deputy Head of the Global Cash Management Business from 2013 to 2014; Member of the Cash Management Group Executive Committee since 2013; Chief Executive Officer of NYSE Liffe U.S. from 2008 to 2013. |
Jennifer McGovern 1977 | | Vice President (Since 2014) | | Managing Director of BlackRock, Inc. since 2016; Director of BlackRock, Inc. from 2011 to 2015; Head of Product Development and Oversight for BlackRock’s Strategic Product Management Group since 2019; Head of Product Structure and Oversight for BlackRock’s U.S. Wealth Advisory Group from 2013 to 2019. |
Neal J. Andrews 1966 | | Chief Financial Officer (Since 2009) | | Chief Financial Officer of the iShares® exchange traded funds since 2019; Managing Director of BlackRock, Inc. since 2006. |
Jay M. Fife 1970 | | Treasurer (Since 2009) | | Managing Director of BlackRock, Inc. since 2007. |
Charles Park 1967 | | Chief Compliance Officer (Since 2014) | | Anti-Money Laundering Compliance Officer for certain BlackRock-advised Funds from 2014 to 2015; Chief Compliance Officer of BlackRock Advisors, LLC and the BlackRock-advised Funds in the BlackRock Multi-Asset Complex and the BlackRock Fixed-Income Complex since 2014; Principal of and Chief Compliance Officer for iShares® Delaware Trust Sponsor LLC since 2012 and BlackRock Fund Advisors (“BFA”) since 2006; Chief Compliance Officer for theBFA-advised iShares® exchange traded funds since 2006; Chief Compliance Officer for BlackRock Asset Management International Inc. since 2012. |
Lisa Belle 1968 | | Anti-Money Laundering Compliance Officer (Since 2019) | | Managing Director of BlackRock, Inc. since 2019; Global Financial Crime Head for Asset and Wealth Management of JP Morgan from 2013 to 2019; Managing Director of RBS Securities from 2012 to 2013; Head of Financial Crimes for Barclays Wealth Americas from 2010 to 2012. |
Janey Ahn 1975 | | Secretary (Since 2019) | | Managing Director of BlackRock, Inc. since 2018; Director of BlackRock, Inc. from 2009 to 2017. |
(a) The address of each Officer is c/o BlackRock, Inc., 55 East 52nd Street, New York, New York 10055. |
(b) Officers of the Trust/MIP serve at the pleasure of the Board. |
Further information about the Trust’s/MIP’s Trustees and Officers is available in the Trust’s/MIP’s Statement of Additional Information, which can be obtained without charge by calling(800) 441-7762.
Effective September 19, 2019, Lisa Belle replaced John MacKessy as the Anti-Money Laundering Compliance Officer of the Trust/MIP.
Effective September 19, 2019, Janey Ahn replaced Benjamin Archibald as the Secretary of the Trust/MIP.
Effective December 31, 2019, Robert M. Hernandez retired as Trustee of the Trust/MIP.
Investment Adviser
BlackRock Fund Advisors
San Francisco, CA 94105
Administrator
BlackRock Advisors, LLC
Wilmington, DE 19809
Accounting Agent and Custodian
State Street Bank and Trust Company
Boston, MA 02111
Transfer Agent
BNY Mellon Investment Servicing (US) Inc.
Wilmington, DE 19809
Distributor
BlackRock Investments, LLC
New York, NY 10022
Independent Registered Public Accounting Firm
PricewaterhouseCoopers LLP
Philadelphia, PA 19103
Legal Counsel
Sidley Austin LLP
New York, NY 10019
Address of the Trust/MIP
400 Howard Street
San Francisco, CA 94105
| | | | |
| TRUSTEEAND OFFICER INFORMATION | | | 55 | |
Additional Information
General Information
Householding
The Fund will mail only one copy of shareholder documents, including prospectuses, annual and semi-annual reports and proxy statements, to shareholders with multiple accounts at the same address. This practice is commonly called “householding” and is intended to reduce expenses and eliminate duplicate mailings of shareholder documents. Mailings of your shareholder documents may be householded indefinitely unless you instruct us otherwise. If you do not want the mailing of these documents to be combined with those for other members of your household, please call the Fund at(800) 441-7762.
Availability of Quarterly Schedule of Investments
The Fund/Master Portfolio file their complete schedule of portfolio holdings with the SEC for the first and third quarters of each fiscal year as an exhibit to its reports on Form N-PORT, and for reporting periods ended prior to March 31, 2019, filed such information on Form N-Q. The Fund’s/Master Portfolio’s Forms N-PORT and N-Q are available on the SEC’s website at sec.gov. The Fund’s/Master Portfolio’s Forms N-Q may also be obtained upon request and without charge by calling (800) 441-7762.
Availability of Proxy Voting Policies and Procedures
A description of the policies and procedures that the Fund/Master Portfolio uses to determine how to vote proxies relating to portfolio securities is available upon request and without charge (1) by calling (800) 441-7762; (2) atblackrock.com; and (3) on the SEC’s website at sec.gov.
Availability of Proxy Voting Record
Information about how the Fund/Master Portfolio voted proxies relating to securities held in the Fund’s/Master Portfolio’s portfolio during the most recent 12-month period ended June 30 is available upon request and without charge (1) atblackrock.com; or by calling(800) 441-7762; and (2) on the SEC’s website at sec.gov.
BlackRock’s Mutual Fund Family
BlackRock offers a diverse lineup of open-end mutual funds crossing all investment styles and managed by experts in equity, fixed-income and tax-exempt investing. Visitblackrock.com for more information.
Shareholder Privileges
Account Information
Call us at (800) 441-7762 from 8:00 AM to 6:00 PM ET on any business day to get information about your account balances, recent transactions and share prices. You can also visitblackrock.com for more information.
Automatic Investment Plans
Investor class shareholders who want to invest regularly can arrange to have $50 or more automatically deducted from their checking or savings account and invested in any of the BlackRock funds.
Systematic Withdrawal Plans
Investor class shareholders can establish a systematic withdrawal plan and receive periodic payments of $50 or more from their BlackRock funds, as long as their account balance is at least $10,000.
Retirement Plans
Shareholders may make investments in conjunction with Traditional, Rollover, Roth, Coverdell, Simple IRAs, SEP IRAs and 403(b) Plans.
| | |
| 56 | | 2019 BLACKROCK ANNUAL REPORTTO SHAREHOLDERS |
Additional Information (continued)
BlackRock Privacy Principles
BlackRock is committed to maintaining the privacy of its current and former fund investors and individual clients (collectively, “Clients”) and to safeguarding their non-public personal information. The following information is provided to help you understand what personal information BlackRock collects, how we protect that information and why in certain cases we share such information with select parties.
If you are located in a jurisdiction where specific laws, rules or regulations require BlackRock to provide you with additional or different privacy-related rights beyond what is set forth below, then BlackRock will comply with those specific laws, rules or regulations.
BlackRock obtains or verifies personal non-public information from and about you from different sources, including the following: (i) information we receive from you or, if applicable, your financial intermediary, on applications, forms or other documents; (ii) information about your transactions with us, our affiliates, or others; (iii) information we receive from a consumer reporting agency; and (iv) from visits to our websites.
BlackRock does not sell or disclose to non-affiliated third parties any non-public personal information about its Clients, except as permitted by law or as is necessary to respond to regulatory requests or to service Client accounts. These non-affiliated third parties are required to protect the confidentiality and security of this information and to use it only for its intended purpose.
We may share information with our affiliates to service your account or to provide you with information about other BlackRock products or services that may be of interest to you. In addition, BlackRock restricts access to non-public personal information about its Clients to those BlackRock employees with a legitimate business need for the information. BlackRock maintains physical, electronic and procedural safeguards that are designed to protect the non-public personal information of its Clients, including procedures relating to the proper storage and disposal of such information.
Glossary of Terms Used in this Report
| | |
| Portfolio Abbreviations |
| |
| ADR | | American Depositary Receipts |
| |
| CVA | | Certificaten Van Aandelen (Dutch Certificate) |
| |
| GDR | | Global Depositary Receipt |
| |
| MSCI | | Morgan Stanley Capital International |
| |
| NVDR | | Non-voting Depository Receipts |
| |
| REIT | | Real Estate Investment Trust |
| |
| S&P | | Standard & Poor’s |
| | | | |
| ADDITIONAL INFORMATION | | | 57 | |
Want to know more?
blackrock.com | 877-275-1255 (1-877-ASK-1BLK)
This report is intended for current holders. It is not authorized for use as an offer of sale or a solicitation of an offer to buy shares of the Fund unless preceded or accompanied by the Fund’s current prospectus. Past performance results shown in this report should not be considered a representation of future performance. Investment returns and principal value of shares will fluctuate so that shares, when redeemed, may be worth more or less than their original cost. Statements and other information herein are as dated and are subject to change.
TIEXUS-12/19-AR
| | |
 | | DECEMBER 31, 2019 |
BlackRock Funds III
| · | | iShares Russell 1000 Large-Cap Index Fund |
Beginning on January 1, 2021, as permitted by regulations adopted by the Securities and Exchange Commission, paper copies of the Fund’s shareholder reports will no longer be sent by mail, unless you specifically request paper copies of the reports from BlackRock or from your financial intermediary, such as a broker-dealer or bank. Instead, the reports will be made available on a website, and you will be notified by mail each time a report is posted and provided with a website link to access the report.
You may elect to receive all future reports in paper free of charge. If you hold accounts directly with BlackRock, you can call(800) 441-7762 to inform BlackRock that you wish to continue receiving paper copies of your shareholder reports. If you hold accounts through a financial intermediary, you can follow the instructions included with this disclosure, if applicable, or contact your financial intermediary to request that you continue to receive paper copies of your shareholder reports. Please note that not all financial intermediaries may offer this service. Your election to receive reports in paper will apply to all funds advised by BlackRock Advisors, LLC, BlackRock Fund Advisors or their affiliates, or all funds held with your financial intermediary, as applicable.
If you already elected to receive shareholder reports electronically, you will not be affected by this change and you need not take any action. You may elect to receive electronic delivery of shareholder reports and other communications by: (i) accessing the BlackRock website at blackrock.com/edelivery and logging into your accounts, if you hold accounts directly with BlackRock, or (ii) contacting your financial intermediary, if you hold accounts through a financial intermediary. Please note that not all financial intermediaries may offer this service.
|
| Not FDIC Insured • May Lose Value • No Bank Guarantee |
The Markets in Review
Dear Shareholder,
U.S. equities and bonds finished the last year of the decade with impressive returns, putting an exclamation point on a decade of strong performance despite the fears and doubts about the economy that were ultimately laid to rest with unprecedented monetary stimulus and a sluggish yet resolute performance from the U.S. economy. In many ways, it was fitting that the themes of 2019 — geopolitical uncertainty, fears of recession, and decisive monetary stimulus — put the capstone on a decade that was defined by grappling with these competing forces.
Equity and bond markets posted solid returns, particularly in the second half of the year, as investors began to realize that the U.S. economy was maintaining the modest yet steady growth that has characterized this economic cycle. U.S. large cap equities advanced the most, while equities at the high end of the risk spectrum — emerging markets and U.S. small cap — lagged while still posting solid returns.
Fixed-income securities played an important role in diversified portfolios by delivering strong returns amid economic uncertainty, as interest rates declined (and bond prices rose). Long-term bonds, particularly long-term Treasuries, generally posted the strongest returns, as inflation remained low. Investment-grade and high-yield corporate bonds also posted solid returns, as the credit fundamentals in corporate markets remained relatively solid.
As equity performance faltered in late 2018 and global economic growth slowed, the U.S. Federal Reserve (the “Fed”) shifted away from policies designed to decrease inflation in favor of renewed efforts to stimulate economic activity. The Fed left interest rates unchanged in January 2019, then reduced interest rates three times thereafter, starting in July 2019. Similarly, the Fed took measures to support liquidity in short-term lending markets. Following in the Fed’s footsteps, the European Central Bank announced aggressive economic stimulus measures, including lower interest rates and the return of its bond purchasing program. The Bank of Japan signaled a continuation of accommodative monetary policy, while China committed to looser credit conditions and an increase in fiscal spending.
The outpouring of global economic stimulus led to a sharp rally in risk assets throughout the world despite the headwind of rising geopolitical and trade tensions. Hopes continued to remain high as the current economic expansion became the longest in U.S. history.
Looking ahead, we believe U.S. economic growth will stabilize and gradually improve in 2020. The primary drivers of recent market performance — trade and monetary policies — could take a back seat to a nascent expansion in manufacturing and a recent uptick in global growth. The headwinds of policy uncertainty in 2019 could become tailwinds in 2020 due topro-cyclical policy shifts.
Overall, we favor increasing investment risk to benefit from the brighter outlook. In addition to having a positive view for equities overall, we favor emerging market equities over developed market equities. Increasing cyclical exposure through value-style investing and maintaining a meaningful emphasis on high-quality companies through quality factors also makes sense for diversified investors. In fixed income, government bonds continue to be important portfolio stabilizers, while emerging market bonds, particularly local currency bonds, offer relatively attractive income opportunities.
In this environment, investors need to think globally, extend their scope across a broad array of asset classes, and be nimble as market conditions change. We encourage you to talk with your financial advisor and visitblackrock.com for further insight about investing in today’s markets.
Sincerely,
Rob Kapito
President, BlackRock Advisors, LLC
Rob Kapito
President, BlackRock Advisors, LLC
| | | | |
| Total Returns as of December 31, 2019 |
| | | 6-month | | 12-month |
U.S. large cap equities
(S&P 500® Index) | | 10.92% | | 31.49% |
U.S. small cap equities
(Russell 2000® Index) | | 7.30 | | 25.52 |
International equities
(MSCI Europe, Australasia, Far East Index) | | 7.01 | | 22.01 |
Emerging market equities
(MSCI Emerging Markets Index) | | 7.09 | | 18.42 |
3-month Treasury bills
(ICE BofAML3-Month U.S. Treasury Bill Index) | | 1.03 | | 2.28 |
U.S. Treasury securities
(ICE BofAML10-Year U.S. Treasury Index) | | 1.36 | | 8.91 |
U.S. investment grade bonds
(Bloomberg Barclays U.S. Aggregate Bond Index) | | 2.45 | | 8.72 |
Tax-exempt municipal bonds
(S&P Municipal Bond Index) | | 2.21 | | 7.26 |
U.S. high yield bonds
(Bloomberg Barclays U.S. Corporate High Yield 2% Issuer Capped Index) | | 3.98 | | 14.32 |
| Past performance is no guarantee of future results. Index performance is shown for illustrative purposes only. You cannot invest directly in an index. |
| | |
| 2 | | THIS PAGEISNOT PARTOF YOUR FUND REPORT |
Table of Contents

| | |
| Fund Summary as of December 31, 2019 | | iShares Russell 1000 Large-Cap Index Fund |
Investment Objective
iShares Russell 1000 Large-Cap Index Fund’s (the “Fund”) investment objective is to match the performance of the Russell 1000® Index as closely as possible before the deduction of Fund expenses.
Portfolio Management Commentary
How did the Fund perform?
For the12-month period ended December 31, 2019, the Fund’s Institutional Shares returned 31.28%, Investor A Shares returned 30.98%, and Class K Shares returned 31.28%. The benchmark Russell 1000® Index returned 31.43% for the same period.
Returns for the Fund’s respective share classes differ from the benchmark index based on individual share-class expenses. The Fund invests all of its assets in Large Cap Index Master Portfolio (the “Master Portfolio”), a series of Master Investment Portfolio.
Describe the market environment.
All eleven of the Global Industry Classification Standard sectors advanced in the first quarter of 2019 as positive headlines regarding Sino-American trade negotiations, relatively strong corporate earnings growth, and the Fed’s dovish pivot helped investor sentiment recover from steep losses in the fourth quarter of 2018. The technology sector outperformed with real estate the second best-performing sector as a decline in interest rates throughout the quarter drove demand for bond proxies. Health care shares underperformed as political risks weighed on sentiment, but still posted a respectable gain.
In its January 2019 announcement, the Fed indicated that it would refrain from interest rate hikes for the foreseeable future, with a dovish assessment of U.S. economic conditions and transparency around balance sheet normalization. This reduced market-based expectations of interest rate hikes, serving as a boon for both equities and bonds. Less optimism was evident in the U.S. rates market. The pause in interest rate hiking by the Fed coupled with lowered forecasts for growth drove investors into longer-duration government bonds.
The prospect of an easier monetary policy buoyed equities broadly in the second quarter of 2019. At the June Federal Open Market Committee announcement, Fed Chair Jerome Powell noted that should trade tensions weigh on the committee’s economic outlook or should the shortfall of inflation from the target rate persist longer than expected, the Fed would provide more accommodation to sustain the expansion.
Trade tensions were a source of intra-quarter volatility. In May, President Trump threatened an increase in tariffs and protectionism against both China and Mexico. However, these announcements did not materialize, and sentiment eased by June month end.
Looking to interest rates, the10-year U.S. Treasury yield declined 0.50% in the second quarter to 2% — the lowest level since 2016. The yield curve remained a source of uncertainty as thethree-month/10-year Treasury spread remained in negative territory while thefive-year/30-year Treasury spread expanded throughout the quarter.
In the third quarter of 2019, trade tensions were a key focus for both domestic and global investors. Markets suffered in early August on the back of President Trump’s promise to impose 10% tariffs on all Chinese imports that were not already subject to 25% tariffs. U.S.-China tensions did ostensibly ease ahead of a new round of trade talks in October. In monetary policy, the Fed lowered the target range for the federal funds rates at both its July and September meetings.
On the macroeconomic front, survey-based U.S. economic indicators continued to soften in the manufacturing and consumer sectors, while hard economic data releases exhibited resilience. In interest rates, the frequently monitoredtwo-year/ten-year Treasury yield spread inverted for the first time since the global financial crisis in August but ended the quarter in positive territory.
In the fourth quarter of 2019, risk appetite was boosted broadly by expectations of a U.S.-China trade deal, strong economic growth, and easy monetary policy. U.S. tariffs on China were originally scheduled to increase on December 15 but were avoided due to persistent negotiations between the United States and China. Additionally, news that the United States did not impose tariffs on European Union auto exports helped support sentiment. On the macroeconomic front, the U.S. services and employment sectors remained buoyant.
In November, 266,000 jobs were added to the economy, revising the third quarter unemployment rate down to 3.5% from 3.7%. Overall, the supportive macroeconomic data and boosted risk appetite drove selling of Treasuries in the quarter. Despite the strength in the U.S. economy, the Fed cut the benchmark federal funds rate to 1.75% in October, marking the third rate cut of the year.
Describe recent portfolio activity.
During the period, as changes were made to the composition of the Russell 1000® Index, the Master Portfolio purchased and sold securities to maintain its objective of replicating the risks and return of the benchmark index.
Describe portfolio positioning at period end.
The Master Portfolio remains positioned to match the risk characteristics of its benchmark index, irrespective of the market’s future direction.
The views expressed reflect the opinions of BlackRock as of the date of this report and are subject to change based on changes in market, economic or other conditions. These views are not intended to be a forecast of future events and are no guarantee of future results.
| | |
| 4 | | 2019 BLACKROCK ANNUAL REPORTTO SHAREHOLDERS |
| | |
| Fund Summary as of December 31, 2019 (continued) | | iShares Russell 1000 Large-Cap Index Fund |
TOTAL RETURN BASED ON A $10,000 INVESTMENT
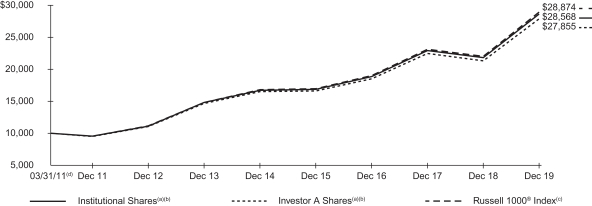
| (a) | Assuming transaction costs and other operating expenses, including administration fees, if any. |
| (b) | The Fund invests all of its assets in the Master Portfolio. The Master Portfolio will be substantially invested in equity securities in the Russell 1000® Index and will invest, under normal circumstances, at least 80% of its assets in securities or other financial instruments that are components of or have economic characteristics similar to the securities included in the Russell 1000® Index. |
| (c) | An index that measures the performance of the large-cap segment of the U.S. equity universe. It is a subset of the Russell 3000® Index and includes approximately 1,000 of the largest securities based on a combination of their market capitalization and current index membership. The index represents approximately 92% of the total market capitalization of the Russell 3000® Index. |
| (d) | Commencement of operations. |
Performance Summary for the Period Ended December 31, 2019
| | | | | | | | | | | | | | | | | | | | |
| | | | | | | | | Average Annual Total Returns (a) | |
| | | 6-Month
Total Returns | | | | | | 1 Year | | | 5 Years | | | Since
Inception (b) | |
Institutional | | | 10.55 | % | | | | | | | 31.28 | % | | | 11.35 | % | | | 12.74 | % |
Investor A | | | 10.37 | | | | | | | | 30.98 | | | | 11.06 | | | | 12.41 | |
Class K | | | 10.51 | | | | | | | | 31.28 | | | | 11.39 | | | | 12.74 | |
Russell 1000® Index | | | 10.59 | | | | | | | | 31.43 | | | | 11.48 | | | | 12.88 | |
| | (a) | See “About Fund Performance” on Page 6 for a detailed description of share classes, including any related fees. | |
| | (b) | The Fund commenced operations on March 31, 2011. | |
Past performance is not indicative of future results.
Performance results may include adjustments made for financial reporting purposes in accordance with U.S. generally accepted accounting principles.
Expense Example
| | | | | | | | | | | | | | | | | | | | | | | | | | | | | | | | |
| | | Actual | | | | | | Hypothetical (b) | |
| | | Beginning
Account Value
(07/01/19) | | | Ending
Account Value
(12/31/19) | | | Expenses
Paid During
the Period (a) | | | | | | Beginning
Account Value
(07/01/19) | | | Ending
Account Value
(12/31/19) | | | Expenses
Paid During
the Period (a) | | | Annualized
Expense
Ratio | |
Institutional | | $ | 1,000.00 | | | $ | 1,105.50 | | | $ | 0.69 | | | | | | | $ | 1,000.00 | | | $ | 1,024.55 | | | $ | 0.66 | | | | 0.13 | % |
Investor A | | | 1,000.00 | | | | 1,103.70 | | | | 2.01 | | | | | | | | 1,000.00 | | | | 1,023.29 | | | | 1.94 | | | | 0.38 | |
Class K | | | 1,000.00 | | | | 1,105.10 | | | | 0.42 | | | | | | | | 1,000.00 | | | | 1,024.80 | | | | 0.41 | | | | 0.08 | |
| | (a) | For each class of the Fund, expenses are equal to the annualized net expense ratio for the class, multiplied by the average account value over the period, multiplied by 184/365 (to reflect the one-half year period shown). Because the Fund invests all of its assets in the Master Portfolio, the expense example reflects the net expenses of both the Fund and the Master Portfolio in which it invests. | |
| | (b) | Hypothetical 5% annual return before expenses is calculated by prorating the number of days in the most recent fiscal half year divided by 365. | |
See “Disclosure of Expenses” on page 6 for further information on how expenses were calculated.
About Fund Performance
Institutional and Class K Shares are not subject to any sales charge. These shares bear no ongoing distribution or service fees and are available only to certain eligible investors.
Investor A Shares are not subject to any sales charge and bear no ongoing distribution fee. These shares are subject to an ongoing service fee of 0.25% per year. These shares are generally available through financial intermediaries.
Performance information reflects past performance and does not guarantee future results. Current performance may be lower or higher than the performance data quoted. Refer toblackrock.com to obtain performance data current to the most recent month-end. Performance results do not reflect the deduction of taxes that a shareholder would pay on fund distributions or the redemption of fund shares. Figures shown in the performance table on the previous page assume reinvestment of all distributions, if any, at net asset value (“NAV”) on the ex-dividend date. Investment return and principal value of shares will fluctuate so that shares, when redeemed, may be worth more or less than their original cost. Distributions paid to each class of shares will vary because of the different levels of service, distribution and transfer agency fees applicable to each class, which are deducted from the income available to be paid to shareholders.
BlackRock Advisors, LLC (the “Administrator”), the Fund’s administrator, has contractually and/or voluntarily agreed to waive and/or reimburse a portion of the Fund’s expenses. Without such waiver and/or reimbursement, the Fund’s performance would have been lower. With respect to the Fund’s voluntary waiver, the Administrator is under no obligation to waive and/or reimburse or to continue waiving and/or reimbursing its fees and such voluntary waiver may be reduced or discontinued at any time. With respect to the Fund’s contractual waiver, the Administrator is under no obligation to continue waiving and/or reimbursing its fees after the applicable termination date of such agreement. See Note 4 of the Notes to Financial Statements for additional information on waivers and/or reimbursements.
Disclosure of Expenses
Shareholders of the Fund may incur the following charges: (a) transactional expenses; and (b) operating expenses, including administration fees, service and distribution fees, including12b-1 fees, acquired fund fees and expenses and other fund expenses. The expense example on the previous page (which is based on a hypothetical investment of $1,000 invested on July 1, 2019 and held through December 31, 2019) is intended to assist shareholders both in calculating expenses based on an investment in the Fund and in comparing these expenses with similar costs of investing in other mutual funds.
The expense example provides information about actual account values and actual expenses. In order to estimate the expenses a shareholder paid during the period covered by this report, shareholders can divide their account value by $1,000 and then multiply the result by the number corresponding to their share class under the heading entitled “Expenses Paid During the Period.”
The expense example also provides information about hypothetical account values and hypothetical expenses based on the Fund’s actual expense ratio and an assumed rate of return of 5% per year before expenses. In order to assist shareholders in comparing the ongoing expenses of investing in the Fund and other funds, compare the 5% hypothetical example with the 5% hypothetical examples that appear in shareholder reports of other funds.
The expenses shown in the expense example are intended to highlight shareholders’ ongoing costs only and do not reflect transactional expenses, such as sales charges, if any. Therefore, the hypothetical example is useful in comparing ongoing expenses only, and will not help shareholders determine the relative total expenses of owning different funds. If these transactional expenses were included, shareholder expenses would have been higher.
| | |
| 6 | | 2019 BLACKROCK ANNUAL REPORTTO SHAREHOLDERS |
Statement of Assets and Liabilities
December 31, 2019
| | | | |
| | | iShares Russell 1000 Large-Cap Index Fund | |
| |
ASSETS | | | | |
Investments at value — Master Portfolio | | $ | 456,334,199 | |
Receivables: | | | | |
Capital shares sold | | | 12,182,488 | |
From the Administrator/Manager | | | 6,912 | |
Prepaid expenses | | | 21,755 | |
| | | | |
Total assets | | | 468,545,354 | |
| | | | |
| |
LIABILITIES | | | | |
Payables: | | | | |
Administration fees | | | 6,577 | |
Capital shares redeemed | | | 1,886,587 | |
Contributions to the Master | | | 10,295,901 | |
Other accrued expenses | | | 77,156 | |
Service fees | | | 17,889 | |
Recoupment of past waived fees | | | 2,271 | |
| | | | |
Total liabilities | | | 12,286,381 | |
| | | | |
| |
NET ASSETS | | $ | 456,258,973 | |
| | | | |
| |
NET ASSETS CONSIST OF | | | | |
Paid-in capital | | $ | 316,458,385 | |
Accumulated earnings | | | 139,800,588 | |
| | | | |
NET ASSETS | | $ | 456,258,973 | |
| | | | |
| |
NET ASSET VALUE | | | | |
Institutional — Based on net assets of $82,728,774 and 3,914,097 shares outstanding, unlimited number of shares authorized, no par value | | $ | 21.14 | |
| | | | |
Investor A — Based on net assets of $86,038,155 and 4,095,559 shares outstanding, unlimited number of shares authorized, no par value | | $ | 21.01 | |
| | | | |
ClassK — Based on net assets of $287,492,044 and 13,656,200 shares outstanding, unlimited number of shares authorized, no par value | | $ | 21.05 | |
| | | | |
See notes to financial statements.
Statement of Operations
Year Ended December 31, 2019
| | | | |
| | | iShares Russell 1000
Large-Cap Index Fund | |
|
INVESTMENT INCOME | |
Net investment income allocated from the Master Portfolio: | |
Dividends — unaffiliated | | $ | 6,529,980 | |
Dividends — affiliated | | | 157,887 | |
Securities lending income — affiliated — net | | | 118,113 | |
Foreign taxes withheld | | | (525 | ) |
Expenses | | | (117,369 | ) |
Fees waived | | | 3,170 | |
| | | | |
Total investment income | | | 6,691,256 | |
| | | | |
|
FUND EXPENSES | |
Transfer agent — class specific | | | 341,727 | |
Service — class specific | | | 175,510 | |
Professional | | | 65,683 | |
Registration | | | 63,628 | |
Administration | | | 34,970 | |
Printing | | | 23,638 | |
Recoupment of past waived and/or reimbursed fees — class specific | | | 7,827 | |
Accounting services | | | 5,088 | |
Officer | | | 148 | |
Miscellaneous | | | 8,774 | |
| | | | |
Total expenses | | | 726,993 | |
Less: | |
Fees waived and/or reimbursed by the Administrator/ Manager | | | (36,766 | ) |
Transfer agent fees waived and/or reimbursed — class specific | | | (274,819 | ) |
| | | | |
Total expenses after fees waived and/or reimbursed | | | 415,408 | |
| | | | |
Net investment income | | | 6,275,848 | |
| | | | |
|
REALIZED AND UNREALIZED GAIN (LOSS) ALLOCATED FROM THE MASTER PORTFOLIO | |
Net realized gain (loss) from: | |
Futures contracts | | | 1,000,435 | |
Investments — affiliated | | | (241,064 | ) |
Investments — unaffiliated | | | 1,632,746 | |
| | | | |
| | | 2,392,117 | |
| | | | |
Net change in unrealized appreciation (depreciation) on: | |
Futures contracts | | | 1,395 | |
Investments — affiliated | | | 487,292 | |
Investments — unaffiliated | | | 86,143,282 | |
| | | | |
| | | 86,631,969 | |
| | | | |
Net realized and unrealized gain | | | 89,024,086 | |
| | | | |
NET INCREASE IN NET ASSETS RESULTING FROM OPERATIONS | | $ | 95,299,934 | |
| | | | |
See notes to financial statements.
| | |
| 8 | | 2019 BLACKROCK ANNUAL REPORTTO SHAREHOLDERS |
Statements of Changes in Net Assets
| | | | | | | | |
| | | iShares Russell 1000
Large-Cap Index Fund | |
| | | Year Ended December 31, | |
| | | 2019 | | | 2018 | |
|
INCREASE (DECREASE) IN NET ASSETS | |
|
OPERATIONS | |
Net investment income | | $ | 6,275,848 | | | $ | 4,644,783 | |
Net realized gain | | | 2,392,117 | | | | 1,210,484 | |
Net change in unrealized appreciation (depreciation) | | | 86,631,969 | | | | (23,156,898 | ) |
| | | | | | | | |
Net increase (decrease) in net assets resulting from operations | | | 95,299,934 | | | | (17,301,631 | ) |
| | | | | | | | |
|
DISTRIBUTIONS TO SHAREHOLDERS(a) | |
Institutional | | | (2,269,109 | ) | | | (1,332,772 | ) |
Investor A | | | (2,032,385 | ) | | | (1,251,128 | ) |
Class K | | | (6,315,002 | ) | | | (3,120,575 | ) |
| | | | | | | | |
Decrease in net assets resulting from distributions to shareholders | | | (10,616,496 | ) | | | (5,704,475 | ) |
| | | | | | | | |
|
CAPITAL SHARE TRANSACTIONS | |
Net increase in net assets derived from capital share transactions | | | 57,699,811 | | | | 125,324,876 | |
| | | | | | | | |
|
NET ASSETS | |
Total increase in net assets | | | 142,383,249 | | | | 102,318,770 | |
Beginning of year | | | 313,875,724 | | | | 211,556,954 | |
| | | | | | | | |
End of year | | $ | 456,258,973 | | | $ | 313,875,724 | |
| | | | | | | | |
| (a) | Distributions for annual periods determined in accordance with U.S. federal income tax regulations. |
See notes to financial statements.
Financial Highlights
(For a share outstanding throughout each period)
| | | | | | | | | | | | | | | | | | | | |
| | | iShares Russell 1000Large-Cap Index Fund | |
| |
| | | Institutional | |
| |
| | | Year Ended December 31, | |
| | | 2019 | | | 2018 | | | 2017 | | | 2016 | | | 2015 | |
| | | | | |
Net asset value, beginning of year | | $ | 16.58 | | | $ | 17.82 | | | $ | 15.07 | | | $ | 14.08 | | | $ | 14.72 | |
| | | | | | | | | | | | | | | | | | | | |
Net investment income(a) | | | 0.35 | | | | 0.34 | | | | 0.30 | | | | 0.31 | | | | 0.28 | |
Net realized and unrealized gain (loss) | | | 4.79 | | | | (1.19 | ) | | | 2.91 | | | | 1.35 | | | | (0.16 | ) |
| | | | | | | | | | | | | | | | | | | | |
Net increase (decrease) from investment operations | | | 5.14 | | | | (0.85 | ) | | | 3.21 | | | | 1.66 | | | | 0.12 | |
| | | | | | | | | | | | | | | | | | | | |
|
Distributions(b) | |
From net investment income | | | (0.39 | ) | | | (0.33 | ) | | | (0.35 | ) | | | (0.29 | ) | | | (0.29 | ) |
From net realized gain | | | (0.19 | ) | | | (0.06 | ) | | | (0.11 | ) | | | (0.38 | ) | | | (0.47 | ) |
From return of capital | | | — | | | | — | | | | (0.00 | )(c) | | | — | | | | — | |
| | | | | | | | | | | | | | | | | | | | |
Total distributions | | | (0.58 | ) | | | (0.39 | ) | | | (0.46 | ) | | | (0.67 | ) | | | (0.76 | ) |
| | | | | | | | | | | | | | | | | | | | |
| | | | | |
Net asset value, end of year | | $ | 21.14 | | | $ | 16.58 | | | $ | 17.82 | | | $ | 15.07 | | | $ | 14.08 | |
| | | | | | | | | | | | | | | | | | | | |
|
Total Return(d) | |
Based on net asset value | | | 31.28 | % | | | (4.88 | )% | | | 21.46 | % | | | 11.92 | % | | | 0.82 | % |
| | | | | | | | | | | | | | | | | | | | |
|
Ratios to Average Net Assets(e) | |
Total expenses | | | 0.15 | %(f)(g) | | | 0.17 | %(f)(h) | | | 0.17 | %(f)(h) | | | 0.13 | %(f) | | | 0.27 | %(i) |
| | | | | | | | | | | | | | | | | | | | |
Total expenses after fees waived and/or reimbursed | | | 0.13 | %(f) | | | 0.13 | %(f) | | | 0.13 | %(f) | | | 0.09 | %(f) | | | 0.13 | %(i) |
| | | | | | | | | | | | | | | | | | | | |
Net investment income | | | 1.81 | %(f) | | | 1.89 | %(f) | | | 1.82 | %(f) | | | 2.14 | %(f) | | | 1.93 | %(i) |
| | | | | | | | | | | | | | | | | | | | |
|
Supplemental Data | |
Net assets, end of year (000) | | $ | 82,729 | | | $ | 102,279 | | | $ | 45,733 | | | $ | 18,964 | | | $ | 3,431 | |
| | | | | | | | | | | | | | | | | | | | |
Portfolio turnover rate of the Master Portfolio | | | 10 | % | | | 12 | % | | | 12 | % | | | 13 | % | | | 6 | % |
| | | | | | | | | | | | | | | | | | | | |
| (a) | Based on average shares outstanding. |
| (b) | Distributions for annual periods determined in accordance with U.S. federal income tax regulations. |
| (c) | Amount is greater than $(0.005) per share. |
| (d) | Where applicable, assumes the reinvestment of distributions. |
| (e) | Includes the Fund’s share of the Master Portfolio’s allocated net expenses and/or net investment income. |
| (f) | Includes the Fund’s share of the Master Portfolio’s allocated fees waived of less than 0.01%. |
| (g) | Includes recoupment of past waived and/or reimbursed fees. Excluding the recoupment of past waived and/or reimbursed fees for the year ended December, 31, 2019 the expense ratio would have been 0.14%. |
| (h) | Includes recoupment of past waived and/or reimbursed fees with no financial impact to the expense ratios. |
| (i) | Includes the Fund’s share of the Master Portfolio’s allocated fees waived of 0.01%. |
See notes to financial statements.
| | |
| 10 | | 2019 BLACKROCK ANNUAL REPORTTO SHAREHOLDERS |
Financial Highlights (continued)
(For a share outstanding throughout each period)
| | | | | | | | | | | | | | | | | | | | |
| | | iShares Russell 1000Large-Cap Index Fund | |
| |
| | | Investor A | |
| |
| | | Year Ended December 31, | |
| | | 2019 | | | 2018 | | | 2017 | | | 2016 | | | 2015 | |
| | | | | |
Net asset value, beginning of year | | $ | 16.48 | | | $ | 17.72 | | | $ | 14.99 | | | $ | 14.01 | | | $ | 14.65 | |
| | | | | | | | | | | | | | | | | | | | |
Net investment income(a) | | | 0.30 | | | | 0.29 | | | | 0.26 | | | | 0.25 | | | | 0.24 | |
Net realized and unrealized gain (loss) | | | 4.76 | | | | (1.18 | ) | | | 2.89 | | | | 1.36 | | | | (0.16 | ) |
| | | | | | | | | | | | | | | | | | | | |
Net increase (decrease) from investment operations | | | 5.06 | | | | (0.89 | ) | | | 3.15 | | | | 1.61 | | | | 0.08 | |
| | | | | | | | | | | | | | | | | | | | |
|
Distributions(b) | |
From net investment income | | | (0.34 | ) | | | (0.29 | ) | | | (0.31 | ) | | | (0.25 | ) | | | (0.25 | ) |
From net realized gain | | | (0.19 | ) | | | (0.06 | ) | | | (0.11 | ) | | | (0.38 | ) | | | (0.47 | ) |
From return of capital | | | — | | | | — | | | | (0.00 | )(c) | | | — | | | | — | |
| | | | | | | | | | | | | | | | | | | | |
Total distributions | | | (0.53 | ) | | | (0.35 | ) | | | (0.42 | ) | | | (0.63 | ) | | | (0.72 | ) |
| | | | | | | | | | | | | | | | | | | | |
| | | | | |
Net asset value, end of year | | $ | 21.01 | | | $ | 16.48 | | | $ | 17.72 | | | $ | 14.99 | | | $ | 14.01 | |
| | | | | | | | | | | | | | | | | | | | |
|
Total Return(d) | |
Based on net asset value | | | 30.98 | % | | | (5.15 | )% | | | 21.16 | % | | | 11.61 | % | | | 0.56 | % |
| | | | | | | | | | | | | | | | | | | | |
|
Ratios to Average Net Assets(e) | |
Total expenses | | | 0.76 | %(f) | | | 0.87 | %(f) | | | 0.68 | %(f)(g) | | | 0.48 | %(f) | | | 0.54 | %(h) |
| | | | | | | | | | | | | | | | | | | | |
Total expenses after fees waived and/or reimbursed | | | 0.38 | %(f) | | | 0.38 | %(f) | | | 0.38 | %(f) | | | 0.38 | %(f) | | | 0.39 | %(h) |
| | | | | | | | | | | | | | | | | | | | |
Net investment income | | | 1.57 | %(f) | | | 1.60 | %(f) | | | 1.56 | %(f) | | | 1.76 | %(f) | | | 1.62 | %(h) |
| | | | | | | | | | | | | | | | | | | | |
|
Supplemental Data | |
Net assets, end of year (000) | | $ | 86,038 | | | $ | 57,500 | | | $ | 66,675 | | | $ | 23,939 | | | $ | 17,397 | |
| | | | | | | | | | | | | | | | | | | | |
Portfolio turnover rate of the Master Portfolio | | | 10 | % | | | 12 | % | | | 12 | % | | | 13 | % | | | 6 | % |
| | | | | | | | | | | | | | | | | | | | |
| (a) | Based on average shares outstanding. |
| (b) | Distributions for annual periods determined in accordance with U.S. federal income tax regulations. |
| (c) | Amount is greater than $(0.005) per share. |
| (d) | Where applicable, assumes the reinvestment of distributions. |
| (e) | Includes the Fund’s share of the Master Portfolio’s allocated expenses and/or net investment income. |
| (f) | Includes the Fund’s share of the Master Portfolio’s allocated fees waived of less than 0.01%. |
| (g) | Includes recoupment of past waived and/or reimbursed fees. Excluding the recoupment of past waived and/or reimbursed fees for the year ended December, 31, 2017 the expense ratio would have been 0.67%. |
| (h) | Includes the Fund’s share of the Master Portfolio’s allocated fees waived of 0.01%. |
See notes to financial statements.
Financial Highlights (continued)
(For a share outstanding throughout each period)
| | | | | | | | | | | | | | | | | | | | |
| | | iShares Russell 1000Large-Cap Index Fund | |
| |
| | | Class K | |
| |
| | | Year Ended December 31, | |
| | | 2019 | | | 2018 | | | 2017 | | | 2016 | | | 2015 | |
| | | | | |
Net asset value, beginning of year | | $ | 16.52 | | | $ | 17.76 | | | $ | 15.01 | | | $ | 14.03 | | | $ | 14.67 | |
| | | | | | | | | | | | | | | | | | | | |
Net investment income(a) | | | 0.36 | | | | 0.35 | | | | 0.31 | | | | 0.30 | | | | 0.28 | |
Net realized and unrealized gain (loss) | | | 4.76 | | | | (1.19 | ) | | | 2.91 | | | | 1.36 | | | | (0.15 | ) |
| | | | | | | | | | | | | | | | | | | | |
Net increase (decrease) from investment operations | | | 5.12 | | | | (0.84 | ) | | | 3.22 | | | | 1.66 | | | | 0.13 | |
| | | | | | | | | | | | | | | | | | | | |
|
Distributions(b) | |
From net investment income | | | (0.40 | ) | | | (0.34 | ) | | | (0.36 | ) | | | (0.30 | ) | | | (0.30 | ) |
From net realized gain | | | (0.19 | ) | | | (0.06 | ) | | | (0.11 | ) | | | (0.38 | ) | | | (0.47 | ) |
From return of capital | | | — | | | | — | | | | (0.00 | )(c) | | | — | | | | — | |
| | | | | | | | | | | | | | | | | | | | |
Total distributions | | | (0.59 | ) | | | (0.40 | ) | | | (0.47 | ) | | | (0.68 | ) | | | (0.77 | ) |
| | | | | | | | | | | | | | | | | | | | |
| | | | | |
Net asset value, end of year | | $ | 21.05 | | | $ | 16.52 | | | $ | 17.76 | | | $ | 15.01 | | | $ | 14.03 | |
| | | | | | | | | | | | | | | | | | | | |
|
Total Return(d) | |
Based on net asset value | | | 31.28 | % | | | (4.85 | )% | | | 21.60 | % | | | 11.92 | % | | | 0.86 | % |
| | | | | | | | | | | | | | | | | | | | |
|
Ratios to Average Net Assets(e) | |
Total expenses | | | 0.10 | %(f) | | | 0.13 | %(f) | | | 0.10 | %(f)(g) | | | 0.12 | %(f) | | | 0.19 | %(h) |
| | | | | | | | | | | | | | | | | | | | |
Total expenses after fees waived and/or reimbursed | | | 0.08 | %(f) | | | 0.08 | %(f) | | | 0.08 | %(f) | | | 0.08 | %(f) | | | 0.09 | %(h) |
| | | | | | | | | | | | | | | | | | | | |
Net investment income | | | 1.87 | %(f) | | | 1.92 | %(f) | | | 1.87 | %(f) | | | 2.06 | %(f) | | | 1.91 | %(h) |
| | | | | | | | | | | | | | | | | | | | |
|
Supplemental Data | |
Net assets, end of year (000) | | $ | 287,492 | | | $ | 154,097 | | | $ | 99,149 | | | $ | 122,724 | | | $ | 77,632 | |
| | | | | | | | | | | | | | | | | | | | |
Portfolio turnover rate of the Master Portfolio | | | 10 | % | | | 12 | % | | | 12 | % | | | 13 | % | | | 6 | % |
| | | | | | | | | | | | | | | | | | | | |
| (a) | Based on average shares outstanding. |
| (b) | Distributions for annual periods determined in accordance with U.S. federal income tax regulations. |
| (c) | Amount is greater than $(0.005) per share. |
| (d) | Where applicable, assumes the reinvestment of distributions. |
| (e) | Includes the Fund’s share of the Master Portfolio’s allocated net expenses and/or net investment income. |
| (f) | Includes the Fund’s share of the Master Portfolio’s allocated fees waived of less than 0.01%. |
| (g) | Includes recoupment of past waived and/or reimbursed fees with no financial impact to the expense ratio. |
| (h) | Includes the Fund’s share of the Master Portfolio’s allocated fees waived of 0.01%. |
See notes to financial statements.
| | |
| 12 | | 2019 BLACKROCK ANNUAL REPORTTO SHAREHOLDERS |
Notes to Financial Statements
BlackRock Funds III (the “Trust”) is registered under the Investment Company Act of 1940, as amended (the “1940 Act”), as anopen-end management investment company. The Trust is organized as a Delaware statutory trust. iShares Russell 1000Large-Cap Index Fund (the “Fund”) is a series of the Trust. The Fund is classified as diversified. The Fund seeks to achieve its investment objective by investing all of its assets in Large Cap Index Master Portfolio (the “Master Portfolio”), a series of Master Investment Portfolio (“MIP”), an affiliate of the Trust, which has the same investment objective and strategies as the Fund. The value of the Fund’s investment in the Master Portfolio reflects the Fund’s proportionate interest in the net assets of the Master Portfolio. The performance of the Fund is directly affected by the performance of the Master Portfolio. At December 31, 2019, the percentage of the Master Portfolio owned by the Fund was 3.01%. The financial statements of the Master Portfolio, including the Schedule of Investments, are included elsewhere in this report and should be read in conjunction with the Fund’s financial statements.
The Fund offers multiple classes of shares. All classes of shares have identical voting, dividend, liquidation and other rights and are subject to the same terms and conditions, except that certain classes bear expenses related to the shareholder servicing and distribution of such shares. Institutional and Class K Shares are sold only to certain eligible investors. Investor A Shares bear certain expenses related to shareholder servicing of such shares. Investor A Shares are generally available through financial intermediaries. Each class has exclusive voting rights with respect to matters relating to its shareholder servicing and distribution expenditures.
| | | | | | | | |
| Share Class | | Initial Sales Charge | | CDSC | | | Conversion Privilege |
Institutional Shares, Investor A and Class K | | No | | | No | | | None |
The Board of Trustees of the Trust and Board of Trustees of MIP are referred to throughout this report as the “Board of Trustees” or the “Board” and the members are referred to as “Trustees.”
The Fund, together with certain other registered investment companies advised by BlackRock Fund Advisors (“BFA” or the “Manager”) or its affiliates, is included in a complex of equity, multi-asset, index and money market funds referred to as the BlackRock Multi-Asset Complex.
| 2. | SIGNIFICANT ACCOUNTING POLICIES |
The financial statements are prepared in conformity with accounting principles generally accepted in the United States of America (“U.S. GAAP”), which may require management to make estimates and assumptions that affect the reported amounts of assets and liabilities in the financial statements, disclosure of contingent assets and liabilities at the date of the financial statements and the reported amounts of increases and decreases in net assets from operations during the reporting period. Actual results could differ from those estimates. The Fund is considered an investment company under U.S. GAAP and follows the accounting and reporting guidance applicable to investment companies. Below is a summary of significant accounting policies:
Investment Transactions and Income Recognition:For financial reporting purposes, contributions to and withdrawals from the Master Portfolio are accounted for on a trade date basis. The Fund records its proportionate share of the Master Portfolio’s income, expenses and realized and unrealized gains and losses on a daily basis. Realized and unrealized gains and losses are adjusted utilizing partnership tax allocation rules. In addition, the Fund accrues its own expenses. Income, expenses and realized and unrealized gains and losses are allocated daily to each class based on its relative net assets.
Distributions: Distributions paid by the Fund are recorded on theex-dividend date. The character and timing of distributions are determined in accordance with U.S. federal income tax regulations, which may differ from U.S. GAAP.
Indemnifications:In the normal course of business, the Fund enters into contracts that contain a variety of representations that provide general indemnification. The Fund’s maximum exposure under these arrangements is unknown because it involves future potential claims against the Fund, which cannot be predicted with any certainty.
Other: Expenses directly related to the Fund or its classes are charged to the Fund or the applicable class. Other operating expenses shared by several funds, including other funds managed by BlackRock Advisors, LLC (“BAL” or the “Administrator”), are prorated among those funds on the basis of relative net assets or other appropriate methods. Expenses directly related to the Fund and other shared expenses prorated to the Fund are allocated daily to each class based on its relative net assets or other appropriate methods.
| 3. | INVESTMENT VALUATION AND FAIR VALUE MEASUREMENTS |
Investment Valuation Policies: The Fund’s policy is to value its financial instruments at fair value. The Fund records its investment in the Master Portfolio at fair value based on the Fund’s proportionate interest in the net assets of the Master Portfolio. Valuation of securities held by the Master Portfolio is discussed in Note 3 of the Master Portfolio’s Notes to Financial Statements, which are included elsewhere in this report.
| 4. | ADMINISTRATION AGREEMENT AND OTHER TRANSACTIONS WITH AFFILIATES |
Administration:The Trust, on behalf of the Fund, entered into an Administration Agreement with the Administrator, an indirect, wholly-owned subsidiary of BlackRock, Inc. (“BlackRock”), to provide administrative services (other than investment advice and related portfolio activities). For such services, the Fund pays the Administrator a monthly fee at an annual rate of 0.01% of the average daily net assets of the Fund. The Fund does not pay an investment advisory fee or investment management fee.
Service Fees: The Trust, on behalf of the Fund, entered into a Distribution Agreement and a Distribution and Service Plan with BlackRock Investments, LLC (“BRIL”), an affiliate of the Administrator. Pursuant to the Distribution and Service Plan and in accordance with Rule12b-1 under the 1940 Act, the Fund pays BRIL ongoing service fees. The fees are accrued daily and paid monthly at an annual rate of 0.25% based upon the average daily net assets of the Investor A Shares.
| | | | |
| NOTESTO FINANCIAL STATEMENTS | | | 13 | |
Notes to Financial Statements (continued)
BRIL and broker-dealers, pursuant tosub-agreements with BRIL, provide shareholder servicing services to the Fund. The ongoing service fee compensates BRIL and each broker-dealer for providing shareholder servicing related services to shareholders.
For the year ended December 31, 2019, the class specific service fees borne directly by Investor A Shares was $175,510.
Transfer Agent:Pursuant to written agreements, certain financial intermediaries, some of which may be affiliates, provide the Fund withsub-accounting, recordkeeping,sub-transfer agency and other administrative services with respect to servicing of underlying investor accounts. For these services, these entities receive an asset-based fee or an annual fee per shareholder account, which will vary depending on share class and/or net assets. For the year ended December 31, 2019, the Fund did not pay any amounts to affiliates in return for these services.
The Administrator maintains a call center that is responsible for providing certain shareholder services to the Fund. Shareholder services include responding to inquiries and processing purchases and sales based upon instructions from shareholders. For the year ended December 31, 2019, the Fund reimbursed the Administrator the following amounts for costs incurred in running the call center, which are included in transfer agent — class specific in the Statement of Operations:
| | | | | | | | | | | | | | | | | | | | |
| Institutional | | | | | Investor A | | | | | Class K | | | | | Total | |
| $ | 359 | | | | | $ | 13,570 | | | | | $ | 901 | | | | | $ | 14,830 | |
For the year ended December 31, 2019, the following table shows the class specific transfer agent fees borne directly by each share class of the Fund:
| | | | | | | | | | | | | | | | | | | | |
| Institutional | | | | | Investor A | | | | | Class K | | | | | Total | |
| $ | 36,993 | | | | | $ | 292,201 | | | | | $ | 12,533 | | | | | $ | 341,727 | |
Expense Limitations, Waivers, Reimbursements and Recoupments: BAL and BFA contractually agreed to waive and/or reimburse fees or expenses in order to limit expenses, excluding interest expense, dividend expense, tax expense, acquired fund fees and expenses, and certain other fund expenses, which constitute extraordinary expenses not incurred in the ordinary course of the Fund’s business (“expense limitation”). The expense limitations as a percentage of average daily net assets are as follows:
| | | | | | | | | | | | | | |
| Institutional | | | | | Investor A | | | | | Class K | |
| | 0.13% | | | | | | 0.38% | | | | | | 0.08% | |
The Administrator/Manager has agreed not to reduce or discontinue these contractual expense limitations through April 30, 2020, unless approved by the Board, including a majority of the trustees who are not “interested persons” of the Trust, as defined in the 1940 Act (“Independent Trustees”) or by a vote of a majority of the outstanding voting securities of the Fund. For the year ended December 31, 2019, the Administrator/Manager waived and/or reimbursed $36,766, which is included in fees waived and/or reimbursed by the Administrator/Manager in the Statement of Operations.
These amounts waived and/or reimbursed are included in fees waived and/or reimbursed by the Administrator and transfer agent fees waived and/or reimbursed — class specific, respectively, in the Statement of Operations. For the year ended December 31, 2019, class specific transfer agent fees waived are as follows:
| | | | | | | | | | | | | | | | | | | | |
| Institutional | | | | | Investor A | | | | | Class K | | | | | Total | |
| $ | 5,372 | | | | | $ | 257,013 | | | | | $ | 12,434 | | | | | $ | 274,819 | |
With respect to the contractual expense limitation, if during the Fund’s fiscal year the operating expenses of a share class, that at any time during the prior two fiscal years received a waiver and/or reimbursement from BAL or BFA, are less than the current expense limitation for that share class, BAL and/or BFA is entitled to be reimbursed by such share class up to the lesser of: (a) the amount of fees waived and/or expenses reimbursed during those prior two fiscal years under the agreement and (b) an amount not to exceed either the current expense limitation of that share class or the expense limitation of the share class in effect at the time that the share class received the applicable waiver and/or reimbursement, provided that:
| | (1) | The Fund, of which the share class is a part, has more than $50 million in assets for the fiscal year, and |
| | (2) | BAL, BFA or an affiliate continues to serve as the Fund’s investment adviser or administrator. |
This repayment applies only to the contractual expense limitation on net expenses and does not apply to any voluntary waivers that may be in effect from time to time. Effective December 1, 2019, the repayment arrangement between the Fund and the BFA and/or BAL pursuant to which such Fund may be required to repay amounts waived and/or reimbursed under the Fund’s contractual caps on net expenses was terminated.
For the year ended December 31, 2019, BAL recouped the following fund level and class specific waivers and/or reimbursements previously recorded by the Fund:
| | | | | | | | | | | | | | |
| Institutional | | | | | Investor A | | | | | Class K | |
| $ | 7,827 | | | | | $ | — | | | | | $ | — | |
| | |
| 14 | | 2019 BLACKROCK ANNUAL REPORTTO SHAREHOLDERS |
Notes to Financial Statements (continued)
The following fund level and class specific waivers and/or reimbursements previously recorded by the Fund, which were subject to recoupment by the Administrator, expired on December 1, 2019:
| | | | |
Fund Level | | $ | 130,759 | |
Institutional | | | 4,905 | |
Investor A | | | 672,592 | |
Class K | | | 22,450 | |
Interfund Lending: In accordance with an exemptive order (the “Order”) from the U.S. Securities and Exchange Commission (“SEC”), the Fund may participate in a joint lending and borrowing facility for temporary purposes (the “Interfund Lending Program”), subject to compliance with the terms and conditions of the Order, and to the extent permitted by the Fund’s investment policies and restrictions. The Fund is currently permitted to borrow and lend under the Interfund Lending Program.
A lending BlackRock fund may lend in aggregate up to 15% of its net assets, but may not lend more than 5% of its net assets to any one borrowing fund through the Interfund Lending Program. A borrowing BlackRock fund may not borrow through the Interfund Lending Program or from any other source more than 33 1/3% of its total assets (or any lower threshold provided for by the fund’s investment restrictions). If a borrowing BlackRock fund’s total outstanding borrowings exceed 10% of its total assets, each of its outstanding interfund loans will be subject to collateralization of at least 102% of the outstanding principal value of the loan. All interfund loans are for temporary or emergency purposes and the interest rate to be charged will be the average of the highest current overnight repurchase agreement rate available to a lending fund and the bank loan rate, as calculated according to a formula established by the Board.
During the year ended December 31, 2019, the Fund did not participate in the Interfund Lending Program.
Trustees and Officers:Certain trustees and/or officers of the Trust are directors and/or officers of BlackRock or its affiliates. The Fund reimburses the Administrator for a portion of the compensation paid to the Trust’s Chief Compliance Officer, which is included in Trustees and Officers in the Master Portfolio’s Statement of Operations.
It is the Fund’s policy to comply with the requirements of the Internal Revenue Code of 1986, as amended, applicable to regulated investment companies, and to distribute substantially all of its taxable income to its shareholders. Therefore, no U.S. federal income tax provision is required.
The Fund files U.S. federal and various state and local tax returns. No income tax returns are currently under examination. The statute of limitations on the Fund’s U.S. federal tax returns generally remains open for each of the four years ended December 31, 2019. The statutes of limitations on the Fund’s state and local tax returns may remain open for an additional year depending upon the jurisdiction.
Management has analyzed tax laws and regulations and their application to the Fund as of December 31, 2019, inclusive of the open tax return years, and does not believe that there are any uncertain tax positions that require recognition of a tax liability in the Fund’s financial statements.
The tax character of distributions paid was as follows:
| | | | | | | | |
| | | 12/31/19 | | | 12/31/18 | |
Ordinary income | | $ | 8,247,420 | | | $ | 5,417,827 | |
Long-term capital gains | | | 2,369,076 | | | | 286,648 | |
| | | | | | | | |
| | $ | 10,616,496 | | | $ | 5,704,475 | |
| | | | | | | | |
As of period end, the tax components of accumulated net earnings were as follows:
| | | | |
Undistributed ordinary income | | $ | 501,667 | |
Undistributed long-term capital gains | | | 301,325 | |
Net unrealized gains (losses)(a) | | | 138,997,596 | |
| | | | |
| | $ | 139,800,588 | |
| | | | |
| | (a) | The differences between book-basis andtax-basis net unrealized gains (losses) was attributable primarily to the timing and recognition of partnership income. | |
| | | | |
| NOTESTO FINANCIAL STATEMENTS | | | 15 | |
Notes to Financial Statements (continued)
| 6. | CAPITAL SHARE TRANSACTIONS |
Transactions in capital shares for each class were as follows:
| | | | | | | | | | | | | | | | |
| | | Year Ended
12/31/19 | | | Year Ended
12/31/18 | |
| | | Shares | | | Amount | | | Shares | | | Amount | |
Institutional | | | | | | | | | | | | | | | | |
Shares sold | | | 835,213 | | | $ | 16,242,478 | | | | 5,051,507 | | | $ | 88,693,979 | |
Shares issued in reinvestment of distributions | | | 114,292 | | | | 2,268,551 | | | | 74,900 | | | | 1,331,969 | |
Shares redeemed | | | (3,204,338 | ) | | | (59,262,954 | ) | | | (1,523,221 | ) | | | (26,923,935 | ) |
| | | | | | | | | | | | | | | | |
Net increase (decrease) | | | (2,254,833 | ) | | $ | (40,751,925 | ) | | | 3,603,186 | | | $ | 63,102,013 | |
| | | | | | | | | | | | | | | | |
| | | | |
Investor A | | | | | | | | | | | | | | | | |
Shares sold | | | 2,162,888 | | | $ | 41,459,170 | | | | 1,705,626 | | | $ | 30,961,424 | |
Shares issued in reinvestment of distributions | | | 102,558 | | | | 2,032,024 | | | | 70,288 | | | | 1,251,040 | |
Shares redeemed | | | (1,658,112 | ) | | | (31,775,082 | ) | | | (2,049,828 | ) | | | (37,625,741 | ) |
| | | | | | | | | | | | | | | | |
Net increase (decrease) | | | 607,334 | | | $ | 11,716,112 | | | | (273,914 | ) | | $ | (5,413,277 | ) |
| | | | | | | | | | | | | | | | |
| | | | |
Class K | | | | | | | | | | | | | | | | |
Shares sold | | | 7,134,662 | | | $ | 141,511,748 | | | | 5,439,208 | | | $ | 98,354,555 | |
Shares issued in reinvestment of distributions | | | 302,081 | | | | 5,980,524 | | | | 170,696 | | | | 3,044,531 | |
Shares redeemed | | | (3,110,790 | ) | | | (60,756,648 | ) | | | (1,863,036 | ) | | | (33,762,946 | ) |
| | | | | | | | | | | | | | | | |
Net increase | | | 4,325,953 | | | $ | 86,735,624 | | | | 3,746,868 | | | $ | 67,636,140 | |
| | | | | | | | | | | | | | | | |
Total Net Increase | | | 2,678,454 | | | $ | 57,699,811 | | | | 7,076,140 | | | $ | 125,324,876 | |
| | | | | | | | | | | | | | | | |
Management has evaluated the impact of all subsequent events on the Fund through the date the financial statements were issued and has determined that there were no subsequent events requiring adjustment or additional disclosure in the financial statements.
| | |
| 16 | | 2019 BLACKROCK ANNUAL REPORTTO SHAREHOLDERS |
| | |
| Report of Independent Registered Public Accounting Firm | | iShares Russell 1000 Large-Cap Index Fund |
To the Board of Trustees of
BlackRock Funds III and Shareholders of iShares Russell 1000 Large-Cap Index Fund
Opinion on the Financial Statements
We have audited the accompanying statement of assets and liabilities of iShares Russell 1000 Large-Cap Index Fund (one of the series constituting BlackRock Funds III, referred to hereafter as the “Fund”) as of December 31, 2019, the related statement of operations for the year ended December 31, 2019, the statements of changes in net assets for each of the two years in the period ended December 31, 2019, including the related notes, and the financial highlights for each of the five years in the period ended December 31, 2019 (collectively referred to as the “financial statements”). In our opinion, the financial statements present fairly, in all material respects, the financial position of the Fund as of December 31, 2019, the results of its operations for the year then ended, the changes in its net assets for each of the two years in the period ended December 31, 2019 and the financial highlights for each of the five years in the period ended December 31, 2019 in conformity with accounting principles generally accepted in the United States of America.
Basis for Opinion
These financial statements are the responsibility of the Fund’s management. Our responsibility is to express an opinion on the Fund’s financial statements based on our audits. We are a public accounting firm registered with the Public Company Accounting Oversight Board (United States) (“PCAOB”) and are required to be independent with respect to the Fund in accordance with the U.S. federal securities laws and the applicable rules and regulations of the Securities and Exchange Commission and the PCAOB.
We conducted our audits of these financial statements in accordance with the standards of the PCAOB. Those standards require that we plan and perform the audit to obtain reasonable assurance about whether the financial statements are free of material misstatement, whether due to error or fraud.
Our audits included performing procedures to assess the risks of material misstatement of the financial statements, whether due to error or fraud, and performing procedures that respond to those risks. Such procedures included examining, on a test basis, evidence regarding the amounts and disclosures in the financial statements. Our audits also included evaluating the accounting principles used and significant estimates made by management, as well as evaluating the overall presentation of the financial statements. Our procedures included confirmation of securities owned as of December 31, 2019 by correspondence with the administrator of the Master Portfolio. We believe that our audits provide a reasonable basis for our opinion.
/s/PricewaterhouseCoopers LLP
Philadelphia, Pennsylvania
February 27, 2020
We have served as the auditor of one or more BlackRock investment companies since 2000.
Important Tax Information (unaudited)
During the fiscal year ended December 31, 2019, the following information is provided with respect to the ordinary income distributions paid by the Fund:
| | |
| | | January – December 2019 |
Qualified Dividend Income for Individuals(a) | | 73.31% |
Qualified Business Income(a) | | 4.92 |
Dividends Qualifying for the Dividend Received Deductions for Corporations(a) | | 70.52 |
Interest-Related Dividends and Qualified Short-Term Capital Gains for Non-U.S. Residents(b) | | 15.72 |
| | (a) | The Fund hereby designates the percentage indicated above or the maximum amount allowable by law. | |
| | (b) | Represents the portion of the taxable ordinary income dividends eligible for exemption from U.S. withholding tax for nonresident aliens and foreign corporations. | |
Additionally, the Fund distributed long-term capital gains of 0.061932 per share and 0.066149 per share to shareholders of record on June 27, 2019 and December 11, 2019, respectively.
| | | | |
| REPORT OF INDEPENDENT REGISTERED PUBLIC ACCOUNTING FIRM / IMPORTANT TAX INFORMATION | | | 17 | |
| | |
| Master Portfolio Information as of December 31, 2019 | | Large Cap Index Master Portfolio |
TEN LARGEST HOLDINGS
| | | | |
| Security | | Percent of
Net Assets | |
Apple, Inc. | | | 4 | % |
Microsoft Corp. | | | 4 | |
Alphabet, Inc. | | | 3 | |
Amazon.com, Inc. | | | 3 | |
Facebook, Inc. | | | 2 | |
Berkshire Hathaway, Inc. | | | 1 | |
JPMorgan Chase & Co. | | | 1 | |
Johnson & Johnson | | | 1 | |
Visa, Inc. | | | 1 | |
Procter & Gamble Co. | | | 1 | |
SECTOR ALLOCATION
| | | | |
| Sector | | Percent of
Net Assets | |
Information Technology | | | 22 | % |
Health Care | | | 14 | |
Financials | | | 13 | |
Short-Term Securities | | | 11 | |
Consumer Discretionary | | | 10 | |
Communication Services | | | 10 | |
Industrials | | | 9 | |
Consumer Staples | | | 6 | |
Energy | | | 4 | |
Real Estate | | | 4 | |
Utilities | | | 3 | |
Materials | | | 3 | |
Investment Companies | | | — | (a) |
Liabilities in Excess of Other Assets | | | (9 | ) |
| | (a) | Represents less than 1% of Net Assets. | |
For Master Portfolio compliance purposes, the Master Portfolio’s sector classifications refer to one or more of the sector sub-classifications used by one or more widely recognized market indexes or ratings group indexes, and/or as defined by the investment adviser. These definitions may not apply for purposes of this report, which may combine such sector sub-classifications for reporting ease.
Derivative Financial Instruments
The Master Portfolio may invest in various derivative financial instruments. These instruments are used to obtain exposure to a security, commodity, index, market, and/or other assets without owning or taking physical custody of securities, commodities and/or other referenced assets or to manage market, equity, credit, interest rate, foreign currency exchange rate, commodity and/or other risks. Derivative financial instruments may give rise to a form of economic leverage and involve risks, including the imperfect correlation between the value of a derivative financial instrument and the underlying asset, possible default of the counterparty to the transaction or illiquidity of the instrument. The Master Portfolio’s successful use of a derivative financial instrument depends on the investment adviser’s ability to predict pertinent market movements accurately, which cannot be assured. The use of these instruments may result in losses greater than if they had not been used, may limit the amount of appreciation the Master Portfolio can realize on an investment and/or may result in lower distributions paid to shareholders. The Master Portfolio’s investments in these instruments, if any, are discussed in detail in the Master Portfolio’s Notes to Financial Statements.
| | |
| 18 | | 2019 BLACKROCK ANNUAL REPORTTO SHAREHOLDERS |
| | |
Schedule of Investments December 31, 2019 | | Large Cap Index Master Portfolio (Percentages shown are based on Net Assets) |
| | | | | | | | |
| Security | | Shares | | | Value | |
|
Common Stocks — 97.8% | |
|
| Aerospace & Defense — 2.3% | |
Arconic, Inc. | | | 192,490 | | | $ | 5,922,917 | |
Boeing Co. | | | 263,980 | | | | 85,994,125 | |
Curtiss-Wright Corp.(a) | | | 20,691 | | | | 2,915,155 | |
General Dynamics Corp. | | | 126,670 | | | | 22,338,255 | |
HEICO Corp.(a) | | | 19,708 | | | | 2,249,668 | |
HEICO Corp., Class A | | | 38,142 | | | | 3,414,853 | |
Hexcel Corp.(a) | | | 42,866 | | | | 3,142,507 | |
Huntington Ingalls Industries, Inc.(a) | | | 19,707 | | | | 4,944,092 | |
L3Harris Technologies, Inc.(a) | | | 109,735 | | | | 21,713,264 | |
Lockheed Martin Corp.(a) | | | 123,614 | | | | 48,132,819 | |
Northrop Grumman Corp. | | | 78,616 | | | | 27,041,546 | |
Raytheon Co. | | | 138,941 | | | | 30,530,895 | |
Spirit AeroSystems Holdings, Inc., Class A | | | 50,972 | | | | 3,714,839 | |
Teledyne Technologies, Inc.(a)(b) | | | 17,683 | | | | 6,127,867 | |
Textron, Inc. | | | 114,868 | | | | 5,123,113 | |
TransDigm Group, Inc.(a) | | | 24,497 | | | | 13,718,320 | |
United Technologies Corp. | | | 404,934 | | | | 60,642,916 | |
| | | | | | | | |
| | | | 347,667,151 | |
|
| Air Freight & Logistics — 0.5% | |
C.H. Robinson Worldwide, Inc.(a) | | | 66,034 | | | | 5,163,859 | |
Expeditors International of Washington, Inc. | | | 84,750 | | | | 6,612,195 | |
FedEx Corp.(a) | | | 120,446 | | | | 18,212,640 | |
United Parcel Service, Inc., Class B | | | 349,393 | | | | 40,899,944 | |
XPO Logistics, Inc.(a)(b) | | | 45,967 | | | | 3,663,570 | |
| | | | | | | | |
| | | | 74,552,208 | |
|
| Airlines — 0.4% | |
Alaska Air Group, Inc.(a) | | | 59,973 | | | | 4,063,171 | |
American Airlines Group, Inc.(a) | | | 191,606 | | | | 5,495,260 | |
Copa Holdings SA, Class A(a) | | | 16,783 | | | | 1,813,907 | |
Delta Air Lines, Inc. | | | 288,918 | | | | 16,895,924 | |
JetBlue Airways Corp.(b) | | | 145,335 | | | | 2,720,671 | |
Southwest Airlines Co. | | | 235,655 | | | | 12,720,657 | |
United Airlines Holdings, Inc.(b) | | | 116,488 | | | | 10,261,428 | |
| | | | | | | | |
| | | | 53,971,018 | |
|
| Auto Components — 0.2% | |
Aptiv PLC(a) | | | 127,762 | | | | 12,133,557 | |
BorgWarner, Inc.(a) | | | 102,606 | | | | 4,451,048 | |
Gentex Corp.(a) | | | 122,538 | | | | 3,551,151 | |
Goodyear Tire & Rubber Co.(a) | | | 118,824 | | | | 1,848,307 | |
Lear Corp.(a) | | | 31,102 | | | | 4,267,195 | |
| | | | | | | | |
| | | | 26,251,258 | |
|
| Automobiles — 0.5% | |
Ford Motor Co.(a) | | | 1,957,454 | | | | 18,204,322 | |
General Motors Co. | | | 616,887 | | | | 22,578,064 | |
Harley-Davidson, Inc.(a) | | | 75,324 | | | | 2,801,300 | |
Tesla, Inc.(a)(b) | | | 70,895 | | | | 29,657,505 | |
Thor Industries, Inc.(a) | | | 27,643 | | | | 2,053,599 | |
| | | | | | | | |
| | | | 75,294,790 | |
|
| Banks — 5.4% | |
Associated Banc-Corp | | | 73,078 | | | | 1,610,639 | |
Bank of America Corp.(a) | | | 4,058,771 | | | | 142,949,915 | |
Bank of Hawaii Corp.(a) | | | 18,581 | | | | 1,768,168 | |
Bank OZK(a) | | | 57,786 | | | | 1,762,762 | |
BankUnited, Inc. | | | 50,616 | | | | 1,850,521 | |
BOK Financial Corp.(a) | | | 15,956 | | | | 1,394,554 | |
CIT Group, Inc.(a) | | | 50,610 | | | | 2,309,334 | |
Citigroup, Inc. | | | 1,088,375 | | | | 86,950,279 | |
Citizens Financial Group, Inc. | | | 219,674 | | | | 8,920,961 | |
Comerica, Inc.(a) | | | 71,982 | | | | 5,164,708 | |
Commerce Bancshares, Inc.(a) | | | 49,429 | | | | 3,358,206 | |
| | | | | | | | |
| Security | | Shares | | | Value | |
|
| Banks (continued) | |
Cullen/Frost Bankers, Inc.(a) | | | 28,357 | | | $ | 2,772,747 | |
East West Bancorp, Inc.(a) | | | 71,292 | | | | 3,471,920 | |
Fifth Third Bancorp | | | 351,858 | | | | 10,816,115 | |
First Citizens BancShares, Inc., Class A | | | 3,311 | | | | 1,762,147 | |
First Hawaiian, Inc.(a) | | | 68,030 | | | | 1,962,666 | |
First Horizon National Corp. | | | 155,035 | | | | 2,567,380 | |
First Republic Bank | | | 83,788 | | | | 9,840,901 | |
FNB Corp. | | | 164,449 | | | | 2,088,502 | |
Huntington Bancshares, Inc.(a) | | | 517,258 | | | | 7,800,251 | |
JPMorgan Chase & Co. | | | 1,555,421 | | | | 216,825,687 | |
KeyCorp | | | 488,177 | | | | 9,880,702 | |
M&T Bank Corp.(a) | | | 65,237 | | | | 11,073,981 | |
PacWest Bancorp(a) | | | 60,351 | | | | 2,309,633 | |
People’s United Financial, Inc.(a) | | | 218,199 | | | | 3,687,563 | |
Pinnacle Financial Partners, Inc.(a) | | | 35,816 | | | | 2,292,224 | |
PNC Financial Services Group, Inc. | | | 218,214 | | | | 34,833,501 | |
Popular, Inc. | | | 48,885 | | | | 2,871,994 | |
Prosperity Bancshares, Inc.(a) | | | 45,146 | | | | 3,245,546 | |
Regions Financial Corp. | | | 480,167 | | | | 8,239,666 | |
Signature Bank | | | 26,656 | | | | 3,641,476 | |
Sterling Bancorp | | | 96,029 | | | | 2,024,291 | |
SVB Financial Group(a)(b) | | | 26,056 | | | | 6,541,098 | |
Synovus Financial Corp. | | | 66,409 | | | | 2,603,233 | |
TCF Financial Corp.(a) | | | 72,846 | | | | 3,409,193 | |
Texas Capital Bancshares, Inc.(b) | | | 22,922 | | | | 1,301,282 | |
Truist Financial Corp.(a) | | | 670,004 | | | | 37,734,625 | |
U.S. Bancorp(a) | | | 715,638 | | | | 42,430,177 | |
Umpqua Holdings Corp.(a) | | | 109,831 | | | | 1,944,009 | |
Webster Financial Corp. | | | 45,042 | | | | 2,403,441 | |
Wells Fargo & Co.(a) | | | 1,900,742 | | | | 102,259,920 | |
Western Alliance Bancorp(a) | | | 49,758 | | | | 2,836,206 | |
Wintrust Financial Corp. | | | 30,232 | | | | 2,143,449 | |
Zions Bancorp. NA | | | 85,292 | | | | 4,428,361 | |
| | | | | | | | |
| | | | 812,083,934 | |
|
| Beverages — 1.6% | |
Brown-Forman Corp., Class A(a) | | | 22,750 | | | | 1,428,018 | |
Brown-Forman Corp., Class B(a) | | | 84,118 | | | | 5,686,377 | |
Coca-Cola Co.(a) | | | 1,911,989 | | | | 105,828,591 | |
Constellation Brands, Inc., Class A | | | 78,627 | | | | 14,919,473 | |
Keurig Dr Pepper, Inc. | | | 103,659 | | | | 3,000,928 | |
Molson Coors Brewing Co., Class B(a) | | | 84,986 | | | | 4,580,745 | |
Monster Beverage Corp.(b) | | | 191,979 | | | | 12,200,266 | |
PepsiCo, Inc. | | | 698,620 | | | | 95,480,395 | |
| | | | | | | | |
| | | | 243,124,793 | |
|
| Biotechnology — 2.1% | |
AbbVie, Inc.(a) | | | 738,034 | | | | 65,345,530 | |
Agios Pharmaceuticals, Inc.(a)(b) | | | 31,302 | | | | 1,494,671 | |
Alexion Pharmaceuticals, Inc.(b) | | | 107,077 | | | | 11,580,378 | |
Alkermes PLC(b) | | | 84,964 | | | | 1,733,266 | |
Alnylam Pharmaceuticals, Inc.(a)(b) | | | 53,583 | | | | 6,171,154 | |
Amgen, Inc.(a) | | | 299,118 | | | | 72,108,376 | |
Biogen, Inc.(b) | | | 89,750 | | | | 26,631,518 | |
BioMarin Pharmaceutical, Inc.(b) | | | 87,388 | | | | 7,388,655 | |
Bluebird Bio, Inc.(a)(b) | | | 28,635 | | | | 2,512,721 | |
Exact Sciences Corp.(a)(b) | | | 69,271 | | | | 6,406,182 | |
Exelixis, Inc.(a)(b) | | | 155,720 | | | | 2,743,786 | |
Gilead Sciences, Inc. | | | 638,149 | | | | 41,466,922 | |
Incyte Corp.(b) | | | 89,140 | | | | 7,783,705 | |
Ionis Pharmaceuticals, Inc.(b) | | | 65,405 | | | | 3,951,116 | |
Moderna, Inc.(a)(b) | | | 97,200 | | | | 1,901,232 | |
Neurocrine Biosciences, Inc.(b) | | | 45,041 | | | | 4,841,457 | |
Regeneron Pharmaceuticals, Inc.(b) | | | 40,533 | | | | 15,219,331 | |
Sage Therapeutics, Inc.(a)(b) | | | 25,531 | | | | 1,843,083 | |
| | | | |
| SCHEDULE OF INVESTMENTS | | | 19 | |
| | |
Schedule of Investments (continued) December 31, 2019 | | Large Cap Index Master Portfolio (Percentages shown are based on Net Assets) |
| | | | | | | | |
| Security | | Shares | | | Value | |
|
| Biotechnology (continued) | |
Sarepta Therapeutics, Inc.(a)(b) | | | 35,811 | | | $ | 4,621,051 | |
Seattle Genetics, Inc.(a)(b) | | | 57,439 | | | | 6,562,980 | |
United Therapeutics Corp.(b) | | | 21,009 | | | | 1,850,473 | |
Vertex Pharmaceuticals, Inc.(b) | | | 128,489 | | | | 28,132,667 | |
| | | | | | | | |
| | | | 322,290,254 | |
|
| Building Products — 0.3% | |
Allegion PLC | | | 45,423 | | | | 5,656,980 | |
AO Smith Corp.(a) | | | 66,918 | | | | 3,187,974 | |
Armstrong World Industries, Inc. | | | 24,670 | | | | 2,318,240 | |
Fortune Brands Home & Security, Inc.(a) | | | 67,809 | | | | 4,430,640 | |
Johnson Controls International PLC(a) | | | 384,875 | | | | 15,668,261 | |
Lennox International, Inc.(a) | | | 17,449 | | | | 4,257,033 | |
Masco Corp.(a) | | | 144,087 | | | | 6,914,735 | |
Owens Corning(a) | | | 53,684 | | | | 3,495,902 | |
Resideo Technologies, Inc.(b) | | | 57,907 | | | | 690,830 | |
| | | | | | | | |
| | | | 46,620,595 | |
|
| Capital Markets — 2.5% | |
Affiliated Managers Group, Inc.(a) | | | 23,180 | | | | 1,964,273 | |
Ameriprise Financial, Inc.(a) | | | 63,044 | | | | 10,501,870 | |
Bank of New York Mellon Corp. | | | 408,939 | | | | 20,581,900 | |
BGC Partners, Inc., Class A(a) | | | 151,735 | | | | 901,306 | |
BlackRock, Inc.(a)(e) | | | 58,828 | | | | 29,572,836 | |
Cboe Global Markets, Inc. | | | 55,368 | | | | 6,644,160 | |
Charles Schwab Corp.(a) | | | 572,841 | | | | 27,244,318 | |
CME Group, Inc. | | | 177,314 | | | | 35,590,466 | |
E*Trade Financial Corp. | | | 112,190 | | | | 5,090,060 | |
Eaton Vance Corp.(a) | | | 52,909 | | | | 2,470,321 | |
Evercore, Inc., Class A | | | 18,456 | | | | 1,379,771 | |
Franklin Resources, Inc.(a) | | | 139,934 | | | | 3,635,485 | |
Goldman Sachs Group, Inc.(a) | | | 158,853 | | | | 36,525,070 | |
Intercontinental Exchange, Inc. | | | 273,105 | | | | 25,275,868 | |
Invesco Ltd.(a) | | | 191,292 | | | | 3,439,430 | |
Janus Henderson Group PLC(a) | | | 77,789 | | | | 1,901,941 | |
Lazard Ltd., Class A | | | 51,262 | | | | 2,048,430 | |
Legg Mason, Inc.(a) | | | 47,205 | | | | 1,695,132 | |
LPL Financial Holdings, Inc. | | | 39,983 | | | | 3,688,432 | |
MarketAxess Holdings, Inc. | | | 18,357 | | | | 6,959,322 | |
Moody’s Corp.(a) | | | 82,104 | | | | 19,492,311 | |
Morgan Stanley | | | 580,286 | | | | 29,664,220 | |
MSCI, Inc. | | | 41,034 | | | | 10,594,158 | |
Nasdaq, Inc.(a) | | | 56,674 | | | | 6,069,785 | |
Northern Trust Corp.(a) | | | 96,438 | | | | 10,245,573 | |
Raymond James Financial, Inc.(a) | | | 62,474 | | | | 5,588,924 | |
S&P Global, Inc.(a) | | | 122,190 | | | | 33,363,979 | |
SEI Investments Co.(a) | | | 65,143 | | | | 4,265,564 | |
State Street Corp. | | | 180,823 | | | | 14,303,099 | |
T. Rowe Price Group, Inc.(a) | | | 114,279 | | | | 13,923,753 | |
TD Ameritrade Holding Corp. | | | 132,001 | | | | 6,560,450 | |
Virtu Financial, Inc., Class A(a) | | | 27,179 | | | | 434,592 | |
| | | | | | | | |
| | | | 381,616,799 | |
|
| Chemicals — 1.9% | |
Air Products & Chemicals, Inc. | | | 109,285 | | | | 25,680,882 | |
Albemarle Corp.(a) | | | 51,954 | | | | 3,794,720 | |
Ashland Global Holdings, Inc.(a) | | | 29,670 | | | | 2,270,645 | |
Axalta Coating Systems Ltd.(b) | | | 102,122 | | | | 3,104,509 | |
Cabot Corp. | | | 30,544 | | | | 1,451,451 | |
Celanese Corp.(a) | | | 59,619 | | | | 7,340,291 | |
CF Industries Holdings, Inc. | | | 111,351 | | | | 5,315,897 | |
Chemours Co.(a) | | | 88,178 | | | | 1,595,140 | |
Corteva, Inc.(a)(b) | | | 379,284 | | | | 11,211,635 | |
Dow, Inc.(b) | | | 373,915 | | | | 20,464,368 | |
DuPont de Nemours, Inc. | | | 367,860 | | | | 23,616,612 | |
Eastman Chemical Co. | | | 68,468 | | | | 5,426,774 | |
| | | | | | | | |
| Security | | Shares | | | Value | |
|
| Chemicals (continued) | |
Ecolab, Inc.(a) | | | 125,222 | | | $ | 24,166,594 | |
Element Solutions, Inc.(b) | | | 111,683 | | | | 1,304,457 | |
FMC Corp.(a) | | | 63,810 | | | | 6,369,514 | |
Huntsman Corp. | | | 104,039 | | | | 2,513,582 | |
International Flavors & Fragrances, Inc.(a) | | | 53,449 | | | | 6,895,990 | |
Linde PLC(a) | | | 267,856 | | | | 57,026,542 | |
LyondellBasell Industries NV, Class A(a) | | | 134,016 | | | | 12,661,832 | |
Mosaic Co.(a) | | | 175,070 | | | | 3,788,515 | |
NewMarket Corp. | | | 3,234 | | | | 1,573,406 | |
Olin Corp.(a) | | | 87,061 | | | | 1,501,802 | |
PPG Industries, Inc. | | | 116,930 | | | | 15,608,986 | |
RPM International, Inc.(a) | | | 63,771 | | | | 4,895,062 | |
ScottsMiracle-Gro Co.(a) | | | 19,170 | | | | 2,035,471 | |
Sherwin-Williams Co.(a) | | | 41,173 | | | | 24,026,092 | |
Valvoline, Inc. | | | 97,038 | | | | 2,077,584 | |
Westlake Chemical Corp.(a) | | | 19,417 | | | | 1,362,103 | |
WR Grace & Co. | | | 26,890 | | | | 1,878,266 | |
| | | | | | | | |
| | | | 280,958,722 | |
|
| Commercial Services & Supplies — 0.4% | |
ADT, Inc.(a) | | | 75,681 | | | | 600,150 | |
Cintas Corp.(a) | | | 42,026 | | | | 11,308,356 | |
Clean Harbors, Inc.(b) | | | 24,197 | | | | 2,074,893 | |
Copart, Inc.(a)(b) | | | 100,270 | | | | 9,118,554 | |
IAA, Inc.(b) | | | 63,921 | | | | 3,008,122 | |
KAR Auction Services, Inc.(a) | | | 68,838 | | | | 1,499,980 | |
Republic Services, Inc.(a) | | | 105,211 | | | | 9,430,062 | |
Rollins, Inc.(a) | | | 68,001 | | | | 2,254,913 | |
Stericycle, Inc.(a)(b) | | | 45,849 | | | | 2,925,625 | |
Waste Management, Inc. | | | 210,988 | | | | 24,044,193 | |
| | | | | | | | |
| | | | 66,264,848 | |
|
| Communications Equipment — 0.9% | |
Arista Networks, Inc.(a)(b) | | | 29,421 | | | | 5,984,232 | |
Ciena Corp.(b) | | | 77,954 | | | | 3,327,856 | |
Cisco Systems, Inc. | | | 2,136,820 | | | | 102,481,887 | |
CommScope Holding Co., Inc.(a)(b) | | | 92,581 | | | | 1,313,724 | |
EchoStar Corp., Class A(a)(b) | | | 24,263 | | | | 1,050,831 | |
F5 Networks, Inc.(b) | | | 29,502 | | | | 4,119,954 | |
Juniper Networks, Inc. | | | 165,161 | | | | 4,067,916 | |
Motorola Solutions, Inc. | | | 85,274 | | | | 13,741,052 | |
Ubiquiti, Inc.(a) | | | 4,263 | | | | 805,622 | |
ViaSat, Inc.(a)(b) | | | 28,882 | | | | 2,114,018 | |
| | | | | | | | |
| | | | 139,007,092 | |
|
| Construction & Engineering — 0.1% | |
AECOM(a)(b) | | | 79,444 | | | | 3,426,420 | |
Fluor Corp.(a) | | | 67,551 | | | | 1,275,363 | |
Jacobs Engineering Group, Inc. | | | 66,264 | | | | 5,952,495 | |
Quanta Services, Inc.(a) | | | 73,159 | | | | 2,978,303 | |
| | | | | | | | |
| | | | 13,632,581 | |
|
| Construction Materials — 0.1% | |
Eagle Materials, Inc.(a) | | | 19,562 | | | | 1,773,491 | |
Martin Marietta Materials, Inc. | | | 30,684 | | | | 8,580,473 | |
Vulcan Materials Co. | | | 64,623 | | | | 9,305,066 | |
| | | | | | | | |
| | | | 19,659,030 | |
|
| Consumer Finance — 0.7% | |
Ally Financial, Inc. | | | 188,997 | | | | 5,775,748 | |
American Express Co. | | | 334,281 | | | | 41,614,642 | |
Capital One Financial Corp. | | | 232,292 | | | | 23,905,170 | |
Credit Acceptance Corp.(a)(b) | | | 5,510 | | | | 2,437,238 | |
Discover Financial Services(a) | | | 155,312 | | | | 13,173,564 | |
Navient Corp.(a) | | | 102,171 | | | | 1,397,699 | |
OneMain Holdings, Inc. | | | 32,596 | | | | 1,373,921 | |
Santander Consumer USA Holdings, Inc.(a) | | | 49,708 | | | | 1,161,676 | |
| | |
| 20 | | 2019 BLACKROCK ANNUAL REPORTTO SHAREHOLDERS |
| | |
Schedule of Investments (continued) December 31, 2019 | | Large Cap Index Master Portfolio (Percentages shown are based on Net Assets) |
| | | | | | | | |
| Security | | Shares | | | Value | |
|
| Consumer Finance (continued) | |
SLM Corp.(a) | | | 208,224 | | | $ | 1,855,276 | |
Synchrony Financial | | | 321,603 | | | | 11,580,924 | |
| | | | | | | | |
| | | | 104,275,858 | |
|
| Containers & Packaging — 0.4% | |
AptarGroup, Inc.(a) | | | 31,639 | | | | 3,658,101 | |
Ardagh Group SA(a) | | | 6,425 | | | | 125,801 | |
Avery Dennison Corp. | | | 40,686 | | | | 5,322,543 | |
Ball Corp.(a) | | | 160,829 | | | | 10,400,811 | |
Berry Global Group, Inc.(a)(b) | | | 66,475 | | | | 3,156,898 | |
Crown Holdings, Inc.(b) | | | 64,292 | | | | 4,663,742 | |
Graphic Packaging Holding Co. | | | 136,660 | | | | 2,275,389 | |
International Paper Co.(a) | | | 197,886 | | | | 9,112,650 | |
O-I Glass, Inc.(a) | | | 89,856 | | | | 1,071,982 | |
Packaging Corp. of America(a) | | | 47,915 | | | | 5,366,001 | |
Sealed Air Corp. | | | 74,294 | | | | 2,959,130 | |
Silgan Holdings, Inc. | | | 35,936 | | | | 1,116,891 | |
Sonoco Products Co.(a) | | | 51,845 | | | | 3,199,873 | |
Westrock Co. | | | 129,015 | | | | 5,536,034 | |
| | | | | | | | |
| | | | 57,965,846 | |
|
| Distributors — 0.1% | |
Genuine Parts Co.(a) | | | 71,519 | | | | 7,597,463 | |
LKQ Corp.(b) | | | 151,191 | | | | 5,397,519 | |
Pool Corp.(a) | | | 19,823 | | | | 4,210,009 | |
| | | | | | | | |
| | | | 17,204,991 | |
| | |
| Diversified Consumer Services — 0.1% | | | | | | |
2U, Inc.(a)(b) | | | 24,787 | | | | 594,640 | |
Bright Horizons Family Solutions, Inc.(b) | | | 28,371 | | | | 4,263,877 | |
frontdoor, Inc.(a)(b) | | | 41,792 | | | | 1,981,777 | |
Graham Holdings Co., Class B | | | 2,130 | | | | 1,361,049 | |
Grand Canyon Education, Inc.(a)(b) | | | 22,371 | | | | 2,142,918 | |
H&R Block, Inc.(a) | | | 95,640 | | | | 2,245,627 | |
Service Corp. International(a) | | | 88,897 | | | | 4,091,929 | |
ServiceMaster Global Holdings, Inc.(b) | | | 64,797 | | | | 2,505,052 | |
| | | | | | | | |
| | | | 19,186,869 | |
|
| Diversified Financial Services — 1.6% | |
AXA Equitable Holdings, Inc.(a) | | | 202,642 | | | | 5,021,469 | |
Berkshire Hathaway, Inc., Class B(b) | | | 975,680 | | | | 220,991,520 | |
FactSet Research Systems, Inc.(a) | | | 18,528 | | | | 4,971,063 | |
Interactive Brokers Group, Inc., Class A(a) | | | 37,593 | | | | 1,752,586 | |
Jefferies Financial Group, Inc.(a) | | | 134,720 | | | | 2,878,966 | |
Morningstar, Inc. | | | 9,274 | | | | 1,403,249 | |
Voya Financial, Inc.(a) | | | 66,781 | | | | 4,072,305 | |
| | | | | | | | |
| | | | 241,091,158 | |
|
| Diversified Telecommunication Services — 1.9% | |
AT&T, Inc.(a) | | | 3,641,394 | | | | 142,305,678 | |
CenturyLink, Inc.(a) | | | 542,221 | | | | 7,162,739 | |
Verizon Communications, Inc. | | | 2,064,210 | | | | 126,742,494 | |
Zayo Group Holdings, Inc.(b) | | | 113,667 | | | | 3,938,562 | |
| | | | | | | | |
| | | | 280,149,473 | |
|
| Electric Utilities — 1.9% | |
Alliant Energy Corp.(a) | | | 117,749 | | | | 6,443,225 | |
American Electric Power Co., Inc.(a) | | | 245,419 | | | | 23,194,550 | |
Avangrid, Inc.(a) | | | 29,257 | | | | 1,496,788 | |
Duke Energy Corp.(a) | | | 361,841 | | | | 33,003,518 | |
Edison International(a) | | | 174,501 | | | | 13,159,120 | |
Entergy Corp. | | | 99,717 | | | | 11,946,097 | |
Evergy, Inc. | | | 115,610 | | | | 7,525,055 | |
Eversource Energy(a) | | | 160,930 | | | | 13,690,315 | |
Exelon Corp. | | | 482,176 | | | | 21,982,404 | |
FirstEnergy Corp. | | | 270,511 | | | | 13,146,835 | |
Hawaiian Electric Industries, Inc.(a) | | | 54,040 | | | | 2,532,314 | |
| | | | | | | | |
| Security | | Shares | | | Value | |
|
| Electric Utilities (continued) | |
IDACORP, Inc. | | | 25,122 | | | $ | 2,683,030 | |
NextEra Energy, Inc. | | | 243,528 | | | | 58,972,740 | |
OGE Energy Corp. | | | 98,428 | | | | 4,377,093 | |
PG&E Corp.(a)(b) | | | 272,778 | | | | 2,965,097 | |
Pinnacle West Capital Corp. | | | 56,006 | | | | 5,036,619 | |
PPL Corp. | | | 360,640 | | | | 12,939,763 | |
Southern Co. | | | 516,844 | | | | 32,922,963 | |
Xcel Energy, Inc. | | | 261,231 | | | | 16,585,556 | |
| | | | | | | | |
| | | | 284,603,082 | |
|
| Electrical Equipment — 0.5% | |
Acuity Brands, Inc.(a) | | | 18,944 | | | | 2,614,272 | |
AMETEK, Inc. | | | 113,083 | | | | 11,278,898 | |
Eaton Corp. PLC | | | 205,733 | | | | 19,487,030 | |
Emerson Electric Co.(a) | | | 304,530 | | | | 23,223,458 | |
GrafTech International Ltd.(a) | | | 31,392 | | | | 364,775 | |
Hubbell, Inc.(a) | | | 27,954 | | | | 4,132,160 | |
nVent Electric PLC(a) | | | 71,057 | | | | 1,817,638 | |
Regal-Beloit Corp. | | | 20,675 | | | | 1,769,987 | |
Rockwell Automation, Inc. | | | 57,372 | | | | 11,627,583 | |
Sensata Technologies Holding PLC(a)(b) | | | 79,007 | | | | 4,256,107 | |
| | | | | | | | |
| | | | 80,571,908 | |
|
| Electronic Equipment, Instruments & Components — 0.6% | |
Amphenol Corp., Class A | | | 146,585 | | | | 15,864,895 | |
Arrow Electronics, Inc.(a)(b) | | | 40,032 | | | | 3,392,312 | |
Avnet, Inc.(a) | | | 51,693 | | | | 2,193,851 | |
CDW Corp.(a) | | | 70,116 | | | | 10,015,369 | |
Cognex Corp.(a) | | | 84,060 | | | | 4,710,722 | |
Coherent, Inc.(a)(b) | | | 11,192 | | | | 1,861,789 | |
Corning, Inc. | | | 377,038 | | | | 10,975,576 | |
Dolby Laboratories, Inc., Class A | | | 30,921 | | | | 2,127,365 | |
FLIR Systems, Inc. | | | 67,007 | | | | 3,489,054 | |
IPG Photonics Corp.(a)(b) | | | 18,042 | | | | 2,614,647 | |
Jabil, Inc. | | | 74,187 | | | | 3,066,149 | |
Keysight Technologies, Inc.(b) | | | 93,951 | | | | 9,642,191 | |
Littelfuse, Inc.(a) | | | 11,995 | | | | 2,294,644 | |
National Instruments Corp. | | | 66,691 | | | | 2,823,697 | |
SYNNEX Corp. | | | 21,063 | | | | 2,712,914 | |
Trimble, Inc.(b) | | | 127,143 | | | | 5,300,592 | |
Universal Display Corp.(a) | | | 21,362 | | | | 4,402,067 | |
Zebra Technologies Corp., Class A(a)(b) | | | 27,079 | | | | 6,917,060 | |
| | | | | | | | |
| | | | 94,404,894 | |
|
| Energy Equipment & Services — 0.4% | |
Apergy Corp.(a)(b) | | | 40,209 | | | | 1,358,260 | |
Baker Hughes Co.(a) | | | 325,101 | | | | 8,332,339 | |
Halliburton Co.(a) | | | 437,404 | | | | 10,703,276 | |
Helmerich & Payne, Inc.(a) | | | 51,067 | | | | 2,319,974 | |
National Oilwell Varco, Inc.(a) | | | 196,884 | | | | 4,931,944 | |
Patterson-UTI Energy, Inc. | | | 90,719 | | | | 952,549 | |
Schlumberger Ltd. | | | 694,700 | | | | 27,926,940 | |
Transocean Ltd.(a)(b) | | | 279,997 | | | | 1,926,379 | |
| | | | | | | | |
| | | | 58,451,661 | |
|
| Entertainment — 0.9% | |
Activision Blizzard, Inc. | | | 377,317 | | | | 22,420,176 | |
Electronic Arts, Inc.(b) | | | 145,907 | | | | 15,686,462 | |
Live Nation Entertainment, Inc.(b) | | | 64,325 | | | | 4,597,308 | |
Netflix, Inc.(b) | | | 210,239 | | | | 68,027,033 | |
Roku, Inc.(a)(b) | | | 43,429 | | | | 5,815,143 | |
Spotify Technology SA(b) | | | 58,124 | | | | 8,692,444 | |
Take-Two Interactive Software, Inc.(b) | | | 56,456 | | | | 6,911,908 | |
World Wrestling Entertainment, Inc., Class A(a) | | | 24,370 | | | | 1,580,882 | |
| | | | | | | | |
| | | | 133,731,356 | |
| | | | |
| SCHEDULE OF INVESTMENTS | | | 21 | |
| | |
Schedule of Investments (continued) December 31, 2019 | | Large Cap Index Master Portfolio (Percentages shown are based on Net Assets) |
| | | | | | | | |
| Security | | Shares | | | Value | |
|
| Equity Real Estate Investment Trusts (REITs) — 3.6% | |
Alexandria Real Estate Equities, Inc.(a) | | | 56,133 | | | $ | 9,069,970 | |
American Campus Communities, Inc.(a) | | | 67,830 | | | | 3,190,045 | |
American Homes 4 Rent, Class A(a) | | | 123,718 | | | | 3,242,649 | |
American Tower Corp. | | | 219,577 | | | | 50,463,186 | |
Americold Realty Trust(a) | | | 93,085 | | | | 3,263,560 | |
Apartment Investment & Management Co., Class A | | | 73,273 | | | | 3,784,551 | |
Apple Hospitality REIT, Inc.(a) | | | 96,831 | | | | 1,573,504 | |
AvalonBay Communities, Inc.(a) | | | 70,041 | | | | 14,687,598 | |
Boston Properties, Inc. | | | 76,911 | | | | 10,602,951 | |
Brandywine Realty Trust(a) | | | 87,207 | | | | 1,373,510 | |
Brixmor Property Group, Inc. | | | 142,947 | | | | 3,089,085 | |
Brookfield Property REIT, Inc., Class A(a) | | | 34,052 | | | | 628,089 | |
Camden Property Trust | | | 46,219 | | | | 4,903,836 | |
Chimera Investment Corp.(a) | | | 87,273 | | | | 1,794,333 | |
Colony Capital, Inc.(a) | | | 250,345 | | | | 1,189,139 | |
Columbia Property Trust, Inc. | | | 54,962 | | | | 1,149,256 | |
CoreSite Realty Corp.(a) | | | 20,002 | | | | 2,242,624 | |
Corporate Office Properties Trust(a) | | | 46,853 | | | | 1,376,541 | |
Cousins Properties, Inc.(a) | | | 73,157 | | | | 3,014,068 | |
Crown Castle International Corp. | | | 205,942 | | | | 29,274,655 | |
CubeSmart(a) | | | 94,890 | | | | 2,987,137 | |
CyrusOne, Inc.(a) | | | 54,804 | | | | 3,585,826 | |
Digital Realty Trust, Inc.(a) | | | 104,266 | | | | 12,484,811 | |
Douglas Emmett, Inc. | | | 80,574 | | | | 3,537,199 | |
Duke Realty Corp.(a) | | | 187,490 | | | | 6,500,278 | |
Empire State Realty Trust, Inc., Class A(a) | | | 77,941 | | | | 1,088,056 | |
EPR Properties(a) | | | 40,258 | | | | 2,843,825 | |
Equinix, Inc. | | | 42,377 | | | | 24,735,455 | |
Equity Commonwealth | | | 58,865 | | | | 1,932,538 | |
Equity LifeStyle Properties, Inc.(a) | | | 88,279 | | | | 6,213,959 | |
Equity Residential(a) | | | 181,356 | | | | 14,675,328 | |
Essex Property Trust, Inc. | | | 32,821 | | | | 9,874,526 | |
Extra Space Storage, Inc.(a) | | | 63,963 | | | | 6,755,772 | |
Federal Realty Investment Trust(a) | | | 37,784 | | | | 4,863,934 | |
Gaming and Leisure Properties, Inc. | | | 100,466 | | | | 4,325,061 | |
Healthcare Trust of America, Inc., Class A(a) | | | 106,941 | | | | 3,238,174 | |
Healthpeak Properties, Inc. | | | 241,628 | | | | 8,328,917 | |
Highwoods Properties, Inc.(a) | | | 50,111 | | | | 2,450,929 | |
Host Hotels & Resorts, Inc.(a) | | | 354,200 | | | | 6,570,410 | |
Hudson Pacific Properties, Inc. | | | 73,745 | | | | 2,776,499 | |
Invitation Homes, Inc. | | | 265,129 | | | | 7,945,916 | |
Iron Mountain, Inc.(a) | | | 143,103 | | | | 4,560,693 | |
JBG SMITH Properties(a) | | | 62,797 | | | | 2,504,972 | |
Kilroy Realty Corp.(a) | | | 50,456 | | | | 4,233,258 | |
Kimco Realty Corp. | | | 197,416 | | | | 4,088,485 | |
Lamar Advertising Co., Class A(a) | | | 42,198 | | | | 3,766,594 | |
Liberty Property Trust | | | 78,306 | | | | 4,702,275 | |
Life Storage, Inc. | | | 22,221 | | | | 2,406,090 | |
Macerich Co.(a) | | | 66,302 | | | | 1,784,850 | |
Medical Properties Trust, Inc.(a) | | | 258,258 | | | | 5,451,826 | |
MFA Financial, Inc.(a) | | | 211,876 | | | | 1,620,851 | |
Mid-America Apartment Communities, Inc. | | | 55,565 | | | | 7,326,801 | |
National Retail Properties, Inc.(a) | | | 85,095 | | | | 4,562,794 | |
New Residential Investment Corp.(a) | | | 214,584 | | | | 3,456,948 | |
Omega Healthcare Investors, Inc.(a) | | | 107,101 | | | | 4,535,727 | |
Outfront Media, Inc.(a) | | | 74,700 | | | | 2,003,454 | |
Paramount Group, Inc.(a) | | | 106,000 | | | | 1,475,520 | |
Park Hotels & Resorts, Inc.(a) | | | 113,524 | | | | 2,936,866 | |
Prologis, Inc. | | | 311,752 | | | | 27,789,573 | |
Public Storage(a) | | | 74,308 | | | | 15,824,632 | |
Rayonier, Inc.(a) | | | 63,500 | | | | 2,080,260 | |
Realty Income Corp. | | | 162,765 | | | | 11,984,387 | |
Regency Centers Corp. | | | 81,103 | | | | 5,116,788 | |
Retail Properties of America, Inc., Class A | | | 110,576 | | | | 1,481,718 | |
| | | | | | | | |
| Security | | Shares | | | Value | |
|
| Equity Real Estate Investment Trusts (REITs) (continued) | |
SBA Communications Corp. | | | 56,080 | | | $ | 13,514,719 | |
Service Properties Trust(a) | | | 79,912 | | | | 1,944,259 | |
Simon Property Group, Inc.(a) | | | 152,534 | | | | 22,721,465 | |
SITE Centers Corp. | | | 82,245 | | | | 1,153,075 | |
SL Green Realty Corp. | | | 38,657 | | | | 3,551,805 | |
Spirit Realty Capital, Inc.(a) | | | 49,335 | | | | 2,426,295 | |
Starwood Property Trust, Inc.(a) | | | 131,719 | | | | 3,274,534 | |
STORE Capital Corp.(a) | | | 105,320 | | | | 3,922,117 | |
Sun Communities, Inc. | | | 45,808 | | | | 6,875,781 | |
Taubman Centers, Inc.(a) | | | 26,329 | | | | 818,569 | |
UDR, Inc. | | | 144,098 | | | | 6,729,377 | |
Ventas, Inc. | | | 186,263 | | | | 10,754,826 | |
VEREIT, Inc.(a) | | | 542,707 | | | | 5,014,613 | |
VICI Properties, Inc.(a) | | | 231,348 | | | | 5,910,941 | |
Vornado Realty Trust | | | 85,895 | | | | 5,712,018 | |
Weingarten Realty Investors(a) | | | 56,750 | | | | 1,772,870 | |
Welltower, Inc. | | | 200,822 | | | | 16,423,223 | |
Weyerhaeuser Co.(a) | | | 371,017 | | | | 11,204,713 | |
WP Carey, Inc. | | | 84,601 | | | | 6,771,464 | |
| | | | | | | | |
| | | | 543,819,726 | |
|
| Food & Staples Retailing — 1.4% | |
Casey’s General Stores, Inc.(a) | | | 17,657 | | | | 2,807,286 | |
Costco Wholesale Corp. | | | 219,319 | | | | 64,462,240 | |
Grocery Outlet Holding Corp.(a)(b) | | | 17,773 | | | | 576,734 | |
Kroger Co.(a) | | | 394,034 | | | | 11,423,046 | |
Sprouts Farmers Market, Inc.(b) | | | 54,669 | | | | 1,057,845 | |
Sysco Corp.(a) | | | 237,922 | | | | 20,351,848 | |
U.S. Foods Holding Corp.(b) | | | 106,972 | | | | 4,481,057 | |
Walgreens Boots Alliance, Inc.(a) | | | 373,618 | | | | 22,028,517 | |
Walmart, Inc. | | | 700,390 | | | | 83,234,348 | |
| | | | | | | | |
| | | | 210,422,921 | |
|
| Food Products — 1.1% | |
Archer-Daniels-Midland Co. | | | 278,653 | | | | 12,915,567 | |
Beyond Meat, Inc.(a)(b) | | | 23,606 | | | | 1,784,614 | |
Bunge Ltd.(a) | | | 68,346 | | | | 3,933,312 | |
Campbell Soup Co.(a) | | | 80,765 | | | | 3,991,406 | |
Conagra Brands, Inc.(a) | | | 240,043 | | | | 8,219,072 | |
Flowers Foods, Inc.(a) | | | 102,672 | | | | 2,232,089 | |
General Mills, Inc.(a) | | | 297,066 | | | | 15,910,855 | |
Hain Celestial Group, Inc.(a)(b) | | | 39,847 | | | | 1,034,229 | |
Hershey Co. | | | 72,291 | | | | 10,625,331 | |
Hormel Foods Corp.(a) | | | 140,231 | | | | 6,325,820 | |
Ingredion, Inc.(a) | | | 32,033 | | | | 2,977,467 | |
J.M. Smucker Co.(a) | | | 53,707 | | | | 5,592,510 | |
Kellogg Co.(a) | | | 122,992 | | | | 8,506,127 | |
Kraft Heinz Co.(a) | | | 314,866 | | | | 10,116,645 | |
Lamb Weston Holdings, Inc. | | | 72,667 | | | | 6,251,542 | |
McCormick & Co., Inc.(a) | | | 60,688 | | | | 10,300,574 | |
Mondelez International, Inc., Class A(a) | | | 711,558 | | | | 39,192,615 | |
Pilgrim’s Pride Corp.(b) | | | 28,135 | | | | 920,436 | |
Post Holdings, Inc.(b) | | | 31,767 | | | | 3,465,780 | |
TreeHouse Foods, Inc.(a)(b) | | | 27,098 | | | | 1,314,253 | |
Tyson Foods, Inc., Class A | | | 144,967 | | | | 13,197,796 | |
| | | | | | | | |
| | | | 168,808,040 | |
|
| Gas Utilities — 0.1% | |
Atmos Energy Corp. | | | 59,520 | | | | 6,657,907 | |
National Fuel Gas Co.(a) | | | 43,998 | | | | 2,047,667 | |
UGI Corp.(a) | | | 103,503 | | | | 4,674,196 | |
| | | | | | | | |
| | | | 13,379,770 | |
|
| Health Care Equipment & Supplies — 3.4% | |
Abbott Laboratories | | | 859,039 | | | | 74,616,128 | |
ABIOMED, Inc.(a)(b) | | | 21,895 | | | | 3,735,068 | |
Align Technology, Inc.(a)(b) | | | 39,322 | | | | 10,972,411 | |
| | |
| 22 | | 2019 BLACKROCK ANNUAL REPORTTO SHAREHOLDERS |
| | |
Schedule of Investments (continued) December 31, 2019 | | Large Cap Index Master Portfolio (Percentages shown are based on Net Assets) |
| | | | | | | | |
| Security | | Shares | | | Value | |
|
| Health Care Equipment & Supplies (continued) | |
Baxter International, Inc. | | | 240,674 | | | $ | 20,125,160 | |
Becton Dickinson & Co.(a) | | | 133,003 | | | | 36,172,826 | |
Boston Scientific Corp.(b) | | | 689,669 | | | | 31,186,832 | |
Cantel Medical Corp.(a) | | | 17,701 | | | | 1,255,001 | |
Cooper Cos., Inc. | | | 24,268 | | | | 7,797,066 | |
Danaher Corp. | | | 305,613 | | | | 46,905,483 | |
DENTSPLY SIRONA, Inc. | | | 112,348 | | | | 6,357,773 | |
DexCom, Inc.(b) | | | 44,811 | | | | 9,801,958 | |
Edwards Lifesciences Corp.(b) | | | 103,064 | | | | 24,043,801 | |
Envista Holdings Corp.(b) | | | 72,360 | | | | 2,144,750 | |
Hill-Rom Holdings, Inc. | | | 32,346 | | | | 3,672,241 | |
Hologic, Inc.(b) | | | 130,448 | | | | 6,810,690 | |
ICU Medical, Inc.(a)(b) | | | 8,920 | | | | 1,669,110 | |
IDEXX Laboratories, Inc.(b) | | | 42,209 | | | | 11,022,036 | |
Insulet Corp.(a)(b) | | | 29,176 | | | | 4,994,931 | |
Integra LifeSciences Holdings Corp.(a)(b) | | | 34,147 | | | | 1,990,087 | |
Intuitive Surgical, Inc.(b) | | | 56,905 | | | | 33,639,391 | |
Masimo Corp.(b) | | | 23,837 | | | | 3,767,676 | |
Medtronic PLC(a) | | | 669,378 | | | | 75,940,934 | |
ResMed, Inc.(a) | | | 70,884 | | | | 10,984,894 | |
STERIS PLC | | | 40,952 | | | | 6,241,904 | |
Stryker Corp.(a) | | | 170,386 | | | | 35,770,837 | |
Teleflex, Inc. | | | 22,677 | | | | 8,536,530 | |
Varian Medical Systems, Inc.(b) | | | 44,952 | | | | 6,383,634 | |
West Pharmaceutical Services, Inc. | | | 35,489 | | | | 5,335,061 | |
Zimmer Biomet Holdings, Inc.(a) | | | 101,340 | | | | 15,168,571 | |
| | | | | | | | |
| | | | 507,042,784 | |
|
| Health Care Providers & Services — 2.7% | |
Acadia Healthcare Co., Inc.(a)(b) | | | 41,453 | | | | 1,377,069 | |
AmerisourceBergen Corp. | | | 76,466 | | | | 6,501,139 | |
Anthem, Inc.(a) | | | 126,498 | | | | 38,206,191 | |
Cardinal Health, Inc.(a) | | | 148,324 | | | | 7,502,228 | |
Centene Corp.(b) | | | 205,152 | | | | 12,897,906 | |
Chemed Corp. | | | 8,070 | | | | 3,544,828 | |
Cigna Corp.(b) | | | 182,715 | | | | 37,363,390 | |
Covetrus, Inc.(a)(b) | | | 44,670 | | | | 589,644 | |
CVS Health Corp.(a) | | | 648,856 | | | | 48,203,512 | |
DaVita, Inc.(b) | | | 49,333 | | | | 3,701,455 | |
Encompass Health Corp.(a) | | | 46,965 | | | | 3,253,266 | |
Guardant Health, Inc.(a)(b) | | | 19,531 | | | | 1,526,152 | |
HCA Healthcare, Inc. | | | 133,567 | | | | 19,742,538 | |
Henry Schein, Inc.(a)(b) | | | 71,797 | | | | 4,790,296 | |
Humana, Inc. | | | 65,950 | | | | 24,171,994 | |
Laboratory Corp. of America Holdings(b) | | | 47,988 | | | | 8,118,130 | |
McKesson Corp. | | | 89,752 | | | | 12,414,497 | |
MEDNAX, Inc.(a)(b) | | | 38,070 | | | | 1,057,965 | |
Molina Healthcare, Inc.(a)(b) | | | 30,860 | | | | 4,187,394 | |
Penumbra, Inc.(b) | | | 15,426 | | | | 2,534,029 | |
Premier, Inc., Class A(a)(b) | | | 29,685 | | | | 1,124,468 | |
Quest Diagnostics, Inc.(a) | | | 68,082 | | | | 7,270,477 | |
UnitedHealth Group, Inc. | | | 471,401 | | | | 138,582,466 | |
Universal Health Services, Inc., Class B | | | 38,550 | | | | 5,530,383 | |
WellCare Health Plans, Inc.(b) | | | 24,662 | | | | 8,143,639 | |
| | | | | | | | |
| | | | 402,335,056 | |
|
| Health Care Technology — 0.1% | |
Cerner Corp. | | | 156,325 | | | | 11,472,692 | |
Change Healthcare, Inc.(a)(b) | | | 23,069 | | | | 378,101 | |
Veeva Systems, Inc., Class A(b) | | | 65,397 | | | | 9,198,742 | |
| | | | | | | | |
| | | | 21,049,535 | |
|
| Hotels, Restaurants & Leisure — 2.0% | |
Aramark(a) | | | 125,474 | | | | 5,445,572 | |
Caesars Entertainment Corp.(a)(b) | | | 284,087 | | | | 3,863,583 | |
Carnival Corp.(a) | | | 201,403 | | | | 10,237,315 | |
| | | | | | | | |
| Security | | Shares | | | Value | |
|
| Hotels, Restaurants & Leisure (continued) | |
Chipotle Mexican Grill, Inc.(b) | | | 12,757 | | | $ | 10,679,012 | |
Choice Hotels International, Inc.(a) | | | 15,480 | | | | 1,601,096 | |
Darden Restaurants, Inc.(a) | | | 61,336 | | | | 6,686,237 | |
Domino’s Pizza, Inc.(a) | | | 20,423 | | | | 5,999,869 | |
Dunkin’ Brands Group, Inc.(a) | | | 42,150 | | | | 3,184,011 | |
Extended Stay America, Inc. | | | 91,249 | | | | 1,355,960 | |
Hilton Grand Vacations, Inc.(b) | | | 44,098 | | | | 1,516,530 | |
Hilton Worldwide Holdings, Inc. | | | 139,546 | | | | 15,477,047 | |
Hyatt Hotels Corp., Class A(a) | | | 18,022 | | | | 1,616,754 | |
International Game Technology PLC(a) | | | 55,334 | | | | 828,350 | |
Las Vegas Sands Corp.(a) | | | 170,886 | | | | 11,797,969 | |
Marriott International, Inc., Class A(a) | | | 136,647 | | | | 20,692,455 | |
McDonald’s Corp.(a) | | | 375,840 | | | | 74,269,742 | |
MGM Resorts International | | | 247,550 | | | | 8,235,989 | |
Norwegian Cruise Line Holdings Ltd.(b) | | | 103,335 | | | | 6,035,797 | |
Planet Fitness, Inc., Class A(b) | | | 38,849 | | | | 2,901,243 | |
Royal Caribbean Cruises Ltd.(a) | | | 85,799 | | | | 11,455,025 | |
Six Flags Entertainment Corp.(a) | | | 36,963 | | | | 1,667,401 | |
Starbucks Corp. | | | 588,858 | | | | 51,772,395 | |
Vail Resorts, Inc.(a) | | | 20,278 | | | | 4,863,273 | |
Wendy’s Co.(a) | | | 91,693 | | | | 2,036,502 | |
Wyndham Destinations, Inc.(a) | | | 45,887 | | | | 2,371,899 | |
Wyndham Hotels & Resorts, Inc.(a) | | | 45,826 | | | | 2,878,331 | |
Wynn Resorts Ltd. | | | 49,169 | | | | 6,828,099 | |
Yum China Holdings, Inc.(a) | | | 182,103 | | | | 8,742,765 | |
Yum! Brands, Inc. | | | 151,060 | | | | 15,216,274 | |
| | | | | | | | |
| | | | 300,256,495 | |
|
| Household Durables — 0.4% | |
D.R. Horton, Inc.(a) | | | 168,600 | | | | 8,893,650 | |
Garmin Ltd. | | | 72,616 | | | | 7,084,417 | |
Leggett & Platt, Inc.(a) | | | 66,425 | | | | 3,376,383 | |
Lennar Corp., Class A(a) | | | 137,217 | | | | 7,655,336 | |
Lennar Corp., Class B | | | 10,779 | | | | 481,821 | |
Mohawk Industries, Inc.(b) | | | 29,446 | | | | 4,015,846 | |
Newell Brands, Inc.(a) | | | 188,436 | | | | 3,621,740 | |
NVR, Inc.(b) | | | 1,645 | | | | 6,264,834 | |
PulteGroup, Inc. | | | 125,969 | | | | 4,887,597 | |
Tempur Sealy International, Inc.(b) | | | 22,517 | | | | 1,960,330 | |
Toll Brothers, Inc.(a) | | | 64,576 | | | | 2,551,398 | |
Whirlpool Corp.(a) | | | 31,456 | | | | 4,640,704 | |
| | | | | | | | |
| | | | 55,434,056 | |
|
| Household Products — 1.5% | |
Church & Dwight Co., Inc. | | | 124,509 | | | | 8,757,963 | |
Clorox Co.(a) | | | 63,662 | | | | 9,774,663 | |
Colgate-Palmolive Co.(a) | | | 417,568 | | | | 28,745,381 | |
Energizer Holdings, Inc.(a) | | | 31,553 | | | | 1,584,592 | |
Kimberly-Clark Corp.(a) | | | 169,590 | | | | 23,327,104 | |
Procter & Gamble Co. | | | 1,232,870 | | | | 153,985,463 | |
Spectrum Brands Holdings, Inc.(a) | | | 19,640 | | | | 1,262,656 | |
| | | | | | | | |
| | | | 227,437,822 | |
|
| Independent Power and Renewable Electricity Producers — 0.1% | |
AES Corp.(a) | | | 325,379 | | | | 6,475,042 | |
NRG Energy, Inc. | | | 124,933 | | | | 4,966,087 | |
Vistra Energy Corp.(a) | | | 210,776 | | | | 4,845,740 | |
| | | | | | | | |
| | | | 16,286,869 | |
|
| Industrial Conglomerates — 1.2% | |
3M Co. | | | 279,678 | | | | 49,340,793 | |
BWX Technologies, Inc.(a) | | | 48,529 | | | | 3,012,680 | |
Carlisle Cos., Inc.(a) | | | 28,592 | | | | 4,627,329 | |
General Electric Co. | | | 4,325,333 | | | | 48,270,716 | |
Honeywell International, Inc. | | | 358,943 | | | | 63,532,911 | |
Roper Technologies, Inc.(a) | | | 51,290 | | | | 18,168,457 | |
Seaboard Corp.(a) | | | 134 | | | | 569,574 | |
| | | | | | | | |
| | | | 187,522,460 | |
| | | | |
| SCHEDULE OF INVESTMENTS | | | 23 | |
| | |
Schedule of Investments (continued) December 31, 2019 | | Large Cap Index Master Portfolio (Percentages shown are based on Net Assets) |
| | | | | | | | |
| Security | | Shares | | | Value | |
|
| Insurance — 2.5% | |
Aflac, Inc. | | | 361,997 | | | $ | 19,149,641 | |
Alleghany Corp.(b) | | | 6,775 | | | | 5,417,087 | |
Allstate Corp. | | | 161,171 | | | | 18,123,679 | |
American Financial Group, Inc. | | | 36,447 | | | | 3,996,414 | |
American International Group, Inc. | | | 432,201 | | | | 22,184,877 | |
American National Insurance Co. | | | 2,683 | | | | 315,735 | |
Aon PLC | | | 116,479 | | | | 24,261,411 | |
Arch Capital Group Ltd.(a)(b) | | | 193,845 | | | | 8,314,012 | |
Arthur J Gallagher & Co. | | | 90,298 | | | | 8,599,079 | |
Assurant, Inc.(a) | | | 30,648 | | | | 4,017,340 | |
Assured Guaranty Ltd. | | | 44,992 | | | | 2,205,508 | |
Athene Holding Ltd., Class A(b) | | | 70,215 | | | | 3,302,211 | |
Axis Capital Holdings Ltd. | | | 40,019 | | | | 2,378,729 | |
Brighthouse Financial, Inc.(b) | | | 52,917 | | | | 2,075,934 | |
Brown & Brown, Inc.(a) | | | 116,973 | | | | 4,618,094 | |
Chubb Ltd.(a) | | | 224,274 | | | | 34,910,491 | |
Cincinnati Financial Corp. | | | 76,312 | | | | 8,024,207 | |
CNA Financial Corp.(a) | | | 11,537 | | | | 516,973 | |
Erie Indemnity Co., Class A(a) | | | 12,991 | | | | 2,156,506 | |
Everest Re Group Ltd.(a) | | | 19,822 | | | | 5,487,522 | |
Fidelity National Financial, Inc. | | | 132,557 | | | | 6,011,460 | |
First American Financial Corp. | | | 53,624 | | | | 3,127,352 | |
Globe Life, Inc.(a) | | | 52,535 | | | | 5,529,309 | |
Hanover Insurance Group, Inc.(a) | | | 18,875 | | | | 2,579,646 | |
Hartford Financial Services Group, Inc.(a) | | | 178,992 | | | | 10,877,344 | |
Kemper Corp.(a) | | | 31,257 | | | | 2,422,417 | |
Lincoln National Corp. | | | 98,297 | | | | 5,800,506 | |
Loews Corp.(a) | | | 127,999 | | | | 6,718,667 | |
Markel Corp.(b) | | | 6,705 | | | | 7,664,955 | |
Marsh & McLennan Cos., Inc.(a) | | | 254,046 | | | | 28,303,265 | |
Mercury General Corp. | | | 13,156 | | | | 641,092 | |
MetLife, Inc. | | | 387,703 | | | | 19,761,222 | |
Old Republic International Corp. | | | 135,330 | | | | 3,027,332 | |
Primerica, Inc. | | | 20,957 | | | | 2,736,146 | |
Principal Financial Group, Inc. | | | 138,919 | | | | 7,640,545 | |
Progressive Corp. | | | 290,527 | | | | 21,031,250 | |
Prudential Financial, Inc.(a) | | | 202,765 | | | | 19,007,191 | |
Reinsurance Group of America, Inc.(a) | | | 30,696 | | | | 5,005,290 | |
RenaissanceRe Holdings Ltd. | | | 21,742 | | | | 4,261,867 | |
Travelers Cos., Inc. | | | 128,841 | | | | 17,644,775 | |
Unum Group | | | 104,440 | | | | 3,045,470 | |
W.R. Berkley Corp. | | | 72,509 | | | | 5,010,372 | |
White Mountains Insurance Group Ltd.(a) | | | 1,444 | | | | 1,610,796 | |
Willis Towers Watson PLC | | | 64,004 | | | | 12,924,968 | |
| | | | | | | | |
| | | | 382,438,687 | |
|
| Interactive Media & Services — 4.4% | |
Alphabet, Inc., Class A(a)(b) | | | 149,339 | | | | 200,023,163 | |
Alphabet, Inc., Class C(b) | | | 149,546 | | | | 199,945,993 | |
Facebook, Inc., Class A(b) | | | 1,191,985 | | | | 244,654,921 | |
IAC/InterActiveCorp.(b) | | | 37,544 | | | | 9,352,586 | |
Match Group, Inc.(a)(b) | | | 25,542 | | | | 2,097,254 | |
Twitter, Inc.(b) | | | 376,436 | | | | 12,064,774 | |
Zillow Group, Inc., Class A(b) | | | 25,163 | | | | 1,150,956 | |
Zillow Group, Inc., Class C(a)(b) | | | 64,526 | | | | 2,964,324 | |
| | | | | | | | |
| | | | 672,253,971 | |
|
| Internet & Direct Marketing Retail — 3.0% | |
Amazon.com, Inc.(b) | | | 206,289 | | | | 381,189,066 | |
Booking Holdings, Inc.(b) | | | 20,828 | | | | 42,775,088 | |
eBay, Inc.(a) | | | 383,827 | | | | 13,859,993 | |
Etsy, Inc.(a)(b) | | | 59,272 | | | | 2,625,750 | |
Expedia Group, Inc.(a) | | | 67,793 | | | | 7,331,135 | |
GrubHub, Inc.(a)(b) | | | 46,591 | | | | 2,266,186 | |
Qurate Retail, Inc., Series A(b) | | | 197,866 | | | | 1,668,010 | |
| | | | | | | | |
| Security | | Shares | | | Value | |
|
| Internet & Direct Marketing Retail (continued) | |
TripAdvisor, Inc.(a) | | | 49,575 | | | $ | 1,506,089 | |
Wayfair, Inc., Class A(a)(b) | | | 30,840 | | | | 2,787,011 | |
| | | | | | | | |
| | | | 456,008,328 | |
|
| IT Services — 5.2% | |
Accenture PLC, Class A(a) | | | 318,115 | | | | 66,985,476 | |
Akamai Technologies, Inc.(a)(b) | | | 79,634 | | | | 6,878,785 | |
Alliance Data Systems Corp. | | | 20,630 | | | | 2,314,686 | |
Amdocs Ltd.(a) | | | 66,066 | | | | 4,769,305 | |
Automatic Data Processing, Inc. | | | 216,155 | | | | 36,854,427 | |
Black Knight, Inc.(a)(b) | | | 72,280 | | | | 4,660,614 | |
Booz Allen Hamilton Holding Corp. | | | 66,587 | | | | 4,736,333 | |
Broadridge Financial Solutions, Inc.(a) | | | 56,628 | | | | 6,995,823 | |
CACI International, Inc., Class A(b) | | | 12,384 | | | | 3,095,876 | |
Cognizant Technology Solutions Corp., Class A(a) | | | 272,857 | | | | 16,922,591 | |
CoreLogic, Inc.(a)(b) | | | 36,221 | | | | 1,583,220 | |
DXC Technology Co. | | | 123,540 | | | | 4,643,869 | |
EPAM Systems, Inc.(b) | | | 25,995 | | | | 5,515,099 | |
Euronet Worldwide, Inc.(b) | | | 24,640 | | | | 3,882,278 | |
Fidelity National Information Services, Inc. | | | 305,118 | | | | 42,438,863 | |
Fiserv, Inc.(a)(b) | | | 280,131 | | | | 32,391,548 | |
FleetCor Technologies, Inc.(b) | | | 42,342 | | | | 12,182,640 | |
Gartner, Inc.(b) | | | 43,996 | | | | 6,779,784 | |
Genpact Ltd. | | | 92,702 | | | | 3,909,243 | |
Global Payments, Inc. | | | 147,998 | | | | 27,018,515 | |
GoDaddy, Inc., Class A(a)(b) | | | 84,376 | | | | 5,730,818 | |
International Business Machines Corp. | | | 442,881 | | | | 59,363,769 | |
Jack Henry & Associates, Inc.(a) | | | 37,916 | | | | 5,523,224 | |
Leidos Holdings, Inc. | | | 67,876 | | | | 6,644,382 | |
Mastercard, Inc., Class A | | | 442,203 | | | | 132,037,394 | |
MongoDB, Inc.(a)(b) | | | 19,907 | | | | 2,619,960 | |
Okta, Inc.(a)(b) | | | 50,944 | | | | 5,877,409 | |
Paychex, Inc.(a) | | | 159,454 | | | | 13,563,157 | |
PayPal Holdings, Inc.(b) | | | 586,435 | | | | 63,434,674 | |
Sabre Corp. | | | 142,477 | | | | 3,197,184 | |
Square, Inc., Class A(b) | | | 170,303 | | | | 10,654,156 | |
Switch, Inc., Class A(a) | | | 29,808 | | | | 441,755 | |
Teradata Corp.(a)(b) | | | 57,517 | | | | 1,539,730 | |
Twilio, Inc., Class A(a)(b) | | | 59,662 | | | | 5,863,581 | |
VeriSign, Inc.(b) | | | 50,830 | | | | 9,793,924 | |
Visa, Inc., Class A(a) | | | 854,573 | | | | 160,574,267 | |
Western Union Co. | | | 208,229 | | | | 5,576,373 | |
WEX, Inc.(a)(b) | | | 21,618 | | | | 4,528,106 | |
| | | | | | | | |
| | | | 791,522,838 | |
|
| Leisure Products — 0.1% | |
Brunswick Corp. | | | 38,541 | | | | 2,311,689 | |
Hasbro, Inc.(a) | | | 61,677 | | | | 6,513,708 | |
Mattel, Inc.(a)(b) | | | 165,131 | | | | 2,237,525 | |
Polaris Industries, Inc.(a) | | | 29,932 | | | | 3,044,085 | |
| | | | | | | | |
| | | | 14,107,007 | |
|
| Life Sciences Tools & Services — 1.1% | |
Adaptive Biotechnologies Corp.(a)(b) | | | 7,827 | | | | 234,184 | |
Agilent Technologies, Inc. | | | 154,293 | | | | 13,162,736 | |
Avantor, Inc.(b) | | | 156,734 | | | | 2,844,722 | |
Bio-Rad Laboratories, Inc., Class A(b) | | | 10,473 | | | | 3,875,324 | |
Bio-Techne Corp. | | | 18,922 | | | | 4,153,568 | |
Bruker Corp.(a) | | | 53,452 | | | | 2,724,449 | |
Charles River Laboratories International, Inc.(b) | | | 23,961 | | | | 3,660,282 | |
Illumina, Inc.(a)(b) | | | 72,876 | | | | 24,175,884 | |
IQVIA Holdings, Inc.(b) | | | 87,991 | | | | 13,595,490 | |
Mettler-Toledo International, Inc.(b) | | | 11,965 | | | | 9,491,595 | |
PerkinElmer, Inc.(a) | | | 54,981 | | | | 5,338,655 | |
PRA Health Sciences, Inc.(b) | | | 30,280 | | | | 3,365,622 | |
QIAGEN NV(b) | | | 111,759 | | | | 3,777,454 | |
| | |
| 24 | | 2019 BLACKROCK ANNUAL REPORTTO SHAREHOLDERS |
| | |
Schedule of Investments (continued) December 31, 2019 | | Large Cap Index Master Portfolio (Percentages shown are based on Net Assets) |
| | | | | | | | |
| Security | | Shares | | | Value | |
|
| Life Sciences Tools & Services (continued) | |
Thermo Fisher Scientific, Inc. | | | 199,017 | | | $ | 64,654,653 | |
Waters Corp.(a)(b) | | | 31,614 | | | | 7,386,611 | |
| | | | | | | | |
| | | | 162,441,229 | |
|
| Machinery — 1.8% | |
AGCO Corp.(a) | | | 29,823 | | | | 2,303,827 | |
Allison Transmission Holdings, Inc. | | | 53,386 | | | | 2,579,611 | |
Caterpillar, Inc. | | | 267,283 | | | | 39,472,353 | |
Colfax Corp.(a)(b) | | | 44,816 | | | | 1,630,406 | |
Crane Co. | | | 25,215 | | | | 2,178,072 | |
Cummins, Inc.(a) | | | 74,520 | | | | 13,336,099 | |
Deere & Co.(a) | | | 156,339 | | | | 27,087,295 | |
Donaldson Co., Inc.(a) | | | 63,918 | | | | 3,682,955 | |
Dover Corp. | | | 72,489 | | | | 8,355,082 | |
Flowserve Corp.(a) | | | 63,215 | | | | 3,146,211 | |
Fortive Corp. | | | 147,079 | | | | 11,235,365 | |
Gardner Denver Holdings, Inc.(a)(b) | | | 68,039 | | | | 2,495,671 | |
Gates Industrial Corp. PLC(a)(b) | | | 16,568 | | | | 227,976 | |
Graco, Inc.(a) | | | 82,773 | | | | 4,304,196 | |
IDEX Corp.(a) | | | 37,526 | | | | 6,454,472 | |
Illinois Tool Works, Inc.(a) | | | 159,505 | | | | 28,651,883 | |
Ingersoll-Rand PLC(a) | | | 119,715 | | | | 15,912,518 | |
ITT, Inc. | | | 42,392 | | | | 3,133,193 | |
Lincoln Electric Holdings, Inc.(a) | | | 29,635 | | | | 2,866,594 | |
Middleby Corp.(a)(b) | | | 27,110 | | | | 2,969,087 | |
Nordson Corp. | | | 28,269 | | | | 4,603,324 | |
Oshkosh Corp. | | | 34,253 | | | | 3,242,046 | |
PACCAR, Inc.(a) | | | 168,079 | | | | 13,295,049 | |
Parker-Hannifin Corp. | | | 63,425 | | | | 13,054,133 | |
Pentair PLC | | | 86,845 | | | | 3,983,580 | |
Snap-on, Inc.(a) | | | 26,956 | | | | 4,566,346 | |
Stanley Black & Decker, Inc. | | | 75,955 | | | | 12,588,782 | |
Timken Co.(a) | | | 31,663 | | | | 1,782,944 | |
Toro Co. | | | 52,705 | | | | 4,199,007 | |
Trinity Industries, Inc.(a) | | | 50,694 | | | | 1,122,872 | |
Valmont Industries, Inc. | | | 10,037 | | | | 1,503,342 | |
WABCO Holdings, Inc.(b) | | | 24,811 | | | | 3,361,890 | |
Westinghouse Air Brake Technologies Corp. | | | 88,186 | | | | 6,860,871 | |
Woodward, Inc. | | | 27,450 | | | | 3,251,178 | |
Xylem, Inc.(a) | | | 89,666 | | | | 7,064,784 | |
| | | | | | | | |
| | | | 266,503,014 | |
|
| Marine — 0.0% | |
Kirby Corp.(a)(b) | | | 29,584 | | | | 2,648,656 | |
| | | | | | | | |
|
| Media — 2.4% | |
Altice USA, Inc., Class A(b) | | | 146,674 | | | | 4,010,067 | |
AMC Networks, Inc., Class A(b) | | | 20,274 | | | | 800,823 | |
Cable One, Inc.(a) | | | 2,233 | | | | 3,323,753 | |
Charter Communications, Inc., Class A(a)(b) | | | 76,516 | | | | 37,116,381 | |
Cinemark Holdings, Inc.(a) | | | 52,241 | | | | 1,768,358 | |
Comcast Corp., Class A | | | 2,246,380 | | | | 101,019,709 | |
Discovery, Inc., Class A(a)(b) | | | 74,562 | | | | 2,441,160 | |
Discovery, Inc., Class C(b) | | | 167,053 | | | | 5,093,446 | |
DISH Network Corp., Class A(b) | | | 131,985 | | | | 4,681,508 | |
Fox Corp., Class A(a) | | | 175,385 | | | | 6,501,522 | |
Fox Corp., Class B(b) | | | 77,600 | | | | 2,824,640 | |
GCI Liberty, Inc., Class A(b) | | | 50,779 | | | | 3,597,692 | |
Interpublic Group of Cos., Inc. | | | 190,291 | | | | 4,395,722 | |
John Wiley & Sons, Inc., Class A(a) | | | 19,515 | | | | 946,868 | |
Liberty Broadband Corp., Class A(b) | | | 12,544 | | | | 1,562,481 | |
Liberty Broadband Corp., Class C(b) | | | 52,061 | | | | 6,546,671 | |
Liberty Media Corp. — Liberty Formula One, Class A(a)(b) | | | 14,208 | | | | 622,026 | |
Liberty Media Corp. — Liberty Formula One, Class C(a)(b) | | | 96,580 | | | | 4,439,300 | |
| | | | | | | | |
| Security | | Shares | | | Value | |
|
| Media (continued) | |
Liberty Media Corp. — Liberty SiriusXM,
Class A(a)(b) | | | 42,844 | | | $ | 2,071,079 | |
Liberty Media Corp. — Liberty SiriusXM,
Class C(b) | | | 77,968 | | | | 3,753,379 | |
Lions Gate Entertainment Corp., Class A(a)(b) | | | 19,444 | | | | 207,273 | |
Lions Gate Entertainment Corp., Class B(b) | | | 41,348 | | | | 410,586 | |
Madison Square Garden Co., Class A(a)(b) | | | 8,771 | | | | 2,580,340 | |
New York Times Co., Class A(a) | | | 82,857 | | | | 2,665,510 | |
News Corp., Class A(a) | | | 202,510 | | | | 2,863,491 | |
News Corp., Class B(a) | | | 53,107 | | | | 770,583 | |
Nexstar Media Group, Inc., Class A(a) | | | 22,849 | | | | 2,679,045 | |
Omnicom Group, Inc.(a) | | | 108,870 | | | | 8,820,647 | |
Sinclair Broadcast Group, Inc., Class A(a) | | | 27,357 | | | | 912,082 | |
Sirius XM Holdings, Inc.(a) | | | 697,687 | | | | 4,988,462 | |
ViacomCBS, Inc., Class A Class A(a) | | | 1,462 | | | | 65,600 | |
ViacomCBS, Inc., Class B Class B(a) | | | 267,310 | | | | 11,219,001 | |
Walt Disney Co. | | | 870,785 | | | | 125,941,635 | |
| | | | | | | | |
| | | | 361,640,840 | |
|
| Metals & Mining — 0.3% | |
Alcoa Corp.(b) | | | 94,543 | | | | 2,033,620 | |
Freeport-McMoRan, Inc.(a) | | | 721,964 | | | | 9,472,168 | |
Newmont Goldcorp Corp. | | | 405,517 | | | | 17,619,714 | |
Nucor Corp.(a) | | | 153,194 | | | | 8,621,758 | |
Reliance Steel & Aluminum Co. | | | 31,789 | | | | 3,807,051 | |
Royal Gold, Inc.(a) | | | 33,978 | | | | 4,153,810 | |
Southern Copper Corp.(a) | | | 38,273 | | | | 1,625,837 | |
Steel Dynamics, Inc.(a) | | | 99,982 | | | | 3,403,387 | |
United States Steel Corp.(a) | | | 86,386 | | | | 985,664 | |
| | | | | | | | |
| | | | 51,723,009 | |
|
| Mortgage Real Estate Investment Trusts (REITs) — 0.1% | |
AGNC Investment Corp.(a) | | | 276,995 | | | | 4,897,271 | |
Annaly Capital Management, Inc.(a) | | | 722,309 | | | | 6,804,151 | |
Two Harbors Investment Corp.(a) | | | 143,603 | | | | 2,099,476 | |
| | | | | | | | |
| | | | 13,800,898 | |
|
| Multi-Utilities — 1.0% | |
Ameren Corp. | | | 122,968 | | | | 9,443,942 | |
CenterPoint Energy, Inc.(a) | | | 249,604 | | | | 6,806,701 | |
CMS Energy Corp. | | | 142,413 | | | | 8,949,233 | |
Consolidated Edison, Inc. | | | 164,935 | | | | 14,921,669 | |
Dominion Energy, Inc. | | | 409,864 | | | | 33,944,936 | |
DTE Energy Co.(a) | | | 92,317 | | | | 11,989,209 | |
MDU Resources Group, Inc. | | | 103,705 | | | | 3,081,076 | |
NiSource, Inc. | | | 182,127 | | | | 5,070,416 | |
Public Service Enterprise Group, Inc. | | | 250,507 | | | | 14,792,438 | |
Sempra Energy | | | 140,562 | | | | 21,292,332 | |
WEC Energy Group, Inc.(a) | | | 157,751 | | | | 14,549,375 | |
| | | | | | | | |
| | | | 144,841,327 | |
|
| Multiline Retail — 0.5% | |
Dollar General Corp. | | | 129,220 | | | | 20,155,736 | |
Dollar Tree, Inc.(b) | | | 116,488 | | | | 10,955,696 | |
Kohl’s Corp.(a) | | | 79,522 | | | | 4,051,646 | |
Macy’s, Inc.(a) | | | 161,073 | | | | 2,738,241 | |
Nordstrom, Inc.(a) | | | 51,684 | | | | 2,115,426 | |
Ollie’s Bargain Outlet Holdings, Inc.(a)(b) | | | 28,346 | | | | 1,851,277 | |
Target Corp. | | | 247,570 | | | | 31,740,950 | |
| | | | | | | | |
| | | | 73,608,972 | |
|
| Oil, Gas & Consumable Fuels — 3.6% | |
Antero Midstream Corp.(a) | | | 151,287 | | | | 1,148,268 | |
Antero Resources Corp.(b) | | | 99,281 | | | | 282,951 | |
Apache Corp.(a) | | | 182,210 | | | | 4,662,754 | |
Cabot Oil & Gas Corp.(a) | | | 208,380 | | | | 3,627,896 | |
Centennial Resource Development, Inc.,
Class A(a)(b) | | | 75,919 | | | | 350,746 | |
Cheniere Energy, Inc.(b) | | | 116,598 | | | | 7,120,640 | |
Chesapeake Energy Corp.(a)(b) | | | 590,525 | | | | 487,537 | |
| | | | |
| SCHEDULE OF INVESTMENTS | | | 25 | |
| | |
Schedule of Investments (continued) December 31, 2019 | | Large Cap Index Master Portfolio (Percentages shown are based on Net Assets) |
| | | | | | | | |
| Security | | Shares | | | Value | |
|
| Oil, Gas & Consumable Fuels (continued) | |
Chevron Corp.(a) | | | 950,854 | | | $ | 114,587,416 | |
Cimarex Energy Co. | | | 50,084 | | | | 2,628,909 | |
Concho Resources, Inc.(a) | | | 98,296 | | | | 8,607,781 | |
ConocoPhillips | | | 547,372 | | | | 35,595,601 | |
Continental Resources, Inc.(a) | | | 38,965 | | | | 1,336,500 | |
Devon Energy Corp.(a) | | | 187,996 | | | | 4,882,256 | |
Diamondback Energy, Inc. | | | 80,877 | | | | 7,510,238 | |
EOG Resources, Inc. | | | 288,794 | | | | 24,189,385 | |
EQT Corp.(a) | | | 121,496 | | | | 1,324,306 | |
Equitrans Midstream Corp.(a) | | | 93,682 | | | | 1,251,592 | |
Exxon Mobil Corp.(a) | | | 2,111,370 | | | | 147,331,399 | |
Hess Corp.(a) | | | 135,873 | | | | 9,077,675 | |
HollyFrontier Corp. | | | 74,223 | | | | 3,763,848 | |
Kinder Morgan, Inc.(a) | | | 972,620 | | | | 20,590,365 | |
Kosmos Energy Ltd.(a) | | | 162,235 | | | | 924,740 | |
Marathon Oil Corp. | | | 396,735 | | | | 5,387,661 | |
Marathon Petroleum Corp. | | | 320,744 | | | | 19,324,826 | |
Murphy Oil Corp.(a) | | | 79,843 | | | | 2,139,792 | |
Noble Energy, Inc.(a) | | | 241,183 | | | | 5,990,986 | |
Occidental Petroleum Corp.(a) | | | 447,975 | | | | 18,461,050 | |
ONEOK, Inc.(a) | | | 206,909 | | | | 15,656,804 | |
Parsley Energy, Inc., Class A | | | 126,731 | | | | 2,396,483 | |
PBF Energy, Inc., Class A | | | 61,053 | | | | 1,915,233 | |
Phillips 66 | | | 222,802 | | | | 24,822,371 | |
Pioneer Natural Resources Co.(a) | | | 81,519 | | | | 12,339,531 | |
Range Resources Corp.(a) | | | 89,120 | | | | 432,232 | |
Targa Resources Corp.(a) | | | 111,132 | | | | 4,537,520 | |
Valero Energy Corp. | | | 204,359 | | | | 19,138,220 | |
Williams Cos., Inc.(a) | | | 599,359 | | | | 14,216,795 | |
WPX Energy, Inc.(a)(b) | | | 212,659 | | | | 2,921,935 | |
| | | | | | | | |
| | | | 550,964,242 | |
|
| Paper & Forest Products — 0.0% | |
Domtar Corp.(a) | | | 26,519 | | | | 1,014,087 | |
| | | | | | | | |
|
| Personal Products — 0.2% | |
Coty, Inc., Class A(a) | | | 132,586 | | | | 1,491,592 | |
Estee Lauder Cos., Inc., Class A(a) | | | 108,646 | | | | 22,439,745 | |
Herbalife Nutrition Ltd.(a)(b) | | | 46,378 | | | | 2,210,839 | |
Nu Skin Enterprises, Inc., Class A(a) | | | 28,665 | | | | 1,174,692 | |
| | | | | | | | |
| | | | 27,316,868 | |
|
| Pharmaceuticals — 4.2% | |
Allergan PLC | | | 162,920 | | | | 31,145,416 | |
Bristol-Myers Squibb Co. | | | 1,166,474 | | | | 74,875,966 | |
Catalent, Inc.(b) | | | 73,217 | | | | 4,122,117 | |
Elanco Animal Health, Inc.(a)(b) | | | 185,508 | | | | 5,463,211 | |
Eli Lilly & Co.(a) | | | 424,214 | | | | 55,754,446 | |
Horizon Therapeutics PLC(b) | | | 93,321 | | | | 3,378,220 | |
Jazz Pharmaceuticals PLC(b) | | | 28,584 | | | | 4,267,020 | |
Johnson & Johnson | | | 1,324,972 | | | | 193,273,666 | |
Merck & Co., Inc.(a) | | | 1,270,427 | | | | 115,545,336 | |
Mylan NV(b) | | | 255,099 | | | | 5,127,490 | |
Nektar Therapeutics(a)(b) | | | 90,298 | | | | 1,949,082 | |
Perrigo Co. PLC(a) | | | 65,638 | | | | 3,390,859 | |
Pfizer, Inc.(a) | | | 2,774,873 | | | | 108,719,524 | |
Zoetis, Inc. | | | 237,871 | | | | 31,482,227 | |
| | | | | | | | |
| | | | 638,494,580 | |
|
| Professional Services — 0.4% | |
CoStar Group, Inc.(b) | | | 17,901 | | | | 10,710,168 | |
Equifax, Inc.(a) | | | 60,816 | | | | 8,521,538 | |
IHS Markit Ltd.(b) | | | 198,245 | | | | 14,937,761 | |
ManpowerGroup, Inc. | | | 28,955 | | | | 2,811,531 | |
Nielsen Holdings PLC | | | 176,041 | | | | 3,573,632 | |
Paylocity Holding Corp.(a)(b) | | | 17,148 | | | | 2,071,821 | |
| | | | | | | | |
| Security | | Shares | | | Value | |
|
| Professional Services (continued) | |
Robert Half International, Inc. | | | 58,080 | | | $ | 3,667,752 | |
TransUnion | | | 92,188 | | | | 7,892,215 | |
Verisk Analytics, Inc. | | | 79,279 | | | | 11,839,526 | |
| | | | | | | | |
| | | | 66,025,944 | |
|
| Real Estate Management & Development — 0.1% | |
CBRE Group, Inc., Class A(b) | | | 168,109 | | | | 10,303,401 | |
Howard Hughes Corp.(a)(b) | | | 21,016 | | | | 2,664,829 | |
Jones Lang LaSalle, Inc. | | | 25,626 | | | | 4,461,230 | |
| | | | | | | | |
| | | | 17,429,460 | |
|
| Road & Rail — 1.1% | |
AMERCO(a) | | | 4,300 | | | | 1,616,026 | |
CSX Corp. | | | 371,819 | | | | 26,904,823 | |
JB Hunt Transport Services, Inc.(a) | | | 41,907 | | | | 4,893,899 | |
Kansas City Southern(a) | | | 49,360 | | | | 7,559,978 | |
Knight-Swift Transportation Holdings, Inc.(a) | | | 58,602 | | | | 2,100,296 | |
Landstar System, Inc.(a) | | | 21,119 | | | | 2,404,820 | |
Lyft, Inc., Class A(b) | | | 94,716 | | | | 4,074,682 | |
Norfolk Southern Corp.(a) | | | 129,997 | | | | 25,236,318 | |
Old Dominion Freight Line, Inc.(a) | | | 32,874 | | | | 6,238,828 | |
Ryder System, Inc. | | | 26,032 | | | | 1,413,798 | |
Schneider National, Inc., Class B | | | 30,004 | | | | 654,687 | |
Uber Technologies, Inc.(a)(b) | | | 472,401 | | | | 14,049,206 | |
Union Pacific Corp. | | | 346,337 | | | | 62,614,266 | |
| | | | | | | | |
| | | | 159,761,627 | |
|
| Semiconductors & Semiconductor Equipment — 3.9% | |
Advanced Micro Devices, Inc.(a)(b) | | | 513,978 | | | | 23,571,031 | |
Analog Devices, Inc. | | | 183,268 | | | | 21,779,569 | |
Applied Materials, Inc. | | | 459,270 | | | | 28,033,841 | |
Broadcom, Inc.(a) | | | 192,820 | | | | 60,934,976 | |
Cree, Inc.(a)(b) | | | 52,200 | | | | 2,409,030 | |
Cypress Semiconductor Corp.(a) | | | 179,165 | | | | 4,179,920 | |
Entegris, Inc.(a) | | | 65,510 | | | | 3,281,396 | |
First Solar, Inc.(a)(b) | | | 42,386 | | | | 2,371,921 | |
Intel Corp. | | | 2,171,352 | | | | 129,955,417 | |
KLA Corp.(a) | | | 79,879 | | | | 14,232,041 | |
Lam Research Corp. | | | 71,725 | | | | 20,972,390 | |
Marvell Technology Group Ltd.(a) | | | 331,032 | | | | 8,792,210 | |
Maxim Integrated Products, Inc. | | | 137,488 | | | | 8,456,887 | |
Microchip Technology, Inc.(a) | | | 115,644 | | | | 12,110,240 | |
Micron Technology, Inc.(b) | | | 549,371 | | | | 29,545,172 | |
MKS Instruments, Inc.(a) | | | 26,952 | | | | 2,964,990 | |
Monolithic Power Systems, Inc.(a) | | | 20,606 | | | | 3,668,280 | |
NVIDIA Corp. | | | 291,209 | | | | 68,521,478 | |
ON Semiconductor Corp.(a)(b) | | | 205,685 | | | | 5,014,600 | |
Qorvo, Inc.(b) | | | 57,628 | | | | 6,698,102 | |
QUALCOMM, Inc.(a) | | | 569,625 | | | | 50,258,014 | |
Skyworks Solutions, Inc. | | | 85,879 | | | | 10,381,054 | |
Teradyne, Inc. | | | 81,328 | | | | 5,545,756 | |
Texas Instruments, Inc.(a) | | | 468,137 | | | | 60,057,296 | |
Xilinx, Inc. | | | 126,169 | | | | 12,335,543 | |
| | | | | | | | |
| | | | 596,071,154 | |
|
| Software — 7.2% | |
Adobe, Inc.(b) | | | 242,867 | | | | 80,099,965 | |
Alteryx, Inc., Class A(a)(b) | | | 24,012 | | | | 2,402,881 | |
Anaplan, Inc.(b) | | | 42,974 | | | | 2,251,838 | |
ANSYS, Inc.(a)(b) | | | 42,152 | | | | 10,850,346 | |
Aspen Technology, Inc.(b) | | | 34,907 | | | | 4,221,304 | |
Atlassian Corp. PLC, Class A(a)(b) | | | 58,436 | | | | 7,032,188 | |
Autodesk, Inc.(b) | | | 109,381 | | | | 20,067,038 | |
Avalara, Inc.(b) | | | 23,359 | | | | 1,711,047 | |
Cadence Design Systems, Inc.(b) | | | 139,463 | | | | 9,673,154 | |
CDK Global, Inc.(a) | | | 61,638 | | | | 3,370,366 | |
| | |
| 26 | | 2019 BLACKROCK ANNUAL REPORTTO SHAREHOLDERS |
| | |
Schedule of Investments (continued) December 31, 2019 | | Large Cap Index Master Portfolio (Percentages shown are based on Net Assets) |
| | | | | | | | |
| Security | | Shares | | | Value | |
|
| Software (continued) | |
Cerence Inc.(a)(b) | | | 17,330 | | | $ | 392,178 | |
Ceridian HCM Holding, Inc.(a)(b) | | | 45,141 | | | | 3,064,171 | |
Citrix Systems, Inc. | | | 62,847 | | | | 6,969,732 | |
Coupa Software, Inc.(a)(b) | | | 31,593 | | | | 4,620,476 | |
DocuSign, Inc.(a)(b) | | | 77,913 | | | | 5,774,132 | |
Dropbox, Inc., Class A(b) | | | 110,077 | | | | 1,971,479 | |
Dynatrace, Inc.(b) | | | 31,715 | | | | 802,390 | |
Elastic NV(b) | | | 21,103 | | | | 1,356,923 | |
Fair Isaac Corp.(b) | | | 13,966 | | | | 5,232,781 | |
FireEye, Inc.(b) | | | 103,414 | | | | 1,709,433 | |
Fortinet, Inc.(b) | | | 72,386 | | | | 7,727,929 | |
Guidewire Software, Inc.(a)(b) | | | 40,218 | | | | 4,414,730 | |
HubSpot, Inc.(a)(b) | | | 19,263 | | | | 3,053,185 | |
Intuit, Inc.(a) | | | 123,642 | | | | 32,385,549 | |
LogMeIn, Inc.(a) | | | 22,470 | | | | 1,926,578 | |
Manhattan Associates, Inc.(a)(b) | | | 31,244 | | | | 2,491,709 | |
Medallia, Inc.(a)(b) | | | 8,487 | | | | 264,031 | |
Microsoft Corp. | | | 3,772,597 | | | | 594,938,547 | |
New Relic, Inc.(b) | | | 25,596 | | | | 1,681,913 | |
NortonLifeLock, Inc. | | | 293,725 | | | | 7,495,862 | |
Nuance Communications, Inc.(a)(b) | | | 138,645 | | | | 2,472,040 | |
Nutanix, Inc., Class A(a)(b) | | | 84,140 | | | | 2,630,216 | |
Oracle Corp. | | | 1,024,169 | | | | 54,260,474 | |
PagerDuty, Inc.(b) | | | 20,928 | | | | 489,506 | |
Palo Alto Networks, Inc.(b) | | | 47,462 | | | | 10,975,587 | |
Paycom Software, Inc.(a)(b) | | | 24,833 | | | | 6,574,785 | |
Pegasystems, Inc.(a) | | | 18,050 | | | | 1,437,683 | |
Pluralsight, Inc., Class A(a)(b) | | | 32,028 | | | | 551,202 | |
Proofpoint, Inc.(b) | | | 26,842 | | | | 3,080,925 | |
PTC, Inc.(b) | | | 51,544 | | | | 3,860,130 | |
RealPage, Inc.(a)(b) | | | 40,928 | | | | 2,199,880 | |
RingCentral, Inc., Class A(a)(b) | | | 37,054 | | | | 6,249,898 | |
salesforce.com, Inc.(b) | | | 414,061 | | | | 67,342,881 | |
ServiceNow, Inc.(b) | | | 92,529 | | | | 26,122,787 | |
Smartsheet, Inc., Class A(a)(b) | | | 46,552 | | | | 2,091,116 | |
SolarWinds Corp.(a)(b) | | | 28,404 | | | | 526,894 | |
Splunk, Inc.(a)(b) | | | 76,977 | | | | 11,528,845 | |
SS&C Technologies Holdings, Inc.(a) | | | 110,047 | | | | 6,756,886 | |
Synopsys, Inc.(b) | | | 73,318 | | | | 10,205,866 | |
Trade Desk, Inc., Class A(a)(b) | | | 19,768 | | | | 5,135,331 | |
Tyler Technologies, Inc.(b) | | | 18,679 | | | | 5,604,074 | |
VMware, Inc., Class A(a)(b) | | | 37,373 | | | | 5,672,848 | |
Workday, Inc., Class A(b) | | | 80,960 | | | | 13,313,872 | |
Zendesk, Inc.(b) | | | 54,286 | | | | 4,159,936 | |
Zscaler, Inc.(a)(b) | | | 34,268 | | | | 1,593,462 | |
Zynga, Inc., Class A(b) | | | 433,541 | | | | 2,653,271 | |
| | | | | | | | |
| | | | 1,087,444,250 | |
|
| Specialty Retail — 2.1% | |
Advance Auto Parts, Inc.(a) | | | 32,056 | | | | 5,134,089 | |
AutoNation, Inc.(b) | | | 27,108 | | | | 1,318,262 | |
AutoZone, Inc.(b) | | | 11,779 | | | | 14,032,441 | |
Best Buy Co., Inc.(a) | | | 112,156 | | | | 9,847,297 | |
Burlington Stores, Inc.(a)(b) | | | 31,999 | | | | 7,296,732 | |
CarMax, Inc.(b) | | | 80,378 | | | | 7,046,739 | |
Carvana Co.(b) | | | 21,417 | | | | 1,971,435 | |
Dick’s Sporting Goods, Inc.(a) | | | 32,815 | | | | 1,624,014 | |
Five Below, Inc.(b) | | | 27,078 | | | | 3,462,193 | |
Floor & Decor Holdings, Inc., Class A(a)(b) | | | 31,642 | | | | 1,607,730 | |
Foot Locker, Inc.(a) | | | 55,973 | | | | 2,182,387 | |
Gap, Inc.(a) | | | 116,136 | | | | 2,053,285 | |
Home Depot, Inc.(a) | | | 549,721 | | | | 120,048,072 | |
L Brands, Inc.(a) | | | 108,526 | | | | 1,966,491 | |
Lowe’s Cos., Inc.(a) | | | 385,240 | | | | 46,136,343 | |
O’Reilly Automotive, Inc.(b) | | | 36,876 | | | | 16,161,276 | |
| | | | | | | | |
| Security | | Shares | | | Value | |
|
| Specialty Retail (continued) | |
Penske Automotive Group, Inc.(a) | | | 15,197 | | | $ | 763,193 | |
Ross Stores, Inc. | | | 176,455 | | | | 20,542,891 | |
Tiffany & Co.(a) | | | 59,285 | | | | 7,923,440 | |
TJX Cos., Inc. | | | 607,969 | | | | 37,122,587 | |
Tractor Supply Co. | | | 59,878 | | | | 5,595,000 | |
Ulta Salon Cosmetics & Fragrance, Inc.(b) | | | 27,601 | | | | 6,986,917 | |
Urban Outfitters, Inc.(a)(b) | | | 31,154 | | | | 865,147 | |
Williams-Sonoma, Inc.(a) | | | 40,386 | | | | 2,965,948 | |
| | | | | | | | |
| | | | 324,653,909 | |
|
| Technology Hardware, Storage & Peripherals — 4.7% | |
Apple, Inc. | | | 2,217,286 | | | | 651,106,034 | |
Dell Technologies, Inc., Class C(a)(b) | | | 76,696 | | | | 3,941,407 | |
Hewlett Packard Enterprise Co.(a) | | | 646,891 | | | | 10,259,691 | |
HP, Inc. | | | 738,818 | | | | 15,182,710 | |
NCR Corp.(b) | | | 63,562 | | | | 2,234,840 | |
NetApp, Inc.(a) | | | 120,882 | | | | 7,524,904 | |
Pure Storage, Inc., Class A(b) | | | 117,353 | | | | 2,007,910 | |
Western Digital Corp. | | | 149,534 | | | | 9,490,923 | |
Xerox Holdings Corp.(b) | | | 87,896 | | | | 3,240,726 | |
| | | | | | | | |
| | | | 704,989,145 | |
|
| Textiles, Apparel & Luxury Goods — 0.8% | |
Capri Holdings Ltd.(b) | | | 67,961 | | | | 2,592,712 | |
Carter’s, Inc.(a) | | | 22,980 | | | | 2,512,633 | |
Columbia Sportswear Co.(a) | | | 15,339 | | | | 1,536,814 | |
Hanesbrands, Inc.(a) | | | 182,139 | | | | 2,704,764 | |
Lululemon Athletica, Inc.(a)(b) | | | 58,559 | | | | 13,566,364 | |
NIKE, Inc., Class B | | | 615,834 | | | | 62,390,143 | |
PVH Corp.(a) | | | 37,356 | | | | 3,927,983 | |
Ralph Lauren Corp.(a) | | | 23,530 | | | | 2,758,187 | |
Skechers U.S.A., Inc., Class A(b) | | | 65,399 | | | | 2,824,583 | |
Tapestry, Inc. | | | 132,547 | | | | 3,574,793 | |
Under Armour, Inc., Class A(a)(b) | | | 88,739 | | | | 1,916,762 | |
Under Armour, Inc., Class C(a)(b) | | | 98,963 | | | | 1,898,110 | |
VF Corp.(a) | | | 151,970 | | | | 15,145,330 | |
| | | | | | | | |
| | | | 117,349,178 | |
|
| Thrifts & Mortgage Finance — 0.0% | |
LendingTree, Inc.(a)(b) | | | 3,481 | | | | 1,056,274 | |
MGIC Investment Corp.(a) | | | 181,135 | | | | 2,566,683 | |
New York Community Bancorp, Inc.(a) | | | 221,693 | | | | 2,664,750 | |
TFS Financial Corp.(a) | | | 20,191 | | | | 397,359 | |
| | | | | | | | |
| | | | 6,685,066 | |
|
| Tobacco — 0.7% | |
Altria Group, Inc. | | | 935,367 | | | | 46,684,167 | |
Philip Morris International, Inc. | | | 775,627 | | | | 65,998,101 | |
| | | | | | | | |
| | | | 112,682,268 | |
|
| Trading Companies & Distributors — 0.3% | |
Air Lease Corp.(a) | | | 53,522 | | | | 2,543,365 | |
Fastenal Co.(a) | | | 286,408 | | | | 10,582,776 | |
HD Supply Holdings, Inc.(b) | | | 84,427 | | | | 3,395,654 | |
MSC Industrial Direct Co., Inc., Class A(a) | | | 22,353 | | | | 1,754,040 | |
United Rentals, Inc.(b) | | | 36,859 | | | | 6,146,975 | |
Univar Solutions, Inc.(a)(b) | | | 83,298 | | | | 2,019,144 | |
W.W. Grainger, Inc. | | | 21,131 | | | | 7,153,266 | |
Watsco, Inc.(a) | | | 15,602 | | | | 2,810,700 | |
WESCO International, Inc.(a)(b) | | | 19,814 | | | | 1,176,754 | |
| | | | | | | | |
| | | | 37,582,674 | |
|
| Transportation Infrastructure — 0.0% | |
Macquarie Infrastructure Corp.(a) | | | 33,742 | | | | 1,445,507 | |
| | | | | | | | |
|
| Water Utilities — 0.1% | |
American Water Works Co., Inc. | | | 89,836 | | | | 11,036,352 | |
Aqua America, Inc.(a) | | | 106,136 | | | | 4,982,024 | |
| | | | | | | | |
| | | | 16,018,376 | |
| | | | |
| SCHEDULE OF INVESTMENTS | | | 27 | |
| | |
Schedule of Investments (continued) December 31, 2019 | | Large Cap Index Master Portfolio (Percentages shown are based on Net Assets) |
| | | | | | | | |
| Security | | Shares | | | Value | |
|
| Wireless Telecommunication Services — 0.1% | |
Sprint Corp.(b) | | | 276,127 | | | $ | 1,438,622 | |
T-Mobile U.S., Inc.(b) | | | 156,822 | | | | 12,297,981 | |
Telephone & Data Systems, Inc. | | | 52,824 | | | | 1,343,314 | |
United States Cellular Corp.(b) | | | 6,801 | | | | 246,400 | |
| | | | | | | | |
| | | | 15,326,317 | |
| | | | | |
| |
Total Common Stocks — 97.8%
(Cost — $11,057,929,319) | | | | 14,803,221,131 | |
| | | | | |
|
| Investment Companies — 0.3% | |
iShares Russell 1000 ETF(a)(e) | | | 256,813 | | | | 45,820,575 | |
| | | | | | | | |
| |
Total Investment Companies — 0.3%
(Cost — $36,126,845) | | | | 45,820,575 | |
| | | | | |
| |
Total Long-Term Investments — 98.1%
(Cost — $11,094,056,164) | | | | 14,849,041,706 | |
| | | | | | | | |
| | | | | | | | |
| Security | | Shares | | | Value | |
|
| Short-Term Securities — 10.8% | |
BlackRock Cash Funds: Institutional,
SL Agency Shares,
| | | | | | | | |
1.84%(c)(d)(e) | | | 1,419,147,567 | | | $ | 1,419,715,226 | |
BlackRock Cash Funds: Treasury,
SL Agency Shares,
| | | | | | | | |
1.52%(c)(e) | | | 216,786,742 | | | | 216,786,742 | |
| | | | | | | | |
| |
Total Short-Term Securities — 10.8%
(Cost — $1,636,221,819) | | | | 1,636,501,968 | |
| | | | | | | | |
| |
Total Investments — 108.9%
(Cost — $12,730,277,983) | | | | 16,485,543,674 | |
| |
Liabilities in Excess of Other Assets — (8.9)% | | | | (1,343,809,803 | ) |
| | | | | | | | |
| |
Net Assets — 100.0% | | | $ | 15,141,733,871 | |
| | | | | | | | |
| (a) | Security, or a portion of the security, is on loan. |
| (b) | Non-income producing security. |
| (c) | Annualized7-day yield as of period end. |
| (d) | All or a portion of the security was purchased with the cash collateral from loaned securities. |
| (e) | During the year ended December 31, 2019, investments in issuers considered to be an affiliate/affiliates of the Master Portfolio for purposes of Section 2(a)(3) of the Investment Company Act of 1940, as amended, and/or related parties of the Master Portfolio were as follows: |
| | | | | | | | | | | | | | | | | | | | | | | | | | | | | | | | |
Affiliated Persons and/or Related
Parties | | Shares
Held at
12/31/18 | | | Shares
Purchased | | | Shares Sold | | | Shares
Held at
12/31/19 | | | Value at
12/31/19 | | | Income | | | Net Realized
Gain (Loss) (a) | | | Change in
Unrealized
Appreciation
(Depreciation) | |
BlackRock, Inc. | | | 52,998 | | | | 7,164 | | | | (1,334 | ) | | | 58,828 | | | $ | 29,572,836 | | | $ | 729,838 | | | $ | (54,049 | ) | | $ | 6,284,173 | |
BlackRock Cash Funds: Institutional, SL Agency Shares(b) | | | 799,897,976 | | | | 619,249,591 | | | | — | | | | 1,419,147,567 | | | | 1,419,715,226 | | | | 4,291,782 | (c) | | | 21,604 | | | | 246,864 | |
BlackRock Cash Funds: Treasury, SL Agency Shares(b) | | | 150,337,223 | | | | 66,449,519 | | | | — | | | | 216,786,742 | | | | 216,786,742 | | | | 2,745,729 | | | | — | | | | — | |
iShares Russell 1000 ETF | | | 206,819 | | | | 3,354,896 | | | | (3,304,902 | ) | | | 256,813 | | | | 45,820,575 | | | | 1,693,906 | | | | 8,067,920 | | | | 9,712,045 | |
| | | | | | | | | | | | | | | | | | | | | | | | | | | | | | | | |
| | | | | | | | | | | | | | | | | | $ | 1,711,895,379 | | | $ | 9,461,255 | | | $ | 8,035,475 | | | $ | 16,243,082 | |
| | | | | | | | | | | | | | | | | |
| | (a) | Includes net capital gain distributions, if applicable. | |
| | (b) | Represents net shares purchased (sold). | |
| | (c) | Represents securities lending income earned from the reinvestment of cash collateral from loaned securities, net of fees and collateral investment expenses, and other payments to and from borrowers of securities. | |
Derivative Financial Instruments Outstanding as of Period End
Futures Contracts
| | | | | | | | | | | | | | | | |
| Description | | Number of
Contracts | | | Expiration
Date | | | Notional
Amount (000) | | | Value /
Unrealized
Appreciation
(Depreciation) | |
Long Contracts | |
S&P 500E-Mini Index | | | 676 | | | | 03/20/20 | | | $ | 109,211 | | | $ | 322,828 | |
S&P MidCap 400E-Mini Index | | | 44 | | | | 03/20/20 | | | | 9,085 | | | | 19,138 | |
| | | | | | | | | | | | | | | | |
| | | | | | | $ | 341,966 | |
| | | | | | | | | |
| | |
| 28 | | 2019 BLACKROCK ANNUAL REPORTTO SHAREHOLDERS |
| | |
Schedule of Investments (continued) December 31, 2019 | | Large Cap Index Master Portfolio |
Derivative Financial Instruments Categorized by Risk Exposure
As of period end, the fair values of derivative financial instruments located in the Statements of Assets and Liabilities were as follows:
| | | | | | | | | | | | | | | | | | | | | | | | | | | | |
| | | Commodity
Contracts | | | Credit
Contracts | | | Equity
Contracts | | | Foreign
Currency
Exchange
Contracts | | | Interest
Rate
Contracts | | | Other
Contracts | | | Total | |
Assets — Derivative Financial Instruments | | | | | | | | | | | | | | | | | | | | | | | | | | | | |
Futures contracts | | | | | | | | | | | | | | | | | | | | | | | | | | | | |
Unrealized appreciation on futures contracts(a) | | $ | — | | | $ | — | | | $ | 341,966 | | | $ | — | | | $ | | | | $ | — | | | $ | 341,966 | |
| | | | | | | | | | | | | | | | | | | | | | | | | | | | |
| | (a) | Net cumulative unrealized appreciation (depreciation) on futures contracts, if any, are reported in the Schedule of Investments. In the Statements of Assets and Liabilities, only current day’s variation margin is reported in receivables or payables and the net cumulative unrealized appreciation (depreciation) is included in net unrealized appreciation. | |
For the year ended December 31, 2019, the effect of derivative financial instruments in the Statements of Operations were as follows:
| | | | | | | | | | | | | | | | | | | | | | | | | | | | |
| | | Commodity
Contracts | | | Credit
Contracts | | | Equity
Contracts | | | Foreign
Currency
Exchange
Contracts | | | Interest
Rate
Contracts | | | Other Contracts | | | Total | |
Net Realized Gain (Loss) from: | | | | | | | | | | | | | | | | | | | | | | | | | | | | |
Futures contracts | | $ | — | | | $ | — | | | $ | 35,649,991 | | | $ | — | | | $ | | | | $ | — | | | $ | 35,649,991 | |
| | | | | | | | | | | | | | | | | | | | | | | | | | | | |
| | | | | | | |
| Net Change in Unrealized Appreciation (Depreciation) on: | | | | | | | | | | | | | | | | | | | | | |
Futures contracts | | $ | — | | | $ | — | | | $ | 101,265 | | | $ | — | | | $ | | | | $ | — | | | $ | 101,265 | |
| | | | | | | | | | | | | | | | | | | | | | | | | | | | |
Average Quarterly Balances of Outstanding Derivative Financial Instruments
| | | | |
Futures contracts: | |
Average notional value of contracts — long | | $ | 98,098,801 | |
For more information about the Master Portfolio’s investment risks regarding derivative financial instruments, refer to the Notes to Financial Statements.
Fair Value Hierarchy as of Period End
Various inputs are used in determining the fair value of investments and derivative financial instruments. For information about the Master Portfolio’s policy regarding valuation of investments and derivative financial instruments, refer to the Notes to Financial Statements.
The following tables summarize the Master Portfolio’s investments and derivative financial instruments categorized in the disclosure hierarchy:
| | | | | | | | | | | | | | | | |
| | | Level 1 | | | Level 2 | | | Level 3 | | | Total | |
Assets: | |
Investments: | |
Long-Term Investments(a): | |
Common Stocks | | $ | 14,803,221,131 | | | $ | — | | | $ | — | | | $ | 14,803,221,131 | |
Investment Companies | | | 45,820,575 | | | | — | | | | — | | | | 45,820,575 | |
Short-Term Securities | | | 1,636,501,968 | | | | — | | | | — | | | | 1,636,501,968 | |
| | | | | | | | | | | | | | | | |
| | $ | 16,485,543,674 | | | $ | — | | | $ | — | | | $ | 16,485,543,674 | |
| | | | | | | | | | | | | | | | |
Derivative Financial Instruments(b) | |
Assets: | |
Equity contracts | | $ | 341,966 | | | $ | — | | | $ | — | | | $ | 341,966 | |
| | | | | | | | | | | | | | | | |
| | (a) | See above Schedule of Investments for values in each industry. | |
| | (b) | Derivative financial instruments are futures contracts. Futures contracts which are valued at the unrealized appreciation (depreciation) on the instrument. | |
See notes to financial statements.
| | | | |
| SCHEDULE OF INVESTMENTS | | | 29 | |
Statement of Assets and Liabilities
December 31, 2019
| | | | |
| | | Large Cap Index
Master Portfolio | |
|
ASSETS | |
Investments at value — unaffiliated (including securities loaned at value of $1,393,562,024, cost — $11,035,160,735) | | $ | 14,773,648,295 | |
Investments at value — affiliated (cost — $1,695,117,248) | | | 1,711,895,379 | |
Cash | | | 37,431 | |
Cash pledged for futures contracts | | | 8,326,100 | |
Receivables: | |
Investments sold | | | 69,584,302 | |
Securities lending income — affiliated | | | 449,515 | |
Contributions from investors | | | 10,996,683 | |
Dividends — affiliated | | | 201,553 | |
Dividends — unaffiliated | | | 15,365,864 | |
Variation margin on futures contracts | | | 501,150 | |
Prepaid expenses | | | 55,835 | |
| | | | |
Total assets | | | 16,591,062,107 | |
| | | | |
|
LIABILITIES | |
Cash collateral on securities loaned at value | | | 1,419,501,248 | |
Payables: | |
Investments purchased | | | 20,783,192 | |
Investment advisory fees | | | 708,257 | |
Other accrued expenses | | | 57,505 | |
Trustees’ fees | | | 40,262 | |
Withdrawals to investors | | | 8,237,772 | |
| | | | |
Total liabilities | | | 1,449,328,236 | |
| | | | |
| |
NET ASSETS | | $ | 15,141,733,871 | |
| | | | |
|
NET ASSETS CONSIST OF | |
Investors’ capital | | $ | 11,386,126,214 | |
Net unrealized appreciation (depreciation) | | | 3,755,607,657 | |
| | | | |
NET ASSETS | | $ | 15,141,733,871 | |
| | | | |
See notes to financial statements.
| | |
| 30 | | 2019 BLACKROCK ANNUAL REPORTTO SHAREHOLDERS |
Statement of Operations
Year Ended December 31, 2019
| | | | |
| | | Large Cap Index Master Portfolio | |
|
INVESTMENT INCOME | |
Dividends — affiliated | | $ | 5,169,473 | |
Dividends — unaffiliated | | | 237,125,691 | |
Securities lending income — affiliated — net | | | 4,291,782 | |
Foreign taxes withheld | | | (18,846 | ) |
| | | | |
Total investment income | | | 246,568,100 | |
| | | | |
|
EXPENSES | |
Investment advisory | | | 3,796,271 | |
Trustees | | | 174,825 | |
Professional | | | 95,716 | |
Accounting services | | | 40,984 | |
Printing | | | 1,338 | |
Miscellaneous | | | 133,584 | |
| | | | |
Total expenses | | | 4,242,718 | |
Less fees waived and/or reimbursed by the Manager | | | (114,692 | ) |
| | | | |
Total expenses after fees waived and/or reimbursed | | | 4,128,026 | |
| | | | |
Net investment income | | | 242,440,074 | |
| | | | |
|
REALIZED AND UNREALIZED GAIN (LOSS) | |
Net realized gain (loss) from: | |
Futures contracts | | | 35,649,991 | |
Investments — affiliated | | | 8,035,475 | |
Investments — unaffiliated | | | (17,250,010 | ) |
| | | | |
| | | 26,435,456 | |
| | | | |
Net change in unrealized appreciation (depreciation) on: | |
Futures contracts | | | 101,265 | |
Investments — affiliated | | | 16,243,082 | |
Investments — unaffiliated | | | 3,115,769,725 | |
| | | | |
| | | 3,132,114,072 | |
| | | | |
Net realized and unrealized gain | | | 3,158,549,528 | |
| | | | |
NET INCREASE IN NET ASSETS RESULTING FROM OPERATIONS | | $ | 3,400,989,602 | |
| | | | |
See notes to financial statements.
Statements of Changes in Net Assets
| | | | | | | | |
| | | Large Cap Index Master Portfolio | |
| | | Year Ended December 31, | |
| | | 2019 | | | 2018 | |
|
INCREASE (DECREASE) IN NET ASSETS | |
|
OPERATIONS | |
Net investment income | | $ | 242,440,074 | | | $ | 162,226,602 | |
Net realized gain (loss) | | | 26,435,456 | | | | (46,751,799 | ) |
Net change in unrealized appreciation (depreciation) | | | 3,132,114,072 | | | | (745,515,325 | ) |
| | | | | | | | |
Net increase (decrease) in net assets resulting from operations | | | 3,400,989,602 | | | | (630,040,522 | ) |
| | | | | | | | |
|
CAPITAL TRANSACTIONS | |
Proceeds from contributions | | | 2,809,050,262 | | | | 7,660,435,677 | |
Value of withdrawals | | | (1,348,261,152 | ) | | | (3,447,460,074 | ) |
| | | | | | | | |
Net increase in net assets derived from capital transactions | | | 1,460,789,110 | | | | 4,212,975,603 | |
| | | | | | | | |
|
NET ASSETS | |
Total increase in net assets | | | 4,861,778,712 | | | | 3,582,935,081 | |
Beginning of year | | | 10,279,955,159 | | | | 6,697,020,078 | |
| | | | | | | | |
End of year | | $ | 15,141,733,871 | | | $ | 10,279,955,159 | |
| | | | | | | | |
See notes to financial statements.
| | |
| 32 | | 2019 BLACKROCK ANNUAL REPORTTO SHAREHOLDERS |
Financial Highlights
(For a share outstanding throughout each period)
| | | | | | | | | | | | | | | | | | | | |
| | | Large Cap Index Master Portfolio | |
| |
| | | Year Ended December 31, | |
| | | 2019 | | | 2018 | | | 2017 | | | 2016 | | | 2015 | |
|
Total Return | |
Total return | | | 31.33 | % | | | (4.81 | )% | | | 21.65 | % | | | 11.97 | % | | | 0.92 | % |
| | | | | | | | | | | | | | | | | | | | |
|
Ratios to Average Net Assets | |
Total expenses | | | 0.03 | % | | | 0.04 | % | | | 0.04 | % | | | 0.04 | % | | | 0.05 | % |
| | | | | | | | | | | | | | | | | | | | |
Total expenses after fees waived and/or reimbursed and paid indirectly | | | 0.03 | % | | | 0.03 | % | | | 0.04 | % | | | 0.04 | % | | | 0.04 | % |
| | | | | | | | | | | | | | | | | | | | |
Net investment income | | | 1.92 | % | | | 1.97 | % | | | 1.92 | % | | | 2.11 | % | | | 1.93 | % |
| | | | | | | | | | | | | | | | | | | | |
|
Supplemental Data | |
Net assets, end of year (000) | | $ | 15,141,734 | | | $ | 10,279,955 | | | $ | 6,697,020 | | | $ | 3,967,557 | | | $ | 2,542,629 | |
| | | | | | | | | | | | | | | | | | | | |
Portfolio turnover rate | | | 10 | % | | | 12 | % | | | 12 | % | | | 13 | % | | | 6 | % |
| | | | | | | | | | | | | | | | | | | | |
See notes to financial statements.
Notes to Financial Statements
Master Investment Portfolio (“MIP”) is registered under the Investment Company Act of 1940, as amended (the “1940 Act”), as anopen-end management investment company. MIP is organized as a Delaware statutory trust. Large Cap Index Master Portfolio (the “Master Portfolio”) is a series of MIP. The Master Portfolio is classified as diversified.
The Master Portfolio, together with certain other registered investment companies advised by BlackRock Fund Advisors (“BFA” or the “Manager”) or its affiliates, are included in a complex of equity, multi-asset, index and money market funds referred to as the BlackRock Multi-Asset Complex.
| 2. | SIGNIFICANT ACCOUNTING POLICIES |
The financial statements are prepared in conformity with accounting principles generally accepted in the United States of America (“U.S. GAAP”), which may require management to make estimates and assumptions that affect the reported amounts of assets and liabilities in the financial statements, disclosure of contingent assets and liabilities at the date of the financial statements and the reported amounts of increases and decreases in net assets from operations during the reporting period. Actual results could differ from those estimates. The Master Portfolio is considered an investment company under U.S. GAAP and follows the accounting and reporting guidance applicable to investment companies. Below is a summary of significant accounting policies:
Investment Transactions and Income Recognition:For financial reporting purposes, investment transactions are recorded on the dates the transactions are executed. Realized gains and losses on investment transactions are determined on the identified cost basis. Dividend income is recorded on theex-dividend date. Dividends from foreign securities where theex-dividend date may have passed are subsequently recorded when the Master Portfolio is informed of theex-dividend date. Under the applicable foreign tax laws, a withholding tax at various rates may be imposed on capital gains, dividends and interest. Upon notification from issuers, a portion of the dividend income received from a real estate investment trust may be redesignated as a reduction of cost of the related investment and/or realized gain.
Segregation and Collateralization: In cases where the Master Portfolio enters into certain investments (e.g., futures contracts) that would be treated as “senior securities” for 1940 Act purposes, the Master Portfolio may segregate or designate on its books and records cash or liquid assets having a market value at least equal to the amount of its future obligations under such investments. Doing so allows the investment to be excluded from treatment as a “senior security.” Furthermore, if required by an exchange or counterparty agreement, the Master Portfolio may be required to deliver/deposit cash and/or securities to/with an exchange, or broker-dealer or custodian as collateral for certain investments or obligations.
Indemnifications:In the normal course of business, the Master Portfolio enters into contracts that contain a variety of representations that provide general indemnification. The Master Portfolio’s maximum exposure under these arrangements is unknown because it involves future potential claims against the Master Portfolio, which cannot be predicted with any certainty.
Other: Expenses directly related to the Master Portfolio are charged to the Master Portfolio. Other operating expenses shared by several funds, including other funds managed by the Manager, are prorated among those funds on the basis of relative net assets or other appropriate methods.
| 3. | INVESTMENT VALUATION AND FAIR VALUE MEASUREMENTS |
Investment Valuation Policies: The Master Portfolio’s investments are valued at fair value (also referred to as “market value” within the financial statements) as of the close of trading on the New York Stock Exchange (“NYSE”) (generally 4:00 p.m., Eastern time). U.S. GAAP defines fair value as the price the Master Portfolio would receive to sell an asset or pay to transfer a liability in an orderly transaction between market participants at the measurement date. The Master Portfolio determines the fair values of its financial instruments using various independent dealers or pricing services under policies approved by the Board of Trustees of the MIP (the “Board”). The BlackRock Global Valuation Methodologies Committee (the “Global Valuation Committee”) is the committee formed by management to develop global pricing policies and procedures and to oversee the pricing function for all financial instruments.
Fair Value Inputs and Methodologies:The following methods and inputs are used to establish the fair value of the Master Portfolio’s assets and liabilities:
| | • | | Equity investments traded on a recognized securities exchange are valued at the official closing price each day, if available. For equity investments traded on more than one exchange, the official closing price on the exchange where the stock is primarily traded is used. Equity investments traded on a recognized exchange for which there were no sales on that day may be valued at the last available bid (long positions) or ask (short positions) price. |
| | • | | Investments inopen-end U.S. mutual funds are valued at net asset value (“NAV”) each business day. |
| | • | | Futures contracts traded on exchanges are valued at their last sale price. |
If events (e.g., a company announcement, market volatility or a natural disaster) occur that are expected to materially affect the value of such investments, or in the event that the application of these methods of valuation results in a price for an investment that is deemed not to be representative of the market value of such investment, or if a price is not available, the investment will be valued by the Global Valuation Committee, or its delegate, in accordance with a policy approved by the Board as reflecting fair value (“Fair Valued Investments”). The fair valuation approaches that may be used by the Global Valuation Committee will include market approach, income approach and cost approach. Valuation techniques such as discounted cash flow, use of market comparables and matrix pricing are types of valuation approaches and are typically used in determining fair value. When determining the price for Fair Valued Investments, the Global Valuation Committee, or its delegate, seeks to determine the price that the Master Portfolio might reasonably expect to receive or pay from the current sale or purchase of that asset or liability in anarm’s-length transaction. Fair value determinations shall be based upon all available factors that the Global Valuation Committee, or its delegate, deems relevant and consistent with the principles of fair value measurement. The pricing of all Fair Valued Investments is subsequently reported to the Board or a committee thereof on a quarterly basis.
| | |
| 34 | | 2019 BLACKROCK ANNUAL REPORTTO SHAREHOLDERS |
Notes to Financial Statements (continued)
Fair Value Hierarchy:Various inputs are used in determining the fair value of investments and derivative financial instruments. These inputs to valuation techniques are categorized into a fair value hierarchy consisting of three broad levels for financial statement purposes as follows:
| | • | | Level 1 — Unadjusted price quotations in active markets/exchanges for identical assets or liabilities that the Master Portfolio has the ability to access |
| | • | | Level 2 — Other observable inputs (including, but not limited to, quoted prices for similar assets or liabilities in markets that are active, quoted prices for identical or similar assets or liabilities in markets that are not active, inputs other than quoted prices that are observable for the assets or liabilities (such as interest rates, yield curves, volatilities, prepayment speeds, loss severities, credit risks and default rates) or other market–corroborated inputs) |
| | • | | Level 3 — Unobservable inputs based on the best information available in the circumstances, to the extent observable inputs are not available (including the Global Valuation Committee’s assumptions used in determining the fair value of investments and derivative financial instruments) |
The hierarchy gives the highest priority to unadjusted quoted prices in active markets for identical assets or liabilities (Level 1 measurements) and the lowest priority to unobservable inputs (Level 3 measurements). Accordingly, the degree of judgment exercised in determining fair value is greatest for instruments categorized in Level 3. The inputs used to measure fair value may fall into different levels of the fair value hierarchy. In such cases, for disclosure purposes, the fair value hierarchy classification is determined based on the lowest level input that is significant to the fair value measurement in its entirety. Investments classified within Level 3 have significant unobservable inputs used by the Global Valuation Committee in determining the price for Fair Valued Investments. Level 3 investments include equity or debt issued by privately held companies or funds. There may not be a secondary market, and/or there are a limited number of investors. The categorization of a value determined for investments and derivative financial instruments is based on the pricing transparency of the investments and derivative financial instruments and is not necessarily an indication of the risks associated with investing in those securities.
| 4. | SECURITIES AND OTHER INVESTMENTS |
Securities Lending: The Master Portfolio may lend its securities to approved borrowers, such as brokers, dealers and other financial institutions. The borrower pledges and maintains with the Master Portfolio collateral consisting of cash, an irrevocable letter of credit issued by a bank, or securities issued or guaranteed by the U.S. Government. The initial collateral received by the Master Portfolio is required to have a value of at least 102% of the current value of the loaned securities for securities traded on U.S. exchanges and a value of at least 105% for all other securities. The collateral is maintained thereafter at a value equal to at least 100% of the current market value of the securities on loan. The market value of the loaned securities is determined at the close of each business day of the Master Portfolio and any additional required collateral is delivered to the Master Portfolio, or excess collateral returned by the Master Portfolio, on the next business day. During the term of the loan, the Master Portfolio is entitled to all distributions made on or in respect of the loaned securities, but does not receive interest income on securities received as collateral. Loans of securities are terminable at any time and the borrower, after notice, is required to return borrowed securities within the standard time period for settlement of securities transactions.
The market value of any securities on loan, all of which were classified as common stocks in the Master Portfolio’s Schedule of Investments, and the value of any related collateral are shown separately in the Statement of Assets and Liabilities as a component of investments at value — unaffiliated, and collateral on securities loaned at value, respectively. As of period end, any securities on loan were collateralized by cash and/or U.S. Government obligations. Cash collateral invested by the securities lending agent, BlackRock Institutional Trust Company, N.A. (“BTC”), if any, is disclosed in the Schedule of Investments.
Securities lending transactions are entered into by the Master Portfolio under Master Securities Lending Agreements (each, an “MSLA”), which provide the right, in the event of default (including bankruptcy or insolvency), for thenon-defaulting party to liquidate the collateral and calculate a net exposure to the defaulting party or request additional collateral. In the event that a borrower defaults, the Master Portfolio, as lender, would offset the market value of the collateral received against the market value of the securities loaned. When the value of the collateral is greater than that of the market value of the securities loaned, the lender is left with a net amount payable to the defaulting party. However, bankruptcy or insolvency laws of a particular jurisdiction may impose restrictions on or prohibitions against such a right of offset in the event of an MSLA counterparty’s bankruptcy or insolvency. Under the MSLA, absent an event of default, the borrower can resell orre-pledge the loaned securities, and the Master Portfolio can reinvest cash collateral received in connection with loaned securities. Upon an event of default, the parties’ obligations to return the securities or collateral to the other party are extinguished, and the parties can resell orre-pledge the loaned securities or the collateral received in connection with the loaned securities in order to satisfy the defaulting party’s net payment obligation for all transactions under the MSLA. The defaulting party remains liable for any deficiency.
As of period end, the following table is a summary of the Master Portfolio’s securities lending agreements by counterparty which are subject to offset under an MSLA:
| | | | | | | | | | | | |
| Counterparty | | Securities
Loaned at Value | | | Cash Collateral Received (a) | | | Net Amount | |
Barclays Bank Plc | | $ | 40,633,469 | | | $ | (40,633,469 | ) | | $ | — | |
Barclays Capital, Inc. | | | 14,666,761 | | | | (14,666,761 | ) | | | — | |
BMO Capital Markets | | | 180,070 | | | | (180,070 | ) | | | — | |
BNP Paribas Prime Brokerage International Limited | | | 419,027,911 | | | | (419,027,911 | ) | | | — | |
BNP Paribas Securities Corp. | | | 3,595,077 | | | | (3,595,077 | ) | | | — | |
BofA Securities, Inc. | | | 204,708,811 | | | | (204,708,811 | ) | | | — | |
Citadel Clearing LLC | | | 3,635,124 | | | | (3,635,124 | ) | | | — | |
Credit Suisse Securities (USA) LLC | | | 14,116,839 | | | | (14,116,839 | ) | | | — | |
Deutsche Bank Securities, Inc. | | | 8,706,707 | | | | (8,706,707 | ) | | | — | |
Goldman Sachs & Co. | | | 124,615,264 | | | | (124,615,264 | ) | | | — | |
HSBC Bank Plc | | | 46,631,441 | | | | (46,631,441 | ) | | | — | |
Jefferies LLC | | | 683,562 | | | | (683,562 | ) | | | — | |
JP Morgan Securities LLC | | | 146,428,140 | | | | (146,428,140 | ) | | | — | |
| | | | |
| NOTESTO FINANCIAL STATEMENTS | | | 35 | |
Notes to Financial Statements (continued)
| | | | | | | | | | | | |
| Counterparty | | Securities
Loaned at Value | | | Cash Collateral Received (a) | | | Net Amount | |
Morgan Stanley��& Co. LLC | | $ | 108,028,420 | | | $ | (108,028,420 | ) | | $ | — | |
Nomura Securities International, Inc. | | | 10,178,572 | | | | (10,178,572 | ) | | | — | |
RBC Capital Markets LLC | | | 2,567,182 | | | | (2,567,182 | ) | | | — | |
Scotia Capital (USA), Inc | | | 8,943,420 | | | | (8,943,420 | ) | | | — | |
SG Americas Securities LLC | | | 26,171,758 | | | | (26,171,758 | ) | | | — | |
State Street Bank and Trust Co. | | | 25,323 | | | | (25,323 | ) | | | — | |
TD Prime Services LLC | | | 3,203,684 | | | | (3,203,684 | ) | | | — | |
UBS AG | | | 39,726,729 | | | | (39,726,729 | ) | | | — | |
UBS Securities LLC | | | 61,144,510 | | | | (61,144,510 | ) | | | — | |
Virtu Americas, LLC | | | 9,028,774 | | | | (9,028,774 | ) | | | — | |
Wells Fargo Bank, National Association | | | 41,525,643 | | | | (41,525,643 | ) | | | — | |
Wells Fargo Securities LLC | | | 55,388,833 | | | | (55,388,833 | ) | | | — | |
| | | | | | | | | | | | |
| | $ | 1,393,562,024 | | | $ | (1,393,562,024 | ) | | $ | — | |
| | | | | | | | | | | | |
| | (a) | Collateral received in excess of the market value of securities on loan is not presented in this table. The total cash collateral received by Master Portfolio is disclosed in the Master Portfolio’s Statement of Assets and Liabilities. | |
The risks of securities lending include the risk that the borrower may not provide additional collateral when required or may not return the securities when due. To mitigate these risks, the Master Portfolio benefits from a borrower default indemnity provided by BlackRock, Inc. (“BlackRock”). BlackRock’s indemnity allows for full replacement of the securities loaned to the extent the collateral received does not cover the value on the securities loaned in the event of borrower default. The Master Portfolio could incur a loss if the value of an investment purchased with cash collateral falls below the market value of loaned securities or if the value of an investment purchased with cash collateral falls below the value of the original cash collateral received. Such losses are borne entirely by the Master Portfolio.
| 5. | DERIVATIVE FINANCIAL INSTRUMENTS |
The Master Portfolio engages in various portfolio investment strategies using derivative contracts both to increase the returns of the Master Portfolio and/or to manage its exposure to certain risks such as credit risk, equity risk, interest rate risk, foreign currency exchange rate risk, commodity price risk or other risks (e.g., inflation risk). Derivative financial instruments categorized by risk exposure are included in the Schedule of Investments. These contracts may be transacted on an exchange orover-the-counter (“OTC”).
Futures Contracts: Futures contracts are purchased or sold to gain exposure to, or manage exposure to, changes in interest rates (interest rate risk) and changes in the value of equity securities (equity risk) or foreign currencies (foreign currency exchange rate risk).
Futures contracts are agreements between the Master Portfolio and a counterparty to buy or sell a specific quantity of an underlying instrument at a specified price and on a specified date. Depending on the terms of a contract, it is settled either through physical delivery of the underlying instrument on the settlement date or by payment of a cash amount on the settlement date. Upon entering into a futures contract, the Master Portfolio is required to deposit initial margin with the broker in the form of cash or securities in an amount that varies depending on a contract’s size and risk profile. The initial margin deposit must then be maintained at an established level over the life of the contract. Amounts pledged, which are considered restricted, are included in cash pledged for futures contracts in the Statement of Assets and Liabilities.
Securities deposited as initial margin are designated in the Schedule of Investments and cash deposited, if any, are shown as cash pledged for futures contracts in the Statement of Assets and Liabilities. Pursuant to the contract, the Master Portfolio agrees to receive from or pay to the broker an amount of cash equal to the daily fluctuation in market value of the contract (“variation margin”). Variation margin is recorded as unrealized appreciation (depreciation) and, if any, shown as variation margin receivable (or payable) on futures contracts in the Statement of Assets and Liabilities. When the contract is closed, a realized gain or loss is recorded in the Statement of Operations equal to the difference between the notional amount of the contract at the time it was opened and the notional amount at the time it was closed. The use of futures contracts involves the risk of an imperfect correlation in the movements in the price of futures contracts and interest, foreign currency exchange rates or underlying assets.
| 6. | INVESTMENT ADVISORY AGREEMENT AND OTHER TRANSACTIONS WITH AFFILIATES |
Investment Advisory:MIP, on behalf of the Master Portfolio, entered into an Investment Advisory Agreement with the Manager, the Master Portfolio’s investment adviser and an indirect, wholly-owned subsidiary of BlackRock, to provide investment advisory services. The Manager is responsible for the management of the Master Portfolio and provides the personnel, facilities, equipment and certain other services necessary to the operations of the Master Portfolio.
For such services, the Master Portfolio pays the Manager a monthly fee at an annual rate equal to 0.03% of the average daily value of the Master Portfolio’s net assets.
BlackRock Advisors, LLC (“BAL”) is not entitled to compensation for providing administrative services to the Master Portfolio, for so long as BAL (or an affiliate) is entitled to compensation for providing administrative services to corresponding feeder funds that invest substantially all of their assets in the Master Portfolio, or BAL (or an affiliate) receives investment advisory fees from the Master Portfolio.
Expense Limitations, Waivers, Reimbursements and Recoupments: With respect to the Master Portfolio, the Manager voluntarily agreed to waive its investment advisory fees by the amount of investment advisory fees the Master Portfolio pays to the Manager indirectly through its investment in affiliated money market funds (the “affiliated money market fund waiver”). The amount of waivers and/or reimbursements of fees and expenses made pursuant to the expense limitation described below will be reduced by the amount of the affiliated money market fund waiver. This amount is included in fees waived and/or reimbursed by the Manager in the Statement of Operations. For the year ended December 31, 2019, the amount waived was $91,431.
| | |
| 36 | | 2019 BLACKROCK ANNUAL REPORTTO SHAREHOLDERS |
Notes to Financial Statements (continued)
The Manager has contractually agreed to waive its investment advisory fee with respect to any portion of the Master Portfolio’s assets invested in affiliated equity and fixed-income mutual funds and affiliated exchange-traded funds that have a contractual management fee through April 30, 2020. The contractual agreement may be terminated upon 90 days’ notice by a majority of the Independent Trustees or by a vote of a majority of the outstanding voting securities of the Master Portfolio. This amount is included in fees waived and/or reimbursed by the Manager. For the year ended December 31, 2019, the Manager waived $23,261 in investment advisory fees pursuant to this arrangement.
Securities Lending:The SEC has issued an exemptive order which permits BTC, an affiliate of the Manager, to serve as securities lending agent for the Master Portfolio, subject to applicable conditions. As securities lending agent, BTC bears all operational costs directly related to securities lending. The Master Portfolio is responsible for fees in connection with the investment of cash collateral received for securities on loan (the “collateral investment fees”). The cash collateral is invested in a money market fund managed by the Manager or its affiliates. However, BTC has agreed to reduce the amount of securities lending income it receives in order to effectively limit the collateral investment fees the Master Portfolio bears to an annual rate of 0.04%. The shares of such money market fund will not be subject to a sales load, distribution fee or service fee. The money market fund in which the cash collateral has been invested may, under certain circumstances, impose a liquidity fee of up to 2% of the value redeemed or temporarily restrict redemptions for up to 10 business days during a 90 day period, in the event that the money market fund’s weekly liquid assets fall below certain thresholds.
Securities lending income is equal to the total of income earned from the reinvestment of cash collateral, net of fees and other payments to and from borrowers of securities, and less the collateral investment fees. The Master Portfolio retains a portion of securities lending income and remits a remaining portion to BTC as compensation for its services as securities lending agent.
Pursuant to the current securities lending agreement, the Master Portfolio retains 73.5% of securities lending income (which excludes collateral investment fees), and this amount retained can never be less than 70% of the total of securities lending income plus the collateral investment fees.
In addition, commencing the business day following the date that the aggregate securities lending income earned across the BlackRock Multi-Asset Complex in a calendar year exceeds a specified threshold, the Master Portfolio, pursuant to the securities lending agreement, will retain for the remainder of that calendar year securities lending income in an amount equal to 80% of securities lending income (which excludes collateral investment fees), and this amount retained can never be less than 70% of the total of securities lending income plus the collateral investment fees.
The share of securities lending income earned by the Master Portfolio is shown as securities lending income — affiliated — net in the Statement of Operations. For the year ended December 31, 2019, the Master Portfolio paid BTC $1,219,910 for securities lending agent services.
Interfund Lending:In accordance with an exemptive order (the “Order”) from the SEC, the Master Portfolio may participate in a joint lending and borrowing facility for temporary purposes (the “Interfund Lending Program”), subject to compliance with the terms and conditions of the Order, and to the extent permitted by the Master Portfolio’s investment policies and restrictions. The Master Portfolio is currently permitted to borrow and lend under the Interfund Lending Program.
A lending BlackRock fund may lend in aggregate up to 15% of its net assets, but may not lend more than 5% of its net assets to any one borrowing fund through the Interfund Lending Program. A borrowing BlackRock fund may not borrow through the Interfund Lending Program or from any other source more than 33 1/3% of its total assets (or any lower threshold provided for by the fund’s investment restrictions). If a borrowing BlackRock fund’s total outstanding borrowings exceed 10% of its total assets, each of its outstanding interfund loans will be subject to collateralization of at least 102% of the outstanding principal value of the loan. All interfund loans are for temporary or emergency purposes and the interest rate to be charged will be the average of the highest current overnight repurchase agreement rate available to a lending fund and the bank loan rate, as calculated according to a formula established by the Board.
During the year ended December 31, 2019, the Master Portfolio did not participate in the Interfund Lending Program.
Trustees and Officers:Certain trustees and/or officers of the Master Portfolio are trustees and/or officers of BlackRock or its affiliates.
Other Transactions:The Master Portfolio may purchase securities from, or sell securities to, an affiliated fund provided the affiliation is due solely to having a common investment adviser, common officers, or common trustees. For the year ended December 31, 2019, the purchase and sale transactions and any net realized gains (losses) with affiliated funds in compliance with Rule17a-7 under the 1940 Act were as follows:
| | | | | | | | | | | | | | |
| Purchases | | | | | Sales | | | | | Net Realized Gain (Loss) | |
| $ | 371,150,750 | | | | | $ | 95,952,350 | | | | | $ | (13,842,660 | ) |
For the year ended December 31, 2019, purchases and sales of investments, excluding short-term securities were $2,716,548,589 and $1,219,977,654, respectively.
The Master Portfolio is classified as a partnership for U.S. federal income tax purposes. As such, each investor in the Master Portfolio is treated as the owner of its proportionate share of net assets, income, expenses and realized and unrealized gains and losses of the Master Portfolio. Therefore, no U.S. federal income tax provision is required. It is intended that the Master Portfolio’s assets will be managed so an investor in the Master Portfolio can satisfy the requirements of Subchapter M of the Internal Revenue Code of 1986, as amended.
The Master Portfolio files U.S. federal and various state and local tax returns. No income tax returns are currently under examination. The statute of limitations on the Master Portfolio’s U.S. federal tax returns generally remains open for each of the four years ended December 31, 2019. The statutes of limitations on the Master Portfolio’s state and local tax returns may remain open for an additional year depending upon the jurisdiction.
| | | | |
| NOTESTO FINANCIAL STATEMENTS | | | 37 | |
Notes to Financial Statements (continued)
Management has analyzed tax laws and regulations and their application to the Master Portfolio as of December 31, 2019, inclusive of the open tax return years, and does not believe that there are any uncertain tax positions that require recognition of a tax liability in the Master Portfolio’s financial statements.
As of December 31, 2019, gross unrealized appreciation and depreciation for investments and derivatives based on cost for U.S. federal income tax purposes were as follows:
| | | | |
Tax cost | | $ | 12,782,785,918 | |
| | | | |
Gross unrealized appreciation | | $ | 4,065,966,013 | |
Gross unrealized depreciation | | | (363,208,257 | ) |
| | | | |
Net unrealized appreciation | | $ | 3,702,757,756 | |
| | | | |
MIP, on behalf of the Master Portfolio along with certain other funds managed by the Manager and its affiliates (“Participating Funds”), is a party to a364-day, $2.25 billion credit agreement with a group of lenders. Under this agreement, the Master Portfolio may borrow to fund shareholder redemptions. Excluding commitments designated for certain individual funds, the Participating Funds, including the Master Portfolio, can borrow up to an aggregate commitment amount of $1.75 billion at any time outstanding, subject to asset coverage and other limitations as specified in the agreement. The credit agreement has the following terms: a fee of 0.10% per annum on unused commitment amounts and interest at a rate equal to the higher of(a) one-month LIBOR (but, in any event, not less than 0.00%) on the date the loan is made plus 0.80% per annum or (b) the Fed Funds rate (but, in any event, not less than 0.00%) in effect from time to time plus 0.80% per annum on amounts borrowed. The agreement expires in April 2020 unless extended or renewed. Prior to April 18, 2019, Participating Funds paid an upfront commitment fee of 0.02% on the total commitment amounts, in addition to administration, legal and arrangement fees, which are included in miscellaneous expenses in the Statement of Operations. These fees were allocated among such funds based upon portions of the aggregate commitment available to them and relative net assets of Participating Funds. During the year ended December 31, 2019, the Master Portfolio did not borrow under the credit agreement.
In the normal course of business, the Master Portfolio invests in securities or other instruments and may enter into certain transactions, and such activities subject the Master Portfolio to various risks, including among others, fluctuations in the market (market risk) or failure of an issuer to meet all of its obligations. The value of securities or other instruments may also be affected by various factors, including, without limitation: (i) the general economy; (ii) the overall market as well as local, regional or global political and/or social instability; (iii) regulation, taxation or international tax treaties between various countries; or (iv) currency, interest rate and price fluctuations. The Master Portfolio’s prospectus provides details of the risks to which the Master Portfolio is subject.
The Master Portfolio may be exposed to additional risks when reinvesting cash collateral in money market funds that do not seek to maintain a stable NAV per share of $1.00, which may be subject to redemption gates or liquidity fees under certain circumstances.
Valuation Risk:The market values of equities, such as common stocks and preferred securities or equity related investments, such as futures and options, may decline due to general market conditions which are not specifically related to a particular company. They may also decline due to factors which affect a particular industry or industries. The Master Portfolio may invest in illiquid investments. An illiquid investment is any investment that the Master Portfolio reasonably expects cannot be sold or disposed of in current market conditions in seven calendar days or less without the sale or disposition significantly changing the market value of the investment. The Master Portfolio may experience difficulty in selling illiquid investments in a timely manner at the price that it believes the investments are worth. Prices may fluctuate widely over short or extended periods in response to company, market or economic news. Markets also tend to move in cycles, with periods of rising and falling prices. This volatility may cause the Master Portfolio’s NAV to experience significant increases or decreases over short periods of time. If there is a general decline in the securities and other markets, the NAV of the Master Portfolio may lose value, regardless of the individual results of the securities and other instruments in which the Master Portfolio invests.
Counterparty Credit Risk:The Master Portfolio may be exposed to counterparty credit risk, or the risk that an entity may fail to or be unable to perform on its commitments related to unsettled or open transactions. The Master Portfolio manages counterparty credit risk by entering into transactions only with counterparties that the Manager believes have the financial resources to honor their obligations and by monitoring the financial stability of those counterparties. Financial assets, which potentially expose the Master Portfolio to market, issuer and counterparty credit risks, consist principally of financial instruments and receivables due from counterparties. The extent of the Master Portfolio’s exposure to market, issuer and counterparty credit risks with respect to these financial assets is approximately their value recorded in the Statement of Assets and Liabilities, less any collateral held by the Master Portfolio.
A derivative contract may suffer amark-to-market loss if the value of the contract decreases due to an unfavorable change in the market rates or values of the underlying instrument. Losses can also occur if the counterparty does not perform under the contract.
With exchange-traded futures, there is less counterparty credit risk to the Master Portfolio since the exchange or clearinghouse, as counterparty to such instruments, guarantees against a possible default. The clearinghouse stands between the buyer and the seller of the contract; therefore, credit risk is limited to failure of the clearinghouse. While offset rights may exist under applicable law, the Master Portfolio does not have a contractual right of offset against a clearing broker or clearinghouse in the event of a default (including the bankruptcy or insolvency). Additionally, credit risk exists in exchange-traded futures with respect to initial and variation margin that is held in a clearing broker’s customer accounts. While clearing brokers are required to segregate customer margin from their own assets, in the event that a clearing broker becomes insolvent or goes into bankruptcy and at that time there is a shortfall in the aggregate amount of margin held by the clearing broker for all its clients, typically the shortfall would be allocated on a pro rata basis across all the clearing broker’s customers, potentially resulting in losses to the Master Portfolio.
Management has evaluated the impact of all subsequent events on the Master Portfolio through the date the financial statements were issued and has determined that there were no subsequent events requiring adjustment or additional disclosure in the financial statements.
| | |
| 38 | | 2019 BLACKROCK ANNUAL REPORTTO SHAREHOLDERS |
| | |
| Report of Independent Registered Public Accounting Firm | | Large Cap Index Master Portfolio |
To the Board of Trustees of
Master Investment Portfolio and Investors of Large Cap Index Master Portfolio
Opinion on the Financial Statements
We have audited the accompanying statement of assets and liabilities, including the schedule of investments, of Large Cap Index Master Portfolio (one of the series constituting Master Investment Portfolio, referred to hereafter as the “Master Portfolio”) as of December 31, 2019, the related statement of operations for the year ended December 31, 2019, the statements of changes in net assets for each of the two years in the period ended December 31, 2019, including the related notes, and the financial highlights for each of the five years in the period ended December 31, 2019 (collectively referred to as the “financial statements”). In our opinion, the financial statements present fairly, in all material respects, the financial position of the Master Portfolio as of December 31, 2019, the results of its operations for the year then ended, the changes in its net assets for each of the two years in the period ended December 31, 2019 and the financial highlights for each of the five years in the period ended December 31, 2019 in conformity with accounting principles generally accepted in the United States of America.
Basis for Opinion
These financial statements are the responsibility of the Master Portfolio’s management. Our responsibility is to express an opinion on the Master Portfolio’s financial statements based on our audits. We are a public accounting firm registered with the Public Company Accounting Oversight Board (United States) (“PCAOB”) and are required to be independent with respect to the Master Portfolio in accordance with the U.S. federal securities laws and the applicable rules and regulations of the Securities and Exchange Commission and the PCAOB.
We conducted our audits of these financial statements in accordance with the standards of the PCAOB. Those standards require that we plan and perform the audit to obtain reasonable assurance about whether the financial statements are free of material misstatement, whether due to error or fraud.
Our audits included performing procedures to assess the risks of material misstatement of the financial statements, whether due to error or fraud, and performing procedures that respond to those risks. Such procedures included examining, on a test basis, evidence regarding the amounts and disclosures in the financial statements. Our audits also included evaluating the accounting principles used and significant estimates made by management, as well as evaluating the overall presentation of the financial statements. Our procedures included confirmation of securities owned as of December 31, 2019 by correspondence with the custodian, transfer agent and brokers; when replies were not received from brokers, we performed other auditing procedures. We believe that our audits provide a reasonable basis for our opinion.
/s/PricewaterhouseCoopers LLP
Philadelphia, Pennsylvania
February 27, 2020
We have served as the auditor of one or more BlackRock investment companies since 2000.
| | | | |
| REPORT OF INDEPENDENT REGISTERED PUBLIC ACCOUNTING FIRM | | | 39 | |
Statement Regarding Liquidity Risk Management Program
The Securities and Exchange Commission adopted Rule 22e-4 under the Investment Company Act of 1940, as amended (the “Liquidity Rule”) to promote effective liquidity risk management throughout the open-end investment company industry, thereby reducing the risk that funds will be unable to meet their redemption obligations and mitigating dilution of the interests of fund shareholders.
The Board of Trustees (the “Board”) of BlackRock Funds III and MIP, on behalf of iShares Russell 1000 Large-Cap Index Fund and Large Cap Index Master Portfolio, respectively, met on November 12-13, 2019 (the “Meeting”) to review the liquidity risk management program (the “Program”) applicable to the BlackRock open-end funds, excluding money market funds (each, a “Fund”), pursuant to the Liquidity Rule. The Board has appointed BlackRock Advisors, LLC or BlackRock Fund Advisors (“BlackRock”), each an investment adviser to certain Funds, as the program administrator for each Fund’s Program, as applicable. BlackRock has delegated oversight of the Program to the 40 Act Liquidity Risk Management Committee (the “Committee”). At the Meeting, the Committee, on behalf of BlackRock, provided the Board with a report that addressed the operation of the Program and assessed its adequacy and effectiveness of implementation, including the operation of each Fund’s Highly Liquid Investment Minimum (“HLIM”) where applicable, and any material changes to the Program (the “Report”). The Report covered the period from December 1, 2018 through September 30, 2019 (the “Program Reporting Period”).
The Report described the Program’s liquidity classification methodology for categorizing a Fund’s investments (including derivative transactions) into one of four liquidity buckets. It also described BlackRock’s methodology in establishing a Fund’s HLIM and noted that the Committee reviews and ratifies the HLIM assigned to each Fund no less frequently than annually.
The Report noted that the Program complied with the key factors for consideration under the Liquidity Rule for assessing, managing and periodically reviewing a Fund’s liquidity risk, as follows:
A. The Fund’s investment strategy and liquidity of portfolio investments during both normal and reasonably foreseeable stressed conditions:During the Program Reporting Period, the Committee reviewed whether each Fund’s strategy is appropriate for an open-end fund structure with a focus on Funds with more significant and consistent holdings of less liquid and illiquid assets. The Committee also factored a Fund’s concentration in an issuer into the liquidity classification methodology by taking issuer position sizes into account. Where a Fund participated in borrowings for investment purposes (such as tender option bonds and reverse repurchase agreements), such borrowings were factored into the Program’s calculation of a Fund’s liquidity bucketing. Derivative exposure was also considered in such calculation.
B. Short-term and long-term cash flow projections during both normal and reasonably foreseeable stressed conditions:During the Program Reporting Period, the Committee reviewed historical net redemption activity and used this information as a component to establish each Fund’s reasonably anticipated trading size (“RATS”). Each Fund has adopted an in-kind redemption policy which may be utilized to meet larger redemption requests. The Committee may also take into consideration a Fund’s shareholder ownership concentration (which, depending on product type and distribution channel, may or may not be available), a Fund’s distribution channels, and the degree of certainty associated with a Fund’s short-term and long-term cash flow projections.
C. Holdings of cash and cash equivalents, as well as borrowing arrangements:The Committee considered the terms of the credit facility applicable to the Funds, the financial health of the institution providing the facility and the fact that the credit facility is shared among multiple Funds (including that a portion of the aggregate commitment amount is specifically designated for BlackRock Floating Rate Income Portfolio and BlackRock Credit Strategies Income Fund, each a series of BlackRock Funds V). The Committee also considered other types of borrowing available to the Funds, such as the ability to use reverse repurchase agreements and interfund lending, as applicable.
There were no material changes to the Program during the Program Reporting Period. The Report provided to the Board stated that the Committee concluded that based on the operation of the functions, as described in the Report, the Program is operating as intended and is effective in implementing the requirements of the Liquidity Rule.
| | |
| 40 | | 2019 BLACKROCK ANNUAL REPORTTO SHAREHOLDERS |
Trustee and Officer Information
| | | | | | | | |
| Independent Trustees (a) |
| | | | | |
Name
Year of Birth (b) | | Position(s) Held
(Length of Service) (c) | | Principal Occupation(s) During Past Five Years | | Number ofBlackRock-Advised
Registered Investment Companies
(“RICs”) Consisting of
Investment Portfolios
(“Portfolios”) Overseen | | Public Company and
Other Investment Company
Directorships Held During
Past Five Years |
Mark Stalnecker 1951 | | Chair of the Board
(Since 2019) and Trustee
(Since 2015) | | Chief Investment Officer, University of Delaware from 1999 to 2013; Trustee and Chair of the Finance and Investment Committees, Winterthur Museum and Country Estate from 2005 to 2016; Member of the Investment Committee, Delaware Public Employees’ Retirement System since 2002; Member of the Investment Committee, Christiana Care Health System from 2009 to 2017; Member of the Investment Committee, Delaware Community Foundation from 2013 to 2014; Director and Chair of the Audit Committee, SEI Private Trust Co. from 2001 to 2014. | | 37 RICs consisting of 177 Portfolios | | None |
Bruce R. Bond 1946 | | Trustee
(Since 2019) | | Board Member, Amsphere Limited (software) since 2018; Trustee and Member of the Governance Committee, State Street Research Mutual Funds from 1997 to 2005; Board Member of Governance, Audit and Finance Committee, Avaya Inc. (computer equipment) from 2003 to 2007. | | 37 RICs consisting of 177 Portfolios | | None |
Susan J. Carter 1956 | | Trustee
(Since 2016) | | Director, Pacific Pension Institute from 2014 to 2018; Advisory Board Member, Center for Private Equity and Entrepreneurship at Tuck School of Business since 1997; Senior Advisor, Commonfund Capital, Inc. (“CCI”) (investment adviser) in 2015; Chief Executive Officer, CCI from 2013 to 2014; President & Chief Executive Officer, CCI from 1997 to 2013; Advisory Board Member, Girls Who Invest from 2015 to 2018 and Board Member thereof since 2018; Advisory Board Member, Bridges Fund Management since 2016; Trustee, Financial Accounting Foundation since 2017; Practitioner Advisory Board Member, Private Capital Research Institute (“PCRI”) since 2017. | | 37 RICs consisting of 177 Portfolios | | None |
Collette Chilton 1958 | | Trustee
(Since 2015) | | Chief Investment Officer, Williams College since 2006; Chief Investment Officer, Lucent Asset Management Corporation from 1998 to 2006. | | 37 RICs consisting of 177 Portfolios | | None |
Neil A. Cotty 1954 | | Trustee
(Since 2016) | | Bank of America Corporation from 1996 to 2015, serving in various senior finance leadership roles, including Chief Accounting Officer from 2009 to 2015, Chief Financial Officer of Global Banking, Markets and Wealth Management from 2008 to 2009, Chief Accounting Officer from 2004 to 2008, Chief Financial Officer of Consumer Bank from 2003 to 2004, Chief Financial Officer of Global Corporate Investment Bank from 1999 to 2002. | | 37 RICs consisting of 177 Portfolios | | None |
Lena G. Goldberg 1949 | | Trustee
(Since 2019) | | Senior Lecturer, Harvard Business School, since 2008; Director, Charles Stark Draper Laboratory, Inc. since 2013; FMR LLC/Fidelity Investments (financial services) from 1996 to 2008, serving in various senior roles including Executive Vice President — Strategic Corporate Initiatives and Executive Vice President and General Counsel; Partner, Sullivan & Worcester LLP from 1985 to 1996 and Associate thereof from 1979 to 1985. | | 37 RICs consisting of 177 Portfolios | | None |
Robert M. Hernandez 1944 | | Trustee
(Since 2019) | | Director, Vice Chairman and Chief Financial Officer of USX Corporation (energy and steel business) from 1991 to 2001; Director andnon-executive Chairman, RTI International Metals, Inc. from 1990 to 2015; Director, TE Connectivity (electronics) from 2006 to 2012. | | 37 RICs consisting of 177 Portfolios | | Chubb Limited (insurance company); Eastman Chemical Company |
| | | | |
| TRUSTEEAND OFFICER INFORMATION | | | 41 | |
Trustee and Officer Information (continued)
| | | | | | | | |
| Independent Trustees (a)(continued) |
| | | | | |
Name
Year of Birth (b) | | Position(s) Held
(Length of Service) (c) | | Principal Occupation(s) During Past Five Years | | Number ofBlackRock-Advised
Registered Investment Companies
(“RICs”) Consisting of
Investment Portfolios
(“Portfolios”) Overseen | | Public Company and
Other Investment Company
Directorships Held During
Past Five Years |
Henry R. Keizer 1956 | | Trustee
(Since 2019) | | Director, Park Indemnity Ltd. (captive insurer) since 2010; Director, MUFG Americas Holdings Corporation and MUFG Union Bank, N.A. (financial and bank holding company) from 2014 to 2016; Director, American Institute of Certified Public Accountants from 2009 to 2011; Director, KPMG LLP (audit, tax and advisory services) from 2004 to 2005 and 2010 to 2012; Director, KPMG International in 2012, Deputy Chairman and Chief Operating Officer thereof from 2010 to 2012 and U.S. Vice Chairman of Audit thereof from 2005 to 2010; Global Head of Audit, KPMGI (consortium of KPMG firms) from 2006 to 2010; Director, YMCA of Greater New York from 2006 to 2010. | | 37 RICs consisting of 177 Portfolios | | Hertz Global Holdings (car rental); Montpelier Re Holdings, Ltd. (publicly held property and casualty reinsurance) from 2013 until 2015; Sealed Air Corp. (packaging); WABCO (commercial vehicle safety systems) |
Cynthia A. Montgomery 1952 | | Trustee
(Since 2009) | | Professor, Harvard Business School since 1989. | | 37 RICs consisting of 177 Portfolios | | Newell Rubbermaid, Inc. (manufacturing) |
Donald C. Opatrny 1952 | | Trustee
(Since 2019) | | Trustee, Vice Chair, Member of the Executive Committee and Chair of the Investment Committee, Cornell University since 2004; President, Trustee and Member of the Investment Committee, The Aldrich Contemporary Art Museum from 2007 to 2014; Member of the Board and Investment Committee, University School from 2007 to 2018; Member of the Investment Committee, Mellon Foundation from 2009 to 2015; Trustee, Artstor (a Mellon Foundation affiliate) from 2010 to 2015; President and Trustee, the Center for the Arts, Jackson Hole from 2011 to 2018; Director, Athena Capital Advisors LLC (investment management firm) since 2013; Trustee and Chair of the Investment Committee, Community Foundation of Jackson Hole since 2014; Member of Affordable Housing Supply Board of Jackson, Wyoming since 2018; Member, Investment Funds Committee, State of Wyoming since 2017; Trustee, Phoenix Art Museum since 2018. | | 37 RICs consisting of 177 Portfolios | | None |
Joseph P. Platt 1947 | | Trustee
(Since 2009) | | General Partner, Thorn Partners, LP (private investments) since 1998; Director, WQED Multi-Media (public broadcastingnot-for-profit) since 2001; Chair, Basic Health International(non-profit) since 2015. | | 37 RICs consisting of 177 Portfolios | | Greenlight Capital Re, Ltd. (reinsurance company); Consol Energy Inc. |
Kenneth L. Urish 1951 | | Trustee
(Since 2009) | | Managing Partner, Urish Popeck & Co., LLC (certified public accountants and consultants) since 1976; Past-Chairman of the Professional Ethics Committee of the Pennsylvania Institute of Certified Public Accountants and Committee Member thereof since 2007; Member of External Advisory Board, The Pennsylvania State University Accounting Department since founding in 2001; Principal, UP Strategic Wealth Investment Advisors, LLC since 2013; Trustee, The Holy Family Institute from 2001 to 2010; President and Trustee, Pittsburgh Catholic Publishing Associates from 2003 to 2008; Director,Inter-Tel from 2006 to 2007. | | 37 RICs consisting of 177 Portfolios | | None |
Claire A. Walton 1957 | | Trustee
(Since 2016) | | Chief Operating Officer and Chief Financial Officer of Liberty Square Asset Management, LP from 1998 to 2015; General Partner of Neon Liberty Capital Management, LLC since 2003; Director, Boston Hedge Fund Group from 2009 to 2018; Director, Woodstock Ski Runners since 2013; Director, Massachusetts Council on Economic Education from 2013 to 2015. | | 37 RICs consisting of 177 Portfolios | | None |
| | |
| 42 | | 2019 BLACKROCK ANNUAL REPORTTO SHAREHOLDERS |
Trustee and Officer Information (continued)
| | | | | | | | |
| Interested Trustees (a)(d) |
| | | | | |
Name
Year of Birth (b) | | Position(s) Held
(Length of Service) (c) | | Principal Occupation(s) During Past Five Years | | Number of BlackRock-Advised
Registered Investment Companies
(“RICs”) Consisting of
Investment Portfolios
(“Portfolios”) Overseen | | Public Company and
Other Investment Company
Directorships Held During
Past Five Years |
Robert Fairbairn 1965 | | Trustee
(Since 2018) | | Vice Chairman of BlackRock, Inc. since 2019; Member of BlackRock’s Global Executive and Global Operating Committees;Co-Chair of BlackRock’s Human Capital Committee; Senior Managing Director of BlackRock, Inc. from 2010 to 2019; oversaw BlackRock’s Strategic Partner Program and Strategic Product Management Group from 2012 to 2019; Member of the Board of Managers of BlackRock Investments, LLC from 2011 to 2018; Global Head of BlackRock’s Retail and iShares® businesses from 2012 to 2016. | | 123 RICs consisting of 287 Portfolios | | None |
John M. Perlowski (e) 1964 | | Trustee
(Since 2015); President and Chief Executive Officer
(Since 2010) | | Managing Director of BlackRock, Inc. since 2009; Head of BlackRock Global Accounting and Product Services since 2009; Advisory Director of Family Resource Network (charitable foundation) since 2009. | | 124 RICs consisting of 288 Portfolios | | None |
(a) The address of each Trustee is c/o BlackRock, Inc.,55 East 52nd Street, New York, New York 10055. (b) Independent Trustees serve until their resignation, retirement, removal or death, or until December 31 of the year in which they turn 75. The Board may determine to extend the terms of Independent Trustees on acase-by-case basis, as appropriate. (c) In connection with the acquisition of Barclays Global Investors by BlackRock, Inc. in December 2009, certain Independent Trustees were elected to the Board. Furthermore, effective January 1, 2019, three BlackRock Fund Complexes were realigned and consolidated into two BlackRock Fund Complexes. As a result, although the chart shows the year that each Independent Trustee joined the Board, certain Independent Trustees first became members of the boards of other BlackRock-advised Funds or legacy BlackRock funds as follows: Bruce R. Bond, 2005; Robert M. Hernandez, 1996; Cynthia A. Montgomery, 1994; Joseph P. Platt, 1999; Kenneth L. Urish, 1999; Lena G. Goldberg, 2016; Henry R. Keizer, 2016; Donald C. Opatrny, 2015. (d) Mr. Fairbairn and Mr. Perlowski are both “interested persons,” as defined in the 1940 Act, of the Trust/MIP based on their positions with BlackRock, Inc. and its affiliates. Mr. Fairbairn and Mr. Perlowski are also board members of the BlackRock Fixed-Income Complex. (e) Mr. Perlowski is also a trustee of the BlackRock Credit Strategies Fund. |
| | | | |
| TRUSTEEAND OFFICER INFORMATION | | | 43 | |
Trustee and Officer Information (continued)
| | | | |
| Officers Who Are Not Trustees (a) |
| | | |
Name
Year of Birth (b) | | Position(s) Held
(Length of Service) | | Principal Occupation(s) During Past Five Years |
Thomas Callahan 1968 | | Vice President
(Since 2016) | | Managing Director of BlackRock, Inc. since 2013; Member of the Board of Managers of BlackRock Investments, LLC (principal underwriter) since 2019 and Managing Director thereof since 2017; Head of BlackRock’s Global Cash Management Business since 2016;Co-Head of the Global Cash Management Business from 2014 to 2016; Deputy Head of the Global Cash Management Business from 2013 to 2014; Member of the Cash Management Group Executive Committee since 2013; Chief Executive Officer of NYSE Liffe U.S. from 2008 to 2013. |
Jennifer McGovern 1977 | | Vice President
(Since 2014) | | Managing Director of BlackRock, Inc. since 2016; Director of BlackRock, Inc. from 2011 to 2015; Head of Product Development and Oversight for BlackRock’s Strategic Product Management Group since 2019; Head of Product Structure and Oversight for BlackRock’s U.S. Wealth Advisory Group from 2013 to 2019. |
Neal J. Andrews 1966 | | Chief Financial Officer
(Since 2009) | | Chief Financial Officer of the iShares® exchange traded funds since 2019; Managing Director of BlackRock, Inc. since 2006. |
Jay M. Fife 1970 | | Treasurer
(Since 2009) | | Managing Director of BlackRock, Inc. since 2007. |
Charles Park 1967 | | Chief Compliance Officer
(Since 2014) | | Anti-Money Laundering Compliance Officer for certain BlackRock-advised Funds from 2014 to 2015; Chief Compliance Officer of BlackRock Advisors, LLC and the BlackRock-advised Funds in the BlackRock Multi-Asset Complex and the BlackRock Fixed-Income Complex since 2014; Principal of and Chief Compliance Officer for iShares® Delaware Trust Sponsor LLC since 2012 and BlackRock Fund Advisors (“BFA”) since 2006; Chief Compliance Officer for theBFA-advised iShares® exchange traded funds since 2006; Chief Compliance Officer for BlackRock Asset Management International Inc. since 2012. |
Lisa Belle 1968 | | Anti-Money Laundering Compliance Officer
(Since 2019) | | Managing Director of BlackRock, Inc. since 2019; Global Financial Crime Head for Asset and Wealth Management of JP Morgan from 2013 to 2019; Managing Director of RBS Securities from 2012 to 2013; Head of Financial Crimes for Barclays Wealth Americas from 2010 to 2012. |
Janey Ahn 1975 | | Secretary
(Since 2019) | | Managing Director of BlackRock, Inc. since 2018; Director of BlackRock, Inc. from 2009 to 2017. |
(a) The address of each Officer is c/o BlackRock, Inc., 55 East 52nd Street, New York, New York 10055. (b) Officers of the Trust/MIP serve at the pleasure of the Board. |
Further information about the Trust’s/MIP’s Trustees and Officers is available in the Trust’s/MIP’s Statement of Additional Information, which can be obtained without charge by calling(800) 441-7762.
Effective September 19, 2019, Lisa Belle replaced John MacKessy as the Anti-Money Laundering Compliance Officer of the Trust/MIP.
Effective September 19, 2019, Janey Ahn replaced Benjamin Archibald as the Secretary of the Trust/MIP.
Effective December 31, 2019, Robert M. Hernandez retired as Trustee of the Trust/MIP.
Investment Adviser
BlackRock Fund Advisors
San Francisco, CA 94105
Administrator
BlackRock Advisors, LLC
Wilmington, DE 19809
Accounting Agent and Custodian
State Street Bank and Trust Company
Boston, MA 02111
Transfer Agent
BNY Mellon Investment Servicing (US) Inc.
Wilmington, DE 19809
Distributor
BlackRock Investments, LLC
New York, NY 10022
Independent Registered Public Accounting Firm
PricewaterhouseCoopers LLP
Philadelphia, PA 19103
Legal Counsel
Sidley Austin LLP
New York, NY 10019
Address of the Trust/MIP
400 Howard Street
San Francisco, CA 94105
| | |
| 44 | | 2019 BLACKROCK ANNUAL REPORTTO SHAREHOLDERS |
Additional Information
General Information
Householding
The Fund will mail only one copy of shareholder documents, including prospectuses, annual and semi-annual reports and proxy statements, to shareholders with multiple accounts at the same address. This practice is commonly called “householding” and is intended to reduce expenses and eliminate duplicate mailings of shareholder documents. Mailings of your shareholder documents may be householded indefinitely unless you instruct us otherwise. If you do not want the mailing of these documents to be combined with those for other members of your household, please call the Fund at(800) 441-7762.
Availability of Quarterly Schedule of Investments
The Fund/Master Portfolio file their complete schedule of portfolio holdings with the SEC for the first and third quarters of each fiscal year as an exhibit to its reports on Form N-PORT, and for reporting periods ended prior to March 31, 2019, filed such information onForm N-Q. The Fund’s/Master Portfolio’s Forms N-PORT and N-Q are available on the SEC’s website at sec.gov. The Fund’s/Master Portfolio’s Forms N-Q may also be obtained upon request and without charge by calling(800) 441-7762.
Availability of Proxy Voting Policies and Procedures
A description of the policies and procedures that the Fund/Master Portfolio use to determine how to vote proxies relating to portfolio securities is available upon request and without charge (1) by calling (800) 441-7762; (2) atblackrock.com; and (3) on the SEC’s website at sec.gov.
Availability of Proxy Voting Record
Information about how the Fund/Master Portfolio voted proxies relating to securities held in the Fund’s/Master Portfolio’s portfolio during the most recent12-month period ended June 30 is available upon request and without charge (1) atblackrock.com; or by calling(800) 441-7762; and (2) on the SEC’s website at sec.gov.
BlackRock’s Mutual Fund Family
BlackRock offers a diverse lineup of open-end mutual funds crossing all investment styles and managed by experts in equity, fixed-income and tax-exempt investing. Visitblackrock.com for more information.
Shareholder Privileges
Account Information
Call us at (800) 441-7762 from 8:00 AM to 6:00 PM ET on any business day to get information about your account balances, recent transactions and share prices. You can also visitblackrock.com for more information.
Automatic Investment Plans
Investor class shareholders who want to invest regularly can arrange to have $50 or more automatically deducted from their checking or savings account and invested in any of the BlackRock funds.
Systematic Withdrawal Plans
Investor class shareholders can establish a systematic withdrawal plan and receive periodic payments of $50 or more from their BlackRock funds, as long as their account balance is at least $10,000.
Retirement Plans
Shareholders may make investments in conjunction with Traditional, Rollover, Roth, Coverdell, Simple IRAs, SEP IRAs and 403(b) Plans.
| | | | |
| ADDITIONAL INFORMATION | | | 45 | |
Additional Information (continued)
BlackRock Privacy Principles
BlackRock is committed to maintaining the privacy of its current and former fund investors and individual clients (collectively, “Clients”) and to safeguarding their non-public personal information. The following information is provided to help you understand what personal information BlackRock collects, how we protect that information and why in certain cases we share such information with select parties.
If you are located in a jurisdiction where specific laws, rules or regulations require BlackRock to provide you with additional or different privacy-related rights beyond what is set forth below, then BlackRock will comply with those specific laws, rules or regulations.
BlackRock obtains or verifies personal non-public information from and about you from different sources, including the following: (i) information we receive from you or, if applicable, your financial intermediary, on applications, forms or other documents; (ii) information about your transactions with us, our affiliates, or others; (iii) information we receive from a consumer reporting agency; and (iv) from visits to our websites.
BlackRock does not sell or disclose to non-affiliated third parties anynon-public personal information about its Clients, except as permitted by law or as is necessary to respond to regulatory requests or to service Client accounts. These non-affiliated third parties are required to protect the confidentiality and security of this information and to use it only for its intended purpose.
We may share information with our affiliates to service your account or to provide you with information about other BlackRock products or services that may be of interest to you. In addition, BlackRock restricts access to non-public personal information about its Clients to those BlackRock employees with a legitimate business need for the information. BlackRock maintains physical, electronic and procedural safeguards that are designed to protect the non-public personal information of its Clients, including procedures relating to the proper storage and disposal of such information.
Glossary of Terms Used in this Report
| | |
| Portfolio Abbreviations |
| |
| ETF | | Exchange-Traded Fund |
| |
| REIT | | Real Estate Investment Trust |
| | |
| 46 | | 2019 BLACKROCK ANNUAL REPORTTO SHAREHOLDERS |
Want to know more?
blackrock.com | 877-275-1255 (1-877-ASK-1BLK)
This report is intended for current holders. It is not authorized for use as an offer of sale or a solicitation of an offer to buy shares of the Fund unless preceded or accompanied by the Fund’s current prospectus. Past performance results shown in this report should not be considered a representation of future performance. Investment returns and principal value of shares will fluctuate so that shares, when redeemed, may be worth more or less than their original cost. Statements and other information herein are as dated and are subject to change.
LCI-12/19-AR
| | |
 | | DECEMBER 31, 2019 |
BlackRock Funds III
| · | | iShares S&P 500 Index Fund |
Beginning on January 1, 2021, as permitted by regulations adopted by the Securities and Exchange Commission, paper copies of the Fund’s shareholder reports will no longer be sent by mail, unless you specifically request paper copies of the reports from BlackRock or from your financial intermediary, such as a broker-dealer or bank. Instead, the reports will be made available on a website, and you will be notified by mail each time a report is posted and provided with a website link to access the report.
You may elect to receive all future reports in paper free of charge. If you hold accounts directly with BlackRock, you can call (800) 441-7762 to inform BlackRock that you wish to continue receiving paper copies of your shareholder reports. If you hold accounts through a financial intermediary, you can follow the instructions included with this disclosure, if applicable, or contact your financial intermediary to request that you continue to receive paper copies of your shareholder reports. Please note that not all financial intermediaries may offer this service. Your election to receive reports in paper will apply to all funds advised by BlackRock Advisors, LLC, BlackRock Fund Advisors or their affiliates, or all funds held with your financial intermediary, as applicable.
If you already elected to receive shareholder reports electronically, you will not be affected by this change and you need not take any action. You may elect to receive electronic delivery of shareholder reports and other communications by: (i) accessing the BlackRock website at blackrock.com/edelivery and logging into your accounts, if you hold accounts directly with BlackRock, or (ii) contacting your financial intermediary, if you hold accounts through a financial intermediary. Please note that not all financial intermediaries may offer this service.
|
| Not FDIC Insured • May Lose Value • No Bank Guarantee |
The Markets in Review
Dear Shareholder,
U.S. equities and bonds finished the last year of the decade with impressive returns, putting an exclamation point on a decade of strong performance despite the fears and doubts about the economy that were ultimately laid to rest with unprecedented monetary stimulus and a sluggish yet resolute performance from the U.S. economy. In many ways, it was fitting that the themes of 2019 — geopolitical uncertainty, fears of recession, and decisive monetary stimulus — put the capstone on a decade that was defined by grappling with these competing forces.
Equity and bond markets posted solid returns, particularly in the second half of the year, as investors began to realize that the U.S. economy was maintaining the modest yet steady growth that has characterized this economic cycle. U.S. large cap equities advanced the most, while equities at the high end of the risk spectrum — emerging markets and U.S. small cap — lagged while still posting solid returns.
Fixed-income securities played an important role in diversified portfolios by delivering strong returns amid economic uncertainty, as interest rates declined (and bond prices rose). Long-term bonds, particularly long-term Treasuries, generally posted the strongest returns, as inflation remained low. Investment-grade and high-yield corporate bonds also posted solid returns, as the credit fundamentals in corporate markets remained relatively solid.
As equity performance faltered in late 2018 and global economic growth slowed, the U.S. Federal Reserve (the “Fed”) shifted away from policies designed to decrease inflation in favor of renewed efforts to stimulate economic activity. The Fed left interest rates unchanged in January 2019, then reduced interest rates three times thereafter, starting in July 2019. Similarly, the Fed took measures to support liquidity in short-term lending markets. Following in the Fed’s footsteps, the European Central Bank announced aggressive economic stimulus measures, including lower interest rates and the return of its bond purchasing program. The Bank of Japan signaled a continuation of accommodative monetary policy, while China committed to looser credit conditions and an increase in fiscal spending.
The outpouring of global economic stimulus led to a sharp rally in risk assets throughout the world despite the headwind of rising geopolitical and trade tensions. Hopes continued to remain high as the current economic expansion became the longest in U.S. history.
Looking ahead, we believe U.S. economic growth will stabilize and gradually improve in 2020. The primary drivers of recent market performance — trade and monetary policies — could take a back seat to a nascent expansion in manufacturing and a recent uptick in global growth. The headwinds of policy uncertainty in 2019 could become tailwinds in 2020 due topro-cyclical policy shifts.
Overall, we favor increasing investment risk to benefit from the brighter outlook. In addition to having a positive view for equities overall, we favor emerging market equities over developed market equities. Increasing cyclical exposure through value-style investing and maintaining a meaningful emphasis on high-quality companies through quality factors also makes sense for diversified investors. In fixed income, government bonds continue to be important portfolio stabilizers, while emerging market bonds, particularly local currency bonds, offer relatively attractive income opportunities.
In this environment, investors need to think globally, extend their scope across a broad array of asset classes, and be nimble as market conditions change. We encourage you to talk with your financial advisor and visitblackrock.com for further insight about investing in today’s markets.
Sincerely,
Rob Kapito
President, BlackRock Advisors, LLC
Rob Kapito
President, BlackRock Advisors, LLC
| | | | |
| Total Returns as of December 31, 2019 |
| | | 6-month | | 12-month |
U.S. large cap equities
(S&P 500® Index) | | 10.92% | | 31.49% |
U.S. small cap equities
(Russell 2000® Index) | | 7.30 | | 25.52 |
International equities
(MSCI Europe, Australasia, Far East Index) | | 7.01 | | 22.01 |
Emerging market equities
(MSCI Emerging Markets Index) | | 7.09 | | 18.42 |
3-month Treasury bills
(ICE BofAML3-Month U.S. Treasury Bill Index) | | 1.03 | | 2.28 |
U.S. Treasury securities
(ICE BofAML10-Year U.S. Treasury Index) | | 1.36 | | 8.91 |
U.S. investment grade bonds
(Bloomberg Barclays U.S. Aggregate Bond Index) | | 2.45 | | 8.72 |
Tax-exempt municipal bonds
(S&P Municipal Bond Index) | | 2.21 | | 7.26 |
U.S. high yield bonds
(Bloomberg Barclays U.S. Corporate High Yield 2% Issuer Capped Index) | | 3.98 | | 14.32 |
| Past performance is no guarantee of future results. Index performance is shown for illustrative purposes only. You cannot invest directly in an index. |
| | |
| 2 | | THIS PAGEISNOT PARTOF YOUR FUND REPORT |
Table of Contents

| | |
| Fund Summary as of December 31, 2019 | | iShares S&P 500 Index Fund |
Investment Objective
iShares S&P 500 Index Fund’s (the “Fund”) investment objective is to seek to provide investment results that correspond to the total return performance of publicly-traded common stocks in the aggregate, as represented by the Standard & Poor’s 500® Index (“S&P 500® Index”).
Portfolio Management Commentary
How did the Fund perform?
For the 12-month period ended December 31, 2019, the Fund’s Institutional Shares returned 31.35%, Service Shares returned 31.20%, Investor A Shares returned 31.02%, Investor C1 Shares returned 30.13%, Class G Shares returned 31.45%, Class K Shares returned 31.44%, and Investor P Shares returned 31.02%. The benchmark S&P 500® Index returned 31.49% for the same period.
Returns for the Fund’s respective share classes differ from the benchmark index based on individual share-class expenses. The Fund invests all of its assets in S&P 500 Index Master Portfolio (the “Master Portfolio”), a series of Master Investment Portfolio.
Describe the market environment.
All eleven of the Global Industry Classification Standard (“GICS”) sectors advanced in the first quarter of 2019 as positive headlines regarding Sino-American trade negotiations, relatively strong corporate earnings growth, and the Fed’s dovish pivot helped investor sentiment recover from steep losses in the fourth quarter of 2018. The technology sector outperformed and was responsible for 29% of the S&P 500® Index’s overall rally. Real estate was the second best-performing sector as a decline in interest rates throughout the quarter drove demand for bond proxies. Health care shares underperformed as political risks weighed on sentiment, but still posted a respectable gain.
In its January 2019 announcement, the Fed indicated that it would refrain from interest rate hikes for the foreseeable future, with a dovish assessment of U.S. economic conditions and transparency around balance sheet normalization. This reduced market-based expectations of interest rate hikes, serving as a boon for both equities and bonds. Less optimism was evident in the U.S. rates market. The pause in interest rate hiking by the Fed coupled with lowered forecasts for growth drove investors into longer-duration government bonds.
The prospect of an easier monetary policy buoyed equities broadly in the second quarter of 2019. At the June Federal Open Market Committee announcement, Fed Chair Jerome Powell noted that should trade tensions weigh on the committee’s economic outlook or should the shortfall of inflation from the target rate persist longer than expected, the Fed would provide more accommodation to sustain the expansion.
Trade tensions were a source of intra-quarter volatility. In May, President Trump threatened an increase in tariffs and protectionism against both China and Mexico. The S&P 500® Index fell 6.4% in May on these renewed trade concerns. However, these announcements did not materialize, and sentiment eased by June month end.
Looking to interest rates, the 10-year U.S. Treasury yield declined 0.50% in the second quarter to 2% — the lowest level since 2016. The yield curve remained a source of uncertainty as the three-month/10-year Treasury spread remained in negative territory while the five-year/30-year Treasury spread expanded throughout the quarter.
In the third quarter of 2019, trade tensions were a key focus for both domestic and global investors. The S&P 500® Index suffered its worst week of 2019 in early August on the back of President Trump’s promise to impose 10% tariffs on all Chinese imports that were not already subject to 25% tariffs. U.S.-China tensions did ostensibly ease ahead of a new round of trade talks in October. In monetary policy, the Fed lowered the target range for the federal funds rates at both its July and September meetings.
On the macroeconomic front, survey-based U.S. economic indicators continued to soften in the manufacturing and consumer sectors, while hard economic data releases exhibited resilience. In interest rates, the frequently monitored two-year/ten-year Treasury yield spread inverted for the first time since the global financial crisis in August but ended the quarter in positive territory.
In the fourth quarter of 2019, risk appetite was boosted broadly by expectations of a U.S.-China trade deal, strong economic growth, and easy monetary policy. U.S. tariffs on China were originally scheduled to increase on December 15 but were avoided due to persistent negotiations between the United States and China. Additionally, news that the United States did not impose tariffs on European Union auto exports helped support sentiment. On the macroeconomic front, the U.S. services and employment sectors remained buoyant.
In November, 266,000 jobs were added to the economy, revising the third quarter unemployment rate down to 3.5% from 3.7%. Overall, the supportive macroeconomic data and boosted risk appetite drove selling of Treasuries in the quarter. Despite the strength in the U.S. economy, the Fed cut the benchmark federal funds rate to 1.75% in October, marking the third rate cut of the year.
For the year 2019, all the GICS sectors returned positive results in the S&P 500® Index. Top contributors were information technology (50.3%), communication services (32.6%), and financials (32.1%). Bottom contributors for the year were energy (11.8%), health care (20.8%), and materials (24.8%).
Describe recent portfolio activity.
During the period, as changes were made to the composition of the S&P 500® Index, the Master Portfolio purchased and sold securities to pursue its objective of seeking to replicate the total return of the benchmark index.
Describe portfolio positioning at period end.
The Master Portfolio remains positioned to match the risk characteristics of its benchmark index, irrespective of the market’s future direction.
The views expressed reflect the opinions of BlackRock as of the date of this report and are subject to change based on changes in market, economic or other conditions. These views are not intended to be a forecast of future events and are no guarantee of future results.
| | |
| 4 | | 2019 BLACKROCK ANNUAL REPORTTO SHAREHOLDERS |
| | |
| Fund Summary as of December 31, 2019 (continued) | | iShares S&P 500 Index Fund |
TOTAL RETURN BASED ON A $10,000 INVESTMENT
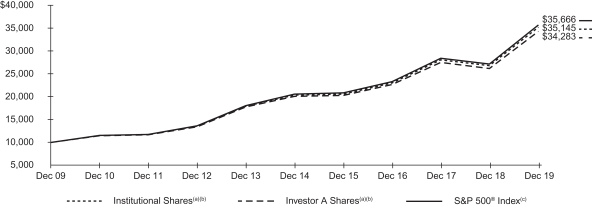
| (a) | Assuming transaction costs and other operating expenses, including administration fees, if any. |
| (b) | The Fund invests all of its assets in the Master Portfolio. Under normal circumstances, the Master Portfolio invests at least 90% of the value of the Fund’s assets, plus the amount of any borrowing for investment purposes, in securities comprised of the S&P 500® Index. |
| (c) | An unmanaged index that covers 500 leading companies and captures approximately 80% coverage of available market capitalization. |
Performance Summary for the Period Ended December 31, 2019
| | | | | | | | | | | | | | | | | | | | | | | | | | | | | | | | | | | | | | | | |
| | | | | | | | | Average Annual Total Returns (a) | |
| | | | | | | | | 1 Year | | | | | | 5 Years | | | | | | 10 Years | |
| | | 6-Month
Total Returns | | | | | | w/o sales
charge | | | w/sales
charge | | | | | | w/o sales
charge | | | w/sales
charge | | | | | | w/o sales
charge | | | w/sales
charge | |
Institutional | | | 10.87 | % | | | | | | | 31.35 | % | | | N/A | | | | | | | | 11.58 | % | | | N/A | | | | | | | | 13.40 | % | | | N/A | |
Service | | | 10.80 | | | | | | | | 31.20 | | | | N/A | | | | | | | | 11.45 | | | | N/A | | | | | | | | 13.26 | | | | N/A | |
Investor A | | | 10.72 | | | | | | | | 31.02 | | | | N/A | | | | | | | | 11.31 | | | | N/A | | | | | | | | 13.11 | | | | N/A | |
Investor C1 | | | 10.36 | | | | | | | | 30.13 | | | | N/A | | | | | | | | 10.51 | | | | N/A | | | | | | | | 12.30 | | | | N/A | |
Class G | | | 10.92 | | | | | | | | 31.45 | | | | N/A | | | | | | | | 11.67 | | | | N/A | | | | | | | | 13.48 | | | | N/A | |
Class K | | | 10.91 | | | | | | | | 31.44 | | | | N/A | | | | | | | | 11.66 | | | | N/A | | | | | | | | 13.47 | | | | N/A | |
Investor P | | | 10.73 | | | | | | | | 31.02 | | | | 24.14 | % | | | | | | | 11.31 | | | | 10.11 | % | | | | | | | 13.12 | | | | 12.51 | % |
S&P 500® Index | | | 10.92 | | | | | | | | 31.49 | | | | N/A | | | | | | | | 11.70 | | | | N/A | | | | | | | | 13.56 | | | | N/A | |
| | (a) | Assuming maximum sales charges, if any. Average annual total returns with and without sales charges reflect reductions for distribution and service fees. See “About Fund Performance” on page 6 for a detailed description of share classes, including any related sales charges and fees, and how performance was calculated for certain share classes. | |
N/A — Not applicable as share class and index do not have a sales charge.
Past performance is not indicative of future results.
Performance results may include adjustments made for financial reporting purposes in accordance with U.S. generally accepted accounting principles.
Expense Example
| | | | | | | | | | | | | | | | | | | | | | | | | | | | | | | | | | | | |
| | | Actual | | | | | | Hypothetical (b) | | | | | | | |
| | | Beginning
Account Value
(07/01/19) | | | Ending
Account Value
(12/31/19) | | | Expenses Paid During
the Period (a) | | | | | | Beginning
Account Value
(07/01/19) | | | Ending
Account Value
(12/31/19) | | | Expenses
Paid During
the Period (a) | | | | | | Annualized
Expense
Ratio | |
Institutional | | $ | 1,000.00 | | | $ | 1,108.70 | | | $ | 0.53 | | | | | | | $ | 1,000.00 | | | $ | 1,024.70 | | | $ | 0.51 | | | | | | | | 0.10 | % |
Service | | | 1,000.00 | | | | 1,108.00 | | | | 1.17 | | | | | | | | 1,000.00 | | | | 1,024.10 | | | | 1.12 | | | | | | | | 0.22 | |
Investor A | | | 1,000.00 | | | | 1,107.20 | | | | 1.86 | | | | | | | | 1,000.00 | | | | 1,023.44 | | | | 1.79 | | | | | | | | 0.35 | |
Investor C1 | | | 1,000.00 | | | | 1,103.60 | | | | 5.30 | | | | | | | | 1,000.00 | | | | 1,025.16 | | | | 5.09 | | | | | | | | 1.00 | |
Class G | | | 1,000.00 | | | | 1,109.20 | | | | 0.05 | | | | | | | | 1,000.00 | | | | 1,020.16 | | | | 0.05 | | | | | | | | 0.01 | |
Class K | | | 1,000.00 | | | | 1,109.10 | | | | 0.16 | | | | | | | | 1,000.00 | | | | 1,025.05 | | | | 0.15 | | | | | | | | 0.03 | |
Investor P | | | 1,000.00 | | | | 1,107.30 | | | | 1.86 | | | | | | | | 1,000.00 | | | | 1,023.44 | | | | 1.79 | | | | | | | | 0.35 | |
| | (a) | For each class of the Fund, expenses are equal to the annualized expense ratio for the class, multiplied by the average account value over the period, multiplied by 184/365 (to reflect the one-half year period shown). Because the Fund invests all of its assets in the Master Portfolio, the expense example reflects the net expenses of both the Fund and the Master Portfolio in which it invests. | |
| | (b) | Hypothetical 5% annual return before expenses is calculated by prorating the number of days in the most recent fiscal half year divided by 365. | |
See “Disclosure of Expenses” on page 6 for further information on how expenses were calculated.
About Fund Performance
Institutional and Class K Sharesare not subject to any sales charge. These shares bear no ongoing distribution or service fees and are available only to certain eligible investors. Prior to April 11, 2013, Class K Shares were an undesignated share class of the Fund. Institutional Shares performance shown prior to the Institutional Shares inception date of April 10, 2013 is that of Class K Shares (which have no distribution or service fees) and was restated to reflect Institutional Shares fees.
Service Sharesare not subject to any sales charge. These shares are subject to a service fee of 0.15% per year (but no distribution fee) and are available only to certain eligible investors. Service Shares performance shown prior to the Service Shares inception date of April 19, 2013 is that of Class K Shares (which have no distribution or service fees) and was restated to reflect Service Shares fees.
Investor A Sharesare not subject to any sales charge and bear no ongoing distribution fee. These shares are subject to an ongoing service fee of 0.25% per year. These shares are generally available through financial intermediaries. Investor A Shares performance shown prior to the Investor A Shares inception date of April 10, 2013 is that of Class K Shares (which have no distribution or service fees) and was restated to reflect Investor A Shares fees.
Investor C1 Sharesare not subject to any sales charge. These shares are subject to a distribution fee of 0.75% per year and a service fee of 0.15% per year. These shares are only available for dividend and capital gain reinvestment by existing shareholders and for purchase by certain employer-sponsored retirement plans. These shares automatically convert to Investor A Shares after approximately ten years. On November 12-13, 2019, the Board of Trustees of the Trust approved the conversion of all issued and outstanding Investor C1 Shares into Investor A Shares, which will be effective on or about the close of business on February 24, 2020. Investor C1 Shares performance shown prior to the Investor C1 Shares inception date of April 19, 2013 is that of Class K Shares (which have no distribution or service fees) and was restated to reflect Investor C1 Shares fees.
Class G Shares are not subject to any sales charge. These shares bear no ongoing distribution or service fees and are available only to investors on eligible platforms. Class G Shares performance shown prior to the Class G Shares inception date of July 1, 2019 is that of Class K Shares (which have no distribution or service fees).
Investor P Shares are subject to a maximum initial sales charge (front-end load) of 5.25% and a service fee of 0.25% per year (but no distribution fee). These shares are only available to investors purchasing shares through registered representatives of an insurance company’s broker-dealer that has entered into an agreement with the Fund’s distributor to offer such shares. Investor P Shares performance shown prior to the Investor P Shares inception date of August 6, 2018 is that of Class K Shares (which have no distribution or service fees) and was restated to reflect Investor P Shares fees.
Performance information reflects past performance and does not guarantee future results. Current performance may be lower or higher than the performance data quoted. Refer toblackrock.comto obtain performance data current to the most recent month-end. Performance results do not reflect the deduction of taxes that a shareholder would pay on fund distributions or the redemption of fund shares. Figures shown in the performance table on the previous page assume reinvestment of all distributions, if any, at net asset value on theex-dividend date. Investment return and principal value of shares will fluctuate so that shares, when redeemed, may be worth more or less than their original cost. Distributions paid to each class of shares will vary because of the different levels of administration, service and distribution fees applicable to each class, which are deducted from the income available to be paid to shareholders.
BlackRock Advisors, LLC (“BAL” or the “Administrator”), the Fund’s administrator, has contractually agreed to waive and/or reimburse a portion of the Fund’s expenses. Without such waiver and/or reimbursement, the Fund’s performance would have been lower. With respect to the Fund’s contractual waiver, the Administrator is under no obligation to continue waiving and/or reimbursing its fees after the applicable termination date of such agreement. See Note 4 of the Notes to Financial Statements for additional information on waivers and/or reimbursements.
Disclosure of Expenses
Shareholders of the Fund may incur the following charges: (a) transactional expenses, such as sales charges; and (b) operating expenses, including administration fees, service and distribution fees, including12b-1 fees, acquired fund fees and expenses, and other fund expenses. The expense example on the previous page (which is based on a hypothetical investment of $1,000 invested on July 1, 2019 and held through December 31, 2019) is intended to assist shareholders both in calculating expenses based on an investment in the Fund and in comparing these expenses with similar costs of investing in other mutual funds.
The expense example provides information about actual account values and actual expenses. In order to estimate the expenses a shareholder paid during the period covered by this report, shareholders can divide their account value by $1,000 and then multiply the result by the number corresponding to their share class under the heading entitled “Expenses Paid During the Period.”
The expense example also provides information about hypothetical account values and hypothetical expenses based on the Fund’s actual expense ratio and an assumed rate of return of 5% per year before expenses. In order to assist shareholders in comparing the ongoing expenses of investing in the Fund and other funds, compare the 5% hypothetical example with the 5% hypothetical examples that appear in shareholder reports of other funds.
The expenses shown in the expense example are intended to highlight shareholders’ ongoing costs only and do not reflect transactional expenses, such as sales charges, if any. Therefore, the hypothetical example is useful in comparing ongoing expenses only, and will not help shareholders determine the relative total expenses of owning different funds. If these transactional expenses were included, shareholder expenses would have been higher.
Derivative Financial Instruments
The Master Portfolio may invest in various derivative financial instruments. These instruments are used to obtain exposure to a security, commodity, index, market, and/or other assets without owning or taking physical custody of securities, commodities and/or other referenced assets or to manage market, equity, credit, interest rate, foreign currency exchange rate, commodity and/or other risks. Derivative financial instruments may give rise to a form of economic leverage and involve risks, including the imperfect correlation between the value of a derivative financial instrument and the underlying asset, possible default of the counterparty to the transaction or illiquidity of the instrument. The Master Portfolio’s successful use of a derivative financial instrument depends on the investment adviser’s ability to predict pertinent market movements accurately, which cannot be assured. The use of these instruments may result in losses greater than if they had not been used, may limit the amount of appreciation the Master Portfolio can realize on an investment and/or may result in lower distributions paid to shareholders. The Master Portfolio’s investments in these instruments, if any, are discussed in detail in the Notes to Financial Statements.
| | |
| 6 | | 2019 BLACKROCK ANNUAL REPORTTO SHAREHOLDERS |
Statement of Assets and Liabilities
December 31, 2019
| | | | |
| | | iShares
S&P 500
Index Fund | |
| |
ASSETS | | | | |
Investments at value — Master Portfolio | | $ | 22,504,337,767 | |
Receivables: | |
Capital shares sold | | | 80,340,197 | |
Withdrawals from the Master Portfolio | | | 16,580,489 | |
| | | | |
Total assets | | | 22,601,258,453 | |
| | | | |
| |
LIABILITIES | | | | |
Payables: | | | | |
Administration fees | | | 1,498,559 | |
Capital shares redeemed | | | 96,920,686 | |
Professional fees | | | 12,200 | |
Service and distribution fees | | | 873,571 | |
| | | | |
Total liabilities | | | 99,305,016 | |
| | | | |
| |
NET ASSETS | | $ | 22,501,953,437 | |
| | | | |
| |
NET ASSETS CONSIST OF | | | | |
Paid-in capital | | $ | 13,811,060,308 | |
Accumulated earnings | | | 8,690,893,129 | |
| | | | |
NET ASSETS | | $ | 22,501,953,437 | |
| | | | |
| |
NET ASSET VALUE | | | | |
Institutional —Based on net assets of $3,950,956,340 and 10,325,832 shares outstanding, unlimited number authorized, no par value | | $ | 382.63 | |
| | | | |
Service — Based on net assets of $334,402,081 and 874,022 shares outstanding, unlimited number authorized, no par value | | $ | 382.60 | |
| | | | |
Investor A — Based on net assets of $2,667,724,492 and 6,974,080 shares outstanding, unlimited number authorized, no par value | | $ | 382.52 | |
| | | | |
Investor C1 — Based on net assets of $2,615,015 and 6,810 shares outstanding, unlimited number authorized, no par value | | $ | 383.97 | |
| | | | |
Class G — Based on net assets of $5,796,330,770 and 15,145,597 shares outstanding, unlimited number authorized, no par value | | $ | 382.71 | |
| | | | |
Class K — Based on net assets of $8,471,585,299 and 22,135,444 shares outstanding, unlimited number authorized, no par value | | $ | 382.72 | |
| | | | |
Investor P — Based on net assets of $1,278,339,440 and 3,344,515 shares outstanding, unlimited number authorized, no par value | | $ | 382.22 | |
| | | | |
See notes to financial statements.
Statement of Operations
Year Ended December 31, 2019
| | | | |
| | | iShares
S&P 500
Index Fund | |
| |
INVESTMENT INCOME | | | | |
Net investment income allocated from the Master Portfolio: | | | | |
Dividends — affiliated | | $ | 6,828,890 | |
Dividends — unaffiliated | | | 379,002,077 | |
Securities lending income — affiliated — net | | | 656,943 | |
Foreign taxes withheld | | | (1,465,581 | ) |
Expenses | | | (5,069,233 | ) |
Fees waived | | | 545,290 | |
| | | | |
Total investment income | | | 380,498,386 | |
| | | | |
| |
FUND EXPENSES | | | | |
Service and distribution — class specific | | | 9,784,335 | |
Administration — class specific | | | 7,168,096 | |
Professional | | | 12,189 | |
Miscellaneous | | | 450 | |
| | | | |
Total expenses | | | 16,965,070 | |
Less fees waived and/or reimbursed by the Manager | | | (12,189 | ) |
| | | | |
Total expenses after fees waived and/or reimbursed | | | 16,952,881 | |
| | | | |
Net investment income | | | 363,545,505 | |
| | | | |
| |
REALIZED AND UNREALIZED GAIN (LOSS) ALLOCATED FROM THE MASTER PORTFOLIO | | | | |
Net realized gain (loss) from: | | | | |
Futures contracts | | | 65,399,174 | |
Investments | | | (25,685,927 | ) |
| | | | |
| | | 39,713,247 | |
| | | | |
Net change in unrealized appreciation (depreciation) on: | | | | |
Futures contracts | | | 1,879,492 | |
Investments | | | 4,820,983,169 | |
| | | | |
| | | 4,822,862,661 | |
| | | | |
Net realized and unrealized gain | | | 4,862,575,908 | |
| | | | |
NET INCREASE IN NET ASSETS RESULTING FROM OPERATIONS | | $ | 5,226,121,413 | |
| | | | |
See notes to financial statements.
| | |
| 8 | | 2019 BLACKROCK ANNUAL REPORTTO SHAREHOLDERS |
Statements of Changes in Net Assets
| | | | | | | | |
| | | iShares S&P 500 Index Fund | |
| | | Year Ended December 31, | |
| | | 2019 | | | 2018 | |
| | |
INCREASE (DECREASE) IN NET ASSETS | | | | | | | | |
| | |
OPERATIONS | | | | | | | | |
Net investment income | | $ | 363,545,505 | | | $ | 281,155,486 | |
Net realized gain | | | 39,713,247 | | | | 46,754,993 | |
Net change in unrealized appreciation (depreciation) | | | 4,822,862,661 | | | | (1,241,188,390 | ) |
| | | | | | | | |
Net increase (decrease) in net assets resulting from operations | | | 5,226,121,413 | | | | (913,277,911 | ) |
| | | | | | | | |
|
DISTRIBUTIONS(a) | |
Institutional | | | (80,052,439 | ) | | | (80,048,879 | ) |
Service | | | (6,647,327 | ) | | | (7,456,614 | ) |
Investor A | | | (46,633,679 | ) | | | (46,008,669 | ) |
Investor C1 | | | (29,188 | ) | | | (285,719 | ) |
Class G | | | (60,325,171 | ) | | | — | |
Class K | | | (199,316,804 | ) | | | (212,831,963 | ) |
Investor P | | | (22,025,637 | ) | | | (9,203,819 | ) |
| | | | | | | | |
Decrease in net assets resulting from distributions to shareholders | | | (415,030,245 | ) | | | (355,835,663 | ) |
| | | | | | | | |
| | |
CAPITAL SHARE TRANSACTIONS | | | | | | | | |
Net increase in net assets derived from capital share transactions | | | 1,109,955,590 | | | | 5,000,372,689 | |
| | | | | | | | |
|
NET ASSETS | |
Total increase in net assets | | | 5,921,046,758 | | | | 3,731,259,115 | |
Beginning of year | | | 16,580,906,679 | | | | 12,849,647,564 | |
| | | | | | | | |
End of year | | $ | 22,501,953,437 | | | $ | 16,580,906,679 | |
| | | | | | | | |
| (a) | Distributions for annual periods determined in accordance with U.S. federal income tax regulations. |
See notes to financial statements.
Financial Highlights
(For a share outstanding throughout each period)
| | | | | | | | | | | | | | | | | | | | |
| | | iShares S&P 500 Index Fund | |
| |
| | | Institutional | |
| |
| | | Year Ended December 31, | |
| | | 2019 | | | 2018 | | | 2017 | | | 2016 | | | 2015 | |
| | | | | | |
Net asset value, beginning of year | | $ | 297.40 | | | $ | 318.31 | | | $ | 267.04 | | | $ | 244.52 | | | $ | 247.36 | |
| | | | | | | | | | | | | | | | | | | | |
Net investment income(a) | | | 6.46 | | | | 6.03 | | | | 5.42 | | | | 5.13 | | | | 4.79 | |
Net realized and unrealized gain (loss) | | | 86.13 | | | | (19.72 | ) | | | 52.02 | | | | 23.55 | | | | (1.71 | ) |
| | | | | | | | | | | | | | | | | | | | |
Net increase (decrease) from investment operations | | | 92.59 | | | | (13.69 | ) | | | 57.44 | | | | 28.68 | | | | 3.08 | |
| | | | | | | | | | | | | | | | | | | | |
|
Distributions(b) | |
From net investment income | | | (7.36 | ) | | | (5.82 | ) | | | (5.32 | ) | | | (5.08 | ) | | | (4.77 | ) |
From net realized gain | | | — | | | | (1.40 | ) | | | (0.85 | ) | | | (1.08 | ) | | | (1.15 | ) |
| | | | | | | | | | | | | | | | | | | | |
Total distributions | | | (7.36 | ) | | | (7.22 | ) | | | (6.17 | ) | | | (6.16 | ) | | | (5.92 | ) |
| | | | | | | | | | | | | | | | | | | | |
| | | | | |
Net asset value, end of year | | $ | 382.63 | | | $ | 297.40 | | | $ | 318.31 | | | $ | 267.04 | | | $ | 244.52 | |
| | | | | | | | | | | | | | | | | | | | |
| | | | | |
Total Return(c) | | | | | | | | | | | | | | | | | | | | |
Based on net asset value | | | 31.35 | % | | | (4.45 | )% | | | 21.68 | % | | | 11.84 | % | | | 1.28 | % |
| | | | | | | | | | | | | | | | | | | | |
| | | | | |
Ratios to Average Net Assets(d) | | | | | | | | | | | | | | | | | | | | |
Total expenses | | | 0.10 | %(e) | | | 0.11 | %(e) | | | 0.11 | %(e) | | | 0.11 | %(e) | | | 0.11 | %(f) |
| | | | | | | | | | | | | | | | | | | | |
Total expenses after fees waived and/or reimbursed | | | 0.10 | %(e) | | | 0.11 | %(e) | | | 0.11 | %(e) | | | 0.11 | %(e) | | | 0.11 | %(f) |
| | | | | | | | | | | | | | | | | | | | |
Net investment income | | | 1.87 | %(e) | | | 1.84 | %(e) | | | 1.86 | %(e) | | | 2.04 | %(e) | | | 1.93 | %(f) |
| | | | | | | | | | | | | | | | | | | | |
| | | | | |
Supplemental Data | | | | | | | | | | | | | | | | | | | | |
Net assets, end of year (000) | | $ | 3,950,956 | | | $ | 3,660,724 | | | $ | 3,596,342 | | | $ | 4,290,475 | | | $ | 3,247,607 | |
| | | | | | | | | | | | | | | | | | | | |
Portfolio turnover rate of the Master Portfolio | | | 3 | % | | | 12 | % | | | 11 | % | | | 4 | % | | | 2 | % |
| | | | | | | | | | | | | | | | | | | | |
| (a) | Based on average shares outstanding. |
| (b) | Distributions for annual periods determined in accordance with U.S. federal income tax regulations. |
| (c) | Where applicable, assumes the reinvestment of distributions. |
| (d) | Includes the Fund’s share of the Master Portfolio’s allocated expenses and/or net investment income. |
| (e) | Includes the Fund’s share of the Master Portfolio’s allocated fees waived of less than 0.01%. |
| (f) | Includes the Fund’s share of the Master Portfolio’s allocated fees waived of 0.01%. |
See notes to financial statements.
| | |
| 10 | | 2019 BLACKROCK ANNUAL REPORTTO SHAREHOLDERS |
Financial Highlights (continued)
(For a share outstanding throughout each period)
| | | | | | | | | | | | | | | | | | | | |
| | | iShares S&P 500 Index Fund (continued) | |
| |
| | | Service | |
| |
| | | Year Ended December 31, | |
| | | 2019 | | | 2018 | | | 2017 | | | 2016 | | | 2015 | |
| | | | | |
Net asset value, beginning of year | | $ | 297.38 | | | $ | 318.29 | | | $ | 267.02 | | | $ | 244.52 | | | $ | 247.35 | |
| | | | | | | | | | | | | | | | | | | | |
Net investment income(a) | | | 6.06 | | | | 5.64 | | | | 5.08 | | | | 4.80 | | | | 4.48 | |
Net realized and unrealized gain (loss) | | | 86.10 | | | | (19.73 | ) | | | 52.00 | | | | 23.56 | | | | (1.69 | ) |
| | | | | | | | | | | | | | | | | | | | |
Net increase (decrease) from investment operations | | | 92.16 | | | | (14.09 | ) | | | 57.08 | | | | 28.36 | | | | 2.79 | |
| | | | | | | | | | | | | | | | | | | | |
|
Distributions(b) | |
From net investment income | | | (6.94 | ) | | | (5.42 | ) | | | (4.96 | ) | | | (4.78 | ) | | | (4.47 | ) |
From net realized gain | | | — | | | | (1.40 | ) | | | (0.85 | ) | | | (1.08 | ) | | | (1.15 | ) |
| | | | | | | | | | | | | | | | | | | | |
Total distributions | | | (6.94 | ) | | | (6.82 | ) | | | (5.81 | ) | | | (5.86 | ) | | | (5.62 | ) |
| | | | | | | | | | | | | | | | | | | | |
| | | | | |
Net asset value, end of year | | $ | 382.60 | | | $ | 297.38 | | | $ | 318.29 | | | $ | 267.02 | | | $ | 244.52 | |
| | | | | | | | | | | | | | | | | | | | |
|
Total Return(c) | |
Based on net asset value | | | 31.20 | % | | | (4.57 | )% | | | 21.54 | % | | | 11.71 | % | | | 1.16 | % |
| | | | | | | | | | | | | | | | | | | | |
|
Ratios to Average Net Assets(d) | |
Total expenses | | | 0.22 | %(e) | | | 0.23 | %(e) | | | 0.23 | %(e) | | | 0.23 | %(e) | | | 0.23 | %(f) |
| | | | | | | | | | | | | | | | | | | | |
Total expenses after fees waived and/or reimbursed | | | 0.22 | %(e) | | | 0.23 | %(e) | | | 0.23 | %(e) | | | 0.23 | %(e) | | | 0.23 | %(f) |
| | | | | | | | | | | | | | | | | | | | |
Net investment income | | | 1.75 | %(e) | | | 1.72 | %(e) | | | 1.74 | %(e) | | | 1.91 | %(e) | | | 1.81 | %(f) |
| | | | | | | | | | | | | | | | | | | | |
|
Supplemental Data | |
Net assets, end of year (000) | | $ | 334,402 | | | $ | 318,651 | | | $ | 319,504 | | | $ | 332,292 | | | $ | 304,088 | |
| | | | | | | | | | | | | | | | | | | | |
Portfolio turnover rate of the Master Portfolio | | | 3 | % | | | 12 | % | | | 11 | % | | | 4 | % | | | 2 | % |
| | | | | | | | | | | | | | | | | | | | |
| (a) | Based on average shares outstanding. |
| (b) | Distributions for annual periods determined in accordance with U.S. federal income tax regulations. |
| (c) | Where applicable, assumes the reinvestment of distributions. |
| (d) | Includes the Fund’s share of the Master Portfolio’s allocated expenses and/or net investment income. |
| (e) | Includes the Fund’s share of the Master Portfolio’s allocated fees waived of less than 0.01%. |
| (f) | Includes the Fund’s share of the Master Portfolio’s allocated fees waived of 0.01%. |
See notes to financial statements.
Financial Highlights (continued)
(For a share outstanding throughout each period)
| | | | | | | | | | | | | | | | | | | | |
| | | iShares S&P 500 Index Fund (continued) | |
| |
| | | Investor A | |
| |
| | | Year Ended December 31, | |
| | | 2019 | | | 2018 | | | 2017 | | | 2016 | | | 2015 | |
| | | | | |
Net asset value, beginning of year | | $ | 297.33 | | | $ | 318.23 | | | $ | 266.99 | | | $ | 244.52 | | | $ | 247.35 | |
| | | | | | | | | | | | | | | | | | | | |
Net investment income(a) | | | 5.61 | | | | 5.22 | | | | 4.71 | | | | 4.49 | | | | 4.16 | |
Net realized and unrealized gain (loss) | | | 86.07 | | | | (19.72 | ) | | | 51.97 | | | | 23.53 | | | | (1.69 | ) |
| | | | | | | | | | | | | | | | | | | | |
Net increase (decrease) from investment operations | | | 91.68 | | | | (14.50 | ) | | | 56.68 | | | | 28.02 | | | | 2.47 | |
| | | | | | | | | | | | | | | | | | | | |
|
Distributions(b) | |
From net investment income | | | (6.49 | ) | | | (5.00 | ) | | | (4.59 | ) | | | (4.47 | ) | | | (4.15 | ) |
From net realized gain | | | — | | | | (1.40 | ) | | | (0.85 | ) | | | (1.08 | ) | | | (1.15 | ) |
| | | | | | | | | | | | | | | | | | | | |
Total distributions | | | (6.49 | ) | | | (6.40 | ) | | | (5.44 | ) | | | (5.55 | ) | | | (5.30 | ) |
| | | | | | | | | | | | | | | | | | | | |
| | | | | |
Net asset value, end of year | | $ | 382.52 | | | $ | 297.33 | | | $ | 318.23 | | | $ | 266.99 | | | $ | 244.52 | |
| | | | | | | | | | | | | | | | | | | | |
|
Total Return(c) | |
Based on net asset value | | | 31.02 | % | | | (4.68 | )% | | | 21.38 | % | | | 11.56 | % | | | 1.03 | % |
| | | | | | | | | | | | | | | | | | | | |
|
Ratios to Average Net Assets(d) | |
Total expenses | | | 0.35 | %(e) | | | 0.36 | %(e) | | | 0.36 | %(e) | | | 0.36 | %(e) | | | 0.36 | %(f) |
| | | | | | | | | | | | | | | | | | | | |
Total expenses after fees waived and/or reimbursed | | | 0.35 | %(e) | | | 0.36 | %(e) | | | 0.36 | %(e) | | | 0.36 | %(e) | | | 0.36 | %(f) |
| | | | | | | | | | | | | | | | | | | | |
Net investment income | | | 1.62 | %(e) | | | 1.60 | %(e) | | | 1.61 | %(e) | | | 1.79 | %(e) | | | 1.68 | %(f) |
| | | | | | | | | | | | | | | | | | | | |
|
Supplemental Data | |
Net assets, end of year (000) | | $ | 2,667,724 | | | $ | 2,160,098 | | | $ | 2,271,969 | | | $ | 1,774,331 | | | $ | 1,281,538 | |
| | | | | | | | | | | | | | | | | | | | |
Portfolio turnover rate of the Master Portfolio | | | 3 | % | | | 12 | % | | | 11 | % | | | 4 | % | | | 2 | % |
| | | | | | | | | | | | | | | | | | | | |
| (a) | Based on average shares outstanding. |
| (b) | Distributions for annual periods determined in accordance with U.S. federal income tax regulations. |
| (c) | Where applicable, assumes the reinvestment of distributions. |
| (d) | Includes the Fund’s share of the Master Portfolio’s allocated expenses and/or net investment income. |
| (e) | Includes the Fund’s share of the Master Portfolio’s allocated fees waived of less than 0.01%. |
| (f) | Includes the Fund’s share of the Master Portfolio’s allocated fees waived of 0.01%. |
See notes to financial statements.
| | |
| 12 | | 2019 BLACKROCK ANNUAL REPORTTO SHAREHOLDERS |
Financial Highlights (continued)
(For a share outstanding throughout each period)
| | | | | | | | | | | | | | | | | | | | |
| | | iShares S&P 500 Index Fund (continued) | |
| |
| | | Investor C1 | |
| |
| | | Year Ended December 31, | |
| | | 2019 | | | 2018 | | | 2017 | | | 2016 | | | 2015 | |
| | | | | |
Net asset value, beginning of year | | $ | 298.47 | | | $ | 318.74 | | | $ | 267.07 | | | $ | 244.59 | | | $ | 247.36 | |
| | | | | | | | | | | | | | | | | | | | |
Net investment income(a) | | | 3.25 | | | | 2.70 | | | | 2.58 | | | | 2.68 | | | | 2.36 | |
Net realized and unrealized gain (loss) | | | 86.35 | | | | (19.69 | ) | | | 52.01 | | | | 23.49 | | | | (1.65 | ) |
| | | | | | | | | | | | | | | | | | | | |
Net increase (decrease) from investment operations | | | 89.60 | | | | (16.99 | ) | | | 54.59 | | | | 26.17 | | | | 0.71 | |
| | | | | | | | | | | | | | | | | | | | |
|
Distributions(b) | |
From net investment income | | | (4.10 | ) | | | (1.88 | ) | | | (2.07 | ) | | | (2.61 | ) | | | (2.33 | ) |
From net realized gain | | | — | | | | (1.40 | ) | | | (0.85 | ) | | | (1.08 | ) | | | (1.15 | ) |
| | | | | | | | | | | | | | | | | | | | |
Total distributions | | | (4.10 | ) | | | (3.28 | ) | | | (2.92 | ) | | | (3.69 | ) | | | (3.48 | ) |
| | | | | | | | | | | | | | | | | | | | |
| | | | | |
Net asset value, end of year | | $ | 383.97 | | | $ | 298.47 | | | $ | 318.74 | | | $ | 267.07 | | | $ | 244.59 | |
| | | | | | | | | | | | | | | | | | | | |
|
Total Return(c) | |
Based on net asset value | | | 30.13 | % | | | (5.40 | )% | | | 20.51 | % | | | 10.76 | % | | | 0.30 | % |
| | | | | | | | | | | | | | | | | | | | |
|
Ratios to Average Net Assets(d) | |
Total expenses | | | 1.04 | %(e) | | | 1.08 | %(e) | | | 1.08 | %(e) | | | 1.08 | %(e) | | | 1.08 | %(f) |
| | | | | | | | | | | | | | | | | | | | |
Total expenses after fees waived and/or reimbursed | | | 1.04 | %(e) | | | 1.08 | %(e) | | | 1.08 | %(e) | | | 1.08 | %(e) | | | 1.08 | %(f) |
| | | | | | | | | | | | | | | | | | | | |
Net investment income | | | 0.94 | %(e) | | | 0.82 | %(e) | | | 0.89 | %(e) | | | 1.07 | %(e) | | | 0.95 | %(f) |
| | | | | | | | | | | | | | | | | | | | |
|
Supplemental Data | |
Net assets, end of year (000) | | $ | 2,615 | | | $ | 2,238 | | | $ | 43,611 | | | $ | 74,259 | | | $ | 74,558 | |
| | | | | | | | | | | | | | | | | | | | |
Portfolio turnover rate of the Master Portfolio | | | 3 | % | | | 12 | % | | | 11 | % | | | 4 | % | | | 2 | % |
| | | | | | | | | | | | | | | | | | | | |
| (a) | Based on average shares outstanding. |
| (b) | Distributions for annual periods determined in accordance with U.S. federal income tax regulations. |
| (c) | Where applicable, assumes the reinvestment of distributions |
| (d) | Includes the Fund’s share of the Master Portfolio’s allocated net expenses and/or net investment income. |
| (e) | Includes the Fund’s share of the Master Portfolio’s allocated fees waived of less than 0.01%. |
| (f) | Includes the Fund’s share of the Master Portfolio’s allocated fees waived of 0.01%. |
See notes to financial statements.
Financial Highlights (continued)
(For a share outstanding throughout each period)
| | | | |
| | | iShares
S&P 500 Index
Fund (continued) | |
| |
| | | Class G | |
| | | Period from
07/01/19(a) to 12/31/19 | |
| |
Net asset value, beginning of period | | $ | 351.81 | |
| | | | |
Net investment income(b) | | | 3.41 | |
Net realized and unrealized gain | | | 31.80 | |
| | | | |
Net increase from investment operations | | | 35.21 | |
| | | | |
Distributions from net investment income(c) | | | (4.31 | ) |
| | | | |
| |
Net asset value, end of period | | $ | 382.71 | |
| | | | |
|
Total Return(d) | |
Based on net asset value | | | 10.07 | %(e) |
| | | | |
|
Ratios to Average Net Assets(f) | |
Total expenses | | | 0.01 | %(g)(h) |
| | | | |
Total expenses after fees waived and/or reimbursed | | | 0.01 | %(g)(h) |
| | | | |
Net investment income | | | 1.89 | %(g)(h) |
| | | | |
|
Supplemental Data | |
Net assets, end of period (000) | | $ | 5,796,331 | |
| | | | |
Portfolio turnover rate of the Master Portfolio | | | 3 | % |
| | | | |
| (a) | Commencement of operations. |
| (b) | Based on average shares outstanding. |
| (c) | Distributions for annual periods determined in accordance with U.S. federal income tax regulations. |
| (d) | Where applicable, assumes the reinvestment of distributions. |
| (e) | Aggregate total return. |
| (f) | Includes the Fund’s share of the Master Portfolio’s allocated expenses and/or net investment income. |
| (h) | Includes the Fund’s share of the Master Portfolio’s allocated fees waived of less than 0.01%. |
See notes to financial statements.
| | |
| 14 | | 2019 BLACKROCK ANNUAL REPORTTO SHAREHOLDERS |
Financial Highlights (continued)
(For a share outstanding throughout each period)
| | | | | | | | | | | | | | | | | | | | |
| | | iShares S&P 500 Index Fund (continued) | |
| |
| | | Class K | |
| |
| | | Year Ended December 31, | |
| | | 2019 | | | 2018 | | | 2017 | | | 2016 | | | 2015 | |
| | | | | |
Net asset value, beginning of year | | $ | 297.46 | | | $ | 318.37 | | | $ | 267.08 | | | $ | 244.56 | | | $ | 247.39 | |
| | | | | | | | | | | | | | | | | | | | |
Net investment income(a) | | | 6.74 | | | | 6.29 | | | | 5.69 | | | | 5.32 | | | | 4.97 | |
Net realized and unrealized gain (loss) | | | 86.12 | | | | (19.76 | ) | | | 51.97 | | | | 23.53 | | | | (1.72 | ) |
| | | | | | | | | | | | | | | | | | | | |
Net increase (decrease) from investment operations | | | 92.86 | | | | (13.47 | ) | | | 57.66 | | | | 28.85 | | | | 3.25 | |
| | | | | | | | | | | | | | | | | | | | |
|
Distributions(b) | |
From net investment income | | | (7.60 | ) | | | (6.04 | ) | | | (5.52 | ) | | | (5.25 | ) | | | (4.93 | ) |
From net realized gain | | | — | | | | (1.40 | ) | | | (0.85 | ) | | | (1.08 | ) | | | (1.15 | ) |
| | | | | | | | | | | | | | | | | | | | |
Total distributions | | | (7.60 | ) | | | (7.44 | ) | | | (6.37 | ) | | | (6.33 | ) | | | (6.08 | ) |
| | | | | | | | | | | | | | | | | | | | |
| | | | | |
Net asset value, end of year | | $ | 382.72 | | | $ | 297.46 | | | $ | 318.37 | | | $ | 267.08 | | | $ | 244.56 | |
| | | | | | | | | | | | | | | | | | | | |
|
Total Return(c) | |
Based on net asset value | | | 31.44 | % | | | (4.38 | )% | | | 21.77 | % | | | 11.92 | % | | | 1.35 | % |
| | | | | | | | | | | | | | | | | | | | |
|
Ratios to Average Net Assets(d) | |
Total expenses | | | 0.03 | %(e) | | | 0.04 | %(e) | | | 0.04 | %(e) | | | 0.04 | %(e) | | | 0.04 | %(f) |
| | | | | | | | | | | | | | | | | | | | |
Total expenses after fees waived and/or reimbursed | | | 0.03 | %(e) | | | 0.04 | %(e) | | | 0.04 | %(e) | | | 0.04 | %(e) | | | 0.04 | %(f) |
| | | | | | | | | | | | | | | | | | | | |
Net investment income | | | 1.96 | %(e) | | | 1.92 | %(e) | | | 1.93 | %(e) | | | 2.11 | %(e) | | | 2.00 | %(f) |
| | | | | | | | | | | | | | | | | | | | |
|
Supplemental Data | |
Net assets, end of year (000) | | $ | 8,471,585 | | | $ | 9,375,051 | | | $ | 6,618,222 | | | $ | 2,347,455 | | | $ | 1,145,165 | |
| | | | | | | | | | | | | | | | | | | | |
Portfolio turnover rate of the Master Portfolio | | | 3 | % | | | 12 | % | | | 11 | % | | | 4 | % | | | 2 | % |
| | | | | | | | | | | | | | | | | | | | |
| (a) | Based on average shares outstanding. |
| (b) | Distributions for annual periods determined in accordance with U.S. federal income tax regulations. |
| (c) | Where applicable, assumes the reinvestment of distributions. |
| (d) | Includes the Fund’s share of the Master Portfolio’s allocated net expenses and/or net investment income. |
| (e) | Includes the Fund’s share of the Master Portfolio’s allocated fees waived of less than 0.01%. |
| (f) | Includes the Fund’s share of the Master Portfolio’s allocated fees waived of 0.01%. |
See notes to financial statements.
Financial Highlights (continued)
(For a share outstanding throughout each period)
| | | | | | | | | | | | |
| | | iShares S&P 500 Index Fund (continued) | |
| |
| | | Investor P | |
| | | Year Ended
December 31,
2019 | | | | | | Period from
08/06/18(a) to 12/31/18 | |
| | | | |
Net asset value, beginning of period | | $ | 297.10 | | | | | | | $ | 339.48 | |
| | | | | | | | | | | | |
Net investment income(b) | | | 5.61 | | | | | | | | 2.20 | |
Net realized and unrealized gain (loss) | | | 86.00 | | | | | | | | (40.58 | ) |
| | | | | | | | | | | | |
Net increase (decrease) from investment operations | | | 91.61 | | | | | | | | (38.38 | ) |
| | | | | | | | | | | | |
|
Distributions(c) | |
From net investment income | | | (6.49 | ) | | | | | | | (2.89 | ) |
From net realized gain | | | — | | | | | | | | (1.11 | ) |
| | | | | | | | | | | | |
Total distributions | | | (6.49 | ) | | | | | | | (4.00 | ) |
| | | | | | | | | | | | |
| | | |
Net asset value, end of period | | $ | 382.22 | | | | | | | $ | 297.10 | |
| | | | | | | | | | | | |
| | | |
Total Return(d) | | | | | | | | | | | | |
Based on net asset value | | | 31.02 | % | | | | | | | (11.38 | )%(e) |
| | | | | | | | | | | | |
| | | |
Ratios to Average Net Assets(f) | | | | | | | | | | | | |
Total expenses | | | 0.35 | %(g) | | | | | | | 0.35 | %(g)(h) |
| | | | | | | | | | | | |
Total expenses after fees waived and/or reimbursed | | | 0.35 | %(g) | | | | | | | 0.35 | %(g)(h) |
| | | | | | | | | | | | |
Net investment income | | | 1.62 | %(g) | | | | | | | 1.68 | %(g)(h) |
| | | | | | | | | | | | |
| | | |
Supplemental Data | | | | | | | | | | | | |
Net assets, end of period (000) | | $ | 1,278,339 | | | | | | | $ | 1,064,145 | |
| | | | | | | | | | | | |
Portfolio turnover rate of the Master Portfolio | | | 3 | % | | | | | | | 12 | % |
| | | | | | | | | | | | |
| (a) | Commencement of operations. |
| (b) | Based on average shares outstanding. |
| (c) | Distributions for annual periods determined in accordance with U.S. federal income tax regulations. |
| (d) | Where applicable, excludes the effects of any sales charges and assumes the reinvestment of distributions |
| (e) | Aggregate total return. |
| (f) | Includes the Fund’s share of the Master Portfolio’s allocated expenses and/or net investment income. |
| (g) | Includes the Fund’s share of the Master Portfolio’s allocated fees waived of less than 0.01%. |
See notes to financial statements.
| | |
| 16 | | 2019 BLACKROCK ANNUAL REPORTTO SHAREHOLDERS |
Notes to Financial Statements
BlackRock Funds III (the “Trust”) is registered under the Investment Company Act of 1940, as amended (the “1940 Act”), as anopen-end management investment company. The Trust is organized as a Delaware statutory trust. iShares S&P 500 Index Fund (the “Fund”) is a series of the Trust. The Fund is classified as diversified.
The Fund seeks to achieve its investment objective by investing all of its assets in S&P 500 Index Master Portfolio (the “Master Portfolio”), a series of Master Investment Portfolio (“MIP”). MIP is an affiliate of the Trust, which has the same investment objective and strategies as the Fund. The value of the Fund’s investment in the Master Portfolio reflects the Fund’s proportionate interest in the net assets of the Master Portfolio. The performance of the Fund is directly affected by the performance of the Master Portfolio. At December 31, 2019, the percentage of the Master Portfolio owned by the Fund was 97.0%. The financial statements of the Master Portfolio, including the Schedule of Investments, are included elsewhere in this report and should be read in conjunction with the Fund’s financial statements.
The Fund offers multiple classes of shares. All classes of shares have identical voting, dividend, liquidation and other rights and are subject to the same terms and conditions, except that Service, Investor A, Investor C1 and Investor P Shares bear expenses related to shareholder servicing of such shares, and Investor C1 Shares also bear certain expenses related to the distribution of such shares. Institutional, Service and Class K Shares are sold only to certain eligible investors. Class G Shares are available only to investors on eligible platforms. Investor A Shares are generally available through financial intermediaries. Investor C1 Shares are only available for dividend and capital gain reinvestment by existing shareholders, and for purchase by certain employer-sponsored retirement plans. Investor P Shares are only available through registered representatives of an insurance company’s broker-dealer that has entered into an agreement with the Fund’s distributor to offer such shares. Each class has exclusive voting rights with respect to matters relating to its shareholder servicing and distribution expenditures (except that Investor C1 shareholders may vote on material changes to the Investor A distribution and service plan). The Board of Trustees of the Trust and Board of Trustees of MIP are referred to throughout this report as the “Board of Trustees” or the “Board” and the members are referred to as “Trustees.”
| | | | | | | | |
| Share Class | | Initial Sales Charge | | CDSC | | Conversion Privilege | |
Institutional, Service and Class K Shares | | No | | No | | | None | |
Investor A Shares | | No | | No | | | None | |
Investor C1 Shares | | No | | No | | | To Investor A Shares after approximately 10 years | (a) |
Class G Shares(b) | | No | | No | | | None | |
Investor P Shares | | Yes | | No | | | None | |
| | (a) | Effective on or about the close of business on February 24, 2020, all issued and outstanding Investor C1 shares will be converted into Investor A shares. | |
| | (b) | Class G Shares commenced operations on July 1, 2019. | |
The Fund together with certain other registered investment companies advised by BlackRock Fund Advisors (“BFA”) or its affiliates, is included in a complex of equity, multi-asset, index and money market funds referred to as the BlackRock Multi-Asset Complex.
Prior Year Reorganization: The Board and shareholders of the Fund and the Board of State Farm Mutual Fund Trust and shareholders of State Farm S&P 500 Index Fund (the “Target Fund”) approved the reorganization of the Target Fund into the Fund. As a result, the Fund acquired substantially all of the assets and assumed substantially all of the liabilities of the Target Fund in exchange for an equal aggregate value of newly-issued common shares of the Fund.
Each shareholder of the Target Fund received shares of the Fund in an amount equal to the aggregate net asset value (“NAV”) of such shareholder’s Target Fund
common shares, as determined at the close of business on November 16, 2018.
On November 16, 2018, all of the portfolio securities previously held by the Target Fund were subsequently contributed by the Fund to the Master Portfolio in exchange for an investment in the Master Portfolio.
The reorganization was accomplished by atax-free exchange of shares of the Fund in the following amounts and at the following conversion ratio:
| | | | | | | | |
| Target Fund’s Share Class | | Shares Prior to Reorganization | | Conversion Ratio | | Fund’s Share Class | | Shares of the Fund |
Premier | | 945,941 | | 0.05913686 | | Investor A | | 55,940 |
Premier | | 33,672,747 | | 0.05915653 | | Investor P | | 1,991,963 |
Legacy B | | 59,477 | | 0.05996906 | | Investor A | | 3,567 |
Legacy B | | 388,175 | | 0.05998901 | | Investor P | | 23,286 |
Class A | | 1,599,816 | | 0.05876672 | | Investor A | | 94,016 |
Class A | | 24,662,964 | | 0.05878626 | | Investor P | | 1,449,843 |
Class B | | 22,457 | | 0.05931427 | | Investor A | | 1,332 |
Class B | | 322,358 | | 0.05933400 | | Investor P | | 19,127 |
Institutional | | 13,145,571 | | 0.05930584 | | Institutional | | 779,609 |
Class R1 | | 411,361 | | 0.05908879 | | Investor P | | 24,307 |
Class R2 | | 1,475,390 | | 0.05869339 | | Investor P | | 86,596 |
Class R3 | | 272,729 | | 0.05916651 | | Institutional | | 16,136 |
| | | | |
| NOTESTO FINANCIAL STATEMENTS | | | 17 | |
Notes to Financial Statements (continued)
The Target Fund’s net assets and composition of net assets on November 16, 2018, the valuation date of the reorganization were as follows:
| | | | |
| | | Target Fund | |
Net assets | | $ | 1,483,308,771 | |
Paid-in-capital | | | 736,125,732 | |
Accumulated earnings | | | 747,183,039 | |
For financial reporting purposes, assets received and shares issued by the Fund were recorded at fair value. However, the cost basis of the investments received from the Target Fund was carried forward by the Master Portfolio to align ongoing reporting of the Fund’s realized and unrealized gains and losses with amounts distributable to shareholders for tax purposes.
The net assets of the Fund before the acquisition were $16,246,612,781. The aggregate net assets of the Fund immediately after the acquisition amounted to $17,729,921,552. The Target Fund’s fair value and cost of investments prior to the reorganization were as follows:
| | | | | | | | |
| Target Fund | | Fair Value of
Investments | | | Cost of
Investments | |
State Farm S&P 500 Index Fund | | $ | 1,473,476,973 | | | $ | 726,300,157 | |
The purpose of the transaction was to combine the assets of the Target Fund with the assets of the Fund. The reorganization was atax-free event and was effective on November 19, 2018.
Assuming the acquisition had been completed on January 1, 2018, the beginning of the fiscal reporting period of the Fund, the pro forma results of operations for the year ended December 31, 2018, are as follows:
| | • | | Net investment income: $304,743,581 |
| | • | | Net realized and change in unrealized loss on investments: $(1,178,955,794) |
| | • | | Net decrease in net assets resulting from operations: $(874,212,213) |
Because the combined investment portfolios have been managed as a single integrated portfolio since the acquisition was completed, it is not practicable to separate the amounts of revenue and earnings of the Fund that have been included in the Fund’s Statement of Operations since November 19, 2018.
| 2. | SIGNIFICANT ACCOUNTING POLICIES |
The financial statements are prepared in conformity with accounting principles generally accepted in the United States of America (“U.S. GAAP”), which may require management to make estimates and assumptions that affect the reported amounts of assets and liabilities in the financial statements, disclosure of contingent assets and liabilities at the date of the financial statements and the reported amounts of increases and decreases in net assets from operations during the reporting period. Actual results could differ from those estimates. The Fund is considered an investment company under U.S. GAAP and follows the accounting and reporting guidance applicable to investment companies. Below is a summary of significant accounting policies:
Investment Transactions and Income Recognition:For financial reporting purposes, contributions to and withdrawals from the Master Portfolio are accounted for on a trade date basis. The Fund records its proportionate share of the Master Portfolio’s income, expenses and realized and unrealized gains and losses on a daily basis. Realized and unrealized gains and losses are adjusted utilizing partnership tax allocation rules. In addition, the Fund accrues its own expenses. Income, expenses and realized and unrealized gains and losses are allocated daily to each class based on its relative net assets.
Distributions: Distributions paid by the Fund are recorded on theex-dividend date. The character and timing of distributions are determined in accordance with U.S. federal income tax regulations, which may differ from U.S. GAAP.
Indemnifications:In the normal course of business, the Fund enters into contracts that contain a variety of representations that provide general indemnification. The Fund’s maximum exposure under these arrangements is unknown because it involves future potential claims against the Fund, which cannot be predicted with any certainty.
Other: Expenses directly related to the Fund or its classes are charged to the Fund or the applicable class. Other operating expenses shared by several funds, including other funds managed by BlackRock Advisors, LLC (“BAL” or the “Administrator”), are prorated among those funds on the basis of relative net assets or other appropriate methods. Expenses directly related to the Fund and other shared expenses prorated to the Fund are allocated daily to each class based on its relative net assets or other appropriate methods.
| 3. | INVESTMENT VALUATION AND FAIR VALUE MEASUREMENTS |
Investment Valuation Policies: The Fund’s policy is to value its financial instruments at fair value. The Fund records its investment in the Master Portfolio at fair value based on the Fund’s proportionate interest in the net assets of the Master Portfolio. Valuation of securities held by the Master Portfolio is discussed in Note 3 of the Master Portfolio’s Notes to Financial Statements, which are included elsewhere in this report.
| | |
| 18 | | 2019 BLACKROCK ANNUAL REPORTTO SHAREHOLDERS |
Notes to Financial Statements (continued)
| 4. | ADMINISTRATION AGREEMENT AND OTHER TRANSACTIONS WITH AFFILIATES |
Administration:The Trust, on behalf of the Fund, entered into an Administration Agreement with BAL, which has agreed to provide general administrative services (other than investment advice and related portfolio activities). BAL has agreed to bear all of the Fund’s ordinary operating expenses, excluding, generally, investment advisory fees, distribution fees, brokerage and other expenses related to the execution of portfolio transactions, extraordinary expenses and certain other expenses which are borne by the Fund. BAL is entitled to receive for these administrative services an annual fee based on the average daily net assets of the Fund as follows:
| | | | | | | | | | | | | | | | | | | | | | | | | | | | |
| | | Institutional | | | Service | | | Investor A | | | Investor C1 | | | Class G | | | Class K | | | Investor P | |
Rate | | | 0.09 | % | | | 0.06 | % | | | 0.09 | % | | | 0.09 | % | | | 0.0025 | % | | | 0.02 | % | | | 0.09 | % |
Prior to July 01, 2019, the annual rates as a percentage of average daily net assets, for the Fund were as follows:
| | | | | | | | | | | | | | | | | | | | | | | | |
| | | Institutional | | | Service | | | Investor A | | | Investor C1 | | | Class K | | | Investor P | |
Rate | | | 0.07 | % | | | 0.04 | % | | | 0.07 | % | | | 0.14 | % | | | 0.00 | % | | | 0.07 | % |
From time to time, BAL may waive such fees in whole or in part. Any such waiver will reduce the expenses of the Fund and, accordingly, have a favorable impact on its performance. BAL may delegate certain of its administration duties tosub-administrators.
For the year ended December 31, 2019, the following table shows the class specific administration fees borne directly by each share class of the Fund:
| | | | | | | | | | | | | | | | | | | | | | | | | | | | | | | | | | | | | | | | | | | | | | |
| Institutional | | | | | Service | | | | | Investor A | | | | | Investor C1 | | | | | Class G | | | | | Class K | | | | | Investor P | | | | | | Total | |
| $ | 3,091,691 | | | | | $ | 168,570 | | | | | $ | 2,020,898 | | | | | $ | 2,868 | | | | | $ | 47,353 | | | | | $ | 882,876 | | | | | $ | 953,840 | | | | | | | $ | 7,168,096 | |
Service and Distribution Fees:The Trust, on behalf of the Fund, entered into a Distribution Agreement and a Distribution and Service Plan with BlackRock Investments, LLC (“BRIL”), an affiliate of the Administrator. Pursuant to the Distribution and Service Plan and in accordance with Rule12b-1 under the 1940 Act, the Fund pays BRIL ongoing service and distribution fees. The fees are accrued daily and paid monthly at annual rates based upon the average daily net assets of the relevant share class of the Fund as follows:
| | | | | | | | | | | | | | | | |
| | | Service | | | Investor A | | | Investor C1 | | | Investor P | |
Service Fee | | | 0.15 | % | | | 0.25 | % | | | 0.15 | % | | | 0.25 | % |
Distribution Fee | | | — | | | | — | | | | 0.75 | | | | — | |
BRIL and broker-dealers, pursuant tosub-agreements with BRIL, provide shareholder servicing and distribution services to the Fund. The ongoing service and/or distribution fee compensates/reimburses BRIL and each broker-dealer for providing shareholder servicing and/or distribution related services to shareholders.
For the year ended December 31, 2019, the following table shows the class specific service and distribution fees borne directly by each share class of the Fund:
| | | | | | | | | | | | | | | | | | | | | | | | | | |
| Service | | | | | Investor A | | | | | Investor C1 | | | | | Investor P | | | | | Total | |
| $ | 506,108 | | | | | $ | 6,285,475 | | | | | $ | 22,553 | | | | | $ | 2,970,199 | | | | | $ | 9,784,335 | |
Other Fees:For the year ended December 31, 2019, affiliates earned underwriting discounts, direct commissions and dealer concessions on sales of the Trust’s Investor P Shares, which totaled $83,796.
Expense Waivers and Reimbursements:The fees and expenses of the Trust’s trustees who are not “interested persons” of the Trust, as defined in the 1940 Act (“Independent Trustees”), counsel to the Independent Trustees and the Fund’s independent registered public accounting firm (together, the “independent expenses”) are paid directly by the Fund. Each of BFA and BAL, as applicable, has contractually agreed to reimburse the Fund or provide an offsetting credit against the administration fees paid by the Fund in an amount equal to these independent expenses through April 30, 2021. For the year ended December 31, 2019, the amount waived was $12,189.
Interfund Lending: In accordance with an exemptive order (the “Order”) from the U.S. Securities and Exchange Commission (“SEC”), the Fund may participate in a joint lending and borrowing facility for temporary purposes (the “Interfund Lending Program”), subject to compliance with the terms and conditions of the Order, and to the extent permitted by the Fund’s investment policies and restrictions. The Fund is currently permitted to borrow and lend under the Interfund Lending Program.
A lending BlackRock fund may lend in aggregate up to 15% of its net assets, but may not lend more than 5% of its net assets to any one borrowing fund through the Interfund Lending Program. A borrowing BlackRock fund may not borrow through the Interfund Lending Program or from any other source more than 33 1/3% of its total assets (or any lower threshold provided for by the fund’s investment restrictions). If a borrowing BlackRock fund’s total outstanding borrowings exceed 10% of its total assets, each of its outstanding interfund loans will be subject to collateralization of at least 102% of the outstanding principal value of the loan. All interfund loans are for temporary or emergency purposes and the interest rate to be charged will be the average of the highest current overnight repurchase agreement rate available to a lending fund and the bank loan rate, as calculated according to a formula established by the Board.
During the year ended December 31, 2019, the Fund did not participate in the Interfund Lending Program.
Trustees and Officers:Certain trustees and/or officers of the Trust are directors and/or officers of BlackRock or its affiliates.
| | | | |
| NOTESTO FINANCIAL STATEMENTS | | | 19 | |
Notes to Financial Statements (continued)
It is the Fund’s policy to comply with the requirements of the Internal Revenue Code of 1986, as amended, applicable to regulated investment companies, and to distribute substantially all of its taxable income to its shareholders. Therefore, no U.S. federal income tax provision is required.
The Fund files U.S. federal and various state and local tax returns. No income tax returns are currently under examination. The statute of limitations on the Fund’s U.S. federal tax returns generally remains open for each of the four years ended December 31, 2019. The statutes of limitations on the Fund’s state and local tax returns may remain open for an additional year depending upon the jurisdiction.
Management has analyzed tax laws and regulations and their application to the Fund as of December 31, 2019, inclusive of the open tax return years, and does not believe that there are any uncertain tax positions that require recognition of a tax liability in the Fund’s financial statements.
The tax character of distributions paid was as follows:
| | | | | | | | |
| | | 12/31/19 | | | 12/31/18 | |
Ordinary income | | $ | 415,030,245 | | | $ | 299,133,782 | |
Long-term capital gains | | | — | | | | 56,701,881 | |
| | | | | | | | |
| | $ | 415,030,245 | | | $ | 355,835,663 | |
| | | | | | | | |
As of period end, the tax components of accumulated net earnings were as follows:
| | | | |
Undistributed ordinary income | | $ | 8,724,642 | |
Undistributed long-term capital gains | | | 24,679,900 | |
Capital loss carryforwards | | | — | |
Net unrealized gains (losses)(a) | | | 8,657,488,587 | |
| | | | |
| | $ | 8,690,893,129 | |
| | | | |
| | (a) | The difference between book-basis andtax-basis net unrealized gains (losses) was attributable primarily to the timing and recognition of partnership income. | |
| 6. | CAPITAL SHARE TRANSACTIONS |
Transactions in capital shares for each class were as follows:
| | | | | | | | | | | | | | | | |
| | | Year Ended
December 31, 2019 | | | Year Ended
December 31, 2018 | |
| | | Shares | | | Amount | | | Shares | | | Amount | |
Institutional | | | | | | | | | | | | | | | | |
Shares sold | | | 3,223,244 | | | $ | 1,104,433,015 | | | | 5,441,283 | | | $ | 1,756,690,463 | |
Shares issued in reinvestment of distributions | | | 220,615 | | | | 78,052,535 | | | | 243,283 | | | | 77,875,113 | |
Shares issued in reorganization | | | — | | | | — | | | | 795,745 | | | | 259,853,359 | |
Shares redeemed | | | (5,427,226 | ) | | | (1,853,297,343 | ) | | | (5,469,279 | ) | | | (1,776,447,671 | ) |
| | | | | | | | | | | | | | | | |
Net increase (decrease) | | | (1,983,367 | ) | | $ | (670,811,793 | ) | | | 1,011,032 | | | $ | 317,971,264 | |
| | | | | | | | | | | | | | | | |
| | | | |
Service | | | | | | | | | | | | | | | | |
Shares sold | | | 212,558 | | | $ | 72,901,799 | | | | 360,243 | | | $ | 117,582,960 | |
Shares issued in reinvestment of distributions | | | 18,054 | | | | 6,382,743 | | | | 22,984 | | | | 7,364,222 | |
Shares redeemed | | | (428,101 | ) | | | (147,524,042 | ) | | | (315,533 | ) | | | (102,661,967 | ) |
| | | | | | | | | | | | | | | | |
Net increase (decrease) | | | (197,489 | ) | | $ | (68,239,500 | ) | | | 67,694 | | | $ | 22,285,215 | |
| | | | | | | | | | | | | | | | |
| | |
| | | Year Ended
December 31, 2019 | | | Year Ended
December 31, 2018 | |
| | | | |
Investor A | | | | | | | | | | | | | | | | |
Shares sold and automatic conversion of shares | | | 2,971,948 | | | $ | 1,011,559,996 | | | | 3,365,228 | | | $ | 1,102,301,834 | |
Shares issued in reinvestment of distributions | | | 127,334 | | | | 45,112,382 | | | | 139,032 | | | | 44,491,277 | |
Shares issued in reorganization | | | — | | | | — | | | | 154,855 | | | | 50,538,536 | |
Shares redeemed | | | (3,390,182 | ) | | | (1,164,300,953 | ) | | | (3,533,444 | ) | | | (1,141,702,406 | ) |
| | | | | | | | | | | | | | | | |
Net increase (decrease) | | | (290,900 | ) | | $ | (107,628,575 | ) | | | 125,671 | | | $ | 55,629,241 | |
| | | | | | | | | | | | | | | | |
| | |
| 20 | | 2019 BLACKROCK ANNUAL REPORTTO SHAREHOLDERS |
Notes to Financial Statements (continued)
| | | | | | | | | | | | | | | | |
| | | Year Ended
December 31, 2019 | | | Year Ended
December 31, 2018 | |
| | | Shares | | | Amount | | | Shares | | | Amount | |
| | | | |
Investor C1 | | | | | | | | | | | | | | | | |
Shares sold | | | 15 | | | $ | 5,682 | | | | — | | | $ | — | |
Shares issued in reinvestment of distributions | | | 59 | | | | 21,074 | | | | 866 | | | | 283,335 | |
Shares redeemed and automatic conversion of shares | | | (761 | ) | | | (268,842 | ) | | | (130,191 | ) | | | (43,416,482 | ) |
| | | | | | | | | | | | | | | | |
Net decrease | | | (687 | ) | | $ | (242,086 | ) | | | (129,325 | ) | | $ | (43,133,147 | ) |
| | | | | | | | | | | | | | | | |
| | | |
| | | Period from
07/01/19 (a)
to 12/31/19 | | | | | | | |
| | | | |
Class G | | | | | | | | | | | | | | | | |
Shares sold | | | 15,586,185 | | | $ | 5,355,968,816 | | | | | | | | | |
Shares issued in reinvestment of distributions | | | 164,870 | | | | 60,324,797 | | | | | | | | | |
Shares redeemed | | | (605,458 | ) | | | (222,735,249 | ) | | | | | | | | |
| | | | | | | | | | | | | | | | |
Net increase | | | 15,145,597 | | | $ | 5,193,558,364 | | | | | | | | | |
| | | | | | | | | | | | | | | | |
| | |
| | | Year Ended
December 31, 2019 | | | Year Ended
December 31, 2018 | |
| | | | |
Class K | | | | | | | | | | | | | | | | |
Shares sold | | | 10,010,359 | | | $ | 3,453,144,534 | | | | 15,764,642 | | | $ | 5,135,616,474 | |
Shares issued in reinvestment of distributions | | | 382,884 | | | | 134,229,627 | | | | 625,798 | | | | 200,507,786 | |
Shares redeemed | | | (19,774,859 | ) | | | (6,743,443,728 | ) | | | (5,660,927 | ) | | | (1,857,697,084 | ) |
| | | | | | | | | | | | | | | | |
Net increase (decrease) | | | (9,381,616 | ) | | $ | (3,156,069,567 | ) | | | 10,729,513 | | | $ | 3,478,427,176 | |
| | | | | | | | | | | | | | | | |
| | | |
| | | | | | | | | Period from
08/06/18 (a)
to 12/31/18 | |
| | | | |
Investor P | | | | | | | | | | | | | | | | |
Shares sold | | | 213,019 | | | $ | 73,377,508 | | | | 23,517 | | | $ | 7,319,688 | |
Shares issued in reinvestment of distributions | | | 62,206 | | | | 22,021,815 | | | | 29,882 | | | | 9,201,465 | |
Shares issued in reorganization | | | — | | | | — | | | | 3,595,122 | | | | 1,172,916,876 | |
Shares redeemed | | | (512,490 | ) | | | (176,010,576 | ) | | | (66,741 | ) | | | (20,245,089 | ) |
| | | | | | | | | | | | | | | | |
Net increase (decrease) | | | (237,265 | ) | | | (80,611,253 | ) | | | 3,581,780 | | | | 1,169,192,940 | |
| | | | | | | | | | | | | | | | |
| | | 3,054,273 | | | $ | 1,109,955,590 | | | | 15,386,365 | | | $ | 5,000,372,689 | |
| | | | | | | | | | | | | | | | |
| | (a) | Commencement of operations. | |
As of December 31, 2019, shares owned by BlackRock Financial Management, Inc., an affiliate of the Fund, were as follows:
| | | | |
Class G | | | 143 | |
Investor P | | | 589 | |
Management has evaluated the impact of all subsequent events on the Fund through the date the financial statements were issued and has determined that there were no subsequent events requiring adjustment or additional disclosure in the financial statements.
| | | | |
| NOTESTO FINANCIAL STATEMENTS | | | 21 | |
Report of Independent Registered Public Accounting Firm
To the Board of Trustees of
BlackRock Funds III and Shareholders of iShares S&P 500 Index Fund
Opinion on the Financial Statements
We have audited the accompanying statement of assets and liabilities of iShares S&P 500 Index Fund (one of the series constituting BlackRock Funds III, referred to hereafter as the “Fund”) as of December 31, 2019, the related statement of operations for the year ended December 31, 2019, the statement of changes in net assets for each of the two years in the period ended December 31, 2019, including the related notes, and the financial highlights for each of the periods indicated therein (collectively referred to as the “financial statements”). In our opinion, the financial statements present fairly, in all material respects, the financial position of the Fund as of December 31, 2019, the results of its operations for the year then ended, the changes in its net assets for each of the two years in the period ended December 31, 2019 and the financial highlights for each of the periods indicated therein in conformity with accounting principles generally accepted in the United States of America.
Basis for Opinion
These financial statements are the responsibility of the Fund’s management. Our responsibility is to express an opinion on the Fund’s financial statements based on our audits. We are a public accounting firm registered with the Public Company Accounting Oversight Board (United States) (“PCAOB”) and are required to be independent with respect to the Fund in accordance with the U.S. federal securities laws and the applicable rules and regulations of the Securities and Exchange Commission and the PCAOB.
We conducted our audits of these financial statements in accordance with the standards of the PCAOB. Those standards require that we plan and perform the audit to obtain reasonable assurance about whether the financial statements are free of material misstatement, whether due to error or fraud.
Our audits included performing procedures to assess the risks of material misstatement of the financial statements, whether due to error or fraud, and performing procedures that respond to those risks. Such procedures included examining, on a test basis, evidence regarding the amounts and disclosures in the financial statements. Our audits also included evaluating the accounting principles used and significant estimates made by management, as well as evaluating the overall presentation of the financial statements. Our procedures included confirmation of securities owned as of December 31, 2019 by correspondence with the administrator of the Master Portfolio. We believe that our audits provide a reasonable basis for our opinion.
/s/PricewaterhouseCoopers LLP
Philadelphia, Pennsylvania
February 14, 2020
We have served as the auditor of one or more BlackRock investment companies since 2000.
Important Tax Information (unaudited)
During the fiscal year ended December 31, 2019, the following information is provided with respect to the ordinary income distributions paid by the Fund:
| | | | |
| | | January 2019 — December 2019 | |
Qualified Dividend Income for Individuals(a) | | | 100.00 | % |
Dividends Qualifying for the Dividends Received Deduction for Corporations(a) | | | 97.71 | % |
Federal Obligation Interest(b) | | | 0.59 | % |
Interest-Related Dividends for Non-U.S. Residents(c) | | | 1.13 | % |
| | (a) | The Fund hereby designates the percentage indicated above or the maximum amount allowable by law. | |
| | (b) | The law varies in each state as to whether and what percentage of dividend income attributable to federal obligations is exempt from state income tax. We recommend that you consult your tax advisor to determine if any portion of the dividends you received is exempt from state income taxes. | |
| | (c) | Represents the portion of the taxable ordinary income dividends eligible for exemption from U.S. withholding tax for nonresident aliens and foreign corporations. | |
| | |
| 22 | | 2019 BLACKROCK ANNUAL REPORTTO SHAREHOLDERS |
| | |
| Master Portfolio Information as of December 31, 2019 | | S&P 500 Index Master Portfolio |
TEN LARGEST HOLDINGS
| | | | |
| Security | | Percent of Net Assets | |
Apple, Inc. | | | 5 | % |
Microsoft Corp. | | | 4 | |
Amazon.com, Inc. | | | 3 | |
Facebook, Inc., Class A | | | 2 | |
Berkshire Hathaway, Inc. | | | 2 | |
JPMorgan Chase & Co. | | | 2 | |
Alphabet, Inc., Class A | | | 1 | |
Alphabet, Inc., Class C | | | 1 | |
Johnson & Johnson | | | 1 | |
Visa, Inc. | | | 1 | |
SECTOR ALLOCATION
| | | | |
| Sector | | Percent of Net Assets | |
Information Technology | | | 23 | % |
Health Care | | | 14 | |
Financials | | | 13 | |
Consumer Discretionary | | | 10 | |
Communication Services | | | 10 | |
Industrials | | | 9 | |
Consumer Staples | | | 7 | |
Energy | | | 4 | |
Utilities | | | 3 | |
Real Estate | | | 3 | |
Materials | | | 3 | |
Short-Term Securities | | | 2 | |
Investment Companies | | | — | (a) |
Liabilities in Excess of Other Assets | | | (1 | ) |
| | (a) | Represents less than 1%. | |
For Master Portfolio compliance purposes, the Master Portfolio’s sector classifications refer to one or more of the sectorsub-classifications used by one or more widely recognized market indexes or ratings group indexes, and/or as defined by the investment adviser. These definitions may not apply for purposes of this report, which may combine such sector sub-classifications for reporting ease.
| | | | |
| MASTER PORTFOLIO INFORMATION | | | 23 | |
| | |
Schedule of Investments December 31, 2019 | | S&P 500 Index Master Portfolio (Percentages shown are based on Net Assets) |
| | | | | | | | |
| Security | | Shares | | | Value | |
|
Common Stocks — 98.6% | |
|
| Aerospace & Defense — 2.4% | |
Arconic, Inc. | | | 327,315 | | | $ | 10,071,483 | |
Boeing Co. | | | 457,205 | | | | 148,939,101 | |
General Dynamics Corp. | | | 200,393 | | | | 35,339,305 | |
Huntington Ingalls Industries, Inc. | | | 34,816 | | | | 8,734,638 | |
L3Harris Technologies, Inc. | | | 189,043 | | | | 37,405,938 | |
Lockheed Martin Corp. | | | 212,266 | | | | 82,652,135 | |
Northrop Grumman Corp. | | | 134,032 | | | | 46,102,987 | |
Raytheon Co. | | | 238,140 | | | | 52,328,884 | |
Textron, Inc. | | | 195,208 | | | | 8,706,277 | |
TransDigm Group, Inc. | | | 42,586 | | | | 23,848,160 | |
United Technologies Corp. | | | 693,790 | | | | 103,901,990 | |
| | | | | | | | |
| | | | | | | 558,030,898 | |
|
| Air Freight & Logistics — 0.5% | |
C.H. Robinson Worldwide, Inc. | | | 115,658 | | | | 9,044,455 | |
Expeditors International of Washington, Inc. | | | 145,632 | | | | 11,362,209 | |
FedEx Corp. | | | 205,267 | | | | 31,038,423 | |
United Parcel Service, Inc., Class B | | | 599,247 | | | | 70,147,854 | |
| | | | | | | | |
| | | | | | | 121,592,941 | |
|
| Airlines — 0.4% | |
Alaska Air Group, Inc. | | | 104,278 | | | | 7,064,834 | |
American Airlines Group, Inc. | | | 333,289 | | | | 9,558,729 | |
Delta Air Lines, Inc. | | | 492,223 | | | | 28,785,201 | |
Southwest Airlines Co. | | | 405,266 | | | | 21,876,259 | |
United Airlines Holdings, Inc.(a) | | | 185,099 | | | | 16,305,371 | |
| | | | | | | | |
| | | | | | | 83,590,394 | |
|
| Auto Components — 0.1% | |
Aptiv PLC | | | 218,308 | | | | 20,732,711 | |
BorgWarner, Inc. | | | 176,581 | | | | 7,660,084 | |
| | | | | | | | |
| | | | | | | 28,392,795 | |
|
| Automobiles — 0.3% | |
Ford Motor Co. | | | 3,329,973 | | | | 30,968,749 | |
General Motors Co. | | | 1,075,199 | | | | 39,352,284 | |
Harley-Davidson, Inc. | | | 133,402 | | | | 4,961,220 | |
| | | | | | | | |
| | | | | | | 75,282,253 | |
|
| Banks — 5.6% | |
Bank of America Corp. | | | 6,922,909 | | | | 243,824,855 | |
Citigroup, Inc. | | | 1,866,948 | | | | 149,150,476 | |
Citizens Financial Group, Inc. | | | 374,540 | | | | 15,210,070 | |
Comerica, Inc. | | | 123,273 | | | | 8,844,838 | |
Fifth Third Bancorp | | | 611,953 | | | | 18,811,435 | |
First Republic Bank | | | 144,111 | | | | 16,925,837 | |
Huntington Bancshares, Inc. | | | 884,212 | | | | 13,333,917 | |
JPMorgan Chase & Co. | | | 2,682,150 | | | | 373,891,710 | |
KeyCorp | | | 840,464 | | | | 17,010,991 | |
M&T Bank Corp. | | | 113,343 | | | | 19,239,974 | |
People’s United Financial, Inc. | | | 379,790 | | | | 6,418,451 | |
PNC Financial Services Group, Inc. | | | 374,698 | | | | 59,813,042 | |
Regions Financial Corp. | | | 833,745 | | | | 14,307,064 | |
SVB Financial Group(a)(b) | | | 44,213 | | | | 11,099,232 | |
Truist Financial Corp. | | | 1,146,804 | | | | 64,588,001 | |
U.S. Bancorp | | | 1,215,411 | | | | 72,061,718 | |
Wells Fargo & Co. | | | 3,291,211 | | | | 177,067,152 | |
Zions Bancorp. NA | | | 145,771 | | | | 7,568,430 | |
| | | | | | | | |
| | | | | | | 1,289,167,193 | |
|
| Beverages — 1.8% | |
Brown-Forman Corp., Class B(b) | | | 156,572 | | | | 10,584,267 | |
Coca-Cola Co. | | | 3,297,475 | | | | 182,515,241 | |
Constellation Brands, Inc., Class A | | | 143,235 | | | | 27,178,841 | |
Molson Coors Brewing Co., Class B | | | 161,725 | | | | 8,716,978 | |
| | | | | | | | |
| Security | | Shares | | | Value | |
|
| Beverages (continued) | |
Monster Beverage Corp.(a) | | | 324,637 | | | $ | 20,630,681 | |
PepsiCo, Inc. | | | 1,192,444 | | | | 162,971,322 | |
| | | | | | | | |
| | | | | | | 412,597,330 | |
|
| Biotechnology — 2.0% | |
AbbVie, Inc. | | | 1,264,606 | | | | 111,968,215 | |
Alexion Pharmaceuticals, Inc.(a) | | | 189,913 | | | | 20,539,091 | |
Amgen, Inc. | | | 508,114 | | | | 122,491,042 | |
Biogen, Inc.(a) | | | 154,517 | | | | 45,849,830 | |
Gilead Sciences, Inc. | | | 1,081,883 | | | | 70,300,757 | |
Incyte Corp.(a)(b) | | | 152,882 | | | | 13,349,656 | |
Regeneron Pharmaceuticals, Inc.(a)(b) | | | 68,310 | | | | 25,649,039 | |
Vertex Pharmaceuticals, Inc.(a) | | | 219,901 | | | | 48,147,324 | |
| | | | | | | | |
| | | | | | | 458,294,954 | |
|
| Building Products — 0.3% | |
Allegion PLC | | | 79,458 | | | | 9,895,700 | |
AO Smith Corp. | | | 116,550 | | | | 5,552,442 | |
Fortune Brands Home & Security, Inc. | | | 118,250 | | | | 7,726,455 | |
Johnson Controls International PLC | | | 659,676 | | | | 26,855,410 | |
Masco Corp. | | | 243,172 | | | | 11,669,824 | |
| | | | | | | | |
| | | | | | | 61,699,831 | |
|
| Capital Markets — 2.6% | |
Ameriprise Financial, Inc. | | | 108,343 | | | | 18,047,777 | |
Bank of New York Mellon Corp. | | | 718,627 | | | | 36,168,497 | |
BlackRock, Inc.(e) | | | 100,848 | | | | 50,696,290 | |
Cboe Global Markets, Inc. | | | 95,502 | | | | 11,460,240 | |
Charles Schwab Corp. | | | 979,258 | | | | 46,573,510 | |
CME Group, Inc. | | | 306,451 | | | | 61,510,845 | |
E*Trade Financial Corp. | | | 193,191 | | | | 8,765,076 | |
Franklin Resources, Inc. | | | 241,326 | | | | 6,269,649 | |
Goldman Sachs Group, Inc. | | | 272,516 | | | | 62,659,604 | |
Intercontinental Exchange, Inc. | | | 476,188 | | | | 44,071,199 | |
Invesco Ltd. | | | 327,515 | | | | 5,888,720 | |
MarketAxess Holdings, Inc.(b) | | | 32,431 | | | | 12,294,916 | |
Moody’s Corp. | | | 138,848 | | | | 32,963,904 | |
Morgan Stanley | | | 1,052,280 | | | | 53,792,554 | |
MSCI, Inc. | | | 72,437 | | | | 18,701,785 | |
Nasdaq, Inc. | | | 97,151 | | | | 10,404,872 | |
Northern Trust Corp. | | | 181,190 | | | | 19,249,626 | |
Raymond James Financial, Inc. | | | 105,579 | | | | 9,445,097 | |
S&P Global, Inc. | | | 208,997 | | | | 57,066,631 | |
State Street Corp. | | | 312,123 | | | | 24,688,929 | |
T. Rowe Price Group, Inc. | | | 199,828 | | | | 24,347,043 | |
| | | | | | | | |
| | | | 615,066,764 | |
|
| Chemicals — 1.9% | |
Air Products & Chemicals, Inc. | | | 188,503 | | | | 44,296,320 | |
Albemarle Corp. | | | 90,674 | | | | 6,622,829 | |
Celanese Corp. | | | 103,779 | | | | 12,777,270 | |
CF Industries Holdings, Inc. | | | 183,499 | | | | 8,760,242 | |
Corteva, Inc.(a) | | | 639,991 | | | | 18,918,134 | |
Dow, Inc.(a) | | | 634,087 | | | | 34,703,582 | |
DuPont de Nemours, Inc. | | | 633,497 | | | | 40,670,507 | |
Eastman Chemical Co. | | | 114,764 | | | | 9,096,195 | |
Ecolab, Inc. | | | 214,447 | | | | 41,386,127 | |
FMC Corp. | | | 109,532 | | | | 10,933,484 | |
International Flavors & Fragrances, Inc. | | | 91,710 | | | | 11,832,424 | |
Linde PLC | | | 459,363 | | | | 97,798,383 | |
LyondellBasell Industries NV, Class A | | | 219,538 | | | | 20,741,950 | |
Mosaic Co.(b) | | | 301,320 | | | | 6,520,565 | |
PPG Industries, Inc. | | | 202,210 | | | | 26,993,013 | |
Sherwin-Williams Co. | | | 70,254 | | | | 40,996,019 | |
| | | | | | | | |
| | | | 433,047,044 | |
| | |
| 24 | | 2019 BLACKROCK ANNUAL REPORTTO SHAREHOLDERS |
| | |
Schedule of Investments (continued) December 31, 2019 | | S&P 500 Index Master Portfolio (Percentages shown are based on Net Assets) |
| | | | | | | | |
| Security | | Shares | | | Value | |
|
| Commercial Services & Supplies — 0.4% | |
Cintas Corp.(b) | | | 71,691 | | | $ | 19,290,614 | |
Copart, Inc.(a)(b) | | | 174,928 | | | | 15,907,952 | |
Republic Services, Inc. | | | 180,124 | | | | 16,144,514 | |
Rollins, Inc. | | | 120,824 | | | | 4,006,524 | |
Waste Management, Inc. | | | 333,765 | | | | 38,035,860 | |
| | | | | | | | |
| | | | 93,385,464 | |
|
| Communications Equipment — 1.0% | |
Arista Networks, Inc.(a)(b) | | | 45,858 | | | | 9,327,517 | |
Cisco Systems, Inc. | | | 3,627,750 | | | | 173,986,890 | |
F5 Networks, Inc.(a) | | | 51,988 | | | | 7,260,124 | |
Juniper Networks, Inc. | | | 290,641 | | | | 7,158,488 | |
Motorola Solutions, Inc. | | | 146,517 | | | | 23,609,750 | |
| | | | | | | | |
| | | | 221,342,769 | |
|
| Construction & Engineering — 0.1% | |
Jacobs Engineering Group, Inc. | | | 116,069 | | | | 10,426,478 | |
Quanta Services, Inc. | | | 121,753 | | | | 4,956,565 | |
| | | | | | | | |
| | | | 15,383,043 | |
|
| Construction Materials — 0.1% | |
Martin Marietta Materials, Inc.(b) | | | 53,447 | | | | 14,945,919 | |
Vulcan Materials Co. | | | 113,183 | | | | 16,297,220 | |
| | | | | | | | |
| | | | 31,243,139 | |
|
| Consumer Finance — 0.7% | |
American Express Co. | | | 573,787 | | | | 71,430,744 | |
Capital One Financial Corp. | | | 398,259 | | | | 40,984,834 | |
Discover Financial Services | | | 268,061 | | | | 22,736,934 | |
Synchrony Financial | | | 511,323 | | | | 18,412,741 | |
| | | | | | | | |
| | | | 153,565,253 | |
|
| Containers & Packaging — 0.3% | |
Amcor PLC(a) | | | 1,385,456 | | | | 15,018,343 | |
Avery Dennison Corp. | | | 70,531 | | | | 9,226,865 | |
Ball Corp.(b) | | | 278,130 | | | | 17,986,667 | |
International Paper Co. | | | 335,316 | | | | 15,441,302 | |
Packaging Corp. of America | | | 81,400 | | | | 9,115,986 | |
Sealed Air Corp. | | | 133,968 | | | | 5,335,946 | |
Westrock Co. | | | 221,545 | | | | 9,506,496 | |
| | | | | | | | |
| | | | 81,631,605 | |
|
| Distributors — 0.1% | |
Genuine Parts Co. | | | 124,507 | | | | 13,226,379 | |
LKQ Corp.(a) | | | 263,623 | | | | 9,411,341 | |
| | | | | | | | |
| | | | 22,637,720 | |
|
| Diversified Consumer Services — 0.0% | |
H&R Block, Inc. | | | 171,262 | | | | 4,021,232 | |
| | | | | | | | |
|
| Diversified Financial Services — 1.6% | |
Berkshire Hathaway, Inc., Class B(a)(b) | | | 1,672,696 | | | | 378,865,644 | |
| | | | | | | | |
|
| Diversified Telecommunication Services — 2.0% | |
AT&T, Inc. | | | 6,246,835 | | | | 244,126,312 | |
CenturyLink, Inc. | | | 839,468 | | | | 11,089,372 | |
Verizon Communications, Inc. | | | 3,536,695 | | | | 217,153,073 | |
| | | | | | | | |
| | | | 472,368,757 | |
|
| Electric Utilities — 2.0% | |
Alliant Energy Corp. | | | 205,536 | | | | 11,246,930 | |
American Electric Power Co., Inc. | | | 422,401 | | | | 39,921,119 | |
Duke Energy Corp. | | | 623,429 | | | | 56,862,959 | |
Edison International | | | 306,656 | | | | 23,124,929 | |
Entergy Corp. | | | 170,261 | | | | 20,397,268 | |
Evergy, Inc. | | | 194,890 | | | | 12,685,390 | |
Eversource Energy | | | 276,863 | | | | 23,552,735 | |
Exelon Corp. | | | 831,294 | | | | 37,898,693 | |
FirstEnergy Corp. | | | 462,045 | | | | 22,455,387 | |
| | | | | | | | |
| Security | | Shares | | | Value | |
|
| Electric Utilities (continued) | |
NextEra Energy, Inc. | | | 417,974 | | | $ | 101,216,584 | |
Pinnacle West Capital Corp. | | | 96,814 | | | | 8,706,483 | |
PPL Corp. | | | 618,298 | | | | 22,184,532 | |
Southern Co. | | | 896,820 | | | | 57,127,434 | |
Xcel Energy, Inc. | | | 448,428 | | | | 28,470,694 | |
| | | | | | | | |
| | | | 465,851,137 | |
|
| Electrical Equipment — 0.5% | |
AMETEK, Inc.(b) | | | 195,480 | | | | 19,497,175 | |
Eaton Corp. PLC | | | 354,242 | | | | 33,553,802 | |
Emerson Electric Co. | | | 520,915 | | | | 39,724,978 | |
Rockwell Automation, Inc. | | | 99,131 | | | | 20,090,880 | |
| | | | | | | | |
| | | | 112,866,835 | |
|
| Electronic Equipment, Instruments & Components — 0.6% | |
Amphenol Corp., Class A | | | 253,544 | | | | 27,441,067 | |
CDW Corp. | | | 122,868 | | | | 17,550,465 | |
Corning, Inc. | | | 654,158 | | | | 19,042,539 | |
FLIR Systems, Inc. | | | 113,633 | | | | 5,916,870 | |
IPG Photonics Corp.(a)(b) | | | 29,995 | | | | 4,346,875 | |
Keysight Technologies, Inc.(a)(b) | | | 160,406 | | | | 16,462,468 | |
TE Connectivity Ltd. | | | 286,025 | | | | 27,412,636 | |
Zebra Technologies Corp., Class A(a) | | | 46,110 | | | | 11,778,339 | |
| | | | | | | | |
| | | | | | | 129,951,259 | |
|
| Energy Equipment & Services — 0.4% | |
Baker Hughes Co. | | | 555,732 | | | | 14,243,411 | |
Halliburton Co. | | | 750,650 | | | | 18,368,405 | |
Helmerich & Payne, Inc. | | | 90,592 | | | | 4,115,595 | |
National Oilwell Varco, Inc. | | | 326,024 | | | | 8,166,901 | |
Schlumberger Ltd. | | | 1,183,853 | | | | 47,590,891 | |
TechnipFMC PLC | | | 362,703 | | | | 7,776,352 | |
| | | | | | | | |
| | | | | | | 100,261,555 | |
|
| Entertainment — 0.9% | |
Activision Blizzard, Inc. | | | 656,974 | | | | 39,037,395 | |
Electronic Arts, Inc.(a) | | | 249,684 | | | | 26,843,527 | |
Live Nation Entertainment, Inc.(a) | | | 120,504 | | | | 8,612,421 | |
Netflix, Inc.(a) | | | 374,768 | | | | 121,263,682 | |
Take-Two Interactive Software, Inc.(a) | | | 96,784 | | | | 11,849,265 | |
| | | | | | | | |
| | | | | | | 207,606,290 | |
|
| Equity Real Estate Investment Trusts (REITs) — 2.8% | |
Alexandria Real Estate Equities, Inc. | | | 98,471 | | | | 15,910,944 | |
American Tower Corp. | | | 378,778 | | | | 87,050,760 | |
Apartment Investment & Management Co., Class A | | | 128,731 | | | | 6,648,956 | |
AvalonBay Communities, Inc. | | | 119,431 | | | | 25,044,681 | |
Boston Properties, Inc. | | | 121,980 | | | | 16,816,163 | |
Crown Castle International Corp. | | | 355,542 | | | | 50,540,295 | |
Digital Realty Trust, Inc. | | | 178,486 | | | | 21,371,914 | |
Duke Realty Corp. | | | 314,327 | | | | 10,897,717 | |
Equinix, Inc. | | | 72,926 | | | | 42,566,906 | |
Equity Residential | | | 299,340 | | | | 24,222,593 | |
Essex Property Trust, Inc. | | | 56,510 | | | | 17,001,598 | |
Extra Space Storage, Inc. | | | 110,751 | | | | 11,697,521 | |
Federal Realty Investment Trust | | | 61,405 | | | | 7,904,666 | |
Healthpeak Properties, Inc. | | | 423,257 | | | | 14,589,669 | |
Host Hotels & Resorts, Inc. | | | 607,358 | | | | 11,266,491 | |
Iron Mountain, Inc. | | | 245,549 | | | | 7,825,647 | |
Kimco Realty Corp. | | | 361,070 | | | | 7,477,760 | |
Mid-America Apartment Communities, Inc. | | | 97,543 | | | | 12,862,020 | |
Prologis, Inc. | | | 540,236 | | | | 48,156,637 | |
Public Storage | | | 128,464 | | | | 27,357,693 | |
Realty Income Corp. | | | 278,708 | | | | 20,521,270 | |
Regency Centers Corp. | | | 143,993 | | | | 9,084,518 | |
SBA Communications Corp. | | | 96,290 | | | | 23,204,927 | |
Simon Property Group, Inc. | | | 262,411 | | | | 39,088,742 | |
| | | | |
| SCHEDULE OF INVESTMENTS | | | 25 | |
| | |
Schedule of Investments (continued) December 31, 2019 | | S&P 500 Index Master Portfolio (Percentages shown are based on Net Assets) |
| | | | | | | | |
| Security | | Shares | | | Value | |
|
| Equity Real Estate Investment Trusts (REITs) (continued) | |
SL Green Realty Corp. | | | 70,082 | | | $ | 6,439,134 | |
UDR, Inc. | | | 250,603 | | | | 11,703,160 | |
Ventas, Inc. | | | 318,743 | | | | 18,404,221 | |
Vornado Realty Trust | | | 135,460 | | | | 9,008,090 | |
Welltower, Inc. | | | 346,982 | | | | 28,376,188 | |
Weyerhaeuser Co. | | | 637,205 | | | | 19,243,591 | |
| | | | | | | | |
| | | | | | | 652,284,472 | |
|
| Food & Staples Retailing — 1.5% | |
Costco Wholesale Corp. | | | 377,789 | | | | 111,039,743 | |
Kroger Co. | | | 685,826 | | | | 19,882,096 | |
Sysco Corp. | | | 436,318 | | | | 37,322,642 | |
Walgreens Boots Alliance, Inc. | | | 641,132 | | | | 37,801,142 | |
Walmart, Inc. | | | 1,213,098 | | | | 144,164,566 | |
| | | | | | | | |
| | | | | | | 350,210,189 | |
|
| Food Products — 1.1% | |
Archer-Daniels-Midland Co. | | | 476,047 | | | | 22,064,779 | |
Campbell Soup Co. | | | 143,388 | | | | 7,086,235 | |
Conagra Brands, Inc. | | | 416,160 | | | | 14,249,318 | |
General Mills, Inc. | | | 516,845 | | | | 27,682,218 | |
Hershey Co. | | | 126,825 | | | | 18,640,739 | |
Hormel Foods Corp. | | | 237,784 | | | | 10,726,436 | |
J.M. Smucker Co. | | | 97,733 | | | | 10,176,937 | |
Kellogg Co. | | | 212,930 | | | | 14,726,239 | |
Kraft Heinz Co. | | | 532,578 | | | | 17,111,731 | |
Lamb Weston Holdings, Inc. | | | 124,905 | | | | 10,745,577 | |
McCormick & Co., Inc. | | | 105,670 | | | | 17,935,369 | |
Mondelez International, Inc., Class A | | | 1,231,258 | | | | 67,817,691 | |
Tyson Foods, Inc., Class A | | | 252,425 | | | | 22,980,772 | |
| | | | | | | | |
| | | | | | | 261,944,041 | |
|
| Gas Utilities — 0.0% | |
Atmos Energy Corp. | | | 102,056 | | | | 11,415,984 | |
| | | | | | | | |
|
| Health Care Equipment & Supplies — 3.5% | |
Abbott Laboratories | | | 1,511,382 | | | | 131,278,641 | |
ABIOMED, Inc.(a) | | | 38,162 | | | | 6,510,056 | |
Align Technology, Inc.(a) | | | 60,889 | | | | 16,990,467 | |
Baxter International, Inc. | | | 436,599 | | | | 36,508,408 | |
Becton Dickinson & Co. | | | 231,283 | | | | 62,902,037 | |
Boston Scientific Corp.(a)(b) | | | 1,191,922 | | | | 53,898,713 | |
Cooper Cos., Inc. | | | 42,393 | | | | 13,620,447 | |
Danaher Corp. | | | 534,857 | | | | 82,089,852 | |
DENTSPLY SIRONA, Inc. | | | 191,806 | | | | 10,854,302 | |
Edwards Lifesciences Corp.(a) | | | 178,358 | | | | 41,609,138 | |
Hologic, Inc.(a) | | | 229,303 | | | | 11,971,910 | |
IDEXX Laboratories, Inc.(a) | | | 73,357 | | | | 19,155,713 | |
Intuitive Surgical, Inc.(a) | | | 98,833 | | | | 58,425,128 | |
Medtronic PLC | | | 1,146,218 | | | | 130,038,432 | |
ResMed, Inc. | | | 122,958 | | | | 19,054,801 | |
STERIS PLC | | | 72,502 | | | | 11,050,755 | |
Stryker Corp. | | | 275,343 | | | | 57,805,509 | |
Teleflex, Inc.(b) | | | 39,590 | | | | 14,903,260 | |
Varian Medical Systems, Inc.(a) | | | 77,926 | | | | 11,066,271 | |
Zimmer Biomet Holdings, Inc. | | | 175,890 | | | | 26,327,215 | |
| | | | | | | | |
| | | | | | | 816,061,055 | |
|
| Health Care Providers & Services — 2.8% | |
AmerisourceBergen Corp. | | | 127,499 | | | | 10,839,965 | |
Anthem, Inc. | | | 216,834 | | | | 65,490,373 | |
Cardinal Health, Inc. | | | 249,757 | | | | 12,632,709 | |
Centene Corp.(a) | | | 353,856 | | | | 22,246,927 | |
Cigna Corp.(a) | | | 319,333 | | | | 65,300,405 | |
CVS Health Corp. | | | 1,112,513 | | | | 82,648,591 | |
DaVita, Inc.(a)(b) | | | 76,688 | | | | 5,753,901 | |
HCA Healthcare, Inc. | | | 226,236 | | | | 33,439,943 | |
| | | | | | | | |
| Security | | Shares | | | Value | |
|
| Health Care Providers & Services (continued) | |
Henry Schein, Inc.(a)(b) | | | 124,314 | | | $ | 8,294,230 | |
Humana, Inc. | | | 113,168 | | | | 41,478,335 | |
Laboratory Corp. of America Holdings(a) | | | 83,386 | | | | 14,106,410 | |
McKesson Corp. | | | 154,900 | | | | 21,425,768 | |
Quest Diagnostics, Inc. | | | 115,185 | | | | 12,300,606 | |
UnitedHealth Group, Inc. | | | 810,177 | | | | 238,175,834 | |
Universal Health Services, Inc., Class B | | | 69,185 | | | | 9,925,280 | |
WellCare Health Plans, Inc.(a) | | | 43,014 | | | | 14,203,653 | |
| | | | | | | | |
| | | | | | | 658,262,930 | |
|
| Health Care Technology — 0.1% | |
Cerner Corp. | | | 266,769 | | | | 19,578,177 | |
| | | | | | | | |
|
| Hotels, Restaurants & Leisure — 1.8% | |
Carnival Corp. | | | 342,538 | | | | 17,411,207 | |
Chipotle Mexican Grill, Inc.(a) | | | 21,867 | | | | 18,305,084 | |
Darden Restaurants, Inc. | | | 104,842 | | | | 11,428,826 | |
Hilton Worldwide Holdings, Inc. | | | 241,409 | | | | 26,774,672 | |
Las Vegas Sands Corp. | | | 288,985 | | | | 19,951,524 | |
Marriott International, Inc., Class A | | | 232,050 | | | | 35,139,332 | |
McDonald’s Corp. | | | 644,004 | | | | 127,261,630 | |
MGM Resorts International | | | 436,817 | | | | 14,532,902 | |
Norwegian Cruise Line Holdings Ltd.(a) | | | 182,061 | | | | 10,634,183 | |
Royal Caribbean Cruises Ltd. | | | 146,997 | | | | 19,625,569 | |
Starbucks Corp. | | | 1,009,926 | | | | 88,792,694 | |
Wynn Resorts Ltd. | | | 81,809 | | | | 11,360,816 | |
Yum! Brands, Inc. | | | 258,649 | | | | 26,053,714 | |
| | | | | | | | |
| | | | | | | 427,272,153 | |
|
| Household Durables — 0.4% | |
D.R. Horton, Inc. | | | 286,755 | | | | 15,126,326 | |
Garmin Ltd. | | | 123,550 | | | | 12,053,538 | |
Leggett & Platt, Inc. | | | 110,137 | | | | 5,598,264 | |
Lennar Corp., Class A | | | 238,254 | | | | 13,292,191 | |
Mohawk Industries, Inc.(a)(b) | | | 50,377 | | | | 6,870,415 | |
Newell Brands, Inc. | | | 319,095 | | | | 6,133,006 | |
NVR, Inc.(a) | | | 2,970 | | | | 11,310,978 | |
PulteGroup, Inc. | | | 215,939 | | | | 8,378,433 | |
Whirlpool Corp. | | | 53,219 | | | | 7,851,399 | |
| | | | | | | | |
| | | | | | | 86,614,550 | |
|
| Household Products — 1.7% | |
Church & Dwight Co., Inc. | | | 210,296 | | | | 14,792,221 | |
Clorox Co. | | | 107,323 | | | | 16,478,373 | |
Colgate-Palmolive Co. | | | 732,897 | | | | 50,452,629 | |
Kimberly-Clark Corp. | | | 293,149 | | | | 40,322,645 | |
Procter & Gamble Co. | | | 2,132,571 | | | | 266,358,118 | |
| | | | | | | | |
| | | | | | | 388,403,986 | |
|
| Independent Power and Renewable Electricity Producers — 0.1% | |
AES Corp. | | | 568,095 | | | | 11,305,090 | |
NRG Energy, Inc. | | | 211,937 | | | | 8,424,496 | |
| | | | | | | | |
| | | | | | | 19,729,586 | |
|
| Industrial Conglomerates — 1.3% | |
3M Co. | | | 491,752 | | | | 86,754,888 | |
General Electric Co. | | | 7,468,451 | | | | 83,347,913 | |
Honeywell International, Inc. | | | 611,029 | | | | 108,152,133 | |
Roper Technologies, Inc. | | | 88,985 | | | | 31,521,157 | |
| | | | | | | | |
| | | | 309,776,091 | |
|
| Insurance — 2.3% | |
Aflac, Inc. | | | 627,692 | | | | 33,204,907 | |
Allstate Corp. | | | 275,775 | | | | 31,010,899 | |
American International Group, Inc. | | | 743,935 | | | | 38,186,184 | |
Aon PLC | | | 200,221 | | | | 41,704,032 | |
Arthur J Gallagher & Co. | | | 159,504 | | | | 15,189,566 | |
Assurant, Inc. | | | 52,112 | | | | 6,830,841 | |
| | |
| 26 | | 2019 BLACKROCK ANNUAL REPORTTO SHAREHOLDERS |
| | |
Schedule of Investments (continued) December 31, 2019 | | S&P 500 Index Master Portfolio (Percentages shown are based on Net Assets) |
| | | | | | | | |
| Security | | Shares | | | Value | |
|
| Insurance (continued) | |
Chubb Ltd. | | | 387,553 | | | $ | 60,326,500 | |
Cincinnati Financial Corp. | | | 129,928 | | | | 13,661,929 | |
Everest Re Group Ltd. | | | 34,875 | | | | 9,654,795 | |
Globe Life, Inc. | | | 85,194 | | | | 8,966,668 | |
Hartford Financial Services Group, Inc. | | | 308,212 | | | | 18,730,043 | |
Lincoln National Corp. | | | 169,602 | | | | 10,008,214 | |
Loews Corp.(b) | | | 219,232 | | | | 11,507,488 | |
Marsh & McLennan Cos., Inc. | | | 431,564 | | | | 48,080,545 | |
MetLife, Inc. | | | 666,820 | | | | 33,987,815 | |
Principal Financial Group, Inc. | | | 221,337 | | | | 12,173,535 | |
Progressive Corp. | | | 499,943 | | | | 36,190,874 | |
Prudential Financial, Inc. | | | 343,768 | | | | 32,224,812 | |
Travelers Cos., Inc. | | | 220,724 | | | | 30,228,152 | |
Unum Group | | | 173,973 | | | | 5,073,053 | |
W.R. Berkley Corp. | | | 124,448 | | | | 8,599,357 | |
Willis Towers Watson PLC | | | 109,948 | | | | 22,202,899 | |
| | | | | | | | |
| | | | 527,743,108 | |
|
| Interactive Media & Services — 4.9% | |
Alphabet, Inc., Class A(a) | | | 256,225 | | | | 343,185,203 | |
Alphabet, Inc., Class C(a) | | | 255,594 | | | | 341,734,290 | |
Facebook, Inc., Class A(a) | | | 2,057,879 | | | | 422,379,664 | |
Twitter, Inc.(a) | | | 663,898 | | | | 21,277,931 | |
| | | | | | | | |
| | | | 1,128,577,088 | |
|
| Internet & Direct Marketing Retail — 3.3% | |
Amazon.com, Inc.(a) | | | 356,142 | | | | 658,093,433 | |
Booking Holdings, Inc.(a)(b) | | | 35,793 | | | | 73,509,158 | |
eBay, Inc. | | | 653,941 | | | | 23,613,810 | |
Expedia Group, Inc. | | | 119,502 | | | | 12,922,946 | |
| | | | | | | | |
| | | | | | | 768,139,347 | |
|
| IT Services — 5.3% | |
Accenture PLC, Class A | | | 543,071 | | | | 114,354,460 | |
Akamai Technologies, Inc.(a)(b) | | | 138,211 | | | | 11,938,666 | |
Alliance Data Systems Corp. | | | 34,374 | | | | 3,856,763 | |
Automatic Data Processing, Inc. | | | 370,020 | | | | 63,088,410 | |
Broadridge Financial Solutions, Inc. | | | 98,039 | | | | 12,111,738 | |
Cognizant Technology Solutions Corp., Class A | | | 468,248 | | | | 29,040,741 | |
DXC Technology Co. | | | 220,706 | | | | 8,296,339 | |
Fidelity National Information Services, Inc. | | | 525,572 | | | | 73,101,809 | |
Fiserv, Inc.(a) | | | 488,383 | | | | 56,471,726 | |
FleetCor Technologies, Inc.(a) | | | 74,210 | | | | 21,351,701 | |
Gartner, Inc.(a)(b) | | | 76,998 | | | | 11,865,392 | |
Global Payments, Inc. | | | 257,012 | | | | 46,920,111 | |
International Business Machines Corp. | | | 757,348 | | | | 101,514,926 | |
Jack Henry & Associates, Inc. | | | 65,792 | | | | 9,583,921 | |
Leidos Holdings, Inc. | | | 113,726 | | | | 11,132,638 | |
Mastercard, Inc., Class A | | | 759,138 | | | | 226,671,015 | |
Paychex, Inc. | | | 272,424 | | | | 23,172,385 | |
PayPal Holdings, Inc.(a) | | | 1,004,105 | | | | 108,614,038 | |
VeriSign, Inc.(a) | | | 88,454 | | | | 17,043,317 | |
Visa, Inc., Class A | | | 1,463,870 | | | | 275,061,173 | |
Western Union Co. | | | 355,433 | | | | 9,518,496 | |
| | | | | | | | |
| | | | | | | 1,234,709,765 | |
|
| Leisure Products — 0.0% | |
Hasbro, Inc. | | | 108,821 | | | | 11,492,586 | |
| | | | | | | | |
|
| Life Sciences Tools & Services — 1.0% | |
Agilent Technologies, Inc. | | | 264,640 | | | | 22,576,438 | |
Illumina, Inc.(a) | | | 125,706 | | | | 41,701,709 | |
IQVIA Holdings, Inc.(a) | | | 154,315 | | | | 23,843,211 | |
Mettler-Toledo International, Inc.(a) | | | 20,929 | | | | 16,602,557 | |
PerkinElmer, Inc.(b) | | | 95,779 | | | | 9,300,141 | |
Thermo Fisher Scientific, Inc.(b) | | | 342,905 | | | | 111,399,547 | |
| | | | | | | | |
| Security | | Shares | | | Value | |
|
| Life Sciences Tools & Services (continued) | |
Waters Corp.(a)(b) | | | 55,926 | | | $ | 13,067,110 | |
| | | | | | | | |
| | | | | | | 238,490,713 | |
|
| Machinery — 1.6% | |
Caterpillar, Inc. | | | 472,837 | | | | 69,828,568 | |
Cummins, Inc. | | | 132,183 | | | | 23,655,470 | |
Deere & Co. | | | 269,262 | | | | 46,652,334 | |
Dover Corp. | | | 124,224 | | | | 14,318,058 | |
Flowserve Corp. | | | 112,148 | | | | 5,581,606 | |
Fortive Corp. | | | 252,702 | | | | 19,303,906 | |
IDEX Corp. | | | 65,042 | | | | 11,187,224 | |
Illinois Tool Works, Inc. | | | 250,112 | | | | 44,927,618 | |
Ingersoll-Rand PLC | | | 204,890 | | | | 27,233,979 | |
PACCAR, Inc. | | | 295,772 | | | | 23,395,565 | |
Parker-Hannifin Corp. | | | 109,856 | | | | 22,610,562 | |
Pentair PLC | | | 140,780 | | | | 6,457,579 | |
Snap-on, Inc. | | | 46,909 | | | | 7,946,385 | |
Stanley Black & Decker, Inc. | | | 129,992 | | | | 21,544,874 | |
Westinghouse Air Brake Technologies Corp. | | | 154,199 | | | | 11,996,682 | |
Xylem, Inc. | | | 153,994 | | | | 12,133,187 | |
| | | | | | | | |
| | | | | | | 368,773,597 | |
|
| Media — 2.4% | |
Charter Communications, Inc., Class A(a)(b) | | | 134,078 | | | | 65,038,556 | |
Comcast Corp., Class A | | | 3,882,193 | | | | 174,582,219 | |
Discovery, Inc., Class A(a)(b) | | | 134,754 | | | | 4,411,846 | |
Discovery, Inc., Class C(a)(b) | | | 286,831 | | | | 8,745,477 | |
DISH Network Corp., Class A(a) | | | 218,051 | | | | 7,734,269 | |
Fox Corp., Class A | | | 303,158 | | | | 11,238,067 | |
Fox Corp., Class B(a) | | | 133,124 | | | | 4,845,714 | |
Interpublic Group of Cos., Inc. | | | 327,050 | | | | 7,554,855 | |
News Corp., Class A | | | 332,273 | | | | 4,698,340 | |
News Corp., Class B | | | 95,128 | | | | 1,380,307 | |
Omnicom Group, Inc. | | | 186,192 | | | | 15,085,276 | |
ViacomCBS, Inc., Class B Class B | | | 462,120 | | | | 19,395,176 | |
Walt Disney Co.(b) | | | 1,541,312 | | | | 222,919,955 | |
| | | | | | | | |
| | | | | | | 547,630,057 | |
|
| Metals & Mining — 0.3% | |
Freeport-McMoRan, Inc. | | | 1,240,742 | | | | 16,278,535 | |
Newmont Goldcorp Corp. | | | 701,081 | | | | 30,461,969 | |
Nucor Corp. | | | 259,293 | | | | 14,593,010 | |
| | | | | | | | |
| | | | | | | 61,333,514 | |
|
| Multi-Utilities — 1.0% | |
Ameren Corp. | | | 210,391 | | | | 16,158,029 | |
CenterPoint Energy, Inc. | | | 429,490 | | | | 11,712,192 | |
CMS Energy Corp. | | | 242,726 | | | | 15,252,902 | |
Consolidated Edison, Inc. | | | 284,276 | | | | 25,718,450 | |
Dominion Energy, Inc. | | | 703,864 | | | | 58,294,016 | |
DTE Energy Co. | | | 164,278 | | | | 21,334,784 | |
NiSource, Inc. | | | 321,488 | | | | 8,950,226 | |
Public Service Enterprise Group, Inc. | | | 432,469 | | | | 25,537,294 | |
Sempra Energy | | | 241,062 | | | | 36,516,072 | |
WEC Energy Group, Inc. | | | 269,744 | | | | 24,878,489 | |
| | | | | | | | |
| | | | | | | 244,352,454 | |
|
| Multiline Retail — 0.5% | |
Dollar General Corp. | | | 217,720 | | | | 33,959,966 | |
Dollar Tree, Inc.(a) | | | 202,380 | | | | 19,033,839 | |
Kohl’s Corp. | | | 132,816 | | | | 6,766,975 | |
Macy’s, Inc. | | | 267,347 | | | | 4,544,899 | |
Nordstrom, Inc. | | | 88,174 | | | | 3,608,962 | |
Target Corp. | | | 433,334 | | | | 55,557,752 | |
| | | | | | | | |
| | | | | | | 123,472,393 | |
| | | | |
| SCHEDULE OF INVESTMENTS | | | 27 | |
| | |
Schedule of Investments (continued) December 31, 2019 | | S&P 500 Index Master Portfolio (Percentages shown are based on Net Assets) |
| | | | | | | | |
| Security | | Shares | | | Value | |
|
| Oil, Gas & Consumable Fuels — 3.9% | |
Apache Corp. | | | 317,469 | | | $ | 8,124,032 | |
Cabot Oil & Gas Corp. | | | 349,750 | | | | 6,089,148 | |
Chevron Corp. | | | 1,616,970 | | | | 194,861,055 | |
Cimarex Energy Co. | | | 87,062 | | | | 4,569,884 | |
Concho Resources, Inc. | | | 171,909 | | | | 15,054,071 | |
ConocoPhillips | | | 938,324 | | | | 61,019,210 | |
Devon Energy Corp. | | | 330,941 | | | | 8,594,538 | |
Diamondback Energy, Inc. | | | 136,845 | | | | 12,707,427 | |
EOG Resources, Inc. | | | 497,493 | | | | 41,670,014 | |
Exxon Mobil Corp. | | | 3,618,209 | | | | 252,478,624 | |
Hess Corp. | | | 221,483 | | | | 14,797,279 | |
HollyFrontier Corp. | | | 129,331 | | | | 6,558,375 | |
Kinder Morgan, Inc. | | | 1,665,711 | | | | 35,263,102 | |
Marathon Oil Corp. | | | 684,055 | | | | 9,289,467 | |
Marathon Petroleum Corp. | | | 555,265 | | | | 33,454,716 | |
Noble Energy, Inc. | | | 412,314 | | | | 10,241,880 | |
Occidental Petroleum Corp. | | | 763,916 | | | | 31,480,978 | |
ONEOK, Inc. | | | 353,248 | | | | 26,730,276 | |
Phillips 66 | | | 379,991 | | | | 42,334,797 | |
Pioneer Natural Resources Co. | | | 141,652 | | | | 21,441,863 | |
Valero Energy Corp. | | | 351,168 | | | | 32,886,883 | |
Williams Cos., Inc. | | | 1,036,478 | | | | 24,585,258 | |
| | | | | | | | |
| | | | | | | 894,232,877 | |
|
| Personal Products — 0.2% | |
Coty, Inc., Class A | | | 246,388 | | | | 2,771,865 | |
Estee Lauder Cos., Inc., Class A(b) | | | 190,313 | | | | 39,307,247 | |
| | | | | | | | |
| | | | | | | 42,079,112 | |
|
| Pharmaceuticals — 4.6% | |
Allergan PLC | | | 280,724 | | | | 53,666,007 | |
Bristol-Myers Squibb Co. | | | 2,004,618 | | | | 128,676,429 | |
Eli Lilly & Co. | | | 722,525 | | | | 94,961,461 | |
Johnson & Johnson | | | 2,250,632 | | | | 328,299,690 | |
Merck & Co., Inc. | | | 2,177,186 | | | | 198,015,066 | |
Mylan NV(a) | | | 441,369 | | | | 8,871,517 | |
Perrigo Co. PLC | | | 116,394 | | | | 6,012,914 | |
Pfizer, Inc. | | | 4,732,477 | | | | 185,418,449 | |
Zoetis, Inc. | | | 407,305 | | | | 53,906,817 | |
| | | | | | | | |
| | | | | | | 1,057,828,350 | |
|
| Professional Services — 0.3% | |
Equifax, Inc. | | | 103,544 | | | | 14,508,585 | |
IHS Markit Ltd.(a)(b) | | | 342,903 | | | | 25,837,741 | |
Nielsen Holdings PLC | | | 301,186 | | | | 6,114,076 | |
Robert Half International, Inc. | | | 98,758 | | | | 6,236,568 | |
Verisk Analytics, Inc.(b) | | | 140,133 | | | | 20,927,462 | |
| | | | | | | | |
| | | | | | | 73,624,432 | |
|
| Real Estate Management & Development — 0.1% | |
CBRE Group, Inc., Class A(a) | | | 286,262 | | | | 17,544,998 | |
| | | | | | | | |
|
| Road & Rail — 1.0% | |
CSX Corp. | | | 664,992 | | | | 48,118,821 | |
JB Hunt Transport Services, Inc. | | | 73,282 | | | | 8,557,872 | |
Kansas City Southern | | | 84,265 | | | | 12,906,027 | |
Norfolk Southern Corp. | | | 222,977 | | | | 43,286,525 | |
Old Dominion Freight Line, Inc. | | | 54,811 | | | | 10,402,032 | |
Union Pacific Corp. | | | 593,642 | | | | 107,324,537 | |
| | | | | | | | |
| | | | | | | 230,595,814 | |
|
| Semiconductors & Semiconductor Equipment — 4.2% | |
Advanced Micro Devices, Inc.(a) | | | 952,313 | | | | 43,673,074 | |
Analog Devices, Inc. | | | 314,952 | | | | 37,428,896 | |
Applied Materials, Inc. | | | 789,944 | | | | 48,218,182 | |
Broadcom, Inc. | | | 339,211 | | | | 107,197,460 | |
Intel Corp. | | | 3,719,881 | | | | 222,634,878 | |
KLA Corp. | | | 134,937 | | | | 24,041,725 | |
| | | | | | | | |
| Security | | Shares | | | Value | |
|
| Semiconductors & Semiconductor Equipment (continued) | |
Lam Research Corp. | | | 124,064 | | | $ | 36,276,314 | |
Maxim Integrated Products, Inc. | | | 231,410 | | | | 14,234,029 | |
Microchip Technology, Inc. | | | 204,361 | | | | 21,400,684 | |
Micron Technology, Inc.(a) | | | 946,689 | | | | 50,912,934 | |
NVIDIA Corp. | | | 523,349 | | | | 123,144,020 | |
Qorvo, Inc.(a) | | | 99,482 | | | | 11,562,793 | |
QUALCOMM, Inc. | | | 976,443 | | | | 86,151,566 | |
Skyworks Solutions, Inc. | | | 145,792 | | | | 17,623,337 | |
Texas Instruments, Inc. | | | 799,368 | | | | 102,550,921 | |
Xilinx, Inc. | | | 215,041 | | | | 21,024,558 | |
| | | | | | | | |
| | | | | | | 968,075,371 | |
|
| Software — 7.0% | |
Adobe, Inc.(a) | | | 413,958 | | | | 136,527,488 | |
ANSYS, Inc.(a)(b) | | | 73,184 | | | | 18,838,294 | |
Autodesk, Inc.(a) | | | 188,160 | | | | 34,519,834 | |
Cadence Design Systems, Inc.(a) | | | 239,948 | | | | 16,642,793 | |
Citrix Systems, Inc. | | | 104,676 | | | | 11,608,568 | |
Fortinet, Inc.(a) | | | 121,395 | | | | 12,960,130 | |
Intuit, Inc. | | | 222,600 | | | | 58,305,618 | |
Microsoft Corp. | | | 6,523,736 | | | | 1,028,793,167 | |
NortonLifeLock, Inc. | | | 490,329 | | | | 12,513,196 | |
Oracle Corp. | | | 1,852,639 | | | | 98,152,814 | |
salesforce.com, Inc.(a) | | | 758,514 | | | | 123,364,717 | |
ServiceNow, Inc.(a)(b) | | | 161,280 | | | | 45,532,570 | |
Synopsys, Inc.(a) | | | 128,555 | | | | 17,894,856 | |
| | | | | | | | |
| | | | | | | 1,615,654,045 | |
|
| Specialty Retail — 2.2% | |
Advance Auto Parts, Inc. | | | 59,306 | | | | 9,498,449 | |
AutoZone, Inc.(a) | | | 20,549 | | | | 24,480,229 | |
Best Buy Co., Inc. | | | 194,308 | | | | 17,060,242 | |
CarMax, Inc.(a) | | | 141,009 | | | | 12,362,259 | |
Gap, Inc. | | | 180,058 | | | | 3,183,425 | |
Home Depot, Inc. | | | 932,819 | | | | 203,709,013 | |
L Brands, Inc. | | | 200,125 | | | | 3,626,265 | |
Lowe’s Cos., Inc. | | | 655,447 | | | | 78,496,333 | |
O’Reilly Automotive, Inc.(a)(b) | | | 64,699 | | | | 28,354,984 | |
Ross Stores, Inc. | | | 309,332 | | | | 36,012,432 | |
Tiffany & Co. | | | 92,777 | | | | 12,399,646 | |
TJX Cos., Inc. | | | 1,037,007 | | | | 63,319,647 | |
Tractor Supply Co. | | | 101,563 | | | | 9,490,047 | |
Ulta Salon Cosmetics & Fragrance, Inc.(a)(b) | | | 49,300 | | | | 12,479,802 | |
| | | | | | | | |
| | | | | | | 514,472,773 | |
|
| Technology Hardware, Storage & Peripherals — 4.9% | |
Apple, Inc. | | | 3,571,658 | | | | 1,048,817,372 | |
Hewlett Packard Enterprise Co. | | | 1,097,787 | | | | 17,410,902 | |
HP, Inc. | | | 1,267,251 | | | | 26,042,008 | |
NetApp, Inc. | | | 195,166 | | | | 12,149,083 | |
Seagate Technology PLC | | | 198,698 | | | | 11,822,531 | |
Western Digital Corp. | | | 254,324 | | | | 16,141,944 | |
Xerox Holdings Corp.(a) | | | 160,203 | | | | 5,906,685 | |
| | | | | | | | |
| | | | | | | 1,138,290,525 | |
|
| Textiles, Apparel & Luxury Goods — 0.7% | |
Capri Holdings Ltd.(a)(b) | | | 130,344 | | | | 4,972,623 | |
Hanesbrands, Inc. | | | 313,302 | | | | 4,652,535 | |
NIKE, Inc., Class B | | | 1,065,535 | | | | 107,949,351 | |
PVH Corp.(b) | | | 63,061 | | | | 6,630,864 | |
Ralph Lauren Corp. | | | 42,619 | | | | 4,995,799 | |
Tapestry, Inc. | | | 237,843 | | | | 6,414,626 | |
Under Armour, Inc., Class A(a)(b) | | | 164,871 | | | | 3,561,214 | |
Under Armour, Inc., Class C(a)(b) | | | 169,421 | | | | 3,249,495 | |
VF Corp. | | | 280,049 | | | | 27,909,683 | |
| | | | | | | | |
| | | | | | | 170,336,190 | |
| | |
| 28 | | 2019 BLACKROCK ANNUAL REPORTTO SHAREHOLDERS |
| | |
Schedule of Investments (continued) December 31, 2019 | | S&P 500 Index Master Portfolio (Percentages shown are based on Net Assets) |
| | | | | | | | |
| Security | | Shares | | | Value | |
|
| Tobacco — 0.8% | |
Altria Group, Inc. | | | 1,597,520 | | | $ | 79,732,223 | |
Philip Morris International, Inc. | | | 1,330,499 | | | | 113,212,160 | |
| | | | | | | | |
| | | | 192,944,383 | |
|
| Trading Companies & Distributors — 0.2% | |
Fastenal Co. | | | 490,449 | | | | 18,122,090 | |
United Rentals, Inc.(a)(b) | | | 64,479 | | | | 10,753,163 | |
W.W. Grainger, Inc. | | | 37,030 | | | | 12,535,396 | |
| | | | | | | | |
| | | | 41,410,649 | |
|
| Water Utilities — 0.1% | |
American Water Works Co., Inc. | | | 154,590 | | | | 18,991,381 | |
| | | | | | | | |
|
| Wireless Telecommunication Services — 0.1% | |
T-Mobile U.S., Inc.(a) | | | 270,707 | | | | 21,228,843 | |
| | | | | | | | |
| |
Total Common Stocks — 98.6%
(Cost — $13,108,218,270) | | | | 22,881,321,678 | |
| | | | | | | | |
|
Investment Companies — 0.4% | |
iShares Core S&P 500 ETF(e) | | | 292,674 | | | | 94,603,944 | |
| | | | | | | | |
| |
Total Investment Companies — 0.4%
(Cost — $88,157,092) | | | | 94,603,944 | |
| | | | | | | | |
| |
Total Long-Term Investments — 99.0%
(Cost — $13,196,375,362) | | | | 22,975,925,622 | |
| | | | | | | | |
| | | | | | | | |
| Security | | Shares | | | Value | |
|
Short-Term Securities — 1.5% | |
BlackRock Cash Funds: Institutional,
SL Agency Shares,
1.84%(c)(d)(e) | | | 139,348,114 | | | $ | 139,403,854 | |
BlackRock Cash Funds: Treasury,
SL Agency Shares,
1.52%(d)(e) | | | 215,380,072 | | | | 215,380,072 | |
| | | | | | | | |
| |
Total Short-Term Securities — 1.5%
(Cost — $354,767,438) | | | | 354,783,926 | |
| | | | | | | | |
| |
Total Investments — 100.5%
(Cost — $13,551,142,800) | | | | 23,330,709,548 | |
| |
Liabilities in Excess of Other Assets — (0.5)% | | | | (122,751,203 | ) |
| | | | | | | | |
| |
Net Assets — 100.0% | | | $ | 23,207,958,345 | |
| | | | | | | | |
| (a) | Non-income producing security. |
| (b) | Security, or a portion of the security, is on loan. |
| (c) | All or a portion of the security was purchased with the cash collateral from loaned securities. |
| (d) | Annualized7-day yield as of period end. |
| (e) | During the year ended December 31, 2019, investments in issuers considered to be an affiliate/affiliates of the Master Portfolio for purposes of Section 2(a)(3) of the Investment Company Act of 1940, as amended, and/or related parties of the Master Portfolio were as follows: |
| | | | | | | | | | | | | | | | | | | | | | | | | | | | | | | | |
| Affiliated Persons and/or Related Parties | | Shares
Held at
12/31/18 | | | Shares
Purchased | | | Shares
Sold | | | Shares
Held at
12/31/19 | | | Value at
12/31/19 | | | Income | | | Net Realized Gain (Loss) (a) | | | Change in
Unrealized Appreciation
(Depreciation) | |
BlackRock, Inc. | | | 98,827 | | | | 4,735 | | | | (2,714 | ) | | | 100,848 | | | $ | 50,696,290 | | | $ | 1,290,152 | | | $ | (361,626 | ) | | $ | 11,125,951 | |
BlackRock Cash Funds: Institutional,
SL Agency Shares(b) | | | 118,748,723 | | | | 20,599,391 | | | | — | | | | 139,348,114 | | | | 139,403,854 | | | | 679,409 | (c) | | | 13,818 | | | | 13,652 | |
BlackRock Cash Funds: Treasury,
SL Agency Shares(b) | | | 479,801,017 | | | | — | | | | (264,420,945 | ) | | | 215,380,072 | | | | 215,380,072 | | | | 5,105,161 | | | | — | | | | — | |
iShares Core S&P 500 ETF | | | — | | | | 292,674 | | | | — | | | | 292,674 | | | | 94,603,944 | | | | 647,089 | | | | — | | | | 6,446,852 | |
| | | | | | | | | | | | | | | | | | | | | | | | | | | | | | | | |
| | | | | | | | | | | | | | | | | | $ | 500,084,160 | | | $ | 7,721,811 | | | $ | (347,808 | ) | | $ | 17,586,455 | |
| | | | | | | | | | | | | | | | | | | | | | | | | | | | | | | | |
| | (a) | Includes net capital gain distributions, if applicable. | |
| | (b) | Represents net shares purchased (sold). | |
| | (c) | All or a portion represents securities lending income earned from the reinvestment of cash collateral from loaned securities, net of fees and collateral investment expenses, and other payments to and from borrowers of securities. | |
Derivative Financial Instruments Outstanding as of Period End
Futures Contracts
| | | | | | | | | | | | | | | | |
| Description | | Number of
Contracts | | | Expiration
Date | | | Notional
Amount (000) | | | Value/
Unrealized
Appreciation
(Depreciation) | |
Long Contracts | | | | | | | | | | | | | | | | |
S&P 500E-Mini Index | | | 1,479 | | | | 03/20/20 | | | $ | 238,940 | | | $ | 2,345,486 | |
| | | | | | | | | | | | | | | | |
| | | | |
| SCHEDULE OF INVESTMENTS | | | 29 | |
| | |
Schedule of Investments (continued) December 31, 2019 | | S&P 500 Index Master Portfolio |
Derivative Financial Instruments Categorized by Risk Exposure
As of period end, the fair values of derivative financial instruments located in the Statement of Assets and Liabilities were as follows:
| | | | | | | | | | | | | | | | | | | | | | | | | | | | |
| | | Commodity
Contracts | | | Credit
Contracts | | | Equity
Contracts | | | Foreign
Currency
Exchange
Contracts | | | Interest Rate
Contracts | | | Other
Contracts | | | Total | |
Assets — Derivative Financial Instruments | | | | | | | | | | | | | | | | | | | | | | | | | | | | |
Futures contracts | | | | | | | | | | | | | | | | | | | | | | | | | | | | |
Unrealized appreciation on futures contracts(a) | | $ | — | | | $ | — | | | $ | 2,345,486 | | | $ | — | | | $ | — | | | $ | — | | | $ | 2,345,486 | |
| | | | | | | | | | | | | | | | | | | | | | | | | | | | |
| | (a) | Net cumulative unrealized appreciation (depreciation) on futures contracts, if any, are reported in the Schedule of Investments. In the Statement of Assets and Liabilities, only current day’s variation margin is reported in receivables or payables and the net cumulative unrealized appreciation (depreciation) is included in net unrealized appreciation (depreciation). | |
For the year ended December 31, 2019, the effect of derivative financial instruments in the Statement of Operations was as follows:
| | | | | | | | | | | | | | | | | | | | | | | | | | | | |
| | | Commodity
Contracts | | | Credit
Contracts | | | Equity
Contracts | | | Foreign
Currency
Exchange
Contracts | | | Interest Rate
Contracts | | | Other
Contracts | | | Total | |
Net Realized Gain (Loss) from: | | | | | | | | | | | | | | | | | | | | | | | | | | | | |
Futures contracts | | $ | — | | | $ | — | | | $ | 67,610,011 | | | $ | — | | | $ | — | | | $ | — | | | $ | 67,610,011 | |
| | | | | | | | | | | | | | | | | | | | | | | | | | | | |
| | | | | | | |
| Net Change in Unrealized Appreciation (Depreciation) on: | | | | | | | | | | | | | | | | | | | | | |
Futures contracts | | $ | — | | | $ | — | | | $ | 1,968,163 | | | $ | — | | | $ | — | | | $ | — | | | $ | 1,968,163 | |
| | | | | | | | | | | | | | | | | | | | | | | | | | | | |
Average Quarterly Balances of Outstanding Derivative Financial Instruments
| | | | |
Futures contracts: | |
Average notional value of contracts — long | | $ | 250,138,951 | |
For more information about the Master Portfolio’s investment risks regarding derivative financial instruments, refer to the Notes to Financial Statements.
Fair Value Hierarchy as of Period End
Various inputs are used in determining the fair value of investments and derivative financial instruments. For information about the Master Portfolio’s policy regarding valuation of investments and derivative financial instruments, refer to the Notes to Financial Statements.
The following tables summarize the Master Portfolio’s investments and derivative financial instruments categorized in the disclosure hierarchy:
| | | | | | | | | | | | | | | | |
| | | Level 1 | | | Level 2 | | | Level 3 | | | Total | |
Assets: | |
Investments: | |
Long-Term Investments(a) | | $ | 22,975,925,622 | | | $ | — | | | $ | — | | | $ | 22,975,925,622 | |
Short-Term Securities | | | 354,783,926 | | | | — | | | | — | | | | 354,783,926 | |
| | | | | | | | | | | | | | | | |
| | $ | 23,330,709,548 | | | $ | — | | | $ | — | | | $ | 23,330,709,548 | |
| | | | | | | | | | | | | | | | |
Derivative Financial Instruments(b) | |
Assets: | |
Equity contracts | | $ | 2,345,486 | | | $ | — | | | $ | — | | | $ | 2,345,486 | |
| | | | | | | | | | | | | | | | |
| | (a) | See above Schedule of Investments for values in each industry. | |
| | (b) | Derivative financial instruments are futures contracts. Futures contracts are valued at the unrealized appreciation (depreciation) on the instrument. | |
See notes to financial statements.
| | |
| 30 | | 2019 BLACKROCK ANNUAL REPORTTO SHAREHOLDERS |
Statement of Assets and Liabilities
December 31, 2019
| | | | |
| | | S&P 500 Index
Master Portfolio | |
|
ASSETS | |
Investments at value — unaffiliated (including securities loaned at value of $137,214,328, cost — $13,076,378,623) | | $ | 22,830,625,388 | |
Investments at value — affiliated (cost — $474,764,177) | | | 500,084,160 | |
Cash | | | 270,037 | |
Cash pledged for futures contracts | | | 9,411,800 | |
Receivables: | |
Securities lending income — affiliated | | | 186,784 | |
Dividends — affiliated | | | 459,684 | |
Dividends — unaffiliated | | | 22,795,533 | |
Variation margin on futures contracts | | | 569,390 | |
Prepaid expenses | | | 84,984 | |
| | | | |
Total assets | | | 23,364,487,760 | |
| | | | |
|
LIABILITIES | |
Cash collateral on securities loaned at value | | | 139,392,096 | |
Payables: | |
Investment advisory fees | | | 334,166 | |
Trustees’ fees | | | 82,740 | |
Withdrawals to investors | | | 16,720,413 | |
| | | | |
Total liabilities | | | 156,529,415 | |
| | | | |
| |
NET ASSETS | | $ | 23,207,958,345 | |
| | | | |
|
NET ASSETS CONSIST OF | |
Investors’ capital | | $ | 13,426,046,111 | |
Net unrealized appreciation (depreciation) | | | 9,781,912,234 | |
| | | | |
NET ASSETS | | $ | 23,207,958,345 | |
| | | | |
See notes to financial statements.
Statement of Operations
Year Ended December 31, 2019
| | | | |
| | | S&P 500 Index
Master Portfolio | |
|
INVESTMENT INCOME | |
Dividends — affiliated | | $ | 7,042,402 | |
Dividends — unaffiliated | | | 392,078,121 | |
Securities lending income — affiliated — net | | | 679,409 | |
Foreign taxes withheld | | | (1,515,553 | ) |
| | | | |
Total investment income | | | 398,284,379 | |
| | | | |
|
EXPENSES | |
Investment advisory | | | 4,863,044 | |
Trustees | | | 310,692 | |
Professional | | | 75,099 | |
| | | | |
Total expenses | | | 5,248,835 | |
Less fees waived and/or reimbursed by the Manager | | | (563,865 | ) |
| | | | |
Total expenses after fees waived and/or reimbursed | | | 4,684,970 | |
| | | | |
Net investment income | | | 393,599,409 | |
| | | | |
|
REALIZED AND UNREALIZED GAIN (LOSS) | |
Net realized gain (loss) from: | |
Futures contracts | | | 67,610,011 | |
Investments — affiliated | | | (347,808 | ) |
Investments — unaffiliated | | | (13,455,802 | ) |
| | | | |
| | | 53,806,401 | |
| | | | |
Net change in unrealized appreciation (depreciation) on: | |
Futures contracts | | | 1,968,163 | |
Investments — affiliated | | | 17,586,455 | |
Investments — unaffiliated | | | 4,960,397,272 | |
| | | | |
| | | 4,979,951,890 | |
| | | | |
Net realized and unrealized gain | | | 5,033,758,291 | |
| | | | |
NET INCREASE IN NET ASSETS RESULTING FROM OPERATIONS | | $ | 5,427,357,700 | |
| | | | |
See notes to financial statements.
| | |
| 32 | | 2019 BLACKROCK ANNUAL REPORTTO SHAREHOLDERS |
Statements of Changes in Net Assets
| | | | | | | | |
| | | S&P 500 Index Master Portfolio | |
| | | Year Ended December 31, | |
| | | 2019 | | | 2018 | |
| | |
INCREASE (DECREASE) IN NET ASSETS | | | | | | | | |
| | |
OPERATIONS | | | | | | | | |
Net investment income | | $ | 393,599,409 | | | $ | 308,119,158 | |
Net realized gain | | | 53,806,401 | | | | 68,976,788 | |
Net change in unrealized appreciation (depreciation) | | | 4,979,951,890 | | | | (1,302,602,820 | ) |
| | | | | | | | |
Net increase (decrease) in net assets resulting from operations | | | 5,427,357,700 | | | | (925,506,874 | ) |
| | | | | | | | |
| | |
CAPITAL TRANSACTIONS | | | | | | | | |
Proceeds from contributions | | | 11,063,823,888 | | | | 9,671,286,018 | |
Value of withdrawals | | | (10,540,152,052 | ) | | | (5,263,924,715 | ) |
| | | | | | | | |
Net increase in net assets derived from capital transactions | | | 523,671,836 | | | | 4,407,361,303 | |
| | | | | | | | |
| | |
NET ASSETS | | | | | | | | |
Total increase in net assets | | | 5,951,029,536 | | | | 3,481,854,429 | |
Beginning of year | | | 17,256,928,809 | | | | 13,775,074,380 | |
| | | | | | | | |
End of year | | $ | 23,207,958,345 | | | $ | 17,256,928,809 | |
| | | | | | | | |
See notes to financial statements.
Financial Highlights
(For a share outstanding throughout each period)
| | | | | | | | | | | | | | | | | | | | |
| | | S&P 500 Index Master Portfolio | |
| |
| | | Year Ended December 31, | |
| | | 2019 | | | 2018 | | | 2017 | | | 2016 | | | 2015 | |
| | | | | |
Total Return | | | | | | | | | | | | | | | | | | | | |
Total return | | | 31.44 | % | | | (4.38 | )% | | | 21.77 | % | | | 11.92 | % | | | 1.35 | % |
| | | | | | | | | | | | | | | | | | | | |
| | | | | |
Ratios to Average Net Assets | | | | | | | | | | | | | | | | | | | | |
Total expenses | | | 0.03 | % | | | 0.04 | % | | | 0.04 | % | | | 0.04 | % | | | 0.05 | % |
| | | | | | | | | | | | | | | | | | | | |
Total expenses after fees waived and/or reimbursed | | | 0.02 | % | | | 0.04 | % | | | 0.04 | % | | | 0.04 | % | | | 0.04 | % |
| | | | | | | | | | | | | | | | | | | | |
Net investment income | | | 1.95 | % | | | 1.92 | % | | | 1.93 | % | | | 2.11 | % | | | 2.00 | % |
| | | | | | | | | | | | | | | | | | | | |
| | | | | |
Supplemental Data | | | | | | | | | | | | | | | | | | | | |
Net assets, end of year (000) | | $ | 23,207,958 | | | $ | 17,256,929 | | | $ | 13,775,074 | | | $ | 9,791,759 | | | $ | 7,209,857 | |
| | | | | | | | | | | | | | | | | | | | |
Portfolio turnover rate | | | 3 | % | | | 12 | % | | | 11 | % | | | 4 | % | | | 2 | % |
| | | | | | | | | | | | | | | | | | | | |
See notes to financial statements.
| | |
| 34 | | 2019 BLACKROCK ANNUAL REPORTTO SHAREHOLDERS |
Notes to Financial Statements
Master Investment Portfolio (“MIP”) is registered under the Investment Company Act of 1940, as amended (the “1940 Act”), as anopen-end management investment company. MIP is organized as a Delaware statutory trust. S&P 500 Index Master Portfolio (the “Master Portfolio”) is a series of MIP. The Master Portfolio is classified as diversified.
The Master Portfolio, together with certain other registered investment companies advised by BlackRock Fund Advisors (the “Manager”) or its affiliates, is included in a complex of equity, multi-asset, index and money market funds referred to as the BlackRock Multi-Asset Complex.
Prior Year Reorganization: The Board of BlackRock Funds III and the Board of State Farm Mutual Fund Trust and the shareholders of State Farm S&P 500 Index Fund (the “Target Fund”) approved the reorganization of the Target Fund into iShares S&P 500 Index Fund (the “Fund”), a series of BlackRock Funds III. As a result, the Fund acquired all of the assets and assumed certain stated liabilities of the Target Fund in exchange for an equal aggregate value of newly-issued shares of the Fund.
On November 19, 2018, all of the portfolio securities previously held by the Target Fund were subsequently contributed by the Fund to the Master Portfolio in exchange for an investment in the Master Portfolio.
For financial reporting purposes, assets received and shares issued by the Fund were recorded at fair value. However, the cost basis of the investments received from the Target Fund was carried forward by the Master Portfolio to align ongoing reporting of the Fund’s realized and unrealized gains and losses with amounts distributable to shareholders for tax purposes.
The Target Fund’s fair value and cost of investments prior to the reorganization were as follows:
| | | | | | | | |
| Target Fund | | Fair Value of
Investments | | | Cost of
Investments | |
State Farm S&P 500 Index Fund | | $ | 1,473,476,973 | | | $ | 726,300,157 | |
| 2. | SIGNIFICANT ACCOUNTING POLICIES |
The financial statements are prepared in conformity with accounting principles generally accepted in the United States of America (“U.S. GAAP”), which may require management to make estimates and assumptions that affect the reported amounts of assets and liabilities in the financial statements, disclosure of contingent assets and liabilities at the date of the financial statements and the reported amounts of increases and decreases in net assets from operations during the reporting period. Actual results could differ from those estimates. The Master Portfolio is considered an investment company under U.S. GAAP and follows the accounting and reporting guidance applicable to investment companies. Below is a summary of significant accounting policies:
Investment Transactions and Income Recognition:For financial reporting purposes, investment transactions are recorded on the dates the transactions are executed. Realized gains and losses on investment transactions are determined on the identified cost basis. Dividend income is recorded on theex-dividend date. Dividends from foreign securities where theex-dividend date may have passed are subsequently recorded when the Master Portfolio is informed of theex-dividend date. Under the applicable foreign tax laws, a withholding tax at various rates may be imposed on capital gains, dividends and interest. Upon notification from issuers, a portion of the dividend income received from a real estate investment trust may be redesignated as a reduction of cost of the related investment and/or realized gain.
Segregation and Collateralization:In cases where the Master Portfolio enters into certain investments (e.g., futures contracts) that would be treated as “senior securities” for 1940 Act purposes, the Master Portfolio may segregate or designate on itsbooks and records cash or liquid assets having a market value at least equal to the amount of its future obligations under such investments. Doing so allows the investment to be excluded from treatment as a “senior security.” Furthermore, if required by an exchange or counterparty agreement, the Master Portfolio may be required to deliver/deposit cash and/or securities to/with an exchange, or broker-dealer or custodian as collateral for certain investments or obligations.
Indemnifications:In the normal course of business, the Master Portfolio enters into contracts that contain a variety of representations that provide general indemnification. The Master Portfolio’s maximum exposure under these arrangements is unknown because it involves future potential claims against the Master Portfolio, which cannot be predicted with any certainty.
Other: Expenses directly related to the Master Portfolio are charged to the Master Portfolio. Other operating expenses shared by several funds, including other funds managed by the Manager, are prorated among those funds on the basis of relative net assets or other appropriate methods.
| 3. | INVESTMENT VALUATION AND FAIR VALUE MEASUREMENTS |
Investment Valuation Policies: The Master Portfolio’s investments are valued at fair value (also referred to as “market value” within the financial statements) as of the close of trading on the New York Stock Exchange (“NYSE”) (generally 4:00 p.m., Eastern time). U.S. GAAP defines fair value as the price the Master Portfolio would receive to sell an asset or pay to transfer a liability in an orderly transaction between market participants at the measurement date. The Master Portfolio determines the fair values of its financial instruments using various independent dealers or pricing services under policies approved by the Board of Trustees of MIP (the “Board”). The BlackRock Global Valuation Methodologies Committee (the “Global Valuation Committee”) is the committee formed by management to develop global pricing policies and procedures and to oversee the pricing function for all financial instruments.
Fair Value Inputs and Methodologies: The following methods and inputs are used to establish the fair value of the Master Portfolio’s assets and liabilities:
| | • | | Equity investments traded on a recognized securities exchange are valued at the official closing price each day, if available. For equity investments traded on more than one exchange, the official closing price on the exchange where the stock is primarily traded is used. Equity investments traded on a recognized exchange for which there were no sales on that day may be valued at the last available bid (long positions) or ask (short positions) price. |
| | | | |
| NOTESTO FINANCIAL STATEMENTS | | | 35 | |
Notes to Financial Statements (continued)
| | • | | Investments inopen-end U.S. mutual funds are valued at net asset value (“NAV”) each business day. |
| | • | | Futures contracts traded on exchanges are valued at their last sale price. |
If events (e.g., a company announcement, market volatility or a natural disaster) occur that are expected to materially affect the value of such investments, or in the event that the application of these methods of valuation results in a price for an investment that is deemed not to be representative of the market value of such investment, or if a price is not available, the investment will be valued by the Global Valuation Committee, or its delegate, in accordance with a policy approved by the Board as reflecting fair value (“Fair Valued Investments”). The fair valuation approaches that may be used by the Global Valuation Committee will include market approach, income approach and cost approach. Valuation techniques such as discounted cash flow, use of market comparables and matrix pricing are types of valuation approaches and are typically used in determining fair value. When determining the price for Fair Valued Investments, the Global Valuation Committee, or its delegate, seeks to determine the price that the Master Portfolio might reasonably expect to receive or pay from the current sale or purchase of that asset or liability in anarm’s-length transaction. Fair value determinations shall be based upon all available factors that the Global Valuation Committee, or its delegate, deems relevant and consistent with the principles of fair value measurement. The pricing of all Fair Valued Investments is subsequently reported to the Board or a committee thereof on a quarterly basis.
Fair Value Hierarchy: Various inputs are used in determining the fair value of investments and derivative financial instruments. These inputs to valuation techniques are categorized into a fair value hierarchy consisting of three broad levels for financial statement purposes as follows:
| | • | | Level 1 — Unadjusted price quotations in active markets/exchanges for identical assets or liabilities that the Master Portfolio has the ability to access |
| | • | | Level 2 — Other observable inputs (including, but not limited to, quoted prices for similar assets or liabilities in markets that are active, quoted prices for identical or similar assets or liabilities in markets that are not active, inputs other than quoted prices that are observable for the assets or liabilities (such as interest rates, yield curves, volatilities, prepayment speeds, loss severities, credit risks and default rates) or other market–corroborated inputs) |
| | • | | Level 3 — Unobservable inputs based on the best information available in the circumstances, to the extent observable inputs are not available (including the Global Valuation Committee’s assumptions used in determining the fair value of investments and derivative financial instruments) |
The hierarchy gives the highest priority to unadjusted quoted prices in active markets for identical assets or liabilities (Level 1 measurements) and the lowest priority to unobservable inputs (Level 3 measurements). Accordingly, the degree of judgment exercised in determining fair value is greatest for instruments categorized in Level 3. The inputs used to measure fair value may fall into different levels of the fair value hierarchy. In such cases, for disclosure purposes, the fair value hierarchy classification is determined based on the lowest level input that is significant to the fair value measurement in its entirety. Investments classified within Level 3 have significant unobservable inputs used by the Global Valuation Committee in determining the price for Fair Valued Investments. Level 3 investments include equity or debt issued by privately held companies or funds. There may not be a secondary market, and/or there are a limited number of investors. The categorization of a value determined for investments and derivative financial instruments is based on the pricing transparency of the investments and derivative financial instruments and is not necessarily an indication of the risks associated with investing in those securities.
| 4. | SECURITIES AND OTHER INVESTMENTS |
Securities Lending:The Master Portfolio may lend its securities to approved borrowers, such as brokers, dealers and other financial institutions. The borrower pledges and maintains with the Master Portfolio collateral consisting of cash, an irrevocable letter of credit issued by a bank, or securities issued or guaranteed by the U.S. Government. The initial collateral received by the Master Portfolio is required to have a value of at least 102% of the current value of the loaned securities for securities traded on U.S. exchanges and a value of at least 105% for all other securities. The collateral is maintained thereafter at a value equal to at least 100% of the current market value of the securities on loan. The market value of the loaned securities is determined at the close of each business day of the Master Portfolio and any additional required collateral is delivered to the Master Portfolio, or excess collateral returned by the Master Portfolio, on the next business day. During the term of the loan, the Master Portfolio is entitled to all distributions made on or in respect of the loaned securities, but does not receive interest income on securities received as collateral. Loans of securities are terminable at any time and the borrower, after notice, is required to return borrowed securities within the standard time period for settlement of securities transactions.
The market value of any securities on loan, all of which were classified as common stocks in the Master Portfolio’s Schedule of Investments, and the value of any related collateral are shown separately in the Statement of Assets and Liabilities as a component of investments at value — unaffiliated, and collateral on securities loaned at value, respectively. As of period end, any securities on loan were collateralized by cash and/or U.S. Government obligations. Cash collateral invested by the securities lending agent, BlackRock Institutional Trust Company, N.A. (“BTC”), if any, is disclosed in the Schedule of Investments.
Securities lending transactions are entered into by the Master Portfolio under Master Securities Lending Agreements (each, an “MSLA”), which provide the right, in the event of default (including bankruptcy or insolvency), for thenon-defaulting party to liquidate the collateral and calculate a net exposure to the defaulting party or request additional collateral. In the event that a borrower defaults, the Master Portfolio, as lender, would offset the market value of the collateral received against the market value of the securities loaned. When the value of the collateral is greater than that of the market value of the securities loaned, the lender is left with a net amount payable to the defaulting party. However, bankruptcy or insolvency laws of a particular jurisdiction may impose restrictions on or prohibitions against such a right of offset in the event of an MSLA counterparty’s bankruptcy or insolvency. Under the MSLA, absent an event of default, the borrower can resell orre-pledge the loaned securities, and the Master Portfolio can reinvest cash collateral received in connection with loaned securities. Upon an event of default, the parties’ obligations to return the securities or collateral to the other party are extinguished, and the parties can resell orre-pledge the loaned securities or the collateral received in connection with the loaned securities in order to satisfy the defaulting party’s net payment obligation for all transactions under the MSLA. The defaulting party remains liable for any deficiency.
| | |
| 36 | | 2019 BLACKROCK ANNUAL REPORTTO SHAREHOLDERS |
Notes to Financial Statements (continued)
As of period end, the following table is a summary of the Master Portfolio’s securities lending agreements by counterparty which are subject to offset under an MSLA:
| | | | | | | | | | | | |
| Counterparty | | Securities
Loaned at Value | | | Cash Collateral
Received (a) | | | Net
Amount | |
Bank of America N.A. | | $ | 5,539,671 | | | $ | (5,539,671 | ) | | $ | — | |
Barclays Bank PLC | | | 3,843,919 | | | | (3,843,919 | ) | | | — | |
Barclays Capital, Inc. | | | 50,783 | | | | (50,783 | ) | | | — | |
BMO Capital Markets | | | 202,006 | | | | (202,006 | ) | | | — | |
Citigroup Global Markets, Inc. | | | 53,451,965 | | | | (53,451,965 | ) | | | — | |
Credit Suisse Securities (USA) LLC | | | 7,798,663 | | | | (7,798,663 | ) | | | — | |
Goldman Sachs & Co. | | | 15,789,735 | | | | (15,789,735 | ) | | | — | |
HSBC Bank PLC | | | 1,045,058 | | | | (1,045,058 | ) | | | — | |
JP Morgan Securities LLC | | | 7,983,961 | | | | (7,983,961 | ) | | | — | |
Nomura Securities International, Inc. | | | 174,471 | | | | (174,471 | ) | | | — | |
Scotia Capital (USA), Inc. | | | 772,920 | | | | (772,920 | ) | | | — | |
SG Americas Securities LLC | | | 16,396,672 | | | | (16,396,672 | ) | | | — | |
UBS AG | | | 665,358 | | | | (665,358 | ) | | | — | |
UBS Securities LLC | | | 22,906,558 | | | | (22,906,558 | ) | | | — | |
Wells Fargo Securities LLC | | | 592,588 | | | | (592,588 | ) | | | — | |
| | | | | | | | | | | | |
| | $ | 137,214,328 | | | $ | (137,214,328 | ) | | $ | — | |
| | | | | | | | | | | | |
| | (a) | Collateral received in excess of the market value of securities on loan is not presented in this table. The total cash collateral received by the Master Portfolio is disclosed in the Master Portfolio’s Statement of Assets and Liabilities. | |
The risks of securities lending include the risk that the borrower may not provide additional collateral when required or may not return the securities when due. To mitigate these risks, the Master Portfolio benefits from a borrower default indemnity provided by BlackRock, Inc. (“BlackRock”). BlackRock’s indemnity allows for full replacement of the securities loaned to the extent the collateral received does not cover the value on the securities loaned in the event of borrower default. The Master Portfolio could incur a loss if the value of an investment purchased with cash collateral falls below the market value of loaned securities or if the value of an investment purchased with cash collateral falls below the value of the original cash collateral received. Such losses are borne entirely by the Master Portfolio.
| 5. | DERIVATIVE FINANCIAL INSTRUMENTS |
The Master Portfolio engages in various portfolio investment strategies using derivative contracts both to increase the returns of the Master Portfolio and/or to manage its exposure to certain risks such as credit risk, equity risk, interest rate risk, foreign currency exchange rate risk, commodity price risk or other risks (e.g., inflation risk). Derivative financial instruments categorized by risk exposure are included in the Schedule of Investments. These contracts may be transacted on an exchange orover-the-counter (“OTC”).
Futures Contracts:Futures contracts are purchased or sold to gain exposure to, or manage exposure to, changes in interest rates (interest rate risk) and changes in the value of equity securities (equity risk) or foreign currencies (foreign currency exchange rate risk).
Futures contracts are agreements between the Master Portfolio and a counterparty to buy or sell a specific quantity of an underlying instrument at a specified price and on a specified date. Depending on the terms of a contract, it is settled either through physical delivery of the underlying instrument on the settlement date or by payment of a cash amount on the settlement date. Upon entering into a futures contract, the Master Portfolio is required to deposit initial margin with the broker in the form of cash or securities in an amount that varies depending on a contract’s size and risk profile. The initial margin deposit must then be maintained at an established level over the life of the contract. Amounts pledged, which are considered restricted, are included in cash pledged for futures contracts in the Statement of Assets and Liabilities.
Securities deposited as initial margin are designated in the Schedule of Investments and cash deposited, if any, are shown as cash pledged for futures contracts in the Statement of Assets and Liabilities. Pursuant to the contract, the Master Portfolio agrees to receive from or pay to the broker an amount of cash equal to the daily fluctuation in market value of the contract (“variation margin”). Variation margin is recorded as unrealized appreciation (depreciation) and, if any, shown as variation margin receivable (or payable) on futures contracts in the Statement of Assets and Liabilities. When the contract is closed, a realized gain or loss is recorded in the Statement of Operations equal to the difference between the notional amount of the contract at the time it was opened and the notional amount at the time it was closed. The use of futures contracts involves the risk of an imperfect correlation in the movements in the price of futures contracts and interest, foreign currency exchange rates or underlying assets.
| 6. | INVESTMENT ADVISORY AGREEMENT AND OTHER TRANSACTIONS WITH AFFILIATES |
Investment Advisory: MIP, on behalf of the Master Portfolio, entered into an Investment Advisory Agreement with the Manager, the Master Portfolio’s investment adviser and an indirect, wholly-owned subsidiary of BlackRock, to provide investment advisory services. The Manager is responsible for the management of the Master Portfolio and provides the personnel, facilities, equipment and certain other services necessary to the operations of the Master Portfolio.
For such services, the Master Portfolio pays the Manager a monthly fee at an annual rate equal to 0.01% of the average daily value of the Master Portfolio’s net assets. Prior to July 1, 2019, the Master Portfolio paid the Manager a monthly fee at an annual rate equal to 0.04% of the average daily value of the Master Portfolio’s net assets.
Administration:MIP, on behalf of the Master Portfolio, entered into an Administration Agreement with BlackRock Advisors, LLC (“BAL”), which has agreed to provide general administrative services (other than investment advice and related portfolio activities). BAL has agreed to bear all of the Master Portfolio’s ordinary operating expenses, excluding, generally, investment advisory fees, distribution fees, brokerage and other expenses related to the execution of portfolio transactions, extraordinary expenses and certain other expenses which are borne by the Master Portfolio.
| | | | |
| NOTESTO FINANCIAL STATEMENTS | | | 37 | |
Notes to Financial Statements (continued)
BAL is not entitled to compensation for providing administrative services to the Master Portfolio, for so long as BAL (or an affiliate) is entitled to compensation for providing administrative services to corresponding feeder funds that invest substantially all of their assets in the Master Portfolio, or BAL (or an affiliate) receives investment advisory fees from the Master Portfolio.
Expense Waivers and Reimbursements:The fees and expenses of the Master Portfolio’s trustees who are not “interested persons” of MIP, as defined in the 1940 Act (“Independent Trustees”), counsel to the Independent Trustees and the Master Portfolio’s independent registered public accounting firm (together, the “independent expenses”) are paid directly by the Master Portfolio. Each of BFA and BAL, as applicable, has contractually agreed to reimburse the Master Portfolio or provide an offsetting credit against the administration fees paid by the Master Portfolio in an amount equal to these independent expenses through April 30, 2021. For the year ended December 31, 2019, the amount waived and/or reimbursed was $385,791.
The Manager voluntarily agreed to waive its investment advisory fees by the amount of investment advisory fees the Master Portfolio pays to the Manager indirectly through its investment in affiliated money market funds (the “affiliated money market fund waiver”). This amount is included in fees waived and/or reimbursed by the Manager in the Statement of Operations. For the year ended December 31, 2019, the amount waived was $175,916.
The Manager has contractually agreed to waive its investment advisory fee with respect to any portion of the Master Portfolio’s assets invested in affiliated equity and fixed-income mutual funds and affiliated exchange-traded funds that have a contractual management fee through April 30, 2021. The contractual agreement may be terminated upon 90 days’ notice by a majority of the Independent Trustees of MIP, or by a vote of a majority of the outstanding voting securities of the Master Portfolio. This amount is included in fees waived and/or reimbursed by the Manager in the Statement of Operations. For the year ended December 31, 2019, the Manager waived $2,158 in investment advisory fees pursuant to this arrangement.
Securities Lending:The U.S. Securities and Exchange Commission (“SEC”) has issued an exemptive order which permits BTC, an affiliate of the Manager, to serve as securities lending agent for the Master Portfolio, subject to applicable conditions. As securities lending agent, BTC bears all operational costs directly related to securities lending. The Master Portfolio is responsible for fees in connection with the investment of cash collateral received for securities on loan (the “collateral investment fees”). The cash collateral is invested in a money market fund managed by the Manager or its affiliates. However, BTC has agreed to reduce the amount of securities lending income it receives in order to effectively limit the collateral investment fees the Master Portfolio bears to an annual rate of 0.04%. The shares of such money market fund will not be subject to a sales load, distribution fee or service fee. The money market fund in which the cash collateral has been invested may, under certain circumstances, impose a liquidity fee of up to 2% of the value redeemed or temporarily restrict redemptions for up to 10 business days during a 90 day period, in the event that the money market fund’s weekly liquid assets fall below certain thresholds.
Securities lending income is equal to the total of income earned from the reinvestment of cash collateral, net of fees and other payments to and from borrowers of securities, and less the collateral investment fees. The Master Portfolio retains a portion of securities lending income and remits a remaining portion to BTC as compensation for its services as securities lending agent.
Pursuant to the current securities lending agreement, the Master Portfolio retains 73.5% of securities lending income (which excludes collateral investment fees), and this amount retained can never be less than 70% of the total of securities lending income plus the collateral investment fees.
In addition, commencing the business day following the date that the aggregate securities lending income earned across the BlackRock Multi-Asset Complex in a calendar year exceeds a specified threshold, the Master Portfolio, pursuant to the securities lending agreement, will retain for the remainder of that calendar year securities lending income in an amount equal to 80% of securities lending income (which excludes collateral investment fees), and this amount retained can never be less than 70% of the total of securities lending income plus the collateral investment fees.
The share of securities lending income earned by the Master Portfolio is shown as securities lending income — affiliated — net in the Statement of Operations. For the year ended December 31, 2019, the Master Portfolio paid BTC $197,708 in total for securities lending agent services.
Interfund Lending: In accordance with an exemptive order (the “Order”) from the SEC, the Master Portfolio may participate in a joint lending and borrowing facility for temporary purposes (the “Interfund Lending Program”), subject to compliance with the terms and conditions of the Order, and to the extent permitted by the Master Portfolio’s investment policies and restrictions. The Master Portfolio is currently permitted to borrow and lend under the Interfund Lending Program.
A lending BlackRock fund may lend in aggregate up to 15% of its net assets, but may not lend more than 5% of its net assets to any one borrowing fund through the Interfund Lending Program. A borrowing BlackRock fund may not borrow through the Interfund Lending Program or from any other source more than 33 1/3% of its total assets (or any lower threshold provided for by the fund’s investment restrictions). If a borrowing BlackRock fund’s total outstanding borrowings exceed 10% of its total assets, each of its outstanding interfund loans will be subject to collateralization of at least 102% of the outstanding principal value of the loan. All interfund loans are for temporary or emergency purposes and the interest rate to be charged will be the average of the highest current overnight repurchase agreement rate available to a lending fund and the bank loan rate, as calculated according to a formula established by the Board.
During the year ended December 31, 2019, the Master Portfolio did not participate in the Interfund Lending Program.
Trustees and Officers:Certain trustees and/or officers of the Master Portfolio are directors and/or officers of BlackRock or its affiliates.
Other Transactions: The Master Portfolio may purchase securities from, or sell securities to, an affiliated fund provided the affiliation is due solely to having a common investment adviser, common officers, or common trustees. For the year ended December 31, 2019, the purchase and sale transactions and any net realized gains (losses) with affiliated funds in compliance with Rule17a-7 under the 1940 Act were as follows:
| | | | | | | | | | | | | | |
| Purchases | | | | | Sales | | | | | Net Realized
Gain (Loss) | |
| $ | 656,292,770 | | | | | $ | 60,145,540 | | | | | $ | (29,208,341 | ) |
| | |
| 38 | | 2019 BLACKROCK ANNUAL REPORTTO SHAREHOLDERS |
Notes to Financial Statements (continued)
For the year ended December 31, 2019, purchases and sales of investments, excluding short-term securities, were $1,567,674,746 and $668,088,798, respectively.
The Master Portfolio is classified as a partnership for U.S. federal income tax purposes. As such, each investor in the Master Portfolio is treated as the owner of its proportionate share of net assets, income, expenses and realized and unrealized gains and losses of the Master Portfolio. Therefore, no U.S. federal income tax provision is required. It is intended that the Master Portfolio’s assets will be managed so an investor in the Master Portfolio can satisfy the requirements of Subchapter M of the Internal Revenue Code of 1986, as amended.
The Master Portfolio files U.S. federal and various state and local tax returns. No income tax returns are currently under examination. The statute of limitations on the Master Portfolio’s U.S. federal tax returns generally remains open for each of the four years ended December 31, 2019. The statutes of limitations on the Master Portfolio’s state and local tax returns may remain open for an additional year depending upon the jurisdiction.
Management has analyzed tax laws and regulations and their application to the Master Portfolio as of December 31, 2019, inclusive of the open tax return years, and does not believe that there are any uncertain tax positions that require recognition of a tax liability in the Master Portfolio’s financial statements.
As of December 31, 2019, gross unrealized appreciation and depreciation for investments and derivatives based on cost for U.S. federal income tax purposes were as follows:
| | | | |
Tax cost | | $ | 13,338,949,197 | |
| | | | |
Gross unrealized appreciation | | $ | 10,452,081,189 | |
Gross unrealized depreciation | | | (460,320,838 | ) |
| | | | |
Net unrealized appreciation | | $ | 9,991,760,351 | |
| | | | |
MIP, on behalf of the Master Portfolio, along with certain other funds managed by the Manager and its affiliates (“Participating Funds”), is a party to a364-day, $2.25 billion credit agreement with a group of lenders. Under this agreement, the Master Portfolio may borrow to fund shareholder redemptions. Excluding commitments designated for certain individual funds, the Participating Funds, including the Master Portfolio, can borrow up to an aggregate commitment amount of $1.75 billion at any time outstanding, subject to asset coverage and other limitations as specified in the agreement. The credit agreement has the following terms: a fee of 0.10% per annum on unused commitment amounts and interest at a rate equal to the higher of(a) one-month LIBOR (but, in any event, not less than 0.00%) on the date the loan is made plus 0.80% per annum or (b) the Fed Funds rate (but, in any event, not less than 0.00%) in effect from time to time plus 0.80% per annum on amounts borrowed. The agreement expires in April 2020 unless extended or renewed. Prior to April 18, 2019, Participating Funds paid an upfront commitment fee of 0.02% on the total commitment amounts, in addition to administration, legal and arrangement fees, which are included in miscellaneous expenses in the Statement of Operations. These fees were allocated among such funds based upon portions of the aggregate commitment available to them and relative net assets of Participating Funds. During the year ended December 31, 2019, the Master Portfolio did not borrow under the credit agreement.
In the normal course of business, the Master Portfolio invests in securities or other instruments and may enter into certain transactions, and such activities subject the Master Portfolio to various risks, including among others, fluctuations in the market (market risk) or failure of an issuer to meet all of its obligations. The value of securities or other instruments may also be affected by various factors, including, without limitation: (i) the general economy; (ii) the overall market as well as local, regional or global political and/or social instability; (iii) regulation, taxation or international tax treaties between various countries; or (iv) currency, interest rate and price fluctuations. The Master Portfolio’s prospectus provides details of the risks to which the Master Portfolio is subject.
The Master Portfolio may be exposed to additional risks when reinvesting cash collateral in money market funds that do not seek to maintain a stable NAV per share of $1.00, which may be subject to redemption gates or liquidity fees under certain circumstances.
Valuation Risk: The market values of equities, such as common stocks and preferred securities or equity related investments, such as futures and options, may decline due to general market conditions which are not specifically related to a particular company. They may also decline due to factors which affect a particular industry or industries. The Master Portfolio may invest in illiquid investments. An illiquid investment is any investment that the Master Portfolio reasonably expects cannot be sold or disposed of in current market conditions in seven calendar days or less without the sale or disposition significantly changing the market value of the investment. The Master Portfolio may experience difficulty in selling illiquid investments in a timely manner at the price that it believes the investments are worth. Prices may fluctuate widely over short or extended periods in response to company, market or economic news. Markets also tend to move in cycles, with periods of rising and falling prices. This volatility may cause the Master Portfolio’s NAV to experience significant increases or decreases over short periods of time. If there is a general decline in the securities and other markets, the NAV of the Master Portfolio may lose value, regardless of the individual results of the securities and other instruments in which the Master Portfolio invests.
Counterparty Credit Risk:The Master Portfolio may be exposed to counterparty credit risk, or the risk that an entity may fail to or be unable to perform on its commitments related to unsettled or open transactions. The Master Portfolio manages counterparty credit risk by entering into transactions only with counterparties that the Manager believes have the financial resources to honor their obligations and by monitoring the financial stability of those counterparties. Financial assets, which
| | | | |
| NOTESTO FINANCIAL STATEMENTS | | | 39 | |
Notes to Financial Statements (continued)
potentially expose the Master Portfolio to market, issuer and counterparty credit risks, consist principally of financial instruments and receivables due from counterparties. The extent of the Master Portfolio’s exposure to market, issuer and counterparty credit risks with respect to these financial assets is approximately their value recorded in the Statement of Assets and Liabilities, less any collateral held by the Master Portfolio.
A derivative contract may suffer amark-to-market loss if the value of the contract decreases due to an unfavorable change in the market rates or values of the underlying instrument. Losses can also occur if the counterparty does not perform under the contract.
With exchange-traded futures, there is less counterparty credit risk to the Master Portfolio since the exchange or clearinghouse, as counterparty to such instruments, guarantees against a possible default. The clearinghouse stands between the buyer and the seller of the contract; therefore, credit risk is limited to failure of the clearinghouse. While offset rights may exist under applicable law, the Master Portfolio does not have a contractual right of offset against a clearing broker or clearinghouse in the event of a default (including the bankruptcy or insolvency). Additionally, credit risk exists in exchange-traded futures with respect to initial and variation margin that is held in a clearing broker’s customer accounts. While clearing brokers are required to segregate customer margin from their own assets, in the event that a clearing broker becomes insolvent or goes into bankruptcy and at that time there is a shortfall in the aggregate amount of margin held by the clearing broker for all its clients, typically the shortfall would be allocated on a pro rata basis across all the clearing broker’s customers, potentially resulting in losses to the Master Portfolio.
Management has evaluated the impact of all subsequent events on the Master Portfolio through the date the financial statements were issued and has determined that there were no subsequent events requiring adjustment or additional disclosure in the financial statements.
| | |
| 40 | | 2019 BLACKROCK ANNUAL REPORTTO SHAREHOLDERS |
| | |
| Report of Independent Registered Public Accounting Firm | | S&P 500 Index Master Portfolio |
To the Board of Trustees of
Master Investment Portfolio and Investors of S&P 500 Index Master Portfolio
Opinion on the Financial Statements
We have audited the accompanying statement of assets and liabilities, including the schedule of investments, of S&P 500 Index Master Portfolio (one of the series constituting Master Investment Portfolio, referred to hereafter as the “Master Portfolio”) as of December 31, 2019, the related statement of operations for the year ended December 31, 2019, the statement of changes in net assets for each of the two years in the period ended December 31, 2019, including the related notes, and the financial highlights for each of the five years in the period ended December 31, 2019 (collectively referred to as the “financial statements”). In our opinion, the financial statements present fairly, in all material respects, the financial position of the Master Portfolio as of December 31, 2019, the results of its operations for the year then ended, the changes in its net assets for each of the two years in the period ended December 31, 2019 and the financial highlights for each of the five years in the period ended December 31, 2019 in conformity with accounting principles generally accepted in the United States of America.
Basis for Opinion
These financial statements are the responsibility of the Master Portfolio’s management. Our responsibility is to express an opinion on the Master Portfolio’s financial statements based on our audits. We are a public accounting firm registered with the Public Company Accounting Oversight Board (United States) (“PCAOB”) and are required to be independent with respect to the Master Portfolio in accordance with the U.S. federal securities laws and the applicable rules and regulations of the Securities and Exchange Commission and the PCAOB.
We conducted our audits of these financial statements in accordance with the standards of the PCAOB. Those standards require that we plan and perform the audit to obtain reasonable assurance about whether the financial statements are free of material misstatement, whether due to error or fraud.
Our audits included performing procedures to assess the risks of material misstatement of the financial statements, whether due to error or fraud, and performing procedures that respond to those risks. Such procedures included examining, on a test basis, evidence regarding the amounts and disclosures in the financial statements. Our audits also included evaluating the accounting principles used and significant estimates made by management, as well as evaluating the overall presentation of the financial statements. Our procedures included confirmation of securities owned as of December 31, 2019 by correspondence with the custodian, transfer agent and brokers. We believe that our audits provide a reasonable basis for our opinion.
/s/PricewaterhouseCoopers LLP
Philadelphia, Pennsylvania
February 14, 2020
We have served as the auditor of one or more BlackRock investment companies since 2000.
| | | | |
| REPORT OF INDEPENDENT REGISTERED PUBLIC ACCOUNTING FIRM | | | 41 | |
Statement Regarding Liquidity Risk Management Program
The Securities and Exchange Commission adopted Rule 22e-4 under the Investment Company Act of 1940, as amended (the “Liquidity Rule”) to promote effective liquidity risk management throughout the open-end investment company industry, thereby reducing the risk that funds will be unable to meet their redemption obligations and mitigating dilution of the interests of fund shareholders.
The Board of Trustees (the “Board”) of BlackRock Funds III and MIP, on behalf of iShares S&P 500 Index Fund, S&P 500 Index Master Portfolio, respectively met on November 12-13, 2019 (the “Meeting”) to review the liquidity risk management program (the “Program”) applicable to the BlackRock open-end funds, excluding money market funds (each, a “Fund”), pursuant to the Liquidity Rule. The Board has appointed BlackRock Advisors, LLC or BlackRock Fund Advisors (“BlackRock”), each an investment adviser to certain Funds, as the program administrator for each Fund’s Program, as applicable. BlackRock has delegated oversight of the Program to the 40 Act Liquidity Risk Management Committee (the “Committee”). At the Meeting, the Committee, on behalf of BlackRock, provided the Board with a report that addressed the operation of the Program and assessed its adequacy and effectiveness of implementation, including the operation of each Fund’s Highly Liquid Investment Minimum (“HLIM”) where applicable, and any material changes to the Program (the “Report”). The Report covered the period from December 1, 2018 through September 30, 2019 (the “Program Reporting Period”).
The Report described the Program’s liquidity classification methodology for categorizing a Fund’s investments (including derivative transactions) into one of four liquidity buckets. It also described BlackRock’s methodology in establishing a Fund’s HLIM and noted that the Committee reviews and ratifies the HLIM assigned to each Fund no less frequently than annually.
The Report noted that the Program complied with the key factors for consideration under the Liquidity Rule for assessing, managing and periodically reviewing a Fund’s liquidity risk, as follows:
A. The Fund’s investment strategy and liquidity of portfolio investments during both normal and reasonably foreseeable stressed conditions: During the Program Reporting Period, the Committee reviewed whether each Fund’s strategy is appropriate for an open-end fund structure with a focus on Funds with more significant and consistent holdings of less liquid and illiquid assets. The Committee also factored a Fund’s concentration into in an issuer the liquidity classification methodology by taking issuer position sizes into account. Where a Fund participated in borrowings for investment purposes (such as tender option bonds and reverse repurchase agreements), such borrowings were factored into the Program’s calculation of a Fund’s liquidity bucketing. Derivative exposure was also considered in such calculation.
B. Short-term and long-term cash flow projections during both normal and reasonably foreseeable stressed conditions: During the Program Reporting Period, the Committee reviewed historical net redemption activity and used this information as a component to establish each Fund’s reasonably anticipated trading size (“RATS”). Each Fund has adopted an in-kind redemption policy which may be utilized to meet larger redemption requests. The Committee may also take into consideration a Fund’s shareholder ownership concentration (which, depending on product type and distribution channel, may or may not be available), a Fund’s distribution channels, and the degree of certainty associated with a Fund’s short-term and long-term cash flow projections.
C. Holdings of cash and cash equivalents, as well as borrowing arrangements: The Committee considered the terms of the credit facility applicable to the Funds, the financial health of the institution providing the facility and the fact that the credit facility is shared among multiple Funds (including that a portion of the aggregate commitment amount is specifically designated for BlackRock Floating Rate Income Portfolio and BlackRock Credit Strategies Income Fund, each a series of BlackRock Funds V). The Committee also considered other types of borrowing available to the Funds, such as the ability to use reverse repurchase agreements and interfund lending, as applicable.
There were no material changes to the Program during the Program Reporting Period. The Report provided to the Board stated that the Committee concluded that based on the operation of the functions, as described in the Report, the Program is operating as intended and is effective in implementing the requirements of the Liquidity Rule.
| | |
| 42 | | 2019 BLACKROCK ANNUAL REPORTTO SHAREHOLDERS |
Trustee and Officer Information
| | | | | | | | |
Independent Trustees (a) |
| | | | | |
Name
Year of Birth (b) | | Position(s) Held
(Length of Service) (c) | | Principal Occupation(s) During Past Five Years | | Number of BlackRock-Advised
Registered Investment Companies
(“RICs”) Consisting of
Investment Portfolios
(“Portfolios”) Overseen | | Public Company and
Other Investment Company
Directorships Held During
Past Five Years |
Mark Stalnecker 1951 | | Chair of the Board (Since 2019) and Trustee (Since 2015) | | Chief Investment Officer, University of Delaware from 1999 to 2013; Trustee and Chair of the Finance and Investment Committees, Winterthur Museum and Country Estate from 2005 to 2016; Member of the Investment Committee, Delaware Public Employees’ Retirement System since 2002; Member of the Investment Committee, Christiana Care Health System from 2009 to 2017; Member of the Investment Committee, Delaware Community Foundation from 2013 to 2014; Director and Chair of the Audit Committee, SEI Private Trust Co. from 2001 to 2014. | | 37 RICs consisting of 177 Portfolios | | None |
Bruce R. Bond 1946 | | Trustee (Since 2019) | | Board Member, Amsphere Limited (software) since 2018; Trustee and Member of the Governance Committee, State Street Research Mutual Funds from 1997 to 2005; Board Member of Governance, Audit and Finance Committee, Avaya Inc. (computer equipment) from 2003 to 2007. | | 37 RICs consisting of 177 Portfolios | | None |
Susan J. Carter 1956 | | Trustee (Since 2016) | | Director, Pacific Pension Institute from 2014 to 2018; Advisory Board Member, Center for Private Equity and Entrepreneurship at Tuck School of Business since 1997; Senior Advisor, Commonfund Capital, Inc. (“CCI”) (investment adviser) in 2015; Chief Executive Officer, CCI from 2013 to 2014; President & Chief Executive Officer, CCI from 1997 to 2013; Advisory Board Member, Girls Who Invest from 2015 to 2018 and Board Member thereof since 2018; Advisory Board Member, Bridges Fund Management since 2016; Trustee, Financial Accounting Foundation since 2017; Practitioner Advisory Board Member, Private Capital Research Institute (“PCRI”) since 2017. | | 37 RICs consisting of 177 Portfolios | | None |
Collette Chilton 1958 | | Trustee (Since 2015) | | Chief Investment Officer, Williams College since 2006; Chief Investment Officer, Lucent Asset Management Corporation from 1998 to 2006. | | 37 RICs consisting of 177 Portfolios | | None |
Neil A. Cotty 1954 | | Trustee (Since 2016) | | Bank of America Corporation from 1996 to 2015, serving in various senior finance leadership roles, including Chief Accounting Officer from 2009 to 2015, Chief Financial Officer of Global Banking, Markets and Wealth Management from 2008 to 2009, Chief Accounting Officer from 2004 to 2008, Chief Financial Officer of Consumer Bank from 2003 to 2004, Chief Financial Officer of Global Corporate Investment Bank from 1999 to 2002. | | 37 RICs consisting of 177 Portfolios | | None |
Lena G. Goldberg 1949 | | Trustee (Since 2019) | | Senior Lecturer, Harvard Business School, since 2008; Director, Charles Stark Draper Laboratory, Inc. since 2013; FMR LLC/Fidelity Investments (financial services) from 1996 to 2008, serving in various senior roles including Executive Vice President — Strategic Corporate Initiatives and Executive Vice President and General Counsel; Partner, Sullivan & Worcester LLP from 1985 to 1996 and Associate thereof from 1979 to 1985. | | 37 RICs consisting of 177 Portfolios | | None |
Robert M. Hernandez 1944 | | Trustee (Since 2019) | | Director, Vice Chairman and Chief Financial Officer of USX Corporation (energy and steel business) from 1991 to 2001; Director andnon-executive Chairman, RTI International Metals, Inc. from 1990 to 2015; Director, TE Connectivity (electronics) from 2006 to 2012. | | 37 RICs consisting of 177 Portfolios | | Chubb Limited (insurance company); Eastman Chemical Company |
| | | | |
| TRUSTEEAND OFFICER INFORMATION | | | 43 | |
Trustee and Officer Information (continued)
| | | | | | | | |
Independent Trustees (a)(continued) |
| | | | | |
Name
Year of Birth (b) | | Position(s) Held
(Length of Service) (c) | | Principal Occupation(s) During Past Five Years | | Number of BlackRock-Advised
Registered Investment Companies
(“RICs”) Consisting of
Investment Portfolios
(“Portfolios”) Overseen | | Public Company and
Other Investment Company
Directorships Held During
Past Five Years |
Henry R. Keizer 1956 | | Trustee (Since 2019) | | Director, Park Indemnity Ltd. (captive insurer) since 2010; Director, MUFG Americas Holdings Corporation and MUFG Union Bank, N.A. (financial and bank holding company) from 2014 to 2016; Director, American Institute of Certified Public Accountants from 2009 to 2011; Director, KPMG LLP (audit, tax and advisory services) from 2004 to 2005 and 2010 to 2012; Director, KPMG International in 2012, Deputy Chairman and Chief Operating Officer thereof from 2010 to 2012 and U.S. Vice Chairman of Audit thereof from 2005 to 2010; Global Head of Audit, KPMGI (consortium of KPMG firms) from 2006 to 2010; Director, YMCA of Greater New York from 2006 to 2010. | | 37 RICs consisting of 177 Portfolios | | Hertz Global Holdings (car rental); Montpelier Re Holdings, Ltd. (publicly held property and casualty reinsurance) from 2013 until 2015; Sealed Air Corp. (packaging); WABCO (commercial vehicle safety systems) |
Cynthia A. Montgomery 1952 | | Trustee (Since 2009) | | Professor, Harvard Business School since 1989. | | 37 RICs consisting of 177 Portfolios | | Newell Rubbermaid, Inc. (manufacturing) |
Donald C. Opatrny 1952 | | Trustee (Since 2019) | | Trustee, Vice Chair, Member of the Executive Committee and Chair of the Investment Committee, Cornell University since 2004; President, Trustee and Member of the Investment Committee, The Aldrich Contemporary Art Museum from 2007 to 2014; Member of the Board and Investment Committee, University School from 2007 to 2018; Member of the Investment Committee, Mellon Foundation from 2009 to 2015; Trustee, Artstor (a Mellon Foundation affiliate) from 2010 to 2015; President and Trustee, the Center for the Arts, Jackson Hole from 2011 to 2018; Director, Athena Capital Advisors LLC (investment management firm) since 2013; Trustee and Chair of the Investment Committee, Community Foundation of Jackson Hole since 2014; Member of Affordable Housing Supply Board of Jackson, Wyoming since 2018; Member, Investment Funds Committee, State of Wyoming since 2017; Trustee, Phoenix Art Museum since 2018. | | 37 RICs consisting of 177 Portfolios | | None |
Joseph P. Platt 1947 | | Trustee (Since 2009) | | General Partner, Thorn Partners, LP (private investments) since 1998; Director, WQED Multi-Media (public broadcastingnot-for-profit) since 2001; Chair, Basic Health International(non-profit) since 2015. | | 37 RICs consisting of 177 Portfolios | | Greenlight Capital Re, Ltd. (reinsurance company); Consol Energy Inc. |
Kenneth L. Urish 1951 | | Trustee (Since 2009) | | Managing Partner, Urish Popeck & Co., LLC (certified public accountants and consultants) since 1976; Past-Chairman of the Professional Ethics Committee of the Pennsylvania Institute of Certified Public Accountants and Committee Member thereof since 2007; Member of External Advisory Board, The Pennsylvania State University Accounting Department since founding in 2001; Principal, UP Strategic Wealth Investment Advisors, LLC since 2013; Trustee, The Holy Family Institute from 2001 to 2010; President and Trustee, Pittsburgh Catholic Publishing Associates from 2003 to 2008; Director,Inter-Tel from 2006 to 2007. | | 37 RICs consisting of 177 Portfolios | | None |
Claire A. Walton 1957 | | Trustee (Since 2016) | | Chief Operating Officer and Chief Financial Officer of Liberty Square Asset Management, LP from 1998 to 2015; General Partner of Neon Liberty Capital Management, LLC since 2003; Director, Boston Hedge Fund Group from 2009 to 2018; Director, Woodstock Ski Runners since 2013; Director, Massachusetts Council on Economic Education from 2013 to 2015. | | 37 RICs consisting of 177 Portfolios | | None |
| | |
| 44 | | 2019 BLACKROCK ANNUAL REPORTTO SHAREHOLDERS |
Trustee and Officer Information (continued)
| | | | | | | | |
Interested Trustees (a)(d) |
| | | | | |
Name
Year of Birth (b) | | Position(s) Held
(Length of Service) (c) | | Principal Occupation(s) During Past Five Years | | Number of BlackRock-Advised
Registered Investment Companies
(“RICs”) Consisting of
Investment Portfolios
(“Portfolios”) Overseen | | Public Company and
Other Investment Company
Directorships Held During
Past Five Years |
Robert Fairbairn 1965 | | Trustee (Since 2018) | | Vice Chairman of BlackRock, Inc. since 2019; Member of BlackRock’s Global Executive and Global Operating Committees;Co-Chair of BlackRock’s Human Capital Committee; Senior Managing Director of BlackRock, Inc. from 2010 to 2019; oversaw BlackRock’s Strategic Partner Program and Strategic Product Management Group from 2012 to 2019; Member of the Board of Managers of BlackRock Investments, LLC from 2011 to 2018; Global Head of BlackRock’s Retail and iShares® businesses from 2012 to 2016. | | 123 RICs consisting of 287 Portfolios | | None |
John M. Perlowski (e) 1964 | | Trustee (Since 2015); President and Chief Executive Officer (Since 2010) | | Managing Director of BlackRock, Inc. since 2009; Head of BlackRock Global Accounting and Product Services since 2009; Advisory Director of Family Resource Network (charitable foundation) since 2009. | | 124 RICs consisting of 288 Portfolios | | None |
(a) The address of each Trustee is c/o BlackRock, Inc., 55 East 52nd Street, New York, New York 10055. (b) Independent Trustees serve until their resignation, retirement, removal or death, or until December 31 of the year in which they turn 75. The Board may determine to extend the terms of Independent Trustees on acase-by-case basis, as appropriate. (c) In connection with the acquisition of Barclays Global Investors by BlackRock, Inc. in December 2009, certain Independent Trustees were elected to the Board. Furthermore, effective January 1, 2019, three BlackRock Fund Complexes were realigned and consolidated into two BlackRock Fund Complexes. As a result, although the chart shows the year that each Independent Trustee joined the Board, certain Independent Trustees first became members of the boards of other BlackRock-advised Funds or legacy BlackRock funds as follows: Bruce R. Bond, 2005; Robert M. Hernandez, 1996; Cynthia A. Montgomery, 1994; Joseph P. Platt, 1999; Kenneth L. Urish, 1999; Lena G. Goldberg, 2016; Henry R. Keizer, 2016; Donald C. Opatrny, 2015. (d) Mr. Fairbairn and Mr. Perlowski are both “interested persons,” as defined in the 1940 Act, of the Trust/MIP based on their positions with BlackRock, Inc. and its affiliates. Mr. Fairbairn and Mr. Perlowski are also board members of the BlackRock Fixed-Income Complex. (e) Mr. Perlowski is also a trustee of the BlackRock Credit Strategies Fund. |
| | | | |
| TRUSTEEAND OFFICER INFORMATION | | | 45 | |
Trustee and Officer Information (continued)
| | | | |
| Officers Who Are Not Trustees (a) |
| | | |
Name
Year of Birth (b) | | Position(s) Held
(Length of Service) | | Principal Occupation(s) During Past Five Years |
Thomas Callahan 1968 | | Vice President (Since 2016) | | Managing Director of BlackRock, Inc. since 2013; Member of the Board of Managers of BlackRock Investments, LLC (principal underwriter) since 2019 and Managing Director thereof since 2017; Head of BlackRock’s Global Cash Management Business since 2016;Co-Head of the Global Cash Management Business from 2014 to 2016; Deputy Head of the Global Cash Management Business from 2013 to 2014; Member of the Cash Management Group Executive Committee since 2013; Chief Executive Officer of NYSE Liffe U.S. from 2008 to 2013. |
Jennifer McGovern 1977 | | Vice President (Since 2014) | | Managing Director of BlackRock, Inc. since 2016; Director of BlackRock, Inc. from 2011 to 2015; Head of Product Development and Oversight for BlackRock’s Strategic Product Management Group since 2019; Head of Product Structure and Oversight for BlackRock’s U.S. Wealth Advisory Group from 2013 to 2019. |
Neal J. Andrews 1966 | | Chief Financial Officer (Since 2009) | | Chief Financial Officer of the iShares® exchange traded funds since 2019; Managing Director of BlackRock, Inc. since 2006. |
Jay M. Fife 1970 | | Treasurer (Since 2009) | | Managing Director of BlackRock, Inc. since 2007. |
Charles Park 1967 | | Chief Compliance Officer (Since 2014) | | Anti-Money Laundering Compliance Officer for certain BlackRock-advised Funds from 2014 to 2015; Chief Compliance Officer of BlackRock Advisors, LLC and the BlackRock-advised Funds in the BlackRock Multi-Asset Complex and the BlackRock Fixed-Income Complex since 2014; Principal of and Chief Compliance Officer for iShares® Delaware Trust Sponsor LLC since 2012 and BlackRock Fund Advisors (“BFA”) since 2006; Chief Compliance Officer for theBFA-advised iShares® exchange traded funds since 2006; Chief Compliance Officer for BlackRock Asset Management International Inc. since 2012. |
Lisa Belle 1968 | | Anti-Money Laundering Compliance Officer (Since 2019) | | Managing Director of BlackRock, Inc. since 2019; Global Financial Crime Head for Asset and Wealth Management of JP Morgan from 2013 to 2019; Managing Director of RBS Securities from 2012 to 2013; Head of Financial Crimes for Barclays Wealth Americas from 2010 to 2012. |
Janey Ahn 1975 | | Secretary (Since 2019) | | Managing Director of BlackRock, Inc. since 2018; Director of BlackRock, Inc. from 2009 to 2017. |
(a) The address of each Officer is c/o BlackRock, Inc., 55 East 52nd Street, New York, New York 10055. (b) Officers of the Trust/MIP serve at the pleasure of the Board. |
Further information about the Trust’s/MIP’s Trustees and Officers is available in the Trust’s/MIP’s Statement of Additional Information, which can be obtained without charge by calling(800) 441-7762.
Effective September 19, 2019, Lisa Belle replaced John MacKessy as the Anti-Money Laundering Compliance Officer of the Trust/MIP.
Effective September 19, 2019, Janey Ahn replaced Benjamin Archibald as the Secretary of the Trust/MIP.
Effective December 31, 2019, Robert M. Hernandez retired as Trustee of the Trust/MIP.
Administrator
BlackRock Advisors, LLC
Wilmington, DE 19809
Investment Adviser
BlackRock Fund Advisors
San Francisco, CA 94105
Accounting Agent and Custodian
State Street Bank and Trust Company
Boston, MA 02111
Transfer Agent
BNY Mellon Investment Servicing (US) Inc.
Wilmington, DE 19809
Distributor
BlackRock Investments, LLC
New York, NY 10022
Independent Registered Public Accounting Firm
PricewaterhouseCoopers LLP
Philadelphia, PA 19103
Legal Counsel
Sidley Austin LLP
New York, NY 10019
Address of the Trust/MIP
400 Howard Street
San Francisco, CA 94105
| | |
| 46 | | 2019 BLACKROCK ANNUAL REPORTTO SHAREHOLDERS |
Additional Information
General Information
Householding
The Fund will mail only one copy of shareholder documents, including prospectuses, annual and semi-annual reports and proxy statements, to shareholders with multiple accounts at the same address. This practice is commonly called “householding” and is intended to reduce expenses and eliminate duplicate mailings of shareholder documents. Mailings of your shareholder documents may be householded indefinitely unless you instruct us otherwise. If you do not want the mailing of these documents to be combined with those for other members of your household, please call the Fund at(800) 441-7762.
Availability of Quarterly Schedule of Investments
The Fund/Master Portfolio file their complete schedule of portfolio holdings with the SEC for the first and third quarters of each fiscal year as an exhibit to its reports on Form N-PORT, and for reporting periods ended prior to March 31, 2019, filed such information onForm N-Q. The Fund’s/Master Portfolio’s Forms N-PORT andN-Q are available on the SEC’s website at sec.gov. The Fund’s/Master Portfolio’s FormN-Q may also be obtained upon request and without charge by calling(800) 441-7762.
Availability of Proxy Voting Policies and Procedures
A description of the policies and procedures that the Fund/Master Portfolio use to determine how to vote proxies relating to portfolio securities is available upon request and without charge (1) by calling(800) 441-7762; (2) atblackrock.com; and (3) on the SEC’s website at sec.gov.
Availability of Proxy Voting Record
Information about how the Fund/Master Portfolio voted proxies relating to securities held in the Fund’s/Master Portfolio’s portfolio during the most recent12-month period ended June 30 is available upon request and without charge (1) atblackrock.com; or by calling(800) 441-7762; and (2) on the SEC’s website at sec.gov.
BlackRock’s Mutual Fund Family
BlackRock offers a diverse lineup of open-end mutual funds crossing all investment styles and managed by experts in equity, fixed income andtax-exempt investing. Visitblackrock.com for more information.
Shareholder Privileges
Account Information
Call us at(800) 441-7762 from 8:00 AM to 6:00 PM ET on any business day to get information about your account balances, recent transactions and share prices. You can also visitblackrock.com for more information.
Automatic Investment Plans
Investor class shareholders who want to invest regularly can arrange to have $50 or more automatically deducted from their checking or savings account and invested in any of the BlackRock funds.
Systematic Withdrawal Plans
Investor class shareholders can establish a systematic withdrawal plan and receive periodic payments of $50 or more from their BlackRock funds, as long as their account balance is at least $10,000.
Retirement Plans
Shareholders may make investments in conjunction with Traditional, Rollover, Roth, Coverdell, Simple IRAs, SEP IRAs and 403(b) Plans.
| | | | |
| ADDITIONAL INFORMATION | | | 47 | |
Additional Information (continued)
BlackRock Privacy Principles
BlackRock is committed to maintaining the privacy of its current and former fund investors and individual clients (collectively, “Clients”) and to safeguarding theirnon-public personal information. The following information is provided to help you understand what personal information BlackRock collects, how we protect that information and why in certain cases we share such information with select parties.
If you are located in a jurisdiction where specific laws, rules or regulations require BlackRock to provide you with additional or different privacy-related rights beyond what is set forth below, then BlackRock will comply with those specific laws, rules or regulations.
BlackRock obtains or verifies personalnon-public information from and about you from different sources, including the following: (i) information we receive from you or, if applicable, your financial intermediary, on applications, forms or other documents; (ii) information about your transactions with us, our affiliates, or others; (iii) information we receive from a consumer reporting agency; and (iv) from visits to our websites.
BlackRock does not sell or disclose tonon-affiliated third parties anynon-public personal information about its Clients, except as permitted by law or as is necessary to respond to regulatory requests or to service Client accounts. Thesenon-affiliated third parties are required to protect the confidentiality and security of this information and to use it only for its intended purpose.
We may share information with our affiliates to service your account or to provide you with information about other BlackRock products or services that may be of interest to you. In addition, BlackRock restricts access tonon-public personal information about its Clients to those BlackRock employees with a legitimate business need for the information. BlackRock maintains physical, electronic and procedural safeguards that are designed to protect thenon-public personal information of its Clients, including procedures relating to the proper storage and disposal of such information.
| | |
| 48 | | 2019 BLACKROCK ANNUAL REPORTTO SHAREHOLDERS |
Want to know more?
blackrock.com | 877-275-1255 (1-877-ASK-1BLK)
This report is intended for current holders. It is not authorized for use as an offer of sale or a solicitation of an offer to buy shares of the Fund unless preceded or accompanied by the Fund’s current prospectus. Past performance results shown in this report should not be considered a representation of future performance. Investment returns and principal value of shares will fluctuate so that shares, when redeemed, may be worth more or less than their original cost. Statements and other information herein are as dated and are subject to change.
SPSF-12/19-AR
| | |
 | | DECEMBER 31, 2019 |
BlackRock Funds III
| · | | iShares U.S. Aggregate Bond Index Fund |
Beginning on January 1, 2021, as permitted by regulations adopted by the Securities and Exchange Commission, paper copies of the Fund’s shareholder reports will no longer be sent by mail, unless you specifically request paper copies of the reports from BlackRock or from your financial intermediary, such as a broker-dealer or bank. Instead, the reports will be made available on a website, and you will be notified by mail each time a report is posted and provided with a website link to access the report.
You may elect to receive all future reports in paper free of charge. If you hold accounts directly with BlackRock, you can call (800) 441-7762 to inform BlackRock that you wish to continue receiving paper copies of your shareholder reports. If you hold accounts through a financial intermediary, you can follow the instructions included with this disclosure, if applicable, or contact your financial intermediary to request that you continue to receive paper copies of your shareholder reports. Please note that not all financial intermediaries may offer this service. Your election to receive reports in paper will apply to all funds advised by BlackRock Advisors, LLC, BlackRock Fund Advisors or their affiliates, or all funds held with your financial intermediary, as applicable.
If you already elected to receive shareholder reports electronically, you will not be affected by this change and you need not take any action. You may elect to receive electronic delivery of shareholder reports and other communications by: (i) accessing the BlackRock website at blackrock.com/edelivery and logging into your accounts, if you hold accounts directly with BlackRock, or (ii) contacting your financial intermediary, if you hold accounts through a financial intermediary. Please note that not all financial intermediaries may offer this service.
|
| Not FDIC Insured • May Lose Value • No Bank Guarantee |
The Markets in Review
Dear Shareholder,
U.S. equities and bonds finished the last year of the decade with impressive returns, putting an exclamation point on a decade of strong performance despite the fears and doubts about the economy that were ultimately laid to rest with unprecedented monetary stimulus and a sluggish yet resolute performance from the U.S. economy. In many ways, it was fitting that the themes of 2019 — geopolitical uncertainty, fears of recession, and decisive monetary stimulus — put the capstone on a decade that was defined by grappling with these competing forces.
Equity and bond markets posted solid returns, particularly in the second half of the year, as investors began to realize that the U.S. economy was maintaining the modest yet steady growth that has characterized this economic cycle. U.S. large cap equities advanced the most, while equities at the high end of the risk spectrum — emerging markets and U.S. small cap — lagged while still posting solid returns.
Fixed-income securities played an important role in diversified portfolios by delivering strong returns amid economic uncertainty, as interest rates declined (and bond prices rose). Long-term bonds, particularly long-term Treasuries, generally posted the strongest returns, as inflation remained low. Investment-grade and high-yield corporate bonds also posted solid returns, as the credit fundamentals in corporate markets remained relatively solid.
As equity performance faltered in late 2018 and global economic growth slowed, the U.S. Federal Reserve (the “Fed”) shifted away from policies designed to decrease inflation in favor of renewed efforts to stimulate economic activity. The Fed left interest rates unchanged in January 2019, then reduced interest rates three times thereafter, starting in July 2019. Similarly, the Fed took measures to support liquidity in short-term lending markets. Following in the Fed’s footsteps, the European Central Bank announced aggressive economic stimulus measures, including lower interest rates and the return of its bond purchasing program. The Bank of Japan signaled a continuation of accommodative monetary policy, while China committed to looser credit conditions and an increase in fiscal spending.
The outpouring of global economic stimulus led to a sharp rally in risk assets throughout the world despite the headwind of rising geopolitical and trade tensions. Hopes continued to remain high as the current economic expansion became the longest in U.S. history.
Looking ahead, we believe U.S. economic growth will stabilize and gradually improve in 2020. The primary drivers of recent market performance — trade and monetary policies — could take a back seat to a nascent expansion in manufacturing and a recent uptick in global growth. The headwinds of policy uncertainty in 2019 could become tailwinds in 2020 due topro-cyclical policy shifts.
Overall, we favor increasing investment risk to benefit from the brighter outlook. In addition to having a positive view for equities overall, we favor emerging market equities over developed market equities. Increasing cyclical exposure through value-style investing and maintaining a meaningful emphasis on high-quality companies through quality factors also makes sense for diversified investors. In fixed income, government bonds continue to be important portfolio stabilizers, while emerging market bonds, particularly local currency bonds, offer relatively attractive income opportunities.
In this environment, investors need to think globally, extend their scope across a broad array of asset classes, and be nimble as market conditions change. We encourage you to talk with your financial advisor and visitblackrock.com for further insight about investing in today’s markets.
Sincerely,
Rob Kapito
President, BlackRock Advisors, LLC
Rob Kapito
President, BlackRock Advisors, LLC
| | | | |
| Total Returns as of December 31, 2019 |
| | | 6-month | | 12-month |
U.S. large cap equities
(S&P 500® Index) | | 10.92% | | 31.49% |
U.S. small cap equities
(Russell 2000® Index) | | 7.30 | | 25.52 |
International equities
(MSCI Europe, Australasia, Far East Index) | | 7.01 | | 22.01 |
Emerging market equities
(MSCI Emerging Markets Index) | | 7.09 | | 18.42 |
3-month Treasury bills
(ICE BofAML3-Month U.S. Treasury Bill Index) | | 1.03 | | 2.28 |
U.S. Treasury securities
(ICE BofAML10-Year U.S. Treasury Index) | | 1.36 | | 8.91 |
U.S. investment grade bonds
(Bloomberg Barclays U.S. Aggregate Bond Index) | | 2.45 | | 8.72 |
Tax-exempt municipal bonds
(S&P Municipal Bond Index) | | 2.21 | | 7.26 |
U.S. high yield bonds
(Bloomberg Barclays U.S. Corporate High Yield 2% Issuer Capped Index) | | 3.98 | | 14.32 |
| Past performance is no guarantee of future results. Index performance is shown for illustrative purposes only. You cannot invest directly in an index. |
| | |
| 2 | | THIS PAGEISNOT PARTOF YOUR FUND REPORT |
Table of Contents

| | |
| Fund Summary as of December 31, 2019 | | iShares U.S. Aggregate Bond Index Fund |
Investment Objective
iShares U.S. Aggregate Bond Index Fund’s (the “Fund”) investment objective is to seek to provide investment results that correspond to the total return performance of fixed-income securities in the aggregate, as represented by the Bloomberg Barclays U.S. Aggregate Bond Index (the “Index”).
Portfolio Management Commentary
How did the Fund perform?
For the 12-month period ended December 31, 2019, the Fund’s Institutional Shares returned 8.56%, Investor A Shares returned 8.39%, Class K Shares returned 8.71% and Investor P Shares returned 8.32%. For the same period, the Index returned 8.72%.
Returns for the Fund’s respective share classes differ from the Index based on individual share class expenses. The Fund invests all of its assets in U.S. Total Bond Index Master Portfolio (the “Master Portfolio”), a series of Master Investment Portfolio.
Describe the market environment.
During the first quarter of 2019, the Fed’s dovish pivot contributed to a meaningful rebound in equity prices. In its January announcement, the Fed indicated that it would refrain from interest rate hikes for the foreseeable future, and provided a dovish assessment of U.S. economic conditions, as well as transparency surrounding balance sheet normalization. The Fed’s messaging reduced the market’s expectations for rising short-term rates, serving as a boon for both equities and bonds. In addition, despite a 35-day government shutdown and global economic weakness, the U.S. economy continued to exhibit a tight labor market, low inflation and slowing but stable growth. Less optimism was evident in the U.S. rates market. The pause in interest rate hikes by the Fed, coupled with lowered forecasts for growth, drove investors into longer-duration government bonds.
In the second quarter of 2019, the prospect of easier monetary policy buoyed equities broadly. In the June Federal Open Market Committee announcement, Fed Chair Powell stated that if trade tensions weigh on the committee’s economic outlook or should the shortfall of inflation from the target rate persist longer than expected, the Fed would provide more accommodation to sustain the expansion. In May, the U.S. administration threatened an increase in tariffs and protectionism against both China and Mexico. However, these threats did not materialize, and sentiment eased heading into the month end G-20 meeting. To close the first half of the year, there were signs of weaker U.S. economic conditions.
In the third quarter of 2019, global trade tensions were a key focus for investors. U.S. equities suffered their worst week of 2019 in early August based on the U.S. administration’s promise to impose 10% tariffs on all Chinese imports not already subject to 25% tariffs. However, U.S./China tensions ostensibly eased ahead of a new round of trade talks in October. Regarding U.S. monetary policy, the Fed lowered the target range for the federal funds rate at its July and September meetings. Additionally, survey-based U.S. economic indicators continued to soften within the manufacturing and consumer sectors, while economic data releases exhibited resilience.
In the fourth quarter of 2019, investor risk appetite was boosted by renewed expectations for a U.S./China trade deal, strong economic growth and looser monetary policy. U.S. services and employment sectors continued to be buoyant. Overall, supportive macroeconomic data and increased investor risk appetite drove a sell-off for Treasuries in the quarter as 10-year U.S. Treasury bond yields increased 26 basis points (0.26%) to 1.92%. Lastly, despite renewed strength in the U.S. economy, the Fed lowered the benchmark federal funds rate by 25 basis points to 1.75% in October, marking its third rate cut of 2019.
Describe recent portfolio activity.
During the period, the Master Portfolio maintained its objective of seeking to provide investment results that correspond to the total return performance of fixed-income securities in the aggregate, as represented by the Index. Other factors considered in security selection included transaction costs and maturity structure.
The Master Portfolio held a small portion of its assets in cash committed for pending transactions, which did not have a material impact on Fund performance during the period.
Describe portfolio positioning at period end.
The Master Portfolio remains positioned to attempt to match the risk characteristics of the Index, irrespective of the market’s future direction.
The views expressed reflect the opinions of BlackRock as of the date of this report and are subject to change based on changes in market, economic or other conditions. These views are not intended to be a forecast of future events and are no guarantee of future results.
| | |
| 4 | | 2019 BLACKROCK ANNUAL REPORTTO SHAREHOLDERS |
| | |
| Fund Summary as of December 31, 2019 (continued) | | iShares U.S. Aggregate Bond Index Fund |
TOTAL RETURN BASED ON A $10,000 INVESTMENT
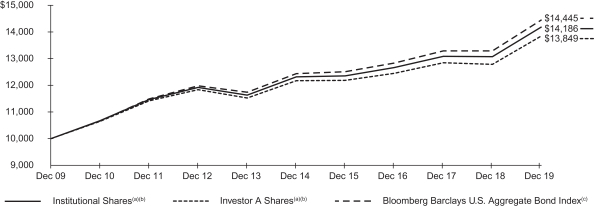
| (a) | Assuming transaction costs and other operating expenses, including administration fees, if any. |
| (b) | The Fund invests all of its assets in the Master Portfolio. The Master Portfolio invests primarily in investment-grade U.S. Government securities and corporate bonds, as well as investment-grade mortgage-backed, asset-backed and commercial mortgage-backed securities. |
| (c) | A widely recognized unmanaged market-capitalization weighted index, comprised of investment-grade corporate bonds rated BBB or better, mortgages and U.S. Treasury and U.S. Government agency issues with at least one year to maturity. |
Performance Summary for the Period Ended December 31, 2019
| | | | | | | | | | | | | | | | | | | | | | | | | | | | | | | | | | | | | | | | | | | | |
| | | | | | | | | | | | Average Annual Total Returns (a) | |
| | | | | | | | | | | | 1 Year | | | | | | 5 Years | | | | | | 10 Years | |
| | | Standardized
30-Day Yields | | | Unsubsidized
30-Day Yields | | | 6-Month
Total Returns | | | w/o sales
charge | | | w/sales
charge | | | | | | w/o sales
charge | | | w/sales
charge | | | | | | w/o sales
charge | | | w/sales
charge | |
Institutional | | | 2.25 | % | | | 2.24 | % | | | 2.33 | % | | | 8.56 | % | | | N/A | | | | | | | | 2.87 | % | | | N/A | | | | | | | | 3.56 | % | | | N/A | |
Investor A | | | 2.00 | | | | 1.99 | | | | 2.30 | | | | 8.39 | | | | N/A | | | | | | | | 2.62 | | | | N/A | | | | | | | | 3.31 | | | | N/A | |
Class K | | | 2.30 | | | | 2.29 | | | | 2.45 | | | | 8.71 | | | | N/A | | | | | | | | 2.94 | | | | N/A | | | | | | | | 3.62 | | | | N/A | |
Investor P | | | 1.92 | | | | 1.91 | | | | 2.22 | | | | 8.32 | | | | 3.98 | % | | | | | | | 2.62 | | | | 1.79 | % | | | | | | | 3.31 | | | | 2.89 | % |
Bloomberg Barclays U.S. Aggregate Bond Index | | | — | | | | — | | | | 2.45 | | | | 8.72 | | | | N/A | | | | | | | | 3.05 | | | | N/A | | | | | | | | 3.75 | | | | N/A | |
| | (a) | Assuming maximum sales charges, if any. Average annual total returns with and without sales charges reflect reductions for distribution and service fees. See “About Fund Performance” on page 6 for a detailed description of share classes, including any related sales charges and fees, and how performance was calculated for certain share classes. | |
N/A — Not applicable as share class and index do not have a sales charge.
Past performance is not indicative of future results.
Performance results may include adjustments made for financial reporting purposes in accordance with U.S. generally accepted accounting principles.
Expense Example
| | | | | | | | | | | | | | | | | | | | | | | | | | | | | | | | |
| | | Actual | | | | | | Hypothetical (b) | | | | |
| | | Beginning
Account Value
(07/01/19) | | | Ending
Account Value (12/31/19) | | | Expenses
Paid During
the Period (a) | | | | | | Beginning
Account Value (07/01/19) | | | Ending
Account Value
(12/31/19) | | | Expenses
Paid During
the Period (a) | | | Annualized
Expense
Ratio | |
Institutional | | $ | 1,000.00 | | | $ | 1,023.30 | | | $ | 0.51 | | | | | | | $ | 1,000.00 | | | $ | 1,024.70 | | | $ | 0.51 | | | | 0.10 | % |
Investor A | | | 1,000.00 | | | | 1,023.00 | | | | 1.78 | | | | | | | | 1,000.00 | | | | 1,023.44 | | | | 1.79 | | | | 0.35 | |
Class K | | | 1,000.00 | | | | 1,024.50 | | | | 0.26 | | | | | | | | 1,000.00 | | | | 1,024.95 | | | | 0.26 | | | | 0.05 | |
Investor P | | | 1,000.00 | | | | 1,022.20 | | | | 1.78 | | | | | | | | 1,000.00 | | | | 1,023.44 | | | | 1.79 | | | | 0.35 | |
| | (a) | For each class of the Fund, expenses are equal to the annualized net expense ratio for the class, multiplied by the average account value over the period, multiplied by 184/365 (to reflect the one-half year period shown). Because the Fund invests all of its assets in the Master Portfolio, the expense example reflects the net expenses of both the Fund and the Master Portfolio. | |
| | (b) | Hypothetical 5% annual return before expenses is calculated by prorating the number of days in the most recent fiscal half year divided by 365. | |
See “Disclosure of Expenses” on page 6 for further information on how expenses were calculated.
About Fund Performance
Institutional and Class K Shares are not subject to any sales charge. These shares bear no ongoing distribution or service fees and are available only to certain eligible investors.
Investor A Sharesare not subject to any sales charge and bear no ongoing distribution fee. These shares are subject to an ongoing service fee of 0.25% per year. These shares are generally available through financial intermediaries.
Investor P Shares are subject to a maximum initial sales charge (front-end load) of 4.00% and a service fee of 0.25% per year (but no distribution fee). These shares are only available to investors purchasing shares through registered representatives of an insurance company’s broker-dealer that has entered into an agreement with the Fund’s distributor to offer such shares.
Prior to the inception date of March 31, 2011 for Institutional and Investor A Shares and prior to the inception date of August 6, 2018 for Investor P Shares, the performance of the classes is based on the returns of Class K Shares, adjusted to reflect the estimated annual fund fees and operating expenses of each respective share class of the Fund.
Performance information reflects past performance and does not guarantee future results. Current performance may be lower or higher than the performance data quoted. Refer toblackrock.com to obtain performance data current to the most recent month-end. Performance results do not reflect the deduction of taxes that a shareholder would pay on fund distributions or the redemption of fund shares. Figures shown in the performance table on the previous page assume reinvestment of all distributions, if any, at net asset value (“NAV”) on the ex-dividend date. Investment return and principal value of shares will fluctuate so that shares, when redeemed, may be worth more or less than their original cost. Distributions paid to each class of shares will vary because of the different levels of service, distribution and transfer agency fees applicable to each class, which are deducted from the income available to be paid to shareholders.
BlackRock Advisors, LLC (the “Administrator”), the Fund’s administrator, has contractually agreed to waive and/or reimburse a portion of the Fund’s expenses. Without such waiver and/or reimbursement, the Fund’s performance would have been lower. With respect to the Fund’s contractual waiver, the Administrator is under no obligation to continue waiving and/or reimbursing its fees after the applicable termination date of such agreement. See Note 4 of the Notes to Financial Statements for additional information on waivers and/or reimbursements.
The standardized 30-day yield includes the effects of any waivers and/or reimbursements. The unsubsidized 30-day yield excludes the effects of any waivers and/or reimbursements.
Disclosure of Expenses
Shareholders of the Fund may incur the following charges: (a) transactional expenses, such as sales charges, and (b) operating expenses, including administration fees, service and distribution fees, including12b-1 fees, acquired fund fees and expenses, and other fund expenses. The expense example shown on the previous page (which is based on a hypothetical investment of $1,000 invested on July 1, 2019 and held through December 31, 2019) is intended to assist shareholders both in calculating expenses based on an investment in the Fund and in comparing these expenses with similar costs of investing in other mutual funds.
The expense example provides information about actual account values and actual expenses. In order to estimate the expenses a shareholder paid during the period covered by this report, shareholders can divide their account value by $1,000 and then multiply the result by the number corresponding to their Fund and share class under the heading entitled “Expenses Paid During the Period.”
The expense example also provides information about hypothetical account values and hypothetical expenses based on the Fund’s actual expense ratio and an assumed rate of return of 5% per year before expenses. In order to assist shareholders in comparing the ongoing expenses of investing in the Fund and other funds, compare the 5% hypothetical example with the 5% hypothetical examples that appear in shareholder reports of other funds.
The expenses shown in the expense example are intended to highlight shareholders’ ongoing costs only and do not reflect transactional expenses, such as sales charges, if any. Therefore, the hypothetical example is useful in comparing ongoing expenses only, and will not help shareholders determine the relative total expenses of owning different funds. If these transactional expenses were included, shareholder expenses would have been higher.
| | |
| 6 | | 2019 BLACKROCK ANNUAL REPORTTO SHAREHOLDERS |
Statement of Assets and Liabilities
December 31, 2019
| | | | |
| | | iShares U.S.
Aggregate Bond
Index Fund | |
|
ASSETS | |
Investments at value — Master Portfolio | | $ | 2,042,840,489 | |
Receivables: | | | | |
Capital shares sold | | | 10,955,607 | |
Withdrawals from the Master Portfolio | | | 644,602 | |
| | | | |
Total assets | | | 2,054,440,698 | |
| | | | |
|
LIABILITIES | |
Payables: | | | | |
Administration fees | | | 58,039 | |
Capital shares redeemed | | | 11,600,209 | |
Other accrued expenses | | | 12,199 | |
Service fees | | | 26,214 | |
| | | | |
Total liabilities | | | 11,696,661 | |
| | | | |
| |
NET ASSETS | | $ | 2,042,744,037 | |
| | | | |
|
NET ASSETS CONSIST OF | |
Paid-in capital | | $ | 1,986,751,072 | |
Accumulated earnings | | | 55,992,965 | |
| | | | |
NET ASSETS | | $ | 2,042,744,037 | |
| | | | |
|
NET ASSET VALUE | |
Institutional — Based on net assets of $187,854,363 and 18,076,935 shares outstanding, unlimited shares authorized, no par value | | $ | 10.39 | |
| | | | |
Investor A — Based on net assets of $121,421,096 and 11,685,337 shares outstanding, unlimited shares authorized, no par value | | $ | 10.39 | |
| | | | |
Class K — Based on net assets of $1,730,754,162 and 166,449,481 shares outstanding, unlimited shares authorized, no par value | | $ | 10.40 | |
| | | | |
Investor P — Based on net assets of $2,714,416 and 261,253 shares outstanding, unlimited shares authorized, no par value | | $ | 10.39 | |
| | | | |
See notes to financial statements.
Statement of Operations
Year Ended December 31, 2019
| | | | |
| | | iShares U.S. Aggregate Bond Index Fund | |
| |
INVESTMENT INCOME | | | | |
Net investment income allocated from the Master Portfolio: | | | | |
Dividends — affiliated | | $ | 2,752,562 | |
Interest — unaffiliated | | | 44,792,120 | |
Securities lending income — affiliated — net | | | 748,141 | |
Other income — affiliated | | | 96,674 | |
Expenses | | | (692,421 | ) |
Fees waived | | | 114,177 | |
| | | | |
Total investment income | | | 47,811,253 | |
| | | | |
| |
FUND EXPENSES | | | | |
Service — class specific | | | 317,539 | |
Administration — class specific | | | 317,352 | |
Professional | | | 12,195 | |
Miscellaneous | | | 1,500 | |
| | | | |
Total expenses | | | 648,586 | |
Less fees waived and/or reimbursed by the Administrator/Manager | | | (12,195 | ) |
| | | | |
Total expenses after fees waived and/or reimbursed | | | 636,391 | |
| | | | |
Net investment income | | | 47,174,862 | |
| | | | |
| |
REALIZED AND UNREALIZED GAIN ALLOCATED FROM THE MASTER PORTFOLIO | | | | |
Net realized gain from investments | | | 4,247,078 | |
Net change in unrealized appreciation on investments | | | 77,964,427 | |
| | | | |
Net realized and unrealized gain | | | 82,211,505 | |
| | | | |
NET INCREASE IN NET ASSETS RESULTING FROM OPERATIONS | | $ | 129,386,367 | |
| | | | |
See notes to financial statements.
| | |
| 8 | | 2019 BLACKROCK ANNUAL REPORTTO SHAREHOLDERS |
Statements of Changes in Net Assets
| | | | | | | | |
| | | iShares U.S. Aggregate
Bond Index Fund | |
| | | Year Ended December 31, | |
| | | 2019 | | | 2018 | |
| | |
INCREASE (DECREASE) IN NET ASSETS | | | | | | | | |
| | |
OPERATIONS | | | | | | | | |
Net investment income | | $ | 47,174,862 | | | $ | 30,533,343 | |
Net realized gain (loss) | | | 4,247,078 | | | | (6,817,144 | ) |
Net change in unrealized appreciation (depreciation) | | | 77,964,427 | | | | (19,188,696 | ) |
| | | | | | | | |
Net increase in net assets resulting from operations | | | 129,386,367 | | | | 4,527,503 | |
| | | | | | | | |
| | |
DISTRIBUTIONS TO SHAREHOLDERS(a) | | | | | | | | |
From net investment income: | | | | | | | | |
Institutional | | | (5,169,750 | ) | | | (3,320,182 | ) |
Investor A | | | (3,287,319 | ) | | | (3,016,684 | ) |
Class K | | | (39,979,544 | ) | | | (24,785,155 | ) |
Investor P | | | (33,347 | ) | | | (2,339 | ) |
From return of capital: | | | | | | | | |
Institutional | | | — | | | | (1,793 | ) |
Investor A | | | — | | | | (1,629 | ) |
Class K | | | — | | | | (13,384 | ) |
Investor P | | | — | | | | (1 | ) |
| | | | | | | | |
Decrease in net assets resulting from distributions to shareholders | | | (48,469,960 | ) | | | (31,141,167 | ) |
| | | | | | | | |
| | |
CAPITAL SHARE TRANSACTIONS | | | | | | | | |
Net increase in net assets derived from capital share transactions | | | 656,733,017 | | | | 354,852,563 | |
| | | | | | | | |
| | |
NET ASSETS | | | | | | | | |
Total increase in net assets | | | 737,649,424 | | | | 328,238,899 | |
Beginning of year | | | 1,305,094,613 | | | | 976,855,714 | |
| | | | | | | | |
End of year | | $ | 2,042,744,037 | | | $ | 1,305,094,613 | |
| | | | | | | | |
| (a) | Distributions for annual periods determined in accordance with U.S. federal income tax regulations. |
See notes to financial statements.
Financial Highlights
(For a share outstanding throughout each period)
| | | | | | | | | | | | | | | | | | | | |
| | | iShares U.S. Aggregate Bond Index Fund | |
| |
| | | Institutional | |
| |
| | | Year Ended December 31, | |
| | | 2019 | | | 2018 | | | 2017 | | | 2016 | | | 2015 | |
| | | | | |
Net asset value, beginning of year | | $ | 9.85 | | | $ | 10.13 | | | $ | 10.02 | | | $ | 9.99 | | | $ | 10.17 | |
| | | | | | | | | | | | | | | | | | | | |
Net investment income(a) | | | 0.29 | | | | 0.26 | | | | 0.22 | | | | 0.20 | | | | 0.19 | |
Net realized and unrealized gain (loss) | | | 0.54 | | | | (0.28 | ) | | | 0.11 | | | | 0.05 | | | | (0.16 | ) |
| | | | | | | | | | | | | | | | | | | | |
Net increase (decrease) from investment operations | | | 0.83 | | | | (0.02 | ) | | | 0.33 | | | | 0.25 | | | | 0.03 | |
| | | | | | | | | | | | | | | | | | | | |
| | | | | |
Distributions(b) | | | | | | | | | | | | | | | | | | | | |
From net investment income | | | (0.29 | ) | | | (0.26 | ) | | | (0.22 | ) | | | (0.21 | ) | | | (0.19 | ) |
From net realized gain | | | — | | | | — | | | | — | | | | (0.01 | ) | | | (0.02 | ) |
From return of capital | | | — | | | | (0.00 | )(c) | | | — | | | | (0.00 | )(c) | | | — | |
| | | | | | | | | | | | | | | | | | | | |
Total distributions | | | (0.29 | ) | | | (0.26 | ) | | | (0.22 | ) | | | (0.22 | ) | | | (0.21 | ) |
| | | | | | | | | | | | | | | | | | | | |
| | | | | |
Net asset value, end of year | | $ | 10.39 | | | $ | 9.85 | | | $ | 10.13 | | | $ | 10.02 | | | $ | 9.99 | |
| | | | | | | | | | | | | | | | | | | | |
| | | | | |
Total Return(d) | | | | | | | | | | | | | | | | | | | | |
Based on net asset value | | | 8.56 | %(e) | | | (0.13 | )% | | | 3.34 | % | | | 2.48 | % | | | 0.33 | % |
| | | | | | | | | | | | | | | | | | | | |
| | | | | |
Ratios to Average Net Assets(f)(g) | | | | | | | | | | | | | | | | | | | | |
Total expenses | | | 0.10 | % | | | 0.09 | % | | | 0.09 | % | | | 0.10 | % | | | 0.12 | % |
| | | | | | | | | | | | | | | | | | | | |
Total expenses after fees waived and/or reimbursed | | | 0.10 | % | | | 0.09 | % | | | 0.09 | % | | | 0.10 | % | | | 0.11 | % |
| | | | | | | | | | | | | | | | | | | | |
Net investment income | | | 2.85 | % | | | 2.67 | % | | | 2.15 | % | | | 1.95 | % | | | 1.85 | % |
| | | | | | | | | | | | | | | | | | | | |
| | | | | |
Supplemental Data | | | | | | | | | | | | | | | | | | | | |
Net assets, end of year (000) | | $ | 187,854 | | | $ | 150,714 | | | $ | 98,927 | | | $ | 116,473 | | | $ | 58,043 | |
| | | | | | | | | | | | | | | | | | | | |
Portfolio turnover rate of the Master Portfolio(h) | | | 158 | % | | | 274 | % | | | 345 | % | | | 278 | % | | | 356 | % |
| | | | | | | | | | | | | | | | | | | | |
| (a) | Based on average shares outstanding. |
| (b) | Distributions for annual periods determined in accordance with U.S. federal income tax regulations. |
| (c) | Amount is greater than $(0.005) per share |
| (d) | Where applicable, assumes the reinvestment of distributions. |
| (e) | Includes payment received from an affiliate, which had no impact on the Fund’s total return. |
| (f) | Includes the Fund’s share of the Master Portfolio’s allocated expenses and/or net investment income. |
| (g) | Includes the Fund’s share of its corresponding Master Portfolio’s allocated fees waived and expenses and/or net investment income. Excludes expenses incurred indirectly as a result of the Master Portfolio’s investments in underlying funds as follows: |
| | | | | | | | | | | | | | | | | | | | |
| | | Year Ended December 31, | |
| | | 2019 | | | 2018 | | | 2017 | | | 2016 | | | 2015 | |
Allocated fees waived | | | 0.01 | % | | | 0.01 | % | | | 0.01 | % | | | 0.01 | % | | | 0.02 | % |
Investments in underlying funds | | | 0.01 | % | | | 0.01 | % | | | 0.01 | % | | | 0.01 | % | | | 0.02 | % |
| | | | | | | | | | | | | | | | | | | | |
| (h) | Includes mortgage dollar roll transactions (“MDRs”). Additional information regarding portfolio turnover rate is as follows: |
| | | | | | | | | | | | | | | | | | | | |
| | | Year Ended December 31, | |
| | | 2019 | | | 2018 | | | 2017 | | | 2016 | | | 2015 | |
Portfolio turnover rate(excluding MDRs) | | | 97 | % | | | 162 | % | | | 193 | % | | | 164 | % | | | 300 | % |
| | | | | | | | | | | | | | | | | | | | |
See notes to financial statements.
| | |
| 10 | | 2019 BLACKROCK ANNUAL REPORTTO SHAREHOLDERS |
Financial Highlights (continued)
(For a share outstanding throughout each period)
| | | | | | | | | | | | | | | | | | | | |
| | | iShares U.S. Aggregate Bond Index Fund | |
| |
| | | Investor A | |
| |
| | | Year Ended December 31, | |
| | | 2019 | | | 2018 | | | 2017 | | | 2016 | | | 2015 | |
| | | | | |
Net asset value, beginning of year | | $ | 9.84 | | | $ | 10.13 | | | $ | 10.01 | | | $ | 9.99 | | | $ | 10.17 | |
| | | | | | | | | | | | | | | | | | | | |
Net investment income(a) | | | 0.26 | | | | 0.24 | | | | 0.19 | | | | 0.17 | | | | 0.16 | |
Net realized and unrealized gain (loss) | | | 0.56 | | | | (0.29 | ) | | | 0.13 | | | | 0.05 | | | | (0.15 | ) |
| | | | | | | | | | | | | | | | | | | | |
Net increase (decrease) from investment operations | | | 0.82 | | | | (0.05 | ) | | | 0.32 | | | | 0.22 | | | | 0.01 | |
| | | | | | | | | | | | | | | | | | | | |
|
Distributions(b) | |
From net investment income | | | (0.27 | ) | | | (0.24 | ) | | | (0.20 | ) | | | (0.19 | ) | | | (0.17 | ) |
From net realized gain | | | — | | | | — | | | | — | | | | (0.01 | ) | | | (0.02 | ) |
From return of capital | | | — | | | | (0.00 | )(c) | | | — | | | | (0.00 | )(c) | | | — | |
| | | | | | | | | | | | | | | | | | | | |
Total distributions | | | (0.27 | ) | | | (0.24 | ) | | | (0.20 | ) | | | (0.20 | ) | | | (0.19 | ) |
| | | | | | | | | | | | | | | | | | | | |
| | | | | |
Net asset value, end of year | | $ | 10.39 | | | $ | 9.84 | | | $ | 10.13 | | | $ | 10.01 | | | $ | 9.99 | |
| | | | | | | | | | | | | | | | | | | | |
|
Total Return(d) | |
Based on net asset value | | | 8.39 | %(e) | | | (0.48 | )% | | | 3.19 | % | | | 2.14 | % | | | 0.08 | % |
| | | | | | | | | | | | | | | | | | | | |
|
Ratios to Average Net Assets(f)(g) | |
Total expenses | | | 0.35 | % | | | 0.34 | % | | | 0.34 | % | | | 0.35 | % | | | 0.37 | % |
| | | | | | | | | | | | | | | | | | | | |
Total expenses after fees waived and/or reimbursed | | | 0.35 | % | | | 0.34 | % | | | 0.34 | % | | | 0.35 | % | | | 0.36 | % |
| | | | | | | | | | | | | | | | | | | | |
Net investment income | | | 2.61 | % | | | 2.39 | % | | | 1.91 | % | | | 1.69 | % | | | 1.61 | % |
| | | | | | | | | | | | | | | | | | | | |
|
Supplemental Data | |
Net assets, end of year (000) | | $ | 121,421 | | | $ | 126,483 | | | $ | 121,690 | | | $ | 71,391 | | | $ | 19,145 | |
| | | | | | | | | | | | | | | | | | | | |
Portfolio turnover rate of the Master Portfolio(h) | | | 158 | % | | | 274 | % | | | 345 | % | | | 278 | % | | | 356 | % |
| | | | | | | | | | | | | | | | | | | | |
| (a) | Based on average shares outstanding. |
| (b) | Distributions for annual periods determined in accordance with U.S. federal income tax regulations. |
| (c) | Amount is greater than $(0.005) per share. |
| (d) | Where applicable, assumes the reinvestment of distributions. |
| (e) | Includes payment received from an affiliate, which had no impact on the Fund’s total return. |
| (f) | Includes the Fund’s share of the Master Portfolio’s allocated expenses and/or net investment income. |
| (g) | Includes the Fund’s share of its corresponding Master Portfolio’s allocated fees waived and expenses and/or net investment income. Excludes expenses incurred indirectly as a result of the Master Portfolio’s investments in underlying funds as follows: |
| | | | | | | | | | | | | | | | | | | | |
| | | Year Ended December 31, | |
| | | 2019 | | | 2018 | | | 2017 | | | 2016 | | | 2015 | |
Allocated fees waived | | | 0.01 | % | | | 0.01 | % | | | 0.01 | % | | | 0.01 | % | | | 0.02 | % |
Investments in underlying funds | | | 0.01 | % | | | 0.01 | % | | | 0.01 | % | | | 0.01 | % | | | 0.02 | % |
| | | | | | | | | | | | | | | | | | | | |
| (h) | Includes mortgage dollar roll transactions (“MDRs”). Additional information regarding portfolio turnover rate is as follows: |
| | | | | | | | | | | | | | | | | | | | |
| | | Year Ended December 31, | |
| | | 2019 | | | 2018 | | | 2017 | | | 2016 | | | 2015 | |
Portfolio turnover rate(excluding MDRs) | | | 97 | % | | | 162 | % | | | 193 | % | | | 164 | % | | | 300 | % |
| | | | | | | | | | | | | | | | | | | | |
See notes to financial statements.
Financial Highlights (continued)
(For a share outstanding throughout each period)
| | | | | | | | | | | | | | | | | | | | |
| | | iShares U.S. Aggregate Bond Index Fund | |
| |
| | | Class K | |
| |
| | | Year Ended December 31, | |
| | | 2019 | | | 2018 | | | 2017 | | | 2016 | | | 2015 | |
| | | | | |
Net asset value, beginning of year | | $ | 9.85 | | | $ | 10.13 | | | $ | 10.02 | | | $ | 9.99 | | | $ | 10.17 | |
| | | | | | | | | | | | | | | | | | | | |
Net investment income(a) | | | 0.29 | | | | 0.27 | | | | 0.22 | | | | 0.20 | | | | 0.19 | |
Net realized and unrealized gain (loss) | | | 0.56 | | | | (0.28 | ) | | | 0.12 | | | | 0.06 | | | | (0.15 | ) |
| | | | | | | | | | | | | | | | | | | | |
Net increase (decrease) from investment operations | | | 0.85 | | | | (0.01 | ) | | | 0.34 | | | | 0.26 | | | | 0.04 | |
| | | | | | | | | | | | | | | | | | | | |
| | | | | |
Distributions(b) | | | | | | | | | | | | | | | | | | | | |
From net investment income | | | (0.30 | ) | | | (0.27 | ) | | | (0.23 | ) | | | (0.22 | ) | | | (0.20 | ) |
From net realized gain | | | — | | | | — | | | | — | | | | (0.01 | ) | | | (0.02 | ) |
From return of capital | | | — | | | | (0.00 | )(c) | | | — | | | | (0.00 | )(c) | | | — | |
| | | | | | | | | | | | | | | | | | | | |
Total distributions | | | (0.30 | ) | | | (0.27 | ) | | | (0.23 | ) | | | (0.23 | ) | | | (0.22 | ) |
| | | | | | | | | | | | | | | | | | | | |
| | | | | |
Net asset value, end of year | | $ | 10.40 | | | $ | 9.85 | | | $ | 10.13 | | | $ | 10.02 | | | $ | 9.99 | |
| | | | | | | | | | | | | | | | | | | | |
|
Total Return(d) | |
Based on net asset value | | | 8.71 | %(e) | | | (0.08 | )% | | | 3.39 | % | | | 2.53 | % | | | 0.38 | % |
| | | | | | | | | | | | | | | | | | | | |
| | | | | |
Ratios to Average Net Assets(f)(g) | | | | | | | | | | | | | | | | | | | | |
Total expenses | | | 0.05 | % | | | 0.04 | % | | | 0.04 | % | | | 0.05 | % | | | 0.07 | % |
| | | | | | | | | | | | | | | | | | | | |
Total expenses after fees waived and/or reimbursed | | | 0.05 | % | | | 0.04 | % | | | 0.04 | % | | | 0.05 | % | | | 0.06 | % |
| | | | | | | | | | | | | | | | | | | | |
Net investment income | | | 2.89 | % | | | 2.71 | % | | | 2.21 | % | | | 2.00 | % | | | 1.89 | % |
| | | | | | | | | | | | | | | | | | | | |
| | | | | |
Supplemental Data | | | | | | | | | | | | | | | | | | | | |
Net assets, end of year (000) | | $ | 1,730,754 | | | $ | 1,027,621 | | | $ | 756,239 | | | $ | 445,650 | | | $ | 166,203 | |
| | | | | | | | | | | | | | | | | | | | |
Portfolio turnover rate of the Master Portfolio(h) | | | 158 | % | | | 274 | % | | | 345 | % | | | 278 | % | | | 356 | % |
| | | | | | | | | | | | | | | | | | | | |
| (a) | Based on average shares outstanding. |
| (b) | Distributions for annual periods determined in accordance with U.S. federal income tax regulations. |
| (c) | Amount is greater than $(0.005) per share. |
| (d) | Where applicable, assumes the reinvestment of distributions. |
| (e) | Includes payment received from an affiliate, which had no impact on the Fund’s total return. |
| (f) | Includes the Fund’s share of the Master Portfolio’s allocated expenses and/or net investment income. |
| (g) | Includes the Fund’s share of its corresponding Master Portfolio’s allocated fees waived and expenses and/or net investment income. Excludes expenses incurred indirectly as a result of the Master Portfolio’s investments in underlying funds as follows: |
| | | | | | | | | | | | | | | | | | | | |
| | | Year Ended December 31, | |
| | | 2019 | | | 2018 | | | 2017 | | | 2016 | | | 2015 | |
Allocated fees waived | | | 0.01 | % | | | 0.01 | % | | | 0.01 | % | | | 0.01 | % | | | 0.02 | % |
Investments in underlying funds | | | 0.01 | % | | | 0.01 | % | | | 0.01 | % | | | 0.01 | % | | | 0.02 | % |
| | | | | | | | | | | | | | | | | | | | |
| (h) | Includes mortgage dollar roll transactions (“MDRs”). Additional information regarding portfolio turnover rate is as follows: |
| | | | | | | | | | | | | | | | | | | | |
| | | Year Ended December 31, | |
| | | 2019 | | | 2018 | | | 2017 | | | 2016 | | | 2015 | |
Portfolio turnover rate(excluding MDRs) | | | 97 | % | | | 162 | % | | | 193 | % | | | 164 | % | | | 300 | % |
| | | | | | | | | | | | | | | | | | | | |
See notes to financial statements.
| | |
| 12 | | 2019 BLACKROCK ANNUAL REPORTTO SHAREHOLDERS |
Financial Highlights (continued)
(For a share outstanding throughout each period)
| | | | | | | | |
| | | iShares U.S. Aggregate Bond Index Fund | |
| |
| | | Investor P | |
| | | Year Ended
December 31,
2019 | | | Period from
08/06/18 (a) to 12/31/18 | |
| | | |
Net asset value, beginning of period | | $ | 9.85 | | | $ | 9.83 | |
| | | | | | | | |
Net investment income(b) | | | 0.27 | | | | 0.10 | |
Net realized and unrealized gain | | | 0.54 | | | | 0.03 | |
| | | | | | | | |
Net increase from investment operations | | | 0.81 | | | | 0.13 | |
| | | | | | | | |
| | |
Distributions(c) | | | | | | | | |
From net investment income | | | (0.27 | ) | | | (0.11 | ) |
From return of capital | | | — | | | | (0.00 | )(d) |
| | | | | | | | |
Total distributions | | | (0.27 | ) | | | (0.11 | ) |
| | | | | | | | |
| | |
Net asset value, end of period | | $ | 10.39 | | | $ | 9.85 | |
| | | | | | | | |
|
Total Return(e) | |
Based on net asset value | | | 8.32 | %(f) | | | 1.30 | %(g) |
| | | | | | | | |
|
Ratios to Average Net Assets(h)(i) | |
Total expenses | | | 0.35 | % | | | 0.34 | %(j) |
| | | | | | | | |
Total expenses after fees waived and/or reimbursed | | | 0.35 | % | | | 0.34 | %(j) |
| | | | | | | | |
Net investment income | | | 2.54 | % | | | 2.61 | %(j) |
| | | | | | | | |
|
Supplemental Data | |
Net assets, end of period (000) | | $ | 2,714 | | | $ | 277 | |
| | | | | | | | |
Portfolio turnover rate of the Master Portfolio(k) | | | 158 | % | | | 274 | % |
| | | | | | | | |
| (a) | Commencement of operations. |
| (b) | Based on average shares outstanding. |
| (c) | Distributions for annual periods determined in accordance with U.S. federal income tax regulations. |
| (d) | Amount is greater than $(0.005) per share. |
| (e) | Where applicable, excludes the effects of any sales charges and assumes the reinvestment of distributions. |
| (f) | Includes payment received from an affiliate, which had no impact on the Fund’s total return. |
| (g) | Aggregate total return. |
| (h) | Includes the Fund’s share of the Master Portfolio’s allocated expenses and/or net investment income. |
| (i) | Includes the Fund’s share of its corresponding Master Portfolio’s allocated fees waived and expenses and/or net investment income. Excludes expenses incurred indirectly as a result of the Master Portfolio’s investments in underlying funds as follows: |
| | | | | | | | | | | | | | | | |
| | | Year Ended
December 31,
2019 | | | | | | Period from 08/06/18 (a) to 12/31/18 | | | | |
Allocated fees waived | | | 0.01 | % | | | | | | | 0.01 | % | | | | |
Investments in underlying funds | | | 0.01 | % | | | | | | | 0.01 | % | | | | |
| | | | | | | | | | | | | | | | |
| (k) | Includes mortgage dollar roll transactions (“MDRs”). Additional information regarding portfolio turnover rate is as follows: |
| | | | | | | | | | | | | | | | |
| | | Year Ended
December 31,
2019 | | | | | | Period from 08/06/18 (a) to 12/31/18 | | | | |
| | | | | | | | | | | | | | | | |
Portfolio turnover rate(excluding MDRs) | | | 97 | % | | | | | | | 162 | % | | | | |
| | | | | | | | | | | | | | | | |
See notes to financial statements.
Notes to Financial Statements
BlackRock Funds III (the “Trust”) is registered under the Investment Company Act of 1940, as amended (the “1940 Act”), as anopen-end management investment company. The Trust is organized as a Delaware statutory trust. iShares U.S. Aggregate Bond Index Fund (the “Fund”) is a series of the Trust. The Fund is classified as diversified.
The Fund seeks to achieve its investment objective by investing all of its assets in U.S. Total Bond Index Master Portfolio (the “Master Portfolio”), a series of Master Investment Portfolio (“MIP”), an affiliate of the Trust, which has the same investment objective and strategies as the Fund. The value of the Fund’s investment in the Master Portfolio reflects the Fund’s proportionate interest in the net assets of the Master Portfolio. The performance of the Fund is directly affected by the performance of the Master Portfolio. At December 31, 2019, the percentage of the Master Portfolio owned by the Fund was 18.27%. The financial statements of the Master Portfolio, including the Schedule of Investments, are included elsewhere in this report and should be read in conjunction with the Fund’s financial statements.
The Fund offers multiple classes of shares. All classes of shares have identical voting, dividend, liquidation and other rights and are subject to the same terms and conditions, except that certain classes bear expenses related to the shareholder servicing and distribution of such shares. Institutional and Class K Shares are sold without a sales charge and only to certain eligible investors. Investor A and Investor P Shares bear certain expenses related to shareholder servicing of such shares. Investor A Shares are generally available through financial intermediaries. Investor P Shares are only available through registered representatives of an insurance company’s broker-dealer that has entered into an agreement with the Fund’s distributor to offer such shares. Each class has exclusive voting rights with respect to matters relating to its shareholder servicing and distribution expenditures.
| | | | | | | | |
| Share Class | | Initial Sales Charge | | CDSC | | | Conversion Privilege |
Institutional, Investor A and Class K Shares | | No | | | No | | | None |
Investor P Shares | | Yes | | | No | (a) | | None |
| | (a) | Investor P Shares may be subject to a contingent deferred sales charge (“CDSC”) for certain redemptions where no initial sales charge was paid at the time of purchase. | |
The Board of Trustees of the Trust and Board of Trustees of MIP are referred to throughout this report as the “Board of Trustees” or the “Board” and the members are referred to as “Trustees.”
The Fund, together with certain other registered investment companies advised by BlackRock Fund Advisors (“BFA” or the “Manager”) or its affiliates, is included in a complex of equity, multi-asset, index and money market funds referred to as the BlackRock Multi-Asset Complex.
| 2. | SIGNIFICANT ACCOUNTING POLICIES |
The financial statements are prepared in conformity with accounting principles generally accepted in the United States of America (“U.S. GAAP”), which may require management to make estimates and assumptions that affect the reported amounts of assets and liabilities in the financial statements, disclosure of contingent assets and liabilities at the date of the financial statements and the reported amounts of increases and decreases in net assets from operations during the reporting period. Actual results could differ from those estimates. The Fund is considered an investment company under U.S. GAAP and follows the accounting and reporting guidance applicable to investment companies. Below is a summary of significant accounting policies:
Investment Transactions and Income Recognition:For financial reporting purposes, contributions to and withdrawals from the Master Portfolio are accounted for on a trade date basis. The Fund records its proportionate share of the Master Portfolio’s income, expenses and realized and unrealized gains and losses on a daily basis. Realized and unrealized gains and losses are adjusted utilizing partnership tax allocation rules. In addition, the Fund accrues its own expenses. Income, expenses and realized and unrealized gains and losses are allocated daily to each class based on its relative net assets.
Distributions: Distributions from net investment income are declared daily and paid monthly. Distributions of capital gains are recorded on theex-dividend date and made at least annually. The portion of distributions, if any, that exceeds a fund’s current and accumulated earnings and profits, as measured on a tax basis, constitutes anon-taxable return of capital. The character and timing of distributions are determined in accordance with U.S. federal income tax regulations, which may differ from U.S. GAAP.
Indemnifications:In the normal course of business, the Fund enters into contracts that contain a variety of representations that provide general indemnification. The Fund’s maximum exposure under these arrangements is unknown because it involves future potential claims against the Fund, which cannot be predicted with any certainty.
Other: Expenses directly related to the Fund or its classes are charged to the Fund or the applicable class. Other operating expenses shared by several funds, including other funds managed by the Manager, are prorated among those funds on the basis of relative net assets or other appropriate methods. Expenses directly related to the Fund and other shared expenses prorated to the Fund are allocated daily to each class based on its relative net assets or other appropriate methods.
| 3. | INVESTMENT VALUATION AND FAIR VALUE MEASUREMENTS |
Investment Valuation Policies: The Fund’s policy is to value its financial instruments at fair value. The Fund records its investment in the Master Portfolio at fair value based on the Fund’s proportionate interest in the net assets of the Master Portfolio. Valuation of securities held by the Master Portfolio is discussed in Note 3 of the Master Portfolio’s Notes to Financial Statements, which are included elsewhere in this report.
| | |
| 14 | | 2019 BLACKROCK ANNUAL REPORTTO SHAREHOLDERS |
Notes to Financial Statements (continued)
| 4. | ADMINISTRATION AGREEMENT AND OTHER TRANSACTIONS WITH AFFILIATES |
Administration:The Trust, on behalf of the Fund, entered into an Administration Agreement with BlackRock Advisors, LLC (“BAL”), which has agreed to provide general administrative services (other than investment advice and related portfolio activities). BAL has agreed to bear all of the Fund’s ordinary operating expenses, excluding, generally, investment advisory fees, distribution fees, brokerage and other expenses related to the execution of portfolio transactions, extraordinary expenses and certain other expenses which are borne by the Fund. BAL is entitled to receive for these administrative services an annual fee based on the average daily net assets of the Fund as follows:
| | | | | | | | | | | | | | | | | | | | |
| Institutional | | | | | Investor A | | | | | Class K | | | | | Investor P | |
| | 0.06% | | | | | | 0.06% | | | | | | 0.01% | | | | | | 0.06% | |
For the year ended December 31, 2019, the following table shows the class specific administration fees borne directly by each share class of the Fund:
| | | | | | | | | | | | | | | | | | | | | | | | | | |
| Institutional | | | | | Investor A | | | | | Class K | | | | | Investor P | | | | | Total | |
| $ | 107,104 | | | | | $ | 75,495 | | | | | $ | 134,063 | | | | | $ | 690 | | | | | $ | 317,352 | |
From time to time, BAL may waive such fees in whole or in part. Any such waiver will reduce the expenses of the Fund and, accordingly, have a favorable impact on its performance. BAL may delegate certain of its administration duties tosub-administrators. For the year ended December 31, 2019, BAL did not waive any amount.
Service and Distribution Fees: The Trust, on behalf of the Fund, entered into a Distribution Agreement and a Distribution and Service Plan with BlackRock Investments, LLC (“BRIL”), an affiliate of the Administrator. Pursuant to the Distribution and Service Plan and in accordance with Rule12b-1 under the 1940 Act, the Fund pays BRIL ongoing service fees. The fees are accrued daily and paid monthly at an annual rate of 0.25% based upon the average daily net assets of Investor A Shares and Investor P Shares.
BRIL and broker-dealers, pursuant tosub-agreements with BRIL, provide shareholder servicing and distribution services to the Fund. The ongoing service and/or distribution fee compensates/reimburses BRIL and each broker-dealer for providing shareholder servicing and/or distribution related services to shareholders.
For the year ended December 31, 2019, the following table shows the class specific service fees borne directly by each share class of the Fund:
| | | | | | | | | | | | | | |
| Investor A | | | | | Investor P | | | | | Total | |
| $ | 314,649 | | | | | $ | 2,890 | | | | | $ | 317,539 | |
Other Fees:For the year ended December 31, 2019, affiliates earned underwriting discounts, direct commissions and dealer concessions on sales of the Fund’s Investor P Shares, which totaled $1,834.
For the year ended December 31, 2019, affiliates received CDSCs of $72 for Investor P Shares.
Expense Limitations, Waivers, Reimbursements, and Recoupments:The fees and expenses of the Trust’s trustees who are not “interested persons” of the Trust, as defined in the 1940 Act (“Independent Trustees”), counsel to the Independent Trustees and the Trust’s independent registered public accounting firm (together, the “independent expenses”) are paid directly by the Fund. Each of BAL and BFA, as applicable, has contractually agreed to reimburse the Fund or provide an offsetting credit against the administration fees paid by the Fund in an amount equal to these independent expenses through April 30, 2020. For the year ended December 31, 2019, the amount waived was $12,195.
Interfund Lending: In accordance with an exemptive order (the “Order”) from the U.S. Securities and Exchange Commission (“SEC”), the Fund may participate in a joint lending and borrowing facility for temporary purposes (the “Interfund Lending Program”), subject to compliance with the terms and conditions of the Order, and to the extent permitted by the Fund’s investment policies and restrictions. The Fund is currently permitted to borrow and lend under the Interfund Lending Program.
A lending BlackRock fund may lend in aggregate up to 15% of its net assets, but may not lend more than 5% of its net assets to any one borrowing fund through the Interfund Lending Program. A borrowing BlackRock fund may not borrow through the Interfund Lending Program or from any other source more than 33 1/3% of its total assets (or any lower threshold provided for by the fund’s investment restrictions). If a borrowing BlackRock fund’s total outstanding borrowings exceed 10% of its total assets, each of its outstanding interfund loans will be subject to collateralization of at least 102% of the outstanding principal value of the loan. All interfund loans are for temporary or emergency purposes and the interest rate to be charged will be the average of the highest current overnight repurchase agreement rate available to a lending fund and the bank loan rate, as calculated according to a formula established by the Board.
During the year ended December 31, 2019, the Fund did not participate in the Interfund Lending Program.
Trustees and Officers:Certain trustees and/or officers of the Trust are directors and/or officers of BlackRock or its affiliates.
It is the Fund’s policy to comply with the requirements of the Internal Revenue Code of 1986, as amended, applicable to regulated investment companies, and to distribute substantially all of its taxable income to its shareholders. Therefore, no U.S. federal income tax provision is required.
The Fund files U.S. federal and various state and local tax returns. No income tax returns are currently under examination. The statute of limitations on the Fund’s U.S. federal tax returns generally remains open for each of the four years ended December 31, 2019. The statutes of limitations on the Fund’s state and local tax returns may remain open for an additional year depending upon the jurisdiction.
| | | | |
| NOTESTO FINANCIAL STATEMENTS | | | 15 | |
Notes to Financial Statements (continued)
Management has analyzed tax laws and regulations and their application to the Fund as of December 31, 2019, inclusive of the open tax return years, and does not believe that there are any uncertain tax positions that require recognition of a tax liability in the Fund’s financial statements.
The tax character of distributions paid was as follows:
| | | | | | | | |
| | | 12/31/19 | | | 12/31/18 | |
Ordinary income | | $ | 48,469,960 | | | $ | 31,124,360 | |
Return of capital | | | — | | | | 16,807 | |
| | | | | | | | |
| | $ | 48,469,960 | | | $ | 31,141,167 | |
| | | | | | | | |
As of period end, the tax components of accumulated earnings were as follows:
| | | | |
Undistributed ordinary income | | $ | 9,322 | |
Non-expiring Capital loss carryforwards(a) | | | (6,508,092 | ) |
Net unrealized gains(b) | | | 62,491,735 | |
| | | | |
| | $ | 55,992,965 | |
| | | | |
| | (a) | Amounts available to offset future realized capital gains. | |
| | (b) | The difference between book-basis andtax-basis net unrealized gains was attributable primarily to the timing and recognition of partnership income. | |
During the year ended December 31, 2019, the Fund utilized $2,880,973 of its capital loss carryforward.
| 6. | CAPITAL SHARE TRANSACTIONS |
Transactions in capital shares for each class were as follows:
| | | | | | | | | | | | | | | | |
| | | Year Ended
12/31/19 | | | Year Ended
12/31/18 | |
| | | Shares | | | Amount | | | Shares | | | Amount | |
Institutional | | | | | | | | | | | | | | | | |
Shares sold | | | 17,058,082 | | | $ | 172,024,769 | | | | 10,611,905 | | | $ | 103,995,282 | |
Shares issued in reinvestment of distributions | | | 504,982 | | | | 5,169,750 | | | | 338,915 | | | | 3,320,601 | |
Shares redeemed | | | (14,794,426 | ) | | | (149,308,238 | ) | | | (5,410,391 | ) | | | (53,156,868 | ) |
| | | | | | | | | | | | | | | | |
Net increase | | | 2,768,638 | | | $ | 27,886,281 | | | | 5,540,429 | | | $ | 54,159,015 | |
| | | | | | | | | | | | | | | | |
| | | | |
Investor A | | | | | | | | | | | | | | | | |
Shares sold | | | 6,256,906 | | | $ | 63,943,486 | | | | 7,603,618 | | | $ | 74,842,788 | |
Shares issued in reinvestment of distributions | | | 320,092 | | | | 3,277,425 | | | | 307,740 | | | | 3,018,107 | |
Shares redeemed | | | (7,741,876 | ) | | | (79,075,805 | ) | | | (7,079,417 | ) | | | (69,658,569 | ) |
| | | | | | | | | | | | | | | | |
Net increase (decrease) | | | (1,164,878 | ) | | $ | (11,854,894 | ) | | | 831,941 | | | $ | 8,202,326 | |
| | | | | | | | | | | | | | | | |
| | | | |
Class K | | | | | | | | | | | | | | | | |
Shares sold | | | 93,270,582 | | | $ | 957,362,242 | | | | 65,903,541 | | | $ | 647,766,551 | |
Shares issued in reinvestment of distributions | | | 3,642,925 | | | | 37,420,389 | | | | 2,464,274 | | | | 24,169,734 | |
Shares redeemed | | | (34,792,319 | ) | | | (356,492,335 | ) | | | (38,677,132 | ) | | | (379,721,218 | ) |
| | | | | | | | | | | | | | | | |
Net increase | | | 62,121,188 | | | $ | 638,290,296 | | | | 29,690,683 | | | $ | 292,215,067 | |
| | | | | | | | | | | | | | | | |
| | |
| | | | | | Period from
08/06/18 (a)
to 12/31/18 | |
| | | | |
Investor P | | | | | | | | | | | | | | | | |
Shares sold | | | 251,721 | | | $ | 2,603,182 | | | | 28,116 | | | $ | 275,976 | |
Shares issued in reinvestment of distributions | | | 2,681 | | | | 27,817 | | | | 19 | | | | 187 | |
Shares redeemed | | | (21,283 | ) | | | (219,665 | ) | | | (1 | ) | | | (8 | ) |
| | | | | | | | | | | | | | | | |
Net increase | | | 233,119 | | | $ | 2,411,334 | | | | 28,134 | | | $ | 276,155 | |
| | | | | | | | | | | | | | | | |
Total Net Increase | | | 63,958,067 | | | $ | 656,733,017 | | | | 36,091,187 | | | $ | 354,852,563 | |
| | | | | | | | | | | | | | | | |
| | (a) | Commencement of operations | |
| | |
| 16 | | 2019 BLACKROCK ANNUAL REPORTTO SHAREHOLDERS |
Notes to Financial Statements (continued)
As of December 31, 2019, BlackRock Financial Management, Inc., an affiliate of the Fund, owned 20,346 Investor P Shares of the Fund.
Management has evaluated the impact of all subsequent events on the Fund through the date the financial statements were issued and has determined that there were no subsequent events requiring adjustment or additional disclosure in the financial statements.
| | | | |
| NOTESTO FINANCIAL STATEMENTS | | | 17 | |
| | |
Report of Independent Registered Public Accounting Firm | | iShares U.S. Aggregate Bond Index Fund |
To the Board of Trustees of
BlackRock Funds III and Shareholders of iShares U.S. Aggregate Bond Index Fund
Opinion on the Financial Statements
We have audited the accompanying statement of assets and liabilities of iShares U.S. Aggregate Bond Index Fund (one of the series constituting BlackRock Funds III, referred to hereafter as the “Fund”) as of December 31, 2019, the related statement of operations for the year ended December 31, 2019, the statements of changes in net assets for each of the two years in the period ended December 31, 2019, including the related notes, and the financial highlights for each of the periods indicated therein (collectively referred to as the “financial statements”). In our opinion, the financial statements present fairly, in all material respects, the financial position of the Fund as of December 31, 2019, the results of its operations for the year then ended, the changes in its net assets for each of the two years in the period ended December 31, 2019 and the financial highlights for each of the periods indicated therein in conformity with accounting principles generally accepted in the United States of America.
Basis for Opinion
These financial statements are the responsibility of the Fund’s management. Our responsibility is to express an opinion on the Fund’s financial statements based on our audits. We are a public accounting firm registered with the Public Company Accounting Oversight Board (United States) (“PCAOB”) and are required to be independent with respect to the Fund in accordance with the U.S. federal securities laws and the applicable rules and regulations of the Securities and Exchange Commission and the PCAOB.
We conducted our audits of these financial statements in accordance with the standards of the PCAOB. Those standards require that we plan and perform the audit to obtain reasonable assurance about whether the financial statements are free of material misstatement, whether due to error or fraud.
Our audits included performing procedures to assess the risks of material misstatement of the financial statements, whether due to error or fraud, and performing procedures that respond to those risks. Such procedures included examining, on a test basis, evidence regarding the amounts and disclosures in the financial statements. Our audits also included evaluating the accounting principles used and significant estimates made by management, as well as evaluating the overall presentation of the financial statements. Our procedures included confirmation of securities owned as of December 31, 2019 by correspondence with the administrator of the Master Portfolio. We believe that our audits provide a reasonable basis for our opinion.
/s/PricewaterhouseCoopers LLP
Philadelphia, Pennsylvania
February 27, 2020
We have served as the auditor of one or more BlackRock investment companies since 2000.
Important Tax Information (unaudited)
During the fiscal year ended December 31, 2019, the following information is provided with respect to the ordinary income distributions paid by the Fund:
| | |
Federal Obligation Interest(a) | | 31.42% |
Interest-Related Dividends for Non-U.S. Residents(b) | | 83.10 |
| | (a) | The law varies in each state as to whether and what percentage of dividend income attributable to federal obligations is exempt from state income tax. We recommend that you consult your tax advisor to determine if any portion of the dividends you received is exempt from state income taxes. | |
| | (b) | Represents the portion of the taxable ordinary income dividends eligible for exemption from U.S. withholding tax for nonresident aliens and foreign corporations. | |
| | |
| 18 | | 2019 BLACKROCK ANNUAL REPORTTO SHAREHOLDERS |
| | |
| Master Portfolio Information as of December 31, 2019 | | U.S. Total Bond Index Master Portfolio |
PORTFOLIO COMPOSITION
| | | | |
| Asset Type | | Percent of
Total Investments | |
U.S. Treasury Obligations | | | 34 | % |
U.S. Government Sponsored Agency Securities | | | 25 | |
Corporate Bonds | | | 21 | |
Foreign Agency Obligations | | | 3 | |
Non-Agency Mortgage-Backed Securities | | | 1 | |
Municipal Bonds | | | 1 | |
Asset-Backed Securities | | | — | (a) |
Preferred Securities | | | — | (a) |
Short-Term Securities | | | 16 | |
TBA Sale Commitments | | | (1 | ) |
| | (a) | Represents less than 1%. | |
CREDIT QUALITY ALLOCATION (b)
| | | | |
| Credit Rating | | Percent of Total Investments (c) | |
AAA/Aaa(d) | | | 73 | % |
AA/Aa | | | 4 | |
A | | | 12 | |
BBB/Baa | | | 11 | |
N/R | | | — | (a) |
| | (b) | For financial reporting purposes, credit quality ratings shown above reflect the highest rating assigned by either S&P Global Ratings or Moody’s Investors Service. These rating agencies are independent, nationally recognized statistical rating organizations and are widely used. Investment grade ratings are credit ratings of BBB/Baa or higher. Below investment grade ratings are credit ratings of BB/Ba or lower. Investments designated N/R are not rated by either rating agency. Unrated investments do not necessarily indicate low credit quality. Credit quality ratings are subject to change. | |
| | (c) | Excludes short-term securities. | |
| | (d) | The investment adviser evaluates the credit quality of not-rated investments based upon certain factors including, but not limited to, credit ratings for similar investments and financial analysis of sectors, individual investments and/or issuer. Using this approach, the investment adviser has deemed U.S. Government Sponsored Agency Securities and U.S. Treasury Obligations as AAA/Aaa. | |
| | | | |
| MASTER PORTFOLIO INFORMATION | | | 19 | |
| | |
Schedule of Investments December 31, 2019 | | U.S. Total Bond Index Master Portfolio (Percentages shown are based on Net Assets) |
| | | | | | | | |
| Security | | Par
(000) | | | Value | |
|
Asset-Backed Securities — 0.5% | |
American Express Credit Account Master Trust,Series 2019-1, Class A, 2.87%, 10/15/24 | | $ | 4,530 | | | $ | 4,628,403 | |
Americredit Automobile Receivables Trust,Series 2018-1, Class D, 3.82%, 03/18/24 | | | 4,000 | | | | 4,139,715 | |
Citibank Credit Card Issuance Trust: | | | | | | | | |
Series2014-A5, Class A5, 2.68%, 06/07/23 | | | 6,870 | | | | 6,950,340 | |
Series2016-A2, Class A2, 2.19%, 11/20/23 | | | 9,750 | | | | 9,805,525 | |
Series2017-A3, Class A3, 1.92%, 04/07/22 | | | 3,600 | | | | 3,599,807 | |
Ford Credit Auto Owner Trust,Series 2017-C, Class A4, 2.16%, 03/15/23 | | | 3,250 | | | | 3,259,736 | |
Honda Auto Receivables Owner Trust,Series 2017-4, Class A4, 2.21%, 03/21/24 | | | 6,525 | | | | 6,548,834 | |
Nissan Auto Receivables2019-B Owner Trust,Series 2019-B, Class A4, 2.54%, 12/15/25 | | | 6,000 | | | | 6,098,830 | |
Synchrony Credit Card Master Note Trust, Class A: | | | | | | | | |
Series2015-1, 2.37%, 03/15/23 | | | 3,000 | | | | 3,002,336 | |
Series2018-2, 3.47%, 05/15/26 | | | 3,415 | | | | 3,565,988 | |
| | | | | | | | |
| |
Total Asset-Backed Securities — 0.5%
(Cost — $50,752,493) | | | | 51,599,514 | |
| | | | | | | | |
|
Corporate Bonds — 25.5% | |
|
| Aerospace & Defense — 0.4% | |
Boeing Co.: | | | | | | | | |
2.30%, 08/01/21(a) | | | 300 | | | | 301,698 | |
2.35%, 10/30/21 | | | 75 | | | | 75,729 | |
2.13%, 03/01/22 | | | 250 | | | | 250,670 | |
1.88%, 06/15/23(a) | | | 500 | | | | 496,875 | |
2.70%, 02/01/27 | | | 230 | | | | 233,199 | |
2.80%, 03/01/27 | | | 1,000 | | | | 1,016,216 | |
3.20%, 03/01/29(a) | | | 1,000 | | | | 1,042,921 | |
2.95%, 02/01/30(a) | | | 570 | | | | 583,472 | |
6.13%, 02/15/33(a) | | | 100 | | | | 130,487 | |
3.25%, 02/01/35 | | | 600 | | | | 614,078 | |
3.30%, 03/01/35 | | | 65 | | | | 65,266 | |
3.38%, 06/15/46 | | | 250 | | | | 244,329 | |
3.85%, 11/01/48 | | | 1,000 | | | | 1,062,384 | |
3.90%, 05/01/49(a) | | | 750 | | | | 814,233 | |
3.75%, 02/01/50(a) | | | 540 | | | | 574,299 | |
3.95%, 08/01/59 | | | 500 | | | | 534,091 | |
Embraer Netherlands Finance BV: | | | | | | | | |
5.05%, 06/15/25 | | | 250 | | | | 273,906 | |
5.40%, 02/01/27(a) | | | 500 | | | | 563,438 | |
General Dynamics Corp.: | | | | | | | | |
3.00%, 05/11/21 | | | 3,000 | | | | 3,050,488 | |
3.88%, 07/15/21(a) | | | 50 | | | | 51,359 | |
2.25%, 11/15/22 | | | 500 | | | | 505,366 | |
3.38%, 05/15/23 | | | 500 | | | | 522,448 | |
3.50%, 05/15/25 | | | 1,000 | | | | 1,071,675 | |
2.13%, 08/15/26 | | | 500 | | | | 495,939 | |
3.75%, 05/15/28 | | | 500 | | | | 550,550 | |
L3Harris Technologies, Inc.: | | | | | | | | |
3.83%, 04/27/25 | | | 500 | | | | 533,625 | |
4.85%, 04/27/35(a) | | | 1,065 | | | | 1,257,354 | |
4.95%, 02/15/21(a)(b) | | | 250 | | | | 256,147 | |
4.40%, 06/15/28(b) | | | 250 | | | | 278,727 | |
2.90%, 12/15/29 | | | 200 | | | | 203,175 | |
Lockheed Martin Corp.: | | | | | | | | |
3.35%, 09/15/21 | | | 1,000 | | | | 1,025,054 | |
3.55%, 01/15/26 | | | 2,250 | | | | 2,413,931 | |
3.60%, 03/01/35(a) | | | 65 | | | | 71,080 | |
4.07%, 12/15/42 | | | 100 | | | | 114,199 | |
3.80%, 03/01/45 | | | 1,500 | | | | 1,666,109 | |
| | | | | | | | |
| Security | | Par
(000) | | | Value | |
|
| Aerospace & Defense (continued) | |
4.70%, 05/15/46 | | $ | 750 | | | $ | 953,677 | |
4.09%, 09/15/52(a) | | | 500 | | | | 586,696 | |
Northrop Grumman Corp.: | | | | | | | | |
3.25%, 08/01/23(a) | | | 500 | | | | 521,275 | |
2.93%, 01/15/25(a) | | | 1,000 | | | | 1,031,200 | |
3.25%, 01/15/28 | | | 2,000 | | | | 2,087,338 | |
4.75%, 06/01/43(a) | | | 375 | | | | 453,263 | |
4.03%, 10/15/47(a) | | | 1,500 | | | | 1,675,640 | |
Raytheon Co.: | | | | | | | | |
4.88%, 10/15/40(a) | | | 250 | | | | 313,449 | |
4.70%, 12/15/41 | | | 100 | | | | 124,000 | |
Rockwell Collins, Inc.: | | | | | | | | |
2.80%, 03/15/22 | | | 1,000 | | | | 1,017,605 | |
3.50%, 03/15/27 | | | 1,000 | | | | 1,062,145 | |
4.35%, 04/15/47 | | | 1,000 | | | | 1,177,739 | |
United Technologies Corp.: | | | | | | | | |
3.35%, 08/16/21 | | | 400 | | | | 409,599 | |
1.95%, 11/01/21 | | | 250 | | | �� | 250,545 | |
3.10%, 06/01/22 | | | 600 | | | | 615,624 | |
3.65%, 08/16/23 | | | 1,250 | | | | 1,318,009 | |
2.65%, 11/01/26(a) | | | 1,000 | | | | 1,023,854 | |
3.13%, 05/04/27(a) | | | 1,000 | | | | 1,049,399 | |
4.13%, 11/16/28(a) | | | 3,000 | | | | 3,375,282 | |
4.45%, 11/16/38(a) | | | 500 | | | | 591,683 | |
5.70%, 04/15/40(a) | | | 300 | | | | 403,948 | |
4.50%, 06/01/42(a) | | | 1,700 | | | | 2,038,167 | |
4.15%, 05/15/45 | | | 500 | | | | 573,508 | |
3.75%, 11/01/46 | | | 750 | | | | 817,324 | |
4.05%, 05/04/47 | | | 500 | | | | 573,575 | |
4.63%, 11/16/48 | | | 1,250 | | | | 1,566,473 | |
| | | | | | | | |
| | | | | | | 48,555,534 | |
|
| Air Freight & Logistics — 0.1% | |
FedEx Corp.: | | | | | | | | |
4.00%, 01/15/24(a) | | | 250 | | | | 267,539 | |
3.25%, 04/01/26(a) | | | 545 | | | | 567,257 | |
3.30%, 03/15/27 | | | 500 | | | | 517,057 | |
3.10%, 08/05/29(a) | | | 1,000 | | | | 999,291 | |
3.90%, 02/01/35 | | | 190 | | | | 193,694 | |
3.88%, 08/01/42(a) | | | 50 | | | | 48,236 | |
4.75%, 11/15/45 | | | 160 | | | | 168,502 | |
4.55%, 04/01/46 | | | 750 | | | | 771,464 | |
4.40%, 01/15/47 | | | 500 | | | | 502,305 | |
4.05%, 02/15/48 | | | 1,000 | | | | 966,225 | |
4.95%, 10/17/48 | | | 1,000 | | | | 1,093,258 | |
United Parcel Service, Inc.: | | | | | | | | |
3.13%, 01/15/21 | | | 500 | | | | 505,969 | |
2.05%, 04/01/21 | | | 500 | | | | 501,339 | |
2.45%, 10/01/22 | | | 500 | | | | 508,016 | |
2.50%, 04/01/23(a) | | | 2,000 | | | | 2,036,805 | |
2.40%, 11/15/26(a) | | | 2,000 | | | | 2,022,028 | |
3.05%, 11/15/27 | | | 500 | | | | 525,981 | |
6.20%, 01/15/38(a) | | | 100 | | | | 139,311 | |
3.63%, 10/01/42 | | | 250 | | | | 255,526 | |
3.40%, 11/15/46(a) | | | 220 | | | | 219,462 | |
3.75%, 11/15/47(a) | | | 500 | | | | 538,835 | |
4.25%, 03/15/49 | | | 1,000 | | | | 1,171,366 | |
3.40%, 09/01/49 | | | 300 | | | | 303,980 | |
| | | | | | | | |
| | | | | | | 14,823,446 | |
|
| Airlines — 0.1% | |
American Airlines Pass-Through Trust: | | | | | | | | |
Series2013-2, Class A, 4.95%, 07/15/24 | | | 99 | | | | 103,539 | |
Series2016-2, Class AA, 3.20%, 12/15/29 | | | 427 | | | | 439,388 | |
Series2019-1, Class AA, 3.15%, 08/15/33 | | | 1,000 | | | | 1,028,219 | |
| | |
| 20 | | 2019 BLACKROCK ANNUAL REPORTTO SHAREHOLDERS |
| | |
Schedule of Investments (continued) December 31, 2019 | | U.S. Total Bond Index Master Portfolio (Percentages shown are based on Net Assets) |
| | | | | | | | |
| Security | | Par
(000) | | | Value | |
|
| Airlines (continued) | |
Continental Airlines Pass-Through Trust,Series 2012-1, Class A, 4.15%, 10/11/25 | | $ | 34 | | | $ | 35,729 | |
Continental Airlines, Inc. Pass Through Trust,Series 2-A, 4.00%, 04/29/26 | | | 350 | | | | 369,032 | |
Delta Air Lines Pass-Through Trust,Series 2019-1, Class AA, 3.20%, 10/25/25 | | | 1,000 | | | | 1,040,253 | |
Delta Air Lines, Inc., 3.75%, 10/28/29 | | | 1,000 | | | | 998,410 | |
JetBlue2019-1 Class AA Pass Through Trust, Series AA, 2.75%, 11/15/33(a) | | | 940 | | | | 951,840 | |
United Airlines Pass-Through Trust: | | | | | | | | |
Series2013-1, Class A, 4.30%, 02/15/27 | | | 151 | | | | 161,320 | |
Series2016-1, Class AA, 3.10%, 01/07/30 | | | 447 | | | | 458,273 | |
Series AA, 2.70%, 11/01/33 | | | 1,350 | | | | 1,355,255 | |
US Airways Pass Through Trust,Series 2013-1 Class A, 3.95%, 05/15/27 | | | 163 | | | | 171,545 | |
| | | | | | | | |
| | | | | | | 7,112,803 | |
|
| Auto Components — 0.1% | |
American Honda Finance Corp.: | | | | | | | | |
1.65%, 07/12/21(a) | | | 750 | | | | 748,269 | |
1.95%, 05/20/22 | | | 300 | | | | 301,089 | |
2.05%, 01/10/23 | | | 895 | | | | 898,428 | |
3.63%, 10/10/23 | | | 2,000 | | | | 2,112,076 | |
2.40%, 06/27/24(a) | | | 1,000 | | | | 1,011,192 | |
2.15%, 09/10/24 | | | 1,000 | | | | 1,000,788 | |
2.30%, 09/09/26 | | | 1,000 | | | | 998,241 | |
Aptiv PLC, 4.40%, 10/01/46(a) | | | 500 | | | | 481,962 | |
BorgWarner, Inc., 3.38%, 03/15/25 | | | 70 | | | | 73,240 | |
Daimler Finance North America LLC, 8.50%, 01/18/31 | | | 600 | | | | 893,041 | |
Lear Corp., 4.25%, 05/15/29 | | | 1,000 | | | | 1,033,702 | |
PACCAR Financial Corp., 2.00%, 09/26/22 | | | 2,180 | | | | 2,192,390 | |
Toyota Motor Corp.: | | | | | | | | |
2.36%, 07/02/24 | | | 500 | | | | 507,085 | |
2.76%, 07/02/29 | | | 185 | | | | 189,833 | |
Toyota Motor Credit Corp., 2.00%, 10/07/24 | | | 3,000 | | | | 3,000,406 | |
| | | | | | | | |
| | | | | | | 15,441,742 | |
|
| Automobiles — 0.1% | |
Ford Motor Co.: | | | | | | | | |
4.35%, 12/08/26 | | | 750 | | | | 774,989 | |
7.45%, 07/16/31 | | | 150 | | | | 178,269 | |
4.75%, 01/15/43 | | | 1,850 | | | | 1,644,231 | |
5.29%, 12/08/46 | | | 500 | | | | 476,447 | |
General Motors Co.: | | | | | | | | |
4.88%, 10/02/23 | | | 600 | | | | 643,955 | |
4.00%, 04/01/25(a) | | | 2,000 | | | | 2,108,491 | |
4.20%, 10/01/27 | | | 2,000 | | | | 2,091,787 | |
5.00%, 04/01/35 | | | 750 | | | | 775,292 | |
6.60%, 04/01/36(a) | | | 250 | | | | 295,075 | |
5.15%, 04/01/38 | | | 500 | | | | 511,492 | |
5.20%, 04/01/45 | | | 250 | | | | 252,501 | |
6.75%, 04/01/46 | | | 275 | | | | 322,610 | |
5.40%, 04/01/48 | | | 500 | | | | 517,849 | |
5.95%, 04/01/49 | | | 1,000 | | | | 1,108,612 | |
| | | | | | | | |
| | | | | | | 11,701,600 | |
|
| Banks — 2.7% | |
Australia & New Zealand Banking Group Ltd.: | | | | | | | | |
3.30%, 05/17/21 | | | 1,000 | | | | 1,019,541 | |
2.30%, 06/01/21 | | | 1,000 | | | | 1,005,411 | |
2.05%, 11/21/22 | | | 1,705 | | | | 1,711,064 | |
Bancolombia SA, 5.95%, 06/03/21 | | | 100 | | | | 105,000 | |
Bank of Montreal: | | | | | | | | |
2.35%, 09/11/22(a) | | | 2,000 | | | | 2,027,195 | |
| | | | | | | | |
| Security | | Par
(000) | | | Value | |
|
| Banks (continued) | |
2.50%, 06/28/24 | | $ | 1,000 | | | $ | 1,012,399 | |
Series D, 3.10%, 04/13/21 | | | 1,000 | | | | 1,016,333 | |
Series E, 3.30%, 02/05/24(a) | | | 4,000 | | | | 4,169,606 | |
Bank of New York Mellon Corp.: | | | | | | | | |
2.50%, 04/15/21 | | | 250 | | | | 251,729 | |
2.05%, 05/03/21 | | | 500 | | | | 501,591 | |
3.55%, 09/23/21 | | | 50 | | | | 51,372 | |
2.60%, 02/07/22 | | | 1,000 | | | | 1,015,207 | |
1.95%, 08/23/22 | | | 1,000 | | | | 1,002,209 | |
3.45%, 08/11/23(a) | | | 500 | | | | 525,636 | |
2.20%, 08/16/23 | | | 1,000 | | | | 1,010,233 | |
2.10%, 10/24/24(a) | | | 250 | | | | 250,326 | |
2.80%, 05/04/26 | | | 70 | | | | 71,992 | |
3.25%, 05/16/27 | | | 750 | | | | 788,503 | |
3.85%, 04/28/28(a) | | | 2,000 | | | | 2,237,162 | |
3.30%, 08/23/29 | | | 1,000 | | | | 1,046,965 | |
Series G, 3.00%, 02/24/25 | | | 105 | | | | 109,213 | |
Bank of Nova Scotia: | | | | | | | | |
2.45%, 03/22/21 | | | 500 | | | | 504,046 | |
3.13%, 04/20/21 | | | 1,750 | | | | 1,777,642 | |
2.80%, 07/21/21 | | | 750 | | | | 761,282 | |
2.70%, 03/07/22 | | | 1,000 | | | | 1,017,654 | |
2.45%, 09/19/22(a) | | | 2,000 | | | | 2,030,181 | |
2.00%, 11/15/22 | | | 1,000 | | | | 1,001,614 | |
2.38%, 01/18/23 | | | 475 | | | | 482,167 | |
3.40%, 02/11/24 | | | 1,000 | | | | 1,047,849 | |
4.50%, 12/16/25(a) | | | 250 | | | | 274,653 | |
2.70%, 08/03/26 | | | 1,000 | | | | 1,017,829 | |
Barclays Bank PLC, 2.65%, 01/11/21 | | | 2,000 | | | | 2,013,083 | |
Barclays PLC: | | | | | | | | |
3.25%, 01/12/21(a) | | | 1,250 | | | | 1,260,550 | |
3.20%, 08/10/21(a) | | | 750 | | | | 760,176 | |
3.68%, 01/10/23 | | | 1,500 | | | | 1,538,240 | |
(3 mo. LIBOR US + 1.36%), 4.34%, 05/16/24(c) | | | 2,000 | | | | 2,108,800 | |
3.65%, 03/16/25 | | | 450 | | | | 468,394 | |
4.38%, 01/12/26 | | | 1,000 | | | | 1,080,300 | |
4.34%, 01/10/28(a) | | | 750 | | | | 804,973 | |
(3 mo. LIBOR US + 1.90%), 4.97%, 05/16/29(c) | | | 2,250 | | | | 2,537,124 | |
4.95%, 01/10/47 | | | 1,000 | | | | 1,181,289 | |
BBVA USA: | | | | | | | | |
2.50%, 08/27/24 | | | 1,000 | | | | 991,939 | |
3.88%, 04/10/25 | | | 250 | | | | 262,645 | |
BNP Paribas SA: | | | | | | | | |
3.25%, 03/03/23 | | | 250 | | | | 259,180 | |
5.00%, 01/15/21 | | | 100 | | | | 103,172 | |
4.25%, 10/15/24(a) | | | 250 | | | | 268,242 | |
BPCE SA: | | | | | | | | |
2.65%, 02/03/21 | | | 1,000 | | | | 1,007,021 | |
4.00%, 04/15/24 | | | 250 | | | | 267,489 | |
Canadian Imperial Bank of Commerce: | | | | | | | | |
(3 mo. LIBOR US + 0.79%), 2.61%, 07/22/23(c) | | | 2,000 | | | | 2,021,823 | |
3.50%, 09/13/23 | | | 2,000 | | | | 2,098,942 | |
Citibank NA: | | | | | | | | |
2.85%, 02/12/21 | | | 2,000 | | | | 2,019,542 | |
3.40%, 07/23/21 | | | 750 | | | | 766,106 | |
3.65%, 01/23/24 | | | 500 | | | | 529,319 | |
Citizens Bank NA/Providence RI: | | | | | | | | |
2.55%, 05/13/21 | | | 1,000 | | | | 1,007,690 | |
2.65%, 05/26/22 | | | 250 | | | | 253,112 | |
Citizens Financial Group, Inc., 2.85%, 07/27/26 | | | 1,500 | | | | 1,528,642 | |
Comerica, Inc.: | | | | | | | | |
3.70%, 07/31/23 | | | 250 | | | | 262,815 | |
4.00%, 02/01/29 | | | 1,000 | | | | 1,092,563 | |
| | | | |
| SCHEDULE OF INVESTMENTS | | | 21 | |
| | |
Schedule of Investments (continued) December 31, 2019 | | U.S. Total Bond Index Master Portfolio (Percentages shown are based on Net Assets) |
| | | | | | | | |
| Security | | Par
(000) | | | Value | |
|
| Banks (continued) | |
Cooperatieve Rabobank UA: | | | | | | | | |
2.50%, 01/19/21 | | $ | 4,000 | | | $ | 4,023,911 | |
2.75%, 01/10/22 | | | 2,000 | | | | 2,033,780 | |
3.88%, 02/08/22 | | | 150 | | | | 156,223 | |
3.95%, 11/09/22(a) | | | 1,000 | | | | 1,045,606 | |
2.75%, 01/10/23 | | | 2,000 | | | | 2,039,245 | |
4.63%, 12/01/23(a) | | | 500 | | | | 541,961 | |
3.38%, 05/21/25 | | | 500 | | | | 530,117 | |
4.38%, 08/04/25 | | | 500 | | | | 542,616 | |
3.75%, 07/21/26(a) | | | 500 | | | | 520,993 | |
5.25%, 05/24/41(a) | | | 1,025 | | | | 1,401,170 | |
5.25%, 08/04/45(a) | | | 1,250 | | | | 1,599,621 | |
Credit Suisse AG, 2.10%, 11/12/21 | | | 2,250 | | | | 2,260,649 | |
Credit Suisse AG, New York: | | | | | | | | |
3.00%, 10/29/21 | | | 3,250 | | | | 3,315,247 | |
3.63%, 09/09/24(a) | | | 1,250 | | | | 1,329,883 | |
Discover Bank: | | | | | | | | |
3.20%, 08/09/21 | | | 1,000 | | | | 1,017,581 | |
3.35%, 02/06/23(a) | | | 500 | | | | 515,660 | |
4.20%, 08/08/23 | | | 2,000 | | | | 2,126,229 | |
2.45%, 09/12/24 | | | 600 | | | | 598,927 | |
(5 year USD Swap + 1.73%),
4.68%, 08/09/28(a)(c) | | | 1,000 | | | | 1,045,000 | |
Fifth Third Bancorp: | | | | | | | | |
3.50%, 03/15/22 | | | 100 | | | | 103,140 | |
4.30%, 01/16/24 | | | 250 | | | | 268,748 | |
8.25%, 03/01/38 | | | 425 | | | | 649,415 | |
Fifth Third Bank: | | | | | | | | |
2.25%, 06/14/21(a) | | | 1,000 | | | | 1,005,416 | |
3.35%, 07/26/21(a) | | | 1,000 | | | | 1,022,103 | |
2.88%, 10/01/21 | | | 200 | | | | 203,029 | |
3.95%, 07/28/25 | | | 500 | | | | 543,481 | |
3.85%, 03/15/26 | | | 500 | | | | 532,766 | |
First Republic Bank, 4.63%, 02/13/47(a) | | | 500 | | | | 570,642 | |
HSBC Holdings PLC: | | | | | | | | |
3.40%, 03/08/21 | | | 1,500 | | | | 1,523,833 | |
5.10%, 04/05/21 | | | 500 | | | | 518,579 | |
2.95%, 05/25/21 | | | 500 | | | | 506,351 | |
2.65%, 01/05/22 | | | 1,500 | | | | 1,516,549 | |
4.88%, 01/14/22(a) | | | 150 | | | | 158,382 | |
(3 mo. LIBOR US + 1.06%), 3.26%, 03/13/23(c) | | | 1,000 | | | | 1,022,861 | |
3.60%, 05/25/23 | | | 750 | | | | 782,464 | |
4.25%, 03/14/24(a) | | | 500 | | | | 530,574 | |
(3 mo. LIBOR US + 0.99%), 3.95%, 05/18/24(a)(c) | | | 380 | | | | 399,821 | |
4.25%, 08/18/25(a) | | | 500 | | | | 534,770 | |
(3 mo. LIBOR US + 1.14%), 2.63%, 11/07/25(c) | | | 1,000 | | | | 1,003,989 | |
4.30%, 03/08/26(a) | | | 1,000 | | | | 1,089,057 | |
3.90%, 05/25/26 | | | 1,000 | | | | 1,066,723 | |
(3 mo. LIBOR US + 1.35%), 4.29%, 09/12/26(c) | | | 4,000 | | | | 4,325,702 | |
4.38%, 11/23/26 | | | 2,000 | | | | 2,163,079 | |
(3 mo. LIBOR US + 1.55%), 4.04%, 03/13/28(a)(c) | | | 3,000 | | | | 3,209,905 | |
(3 mo. LIBOR US + 1.53%), 4.58%, 06/19/29(c) | | | 3,000 | | | | 3,354,726 | |
(3 mo. LIBOR US + 1.61%), 3.97%, 05/22/30(a)(c) | | | 1,000 | | | | 1,078,365 | |
6.50%, 05/02/36(a) | | | 200 | | | | 273,332 | |
6.50%, 09/15/37 | | | 750 | | | | 1,036,903 | |
6.80%, 06/01/38(a) | | | 250 | | | | 356,228 | |
6.10%, 01/14/42(a) | | | 1,000 | | | | 1,420,144 | |
5.25%, 03/14/44(a) | | | 1,250 | | | | 1,581,158 | |
Huntington Bancshares, Inc.: | | | | | | | | |
3.15%, 03/14/21 | | | 1,250 | | | | 1,265,512 | |
2.63%, 08/06/24 | | | 775 | | | | 786,073 | |
4.00%, 05/15/25(a) | | | 2,000 | | | | 2,161,319 | |
| | | | | | | | |
| Security | | Par
(000) | | | Value | |
|
| Banks (continued) | |
ING Groep NV: | | | | | | | | |
4.10%, 10/02/23 | | $ | 1,000 | | | $ | 1,063,302 | |
3.95%, 03/29/27 | | | 250 | | | | 269,588 | |
4.55%, 10/02/28 | | | 1,000 | | | | 1,134,741 | |
4.05%, 04/09/29(a) | | | 1,000 | | | | 1,098,837 | |
KeyBank NA: | | | | | | | | |
2.50%, 11/22/21 | | | 1,000 | | | | 1,011,307 | |
3.30%, 02/01/22 | | | 1,000 | | | | 1,027,334 | |
2.30%, 09/14/22 | | | 350 | | | | 353,886 | |
3.38%, 03/07/23 | | | 250 | | | | 259,838 | |
3.90%, 04/13/29 | | | 1,000 | | | | 1,074,287 | |
KeyCorp(a): | | | | | | | | |
5.10%, 03/24/21 | | | 2,100 | | | | 2,179,408 | |
2.55%, 10/01/29 | | | 500 | | | | 488,966 | |
KFW: | | | | | | | | |
1.63%, 03/15/21 | | | 1,250 | | | | 1,249,500 | |
2.63%, 04/12/21 | | | 2,000 | | | | 2,024,137 | |
1.50%, 06/15/21 | | | 4,500 | | | | 4,490,008 | |
1.75%, 09/15/21 | | | 500 | | | | 500,900 | |
2.00%, 11/30/21 | | | 2,000 | | | | 2,013,247 | |
2.13%, 03/07/22 | | | 2,000 | | | | 2,019,839 | |
2.13%, 06/15/22 | | | 2,250 | | | | 2,274,772 | |
2.38%, 12/29/22 | | | 3,000 | | | | 3,060,928 | |
2.13%, 01/17/23 | | | 200 | | | | 202,566 | |
2.63%, 02/28/24(a) | | | 1,000 | | | | 1,035,047 | |
2.50%, 11/20/24 | | | 2,000 | | | | 2,069,348 | |
2.00%, 05/02/25 | | | 2,000 | | | | 2,024,180 | |
2.88%, 04/03/28 | | | 5,000 | | | | 5,348,415 | |
Kreditanstalt fuer Wiederaufbau: | | | | | | | | |
3.13%, 12/15/21 | | | 4,000 | | | | 4,113,405 | |
1.38%, 08/05/24(a) | | | 5,000 | | | | 4,913,335 | |
1.75%, 09/14/29 | | | 500 | | | | 489,550 | |
Lloyds Bank PLC, 2.25%, 08/14/22 | | | 1,000 | | | | 1,004,960 | |
M&T Bank Corp., 3.55%, 07/26/23 | | | 2,000 | | | | 2,100,034 | |
MUFG Union Bank NA, 2.10%, 12/09/22 | | | 1,000 | | | | 1,002,809 | |
National Australia Bank Ltd.: | | | | | | | | |
3.70%, 11/04/21 | | | 500 | | | | 515,905 | |
2.50%, 05/22/22(a) | | | 1,000 | | | | 1,011,844 | |
2.88%, 04/12/23 | | | 2,000 | | | | 2,047,587 | |
2.50%, 07/12/26 | | | 1,250 | | | | 1,250,777 | |
Northern Trust Corp., 3.65%, 08/03/28 | | | 250 | | | | 273,115 | |
Oesterreichische Kontrollbank AG, 2.88%, 03/13/23 | | | 2,000 | | | | 2,071,698 | |
PNC Bank NA: | | | | | | | | |
2.15%, 04/29/21 | | | 500 | | | | 501,640 | |
2.45%, 07/28/22(a) | | | 750 | | | | 760,248 | |
2.95%, 01/30/23 | | | 250 | | | | 255,890 | |
2.95%, 02/23/25(a) | | | 250 | | | | 258,867 | |
4.05%, 07/26/28 | | | 500 | | | | 548,832 | |
PNC Financial Services Group, Inc.: | | | | | | | | |
3.30%, 03/08/22 | | | 75 | | | | 77,056 | |
3.90%, 04/29/24 | | | 2,000 | | | | 2,128,203 | |
2.20%, 11/01/24 | | | 300 | | | | 301,115 | |
3.45%, 04/23/29 | | | 2,000 | | | | 2,134,779 | |
Regions Financial Corp.: | | | | | | | | |
2.75%, 08/14/22 | | | 500 | | | | 509,041 | |
3.80%, 08/14/23(a) | | | 2,000 | | | | 2,117,324 | |
Royal Bank of Canada: | | | | | | | | |
2.50%, 01/19/21 | | | 250 | | | | 251,799 | |
3.70%, 10/05/23 | | | 2,000 | | | | 2,114,460 | |
2.55%, 07/16/24(a) | | | 1,000 | | | | 1,015,389 | |
2.25%, 11/01/24 | | | 1,500 | | | | 1,506,367 | |
4.65%, 01/27/26(a) | | | 700 | | | | 776,522 | |
| | |
| 22 | | 2019 BLACKROCK ANNUAL REPORTTO SHAREHOLDERS |
| | |
Schedule of Investments (continued) December 31, 2019 | | U.S. Total Bond Index Master Portfolio (Percentages shown are based on Net Assets) |
| | | | | | | | |
| Security | | Par
(000) | | | Value | |
|
| Banks (continued) | |
Santander Holdings USA, Inc.: | | | | | | | | |
3.40%, 01/18/23 | | $ | 2,000 | | | $ | 2,050,692 | |
3.24%, 10/05/26(b) | | | 2,000 | | | | 2,022,154 | |
Santander UK Group Holdings PLC: | | | | | | | | |
3.13%, 01/08/21 | | | 75 | | | | 75,641 | |
2.88%, 08/05/21 | | | 1,000 | | | | 1,009,318 | |
(3 mo. LIBOR US + 1.08%), 3.37%, 01/05/24(c) | | | 3,000 | | | | 3,073,802 | |
Santander UK PLC, 2.88%, 06/18/24(a) | | | 1,500 | | | | 1,534,209 | |
Skandinaviska Enskilda Banken AB, 2.63%, 03/15/21 | | | 1,000 | | | | 1,006,304 | |
Svenska Handelsbanken AB: | | | | | | | | |
2.45%, 03/30/21 | | | 500 | | | | 503,327 | |
3.35%, 05/24/21(a) | | | 2,000 | | | | 2,039,472 | |
Synchrony Bank, 3.00%, 06/15/22 | | | 500 | | | | 509,808 | |
Toronto-Dominion Bank: | | | | | | | | |
2.13%, 04/07/21 | | | 500 | | | | 503,004 | |
3.25%, 06/11/21 | | | 500 | | | | 510,660 | |
1.80%, 07/13/21(a) | | | 2,000 | | | | 2,001,400 | |
1.90%, 12/01/22 | | | 730 | | | | 730,699 | |
3.50%, 07/19/23(a) | | | 500 | | | | 526,307 | |
2.65%, 06/12/24 | | | 500 | | | | 512,196 | |
(5 year USD Swap + 2.21%),
3.63%, 09/15/31(a)(c) | | | 500 | | | | 522,948 | |
Truist Bank: | | | | | | | | |
2.45%, 08/01/22 | | | 1,000 | | | | 1,010,875 | |
(3 mo. LIBOR US + 0.59%), 3.50%, 08/02/22(c) | | | 4,000 | | | | 4,091,122 | |
2.75%, 05/01/23 | | | 500 | | | | 509,037 | |
(3 mo. LIBOR US + 0.74%), 3.69%, 08/02/24(c) | | | 365 | | | | 383,190 | |
2.15%, 12/06/24 | | | 1,000 | | | | 998,422 | |
3.80%, 10/30/26(a) | | | 250 | | | | 268,286 | |
(5 year CMT + 1.15%), 2.64%, 09/17/29(c) | | | 1,000 | | | | 1,000,069 | |
Truist Financial Corp.: | | | | | | | | |
2.90%, 03/03/21 | | | 500 | | | | 505,229 | |
2.75%, 04/01/22(a) | | | 1,000 | | | | 1,017,721 | |
3.75%, 12/06/23(a) | | | 2,000 | | | | 2,121,657 | |
2.50%, 08/01/24 | | | 2,000 | | | | 2,026,336 | |
2.85%, 10/26/24 | | | 500 | | | | 516,606 | |
US Bancorp, 2.95%, 07/15/22 | | | 2,000 | | | | 2,046,697 | |
US Bancorp.: | | | | | | | | |
4.13%, 05/24/21(a) | | | 50 | | | | 51,472 | |
2.40%, 07/30/24 | | | 1,000 | | | | 1,013,920 | |
3.90%, 04/26/28(a) | | | 2,000 | | | | 2,244,433 | |
Series V, 2.63%, 01/24/22(a) | | | 2,000 | | | | 2,031,720 | |
Series V, 2.38%, 07/22/26 | | | 500 | | | | 501,561 | |
US Bank NA: | | | | | | | | |
3.40%, 07/24/23 | | | 3,000 | | | | 3,134,501 | |
2.80%, 01/27/25 | | | 500 | | | | 517,059 | |
Wells Fargo & Co.: | | | | | | | | |
3.00%, 01/22/21 | | | 250 | | | | 252,918 | |
2.50%, 03/04/21 | | | 2,740 | | | | 2,759,689 | |
4.60%, 04/01/21 | | | 1,000 | | | | 1,032,453 | |
2.10%, 07/26/21 | | | 1,000 | | | | 1,001,469 | |
3.50%, 03/08/22 | | | 5,000 | | | | 5,163,567 | |
2.63%, 07/22/22 | | | 3,750 | | | | 3,806,040 | |
3.07%, 01/24/23 | | | 2,500 | | | | 2,551,590 | |
4.13%, 08/15/23(a) | | | 1,750 | | | | 1,858,220 | |
4.48%, 01/16/24 | | | 250 | | | | 270,006 | |
3.30%, 09/09/24(a) | | | 750 | | | | 786,019 | |
3.00%, 02/19/25 | | | 350 | | | | 361,173 | |
3.55%, 09/29/25 | | | 1,000 | | | | 1,058,912 | |
(3 mo. LIBOR US + 0.83%), 2.41%, 10/30/25(c) | | | 1,000 | | | | 1,000,942 | |
3.00%, 04/22/26 | | | 1,750 | | | | 1,800,200 | |
4.10%, 06/03/26(a) | | | 2,020 | | | | 2,178,384 | |
| | | | | | | | |
| Security | | Par
(000) | | | Value | |
|
| Banks (continued) | |
3.00%, 10/23/26 | | $ | 1,750 | | | $ | 1,793,581 | |
(3 mo. LIBOR US + 1.17%), 3.20%, 06/17/27(c) | | | 1,335 | | | | 1,385,281 | |
4.30%, 07/22/27 | | | 1,500 | | | | 1,643,833 | |
(3 mo. LIBOR US + 1.31%), 3.58%, 05/22/28(c) | | | 1,500 | | | | 1,594,600 | |
4.15%, 01/24/29 | | | 2,000 | | | | 2,227,928 | |
(3 mo. LIBOR US + 1.17%), 2.88%, 10/30/30(c) | | | 1,000 | | | | 1,006,951 | |
5.38%, 11/02/43(a) | | | 900 | | | | 1,155,889 | |
5.61%, 01/15/44 | | | 656 | | | | 864,507 | |
4.65%, 11/04/44 | | | 3,345 | | | | 3,934,344 | |
3.90%, 05/01/45 | | | 150 | | | | 170,139 | |
4.90%, 11/17/45 | | | 500 | | | | 611,641 | |
4.40%, 06/14/46 | | | 600 | | | | 684,370 | |
4.75%, 12/07/46 | | | 1,600 | | | | 1,921,433 | |
Series M, 3.45%, 02/13/23 | | | 450 | | | | 466,037 | |
Wells Fargo Bank N.A., 3.55%, 08/14/23 | | | 500 | | | | 524,036 | |
Wells Fargo Bank NA: | | | | | | | | |
2.60%, 01/15/21 | | | 2,000 | | | | 2,014,025 | |
(3 mo. LIBOR US + 0.65%), 2.08%, 09/09/22(c) | | | 1,000 | | | | 1,001,550 | |
6.60%, 01/15/38 | | | 500 | | | | 723,718 | |
Westpac Banking Corp.: | | | | | | | | |
2.65%, 01/25/21 | | | 4,000 | | | | 4,027,089 | |
2.10%, 05/13/21 | | | 500 | | | | 501,466 | |
2.75%, 01/11/23 | | | 3,000 | | | | 3,056,816 | |
2.35%, 02/19/25 | | | 500 | | | | 501,240 | |
2.85%, 05/13/26 | | | 500 | | | | 512,243 | |
3.40%, 01/25/28 | | | 500 | | | | 532,948 | |
(5 year USD ICE Swap + 2.24%), 4.32%, 11/23/31(c) | | | 750 | | | | 794,215 | |
4.42%, 07/24/39 | | | 1,000 | | | | 1,100,087 | |
Zions Bancorp NA, 3.25%, 10/29/29 | | | 1,000 | | | | 982,014 | |
3.50%, 08/27/21 | | | 250 | | | | 255,856 | |
| | | | | | | | |
| | | | | | | 305,864,538 | |
|
| Beverages — 0.7% | |
Anheuser-Busch Cos. LLC/Anheuser-Busch InBev Worldwide, Inc.: | | | | | | | | |
3.65%, 02/01/26 | | | 2,250 | | | | 2,399,766 | |
4.70%, 02/01/36(a) | | | 2,500 | | | | 2,896,886 | |
4.90%, 02/01/46 | | | 5,620 | | | | 6,666,009 | |
Anheuser-Busch InBev Finance, Inc.: | | | | | | | | |
3.30%, 02/01/23 | | | 4,036 | | | | 4,181,501 | |
3.65%, 02/01/26 | | | 500 | | | | 530,939 | |
4.63%, 02/01/44 | | | 650 | | | | 737,262 | |
4.90%, 02/01/46 | | | 500 | | | | 590,609 | |
Anheuser-Busch InBev Worldwide, Inc.: | | | | | | | | |
4.15%, 01/23/25 | | | 2,000 | | | | 2,179,738 | |
4.00%, 04/13/28 | | | 1,000 | | | | 1,100,553 | |
4.75%, 01/23/29 | | | 500 | | | | 579,585 | |
4.38%, 04/15/38 | | | 1,000 | | | | 1,123,382 | |
8.20%, 01/15/39(a) | | | 150 | | | | 237,238 | |
5.45%, 01/23/39 | | | 1,000 | | | | 1,258,432 | |
4.95%, 01/15/42 | | | 500 | | | | 591,863 | |
3.75%, 07/15/42(a) | | | 300 | | | | 310,204 | |
4.60%, 04/15/48 | | | 1,000 | | | | 1,144,404 | |
4.44%, 10/06/48 | | | 632 | | | | 708,860 | |
5.55%, 01/23/49(a) | | | 3,000 | | | | 3,897,949 | |
4.75%, 04/15/58(a) | | | 500 | | | | 584,796 | |
5.80%, 01/23/59 | | | 1,000 | | | | 1,365,738 | |
Coca-Cola Co.: | | | | | | | | |
3.30%, 09/01/21(a) | | | 2,000 | | | | 2,049,568 | |
2.20%, 05/25/22(a) | | | 250 | | | | 252,602 | |
1.75%, 09/06/24 | | | 1,000 | | | | 993,152 | |
2.88%, 10/27/25(a) | | | 125 | | | | 130,345 | |
2.55%, 06/01/26(a) | | | 750 | | | | 766,717 | |
| | | | |
| SCHEDULE OF INVESTMENTS | | | 23 | |
| | |
Schedule of Investments (continued) December 31, 2019 | | U.S. Total Bond Index Master Portfolio (Percentages shown are based on Net Assets) |
| | | | | | | | |
| Security | | Par
(000) | | | Value | |
|
| Beverages (continued) | |
2.90%, 05/25/27 | | $ | 250 | | | $ | 261,405 | |
2.13%, 09/06/29 | | | 1,000 | | | | 974,864 | |
Coca-Cola Femsa SAB de CV, 3.88%, 11/26/23(a) | | | 500 | | | | 527,344 | |
Constellation Brands, Inc.: | | | | | | | | |
2.65%, 11/07/22 | | | 4,000 | | | | 4,056,300 | |
3.70%, 12/06/26(a) | | | 750 | | | | 796,443 | |
3.50%, 05/09/27(a) | | | 1,000 | | | | 1,044,814 | |
3.15%, 08/01/29 | | | 2,000 | | | | 2,022,953 | |
Diageo Capital PLC: | | | | | | | | |
2.63%, 04/29/23(a) | | | 250 | | | | 255,335 | |
3.50%, 09/18/23(a) | | | 2,000 | | | | 2,107,023 | |
3.88%, 05/18/28 | | | 1,000 | | | | 1,096,716 | |
2.38%, 10/24/29(a) | | | 830 | | | | 818,939 | |
3.88%, 04/29/43 | | | 125 | | | | 138,085 | |
Diageo Investment Corp.: | | | | | | | | |
2.88%, 05/11/22 | | | 100 | | | | 102,021 | |
4.25%, 05/11/42(a) | | | 250 | | | | 288,165 | |
Keurig Dr. Pepper, Inc.: | | | | | | | | |
3.55%, 05/25/21 | | | 1,750 | | | | 1,787,379 | |
2.70%, 11/15/22 | | | 100 | | | | 100,965 | |
4.06%, 05/25/23 | | | 500 | | | | 527,351 | |
4.42%, 05/25/25 | | | 250 | | | | 273,043 | |
4.60%, 05/25/28 | | | 750 | | | | 842,208 | |
4.99%, 05/25/38 | | | 250 | | | | 295,214 | |
4.42%, 12/15/46 | | | 500 | | | | 538,936 | |
5.09%, 05/25/48 | | | 750 | | | | 903,636 | |
Molson Coors Brewing Co.: | | | | | | | | |
2.10%, 07/15/21 | | | 750 | | | | 750,657 | |
3.50%, 05/01/22(a) | | | 75 | | | | 77,107 | |
3.00%, 07/15/26(a) | | | 2,345 | | | | 2,374,194 | |
5.00%, 05/01/42 | | | 750 | | | | 820,091 | |
4.20%, 07/15/46 | | | 500 | | | | 499,075 | |
PepsiCo, Inc.: | | | | | | | | |
3.00%, 08/25/21 | | | 750 | | | | 764,946 | |
2.75%, 03/05/22 | | | 250 | | | | 255,227 | |
3.10%, 07/17/22 | | | 500 | | | | 515,932 | |
2.75%, 03/01/23 | | | 300 | | | | 308,349 | |
3.60%, 03/01/24(a) | | | 250 | | | | 266,202 | |
2.75%, 04/30/25 | | | 1,000 | | | | 1,036,177 | |
3.50%, 07/17/25 | | | 250 | | | | 268,517 | |
2.85%, 02/24/26 | | | 500 | | | | 519,368 | |
2.38%, 10/06/26 | | | 1,000 | | | | 1,015,187 | |
3.00%, 10/15/27 | | | 1,000 | | | | 1,060,091 | |
2.63%, 07/29/29(a) | | | 1,000 | | | | 1,020,674 | |
3.60%, 08/13/42 | | | 100 | | | | 107,529 | |
4.60%, 07/17/45(a) | | | 500 | | | | 620,309 | |
4.45%, 04/14/46(a) | | | 1,000 | | | | 1,228,538 | |
3.45%, 10/06/46 | | | 2,250 | | | | 2,388,583 | |
2.88%, 10/15/49(a) | | | 500 | | | | 483,615 | |
| | | | | | | | |
| | | | | | | 73,417,605 | |
|
| Biotechnology — 0.3% | |
Amgen, Inc.: | | | | | | | | |
4.10%, 06/15/21 | | | 250 | | | | 256,848 | |
1.85%, 08/19/21 | | | 250 | | | | 249,463 | |
3.88%, 11/15/21 | | | 1,000 | | | | 1,031,572 | |
2.70%, 05/01/22 | | | 500 | | | | 506,756 | |
2.25%, 08/19/23 | | | 250 | | | | 252,349 | |
3.63%, 05/22/24 | | | 250 | | | | 264,173 | |
3.13%, 05/01/25(a) | | | 750 | | | | 782,519 | |
2.60%, 08/19/26(a) | | | 715 | | | | 724,388 | |
3.20%, 11/02/27(a) | | | 2,000 | | | | 2,107,844 | |
4.95%, 10/01/41 | | | 2,000 | | | | 2,382,463 | |
5.65%, 06/15/42(a) | | | 750 | | | | 951,582 | |
| | | | | | | | |
| Security | | Par
(000) | | | Value | |
|
| Biotechnology (continued) | |
4.40%, 05/01/45 | | $ | 925 | | | $ | 1,036,508 | |
4.56%, 06/15/48 | | | 500 | | | | 581,229 | |
4.66%, 06/15/51(a) | | | 904 | | | | 1,065,123 | |
Baxalta, Inc.: | | | | | | | | |
4.00%, 06/23/25 | | | 1,398 | | | | 1,506,506 | |
5.25%, 06/23/45 | | | 105 | | | | 135,614 | |
Biogen, Inc.: | | | | | | | | |
4.05%, 09/15/25 | | | 595 | | | | 647,265 | |
5.20%, 09/15/45 | | | 750 | | | | 905,812 | |
Gilead Sciences, Inc.: | | | | | | | | |
1.95%, 03/01/22 | | | 1,000 | | | | 1,001,420 | |
2.50%, 09/01/23 | | | 500 | | | | 507,616 | |
3.70%, 04/01/24 | | | 1,750 | | | | 1,855,925 | |
3.50%, 02/01/25 | | | 170 | | | | 180,451 | |
3.65%, 03/01/26(a) | | | 1,325 | | | | 1,427,018 | |
2.95%, 03/01/27(a) | | | 500 | | | | 519,466 | |
4.60%, 09/01/35 | | | 1,350 | | | | 1,612,067 | |
5.65%, 12/01/41(a) | | | 50 | | | | 65,713 | |
4.80%, 04/01/44 | | | 500 | | | | 600,891 | |
4.50%, 02/01/45 | | | 1,150 | | | | 1,336,876 | |
4.75%, 03/01/46(a) | | | 1,000 | | | | 1,202,535 | |
4.15%, 03/01/47(a) | | | 1,500 | | | | 1,671,083 | |
| | | | | | | | |
| | | | | | | 27,369,075 | |
|
| Building Materials — 0.0% | |
Martin Marietta Materials, Inc., 4.25%, 12/15/47 | | | 250 | | | | 259,952 | |
| | | | | | | | |
|
| Building Products — 0.1% | |
Allegion PLC, 3.50%, 10/01/29 | | | 500 | | | | 508,983 | |
Fortune Brands Home & Security, Inc., 3.25%, 09/15/29(a) | | | 500 | | | | 505,708 | |
Johnson Controls International PLC: | | | | | | | | |
3.63%, 07/02/24(d) | | | 75 | | | | 78,300 | |
4.63%, 07/02/44 | | | 750 | | | | 824,437 | |
5.13%, 09/14/45 | | | 24 | | | | 28,041 | |
4.50%, 02/15/47(a) | | | 250 | | | | 270,421 | |
4.95%, 07/02/64(a)(d) | | | 179 | | | | 189,398 | |
Masco Corp., 4.38%, 04/01/26(a) | | | 1,000 | | | | 1,080,705 | |
Owens Corning: | | | | | | | | |
4.20%, 12/01/24 | | | 250 | | | | 263,820 | |
4.40%, 01/30/48 | | | 1,000 | | | | 967,374 | |
| | | | | | | | |
| | | | | | | 4,717,187 | |
|
| Capital Markets — 0.9% | |
Ameriprise Financial, Inc.: | | | | | | | | |
4.00%, 10/15/23 | | | 150 | | | | 160,785 | |
2.88%, 09/15/26(a) | | | 500 | | | | 511,117 | |
Brookfield Asset Management, Inc., 4.00%, 01/15/25 | | | 250 | | | | 268,927 | |
Brookfield Finance, Inc.: | | | | | | | | |
4.00%, 04/01/24 | | | 150 | | | | 160,887 | |
3.90%, 01/25/28(a) | | | 1,000 | | | | 1,072,573 | |
4.70%, 09/20/47 | | | 500 | | | | 575,105 | |
Charles Schwab Corp.: | | | | | | | | |
3.00%, 03/10/25 | | | 80 | | | | 83,067 | |
3.85%, 05/21/25(a) | | | 1,000 | | | | 1,083,676 | |
3.20%, 01/25/28(a) | | | 1,000 | | | | 1,050,777 | |
3.25%, 05/22/29(a) | | | 200 | | | | 211,767 | |
CME Group, Inc.: | | | | | | | | |
3.00%, 09/15/22 | | | 1,000 | | | | 1,029,479 | |
3.00%, 03/15/25 | | | 250 | | | | 259,749 | |
3.75%, 06/15/28 | | | 1,000 | | | | 1,104,898 | |
5.30%, 09/15/43(a) | | | 100 | | | | 133,997 | |
Franklin Resources, Inc., 2.80%, 09/15/22 | | | 150 | | | | 153,290 | |
| | |
| 24 | | 2019 BLACKROCK ANNUAL REPORTTO SHAREHOLDERS |
| | |
Schedule of Investments (continued) December 31, 2019 | | U.S. Total Bond Index Master Portfolio (Percentages shown are based on Net Assets) |
| | | | | | | | |
| Security | | Par
(000) | | | Value | |
|
| Capital Markets (continued) | |
FS KKR Capital Corp.: | | | | | | | | |
4.63%, 07/15/24(a) | | $ | 500 | | | $ | 519,602 | |
4.13%, 02/01/25 | | | 100 | | | | 101,412 | |
Goldman Sachs Group, Inc.: | | | | | | | | |
2.88%, 02/25/21 | | | 1,000 | | | | 1,009,957 | |
2.63%, 04/25/21 | | | 500 | | | | 504,364 | |
5.25%, 07/27/21 | | | 500 | | | | 524,710 | |
2.35%, 11/15/21 | | | 1,500 | | | | 1,505,960 | |
5.75%, 01/24/22 | | | 2,350 | | | | 2,522,761 | |
3.00%, 04/26/22 | | | 3,000 | | | | 3,037,890 | |
(3 mo. LIBOR US + 0.82%), 2.88%, 10/31/22(c) | | | 1,000 | | | | 1,014,189 | |
3.63%, 01/22/23(a) | | | 150 | | | | 156,229 | |
(3 mo. LIBOR US + 0.99%), 2.91%, 07/24/23(c) | | | 2,000 | | | | 2,036,104 | |
4.00%, 03/03/24(a) | | | 3,425 | | | | 3,649,805 | |
3.85%, 07/08/24(a) | | | 500 | | | | 528,848 | |
3.50%, 01/23/25 | | | 750 | | | | 787,359 | |
3.75%, 05/22/25 | | | 2,250 | | | | 2,388,495 | |
(3 mo. LIBOR US + 1.20%), 3.27%, 09/29/25(c) | | | 1,000 | | | | 1,035,304 | |
4.25%, 10/21/25 | | | 1,050 | | | | 1,140,547 | |
3.75%, 02/25/26(a) | | | 380 | | | | 402,236 | |
5.95%, 01/15/27 | | | 250 | | | | 298,776 | |
3.85%, 01/26/27 | | | 2,000 | | | | 2,129,096 | |
(3 mo. LIBOR US + 1.51%), 3.69%, 06/05/28(a)(c) | | | 500 | | | | 531,993 | |
(3 mo. LIBOR US + 1.16%), 3.81%, 04/23/29(c) | | | 1,000 | | | | 1,072,878 | |
(3 mo. LIBOR US + 1.30%), 4.22%, 05/01/29(a)(c) | | | 1,000 | | | | 1,102,579 | |
6.75%, 10/01/37 | | | 1,650 | | | | 2,292,063 | |
(3 mo. LIBOR US + 1.37%), 4.02%, 10/31/38(a)(c) | | | 2,000 | | | | 2,173,561 | |
(3 mo. LIBOR US + 1.43%), 4.41%, 04/23/39(c) | | | 2,400 | | | | 2,734,902 | |
4.80%, 07/08/44 | | | 1,250 | | | | 1,514,085 | |
5.15%, 05/22/45 | | | 1,500 | | | | 1,843,852 | |
4.75%, 10/21/45 | | | 1,750 | | | | 2,136,428 | |
Invesco Finance PLC, 4.00%, 01/30/24(a) | | | 250 | | | | 265,757 | |
Jefferies Group LLC, 5.13%, 01/20/23 | | | 650 | | | | 701,986 | |
Jefferies Group LLC/Jefferies Group Capital Finance, Inc.: | | | | | | | | |
4.85%, 01/15/27(a) | | | 1,000 | | | | 1,104,526 | |
4.15%, 01/23/30 | | | 1,000 | | | | 1,060,480 | |
Landwirtschaftliche Rentenbank, Series 36, 2.00%, 12/06/21 | | | 2,000 | | | | 2,013,011 | |
Lazard Group LLC, 4.38%, 03/11/29(a) | | | 1,000 | | | | 1,089,936 | |
Legg Mason, Inc., 5.63%, 01/15/44 | | | 625 | | | | 709,835 | |
Morgan Stanley: | | | | | | | | |
5.75%, 01/25/21 | | | 750 | | | | 778,928 | |
2.50%, 04/21/21 | | | 500 | | | | 503,791 | |
5.50%, 07/28/21 | | | 1,600 | | | | 1,685,486 | |
2.63%, 11/17/21 | | | 2,750 | | | | 2,782,966 | |
2.75%, 05/19/22(a) | | | 2,000 | | | | 2,036,934 | |
4.88%, 11/01/22 | | | 500 | | | | 535,756 | |
3.13%, 01/23/23 | | | 3,500 | | | | 3,598,300 | |
3.75%, 02/25/23(a) | | | 500 | | | | 523,605 | |
4.10%, 05/22/23 | | | 250 | | | | 263,990 | |
(3 mo. LIBOR US + 0.85%), 3.74%, 04/24/24(c) | | | 4,000 | | | | 4,179,588 | |
3.70%, 10/23/24 | | | 500 | | | | 531,152 | |
(Secured Overnight Financing Rate + 1.15%), 2.72%, 07/22/25(a)(c) | | | 605 | | | | 612,649 | |
4.00%, 07/23/25 | | | 505 | | | | 546,442 | |
5.00%, 11/24/25(a) | | | 1,250 | | | | 1,408,007 | |
3.88%, 01/27/26 | | | 500 | | | | 537,047 | |
3.13%, 07/27/26 | | | 500 | | | | 516,271 | |
4.35%, 09/08/26(a) | | | 1,500 | | | | 1,640,826 | |
3.63%, 01/20/27 | | | 2,000 | | | | 2,129,628 | |
3.95%, 04/23/27 | | | 250 | | | | 268,227 | |
(3 mo. LIBOR US + 1.34%), 3.59%, 07/22/28(c) | | | 2,250 | | | | 2,392,455 | |
| | | | | | | | |
| Security | | Par
(000) | | | Value | |
|
| Capital Markets (continued) | |
(3 mo. LIBOR US + 1.14%), 3.77%, 01/24/29(c) | | $ | 3,000 | | | $ | 3,229,358 | |
(3 mo. LIBOR US + 1.63%), 4.43%, 01/23/30(c) | | | 750 | | | | 848,307 | |
7.25%, 04/01/32 | | | 50 | | | | 71,550 | |
(3 mo. LIBOR US + 1.46%), 3.97%, 07/22/38(c) | | | 1,000 | | | | 1,110,939 | |
(3 mo. LIBOR US + 1.43%), 4.46%, 04/22/39(a)(c) | | | 3,000 | | | | 3,536,215 | |
6.38%, 07/24/42 | | | 50 | | | | 73,713 | |
4.30%, 01/27/45 | | | 500 | | | | 588,158 | |
4.38%, 01/22/47 | | | 1,000 | | | | 1,199,281 | |
Series F, 3.88%, 04/29/24 | | | 250 | | | | 265,770 | |
Nasdaq, Inc., 4.25%, 06/01/24 | | | 250 | | | | 269,154 | |
Owl Rock Capital Corp., 4.00%, 03/30/25 | | | 345 | | | | 346,369 | |
Raymond James Financial, Inc., 4.95%, 07/15/46 | | | 500 | | | | 584,620 | |
State Street Corp.: | | | | | | | | |
3.10%, 05/15/23 | | | 250 | | | | 257,981 | |
3.30%, 12/16/24 | | | 405 | | | | 427,258 | |
(Secured Overnight Financing Rate + 0.94%), 2.35%, 11/01/25(c) | | | 450 | | | | 451,983 | |
2.65%, 05/19/26(a) | | | 1,000 | | | | 1,017,920 | |
(Secured Overnight Financing Rate + 1.49%), 3.03%, 11/01/34(c) | | | 200 | | | | 200,781 | |
TD Ameritrade Holding Corp.: | | | | | | | | |
2.95%, 04/01/22 | | | 250 | | | | 255,575 | |
3.63%, 04/01/25(a) | | | 1,000 | | | | 1,064,203 | |
2.75%, 10/01/29 | | | 1,000 | | | | 1,000,653 | |
TPG Specialty Lending, Inc., 3.88%, 11/01/24 | | | 500 | | | | 503,683 | |
| | | | | | | | |
| | | | | | | 100,277,129 | |
|
| Chemicals — 0.4% | |
Albemarle Corp., 4.15%, 12/01/24(a) | | | 250 | | | | 267,960 | |
Cabot Corp., 4.00%, 07/01/29 | | | 1,500 | | | | 1,573,373 | |
Dow Chemical Co.: | | | | | | | | |
3.00%, 11/15/22(a) | | | 250 | | | | 255,650 | |
3.50%, 10/01/24 | | | 1,000 | | | | 1,050,255 | |
4.80%, 11/30/28 | | | 300 | | | | 343,194 | |
4.25%, 10/01/34(a) | | | 1,600 | | | | 1,750,731 | |
9.40%, 05/15/39(a) | | | 250 | | | | 409,097 | |
5.25%, 11/15/41 | | | 100 | | | | 116,574 | |
4.38%, 11/15/42(a) | | | 250 | | | | 267,041 | |
5.55%, 11/30/48 | | | 1,000 | | | | 1,249,987 | |
DuPont de Nemours, Inc.: | | | | | | | | |
4.21%, 11/15/23 | | | 2,000 | | | | 2,139,897 | |
4.73%, 11/15/28(a) | | | 1,500 | | | | 1,703,159 | |
5.32%, 11/15/38(a) | | | 750 | | | | 895,253 | |
5.42%, 11/15/48 | | | 1,000 | | | | 1,233,880 | |
Eastman Chemical Co.: | | | | | | | | |
3.60%, 08/15/22 | | | 200 | | | | 207,026 | |
3.80%, 03/15/25(a) | | | 1,050 | | | | 1,107,731 | |
4.50%, 12/01/28(a) | | | 1,000 | | | | 1,107,579 | |
4.80%, 09/01/42 | | | 250 | | | | 271,723 | |
FMC Corp.: | | | | | | | | |
3.20%, 10/01/26 | | | 155 | | | | 158,335 | |
3.45%, 10/01/29 | | | 115 | | | | 118,908 | |
4.50%, 10/01/49 | | | 165 | | | | 180,047 | |
International Flavors & Fragrances, Inc.(a): | | | | | | | | |
4.45%, 09/26/28 | | | 500 | | | | 546,844 | |
5.00%, 09/26/48 | | | 500 | | | | 567,695 | |
LYB International Finance BV: | | | | | | | | |
4.00%, 07/15/23 | | | 450 | | | | 476,015 | |
5.25%, 07/15/43 | | | 75 | | | | 88,593 | |
4.88%, 03/15/44(a) | | | 350 | | | | 394,379 | |
LYB International Finance II BV, 3.50%, 03/02/27(a) | | | 1,000 | | | | 1,048,304 | |
LYB International Finance III LLC, 4.20%, 10/15/49 | | | 330 | | | | 344,434 | |
LyondellBasell Industries NV, 4.63%, 02/26/55 | | | 600 | | | | 631,358 | |
| | | | |
| SCHEDULE OF INVESTMENTS | | | 25 | |
| | |
Schedule of Investments (continued) December 31, 2019 | | U.S. Total Bond Index Master Portfolio (Percentages shown are based on Net Assets) |
| | | | | | | | |
| Security | | Par
(000) | | | Value | |
|
| Chemicals (continued) | |
Methanex Corp.: | | | | | | | | |
4.25%, 12/01/24 | | $ | 250 | | | $ | 257,822 | |
5.25%, 12/15/29 | | | 250 | | | | 258,343 | |
Mosaic Co.: | | | | | | | | |
3.75%, 11/15/21 | | | 50 | | | | 51,426 | |
4.25%, 11/15/23(a) | | | 1,000 | | | | 1,066,825 | |
4.05%, 11/15/27 | | | 1,000 | | | | 1,038,490 | |
5.45%, 11/15/33 | | | 250 | | | | 283,797 | |
Nutrien Ltd.: | | | | | | | | |
3.15%, 10/01/22 | | | 1,050 | | | | 1,072,857 | |
3.50%, 06/01/23 | | | 250 | | | | 258,110 | |
3.63%, 03/15/24 | | | 250 | | | | 261,143 | |
3.38%, 03/15/25 | | | 1,395 | | | | 1,445,610 | |
3.00%, 04/01/25 | | | 250 | | | | 255,141 | |
4.00%, 12/15/26(a) | | | 250 | | | | 266,240 | |
4.90%, 06/01/43 | | | 500 | | | | 563,445 | |
5.00%, 04/01/49 | | | 750 | | | | 894,484 | |
PPG Industries, Inc.: | | | | | | | | |
2.40%, 08/15/24 | | | 1,000 | | | | 1,010,013 | |
2.80%, 08/15/29 | | | 1,000 | | | | 1,007,945 | |
Praxair, Inc.: | | | | | | | | |
2.70%, 02/21/23(a) | | | 1,000 | | | | 1,021,376 | |
2.65%, 02/05/25 | | | 165 | | | | 168,975 | |
3.20%, 01/30/26 | | | 250 | | | | 263,540 | |
Rohm & Haas Co., 7.85%, 07/15/29 | | | 250 | | | | 334,289 | |
RPM International, Inc., 5.25%, 06/01/45 | | | 250 | | | | 280,133 | |
SASOL Financing USA LLC: | | | | | | | | |
5.88%, 03/27/24(a) | | | 500 | | | | 541,719 | |
6.50%, 09/27/28 | | | 750 | | | | 832,969 | |
Sherwin-Williams Co.: | | | | | | | | |
3.95%, 01/15/26(a) | | | 500 | | | | 535,134 | |
3.45%, 06/01/27 | | | 250 | | | | 264,535 | |
2.95%, 08/15/29 | | | 620 | | | | 626,218 | |
4.50%, 06/01/47(a) | | | 1,500 | | | | 1,705,023 | |
3.80%, 08/15/49 | | | 880 | | | | 897,155 | |
Westlake Chemical Corp.: | | | | | | | | |
3.60%, 08/15/26 | | | 500 | | | | 518,354 | |
5.00%, 08/15/46 | | | 750 | | | | 795,286 | |
| | | | | | | | |
| | | | | | | 39,281,419 | |
|
| Commercial Services & Supplies — 0.1% | |
American University, Series 2019, 3.67%, 04/01/49 | | | 135 | | | | 144,795 | |
California Institute of Technology, 3.65%, 09/01/19 | | | 263 | | | | 255,094 | |
Ecolab, Inc.: | | | | | | | | |
4.35%, 12/08/21 | | | 122 | | | | 127,757 | |
2.38%, 08/10/22 | | | 500 | | | | 505,123 | |
3.25%, 01/14/23 | | | 250 | | | | 257,992 | |
3.25%, 12/01/27(a) | | | 1,000 | | | | 1,057,137 | |
3.70%, 11/01/46 | | | 250 | | | | 259,185 | |
George Washington University: | | | | | | | | |
4.87%, 09/15/45 | | | 100 | | | | 125,449 | |
Series 2014, 4.30%, 09/15/44 | | | 250 | | | | 290,647 | |
Series 2018, 4.13%, 09/15/48 | | | 164 | | | | 189,320 | |
Georgetown University: | | | | | | | | |
Series A, 5.22%, 10/01/18 | | | 62 | | | | 79,339 | |
Series B, 4.32%, 04/01/49 | | | 40 | | | | 47,847 | |
Leland Stanford Junior University, 3.65%, 05/01/48(a) | | | 250 | | | | 278,998 | |
Massachusetts Institute of Technology: | | | | | | | | |
4.68%, 07/01/14 | | | 300 | | | | 386,891 | |
Series F, 2.99%, 07/01/50 | | | 289 | | | | 287,078 | |
Northwestern University: | | | | | | | | |
3.87%, 12/01/48 | | | 100 | | | | 112,310 | |
Series 2017, 3.66%, 12/01/57 | | | 58 | | | | 64,115 | |
| | | | | | | | |
| Security | | Par
(000) | | | Value | |
|
| Commercial Services & Supplies (continued) | |
President and Fellows of Harvard College: | | | | | | | | |
3.15%, 07/15/46 | | $ | 175 | | | $ | 178,814 | |
3.30%, 07/15/56(a) | | | 200 | | | | 206,946 | |
Republic Services, Inc.: | | | | | | | | |
5.25%, 11/15/21 | | | 50 | | | | 53,040 | |
3.55%, 06/01/22(a) | | | 250 | | | | 258,287 | |
4.75%, 05/15/23(a) | | | 250 | | | | 269,231 | |
2.50%, 08/15/24 | | | 205 | | | | 207,348 | |
3.20%, 03/15/25 | | | 250 | | | | 260,130 | |
2.90%, 07/01/26 | | | 85 | | | | 87,087 | |
3.95%, 05/15/28(a) | | | 1,750 | | | | 1,928,491 | |
Trustees of Boston University, Series CC, 4.06%, 10/01/48 | | | 35 | | | | 40,185 | |
University of Notre Dame du Lac, Series 2017, 3.39%, 02/15/48 | | | 110 | | | | 117,174 | |
University of Southern California, 3.03%, 10/01/39(a) | | | 200 | | | | 201,069 | |
Waste Management, Inc.: | | | | | | | | |
4.60%, 03/01/21(a) | | | 100 | | | | 102,465 | |
2.90%, 09/15/22 | | | 200 | | | | 204,638 | |
2.40%, 05/15/23 | | | 500 | | | | 505,147 | |
3.15%, 11/15/27 | | | 1,000 | | | | 1,043,519 | |
3.45%, 06/15/29 | | | 1,500 | | | | 1,606,434 | |
3.90%, 03/01/35(a) | | | 315 | | | | 347,253 | |
4.15%, 07/15/49(a) | | | 500 | | | | 572,119 | |
William Marsh Rice University, 3.77%, 05/15/55 | | | 300 | | | | 329,374 | |
| | | | | | | | |
| | | | | | | 12,987,828 | |
|
| Communications Equipment — 0.1% | |
Cisco Systems, Inc.: | | | | | | | | |
2.20%, 02/28/21 | | | 1,000 | | | | 1,005,853 | |
2.90%, 03/04/21(a) | | | 125 | | | | 126,667 | |
1.85%, 09/20/21 | | | 4,000 | | | | 4,002,739 | |
2.60%, 02/28/23(a) | | | 500 | | | | 511,241 | |
2.95%, 02/28/26 | | | 500 | | | | 521,550 | |
5.90%, 02/15/39 | | | 500 | | | | 700,736 | |
5.50%, 01/15/40 | | | 850 | | | | 1,161,335 | |
Juniper Networks, Inc.(a): | | | | | | | | |
4.35%, 06/15/25 | | | 250 | | | | 269,022 | |
3.75%, 08/15/29 | | | 1,000 | | | | 1,040,165 | |
5.95%, 03/15/41 | | | 500 | | | | 570,259 | |
Motorola Solutions, Inc.: | | | | | | | | |
3.75%, 05/15/22 | | | 85 | | | | 87,899 | |
3.50%, 03/01/23 | | | 250 | | | | 258,226 | |
4.60%, 02/23/28 | | | 500 | | | | 542,295 | |
4.60%, 05/23/29(a) | | | 965 | | | | 1,053,436 | |
| | | | | | | | |
| | | | | | | 11,851,423 | |
|
| Construction & Engineering — 0.0% | |
ABB Finance USA, Inc.: | | | | | | | | |
2.88%, 05/08/22 | | | 100 | | | | 102,121 | |
3.80%, 04/03/28 | | | 1,000 | | | | 1,092,028 | |
Fluor Corp., 3.50%, 12/15/24(a) | | | 1,250 | | | | 1,276,537 | |
| | | | | | | | |
| | | | | | | 2,470,686 | |
|
| Construction Materials — 0.0% | |
Vulcan Materials Co., 3.90%, 04/01/27(a) | | | 1,000 | | | | 1,056,959 | |
WW Grainger, Inc., 4.60%, 06/15/45 | | | 1,250 | | | | 1,494,618 | |
| | | | | | | | |
| | | | | | | 2,551,577 | |
|
| Consumer Discretionary — 0.0% | |
Royal Caribbean Cruises Ltd.: | | | | | | | | |
5.25%, 11/15/22 | | | 1,000 | | | | 1,082,873 | |
3.70%, 03/15/28(a) | | | 225 | | | | 231,547 | |
| | | | | | | | |
| | | | | | | 1,314,420 | |
| | |
| 26 | | 2019 BLACKROCK ANNUAL REPORTTO SHAREHOLDERS |
| | |
Schedule of Investments (continued) December 31, 2019 | | U.S. Total Bond Index Master Portfolio (Percentages shown are based on Net Assets) |
| | | | | | | | |
| Security | | Par
(000) | | | Value | |
|
| Consumer Finance — 0.5% | |
Ally Financial, Inc.: | | | | | | | | |
4.25%, 04/15/21(a) | | $ | 2,000 | | | $ | 2,045,000 | |
4.13%, 02/13/22 | | | 500 | | | | 516,250 | |
4.63%, 05/19/22(a) | | | 500 | | | | 523,750 | |
3.88%, 05/21/24 | | | 1,500 | | | | 1,571,250 | |
5.13%, 09/30/24 | | | 300 | | | | 330,837 | |
4.63%, 03/30/25 | | | 2,500 | | | | 2,706,250 | |
American Express Co.: | | | | | | | | |
3.38%, 05/17/21 | | | 3,000 | | | | 3,057,367 | |
2.65%, 12/02/22 | | | 1,000 | | | | 1,019,270 | |
3.40%, 02/27/23(a) | | | 500 | | | | 519,180 | |
3.70%, 08/03/23 | | | 2,000 | | | | 2,102,792 | |
3.40%, 02/22/24 | | | 3,000 | | | | 3,138,326 | |
2.50%, 07/30/24 | | | 655 | | | | 662,664 | |
3.00%, 10/30/24(a) | | | 1,000 | | | | 1,033,922 | |
3.63%, 12/05/24 | | | 300 | | | | 317,184 | |
4.05%, 12/03/42(a) | | | 67 | | | | 78,942 | |
Capital One Bank USA NA, 3.38%, 02/15/23(a) | | | 350 | | | | 361,619 | |
Capital One Financial Corp.: | | | | | | | | |
4.75%, 07/15/21 | | | 1,000 | | | | 1,041,447 | |
3.20%, 01/30/23 | | | 4,000 | | | | 4,112,755 | |
3.50%, 06/15/23 | | | 110 | | | | 114,319 | |
3.75%, 04/24/24 | | | 250 | | | | 263,305 | |
3.20%, 02/05/25 | | | 250 | | | | 258,993 | |
4.20%, 10/29/25 | | | 340 | | | | 367,025 | |
3.75%, 07/28/26 | | | 230 | | | | 242,344 | |
3.75%, 03/09/27(a) | | | 500 | | | | 533,354 | |
3.80%, 01/31/28(a) | | | 1,000 | | | | 1,075,424 | |
Capital One NA: | | | | | | | | |
2.25%, 09/13/21 | | | 1,000 | | | | 1,004,517 | |
2.15%, 09/06/22(a) | | | 455 | | | | 455,772 | |
Caterpillar Financial Services Corp.: | | | | | | | | |
1.70%, 08/09/21 | | | 1,000 | | | | 998,563 | |
2.95%, 02/26/22 | | | 1,000 | | | | 1,022,796 | |
1.90%, 09/06/22 | | | 1,000 | | | | 1,002,019 | |
2.63%, 03/01/23 | | | 2,000 | | | | 2,037,896 | |
3.45%, 05/15/23 | | | 400 | | | | 419,035 | |
3.65%, 12/07/23 | | | 1,000 | | | | 1,061,361 | |
3.30%, 06/09/24(a) | | | 250 | | | | 262,881 | |
2.15%, 11/08/24 | | | 200 | | | | 200,815 | |
Discover Financial Services: | | | | | | | | |
3.95%, 11/06/24 | | | 350 | | | | 371,755 | |
3.75%, 03/04/25 | | | 75 | | | | 79,449 | |
Mastercard, Inc.: | | | | | | | | |
3.38%, 04/01/24(a) | | | 250 | | | | 265,302 | |
2.00%, 03/03/25 | | | 1,200 | | | | 1,197,030 | |
3.50%, 02/26/28(a) | | | 1,000 | | | | 1,078,730 | |
2.95%, 06/01/29 | | | 2,500 | | | | 2,609,010 | |
3.65%, 06/01/49 | | | 500 | | | | 555,440 | |
Synchrony Financial: | | | | | | | | |
3.75%, 08/15/21 | | | 1,500 | | | | 1,534,135 | |
2.85%, 07/25/22(a) | | | 175 | | | | 177,162 | |
4.50%, 07/23/25 | | | 190 | | | | 205,012 | |
3.95%, 12/01/27(a) | | | 1,000 | | | | 1,051,071 | |
5.15%, 03/19/29(a) | | | 500 | | | | 568,945 | |
Visa, Inc.: | | | | | | | | |
2.15%, 09/15/22(a) | | | 2,000 | | | | 2,022,765 | |
2.80%, 12/14/22 | | | 750 | | | | 771,802 | |
3.15%, 12/14/25 | | | 1,945 | | | | 2,056,379 | |
2.75%, 09/15/27(a) | | | 2,150 | | | | 2,249,963 | |
4.15%, 12/14/35 | | | 500 | | | | 589,798 | |
4.30%, 12/14/45 | | | 1,750 | | | | 2,151,284 | |
3.65%, 09/15/47(a) | | | 195 | | | | 218,481 | |
| | | | | | | | |
| | | | | | | 56,212,737 | |
| | | | | | | | |
| Security | | Par
(000) | | | Value | |
|
| Containers & Packaging — 0.0% | |
Packaging Corp. of America: | | | | | | | | |
4.50%, 11/01/23(a) | | $ | 250 | | | $ | 268,623 | |
3.00%, 12/15/29 | | | 200 | | | | 201,026 | |
4.05%, 12/15/49 | | | 150 | | | | 155,942 | |
WRKCo, Inc.: | | | | | | | | |
4.65%, 03/15/26(a) | | | 1,170 | | | | 1,287,809 | |
3.38%, 09/15/27(a) | | | 500 | | | | 511,997 | |
4.00%, 03/15/28 | | | 1,000 | | | | 1,075,327 | |
| | | | | | | | |
| | | | | | | 3,500,724 | |
|
| Diversified Financial Services — 2.9% | |
AerCap Ireland Capital DAC/AerCap Global Aviation Trust: | | | | | | | | |
3.95%, 02/01/22 | | | 1,250 | | | | 1,291,555 | |
3.30%, 01/23/23(a) | | | 500 | | | | 512,551 | |
2.88%, 08/14/24 | | | 1,000 | | | | 1,008,998 | |
4.45%, 04/03/26 | | | 1,000 | | | | 1,073,570 | |
3.65%, 07/21/27 | | | 1,000 | | | | 1,030,449 | |
3.88%, 01/23/28 | | | 500 | | | | 519,316 | |
Air Lease Corp.: | | | | | | | | |
3.88%, 04/01/21 | | | 175 | | | | 178,589 | |
2.25%, 01/15/23(a) | | | 1,095 | | | | 1,096,029 | |
4.25%, 09/15/24 | | | 250 | | | | 267,844 | |
3.25%, 03/01/25(a) | | | 2,000 | | | | 2,059,329 | |
3.63%, 12/01/27 | | | 200 | | | | 207,097 | |
3.25%, 10/01/29 | | | 500 | | | | 497,404 | |
Aircastle Ltd.: | | | | | | | | |
5.00%, 04/01/23 | | | 100 | | | | 106,958 | |
4.13%, 05/01/24(a) | | | 1,000 | | | | 1,050,713 | |
4.25%, 06/15/26 | | | 500 | | | | 529,145 | |
American Express Credit Corp.: | | | | | | | | |
2.25%, 05/05/21 | | | 1,000 | | | | 1,004,819 | |
2.70%, 03/03/22 | | | 1,000 | | | | 1,016,787 | |
3.30%, 05/03/27 | | | 500 | | | | 531,161 | |
Banco Santander SA: | | | | | | | | |
3.50%, 04/11/22 | | | 1,600 | | | | 1,643,724 | |
3.13%, 02/23/23 | | | 1,000 | | | | 1,020,757 | |
2.71%, 06/27/24 | | | 1,000 | | | | 1,014,241 | |
5.18%, 11/19/25 | | | 200 | | | | 224,097 | |
4.38%, 04/12/28(a) | | | 1,000 | | | | 1,094,843 | |
3.31%, 06/27/29 | | | 600 | | | | 618,383 | |
Bank of America Corp.: | | | | | | | | |
2.63%, 04/19/21 | | | 1,500 | | | | 1,513,743 | |
2.50%, 10/21/22 | | | 1,000 | | | | 1,009,734 | |
3.30%, 01/11/23 | | | 1,000 | | | | 1,033,882 | |
(3 mo. LIBOR US + 1.02%), 2.88%, 04/24/23(a)(c) | | | 1,000 | | | | 1,016,825 | |
(3 mo. LIBOR US + 0.93%), 2.82%, 07/21/23(c) | | | 500 | | | | 507,997 | |
4.10%, 07/24/23 | | | 4,000 | | | | 4,266,773 | |
(3 mo. LIBOR US + 0.79%), 3.00%, 12/20/23(c) | | | 5,144 | | | | 5,264,086 | |
(3 mo. LIBOR US + 0.78%), 3.55%, 03/05/24(c) | | | 1,000 | | | | 1,037,855 | |
4.00%, 04/01/24(a) | | | 500 | | | | 535,542 | |
(3 mo. LIBOR US + 0.94%), 3.86%, 07/23/24(c) | | | 1,500 | | | | 1,578,573 | |
4.20%, 08/26/24 | | | 750 | | | | 805,361 | |
4.00%, 01/22/25 | | | 750 | | | | 800,023 | |
3.88%, 08/01/25(a) | | | 2,250 | | | | 2,417,765 | |
(3 mo. LIBOR US + 1.09%), 3.09%, 10/01/25(c) | | | 1,000 | | | | 1,032,094 | |
(3 mo. LIBOR US + 0.87%), 2.46%, 10/22/25(c) | | | 385 | | | | 387,576 | |
(3 mo. LIBOR US + 0.81%), 3.37%, 01/23/26(a)(c) | | | 2,000 | | | | 2,091,997 | |
4.45%, 03/03/26 | | | 1,340 | | | | 1,471,735 | |
3.50%, 04/19/26 | | | 645 | | | | 685,991 | |
4.25%, 10/22/26 | | | 1,290 | | | | 1,407,144 | |
3.25%, 10/21/27 | | | 1,375 | | | | 1,433,379 | |
(3 mo. LIBOR US + 1.58%), 3.82%, 01/20/28(c) | | | 2,000 | | | | 2,147,407 | |
(3 mo. LIBOR US + 1.51%), 3.71%, 04/24/28(c) | | | 1,000 | | | | 1,069,255 | |
| | | | |
| SCHEDULE OF INVESTMENTS | | | 27 | |
| | |
Schedule of Investments (continued) December 31, 2019 | | U.S. Total Bond Index Master Portfolio (Percentages shown are based on Net Assets) |
| | | | | | | | |
| Security | | Par
(000) | | | Value | |
|
| Diversified Financial Services (continued) | |
(3 mo. LIBOR US + 1.37%), 3.59%, 07/21/28(c) | | $ | 500 | | | $ | 530,039 | |
(3 mo. LIBOR US + 1.04%), 3.42%, 12/20/28(c) | | | 3,044 | | | | 3,196,638 | |
(3 mo. LIBOR US + 1.07%), 3.97%, 03/05/29(c) | | | 1,000 | | | | 1,089,772 | |
(3 mo. LIBOR US + 1.31%), 4.27%, 07/23/29(c) | | | 1,450 | | | | 1,611,697 | |
(3 mo. LIBOR US + 1.21%), 3.97%, 02/07/30(c) | | | 2,650 | | | | 2,909,350 | |
(3 mo. LIBOR US + 1.18%), 3.19%, 07/23/30(c) | | | 965 | | | | 998,373 | |
(3 mo. LIBOR US + 0.01%), 2.88%, 10/22/30(a)(c) | | | 1,000 | | | | 1,008,785 | |
6.11%, 01/29/37 | | | 350 | | | | 473,105 | |
(3 mo. LIBOR US + 1.81%), 4.24%, 04/24/38(a)(c) | | | 1,500 | | | | 1,729,379 | |
7.75%, 05/14/38 | | | 200 | | | | 315,281 | |
5.88%, 02/07/42 | | | 1,100 | | | | 1,562,925 | |
5.00%, 01/21/44 | | | 1,250 | | | | 1,630,381 | |
(3 mo. LIBOR US + 1.99%), 4.44%, 01/20/48(a)(c) | | | 1,150 | | | | 1,402,808 | |
(3 mo. LIBOR US + 1.52%), 4.33%, 03/15/50(c) | | | 3,000 | | | | 3,616,660 | |
Series L, 3.95%, 04/21/25(a) | | | 2,155 | | | | 2,301,447 | |
Series L, 4.18%, 11/25/27(a) | | | 1,000 | | | | 1,084,447 | |
Citigroup, Inc.: | | | | | | | | |
2.70%, 03/30/21 | | | 4,750 | | | | 4,794,604 | |
2.35%, 08/02/21 | | | 4,000 | | | | 4,024,686 | |
2.90%, 12/08/21 | | | 750 | | | | 762,326 | |
2.75%, 04/25/22 | | | 1,500 | | | | 1,524,034 | |
4.05%, 07/30/22 | | | 250 | | | | 261,290 | |
2.70%, 10/27/22 | | | 500 | | | | 508,324 | |
(Secured Overnight Financing Rate + 0.87%), 2.31%, 11/04/22(c) | | | 700 | | | | 702,179 | |
(3 mo. LIBOR US + 0.72%), 3.14%, 01/24/23(c) | | | 500 | | | | 509,797 | |
3.50%, 05/15/23(a) | | | 500 | | | | 520,417 | |
(3 mo. LIBOR US + 0.95%), 2.88%, 07/24/23(c) | | | 500 | | | | 508,460 | |
3.88%, 03/26/25 | | | 500 | | | | 528,966 | |
(3 mo. LIBOR US + 0.90%), 3.35%, 04/24/25(c) | | | 4,000 | | | | 4,163,220 | |
3.30%, 04/27/25 | | | 155 | | | | 162,790 | |
4.40%, 06/10/25 | | | 500 | | | | 543,546 | |
3.70%, 01/12/26 | | | 1,000 | | | | 1,066,632 | |
4.60%, 03/09/26 | | | 250 | | | | 275,288 | |
3.40%, 05/01/26(a) | | | 500 | | | | 525,336 | |
3.20%, 10/21/26 | | | 500 | | | | 518,794 | |
4.30%, 11/20/26(a) | | | 150 | | | | 163,343 | |
4.45%, 09/29/27(a) | | | 3,000 | | | | 3,305,344 | |
(3 mo. LIBOR US + 1.56%), 3.89%, 01/10/28(a)(c) | | | 1,000 | | | | 1,077,712 | |
(3 mo. LIBOR US + 1.39%), 3.67%, 07/24/28(c) | | | 1,000 | | | | 1,066,142 | |
4.13%, 07/25/28(a) | | | 750 | | | | 818,452 | |
(3 mo. LIBOR US + 1.15%), 3.52%, 10/27/28(c) | | | 3,000 | | | | 3,158,691 | |
(Secured Overnight Financing Rate + 1.42%), 2.98%, 11/05/30(c) | | | 1,000 | | | | 1,015,556 | |
6.63%, 06/15/32 | | | 100 | | | | 134,674 | |
6.13%, 08/25/36 | | | 184 | | | | 239,661 | |
8.13%, 07/15/39 | | | 575 | | | | 959,938 | |
5.88%, 01/30/42(a) | | | 3,000 | | | | 4,223,276 | |
6.68%, 09/13/43 | | | 250 | | | | 365,028 | |
5.30%, 05/06/44(a) | | | 500 | | | | 637,911 | |
4.65%, 07/30/45 | | | 250 | | | | 309,762 | |
4.75%, 05/18/46 | | | 500 | | | | 598,065 | |
(3 mo. LIBOR US + 1.84%), 4.28%, 04/24/48(a)(c) | | | 1,000 | | | | 1,189,096 | |
4.65%, 07/23/48(a) | | | 1,500 | | | | 1,876,245 | |
Credit Suisse Group Funding Guernsey Ltd.: | | | | | | | | |
3.45%, 04/16/21 | | | 2,000 | | | | 2,034,259 | |
3.80%, 09/15/22 | | | 500 | | | | 520,573 | |
3.80%, 06/09/23 | | | 1,000 | | | | 1,047,022 | |
3.75%, 03/26/25(a) | | | 500 | | | | 529,276 | |
4.55%, 04/17/26 | | | 250 | | | | 277,558 | |
4.88%, 05/15/45 | | | 1,500 | | | | 1,893,882 | |
Deutsche Bank AG: | | | | | | | | |
3.13%, 01/13/21 | | | 200 | | | | 200,761 | |
| | | | | | | | |
| Security | | Par
(000) | | | Value | |
|
| Diversified Financial Services (continued) | |
(Secured Overnight Financing Rate + 2.58%), 3.96%, 11/26/25(c) | | $ | 800 | | | $ | 817,436 | |
4.10%, 01/13/26 | | | 350 | | | | 355,992 | |
Deutsche Bank AG, London, 3.70%, 05/30/24 | | | 215 | | | | 218,818 | |
Deutsche Bank AG, New York: | | | | | | | | |
3.13%, 01/13/21 | | | 300 | | | | 301,142 | |
3.15%, 01/22/21 | | | 500 | | | | 502,274 | |
4.25%, 10/14/21(a) | | | 2,000 | | | | 2,057,044 | |
3.95%, 02/27/23 | | | 2,000 | | | | 2,051,124 | |
E*TRADE Financial Corp., 4.50%, 06/20/28 | | | 1,000 | | | | 1,087,860 | |
Ford Motor Credit Co. LLC: | | | | | | | | |
3.20%, 01/15/21(a) | | | 500 | | | | 502,797 | |
5.75%, 02/01/21 | | | 250 | | | | 258,072 | |
3.34%, 03/18/21 | | | 500 | | | | 503,760 | |
3.81%, 10/12/21(a) | | | 2,000 | | | | 2,037,074 | |
3.35%, 11/01/22 | | | 500 | | | | 505,087 | |
4.14%, 02/15/23 | | | 1,000 | | | | 1,028,871 | |
3.10%, 05/04/23(a) | | | 500 | | | | 499,626 | |
4.38%, 08/06/23 | | | 220 | | | | 228,775 | |
5.58%, 03/18/24 | | | 1,000 | | | | 1,082,540 | |
3.66%, 09/08/24(a) | | | 1,000 | | | | 1,005,491 | |
4.06%, 11/01/24 | | | 500 | | | | 510,293 | |
4.69%, 06/09/25 | | | 500 | | | | 519,821 | |
4.13%, 08/04/25 | | | 500 | | | | 507,033 | |
4.39%, 01/08/26 | | | 250 | | | | 254,097 | |
4.54%, 08/01/26 | | | 500 | | | | 511,656 | |
3.82%, 11/02/27 | | | 2,250 | | | | 2,181,939 | |
GE Capital International Funding Co.: | | | | | | | | |
3.37%, 11/15/25(a) | | | 1,427 | | | | 1,486,918 | |
4.42%, 11/15/35 | | | 5,685 | | | | 6,081,438 | |
General Motors Financial Co., Inc.: | | | | | | | | |
4.20%, 03/01/21(a) | | | 750 | | | | 766,216 | |
3.45%, 04/10/22 | | | 400 | | | | 409,094 | |
3.55%, 07/08/22(a) | | | 1,000 | | | | 1,029,429 | |
3.25%, 01/05/23 | | | 3,000 | | | | 3,066,319 | |
5.10%, 01/17/24 | | | 1,000 | | | | 1,085,632 | |
3.95%, 04/13/24(a) | | | 1,000 | | | | 1,045,455 | |
4.00%, 01/15/25(a) | | | 250 | | | | 262,807 | |
4.30%, 07/13/25 | | | 1,000 | | | | 1,068,945 | |
5.25%, 03/01/26 | | | 405 | | | | 449,153 | |
5.65%, 01/17/29 | | | 250 | | | | 282,696 | |
Genpact Luxembourg Sarl, 3.38%, 12/01/24(a) | | | 1,000 | | | | 1,004,638 | |
Intercontinental Exchange, Inc.: | | | | | | | | |
2.35%, 09/15/22 | | | 2,000 | | | | 2,021,226 | |
3.75%, 12/01/25(a) | | | 1,115 | | | | 1,200,762 | |
3.75%, 09/21/28 | | | 1,135 | | | | 1,239,348 | |
4.25%, 09/21/48 | | | 500 | | | | 591,799 | |
Jefferies Financial Group, Inc., 5.50%, 10/18/23 | | | 150 | | | | 163,133 | |
John Deere Capital Corp.: | | | | | | | | |
2.35%, 01/08/21 | | | 4,000 | | | | 4,021,593 | |
2.80%, 03/04/21 | | | 250 | | | | 253,098 | |
3.90%, 07/12/21 | | | 50 | | | | 51,671 | |
2.65%, 01/06/22 | | | 140 | | | | 142,348 | |
2.75%, 03/15/22(a) | | | 500 | | | | 509,647 | |
2.95%, 04/01/22(a) | | | 500 | | | | 511,970 | |
1.95%, 06/13/22(a) | | | 300 | | | | 300,638 | |
2.15%, 09/08/22 | | | 1,000 | | | | 1,008,473 | |
2.80%, 03/06/23 | | | 500 | | | | 513,111 | |
3.45%, 01/10/24 | | | 1,000 | | | | 1,054,183 | |
2.25%, 09/14/26(a) | | | 500 | | | | 500,292 | |
3.05%, 01/06/28(a) | | | 300 | | | | 315,063 | |
2.80%, 07/18/29(a) | | | 630 | | | | 646,768 | |
| | |
| 28 | | 2019 BLACKROCK ANNUAL REPORTTO SHAREHOLDERS |
| | |
Schedule of Investments (continued) December 31, 2019 | | U.S. Total Bond Index Master Portfolio (Percentages shown are based on Net Assets) |
| | | | | | | | |
| Security | | Par
(000) | | | Value | |
|
| Diversified Financial Services (continued) | |
JPMorgan Chase & Co.: | | | | | | | | |
2.55%, 03/01/21 | | $ | 1,000 | | | $ | 1,007,735 | |
2.40%, 06/07/21 | | | 1,000 | | | | 1,006,596 | |
2.30%, 08/15/21 | | | 2,000 | | | | 2,004,928 | |
4.35%, 08/15/21 | | | 500 | | | | 519,260 | |
4.50%, 01/24/22 | | | 1,300 | | | | 1,365,030 | |
(3 mo. LIBOR US + 0.61%), 3.51%, 06/18/22(c) | | | 2,000 | | | | 2,043,317 | |
3.25%, 09/23/22 | | | 200 | | | | 206,929 | |
2.97%, 01/15/23 | | | 2,000 | | | | 2,037,858 | |
3.20%, 01/25/23 | | | 3,150 | | | | 3,250,938 | |
(3 mo. LIBOR US + 0.70%), 3.21%, 04/01/23(c) | | | 2,000 | | | | 2,047,694 | |
(3 mo. LIBOR US + 0.94%), 2.78%, 04/25/23(a)(c) | | | 1,500 | | | | 1,523,686 | |
3.38%, 05/01/23 | | | 250 | | | | 259,797 | |
2.70%, 05/18/23(a) | | | 500 | | | | 509,098 | |
(3 mo. LIBOR US + 0.73%), 3.56%, 04/23/24(c) | | | 1,500 | | | | 1,563,134 | |
3.63%, 05/13/24 | | | 1,000 | | | | 1,060,112 | |
(3 mo. LIBOR US + 0.89%), 3.80%, 07/23/24(c) | | | 4,500 | | | | 4,743,223 | |
3.88%, 09/10/24 | | | 1,300 | | | | 1,391,747 | |
3.13%, 01/23/25 | | | 250 | | | | 260,909 | |
(3 mo. LIBOR US + 1.16%), 3.22%, 03/01/25(a)(c) | | | 2,000 | | | | 2,073,558 | |
3.90%, 07/15/25 | | | 250 | | | | 270,019 | |
(Secured Overnight Financing Rate + 1.16%), 2.30%, 10/15/25(c) | | | 500 | | | | 499,436 | |
3.30%, 04/01/26 | | | 500 | | | | 526,325 | |
3.20%, 06/15/26 | | | 1,000 | | | | 1,044,825 | |
7.63%, 10/15/26 | | | 500 | | | | 645,816 | |
4.13%, 12/15/26(a) | | | 250 | | | | 273,886 | |
4.25%, 10/01/27(a) | | | 500 | | | | 553,591 | |
3.63%, 12/01/27 | | | 1,000 | | | | 1,056,533 | |
(3 mo. LIBOR US + 1.34%), 3.78%, 02/01/28(c) | | | 2,000 | | | | 2,156,770 | |
(3 mo. LIBOR US + 1.38%), 3.54%, 05/01/28(c) | | | 750 | | | | 796,893 | |
(3 mo. LIBOR US + 0.95%), 3.51%, 01/23/29(c) | | | 1,000 | | | | 1,062,915 | |
(3 mo. LIBOR US + 1.12%), 4.01%, 04/23/29(a)(c) | | | 4,000 | | | | 4,393,734 | |
(3 mo. LIBOR US + 1.26%), 4.20%, 07/23/29(c) | | | 175 | | | | 195,351 | |
(3 mo. LIBOR US + 1.33%), 4.45%, 12/05/29(a)(c) | | | 500 | | | | 569,046 | |
(3 mo. LIBOR US + 1.16%), 3.70%, 05/06/30(c) | | | 1,000 | | | | 1,077,382 | |
(Secured Overnight Financing Rate + 1.51%), 2.74%, 10/15/30(c) | | | 1,000 | | | | 1,000,146 | |
6.40%, 05/15/38(a) | | | 1,100 | | | | 1,594,088 | |
(3 mo. LIBOR US + 1.36%), 3.88%, 07/24/38(a)(c) | | | 1,000 | | | | 1,106,934 | |
5.50%, 10/15/40 | | | 125 | | | | 168,190 | |
5.60%, 07/15/41 | | | 550 | | | | 753,246 | |
5.40%, 01/06/42 | | | 400 | | | | 538,562 | |
5.63%, 08/16/43(a) | | | 500 | | | | 669,753 | |
4.85%, 02/01/44 | | | 100 | | | | 127,865 | |
4.95%, 06/01/45(a) | | | 2,250 | | | | 2,863,932 | |
(3 mo. LIBOR US + 1.58%), 4.26%, 02/22/48(c) | | | 1,000 | | | | 1,181,909 | |
(3 mo. LIBOR US + 1.46%), 4.03%, 07/24/48(c) | | | 500 | | | | 571,489 | |
(3 mo. LIBOR US + 1.38%), 3.96%, 11/15/48(a)(c) | | | 1,500 | | | | 1,699,670 | |
(3 mo. LIBOR US + 1.22%), 3.90%, 01/23/49(c) | | | 2,000 | | | | 2,250,953 | |
Lloyds Banking Group PLC: | | | | | | | | |
3.10%, 07/06/21 | | | 500 | | | | 507,886 | |
3.00%, 01/11/22(a) | | | 2,000 | | | | 2,032,248 | |
(3 mo. LIBOR US + 1.25%), 2.86%, 03/17/23(c) | | | 1,000 | | | | 1,013,819 | |
4.05%, 08/16/23(a) | | | 500 | | | | 530,186 | |
3.90%, 03/12/24 | | | 500 | | | | 528,012 | |
4.45%, 05/08/25 | | | 500 | | | | 546,259 | |
4.58%, 12/10/25 | | | 250 | | | | 270,776 | |
4.65%, 03/24/26(a) | | | 250 | | | | 271,950 | |
4.55%, 08/16/28(a) | | | 2,000 | | | | 2,240,729 | |
(3 mo. LIBOR US + 1.21%), 3.57%, 11/07/28(c) | | | 500 | | | | 522,443 | |
5.30%, 12/01/45(a) | | | 250 | | | | 307,760 | |
4.34%, 01/09/48(a) | | | 1,000 | | | | 1,082,823 | |
(3 mo. LIBOR US + 0.81%), 2.91%, 11/07/23(a)(c) | | | 1,000 | | | | 1,015,074 | |
| | | | | | | | |
| Security | | Par
(000) | | | Value | |
|
| Diversified Financial Services (continued) | |
Mitsubishi UFJ Financial Group, Inc.: | | | | | | | | |
2.95%, 03/01/21 | | $ | 2,000 | | | $ | 2,021,930 | |
3.00%, 02/22/22(a) | | | 1,500 | | | | 1,528,847 | |
3.46%, 03/02/23(a) | | | 3,000 | | | | 3,104,919 | |
3.76%, 07/26/23 | | | 1,500 | | | | 1,580,217 | |
2.80%, 07/18/24(a) | | | 1,000 | | | | 1,020,305 | |
3.85%, 03/01/26 | | | 500 | | | | 537,099 | |
2.76%, 09/13/26 | | | 250 | | | | 253,365 | |
3.29%, 07/25/27(a) | | | 1,000 | | | | 1,042,452 | |
3.96%, 03/02/28(a) | | | 1,000 | | | | 1,090,786 | |
3.74%, 03/07/29 | | | 2,000 | | | | 2,158,468 | |
4.29%, 07/26/38 | | | 250 | | | | 288,757 | |
3.75%, 07/18/39 | | | 1,010 | | | | 1,107,286 | |
Mizuho Financial Group, Inc.: | | | | | | | | |
2.95%, 02/28/22 | | | 250 | | | | 254,581 | |
3.55%, 03/05/23 | | | 2,000 | | | | 2,086,525 | |
(3 mo. LIBOR US + 1.00%), 3.92%, 09/11/24(c) | | | 2,000 | | | | 2,101,381 | |
(3 mo. LIBOR US + 1.10%), 2.56%, 09/13/25(c) | | | 905 | | | | 905,261 | |
3.17%, 09/11/27(a) | | | 1,000 | | | | 1,030,254 | |
(3 mo. LIBOR US + 1.13%), 3.15%, 07/16/30(c) | | | 1,000 | | | | 1,022,295 | |
(3 mo. LIBOR US + 1.31%), 2.87%, 09/13/30(c) | | | 500 | | | | 499,589 | |
Moody’s Corp.: | | | | | | | | |
4.50%, 09/01/22 | | | 550 | | | | 581,607 | |
4.88%, 02/15/24(a) | | | 500 | | | | 549,870 | |
3.25%, 01/15/28 | | | 750 | | | | 786,919 | |
4.25%, 02/01/29(a) | | | 1,000 | | | | 1,132,635 | |
MUFG Americas Holdings Corp., 3.00%, 02/10/25 | | | 200 | | | | 204,027 | |
National Rural Utilities Cooperative Finance Corp.: | | | | | | | | |
2.90%, 03/15/21(a) | | | 400 | | | | 404,502 | |
2.30%, 09/15/22(a) | | | 1,000 | | | | 1,009,027 | |
3.40%, 11/15/23 | | | 350 | | | | 368,453 | |
2.85%, 01/27/25 | | | 250 | | | | 257,390 | |
3.40%, 02/07/28 | | | 2,000 | | | | 2,128,107 | |
4.30%, 03/15/49 | | | 500 | | | | 594,547 | |
Royal Bank of Scotland Group PLC: | | | | | | | | |
6.13%, 12/15/22 | | | 1,000 | | | | 1,094,612 | |
3.88%, 09/12/23 | | | 1,000 | | | | 1,048,034 | |
6.00%, 12/19/23 | | | 2,000 | | | | 2,224,400 | |
(3 mo. LIBOR US + 1.55%), 4.52%, 06/25/24(c) | | | 2,000 | | | | 2,124,745 | |
4.80%, 04/05/26 | | | 500 | | | | 555,581 | |
(3 mo. LIBOR US + 1.75%), 4.89%, 05/18/29(a)(c) | | | 750 | | | | 848,415 | |
(5 year CMT + 2.10%), 3.75%, 11/01/29(a)(c) | | | 290 | | | | 296,185 | |
(3 mo. LIBOR US + 1.91%), 5.08%, 01/27/30(c) | | | 1,000 | | | | 1,150,378 | |
(3 mo. LIBOR US + 1.87%), 4.45%, 05/08/30(a)(c) | | | 1,000 | | | | 1,105,004 | |
S&P Global, Inc.: | | | | | | | | |
4.40%, 02/15/26 | | | 750 | | | | 831,820 | |
2.50%, 12/01/29 | | | 320 | | | | 320,246 | |
4.50%, 05/15/48 | | | 250 | | | | 304,743 | |
3.25%, 12/01/49 | | | 225 | | | | 230,270 | |
Sumitomo Mitsui Financial Group, Inc.: | | | | | | | | |
2.93%, 03/09/21 | | | 1,500 | | | | 1,516,191 | |
2.44%, 10/19/21 | | | 1,000 | | | | 1,007,902 | |
2.85%, 01/11/22 | | | 1,000 | | | | 1,015,627 | |
3.10%, 01/17/23 | | | 4,000 | | | | 4,102,837 | |
3.75%, 07/19/23 | | | 500 | | | | 524,587 | |
2.45%, 09/27/24 | | | 1,000 | | | | 1,002,555 | |
3.78%, 03/09/26 | | | 500 | | | | 534,646 | |
2.63%, 07/14/26 | | | 1,000 | | | | 1,000,943 | |
3.01%, 10/19/26 | | | 250 | | | | 256,195 | |
3.36%, 07/12/27 | | | 1,000 | | | | 1,044,276 | |
3.35%, 10/18/27(a) | | | 500 | | | | 521,716 | |
3.54%, 01/17/28(a) | | | 2,000 | | | | 2,116,971 | |
3.04%, 07/16/29 | | | 920 | | | | 938,839 | |
| | | | |
| SCHEDULE OF INVESTMENTS | | | 29 | |
| | |
Schedule of Investments (continued) December 31, 2019 | | U.S. Total Bond Index Master Portfolio (Percentages shown are based on Net Assets) |
| | | | | | | | |
| Security | | Par
(000) | | | Value | |
|
| Diversified Financial Services (continued) | |
3.20%, 09/17/29 | | $ | 500 | | | $ | 507,325 | |
2.72%, 09/27/29(a) | | | 1,000 | | | | 998,430 | |
Toyota Motor Credit Corp.: | | | | | | | | |
1.90%, 04/08/21(a) | | | 900 | | | | 901,244 | |
2.95%, 04/13/21 | | | 500 | | | | 507,541 | |
2.60%, 01/11/22(a) | | | 250 | | | | 253,781 | |
3.30%, 01/12/22 | | | 2,000 | | | | 2,057,188 | |
2.63%, 01/10/23 | | | 2,000 | | | | 2,039,346 | |
3.65%, 01/08/29 | | | 2,000 | | | | 2,189,586 | |
| | | | | | | | |
| | | | | | | 318,947,917 | |
|
| Diversified Telecommunication Services — 0.9% | |
AT&T, Inc.: | | | | | | | | |
2.80%, 02/17/21 | | | 400 | | | | 403,602 | |
3.20%, 03/01/22 | | | 2,000 | | | | 2,047,490 | |
3.80%, 03/15/22 | | | 250 | | | | 259,502 | |
2.63%, 12/01/22(a) | | | 2,000 | | | | 2,030,886 | |
3.60%, 02/17/23 | | | 500 | | | | 521,898 | |
3.80%, 03/01/24 | | | 1,000 | | | | 1,061,358 | |
4.45%, 04/01/24(a) | | | 500 | | | | 542,030 | |
3.95%, 01/15/25 | | | 500 | | | | 535,951 | |
3.40%, 05/15/25 | | | 2,500 | | | | 2,618,181 | |
3.60%, 07/15/25 | | | 250 | | | | 264,638 | |
3.88%, 01/15/26 | | | 1,000 | | | | 1,071,702 | |
4.13%, 02/17/26 | | | 1,250 | | | | 1,354,921 | |
2.95%, 07/15/26 | | | 1,500 | | | | 1,529,227 | |
3.80%, 02/15/27(a) | | | 500 | | | | 533,016 | |
4.25%, 03/01/27(a) | | | 1,000 | | | | 1,098,382 | |
4.10%, 02/15/28 | | | 1,544 | | | | 1,680,101 | |
4.35%, 03/01/29(a) | | | 500 | | | | 556,256 | |
4.30%, 02/15/30(a) | | | 1,000 | | | | 1,111,191 | |
4.50%, 05/15/35 | | | 810 | | | | 902,605 | |
5.25%, 03/01/37 | | | 1,000 | | | | 1,194,784 | |
4.90%, 08/15/37(a) | | | 750 | | | | 863,568 | |
4.85%, 03/01/39(a) | | | 2,000 | | | | 2,306,840 | |
6.00%, 08/15/40 | | | 250 | | | | 320,211 | |
5.35%, 09/01/40 | | | 463 | | | | 558,826 | |
6.25%, 03/29/41(a) | | | 150 | | | | 195,336 | |
5.55%, 08/15/41 | | | 200 | | | | 244,742 | |
5.38%, 10/15/41 | | | 1,500 | | | | 1,784,907 | |
5.15%, 03/15/42 | | | 150 | | | | 175,273 | |
4.90%, 06/15/42 | | | 350 | | | | 399,600 | |
4.30%, 12/15/42 | | | 651 | | | | 697,426 | |
5.35%, 12/15/43 | | | 250 | | | | 296,419 | |
4.65%, 06/01/44 | | | 250 | | | | 273,278 | |
4.80%, 06/15/44 | | | 750 | | | | 855,746 | |
4.35%, 06/15/45 | | | 2,759 | | | | 2,978,650 | |
4.85%, 07/15/45 | | | 500 | | | | 571,079 | |
4.75%, 05/15/46 | | | 1,000 | | | | 1,131,743 | |
5.15%, 11/15/46 | | | 1,952 | | | | 2,337,214 | |
5.65%, 02/15/47(a) | | | 250 | | | | 318,545 | |
5.45%, 03/01/47 | | | 750 | | | | 931,705 | |
4.50%, 03/09/48(a) | | | 3,250 | | | | 3,590,594 | |
4.55%, 03/09/49(a) | | | 2,000 | | | | 2,221,030 | |
5.15%, 02/15/50 | | | 500 | | | | 603,278 | |
5.70%, 03/01/57 | | | 500 | | | | 645,637 | |
British Telecommunications PLC: | | | | | | | | |
5.13%, 12/04/28 | | | 1,000 | | | | 1,149,677 | |
9.63%, 12/15/30 | | | 900 | | | | 1,384,147 | |
Deutsche Telekom International Finance BV, 8.75%, 06/15/30 | | | 1,650 | | | | 2,430,785 | |
Orange SA(a): | | | | | | | | |
9.00%, 03/01/31 | | | 250 | | | | 387,258 | |
5.38%, 01/13/42 | | | 1,825 | | | | 2,350,874 | |
| | | | | | | | |
| Security | | Par
(000) | | | Value | |
|
| Diversified Telecommunication Services (continued) | |
Telefonica Emisiones SAU: | | | | | | | | |
5.46%, 02/16/21 | | $ | 1,050 | | | $ | 1,089,793 | |
4.57%, 04/27/23(a) | | | 1,200 | | | | 1,291,372 | |
4.10%, 03/08/27 | | | 1,000 | | | | 1,082,522 | |
7.05%, 06/20/36 | | | 75 | | | | 104,981 | |
4.67%, 03/06/38 | | | 1,000 | | | | 1,118,794 | |
5.21%, 03/08/47 | | | 1,750 | | | | 2,077,085 | |
4.90%, 03/06/48(a) | | | 500 | | | | 572,519 | |
5.52%, 03/01/49 | | | 500 | | | | 627,286 | |
Telefonica Europe BV, 8.25%, 09/15/30 | | | 300 | | | | 431,024 | |
Verizon Communications, Inc.: | | | | | | | | |
4.15%, 03/15/24(a) | | | 2,000 | | | | 2,157,280 | |
3.50%, 11/01/24 | | | 500 | | | | 530,236 | |
3.38%, 02/15/25 | | | 3,992 | | | | 4,228,760 | |
2.63%, 08/15/26 | | | 900 | | | | 914,037 | |
4.13%, 03/16/27(a) | | | 750 | | | | 832,679 | |
4.33%, 09/21/28 | | | 3,164 | | | | 3,591,042 | |
3.88%, 02/08/29 | | | 3,000 | | | | 3,309,341 | |
4.02%, 12/03/29 | | | 1,500 | | | | 1,672,118 | |
4.50%, 08/10/33 | | | 1,750 | | | | 2,042,793 | |
4.40%, 11/01/34 | | | 2,500 | | | | 2,898,141 | |
4.27%, 01/15/36 | | | 1,250 | | | | 1,415,691 | |
5.25%, 03/16/37 | | | 1,250 | | | | 1,569,912 | |
4.81%, 03/15/39(a) | | | 596 | | | | 719,470 | |
3.85%, 11/01/42 | | | 250 | | | | 270,158 | |
6.55%, 09/15/43(a) | | | 750 | | | | 1,101,199 | |
4.86%, 08/21/46 | | | 1,500 | | | | 1,862,093 | |
5.50%, 03/16/47 | | | 250 | | | | 339,470 | |
4.52%, 09/15/48 | | | 4,250 | | | | 5,099,768 | |
5.01%, 04/15/49 | | | 1,981 | | | | 2,539,871 | |
| | | | | | | | |
| | | | | | | 98,811,544 | |
|
| Electric Utilities — 1.6% | |
AEP Texas, Inc.: | | | | | | | | |
2.40%, 10/01/22 | | | 2,000 | | | | 2,018,669 | |
3.95%, 06/01/28 | | | 500 | | | | 543,724 | |
Series H, 3.45%, 01/15/50 | | | 250 | | | | 250,239 | |
AEP Transmission Co. LLC: | | | | | | | | |
3.10%, 12/01/26(a) | | | 500 | | | | 518,172 | |
3.80%, 06/15/49(a) | | | 1,000 | | | | 1,070,154 | |
3.15%, 09/15/49 | | | 135 | | | | 130,624 | |
Alabama Power Co.: | | | | | | | | |
3.75%, 03/01/45 | | | 250 | | | | 265,033 | |
4.30%, 01/02/46 | | | 250 | | | | 285,859 | |
3.45%, 10/01/49 | | | 185 | | | | 189,812 | |
Series B, 3.70%, 12/01/47(a) | | | 2,500 | | | | 2,641,237 | |
Ameren Corp., 2.50%, 09/15/24 | | | 635 | | | | 637,833 | |
Ameren Illinois Co.: | | | | | | | | |
2.70%, 09/01/22 | | | 100 | | | | 101,789 | |
4.30%, 07/01/44 | | | 250 | | | | 285,166 | |
3.25%, 03/15/50 | | | 150 | | | | 151,906 | |
American Electric Power Co., Inc., Series F, 2.95%, 12/15/22 | | | 500 | | | | 509,553 | |
Appalachian Power Co., 4.40%, 05/15/44 | | | 250 | | | | 282,541 | |
Arizona Public Service Co.: | | | | | | | | |
3.15%, 05/15/25(a) | | | 250 | | | | 259,258 | |
2.60%, 08/15/29(a) | | | 1,000 | | | | 991,603 | |
5.05%, 09/01/41 | | | 250 | | | | 304,092 | |
4.20%, 08/15/48 | | | 250 | | | | 283,522 | |
3.50%, 12/01/49 | | | 1,100 | | | | 1,109,306 | |
Baltimore Gas & Electric Co.: | | | | | | | | |
2.40%, 08/15/26 | | | 1,000 | | | | 992,884 | |
3.50%, 08/15/46 | | | 700 | | | | 712,918 | |
3.20%, 09/15/49(a) | | | 225 | | | | 220,529 | |
| | |
| 30 | | 2019 BLACKROCK ANNUAL REPORTTO SHAREHOLDERS |
| | |
Schedule of Investments (continued) December 31, 2019 | | U.S. Total Bond Index Master Portfolio (Percentages shown are based on Net Assets) |
| | | | | | | | |
| Security | | Par
(000) | | | Value | |
|
| Electric Utilities (continued) | |
Berkshire Hathaway Energy Co.: | | | | | | | | |
2.38%, 01/15/21 | | $ | 2,000 | | | $ | 2,010,690 | |
3.75%, 11/15/23 | | | 500 | | | | 531,135 | |
3.50%, 02/01/25 | | | 110 | | | | 116,789 | |
3.25%, 04/15/28(a) | | | 1,000 | | | | 1,057,310 | |
6.13%, 04/01/36 | | | 250 | | | | 343,426 | |
5.15%, 11/15/43 | | | 250 | | | | 316,645 | |
4.50%, 02/01/45(a) | | | 400 | | | | 471,517 | |
4.45%, 01/15/49 | | | 2,000 | | | | 2,380,414 | |
Black Hills Corp.: | | | | | | | | |
3.95%, 01/15/26 | | | 200 | | | | 210,621 | |
3.05%, 10/15/29 | | | 415 | | | | 413,516 | |
4.35%, 05/01/33(a) | | | 400 | | | | 444,045 | |
3.88%, 10/15/49(a) | | | 350 | | | | 349,773 | |
CenterPoint Energy Houston Electric LLC: | | | | | | | | |
1.85%, 06/01/21(a) | | | 500 | | | | 499,892 | |
3.55%, 08/01/42 | | | 100 | | | | 105,161 | |
3.95%, 03/01/48 | | | 250 | | | | 280,853 | |
Cleco Corporate Holdings LLC: | | | | | | | | |
3.74%, 05/01/26(a) | | | 500 | | | | 516,691 | |
3.38%, 09/15/29(b) | | | 1,000 | | | | 1,004,308 | |
CMS Energy Corp.: | | | | | | | | |
3.45%, 08/15/27 | | | 1,000 | | | | 1,046,553 | |
4.70%, 03/31/43 | | | 200 | | | | 225,583 | |
Commonwealth Edison Co.: | | | | | | | | |
3.10%, 11/01/24(a) | | | 250 | | | | 259,515 | |
2.55%, 06/15/26 | | | 250 | | | | 253,071 | |
3.70%, 08/15/28 | | | 500 | | | | 547,040 | |
5.90%, 03/15/36 | | | 50 | | | | 66,375 | |
3.70%, 03/01/45 | | | 250 | | | | 266,151 | |
3.65%, 06/15/46 | | | 1,000 | | | | 1,062,143 | |
4.00%, 03/01/48 | | | 2,000 | | | | 2,250,744 | |
Series 122, 2.95%, 08/15/27(a) | | | 1,000 | | | | 1,036,283 | |
Series 127, 3.20%, 11/15/49 | | | 610 | | | | 607,326 | |
Connecticut Light & Power Co.: | | | | | | | | |
2.50%, 01/15/23 | | | 150 | | | | 152,193 | |
Series A, 3.20%, 03/15/27 | | | 500 | | | | 528,243 | |
Consolidated Edison Co. of New York, Inc.: | | | | | | | | |
3.30%, 12/01/24(a) | | | 250 | | | | 262,514 | |
3.80%, 05/15/28(a) | | | 1,000 | | | | 1,089,097 | |
3.95%, 03/01/43 | | | 150 | | | | 162,485 | |
4.45%, 03/15/44 | | | 250 | | | | 290,500 | |
4.50%, 05/15/58(a) | | | 1,000 | | | | 1,162,886 | |
3.70%, 11/15/59 | | | 200 | | | | 206,676 | |
Series A, 4.20%, 03/15/42 | | | 400 | | | | 446,393 | |
Series A, 4.13%, 05/15/49 | | | 500 | | | | 568,207 | |
Series C, 4.30%, 12/01/56 | | | 500 | | | | 564,723 | |
Series C, 4.00%, 11/15/57 | | | 750 | | | | 804,175 | |
Series D, 4.00%, 12/01/28(a) | | | 500 | | | | 555,601 | |
Series E, 4.65%, 12/01/48(a) | | | 500 | | | | 608,627 | |
Consolidated Edison, Inc., 2.00%, 05/15/21 | | | 750 | | | | 750,483 | |
Consumers Energy Co.(a): | | | | | | | | |
4.35%, 04/15/49 | | | 1,000 | | | | 1,214,029 | |
3.10%, 08/15/50 | | | 215 | | | | 214,621 | |
Dominion Energy South Carolina, Inc.: | | | | | | | | |
5.45%, 02/01/41 | | | 1,000 | | | | 1,300,917 | |
4.60%, 06/15/43 | | | 250 | | | | 296,896 | |
Dominion Energy, Inc.: | | | | | | | | |
3.07%, 08/15/24(a)(d) | | | 500 | | | | 515,084 | |
3.90%, 10/01/25 | | | 2,000 | | | | 2,148,900 | |
7.00%, 06/15/38 | | | 250 | | | | 347,190 | |
Series C, 4.90%, 08/01/41 | | | 50 | | | | 58,673 | |
DTE Electric Co.: | | | | | | | | |
3.65%, 03/15/24 | | | 1,000 | | | | 1,058,706 | |
| | | | | | | | |
| Security | | Par
(000) | | | Value | |
|
| Electric Utilities (continued) | |
3.70%, 03/15/45 | | $ | 645 | | | $ | 696,378 | |
3.70%, 06/01/46(a) | | | 250 | | | | 270,434 | |
3.75%, 08/15/47 | | | 200 | | | | 218,899 | |
Series A, 4.00%, 04/01/43 | | | 150 | | | | 168,439 | |
Series A, 4.05%, 05/15/48(a) | | | 250 | | | | 290,260 | |
DTE Energy Co.: | | | | | | | | |
2.25%, 11/01/22 | | | 200 | | | | 199,985 | |
2.95%, 03/01/30 | | | 1,500 | | | | 1,485,452 | |
Series C, 2.53%, 10/01/24 | | | 1,000 | | | | 1,004,879 | |
Series C, 3.40%, 06/15/29 | | | 1,225 | | | | 1,263,055 | |
Duke Energy Carolinas LLC: | | | | | | | | |
3.05%, 03/15/23 | | | 200 | | | | 206,153 | |
2.45%, 08/15/29(a) | | | 1,000 | | | | 993,283 | |
6.10%, 06/01/37 | | | 500 | | | | 680,287 | |
6.05%, 04/15/38 | | | 100 | | | | 138,359 | |
5.30%, 02/15/40 | | | 250 | | | | 323,812 | |
4.25%, 12/15/41 | | | 2,000 | | | | 2,286,899 | |
3.70%, 12/01/47 | | | 500 | | | | 538,099 | |
3.95%, 03/15/48 | | | 1,000 | | | | 1,122,831 | |
3.20%, 08/15/49 | | | 595 | | | | 593,024 | |
Duke Energy Corp.: | | | | | | | | |
1.80%, 09/01/21 | | | 3,000 | | | | 2,997,571 | |
2.40%, 08/15/22 | | | 1,000 | | | | 1,010,175 | |
3.95%, 10/15/23 | | | 250 | | | | 265,282 | |
3.75%, 04/15/24(a) | | | 500 | | | | 529,957 | |
2.65%, 09/01/26 | | | 500 | | | | 502,435 | |
3.15%, 08/15/27(a) | | | 500 | | | | 515,294 | |
4.80%, 12/15/45 | | | 250 | | | | 296,493 | |
3.75%, 09/01/46 | | | 500 | | | | 517,223 | |
3.95%, 08/15/47(a) | | | 500 | | | | 529,659 | |
4.20%, 06/15/49 | | | 500 | | | | 552,861 | |
Duke Energy Florida LLC: | | | | | | | | |
2.50%, 12/01/29 | | | 345 | | | | 344,086 | |
3.40%, 10/01/46(a) | | | 250 | | | | 254,744 | |
Duke Energy Indiana LLC: | | | | | | | | |
3.75%, 05/15/46 | | | 500 | | | | 537,297 | |
Series UUU, 4.20%, 03/15/42 | | | 400 | | | | 443,519 | |
Series WWW, 4.90%, 07/15/43(a) | | | 250 | | | | 308,430 | |
Series YYY, 3.25%, 10/01/49 | | | 500 | | | | 500,067 | |
Duke Energy Ohio, Inc., 3.70%, 06/15/46 | | | 250 | | | | 265,483 | |
Duke Energy Progress LLC: | | | | | | | | |
3.38%, 09/01/23 | | | 250 | | | | 261,238 | |
3.70%, 09/01/28 | | | 365 | | | | 398,279 | |
4.10%, 05/15/42 | | | 150 | | | | 169,788 | |
4.10%, 03/15/43 | | | 250 | | | | 280,116 | |
4.38%, 03/30/44 | | | 100 | | | | 116,190 | |
4.20%, 08/15/45 | | | 250 | | | | 284,763 | |
3.70%, 10/15/46 | | | 500 | | | | 535,371 | |
Edison International: | | | | | | | | |
3.13%, 11/15/22 | | | 95 | | | | 96,493 | |
3.55%, 11/15/24 | | | 175 | | | | 179,261 | |
5.75%, 06/15/27(a) | | | 50 | | | | 56,140 | |
Emera US Finance LP: | | | | | | | | |
2.70%, 06/15/21 | | | 1,000 | | | | 1,009,307 | |
3.55%, 06/15/26 | | | 75 | | | | 77,915 | |
4.75%, 06/15/46 | | | 350 | | | | 405,248 | |
Entergy Arkansas LLC, 3.50%, 04/01/26(a) | | | 65 | | | | 68,573 | |
Entergy Corp., 4.00%, 07/15/22 | | | 200 | | | | 208,783 | |
Entergy Louisiana LLC: | | | | | | | | |
4.05%, 09/01/23(a) | | | 250 | | | | 265,836 | |
5.40%, 11/01/24 | | | 3,000 | | | | 3,436,070 | |
4.00%, 03/15/33 | | | 250 | | | | 282,913 | |
4.20%, 09/01/48 | | | 250 | | | | 289,385 | |
4.20%, 04/01/50 | | | 1,000 | | | | 1,160,390 | |
| | | | |
| SCHEDULE OF INVESTMENTS | | | 31 | |
| | |
Schedule of Investments (continued) December 31, 2019 | | U.S. Total Bond Index Master Portfolio (Percentages shown are based on Net Assets) |
| | | | | | | | |
| Security | | Par
(000) | | | Value | |
|
| Electric Utilities (continued) | |
Entergy Mississippi LLC, 2.85%, 06/01/28 | | $ | 500 | | | $ | 511,496 | |
Entergy Texas, Inc., 3.55%, 09/30/49 | | | 200 | | | | 203,803 | |
Evergy Kansas Central, Inc.: | | | | | | | | |
2.55%, 07/01/26 | | | 350 | | | | 351,081 | |
4.25%, 12/01/45 | | | 1,000 | | | | 1,140,530 | |
3.25%, 09/01/49 | | | 500 | | | | 492,625 | |
Evergy Metro, Inc., 3.65%, 08/15/25 | | | 150 | | | | 160,018 | |
Evergy, Inc.: | | | | | | | | |
2.45%, 09/15/24 | | | 500 | | | | 502,969 | |
2.90%, 09/15/29 | | | 500 | | | | 497,651 | |
Eversource Energy: | | | | | | | | |
2.50%, 03/15/21(a) | | | 500 | | | | 502,933 | |
Series H, 3.15%, 01/15/25 | | | 125 | | | | 128,999 | |
Series M, 3.30%, 01/15/28 | | | 2,000 | | | | 2,061,216 | |
Exelon Corp.: | | | | | | | | |
3.50%, 06/01/22 | | | 500 | | | | 513,523 | |
3.95%, 06/15/25 | | | 250 | | | | 268,964 | |
3.40%, 04/15/26 | | | 750 | | | | 783,637 | |
5.10%, 06/15/45(a) | | | 250 | | | | 301,523 | |
4.45%, 04/15/46 | | | 250 | | | | 281,069 | |
Exelon Generation Co. LLC: | | | | | | | | |
4.25%, 06/15/22 | | | 500 | | | | 522,991 | |
6.25%, 10/01/39 | | | 150 | | | | 180,583 | |
5.75%, 10/01/41 | | | 500 | | | | 577,546 | |
5.60%, 06/15/42 | | | 50 | | | | 57,208 | |
FirstEnergy Corp.: | | | | | | | | |
Series B, 3.90%, 07/15/27 | | | 2,000 | | | | 2,139,348 | |
Series C, 4.85%, 07/15/47 | | | 500 | | | | 594,816 | |
Florida Power & Light Co.: | | | | | | | | |
2.75%, 06/01/23 | | | 250 | | | | 256,281 | |
3.13%, 12/01/25 | | | 500 | | | | 525,389 | |
5.95%, 02/01/38(a) | | | 50 | | | | 69,281 | |
5.25%, 02/01/41 | | | 500 | | | | 646,687 | |
4.13%, 02/01/42 | | | 500 | | | | 573,079 | |
4.05%, 10/01/44(a) | | | 750 | | | | 855,712 | |
3.70%, 12/01/47(a) | | | 1,000 | | | | 1,092,109 | |
3.95%, 03/01/48 | | | 500 | | | | 570,620 | |
4.13%, 06/01/48(a) | | | 500 | | | | 585,884 | |
3.15%, 10/01/49 | | | 885 | | | | 895,196 | |
Georgia Power Co.: | | | | | | | | |
4.30%, 03/15/42 | | | 700 | | | | 768,125 | |
Series A, 2.20%, 09/15/24 | | | 1,000 | | | | 1,000,128 | |
Series B, 2.65%, 09/15/29 | | | 1,000 | | | | 986,963 | |
Indiana Michigan Power Co.: | | | | | | | | |
6.05%, 03/15/37 | | | 175 | | | | 229,126 | |
4.25%, 08/15/48 | | | 250 | | | | 286,165 | |
Series K, 4.55%, 03/15/46 | | | 150 | | | | 175,194 | |
Interstate Power & Light Co.: | | | | | | | | |
3.25%, 12/01/24 | | | 250 | | | | 260,366 | |
3.70%, 09/15/46 | | | 500 | | | | 507,900 | |
3.50%, 09/30/49 | | | 105 | | | | 103,023 | |
ITC Holdings Corp., 3.25%, 06/30/26 | | | 1,000 | | | | 1,031,759 | |
Louisville Gas & Electric Co., 4.65%, 11/15/43(a) | | | 250 | | | | 294,687 | |
MidAmerican Energy Co.: | | | | | | | | |
3.65%, 04/15/29 | | | 500 | | | | 546,780 | |
4.80%, 09/15/43 | | | 250 | | | | 309,249 | |
4.40%, 10/15/44 | | | 1,000 | | | | 1,180,043 | |
4.25%, 07/15/49(a) | | | 1,500 | | | | 1,800,791 | |
3.15%, 04/15/50 | | | 250 | | | | 246,954 | |
Mississippi Power Co., Series A, 4.25%, 03/15/42 | | | 500 | | | | 537,623 | |
Nevada Power Co., 5.45%, 05/15/41(a) | | | 50 | | | | 63,926 | |
NextEra Energy Capital Holdings, Inc.: | | | | | | | | |
2.80%, 01/15/23 | | | 1,000 | | | | 1,022,291 | |
3.63%, 06/15/23 | | | 1,250 | | | | 1,307,072 | |
| | | | | | | | |
| Security | | Par
(000) | | | Value | |
|
| Electric Utilities (continued) | |
3.15%, 04/01/24 | | $ | 500 | | | $ | 518,541 | |
3.55%, 05/01/27 | | | 1,000 | | | | 1,062,497 | |
2.75%, 11/01/29 | | | 245 | | | | 246,307 | |
Northern States Power Co.: | | | | | | | | |
2.60%, 05/15/23 | | | 500 | | | | 507,870 | |
3.40%, 08/15/42 | | | 200 | | | | 209,408 | |
4.00%, 08/15/45 | | | 85 | | | | 96,501 | |
3.60%, 09/15/47 | | | 150 | | | | 160,613 | |
2.90%, 03/01/50(a) | | | 445 | | | | 425,136 | |
NSTAR Electric Co., 2.70%, 06/01/26(a) | | | 250 | | | | 253,448 | |
Oglethorpe Power Corp.: | | | | | | | | |
4.55%, 06/01/44 | | | 250 | | | | 262,583 | |
5.05%, 10/01/48 | | | 500 | | | | 589,057 | |
Ohio Power Co., 4.15%, 04/01/48(a) | | | 1,000 | | | | 1,129,989 | |
Oncor Electric Delivery Co. LLC: | | | | | | | | |
7.00%, 09/01/22 | | | 100 | | | | 111,752 | |
3.70%, 11/15/28 | | | 355 | | | | 388,610 | |
5.25%, 09/30/40 | | | 250 | | | | 320,666 | |
5.30%, 06/01/42 | | | 75 | | | | 98,157 | |
3.75%, 04/01/45 | | | 250 | | | | 271,843 | |
3.80%, 09/30/47 | | | 1,000 | | | | 1,103,904 | |
3.10%, 09/15/49 | | | 245 | | | | 239,473 | |
PacifiCorp: | | | | | | | | |
2.95%, 02/01/22 | | | 100 | | | | 101,960 | |
2.95%, 06/01/23 | | | 300 | | | | 308,256 | |
4.10%, 02/01/42 | | | 250 | | | | 279,072 | |
PECO Energy Co.: | | | | | | | | |
1.70%, 09/15/21 | | | 1,000 | | | | 998,780 | |
3.90%, 03/01/48(a) | | | 1,000 | | | | 1,127,461 | |
3.00%, 09/15/49 | | | 195 | | | | 187,419 | |
Pennsylvania Electric Co., 6.15%, 10/01/38 | | | 250 | | | | 324,199 | |
Potomac Electric Power Co.: | | | | | | | | |
3.60%, 03/15/24 | | | 250 | | | | 263,460 | |
4.15%, 03/15/43 | | | 250 | | | | 282,547 | |
PPL Capital Funding, Inc.: | | | | | | | | |
3.50%, 12/01/22 | | | 2,000 | | | | 2,069,844 | |
3.40%, 06/01/23 | | | 1,250 | | | | 1,290,618 | |
5.00%, 03/15/44 | | | 1,000 | | | | 1,149,720 | |
4.00%, 09/15/47 | | | 500 | | | | 512,040 | |
PPL Electric Utilities Corp.: | | | | | | | | |
4.75%, 07/15/43 | | | 250 | | | | 302,083 | |
3.00%, 10/01/49 | | | 170 | | | | 162,545 | |
Progress Energy, Inc.: | | | | | | | | |
4.40%, 01/15/21 | | | 100 | | | | 101,955 | |
7.75%, 03/01/31(a) | | | 50 | | | | 70,415 | |
Public Service Co. of Colorado: | | | | | | | | |
3.70%, 06/15/28 | | | 2,000 | | | | 2,182,171 | |
3.60%, 09/15/42 | | | 250 | | | | 264,336 | |
3.95%, 03/15/43(a) | | | 200 | | | | 215,957 | |
4.30%, 03/15/44 | | | 75 | | | | 87,461 | |
3.80%, 06/15/47 | | | 1,000 | | | | 1,088,126 | |
Public Service Co. of New Hampshire, 3.60%, 07/01/49 | | | 1,000 | | | | 1,068,813 | |
Public Service Co. of Oklahoma, Series G, 6.63%, 11/15/37 | | | 250 | | | | 346,270 | |
Public Service Electric & Gas Co.: | | | | | | | | |
2.38%, 05/15/23 | | | 250 | | | | 253,368 | |
3.05%, 11/15/24(a) | | | 250 | | | | 259,359 | |
3.20%, 05/15/29(a) | | | 500 | | | | 527,537 | |
3.95%, 05/01/42 | | | 50 | | | | 55,484 | |
3.65%, 09/01/42 | | | 50 | | | | 53,447 | |
3.80%, 03/01/46(a) | | | 1,250 | | | | 1,378,842 | |
3.85%, 05/01/49 | | | 500 | | | | 563,267 | |
Series K, 4.05%, 05/01/45(a) | | | 150 | | | | 167,092 | |
| | |
| 32 | | 2019 BLACKROCK ANNUAL REPORTTO SHAREHOLDERS |
| | |
Schedule of Investments (continued) December 31, 2019 | | U.S. Total Bond Index Master Portfolio (Percentages shown are based on Net Assets) |
| | | | | | | | |
| Security | | Par
(000) | | | Value | |
|
| Electric Utilities (continued) | |
Puget Energy, Inc.: | | | | | | | | |
5.63%, 07/15/22 | | $ | 500 | | | $ | 536,416 | |
3.65%, 05/15/25 | | | 250 | | | | 258,965 | |
Puget Sound Energy, Inc.: | | | | | | | | |
5.80%, 03/15/40(a) | | | 500 | | | | 665,400 | |
4.22%, 06/15/48 | | | 500 | | | | 576,259 | |
3.25%, 09/15/49 | | | 1,000 | | | | 996,489 | |
Sierra Pacific Power Co., 2.60%, 05/01/26(a) | | | 1,250 | | | | 1,257,038 | |
Southern California Edison Co.: | | | | | | | | |
2.85%, 08/01/29(a) | | | 2,000 | | | | 1,998,183 | |
5.50%, 03/15/40 | | | 50 | | | | 61,752 | |
4.50%, 09/01/40 | | | 1,000 | | | | 1,098,653 | |
4.65%, 10/01/43 | | | 350 | | | | 397,111 | |
4.00%, 04/01/47 | | | 500 | | | | 526,426 | |
Series A, 5.95%, 02/01/38(a) | | | 500 | | | | 634,305 | |
Series B, 2.40%, 02/01/22 | | | 250 | | | | 251,304 | |
Series C, 3.60%, 02/01/45 | | | 250 | | | | 248,649 | |
Series C, 4.13%, 03/01/48 | | | 1,000 | | | | 1,068,506 | |
Series D, 3.40%, 06/01/23 | | | 1,000 | | | | 1,036,973 | |
Series E, 3.70%, 08/01/25(a) | | | 2,000 | | | | 2,118,499 | |
Southern Co.: | | | | | | | | |
2.35%, 07/01/21 | | | 1,000 | | | | 1,005,058 | |
2.95%, 07/01/23 | | | 500 | | | | 512,905 | |
3.25%, 07/01/26 | | | 500 | | | | 520,946 | |
4.40%, 07/01/46 | | | 250 | | | | 277,266 | |
Southern Power Co.: | | | | | | | | |
5.25%, 07/15/43(a) | | | 500 | | | | 573,009 | |
Series E, 2.50%, 12/15/21 | | | 1,000 | | | | 1,010,411 | |
Southwestern Electric Power Co., Series L, 3.85%, 02/01/48 | | | 500 | | | | 519,885 | |
Southwestern Public Service Co., 3.75%, 06/15/49 | | | 1,000 | | | | 1,076,009 | |
Tampa Electric Co.: | | | | | | | | |
4.10%, 06/15/42 | | | 250 | | | | 272,470 | |
4.45%, 06/15/49 | | | 250 | | | | 296,446 | |
3.63%, 06/15/50(a) | | | 80 | | | | 84,438 | |
Toledo Edison Co., 6.15%, 05/15/37 | | | 100 | | | | 137,324 | |
Tucson Electric Power Co., 4.85%, 12/01/48 | | | 250 | | | | 305,168 | |
Union Electric Co.: | | | | | | | | |
2.95%, 06/15/27 | | | 2,000 | | | | 2,061,311 | |
4.00%, 04/01/48 | | | 1,000 | | | | 1,109,877 | |
3.25%, 10/01/49 | | | 500 | | | | 496,593 | |
Virginia Electric & Power Co.: | | | | | | | | |
2.95%, 01/15/22 | | | 400 | | | | 406,997 | |
4.00%, 01/15/43 | | | 250 | | | | 276,437 | |
4.45%, 02/15/44 | | | 150 | | | | 174,275 | |
4.60%, 12/01/48(a) | | | 455 | | | | 557,905 | |
3.30%, 12/01/49 | | | 280 | | | | 282,722 | |
Series A, 3.15%, 01/15/26 | | | 555 | | | | 580,244 | |
Series A, 3.50%, 03/15/27(a) | | | 750 | | | | 802,345 | |
Series A, 2.88%, 07/15/29 | | | 115 | | | | 117,846 | |
Series A, 6.00%, 05/15/37 | | | 250 | | | | 337,897 | |
Series B, 6.00%, 01/15/36 | | | 1,000 | | | | 1,329,481 | |
Series B, 3.80%, 09/15/47 | | | 1,500 | | | | 1,623,769 | |
Series D, 4.65%, 08/15/43 | | | 500 | | | | 598,049 | |
WEC Energy Group, Inc., 3.55%, 06/15/25 | | | 350 | | | | 371,644 | |
Wisconsin Electric Power Co., 4.30%, 10/15/48(a) | | | 750 | | | | 881,811 | |
Wisconsin Power & Light Co., 3.00%, 07/01/29 | | | 1,000 | | | | 1,032,573 | |
Wisconsin Public Service Corp., 3.30%, 09/01/49 | | | 625 | | | | 626,590 | |
Xcel Energy, Inc.: | | | | | | | | |
3.30%, 06/01/25 | | | 292 | | | | 304,954 | |
3.35%, 12/01/26(a) | | | 500 | | | | 524,818 | |
4.00%, 06/15/28 | | | 1,000 | | | | 1,099,218 | |
2.60%, 12/01/29 | | | 200 | | | | 198,220 | |
| | | | | | | | |
| Security | | Par
(000) | | | Value | |
|
| Electric Utilities (continued) | |
4.80%, 09/15/41 | | $ | 250 | | | $ | 282,133 | |
3.50%, 12/01/49 | | | 200 | | | | 203,341 | |
| | | | | | | | |
| | | | | | | 175,317,479 | |
|
| Electrical Equipment — 0.1% | |
Eaton Corp.: | | | | | | | | |
2.75%, 11/02/22 | | | 2,250 | | | | 2,295,907 | |
3.10%, 09/15/27 | | | 190 | | | | 197,465 | |
4.00%, 11/02/32 | | | 200 | | | | 226,912 | |
4.15%, 11/02/42(a) | | | 250 | | | | 279,754 | |
Emerson Electric Co.: | | | | | | | | |
2.63%, 12/01/21 | | | 750 | | | | 762,751 | |
2.63%, 02/15/23 | | | 350 | | | | 359,226 | |
Rockwell Automation, Inc., 4.20%, 03/01/49 | | | 1,000 | | | | 1,168,339 | |
Roper Technologies, Inc.: | | | | | | | | |
3.13%, 11/15/22(a) | | | 150 | | | | 153,742 | |
3.65%, 09/15/23 | | | 250 | | | | 262,531 | |
2.35%, 09/15/24(a) | | | 240 | | | | 241,377 | |
3.80%, 12/15/26(a) | | | 250 | | | | 268,723 | |
2.95%, 09/15/29(a) | | | 435 | | | | 439,430 | |
Tyco Electronics Group SA: | | | | | | | | |
3.50%, 02/03/22 | | | 100 | | | | 102,851 | |
3.45%, 08/01/24 | | | 75 | | | | 78,598 | |
| | | | | | | | |
| | | | | | | 6,837,606 | |
|
| Electronic Equipment, Instruments & Components — 0.1% | |
Amphenol Corp., 2.80%, 02/15/30(a) | | | 1,000 | | | | 990,670 | |
Arrow Electronics, Inc., 4.00%, 04/01/25(a) | | | 500 | | | | 527,164 | |
Avnet, Inc., 3.75%, 12/01/21 | | | 1,000 | | | | 1,026,306 | |
Corning, Inc.: | | | | | | | | |
3.70%, 11/15/23 | | | 250 | | | | 260,586 | |
4.75%, 03/15/42 | | | 50 | | | | 56,808 | |
5.35%, 11/15/48(a) | | | 1,000 | | | | 1,255,124 | |
3.90%, 11/15/49 | | | 250 | | | | 253,661 | |
4.38%, 11/15/57 | | | 750 | | | | 769,644 | |
5.45%, 11/15/79 | | | 250 | | | | 273,907 | |
Flex Ltd., 4.88%, 06/15/29 | | | 500 | | | | 544,222 | |
Honeywell International, Inc.: | | | | | | | | |
1.85%, 11/01/21(a) | | | 4,000 | | | | 4,009,217 | |
2.30%, 08/15/24 | | | 1,000 | | | | 1,012,291 | |
2.70%, 08/15/29 | | | 1,500 | | | | 1,535,304 | |
3.81%, 11/21/47(a) | | | 500 | | | | 568,889 | |
Jabil, Inc., 4.70%, 09/15/22(a) | | | 250 | | | | 264,947 | |
Keysight Technologies, Inc., 3.00%, 10/30/29 | | | 800 | | | | 802,658 | |
| | | | | | | | |
| | | | | | | 14,151,398 | |
|
| Energy Equipment & Services — 0.1% | |
Baker Hughes a GE Co. LLC, 5.13%, 09/15/40(a) | | | 100 | | | | 117,823 | |
Baker Hughes a GE Co. LLC/Baker HughesCo-Obligor, Inc.: | | | | | | | | |
2.77%, 12/15/22 | | | 500 | | | | 510,039 | |
3.34%, 12/15/27 | | | 450 | | | | 469,773 | |
3.14%, 11/07/29 | | | 325 | | | | 334,653 | |
4.08%, 12/15/47 | | | 1,500 | | | | 1,538,260 | |
Halliburton Co.: | | | | | | | | |
3.80%, 11/15/25 | | | 4,550 | | | | 4,853,898 | |
4.85%, 11/15/35 | | | 1,000 | | | | 1,131,463 | |
4.50%, 11/15/41(a) | | | 50 | | | | 53,133 | |
4.75%, 08/01/43 | | | 250 | | | | 278,012 | |
5.00%, 11/15/45 | | | 1,175 | | | | 1,343,179 | |
National Oilwell Varco, Inc.: | | | | | | | | |
2.60%, 12/01/22 | | | 786 | | | | 793,552 | |
3.60%, 12/01/29 | | | 1,000 | | | | 1,003,049 | |
3.95%, 12/01/42 | | | 150 | | | | 138,230 | |
TechnipFMC PLC, 3.45%, 10/01/22 | | | 100 | | | | 102,155 | |
| | | | | | | | |
| | | | | | | 12,667,219 | |
| | | | |
| SCHEDULE OF INVESTMENTS | | | 33 | |
| | |
Schedule of Investments (continued) December 31, 2019 | | U.S. Total Bond Index Master Portfolio (Percentages shown are based on Net Assets) |
| | | | | | | | |
| Security | | Par
(000) | | | Value | |
|
| Equity Real Estate Investment Trusts (REITs) — 0.8% | |
Alexandria Real Estate Equities, Inc.: | | | | | | | | |
3.90%, 06/15/23(a) | | $ | 2,000 | | | $ | 2,101,199 | |
4.30%, 01/15/26(a) | | | 750 | | | | 823,393 | |
3.38%, 08/15/31 | | | 820 | | | | 852,386 | |
4.00%, 02/01/50 | | | 1,000 | | | | 1,095,863 | |
American Campus Communities Operating Partnership LP, 3.30%, 07/15/26(a) | | | 1,000 | | | | 1,036,539 | |
American Tower Corp.: | | | | | | | | |
2.75%, 01/15/27 | | | 435 | | | | 434,526 | |
3.70%, 10/15/49 | | | 425 | | | | 423,579 | |
5.90%, 11/01/21(a) | | | 500 | | | | 533,973 | |
4.70%, 03/15/22 | | | 100 | | | | 105,379 | |
3.50%, 01/31/23 | | | 150 | | | | 155,450 | |
3.00%, 06/15/23 | | | 1,000 | | | | 1,022,118 | |
5.00%, 02/15/24 | | | 1,000 | | | | 1,099,868 | |
2.95%, 01/15/25 | | | 500 | | | | 510,962 | |
4.40%, 02/15/26 | | | 30 | | | | 32,738 | |
3.38%, 10/15/26 | | | 500 | | | | 519,880 | |
3.95%, 03/15/29(a) | | | 1,000 | | | | 1,075,604 | |
3.80%, 08/15/29(a) | | | 500 | | | | 534,565 | |
AvalonBay Communities, Inc.: | | | | | | | | |
2.95%, 09/15/22 | | | 100 | | | | 102,434 | |
3.45%, 06/01/25 | | | 100 | | | | 105,705 | |
3.20%, 01/15/28 | | | 2,000 | | | | 2,088,465 | |
3.30%, 06/01/29 | | | 255 | | | | 269,750 | |
3.90%, 10/15/46(a) | | | 250 | | | | 274,380 | |
Boston Properties LP: | | | | | | | | |
4.13%, 05/15/21 | | | 250 | | | | 255,867 | |
3.85%, 02/01/23 | | | 1,000 | | | | 1,047,885 | |
3.13%, 09/01/23 | | | 250 | | | | 258,027 | |
3.20%, 01/15/25 | | | 1,000 | | | | 1,038,091 | |
3.65%, 02/01/26 | | | 190 | | | | 201,359 | |
4.50%, 12/01/28 | | | 1,000 | | | | 1,133,992 | |
2.90%, 03/15/30 | | | 480 | | | | 479,229 | |
Brixmor Operating Partnership LP: | | | | | | | | |
3.65%, 06/15/24(a) | | | 750 | | | | 784,557 | |
4.13%, 06/15/26 | | | 250 | | | | 266,366 | |
4.13%, 05/15/29 | | | 1,250 | | | | 1,342,978 | |
Choice Hotels International, Inc., 3.70%, 12/01/29 | | | 200 | | | | 201,458 | |
Crown Castle International Corp.: | | | | | | | | |
3.40%, 02/15/21 | | | 750 | | | | 760,206 | |
2.25%, 09/01/21 | | | 1,000 | | | | 1,002,907 | |
3.70%, 06/15/26 | | | 280 | | | | 296,002 | |
4.00%, 03/01/27(a) | | | 1,000 | | | | 1,079,827 | |
3.80%, 02/15/28(a) | | | 2,000 | | | | 2,131,980 | |
4.00%, 11/15/49 | | | 585 | | | | 605,636 | |
CubeSmart LP, 3.00%, 02/15/30 | | | 1,500 | | | | 1,483,253 | |
Digital Realty Trust LP: | | | | | | | | |
4.75%, 10/01/25(a) | | | 500 | | | | 555,695 | |
3.70%, 08/15/27 | | | 1,000 | | | | 1,059,738 | |
3.60%, 07/01/29 | | | 750 | | | | 780,720 | |
Duke Realty LP, 2.88%, 11/15/29 | | | 540 | | | | 541,539 | |
EPR Properties: | | | | | | | | |
4.50%, 06/01/27 | | | 1,000 | | | | 1,070,628 | |
3.75%, 08/15/29(a) | | | 845 | | | | 856,657 | |
ERP Operating LP: | | | | | | | | |
4.63%, 12/15/21 | | | 2,000 | | | | 2,089,618 | |
3.00%, 04/15/23(a) | | | 500 | | | | 514,956 | |
3.25%, 08/01/27(a) | | | 500 | | | | 525,671 | |
3.50%, 03/01/28(a) | | | 1,000 | | | | 1,066,906 | |
3.00%, 07/01/29(a) | | | 735 | | | | 761,399 | |
2.50%, 02/15/30(a) | | | 405 | | | | 402,142 | |
4.50%, 07/01/44 | | | 150 | | | | 178,335 | |
| | | | | | | | |
| Security | | Par
(000) | | | Value | |
|
| Equity Real Estate Investment Trusts (REITs) (continued) | |
Essex Portfolio LP: | | | | | | | | |
3.88%, 05/01/24(a) | | $ | 100 | | | $ | 105,725 | |
4.00%, 03/01/29(a) | | | 2,000 | | | | 2,173,377 | |
3.00%, 01/15/30 | | | 200 | | | | 202,419 | |
Federal Realty Investment Trust, 3.25%, 07/15/27 | | | 500 | | | | 518,431 | |
Healthcare Trust of America Holdings LP, 3.10%, 02/15/30 | | | 1,000 | | | | 993,152 | |
Healthpeak Properties, Inc.: | | | | | | | | |
3.15%, 08/01/22 | | | 100 | | | | 102,372 | |
3.40%, 02/01/25 | | | 500 | | | | 522,213 | |
4.00%, 06/01/25 | | | 500 | | | | 537,610 | |
3.50%, 07/15/29 | | | 1,500 | | | | 1,564,687 | |
3.00%, 01/15/30 | | | 530 | | | | 532,094 | |
Host Hotels & Resorts LP: | | | | | | | | |
Series E, 4.00%, 06/15/25 | | | 190 | | | | 203,482 | |
Series H, 3.38%, 12/15/29 | | | 1,000 | | | | 1,009,041 | |
Hudson Pacific Properties LP, 4.65%, 04/01/29 | | | 1,000 | | | | 1,100,893 | |
Kilroy Realty LP(a): | | | | | | | | |
4.75%, 12/15/28 | | | 1,000 | | | | 1,134,824 | |
3.05%, 02/15/30 | | | 1,000 | | | | 986,298 | |
Kimco Realty Corp.: | | | | | | | | |
3.20%, 05/01/21 | | | 250 | | | | 253,529 | |
3.30%, 02/01/25 | | | 350 | | | | 364,341 | |
2.80%, 10/01/26(a) | | | 500 | | | | 502,640 | |
4.45%, 09/01/47 | | | 350 | | | | 383,990 | |
3.70%, 10/01/49 | | | 500 | | | | 486,805 | |
Liberty Property LP, 4.40%, 02/15/24(a) | | | 250 | | | | 270,305 | |
Life Storage LP, 4.00%, 06/15/29(a) | | | 1,000 | | | | 1,070,962 | |
Mid-America Apartments LP(a): | | | | | | | | |
4.30%, 10/15/23 | | | 200 | | | | 214,047 | |
3.95%, 03/15/29 | | | 500 | | | | 545,672 | |
National Retail Properties, Inc.: | | | | | | | | |
3.30%, 04/15/23(a) | | | 500 | | | | 514,758 | |
4.30%, 10/15/28 | | | 1,000 | | | | 1,106,783 | |
Omega Healthcare Investors, Inc.: | | | | | | | | |
4.50%, 04/01/27(a) | | | 250 | | | | 269,903 | |
4.75%, 01/15/28(a) | | | 500 | | | | 544,594 | |
3.63%, 10/01/29 | | | 600 | | | | 600,725 | |
Realty Income Corp.: | | | | | | | | |
4.65%, 08/01/23 | | | 250 | | | | 270,591 | |
4.13%, 10/15/26 | | | 1,000 | | | | 1,097,392 | |
3.00%, 01/15/27 | | | 1,000 | | | | 1,029,124 | |
3.25%, 06/15/29(a) | | | 975 | | | | 1,029,881 | |
Sabra Health Care LP/Sabra Capital Corp., 3.90%, 10/15/29 | | | 1,000 | | | | 1,005,700 | |
Service Properties Trust: | | | | | | | | |
5.00%, 08/15/22(a) | | | 200 | | | | 210,424 | |
4.95%, 02/15/27(a) | | | 1,000 | | | | 1,037,204 | |
4.35%, 10/01/24 | | | 1,000 | | | | 1,027,684 | |
Simon Property Group LP: | | | | | | | | |
2.35%, 01/30/22 | | | 2,000 | | | | 2,017,822 | |
2.63%, 06/15/22 | | | 250 | | | | 253,950 | |
2.00%, 09/13/24 | | | 1,040 | | | | 1,035,016 | |
3.38%, 10/01/24(a) | | | 500 | | | | 526,619 | |
3.30%, 01/15/26(a) | | | 1,500 | | | | 1,579,151 | |
3.38%, 06/15/27(a) | | | 750 | | | | 793,891 | |
2.45%, 09/13/29 | | | 500 | | | | 492,240 | |
4.75%, 03/15/42 | | | 100 | | | | 120,130 | |
4.25%, 10/01/44 | | | 250 | | | | 283,180 | |
4.25%, 11/30/46(a) | | | 500 | | | | 572,080 | |
3.25%, 09/13/49 | | | 655 | | | | 637,340 | |
SITE Centers Corp.: | | | | | | | | |
4.63%, 07/15/22 | | | 32 | | | | 33,377 | |
4.25%, 02/01/26 | | | 250 | | | | 263,865 | |
| | |
| 34 | | 2019 BLACKROCK ANNUAL REPORTTO SHAREHOLDERS |
| | |
Schedule of Investments (continued) December 31, 2019 | | U.S. Total Bond Index Master Portfolio (Percentages shown are based on Net Assets) |
| | | | | | | | |
| Security | | Par
(000) | | | Value | |
|
| Equity Real Estate Investment Trusts (REITs) (continued) | |
Spirit Realty LP: | | | | | | | | |
4.00%, 07/15/29 | | $ | 425 | | | $ | 447,602 | |
3.40%, 01/15/30 | | | 500 | | | | 502,631 | |
UDR, Inc.: | | | | | | | | |
4.40%, 01/26/29(a) | | | 1,000 | | | | 1,116,937 | |
3.20%, 01/15/30 | | | 500 | | | | 511,437 | |
3.00%, 08/15/31 | | | 500 | | | | 500,979 | |
Ventas Realty LP: | | | | | | | | |
2.65%, 01/15/25 | | | 650 | | | | 654,904 | |
4.13%, 01/15/26 | | | 1,250 | | | | 1,339,169 | |
3.25%, 10/15/26 | | | 500 | | | | 511,978 | |
4.00%, 03/01/28(a) | | | 1,500 | | | | 1,608,874 | |
3.00%, 01/15/30(a) | | | 1,000 | | | | 991,467 | |
VEREIT Operating Partnership LP, 3.95%, 08/15/27 | | | 500 | | | | 525,796 | |
Welltower, Inc.: | | | | | | | | |
4.00%, 06/01/25 | | | 2,250 | | | | 2,422,494 | |
4.25%, 04/01/26 | | | 350 | | | | 381,134 | |
4.13%, 03/15/29(a) | | | 1,000 | | | | 1,090,060 | |
3.10%, 01/15/30(a) | | | 1,000 | | | | 1,012,712 | |
Weyerhaeuser Co.: | | | | | | | | |
4.00%, 11/15/29(a) | | | 2,000 | | | | 2,165,168 | |
7.38%, 03/15/32 | | | 350 | | | | 484,008 | |
WP Carey, Inc., 3.85%, 07/15/29 | | | 475 | | | | 501,684 | |
| | | | | | | | |
| | | | | | | 90,873,747 | |
|
| Food & Staples Retailing — 0.3% | |
Koninklijke Ahold Delhaize NV, 5.70%, 10/01/40(a) | | | 73 | | | | 90,142 | |
Kroger Co.: | | | | | | | | |
3.30%, 01/15/21 | | | 500 | | | | 506,477 | |
3.40%, 04/15/22 | | | 100 | | | | 102,841 | |
3.50%, 02/01/26(a) | | | 495 | | | | 521,952 | |
2.65%, 10/15/26(a) | | | 1,000 | | | | 1,006,827 | |
3.70%, 08/01/27 | | | 500 | | | | 535,484 | |
4.50%, 01/15/29(a) | | | 1,000 | | | | 1,125,145 | |
5.15%, 08/01/43(a) | | | 125 | | | | 143,493 | |
3.88%, 10/15/46(a) | | | 500 | | | | 489,891 | |
4.65%, 01/15/48 | | | 500 | | | | 547,280 | |
5.40%, 01/15/49 | | | 500 | | | | 610,820 | |
Mondelez International, Inc.: | | | | | | | | |
3.63%, 05/07/23(a) | | | 500 | | | | 524,279 | |
4.63%, 05/07/48 | | | 500 | | | | 577,234 | |
Walgreen Co., 3.10%, 09/15/22 | | | 200 | | | | 204,179 | |
Walgreens Boots Alliance, Inc.: | | | | | | | | |
3.30%, 11/18/21 | | | 500 | | | | 509,482 | |
3.80%, 11/18/24(a) | | | 1,000 | | | | 1,042,401 | |
3.45%, 06/01/26 | | | 1,305 | | | | 1,327,763 | |
4.50%, 11/18/34 | | | 155 | | | | 161,709 | |
4.80%, 11/18/44(a) | | | 150 | | | | 152,008 | |
4.65%, 06/01/46 | | | 1,000 | | | | 1,005,745 | |
Walmart, Inc.: | | | | | | | | |
3.13%, 06/23/21(a) | | | 4,500 | | | | 4,596,217 | |
2.35%, 12/15/22 | | | 1,250 | | | | 1,271,879 | |
3.30%, 04/22/24 | | | 1,750 | | | | 1,840,552 | |
2.85%, 07/08/24 | | | 2,500 | | | | 2,593,866 | |
2.65%, 12/15/24(a) | | | 250 | | | | 258,171 | |
3.70%, 06/26/28 | | | 1,000 | | | | 1,101,793 | |
3.25%, 07/08/29 | | | 250 | | | | 268,330 | |
2.38%, 09/24/29(a) | | | 275 | | | | 275,326 | |
3.95%, 06/28/38(a) | | | 1,000 | | | | 1,158,439 | |
4.88%, 07/08/40(a) | | | 2,000 | | | | 2,517,968 | |
4.00%, 04/11/43 | | | 150 | | | | 171,447 | |
4.30%, 04/22/44 | | | 750 | | | | 891,499 | |
3.63%, 12/15/47 | | | 1,000 | | | | 1,113,050 | |
| | | | | | | | |
| Security | | Par
(000) | | | Value | |
|
| Food & Staples Retailing (continued) | |
4.05%, 06/29/48 | | $ | 1,900 | | | $ | 2,252,154 | |
2.95%, 09/24/49 | | | 495 | | | | 493,188 | |
| | | | | | | | |
| | | | | | | 31,989,031 | |
|
| Food Products — 0.3% | |
Archer-Daniels-Midland Co.: | | | | | | | | |
2.50%, 08/11/26 | | | 1,750 | | | | 1,775,793 | |
4.54%, 03/26/42 | | | 75 | | | | 88,765 | |
4.02%, 04/16/43 | | | 250 | | | | 276,297 | |
4.50%, 03/15/49 | | | 1,000 | | | | 1,222,541 | |
Bunge, Ltd. Finance Corp., 3.75%, 09/25/27 | | | 1,000 | | | | 1,022,296 | |
Campbell Soup Co.: | | | | | | | | |
3.65%, 03/15/23 | | | 1,000 | | | | 1,041,840 | |
3.30%, 03/19/25(a) | | | 1,000 | | | | 1,030,579 | |
4.80%, 03/15/48(a) | | | 1,000 | | | | 1,158,345 | |
Conagra Brands, Inc.: | | | | | | | | |
3.25%, 09/15/22 | | | 200 | | | | 204,863 | |
3.20%, 01/25/23 | | | 500 | | | | 515,361 | |
4.30%, 05/01/24(a) | | | 1,000 | | | | 1,077,006 | |
4.60%, 11/01/25(a) | | | 1,000 | | | | 1,104,822 | |
5.30%, 11/01/38 | | | 1,000 | | | | 1,187,625 | |
5.40%, 11/01/48(a) | | | 500 | | | | 610,704 | |
General Mills, Inc.: | | | | | | | | |
3.15%, 12/15/21(a) | | | 650 | | | | 664,576 | |
2.60%, 10/12/22(a) | | | 250 | | | | 253,833 | |
3.65%, 02/15/24 | | | 500 | | | | 525,684 | |
3.20%, 02/10/27(a) | | | 250 | | | | 263,450 | |
4.20%, 04/17/28(a) | | | 1,000 | | | | 1,114,720 | |
4.15%, 02/15/43 | | | 300 | | | | 322,504 | |
4.70%, 04/17/48 | | | 1,000 | | | | 1,193,073 | |
JM Smucker Co.: | | | | | | | | |
3.50%, 10/15/21 | | | 50 | | | | 51,291 | |
3.50%, 03/15/25(a) | | | 1,250 | | | | 1,315,769 | |
4.25%, 03/15/35(a) | | | 250 | | | | 270,760 | |
4.38%, 03/15/45 | | | 500 | | | | 539,764 | |
Kellogg Co.(a): | | | | | | | | |
3.25%, 04/01/26 | | | 65 | | | | 67,604 | |
4.30%, 05/15/28 | | | 1,000 | | | | 1,107,502 | |
4.50%, 04/01/46 | | | 350 | | | | 390,740 | |
Kraft Heinz Foods Co.: | | | | | | | | |
3.95%, 07/15/25(a) | | | 1,750 | | | | 1,853,082 | |
3.00%, 06/01/26 | | | 310 | | | | 310,090 | |
4.63%, 01/30/29 | | | 1,000 | | | | 1,100,198 | |
3.75%, 04/01/30(a)(b) | | | 250 | | | | 257,616 | |
5.00%, 07/15/35 | | | 500 | | | | 555,527 | |
6.50%, 02/09/40 | | | 750 | | | | 910,426 | |
5.00%, 06/04/42 | | | 200 | | | | 213,704 | |
5.20%, 07/15/45 | | | 1,000 | | | | 1,085,950 | |
4.38%, 06/01/46 | | | 2,500 | | | | 2,464,424 | |
4.88%, 10/01/49(a)(b) | | | 750 | | | | 791,622 | |
Sysco Corp.: | | | | | | | | |
3.55%, 03/15/25 | | | 1,000 | | | | 1,064,852 | |
3.75%, 10/01/25 | | | 100 | | | | 107,575 | |
3.30%, 07/15/26 | | | 130 | | | | 137,093 | |
4.85%, 10/01/45(a) | | | 150 | | | | 180,287 | |
4.50%, 04/01/46 | | | 250 | | | | 285,743 | |
4.45%, 03/15/48(a) | | | 500 | | | | 569,484 | |
Tyson Foods, Inc.: | | | | | | | | |
4.50%, 06/15/22 | | | 150 | | | | 157,943 | |
3.55%, 06/02/27 | | | 1,000 | | | | 1,063,292 | |
4.88%, 08/15/34 | | | 70 | | | | 83,564 | |
5.15%, 08/15/44 | | | 250 | | | | 305,235 | |
5.10%, 09/28/48 | | | 1,500 | | | | 1,888,738 | |
| | | | | | | | |
| | | | | | | 35,784,552 | |
| | | | |
| SCHEDULE OF INVESTMENTS | | | 35 | |
| | |
Schedule of Investments (continued) December 31, 2019 | | U.S. Total Bond Index Master Portfolio (Percentages shown are based on Net Assets) |
| | | | | | | | |
| Security | | Par
(000) | | | Value | |
|
| Forest Products — 0.0% | |
Hershey Co.: | | | | | | | | |
2.05%, 11/15/24 | | $ | 500 | | | $ | 501,216 | |
2.45%, 11/15/29 | | | 500 | | | | 502,920 | |
3.13%, 11/15/49 | | | 500 | | | | 495,898 | |
| | | | | | | | |
| | | | | | | 1,500,034 | |
|
| Gas Utilities — 0.1% | |
Atmos Energy Corp.: | | | | | | | | |
3.00%, 06/15/27 | | | 500 | | | | 516,066 | |
2.63%, 09/15/29(a) | | | 210 | | | | 212,029 | |
4.15%, 01/15/43(a) | | | 100 | | | | 112,242 | |
4.30%, 10/01/48 | | | 500 | | | | 586,017 | |
4.13%, 03/15/49 | | | 500 | | | | 574,634 | |
3.38%, 09/15/49 | | | 630 | | | | 639,784 | |
National Fuel Gas Co., 3.75%, 03/01/23 | | | 300 | | | | 309,695 | |
NiSource, Inc.: | | | | | | | | |
3.65%, 06/15/23 | | | 1,000 | | | | 1,041,718 | |
2.95%, 09/01/29 | | | 1,000 | | | | 996,671 | |
5.95%, 06/15/41 | | | 1,050 | | | | 1,345,871 | |
5.25%, 02/15/43 | | | 75 | | | | 91,291 | |
4.80%, 02/15/44 | | | 250 | | | | 290,784 | |
4.38%, 05/15/47 | | | 500 | | | | 554,738 | |
Sempra Energy: | | | | | | | | |
4.05%, 12/01/23 | | | 250 | | | | 265,879 | |
3.55%, 06/15/24 | | | 250 | | | | 261,904 | |
3.75%, 11/15/25 | | | 250 | | | | 264,615 | |
3.40%, 02/01/28(a) | | | 2,000 | | | | 2,073,365 | |
4.00%, 02/01/48(a) | | | 1,000 | | | | 1,051,111 | |
Southern California Gas Co.(a): | | | | | | | | |
Series TT, 2.60%, 06/15/26 | | | 1,250 | | | | 1,252,894 | |
Series UU, 4.13%, 06/01/48 | | | 250 | | | | 278,337 | |
Southern Co. Gas Capital Corp.: | | | | | | | | |
3.50%, 09/15/21(a) | | | 50 | | | | 51,033 | |
2.45%, 10/01/23(a) | | | 1,000 | | | | 1,007,041 | |
3.95%, 10/01/46 | | | 750 | | | | 775,933 | |
| | | | | | | | |
| | | | | | | 14,553,652 | |
|
| Health Care Equipment & Supplies — 0.2% | |
Baxter International, Inc.: | | | | | | | | |
1.70%, 08/15/21 | | | 1,000 | | | | 998,548 | |
2.60%, 08/15/26 | | | 730 | | | | 736,660 | |
Becton Dickinson & Co.: | | | | | | | | |
2.89%, 06/06/22 | | | 500 | | | | 508,326 | |
3.30%, 03/01/23 | | | 200 | | | | 204,282 | |
3.36%, 06/06/24 | | | 1,000 | | | | 1,041,541 | |
3.73%, 12/15/24 | | | 1,250 | | | | 1,325,220 | |
3.70%, 06/06/27 | | | 1,630 | | | | 1,734,646 | |
6.00%, 05/15/39 | | | 250 | | | | 309,855 | |
4.69%, 12/15/44 | | | 196 | | | | 229,381 | |
4.67%, 06/06/47(a) | | | 500 | | | | 596,099 | |
Boston Scientific Corp.: | | | | | | | | |
3.85%, 05/15/25 | | | 382 | | | | 410,428 | |
4.00%, 03/01/29 | | | 250 | | | | 276,684 | |
4.55%, 03/01/39 | | | 1,000 | | | | 1,176,419 | |
4.70%, 03/01/49 | | | 800 | | | | 973,546 | |
DH Europe Finance II Sarl: | | | | | | | | |
2.05%, 11/15/22 | | | 300 | | | | 300,328 | |
2.20%, 11/15/24 | | | 1,000 | | | | 1,001,347 | |
2.60%, 11/15/29(a) | | | 445 | | | | 443,386 | |
3.25%, 11/15/39 | | | 400 | | | | 403,452 | |
3.40%, 11/15/49(a) | | | 675 | | | | 687,751 | |
Medtronic Global Holdings SCA, 3.35%, 04/01/27(a) | | | 250 | | | | 266,713 | |
Medtronic, Inc.: | | | | | | | | |
3.15%, 03/15/22 | | | 1,350 | | | | 1,388,500 | |
3.63%, 03/15/24 | | | 400 | | | | 424,225 | |
| | | | | | | | |
| Security | | Par
(000) | | | Value | |
|
| Health Care Equipment & Supplies (continued) | |
3.50%, 03/15/25(a) | | $ | 1,084 | | | $ | 1,162,035 | |
4.38%, 03/15/35 | | | 350 | | | | 414,428 | |
4.63%, 03/15/45(a) | | | 1,750 | | | | 2,204,221 | |
Stryker Corp.: | | | | | | | | |
3.38%, 11/01/25 | | | 580 | | | | 614,847 | |
3.50%, 03/15/26(a) | | | 500 | | | | 532,251 | |
4.63%, 03/15/46(a) | | | 1,250 | | | | 1,505,927 | |
Zimmer Biomet Holdings, Inc.: | | | | | | | | |
3.15%, 04/01/22(a) | | | 1,500 | | | | 1,531,519 | |
3.55%, 04/01/25(a) | | | 750 | | | | 790,957 | |
4.45%, 08/15/45 | | | 500 | | | | 538,048 | |
| | | | | | | | |
| | | | | | | 24,731,570 | |
|
| Health Care Providers & Services — 0.7% | |
Adventist Health System/West, 3.63%, 03/01/49 | | | 197 | | | | 192,307 | |
Advocate Health & Hospitals Corp.: | | | | | | | | |
3.83%, 08/15/28 | | | 74 | | | | 80,467 | |
4.27%, 08/15/48 | | | 107 | | | | 121,929 | |
3.39%, 10/15/49 | | | 85 | | | | 85,173 | |
Aetna, Inc.: | | | | | | | | |
2.75%, 11/15/22 | | | 2,250 | | | | 2,286,665 | |
2.80%, 06/15/23 | | | 1,500 | | | | 1,524,379 | |
3.50%, 11/15/24(a) | | | 320 | | | | 335,016 | |
6.75%, 12/15/37(a) | | | 300 | | | | 404,994 | |
4.50%, 05/15/42 | | | 250 | | | | 269,680 | |
4.75%, 03/15/44 | | | 25 | | | | 27,927 | |
3.88%, 08/15/47 | | | 1,400 | | | | 1,424,109 | |
Allina Health System, Series 2019, 3.89%, 04/15/49 | | | 220 | | | | 233,982 | |
Anthem, Inc.: | | | | | | | | |
3.13%, 05/15/22(a) | | | 1,200 | | | | 1,230,170 | |
2.95%, 12/01/22(a) | | | 1,000 | | | | 1,023,075 | |
3.30%, 01/15/23 | | | 100 | | | | 103,476 | |
3.50%, 08/15/24 | | | 250 | | | | 262,118 | |
2.38%, 01/15/25 | | | 160 | | | | 159,812 | |
4.63%, 05/15/42 | | | 50 | | | | 56,422 | |
4.65%, 01/15/43(a) | | | 2,000 | | | | 2,256,602 | |
5.10%, 01/15/44 | | | 900 | | | | 1,077,109 | |
4.65%, 08/15/44 | | | 350 | | | | 396,743 | |
4.38%, 12/01/47 | | | 1,000 | | | | 1,104,122 | |
Ascension Health: | | | | | | | | |
3.95%, 11/15/46 | | | 1,000 | | | | 1,110,629 | |
Series B, 2.53%, 11/15/29 | | | 150 | | | | 148,604 | |
Series B, 3.11%, 11/15/39 | | | 52 | | | | 51,083 | |
Children’s Hospital Corp., Series 2017, 4.12%, 01/01/47 | | | 200 | | | | 226,863 | |
CHRISTUS Health, Series C, 4.34%, 07/01/28 | | | 155 | | | | 171,244 | |
Cigna Corp.: | | | | | | | | |
4.75%, 11/15/21(b) | | | 300 | | | | 314,513 | |
4.00%, 02/15/22(b) | | | 1,525 | | | | 1,574,595 | |
3.05%, 11/30/22(b) | | | 3,000 | | | | 3,066,631 | |
3.00%, 07/15/23(b) | | | 1,000 | | | | 1,021,842 | |
3.75%, 07/15/23 | | | 2,000 | | | | 2,097,591 | |
3.50%, 06/15/24(b) | | | 1,250 | | | | 1,305,642 | |
3.25%, 04/15/25(b) | | | 300 | | | | 311,134 | |
4.13%, 11/15/25(a) | | | 1,000 | | | | 1,085,244 | |
4.50%, 02/25/26(b) | | | 250 | | | | 274,345 | |
3.40%, 03/01/27(b) | | | 750 | | | | 779,548 | |
4.38%, 10/15/28 | | | 3,000 | | | | 3,323,664 | |
4.80%, 08/15/38(a) | | | 1,000 | | | | 1,166,420 | |
4.80%, 07/15/46(a)(b) | | | 250 | | | | 290,186 | |
3.88%, 10/15/47(b) | | | 750 | | | | 762,457 | |
4.90%, 12/15/48(a) | | | 1,500 | | | | 1,791,744 | |
CommonSpirit Health: | | | | | | | | |
2.76%, 10/01/24 | | | 245 | | | | 247,268 | |
| | |
| 36 | | 2019 BLACKROCK ANNUAL REPORTTO SHAREHOLDERS |
| | |
Schedule of Investments (continued) December 31, 2019 | | U.S. Total Bond Index Master Portfolio (Percentages shown are based on Net Assets) |
| | | | | | | | |
| Security | | Par
(000) | | | Value | |
|
| Health Care Providers & Services (continued) | |
3.35%, 10/01/29 | | $ | 132 | | | $ | 132,810 | |
3.82%, 10/01/49 | | | 251 | | | | 244,933 | |
4.19%, 10/01/49 | | | 245 | | | | 244,957 | |
Dartmouth-Hitchcock Health, Series B, 4.18%, 08/01/48 | | | 100 | | | | 111,568 | |
Dignity Health, 5.27%, 11/01/64 | | | 100 | | | | 115,185 | |
Duke University Health System, Inc., Series 2017, 3.92%, 06/01/47(a) | | | 173 | | | | 193,204 | |
HCA, Inc.: | | | | | | | | |
4.75%, 05/01/23 | | | 3,000 | | | | 3,213,944 | |
5.25%, 04/15/25 | | | 1,000 | | | | 1,118,910 | |
4.13%, 06/15/29 | | | 750 | | | | 795,809 | |
5.13%, 06/15/39(a) | | | 1,000 | | | | 1,102,204 | |
5.50%, 06/15/47 | | | 1,000 | | | | 1,149,498 | |
5.25%, 06/15/49(a) | | | 500 | | | | 558,964 | |
Humana, Inc.: | | | | | | | | |
3.85%, 10/01/24(a) | | | 500 | | | | 531,567 | |
3.13%, 08/15/29 | | | 500 | | | | 510,054 | |
4.63%, 12/01/42 | | | 1,000 | | | | 1,125,728 | |
4.95%, 10/01/44(a) | | | 250 | | | | 295,342 | |
4.80%, 03/15/47 | | | 200 | | | | 234,424 | |
Johns Hopkins Health System Corp., 3.84%, 05/15/46 | | | 25 | | | | 27,220 | |
Kaiser Foundation Hospitals: | | | | | | | | |
3.50%, 04/01/22(a) | | | 100 | | | | 103,352 | |
3.15%, 05/01/27 | | | 500 | | | | 522,317 | |
4.15%, 05/01/47 | | | 1,110 | | | | 1,267,762 | |
Series 2019, 3.27%, 11/01/49 | | | 325 | | | | 326,199 | |
Laboratory Corp. of America Holdings: | | | | | | | | |
3.75%, 08/23/22(a) | | | 100 | | | | 103,859 | |
4.00%, 11/01/23 | | | 100 | | | | 105,845 | |
3.25%, 09/01/24(a) | | | 1,000 | | | | 1,040,393 | |
3.60%, 02/01/25 | | | 75 | | | | 78,962 | |
3.60%, 09/01/27(a) | | | 500 | | | | 528,321 | |
4.70%, 02/01/45 | | | 450 | | | | 506,697 | |
Mayo Clinic, Series 2016, 4.13%, 11/15/52 | | | 300 | | | | 344,393 | |
McKesson Corp.: | | | | | | | | |
2.85%, 03/15/23 | | | 150 | | | | 152,358 | |
3.80%, 03/15/24(a) | | | 1,500 | | | | 1,578,901 | |
3.95%, 02/16/28(a) | | | 1,000 | | | | 1,066,909 | |
Memorial Health Services, 3.45%, 11/01/49 | | | 175 | | | | 172,139 | |
Memorial Sloan-Kettering Cancer Center: | | | | | | | | |
5.00%, 07/01/42 | | | 200 | | | | 251,328 | |
4.13%, 07/01/52(a) | | | 200 | | | | 228,430 | |
Mercy Health, Series 2018, 4.30%, 07/01/28 | | | 64 | | | | 71,701 | |
Mount Sinai Hospitals Group, Inc.: | | | | | | | | |
Series 2017, 3.98%, 07/01/48(a) | | | 66 | | | | 66,920 | |
Series 2019, 3.74%, 07/01/49 | | | 300 | | | | 299,113 | |
New York and Presbyterian Hospital: | | | | | | | | |
4.02%, 08/01/45 | | | 150 | | | | 167,510 | |
Series 2019, 3.95%, 08/01/19 | | | 207 | | | | 208,945 | |
Northwell Healthcare, Inc.: | | | | | | | | |
3.98%, 11/01/46 | | | 200 | | | | 204,906 | |
4.26%, 11/01/47 | | | 70 | | | | 75,304 | |
3.81%, 11/01/49 | | | 162 | | | | 163,096 | |
Orlando Health Obligated Group, 4.09%, 10/01/48 | | | 29 | | | | 31,861 | |
Partners Healthcare System, Inc., Series 2017, 3.77%, 07/01/48 | | | 85 | | | | 88,706 | |
PeaceHealth Obligated Group, Series 2018, 4.79%, 11/15/48 | | | 79 | | | | 97,270 | |
Providence St Joseph Health Obligated Group: | | | | | | | | |
Series 19A, 2.53%, 10/01/29 | | | 325 | | | | 319,137 | |
Series A, 3.93%, 10/01/48 | | | 77 | | | | 83,397 | |
| | | | | | | | |
| Security | | Par
(000) | | | Value | |
|
| Health Care Providers & Services (continued) | |
Quest Diagnostics, Inc.: | | | | | | | | |
4.70%, 04/01/21 | | $ | 100 | | | $ | 103,323 | |
4.25%, 04/01/24 | | | 250 | | | | 269,214 | |
3.50%, 03/30/25 | | | 370 | | | | 389,864 | |
4.20%, 06/30/29(a) | | | 250 | | | | 276,191 | |
RWJ Barnabas Health, Inc., 3.95%, 07/01/46 | | | 160 | | | | 169,615 | |
Spectrum Health System Obligated Group, Series 19A, 3.49%, 07/15/49 | | | 85 | | | | 85,118 | |
Stanford Health Care, Series 2018, 3.80%, 11/15/48 | | | 64 | | | | 69,357 | |
Sutter Health, : | | | | | | | | |
3.70%, 08/15/28 | | | 86 | | | | 92,167 | |
4.09%, 08/15/48(a) | | | 107 | | | | 117,061 | |
Toledo Hospital: | | | | | | | | |
6.02%, 11/15/48 | | | 125 | | | | 141,695 | |
Series B, 5.33%, 11/15/28 | | | 125 | | | | 135,344 | |
Trinity Health Corp., Series 2019, 3.43%, 12/01/48 | | | 137 | | | | 135,379 | |
UnitedHealth Group, Inc.: | | | | | | | | |
2.13%, 03/15/21 | | | 1,500 | | | | 1,505,192 | |
3.15%, 06/15/21 | | | 2,000 | | | | 2,036,981 | |
3.35%, 07/15/22 | | | 750 | | | | 776,862 | |
2.88%, 03/15/23 | | | 250 | | | | 256,831 | |
2.38%, 08/15/24 | | | 425 | | | | 430,639 | |
3.10%, 03/15/26(a) | | | 500 | | | | 523,745 | |
3.45%, 01/15/27 | | | 500 | | | | 536,140 | |
3.38%, 04/15/27(a) | | | 1,000 | | | | 1,067,564 | |
3.85%, 06/15/28(a) | | | 1,000 | | | | 1,103,493 | |
2.88%, 08/15/29 | | | 1,890 | | | | 1,945,357 | |
4.63%, 07/15/35(a) | | | 555 | | | | 674,170 | |
6.88%, 02/15/38 | | | 100 | | | | 148,244 | |
3.50%, 08/15/39(a) | | | 645 | | | | 677,372 | |
5.95%, 02/15/41 | | | 100 | | | | 135,782 | |
3.95%, 10/15/42 | | | 150 | | | | 165,161 | |
4.75%, 07/15/45 | | | 2,500 | | | | 3,078,604 | |
4.20%, 01/15/47 | | | 750 | | | | 861,117 | |
4.25%, 04/15/47 | | | 1,000 | | | | 1,157,793 | |
3.75%, 10/15/47(a) | | | 500 | | | | 538,192 | |
4.25%, 06/15/48 | | | 400 | | | | 464,987 | |
3.70%, 08/15/49(a) | | | 1,500 | | | | 1,612,305 | |
Willis-Knighton Medical Center, Series 2018, 4.81%, 09/01/48 | | | 108 | | | | 128,976 | |
| | | | | | | | |
| | | | | | | 79,549,711 | |
|
| Hotels, Restaurants & Leisure — 0.3% | |
GLP Capital LP/GLP Financing II, Inc.: | | | | | | | | |
3.35%, 09/01/24 | | | 215 | | | | 219,453 | |
5.25%, 06/01/25 | | | 400 | | | | 439,040 | |
5.30%, 01/15/29 | | | 1,000 | | | | 1,110,700 | |
4.00%, 01/15/30(a) | | | 980 | | | | 1,000,286 | |
Hyatt Hotels Corp.: | | | | | | | | |
3.38%, 07/15/23(a) | | | 190 | | | | 194,668 | |
4.38%, 09/15/28 | | | 305 | | | | 331,163 | |
Las Vegas Sands Corp.: | | | | | | | | |
3.20%, 08/08/24 | | | 2,745 | | | | 2,826,267 | |
3.50%, 08/18/26 | | | 270 | | | | 277,774 | |
3.90%, 08/08/29 | | | 185 | | | | 193,167 | |
Marriott International, Inc.: | | | | | | | | |
2.30%, 01/15/22 | | | 2,000 | | | | 2,009,470 | |
3.25%, 09/15/22 | | | 100 | | | | 102,808 | |
2.13%, 10/03/22 | | | 1,000 | | | | 1,001,923 | |
McDonald’s Corp.: | | | | | | | | |
2.63%, 01/15/22(a) | | | 3,000 | | | | 3,043,198 | |
3.35%, 04/01/23 | | | 250 | | | | 260,401 | |
3.25%, 06/10/24 | | | 400 | | | | 421,077 | |
3.38%, 05/26/25(a) | | | 500 | | | | 529,002 | |
| | | | |
| SCHEDULE OF INVESTMENTS | | | 37 | |
| | |
Schedule of Investments (continued) December 31, 2019 | | U.S. Total Bond Index Master Portfolio (Percentages shown are based on Net Assets) |
| | | | | | | | |
| Security | | Par
(000) | | | Value | |
|
| Hotels, Restaurants & Leisure (continued) | |
3.70%, 01/30/26 | | $ | 250 | | | $ | 269,761 | |
3.50%, 03/01/27 | | | 1,000 | | | | 1,068,367 | |
3.80%, 04/01/28(a) | | | 1,000 | | | | 1,093,651 | |
2.63%, 09/01/29 | | | 1,000 | | | | 1,001,424 | |
4.70%, 12/09/35 | | | 315 | | | | 373,602 | |
6.30%, 03/01/38(a) | | | 1,000 | | | | 1,354,625 | |
3.70%, 02/15/42 | | | 100 | | | | 101,567 | |
4.88%, 12/09/45(a) | | | 750 | | | | 904,206 | |
4.45%, 03/01/47 | | | 500 | | | | 568,537 | |
4.45%, 09/01/48 | | | 500 | | | | 573,075 | |
3.63%, 09/01/49 | | | 875 | | | | 890,068 | |
Regency Centers LP, 2.95%, 09/15/29 | | | 1,000 | | | | 999,433 | |
Sands China Ltd.: | | | | | | | | |
4.60%, 08/08/23(a) | | | 500 | | | | 529,219 | |
5.13%, 08/08/25 | | | 500 | | | | 551,250 | |
5.40%, 08/08/28 | | | 1,750 | | | | 1,977,068 | |
Starbucks Corp.: | | | | | | | | |
2.70%, 06/15/22 | | | 500 | | | | 508,901 | |
3.10%, 03/01/23(a) | | | 3,000 | | | | 3,094,057 | |
3.85%, 10/01/23 | | | 250 | | | | 265,209 | |
3.80%, 08/15/25(a) | | | 2,000 | | | | 2,155,189 | |
4.00%, 11/15/28 | | | 500 | | | | 557,453 | |
3.55%, 08/15/29(a) | | | 1,250 | | | | 1,356,049 | |
3.75%, 12/01/47 | | | 1,000 | | | | 1,039,695 | |
| | | | | | | | |
| | | | | | | 35,192,803 | |
|
| Household Durables — 0.0% | |
DR Horton, Inc., 2.50%, 10/15/24(a) | | | 425 | | | | 425,498 | |
Leggett & Platt, Inc., 3.80%, 11/15/24 | | | 200 | | | | 207,818 | |
Mohawk Industries, Inc., 3.85%, 02/01/23(a) | | | 125 | | | | 130,323 | |
Whirlpool Corp.: | | | | | | | | |
5.15%, 03/01/43(a) | | | 200 | | | | 215,741 | |
4.50%, 06/01/46 | | | 250 | | | | 259,257 | |
| | | | | | | | |
| | | | | | | 1,238,637 | |
|
| Household Products — 0.0% | |
Clorox Co.(a): | | | | | | | | |
3.05%, 09/15/22 | | | 50 | | | | 51,204 | |
3.50%, 12/15/24 | | | 250 | | | | 264,629 | |
Kimberly-Clark Corp.: | | | | | | | | |
2.65%, 03/01/25(a) | | | 85 | | | | 87,136 | |
2.75%, 02/15/26(a) | | | 500 | | | | 515,031 | |
5.30%, 03/01/41(a) | | | 250 | | | | 331,109 | |
3.20%, 07/30/46(a) | | | 210 | | | | 212,023 | |
3.90%, 05/04/47 | | | 750 | | | | 841,361 | |
| | | | | | | | |
| | | | | | | 2,302,493 | |
|
| Industrial Conglomerates — 0.2% | |
3M Co.: | | | | | | | | |
1.63%, 09/19/21 | | | 500 | | | | 498,888 | |
2.00%, 06/26/22 | | | 500 | | | | 501,952 | |
1.75%, 02/14/23 | | | 500 | | | | 497,274 | |
2.00%, 02/14/25 | | | 1,000 | | | | 994,625 | |
3.00%, 08/07/25(a) | | | 250 | | | | 262,877 | |
2.88%, 10/15/27(a) | | | 750 | | | | 782,280 | |
2.38%, 08/26/29(a) | | | 985 | | | | 971,909 | |
3.13%, 09/19/46(a) | | | 250 | | | | 240,887 | |
4.00%, 09/14/48(a) | | | 1,000 | | | | 1,104,126 | |
3.25%, 08/26/49(a) | | | 430 | | | | 418,550 | |
Crane Co., 4.45%, 12/15/23 | | | 125 | | | | 133,733 | |
Dover Corp.: | | | | | | | | |
3.15%, 11/15/25 | | | 250 | | | | 258,869 | |
2.95%, 11/04/29 | | | 170 | | | | 171,338 | |
General Electric Co.: | | | | | | | | |
5.30%, 02/11/21 | | | 1,000 | | | | 1,031,729 | |
| | | | | | | | |
| Security | | Par
(000) | | | Value | |
|
| Industrial Conglomerates (continued) | |
4.63%, 01/07/21 | | $ | 72 | | | $ | 73,636 | |
4.65%, 10/17/21 | | | 201 | | | | 209,565 | |
2.70%, 10/09/22(a) | | | 1,000 | | | | 1,013,829 | |
3.10%, 01/09/23(a) | | | 1,500 | | | | 1,532,629 | |
3.45%, 05/15/24 | | | 4,086 | | | | 4,241,385 | |
6.75%, 03/15/32 | | | 394 | | | | 506,177 | |
5.88%, 01/14/38 | | | 2,215 | | | | 2,692,465 | |
6.88%, 01/10/39 | | | 1,322 | | | | 1,766,909 | |
4.13%, 10/09/42 | | | 60 | | | | 61,899 | |
4.50%, 03/11/44 | | | 300 | | | | 328,702 | |
Ingersoll-Rand Global Holding Co. Ltd., 4.30%, 02/21/48(a) | | | 500 | | | | 540,838 | |
Koninklijke Philips NV, 5.00%, 03/15/42(a) | | | 250 | | | | 300,620 | |
| | | | | | | | |
| | | | | | | 21,137,691 | |
|
| Insurance — 0.8% | |
Aflac, Inc.: | | | | | | | | |
3.63%, 06/15/23 | | | 250 | | | | 263,073 | |
3.63%, 11/15/24 | | | 250 | | | | 267,315 | |
2.88%, 10/15/26(a) | | | 750 | | | | 771,487 | |
4.75%, 01/15/49 | | | 1,000 | | | | 1,218,302 | |
Alleghany Corp., 4.95%, 06/27/22 | | | 550 | | | | 585,454 | |
Allstate Corp.: | | | | | | | | |
3.15%, 06/15/23 | | | 250 | | | | 259,647 | |
3.28%, 12/15/26 | | | 750 | | | | 792,404 | |
4.50%, 06/15/43 | | | 150 | | | | 178,392 | |
4.20%, 12/15/46(a) | | | 1,250 | | | | 1,440,616 | |
American Financial Group, Inc., 4.50%, 06/15/47(a) | | | 750 | | | | 811,707 | |
American International Group, Inc.: | | | | | | | | |
3.30%, 03/01/21 | | | 2,000 | | | | 2,029,108 | |
4.88%, 06/01/22 | | | 250 | | | | 266,906 | |
4.13%, 02/15/24 | | | 250 | | | | 268,477 | |
3.75%, 07/10/25(a) | | | 750 | | | | 802,760 | |
3.90%, 04/01/26 | | | 1,000 | | | | 1,074,148 | |
3.88%, 01/15/35 | | | 500 | | | | 530,915 | |
4.70%, 07/10/35 | | | 500 | | | | 579,578 | |
4.50%, 07/16/44 | | | 250 | | | | 288,382 | |
4.80%, 07/10/45 | | | 2,000 | | | | 2,400,359 | |
4.75%, 04/01/48 | | | 1,000 | | | | 1,205,818 | |
Aon Corp.: | | | | | | | | |
2.20%, 11/15/22 | | | 335 | | | | 336,577 | |
4.50%, 12/15/28 | | | 1,000 | | | | 1,126,644 | |
Aon PLC: | | | | | | | | |
2.80%, 03/15/21(a) | | | 250 | | | | 252,676 | |
3.50%, 06/14/24 | | | 1,000 | | | | 1,048,823 | |
3.88%, 12/15/25 | | | 600 | | | | 645,819 | |
4.60%, 06/14/44 | | | 250 | | | | 289,794 | |
Arch Capital Finance LLC, 4.01%, 12/15/26(a) | | | 1,000 | | | | 1,098,430 | |
Arch Capital Group US, Inc., 5.14%, 11/01/43 | | | 125 | | | | 155,104 | |
Assured Guaranty US Holdings, Inc., 5.00%, 07/01/24 | | | 110 | | | | 122,373 | |
AXA Equitable Holdings, Inc.: | | | | | | | | |
4.35%, 04/20/28 | | | 1,000 | | | | 1,086,048 | |
5.00%, 04/20/48 | | | 500 | | | | 538,154 | |
AXA SA, 8.60%, 12/15/30 | | | 550 | | | | 799,067 | |
Berkshire Hathaway Finance Corp.: | | | | | | | | |
4.25%, 01/15/21(a) | | | 250 | | | | 256,310 | |
3.00%, 05/15/22 | | | 750 | | | | 770,552 | |
4.40%, 05/15/42 | | | 100 | | | | 117,662 | |
4.30%, 05/15/43 | | | 250 | | | | 289,062 | |
4.20%, 08/15/48 | | | 750 | | | | 887,982 | |
4.25%, 01/15/49 | | | 1,000 | | | | 1,186,475 | |
Berkshire Hathaway, Inc.: | | | | | | | | |
2.20%, 03/15/21 | | | 500 | | | | 501,934 | |
| | |
| 38 | | 2019 BLACKROCK ANNUAL REPORTTO SHAREHOLDERS |
| | |
Schedule of Investments (continued) December 31, 2019 | | U.S. Total Bond Index Master Portfolio (Percentages shown are based on Net Assets) |
| | | | | | | | |
| Security | | Par
(000) | | | Value | |
|
| Insurance (continued) | |
3.00%, 02/11/23(a) | | $ | 1,000 | | | $ | 1,032,976 | |
2.75%, 03/15/23 | | | 1,500 | | | | 1,538,136 | |
3.13%, 03/15/26 | | | 1,400 | | | | 1,475,614 | |
4.50%, 02/11/43(a) | | | 1,100 | | | | 1,334,032 | |
Brighthouse Financial, Inc., 3.70%, 06/22/27(a) | | | 2,500 | | | | 2,494,170 | |
Chubb Corp.: | | | | | | | | |
6.00%, 05/11/37 | | | 50 | | | | 69,145 | |
Series 1, 6.50%, 05/15/38 | | | 100 | | | | 146,487 | |
Chubb INA Holdings, Inc.: | | | | | | | | |
2.88%, 11/03/22 | | | 1,000 | | | | 1,026,071 | |
3.35%, 05/15/24 | | | 500 | | | | 526,854 | |
3.35%, 05/03/26 | | | 795 | | | | 845,504 | |
4.15%, 03/13/43 | | | 150 | | | | 174,079 | |
CNA Financial Corp.: | | | | | | | | |
5.75%, 08/15/21 | | | 100 | | | | 105,707 | |
4.50%, 03/01/26 | | | 350 | | | | 386,058 | |
First American Financial Corp., 4.60%, 11/15/24 | | | 200 | | | | 214,046 | |
Hartford Financial Services Group, Inc.: | | | | | | | | |
2.80%, 08/19/29 | | | 500 | | | | 505,847 | |
6.10%, 10/01/41 | | | 100 | | | | 137,157 | |
3.60%, 08/19/49(a) | | | 1,335 | | | | 1,370,143 | |
Lincoln National Corp.: | | | | | | | | |
4.20%, 03/15/22 | | | 1,350 | | | | 1,408,294 | |
4.00%, 09/01/23 | | | 200 | | | | 212,962 | |
3.35%, 03/09/25 | | | 65 | | | | 67,668 | |
3.80%, 03/01/28 | | | 1,500 | | | | 1,599,043 | |
6.30%, 10/09/37 | | | 250 | | | | 323,624 | |
4.35%, 03/01/48 | | | 200 | | | | 220,485 | |
Loews Corp.: | | | | | | | | |
2.63%, 05/15/23 | | | 250 | | | | 254,763 | |
3.75%, 04/01/26 | | | 500 | | | | 537,136 | |
Manulife Financial Corp.: | | | | | | | | |
4.15%, 03/04/26 | | | 500 | | | | 550,419 | |
(5 year USD Swap + 1.65%), 4.06%, 02/24/32(c) | | | 500 | | | | 518,755 | |
Markel Corp.: | | | | | | | | |
3.35%, 09/17/29 | | | 475 | | | | 486,633 | |
4.30%, 11/01/47 | | | 750 | | | | 783,844 | |
4.15%, 09/17/50 | | | 500 | | | | 515,395 | |
Marsh & McLennan Cos., Inc.: | | | | | | | | |
4.80%, 07/15/21 | | | 50 | | | | 51,816 | |
2.75%, 01/30/22 | | | 1,000 | | | | 1,016,030 | |
3.30%, 03/14/23 | | | 500 | | | | 517,333 | |
3.88%, 03/15/24 | | | 500 | | | | 533,399 | |
3.50%, 06/03/24 | | | 1,000 | | | | 1,050,548 | |
3.75%, 03/14/26 | | | 1,000 | | | | 1,074,741 | |
4.38%, 03/15/29 | | | 1,000 | | | | 1,140,141 | |
4.90%, 03/15/49 | | | 1,000 | | | | 1,270,025 | |
MetLife, Inc.: | | | | | | | | |
3.00%, 03/01/25 | | | 650 | | | | 676,321 | |
6.38%, 06/15/34 | | | 500 | | | | 715,269 | |
5.88%, 02/06/41(a) | | | 2,000 | | | | 2,724,182 | |
4.13%, 08/13/42 | | | 300 | | | | 342,169 | |
4.88%, 11/13/43(a) | | | 250 | | | | 310,017 | |
4.05%, 03/01/45 | | | 250 | | | | 290,243 | |
4.60%, 05/13/46(a) | | | 500 | | | | 616,261 | |
Old Republic International Corp., 4.88%, 10/01/24 | | | 250 | | | | 274,170 | |
Principal Financial Group, Inc.: | | | | | | | | |
3.40%, 05/15/25 | | | 250 | | | | 262,003 | |
3.10%, 11/15/26(a) | | | 1,000 | | | | 1,035,511 | |
3.70%, 05/15/29(a) | | | 135 | | | | 147,229 | |
4.63%, 09/15/42 | | | 50 | | | | 58,254 | |
4.30%, 11/15/46 | | | 250 | | | | 282,925 | |
| | | | | | | | |
| Security | | Par
(000) | | | Value | |
|
| Insurance (continued) | |
Progressive Corp.: | | | | | | | | |
3.75%, 08/23/21 | | $ | 1,050 | | | $ | 1,083,066 | |
2.45%, 01/15/27 | | | 500 | | | | 502,114 | |
4.35%, 04/25/44 | | | 100 | | | | 117,046 | |
3.70%, 01/26/45 | | | 200 | | | | 214,098 | |
4.13%, 04/15/47 | | | 500 | | | | 581,927 | |
4.20%, 03/15/48(a) | | | 500 | | | | 585,452 | |
Prudential Financial, Inc.: | | | | | | | | |
3.50%, 05/15/24 | | | 1,000 | | | | 1,064,225 | |
3.88%, 03/27/28(a) | | | 951 | | | | 1,042,915 | |
(3 mo. LIBOR US + 3.04%), 5.20%, 03/15/44(a)(c) | | | 350 | | | | 373,349 | |
4.60%, 05/15/44 | | | 250 | | | | 295,231 | |
(3 mo. LIBOR US + 2.67%), 5.70%, 09/15/48(c) | | | 1,000 | | | | 1,142,500 | |
3.94%, 12/07/49 | | | 908 | | | | 991,343 | |
4.35%, 02/25/50 | | | 1,000 | | | | 1,152,853 | |
3.70%, 03/13/51 | | | 1,250 | | | | 1,315,793 | |
Reinsurance Group of America, Inc., 3.90%, 05/15/29(a) | | | 475 | | | | 506,839 | |
Travelers Cos., Inc.: | | | | | | | | |
6.75%, 06/20/36 | | | 250 | | | | 361,996 | |
4.60%, 08/01/43(a) | | | 850 | | | | 1,030,758 | |
4.30%, 08/25/45 | | | 250 | | | | 291,106 | |
4.00%, 05/30/47 | | | 250 | | | | 283,398 | |
4.05%, 03/07/48(a) | | | 2,000 | | | | 2,281,847 | |
Travelers Property Casualty Corp., 6.38%, 03/15/33 | | | 100 | | | | 138,035 | |
Trinity Acquisition PLC, 4.40%, 03/15/26 | | | 500 | | | | 543,690 | |
Unum Group: | | | | | | | | |
4.00%, 06/15/29(a) | | | 1,000 | | | | 1,050,341 | |
5.75%, 08/15/42(a) | | | 250 | | | | 282,557 | |
4.50%, 12/15/49 | | | 250 | | | | 244,156 | |
Voya Financial, Inc.: | | | | | | | | |
3.65%, 06/15/26 | | | 350 | | | | 369,780 | |
5.70%, 07/15/43(a) | | | 500 | | | | 626,312 | |
Willis North America, Inc.: | | | | | | | | |
4.50%, 09/15/28 | | | 1,500 | | | | 1,654,167 | |
3.88%, 09/15/49(a) | | | 80 | | | | 79,815 | |
WR Berkley Corp., 4.63%, 03/15/22(a) | | | 200 | | | | 210,929 | |
XLIT Ltd., 5.50%, 03/31/45(a) | | | 250 | | | | 318,026 | |
| | | | | | | | |
| | | | | | | 83,529,632 | |
|
| Interactive Media & Services — 0.1% | |
Alphabet, Inc.(a): | | | | | | | | |
3.63%, 05/19/21 | | | 25 | | | | 25,657 | |
3.38%, 02/25/24 | | | 500 | | | | 531,875 | |
2.00%, 08/15/26 | | | 2,500 | | | | 2,487,577 | |
Baidu, Inc.(a): | | | | | | | | |
4.13%, 06/30/25 | | | 1,000 | | | | 1,065,937 | |
4.88%, 11/14/28 | | | 2,000 | | | | 2,256,621 | |
Booking Holdings, Inc.: | | | | | | | | |
2.75%, 03/15/23 | | | 500 | | | | 510,904 | |
3.60%, 06/01/26 | | | 2,500 | | | | 2,668,908 | |
eBay, Inc.: | | | | | | | | |
2.88%, 08/01/21 | | | 1,000 | | | | 1,012,013 | |
3.80%, 03/09/22 | | | 640 | | | | 661,626 | |
2.60%, 07/15/22 | | | 50 | | | | 50,292 | |
3.60%, 06/05/27(a) | | | 1,000 | | | | 1,048,772 | |
Equinix, Inc., 5.88%, 01/15/26 | | | 600 | | | | 636,756 | |
| | | | | | | | |
| | | | | | | 12,956,938 | |
|
| Internet & Direct Marketing Retail — 0.2% | |
Alibaba Group Holding Ltd.: | | | | | | | | |
3.13%, 11/28/21(a) | | | 475 | | | | 483,550 | |
3.60%, 11/28/24(a) | | | 2,500 | | | | 2,627,000 | |
3.40%, 12/06/27 | | | 1,000 | | | | 1,042,520 | |
| | | | |
| SCHEDULE OF INVESTMENTS | | | 39 | |
| | |
Schedule of Investments (continued) December 31, 2019 | | U.S. Total Bond Index Master Portfolio (Percentages shown are based on Net Assets) |
| | | | | | | | |
| Security | | Par
(000) | | | Value | |
|
| Internet & Direct Marketing Retail (continued) | |
4.50%, 11/28/34 | | $ | 250 | | | $ | 283,750 | |
4.00%, 12/06/37 | | | 1,000 | | | | 1,063,250 | |
4.20%, 12/06/47(a) | | | 1,300 | | | | 1,458,438 | |
Amazon.com, Inc.: | | | | | | | | |
2.40%, 02/22/23 | | | 1,500 | | | | 1,526,676 | |
2.80%, 08/22/24 | | | 1,500 | | | | 1,552,453 | |
3.15%, 08/22/27 | | | 2,750 | | | | 2,914,401 | |
4.80%, 12/05/34(a) | | | 600 | | | | 757,159 | |
3.88%, 08/22/37 | | | 1,000 | | | | 1,136,585 | |
4.05%, 08/22/47 | | | 2,500 | | | | 2,942,117 | |
4.25%, 08/22/57 | | | 1,000 | | | | 1,219,922 | |
Expedia Group, Inc.: | | | | | | | | |
4.50%, 08/15/24 | | | 250 | | | | 266,898 | |
3.80%, 02/15/28 | | | 750 | | | | 767,157 | |
3.25%, 02/15/30(b) | | | 325 | | | | 312,800 | |
| | | | | | | | |
| | | | | | | 20,354,676 | |
|
| IT Services — 0.3% | |
Broadridge Financial Solutions, Inc.: | | | | | | | | |
3.40%, 06/27/26 | | | 270 | | | | 282,271 | |
2.90%, 12/01/29 | | | 500 | | | | 499,542 | |
DXC Technology Co., 4.75%, 04/15/27(a) | | | 1,000 | | | | 1,077,085 | |
Fidelity National Information Services, Inc.: | | | | | | | | |
3.50%, 04/15/23 | | | 25 | | | | 26,028 | |
3.00%, 08/15/26(a) | | | 750 | | | | 776,100 | |
Series 10Y, 4.25%, 05/15/28 | | | 1,000 | | | | 1,120,930 | |
Fiserv, Inc.: | | | | | | | | |
2.75%, 07/01/24 | | | 1,120 | | | | 1,139,785 | |
4.20%, 10/01/28(a) | | | 2,000 | | | | 2,218,493 | |
3.50%, 07/01/29 | | | 1,645 | | | | 1,729,024 | |
4.40%, 07/01/49(a) | | | 880 | | | | 999,050 | |
Global Payments, Inc.: | | | | | | | | |
4.80%, 04/01/26(a) | | | 500 | | | | 556,557 | |
3.20%, 08/15/29 | | | 250 | | | | 254,802 | |
4.15%, 08/15/49 | | | 355 | | | | 379,810 | |
IBM Credit LLC, 3.00%, 02/06/23(a) | | | 500 | | | | 514,684 | |
International Business Machines Corp.: | | | | | | | | |
2.25%, 02/19/21(a) | | | 1,000 | | | | 1,003,642 | |
2.90%, 11/01/21 | | | 100 | | | | 101,855 | |
2.50%, 01/27/22 | | | 600 | | | | 607,035 | |
2.85%, 05/13/22 | | | 2,250 | | | | 2,300,900 | |
2.88%, 11/09/22 | | | 3,400 | | | | 3,488,200 | |
3.63%, 02/12/24 | | | 775 | | | | 821,691 | |
3.45%, 02/19/26 | | | 250 | | | | 266,687 | |
3.30%, 05/15/26 | | | 500 | | | | 527,829 | |
3.30%, 01/27/27 | | | 1,000 | | | | 1,061,530 | |
3.50%, 05/15/29 | | | 5,000 | | | | 5,379,539 | |
5.88%, 11/29/32 | | | 250 | | | | 333,582 | |
4.00%, 06/20/42(a) | | | 850 | | | | 939,187 | |
4.70%, 02/19/46(a) | | | 250 | | | | 301,932 | |
4.25%, 05/15/49 | | | 1,925 | | | | 2,203,091 | |
PayPal Holdings, Inc.: | | | | | | | | |
2.40%, 10/01/24 | | | 1,170 | | | | 1,181,539 | |
2.85%, 10/01/29 | | | 1,335 | | | | 1,347,401 | |
Verisk Analytics, Inc.(a): | | | | | | | | |
4.13%, 03/15/29 | | | 500 | | | | 549,116 | |
4.00%, 06/15/25 | | | 250 | | | | 269,214 | |
Western Union Co., 6.20%, 11/17/36 | | | 525 | | | | 598,874 | |
| | | | | | | | |
| | | | | | | 34,857,005 | |
|
| Leisure Products — 0.0% | |
Hasbro, Inc.: | | | | | | | | |
2.60%, 11/19/22 | | | 305 | | | | 306,869 | |
3.00%, 11/19/24 | | | 500 | | | | 502,573 | |
| | | | | | | | |
| Security | | Par
(000) | | | Value | |
|
| Leisure Products (continued) | |
3.55%, 11/19/26 | | $ | 300 | | | $ | 302,108 | |
3.50%, 09/15/27(a) | | | 250 | | | | 248,995 | |
3.90%, 11/19/29 | | | 300 | | | | 302,176 | |
6.35%, 03/15/40 | | | 500 | | | | 578,754 | |
5.10%, 05/15/44 | | | 60 | | | | 59,671 | |
| | | | | | | | |
| | | | | | | 2,301,146 | |
|
| Life Sciences Tools & Services — 0.1% | |
Agilent Technologies, Inc.: | | | | | | | | |
3.88%, 07/15/23(a) | | | 200 | | | | 209,888 | |
2.75%, 09/15/29 | | | 645 | | | | 640,418 | |
PerkinElmer, Inc., 3.30%, 09/15/29 | | | 1,000 | | | | 1,021,513 | |
Thermo Fisher Scientific, Inc.: | | | | | | | | |
4.15%, 02/01/24(a) | | | 250 | | | | 267,911 | |
3.65%, 12/15/25 | | | 500 | | | | 534,561 | |
3.20%, 08/15/27(a) | | | 500 | | | | 523,231 | |
2.60%, 10/01/29 | | | 970 | | | | 959,560 | |
4.10%, 08/15/47 | | | 500 | | | | 566,936 | |
| | | | | | | | |
| | | | | | | 4,724,018 | |
|
| Machinery — 0.2% | |
Caterpillar, Inc.: | | | | | | | | |
3.90%, 05/27/21 | | | 50 | | | | 51,367 | |
3.40%, 05/15/24(a) | | | 500 | | | | 529,577 | |
2.60%, 09/19/29(a) | | | 70 | | | | 70,703 | |
5.20%, 05/27/41 | | | 600 | | | | 778,208 | |
3.80%, 08/15/42(a) | | | 1,450 | | | | 1,627,121 | |
3.25%, 09/19/49 | | | 1,000 | | | | 1,004,131 | |
CNH Industrial NV, 4.50%, 08/15/23(a) | | | 3,000 | | | | 3,212,340 | |
Cummins, Inc., 3.65%, 10/01/23(a) | | | 250 | | | | 264,362 | |
Deere & Co.: | | | | | | | | |
3.90%, 06/09/42(a) | | | 550 | | | | 618,950 | |
2.88%, 09/07/49 | | | 385 | | | | 366,301 | |
Flowserve Corp., 3.50%, 09/15/22 | | | 100 | | | | 102,012 | |
Fortive Corp.: | | | | | | | | |
2.35%, 06/15/21 | | | 1,000 | | | | 1,004,255 | |
3.15%, 06/15/26 | | | 500 | | | | 511,691 | |
Illinois Tool Works, Inc.: | | | | | | | | |
2.65%, 11/15/26(a) | | | 3,000 | | | | 3,080,928 | |
4.88%, 09/15/41 | | | 50 | | | | 63,536 | |
3.90%, 09/01/42 | | | 75 | | | | 86,823 | |
Ingersoll-Rand Luxembourg Finance SA: | | | | | | | | |
3.55%, 11/01/24 | | | 500 | | | | 524,783 | |
4.65%, 11/01/44 | | | 30 | | | | 33,924 | |
4.50%, 03/21/49 | | | 500 | | | | 562,395 | |
Parker-Hannifin Corp.: | | | | | | | | |
3.25%, 06/14/29(a) | | | 2,000 | | | | 2,089,512 | |
4.20%, 11/21/34 | | | 250 | | | | 276,817 | |
4.10%, 03/01/47(a) | | | 500 | | | | 545,581 | |
4.00%, 06/14/49 | | | 500 | | | | 540,796 | |
Stanley Black & Decker, Inc.: | | | | | | | | |
2.90%, 11/01/22(a) | | | 150 | | | | 153,488 | |
4.25%, 11/15/28 | | | 1,000 | | | | 1,128,243 | |
4.85%, 11/15/48(a) | | | 250 | | | | 307,571 | |
Valmont Industries, Inc., 5.00%, 10/01/44(a) | | | 1,000 | | | | 1,023,113 | |
Westinghouse Air Brake Technologies Corp.: | | | | | | | | |
4.40%, 03/15/24 | | | 500 | | | | 530,907 | |
4.95%, 09/15/28 | | | 500 | | | | 550,030 | |
Xylem, Inc., 4.38%, 11/01/46 | | | 500 | | | | 545,104 | |
| | | | | | | | |
| | | | | | | 22,184,569 | |
|
| Media — 1.0% | |
Bell Canada, Inc.: | | | | | | | | |
4.46%, 04/01/48 | | | 310 | | | | 359,525 | |
4.30%, 07/29/49(a) | | | 265 | | | | 300,187 | |
| | |
| 40 | | 2019 BLACKROCK ANNUAL REPORTTO SHAREHOLDERS |
| | |
Schedule of Investments (continued) December 31, 2019 | | U.S. Total Bond Index Master Portfolio (Percentages shown are based on Net Assets) |
| | | | | | | | |
| Security | | Par
(000) | | | Value | |
|
| Media (continued) | |
Charter Communications Operating LLC/Charter Communications Operating Capital: | | | | | | | | |
4.46%, 07/23/22 | | $ | 1,000 | | | $ | 1,051,169 | |
4.50%, 02/01/24 | | | 4,000 | | | | 4,304,918 | |
4.91%, 07/23/25 | | | 1,930 | | | | 2,125,272 | |
3.75%, 02/15/28 | | | 1,000 | | | | 1,037,312 | |
5.05%, 03/30/29 | | | 1,750 | | | | 1,985,650 | |
6.38%, 10/23/35 | | | 250 | | | | 314,662 | |
5.38%, 04/01/38(a) | | | 1,000 | | | | 1,141,039 | |
6.48%, 10/23/45 | | | 1,000 | | | | 1,239,726 | |
5.38%, 05/01/47(a) | | | 500 | | | | 560,953 | |
5.75%, 04/01/48 | | | 1,000 | | | | 1,167,924 | |
5.13%, 07/01/49 | | | 1,000 | | | | 1,088,351 | |
4.80%, 03/01/50 | | | 1,400 | | | | 1,476,306 | |
6.83%, 10/23/55 | | | 250 | | | | 327,406 | |
Cintas Corp. No. 2: | | | | | | | | |
4.30%, 06/01/21 | | | 25 | | | | 25,813 | |
2.90%, 04/01/22 | | | 250 | | | | 255,033 | |
3.70%, 04/01/27 | | | 500 | | | | 542,450 | |
Comcast Corp.: | | | | | | | | |
3.45%, 10/01/21 | | | 3,000 | | | | 3,088,131 | |
2.75%, 03/01/23 | | | 750 | | | | 766,253 | |
3.00%, 02/01/24 | | | 1,500 | | | | 1,554,768 | |
3.60%, 03/01/24 | | | 250 | | | | 265,038 | |
3.70%, 04/15/24 | | | 1,000 | | | | 1,066,594 | |
3.38%, 08/15/25 | | | 500 | | | | 530,714 | |
3.95%, 10/15/25 | | | 2,000 | | | | 2,182,825 | |
3.15%, 03/01/26 | | | 750 | | | | 786,301 | |
2.35%, 01/15/27 | | | 1,850 | | | | 1,848,472 | |
3.30%, 02/01/27 | | | 1,000 | | | | 1,059,432 | |
3.15%, 02/15/28(a) | | | 250 | | | | 262,096 | |
3.55%, 05/01/28(a) | | | 1,000 | | | | 1,076,280 | |
4.15%, 10/15/28 | | | 1,720 | | | | 1,937,312 | |
2.65%, 02/01/30 | | | 945 | | | | 949,048 | |
4.25%, 10/15/30 | | | 1,000 | | | | 1,143,862 | |
4.25%, 01/15/33(a) | | | 650 | | | | 753,403 | |
4.20%, 08/15/34 | | | 2,235 | | | | 2,550,780 | |
4.40%, 08/15/35(a) | | | 250 | | | | 293,257 | |
3.20%, 07/15/36(a) | | | 500 | | | | 511,906 | |
3.90%, 03/01/38(a) | | | 500 | | | | 553,993 | |
4.60%, 10/15/38 | | | 3,000 | | | | 3,576,801 | |
3.25%, 11/01/39 | | | 1,000 | | | | 1,015,869 | |
4.65%, 07/15/42 | | | 1,150 | | | | 1,382,777 | |
4.75%, 03/01/44 | | | 250 | | | | 304,266 | |
4.60%, 08/15/45 | | | 500 | | | | 601,160 | |
3.40%, 07/15/46(a) | | | 500 | | | | 507,485 | |
4.00%, 08/15/47 | | | 500 | | | | 551,330 | |
3.97%, 11/01/47 | | | 1,500 | | | | 1,652,593 | |
4.00%, 03/01/48(a) | | | 500 | | | | 555,082 | |
4.70%, 10/15/48 | | | 2,500 | | | | 3,086,915 | |
4.00%, 11/01/49 | | | 1,255 | | | | 1,391,719 | |
3.45%, 02/01/50 | | | 800 | | | | 820,151 | |
4.05%, 11/01/52 | | | 694 | | | | 777,536 | |
4.95%, 10/15/58 | | | 1,000 | | | | 1,303,221 | |
Discovery Communications LLC: | | | | | | | | |
4.38%, 06/15/21 | | | 50 | | | | 51,643 | |
2.95%, 03/20/23(a) | | | 1,000 | | | | 1,019,202 | |
3.25%, 04/01/23 | | | 50 | | | | 51,452 | |
3.90%, 11/15/24(a) | | | 250 | | | | 265,647 | |
3.45%, 03/15/25 | | | 1,000 | | | | 1,038,845 | |
4.90%, 03/11/26 | | | 330 | | | | 368,335 | |
3.95%, 03/20/28 | | | 1,220 | | | | 1,302,377 | |
5.00%, 09/20/37(a) | | | 500 | | | | 565,093 | |
4.95%, 05/15/42 | | | 50 | | | | 55,465 | |
| | | | | | | | |
| Security | | Par
(000) | | | Value | |
|
| Media (continued) | |
4.88%, 04/01/43 | | $ | 150 | | | $ | 164,130 | |
5.20%, 09/20/47 | | | 1,445 | | | | 1,684,433 | |
Fox Corp.(b): | | | | | | | | |
4.03%, 01/25/24 | | | 2,000 | | | | 2,131,315 | |
4.71%, 01/25/29 | | | 1,000 | | | | 1,140,383 | |
5.48%, 01/25/39 | | | 1,000 | | | | 1,223,593 | |
5.58%, 01/25/49 | | | 500 | | | | 636,996 | |
Grupo Televisa SAB: | | | | | | | | |
4.63%, 01/30/26(a) | | | 2,000 | | | | 2,143,750 | |
6.63%, 01/15/40 | | | 250 | | | | 312,109 | |
5.00%, 05/13/45 | | | 200 | | | | 208,062 | |
6.13%, 01/31/46(a) | | | 250 | | | | 301,406 | |
5.25%, 05/24/49 | | | 500 | | | | 538,750 | |
Interpublic Group of Cos., Inc.: | | | | | | | | |
3.75%, 10/01/21 | | | 1,000 | | | | 1,027,852 | |
4.20%, 04/15/24 | | | 250 | | | | 269,179 | |
NBCUniversal Media LLC: | | | | | | | | |
4.38%, 04/01/21 | | | 600 | | | | 618,818 | |
2.88%, 01/15/23(a) | | | 250 | | | | 256,931 | |
5.95%, 04/01/41 | | | 250 | | | | 344,004 | |
4.45%, 01/15/43 | | | 250 | | | | 291,566 | |
Omnicom Group, Inc/Omnicom Capital, Inc.: | | | | | | | | |
3.63%, 05/01/22(a) | | | 125 | | | | 129,490 | |
3.65%, 11/01/24 | | | 70 | | | | 73,989 | |
3.60%, 04/15/26(a) | | | 500 | | | | 526,837 | |
RELX Capital, Inc., 3.50%, 03/16/23 | | | 300 | | | | 311,518 | |
TCI Communications, Inc., 7.88%, 02/15/26 | | | 250 | | | | 325,582 | |
TELUS Corp.: | | | | | | | | |
4.60%, 11/16/48 | | | 200 | | | | 236,392 | |
4.30%, 06/15/49(a) | | | 500 | | | | 551,285 | |
Thomson Reuters Corp.: | | | | | | | | |
4.30%, 11/23/23 | | | 250 | | | | 268,298 | |
3.35%, 05/15/26(a) | | | 140 | | | | 144,256 | |
5.65%, 11/23/43 | | | 1,500 | | | | 1,775,556 | |
Time Warner Cable LLC: | | | | | | | | |
4.13%, 02/15/21 | | | 100 | | | | 101,619 | |
4.00%, 09/01/21 | | | 300 | | | | 306,996 | |
6.55%, 05/01/37(a) | | | 650 | | | | 797,384 | |
6.75%, 06/15/39 | | | 2,050 | | | | 2,590,174 | |
5.88%, 11/15/40 | | | 250 | | | | 286,943 | |
5.50%, 09/01/41 | | | 250 | | | | 279,277 | |
4.50%, 09/15/42(a) | | | 1,225 | | | | 1,252,414 | |
TWDC Enterprises 18 Corp.: | | | | | | | | |
2.30%, 02/12/21 | | | 500 | | | | 503,304 | |
3.75%, 06/01/21 | | | 50 | | | | 51,400 | |
2.35%, 12/01/22 | | | 1,300 | | | | 1,319,396 | |
3.15%, 09/17/25 | | | 165 | | | | 175,373 | |
3.00%, 02/13/26 | | | 200 | | | | 210,619 | |
1.85%, 07/30/26 | | | 1,000 | | | | 982,789 | |
2.95%, 06/15/27(a) | | | 750 | | | | 791,340 | |
4.13%, 06/01/44 | | | 500 | | | | 590,363 | |
3.00%, 07/30/46 | | | 75 | | | | 74,186 | |
Series E, 4.13%, 12/01/41 | | | 250 | | | | 287,347 | |
ViacomCBS, Inc.: | | | | | | | | |
4.25%, 09/01/23(a) | | | 1,250 | | | | 1,331,343 | |
3.70%, 08/15/24 | | | 1,000 | | | | 1,058,233 | |
3.50%, 01/15/25 | | | 500 | | | | 523,255 | |
4.00%, 01/15/26(a) | | | 1,500 | | | | 1,607,251 | |
3.38%, 02/15/28 | | | 500 | | | | 512,476 | |
3.70%, 06/01/28(a) | | | 500 | | | | 524,344 | |
6.88%, 04/30/36 | | | 250 | | | | 334,760 | |
4.85%, 07/01/42 | | | 325 | | | | 363,716 | |
4.38%, 03/15/43 | | | 1,070 | | | | 1,134,479 | |
5.85%, 09/01/43 | | | 100 | | | | 125,291 | |
| | | | |
| SCHEDULE OF INVESTMENTS | | | 41 | |
| | |
Schedule of Investments (continued) December 31, 2019 | | U.S. Total Bond Index Master Portfolio (Percentages shown are based on Net Assets) |
| | | | | | | | |
| Security | | Par
(000) | | | Value | |
|
| Media (continued) | |
5.25%, 04/01/44(a) | | $ | 250 | | | $ | 290,111 | |
4.90%, 08/15/44 | | | 1,000 | | | | 1,131,981 | |
Walt Disney Co.: | | | | | | | | |
4.50%, 02/15/21 | | | 1,100 | | | | 1,133,604 | |
1.65%, 09/01/22 | | | 230 | | | | 229,435 | |
3.00%, 09/15/22 | | | 150 | | | | 154,522 | |
1.75%, 08/30/24 | | | 500 | | | | 496,206 | |
3.70%, 09/15/24 | | | 500 | | | | 535,171 | |
3.70%, 10/15/25 | | | 830 | | | | 898,549 | |
3.38%, 11/15/26 | | | 1,500 | | | | 1,617,917 | |
2.00%, 09/01/29 | | | 500 | | | | 485,249 | |
6.20%, 12/15/34 | | | 350 | | | | 491,573 | |
6.40%, 12/15/35 | | | 764 | | | | 1,085,902 | |
6.65%, 11/15/37(a) | | | 250 | | | | 371,631 | |
4.75%, 09/15/44 | | | 500 | | | | 624,628 | |
4.95%, 10/15/45 | | | 15 | | | | 19,585 | |
4.75%, 11/15/46 | | | 1,500 | | | | 1,915,588 | |
2.75%, 09/01/49 | | | 1,000 | | | | 944,023 | |
WPP Finance 2010: | | | | | | | | |
3.63%, 09/07/22 | | | 1,500 | | | | 1,552,430 | |
3.75%, 09/19/24(a) | | | 250 | | | | 263,833 | |
| | | | | | | | |
| | | | | | | 114,723,615 | |
|
| Metal Fabricating — 0.0% | |
Timken Co., 4.50%, 12/15/28 | | | 500 | | | | 538,919 | |
| | | | | | | | |
|
| Metals & Mining — 0.3% | |
ArcelorMittal SA: | | | | | | | | |
3.60%, 07/16/24 | | | 1,000 | | | | 1,025,455 | |
6.13%, 06/01/25 | | | 1,000 | | | | 1,148,988 | |
4.25%, 07/16/29(a) | | | 1,000 | | | | 1,044,795 | |
7.00%, 10/15/39 | | | 375 | | | | 457,098 | |
Barrick Gold Corp., 5.25%, 04/01/42 | | | 950 | | | | 1,133,773 | |
Barrick North America Finance LLC: | | | | | | | | |
5.70%, 05/30/41 | | | 250 | | | | 308,380 | |
5.75%, 05/01/43 | | | 250 | | | | 318,326 | |
BHP Billiton Finance USA Ltd.: | | | | | | | | |
2.88%, 02/24/22(a) | | | 1,250 | | | | 1,274,310 | |
5.00%, 09/30/43 | | | 1,850 | | | | 2,369,303 | |
Newmont Goldcorp Corp.: | | | | | | | | |
3.63%, 06/09/21 | | | 250 | | | | 254,814 | |
3.50%, 03/15/22(a) | | | 1,950 | | | | 2,001,614 | |
3.70%, 03/15/23 | | | 500 | | | | 522,846 | |
2.80%, 10/01/29 | | | 80 | | | | 79,261 | |
4.88%, 03/15/42 | | | 1,300 | | | | 1,522,209 | |
Nucor Corp.: | | | | | | | | |
3.95%, 05/01/28(a) | | | 1,000 | | | | 1,085,668 | |
5.20%, 08/01/43 | | | 250 | | | | 308,805 | |
4.40%, 05/01/48 | | | 500 | | | | 567,302 | |
Precision Castparts Corp.: | | | | | | | | |
2.50%, 01/15/23(a) | | | 150 | | | | 152,681 | |
4.20%, 06/15/35 | | | 250 | | | | 277,743 | |
Reliance Steel & Aluminum Co., 4.50%, 04/15/23 | | | 25 | | | | 26,426 | |
Rio Tinto Finance USA Ltd.: | | | | | | | | |
3.75%, 06/15/25 | | | 3,500 | | | | 3,763,475 | |
5.20%, 11/02/40(a) | | | 350 | | | | 457,452 | |
Rio Tinto Finance USA PLC: | | | | | | | | |
4.75%, 03/22/42 | | | 100 | | | | 122,498 | |
4.13%, 08/21/42 | | | 500 | | | | 573,567 | |
Southern Copper Corp.: | | | | | | | | |
3.50%, 11/08/22 | | | 1,000 | | | | 1,030,937 | |
3.88%, 04/23/25(a) | | | 2,750 | | | | 2,888,359 | |
6.75%, 04/16/40(a) | | | 1,350 | | | | 1,801,406 | |
5.88%, 04/23/45 | | | 615 | | | | 767,213 | |
| | | | | | | | |
| Security | | Par
(000) | | | Value | |
|
| Metals & Mining (continued) | |
Steel Dynamics, Inc.: | | | | | | | | |
2.80%, 12/15/24 | | $ | 30 | | | $ | 30,192 | |
5.00%, 12/15/26 | | | 1,100 | | | | 1,169,882 | |
3.45%, 04/15/30 | | | 90 | | | | 91,069 | |
Teck Resources Ltd., 5.40%, 02/01/43 | | | 2,000 | | | | 2,114,726 | |
Vale Overseas Ltd.: | | | | | | | | |
6.25%, 08/10/26 | | | 2,000 | | | | 2,340,000 | |
6.88%, 11/10/39 | | | 1,250 | | | | 1,628,125 | |
| | | | | | | | |
| | | | | | | 34,658,698 | |
|
| Multi-Utilities — 0.1% | |
CenterPoint Energy Resources Corp., 5.85%, 01/15/41 | | | 250 | | | | 318,757 | |
CenterPoint Energy, Inc.: | | | | | | | | |
2.50%, 09/01/24 | | | 425 | | | | 425,611 | |
4.25%, 11/01/28(a) | | | 2,000 | | | | 2,171,875 | |
2.95%, 03/01/30 | | | 1,000 | | | | 985,979 | |
3.70%, 09/01/49(a) | | | 250 | | | | 246,112 | |
Dominion Energy Gas Holdings LLC: | | | | | | | | |
3.60%, 12/15/24 | | | 250 | | | | 262,521 | |
Series A, 2.50%, 11/15/24 | | | 495 | | | | 497,319 | |
Series B, 3.00%, 11/15/29 | | | 1,000 | | | | 996,633 | |
Series C, 3.90%, 11/15/49 | | | 300 | | | | 299,637 | |
ONE Gas, Inc., 4.66%, 02/01/44(a) | | | 250 | | | | 297,396 | |
San Diego Gas & Electric Co.: | | | | | | | | |
3.60%, 09/01/23 | | | 250 | | | | 261,429 | |
4.30%, 04/01/42 | | | 100 | | | | 107,578 | |
4.15%, 05/15/48 | | | 1,000 | | | | 1,100,494 | |
Washington Gas Light Co., 3.65%, 09/15/49 | | | 500 | | | | 503,109 | |
| | | | | | | | |
| | | | | | | 8,474,450 | |
|
| Multiline Retail — 0.1% | |
Kohl’s Corp., 5.55%, 07/17/45 | | | 100 | | | | 101,983 | |
Nordstrom, Inc.: | | | | | | | | |
4.00%, 10/15/21 | | | 100 | | | | 102,638 | |
4.38%, 04/01/30 | | | 200 | | | | 203,971 | |
5.00%, 01/15/44(a) | | | 500 | | | | 490,139 | |
O’Reilly Automotive, Inc.: | | | | | | | | |
4.35%, 06/01/28 | | | 1,000 | | | | 1,116,615 | |
3.90%, 06/01/29 | | | 1,000 | | | | 1,092,837 | |
Target Corp.: | | | | | | | | |
2.90%, 01/15/22 | | | 150 | | | | 153,479 | |
3.50%, 07/01/24 | | | 1,000 | | | | 1,070,405 | |
2.50%, 04/15/26(a) | | | 250 | | | | 256,288 | |
3.38%, 04/15/29(a) | | | 1,000 | | | | 1,087,152 | |
4.00%, 07/01/42(a) | | | 350 | | | | 400,375 | |
3.63%, 04/15/46(a) | | | 850 | | | | 929,911 | |
3.90%, 11/15/47(a) | | | 500 | | | | 574,938 | |
| | | | | | | | |
| | | | | | | 7,580,731 | |
|
| Office Supplies & Equipment — 0.0% | |
VMware, Inc., 2.95%, 08/21/22 | | | 2,000 | | | | 2,037,917 | |
| | | | | | | | |
|
| Oil, Gas & Consumable Fuels — 2.5% | |
Apache Corp.: | | | | | | | | |
3.25%, 04/15/22 | | | 756 | | | | 770,347 | |
4.38%, 10/15/28 | | | 2,000 | | | | 2,091,977 | |
4.25%, 01/15/30(a) | | | 750 | | | | 777,914 | |
5.10%, 09/01/40 | | | 250 | | | | 254,534 | |
5.25%, 02/01/42 | | | 250 | | | | 260,581 | |
4.75%, 04/15/43 | | | 250 | | | | 241,557 | |
4.25%, 01/15/44 | | | 600 | | | | 553,370 | |
Boardwalk Pipelines LP: | | | | | | | | |
3.38%, 02/01/23(a) | | | 200 | | | | 203,786 | |
4.80%, 05/03/29 | | | 500 | | | | 535,984 | |
| | |
| 42 | | 2019 BLACKROCK ANNUAL REPORTTO SHAREHOLDERS |
| | |
Schedule of Investments (continued) December 31, 2019 | | U.S. Total Bond Index Master Portfolio (Percentages shown are based on Net Assets) |
| | | | | | | | |
| Security | | Par
(000) | | | Value | |
|
| Oil, Gas & Consumable Fuels (continued) | |
BP Capital Markets America, Inc.: | | | | | | | | |
4.74%, 03/11/21 | | $ | 550 | | | $ | 568,374 | |
2.11%, 09/16/21 | | | 500 | | | | 502,427 | |
3.25%, 05/06/22 | | | 100 | | | | 103,221 | |
2.52%, 09/19/22 | | | 1,000 | | | | 1,013,214 | |
2.75%, 05/10/23 | | | 350 | | | | 358,090 | |
3.22%, 11/28/23(a) | | | 1,000 | | | | 1,041,953 | |
3.41%, 02/11/26 | | | 2,000 | | | | 2,131,000 | |
3.12%, 05/04/26(a) | | | 350 | | | | 365,746 | |
3.02%, 01/16/27 | | | 500 | | | | 516,904 | |
3.94%, 09/21/28(a) | | | 500 | | | | 552,660 | |
4.23%, 11/06/28 | | | 1,000 | | | | 1,131,053 | |
BP Capital Markets PLC: | | | | | | | | |
3.56%, 11/01/21 | | | 3,000 | | | | 3,093,785 | |
3.06%, 03/17/22 | | | 210 | | | | 215,354 | |
3.99%, 09/26/23 | | | 250 | | | | 267,249 | |
3.28%, 09/19/27 | | | 500 | | | | 526,148 | |
Canadian Natural Resources Ltd.: | | | | | | | | |
3.45%, 11/15/21 | | | 1,100 | | | | 1,127,455 | |
2.95%, 01/15/23(a) | | | 1,000 | | | | 1,020,155 | |
3.80%, 04/15/24 | | | 1,250 | | | | 1,320,903 | |
3.90%, 02/01/25 | | | 250 | | | | 266,432 | |
3.85%, 06/01/27 | | | 250 | | | | 266,266 | |
6.25%, 03/15/38(a) | | | 300 | | | | 390,394 | |
4.95%, 06/01/47(a) | | | 1,500 | | | | 1,824,068 | |
Cenovus Energy, Inc.: | | | | | | | | |
4.25%, 04/15/27 | | | 1,000 | | | | 1,059,468 | |
5.25%, 06/15/37 | | | 500 | | | | 554,193 | |
6.75%, 11/15/39(a) | | | 500 | | | | 637,034 | |
5.40%, 06/15/47(a) | | | 500 | | | | 581,132 | |
Cheniere Corpus Christi Holdings LLC: | | | | | | | | |
7.00%, 06/30/24 | | | 1,000 | | | | 1,152,390 | |
5.13%, 06/30/27 | | | 1,500 | | | | 1,657,770 | |
3.70%, 11/15/29(b) | | | 500 | | | | 510,609 | |
Chevron Corp.: | | | | | | | | |
2.10%, 05/16/21(a) | | | 3,000 | | | | 3,018,945 | |
2.41%, 03/03/22 | | | 145 | | | | 146,915 | |
3.19%, 06/24/23 | | | 500 | | | | 520,531 | |
3.33%, 11/17/25(a) | | | 500 | | | | 534,422 | |
2.95%, 05/16/26 | | | 1,250 | | | | 1,306,583 | |
Cimarex Energy Co., 4.38%, 03/15/29 | | | 1,000 | | | | 1,060,790 | |
CNOOC Finance 2013 Ltd., 3.00%, 05/09/23 | | | 1,300 | | | | 1,320,719 | |
CNOOC Finance 2015 USA LLC: | | | | | | | | |
3.50%, 05/05/25 | | | 500 | | | | 521,493 | |
4.38%, 05/02/28 | | | 2,000 | | | | 2,220,000 | |
CNOOC Nexen Finance 2014 ULC: | | | | | | | | |
4.25%, 04/30/24 | | | 1,750 | | | | 1,873,594 | |
4.88%, 04/30/44 | | | 500 | | | | 610,938 | |
Columbia Pipeline Group, Inc., 4.50%, 06/01/25(a) | | | 250 | | | | 274,313 | |
Concho Resources, Inc.: | | | | | | | | |
3.75%, 10/01/27(a) | | | 1,000 | | | | 1,051,842 | |
4.88%, 10/01/47 | | | 500 | | | | 584,161 | |
ConocoPhillips, 6.50%, 02/01/39 | | | 1,400 | | | | 2,040,311 | |
ConocoPhillips Co.: | | | | | | | | |
4.95%, 03/15/26(a) | | | 1,000 | | | | 1,150,802 | |
4.30%, 11/15/44 | | | 500 | | | | 586,994 | |
5.95%, 03/15/46 | | | 750 | | | | 1,073,563 | |
ConocoPhillips Holding Co., 6.95%, 04/15/29 | | | 850 | | | | 1,155,941 | |
Continental Resources, Inc.: | | | | | | | | |
4.38%, 01/15/28(a) | | | 1,000 | | | | 1,063,380 | |
4.90%, 06/01/44 | | | 250 | | | | 265,439 | |
Devon Energy Corp.: | | | | | | | | |
5.85%, 12/15/25(a) | | | 250 | | | | 296,465 | |
5.60%, 07/15/41 | | | 500 | | | | 608,057 | |
| | | | | | | | |
| Security | | Par
(000) | | | Value | |
|
| Oil, Gas & Consumable Fuels (continued) | |
4.75%, 05/15/42 | | $ | 350 | | | $ | 392,667 | |
5.00%, 06/15/45 | | | 500 | | | | 580,337 | |
Diamondback Energy, Inc., 3.50%, 12/01/29 | | | 1,000 | | | | 1,017,600 | |
Ecopetrol SA: | | | | | | | | |
5.88%, 09/18/23 | | | 350 | | | | 388,430 | |
4.13%, 01/16/25 | | | 1,000 | | | | 1,051,875 | |
5.38%, 06/26/26 | | | 500 | | | | 560,625 | |
5.88%, 05/28/45 | | | 2,250 | | | | 2,652,188 | |
Enable Midstream Partners LP: | | | | | | | | |
4.95%, 05/15/28(a) | | | 1,000 | | | | 1,012,965 | |
5.00%, 05/15/44 | | | 500 | | | | 458,967 | |
Enbridge Energy Partners LP: | | | | | | | | |
4.20%, 09/15/21 | | | 100 | | | | 103,058 | |
5.88%, 10/15/25(a) | | | 1,500 | | | | 1,749,695 | |
7.38%, 10/15/45 | | | 800 | | | | 1,195,175 | |
Enbridge, Inc.: | | | | | | | | |
3.50%, 06/10/24 | | | 65 | | | | 67,786 | |
2.50%, 01/15/25 | | | 250 | | | | 251,346 | |
4.25%, 12/01/26 | | | 1,000 | | | | 1,101,721 | |
3.70%, 07/15/27 | | | 1,000 | | | | 1,059,245 | |
3.13%, 11/15/29 | | | 250 | | | | 253,108 | |
4.50%, 06/10/44 | | | 250 | | | | 275,670 | |
4.00%, 11/15/49 | | | 250 | | | | 262,668 | |
Encana Corp.: | | | | | | | | |
3.90%, 11/15/21(a) | | | 1,250 | | | | 1,280,182 | |
7.20%, 11/01/31 | | | 1,000 | | | | 1,223,527 | |
7.38%, 11/01/31(a) | | | 250 | | | | 305,007 | |
6.50%, 02/01/38 | | | 250 | | | | 295,369 | |
Energy Transfer Operating LP: | | | | | | | | |
5.20%, 02/01/22 | | | 250 | | | | 262,182 | |
3.60%, 02/01/23 | | | 150 | | | | 153,653 | |
4.25%, 03/15/23 | | | 1,000 | | | | 1,044,515 | |
4.90%, 02/01/24(a) | | | 250 | | | | 268,302 | |
4.75%, 01/15/26 | | | 1,000 | | | | 1,082,961 | |
4.20%, 04/15/27 | | | 1,000 | | | | 1,047,352 | |
4.90%, 03/15/35(a) | | | 250 | | | | 262,623 | |
5.15%, 02/01/43 | | | 500 | | | | 513,989 | |
5.95%, 10/01/43 | | | 150 | | | | 167,555 | |
5.15%, 03/15/45(a) | | | 2,000 | | | | 2,105,677 | |
6.13%, 12/15/45 | | | 250 | | | | 289,931 | |
5.30%, 04/15/47(a) | | | 250 | | | | 266,884 | |
6.25%, 04/15/49 | | | 1,500 | | | | 1,810,218 | |
Series 30Y, 6.00%, 06/15/48(a) | | | 1,000 | | | | 1,166,837 | |
Energy Transfer Partners LP/Regency Energy Finance Corp., 5.88%, 03/01/22 | | | 500 | | | | 530,712 | |
Enterprise Products Operating LLC: | | | | | | | | |
2.80%, 02/15/21 | | | 500 | | | | 504,772 | |
3.90%, 02/15/24 | | | 125 | | | | 132,647 | |
3.75%, 02/15/25 | | | 790 | | | | 841,957 | |
3.70%, 02/15/26(a) | | | 960 | | | | 1,022,060 | |
3.95%, 02/15/27(a) | | | 3,000 | | | | 3,238,835 | |
3.13%, 07/31/29 | | | 2,655 | | | | 2,732,005 | |
5.95%, 02/01/41 | | | 150 | | | | 193,587 | |
4.45%, 02/15/43 | | | 325 | | | | 357,683 | |
4.85%, 03/15/44 | | | 200 | | | | 231,417 | |
5.10%, 02/15/45(a) | | | 250 | | | | 299,719 | |
4.90%, 05/15/46(a) | | | 1,100 | | | | 1,290,188 | |
4.25%, 02/15/48 | | | 1,000 | | | | 1,074,388 | |
4.80%, 02/01/49 | | | 1,000 | | | | 1,174,752 | |
4.20%, 01/31/50 | | | 620 | | | | 665,527 | |
(3 mo. LIBOR US + 2.57%), 5.38%, 02/15/78(c) | | | 1,000 | | | | 993,793 | |
Series E, (3 mo. LIBOR US + 3.03%), 5.25%, 08/16/77(c) | | | 750 | | | | 758,985 | |
| | | | |
| SCHEDULE OF INVESTMENTS | | | 43 | |
| | |
Schedule of Investments (continued) December 31, 2019 | | U.S. Total Bond Index Master Portfolio (Percentages shown are based on Net Assets) |
| | | | | | | | |
| Security | | Par
(000) | | | Value | |
|
| Oil, Gas & Consumable Fuels (continued) | |
EOG Resources, Inc.: | | | | | | | | |
3.15%, 04/01/25 | | $ | 80 | | | $ | 84,013 | |
5.10%, 01/15/36 | | | 250 | | | | 307,238 | |
EQM Midstream Partners LP, 4.75%, 07/15/23 | | | 1,000 | | | | 1,003,191 | |
EQT Corp.(a): | | | | | | | | |
4.88%, 11/15/21 | | | 1,050 | | | | 1,084,070 | |
3.00%, 10/01/22 | | | 1,000 | | | | 982,809 | |
EQT Midstream Partners LP, Series 10Y, 5.50%, 07/15/28 | | | 1,000 | | | | 982,933 | |
Equinor ASA: | | | | | | | | |
2.75%, 11/10/21 | | | 500 | | | | 508,799 | |
2.65%, 01/15/24 | | | 1,500 | | | | 1,538,312 | |
3.70%, 03/01/24 | | | 250 | | | | 266,373 | |
3.25%, 11/10/24 | | | 500 | | | | 526,911 | |
5.10%, 08/17/40 | | | 1,100 | | | | 1,402,832 | |
4.25%, 11/23/41 | | | 300 | | | | 347,702 | |
3.25%, 11/18/49 | | | 1,000 | | | | 1,008,314 | |
Exxon Mobil Corp.: | | | | | | | | |
2.22%, 03/01/21 | | | 750 | | | | 754,427 | |
2.40%, 03/06/22 | | | 500 | | | | 505,449 | |
1.90%, 08/16/22 | | | 270 | | | | 271,490 | |
2.73%, 03/01/23(a) | | | 1,000 | | | | 1,024,278 | |
3.18%, 03/15/24 | | | 250 | | | | 261,939 | |
2.02%, 08/16/24(a) | | | 500 | | | | 501,810 | |
2.71%, 03/06/25 | | | 1,250 | | | | 1,292,361 | |
3.04%, 03/01/26(a) | | | 620 | | | | 650,476 | |
2.28%, 08/16/26 | | | 500 | | | | 503,374 | |
2.44%, 08/16/29(a) | | | 500 | | | | 504,869 | |
3.00%, 08/16/39 | | | 500 | | | | 501,333 | |
4.11%, 03/01/46(a) | | | 1,000 | | | | 1,174,054 | |
3.10%, 08/16/49 | | | 1,500 | | | | 1,497,632 | |
Hess Corp.: | | | | | | | | |
4.30%, 04/01/27(a) | | | 1,500 | | | | 1,599,636 | |
5.60%, 02/15/41(a) | | | 550 | | | | 644,118 | |
5.80%, 04/01/47 | | | 1,000 | | | | 1,224,738 | |
Husky Energy, Inc.: | | | | | | | | |
3.95%, 04/15/22 | | | 150 | | | | 155,147 | |
4.00%, 04/15/24(a) | | | 500 | | | | 527,618 | |
6.80%, 09/15/37 | | | 500 | | | | 651,317 | |
Kinder Morgan Energy Partners LP: | | | | | | | | |
4.30%, 05/01/24 | | | 500 | | | | 534,402 | |
3.50%, 03/01/21 | | | 750 | | | | 759,575 | |
5.80%, 03/01/21 | | | 250 | | | | 260,256 | |
5.00%, 10/01/21 | | | 200 | | | | 208,479 | |
3.95%, 09/01/22 | | | 225 | | | | 234,514 | |
3.45%, 02/15/23 | | | 500 | | | | 515,047 | |
4.15%, 02/01/24(a) | | | 1,000 | | | | 1,060,558 | |
4.25%, 09/01/24(a) | | | 155 | | | | 166,015 | |
5.80%, 03/15/35 | | | 1,000 | | | | 1,210,723 | |
6.50%, 02/01/37 | | | 100 | | | | 124,736 | |
6.95%, 01/15/38 | | | 1,250 | | | | 1,656,097 | |
5.00%, 08/15/42 | | | 75 | | | | 81,814 | |
5.00%, 03/01/43 | | | 250 | | | | 274,197 | |
5.50%, 03/01/44 | | | 250 | | | | 291,122 | |
5.40%, 09/01/44(a) | | | 250 | | | | 288,064 | |
Kinder Morgan, Inc.: | | | | | | | | |
3.15%, 01/15/23 | | | 1,500 | | | | 1,534,070 | |
4.30%, 06/01/25 | | | 410 | | | | 444,844 | |
4.30%, 03/01/28(a) | | | 1,000 | | | | 1,090,417 | |
5.30%, 12/01/34(a) | | | 250 | | | | 294,530 | |
5.55%, 06/01/45 | | | 1,250 | | | | 1,487,606 | |
5.05%, 02/15/46 | | | 750 | | | | 841,644 | |
5.20%, 03/01/48(a) | | | 1,250 | | | | 1,451,560 | |
| | | | | | | | |
| Security | | Par
(000) | | | Value | |
|
| Oil, Gas & Consumable Fuels (continued) | |
Magellan Midstream Partners LP: | | | | | | | | |
3.20%, 03/15/25 | | $ | 500 | | | $ | 511,448 | |
4.25%, 09/15/46(a) | | | 250 | | | | 266,863 | |
4.85%, 02/01/49(a) | | | 750 | | | | 870,895 | |
3.95%, 03/01/50 | | | 175 | | | | 179,992 | |
Marathon Oil Corp.: | | | | | | | | |
2.80%, 11/01/22(a) | | | 400 | | | | 406,732 | |
3.85%, 06/01/25 | | | 250 | | | | 264,774 | |
4.40%, 07/15/27 | | | 1,000 | | | | 1,087,609 | |
6.60%, 10/01/37 | | | 250 | | | | 318,974 | |
5.20%, 06/01/45(a) | | | 250 | | | | 290,915 | |
Marathon Petroleum Corp.: | | | | | | | | |
5.13%, 03/01/21 | | | 150 | | | | 155,309 | |
3.63%, 09/15/24 | | | 115 | | | | 120,801 | |
3.80%, 04/01/28(a) | | | 1,000 | | | | 1,052,691 | |
4.75%, 09/15/44 | | | 250 | | | | 274,844 | |
5.85%, 12/15/45(a) | | | 250 | | | | 287,097 | |
4.50%, 04/01/48(a) | | | 1,000 | | | | 1,064,080 | |
MPLX LP: | | | | | | | | |
3.50%, 12/01/22(b) | | | 1,000 | | | | 1,029,604 | |
3.38%, 03/15/23 | | | 2,000 | | | | 2,053,999 | |
4.50%, 07/15/23 | | | 250 | | | | 265,705 | |
4.88%, 12/01/24 | | | 250 | | | | 271,798 | |
4.88%, 06/01/25 | | | 250 | | | | 273,110 | |
4.13%, 03/01/27(a) | | | 1,000 | | | | 1,050,439 | |
4.00%, 03/15/28(a) | | | 1,000 | | | | 1,035,773 | |
4.50%, 04/15/38 | | | 750 | | | | 763,180 | |
5.20%, 12/01/47(b) | | | 500 | | | | 532,474 | |
4.70%, 04/15/48(a) | | | 1,750 | | | | 1,783,142 | |
5.50%, 02/15/49 | | | 200 | | | | 227,217 | |
Nexen, Inc.: | | | | | | | | |
7.88%, 03/15/32 | | | 900 | | | | 1,303,031 | |
6.40%, 05/15/37 | | | 400 | | | | 547,000 | |
Noble Energy, Inc.: | | | | | | | | |
3.85%, 01/15/28(a) | | | 1,500 | | | | 1,585,044 | |
5.25%, 11/15/43 | | | 500 | | | | 563,387 | |
4.95%, 08/15/47 | | | 500 | | | | 555,745 | |
4.20%, 10/15/49 | | | 500 | | | | 506,733 | |
Occidental Petroleum Corp.: | | | | | | | | |
2.70%, 08/15/22 | | | 110 | | | | 111,143 | |
6.95%, 07/01/24(a) | | | 1,000 | | | | 1,178,099 | |
2.90%, 08/15/24 | | | 500 | | | | 508,170 | |
3.50%, 06/15/25 | | | 250 | | | | 258,181 | |
5.55%, 03/15/26 | | | 1,090 | | | | 1,236,181 | |
3.40%, 04/15/26(a) | | | 390 | | | | 399,643 | |
3.00%, 02/15/27 | | | 2,250 | | | | 2,254,287 | |
3.50%, 08/15/29(a) | | | 225 | | | | 229,696 | |
6.45%, 09/15/36 | | | 350 | | | | 429,945 | |
4.30%, 08/15/39 | | | 30 | | | | 30,591 | |
6.20%, 03/15/40 | | | 1,250 | | | | 1,502,129 | |
4.50%, 07/15/44 | | | 250 | | | | 252,574 | |
6.60%, 03/15/46 | | | 1,000 | | | | 1,289,260 | |
4.40%, 04/15/46 | | | 250 | | | | 253,258 | |
4.20%, 03/15/48 | | | 1,250 | | | | 1,241,774 | |
4.40%, 08/15/49(a) | | | 500 | | | | 516,282 | |
Series 1, 4.10%, 02/01/21 | | | 50 | | | | 50,870 | |
ONEOK Partners LP(a): | | | | | | | | |
3.38%, 10/01/22 | | | 500 | | | | 514,597 | |
4.90%, 03/15/25 | | | 250 | | | | 275,356 | |
6.13%, 02/01/41 | | | 300 | | | | 361,241 | |
ONEOK, Inc.: | | | | | | | | |
2.75%, 09/01/24 | | | 430 | | | | 434,085 | |
4.55%, 07/15/28(a) | | | 500 | | | | 550,064 | |
3.40%, 09/01/29 | | | 1,000 | | | | 1,016,137 | |
| | |
| 44 | | 2019 BLACKROCK ANNUAL REPORTTO SHAREHOLDERS |
| | |
Schedule of Investments (continued) December 31, 2019 | | U.S. Total Bond Index Master Portfolio (Percentages shown are based on Net Assets) |
| | | | | | | | |
| Security | | Par
(000) | | | Value | |
|
| Oil, Gas & Consumable Fuels (continued) | |
4.95%, 07/13/47(a) | | $ | 1,000 | | | $ | 1,102,842 | |
4.45%, 09/01/49 | | | 1,000 | | | | 1,037,275 | |
Petroleos Mexicanos: | | | | | | | | |
6.63%, 06/15/35 | | | 250 | | | | 255,750 | |
5.50%, 01/21/21 | | | 350 | | | | 359,625 | |
6.38%, 02/04/21 | | | 1,400 | | | | 1,453,375 | |
4.88%, 01/24/22 | | | 1,280 | | | | 1,326,400 | |
5.38%, 03/13/22 | | | 2,800 | | | | 2,933,875 | |
3.50%, 01/30/23 | | | 280 | | | | 282,100 | |
4.63%, 09/21/23(a) | | | 1,050 | | | | 1,097,250 | |
4.88%, 01/18/24 | | | 250 | | | | 263,250 | |
4.50%, 01/23/26 | | | 2,000 | | | | 1,987,800 | |
6.88%, 08/04/26 | | | 500 | | | | 549,000 | |
6.50%, 03/13/27 | | | 1,750 | | | | 1,854,081 | |
5.35%, 02/12/28 | | | 1,250 | | | | 1,237,500 | |
6.50%, 01/23/29(a) | | | 2,000 | | | | 2,101,250 | |
6.84%, 01/23/30(b) | | | 3,000 | | | | 3,209,700 | |
6.50%, 06/02/41(a) | | | 550 | | | | 545,703 | |
5.50%, 06/27/44 | | | 862 | | | | 766,103 | |
6.38%, 01/23/45 | | | 2,750 | | | | 2,670,078 | |
5.63%, 01/23/46 | | | 850 | | | | 764,203 | |
6.75%, 09/21/47 | | | 2,473 | | | | 2,494,639 | |
6.35%, 02/12/48 | | | 2,000 | | | | 1,936,463 | |
7.69%, 01/23/50(b) | | | 2,900 | | | | 3,177,559 | |
Phillips 66: | | | | | | | | |
4.30%, 04/01/22 | | | 1,000 | | | | 1,049,745 | |
4.65%, 11/15/34 | | | 1,355 | | | | 1,592,558 | |
5.88%, 05/01/42 | | | 100 | | | | 135,119 | |
4.88%, 11/15/44 | | | 1,250 | | | | 1,508,058 | |
Phillips 66 Partners LP: | | | | | | | | |
2.45%, 12/15/24 | | | 255 | | | | 255,218 | |
3.15%, 12/15/29 | | | 370 | | | | 368,706 | |
4.90%, 10/01/46 | | | 500 | | | | 568,114 | |
Pioneer Natural Resources Co., 3.95%, 07/15/22 | | | 150 | | | | 155,684 | |
Plains All American Pipeline LP/PAA Finance Corp.: | | | | | | | | |
3.65%, 06/01/22 | | | 500 | | | | 513,001 | |
2.85%, 01/31/23(a) | | | 250 | | | | 252,495 | |
3.60%, 11/01/24 | | | 750 | | | | 771,925 | |
4.50%, 12/15/26 | | | 500 | | | | 532,841 | |
5.15%, 06/01/42 | | | 50 | | | | 50,451 | |
4.70%, 06/15/44 | | | 750 | | | | 729,367 | |
4.90%, 02/15/45 | | | 1,000 | | | | 996,544 | |
Sabine Pass Liquefaction LLC: | | | | | | | | |
5.63%, 02/01/21 | | | 3,500 | | | | 3,597,625 | |
5.63%, 03/01/25 | | | 1,000 | | | | 1,126,309 | |
5.00%, 03/15/27 | | | 1,000 | | | | 1,100,789 | |
4.20%, 03/15/28 | | | 750 | | | | 795,036 | |
Shell International Finance BV: | | | | | | | | |
1.88%, 05/10/21 | | | 250 | | | | 250,293 | |
1.75%, 09/12/21(a) | | | 1,000 | | | | 999,598 | |
2.25%, 01/06/23 | | | 1,000 | | | | 1,008,304 | |
3.40%, 08/12/23 | | | 2,000 | | | | 2,097,430 | |
2.00%, 11/07/24 | | | 1,000 | | | | 997,367 | |
3.25%, 05/11/25 | | | 1,250 | | | | 1,324,968 | |
2.88%, 05/10/26 | | | 500 | | | | 518,850 | |
2.50%, 09/12/26 | | | 1,000 | | | | 1,016,730 | |
2.38%, 11/07/29 | | | 1,000 | | | | 991,899 | |
4.13%, 05/11/35(a) | | | 500 | | | | 585,053 | |
6.38%, 12/15/38 | | | 300 | | | | 437,876 | |
5.50%, 03/25/40(a) | | | 300 | | | | 405,211 | |
4.55%, 08/12/43 | | | 200 | | | | 243,905 | |
4.38%, 05/11/45 | | | 2,500 | | | | 2,984,546 | |
4.00%, 05/10/46 | | | 1,250 | | | | 1,424,508 | |
| | | | | | | | |
| Security | | Par
(000) | | | Value | |
|
| Oil, Gas & Consumable Fuels (continued) | |
3.75%, 09/12/46(a) | | $ | 900 | | | $ | 989,755 | |
3.13%, 11/07/49 | | | 940 | | | | 928,525 | |
Spectra Energy Partners LP: | | | | | | | | |
4.75%, 03/15/24 | | | 250 | | | | 272,233 | |
3.50%, 03/15/25 | | | 250 | | | | 261,685 | |
3.38%, 10/15/26 | | | 1,000 | | | | 1,035,439 | |
Suncor Energy, Inc.: | | | | | | | | |
3.60%, 12/01/24(a) | | | 1,165 | | | | 1,236,469 | |
6.50%, 06/15/38 | | | 500 | | | | 696,035 | |
6.85%, 06/01/39 | | | 250 | | | | 360,738 | |
4.00%, 11/15/47 | | | 1,500 | | | | 1,637,358 | |
Sunoco Logistics Partners Operations LP: | | | | | | | | |
4.25%, 04/01/24(a) | | | 400 | | | | 420,676 | |
4.00%, 10/01/27(a) | | | 1,750 | | | | 1,810,633 | |
4.95%, 01/15/43 | | | 250 | | | | 247,612 | |
5.30%, 04/01/44 | | | 100 | | | | 106,432 | |
5.35%, 05/15/45 | | | 250 | | | | 268,861 | |
5.40%, 10/01/47(a) | | | 500 | | | | 543,639 | |
TC PipeLines LP: | | | | | | | | |
4.38%, 03/13/25 | | | 250 | | | | 266,244 | |
3.90%, 05/25/27 | | | 105 | | | | 109,792 | |
Total Capital Canada Ltd., 2.75%, 07/15/23 | | | 1,150 | | | | 1,179,672 | |
Total Capital International SA: | | | | | | | | |
2.75%, 06/19/21 | | | 250 | | | | 253,375 | |
2.70%, 01/25/23 | | | 500 | | | | 510,945 | |
3.75%, 04/10/24(a) | | | 1,000 | | | | 1,071,115 | |
3.46%, 02/19/29 | | | 3,000 | | | | 3,252,663 | |
3.46%, 07/12/49 | | | 500 | | | | 526,079 | |
Total Capital SA, 4.25%, 12/15/21 | | | 250 | | | | 261,310 | |
TransCanada PipeLines Ltd.: | | | | | | | | |
2.50%, 08/01/22(a) | | | 1,000 | | | | 1,010,697 | |
3.75%, 10/16/23 | | | 500 | | | | 526,928 | |
4.88%, 01/15/26 | | | 850 | | | | 951,702 | |
4.25%, 05/15/28(a) | | | 750 | | | | 833,097 | |
4.63%, 03/01/34 | | | 2,250 | | | | 2,566,528 | |
6.20%, 10/15/37 | | | 200 | | | | 260,985 | |
4.75%, 05/15/38 | | | 250 | | | | 285,620 | |
7.25%, 08/15/38 | | | 250 | | | | 361,489 | |
7.63%, 01/15/39(a) | | | 250 | | | | 375,144 | |
5.00%, 10/16/43 | | | 150 | | | | 173,927 | |
4.88%, 05/15/48(a) | | | 750 | | | | 887,170 | |
5.10%, 03/15/49(a) | | | 500 | | | | 610,252 | |
Transcanada Trust(3 mo. LIBOR US + 4.15%), 5.50%, 09/15/79(c) | | | 250 | | | | 262,375 | |
Transcontinental Gas Pipe Line Co. LLC: | | | | | | | | |
7.85%, 02/01/26 | | | 250 | | | | 317,740 | |
4.00%, 03/15/28 | | | 750 | | | | 797,980 | |
4.45%, 08/01/42(a) | | | 250 | | | | 263,384 | |
Valero Energy Corp.: | | | | | | | | |
3.65%, 03/15/25(a) | | | 1,500 | | | | 1,595,672 | |
3.40%, 09/15/26(a) | | | 750 | | | | 786,168 | |
4.00%, 04/01/29(a) | | | 1,000 | | | | 1,078,866 | |
6.63%, 06/15/37(a) | | | 300 | | | | 396,952 | |
4.90%, 03/15/45 | | | 500 | | | | 576,756 | |
Western Midstream Operating LP: | | | | | | | | |
4.00%, 07/01/22 | | | 250 | | | | 256,266 | |
3.95%, 06/01/25 | | | 750 | | | | 757,457 | |
4.65%, 07/01/26(a) | | | 250 | | | | 256,002 | |
4.50%, 03/01/28 | | | 1,000 | | | | 987,286 | |
4.75%, 08/15/28 | | | 1,000 | | | | 1,009,021 | |
Williams Cos., Inc.: | | | | | | | | |
4.00%, 11/15/21 | | | 250 | | | | 257,034 | |
3.60%, 03/15/22 | | | 750 | | | | 771,190 | |
| | | | |
| SCHEDULE OF INVESTMENTS | | | 45 | |
| | |
Schedule of Investments (continued) December 31, 2019 | | U.S. Total Bond Index Master Portfolio (Percentages shown are based on Net Assets) |
| | | | | | | | |
| Security | | Par
(000) | | | Value | |
|
| Oil, Gas & Consumable Fuels (continued) | |
3.70%, 01/15/23 | | $ | 3,000 | | | $ | 3,107,277 | |
4.30%, 03/04/24 | | | 250 | | | | 266,822 | |
3.90%, 01/15/25 | | | 250 | | | | 263,282 | |
4.00%, 09/15/25 | | | 250 | | | | 265,261 | |
3.75%, 06/15/27(a) | | | 750 | | | | 782,295 | |
6.30%, 04/15/40 | | | 250 | | | | 310,177 | |
5.75%, 06/24/44 | | | 1,000 | | | | 1,185,145 | |
4.90%, 01/15/45 | | | 500 | | | | 539,865 | |
5.10%, 09/15/45(a) | | | 900 | | | | 1,003,604 | |
4.85%, 03/01/48(a) | | | 500 | | | | 547,391 | |
| | | | | | | | |
| | | | | | | 283,774,449 | |
|
| Paper & Forest Products — 0.1% | |
Fibria Overseas Finance, Ltd., 5.50%, 01/17/27(a) | | | 1,000 | | | | 1,095,625 | |
Georgia-Pacific LLC, 8.88%, 05/15/31 | | | 525 | | | | 816,009 | |
International Paper Co.: | | | | | | | | |
3.65%, 06/15/24 | | | 500 | | | | 525,083 | |
5.00%, 09/15/35 | | | 250 | | | | 294,216 | |
7.30%, 11/15/39 | | | 250 | | | | 346,374 | |
4.80%, 06/15/44 | | | 250 | | | | 274,760 | |
5.15%, 05/15/46 | | | 1,000 | | | | 1,150,759 | |
4.40%, 08/15/47 | | | 500 | | | | 535,526 | |
4.35%, 08/15/48(a) | | | 750 | | | | 798,559 | |
WestRock MWV LLC, 8.20%, 01/15/30 | | | 100 | | | | 137,962 | |
| | | | | | | | |
| | | | | | | 5,974,873 | |
|
| Personal Products — 0.1% | |
Colgate-Palmolive Co.: | | | | | | | | |
3.25%, 03/15/24(a) | | | 250 | | | | 264,060 | |
3.70%, 08/01/47 | | | 750 | | | | 862,237 | |
Estee Lauder Cos., Inc.: | | | | | | | | |
2.00%, 12/01/24 | | | 325 | | | | 325,872 | |
3.15%, 03/15/27(a) | | | 1,000 | | | | 1,056,239 | |
2.38%, 12/01/29 | | | 130 | | | | 129,964 | |
4.15%, 03/15/47(a) | | | 250 | | | | 291,154 | |
3.13%, 12/01/49 | | | 185 | | | | 185,134 | |
Procter & Gamble Co.: | | | | | | | | |
2.30%, 02/06/22 | | | 250 | | | | 253,386 | |
3.10%, 08/15/23 | | | 500 | | | | 522,341 | |
2.85%, 08/11/27(a) | | | 500 | | | | 530,198 | |
3.50%, 10/25/47(a) | | | 1,000 | | | | 1,128,440 | |
Unilever Capital Corp.: | | | | | | | | |
4.25%, 02/10/21(a) | | | 200 | | | | 205,364 | |
1.38%, 07/28/21 | | | 3,000 | | | | 2,981,555 | |
3.13%, 03/22/23(a) | | | 2,000 | | | | 2,067,836 | |
3.10%, 07/30/25(a) | | | 250 | | | | 261,919 | |
2.00%, 07/28/26(a) | | | 750 | | | | 743,381 | |
2.13%, 09/06/29 | | | 1,000 | | | | 971,272 | |
| | | | | | | | |
| | | | | | | 12,780,352 | |
|
| Pharmaceuticals — 1.6% | |
Abbott Laboratories: | | | | | | | | |
2.55%, 03/15/22 | | | 1,000 | | | | 1,016,403 | |
3.88%, 09/15/25 | | | 45 | | | | 49,018 | |
3.75%, 11/30/26(a) | | | 1,417 | | | | 1,548,287 | |
4.75%, 11/30/36 | | | 2,500 | | | | 3,135,370 | |
5.30%, 05/27/40 | | | 500 | | | | 657,442 | |
4.75%, 04/15/43(a) | | | 250 | | | | 314,919 | |
4.90%, 11/30/46(a) | | | 1,000 | | | | 1,314,259 | |
AbbVie, Inc.: | | | | | | | | |
2.30%, 05/14/21 | | | 750 | | | | 752,763 | |
2.15%, 11/19/21(b) | | | 700 | | | | 701,014 | |
2.90%, 11/06/22 | | | 1,250 | | | | 1,275,773 | |
2.30%, 11/21/22(b) | | | 1,400 | | | | 1,407,076 | |
2.85%, 05/14/23(a) | | | 1,500 | | | | 1,529,943 | |
| | | | | | | | |
| Security | | Par
(000) | | | Value | |
|
| Pharmaceuticals (continued) | |
3.75%, 11/14/23 | | $ | 3,000 | | | $ | 3,157,864 | |
2.60%, 11/21/24(b) | | | 1,850 | | | | 1,864,970 | |
3.60%, 05/14/25(a) | | | 1,500 | | | | 1,584,712 | |
3.20%, 05/14/26(a) | | | 1,435 | | | | 1,487,078 | |
2.95%, 11/21/26(b) | | | 2,000 | | | | 2,036,328 | |
3.20%, 11/21/29(b) | | | 2,600 | | | | 2,645,122 | |
4.50%, 05/14/35(a) | | | 450 | | | | 507,533 | |
4.30%, 05/14/36 | | | 200 | | | | 220,165 | |
4.05%, 11/21/39(b) | | | 1,895 | | | | 1,991,753 | |
4.40%, 11/06/42 | | | 1,400 | | | | 1,504,782 | |
4.70%, 05/14/45 | | | 1,000 | | | | 1,117,469 | |
4.45%, 05/14/46(a) | | | 1,250 | | | | 1,338,859 | |
4.88%, 11/14/48 | | | 1,000 | | | | 1,155,336 | |
4.25%, 11/21/49(a)(b) | | | 3,445 | | | | 3,657,965 | |
Allergan Finance LLC, 3.25%, 10/01/22 | | | 3,150 | | | | 3,219,769 | |
Allergan Funding SCS: | | | | | | | | |
3.45%, 03/15/22 | | | 1,155 | | | | 1,181,524 | |
3.80%, 03/15/25 | | | 750 | | | | 788,181 | |
4.55%, 03/15/35(a) | | | 630 | | | | 688,727 | |
4.85%, 06/15/44(a) | | | 1,250 | | | | 1,362,352 | |
4.75%, 03/15/45 | | | 668 | | | | 727,528 | |
AmerisourceBergen Corp.: | | | | | | | | |
3.45%, 12/15/27 | | | 750 | | | | 783,888 | |
4.25%, 03/01/45 | | | 250 | | | | 257,129 | |
4.30%, 12/15/47 | | | 500 | | | | 519,324 | |
AstraZeneca PLC: | | | | | | | | |
2.38%, 06/12/22 | | | 500 | | | | 505,799 | |
3.38%, 11/16/25(a) | | | 1,700 | | | | 1,806,849 | |
3.13%, 06/12/27(a) | | | 500 | | | | 521,546 | |
4.00%, 01/17/29 | | | 1,500 | | | | 1,666,309 | |
6.45%, 09/15/37 | | | 100 | | | | 141,047 | |
4.38%, 11/16/45(a) | | | 950 | | | | 1,107,903 | |
4.38%, 08/17/48(a) | | | 1,150 | | | | 1,343,966 | |
Bristol-Myers Squibb Co.: | | | | | | | | |
2.00%, 08/01/22(a) | | | 250 | | | | 251,644 | |
3.25%, 08/15/22(b) | | | 150 | | | | 154,999 | |
3.55%, 08/15/22(b) | | | 750 | | | | 779,478 | |
4.00%, 08/15/23(b) | | | 750 | | | | 799,182 | |
3.88%, 08/15/25(b) | | | 500 | | | | 540,512 | |
3.20%, 06/15/26(b) | | | 5,000 | | | | 5,253,095 | |
3.45%, 11/15/27(b) | | | 1,000 | | | | 1,070,272 | |
3.90%, 02/20/28(b) | | | 1,000 | | | | 1,102,381 | |
3.40%, 07/26/29(a)(b) | | | 1,500 | | | | 1,605,335 | |
5.25%, 08/15/43(b) | | | 145 | | | | 188,161 | |
4.50%, 03/01/44(a) | | | 250 | | | | 301,060 | |
5.00%, 08/15/45(b) | | | 750 | | | | 962,093 | |
4.35%, 11/15/47(b) | | | 500 | | | | 596,656 | |
4.55%, 02/20/48(b) | | | 1,000 | | | | 1,225,316 | |
4.25%, 10/26/49(a)(b) | | | 2,500 | | | | 2,968,188 | |
Cardinal Health, Inc.: | | | | | | | | |
2.62%, 06/15/22 | | | 1,000 | | | | 1,010,240 | |
3.50%, 11/15/24 | | | 250 | | | | 261,201 | |
3.41%, 06/15/27 | | | 2,000 | | | | 2,045,784 | |
4.60%, 03/15/43 | | | 50 | | | | 50,186 | |
4.90%, 09/15/45 | | | 250 | | | | 260,880 | |
4.37%, 06/15/47 | | | 500 | | | | 496,795 | |
CVS Health Corp.: | | | | | | | | |
3.35%, 03/09/21 | | | 797 | | | | 810,251 | |
2.13%, 06/01/21(a) | | | 250 | | | | 250,432 | |
3.50%, 07/20/22 | | | 500 | | | | 516,216 | |
3.70%, 03/09/23 | | | 4,000 | | | | 4,169,344 | |
4.00%, 12/05/23 | | | 500 | | | | 529,152 | |
2.63%, 08/15/24(a) | | | 1,225 | | | | 1,235,450 | |
4.10%, 03/25/25(a) | | | 1,500 | | | | 1,610,496 | |
| | |
| 46 | | 2019 BLACKROCK ANNUAL REPORTTO SHAREHOLDERS |
| | |
Schedule of Investments (continued) December 31, 2019 | | U.S. Total Bond Index Master Portfolio (Percentages shown are based on Net Assets) |
| | | | | | | | |
| Security | | Par
(000) | | | Value | |
|
| Pharmaceuticals (continued) | |
3.88%, 07/20/25 | | $ | 943 | | | $ | 1,004,395 | |
2.88%, 06/01/26(a) | | | 750 | | | | 760,999 | |
4.30%, 03/25/28 | | | 4,500 | | | | 4,915,986 | |
4.88%, 07/20/35(a) | | | 1,000 | | | | 1,150,209 | |
4.78%, 03/25/38(a) | | | 2,500 | | | | 2,842,173 | |
5.13%, 07/20/45(a) | | | 1,250 | | | | 1,482,894 | |
5.05%, 03/25/48 | | | 4,750 | | | | 5,628,875 | |
Eli Lilly & Co.: | | | | | | | | |
2.75%, 06/01/25 | | | 45 | | | | 46,413 | |
3.10%, 05/15/27(a) | | | 750 | | | | 786,283 | |
3.38%, 03/15/29 | | | 1,000 | | | | 1,077,118 | |
3.95%, 03/15/49 | | | 1,000 | | | | 1,158,377 | |
4.15%, 03/15/59 | | | 500 | | | | 590,572 | |
GlaxoSmithKline Capital PLC: | | | | | | | | |
2.85%, 05/08/22 | | | 3,650 | | | | 3,730,441 | |
2.88%, 06/01/22 | | | 500 | | | | 510,913 | |
3.38%, 06/01/29(a) | | | 1,000 | | | | 1,073,349 | |
GlaxoSmithKline Capital, Inc.: | | | | | | | | |
2.80%, 03/18/23(a) | | | 1,500 | | | | 1,537,246 | |
3.38%, 05/15/23 | | | 1,000 | | | | 1,042,985 | |
3.63%, 05/15/25(a) | | | 1,500 | | | | 1,610,531 | |
3.88%, 05/15/28 | | | 1,000 | | | | 1,104,590 | |
5.38%, 04/15/34 | | | 250 | | | | 321,943 | |
6.38%, 05/15/38(a) | | | 1,100 | | | | 1,579,549 | |
Johnson & Johnson: | | | | | | | | |
1.65%, 03/01/21 | | | 500 | | | | 499,806 | |
2.45%, 12/05/21 | | | 450 | | | | 455,108 | |
2.25%, 03/03/22 | | | 250 | | | | 252,763 | |
2.05%, 03/01/23 | | | 750 | | | | 754,585 | |
2.45%, 03/01/26(a) | | | 370 | | | | 375,763 | |
4.38%, 12/05/33 | | | 250 | | | | 296,191 | |
3.55%, 03/01/36(a) | | | 750 | | | | 820,807 | |
3.63%, 03/03/37 | | | 500 | | | | 552,330 | |
4.50%, 09/01/40 | | | 100 | | | | 122,156 | |
4.50%, 12/05/43 | | | 750 | | | | 929,658 | |
3.70%, 03/01/46 | | | 500 | | | | 565,193 | |
3.75%, 03/03/47(a) | | | 2,000 | | | | 2,287,371 | |
3.50%, 01/15/48(a) | | | 750 | | | | 821,956 | |
Mead Johnson Nutrition Co., 4.60%, 06/01/44(a) | | | 250 | | | | 299,431 | |
Merck & Co., Inc.: | | | | | | | | |
3.88%, 01/15/21 | | | 250 | | | | 254,715 | |
2.35%, 02/10/22 | | | 1,500 | | | | 1,514,989 | |
2.75%, 02/10/25 | | | 3,570 | | | | 3,704,248 | |
3.90%, 03/07/39(a) | | | 500 | | | | 572,010 | |
4.15%, 05/18/43(a) | | | 250 | | | | 298,297 | |
3.70%, 02/10/45 | | | 1,900 | | | | 2,101,923 | |
4.00%, 03/07/49 | | | 1,000 | | | | 1,172,896 | |
Mylan NV: | | | | | | | | |
3.15%, 06/15/21 | | | 1,000 | | | | 1,013,143 | |
3.95%, 06/15/26 | | | 250 | | | | 260,631 | |
5.25%, 06/15/46 | | | 500 | | | | 562,380 | |
Mylan, Inc.: | | | | | | | | |
4.20%, 11/29/23(a) | | | 250 | | | | 264,725 | |
4.55%, 04/15/28(a) | | | 800 | | | | 861,254 | |
5.20%, 04/15/48 | | | 550 | | | | 615,801 | |
Novartis Capital Corp.: | | | | | | | | |
3.40%, 05/06/24 | | | 650 | | | | 688,383 | |
3.00%, 11/20/25 | | | 1,100 | | | | 1,156,402 | |
3.10%, 05/17/27(a) | | | 2,500 | | | | 2,647,307 | |
4.40%, 05/06/44 | | | 1,250 | | | | 1,523,714 | |
Perrigo Finance Unlimited Co.: | | | | | | | | |
3.90%, 12/15/24 | | | 250 | | | | 256,966 | |
4.38%, 03/15/26 | | | 250 | | | | 258,102 | |
| | | | | | | | |
| Security | | Par
(000) | | | Value | |
|
| Pharmaceuticals (continued) | |
Pfizer, Inc.: | | | | | | | | |
1.95%, 06/03/21 | | $ | 500 | | | $ | 502,323 | |
2.20%, 12/15/21 | | | 3,000 | | | | 3,029,401 | |
5.80%, 08/12/23 | | | 500 | | | | 565,111 | |
3.40%, 05/15/24(a) | | | 1,000 | | | | 1,058,070 | |
2.75%, 06/03/26 | | | 115 | | | | 118,982 | |
3.00%, 12/15/26(a) | | | 1,750 | | | | 1,839,407 | |
3.45%, 03/15/29(a) | | | 1,000 | | | | 1,077,680 | |
4.00%, 12/15/36 | | | 500 | | | | 567,075 | |
3.90%, 03/15/39 | | | 500 | | | | 564,105 | |
7.20%, 03/15/39(a) | | | 2,250 | | | | 3,539,533 | |
4.30%, 06/15/43 | | | 500 | | | | 587,204 | |
4.40%, 05/15/44 | | | 500 | | | | 597,150 | |
4.13%, 12/15/46 | | | 500 | | | | 581,404 | |
4.20%, 09/15/48 | | | 500 | | | | 586,708 | |
4.00%, 03/15/49(a) | | | 500 | | | | 575,590 | |
Quest Diagnostics, Inc., 2.95%, 06/30/30 | | | 425 | | | | 425,082 | |
Sanofi, 3.63%, 06/19/28(a) | | | 2,000 | | | | 2,203,363 | |
Shire Acquisitions Investments Ireland DAC: | | | | | | | | |
2.88%, 09/23/23 | | | 500 | | | | 509,509 | |
3.20%, 09/23/26 | | | 900 | | | | 927,535 | |
Takeda Pharmaceutical Co. Ltd.: | | | | | | | | |
4.00%, 11/26/21 | | | 3,000 | | | | 3,102,449 | |
4.40%, 11/26/23 | | | 1,000 | | | | 1,073,921 | |
5.00%, 11/26/28(a) | | | 1,000 | | | | 1,165,091 | |
Wyeth LLC: | | | | | | | | |
6.50%, 02/01/34 | | | 500 | | | | 703,789 | |
5.95%, 04/01/37 | | | 250 | | | | 341,496 | |
Zoetis, Inc.: | | | | | | | | |
3.25%, 02/01/23(a) | | | 1,000 | | | | 1,029,504 | |
3.90%, 08/20/28 | | | 1,000 | | | | 1,085,139 | |
4.70%, 02/01/43(a) | | | 400 | | | | 477,009 | |
4.45%, 08/20/48(a) | | | 250 | | | | 290,880 | |
| | | | | | | | |
| | | | | | | 177,480,198 | |
|
| Professional Services — 0.0% | |
IHS Markit Ltd.: | | | | | | | | |
4.75%, 08/01/28 | | | 300 | | | | 334,129 | |
4.25%, 05/01/29 | | | 1,000 | | | | 1,077,620 | |
| | | | | | | | |
| | | | | | | 1,411,749 | |
|
| Real Estate — 0.1% | |
CBRE Services, Inc.(a): | | | | | | | | |
5.25%, 03/15/25 | | | 250 | | | | 281,369 | |
4.88%, 03/01/26 | | | 250 | | | | 278,743 | |
Equifax, Inc.: | | | | | | | | |
2.60%, 12/01/24 | | | 1,000 | | | | 1,006,286 | |
3.25%, 06/01/26(a) | | | 250 | | | | 251,259 | |
Equinix, Inc.: | | | | | | | | |
2.63%, 11/18/24 | | | 335 | | | | 335,623 | |
2.90%, 11/18/26 | | | 135 | | | | 135,236 | |
5.38%, 05/15/27 | | | 1,100 | | | | 1,194,633 | |
3.20%, 11/18/29 | | | 455 | | | | 456,693 | |
Highwoods Realty LP: | | | | | | | | |
4.13%, 03/15/28 | | | 250 | | | | 267,744 | |
3.05%, 02/15/30 | | | 500 | | | | 493,148 | |
Prologis LP: | | | | | | | | |
3.75%, 11/01/25 | | | 45 | | | | 48,722 | |
4.38%, 09/15/48 | | | 100 | | | | 120,446 | |
Vornado Realty LP, 3.50%, 01/15/25(a) | | | 250 | | | | 260,115 | |
| | | | | | | | |
| | | | | | | 5,130,017 | |
|
| Road & Rail — 0.4% | |
Burlington Northern Santa Fe LLC: | | | | | | | | |
3.45%, 09/15/21 | | | 2,000 | | | | 2,045,590 | |
3.75%, 04/01/24 | | | 50 | | | | 53,332 | |
| | | | |
| SCHEDULE OF INVESTMENTS | | | 47 | |
| | |
Schedule of Investments (continued) December 31, 2019 | | U.S. Total Bond Index Master Portfolio (Percentages shown are based on Net Assets) |
| | | | | | | | |
| Security | | Par
(000) | | | Value | |
|
| Road & Rail (continued) | |
3.65%, 09/01/25 | | $ | 750 | | | $ | 808,419 | |
7.00%, 12/15/25 | | | 250 | | | | 316,052 | |
3.25%, 06/15/27 | | | 1,750 | | | | 1,868,200 | |
5.40%, 06/01/41 | | | 50 | | | | 64,698 | |
4.40%, 03/15/42 | | | 150 | | | | 173,814 | |
4.38%, 09/01/42 | | | 250 | | | | 290,619 | |
4.45%, 03/15/43 | | | 200 | | | | 235,000 | |
5.15%, 09/01/43(a) | | | 250 | | | | 319,155 | |
4.90%, 04/01/44 | | | 500 | | | | 623,529 | |
4.55%, 09/01/44 | | | 250 | | | | 298,139 | |
4.15%, 04/01/45 | | | 500 | | | | 567,700 | |
3.90%, 08/01/46(a) | | | 2,000 | | | | 2,196,873 | |
4.13%, 06/15/47 | | | 250 | | | | 284,101 | |
4.05%, 06/15/48 | | | 1,000 | | | | 1,134,147 | |
4.15%, 12/15/48(a) | | | 500 | | | | 576,173 | |
3.55%, 02/15/50 | | | 125 | | | | 131,721 | |
Canadian National Railway Co.: | | | | | | | | |
2.85%, 12/15/21(a) | | | 1,000 | | | | 1,014,666 | |
2.95%, 11/21/24 | | | 305 | | | | 315,010 | |
2.75%, 03/01/26 | | | 560 | | | | 573,732 | |
3.50%, 11/15/42 | | | 100 | | | | 104,424 | |
3.65%, 02/03/48 | | | 1,500 | | | | 1,656,244 | |
Canadian Pacific Railway Co.: | | | | | | | | |
4.45%, 03/15/23 | | | 500 | | | | 532,062 | |
2.90%, 02/01/25 | | | 1,000 | | | | 1,027,133 | |
7.13%, 10/15/31 | | | 250 | | | | 346,815 | |
4.80%, 09/15/35 | | | 250 | | | | 297,837 | |
5.75%, 01/15/42 | | | 25 | | | | 33,215 | |
4.80%, 08/01/45(a) | | | 1,110 | | | | 1,377,573 | |
CSX Corp.: | | | | | | | | |
3.35%, 11/01/25(a) | | | 250 | | | | 264,910 | |
3.80%, 03/01/28(a) | | | 3,500 | | | | 3,819,803 | |
2.40%, 02/15/30 | | | 500 | | | | 489,231 | |
4.75%, 05/30/42 | | | 100 | | | | 117,893 | |
4.30%, 03/01/48(a) | | | 750 | | | | 852,058 | |
4.50%, 03/15/49 | | | 1,000 | | | | 1,172,041 | |
3.35%, 09/15/49(a) | | | 215 | | | | 212,065 | |
3.95%, 05/01/50(a) | | | 450 | | | | 486,477 | |
4.50%, 08/01/54 | | | 250 | | | | 288,210 | |
4.25%, 11/01/66 | | | 750 | | | | 802,358 | |
Kansas City Southern: | | | | | | | | |
3.13%, 06/01/26 | | | 250 | | | | 255,256 | |
2.88%, 11/15/29 | | | 120 | | | | 119,719 | |
4.70%, 05/01/48 | | | 500 | | | | 586,552 | |
4.20%, 11/15/69 | | | 105 | | | | 107,357 | |
Norfolk Southern Corp.: | | | | | | | | |
3.00%, 04/01/22 | | | 1,750 | | | | 1,786,432 | |
3.85%, 01/15/24 | | | 1,000 | | | | 1,061,324 | |
3.15%, 06/01/27 | | | 880 | | | | 919,935 | |
2.55%, 11/01/29 | | | 165 | | | | 164,578 | |
3.95%, 10/01/42 | | | 100 | | | | 106,777 | |
4.45%, 06/15/45(a) | | | 250 | | | | 288,575 | |
3.94%, 11/01/47 | | | 225 | | | | 242,507 | |
4.15%, 02/28/48 | | | 250 | | | | 282,646 | |
4.10%, 05/15/49 | | | 1,000 | | | | 1,105,224 | |
3.40%, 11/01/49 | | | 335 | | | | 332,826 | |
4.05%, 08/15/52 | | | 1,000 | | | | 1,100,928 | |
Ryder System, Inc.: | | | | | | | | |
3.40%, 03/01/23(a) | | | 500 | | | | 515,699 | |
2.50%, 09/01/24 | | | 285 | | | | 286,345 | |
2.90%, 12/01/26 | | | 1,160 | | | | 1,167,949 | |
Union Pacific Corp.: | | | | | | | | |
4.16%, 07/15/22 | | | 100 | | | | 105,102 | |
3.65%, 02/15/24(a) | | | 1,000 | | | | 1,057,514 | |
| | | | | | | | |
| Security | | Par
(000) | | | Value | |
|
| Road & Rail (continued) | |
3.25%, 08/15/25(a) | | $ | 250 | | | $ | 263,581 | |
2.75%, 03/01/26 | | | 1,000 | | | | 1,024,900 | |
3.95%, 09/10/28 | | | 1,000 | | | | 1,105,011 | |
3.60%, 09/15/37 | | | 1,250 | | | | 1,304,154 | |
4.38%, 09/10/38 | | | 2,750 | | | | 3,153,077 | |
4.30%, 06/15/42 | | | 50 | | | | 56,190 | |
4.05%, 11/15/45 | | | 250 | | | | 272,141 | |
4.05%, 03/01/46 | | | 140 | | | | 152,633 | |
4.50%, 09/10/48(a) | | | 500 | | | | 590,622 | |
3.80%, 10/01/51 | | | 250 | | | | 265,596 | |
3.95%, 08/15/59(a) | | | 780 | | | | 818,007 | |
3.84%, 03/20/60(b) | | | 450 | | | | 456,581 | |
| | | | | | | | |
| | | | | | | 48,826,757 | |
|
| Semiconductors & Semiconductor Equipment — 0.4% | |
Altera Corp., 4.10%, 11/15/23(a) | | | 250 | | | | 269,466 | |
Analog Devices, Inc.: | | | | | | | | |
2.95%, 01/12/21 | | | 1,000 | | | | 1,008,364 | |
2.88%, 06/01/23 | | | 1,000 | | | | 1,019,038 | |
3.50%, 12/05/26(a) | | | 750 | | | | 786,928 | |
Applied Materials, Inc.: | | | | | | | | |
4.30%, 06/15/21 | | | 500 | | | | 517,412 | |
3.90%, 10/01/25(a) | | | 160 | | | | 174,440 | |
3.30%, 04/01/27 | | | 1,000 | | | | 1,060,542 | |
5.85%, 06/15/41 | | | 300 | | | | 407,616 | |
4.35%, 04/01/47 | | | 500 | | | | 604,259 | |
Broadcom Corp./Broadcom Cayman Finance Ltd.: | | | | | | | | |
3.00%, 01/15/22 | | | 1,500 | | | | 1,522,191 | |
2.65%, 01/15/23(a) | | | 1,500 | | | | 1,508,546 | |
3.63%, 01/15/24(a) | | | 250 | | | | 259,106 | |
3.88%, 01/15/27 | | | 3,750 | | | | 3,895,342 | |
3.50%, 01/15/28 | | | 500 | | | | 503,144 | |
Broadcom, Inc.(b): | | | | | | | | |
3.13%, 10/15/22(a) | | | 1,000 | | | | 1,018,797 | |
3.63%, 10/15/24 | | | 2,000 | | | | 2,079,778 | |
4.25%, 04/15/26 | | | 1,000 | | | | 1,062,172 | |
4.75%, 04/15/29 | | | 1,000 | | | | 1,093,483 | |
Intel Corp.: | | | | | | | | |
1.70%, 05/19/21 | | | 1,000 | | | | 999,410 | |
2.70%, 12/15/22 | | | 2,500 | | | | 2,562,001 | |
2.88%, 05/11/24 | | | 1,000 | | | | 1,038,740 | |
3.70%, 07/29/25 | | | 1,000 | | | | 1,081,717 | |
2.45%, 11/15/29 | | | 500 | | | | 498,637 | |
4.10%, 05/19/46 | | | 2,500 | | | | 2,886,292 | |
4.10%, 05/11/47 | | | 250 | | | | 290,520 | |
3.73%, 12/08/47 | | | 1,399 | | | | 1,540,265 | |
KLA Corp.: | | | | | | | | |
4.65%, 11/01/24 | | | 305 | | | | 334,784 | |
4.10%, 03/15/29 | | | 1,000 | | | | 1,095,656 | |
Lam Research Corp.: | | | | | | | | |
3.80%, 03/15/25(a) | | | 230 | | | | 245,574 | |
4.88%, 03/15/49 | | | 1,000 | | | | 1,252,305 | |
Maxim Integrated Products, Inc., 3.38%, 03/15/23(a) | | | 100 | | | | 102,293 | |
Microchip Technology, Inc., 4.33%, 06/01/23 | | | 2,000 | | | | 2,112,898 | |
Micron Technology, Inc.: | | | | | | | | |
4.64%, 02/06/24 | | | 300 | | | | 325,588 | |
4.98%, 02/06/26(a) | | | 250 | | | | 277,580 | |
5.33%, 02/06/29 | | | 250 | | | | 286,797 | |
4.66%, 02/15/30 | | | 750 | | | | 826,345 | |
NVIDIA Corp.: | | | | | | | | |
2.20%, 09/16/21 | | | 300 | | | | 301,512 | |
3.20%, 09/16/26 | | | 1,000 | | | | 1,050,157 | |
NXP BV/NXP Funding LLC/NXP USA, Inc.(b): | | | | | | | | |
3.88%, 06/18/26 | | | 320 | | | | 339,465 | |
4.30%, 06/18/29 | | | 1,000 | | | | 1,081,384 | |
| | |
| 48 | | 2019 BLACKROCK ANNUAL REPORTTO SHAREHOLDERS |
| | |
Schedule of Investments (continued) December 31, 2019 | | U.S. Total Bond Index Master Portfolio (Percentages shown are based on Net Assets) |
| | | | | | | | |
| Security | | Par
(000) | | | Value | |
|
| Semiconductors & Semiconductor Equipment (continued) | |
QUALCOMM, Inc.: | | | | | | | | |
3.00%, 05/20/22 | | $ | 1,500 | | | $ | 1,537,906 | |
2.60%, 01/30/23(a) | | | 1,140 | | | | 1,160,462 | |
3.45%, 05/20/25(a) | | | 250 | | | | 264,422 | |
3.25%, 05/20/27 | | | 500 | | | | 526,275 | |
4.65%, 05/20/35 | | | 250 | | | | 297,218 | |
4.80%, 05/20/45(a) | | | 750 | | | | 918,965 | |
4.30%, 05/20/47 | | | 1,500 | | | | 1,720,916 | |
Seagate HDD Cayman: | | | | | | | | |
4.75%, 06/01/23 | | | 168 | | | | 178,637 | |
4.88%, 06/01/27 | | | 500 | | | | 531,369 | |
5.75%, 12/01/34 | | | 650 | | | | 680,998 | |
Texas Instruments, Inc.: | | | | | | | | |
2.25%, 09/04/29 | | | 680 | | | | 671,438 | |
4.15%, 05/15/48 | | | 1,000 | | | | 1,189,299 | |
Xilinx, Inc., 3.00%, 03/15/21 | | | 75 | | | | 75,952 | |
| | | | | | | | |
| | | | | | | 49,074,401 | |
|
| Software — 0.6% | |
Activision Blizzard, Inc., 3.40%, 06/15/27 | | | 1,000 | | | | 1,043,843 | |
Autodesk, Inc., 3.50%, 06/15/27(a) | | | 2,000 | | | | 2,096,945 | |
CA, Inc., 4.50%, 08/15/23 | | | 170 | | | | 178,762 | |
Microsoft Corp.: | | | | | | | | |
1.55%, 08/08/21 | | | 1,000 | | | | 998,677 | |
2.40%, 02/06/22 | | | 1,000 | | | | 1,014,136 | |
2.38%, 02/12/22 | | | 1,000 | | | | 1,013,608 | |
2.65%, 11/03/22 | | | 500 | | | | 512,078 | |
2.00%, 08/08/23(a) | | | 2,000 | | | | 2,014,289 | |
3.63%, 12/15/23 | | | 1,000 | | | | 1,064,589 | |
2.88%, 02/06/24 | | | 865 | | | | 897,576 | |
3.13%, 11/03/25 | | | 500 | | | | 528,554 | |
2.40%, 08/08/26 | | | 1,485 | | | | 1,502,590 | |
3.30%, 02/06/27 | | | 5,500 | | | | 5,878,987 | |
3.50%, 02/12/35 | | | 1,165 | | | | 1,283,684 | |
4.20%, 11/03/35 | | | 250 | | | | 297,440 | |
3.45%, 08/08/36 | | | 750 | | | | 822,010 | |
4.10%, 02/06/37(a) | | | 1,250 | | | | 1,478,756 | |
4.50%, 10/01/40 | | | 500 | | | | 620,016 | |
5.30%, 02/08/41 | | | 100 | | | | 136,735 | |
3.75%, 05/01/43 | | | 150 | | | | 168,574 | |
3.75%, 02/12/45 | | | 500 | | | | 568,619 | |
4.45%, 11/03/45 | | | 1,500 | | | | 1,878,293 | |
3.70%, 08/08/46 | | | 2,500 | | | | 2,826,884 | |
4.00%, 02/12/55 | | | 1,750 | | | | 2,075,088 | |
4.75%, 11/03/55(a) | | | 250 | | | | 334,006 | |
3.95%, 08/08/56 | | | 250 | | | | 296,290 | |
4.50%, 02/06/57(a) | | | 1,500 | | | | 1,945,662 | |
Series 30Y, 4.25%, 02/06/47 | | | 1,500 | | | | 1,840,590 | |
Oracle Corp.: | | | | | | | | |
2.80%, 07/08/21 | | | 1,000 | | | | 1,015,288 | |
1.90%, 09/15/21 | | | 2,000 | | | | 2,004,190 | |
2.50%, 10/15/22 | | | 3,250 | | | | 3,310,295 | |
2.63%, 02/15/23(a) | | | 2,000 | | | | 2,042,503 | |
2.40%, 09/15/23(a) | | | 1,000 | | | | 1,016,700 | |
2.95%, 11/15/24 | | | 500 | | | | 519,754 | |
2.95%, 05/15/25 | | | 500 | | | | 520,525 | |
2.65%, 07/15/26 | | | 745 | | | | 762,124 | |
3.25%, 11/15/27 | | | 2,750 | | | | 2,914,655 | |
3.25%, 05/15/30(a) | | | 950 | | | | 1,012,958 | |
4.30%, 07/08/34(a) | | | 250 | | | | 292,494 | |
3.90%, 05/15/35 | | | 500 | | | | 557,686 | |
3.85%, 07/15/36 | | | 750 | | | | 822,349 | |
3.80%, 11/15/37 | | | 750 | | | | 819,718 | |
6.13%, 07/08/39 | | | 500 | | | | 705,344 | |
| | | | | | | | |
| Security | | Par
(000) | | | Value | |
|
| Software (continued) | |
5.38%, 07/15/40(a) | | $ | 400 | | | $ | 519,937 | |
4.50%, 07/08/44 | | | 500 | | | | 594,418 | |
4.13%, 05/15/45 | | | 2,250 | | | | 2,542,517 | |
4.00%, 07/15/46 | | | 1,250 | | | | 1,391,458 | |
4.00%, 11/15/47(a) | | | 1,500 | | | | 1,678,154 | |
4.38%, 05/15/55 | | | 250 | | | | 296,856 | |
salesforce.com, Inc., 3.25%, 04/11/23(a) | | | 2,500 | | | | 2,600,562 | |
| | | | | | | | |
| | | | | | | 63,257,766 | |
|
| Specialty Retail — 0.3% | |
Advance Auto Parts, Inc., 4.50%, 12/01/23 | | | 250 | | | | 267,974 | |
AutoZone, Inc.: | | | | | | | | |
3.70%, 04/15/22 | | | 50 | | | | 51,595 | |
3.13%, 07/15/23(a) | | | 250 | | | | 257,348 | |
3.25%, 04/15/25(a) | | | 165 | | | | 172,048 | |
3.75%, 04/18/29(a) | | | 1,000 | | | | 1,059,237 | |
Costco Wholesale Corp.: | | | | | | | | |
2.25%, 02/15/22 | | | 85 | | | | 85,911 | |
3.00%, 05/18/27 | | | 1,500 | | | | 1,582,434 | |
Dollar Tree, Inc.: | | | | | | | | |
3.70%, 05/15/23 | | | 2,500 | | | | 2,605,121 | |
4.20%, 05/15/28(a) | | | 1,000 | | | | 1,072,744 | |
Home Depot, Inc.: | | | | | | | | |
2.00%, 04/01/21 | | | 500 | | | | 501,211 | |
4.40%, 04/01/21 | | | 150 | | | | 154,129 | |
2.63%, 06/01/22 | | | 2,750 | | | | 2,805,863 | |
3.35%, 09/15/25 | | | 2,500 | | | | 2,671,509 | |
2.13%, 09/15/26(a) | | | 500 | | | | 499,769 | |
2.80%, 09/14/27 | | | 500 | | | | 520,121 | |
3.90%, 12/06/28 | | | 440 | | | | 494,157 | |
5.88%, 12/16/36 | | | 100 | | | | 138,048 | |
5.40%, 09/15/40(a) | | | 500 | | | | 663,463 | |
4.20%, 04/01/43 | | | 750 | | | | 870,472 | |
4.40%, 03/15/45(a) | | | 2,250 | | | | 2,689,397 | |
4.25%, 04/01/46 | | | 1,000 | | | | 1,179,249 | |
3.90%, 06/15/47 | | | 500 | | | | 565,864 | |
4.50%, 12/06/48 | | | 1,000 | | | | 1,235,330 | |
3.50%, 09/15/56 | | | 140 | | | | 145,813 | |
Lowe’s Cos., Inc.: | | | | | | | | |
3.80%, 11/15/21 | | | 250 | | | | 257,516 | |
3.12%, 04/15/22(a) | | | 1,600 | | | | 1,639,047 | |
3.38%, 09/15/25 | | | 500 | | | | 528,257 | |
2.50%, 04/15/26 | | | 955 | | | | 961,447 | |
3.65%, 04/05/29(a) | | | 500 | | | | 534,761 | |
4.25%, 09/15/44 | | | 250 | | | | 269,624 | |
4.38%, 09/15/45 | | | 1,000 | | | | 1,116,247 | |
3.70%, 04/15/46 | | | 250 | | | | 255,029 | |
4.05%, 05/03/47 | | | 1,000 | | | | 1,080,339 | |
4.55%, 04/05/49 | | | 500 | | | | 590,339 | |
Macy’s Retail Holdings, Inc.: | | | | | | | | |
3.88%, 01/15/22 | | | 168 | | | | 171,220 | |
2.88%, 02/15/23(a) | | | 1,000 | | | | 996,915 | |
3.63%, 06/01/24 | | | 250 | | | | 252,575 | |
4.50%, 12/15/34 | | | 60 | | | | 57,104 | |
QVC, Inc.: | | | | | | | | |
5.45%, 08/15/34 | | | 200 | | | | 192,017 | |
5.95%, 03/15/43 | | | 350 | | | | 327,919 | |
Tapestry, Inc., 3.00%, 07/15/22 | | | 1,000 | | | | 1,012,838 | |
TJX Cos., Inc., 2.25%, 09/15/26 | | | 2,500 | | | | 2,512,285 | |
| | | | | | | | |
| | | | | | | 35,044,286 | |
|
| Technology Hardware, Storage & Peripherals — 0.5% | |
Adobe, Inc., 3.25%, 02/01/25 | | | 70 | | | | 73,952 | |
| | | | |
| SCHEDULE OF INVESTMENTS | | | 49 | |
| | |
Schedule of Investments (continued) December 31, 2019 | | U.S. Total Bond Index Master Portfolio (Percentages shown are based on Net Assets) |
| | | | | | | | |
| Security | | Par
(000) | | | Value | |
|
| Technology Hardware, Storage & Peripherals (continued) | |
Apple, Inc.: | | | | | | | | |
2.25%, 02/23/21 | | $ | 500 | | | $ | 502,976 | |
1.55%, 08/04/21(a) | | | 1,000 | | | | 996,249 | |
2.50%, 02/09/22 | | | 1,000 | | | | 1,015,085 | |
1.70%, 09/11/22 | | | 2,500 | | | | 2,498,241 | |
2.10%, 09/12/22(a) | | | 500 | | | | 505,039 | |
2.40%, 01/13/23 | | | 1,000 | | | | 1,016,609 | |
2.85%, 02/23/23 | | | 250 | | | | 257,149 | |
2.40%, 05/03/23 | | | 2,000 | | | | 2,034,127 | |
3.45%, 05/06/24(a) | | | 1,000 | | | | 1,062,037 | |
1.80%, 09/11/24 | | | 3,635 | | | | 3,612,470 | |
2.50%, 02/09/25 | | | 140 | | | | 142,605 | |
3.20%, 05/13/25 | | | 750 | | | | 792,517 | |
3.25%, 02/23/26 | | | 2,660 | | | | 2,817,141 | |
2.45%, 08/04/26 | | | 1,410 | | | | 1,430,136 | |
3.35%, 02/09/27 | | | 2,000 | | | | 2,130,372 | |
3.20%, 05/11/27 | | | 1,000 | | | | 1,055,211 | |
2.90%, 09/12/27 | | | 1,000 | | | | 1,041,141 | |
3.00%, 11/13/27(a) | | | 1,000 | | | | 1,049,148 | |
2.20%, 09/11/29 | | | 1,235 | | | | 1,211,815 | |
4.50%, 02/23/36 | | | 250 | | | | 303,818 | |
3.85%, 05/04/43 | | | 1,250 | | | | 1,401,414 | |
4.45%, 05/06/44 | | | 250 | | | | 305,031 | |
3.45%, 02/09/45 | | | 350 | | | | 368,940 | |
4.38%, 05/13/45 | | | 500 | | | | 607,160 | |
4.65%, 02/23/46 | | | 2,980 | | | | 3,739,163 | |
3.85%, 08/04/46(a) | | | 750 | | | | 845,851 | |
4.25%, 02/09/47 | | | 250 | | | | 299,342 | |
3.75%, 11/13/47 | | | 1,250 | | | | 1,388,203 | |
2.95%, 09/11/49(a) | | | 1,250 | | | | 1,211,989 | |
Dell International LLC/EMC Corp.(b): | | | | | | | | |
4.42%, 06/15/21 | | | 500 | | | | 514,556 | |
5.45%, 06/15/23 | | | 3,000 | | | | 3,254,218 | |
4.00%, 07/15/24 | | | 1,000 | | | | 1,047,724 | |
6.02%, 06/15/26 | | | 3,090 | | | | 3,557,208 | |
5.30%, 10/01/29(a) | | | 1,250 | | | | 1,409,486 | |
8.10%, 07/15/36(a) | | | 500 | | | | 657,469 | |
8.35%, 07/15/46 | | | 850 | | | | 1,171,246 | |
Hewlett Packard Enterprise Co.: | | | | | | | | |
4.40%, 10/15/22 | | | 1,500 | | | | 1,584,944 | |
2.25%, 04/01/23 | | | 1,000 | | | | 998,995 | |
4.90%, 10/15/25 | | | 1,750 | | | | 1,945,264 | |
6.20%, 10/15/35 | | | 500 | | | | 599,833 | |
6.35%, 10/15/45 | | | 250 | | | | 301,033 | |
HP, Inc.: | | | | | | | | |
4.05%, 09/15/22 | | | 1,000 | | | | 1,044,830 | |
6.00%, 09/15/41 | | | 650 | | | | 720,722 | |
NetApp, Inc., 3.38%, 06/15/21 | | | 105 | | | | 106,751 | |
| | | | | | | | |
| | | | | | | 54,629,210 | |
|
| Textiles, Apparel & Luxury Goods — 0.0% | |
NIKE, Inc.: | | | | | | | | |
3.88%, 11/01/45(a) | | | 500 | | | | 568,353 | |
3.38%, 11/01/46 | | | 1,500 | | | | 1,585,180 | |
VF Corp., 3.50%, 09/01/21 | | | 100 | | | | 102,113 | |
| | | | | | | | |
| | | | | | | 2,255,646 | |
|
| Tobacco — 0.3% | |
Altria Group, Inc.: | | | | | | | | |
4.75%, 05/05/21 | | | 1,000 | | | | 1,036,357 | |
2.85%, 08/09/22(a) | | | 1,500 | | | | 1,528,967 | |
4.00%, 01/31/24(a) | | | 250 | | | | 265,279 | |
4.80%, 02/14/29 | | | 4,000 | | | | 4,458,660 | |
5.80%, 02/14/39 | | | 1,000 | | | | 1,176,515 | |
4.50%, 05/02/43 | | | 400 | | | | 408,819 | |
| | | | | | | | |
| Security | | Par
(000) | | | Value | |
|
| Tobacco (continued) | |
5.38%, 01/31/44 | | $ | 820 | | | $ | 926,533 | |
3.88%, 09/16/46 | | | 1,250 | | | | 1,153,988 | |
5.95%, 02/14/49 | | | 1,000 | | | | 1,212,469 | |
BAT Capital Corp.: | | | | | | | | |
2.76%, 08/15/22(a) | | | 3,000 | | | | 3,044,223 | |
3.22%, 08/15/24 | | | 1,250 | | | | 1,278,598 | |
3.56%, 08/15/27(a) | | | 1,000 | | | | 1,021,026 | |
3.46%, 09/06/29(a) | | | 500 | | | | 505,830 | |
4.39%, 08/15/37 | | | 1,250 | | | | 1,265,826 | |
4.54%, 08/15/47 | | | 1,700 | | | | 1,709,729 | |
4.76%, 09/06/49 | | | 750 | | | | 775,465 | |
Philip Morris International, Inc.: | | | | | | | | |
4.13%, 05/17/21 | | | 50 | | �� | | 51,532 | |
2.63%, 03/06/23(a) | | | 250 | | | | 254,160 | |
2.13%, 05/10/23 | | | 1,000 | | | | 1,003,048 | |
3.25%, 11/10/24 | | | 1,000 | | | | 1,050,213 | |
3.38%, 08/11/25(a) | | | 750 | | | | 788,941 | |
2.75%, 02/25/26 | | | 415 | | | | 420,840 | |
3.13%, 08/17/27(a) | | | 1,000 | | | | 1,037,198 | |
6.38%, 05/16/38(a) | | | 2,000 | | | | 2,763,673 | |
4.50%, 03/20/42 | | | 50 | | | | 56,825 | |
3.88%, 08/21/42(a) | | | 350 | | | | 364,610 | |
4.13%, 03/04/43 | | | 450 | | | | 483,368 | |
4.88%, 11/15/43 | | | 250 | | | | 298,956 | |
4.25%, 11/10/44 | | | 365 | | | | 403,587 | |
Reynolds American, Inc.: | | | | | | | | |
4.45%, 06/12/25 | | | 1,000 | | | | 1,076,885 | |
5.70%, 08/15/35 | | | 325 | | | | 377,861 | |
6.15%, 09/15/43 | | | 150 | | | | 176,238 | |
5.85%, 08/15/45(a) | | | 750 | | | | 860,770 | |
| | | | | | | | |
| | | | | | | 33,236,989 | |
|
| Trading Companies & Distributors — 0.0% | |
GATX Corp.: | | | | | | | | |
3.25%, 09/15/26 | | | 750 | | | | 763,562 | |
4.70%, 04/01/29(a) | | | 1,000 | | | | 1,114,937 | |
| | | | | | | | |
| | | | | | | 1,878,499 | |
|
| Water Utilities — 0.0% | |
American Water Capital Corp.: | | | | | | | | |
3.40%, 03/01/25 | | | 250 | | | | 262,187 | |
2.95%, 09/01/27(a) | | | 500 | | | | 511,112 | |
3.75%, 09/01/28 | | | 1,500 | | | | 1,621,382 | |
3.45%, 06/01/29 | | | 500 | | | | 528,937 | |
4.30%, 09/01/45 | | | 250 | | | | 284,403 | |
3.75%, 09/01/47 | | | 500 | | | | 529,509 | |
4.15%, 06/01/49 | | | 500 | | | | 566,416 | |
| | | | | | | | |
| | | | | | | 4,303,946 | |
|
| Wireless Telecommunication Services — 0.2% | |
America Movil SAB de CV: | | | | | | | | |
3.13%, 07/16/22 | | | 3,500 | | | | 3,578,750 | |
3.63%, 04/22/29 | | | 1,400 | | | | 1,479,188 | |
6.13%, 03/30/40(a) | | | 250 | | | | 335,156 | |
4.38%, 07/16/42(a) | | | 850 | | | | 949,078 | |
4.38%, 04/22/49 | | | 1,000 | | | | 1,146,560 | |
Rogers Communications, Inc.: | | | | | | | | |
3.00%, 03/15/23 | | | 650 | | | | 666,183 | |
3.63%, 12/15/25(a) | | | 565 | | | | 602,658 | |
2.90%, 11/15/26(a) | | | 1,000 | | | | 1,019,013 | |
5.00%, 03/15/44(a) | | | 250 | | | | 302,987 | |
4.30%, 02/15/48 | | | 750 | | | | 835,675 | |
4.35%, 05/01/49 | | | 1,500 | | | | 1,679,388 | |
3.70%, 11/15/49 | | | 400 | | | | 403,801 | |
| | |
| 50 | | 2019 BLACKROCK ANNUAL REPORTTO SHAREHOLDERS |
| | |
Schedule of Investments (continued) December 31, 2019 | | U.S. Total Bond Index Master Portfolio (Percentages shown are based on Net Assets) |
| | | | | | | | |
| Security | | Par
(000) | | | Value | |
|
| Wireless Telecommunication Services (continued) | |
Vodafone Group PLC: | | | | | | | | |
3.75%, 01/16/24(a) | | $ | 1,000 | | | $ | 1,057,807 | |
4.13%, 05/30/25(a) | | | 1,000 | | | | 1,086,273 | |
4.38%, 05/30/28(a) | | | 1,350 | | | | 1,496,823 | |
7.88%, 02/15/30 | | | 100 | | | | 139,582 | |
5.00%, 05/30/38 | | | 500 | | | | 579,034 | |
4.38%, 02/19/43 | | | 950 | | | | 1,020,284 | |
5.25%, 05/30/48 | | | 2,500 | | | | 3,003,056 | |
4.88%, 06/19/49 | | | 500 | | | | 579,849 | |
4.25%, 09/17/50 | | | 1,190 | | | | 1,242,125 | |
| | | | | | | | |
| | | | | | | 23,203,270 | |
| | | | | | | | |
| |
Total Corporate Bonds — 25.5%
(Cost — $2,690,380,079) | | | | 2,856,483,231 | |
| | | | | |
|
| Foreign Agency Obligations — 2.9% | |
African Development Bank: | | | | | | | | |
3.00%, 09/20/23 | | | 5,000 | | | | 5,234,450 | |
Series GDIF, 2.63%, 03/22/21 | | | 500 | | | | 505,672 | |
Series GDIF, 1.25%, 07/26/21 | | | 500 | | | | 496,696 | |
Asian Development Bank: | | | | | | | | |
2.25%, 01/20/21 | | | 5,000 | | | | 5,029,622 | |
1.63%, 03/16/21(a) | | | 750 | | | | 749,394 | |
2.00%, 02/16/22(a) | | | 2,000 | | | | 2,013,583 | |
1.88%, 02/18/22 | | | 1,000 | | | | 1,004,185 | |
1.88%, 07/19/22(a) | | | 2,000 | | | | 2,009,540 | |
1.75%, 09/13/22 | | | 2,500 | | | | 2,505,750 | |
2.75%, 03/17/23 | | | 3,750 | | | | 3,874,641 | |
2.63%, 01/30/24 | | | 3,000 | | | | 3,105,210 | |
2.00%, 04/24/26(a) | | | 1,000 | | | | 1,004,830 | |
2.75%, 01/19/28(a) | | | 750 | | | | 795,647 | |
Series 5Y, 1.88%, 08/10/22 | | | 500 | | | | 502,581 | |
Canada Government International Bond, 2.63%, 01/25/22(a) | | | 1,000 | | | | 1,019,057 | |
Chile Government International Bond: | | | | | | | | |
3.25%, 09/14/21 | | | 500 | | | | 510,000 | |
3.24%, 02/06/28 | | | 2,000 | | | | 2,103,750 | |
3.63%, 10/30/42(a) | | | 350 | | | | 377,344 | |
3.86%, 06/21/47(a) | | | 1,000 | | | | 1,110,937 | |
Colombia Government International Bond: | | | | | | | | |
4.38%, 07/12/21 | | | 750 | | | | 774,141 | |
2.63%, 03/15/23 | | | 250 | | | | 251,094 | |
4.00%, 02/26/24 | | | 2,750 | | | | 2,902,109 | |
4.50%, 01/28/26 | | | 2,250 | | | | 2,452,500 | |
3.88%, 04/25/27(a) | | | 1,000 | | | | 1,060,000 | |
4.50%, 03/15/29 | | | 2,500 | | | | 2,772,656 | |
7.38%, 09/18/37 | | | 100 | | | | 142,000 | |
6.13%, 01/18/41 | | | 1,000 | | | | 1,297,500 | |
5.63%, 02/26/44 | | | 950 | | | | 1,183,641 | |
5.00%, 06/15/45 | | | 2,000 | | | | 2,323,750 | |
5.20%, 05/15/49 | | | 1,500 | | | | 1,809,375 | |
European Bank for Reconstruction & Development: | | | | | | | | |
2.75%, 04/26/21(a) | | | 1,000 | | | | 1,013,647 | |
2.75%, 03/07/23 | | | 1,000 | | | | 1,032,600 | |
European Investment Bank: | | | | | | | | |
2.00%, 03/15/21 | | | 1,500 | | | | 1,506,019 | |
2.38%, 05/13/21 | | | 4,000 | | | | 4,038,469 | |
1.63%, 06/15/21(a) | | | 2,000 | | | | 1,998,739 | |
1.38%, 09/15/21(a) | | | 2,000 | | | | 1,990,575 | |
2.25%, 03/15/22 | | | 1,000 | | | | 1,012,353 | |
2.63%, 05/20/22 | | | 10,000 | | | | 10,223,129 | |
2.00%, 12/15/22(a) | | | 1,000 | | | | 1,009,169 | |
2.50%, 03/15/23 | | | 2,000 | | | | 2,049,536 | |
2.88%, 08/15/23 | | | 1,500 | | | | 1,560,355 | |
| | | | | | | | |
| Security | | Par
(000) | | | Value | |
|
| Foreign Agency Obligations (continued) | |
3.13%, 12/14/23 | | $ | 4,000 | | | $ | 4,212,052 | |
3.25%, 01/29/24(a) | | | 1,000 | | | | 1,059,557 | |
2.63%, 03/15/24 | | | 2,000 | | | | 2,071,396 | |
2.13%, 04/13/26(a) | | | 1,000 | | | | 1,012,878 | |
2.38%, 05/24/27 | | | 3,500 | | | | 3,612,265 | |
Export Development Canada: | | | | | | | | |
2.00%, 05/17/22 | | | 4,000 | | | | 4,029,240 | |
2.50%, 01/24/23 | | | 2,000 | | | | 2,048,234 | |
Export-Import Bank of Korea: | | | | | | | | |
4.00%, 01/29/21 | | | 3,000 | | | | 3,067,500 | |
1.88%, 10/21/21 | | | 2,000 | | | | 1,997,500 | |
2.75%, 01/25/22 | | | 1,000 | | | | 1,015,625 | |
3.25%, 11/10/25 | | | 500 | | | | 527,500 | |
3.25%, 08/12/26 | | | 500 | | | | 523,438 | |
FMS Wertmanagement: | | | | | | | | |
1.38%, 06/08/21 | | | 1,000 | | | | 995,224 | |
2.00%, 08/01/22 | | | 1,000 | | | | 1,007,839 | |
2.75%, 03/06/23 | | | 500 | | | | 516,006 | |
Hungary Government International Bond: | | | | | | | | |
6.38%, 03/29/21 | | | 5,000 | | | | 5,275,000 | |
5.38%, 02/21/23 | | | 500 | | | | 549,375 | |
5.75%, 11/22/23 | | | 500 | | | | 564,844 | |
5.38%, 03/25/24 | | | 500 | | | | 562,344 | |
7.63%, 03/29/41 | | | 750 | | | | 1,233,750 | |
Indonesia Government International Bond: | | | | | | | | |
4.10%, 04/24/28 | | | 2,000 | | | | 2,171,250 | |
4.75%, 02/11/29 | | | 2,000 | | | | 2,290,000 | |
4.35%, 01/11/48 | | | 1,400 | | | | 1,543,937 | |
Inter-American Development Bank: | | | | | | | | |
1.88%, 03/15/21 | | | 500 | | | | 501,033 | |
2.63%, 04/19/21 | | | 5,000 | | | | 5,060,322 | |
1.25%, 09/14/21(a) | | | 1,000 | | | | 993,144 | |
2.13%, 01/18/22(a) | | | 1,000 | | | | 1,008,649 | |
1.75%, 04/14/22 | | | 750 | | | | 751,179 | |
1.75%, 09/14/22(a) | | | 2,000 | | | | 2,004,681 | |
2.63%, 01/16/24 | | | 5,000 | | | | 5,169,062 | |
2.00%, 06/02/26 | | | 500 | | | | 503,501 | |
2.38%, 07/07/27 | | | 1,000 | | | | 1,032,644 | |
2.25%, 06/18/29 | | | 4,500 | | | | 4,605,876 | |
3.20%, 08/07/42 | | | 750 | | | | 836,819 | |
4.38%, 01/24/44 | | | 300 | | | | 395,821 | |
International Bank for Reconstruction & Development: | | | | | | | | |
2.00%, 01/26/22 | | | 3,000 | | | | 3,021,490 | |
7.63%, 01/19/23 | | | 1,000 | | | | 1,174,234 | |
1.75%, 04/19/23 | | | 1,000 | | | | 1,001,987 | |
3.00%, 09/27/23(a) | | | 4,000 | | | | 4,187,582 | |
2.50%, 03/19/24(a) | | | 3,000 | | | | 3,093,281 | |
2.20%, 09/23/24 | | | 5,000 | | | | 5,005,316 | |
4.75%, 02/15/35 | | | 500 | | | | 653,294 | |
Series GDIF, 1.63%, 03/09/21(a) | | | 1,500 | | | | 1,499,040 | |
Series GDIF, 1.38%, 05/24/21(a) | | | 4,500 | | | | 4,482,873 | |
Series GDIF, 2.25%, 06/24/21 | | | 1,000 | | | | 1,008,717 | |
Series GDIF, 2.75%, 07/23/21(a) | | | 2,000 | | | | 2,033,251 | |
Series GDIF, 1.38%, 09/20/21 | | | 1,000 | | | | 995,201 | |
Series GDIF, 1.63%, 02/10/22 | | | 3,500 | | | | 3,496,825 | |
Series GDIF, 2.50%, 07/29/25 | | | 1,000 | | | | 1,037,250 | |
Series GDIF, 1.88%, 10/27/26 | | | 750 | | | | 749,013 | |
Series GDIF, 2.50%, 11/22/27(a) | | | 2,000 | | | | 2,084,827 | |
International Finance Corp.: | | | | | | | | |
2.25%, 01/25/21 | | | 750 | | | | 754,495 | |
1.13%, 07/20/21 | | | 500 | | | | 495,769 | |
2.88%, 07/31/23 | | | 750 | | | | 779,566 | |
Israel Government International Bond: | | | | | | | | |
4.00%, 06/30/22 | | | 900 | | | | 945,563 | |
| | | | |
| SCHEDULE OF INVESTMENTS | | | 51 | |
| | |
Schedule of Investments (continued) December 31, 2019 | | U.S. Total Bond Index Master Portfolio (Percentages shown are based on Net Assets) |
| | | | | | | | |
| Security | | Par
(000) | | | Value | |
|
| Foreign Agency Obligations (continued) | |
3.15%, 06/30/23 | | $ | 3,000 | | | $ | 3,124,687 | |
3.25%, 01/17/28 | | | 2,000 | | | | 2,145,000 | |
4.50%, 01/30/43 | | | 1,200 | | | | 1,437,000 | |
Italian Government International Bond: | | | | | | | | |
6.88%, 09/27/23 | | | 100 | | | | 114,643 | |
5.38%, 06/15/33 | | | 750 | | | | 873,572 | |
Japan Bank for International Cooperation: | | | | | | | | |
1.88%, 04/20/21 | | | 2,000 | | | | 2,000,722 | |
1.50%, 07/21/21 | | | 500 | | | | 497,407 | |
2.00%, 11/04/21 | | | 2,000 | | | | 2,004,943 | |
2.50%, 06/01/22 | | | 2,000 | | | | 2,028,110 | |
2.38%, 07/21/22 | | | 1,000 | | | | 1,011,619 | |
2.38%, 11/16/22 | | | 2,000 | | | | 2,026,410 | |
3.25%, 07/20/23 | | | 600 | | | | 626,655 | |
3.38%, 07/31/23(a) | | | 500 | | | | 524,852 | |
3.38%, 10/31/23 | | | 500 | | | | 526,019 | |
2.50%, 05/23/24 | | | 500 | | | | 510,249 | |
2.38%, 04/20/26(a) | | | 750 | | | | 759,359 | |
2.25%, 11/04/26 | | | 500 | | | | 501,559 | |
2.75%, 11/16/27 | | | 500 | | | | 520,220 | |
3.25%, 07/20/28 | | | 2,000 | | | | 2,161,180 | |
2.00%, 10/17/29 | | | 1,000 | | | | 975,989 | |
Korea Development Bank: | | | | | | | | |
3.38%, 03/12/23 | | | 4,000 | | | | 4,146,840 | |
2.75%, 03/19/23 | | | 1,000 | | | | 1,017,500 | |
Korea International Bond(a): | | | | | | | | |
4.13%, 06/10/44 | | | 250 | | | | 306,593 | |
3.88%, 09/20/48 | | | 2,000 | | | | 2,407,500 | |
Landwirtschaftliche Rentenbank: | | | | | | | | |
2.25%, 10/01/21 | | | 500 | | | | 505,070 | |
1.75%, 07/27/26(a) | | | 1,000 | | | | 988,106 | |
Mexico Government International Bond: | | | | | | | | |
3.63%, 03/15/22 | | | 4,750 | | | | 4,898,437 | |
4.00%, 10/02/23 | | | 250 | | | | 263,438 | |
3.60%, 01/30/25 | | | 500 | | | | 523,750 | |
4.13%, 01/21/26 | | | 3,000 | | | | 3,203,437 | |
4.15%, 03/28/27 | | | 1,000 | | | | 1,070,937 | |
4.50%, 04/22/29 | | | 500 | | | | 548,906 | |
6.75%, 09/27/34 | | | 150 | | | | 205,125 | |
6.05%, 01/11/40(a) | | | 4,300 | | | | 5,596,719 | |
4.75%, 03/08/44 | | | 1,700 | | | | 1,877,969 | |
5.55%, 01/21/45(a) | | | 1,525 | | | | 1,879,562 | |
4.60%, 01/23/46 | | | 1,500 | | | | 1,625,156 | |
4.35%, 01/15/47 | | | 750 | | | | 790,781 | |
4.60%, 02/10/48 | | | 2,000 | | | | 2,187,500 | |
4.50%, 01/31/50 | | | 1,450 | | | | 1,568,266 | |
Nordic Investment Bank, 1.38%, 10/17/22 | | | 2,000 | | | | 1,982,627 | |
Panama Government International Bond: | | | | | | | | |
3.75%, 03/16/25(a) | | | 3,500 | | | | 3,722,031 | |
3.88%, 03/17/28 | | | 2,500 | | | | 2,727,344 | |
6.70%, 01/26/36 | | | 350 | | | | 490,875 | |
4.50%, 05/15/47(a) | | | 750 | | | | 891,797 | |
4.50%, 04/16/50 | | | 1,500 | | | | 1,773,281 | |
3.87%, 07/23/60(a) | | | 400 | | | | 431,375 | |
Peruvian Government International Bond: | | | | | | | | |
7.35%, 07/21/25 | | | 400 | | | | 505,250 | |
4.13%, 08/25/27 | | | 1,000 | | | | 1,120,000 | |
2.84%, 06/20/30(a) | | | 2,000 | | | | 2,064,375 | |
8.75%, 11/21/33 | | | 441 | | | | 725,666 | |
6.55%, 03/14/37(a) | | | 250 | | | | 365,391 | |
5.63%, 11/18/50(a) | | | 1,400 | | | | 2,043,562 | |
Philippine Government International Bond: | | | | | | | | |
4.00%, 01/15/21(a) | | | 4,500 | | | | 4,588,594 | |
4.20%, 01/21/24 | | | 2,500 | | | | 2,690,625 | |
| | | | | | | | |
| Security | | Par
(000) | | | Value | |
|
| Foreign Agency Obligations (continued) | |
3.75%, 01/14/29 | | $ | 3,000 | | | $ | 3,314,062 | |
7.75%, 01/14/31(a) | | | 1,500 | | | | 2,216,250 | |
6.38%, 10/23/34 | | | 250 | | | | 354,766 | |
5.00%, 01/13/37 | | | 1,000 | | | | 1,275,937 | |
3.95%, 01/20/40 | | | 250 | | | | 286,328 | |
3.70%, 03/01/41(a) | | | 1,100 | | | | 1,245,062 | |
3.70%, 02/02/42 | | | 2,000 | | | | 2,264,375 | |
Poland Government International Bond: | | | | | | | | |
5.13%, 04/21/21 | | | 3,000 | | | | 3,125,625 | |
5.00%, 03/23/22 | | | 2,050 | | | | 2,196,062 | |
3.00%, 03/17/23 | | | 200 | | | | 206,125 | |
4.00%, 01/22/24 | | | 250 | | | | 268,181 | |
3.25%, 04/06/26 | | | 250 | | | | 265,000 | |
Province of Alberta Canada: | | | | | | | | |
2.20%, 07/26/22 | | | 1,000 | | | | 1,009,466 | |
1.88%, 11/13/24(a) | | | 1,000 | | | | 996,741 | |
Province of British Columbia Canada: | | | | | | | | |
2.65%, 09/22/21 | | | 1,000 | | | | 1,015,566 | |
2.00%, 10/23/22 | | | 750 | | | | 755,572 | |
Province of Manitoba Canada, 2.13%, 05/04/22 | | | 2,000 | | | | 2,016,400 | |
Province of Ontario Canada: | | | | | | | | |
2.40%, 02/08/22 | | | 1,000 | | | | 1,012,218 | |
2.55%, 04/25/22 | | | 4,000 | | | | 4,070,320 | |
2.25%, 05/18/22(a) | | | 2,000 | | | | 2,020,413 | |
2.20%, 10/03/22(a) | | | 2,000 | | | | 2,021,613 | |
2.50%, 04/27/26 | | | 3,000 | | | | 3,063,786 | |
Province of Quebec Canada: | | | | | | | | |
2.75%, 08/25/21 | | | 500 | | | | 507,915 | |
2.38%, 01/31/22 | | | 1,000 | | | | 1,012,142 | |
2.63%, 02/13/23(a) | | | 250 | | | | 256,673 | |
2.50%, 04/20/26 | | | 2,750 | | | | 2,823,064 | |
Series QO, 2.88%, 10/16/24 | | | 500 | | | | 522,445 | |
Republic of Italy Government International Bond: | | | | | | | | |
2.38%, 10/17/24 | | | 2,000 | | | | 1,958,473 | |
2.88%, 10/17/29 | | | 500 | | | | 474,464 | |
4.00%, 10/17/49 | | | 1,500 | | | | 1,431,253 | |
Svensk Exportkredit AB: | | | | | | | | |
2.88%, 05/22/21 | | | 2,000 | | | | 2,030,102 | |
2.38%, 03/09/22 | | | 1,500 | | | | 1,519,997 | |
1.63%, 11/14/22 | | | 500 | | | | 498,873 | |
2.88%, 03/14/23 | | | 1,000 | | | | 1,035,540 | |
Uruguay Government International Bond: | | | | | | | | |
8.00%, 11/18/22 | | | 150 | | | | 167,250 | |
4.50%, 08/14/24(a) | | | 1,250 | | | | 1,352,344 | |
4.38%, 10/27/27(a) | | | 1,000 | | | | 1,104,375 | |
4.38%, 01/23/31(a) | | | 3,000 | | | | 3,357,187 | |
5.10%, 06/18/50 | | | 2,250 | | | | 2,702,812 | |
4.98%, 04/20/55 | | | 1,000 | | | | 1,179,062 | |
| | | | | | | | |
| |
Total Foreign Agency Obligations — 2.9%
(Cost — $314,743,009) | | | | 326,643,724 | |
| | | | | | | | |
|
Municipal Bonds — 0.6% | |
| | |
| Arizona — 0.0% | | | | | | |
Salt River Project Agricultural Improvement & Power District, RB, Build America Bonds, Series A, 4.84%, 01/01/41 | | | 220 | | | | 270,761 | |
| | | | | | | | |
|
| California — 0.2% | |
Bay Area Toll Authority, RB, Build America Bonds, San Francisco Toll Bridge: | | | | | | | | |
SeriesF-2, 6.26%, 04/01/49 | | | 750 | | | | 1,142,017 | |
SeriesS-1, 6.92%, 04/01/40 | | | 530 | | | | 776,418 | |
| | |
| 52 | | 2019 BLACKROCK ANNUAL REPORTTO SHAREHOLDERS |
| | |
Schedule of Investments (continued) December 31, 2019 | | U.S. Total Bond Index Master Portfolio (Percentages shown are based on Net Assets) |
| | | | | | | | |
| Security | | Par
(000) | | | Value | |
|
| California (continued) | |
SeriesS-1, 7.04%, 04/01/50 | | $ | 100 | | | $ | 160,214 | |
SeriesS-3, 6.91%, 10/01/50 | | | 200 | | | | 323,456 | |
Bay Area Toll Authority, Refunding RB, San Francisco Bay Area Toll Bridge, 2.57%, 04/01/31 | | | 95 | | | | 94,382 | |
City & County of San Francisco California Public Utilities Commission Water Revenue, RB, Build America Bonds,Sub-Series G, 6.95%, 11/01/50 | | | 100 | | | | 155,805 | |
City of Los Angeles California Department of Water & Power, RB, Build America Bonds: | | | | | | | | |
5.72%, 07/01/39 | | | 200 | | | | 271,572 | |
6.60%, 07/01/50 | | | 90 | | | | 143,932 | |
Series D, 6.57%, 07/01/45 | | | 675 | | | | 1,056,193 | |
City of San Francisco CA Public Utilities Commission Water Revenue, Refunding RB, Series A, 3.30%, 11/01/39(e) | | | 115 | | | | 114,704 | |
County of Los Angeles California Metropolitan Transportation Authority, RB, Build America Bonds, 5.74%, 06/01/39 | | | 100 | | | | 130,439 | |
County of Los Angeles Public Works Financing Authority, RB, 7.62%, 08/01/40 | | | 100 | | | | 154,935 | |
County of San Diego California Regional Transportation Commission, RB, Build America Bonds, Series A, 5.91%, 04/01/48 | | | 260 | | | | 375,066 | |
County of San Diego California Water Authority, RB, Build America Bonds, Series B, 6.14%, 05/01/49 | | | 315 | | | | 445,315 | |
County of San Diego Regional Transportation Commission, Refunding RB, Series A, 3.25%, 04/01/48 | | | 175 | | | | 173,516 | |
East Bay Municipal Utility District Water System Revenue, RB, Build America Bonds, 5.87%, 06/01/40 | | | 100 | | | | 136,855 | |
Foothill-Eastern Transportation Corridor Agency, Refunding RB, Toll Road, Series A: | | | | | | | | |
4.09%, 01/15/49 | | | 75 | | | | 75,050 | |
(AGM), 3.92%, 01/15/53 | | | 175 | | | | 172,914 | |
Los Angeles California Community College District, GO, Build America Bonds, 6.75%, 08/01/49 | | | 200 | | | | 328,384 | |
Los Angeles California Unified School District, GO, Build America Bonds: | | | | | | | | |
5.76%, 07/01/29 | | | 300 | | | | 362,571 | |
5.75%, 07/01/34 | | | 850 | | | | 1,083,750 | |
6.76%, 07/01/34(a) | | | 450 | | | | 616,383 | |
Regents of the University of California Medical Center Pooled Revenue, RB, Regents, Build America Bonds, Series H, 6.55%, 05/15/48 | | | 50 | | | | 72,180 | |
Regents of the University of California Medical Center Pooled Revenue, Refunding RB, Build America Bonds, Series F, 6.58%, 05/15/49 | | | 600 | | | | 854,040 | |
Santa Clara Valley Transportation Authority, RB, Build America Bonds, Series A, 5.88%, 04/01/32 | | | 100 | | | | 122,377 | |
State of California, GO: | | | | | | | | |
Refunding, Bid Group, Series A, 2.50%, 10/01/29 | | | 750 | | | | 747,855 | |
Build America Bonds, 5.70%, 11/01/21 | | | 200 | | | | 214,140 | |
Build America Bonds, 2.37%, 04/01/22 | | | 500 | | | | 506,440 | |
Build America Bonds, 7.50%, 04/01/34 | | | 645 | | | | 973,460 | |
Build America Bonds, 7.55%, 04/01/39 | | | 1,375 | | | | 2,200,041 | |
Build America Bonds, 7.30%, 10/01/39 | | | 600 | | | | 916,596 | |
Build America Bonds, 7.35%, 11/01/39(a) | | | 800 | | | | 1,218,464 | |
Build America Bonds, 7.60%, 11/01/40 | | | 1,850 | | | | 3,034,962 | |
State of California, GO, Refunding: | | | | | | | | |
2.80%, 04/01/21 | | | 95 | | | | 96,201 | |
3.38%, 04/01/25 | | | 100 | | | | 106,218 | |
3.50%, 04/01/28 | | | 355 | | | | 380,894 | |
| | | | | | | | |
| Security | | Par
(000) | | | Value | |
|
| California (continued) | |
4.50%, 04/01/33 | | $ | 200 | | | $ | 224,704 | |
4.60%, 04/01/38 | | | 165 | | | | 183,805 | |
State of California Department of Water Res. Power Supply Revenue, Refunding RB, Series P, 2.00%, 05/01/22 | | | 250 | | | | 251,227 | |
University of California, RB: | | | | | | | | |
Build America Bonds, 5.77%, 05/15/43 | | | 190 | | | | 251,421 | |
Build America Bonds, 5.95%, 05/15/45 | | | 500 | | | | 674,010 | |
General, Series AD, 4.86%, 05/15/12 | | | 300 | | | | 371,067 | |
General, Series AQ, 4.77%, 05/15/15 | | | 405 | | | | 491,107 | |
General, Series BD, 3.35%, 07/01/29 | | | 170 | | | | 181,902 | |
University of California, Refunding RB: | | | | | | | | |
3.06%, 07/01/25 | | | 100 | | | | 104,456 | |
General, Series AJ, 4.60%, 05/15/31 | | | 150 | | | | 172,641 | |
| | | | | | | | |
| | | | | | | 22,644,079 | |
|
| Colorado — 0.0% | |
Regional Transportation District Sales Tax Revenue, RB, Build America Bonds, Series B, 5.84%, 11/01/50 | | | 100 | | | | 145,249 | |
| | | | | | | | |
|
| Connecticut — 0.0% | |
State of Connecticut, GO: | | | | | | | | |
Build America Bonds, Series D, 5.09%, 10/01/30 | | | 150 | | | | 172,220 | |
Series A, 5.85%, 03/15/32 | | | 550 | | | | 699,776 | |
| | | | | | | | |
| | | | | | | 871,996 | |
|
| District of Columbia — 0.0% | |
District of Columbia, RB, Build America Bonds, Series E, 5.59%, 12/01/34 | | | 200 | | | | 247,138 | |
District of Columbia Water & Sewer Authority, RB, Series A, 4.81%, 10/01/14 | | | 200 | | | | 256,918 | |
District of Columbia Water & Sewer Authority, Refunding RB, Subordinate Lien, Series A, 3.21%, 10/01/48 | | | 160 | | | | 159,283 | |
Metropolitan Washington Airports Authority Dulles Toll Road Revenue, ARB, Dulles Toll Road Revenue, Build America Bonds, 7.46%, 10/01/46 | | | 100 | | | | 159,328 | |
| | | | | | | | |
| | | | | | | 822,667 | |
|
| Florida — 0.0% | |
County of Miami-Dade Florida Aviation Revenue, Refunding RB, Series C, 4.28%, 10/01/41 | | | 665 | | | | 718,000 | |
County of Miami-Dade Florida Water & Sewer System Revenue, Refunding RB, Series C, 3.49%, 10/01/42 | | | 70 | | | | 70,444 | |
State Board of Administration Finance Corp., RB, Series A, 2.64%, 07/01/21 | | | 200 | | | | 202,412 | |
| | | | | | | | |
| | | | | | | 990,856 | |
|
| Georgia — 0.0% | |
Municipal Electric Authority of Georgia, Refunding RB, Build America Bonds, Series A: | | | | | | | | |
6.64%, 04/01/57 | | | 343 | | | | 461,321 | |
6.66%, 04/01/57 | | | 400 | | | | 555,912 | |
| | | | | | | | |
| | | | | | | 1,017,233 | |
|
| Illinois — 0.1% | |
Chicago O’Hare International Airport, ARB, General Senior Lien, Series C: | | | | | | | | |
4.47%, 01/01/49 | | | 165 | | | | 197,635 | |
4.57%, 01/01/54 | | | 165 | | | | 200,995 | |
Chicago O’Hare International Airport, Refunding ARB, Build America Bonds, Series B, 6.40%, 01/01/40 | | | 250 | | | | 358,723 | |
Chicago Transit Authority, RB: | | | | | | | | |
Build America Bonds, Series B, 6.20%, 12/01/40 | | | 435 | | | | 561,750 | |
Pension Funding, Series A, 6.90%, 12/01/40 | | | 530 | | | | 715,283 | |
| | | | |
| SCHEDULE OF INVESTMENTS | | | 53 | |
| | |
Schedule of Investments (continued) December 31, 2019 | | U.S. Total Bond Index Master Portfolio (Percentages shown are based on Net Assets) |
| | | | | | | | |
| Security | | Par
(000) | | | Value | |
|
| Illinois (continued) | |
Metropolitan Water Reclamation District of Greater Chicago, GO, Build America Bonds, 5.72%, 12/01/38 | | $ | 150 | | | $ | 196,815 | |
State of Illinois, GO, Pension, 5.10%, 06/01/33 | | | 4,400 | | | | 4,739,240 | |
| | | | | | | | |
| | | | | | | 6,970,441 | |
|
| Massachusetts — 0.0% | |
Commonwealth of Massachusetts, GO: | | | | | | | | |
Build America Bonds, 5.46%, 12/01/39 | | | 500 | | | | 647,655 | |
Consolidated Loan, Series H, 2.90%, 09/01/49 | | | 105 | | | | 99,958 | |
Refunding Series D, 2.81%, 09/01/43 | | | 1,000 | | | | 950,660 | |
Massachusetts School Building Authority, RB, Build America Bonds, 5.72%, 08/15/39 | | | 585 | | | | 759,979 | |
Massachusetts School Building Authority, Refunding RB, Series B, 3.40%, 10/15/40 | | | 125 | | | | 125,178 | |
| | | | | | | | |
| | | | | | | 2,583,430 | |
|
| Michigan — 0.0% | |
Michigan Finance Authority, Refunding RB, Trinity Health Credit Group: | | | | | | | | |
3.08%, 12/01/34 | | | 150 | | | | 149,135 | |
3.38%, 12/01/40 | | | 125 | | | | 125,031 | |
| | | | | | | | |
| | | | | | | 274,166 | |
|
| Missouri — 0.0% | |
Health & Educational Facilities Authority of the State of Missouri, RB, Taxable, Washington University, Series A, 3.65%, 08/15/57 | | | 240 | | | | 257,203 | |
| | | | | | | | |
|
| Nevada — 0.0% | |
County of Clark Nevada Department of Aviation, ARB, Build America Bonds, Series C, 6.82%, 07/01/45 | | | 450 | | | | 701,222 | |
| | | | | | | | |
|
| New Jersey — 0.1% | |
New Jersey EDA, RB, Series A (NPFGC), 7.43%, 02/15/29 | | | 1,450 | | | | 1,821,881 | |
New Jersey State Turnpike Authority, RB, Build America Bonds: | | | | | | | | |
Series A, 7.10%, 01/01/41 | | | 750 | | | | 1,147,522 | |
Series F, 7.41%, 01/01/40 | | | 900 | | | | 1,412,208 | |
New Jersey Transportation Trust Fund Authority, RB, Build America Bonds: | | | | | | | | |
Series B, 6.56%, 12/15/40 | | | 100 | | | | 133,355 | |
Series C, 5.75%, 12/15/28 | | | 350 | | | | 403,242 | |
New Jersey Transportation Trust Fund Authority, Refunding RB, Transportation System: | | | | | | | | |
4.08%, 06/15/39 | | | 200 | | | | 198,694 | |
4.13%, 06/15/42 | | | 55 | | | | 54,392 | |
Rutgers — The State University of New Jersey, RB, Rutgers University, Series P, 3.92%, 05/01/19 | | | 110 | | | | 108,642 | |
Rutgers The State University of New Jersey, Refunding RB, Series R, 3.27%, 05/01/43 | | | 425 | | | | 417,801 | |
| | | | | | | | |
| | | | | | | 5,697,737 | |
|
| New York — 0.1% | |
City of New York New York,Series A-2, 5.21%, 10/01/31 | | | 225 | | | | 266,461 | |
City of New York New York, GO, Build America Bonds: | | | | | | | | |
5.52%, 10/01/37 | | | 500 | | | | 641,570 | |
Series F1, 6.27%, 12/01/37 | | | 300 | | | | 416,001 | |
City of New York New York Water & Sewer System, Refunding RB, 2nd General Resolution, Build America Bonds, Fiscal 2010, Series EE, 6.01%, 06/15/42 | | | 600 | | | | 851,970 | |
| | | | | | | | |
| Security | | Par
(000) | | | Value | |
|
| New York (continued) | |
City of New York Transitional Finance Authority Future Tax Secured Revenue, RB, Build America Bonds, Future Tax Secured,Sub-Series B-1, 5.57%, 11/01/38 | | $ | 345 | | | $ | 440,151 | |
City of New York Water & Sewer System, Refunding RB, 2nd General Resolution, Series GG, Build America Bonds, 5.72%, 06/15/42 | | | 300 | | | | 419,049 | |
Metropolitan Transportation Authority, RB, Build America Bonds: | | | | | | | | |
6.67%, 11/15/39 | | | 515 | | | | 725,347 | |
7.34%, 11/15/39 | | | 500 | | | | 781,500 | |
Series E, 6.81%, 11/15/40 | | | 400 | | | | 570,388 | |
New York City Transitional Finance Authority Future Tax Secured Revenue, RB, Build America Bonds, 5.77%, 08/01/36 | | | 100 | | | | 123,124 | |
New York City Water & Sewer System, RB, Build America Bonds, 2nd General Resolution, Fiscal 2020, Series DD, 5.95%, 06/15/42 | | | 115 | | | | 162,556 | |
New York City Water & Sewer System, Refunding RB, Build America Bonds: | | | | | | | | |
5.88%, 06/15/44 | | | 100 | | | | 143,662 | |
2nd General Resolution, Fiscal 2011, Series AA, 5.44%, 06/15/43 | | | 200 | | | | 272,066 | |
New York State Dormitory Authority, RB, Build America Bonds, 5.60%, 03/15/40 | | | 475 | | | | 613,961 | |
New York State Urban Development Corp., RB, Build America Bonds, 5.77%, 03/15/39 | | | 200 | | | | 241,356 | |
Port Authority of New York & New Jersey, ARB: | | | | | | | | |
192nd Series, 4.81%, 10/15/65 | | | 100 | | | | 126,824 | |
Consolidated, 160th Series, 5.65%, 11/01/40 | | | 1,245 | | | | 1,662,697 | |
Consolidated, 168th Series, 4.93%, 10/01/51 | | | 250 | | | | 323,935 | |
Consolidated, 181th Series, 4.96%, 08/01/46 | | | 180 | | | | 228,346 | |
Port Authority of New York & New Jersey, RB: | | | | | | | | |
159th Series, 6.04%, 12/01/29 | | | 200 | | | | 257,338 | |
182nd Series, 5.31%, 08/01/46 | | | 100 | | | | 110,673 | |
Consolidated Bonds, Series 21, 3.29%, 08/01/69 | | | 200 | | | | 192,246 | |
Port Authority of New York & New Jersey, Refunding ARB, Consolidated,174th Series, 4.46%, 10/01/62 | | | 1,300 | | | | 1,596,179 | |
State of New York Dormitory Authority, Refunding RB: | | | | | | | | |
Series B, 3.14%, 07/01/43 | | | 50 | | | | 49,566 | |
Series F, 3.11%, 02/15/39(e) | | | 350 | | | | 349,895 | |
State of New York Thruway Authority, Refunding RB, Series M: | | | | | | | | |
2.90%, 01/01/35 | | | 500 | | | | 499,225 | |
3.50%, 01/01/42 | | | 160 | | | | 160,606 | |
State of New York Urban Development Corp., RB, State Personal Income Tax, General Purpose, Series B, 3.90%, 03/15/33 | | | 500 | | | | 537,100 | |
| | | | | | | | |
| | | | | | | 12,763,792 | |
|
| Ohio — 0.0% | |
American Municipal Power, Inc., RB, Build America Bonds, Combined Hydroelectric Projects, Series B: | | | | | | | | |
7.83%, 02/15/41 | | | 650 | | | | 1,016,333 | |
8.08%, 02/15/50 | | | 500 | | | | 852,835 | |
JobsOhio Beverage System, Refunding RB, Series B: | | | | | | | | |
3.99%, 01/01/29 | | | 100 | | | | 108,682 | |
4.53%, 01/01/35 | | | 100 | | | | 116,811 | |
Ohio State University, RB: | | | | | | | | |
Build America Bonds, Series C, 4.91%, 06/01/40 | | | 200 | | | | 252,894 | |
Series A, 3.80%, 12/01/46 | | | 200 | | | | 222,128 | |
| | |
| 54 | | 2019 BLACKROCK ANNUAL REPORTTO SHAREHOLDERS |
| | |
Schedule of Investments (continued) December 31, 2019 | | U.S. Total Bond Index Master Portfolio (Percentages shown are based on Net Assets) |
| | | | | | | | |
| Security | | Par
(000) | | | Value | |
|
| Ohio (continued) | |
Ohio Water Development Authority Water Pollution Control Loan Fund, RB, Build America Bonds,Series B-2, 4.88%, 12/01/34 | | $ | 100 | | | $ | 114,949 | |
| | | | | | | | |
| | | | | | | 2,684,632 | |
|
| Oregon — 0.0% | |
Oregon School Boards Association, Refunding, GOL, Taxable Pension, Series B (NPFCG), 5.55%, 06/30/28 | | | 375 | | | | 443,186 | |
State of Oregon, GO: | | | | | | | | |
5.76%, 06/01/23 | | | 68 | | | | 72,818 | |
5.89%, 06/01/27 | | | 750 | | | | 894,660 | |
State of Oregon Department of Transportation, RB, Build America Bonds,Sub-Lien, Series A, 5.83%, 11/15/34 | | | 125 | | | | 166,485 | |
| | | | | | | | |
| | | | | | | 1,577,149 | |
|
| Pennsylvania — 0.0% | |
University ofPittsburgh-of the Commonwealth System of Higher Education, RB, Commonwealth System of Higher Education, 3.56%, 09/15/19 | | | 175 | | | | 169,726 | |
| | | | | | | | |
|
| South Carolina — 0.0% | |
South Carolina Public Service Authority, RB, Build America Bonds, Series C, 6.45%, 01/01/50 | | | 100 | | | | 146,972 | |
| | | | | | | | |
|
| Tennessee — 0.0% | |
Metropolitan Government Nashville & Davidson County Health & Educational Facilities Board, RB, 4.05%, 07/01/26 | | | 350 | | | | 379,351 | |
| | | | | | | | |
|
| Texas — 0.1% | |
City of San Antonio Texas Electric & Gas Systems Revenue, RB: | | | | | | | | |
4.43%, 02/01/42 | | | 170 | | | | 195,247 | |
Build America Bonds, 5.72%, 02/01/41 | | | 200 | | | | 266,076 | |
Junior Lien, Build America Bonds, 5.81%, 02/01/41 | | | 250 | | | | 343,595 | |
Dallas Area Rapid Transit, RB, Build America Bonds, Senior Lien, Series B, 5.02%, 12/01/48 | | | 560 | | | | 742,902 | |
Dallas-Fort Worth International Airport, Refunding RB, Series A, 3.14%, 11/01/45 | | | 65 | | | | 64,567 | |
North Texas Tollway Authority, RB, Build America Bonds, Series B, 6.72%, 01/01/49 | | | 550 | | | | 862,647 | |
Permanent University Fund — University of Texas System, Refunding RB, 3.38%, 07/01/47 | | | 540 | | | | 568,220 | |
State of Texas, GO, Build America Bonds, Series A, 5.52%, 04/01/39(a) | | | 1,000 | | | | 1,351,500 | |
Texas Private Activity Bond Surface Transportation Corp., RB, North Tarrant Express Managed Lanes Project, Series B, 3.92%, 12/31/49 | | | 425 | | | | 427,971 | |
Texas Transportation Commission State Highway Fund, RB, 1st Tier, Build America Bonds, Series B, 5.18%, 04/01/30 | | | 600 | | | | 721,020 | |
| | | | | | | | |
| | | | | | | 5,543,745 | |
|
| Virginia — 0.0% | |
University of Virginia, RB, Series C, 4.18%, 09/01/17 | | | 60 | | | | 70,076 | |
University of Virginia, Refunding RB, Series A, 3.23%, 09/01/19 | | | 120 | | | | 111,209 | |
| | | | | | | | |
| | | | | | | 181,285 | |
|
| Washington — 0.0% | |
State of Washington, GO, Build America Bonds, 5.14%, 08/01/40 | | | 200 | | | | 254,194 | |
| | | | | | | | |
| | | | | | | | |
| Security | | Par
(000) | | | Value | |
|
| Wisconsin — 0.0% | |
State of Wisconsin, RB, Series A (AGM), 5.70%, 05/01/26 | | $ | 90 | | | $ | 101,139 | |
State of Wisconsin, Refunding RB: | | | | | | | | |
Series A, 3.95%, 05/01/36 | | | 600 | | | | 642,090 | |
Series C, 3.15%, 05/01/27 | | | 320 | | | | 333,696 | |
| | | | | | | | |
| | | | | | | 1,076,925 | |
| | | | | | | | |
| |
Total Municipal Bonds — 0.6%
(Cost — $63,326,749) | | | | 68,024,811 | |
| | | | | | | | |
|
Non-Agency Mortgage-Backed Securities — 1.2% | |
|
Commercial Mortgage-Backed Securities — 1.2% | |
BANK 2019-BNK18, Series 2019-BN18, Class A4, 3.58%, 05/15/62 | | | 2,000 | | | | 2,152,202 | |
Barclays Commercial Mortgage Trust,Series 2017-C1, Class A4, 3.67%, 02/15/50 | | | 2,300 | | | | 2,467,210 | |
Benchmark Mortgage Trust: | | | | | | | | |
Series2018-B5, Class A4, 4.21%, 07/15/51 | | | 3,000 | | | | 3,356,290 | |
Series2019-B11, Class A4, 3.28%, 05/15/52 | | | 4,000 | | | | 4,212,592 | |
Series2019-B13, Class A4, 2.95%, 08/15/57 | | | 8,544 | | | | 8,748,601 | |
Series2019-B9, Class A5, 4.02%, 03/15/52 | | | 3,000 | | | | 3,323,219 | |
Citigroup Commercial Mortgage Trust: | | | | | | | | |
Series 2013-GC17, Class A4, 4.13%, 11/10/46 | | | 750 | | | | 796,526 | |
Series 2014-GC25, Class A4, 3.64%, 10/10/47 | | | 500 | | | | 526,902 | |
Series 2014-GC25, Class AS, 4.02%, 10/10/47 | | | 1,500 | | | | 1,578,885 | |
Series 2016-GC37, Class A4, 3.31%, 04/10/49 | | | 3,500 | | | | 3,665,889 | |
Series2016-P5, Class A4, 2.94%, 10/10/49 | | | 1,000 | | | | 1,027,335 | |
Series2017-P7, Class A4, 3.71%, 04/14/50 | | | 2,250 | | | | 2,420,694 | |
Commercial Mortgage Trust: | | | | | | | | |
Series 2013-CR09, Class A4, 4.22%, 07/10/45(f) | | | 2,700 | | | | 2,859,613 | |
Series 2013-CR12, Class A4, 4.05%, 10/10/46 | | | 1,300 | | | | 1,371,968 | |
Series2013-CR8, Class A5, 3.61%, 06/10/46(f) | | | 1,900 | | | | 1,979,130 | |
Series 2014-UBS2, Class A5, 3.96%, 03/10/47 | | | 500 | | | | 530,401 | |
Series2015-PC1, Class A5, 3.90%, 07/10/50 | | | 1,500 | | | | 1,596,920 | |
Series 2016-CR28, Class A4, 3.76%, 02/10/49 | | | 750 | | | | 800,334 | |
CSAIL Commercial Mortgage Securities Trust: | | | | | | | | |
Series2015-C3, Class A4, 3.72%, 08/15/48 | | | 1,000 | | | | 1,057,482 | |
Series2016-C7, Class A5, 3.50%, 11/15/49 | | | 4,800 | | | | 5,032,056 | |
Series 2018-CX11, Class A5, 4.03%, 04/15/51(f) | | | 4,000 | | | | 4,384,828 | |
DBJPM Mortgage Trust,Series 2016-C3, Class A5, 2.89%, 08/10/49 | | | 7,500 | | | | 7,671,735 | |
GS Mortgage Securities Corp. II, Series 2018-GS10, Class A5, 4.16%, 07/10/51(f) | | | 3,000 | | | | 3,332,412 | |
GS Mortgage Securities Trust: | | | | | | | | |
Series2012-GC6, Class A3, 3.48%, 01/10/45 | | | 5,280 | | | | 5,374,209 | |
Series 2012-GCJ9, Class A3, 2.77%, 11/10/45 | | | 247 | | | | 250,087 | |
Series 2015-GC30, Class A4, 3.38%, 05/10/50 | | | 600 | | | | 627,851 | |
Series2015-GS1, Class A3, 3.73%, 11/10/48 | | | 2,300 | | | | 2,457,375 | |
JPMBB Commercial Mortgage Securities Trust: | | | | | | | | |
Series2014-C18, Class A5, 4.08%, 02/15/47 | | | 250 | | | | 266,904 | |
Series2014-C22, Class A4, 3.80%, 09/15/47 | | | 300 | | | | 318,596 | |
JPMBB Commercial Mortgage Securities Trust2015-C31,Series 2015-C31, Class A3, 3.80%, 08/15/48 | | | 2,250 | | | | 2,407,472 | |
JPMDB Commercial Mortgage Securities Trust,Series 2017-C7, Class A5, 3.41%, 10/15/50 | | | 6,000 | | | | 6,334,979 | |
JPMorgan Chase Commercial Mortgage Securities Trust: | | | | | | | | |
Series2011-C5, Class A3, 4.17%, 08/15/46 | | | 135 | | | | 137,499 | |
Series2014-C20, Class A5, 3.80%, 07/15/47 | | | 1,400 | | | | 1,483,800 | |
Series2017-JP7, Class A5, 3.45%, 09/15/50 | | | 3,500 | | | | 3,703,845 | |
Morgan Stanley Bank of America Merrill Lynch Trust: | | | | | | | | |
Series2013-C10, Class A5, 4.08%, 07/15/46(f) | | | 3,750 | | | | 3,957,780 | |
Series2013-C10, Class AS, 4.08%, 07/15/46(f) | | | 2,500 | | | | 2,628,402 | |
| | | | |
| SCHEDULE OF INVESTMENTS | | | 55 | |
| | |
Schedule of Investments (continued) December 31, 2019 | | U.S. Total Bond Index Master Portfolio (Percentages shown are based on Net Assets) |
| | | | | | | | |
| Security | | Par
(000) | | | Value | |
|
| Commercial Mortgage-Backed Securities (continued) | |
Series2013-C11, Class A4, 4.15%, 08/15/46(f) | | $ | 11,765 | | | $ | 12,484,133 | |
Series2014-C16, Class A4, 3.60%, 06/15/47 | | | 4,430 | | | | 4,622,063 | |
Series2015-C24, Class A4, 3.73%, 05/15/48 | | | 750 | | | | 798,443 | |
Morgan Stanley Capital I Trust, Class A4: | | | | | | | | |
Series 2015-UBS8, 3.81%, 12/15/48 | | | 1,181 | | | | 1,260,673 | |
Series2018-H3, 3.91%, 07/15/51 | | | 3,000 | | | | 3,277,085 | |
Series2019-H6, 3.42%, 06/15/52 | | | 590 | | | | 625,758 | |
Morgan Stanley Capital I Trust2019-L3,Series 2019-L3, Class AS, 3.49%, 11/15/29 | | | 760 | | | | 784,240 | |
Wells Fargo Commercial Mortgage Trust: | | | | | | | | |
Series 2013-LC12, Class A4, 4.22%, 07/15/46(f) | | | 200 | | | | 212,172 | |
Series 2014-LC18, Class ASB, 3.24%, 12/15/47 | | | 2,500 | | | | 2,558,999 | |
Series2015-C27, Class A5, 3.45%, 02/15/48 | | | 1,500 | | | | 1,574,811 | |
Series2015-SG1, Class A4, 3.79%, 09/15/48 | | | 5,000 | | | | 5,331,544 | |
Series2019-C49, Class A5, 4.02%, 03/15/52 | | | 3,850 | | | | 4,253,954 | |
WFRBS Commercial Mortgage Trust: | | | | | | | | |
Series2012-C7, Class A1, 2.30%, 06/15/45 | | | 97 | | | | 97,394 | |
Series2012-C7, Class A2, 3.43%, 06/15/45 | | | 800 | | | | 820,298 | |
Series2013-C11, Class A5, 3.07%, 03/15/45 | | | 500 | | | | 511,540 | |
| | | | | | | | |
| |
TotalNon-Agency Mortgage-Backed Securities — 1.2%
(Cost — $131,291,755) | | | | 134,055,130 | |
| | | | | |
|
Preferred Securities — 0.0% | |
|
Capital Trusts — 0.0% | |
|
| Banks — 0.0% | |
Goldman Sachs Capital I, 6.35%, 02/15/34 | | | 250 | | | | 324,804 | |
Wells Fargo Capital X, 5.95%, 12/01/86 | | | 250 | | | | 305,122 | |
| | | | | | | | |
| | | | | | | 629,926 | |
|
| Insurance — 0.0% | |
Allstate Corp., Series B, 5.75%, 08/15/53(c) | | | 1,250 | | | | 1,343,838 | |
MetLife, Inc., 6.40%, 12/15/66 | | | 600 | | | | 735,000 | |
Prudential Financial, Inc.(c): | | | | | | | | |
5.63%, 06/15/43 | | | 100 | | | | 107,500 | |
5.38%, 05/15/45(a) | | | 500 | | | | 540,535 | |
| | | | | | | | |
| | | | | | | 2,726,873 | |
| | | | | | | | |
| |
Total Capital Trusts — 0.0%
(Cost — $3,154,809) | | | | 3,356,799 | |
| | | | | |
| |
Total Preferred Securities — 0.0%
(Cost — $3,154,809) | | | | 3,356,799 | |
| | | | | |
|
U.S. Government Sponsored Agency Securities — 29.7% | |
|
Agency Obligations — 0.8% | |
Fannie Mae: | | | | | | | | |
1.25%, 08/17/21(a) | | | 8,200 | | | | 8,156,675 | |
1.38%, 10/07/21 | | | 2,000 | | | | 1,992,403 | |
1.88%, 04/05/22(a) | | | 5,000 | | | | 5,032,216 | |
2.38%, 01/19/23(a) | | | 490 | | | | 501,064 | |
2.63%, 01/11/22 - 09/06/24(a) | | | 8,715 | | | | 9,016,341 | |
6.25%, 05/15/29 | | | 5,350 | | | | 7,235,320 | |
6.63%, 11/15/30 | | | 149 | | | | 212,409 | |
7.25%, 05/15/30 | | | 5,550 | | | | 8,167,196 | |
Federal Farm Credit Banks Funding Corp., 2.85%, 09/20/21 | | | 1,705 | | | | 1,742,028 | |
Federal Home Loan Bank: | | | | | | | | |
2.75%, 12/13/24 | | | 5,000 | | | | 5,240,898 | |
3.00%, 12/09/22 | | | 4,910 | | | | 5,104,714 | |
3.13%, 06/13/25 | | | 9,570 | | | | 10,205,280 | |
5.50%, 07/15/36 | | | 2,100 | | | | 2,951,897 | |
Freddie Mac: | | | | | | | | |
1.13%, 08/12/21(a) | | | 3,032 | | | | 3,009,633 | |
2.38%, 02/16/21 - 01/13/22(a) | | | 19,715 | | | | 19,971,006 | |
| | | | | | | | |
| Security | | Par
(000) | | | Value | |
|
| Agency Obligations (continued) | |
6.25%, 07/15/32 | | $ | 1,300 | | | $ | 1,872,517 | |
6.75%, 03/15/31 | | | 2,800 | | | | 4,057,503 | |
Tennessee Valley Authority: | | | | | | | | |
3.50%, 12/15/42 | | | 140 | | | | 157,095 | |
5.88%, 04/01/36 | | | 2,100 | | | | 2,980,541 | |
| | | | | | | | |
| | | | | | | 97,606,736 | |
|
| Commercial Mortgage-Backed Securities — 0.8% | |
Fannie Mae: | | | | | | | | |
Series2016-M5, Class A2, 2.47%, 04/25/26 | | | 6,110 | | | | 6,135,199 | |
Series2012-M9, Class A2, 2.48%, 04/25/22 | | | 1,167 | | | | 1,174,035 | |
Series2016-M6, Class A2, 2.49%, 05/25/26 | | | 7,000 | | | | 7,085,187 | |
Series2014-M6, Class A2, 2.68%, 05/25/21(f) | | | 83 | | | | 83,709 | |
Series2014-M2, Class ASV2, 2.78%, 06/25/21(f) | | | 182 | | | | 182,133 | |
Series2014-M13, Class A2, 3.02%, 08/25/24(f) | | | 500 | | | | 515,301 | |
Freddie Mac: | | | | | | | | |
Series K026, Class A2, 2.51%, 11/25/22 | | | 200 | | | | 202,770 | |
Series K038, Class A1, 2.60%, 10/25/23 | | | 99 | | | | 99,699 | |
Series K017, Class A2, 2.87%, 12/25/21 | | | 6,994 | | | | 7,082,592 | |
Series K727, Class A2, 2.95%, 07/25/24 | | | 5,000 | | | | 5,152,367 | |
Series K033, Class A2, 3.06%, 07/25/23(f) | | | 100 | | | | 103,307 | |
Series K066, Class A2, 3.12%, 06/25/27 | | | 3,500 | | | | 3,681,979 | |
Series K052, Class A2, 3.15%, 11/25/25 | | | 750 | | | | 787,381 | |
Series K041, Class A2, 3.17%, 10/25/24 | | | 7,500 | | | | 7,851,657 | |
Series K734, Class A2, 3.21%, 02/25/26 | | | 5,700 | | | | 5,994,350 | |
Series K031, Class A2, 3.30%, 04/25/23(f) | | | 100 | | | | 103,914 | |
Series K047, Class A2, 3.33%, 05/25/25(f) | | | 7,435 | | | | 7,856,130 | |
Series K063, Class A2, 3.43%, 01/25/27(f) | | | 5,000 | | | | 5,352,569 | |
Series K035, Class A2, 3.46%, 08/25/23(f) | | | 2,000 | | | | 2,093,851 | |
Series K037, Class A2, 3.49%, 01/25/24 | | | 2,700 | | | | 2,839,569 | |
Series K036, Class A2, 3.53%, 10/25/23(f) | | | 1,200 | | | | 1,261,061 | |
Series K034, Class A2, 3.53%, 07/25/23(f) | | | 3,900 | | | | 4,090,762 | |
Series K730, Class A2, 3.59%, 01/25/25(f) | | | 9,000 | | | | 9,545,012 | |
Series K088, Class A2, 3.69%, 01/25/29 | | | 500 | | | | 546,715 | |
Series K076, Class A2, 3.90%, 04/25/28 | | | 2,000 | | | | 2,209,952 | |
Series K081, Class A2, 3.90%, 08/25/28(f) | | | 5,000 | | | | 5,534,799 | |
Series K013, Class A2, 3.97%, 01/25/21(f) | | | 500 | | | | 507,456 | |
| | | | | | | | |
| | | | | | | 88,073,456 | |
|
| Mortgage-Backed Securities — 28.1% | |
Fannie Mae Mortgage-Backed Securities: | | | | | | | | |
(12 mo. LIBOR US + 1.54%), 2.02%, 06/01/43(g) | | | 329 | | | | 337,645 | |
2.50%, 09/01/28 - 01/01/50(h) | | | 149,883 | | | | 150,751,608 | |
3.00%, 01/01/27 - 01/01/50(h) | | | 491,776 | | | | 502,446,255 | |
3.50%, 02/01/26 - 11/01/51(h) | | | 419,530 | | | | 436,713,616 | |
(12 mo. LIBOR US + 1.83%), 3.77%, 11/01/40(g) | | | 7 | | | | 7,091 | |
4.00%, 10/01/25 - 02/01/57(h) | | | 354,877 | | | | 375,106,915 | |
(12 mo. LIBOR US + 1.75%), 4.35%, 08/01/41(g) | | | 10 | | | | 10,658 | |
(12 mo. LIBOR US + 1.53%), 4.41%,04/01/43 - 05/01/43(g) | | | 151 | | | | 156,549 | |
(12 mo. LIBOR US + 1.70%), 4.45%, 08/01/42(g) | | | 41 | | | | 42,540 | |
4.50%, 05/01/24 - 01/01/50(h) | | | 141,405 | | | | 150,536,910 | |
5.00%, 11/01/33 - 01/01/50(h) | | | 39,123 | | | | 42,261,996 | |
5.50%, 04/01/36 - 01/01/50(h) | | | 31,442 | | | | 34,037,286 | |
6.00%, 03/01/34 - 01/01/50(h) | | | 11,075 | | | | 12,349,815 | |
6.50%, 07/01/32 | | | 86 | | | | 96,258 | |
7.00%, 02/01/32 | | | 12 | | | | 12,021 | |
Freddie Mac Mortgage-Backed Securities: | | | | | | | | |
2.50%, 07/01/28 - 10/01/49 | | | 27,494 | | | | 27,818,842 | |
3.00%, 03/01/27 - 12/01/49 | | | 154,545 | | | | 158,524,819 | |
3.50%, 03/01/32 - 11/01/49 | | | 221,271 | | | | 230,461,779 | |
4.00%, 05/01/33 - 06/01/49 | | | 81,149 | | | | 85,158,713 | |
(12 mo. LIBOR US + 1.77%), 4.37%, 08/01/41(g) | | | 10 | | | | 10,285 | |
(12 mo. LIBOR US + 1.50%), 4.37%, 06/01/43(g) | | | 21 | | | | 21,255 | |
| | |
| 56 | | 2019 BLACKROCK ANNUAL REPORTTO SHAREHOLDERS |
| | |
Schedule of Investments (continued) December 31, 2019 | | U.S. Total Bond Index Master Portfolio (Percentages shown are based on Net Assets) |
| | | | | | | | |
| Security | | Par
(000) | | | Value | |
|
| Mortgage-Backed Securities (continued) | |
4.50%, 06/01/38 - 01/01/49 | | $ | 36,093 | | | $ | 38,429,049 | |
(12 mo. LIBOR US + 1.82%), 4.52%, 09/01/40(g) | | | 24 | | | | 24,765 | |
5.00%, 04/01/33 - 04/01/49 | | | 7,479 | | | | 8,048,649 | |
5.50%, 06/01/35 - 01/01/39 | | | 138 | | | | 154,512 | |
6.50%, 06/01/31 | | | 20 | | | | 22,193 | |
8.00%, 12/01/24 | | | 62 | | | | 65,670 | |
Ginnie Mae Mortgage-Backed Securities: | | | | | | | | |
2.50%, 05/20/45 - 01/01/50(h) | | | 5,544 | | | | 5,583,101 | |
3.00%, 01/20/43 - 01/01/50(h) | | | 231,484 | | | | 238,671,442 | |
3.50%, 09/20/42 - 01/01/50(h) | | | 302,305 | | | | 314,265,333 | |
4.00%, 03/15/41 - 01/01/50(h) | | | 186,785 | | | | 194,603,411 | |
4.50%, 07/15/39 - 01/01/50(h) | | | 87,908 | | | | 92,454,411 | |
5.00%, 11/15/39 - 01/01/50(h) | | | 38,135 | | | | 40,479,442 | |
5.50%, 12/15/32 - 04/20/48 | | | 538 | | | | 585,366 | |
6.00%, 03/15/35 - 10/20/38 | | | 157 | | | | 178,027 | |
6.50%, 09/15/36 | | | 97 | | | | 110,686 | |
7.50%, 12/15/23 | | | 51 | | | | 53,613 | |
| | | | | | | | |
| | | | | | | 3,140,592,526 | |
| | | | | | | | |
| |
Total U.S. Government Sponsored Agency Securities — 29.7%
(Cost — $3,253,138,779) | | | | 3,326,272,718 | |
| | | | | |
|
| U.S. Treasury Obligations — 40.9% | |
U.S. Treasury Bonds: | | | | | | | | |
6.13%, 08/15/29(a) | | | 7,500 | | | | 10,287,598 | |
5.38%, 02/15/31(a) | | | 6,000 | | | | 8,058,516 | |
4.50%, 02/15/36(a) | | | 18,000 | | | | 23,896,406 | |
4.75%, 02/15/37(a) | | | 1,450 | | | | 1,997,771 | |
5.00%, 05/15/37 | | | 9,000 | | | | 12,755,742 | |
4.38%, 02/15/38 | | | 6,000 | | | | 7,992,188 | |
4.50%, 05/15/38(a) | | | 1,000 | | | | 1,353,164 | |
3.50%, 02/15/39(a) | | | 11,300 | | | | 13,563,973 | |
4.25%, 05/15/39 | | | 11,775 | | | | 15,520,002 | |
4.50%, 08/15/39(a) | | | 1,700 | | | | 2,310,738 | |
4.38%, 11/15/39 | | | 4,800 | | | | 6,434,063 | |
4.63%, 02/15/40(a) | | | 1,230 | | | | 1,703,262 | |
4.38%, 05/15/40 | | | 1,650 | | | | 2,219,057 | |
3.88%, 08/15/40 | | | 3,860 | | | | 4,873,401 | |
4.25%, 11/15/40(a) | | | 7,528 | | | | 9,979,599 | |
4.75%, 02/15/41(a) | | | 11,000 | | | | 15,543,086 | |
4.38%, 05/15/41 | | | 12,610 | | | | 17,027,933 | |
3.75%, 08/15/41 | | | 9,550 | | | | 11,877,813 | |
3.13%, 11/15/41 | | | 10,700 | | | | 12,160,383 | |
3.13%, 02/15/42 | | | 34,350 | | | | 39,040,922 | |
3.00%, 05/15/42(a) | | | 13,480 | | | | 15,026,514 | |
2.75%, 08/15/42(a) | | | 18,250 | | | | 19,531,064 | |
2.75%, 11/15/42(a) | | | 42,500 | | | | 45,451,758 | |
3.13%, 02/15/43 | | | 21,000 | | | | 23,865,352 | |
2.88%, 05/15/43 | | | 24,750 | | | | 27,021,006 | |
3.63%, 08/15/43(a) | | | 7,500 | | | | 9,216,211 | |
3.75%, 11/15/43(a) | | | 64,700 | | | | 81,074,660 | |
3.63%, 02/15/44 | | | 11,000 | | | | 13,545,898 | |
3.38%, 05/15/44(a) | | | 7,600 | | | | 9,013,125 | |
3.13%, 08/15/44 | | | 2,000 | | | | 2,280,078 | |
3.00%, 11/15/44 | | | 6,300 | | | | 7,038,281 | |
2.50%, 02/15/45 | | | 23,500 | | | | 24,034,258 | |
3.00%, 05/15/45 | | | 15,600 | | | | 17,455,547 | |
2.88%, 08/15/45 | | | 18,800 | | | | 20,599,219 | |
3.00%, 11/15/45(a) | | | 15,900 | | | | 17,829,117 | |
2.50%, 02/15/46 | | | 18,600 | | | | 19,036,664 | |
2.50%, 05/15/46(a) | | | 25,850 | | | | 26,456,869 | |
2.25%, 08/15/46 | | | 26,500 | | | | 25,818,867 | |
2.88%, 11/15/46 | | | 8,500 | | | | 9,346,680 | |
| | | | | | | | |
| Security | | Par
(000) | | | Value | |
| U.S. Treasury Obligations (continued) | |
3.00%, 02/15/47(a) | | $ | 9,000 | | | $ | 10,136,953 | |
3.00%, 05/15/47(a) | | | 18,200 | | | | 20,498,461 | |
2.75%, 08/15/47(a) | | | 35,500 | | | | 38,166,660 | |
2.75%, 11/15/47 | | | 30,000 | | | | 32,253,516 | |
3.00%, 02/15/48 | | | 8,000 | | | | 9,016,250 | |
3.13%, 05/15/48(a) | | | 32,500 | | | | 37,517,188 | |
3.00%, 08/15/48 | | | 9,000 | | | | 10,161,914 | |
3.38%, 11/15/48 | | | 14,700 | | | | 17,782,406 | |
2.88%, 05/15/49 | | | 6,500 | | | | 7,183,770 | |
2.25%, 08/15/49(a) | | | 25,000 | | | | 24,320,313 | |
2.38%, 11/15/49(a) | | | 62,000 | | | | 61,968,516 | |
U.S. Treasury Notes: | | | | | | | | |
2.13%, 01/31/21(a) | | | 11,800 | | | | 11,861,766 | |
3.63%, 02/15/21(a) | | | 2,310 | | | | 2,360,531 | |
1.13%, 02/28/21 | | | 60,000 | | | | 59,648,437 | |
2.00%, 02/28/21 | | | 32,700 | | | | 32,834,121 | |
1.25%, 03/31/21 | | | 9,000 | | | | 8,958,867 | |
2.25%, 03/31/21 | | | 11,500 | | | | 11,587,598 | |
1.38%, 04/30/21(a) | | | 60,000 | | | | 59,817,187 | |
2.25%, 04/30/21(a) | | | 50,000 | | | | 50,421,875 | |
2.63%, 05/15/21(a) | | | 120,000 | | | | 121,650,000 | |
3.13%, 05/15/21 | | | 3,000 | | | | 3,061,289 | |
2.00%, 05/31/21 | | | 5,000 | | | | 5,027,539 | |
2.63%, 06/15/21 | | | 16,000 | | | | 16,232,500 | |
1.13%, 06/30/21(a) | | | 4,500 | | | | 4,468,535 | |
2.13%, 06/30/21(a) | | | 20,000 | | | | 20,157,812 | |
2.63%, 07/15/21(a) | | | 74,000 | | | | 75,150,469 | |
2.25%, 07/31/21(a) | | | 12,804 | | | | 12,933,040 | |
2.75%, 08/15/21 | | | 20,000 | | | | 20,364,844 | |
1.13%, 08/31/21 | | | 18,000 | | | | 17,861,484 | |
2.00%, 08/31/21 | | | 8,500 | | | | 8,556,113 | |
2.75%, 09/15/21 | | | 50,000 | | | | 50,958,984 | |
1.13%, 09/30/21 | | | 20,000 | | | | 19,839,062 | |
2.13%, 09/30/21(a) | | | 122,900 | | | | 123,999,379 | |
1.25%, 10/31/21 | | | 8,000 | | | | 7,951,875 | |
1.50%, 10/31/21 | | | 150,000 | | | | 149,794,921 | |
2.00%, 10/31/21(a) | | | 9,000 | | | | 9,067,148 | |
2.00%, 11/15/21(a) | | | 13,700 | | | | 13,808,101 | |
1.75%, 11/30/21 | | | 16,000 | | | | 16,049,375 | |
1.88%, 11/30/21(a) | | | 53,000 | | | | 53,308,476 | |
2.00%, 12/31/21(a) | | | 12,000 | | | | 12,096,094 | |
2.13%, 12/31/21(a) | | | 10,000 | | | | 10,105,078 | |
2.50%, 01/15/22 | | | 25,000 | | | | 25,452,149 | |
1.50%, 01/31/22(a) | | | 3,500 | | | | 3,494,805 | |
1.88%, 01/31/22(a) | | | 59,000 | | | | 59,345,703 | |
1.75%, 02/28/22 | | | 1,500 | | | | 1,505,625 | |
1.88%, 02/28/22 | | | 5,000 | | | | 5,030,664 | |
1.75%, 03/31/22(a) | | | 9,100 | | | | 9,134,125 | |
1.88%, 03/31/22 | | | 18,000 | | | | 18,114,609 | |
2.25%, 04/15/22 | | | 20,000 | | | | 20,293,750 | |
1.75%, 04/30/22 | | | 10,000 | | | | 10,037,500 | |
1.88%, 04/30/22 | | | 5,000 | | | | 5,032,422 | |
1.75%, 05/31/22(a) | | | 3,000 | | | | 3,011,719 | |
1.75%, 06/30/22(a) | | | 18,000 | | | | 18,074,531 | |
2.13%, 06/30/22(a) | | | 18,000 | | | | 18,237,656 | |
1.88%, 07/31/22 | | | 40,000 | | | | 40,282,812 | |
2.00%, 07/31/22 | | | 15,000 | | | | 15,154,688 | |
1.88%, 08/31/22(a) | | | 34,958 | | | | 35,214,723 | |
1.50%, 09/15/22 | | | 20,000 | | | | 19,953,906 | |
1.75%, 09/30/22(a) | | | 23,000 | | | | 23,092,539 | |
1.88%, 09/30/22 | | | 10,000 | | | | 10,076,172 | |
1.38%, 10/15/22 | | | 20,000 | | | | 19,878,125 | |
1.88%, 10/31/22 | | | 17,000 | | | | 17,126,836 | |
| | | | |
| SCHEDULE OF INVESTMENTS | | | 57 | |
| | |
Schedule of Investments (continued) December 31, 2019 | | U.S. Total Bond Index Master Portfolio (Percentages shown are based on Net Assets) |
| | | | | | | | |
| Security | | Par
(000) | | | Value | |
| U.S. Treasury Obligations (continued) | |
2.00%, 10/31/22 | | $ | 10,000 | | | $ | 10,109,766 | |
1.63%, 11/15/22(a) | | | 50,000 | | | | 50,037,110 | |
7.63%, 11/15/22(a) | | | 3,400 | | | | 3,974,281 | |
2.00%, 11/30/22(a) | | | 36,000 | | | | 36,406,406 | |
2.13%, 12/31/22 | | | 45,000 | | | | 45,685,547 | |
1.75%, 01/31/23 | | | 20,000 | | | | 20,082,812 | |
2.00%, 02/15/23 | | | 8,000 | | | | 8,093,750 | |
1.50%, 02/28/23(a) | | | 10,200 | | | | 10,164,539 | |
1.50%, 03/31/23 | | | 31,500 | | | | 31,385,566 | |
1.63%, 04/30/23 | | | 19,000 | | | | 18,998,516 | |
2.75%, 04/30/23(a) | | | 26,600 | | | | 27,563,211 | |
1.75%, 05/15/23 | | | 1,000 | | | | 1,003,867 | |
1.63%, 05/31/23 | | | 4,000 | | | | 4,000,156 | |
1.38%, 06/30/23 | | | 26,500 | | | | 26,269,160 | |
2.63%, 06/30/23(a) | | | 133,000 | | | | 137,499,140 | |
1.25%, 07/31/23 | | | 4,000 | | | | 3,946,406 | |
2.75%, 07/31/23(a) | | | 46,000 | | | | 47,768,125 | |
2.50%, 08/15/23 | | | 16,000 | | | | 16,479,375 | |
6.25%, 08/15/23 | | | 2,050 | | | | 2,381,443 | |
1.38%, 08/31/23(a) | | | 38,000 | | | | 37,649,688 | |
1.38%, 09/30/23(a) | | | 4,000 | | | | 3,960,156 | |
2.88%, 09/30/23(a) | | | 6,000 | | | | 6,266,484 | |
1.63%, 10/31/23 | | | 15,000 | | | | 14,986,523 | |
2.75%, 11/15/23 | | | 28,000 | | | | 29,142,969 | |
2.13%, 11/30/23 | | | 54,000 | | | | 54,961,875 | |
2.25%, 12/31/23(a) | | | 11,000 | | | | 11,250,508 | |
2.63%, 12/31/23 | | | 10,000 | | | | 10,373,047 | |
2.25%, 01/31/24 | | | 40,000 | | | | 40,926,562 | |
2.50%, 01/31/24 | | | 65,000 | | | | 67,140,430 | |
2.75%, 02/15/24(a) | | | 15,000 | | | | 15,646,289 | |
2.13%, 02/29/24 | | | 13,000 | | | | 13,241,211 | |
2.13%, 03/31/24 | | | 10,000 | | | | 10,185,938 | |
2.00%, 04/30/24 | | | 22,000 | | | | 22,301,641 | |
2.50%, 05/15/24 | | | 22,300 | | | | 23,074,402 | |
2.00%, 05/31/24 | | | 5,700 | | | | 5,779,043 | |
1.75%, 06/30/24(a) | | | 70,000 | | | | 70,221,484 | |
2.00%, 06/30/24 | | | 40,000 | | | | 40,554,688 | |
2.38%, 08/15/24(a) | | | 7,500 | | | | 7,729,688 | |
1.88%, 08/31/24(a) | | | 5,000 | | | | 5,043,164 | |
1.50%, 09/30/24(a) | | | 75,000 | | | | 74,375,977 | |
2.13%, 09/30/24(a) | | | 20,000 | | | | 20,400,000 | |
1.50%, 10/31/24 | | | 50,000 | | | | 49,583,985 | |
2.25%, 10/31/24(a) | | | 5,000 | | | | 5,130,859 | |
2.25%, 11/15/24(a) | | | 57,000 | | | | 58,494,024 | |
7.50%, 11/15/24(a) | | | 5,000 | | | | 6,350,391 | |
2.13%, 11/30/24 | | | 15,000 | | | | 15,306,445 | |
2.25%, 12/31/24 | | | 55,000 | | | | 56,465,234 | |
2.00%, 02/15/25(a) | | | 21,984 | | | | 22,301,737 | |
7.63%, 02/15/25 | | | 375 | | | | 483,457 | |
2.75%, 02/28/25 | | | 30,000 | | | | 31,551,563 | |
2.13%, 05/15/25 | | | 24,000 | | | | 24,495,000 | |
2.75%, 06/30/25 | | | 28,000 | | | | 29,494,063 | |
2.88%, 07/31/25(a) | | | 50,000 | | | | 53,021,484 | |
2.00%, 08/15/25 | | | 56,800 | | | | 57,578,781 | |
6.88%, 08/15/25(a) | | | 8,000 | | | | 10,205,625 | |
3.00%, 09/30/25(a) | | | 38,000 | | | | 40,591,719 | |
3.00%, 10/31/25(a) | | | 15,000 | | | | 16,031,836 | |
2.25%, 11/15/25 | | | 16,600 | | | | 17,051,961 | |
2.63%, 01/31/26 | | | 15,000 | | | | 15,734,180 | |
1.63%, 02/15/26(a) | | | 68,000 | | | | 67,402,344 | |
6.00%, 02/15/26(a) | | | 7,660 | | | | 9,537,274 | |
1.63%, 05/15/26 | | | 36,350 | | | | 35,982,240 | |
1.50%, 08/15/26 | | | 27,500 | | | | 26,968,262 | |
| | | | | | | | |
| Security | | Par
(000) | | | Value | |
| U.S. Treasury Obligations (continued) | |
6.75%, 08/15/26(a) | | $ | 7,500 | | | $ | 9,823,535 | |
1.63%, 09/30/26 | | | 15,000 | | | | 14,821,289 | |
1.63%, 10/31/26 | | | 60,000 | | | | 59,252,344 | |
2.00%, 11/15/26 | | | 15,000 | | | | 15,174,023 | |
6.50%, 11/15/26 | | | 900 | | | | 1,173,586 | |
1.63%, 11/30/26 | | | 30,000 | | | | 29,620,313 | |
6.63%, 02/15/27(a) | | | 3,500 | | | | 4,624,922 | |
2.38%, 05/15/27 | | | 13,000 | | | | 13,484,961 | |
2.25%, 08/15/27(a) | | | 28,500 | | | | 29,313,809 | |
6.38%, 08/15/27 | | | 3,000 | | | | 3,970,078 | |
2.25%, 11/15/27(a) | | | 98,510 | | | | 101,311,378 | |
2.75%, 02/15/28 | | | 20,000 | | | | 21,322,656 | |
2.88%, 05/15/28 | | | 14,000 | | | | 15,078,984 | |
2.88%, 08/15/28(a) | | | 70,000 | | | | 75,496,093 | |
3.13%, 11/15/28(a) | | | 30,000 | | | | 33,008,203 | |
5.25%, 11/15/28(a) | | | 9,000 | | | | 11,465,508 | |
2.63%, 02/15/29(a) | | | 23,884 | | | | 25,330,102 | |
5.25%, 02/15/29(a) | | | 5,000 | | | | 6,397,852 | |
1.63%, 08/15/29(a) | | | 75,000 | | | | 73,122,070 | |
| | | | | | | | |
| |
Total U.S. Treasury Obligations — 40.9%
(Cost — $4,424,571,917) | | | | 4,569,335,404 | |
| | | | | |
| |
Total Long-Term Investments — 101.3%
(Cost — $10,931,359,590) | | | | 11,335,771,331 | |
| | | | | |
| | |
| | | Shares | | | | |
|
| Short-Term Securities — 19.9% | |
BlackRock Cash Funds: Institutional, SL Agency Shares, | | | | | | | | |
1.87%(i)(j)(k) | | | 2,221,384,022 | | | | 2,222,272,575 | |
BlackRock Cash Funds: Treasury, SL Agency Shares, | | | | | | | | |
1.55%(i)(k) | | | 100,000 | | | | 100,000 | |
| | | | | | | | |
| |
Total Short-Term Securities — 19.9%
(Cost — $2,222,030,290) | | | | 2,222,372,575 | |
| | | | | |
| |
Total Investments Before TBA Sale Commitments — 121.2%
(Cost — $13,153,389,880) | | | | 13,558,143,906 | |
| | | | | |
|
TBA Sale Commitments(h) — (0.6%) | |
|
Mortgage-Backed Securities — (0.6%) | |
Fannie Mae Mortgage-Backed Securities: | | | | | | | | |
2.50%, 01/16/35 | | USD | 8,440 | | | | (8,517,147 | ) |
3.00%, 01/16/35 - 01/14/50 | | | 35,967 | | | | (36,528,334 | ) |
3.50%, 01/14/50 | | | 3,287 | | | | (3,381,373 | ) |
4.50%, 01/14/50 | | | 8,119 | | | | (8,548,102 | ) |
Ginnie Mae Mortgage-Backed Securities: | | | | | | | | |
3.00%, 01/21/50 | | | 4,183 | | | | (4,297,542 | ) |
3.50%, 01/21/50 | | | 6,297 | | | | (6,489,600 | ) |
| | | | | | | | |
| |
Total TBA Sale Commitments — (0.6)%
(Proceeds — $67,631,073) | | | | (67,762,098 | ) |
| | | | | |
| |
Total Investments, Net of TBA Sale Commitments — 120.6%
(Cost — $13,085,758,807) | | | | 13,490,381,808 | |
| |
Liabilities in Excess of Other Assets — (20.6)% | | | | (2,307,737,256 | ) |
| | | | | |
| |
Net Assets — 100.0% | | | $ | 11,182,644,552 | |
| | | | | |
| (a) | Security, or a portion of the security, is on loan. |
| (b) | Security exempt from registration pursuant to Rule 144A under the Securities Act of 1933, as amended. These securities may be resold in transactions exempt from registration to qualified institutional investors. |
| (c) | Variable rate security. Security may be issued at a fixed coupon rate, which converts to a variable rate at a specified date. Rate shown is the rate in effect as of period end. |
| | |
| 58 | | 2019 BLACKROCK ANNUAL REPORTTO SHAREHOLDERS |
| | |
Schedule of Investments (continued) December 31, 2019 | | U.S. Total Bond Index Master Portfolio |
| (d) | Step-up bond that pays an initial coupon rate for the first period and then a higher coupon rate for the following periods. Rate as of period end. |
| (e) | When-issued security. |
| (f) | Variable or floating rate security, which interest rate adjusts periodically based on changes in current interest rates and prepayments on the underlying pool of assets. Rate shown is the rate in effect as of period end. |
| (g) | Variable rate security. Rate shown is the rate in effect as of period end. |
| (h) | Represents or includes a TBA transaction. |
| (i) | Annualized7-day yield as of period end. |
| (j) | All or a portion of security was purchased with the cash collateral from loaned securities |
| (k) | During the year ended December 31, 2019, investments in issuers considered to be an affiliate/affiliates of the Master Portfolio for purposes of Section 2(a)(3) of the Investment Company Act of 1940, as amended, were as follows: |
| | | | | | | | | | | | | | | | | | | | | | | | | | | | |
| Affiliate | | Shares
Held at
12/31/18 | | | Net
Activity | | | Shares
Held at
12/31/19 | | | Value at
12/31/19 | | | Income | | | Net
Realized
Gain (Loss) (a) | | | Change in
Unrealized
Appreciation
(Depreciation) | |
BlackRock Cash Funds: Institutional,
SL Agency Shares | | | 794,588,139 | | | | 1,426,795,883 | | | | 2,221,384,022 | | | $ | 2,222,272,575 | | | $ | 21,095,816 | (b) | | $ | 385,746 | | | $ | 296,148 | |
BlackRock Cash Funds: Treasury,
SL Agency Shares | | | 100,000 | | | | — | | | | 100,000 | | | | 100,000 | | | | 2,129 | | | | — | | | | — | |
| | | | | | | | | | | | | | | | | | | | | | | | | | | | |
| | | | | | | | | | | | | | $ | 2,222,372,575 | | | $ | 21,097,945 | | | $ | 385,746 | | | $ | 296,148 | |
| | | | | | | | | | | | | | | | | | | | | | | | | | | | |
| | (a) | Includes net capital gain distributions, if applicable. | |
| | (b) | All or a portion represents securities lending income earned from the reinvestment of cash collateral from loaned securities, net of fees and collateral investment expenses, and other payments to and from borrowers of securities. | |
For Master Portfolio compliance purposes, the Master Portfolio’s industry classifications refer to one or more of the industry sub-classifications used by one or more widely recognized market indexes or ratings group indexes, and/or as defined by the investment advisor. These definitions may not apply for purposes of this report, which may combine such industrysub-classifications for reporting ease.
Fair Value Hierarchy as of Period End
Various inputs are used in determining the fair value of investments. For information about the Master Portfolio’s policy regarding valuation of investments, refer to the Notes to Financial Statements.
The following table summarizes the Master Portfolio’s investments categorized in the disclosure hierarchy:
| | | | | | | | | | | | | | | | |
| | | Level 1 | | | Level 2 | | | Level 3 | | | Total | |
Assets: | |
Investments: | |
Long-Term Investments(a) | | $ | — | | | $ | 11,335,771,331 | | | $ | — | | | $ | 11,335,771,331 | |
Short-Term Securities | | | 2,222,372,575 | | | | — | | | | — | | | | 2,222,372,575 | |
Liabilities: | |
Investments: | |
TBA Sale Commitments | | $ | — | | | $ | (67,762,098 | ) | | $ | — | | | $ | (67,762,098 | ) |
| | | | | | | | | | | | | | | | |
| | $ | 2,222,372,575 | | | $ | 11,268,009,233 | | | $ | — | | | $ | 13,490,381,808 | |
| | | | | | | | | | | | | | | | |
| (a) | See above Schedule of Investments for values in each industry/state/security type. |
See notes to financial statements.
| | | | |
| SCHEDULE OF INVESTMENTS | | | 59 | |
Statement of Assets and Liabilities
December 31, 2019
| | | | |
| | | U.S. Total
Bond Index
Master Portfolio | |
|
ASSETS | |
Investments at value — unaffiliated (including securities loaned at value of $1,530,998,508, cost — $10,931,359,590) | | $ | 11,335,771,331 | |
Investments at value — affiliated (cost — $2,222,030,290) | | | 2,222,372,575 | |
Cash | | | 11,653 | |
Receivables: | |
Investments sold | | | 137,735,940 | |
Securities lending income — affiliated | | | 616,195 | |
TBA sale commitments | | | 67,631,073 | |
Contributions from investors | | | 10,952,880 | |
Dividends — unaffiliated | | | 1,058,092 | |
Interest — unaffiliated | | | 64,663,203 | |
Principal paydowns | | | 2,594 | |
| | | | |
Total assets | | | 13,840,815,536 | |
| | | | |
|
LIABILITIES | |
Cash collateral on securities loaned at value | | | 1,574,802,234 | |
TBA sale commitments at value (proceeds — $67,631,073) | | | 67,762,098 | |
Payables: | |
Investments purchased | | | 1,014,285,376 | |
Withdrawals to investors | | | 644,602 | |
Investment advisory fees | | | 593,689 | |
Trustees’ fees | | | 42,194 | |
Other accrued expenses | | | 40,791 | |
| | | | |
Total liabilities | | | 2,658,170,984 | |
| | | | |
| |
NET ASSETS | | $ | 11,182,644,552 | |
| | | | |
|
NET ASSETS CONSIST OF | |
Investors’ capital | | $ | 10,778,137,162 | |
Net unrealized appreciation (depreciation) | | | 404,507,390 | |
| | | | |
NET ASSETS | | $ | 11,182,644,552 | |
| | | | |
See notes to financial statements.
| | |
| 60 | | 2019 BLACKROCK ANNUAL REPORTTO SHAREHOLDERS |
Statement of Operations
Year Ended December 31, 2019
| | | | |
| | | U.S. Total Bond Index Master Portfolio | |
| |
INVESTMENT INCOME | | | | |
Dividends — affiliated | | $ | 16,659,271 | |
Interest — unaffiliated | | | 267,413,171 | |
Securities lending income — affiliated — net | | | 4,438,674 | |
Other income — affiliated | | | 529,200 | (a) |
| | | | |
Total investment income | | | 289,040,316 | |
| | | | |
| |
EXPENSES | | | | |
Investment advisory | | | 3,937,273 | |
Trustees | | | 145,562 | |
Professional | | | 49,969 | |
| | | | |
Total expenses | | | 4,132,804 | |
Less fees waived and/or reimbursed by the Manager | | | (681,997 | ) |
| | | | |
Total expenses after fees waived and/or reimbursed | | | 3,450,807 | |
| | | | |
Net investment income | | | 285,589,509 | |
| | | | |
| |
REALIZED AND UNREALIZED GAIN | | | | |
Net realized gain from: | | | | |
Investments — affiliated | | | 385,746 | |
Investments — unaffiliated | | | 39,605,176 | |
| | | | |
| | | 39,990,922 | |
| | | | |
Net change in unrealized appreciation on: | | | | |
Investments — affiliated | | | 296,148 | |
Investments — unaffiliated | | | 474,538,987 | |
| | | | |
| | | 474,835,135 | |
| | | | |
Net realized and unrealized gain | | | 514,826,057 | |
| | | | |
NET INCREASE IN NET ASSETS RESULTING FROM OPERATIONS | | $ | 800,415,566 | |
| | | | |
| (a) | Includes a reimbursement from an affiliate of $529,200 relating to an operating event. |
See notes to financial statements.
Statements of Changes in Net Assets
| | | | | | | | |
| | | U.S. Total Bond Index
Master Portfolio | |
| | | Year Ended December 31, | |
| | | 2019 | | | 2018 | |
| | |
INCREASE (DECREASE) IN NET ASSETS | | | | | | | | |
| | |
OPERATIONS | | | | | | | | |
Net investment income | | $ | 285,589,509 | | | $ | 170,905,829 | |
Net realized gain (loss) | | | 39,990,922 | | | | (35,233,237 | ) |
Net change in unrealized appreciation (depreciation) | | | 474,835,135 | | | | (74,163,353 | ) |
| | | | | | | | |
Net increase in net assets resulting from operations | | | 800,415,566 | | | | 61,509,239 | |
| | | | | | | | |
| | |
CAPITAL TRANSACTIONS | | | | | | | | |
Proceeds from contributions | | | 3,801,148,795 | | | | 6,455,698,739 | |
Value of withdrawals | | | (1,746,558,904 | ) | | | (3,237,334,937 | ) |
| | | | | | | | |
Net increase in net assets derived from capital transactions | | | 2,054,589,891 | | | | 3,218,363,802 | |
| | | | | | | | |
|
NET ASSETS | |
Total increase in net assets | | | 2,855,005,457 | | | | 3,279,873,041 | |
Beginning of year | | | 8,327,639,095 | | | | 5,047,766,054 | |
| | | | | | | | |
End of year | | $ | 11,182,644,552 | | | $ | 8,327,639,095 | |
| | | | | | | | |
See notes to financial statements.
| | |
| 62 | | 2019 BLACKROCK ANNUAL REPORTTO SHAREHOLDERS |
Financial Highlights
(For a share outstanding throughout each period)
| | | | | | | | | | | | | | | | | | | | |
| | | U.S. Total Bond Index Master Portfolio | |
| |
| | | Year Ended December 31, | |
| | | 2019 | | | 2018 | | | 2017 | | | 2016 | | | 2015 | |
| | | | | |
Total Return | | | | | | | | | | | | | | | | | | | | |
Total return | | | 8.72 | %(a) | | | (0.07 | )% | | | 3.40 | % | | | 2.55 | % | | | 0.40 | % |
| | | | | | | | | | | | | | | | | | | | |
|
Ratios to Average Net Assets(b) | |
Total expenses | | | 0.04 | % | | | 0.04 | % | | | 0.04 | % | | | 0.04 | % | | | 0.06 | % |
| | | | | | | | | | | | | | | | | | | | |
Total expenses after fees waived and/or reimbursed and paid indirectly | | | 0.04 | % | | | 0.03 | % | | | 0.03 | % | | | 0.03 | % | | | 0.04 | % |
| | | | | | | | | | | | | | | | | | | | |
Net investment income | | | 2.90 | % | | | 2.74 | % | | | 2.22 | % | | | 2.02 | % | | | 1.93 | % |
| | | | | | | | | | | | | | | | | | | | |
| | | | | |
Supplemental Data | | | | | | | | | | | | | | | | | | | | |
Net assets, end of year (000) | | $ | 11,182,645 | | | $ | 8,327,639 | | | $ | 5,047,766 | | | $ | 3,018,237 | | | $ | 1,588,374 | |
| | | | | | | | | | | | | | | | | | | | |
Portfolio turnover rate(c)(d) | | | 158 | % | | | 274 | % | | | 345 | % | | | 278 | % | | | 356 | % |
| | | | | | | | | | | | | | | | | | | | |
| (a) | Includes payment received from an affiliate, which had no impact on the Fund’s total return. |
| (b) | Excludes expenses incurred indirectly as a result of investments in underlying funds: |
| | | | | | | | | | | | | | | | | | | | |
| | | Year Ended December 31, | |
| | | 2019 | | | 2018 | | | 2017 | | | 2016 | | | 2015 | |
Investments in underlying funds | | | 0.01 | % | | | 0.01 | % | | | 0.01 | % | | | 0.01 | % | | | 0.02 | % |
| | | | | | | | | | | | | | | | | | | | |
| (c) | Portfolio turnover rates include TBA transactions, if any. |
| (d) | Includes mortgage dollar roll transactions (“MDRs”). Additional information regarding portfolio turnover rate is as follows: |
| | | | | | | | | | | | | | | | | | | | |
| | | Year Ended December 31, | |
| | | 2019 | | | 2018 | | | 2017 | | | 2016 | | | 2015 | |
Portfolio turnover rate(excluding MDRs) | | | 97 | % | | | 162 | % | | | 193 | % | | | 164 | % | | | 300 | % |
| | | | | | | | | | | | | | | | | | | | |
Notes to Financial Statements
Master Investment Portfolio (“MIP”) is registered under the Investment Company Act of 1940, as amended (the “1940 Act”), as anopen-end management investment company. MIP is organized as a Delaware statutory trust. U.S. Total Bond Index Master Portfolio (the “Master Portfolio”) is a series of MIP. The Master Portfolio is classified as diversified.
The Master Portfolio, together with certain other registered investment companies advised by BlackRock Fund Advisors (“BFA” or the “Manager”) or its affiliates, is included in a complex of equity, multi-asset, index and money market funds referred to as the BlackRock Multi-Asset Complex.
| 2. | SIGNIFICANT ACCOUNTING POLICIES |
The financial statements are prepared in conformity with accounting principles generally accepted in the United States of America (“U.S. GAAP”), which may require management to make estimates and assumptions that affect the reported amounts of assets and liabilities in the financial statements, disclosure of contingent assets and liabilities at the date of the financial statements and the reported amounts of increases and decreases in net assets from operations during the reporting period. Actual results could differ from those estimates. The Master Portfolio is considered an investment company under U.S. GAAP and follows the accounting and reporting guidance applicable to investment companies. Below is a summary of significant accounting policies:
Investment Transactions and Income Recognition:For financial reporting purposes, investment transactions are recorded on the dates the transactions are executed. Realized gains and losses on investment transactions are determined on the identified cost basis. Dividend income is recorded on theex-dividend date. Upon notification from issuers, a portion of the dividend income received from a real estate investment trust may be redesignated as a reduction of cost of the related investment and/or realized gain. Interest income, including amortization and accretion of premiums and discounts on debt securities, is recognized on an accrual basis.
Segregation and Collateralization:In cases where the Master Portfolio enters into certain investments (e.g., dollar rolls and TBA sale commitments) that would be treated as “senior securities” for 1940 Act purposes, the Master Portfolio may segregate or designate on itsbooks and records cash or liquid assets having a market value at least equal to the amount of its future obligations under such investments. Doing so allows the investment to be excluded from treatment as a “senior security.” Furthermore, if required by an exchange or counterparty agreement, the Master Portfolio may be required to deliver/deposit cash and/or securities to/with an exchange, or broker-dealer or custodian as collateral for certain investments or obligations.
Recent Accounting Standards:The Trust has adopted Financial Accounting Standards Board Accounting Standards Update2017-08 to amend the amortization period for certain purchased callable debt securities held at a premium. Under the new standard, the Trust has changed the amortization period for the premium on certain purchased callable debt securities withnon-contingent call features to the earliest call date. In accordance with the transition provisions of the standard, the Trust applied the amendments on a modified retrospective basis beginning with the fiscal period ended December 31, 2019. The adjusted cost basis of securities at December 31, 2018 is $9,084,044,723. This change in accounting policy has been made to comply with the newly issued accounting standard and had no impact on accumulated earnings (loss) or the net asset value of the Trust.
Indemnifications:In the normal course of business, the Master Portfolio enters into contracts that contain a variety of representations that provide general indemnification. The Master Portfolio’s maximum exposure under these arrangements is unknown because it involves future potential claims against the Master Portfolio, which cannot be predicted with any certainty.
Other: Expenses directly related to the Master Portfolio are charged to the Master Portfolio. Other operating expenses shared by several funds, including other funds managed by the Manager, are prorated among those funds on the basis of relative net assets or other appropriate methods.
| 3. | INVESTMENT VALUATION AND FAIR VALUE MEASUREMENTS |
Investment Valuation Policies: The Master Portfolio’s investments are valued at fair value (also referred to as “market value” within the financial statements) as of the close of trading on the New York Stock Exchange (“NYSE”) (generally 4:00 p.m., Eastern time). U.S. GAAP defines fair value as the price the Master Portfolio would receive to sell an asset or pay to transfer a liability in an orderly transaction between market participants at the measurement date. The Master Portfolio determines the fair values of its financial instruments using various independent dealers or pricing services under policies approved by the Board of Trustees of MIP (the “Board”). The BlackRock Global Valuation Methodologies Committee (the “Global Valuation Committee”) is the committee formed by management to develop global pricing policies and procedures and to oversee the pricing function for all financial instruments.
Fair Value Inputs and Methodologies: The following methods and inputs are used to establish the fair value of the Master Portfolio’s assets and liabilities:
| | • | | Fixed-income securities for which market quotations are readily available are generally valued using the last available bid prices or current market quotations provided by independent dealers or third party pricing services. Floating rate loan interests are valued at the mean of the bid prices from one or more independent brokers or dealers as obtained from a third party pricing service. Pricing services generally value fixed-income securities assuming orderly transactions of an institutional round lot size, but a fund may hold or transact in such securities in smaller, odd lot sizes. Odd lots may trade at lower prices than institutional round lots. The pricing services may use matrix pricing or valuation models that utilize certain inputs and assumptions to derive values, including transaction data (e.g., recent representative bids and offers), credit quality information, perceived market movements, news, and other relevant information. Certain fixed-income securities, including asset-backed and mortgage related securities may be valued based on valuation models that consider the estimated cash flows of each tranche of the entity, establish a benchmark yield and develop an estimated tranche specific spread to the benchmark yield based on the unique attributes of the tranche. The amortized cost method of valuation may be used with respect to debt obligations with sixty days or less remaining to maturity unless the Manager determines such method does not represent fair value. |
| | |
| 64 | | 2019 BLACKROCK ANNUAL REPORTTO SHAREHOLDERS |
Notes to Financial Statements (continued)
| | • | | Municipal investments (including commitments to purchase such investments on a “when-issued” basis) are valued on the basis of prices provided by dealers or pricing services. In determining the value of a particular investment, pricing services may use certain information with respect to transactions in such investments, quotations from dealers, pricing matrixes, market transactions in comparable investments and information with respect to various relationships between investments. |
| | • | | Investments inopen-end U.S. mutual funds are valued at net asset value (“NAV”) each business day. |
| | • | | To-be-announced (“TBA”) commitments are valued on the basis of last available bid prices or current market quotations provided by pricing services. |
If events (e.g., a company announcement, market volatility or a natural disaster) occur that are expected to materially affect the value of such investments, or in the event that the application of these methods of valuation results in a price for an investment that is deemed not to be representative of the market value of such investment, or if a price is not available, the investment will be valued by the Global Valuation Committee, or its delegate, in accordance with a policy approved by the Board as reflecting fair value (“Fair Valued Investments”). The fair valuation approaches that may be used by the Global Valuation Committee will include market approach, income approach and cost approach. Valuation techniques such as discounted cash flow, use of market comparables and matrix pricing are types of valuation approaches and are typically used in determining fair value. When determining the price for Fair Valued Investments, the Global Valuation Committee, or its delegate, seeks to determine the price that the Master Portfolio might reasonably expect to receive or pay from the current sale or purchase of that asset or liability in anarm’s-length transaction. Fair value determinations shall be based upon all available factors that the Global Valuation Committee, or its delegate, deems relevant and consistent with the principles of fair value measurement. The pricing of all Fair Valued Investments is subsequently reported to the Board or a committee thereof on a quarterly basis.
Fair Value Hierarchy: Various inputs are used in determining the fair value of investments. These inputs to valuation techniques are categorized into a fair value hierarchy consisting of three broad levels for financial statement purposes as follows:
| | • | | Level 1 — Unadjusted price quotations in active markets/exchanges for identical assets or liabilities that the Master Portfolio has the ability to access |
| | • | | Level 2 — Other observable inputs (including, but not limited to, quoted prices for similar assets or liabilities in markets that are active, quoted prices for identical or similar assets or liabilities in markets that are not active, inputs other than quoted prices that are observable for the assets or liabilities (such as interest rates, yield curves, volatilities, prepayment speeds, loss severities, credit risks and default rates) or other market-corroborated inputs) |
| | • | | Level 3 — Unobservable inputs based on the best information available in the circumstances, to the extent observable inputs are not available (including the Global Valuation Committee’s assumptions used in determining the fair value of investments) |
The hierarchy gives the highest priority to unadjusted quoted prices in active markets for identical assets or liabilities (Level 1 measurements) and the lowest priority to unobservable inputs (Level 3 measurements). Accordingly, the degree of judgment exercised in determining fair value is greatest for instruments categorized in Level 3. The inputs used to measure fair value may fall into different levels of the fair value hierarchy. In such cases, for disclosure purposes, the fair value hierarchy classification is determined based on the lowest level input that is significant to the fair value measurement in its entirety. Investments classified within Level 3 have significant unobservable inputs used by the Global Valuation Committee in determining the price for Fair Valued Investments. Level 3 investments include equity or debt issued by privately held companies or funds. There may not be a secondary market, and/or there are a limited number of investors. The categorization of a value determined for investments is based on the pricing transparency of the investments and is not necessarily an indication of the risks associated with investing in those securities.
| 4. | SECURITIES AND OTHER INVESTMENTS |
Asset-Backed and Mortgage-Backed Securities:Asset-backed securities are generally issued as pass-through certificates or as debt instruments. Asset-backed securities issued as pass-through certificates represent undivided fractional ownership interests in an underlying pool of assets. Asset-backed securities issued as debt instruments, which are also known as collateralized obligations, are typically issued as the debt of a special purpose entity organized solely for the purpose of owning such assets and issuing such debt. Asset-backed securities are often backed by a pool of assets representing the obligations of a number of different parties. The yield characteristics of certain asset-backed securities may differ from traditional debt securities. One such major difference is that all or a principal part of the obligations may be prepaid at any time because the underlying assets (i.e., loans) may be prepaid at any time. As a result, a decrease in interest rates in the market may result in increases in the level of prepayments as borrowers, particularly mortgagors, refinance and repay their loans. An increased prepayment rate with respect to an asset-backed security will have the effect of shortening the maturity of the security. In addition, the Master Portfolio may subsequently have to reinvest the proceeds at lower interest rates. If the Master Portfolio has purchased such an asset-backed security at a premium, a faster than anticipated prepayment rate could result in a loss of principal to the extent of the premium paid.
For mortgage pass-through securities (the “Mortgage Assets”) there are a number of important differences among the agencies and instrumentalities of the U.S. Government that issue mortgage-related securities and among the securities that they issue. For example, mortgage-related securities guaranteed by Ginnie Mae are guaranteed as to the timely payment of principal and interest by Ginnie Mae and such guarantee is backed by the full faith and credit of the United States. However, mortgage-related securities issued by Freddie Mac and Fannie Mae, including Freddie Mac and Fannie Mae guaranteed mortgage pass-through certificates, which are solely the obligations of Freddie Mac and Fannie Mae, are not backed by or entitled to the full faith and credit of the United States, but are supported by the right of the issuer to borrow from the U.S. Treasury.
Non-agency mortgage-backed securities are securities issued bynon-governmental issuers and have no direct or indirect government guarantees of payment and are subject to various risks.Non-agency mortgage loans are obligations of the borrowers thereunder only and are not typically insured or guaranteed by any other person or entity. The ability of a borrower to repay a loan is dependent upon the income or assets of the borrower. A number of factors, including a general economic downturn, acts of God, terrorism, social unrest and civil disturbances, may impair a borrower’s ability to repay its loans.
| | | | |
| NOTESTO FINANCIAL STATEMENTS | | | 65 | |
Notes to Financial Statements (continued)
Multiple Class Pass-Through Securities: Multiple class pass-through securities, including collateralized mortgage obligations (“CMOs”) and commercial mortgage-backed securities, may be issued by Ginnie Mae, U.S. Government agencies or instrumentalities or by trusts formed by private originators of, or investors in, mortgage loans. In general, CMOs are debt obligations of a legal entity that are collateralized by a pool of residential or commercial mortgage loans or Mortgage Assets. The payments on these are used to make payments on the CMOs or multiple pass-through securities. Multiple class pass-through securities represent direct ownership interests in the Mortgage Assets. Classes of CMOs include interest only (“IOs”), principal only (“POs”), planned amortization classes and targeted amortization classes. IOs and POs are stripped mortgage-backed securities representing interests in a pool of mortgages, the cash flow from which has been separated into interest and principal components. IOs receive the interest portion of the cash flow while POs receive the principal portion. IOs and POs can be extremely volatile in response to changes in interest rates. As interest rates rise and fall, the value of IOs tends to move in the same direction as interest rates. POs perform best when prepayments on the underlying mortgages rise since this increases the rate at which the principal is returned and the yield to maturity on the PO. When payments on mortgages underlying a PO are slower than anticipated, the life of the PO is lengthened and the yield to maturity is reduced. If the underlying Mortgage Assets experience greater than anticipated prepayments of principal, the Master Portfolio’s initial investment in the IOs may not fully recoup.
Capital Securities and Trust Preferred Securities: Capital securities, including trust preferred securities, are typically issued by corporations, generally in the form of interest-bearing notes with preferred securities characteristics. In the case of trust preferred securities, an affiliated business trust of a corporation issues these securities, generally in the form of beneficial interests in subordinated debentures or similarly structured securities. The securities can be structured with either a fixed or adjustable coupon that can have either a perpetual or stated maturity date. For trust preferred securities, the issuing bank or corporation pays interest to the trust, which is then distributed to holders of these securities as a dividend. Dividends can be deferred without creating an event of default or acceleration, although maturity cannot take place unless all cumulative payment obligations have been met. The deferral of payments does not affect the purchase or sale of these securities in the open market. These securities generally are rated below that of the issuing company’s senior debt securities and are freely callable at the issuer’s option.
Forward Commitments, When-Issued and Delayed Delivery Securities: The Master Portfolio may purchase securities on a when-issued basis and may purchase or sell securities on a forward commitment basis. Settlement of such transactions normally occurs within a month or more after the purchase or sale commitment is made. The Master Portfolio may purchase securities under such conditions with the intention of actually acquiring them, but may enter into a separate agreement to sell the securities before the settlement date. Since the value of securities purchased may fluctuate prior to settlement, the Master Portfolio may be required to pay more at settlement than the security is worth. In addition, the Master Portfolio is not entitled to any of the interest earned prior to settlement. When purchasing a security on a delayed delivery basis, the Master Portfolio assumes the rights and risks of ownership of the security, including the risk of price and yield fluctuations. In the event of default by the counterparty, the Master Portfolio’s maximum amount of loss is the unrealized appreciation of unsettled when-issued transactions.
TBA Commitments:TBA commitments are forward agreements for the purchase or sale of mortgage-backed securities for a fixed price, with payment and delivery on an agreed upon future settlement date. The specific securities to be delivered are not identified at the trade date. However, delivered securities must meet specified terms, including issuer, rate and mortgage terms. When entering into TBA commitments, the Master Portfolio may take possession of or deliver the underlying mortgage-backed securities but can extend the settlement or roll the transaction. TBA commitments involve a risk of loss if the value of the security to be purchased or sold declines or increases, respectively, prior to settlement date.
In order to better define contractual rights and to secure rights that will help the Master Portfolio mitigate its counterparty risk, TBA commitments may be entered into by the Master Portfolio under Master Securities Forward Transaction Agreements (each, an “MSFTA”). An MSFTA typically contains, among other things, collateral posting terms and netting provisions in the event of default and/or termination event. The collateral requirements are typically calculated by netting themark-to-market amount for each transaction under such agreement and comparing that amount to the value of the collateral currently pledged by the Master Portfolio and the counterparty. Cash collateral that has been pledged to cover the obligations of the Master Portfolio and cash collateral received from the counterparty, if any, is reported separately on the Statement of Assets and Liabilities as cash pledged as collateral for TBA commitments or cash received as collateral for TBA commitments, respectively.Non-cash collateral pledged by the Master Portfolio, if any, is noted in the Schedule of Investments. Typically, the Master Portfolio is permitted to sell,re-pledge or use the collateral it receives; however, the counterparty is not permitted to do so. To the extent amounts due to the Master Portfolio are not fully collateralized, contractually or otherwise, the Master Portfolio bears the risk of loss from counterpartynon-performance.
Mortgage Dollar Roll Transactions: The Master Portfolio may sell TBA mortgage-backed securities and simultaneously contract to repurchase substantially similar (i.e., same type, coupon and maturity) securities on a specific future date at an agreed upon price. During the period between the sale and repurchase, the Master Portfolio is not entitled to receive interest and principal payments on the securities sold. Mortgage dollar roll transactions are treated as purchases and sales and realizes gains and losses on these transactions. Mortgage dollar rolls involve the risk that the market value of the securities that the Master Portfolio is required to purchase may decline below the agreed upon repurchase price of those securities.
Securities Lending:The Master Portfolio may lend its securities to approved borrowers, such as brokers, dealers and other financial institutions. The borrower pledges and maintains with the Master Portfolio collateral consisting of cash, an irrevocable letter of credit issued by a bank, or securities issued or guaranteed by the U.S. Government. The initial collateral received by the Master Portfolio is required to have a value of at least 102% of the current value of the loaned securities for securities traded on U.S. exchanges and a value of at least 105% for all other securities. The collateral is maintained thereafter at a value equal to at least 100% of the current market value of the securities on loan. The market value of the loaned securities is determined at the close of each business day of the Master Portfolio and any additional required collateral is delivered to the Master Portfolio, or excess collateral returned by the Master Portfolio, on the next business day. During the term of the loan, the Master Portfolio is entitled to all distributions made on or in respect of the loaned securities, but does not receive interest income on securities received as collateral. Loans of securities are terminable at any time and the borrower, after notice, is required to return borrowed securities within the standard time period for settlement of securities transactions.
The market value of any securities on loan, all of which were classified as corporate bonds in the Master Portfolio’s Schedule of Investments, and the value of any related collateral are shown separately in the Statement of Assets and Liabilities as a component of investments at value-unaffiliated, and collateral on securities loaned at value, respectively. As of period end, any securities on loan were collateralized by cash and/or U.S. Government obligations. Cash collateral invested by the securities lending agent, BlackRock Institutional Trust Company, N.A. (“BTC”), if any, is disclosed in the Schedule of Investments.
| | |
| 66 | | 2019 BLACKROCK ANNUAL REPORTTO SHAREHOLDERS |
Notes to Financial Statements (continued)
Securities lending transactions are entered into by the Master Portfolio under Master Securities Lending Agreements (each, an “MSLA”), which provide the right, in the event of default (including bankruptcy or insolvency), for thenon-defaulting party to liquidate the collateral and calculate a net exposure to the defaulting party or request additional collateral. In the event that a borrower defaults, the Master Portfolio, as lender, would offset the market value of the collateral received against the market value of the securities loaned. When the value of the collateral is greater than that of the market value of the securities loaned, the lender is left with a net amount payable to the defaulting party. However, bankruptcy or insolvency laws of a particular jurisdiction may impose restrictions on or prohibitions against such a right of offset in the event of an MSLA counterparty’s bankruptcy or insolvency. Under the MSLA, absent an event of default, the borrower can resell orre-pledge the loaned securities, and the Master Portfolio can reinvest cash collateral received in connection with loaned securities. Upon an event of default, the parties’ obligations to return the securities or collateral to the other party are extinguished, and the parties can resell orre-pledge the loaned securities or the collateral received in connection with the loaned securities in order to satisfy the defaulting party’s net payment obligation for all transactions under the MSLA. The defaulting party remains liable for any deficiency.
As of period end, the following table is a summary of the Master Portfolio’s securities lending agreements by counterparty which are subject to offset under an MSLA:
| | | | | | | | | | | | |
| Counterparty | | Securities Loaned at Value | | | Cash Collateral
Received (a) | | | Net Amount | |
Bank of America N.A. | | $ | 199,629,398 | | | $ | (199,629,398 | ) | | $ | — | |
Barclays Bank PLC | | | 11,556,296 | | | | (11,556,296 | ) | | | — | |
Barclays Capital,Inc. | | | 6,018,536 | | | | (6,018,536 | ) | | | — | |
BMO Capital Markets | | | 1,667,172 | | | | (1,667,172 | ) | | | — | |
BNP Paribas Prime Brokerage International Limited | | | 11,869,476 | | | | (11,869,476 | ) | | | — | |
Citadel Clearing LLC | | | 3,852,957 | | | | (3,852,957 | ) | | | — | |
Citigroup Global Markets,Inc. | | | 719,588,220 | | | | (719,588,220 | ) | | | — | |
Credit Suisse Securities (USA) LLC | | | 20,200,406 | | | | (20,200,406 | ) | | | — | |
Deutsche Bank Securities,Inc. | | | 59,108,691 | | | | (59,108,691 | ) | | | — | |
Goldman Sachs & Co. | | | 121,446,639 | | | | (121,446,639 | ) | | | — | |
HSBC PLC | | | 12,543,744 | | | | (12,543,744 | ) | | | — | |
Jefferies LLC | | | 1,400,575 | | | | (1,400,575 | ) | | | — | |
Morgan Stanley & Co. LLC | | | 86,716,448 | | | | (86,716,448 | ) | | | — | |
Natwest Markets Securities,Inc. | | | 2,027,195 | | | | (2,027,195 | ) | | | — | |
Nomura Securities International,Inc. | | | 28,491,978 | | | | (28,491,978 | ) | | | — | |
RBC Capital Markets LLC | | | 81,334,443 | | | | (81,334,443 | ) | | | — | |
Scotia Capital (USA), Inc. | | | 9,557,496 | | | | (9,557,496 | ) | | | — | |
SG Americas Securities LLC | | | 293,469 | | | | (293,469 | ) | | | — | |
State Street Bank & Trust Co. | | | 732,035 | | | | (732,035 | ) | | | — | |
TD Prime Services LLC | | | 203,078 | | | | (203,078 | ) | | | — | |
UBS AG | | | 3,445,078 | | | | (3,445,078 | ) | | | — | |
UBS Securities LLC | | | 217,036 | | | | (217,036 | ) | | | — | |
Wells Fargo Securities LLC | | | 149,098,142 | | | | (149,098,142 | ) | | | — | |
| | | | | | | | | | | | |
| | $ | 1,530,998,508 | | | $ | (1,530,998,508 | ) | | $ | — | |
| | | | | | | | | | | | |
| | (a) | Collateral received in excess of the market value of securities on loan is not presented in this table. The total cash collateral received by the Master Portfolio is disclosed in the Master Portfolio’s Statement of Assets and Liabilities. | |
The risks of securities lending include the risk that the borrower may not provide additional collateral when required or may not return the securities when due. To mitigate these risks, the Master Portfolio benefits from a borrower default indemnity provided by BlackRock, Inc. (“BlackRock”). BlackRock’s indemnity allows for full replacement of the securities loaned to the extent the collateral received does not cover the value on the securities loaned in the event of borrower default. The Master Portfolio could incur a loss if the value of an investment purchased with cash collateral falls below the market value of loaned securities or if the value of an investment purchased with cash collateral falls below the value of the original cash collateral received. Such losses are borne entirely by the Master Portfolio.
| 5. | INVESTMENT ADVISORY AGREEMENT AND OTHER TRANSACTIONS WITH AFFILIATES |
Investment Advisory: MIP, on behalf of the Master Portfolio, entered into an Investment Advisory Agreement with the Manager, the Master Portfolio’s investment adviser and an indirect, wholly-owned subsidiary of BlackRock, to provide investment advisory and administrative services. The Manager is responsible for the management of the Master Portfolio’s portfolio and provides the personnel, facilities, equipment and certain other services necessary to the operations of the Master Portfolio.
For such services, the Master Portfolio pays the Manager a monthly fee at an annual rate equal to 0.04% of the average daily value of the Master Portfolio’s net assets.
Administration: MIP, on behalf of the Master Portfolio, entered into an Administration Agreement with BlackRock Advisors, LLC (“BAL”), which has agreed to provide general administrative services (other than investment advice and related portfolio activities). BAL has agreed to bear all of the Master Portfolio’s ordinary operating expenses, excluding, generally, investment advisory fees, distribution fees, brokerage and other expenses related to the execution of portfolio transactions, extraordinary expenses and certain other expenses which are borne by the Master Portfolio. BAL is entitled to receive for these administrative services an annual fee based on the average daily net assets of the Master Portfolio.
BAL is not entitled to compensation for providing administrative services to the Master Portfolio, for so long as BAL (or an affiliate) is entitled to compensation for providing administrative services to corresponding feeder funds that invest substantially all of their assets in the Master Portfolio, or BAL (or an affiliate) receives investment advisory fees from the Master Portfolio.
| | | | |
| NOTESTO FINANCIAL STATEMENTS | | | 67 | |
Notes to Financial Statements (continued)
Expense Waivers and Reimbursements:The fees and expenses of the Master Portfolio’s trustees who are not “interested persons” of Master Portfolio, as defined in the 1940 Act (“Independent Trustees”), counsel to the Independent Trustees and the Master Portfolio’s independent registered public accounting firm (together, the “independent expenses”) are paid directly by the Master Portfolio. BAL and BFA, as applicable, have contractually agreed to reimburse the Master Portfolio or provide an offsetting credit against the management fees paid by the Master Portfolio in an amount equal to these independent expenses through April 30, 2020. For the year ended December 31, 2019, the amount waived and/or reimbursed was $195,531.
The Manager contractually agreed to waive its investment advisory fees by the amount of investment advisory fees the Master Portfolio pays to the Manager indirectly through its investment in affiliated money market funds (the “affiliated money market fund waiver”). This amount is included in fees waived and/or reimbursed by the Manager in the Statement of Operations. For the year ended December 31, 2019, the amounts waived were $486,466.
The Manager has contractually agreed to waive its investment advisory fee with respect to any portion of the Master Portfolio’s assets invested in affiliated equity and fixed-income mutual funds and affiliated exchange-traded funds that have a contractual management fee through April 30, 2020. The contractual agreement may be terminated upon 90 days’ notice by a majority of the Independent Trustees of MIP or by a vote of a majority of the outstanding voting securities of the Master Portfolio. For the year ended December 31, 2019, there were no fees waived and/or reimbursed by the Manager pursuant to this arrangement.
Securities Lending: The U.S. Securities and Exchange Commission (“SEC”) has issued an exemptive order which permits BTC, an affiliate of the Manager, to serve as securities lending agent for the Master Portfolio, subject to applicable conditions. As securities lending agent, BTC bears all operational costs directly related to securities lending. The Master Portfolio is responsible for fees in connection with the investment of cash collateral received for securities on loan (the “collateral investment fees”). The cash collateral is invested in a money market fund managed by the Manager or its affiliates. However, BTC has agreed to reduce the amount of securities lending income it receives in order to effectively limit the collateral investment fees the Master Portfolio bears to an annual rate of 0.04%. The shares of such money market fund will not be subject to a sales load, distribution fee or service fee. The money market fund in which the cash collateral has been invested may, under certain circumstances, impose a liquidity fee of up to 2% of the value redeemed or temporarily restrict redemptions for up to 10 business days during a 90 day period, in the event that the money market fund’s weekly liquid assets fall below certain thresholds.
Securities lending income is equal to the total of income earned from the reinvestment of cash collateral, net of fees and other payments to and from borrowers of securities, and less the collateral investment fees. The Master Portfolio retains a portion of securities lending income and remits a remaining portion to BTC as compensation for its services as securities lending agent.
Pursuant to the current securities lending agreement, the Master Portfolio retains 82% of securities lending income (which excludes collateral investment fees), and this amount retained can never be less than 70% of the total of securities lending income plus the collateral investment fees.
In addition, commencing the business day following the date that the aggregate securities lending income earned across the BlackRock Multi-Asset Complex in a calendar year exceeds a specified threshold, the Master Portfolio, pursuant to the securities lending agreement, will retain for the remainder of that calendar year securities lending income in an amount equal to 85% of securities lending income (which excludes collateral investment fees), and this amount retained can never be less than 70% of the total of securities lending income plus the collateral investment fees.
The share of securities lending income earned by the Master Portfolio is shown as securities lending income — affiliated — net in the Statement of Operations. For the year ended December 31, 2019, the Master Portfolio paid BTC $657,316 for securities lending agent services.
Interfund Lending: In accordance with an exemptive order (the “Order”) from the SEC, the Master Portfolio may participate in a joint lending and borrowing facility for temporary purposes (the “Interfund Lending Program”), subject to compliance with the terms and conditions of the Order, and to the extent permitted by the Master Portfolio’s investment policies and restrictions. The Master Portfolio is currently permitted to borrow and lend under the Interfund Lending Program.
A lending BlackRock fund may lend in aggregate up to 15% of its net assets, but may not lend more than 5% of its net assets to any one borrowing fund through the Interfund Lending Program. A borrowing BlackRock fund may not borrow through the Interfund Lending Program or from any other source more than 33 1/3% of its total assets (or any lower threshold provided for by the fund’s investment restrictions). If a borrowing BlackRock fund’s total outstanding borrowings exceed 10% of its total assets, each of its outstanding interfund loans will be subject to collateralization of at least 102% of the outstanding principal value of the loan. All interfund loans are for temporary or emergency purposes and the interest rate to be charged will be the average of the highest current overnight repurchase agreement rate available to a lending fund and the bank loan rate, as calculated according to a formula established by the Board.
During the year ended December 31, 2019, the Master Portfolio did not participate in the Interfund Lending Program.
Trustees and Officers:Certain trustees and/or officers of the Master Portfolio are directors and/or officers of BlackRock or its affiliates.
Other Transactions:During the year ended December 31, 2019, the Master Portfolio received a reimbursement of $529,200 from an affiliate, which is included in Other income — affiliated in the Statement of Operations, related to an operating event.
The Master Portfolio may purchase securities from, or sell securities to, an affiliated fund provided the affiliation is due solely to having a common investment adviser, common officers, or common directors. For the year ended December 31, 2019, the purchase and sale transactions and any net realized gains (losses) with affiliated funds in compliance with Rule17a-7 under the 1940 Act were as follows:
| | | | | | | | | | | | | | |
| Purchases | | | | | Sales | | | | | Net Realized Gain (Loss) | |
| $ | 10,667,131 | | | | | $ | 2,306,302 | | | | | $ | (66,390 | ) |
| | |
| 68 | | 2019 BLACKROCK ANNUAL REPORTTO SHAREHOLDERS |
Notes to Financial Statements (continued)
For the year ended December 31, 2019, purchases and sales of investments, including paydowns, TBA transactions, mortgage dollar rolls and excluding short-term securities andin-kind redemptions, were as follows:
| | | | | | | | |
| | | Purchases | | | Sales | |
Non-U.S. Government Securities | | $ | 15,698,757,501 | | | $ | 14,462,697,496 | * |
U.S. Government Securities. | | | 2,268,349,311 | | | | 962,349,245 | |
For the year ended December 31, 2019, purchases and sales related to mortgage dollar rolls were $5,988,007,949 and $5,989,914,092 respectively.
The Master Portfolio is classified as a partnership for U.S. federal income tax purposes. As such, each investor in the Master Portfolio is treated as the owner of its proportionate share of net assets, income, expenses and realized and unrealized gains and losses of the Master Portfolio. Therefore, no U.S. federal income tax provision is required. It is intended that the Master Portfolio’s assets will be managed so an investor in the Master Portfolio can satisfy the requirements of Subchapter M of the Internal Revenue Code of 1986, as amended.
The Master Portfolio files U.S. federal and various state and local tax returns. No income tax returns are currently under examination. The statute of limitations on the Master Portfolio’s U.S. federal tax returns generally remains open for each of the four years ended December 31, 2019. The statutes of limitations on the Master Portfolio’s state and local tax returns may remain open for an additional year depending upon the jurisdiction.
Management has analyzed tax laws and regulations and their application to the Master Portfolio as of December 31, 2019, inclusive of the open tax return years, and does not believe that there are any uncertain tax positions that require recognition of a tax liability in the Master Portfolio’s financial statements.
As of December 31, 2019, gross unrealized appreciation and depreciation for investments based on cost for U.S. federal income tax purposes were as follows:
| | | | |
Tax cost | | $ | 13,155,837,125 | |
| | | | |
Gross unrealized appreciation | | $ | 416,144,290 | |
Gross unrealized depreciation | | | (13,968,535 | ) |
| | | | |
Net unrealized appreciation | | $ | 402,175,755 | |
| | | | |
MIP, on behalf of the Master Portfolio, along with certain other funds managed by the Manager and its affiliates (“Participating Funds”), is a party to a364-day, $2.25 billion credit agreement with a group of lenders. Under this agreement, the Master Portfolio may borrow to fund shareholder redemptions. Excluding commitments designated for certain individual funds, the Participating Funds, including the Master Portfolio, can borrow up to an aggregate commitment amount of $1.75 billion at any time outstanding, subject to asset coverage and other limitations as specified in the agreement. The credit agreement has the following terms: a fee of 0.10% per annum on unused commitment amounts and interest at a rate equal to the higher of(a) one-month LIBOR (but, in any event, not less than 0.00%) on the date the loan is made plus 0.80% per annum or (b) the Fed Funds rate (but, in any event, not less than 0.00%) in effect from time to time plus 0.80% per annum on amounts borrowed. The agreement expires in April 2020 unless extended or renewed. Prior to April 18, 2019, Participating Funds paid an upfront commitment fee of 0.02% on the total commitment amounts, in addition to administration, legal and arrangement fees, which are included in miscellaneous expenses in the Statement of Operations. These fees were allocated among such funds based upon portions of the aggregate commitment available to them and relative net assets of Participating Funds. During the year ended December 31, 2019, the Master Portfolio did not borrow under the credit agreement.
Many municipalities insure repayment of their bonds, which may reduce the potential for loss due to credit risk. The market value of these bonds may fluctuate for other reasons, including market perception of the value of such insurance, and there is no guarantee that the insurer will meet its obligation.
Inventories of municipal bonds held by brokers and dealers may decrease, which would lessen their ability to make a market in these securities. Such a reduction in market making capacity could potentially decrease the Master Portfolio’s ability to buy or sell bonds. As a result, the Master Portfolio may sell a security at a lower price, sell other securities to raise cash, or give up an investment opportunity, any of which could have a negative impact on performance. If the Master Portfolio needed to sell large blocks of bonds, those sales could further reduce the bonds’ prices and impact performance.
In the normal course of business, the Master Portfolio invests in securities or other instruments and may enter into certain transactions, and such activities subject the Master Portfolio to various risks, including among others, fluctuations in the market (market risk) or failure of an issuer to meet all of its obligations. The value of securities or other instruments may also be affected by various factors, including, without limitation: (i) the general economy; (ii) the overall market as well as local, regional or global political and/or social instability; (iii) regulation, taxation or international tax treaties between various countries; or (iv) currency, interest rate and price fluctuations. The Master Portfolio’s prospectus provides details of the risks to which the Master Portfolio is subject.
| | | | |
| NOTESTO FINANCIAL STATEMENTS | | | 69 | |
Notes to Financial Statements (continued)
The Master Portfolio may be exposed to prepayment risk, which is the risk that borrowers may exercise their option to prepay principal earlier than scheduled during periods of declining interest rates, which would force the Master Portfolio to reinvest in lower yielding securities. The Master Portfolio may also be exposed to reinvestment risk, which is the risk that income from the Master Portfolio’s portfolio will decline if the Master Portfolio invests the proceeds from matured, traded or called fixed-income securities at market interest rates that are below the Master Portfolio portfolio’s current earnings rate.
The Master Portfolio may be exposed to additional risks when reinvesting cash collateral in money market funds that do not seek to maintain a stable NAV per share of $1.00, which may be subject to redemption gates or liquidity fees under certain circumstances.
Counterparty Credit Risk:The Master Portfolio may be exposed to counterparty credit risk, or the risk that an entity may fail to or be unable to perform on its commitments related to unsettled or open transactions. The Master Portfolio manages counterparty credit risk by entering into transactions only with counterparties that the Manager believes have the financial resources to honor their obligations and by monitoring the financial stability of those counterparties. Financial assets, which potentially expose the Master Portfolio to market, issuer and counterparty credit risks, consist principally of financial instruments and receivables due from counterparties. The extent of the Master Portfolio’s exposure to market, issuer and counterparty credit risks with respect to these financial assets is approximately their value recorded in the Statement of Assets and Liabilities, less any collateral held by the Master Portfolio.
Concentration Risk:The Master Portfolio invests a significant portion of its assets in fixed-income securities and/or uses derivatives tied to the fixed-income markets. Changes in market interest rates or economic conditions may affect the value and/or liquidity of such investments. Interest rate risk is the risk that prices of bonds and other fixed-income securities will increase as interest rates fall and decrease as interest rates rise. The Master Portfolio may be subject to a greater risk of rising interest rates due to the current period of historically low rates.
The Master Portfolio invests a significant portion of its assets in securities backed by commercial or residential mortgage loans or in issuers that hold mortgage and other asset-backed securities. Investment percentages in these securities are presented in the Schedule of Investments. Changes in economic conditions, including delinquencies and/or defaults on assets underlying these securities, can affect the value, income and/or liquidity of such positions.
Management has evaluated the impact of all subsequent events on the Master Portfolio through the date the financial statements were issued and has determined that there were no subsequent events requiring adjustment or additional disclosure in the financial statements.
| | |
| 70 | | 2019 BLACKROCK ANNUAL REPORTTO SHAREHOLDERS |
| | |
| Report of Independent Registered Public Accounting Firm | | U.S. Total Bond Index Master Portfolio |
To the Board of Trustees of
Master Investment Portfolio and Investors of U.S. Total Bond Index Master Portfolio
Opinion on the Financial Statements
We have audited the accompanying statement of assets and liabilities, including the schedule of investments, of U.S. Total Bond Index Master Portfolio (one of the series constituting Master Investment Portfolio, referred to hereafter as the “Master Portfolio”) as of December 31, 2019, the related statement of operations for the year ended December 31, 2019, the statements of changes in net assets for each of the two years in the period ended December 31, 2019, including the related notes, and the financial highlights for each of the five years in the period ended December 31, 2019 (collectively referred to as the “financial statements”). In our opinion, the financial statements present fairly, in all material respects, the financial position of the Master Portfolio as of December 31, 2019, the results of its operations for the year then ended, the changes in its net assets for each of the two years in the period ended December 31, 2019 and the financial highlights for each of the five years in the period ended December 31, 2019 in conformity with accounting principles generally accepted in the United States of America.
Basis for Opinion
These financial statements are the responsibility of the Master Portfolio’s management. Our responsibility is to express an opinion on the Master Portfolio’s financial statements based on our audits. We are a public accounting firm registered with the Public Company Accounting Oversight Board (United States) (“PCAOB”) and are required to be independent with respect to the Master Portfolio in accordance with the U.S. federal securities laws and the applicable rules and regulations of the Securities and Exchange Commission and the PCAOB.
We conducted our audits of these financial statements in accordance with the standards of the PCAOB. Those standards require that we plan and perform the audit to obtain reasonable assurance about whether the financial statements are free of material misstatement, whether due to error or fraud.
Our audits included performing procedures to assess the risks of material misstatement of the financial statements, whether due to error or fraud, and performing procedures that respond to those risks. Such procedures included examining, on a test basis, evidence regarding the amounts and disclosures in the financial statements. Our audits also included evaluating the accounting principles used and significant estimates made by management, as well as evaluating the overall presentation of the financial statements. Our procedures included confirmation of securities owned as of December 31, 2019 by correspondence with the custodian, transfer agent and brokers; when replies were not received from brokers, we performed other auditing procedures. We believe that our audits provide a reasonable basis for our opinion.
/s/PricewaterhouseCoopers LLP
Philadelphia, Pennsylvania
February 27, 2020
We have served as the auditor of one or more BlackRock investment companies since 2000.
| | | | |
| REPORT OF INDEPENDENT REGISTERED PUBLIC ACCOUNTING FIRM | | | 71 | |
Statement Regarding Liquidity Risk Management Program
The Securities and Exchange Commission adopted Rule 22e-4 under the Investment Company Act of 1940, as amended (the “Liquidity Rule”) to promote effective liquidity risk management throughout the open-end investment company industry, thereby reducing the risk that funds will be unable to meet their redemption obligations and mitigating dilution of the interests of fund shareholders.
The Board of Trustees (the “Board”) of BlackRock Funds III and MIP, on behalf of iShares U.S. Aggregate Bond Index Fund and U.S. Total Bond Index Master Portfolio, respectively, met on November 12-13, 2019 (the “Meeting”) to review the liquidity risk management program (the “Program”) applicable to the BlackRock open-end funds, excluding money market funds (each, a “Fund”), pursuant to the Liquidity Rule. The Board has appointed BlackRock Advisors, LLC or BlackRock Fund Advisors (“BlackRock”), each an investment adviser to certain Funds, as the program administrator for each Fund’s Program, as applicable. BlackRock has delegated oversight of the Program to the 40 Act Liquidity Risk Management Committee (the “Committee”). At the Meeting, the Committee, on behalf of BlackRock, provided the Board with a report that addressed the operation of the Program and assessed its adequacy and effectiveness of implementation, including the operation of each Fund’s Highly Liquid Investment Minimum (“HLIM”) where applicable, and any material changes to the Program (the “Report”). The Report covered the period from December 1, 2018 through September 30, 2019 (the “Program Reporting Period”).
The Report described the Program’s liquidity classification methodology for categorizing a Fund’s investments (including derivative transactions) into one of four liquidity buckets. It also described BlackRock’s methodology in establishing a Fund’s HLIM and noted that the Committee reviews and ratifies the HLIM assigned to each Fund no less frequently than annually.
The Report noted that the Program complied with the key factors for consideration under the Liquidity Rule for assessing, managing and periodically reviewing a Fund’s liquidity risk, as follows:
A. The Fund’s investment strategy and liquidity of portfolio investments during both normal and reasonably foreseeable stressed conditions: During the Program Reporting Period, the Committee reviewed whether each Fund’s strategy is appropriate for an open-end fund structure with a focus on Funds with more significant and consistent holdings of less liquid and illiquid assets. The Committee also factored a Fund’s concentration in an issuer into the liquidity classification methodology by taking issuer position sizes into account. Where a Fund participated in borrowings for investment purposes (such as tender option bonds and reverse repurchase agreements), such borrowings were factored into the Program’s calculation of a Fund’s liquidity bucketing. Derivative exposure was also considered in such calculation.
B. Short-term and long-term cash flow projections during both normal and reasonably foreseeable stressed conditions: During the Program Reporting Period, the Committee reviewed historical net redemption activity and used this information as a component to establish each Fund’s reasonably anticipated trading size (“RATS”). Each Fund has adopted an in-kind redemption policy which may be utilized to meet larger redemption requests. The Committee may also take into consideration a Fund’s shareholder ownership concentration (which, depending on product type and distribution channel, may or may not be available), a Fund’s distribution channels, and the degree of certainty associated with a Fund’s short-term and long-term cash flow projections.
C. Holdings of cash and cash equivalents, as well as borrowing arrangements: The Committee considered the terms of the credit facility applicable to the Funds, the financial health of the institution providing the facility and the fact that the credit facility is shared among multiple Funds (including that a portion of the aggregate commitment amount is specifically designated for BlackRock Floating Rate Income Portfolio and BlackRock Credit Strategies Income Fund, each a series of BlackRock Funds V). The Committee also considered other types of borrowing available to the Funds, such as the ability to use reverse repurchase agreements and interfund lending, as applicable.
There were no material changes to the Program during the Program Reporting Period. The Report provided to the Board stated that the Committee concluded that based on the operation of the functions, as described in the Report, the Program is operating as intended and is effective in implementing the requirements of the Liquidity Rule.
| | |
| 72 | | 2019 BLACKROCK ANNUAL REPORTTO SHAREHOLDERS |
Trustee and Officer Information
| | | | | | | | |
| Independent Trustees (a) |
| | | | | |
Name Year of Birth (b) | | Position(s) Held (Length of Service) (c) | | Principal Occupation(s) During Past Five Years | | Number of BlackRock-Advised Registered Investment Companies (“RICs”) Consisting of Investment Portfolios (“Portfolios”) Overseen | | Public Company and
Other Investment
Company Directorships
Held During Past Five Years |
Mark Stalnecker 1951 | | Chair of the Board (Since 2019) and Trustee (Since 2015) | | Chief Investment Officer, University of Delaware from 1999 to 2013; Trustee and Chair of the Finance and Investment Committees, Winterthur Museum and Country Estate from 2005 to 2016; Member of the Investment Committee, Delaware Public Employees’ Retirement System since 2002; Member of the Investment Committee, Christiana Care Health System from 2009 to 2017; Member of the Investment Committee, Delaware Community Foundation from 2013 to 2014; Director and Chair of the Audit Committee, SEI Private Trust Co. from 2001 to 2014. | | 37 RICs consisting of 177 Portfolios | | None |
Bruce R. Bond 1946 | | Trustee (Since 2019) | | Board Member, Amsphere Limited (software) since 2018; Trustee and Member of the Governance Committee, State Street Research Mutual Funds from 1997 to 2005; Board Member of Governance, Audit and Finance Committee, Avaya Inc. (computer equipment) from 2003 to 2007. | | 37 RICs consisting of 177 Portfolios | | None |
Susan J. Carter 1956 | | Trustee (Since 2016) | | Director, Pacific Pension Institute from 2014 to 2018; Advisory Board Member, Center for Private Equity and Entrepreneurship at Tuck School of Business since 1997; Senior Advisor, Commonfund Capital, Inc. (“CCI”) (investment adviser) in 2015; Chief Executive Officer, CCI from 2013 to 2014; President & Chief Executive Officer, CCI from 1997 to 2013; Advisory Board Member, Girls Who Invest from 2015 to 2018 and Board Member thereof since 2018; Advisory Board Member, Bridges Fund Management since 2016; Trustee, Financial Accounting Foundation since 2017; Practitioner Advisory Board Member, Private Capital Research Institute (“PCRI”) since 2017. | | 37 RICs consisting of 177 Portfolios | | None |
Collette Chilton 1958 | | Trustee (Since 2015) | | Chief Investment Officer, Williams College since 2006; Chief Investment Officer, Lucent Asset Management Corporation from 1998 to 2006. | | 37 RICs consisting of 177 Portfolios | | None |
Neil A. Cotty 1954 | | Trustee (Since 2016) | | Bank of America Corporation from 1996 to 2015, serving in various senior finance leadership roles, including Chief Accounting Officer from 2009 to 2015, Chief Financial Officer of Global Banking, Markets and Wealth Management from 2008 to 2009, Chief Accounting Officer from 2004 to 2008, Chief Financial Officer of Consumer Bank from 2003 to 2004, Chief Financial Officer of Global Corporate Investment Bank from 1999 to 2002. | | 37 RICs consisting of 177 Portfolios | | None |
Lena G. Goldberg 1949 | | Trustee (Since 2019) | | Senior Lecturer, Harvard Business School, since 2008; Director, Charles Stark Draper Laboratory, Inc. since 2013; FMR LLC/Fidelity Investments (financial services) from 1996 to 2008, serving in various senior roles including Executive Vice President — Strategic Corporate Initiatives and Executive Vice President and General Counsel; Partner, Sullivan & Worcester LLP from 1985 to 1996 and Associate thereof from 1979 to 1985. | | 37 RICs consisting of 177 Portfolios | | None |
Robert M. Hernandez 1944 | | Trustee (Since 2019) | | Director, Vice Chairman and Chief Financial Officer of USX Corporation (energy and steel business) from 1991 to 2001; Director and non-executive Chairman, RTI International Metals, Inc. from 1990 to 2015; Director, TE Connectivity (electronics) from 2006 to 2012. | | 37 RICs consisting of 177 Portfolios | | Chubb Limited (insurance company); Eastman Chemical Company |
| | | | |
| TRUSTEEAND OFFICER INFORMATION | | | 73 | |
Trustee and Officer Information (continued)
| | | | | | | | |
| Independent Trustees (a)(continued) |
| | | | | |
Name Year of Birth (b) | | Position(s) Held (Length of Service) (c) | | Principal Occupation(s) During Past Five Years | | Number of BlackRock-Advised Registered Investment Companies (“RICs”) Consisting of Investment Portfolios (“Portfolios”) Overseen | | Public Company and
Other Investment
Company Directorships
Held During Past Five Years |
Henry R. Keizer 1956 | | Trustee (Since 2019) | | Director, Park Indemnity Ltd. (captive insurer) since 2010; Director, MUFG Americas Holdings Corporation and MUFG Union Bank, N.A. (financial and bank holding company) from 2014 to 2016; Director, American Institute of Certified Public Accountants from 2009 to 2011; Director, KPMG LLP (audit, tax and advisory services) from 2004 to 2005 and 2010 to 2012; Director, KPMG International in 2012, Deputy Chairman and Chief Operating Officer thereof from 2010 to 2012 and U.S. Vice Chairman of Audit thereof from 2005 to 2010; Global Head of Audit, KPMGI (consortium of KPMG firms) from 2006 to 2010; Director, YMCA of Greater New York from 2006 to 2010. | | 37 RICs consisting of 177 Portfolios | | Hertz Global Holdings (car rental); Montpelier Re Holdings, Ltd. (publicly held property and casualty reinsurance) from 2013 until 2015; Sealed Air Corp. (packaging); WABCO (commercial vehicle safety systems) |
Cynthia A. Montgomery 1952 | | Trustee (Since 2009) | | Professor, Harvard Business School since 1989. | | 37 RICs consisting of 177 Portfolios | | Newell Rubbermaid, Inc. (manufacturing) |
Donald C. Opatrny 1952 | | Trustee (Since 2019) | | Trustee, Vice Chair, Member of the Executive Committee and Chair of the Investment Committee, Cornell University since 2004; President, Trustee and Member of the Investment Committee, The Aldrich Contemporary Art Museum from 2007 to 2014; Member of the Board and Investment Committee, University School from 2007 to 2018; Member of the Investment Committee, Mellon Foundation from 2009 to 2015; Trustee, Artstor (a Mellon Foundation affiliate) from 2010 to 2015; President and Trustee, the Center for the Arts, Jackson Hole from 2011 to 2018; Director, Athena Capital Advisors LLC (investment management firm) since 2013; Trustee and Chair of the Investment Committee, Community Foundation of Jackson Hole since 2014; Member of Affordable Housing Supply Board of Jackson, Wyoming since 2018; Member, Investment Funds Committee, State of Wyoming since 2017; Trustee, Phoenix Art Museum since 2018. | | 37 RICs consisting of 177 Portfolios | | None |
Joseph P. Platt 1947 | | Trustee (Since 2009) | | General Partner, Thorn Partners, LP (private investments) since 1998; Director, WQED Multi-Media (public broadcasting not-for-profit) since 2001; Chair, Basic Health International (non-profit) since 2015. | | 37 RICs consisting of 177 Portfolios | | Greenlight Capital Re, Ltd. (reinsurance company); Consol Energy Inc. |
Kenneth L. Urish 1951 | | Trustee (Since 2009) | | Managing Partner, Urish Popeck & Co., LLC (certified public accountants and consultants) since 1976; Past-Chairman of the Professional Ethics Committee of the Pennsylvania Institute of Certified Public Accountants and Committee Member thereof since 2007; Member of External Advisory Board, The Pennsylvania State University Accounting Department since founding in 2001; Principal, UP Strategic Wealth Investment Advisors, LLC since 2013; Trustee, The Holy Family Institute from 2001 to 2010; President and Trustee, Pittsburgh Catholic Publishing Associates from 2003 to 2008; Director, Inter-Tel from 2006 to 2007. | | 37 RICs consisting of 177 Portfolios | | None |
Claire A. Walton 1957 | | Trustee (Since 2016) | | Chief Operating Officer and Chief Financial Officer of Liberty Square Asset Management, LP from 1998 to 2015; General Partner of Neon Liberty Capital Management, LLC since 2003; Director, Boston Hedge Fund Group from 2009 to 2018; Director, Woodstock Ski Runners since 2013; Director, Massachusetts Council on Economic Education from 2013 to 2015. | | 37 RICs consisting of 177 Portfolios | | None |
| | |
| 74 | | 2019 BLACKROCK ANNUAL REPORTTO SHAREHOLDERS |
Trustee and Officer Information (continued)
| | | | | | | | |
| Interested Trustees (a)(d) |
| | | | | |
Name Year of Birth (b) | | Position(s) Held (Length of Service) (c) | | Principal Occupation(s) During Past Five Years | | Number of BlackRock-Advised Registered Investment Companies (“RICs”) Consisting of Investment Portfolios (“Portfolios”) Overseen | | Public Company and
Other Investment
Company Directorships
Held During Past Five Years |
Robert Fairbairn 1965 | | Trustee (Since 2018) | | Vice Chairman of BlackRock, Inc. since 2019; Member of BlackRock’s Global Executive and Global Operating Committees; Co-Chair of BlackRock’s Human Capital Committee; Senior Managing Director of BlackRock, Inc. from 2010 to 2019; oversaw BlackRock’s Strategic Partner Program and Strategic Product Management Group from 2012 to 2019; Member of the Board of Managers of BlackRock Investments, LLC from 2011 to 2018; Global Head of BlackRock’s Retail and iShares® businesses from 2012 to 2016. | | 123 RICs consisting of 287 Portfolios | | None |
John M. Perlowski (e) 1964 | | Trustee (Since 2015); President and Chief Executive Officer (Since 2010) | | Managing Director of BlackRock, Inc. since 2009; Head of BlackRock Global Accounting and Product Services since 2009; Advisory Director of Family Resource Network (charitable foundation) since 2009. | | 124 RICs consisting of 288 Portfolios | | None |
(a) The address of each Trustee is c/o BlackRock, Inc., 55 East 52nd Street, New York, New York 10055. |
(b) Independent Trustees serve until their resignation, retirement, removal or death, or until December 31 of the year in which they turn 75. The Board may determine to extend the terms of Independent Trustees on a case-by-case basis, as appropriate. |
(c) In connection with the acquisition of Barclays Global Investors by BlackRock, Inc. in December 2009, certain Independent Trustees were elected to the Board. Furthermore, effective January 1, 2019, three BlackRock Fund Complexes were realigned and consolidated into two BlackRock Fund Complexes. As a result, although the chart shows the year that each Independent Trustee joined the Board, certain Independent Trustees first became members of the boards of other BlackRock-advised Funds or legacy BlackRock funds as follows: Bruce R. Bond, 2005; Robert M. Hernandez, 1996; Cynthia A. Montgomery, 1994; Joseph P. Platt, 1999; Kenneth L. Urish, 1999; Lena G. Goldberg, 2016; Henry R. Keizer, 2016; Donald C. Opatrny, 2015. |
(d) Mr. Fairbairn and Mr. Perlowski are both “interested persons,” as defined in the 1940 Act, of the Trust/MIP based on their positions with BlackRock, Inc. and its affiliates. Mr. Fairbairn and Mr. Perlowski are also board members of the BlackRock Fixed-Income Complex. |
(e) Mr. Perlowski is also a trustee of the BlackRock Credit Strategies Fund. |
| | | | |
| TRUSTEEAND OFFICER INFORMATION | | | 75 | |
Trustee and Officer Information (continued)
| | | | |
| Officers Who Are Not Trustees (a) |
| | | |
Name Year of Birth (b) | | Position(s) Held (Length of Service) | | Principal Occupation(s) During Past Five Years |
Thomas Callahan 1968 | | Vice President (Since 2016) | | Managing Director of BlackRock, Inc. since 2013; Member of the Board of Managers of BlackRock Investments, LLC (principal underwriter) since 2019 and Managing Director thereof since 2017; Head of BlackRock’s Global Cash Management Business since 2016; Co-Head of the Global Cash Management Business from 2014 to 2016; Deputy Head of the Global Cash Management Business from 2013 to 2014; Member of the Cash Management Group Executive Committee since 2013; Chief Executive Officer of NYSE Liffe U.S. from 2008 to 2013. |
Jennifer McGovern 1977 | | Vice President (Since 2014) | | Managing Director of BlackRock, Inc. since 2016; Director of BlackRock, Inc. from 2011 to 2015; Head of Product Development and Oversight for BlackRock’s Strategic Product Management Group since 2019; Head of Product Structure and Oversight for BlackRock’s U.S. Wealth Advisory Group from 2013 to 2019. |
Neal J. Andrews 1966 | | Chief Financial Officer (Since 2009) | | Chief Financial Officer of the iShares® exchange traded funds since 2019; Managing Director of BlackRock, Inc. since 2006. |
Jay M. Fife 1970 | | Treasurer (Since 2009) | | Managing Director of BlackRock, Inc. since 2007. |
Charles Park 1967 | | Chief Compliance Officer (Since 2014) | | Anti-Money Laundering Compliance Officer for certain BlackRock-advised Funds from 2014 to 2015; Chief Compliance Officer of BlackRock Advisors, LLC and the BlackRock-advised Funds in the BlackRock Multi-Asset Complex and the BlackRock Fixed-Income Complex since 2014; Principal of and Chief Compliance Officer for iShares® Delaware Trust Sponsor LLC since 2012 and BlackRock Fund Advisors (“BFA”) since 2006; Chief Compliance Officer for the BFA-advised iShares® exchange traded funds since 2006; Chief Compliance Officer for BlackRock Asset Management International Inc. since 2012. |
Lisa Belle 1968 | | Anti-Money Laundering Compliance Officer (Since 2019) | | Managing Director of BlackRock, Inc. since 2019; Global Financial Crime Head for Asset and Wealth Management of JP Morgan from 2013 to 2019; Managing Director of RBS Securities from 2012 to 2013; Head of Financial Crimes for Barclays Wealth Americas from 2010 to 2012. |
Janey Ahn 1975 | | Secretary (Since 2019) | | Managing Director of BlackRock, Inc. since 2018; Director of BlackRock, Inc. from 2009 to 2017. |
(a) The address of each Officer is c/o BlackRock, Inc., 55 East 52nd Street, New York, New York 10055. |
(b) Officers of the Trust/MIP serve at the pleasure of the Board. |
Further information about the Trust’s/MIP’s Trustees and Officers is available in the Trust’s/MIP’s Statement of Additional Information, which can be obtained without charge by calling (800) 441-7762.
Effective September 19, 2019, Lisa Belle replaced John MacKessy as the Anti-Money Laundering Compliance Officer of the Trust/MIP.
Effective September 19, 2019, Janey Ahn replaced Benjamin Archibald as the Secretary of the Trust/MIP.
Effective December 31, 2019, Robert M. Hernandez retired as Trustee of the Trust/MIP.
Investment Adviser
BlackRock Fund Advisors
San Francisco, CA 94105
Administrator
BlackRock Advisors, LLC
Wilmington, DE 19809
Accounting Agent and Custodian
State Street Bank and Trust Company
Boston, MA 02111
Transfer Agent
BNY Mellon Investment Servicing (US) Inc.
Wilmington, DE 19809
Distributor
BlackRock Investments, LLC
New York, NY 10022
Independent Registered Public Accounting Firm
PricewaterhouseCoopers LLP
Philadelphia, PA 19103
Legal Counsel
Sidley Austin LLP
New York, NY 10019
Address of the Trust/MIP
400 Howard Street
San Francisco, CA 94105
| | |
| 76 | | 2019 BLACKROCK ANNUAL REPORTTO SHAREHOLDERS |
Additional Information
General Information
Householding
The Fund will mail only one copy of shareholder documents, including prospectuses, annual and semi-annual reports and proxy statements, to shareholders with multiple accounts at the same address. This practice is commonly called “householding” and is intended to reduce expenses and eliminate duplicate mailings of shareholder documents. Mailings of your shareholder documents may be householded indefinitely unless you instruct us otherwise. If you do not want the mailing of these documents to be combined with those for other members of your household, please call the Fund at(800) 441-7762.
Availability of Quarterly Schedule of Investments
The Fund/Master Portfolio file their complete schedule of portfolio holdings with the SEC for the first and third quarters of each fiscal year as an exhibit to their reports on Form N-PORT, and for reporting periods ended prior to March 31, 2019, filed such information onForm N-Q. The Fund’s/Master Portfolio’s Forms N-PORT and N-Q are available on the SEC’s website at sec.gov. The Fund’s/Master Portfolio’s Form N-Q may also be obtained upon request and without charge by calling(800) 441-7762.
Availability of Proxy Voting Policies and Procedures
A description of the policies and procedures that the Fund/Master Portfolio use to determine how to vote proxies relating to portfolio securities is available upon request and without charge (1) by calling (800) 441-7762; (2) atblackrock.com; and (3) on the SEC’s website at sec.gov.
Availability of Proxy Voting Record
Information about how the Fund/Master Portfolio voted proxies relating to securities held in the Fund’s/Master Portfolio’s portfolio during the most recent 12-month period ended June 30 is available upon request and without charge (1) atblackrock.com or by calling (800) 441-7762 and (2) on the SEC’s website at sec.gov.
BlackRock’s Mutual Fund Family
BlackRock offers a diverse lineup of open-end mutual funds crossing all investment styles and managed by experts in equity, fixed income and tax-exempt investing. Visitblackrock.comfor more information.
Shareholder Privileges
Account Information
Call us at (800) 441-7762 from 8:00 AM to 6:00 PM ET on any business day to get information about your account balances, recent transactions and share prices. You can also visitblackrock.com for more information.
Automatic Investment Plans
Investor class shareholders who want to invest regularly can arrange to have $50 or more automatically deducted from their checking or savings account and invested in any of the BlackRock funds.
Systematic Withdrawal Plans
Investor class shareholders can establish a systematic withdrawal plan and receive periodic payments of $50 or more from their BlackRock funds, as long as their account balance is at least $10,000.
Retirement Plans
Shareholders may make investments in conjunction with Traditional, Rollover, Roth, Coverdell, Simple IRAs, SEP IRAs and 403(b) Plans.
| | | | |
| ADDITIONAL INFORMATION | | | 77 | |
Additional Information (continued)
BlackRock Privacy Principles
BlackRock is committed to maintaining the privacy of its current and former fund investors and individual clients (collectively, “Clients”) and to safeguarding their non-public personal information. The following information is provided to help you understand what personal information BlackRock collects, how we protect that information and why in certain cases we share such information with select parties.
If you are located in a jurisdiction where specific laws, rules or regulations require BlackRock to provide you with additional or different privacy-related rights beyond what is set forth below, then BlackRock will comply with those specific laws, rules or regulations.
BlackRock obtains or verifies personal non-public information from and about you from different sources, including the following: (i) information we receive from you or, if applicable, your financial intermediary, on applications, forms or other documents; (ii) information about your transactions with us, our affiliates, or others; (iii) information we receive from a consumer reporting agency; and (iv) from visits to our websites.
BlackRock does not sell or disclose to non-affiliated third parties any non-public personal information about its Clients, except as permitted by law or as is necessary to respond to regulatory requests or to service Client accounts. These non-affiliated third parties are required to protect the confidentiality and security of this information and to use it only for its intended purpose.
We may share information with our affiliates to service your account or to provide you with information about other BlackRock products or services that may be of interest to you. In addition, BlackRock restricts access to non-public personal information about its Clients to those BlackRock employees with a legitimate business need for the information. BlackRock maintains physical, electronic and procedural safeguards that are designed to protect the non-public personal information of its Clients, including procedures relating to the proper storage and disposal of such information.
Glossary of Terms Used in this Report
| | |
| Portfolio Abbreviations |
| |
| AGM | | Assured Guaranty Municipal Corp. |
| |
| ARB | | Airport Revenue Bonds |
| |
| EDA | | Economic Development Authority |
| |
| GO | | General Obligation Bonds |
| |
| LIBOR | | London Interbank Offered Rate |
| |
| NPFGC | | National Public Finance Guarantee Corp. |
| |
| RB | | Revenue Bonds |
| |
| S&P | | Standard & Poor’s |
| | |
| 78 | | 2019 BLACKROCK ANNUAL REPORTTO SHAREHOLDERS |
Want to know more?
blackrock.com | 877-275-1255 (1-877-ASK-1BLK)
This report is intended for current holders. It is not authorized for use as an offer of sale or a solicitation of an offer to buy shares of the Fund unless preceded or accompanied by the Fund’s current prospectus. Past performance results shown in this report should not be considered a representation of future performance. Investment returns and principal value of shares will fluctuate so that shares, when redeemed, may be worth more or less than their original cost. Statements and other information herein are as dated and are subject to change.
USTB-12/19-AR
| | |
| Portfolio Information as of December 31, 2019 | | Active Stock Master Portfolio |
TEN LARGEST HOLDINGS
| | | | |
| Security | | Percent of
Net Assets | |
Apple, Inc. | | | 2 | % |
Microsoft Corp. | | | 2 | |
Alibaba Group Holding Ltd. — ADR | | | 1 | |
Amazon.com, Inc. | | | 1 | |
Taiwan Semiconductor Manufacturing Co. Ltd. | | | 1 | |
Tencent Holdings Ltd. | | | 1 | |
Facebook, Inc. | | | 1 | |
Johnson & Johnson | | | 1 | |
Samsung Electronics Co. Ltd. | | | 1 | |
Mastercard, Inc. | | | 1 | |
SECTOR ALLOCATION
| | | | |
| Sector | | Percent of
Net Assets | |
Information Technology | | | 16 | % |
Financials | | | 14 | |
Health Care | | | 12 | |
Consumer Discretionary | | | 10 | |
Industrials | | | 10 | |
Communication Services | | | 6 | |
Consumer Staples | | | 6 | |
Materials | | | 5 | |
Energy | | | 4 | |
Real Estate | | | 4 | |
Utilities | | | 2 | |
Short-Term Securities | | | 15 | |
Liabilities in Excess of Other Assets | | | (4 | ) |
For Active Stock Master Portfolio (the “Master Portfolio”) compliance purposes, the Master Portfolio’s sector classifications refer to one or more of the sector sub-classifications used by one or more widely recognized market indexes or ratings group indexes, and/or as defined by the investment adviser. These definitions may not apply for purposes of this report, which may combine such sector sub-classifications for reporting ease.
Derivative Financial Instruments
The Master Portfolio may invest in various derivative financial instruments. These instruments are used to obtain exposure to a security, commodity, index, market, and/or other assets without owning or taking physical custody of securities, commodities and/or other referenced assets or to manage market, equity, credit, interest rate, foreign currency exchange rate, commodity and/or other risks. Derivative financial instruments may give rise to a form of economic leverage and involve risks, including the imperfect correlation between the value of a derivative financial instrument and the underlying asset, possible default of the counterparty to the transaction or illiquidity of the instrument. The Master Portfolio’s successful use of a derivative financial instrument depends on the investment adviser’s ability to predict pertinent market movements accurately, which cannot be assured. The use of these instruments may result in losses greater than if they had not been used, may limit the amount of appreciation the Master Portfolio can realize on an investment and/or may result in lower distributions paid to shareholders. The Master Portfolio’s investments in these instruments, if any, are discussed in detail in the Notes to Financial Statements.
| | | | |
| PORTFOLIO INFORMATION / DERIVATIVE FINANCIAL INSTRUMENTS | | | 1 | |
| | |
Schedule of Investments December 31, 2019 | | Active Stock Master Portfolio (Percentages shown are based on Net Assets) |
| | | | | | | | |
| Security | | Shares | | | Value | |
|
Common Stocks — 87.4% | |
|
| Aerospace & Defense — 0.8% | |
AAR Corp. | | | 1,912 | | | $ | 86,231 | |
Aerojet Rocketdyne Holdings, Inc.(a)(b) | | | 1,246 | | | | 56,892 | |
Arconic, Inc. | | | 5,074 | | | | 156,127 | |
Boeing Co. | | | 496 | | | | 161,577 | |
Curtiss-Wright Corp. | | | 513 | | | | 72,277 | |
Ducommun, Inc.(a) | | | 1,147 | | | | 57,958 | |
Hanwha Aerospace Co. Ltd.(a) | | | 992 | | | | 30,007 | |
HEICO Corp.(b) | | | 1,945 | | | | 222,022 | |
HEICO Corp., Class A | | | 1,443 | | | | 129,192 | |
Hexcel Corp.(b) | | | 1,605 | | | | 117,663 | |
Lockheed Martin Corp. | | | 3,691 | | | | 1,437,202 | |
Meggitt PLC | | | 627 | | | | 5,461 | |
Mercury Systems, Inc.(a)(b) | | | 1,039 | | | | 71,805 | |
MTU Aero Engines AG | | | 36 | | | | 10,257 | |
Northrop Grumman Corp. | | | 1,007 | | | | 346,378 | |
Parsons Corp.(a)(b) | | | 461 | | | | 19,030 | |
Raytheon Co. | | | 1,815 | | | | 398,828 | |
Spirit AeroSystems Holdings, Inc., Class A | | | 956 | | | | 69,673 | |
Teledyne Technologies, Inc.(a)(b) | | | 1,586 | | | | 549,612 | |
TransDigm Group, Inc.(b) | | | 388 | | | | 217,280 | |
Wesco Aircraft Holdings, Inc.(a) | | | 2,940 | | | | 32,399 | |
| | | | | | | | |
| | | | 4,247,871 | |
|
| Air Freight & Logistics — 0.6% | |
C.H. Robinson Worldwide, Inc.(b) | | | 3,430 | | | | 268,226 | |
Deutsche Post AG, Registered Shares | | | 2,215 | | | | 84,224 | |
DSV PANALPINA A/S | | | 595 | | | | 68,576 | |
Echo Global Logistics, Inc.(a)(b) | | | 4,359 | | | | 90,231 | |
Expeditors International of Washington, Inc. | | | 1,672 | | | | 130,449 | |
FedEx Corp. | | | 3,430 | | | | 518,650 | |
Hub Group, Inc., Class A(a)(b) | | | 8,291 | | | | 425,245 | |
Hyundai Glovis Co. Ltd. | | | 279 | | | | 34,425 | |
Radiant Logistics, Inc.(a) | | | 13,114 | | | | 73,045 | |
United Parcel Service, Inc., Class B | | | 7,552 | | | | 884,037 | |
XPO Logistics, Inc.(a)(b) | | | 3,138 | | | | 250,099 | |
| | | | | | | | |
| | | | 2,827,207 | |
|
| Airlines — 0.8% | |
Alaska Air Group, Inc. | | | 1,721 | | | | 116,598 | |
American Airlines Group, Inc. | | | 19,942 | | | | 571,937 | |
Copa Holdings SA, Class A | | | 142 | | | | 15,347 | |
Delta Air Lines, Inc. | | | 19,594 | | | | 1,145,857 | |
Deutsche Lufthansa AG, Registered Shares | | | 978 | | | | 18,002 | |
Southwest Airlines Co. | | | 17,353 | | | | 936,715 | |
Spirit Airlines, Inc.(a)(b) | | | 10,081 | | | | 406,365 | |
United Airlines Holdings, Inc.(a) | | | 11,511 | | | | 1,014,004 | |
| | | | | | | | |
| | | | 4,224,825 | |
|
| Auto Components — 0.5% | |
Aisin Seiki Co. Ltd. | | | 1,000 | | | | 37,040 | |
American Axle & Manufacturing Holdings, Inc.(a)(b) | | | 7,040 | | | | 75,750 | |
Aptiv PLC | | | 2,263 | | | | 214,917 | |
Autoliv, Inc. | | | 1,195 | | | | 100,870 | |
BorgWarner, Inc. | | | 2,097 | | | | 90,968 | |
Cie Generale des Etablissements Michelin SCA | | | 713 | | | | 87,741 | |
Continental AG | | | 53 | | | | 6,849 | |
Cooper-Standard Holdings, Inc.(a) | | | 2,053 | | | | 68,077 | |
Dana, Inc. | | | 22,284 | | | | 405,569 | |
Denso Corp. | | | 1,700 | | | | 76,776 | |
Gentex Corp. | | | 1,529 | | | | 44,310 | |
Goodyear Tire & Rubber Co. | | | 10,338 | | | | 160,808 | |
Koito Manufacturing Co. Ltd. | | | 600 | | | | 27,784 | |
LCI Industries | | | 5,286 | | | | 566,289 | |
Lear Corp. | | | 37 | | | | 5,076 | |
| | | | | | | | |
| Security | | Shares | | | Value | |
|
| Auto Components (continued) | |
Standard Motor Products, Inc. | | | 1,390 | | | $ | 73,976 | |
Stanley Electric Co. Ltd. | | | 1,400 | | | | 40,434 | |
Sumitomo Electric Industries Ltd. | | | 7,400 | | | | 111,134 | |
Tenneco, Inc., Class A | | | 12,138 | | | | 159,008 | |
Toyota Industries Corp. | | | 500 | | | | 28,770 | |
Visteon Corp.(a) | | | 1,269 | | | | 109,883 | |
| | | | | | | | |
| | | | 2,492,029 | |
|
| Automobiles — 0.7% | |
BAIC Motor Corp. Ltd., Class H(c) | | | 74,500 | | | | 42,333 | |
Bayerische Motoren Werke AG | | | 783 | | | | 64,132 | |
Daimler AG, Registered Shares | | | 534 | | | | 29,522 | |
Ferrari NV | | | 179 | | | | 29,720 | |
Fiat Chrysler Automobiles NV | | | 871 | | | | 12,914 | |
Ford Motor Co. | | | 51,140 | | | | 475,602 | |
Ford Otomotiv Sanayi AS | | | 16,064 | | | | 191,262 | |
General Motors Co. | | | 17,028 | | | | 623,225 | |
Harley-Davidson, Inc.(b) | | | 1,737 | | | | 64,599 | |
Honda Motor Co. Ltd. | | | 2,200 | | | | 62,263 | |
Hyundai Motor Co. | | | 6,380 | | | | 664,521 | |
Kia Motors Corp. | | | 8,988 | | | | 343,256 | |
Peugeot SA | | | 844 | | | | 20,321 | |
Renault SA | | | 623 | | | | 29,585 | |
Suzuki Motor Corp. | | | 1,100 | | | | 45,916 | |
Tesla, Inc.(a)(b) | | | 1,434 | | | | 599,885 | |
Toyota Motor Corp. | | | 4,000 | | | | 281,846 | |
Winnebago Industries, Inc.(b) | | | 573 | | | | 30,358 | |
| | | | | | | | |
| | | | 3,611,260 | |
|
| Banks — 6.6% | |
ABN AMRO Group NV CVA(c) | | | 288 | | | | 5,249 | |
AIB Group PLC | | | 1,393 | | | | 4,853 | |
Akbank TAS(a) | | | 53,248 | | | | 72,530 | |
Al Rajhi Bank | | | 33,536 | | | | 584,807 | |
Alinma Bank | | | 45,334 | | | | 306,341 | |
Ameris Bancorp(b) | | | 333 | | | | 14,166 | |
AMMB Holdings Bhd | | | 47,400 | | | | 45,336 | |
Australia & New Zealand Banking Group Ltd. | | | 4,879 | | | | 84,143 | |
Banco Bilbao Vizcaya Argentaria SA | | | 11,406 | | | | 64,037 | |
Banco de Sabadell SA | | | 2,141 | | | | 2,507 | |
Banco do Brasil SA | | | 9,800 | | | | 128,679 | |
Banco Santander Brasil SA | | | 3,100 | | | | 38,161 | |
Banco Santander SA | | | 31,805 | | | | 133,350 | |
Bancolombia SA — ADR | | | 13,858 | | | | 759,280 | |
Bancorp, Inc.(a) | | | 11,436 | | | | 148,325 | |
BankAl-Jazira | | | 10,368 | | | | 41,605 | |
Bank Hapoalim BM | | | 1,940 | | | | 16,111 | |
Bank LeumiLe-Israel BM | | | 2,554 | | | | 18,626 | |
Bank Mandiri Persero Tbk PT | | | 631,100 | | | | 348,723 | |
Bank of America Corp. | | | 53,487 | | | | 1,883,812 | |
Bank of Beijing Co. Ltd., Class A | | | 215,600 | | | | 176,062 | |
Bank of Commerce Holdings | | | 4,494 | | | | 51,996 | |
Bank of East Asia Ltd.(b) | | | 2,200 | | | | 4,912 | |
Bank of Guiyang Co. Ltd. | | | 84,600 | | | | 116,308 | |
Bank of Ireland Group PLC | | | 1,656 | | | | 9,114 | |
Bank of Jiangsu Co. Ltd., Class A | | | 167,298 | | | | 174,210 | |
Bank of Nanjing Co. Ltd., Class A | | | 85,566 | | | | 107,912 | |
Bank of Shanghai Co. Ltd., Class A | | | 45,296 | | | | 61,823 | |
Bank OZK | | | 1,713 | | | | 52,255 | |
Bank Polska Kasa Opieki SA | | | 6,581 | | | | 174,156 | |
Bank7 Corp. | | | 10 | | | | 190 | |
BankFinancial Corp. | | | 1,975 | | | | 25,833 | |
Banner Corp. | | | 8,722 | | | | 493,578 | |
Banque Saudi Fransi | | | 3,326 | | | | 33,605 | |
Barclays PLC | | | 29,492 | | | | 70,323 | |
| | |
| 2 | | 2019 BLACKROCK ANNUAL REPORTTO SHAREHOLDERS |
| | |
Schedule of Investments (continued) December 31, 2019 | | Active Stock Master Portfolio (Percentages shown are based on Net Assets) |
| | | | | | | | |
| Security | | Shares | | | Value | |
|
| Banks (continued) | |
BNP Paribas SA | | | 1,937 | | | $ | 115,132 | |
BOC Hong Kong Holdings Ltd. | | | 11,000 | | | | 38,186 | |
Cadence BanCorp(b) | | | 11,287 | | | | 204,633 | |
CaixaBank SA | | | 6,139 | | | | 19,332 | |
Capital City Bank Group, Inc. | | | 2,895 | | | | 88,297 | |
Capstar Financial Holdings, Inc. | | | 1,368 | | | | 22,777 | |
Cathay General Bancorp(b) | | | 24,173 | | | | 919,783 | |
Central Pacific Financial Corp. | | | 18,926 | | | | 559,831 | |
Chiba Bank Ltd. (The) | | | 900 | | | | 5,175 | |
China CITIC Bank Corp. Ltd., Class A | | | 62,596 | | | | 55,521 | |
China CITIC Bank Corp. Ltd., Class H | | | 202,000 | | | | 121,120 | |
China Construction Bank Corp., Class H | | | 616,000 | | | | 534,097 | |
China Everbright Bank Co. Ltd., Class A | | | 348,300 | | | | 220,833 | |
China Merchants Bank Co. Ltd., Class H | | | 16,500 | | | | 84,829 | |
China Minsheng Banking Corp. Ltd., Class A(a) | | | 169,900 | | | | 154,099 | |
CIMB Group Holdings Bhd | | | 475,600 | | | | 599,027 | |
CIT Group, Inc. | | | 5,580 | | | | 254,615 | |
Citigroup, Inc. | | | 6,077 | | | | 485,491 | |
Citizens Financial Group, Inc. | | | 2,008 | | | | 81,545 | |
Coastal Financial Corp./WA(a) | | | 267 | | | | 4,397 | |
Comerica, Inc. | | | 262 | | | | 18,798 | |
Commonwealth Bank of Australia | | | 3,313 | | | | 185,852 | |
Credicorp Ltd. | | | 831 | | | | 177,111 | |
Credit Agricole SA | | | 1,961 | | | | 28,535 | |
CTBC Financial Holding Co. Ltd. | | | 557,000 | | | | 416,715 | |
Cullen/Frost Bankers, Inc.(b) | | | 2,741 | | | | 268,015 | |
Danske Bank A/S | | | 429 | | | | 6,940 | |
DBS Group Holdings Ltd. | | | 3,000 | | | | 57,844 | |
DNB ASA | | | 934 | | | | 17,478 | |
Dubai Islamic Bank PJSC | | | 32,718 | | | | 49,107 | |
East West Bancorp, Inc. | | | 3,050 | | | | 148,535 | |
Erste Group Bank AG(a) | | | 368 | | | | 13,823 | |
First Abu Dhabi Bank PJSC | | | 28,253 | | | | 116,824 | |
First BanCorp, Puerto Rico | | | 1,403 | | | | 14,858 | |
First Citizens BancShares, Inc., Class A | | | 52 | | | | 27,675 | |
First Commonwealth Financial Corp. | | | 4,945 | | | | 71,752 | |
First Financial Corp. | | | 1,377 | | | | 62,956 | |
First Financial Northwest, Inc. | | | 18,667 | | | | 278,885 | |
First Horizon National Corp. | | | 16,351 | | | | 270,773 | |
First Midwest Bancorp, Inc.(b) | | | 2,099 | | | | 48,403 | |
First Savings Financial Group, Inc.(b) | | | 453 | | | | 30,396 | |
First United Corp. | | | 982 | | | | 23,656 | |
Glacier Bancorp, Inc.(b) | | | 3,633 | | | | 167,082 | |
Hang Seng Bank Ltd.(b) | | | 2,400 | | | | 49,608 | |
HBT Financial, Inc.(a) | | | 12,974 | | | | 246,376 | |
HDFC Bank Ltd. | | | 45,434 | | | | 810,704 | |
HDFC Bank Ltd. — ADR | | | 10,362 | | | | 656,640 | |
Home BancShares, Inc.(b) | | | 23,474 | | | | 461,499 | |
Hong Leong Bank Bhd | | | 16,600 | | | | 70,245 | |
HSBC Holdings PLC | | | 43,062 | | | | 337,108 | |
Iberiabank Corp. | | | 2,882 | | | | 215,660 | |
Independent Bank Group, Inc. | | | 8,774 | | | | 486,431 | |
Industrial & Commercial Bank of China Ltd., Class A | | | 126,000 | | | | 106,516 | |
Industrial & Commercial Bank of China Ltd., Class H | | | 111,000 | | | | 85,640 | |
ING Groep NV | | | 6,710 | | | | 80,670 | |
Intesa Sanpaolo SpA | | | 25,629 | | | | 67,512 | |
Investors Bancorp, Inc. | | | 11,646 | | | | 138,762 | |
Israel Discount Bank Ltd., Series A | | | 738 | | | | 3,427 | |
Japan Post Bank Co. Ltd. | | | 12,000 | | | | 115,137 | |
JPMorgan Chase & Co.(b) | | | 18,954 | | | | 2,642,188 | |
Karnataka Bank Ltd. | | | 48,343 | | | | 48,830 | |
KB Financial Group, Inc. | | | 7,343 | | | | 302,517 | |
KBC Group NV | | | 358 | | | | 26,991 | |
KeyCorp | | | 615 | | | | 12,448 | |
| | | | | | | | |
| Security | | Shares | | | Value | |
|
| Banks (continued) | |
Kotak Mahindra Bank Ltd. | | | 14,966 | | | $ | 353,231 | |
Lakeland Bancorp, Inc. | | | 6,566 | | | | 114,117 | |
M&T Bank Corp. | | | 132 | | | | 22,407 | |
Macatawa Bank Corp. | | | 505 | | | | 5,621 | |
Mediobanca Banca di Credito Finanziario SpA | | | 1,069 | | | | 11,770 | |
Mercantile Bank Corp. | | | 4,790 | | | | 174,691 | |
Mitsubishi UFJ Financial Group, Inc. | | | 33,400 | | | | 180,572 | |
Mizuho Financial Group, Inc. | | | 64,300 | | | | 99,049 | |
National Australia Bank Ltd. | | | 4,841 | | | | 83,769 | |
National Bank Holdings Corp., Class A | | | 2,352 | | | | 82,837 | |
National Commercial Bank | | | 36,998 | | | | 485,719 | |
Nedbank Group Ltd. | | | 16,668 | | | | 255,217 | |
Nordea Bank Abp | | | 4,428 | | | | 35,823 | |
Opus Bank | | | 1,160 | | | | 30,009 | |
Oversea-Chinese Banking Corp. Ltd. | | | 5,400 | | | | 44,175 | |
Pacific Mercantile Bancorp(a) | | | 25,243 | | | | 204,973 | |
Powszechna Kasa Oszczednosci Bank Polski SA | | | 86,780 | | | | 787,845 | |
Regional SAB de CV | | | 20,200 | | | | 113,406 | |
Republic Bancorp, Inc., Class A | | | 7,218 | | | | 337,802 | |
Republic First Bancorp, Inc.(a)(b) | | | 67,050 | | | | 280,269 | |
Resona Holdings, Inc. | | | 3,500 | | | | 15,255 | |
RHB Capital Bhd | | | 140,300 | | | | 198,248 | |
Riyad Bank | | | 35,129 | | | | 224,835 | |
Royal Bank of Scotland Group PLC | | | 8,273 | | | | 26,539 | |
Samba Financial Group | | | 10,249 | | | | 88,672 | |
Sandy Spring Bancorp, Inc. | | | 28,218 | | | | 1,068,898 | |
Saudi British Bank | | | 3,811 | | | | 35,241 | |
Shanghai Pudong Development Bank Co. Ltd., Class A | | | 49,300 | | | | 87,681 | |
Shinhan Financial Group Co. Ltd. | | | 8,654 | | | | 324,463 | |
Shizuoka Bank Ltd. | | | 700 | | | | 5,207 | |
Sierra Bancorp(b) | | | 9,097 | | | | 264,905 | |
Skandinaviska Enskilda Banken AB, Class A | | | 523 | | | | 4,918 | |
Societe Generale SA | | | 1,313 | | | | 45,821 | |
South Plains Financial, Inc. | | | 6,038 | | | | 126,013 | |
South State Corp. | | | 3,361 | | | | 291,567 | |
Standard Bank Group Ltd. | | | 59,220 | | | | 712,296 | |
Standard Chartered PLC | | | 4,776 | | | | 45,005 | |
Sumitomo Mitsui Financial Group, Inc. | | | 4,100 | | | | 151,435 | |
Sumitomo Mitsui Trust Holdings, Inc. | | | 500 | | | | 19,765 | |
Svenska Handelsbanken AB, Class A | | | 1,244 | | | | 13,398 | |
Swedbank AB, Class A | | | 285 | | | | 4,237 | |
Synovus Financial Corp. | | | 7,303 | | | | 286,278 | |
TCF Financial Corp. | | | 817 | | | | 38,236 | |
TriState Capital Holdings, Inc.(a)(b) | | | 43,917 | | | | 1,147,112 | |
Truist Financial Corp. | | | 6,444 | | | | 362,926 | |
Turkiye Garanti Bankasi AS(a) | | | 186,241 | | | | 348,796 | |
U.S. Bancorp | | | 8,658 | | | | 513,333 | |
UniCredit SpA | | | 3,461 | | | | 50,589 | |
United Community Banks, Inc. | | | 33,577 | | | | 1,036,858 | |
United Overseas Bank Ltd. | | | 2,100 | | | | 41,300 | |
Univest Financial Corp. | | | 4,217 | | | | 112,931 | |
Wells Fargo & Co.(b) | | | 24,292 | | | | 1,306,910 | |
WesBanco, Inc. | | | 143 | | | | 5,404 | |
Westpac Banking Corp. | | | 5,937 | | | | 101,385 | |
Wintrust Financial Corp. | | | 7,010 | | | | 497,009 | |
Woori Financial Group, Inc. | | | 3,462 | | | | 34,662 | |
Zions Bancorp. NA | | | 873 | | | | 45,326 | |
| | | | | | | | |
| | | | 33,675,316 | |
|
| Beverages — 1.6% | |
Anadolu Efes Biracilik Ve Malt Sanayii AS | | | 28,678 | | | | 111,260 | |
Anheuser-Busch InBev SA | | | 1,735 | | | | 142,097 | |
Asahi Group Holdings Ltd. | | | 800 | | | | 36,496 | |
Brown-Forman Corp., Class B(b) | | | 2,236 | | | | 151,154 | |
Budweiser Brewing Co. APAC Ltd.(a)(c) | | | 7,200 | | | | 24,301 | |
| | | | |
| SCHEDULE OF INVESTMENTS | | | 3 | |
| | |
Schedule of Investments (continued) December 31, 2019 | | Active Stock Master Portfolio (Percentages shown are based on Net Assets) |
| | | | | | | | |
| Security | | Shares | | | Value | |
|
| Beverages (continued) | |
Carlsberg A/S, Class B | | | 23 | | | $ | 3,432 | |
Coca-Cola Co. | | | 25,860 | | | | 1,431,351 | |
Coca-Cola European Partners PLC | | | 6,169 | | | | 313,879 | |
Coca-Cola Femsa SAB de C.V., ADR | | | 4,212 | | | | 255,331 | |
Coca-Cola Femsa SAB de CV | | | 38,800 | | | | 235,745 | |
Coca-Cola HBC AG(a) | | | 777 | | | | 26,410 | |
Constellation Brands, Inc., Class A | | | 1,282 | | | | 243,260 | |
Davide Campari-Milano SpA | | | 1,000 | | | | 9,137 | |
Diageo PLC | | | 5,526 | | | | 232,847 | |
Fomento Economico Mexicano SAB de CV | | | 92,000 | | | | 869,371 | |
Fraser & Neave Holdings BHD | | | 10,200 | | | | 86,876 | |
Heineken Holding NV | | | 1,004 | | | | 97,581 | |
Heineken NV | | | 325 | | | | 34,687 | |
Kirin Holdings Co. Ltd. | | | 1,700 | | | | 37,105 | |
Molson Coors Brewing Co., Class B(b) | | | 3,064 | | | | 165,150 | |
Monster Beverage Corp.(a) | | | 6,499 | | | | 413,012 | |
National Beverage Corp.(a) | | | 4,785 | | | | 244,131 | |
PepsiCo, Inc. | | | 12,467 | | | | 1,703,865 | |
Pernod Ricard SA | | | 283 | | | | 50,639 | |
Shanxi Xinghuacun Fen Wine Factory Co. Ltd., Class A | | | 16,863 | | | | 217,502 | |
Suntory Beverage & Food Ltd. | | | 200 | | | | 8,350 | |
Wuliangye Yibin Co. Ltd., Class A | | | 46,600 | | | | 892,351 | |
| | | | | | | | |
| | | | 8,037,320 | |
|
| Biotechnology — 3.3% | |
AbbVie, Inc. | | | 13,028 | | | | 1,153,499 | |
ACADIA Pharmaceuticals, Inc.(a)(b) | | | 8,123 | | | | 347,502 | |
Acceleron Pharma, Inc.(a)(b) | | | 1,564 | | | | 82,923 | |
Agenus, Inc.(a) | | | 45,478 | | | | 185,095 | |
Aimmune Therapeutics, Inc.(a)(b) | | | 600 | | | | 20,082 | |
Akcea Therapeutics, Inc.(a) | | | 645 | | | | 10,926 | |
Akero Therapeutics, Inc.(a) | | | 1,213 | | | | 26,923 | |
Alder Biopharmaceuticals, Inc.(d) | | | 3,943 | | | | 3,470 | |
Alector, Inc.(a) | | | 801 | | | | 13,801 | |
Alexion Pharmaceuticals, Inc.(a) | | | 1,731 | | | | 187,208 | |
Alnylam Pharmaceuticals, Inc.(a)(b) | | | 309 | | | | 35,588 | |
Amgen, Inc. | | | 4,135 | | | | 996,824 | |
Apellis Pharmaceuticals, Inc.(a) | | | 5,217 | | | | 159,745 | |
Aptinyx, Inc.(a) | | | 15,699 | | | | 53,691 | |
AquaBounty Technologies, Inc.(a)(b) | | | 3 | | | | 7 | |
Arcus Biosciences, Inc.(a)(b) | | | 24,198 | | | | 244,400 | |
Arrowhead Pharmaceuticals, Inc.(a)(b) | | | 4,851 | | | | 307,699 | |
Atara Biotherapeutics, Inc.(a) | | | 3,887 | | | | 64,019 | |
Athersys, Inc.(a)(b) | | | 54,167 | | | | 66,625 | |
Audentes Therapeutics, Inc.(a) | | | 2,010 | | | | 120,278 | |
BeiGene Ltd., ADR(a) | | | 83 | | | | 13,758 | |
Beyondspring, Inc.(a) | | | 672 | | | | 10,416 | |
Biocon Ltd. | | | 77,216 | | | | 317,721 | |
BioCryst Pharmaceuticals, Inc.(a) | | | 5,428 | | | | 18,727 | |
Biogen, Inc.(a) | | | 1,363 | | | | 404,443 | |
Biohaven Pharmaceutical Holding Co. Ltd.(a) | | | 1,357 | | | | 73,875 | |
BioMarin Pharmaceutical, Inc.(a) | | | 200 | | | | 16,910 | |
Blueprint Medicines Corp.(a) | | | 486 | | | | 38,933 | |
Calithera Biosciences, Inc.(a)(b) | | | 21,066 | | | | 120,287 | |
Castle Biosciences, Inc.(a)(b) | | | 1,050 | | | | 36,089 | |
Celltrion, Inc.(a) | | | 871 | | | | 135,777 | |
ChemoCentryx, Inc.(a) | | | 8,603 | | | | 340,249 | |
Chimerix, Inc.(a) | | | 18,925 | | | | 38,418 | |
Coherus Biosciences, Inc.(a)(b) | | | 15,034 | | | | 270,687 | |
Corvus Pharmaceuticals, Inc.(a)(b) | | | 21,424 | | | | 116,547 | |
Crinetics Pharmaceuticals, Inc.(a)(b) | | | 1,995 | | | | 50,055 | |
CSL Ltd. | | | 868 | | | | 168,290 | |
CytomX Therapeutics, Inc.(a) | | | 2,089 | | | | 17,360 | |
Deciphera Pharmaceuticals, Inc.(a)(b) | | | 1,984 | | | | 123,484 | |
Denali Therapeutics, Inc.(a)(b) | | | 6,803 | | | | 118,508 | |
| | | | | | | | |
| Security | | Shares | | | Value | |
|
| Biotechnology (continued) | |
Eagle Pharmaceuticals, Inc.(a)(b) | | | 2,477 | | | $ | 148,818 | |
Eiger Biopharmaceuticals, Inc.(a) | | | 2,058 | | | | 30,664 | |
Emergent Biosolutions, Inc.(a)(b) | | | 3,075 | | | | 165,896 | |
Enanta Pharmaceuticals, Inc.(a)(b) | | | 3,700 | | | | 228,586 | |
Epizyme, Inc.(a)(b) | | | 3,065 | | | | 75,399 | |
Exact Sciences Corp.(a)(b) | | | 2,871 | | | | 265,510 | |
Exelixis, Inc.(a)(b) | | | 4,683 | | | | 82,514 | |
Fate Therapeutics, Inc.(a)(b) | | | 9,857 | | | | 192,901 | |
FibroGen, Inc.(a)(b) | | | 4,926 | | | | 211,276 | |
Flexion Therapeutics, Inc.(a)(b) | | | 4,562 | | | | 94,433 | |
Galapagos NV(a) | | | 26 | | | | 5,414 | |
Genmab A/S(a) | | | 97 | | | | 21,573 | |
Gilead Sciences, Inc.(b) | | | 24,851 | | | | 1,614,818 | |
Global Blood Therapeutics, Inc.(a)(b) | | | 3,675 | | | | 292,126 | |
Gossamer Bio, Inc.(a)(b) | | | 3,404 | | | | 53,205 | |
Green Cross Corp. | | | 1,156 | | | | 132,015 | |
Grifols SA | | | 510 | | | | 18,019 | |
Hualan Biological Engineering, Inc., Class A | | | 20,900 | | | | 105,698 | |
Immunomedics, Inc.(a)(b) | | | 10,077 | | | | 213,229 | |
Incyte Corp.(a) | | | 1,816 | | | | 158,573 | |
Insmed, Inc.(a) | | | 8,999 | | | | 214,896 | |
Intellia Therapeutics, Inc.(a)(b) | | | 6,798 | | | | 99,727 | |
Intercept Pharmaceuticals, Inc.(a) | | | 2,852 | | | | 353,420 | |
Invitae Corp.(a)(b) | | | 11,559 | | | | 186,447 | |
Ionis Pharmaceuticals, Inc.(a) | | | 730 | | | | 44,099 | |
Ironwood Pharmaceuticals, Inc.(a) | | | 19,339 | | | | 257,402 | |
Jounce Therapeutics, Inc.(a) | | | 6,615 | | | | 57,749 | |
KalVista Pharmaceuticals, Inc.(a)(b) | | | 1,067 | | | | 19,003 | |
Kezar Life Sciences, Inc.(a) | | | 3,133 | | | | 12,563 | |
Kodiak Sciences, Inc.(a) | | | 747 | | | | 53,747 | |
Ligand Pharmaceuticals, Inc.(a)(b) | | | 2,977 | | | | 310,471 | |
MacroGenics, Inc.(a) | | | 8,094 | | | | 88,063 | |
Medicines Co.(a) | | | 3,065 | | | | 260,341 | |
Medy-Tox, Inc. | | | 155 | | | | 40,309 | |
Mirati Therapeutics, Inc.(a) | | | 787 | | | | 101,413 | |
Natera, Inc.(a) | | | 9,359 | | | | 315,305 | |
Neurocrine Biosciences, Inc.(a) | | | 191 | | | | 20,531 | |
OPKO Health, Inc.(a) | | | 49,249 | | | | 72,396 | |
Portola Pharmaceuticals, Inc.(a)(b) | | | 3,626 | | | | 86,589 | |
Precision BioSciences, Inc.(a)(b) | | | 3,260 | | | | 45,281 | |
Principia Biopharma, Inc.(a) | | | 1,837 | | | | 100,631 | |
Puma Biotechnology, Inc.(a) | | | 5,073 | | | | 44,389 | |
Ra Pharmaceuticals, Inc.(a)(b) | | | 1,921 | | | | 90,153 | |
Radius Health, Inc.(a) | | | 969 | | | | 19,535 | |
Regeneron Pharmaceuticals, Inc.(a) | | | 1,328 | | | | 498,637 | |
Replimune Group, Inc.(a) | | | 3,054 | | | | 43,825 | |
Retrophin, Inc.(a)(b) | | | 17,990 | | | | 255,458 | |
Rigel Pharmaceuticals, Inc.(a) | | | 15,153 | | | | 32,427 | |
Sangamo Therapeutics, Inc.(a)(b) | | | 6,487 | | | | 54,296 | |
Sarepta Therapeutics, Inc.(a) | | | 169 | | | | 21,808 | |
Seattle Genetics, Inc.(a)(b) | | | 347 | | | | 39,648 | |
Seegene, Inc.(a) | | | 3,949 | | | | 104,287 | |
Seres Therapeutics, Inc.(a) | | | 21,532 | | | | 74,285 | |
Spectrum Pharmaceuticals, Inc.(a) | | | 9,826 | | | | 35,767 | |
Stemline Therapeutics, Inc.(a)(b) | | | 1,297 | | | | 13,787 | |
Sutro Biopharma, Inc.(a)(b) | | | 2,790 | | | | 30,690 | |
Turning Point Therapeutics, Inc.(a) | | | 801 | | | | 49,894 | |
Ultragenyx Pharmaceutical, Inc.(a)(b) | | | 6,605 | | | | 282,100 | |
United Therapeutics Corp.(a) | | | 1,648 | | | | 145,156 | |
UNITY Biotechnology, Inc.(a)(b) | | | 7,272 | | | | 52,431 | |
Vanda Pharmaceuticals, Inc.(a) | | | 2,392 | | | | 39,253 | |
Veracyte, Inc.(a) | | | 9,446 | | | | 263,732 | |
Vertex Pharmaceuticals, Inc.(a)(b) | | | 3,313 | | | | 725,381 | |
X4 Pharmaceuticals, Inc.(a) | | | 864 | | | | 9,245 | |
| | |
| 4 | | 2019 BLACKROCK ANNUAL REPORTTO SHAREHOLDERS |
| | |
Schedule of Investments (continued) December 31, 2019 | | Active Stock Master Portfolio (Percentages shown are based on Net Assets) |
| | | | | | | | |
| Security | | Shares | | | Value | |
|
| Biotechnology (continued) | |
Xencor, Inc.(a) | | | 1,614 | | | $ | 55,505 | |
Y-mAbs Therapeutics, Inc.(a) | | | 3,589 | | | | 112,156 | |
| | | | | | | | |
| | | | 16,455,734 | |
|
| Building Products — 0.4% | |
Advanced Drainage Systems, Inc. | | | 881 | | | | 34,218 | |
AGC, Inc. | | | 1,000 | | | | 35,758 | |
Allegion PLC | | | 7,117 | | | | 886,351 | |
Apogee Enterprises, Inc. | | | 617 | | | | 20,053 | |
Assa Abloy AB, Class B | | | 2,593 | | | | 60,613 | |
Builders FirstSource, Inc.(a) | | | 19,059 | | | | 484,289 | |
Cie de Saint-Gobain | | | 930 | | | | 38,098 | |
Continental Building Products, Inc.(a) | | | 1,921 | | | | 69,982 | |
Daikin Industries Ltd. | | | 600 | | | | 84,654 | |
Kingspan Group PLC | | | 239 | | | | 14,597 | |
Resideo Technologies, Inc.(a) | | | 3,470 | | | | 41,397 | |
TOTO Ltd. | | | 600 | | | | 25,336 | |
Trex Co., Inc.(a) | | | 1,789 | | | | 160,795 | |
Universal Forest Products, Inc. | | | 5,824 | | | | 277,805 | |
| | | | | | | | |
| | | | 2,233,946 | |
|
| Capital Markets — 2.1% | |
3i Group PLC | | | 2,306 | | | | 33,556 | |
Affiliated Managers Group, Inc.(b) | | | 1,700 | | | | 144,058 | |
Ameriprise Financial, Inc. | | | 255 | | | | 42,478 | |
Amundi SA(c) | | | 258 | | | | 20,288 | |
Ares Management Corp., Class A | | | 2,673 | | | | 95,399 | |
Artisan Partners Asset Management, Inc., Class A | | | 2,389 | | | | 77,213 | |
ASX Ltd. | | | 331 | | | | 18,225 | |
B3 SA — Brasil Bolsa Balcao | | | 21,985 | | | | 234,841 | |
Bank of New York Mellon Corp. | | | 7,004 | | | | 352,511 | |
Blackstone Group, Inc., Class A | | | 1,613 | | | | 90,231 | |
Cboe Global Markets, Inc. | | | 442 | | | | 53,040 | |
Charles Schwab Corp.(b) | | | 11,911 | | | | 566,487 | |
China Merchants Securities Co. Ltd., Class A | | | 71,400 | | | | 188,004 | |
CITIC Securities Co. Ltd., Class H(b) | | | 16,500 | | | | 37,644 | |
CME Group, Inc. | | | 3,258 | | | | 653,946 | |
Cohen & Steers, Inc. | | | 3,079 | | | | 193,238 | |
Credit Suisse Group AG, Registered Shares(a) | | | 5,656 | | | | 76,456 | |
Daiwa Securities Group, Inc. | | | 2,600 | | | | 13,126 | |
Deutsche Bank AG, Registered Shares | | | 2,138 | | | | 16,566 | |
Deutsche Boerse AG | | | 626 | | | | 98,165 | |
Donnelley Financial Solutions, Inc.(a)(b) | | | 9,716 | | | | 101,727 | |
E*Trade Financial Corp. | | | 131 | | | | 5,944 | |
Everbright Securities Co. Ltd., Class A | | | 29,000 | | | | 54,719 | |
Evercore, Inc., Class A(b) | | | 1,195 | | | | 89,338 | |
FactSet Research Systems, Inc.(b) | | | 1,754 | | | | 470,598 | |
Focus Financial Partners, Inc., Class A(a) | | | 3,441 | | | | 101,406 | |
Franklin Resources, Inc.(b) | | | 929 | | | | 24,135 | |
Goldman Sachs Group, Inc. | | | 1,015 | | | | 233,379 | |
Guotai Junan Securities Co. Ltd., Class A | | | 107,400 | | | | 285,849 | |
Hamilton Lane, Inc., Class A(b) | | | 1,587 | | | | 94,585 | |
Hargreaves Lansdown PLC | | | 487 | | | | 12,492 | |
Hong Kong Exchanges & Clearing Ltd. | | | 2,000 | | | | 64,975 | |
Industrial Securities Co. Ltd., Class A | | | 211,400 | | | | 215,503 | |
Intercontinental Exchange, Inc. | | | 10,369 | | | | 959,651 | |
Invesco Ltd. | | | 2,426 | | | | 43,620 | |
Japan Exchange Group, Inc. | | | 1,600 | | | | 28,168 | |
Julius Baer Group Ltd.(a) | | | 383 | | | | 19,745 | |
KKR & Co., Inc., Class A | | | 1,110 | | | | 32,379 | |
London Stock Exchange Group PLC | | | 700 | | | | 71,940 | |
Macquarie Group Ltd. | | | 553 | | | | 53,555 | |
MarketAxess Holdings, Inc. | | | 131 | | | | 49,663 | |
Moelis & Co., Class A(b) | | | 10,549 | | | | 336,724 | |
Moody’s Corp. | | | 1,956 | | | | 464,374 | |
| | | | | | | | |
| Security | | Shares | | | Value | |
|
| Capital Markets (continued) | |
Morgan Stanley | | | 19,504 | | | $ | 997,045 | |
MSCI, Inc. | | | 227 | | | | 58,607 | |
Nasdaq, Inc. | | | 758 | | | | 81,182 | |
Natixis SA | | | 1,618 | | | | 7,207 | |
NH Investment & Securities Co. Ltd. | | | 4 | | | | 44 | |
Nomura Holdings, Inc. | | | 7,200 | | | | 37,050 | |
Northern Trust Corp. | | | 528 | | | | 56,095 | |
Partners Group Holding AG | | | 66 | | | | 60,491 | |
Pzena Investment Management, Inc., Class A | | | 2,613 | | | | 22,524 | |
Raymond James Financial, Inc. | | | 244 | | | | 21,828 | |
S&P Global, Inc. | | | 3,735 | | | | 1,019,842 | |
Schroders PLC | | | 213 | | | | 9,405 | |
SEI Investments Co. | | | 148 | | | | 9,691 | |
St. James’s Place PLC | | | 908 | | | | 13,997 | |
Standard Life Aberdeen PLC | | | 4,158 | | | | 18,090 | |
State Street Corp. | | | 1,144 | | | | 90,490 | |
Stifel Financial Corp. | | | 8,577 | | | | 520,195 | |
T. Rowe Price Group, Inc. | | | 752 | | | | 91,624 | |
TD Ameritrade Holding Corp. | | | 4,362 | | | | 216,791 | |
UBS Group AG, Registered Shares(a) | | | 9,228 | | | | 116,452 | |
Virtus Investment Partners, Inc.(b) | | | 2,066 | | | | 251,474 | |
Westwood Holdings Group, Inc.(b) | | | 1,999 | | | | 59,210 | |
| | | | | | | | |
| | | | 10,579,275 | |
|
| Chemicals — 1.7% | |
Air Liquide SA | | | 461 | | | | 65,356 | |
Air Products & Chemicals, Inc. | | | 2,450 | | | | 575,725 | |
Albemarle Corp.(b) | | | 1,874 | | | | 136,877 | |
Asahi Kasei Corp. | | | 1,700 | | | | 19,088 | |
Axalta Coating Systems Ltd.(a) | | | 3,003 | | | | 91,291 | |
BASF SE | | | 2,256 | | | | 169,959 | |
Celanese Corp. | | | 1,841 | | | | 226,664 | |
CF Industries Holdings, Inc. | | | 3,122 | | | | 149,044 | |
Clariant AG, Registered Shares(a) | | | 1,271 | | | | 28,405 | |
Corteva, Inc.(a) | | | 5,189 | | | | 153,387 | |
Daicel Corp. | | | 800 | | | | 7,648 | |
Dow, Inc.(a) | | | 4,085 | | | | 223,572 | |
DuPont de Nemours, Inc. | | | 4,902 | | | | 314,708 | |
Eastman Chemical Co. | | | 987 | | | | 78,230 | |
Ecolab, Inc. | | | 4,588 | | | | 885,438 | |
EMS-Chemie Holding AG, Registered Shares | | | 55 | | | | 36,159 | |
FMC Corp. | | | 747 | | | | 74,566 | |
Givaudan SA, Registered Shares | | | 8 | | | | 25,064 | |
Hanwha Chemical Corp. | | | 6,484 | | | | 105,409 | |
Hitachi Chemical Co. Ltd. | | | 900 | | | | 37,706 | |
Ingevity Corp.(a) | | | 1,605 | | | | 140,245 | |
Innophos Holdings, Inc. | | | 408 | | | | 13,048 | |
Innospec, Inc. | | | 2,781 | | | | 287,667 | |
International Flavors & Fragrances, Inc.(b) | | | 1,582 | | | | 204,110 | |
Israel Chemicals Ltd. | | | 6,191 | | | | 29,237 | |
Koninklijke DSM NV | | | 526 | | | | 68,772 | |
Kumho Petrochemical Co. Ltd. | | | 2,905 | | | | 194,277 | |
Linde PLC | | | 2,579 | | | | 549,069 | |
LyondellBasell Industries NV, Class A | | | 2,049 | | | | 193,589 | |
Mitsui Chemicals, Inc. | | | 600 | | | | 14,616 | |
Mosaic Co. | | | 8,337 | | | | 180,413 | |
Nippon Paint Holdings Co. Ltd. | | | 1,900 | | | | 97,815 | |
Nissan Chemical Corp. | | | 200 | | | | 8,376 | |
Nitto Denko Corp. | | | 2,000 | | | | 112,456 | |
Novozymes A/S, Class B | | | 313 | | | | 15,317 | |
PhosAgro PJSC, — GDR | | | 16,832 | | | | 213,766 | |
PolyOne Corp. | | | 27,194 | | | | 1,000,467 | |
PPG Industries, Inc. | | | 2,292 | | | | 305,959 | |
RPM International, Inc.(b) | | | 1,450 | | | | 111,302 | |
ScottsMiracle-Gro Co. | | | 867 | | | | 92,058 | |
| | | | |
| SCHEDULE OF INVESTMENTS | | | 5 | |
| | |
Schedule of Investments (continued) December 31, 2019 | | Active Stock Master Portfolio (Percentages shown are based on Net Assets) |
| | | | | | | | |
| Security | | Shares | | | Value | |
|
| Chemicals (continued) | |
Sherwin-Williams Co. | | | 1,703 | | | $ | 993,769 | |
Shin-Etsu Chemical Co. Ltd. | | | 600 | | | | 65,984 | |
Sinopec Shanghai Petrochemical Co. Ltd., Class H | | | 634,000 | | | | 191,391 | |
Sumitomo Chemical Co. Ltd. | | | 15,900 | | | | 72,195 | |
Symrise AG | | | 722 | | | | 75,889 | |
Teijin Ltd. | | | 1,000 | | | | 18,682 | |
Toray Industries, Inc. | | | 8,300 | | | | 56,237 | |
Tosoh Corp. | | | 1,300 | | | | 20,027 | |
Westlake Chemical Corp.(b) | | | 694 | | | | 48,684 | |
| | | | | | | | |
| | | | 8,779,713 | |
|
| Commercial Services & Supplies — 0.7% | |
ADT, Inc.(b) | | | 1,964 | | | | 15,575 | |
ARC Document Solutions, Inc.(a) | | | 26,658 | | | | 37,055 | |
Cintas Corp. | | | 740 | | | | 199,119 | |
Copart, Inc.(a) | | | 1,491 | | | | 135,592 | |
Country Garden Services Holdings Co. Ltd. | | | 38,000 | | | | 127,939 | |
Ennis, Inc. | | | 5,515 | | | | 119,400 | |
Healthcare Services Group, Inc.(b) | | | 10,513 | | | | 255,676 | |
McGrath RentCorp | | | 10,370 | | | | 793,720 | |
Mobile Mini, Inc. | | | 15,390 | | | | 583,435 | |
Republic Services, Inc. | | | 140 | | | | 12,548 | |
Shanghai M&G Stationery, Inc. | | | 13,900 | | | | 97,430 | |
Steelcase, Inc., Class A(b) | | | 33,962 | | | | 694,862 | |
Tetra Tech, Inc. | | | 2,911 | | | | 250,812 | |
Viad Corp. | | | 5,529 | | | | 373,207 | |
Waste Management, Inc. | | | 481 | | | | 54,815 | |
Harsco Corp.(a) | | | 2,315 | | | | 53,268 | |
SP Plus Corp.(a) | | | 1,632 | | | | 69,246 | |
| | | | | | | | |
| | | | 3,873,699 | |
|
| Communications Equipment — 0.4% | |
Calix, Inc.(a)(b) | | | 16,263 | | | | 130,104 | |
Ciena Corp.(a)(b) | | | 25,088 | | | | 1,071,007 | |
Cisco Systems, Inc. | | | 13,083 | | | | 627,461 | |
Sercomm Corp. | | | 45,000 | | | | 116,783 | |
Tessco Technologies, Inc. | | | 16,102 | | | | 180,664 | |
| | | | | | | | |
| | | | 2,126,019 | |
|
| Construction & Engineering — 0.9% | |
ACS Actividades de Construccion y Servicios SA | | | 1,606 | | | | 64,423 | |
Bouygues SA | | | 1,289 | | | | 54,946 | |
China Communications Services Corp. Ltd., Class H | | | 170,000 | | | | 123,927 | |
China Railway Construction Corp. Ltd., Class H | | | 71,500 | | | | 78,308 | |
China Railway Group Ltd., Class H | | | 301,000 | | | | 185,744 | |
Comfort Systems USA, Inc. | | | 16,969 | | | | 845,905 | |
Dycom Industries, Inc.(a)(b) | | | 9,856 | | | | 464,710 | |
Eiffage SA | | | 564 | | | | 64,706 | |
EMCOR Group, Inc. | | | 649 | | | | 56,009 | |
Engineers India Ltd. | | | 31,276 | | | | 43,387 | |
Fluor Corp. | | | 5,713 | | | | 107,861 | |
Hyundai Engineering & Construction Co. Ltd. | | | 1,986 | | | | 72,448 | |
IRB Infrastructure Developers Ltd.(a) | | | 49,010 | | | | 51,154 | |
KEC International Ltd. | | | 14,197 | | | | 60,106 | |
Larsen & Toubro Ltd. | | | 21,431 | | | | 389,840 | |
Larsen & Toubro Ltd. — GDR | | | 2,111 | | | | 38,784 | |
MasTec, Inc.(a) | | | 10,591 | | | | 679,519 | |
MYR Group, Inc.(a) | | | 3,935 | | | | 128,242 | |
Obayashi Corp. | | | 2,300 | | | | 25,545 | |
Samsung Engineering Co. Ltd.(a) | | | 10,961 | | | | 181,144 | |
Shimizu Corp. | | | 1,100 | | | | 11,206 | |
Sino-Thai Engineering & Construction PCL | | | 54,500 | | | | 25,799 | |
Taisei Corp. | | | 300 | | | | 12,426 | |
Tekfen Holding AS | | | 109,616 | | | | 356,028 | |
Vinci SA | | | 1,997 | | | | 222,413 | |
| | | | | | | | |
| Security | | Shares | | | Value | |
|
| Construction & Engineering (continued) | |
Voltas, Ltd. | | | 8,094 | | | $ | 74,805 | |
| | | | | | | | |
| | | | 4,419,385 | |
|
| Construction Materials — 0.4% | |
Anhui Conch Cement Co. Ltd., Class A | | | 34,700 | | | | 273,376 | |
Anhui Conch Cement Co. Ltd., Class H | | | 125,000 | | | | 910,766 | |
Cemex SAB de CV CPO | | | 329,510 | | | | 123,387 | |
CRH PLC(a) | | | 1,169 | | | | 46,887 | |
Martin Marietta Materials, Inc. | | | 508 | | | | 142,057 | |
Summit Materials, Inc., Class A(a)(b) | | | 15,613 | | | | 373,151 | |
Vulcan Materials Co. | | | 969 | | | | 139,526 | |
| | | | | | | | |
| | | | 2,009,150 | |
|
| Consumer Finance — 0.7% | |
Acom Co. Ltd. | | | 3,400 | | | | 15,426 | |
Ally Financial, Inc. | | | 11,636 | | | | 355,596 | |
American Express Co.(b) | | | 6,949 | | | | 865,081 | |
Bajaj Finance Ltd. | | | 4,462 | | | | 264,854 | |
Capital One Financial Corp. | | | 5,885 | | | | 605,625 | |
Discover Financial Services | | | 948 | | | | 80,409 | |
Elevate Credit, Inc.(a) | | | 8,804 | | | | 39,178 | |
Enova International, Inc.(a) | | | 8,665 | | | | 208,480 | |
FirstCash, Inc.(b) | | | 4,918 | | | | 396,538 | |
Gentera SAB de CV | | | 38,100 | | | | 39,234 | |
Green Dot Corp., Class A(a) | | | 16,891 | | | | 393,560 | |
Regional Management Corp.(a) | | | 4,047 | | | | 121,532 | |
Synchrony Financial | | | 1,569 | | | | 56,500 | |
| | | | | | | | |
| | | | 3,442,013 | |
|
| Containers & Packaging — 0.0% | |
Packaging Corp. of America | | | 168 | | | | 18,814 | |
Westrock Co. | | | 4,112 | | | | 176,446 | |
| | | | | | | | |
| | | | 195,260 | |
|
| Distributors — 0.1% | |
Core-Mark Holding Co., Inc. | | | 8,394 | | | | 228,233 | |
Pool Corp.(b) | | | 181 | | | | 38,440 | |
Wuchan Zhongda Group Co. Ltd. | | | 40,300 | | | | 30,428 | |
| | | | | | | | |
| | | | 297,101 | |
|
| Diversified Consumer Services — 0.4% | |
Chegg, Inc.(a) | | | 5,286 | | | | 200,392 | |
H&R Block, Inc. | | | 7,412 | | | | 174,034 | |
New Oriental Education & Technology Group, Inc. — ADR(a) | | | 6,673 | | | | 809,101 | |
OneSpaWorld Holdings Ltd.(a) | | | 3,601 | | | | 60,641 | |
Strategic Education, Inc.(b) | | | 4,068 | | | | 646,405 | |
| | | | | | | | |
| | | | 1,890,573 | |
|
| Diversified Financial Services — 0.7% | |
AXA Equitable Holdings, Inc. | | | 3,445 | | | | 85,367 | |
Ayala Corp. | | | 6,535 | | | | 101,222 | |
Berkshire Hathaway, Inc., Class B(a) | | | 8,421 | | | | 1,907,356 | |
Chailease Holding Co. Ltd. | | | 106,613 | | | | 491,468 | |
Eurazeo SE | | | 69 | | | | 4,736 | |
EXOR NV | | | 403 | | | | 31,245 | |
FGL Holdings | | | 7,646 | | | | 81,430 | |
FirstRand Ltd. | | | 94,935 | | | | 425,972 | |
Groupe Bruxelles Lambert SA | | | 681 | | | | 71,860 | |
Industrivarden AB, Class C | | | 286 | | | | 6,897 | |
Investor AB, Class B | | | 2,324 | | | | 126,876 | |
Kinnevik AB, Class B | | | 414 | | | | 10,145 | |
L E Lundbergforetagen AB, B Shares | | | 502 | | | | 22,037 | |
M&G PLC(a) | | | 4,365 | | | | 13,715 | |
Metro Pacific Investments Corp. | | | 626,000 | | | | 43,015 | |
Mitsubishi UFJ Lease & Finance Co. Ltd. | | | 600 | | | | 3,863 | |
ORIX Corp. | | | 3,800 | | | | 62,971 | |
| | |
| 6 | | 2019 BLACKROCK ANNUAL REPORTTO SHAREHOLDERS |
| | |
Schedule of Investments (continued) December 31, 2019 | | Active Stock Master Portfolio (Percentages shown are based on Net Assets) |
| | | | | | | | |
| Security | | Shares | | | Value | |
|
| Diversified Financial Services (continued) | |
Pargesa Holding SA, Bearer Shares | | | 285 | | | $ | 23,678 | |
Voya Financial, Inc. | | | 426 | | | | 25,977 | |
Wendel SA | | | 46 | | | | 6,128 | |
Yuanta Financial Holding Co. Ltd. | | | 172,000 | | | | 115,953 | |
| | | | | | | | |
| | | | 3,661,911 | |
|
| Diversified Telecommunication Services — 1.0% | |
AT&T, Inc. | | | 22,860 | | | | 893,369 | |
Bandwidth, Inc., Class A(a) | | | 716 | | | | 45,860 | |
CenturyLink, Inc. | | | 10,449 | | | | 138,031 | |
China Unicom Hong Kong Ltd. | | | 758,000 | | | | 713,748 | |
Cogent Communications Holdings, Inc. | | | 8,995 | | | | 591,961 | |
Hellenic Telecommunications Organization SA | | | 4,764 | | | | 76,256 | |
IDT Corp., Class B(a) | | | 8,437 | | | | 60,831 | |
KT Corp. — ADR(a) | | | 39,616 | | | | 459,546 | |
Nippon Telegraph & Telephone Corp. | | | 600 | | | | 15,164 | |
Ooma, Inc.(a) | | | 10,104 | | | | 133,676 | |
Saudi Telecom Co. | | | 14,518 | | | | 393,937 | |
Tata Communications Ltd. | | | 16,541 | | | | 91,988 | |
Telekom Malaysia Bhd | | | 130,300 | | | | 121,741 | |
Turk Telekomunikasyon AS(a) | | | 55,862 | | | | 69,166 | |
Verizon Communications, Inc. | | | 24,033 | | | | 1,475,626 | |
Vonage Holdings Corp.(a) | | | 2,328 | | | | 17,250 | |
| | | | | | | | |
| | | | 5,298,150 | |
|
| Electric Utilities — 1.1% | |
Alliant Energy Corp. | | | 2,856 | | | | 156,280 | |
CEZ AS | | | 11,459 | | | | 257,536 | |
CPFL Energia SA | | | 27,300 | | | | 241,260 | |
Edison International | | | 2,220 | | | | 167,410 | |
El Paso Electric Co. | | | 2,241 | | | | 152,141 | |
Electricite de France SA | | | 1,572 | | | | 17,541 | |
Energa SA(a) | | | 11 | | | | 21 | |
Evergy, Inc. | | | 890 | | | | 57,930 | |
Eversource Energy | | | 226 | | | | 19,226 | |
Exelon Corp. | | | 5,239 | | | | 238,846 | |
Fortum OYJ | | | 1,248 | | | | 30,805 | |
Iberdrola SA | | | 21,323 | | | | 219,746 | |
IDACORP, Inc.(b) | | | 11,345 | | | | 1,211,646 | |
Inter RAO UES PJSC | | | 4,981,360 | | | | 405,154 | |
NextEra Energy, Inc. | | | 2,106 | | | | 509,989 | |
Orsted A/S(c) | | | 452 | | | | 46,748 | |
Pinnacle West Capital Corp. | | | 2,008 | | | | 180,579 | |
PNM Resources, Inc. | | | 872 | | | | 44,219 | |
Portland General Electric Co. | | | 2,759 | | | | 153,925 | |
Red Electrica Corp. SA | | | 276 | | | | 5,561 | |
Tenaga Nasional Bhd | | | 60,400 | | | | 195,908 | |
Terna Rete Elettrica Nazionale SpA | | | 2,423 | | | | 16,205 | |
Verbund AG | | | 116 | | | | 5,821 | |
Xcel Energy, Inc. | | | 16,567 | | | | 1,051,839 | |
| | | | | | | | |
| | | | 5,386,336 | |
|
| Electrical Equipment — 0.5% | |
ABB Ltd., Registered Shares | | | 4,330 | | | | 104,453 | |
Amara Raja Batteries Ltd. | | | 2,304 | | | | 23,381 | |
AMETEK, Inc. | | | 5,520 | | | | 550,565 | |
Atkore International Group, Inc.(a) | | | 7,260 | | | | 293,740 | |
AZZ, Inc. | | | 225 | | | | 10,339 | |
Bharat Heavy Electricals Ltd. | | | 110,950 | | | | 67,569 | |
Fuji Electric Co. Ltd. | | | 500 | | | | 15,189 | |
Generac Holdings, Inc.(a) | | | 3,063 | | | | 308,107 | |
Hubbell, Inc. | | | 2,821 | | | | 417,000 | |
LSI Industries, Inc. | | | 14,477 | | | | 87,586 | |
Mitsubishi Electric Corp. | | | 8,600 | | | | 117,095 | |
Nidec Corp. | | | 1,000 | | | | 136,584 | |
Schneider Electric SE | | | 2,419 | | | | 248,527 | |
| | | | | | | | |
| Security | | Shares | | | Value | |
|
| Electrical Equipment (continued) | |
Siemens Gamesa Renewable Energy SA | | | 408 | | | $ | 7,185 | |
Vestas Wind Systems A/S | | | 604 | | | | 61,008 | |
| | | | | | | | |
| | | | 2,448,328 | |
|
| Electronic Equipment, Instruments & Components — 1.4% | |
AAC Technologies Holdings, Inc. | | | 9,500 | | | | 82,935 | |
Anixter International, Inc.(a) | | | 1,683 | | | | 155,004 | |
Avnet, Inc. | | | 2,993 | | | | 127,023 | |
CDW Corp. | | | 4,472 | | | | 638,781 | |
Compeq Manufacturing Co. Ltd. | | | 110,000 | | | | 165,874 | |
Corning, Inc. | | | 538 | | | | 15,661 | |
Daktronics, Inc. | | | 2,955 | | | | 17,996 | |
ePlus, Inc.(a) | | | 684 | | | | 57,654 | |
Hirose Electric Co. Ltd. | | | 400 | | | | 51,133 | |
Hitachi Ltd. | | | 1,100 | | | | 46,415 | |
Hon Hai Precision Industry Co. Ltd. | | | 450,000 | | | | 1,365,081 | |
Hon Hai Precision Industry Co. Ltd., — GDR | | | 2,721 | | | | 16,652 | |
Insight Enterprises, Inc.(a)(b) | | | 3,867 | | | | 271,811 | |
IPG Photonics Corp.(a)(b) | | | 203 | | | | 29,419 | |
Keyence Corp. | | | 200 | | | | 70,228 | |
Largan Precision Co. Ltd. | | | 5,000 | | | | 835,191 | |
LG Innotek Co. Ltd. | | | 1,389 | | | | 167,417 | |
Murata Manufacturing Co. Ltd. | | | 2,000 | | | | 123,097 | |
National Instruments Corp.(b) | | | 6,144 | | | | 260,137 | |
Omron Corp. | | | 100 | | | | 5,829 | |
OSI Systems, Inc.(a)(b) | | | 7,925 | | | | 798,365 | |
PC Connection, Inc. | | | 9,284 | | | | 461,044 | |
Sanmina Corp.(a) | | | 3,764 | | | | 128,879 | |
ScanSource, Inc.(a) | | | 19,859 | | | | 733,790 | |
Sunny Optical Technology Group Co. Ltd. | | | 10,400 | | | | 180,192 | |
TDK Corp. | | | 800 | | | | 89,903 | |
Tech Data Corp.(a) | | | 2,009 | | | | 288,492 | |
TPK Holding Co. Ltd.(a) | | | 23,000 | | | | 43,620 | |
Unimicron Technology Corp. | | | 70,000 | | | | 98,634 | |
| | | | | | | | |
| | | | 7,326,257 | |
|
| Energy Equipment & Services — 0.4% | |
Archrock, Inc. | | | 37,420 | | | | 375,697 | |
Baker Hughes Co. | | | 4,401 | | | | 112,798 | |
Exterran Corp.(a)(b) | | | 4,864 | | | | 38,085 | |
Forum Energy Technologies, Inc.(a) | | | 129,774 | | | | 218,020 | |
Halliburton Co. | | | 5,402 | | | | 132,187 | |
Matrix Service Co.(a) | | | 7,714 | | | | 176,496 | |
National Oilwell Varco, Inc. | | | 3,544 | | | | 88,777 | |
Natural Gas Services Group, Inc.(a)(b) | | | 4,228 | | | | 51,835 | |
Oceaneering International, Inc.(a)(b) | | | 17,187 | | | | 256,258 | |
Oil States International, Inc.(a)(b) | | | 2,154 | | | | 35,132 | |
Patterson-UTI Energy, Inc.(b) | | | 8,708 | | | | 91,434 | |
ProPetro Holding Corp.(a) | | | 5,360 | | | | 60,300 | |
Seadrill Ltd.(a) | | | 4,489 | | | | 11,402 | |
TechnipFMC PLC | | | 5,395 | | | | 115,669 | |
Tenaris SA | | | 2,082 | | | | 23,589 | |
Transocean Ltd.(a) | | | 13,908 | | | | 95,687 | |
| | | | | | | | |
| | | | 1,883,366 | |
|
| Entertainment — 0.7% | |
Activision Blizzard, Inc. | | | 3,393 | | | | 201,612 | |
Bollore SA | | | 2,022 | | | | 8,836 | |
Cinemark Holdings, Inc. | | | 3,311 | | | | 112,077 | |
Electronic Arts, Inc.(a) | | | 2,157 | | | | 231,899 | |
Glu Mobile, Inc.(a)(b) | | | 13,000 | | | | 78,650 | |
HUYA, Inc., ADR(a) | | | 4,086 | | | | 73,344 | |
IGG, Inc.(b) | | | 91,000 | | | | 67,201 | |
Konami Holdings Corp. | | | 100 | | | | 4,109 | |
Live Nation Entertainment, Inc.(a) | | | 3,378 | | | | 241,426 | |
NCSoft Corp. | | | 292 | | | | 136,249 | |
| | | | |
| SCHEDULE OF INVESTMENTS | | | 7 | |
| | |
Schedule of Investments (continued) December 31, 2019 | | Active Stock Master Portfolio (Percentages shown are based on Net Assets) |
| | | | | | | | |
| Security | | Shares | | | Value | |
|
| Entertainment (continued) | |
NetEase, Inc. — ADR(b) | | | 2,168 | | | $ | 664,795 | |
Netflix, Inc.(a) | | | 761 | | | | 246,237 | |
Nexon Co. Ltd.(a) | | | 800 | | | | 10,612 | |
Nintendo Co. Ltd. | | | 200 | | | | 79,992 | |
Spotify Technology SA(a) | | | 803 | | | | 120,089 | |
Take-Two Interactive Software, Inc.(a)(b) | | | 2,048 | | | | 250,737 | |
UbiSoft Entertainment SA(a) | | | 143 | | | | 9,907 | |
Walt Disney Co. | | | 5,628 | | | | 813,978 | |
Zynga, Inc., Class A(a) | | | 30,985 | | | | 189,628 | |
| | | | | | | | |
| | | | 3,541,378 | |
|
| Equity Real Estate Investment Trusts (REITs) — 3.0% | |
Acadia Realty Trust | | | 9,246 | | | | 239,749 | |
Agree Realty Corp. | | | 202 | | | | 14,174 | |
Alexandria Real Estate Equities, Inc. | | | 601 | | | | 97,110 | |
American Tower Corp. | | | 1,374 | | | | 315,773 | |
Armada Hoffler Properties, Inc.(b) | | | 19,806 | | | | 363,440 | |
AvalonBay Communities, Inc. | | | 417 | | | | 87,445 | |
Boston Properties, Inc. | | | 1,924 | | | | 265,243 | |
Brandywine Realty Trust(b) | | | 10,960 | | | | 172,620 | |
British Land Co. PLC | | | 1,539 | | | | 13,022 | |
City Office REIT, Inc. | | | 30,922 | | | | 418,065 | |
Covivio | | | 78 | | | | 8,858 | |
Crown Castle International Corp. | | | 1,243 | | | | 176,692 | |
Daiwa House REIT Investment Corp. | | | 3 | | | | 7,844 | |
Dexus | | | 1,867 | | | | 15,369 | |
DiamondRock Hospitality Co. | | | 13,254 | | | | 146,854 | |
Digital Realty Trust, Inc. | | | 440 | | | | 52,686 | |
EastGroup Properties, Inc. | | | 11,431 | | | | 1,516,551 | |
Equinix, Inc. | | | 230 | | | | 134,251 | |
Equity LifeStyle Properties, Inc. | | | 127 | | | | 8,939 | |
Equity Residential | | | 4,480 | | | | 362,522 | |
Essex Property Trust, Inc. | | | 504 | | | | 151,633 | |
Extra Space Storage, Inc. | | | 74 | | | | 7,816 | |
Fibra Uno Administracion SA de CV | | | 41,000 | | | | 63,514 | |
First Industrial Realty Trust, Inc. | | | 22,013 | | | | 913,760 | |
Four Corners Property Trust, Inc.(b) | | | 36,485 | | | | 1,028,512 | |
Gecina SA | | | 129 | | | | 23,094 | |
Goodman Group | | | 2,792 | | | | 26,237 | |
GPT Group | | | 3,313 | | | | 13,050 | |
Healthpeak Properties, Inc. | | | 840 | | | | 28,955 | |
Hersha Hospitality Trust(b) | | | 32,131 | | | | 467,506 | |
Host Hotels & Resorts, Inc. | | | 8,983 | | | | 166,635 | |
ICADE | | | 51 | | | | 5,553 | |
Invitation Homes, Inc. | | | 11,414 | | | | 342,078 | |
Japan Prime Realty Investment Corp. | | | 1 | | | | 4,397 | |
Japan Real Estate Investment Corp. | | | 3 | | | | 19,909 | |
Japan Retail Fund Investment Corp. | | | 4 | | | | 8,608 | |
Klepierre SA | | | 342 | | | | 13,011 | |
Lamar Advertising Co., Class A(b) | | | 5,215 | | | | 465,491 | |
Land Securities Group PLC | | | 1,205 | | | | 15,817 | |
Link REIT | | | 4,500 | | | | 47,673 | |
Mid-America Apartment Communities, Inc. | | | 139 | | | | 18,329 | |
Mirvac Group | | | 3,934 | | | | 8,805 | |
National Retail Properties, Inc. | | | 3,327 | | | | 178,394 | |
National Storage Affiliates Trust(b) | | | 10,634 | | | | 357,515 | |
NexPoint Residential Trust, Inc. | | | 18,913 | | | | 851,085 | |
Nippon Building Fund, Inc. | | | 4 | | | | 29,321 | |
Nippon Prologis REIT, Inc. | | | 3 | | | | 7,641 | |
Nomura Real Estate Master Fund, Inc. | | | 7 | | | | 11,974 | |
Park Hotels & Resorts, Inc.(b) | | | 17,230 | | | | 445,740 | |
Plymouth Industrial REIT, Inc. | | | 786 | | | | 14,455 | |
Prologis, Inc. | | | 2,819 | | | | 251,286 | |
Public Storage | | | 463 | | | | 98,600 | |
QTS Realty Trust, Inc., Class A | | | 16,048 | | | | 870,925 | |
| | | | | | | | |
| Security | | Shares | | | Value | |
|
| Equity Real Estate Investment Trusts (REITs) (continued) | |
Realty Income Corp. | | | 792 | | | $ | 58,315 | |
Regency Centers Corp. | | | 158 | | | | 9,968 | |
RLJ Lodging Trust(b) | | | 62,139 | | | | 1,101,103 | |
Ryman Hospitality Properties, Inc. | | | 6,879 | | | | 596,134 | |
SBA Communications Corp. | | | 253 | | | | 60,970 | |
Scentre Group | | | 9,095 | | | | 24,477 | |
Segro PLC | | | 1,870 | | | | 22,267 | |
Simon Property Group, Inc. | | | 6,070 | | | | 904,187 | |
SL Green Realty Corp. | | | 359 | | | | 32,985 | |
STAG Industrial, Inc. | | | 7,472 | | | | 235,891 | |
Stockland | | | 4,079 | | | | 13,235 | |
Summit Hotel Properties, Inc.(b) | | | 32,574 | | | | 401,963 | |
Sun Communities, Inc. | | | 118 | | | | 17,712 | |
Sunstone Hotel Investors, Inc. | | | 13,969 | | | | 194,448 | |
UDR, Inc. | | | 1,014 | | | | 47,354 | |
United Urban Investment Corp. | | | 5 | | | | 9,390 | |
Ventas, Inc. | | | 856 | | | | 49,425 | |
Vicinity Centres | | | 5,484 | | | | 9,592 | |
Welltower, Inc.(b) | | | 1,263 | | | | 103,288 | |
Weyerhaeuser Co. | | | 774 | | | | 23,375 | |
WP Carey, Inc. | | | 167 | | | | 13,367 | |
Unibail-Rodamco-Westfield | | | 237 | | | | 37,391 | |
| | | | | | | | |
| | | | 15,341,363 | |
|
| Food & Staples Retailing — 1.1% | |
Aeon Co. Ltd. | | | 1,700 | | | | 35,082 | |
Carrefour SA | | | 998 | | | | 16,785 | |
Coles Group Ltd. | | | 1,300 | | | | 13,533 | |
Colruyt SA | | | 1,059 | | | | 55,213 | |
Costco Wholesale Corp. | | | 8,001 | | | | 2,351,654 | |
CP ALL PCL — NVDR | | | 163,700 | | | | 394,447 | |
FamilyMart Co. Ltd. | | | 400 | | | | 9,580 | |
ICA Gruppen AB | | | 2,140 | | | | 99,963 | |
J. Sainsbury PLC | | | 25,567 | | | | 77,960 | |
Koninklijke Ahold Delhaize NV | | | 280 | | | | 7,020 | |
Kroger Co.(b) | | | 8,897 | | | | 257,924 | |
METRO AG | | | 2,017 | | | | 32,456 | |
Performance Food Group Co.(a) | | | 11,103 | | | | 571,582 | |
Raia Drogasil SA | | | 2,400 | | | | 66,606 | |
Seven & i Holdings Co. Ltd. | | | 700 | | | | 25,659 | |
Spar Group Ltd.(b) | | | 4,442 | | | | 62,752 | |
Sysco Corp. | | | 4,435 | | | | 379,370 | |
Tesco PLC | | | 27,887 | | | | 94,248 | |
Tsuruha Holdings, Inc. | | | 100 | | | | 12,840 | |
Wal-Mart de Mexico SAB de CV | | | 90,700 | | | | 259,760 | |
Walgreens Boots Alliance, Inc. | | | 5,858 | | | | 345,388 | |
Walmart, Inc. | | | 2,086 | | | | 247,900 | |
Weis Markets, Inc.(b) | | | 874 | | | | 35,388 | |
WM Morrison Supermarkets PLC | | | 23,724 | | | | 62,787 | |
Woolworths Group Ltd. | | | 2,992 | | | | 75,887 | |
| | | | | | | | |
| | | | 5,591,784 | |
|
| Food Products — 1.6% | |
a2 Milk Co. Ltd.(a) | | | 1,257 | | | | 12,727 | |
Associated British Foods PLC | | | 1,828 | | | | 62,885 | |
BRF SA(a) | | | 5,800 | | | | 50,752 | |
Calavo Growers, Inc.(b) | | | 5,491 | | | | 497,430 | |
Chocoladefabriken Lindt & Spruengli AG | | | 2 | | | | 15,530 | |
Chocoladefabriken Lindt & Spruengli AG, Registered Shares | | | 1 | | | | 88,345 | |
Conagra Brands, Inc. | | | 282 | | | | 9,656 | |
Danone SA | | | 1,333 | | | | 110,700 | |
Freshpet, Inc.(a)(b) | | | 10,897 | | | | 643,904 | |
General Mills, Inc. | | | 1,252 | | | | 67,057 | |
Hershey Co. | | | 6,405 | | | | 941,407 | |
| | |
| 8 | | 2019 BLACKROCK ANNUAL REPORTTO SHAREHOLDERS |
| | |
Schedule of Investments (continued) December 31, 2019 | | Active Stock Master Portfolio (Percentages shown are based on Net Assets) |
| | | | | | | | |
| Security | | Shares | | | Value | |
|
| Food Products (continued) | |
Hormel Foods Corp. | | | 4,729 | | | $ | 213,325 | |
Hostess Brands, Inc.(a) | | | 22,013 | | | | 320,069 | |
J&J Snack Foods Corp. | | | 2,593 | | | | 477,812 | |
JBS SA | | | 145,236 | | | | 931,486 | |
John B Sanfilippo & Son, Inc. | | | 3,696 | | | | 337,371 | |
Kerry Group PLC, Class A | | | 365 | | | | 45,487 | |
Kraft Heinz Co. | | | 650 | | | | 20,884 | |
Lamb Weston Holdings, Inc. | | | 39 | | | | 3,355 | |
Lancaster Colony Corp. | | | 135 | | | | 21,613 | |
McCormick & Co., Inc.(b) | | | 121 | | | | 20,537 | |
MEIJI Holdings Co. Ltd. | | | 200 | | | | 13,516 | |
Mondelez International, Inc., Class A | | | 2,878 | | | | 158,520 | |
Mowi ASA | | | 353 | | | | 9,178 | |
Nestle SA, Registered Shares | | | 6,481 | | | | 701,667 | |
Orkla ASA | | | 6,680 | | | | 67,741 | |
Simply Good Foods Co.(a) | | | 7,516 | | | | 214,507 | |
Tingyi Cayman Islands Holding Corp. | | | 192,000 | | | | 327,694 | |
Tyson Foods, Inc., Class A(b) | | | 464 | | | | 42,242 | |
Uni-President China Holdings Ltd. | | | 103,000 | | | | 108,209 | |
Uni-President Enterprises Corp. | | | 431,000 | | | | 1,068,806 | |
Vitasoy International Holdings Ltd.(b) | | | 10,000 | | | | 36,276 | |
Want Want China Holdings Ltd. | | | 77,000 | | | | 71,923 | |
WH Group Ltd.(c) | | | 10,500 | | | | 10,857 | |
Wilmar International Ltd. | | | 51,300 | | | | 157,168 | |
Yakult Honsha Co. Ltd. | | | 400 | | | | 22,045 | |
| | | | | | | | |
| | | | 7,902,681 | |
|
| Gas Utilities — 0.7% | |
Atmos Energy Corp. | | | 546 | | | | 61,075 | |
Beijing Enterprises Holdings Ltd. | | | 66,000 | | | | 302,845 | |
China Gas Holdings Ltd. | | | 14,000 | | | | 52,419 | |
ENN Energy Holdings Ltd. | | | 35,500 | | | | 387,844 | |
GAIL India Ltd. | | | 334,386 | | | | 566,822 | |
Gujarat Gas Ltd. | | | 15,259 | | | | 50,783 | |
Gujarat State Petronet Ltd. | | | 24,106 | | | | 74,130 | |
Hong Kong & China Gas Co. Ltd. | | | 62,000 | | | | 121,140 | |
Kunlun Energy Co. Ltd. | | | 620,000 | | | | 547,732 | |
Mahanagar Gas Ltd. | | | 4,989 | | | | 74,474 | |
Naturgy Energy Group SA | | | 2,430 | | | | 61,190 | |
New Jersey Resources Corp.(b) | | | 11,530 | | | | 513,892 | |
Petronas Gas Bhd | | | 24,200 | | | | 98,326 | |
Snam SpA | | | 3,508 | | | | 18,444 | |
Southwest Gas Holdings, Inc. | | | 7,643 | | | | 580,639 | |
Tokyo Gas Co. Ltd. | | | 400 | | | | 9,720 | |
| | | | | | | | |
| | | | 3,521,475 | |
|
| Health Care Equipment & Supplies — 1.7% | |
Abbott Laboratories(b) | | | 7,162 | | | | 622,091 | |
ABIOMED, Inc.(a)(b) | | | 29 | | | | 4,947 | |
Alcon, Inc.(a) | | | 772 | | | | 43,727 | |
Align Technology, Inc.(a) | | | 142 | | | | 39,624 | |
AtriCure, Inc.(a)(b) | | | 2,977 | | | | 96,782 | |
Baxter International, Inc. | | | 2,451 | | | | 204,953 | |
Becton Dickinson & Co. | | | 705 | | | | 191,739 | |
Boston Scientific Corp.(a) | | | 3,654 | | | | 165,234 | |
Carl Zeiss Meditec AG, Bearer Shares | | | 111 | | | | 14,111 | |
Cochlear Ltd. | | | 37 | | | | 5,831 | |
Coloplast A/S, Class B | | | 458 | | | | 56,820 | |
Cooper Cos., Inc. | | | 55 | | | | 17,671 | |
Danaher Corp. | | | 1,877 | | | | 288,082 | |
DENTSPLY SIRONA, Inc.(b) | | | 248 | | | | 14,034 | |
DexCom, Inc.(a) | | | 1,115 | | | | 243,895 | |
Edwards Lifesciences Corp.(a) | | | 2,989 | | | | 697,304 | |
Fisher & Paykel Healthcare Corp. Ltd. | | | 1,694 | | | | 25,352 | |
GenMark Diagnostics, Inc.(a) | | | 2,515 | | | | 12,097 | |
| | | | | | | | |
| Security | | Shares | | | Value | |
|
| Health Care Equipment & Supplies (continued) | |
Globus Medical, Inc., Class A(a) | | | 4,334 | | | $ | 255,186 | |
Hologic, Inc.(a) | | | 6,796 | | | | 354,819 | |
Hoya Corp. | | | 900 | | | | 85,916 | |
IDEXX Laboratories, Inc.(a) | | | 1,324 | | | | 345,736 | |
Inogen, Inc.(a)(b) | | | 6,101 | | | | 416,881 | |
Insulet Corp.(a) | | | 67 | | | | 11,470 | |
Intuitive Surgical, Inc.(a) | | | 272 | | | | 160,793 | |
iRhythm Technologies, Inc.(a) | | | 3,075 | | | | 209,377 | |
Koninklijke Philips NV | | | 1,894 | | | | 92,586 | |
LivaNova PLC(a)(b) | | | 405 | | | | 30,549 | |
Masimo Corp.(a)(b) | | | 180 | | | | 28,451 | |
Medtronic PLC | | | 6,668 | | | | 756,485 | |
Merit Medical Systems, Inc.(a)(b) | | | 1,934 | | | | 60,380 | |
Neogen Corp.(a) | | | 305 | | | | 19,904 | |
Novocure Ltd.(a) | | | 3,604 | | | | 303,709 | |
Olympus Corp. | | | 2,800 | | | | 43,156 | |
Osstem Implant Co. Ltd.(a) | | | 2,750 | | | | 100,605 | |
ResMed, Inc. | | | 266 | | | | 41,222 | |
RTI Surgical Holdings, Inc.(a)(b) | | | 12,556 | | | | 34,403 | |
SI-BONE, Inc.(a) | | | 3,601 | | | | 77,422 | |
Siemens Healthineers AG(c) | | | 1,067 | | | | 51,149 | |
Silk Road Medical, Inc.(a) | | | 2,923 | | | | 118,031 | |
SmileDirectClub, Inc.(a)(b) | | | 12,222 | | | | 106,820 | |
Smith & Nephew PLC | | | 1,496 | | | | 36,055 | |
Sonova Holding AG, Registered Shares | | | 100 | | | | 22,861 | |
Stryker Corp.(b) | | | 7,286 | | | | 1,529,623 | |
Sysmex Corp. | | | 300 | | | | 20,426 | |
Tactile Systems Technology, Inc.(a)(b) | | | 228 | | | | 15,392 | |
Tandem Diabetes Care, Inc.(a)(b) | | | 1,387 | | | | 82,679 | |
Teleflex, Inc. | | | 75 | | | | 28,233 | |
Terumo Corp. | | | 1,500 | | | | 53,211 | |
TransMedics Group, Inc.(a)(b) | | | 1,439 | | | | 27,355 | |
Varian Medical Systems, Inc.(a) | | | 83 | | | | 11,787 | |
Zimmer Biomet Holdings, Inc. | | | 481 | | | | 71,996 | |
| | | | | | | | |
| | | | 8,348,962 | |
|
| Health Care Providers & Services — 1.9% | |
AmerisourceBergen Corp. | | | 2,859 | | | | 243,072 | |
AMN Healthcare Services, Inc.(a)(b) | | | 12,706 | | | | 791,711 | |
Anthem, Inc. | | | 3,092 | | | | 933,877 | |
Apollo Hospitals Enterprise Ltd. | | | 1,925 | | | | 38,932 | |
Cardinal Health, Inc. | | | 348 | | | | 17,602 | |
Centene Corp.(a) | | | 227 | | | | 14,271 | |
Chemed Corp. | | | 1,028 | | | | 451,559 | |
Cigna Corp.(a) | | | 1,617 | | | | 330,660 | |
CVS Health Corp. | | | 13,392 | | | | 994,892 | |
DaVita, Inc.(a) | | | 149 | | | | 11,179 | |
Fresenius Medical Care AG & Co. KGaA | | | 461 | | | | 33,942 | |
Fresenius SE & Co. KGaA | | | 881 | | | | 49,577 | |
HCA Healthcare, Inc. | | | 800 | | | | 118,248 | |
HealthEquity, Inc.(a)(b) | | | 10,960 | | | | 811,807 | |
Humana, Inc. | | | 739 | | | | 270,858 | |
IHH Healthcare Bhd | | | 93,100 | | | | 124,649 | |
Integer Holdings Corp.(a) | | | 2,427 | | | | 195,204 | |
Laboratory Corp. of America Holdings(a) | | | 182 | | | | 30,789 | |
LHC Group, Inc.(a)(b) | | | 264 | | | | 36,369 | |
Magellan Health, Inc.(a) | | | 1,143 | | | | 89,440 | |
McKesson Corp. | | | 1,021 | | | | 141,225 | |
Patterson Cos., Inc.(b) | | | 51,294 | | | | 1,050,501 | |
Penumbra, Inc.(a)(b) | | | 421 | | | | 69,158 | |
PetIQ, Inc.(a) | | | 1,594 | | | | 39,930 | |
Quest Diagnostics, Inc. | | | 108 | | | | 11,533 | |
Ryman Healthcare Ltd. | | | 1,537 | | | | 16,893 | |
Select Medical Holdings Corp.(a) | | | 10,800 | | | | 252,072 | |
Sinopharm Group Co. Ltd., Class H | | | 148,800 | | | | 542,954 | |
| | | | |
| SCHEDULE OF INVESTMENTS | | | 9 | |
| | |
Schedule of Investments (continued) December 31, 2019 | | Active Stock Master Portfolio (Percentages shown are based on Net Assets) |
| | | | | | | | |
| Security | | Shares | | | Value | |
|
| Health Care Providers & Services (continued) | |
Tivity Health, Inc.(a)(b) | | | 990 | | | $ | 20,142 | |
U.S. Physical Therapy, Inc.(b) | | | 3,012 | | | | 344,422 | |
UnitedHealth Group, Inc. | | | 5,006 | | | | 1,471,664 | |
Universal Health Services, Inc., Class B | | | 153 | | | | 21,949 | |
WellCare Health Plans, Inc.(a) | | | 200 | | | | 66,042 | |
| | | | | | | | |
| | | | 9,637,123 | |
|
| Health Care Technology — 0.6% | |
Allscripts Healthcare Solutions, Inc.(a)(b) | | | 44,244 | | | | 434,255 | |
Castlight Health, Inc., Class B(a) | | | 73,355 | | | | 97,562 | |
Cerner Corp. | | | 394 | | | | 28,916 | |
Evolent Health, Inc., Class A(a)(b) | | | 25,586 | | | | 231,553 | |
Inovalon Holdings, Inc., Class A(a)(b) | | | 15,469 | | | | 291,127 | |
Inspire Medical Systems, Inc.(a)(b) | | | 1,225 | | | | 90,907 | |
M3, Inc. | | | 800 | | | | 24,124 | |
NextGen Healthcare, Inc.(a) | | | 3,998 | | | | 64,248 | |
Omnicell, Inc.(a) | | | 8,252 | | | | 674,353 | |
Phreesia, Inc.(a) | | | 15,681 | | | | 417,742 | |
Teladoc Health, Inc.(a)(b) | | | 2,206 | | | | 184,686 | |
Veeva Systems, Inc., Class A(a) | | | 2,130 | | | | 299,606 | |
Vocera Communications, Inc.(a)(b) | | | 1,589 | | | | 32,988 | |
| | | | | | | | |
| | | | 2,872,067 | |
|
| Hotels, Restaurants & Leisure — 1.5% | |
BJ’s Restaurants, Inc.(b) | | | 11,329 | | | | 430,049 | |
Boyd Gaming Corp. | | | 23,338 | | | | 698,740 | |
Brinker International, Inc.(b) | | | 3,482 | | | | 146,244 | |
Carnival Corp. | | | 3,066 | | | | 155,845 | |
Century Casinos, Inc.(a) | | | 28,255 | | | | 223,780 | |
Cheesecake Factory, Inc.(b) | | | 959 | | | | 37,267 | |
Chipotle Mexican Grill, Inc.(a) | | | 15 | | | | 12,557 | |
Choice Hotels International, Inc.(b) | | | 5,105 | | | | 528,010 | |
Churchill Downs, Inc. | | | 4,187 | | | | 574,456 | |
Darden Restaurants, Inc. | | | 4,419 | | | | 481,715 | |
Dunkin’ Brands Group, Inc. | | | 1,217 | | | | 91,932 | |
Everi Holdings, Inc.(a) | | | 1,826 | | | | 24,523 | |
Extended Stay America, Inc. | | | 8,568 | | | | 127,320 | |
Genting Bhd | | | 229,700 | | | | 339,899 | |
Genting Malaysia Bhd | | | 190,200 | | | | 153,095 | |
Gourmet Master Co. Ltd. | | | 8,000 | | | | 33,018 | |
International Game Technology PLC(b) | | | 3,104 | | | | 46,467 | |
J Alexander’s Holdings, Inc.(a) | | | 4,680 | | | | 44,741 | |
Jubilant Foodworks Ltd. | | | 6,507 | | | | 150,732 | |
McDonald’s Corp. | | | 3,842 | | | | 759,218 | |
OPAP SA | | | 4,323 | | | | 56,245 | |
Penn National Gaming, Inc.(a) | | | 4,126 | | | | 105,461 | |
Ruth’s Hospitality Group, Inc. | | | 4,458 | | | | 97,028 | |
Starbucks Corp. | | | 223 | | | | 19,606 | |
Target Hospitality Corp.(a)(b) | | | 15,756 | | | | 78,780 | |
Texas Roadhouse, Inc.(b) | | | 30,258 | | | | 1,704,130 | |
Wingstop, Inc. | | | 1,974 | | | | 170,218 | |
Wyndham Destinations, Inc. | | | 543 | | | | 28,068 | |
Yum China Holdings, Inc. | | | 6,520 | | | | 313,025 | |
| | | | | | | | |
| | | | 7,632,169 | |
|
| Household Durables — 0.8% | |
Bassett Furniture Industries, Inc. | | | 4,635 | | | | 77,312 | |
Century Communities, Inc.(a) | | | 2,549 | | | | 69,715 | |
D.R. Horton, Inc. | | | 6,793 | | | | 358,331 | |
Green Brick Partners, Inc.(a)(b) | | | 6,016 | | | | 69,064 | |
Helen of Troy Ltd.(a)(b) | | | 752 | | | | 135,202 | |
Hooker Furniture Corp. | | | 5,569 | | | | 143,068 | |
iRobot Corp.(a)(b) | | | 1,048 | | | | 53,060 | |
KB Home | | | 2,654 | | | | 90,953 | |
La-Z-Boy, Inc. | | | 1,963 | | | | 61,795 | |
Lennar Corp., Class A(b) | | | 1,412 | | | | 78,775 | |
| | | | | | | | |
| Security | | Shares | | | Value | |
|
| Household Durables (continued) | |
LG Electronics, Inc. | | | 14,681 | | | $ | 911,942 | |
LGI Homes, Inc.(a)(b) | | | 872 | | | | 61,607 | |
M/I Homes, Inc.(a) | | | 4,035 | | | | 158,777 | |
MDC Holdings, Inc. | | | 24,122 | | | | 920,496 | |
Meritage Homes Corp.(a) | | | 5,457 | | | | 333,477 | |
NVR, Inc.(a) | | | 13 | | | | 49,509 | |
PulteGroup, Inc. | | | 892 | | | | 34,610 | |
SEB SA | | | 65 | | | | 9,667 | |
Sony Corp. | | | 1,600 | | | | 108,636 | |
TopBuild Corp.(a) | | | 2,766 | | | | 285,119 | |
TRI Pointe Group, Inc.(a) | | | 872 | | | | 13,586 | |
| | | | | | | | |
| | | | 4,024,701 | |
|
| Household Products — 0.8% | |
Central Garden & Pet Co.(a) | | | 660 | | | | 20,506 | |
Church & Dwight Co., Inc. | | | 7,651 | | | | 538,171 | |
Clorox Co. | | | 445 | | | | 68,325 | |
Colgate-Palmolive Co. | | | 2,628 | | | | 180,912 | |
Henkel AG & Co. KGaA | | | 319 | | | | 29,984 | |
Kimberly-Clark Corp. | | | 1,380 | | | | 189,819 | |
Kimberly-Clark de Mexico SAB de CV, Class A(a) | | | 98,500 | | | | 195,359 | |
LG Household & Health Care Ltd. | | | 429 | | | | 466,002 | |
Lion Corp. | | | 300 | | | | 5,832 | |
Procter & Gamble Co. | | | 18,566 | | | | 2,318,893 | |
Reckitt Benckiser Group PLC | | | 1,585 | | | | 128,747 | |
Unicharm Corp. | | | 400 | | | | 13,507 | |
| | | | | | | | |
| | | | 4,156,057 | |
|
| Independent Power and Renewable Electricity Producers — 0.1% | |
Huaneng Power International, Inc., Class H | | | 32,000 | | | | 16,181 | |
Meridian Energy Ltd. | | | 5,962 | | | | 20,083 | |
TerraForm Power, Inc., Class A | | | 11,724 | | | | 180,433 | |
Uniper SE | | | 509 | | | | 16,823 | |
| | | | | | | | |
| | | | 233,520 | |
|
| Industrial Conglomerates — 0.4% | |
3M Co. | | | 536 | | | | 94,561 | |
Carlisle Cos., Inc. | | | 870 | | | | 140,801 | |
CITIC Ltd. | | | 57,000 | | | | 76,079 | |
DCC PLC | | | 632 | | | | 54,819 | |
Honeywell International, Inc. | | | 3,147 | | | | 557,019 | |
KOC Holding AS | | | 84,786 | | | | 289,755 | |
NWS Holdings Ltd. | | | 18,000 | | | | 25,228 | |
Roper Technologies, Inc. | | | 1,195 | | | | 423,305 | |
Siemens AG, Registered Shares | | | 2,012 | | | | 262,750 | |
Smiths Group PLC | | | 1,288 | | | | 28,768 | |
Toshiba Corp. | | | 600 | | | | 20,365 | |
| | | | | | | | |
| | | | 1,973,450 | |
|
| Insurance — 2.6% | |
Admiral Group PLC | | | 323 | | | | 9,870 | |
Aflac, Inc. | | | 3,961 | | | | 209,537 | |
Ageas | | | 137 | | | | 8,101 | |
AIA Group Ltd. | | | 22,600 | | | | 237,706 | |
Alleghany Corp.(a) | | | 16 | | | | 12,793 | |
Allianz SE, Registered Shares | | | 1,157 | | | | 283,497 | |
Allstate Corp. | | | 6,936 | | | | 779,953 | |
American Financial Group, Inc. | | | 61 | | | | 6,689 | |
American International Group, Inc. | | | 4,337 | | | | 222,618 | |
Aon PLC | | | 1,069 | | | | 222,662 | |
Arch Capital Group Ltd.(a) | | | 725 | | | | 31,095 | |
Arthur J Gallagher & Co. | | | 2,960 | | | | 281,881 | |
Assicurazioni Generali SpA | | | 4,950 | | | | 102,192 | |
Assurant, Inc. | | | 76 | | | | 9,962 | |
Athene Holding Ltd., Class A(a) | | | 496 | | | | 23,327 | |
Aviva PLC | | | 6,700 | | | | 37,189 | |
| | |
| 10 | | 2019 BLACKROCK ANNUAL REPORTTO SHAREHOLDERS |
| | |
Schedule of Investments (continued) December 31, 2019 | | Active Stock Master Portfolio (Percentages shown are based on Net Assets) |
| | | | | | | | |
| Security | | Shares | | | Value | |
|
| Insurance (continued) | |
AXA SA | | | 4,365 | | | $ | 123,338 | |
Bajaj Finserv Ltd. | | | 1,238 | | | | 162,995 | |
Baloise Holding AG, Registered Shares | | | 83 | | | | 15,022 | |
Brown & Brown, Inc. | | | 5,399 | | | | 213,152 | |
BRP Group, Inc.(a) | | | 2,788 | | | | 44,747 | |
Cathay Financial Holding Co. Ltd. | | | 74,476 | | | | 105,746 | |
China Life Insurance Co. Ltd.(a) | | | 29,948 | | | | 25,568 | |
China Life Insurance Co. Ltd., Class A | | | 12,652 | | | | 63,524 | |
China Life Insurance Co. Ltd., Class H | | | 730,000 | | | | 2,030,609 | |
China Pacific Insurance Group Co. Ltd., Class A | | | 24,800 | | | | 135,043 | |
China Pacific Insurance Group Co. Ltd., Class H | | | 12,800 | | | | 50,432 | |
Cincinnati Financial Corp. | | | 3,728 | | | | 391,999 | |
CNO Financial Group, Inc.(b) | | | 37,565 | | | | 681,053 | |
CNP Assurances | | | 294 | | | | 5,858 | |
Dai-ichi Life Holdings, Inc. | | | 1,800 | | | | 29,664 | |
Direct Line Insurance Group PLC | | | 2,352 | | | | 9,731 | |
Discovery Ltd. | | | 8,800 | | | | 75,792 | |
Employers Holdings, Inc. | | | 10,869 | | | | 453,781 | |
Everest Re Group Ltd. | | | 51 | | | | 14,119 | |
FedNat Holding Co. | | | 6,938 | | | | 115,379 | |
Fidelity National Financial, Inc. | | | 564 | | | | 25,577 | |
First American Financial Corp. | | | 5,541 | | | | 323,151 | |
Gjensidige Forsikring ASA | | | 155 | | | | 3,254 | |
Globe Life, Inc. | | | 2,929 | | | | 308,277 | |
Hannover Rueck SE | | | 282 | | | | 54,374 | |
Hanwha Life Insurance Co. Ltd. | | | 43,151 | | | | 86,009 | |
Hartford Financial Services Group, Inc. | | | 1,209 | | | | 73,471 | |
HCI Group, Inc.(b) | | | 909 | | | | 41,496 | |
Heritage Insurance Holdings, Inc. | | | 2,252 | | | | 29,839 | |
Insurance Australia Group Ltd. | | | 2,815 | | | | 15,125 | |
Investors Title Co. | | | 19 | | | | 3,025 | |
IRB Brasil Resseguros S/A | | | 16,700 | | | | 161,699 | |
Japan Post Holdings Co. Ltd. | | | 8,100 | | | | 76,176 | |
Kinsale Capital Group, Inc.(b) | | | 641 | | | | 65,164 | |
Legal & General Group PLC | | | 10,196 | | | | 40,958 | |
Lincoln National Corp. | | | 1,779 | | | | 104,979 | |
Mapfre SA | | | 1,844 | | | | 4,889 | |
Markel Corp.(a) | | | 42 | | | | 48,013 | |
Marsh & McLennan Cos., Inc. | | | 3,007 | | | | 335,010 | |
MetLife, Inc. | | | 8,769 | | | | 446,956 | |
MS&AD Insurance Group Holdings, Inc. | | | 1,500 | | | | 49,513 | |
Muenchener Rueckversicherungs-Gesellschaft AG, Registered Shares | | | 418 | | | | 123,349 | |
National General Holdings Corp. | | | 2,480 | | | | 54,808 | |
New China Life Insurance Co. Ltd., Class A | | | 9,600 | | | | 67,925 | |
NN Group NV | | | 516 | | | | 19,620 | |
Ping An Insurance Group Co. of China Ltd., Class H | | | 89,000 | | | | 1,053,178 | |
Poste Italiane SpA(c) | | | 1,575 | | | | 17,897 | |
Principal Financial Group, Inc. | | | 816 | | | | 44,880 | |
Progressive Corp. | | | 3,914 | | | | 283,334 | |
Protective Insurance Corp., Class B | | | 3,231 | | | | 51,987 | |
Prudential Financial, Inc.(b) | | | 5,120 | | | | 479,949 | |
Prudential PLC | | | 4,408 | | | | 84,460 | |
QBE Insurance Group Ltd. | | | 791 | | | | 7,148 | |
Reinsurance Group of America, Inc. | | | 82 | | | | 13,371 | |
RenaissanceRe Holdings Ltd. | | | 26 | | | | 5,096 | |
RSA Insurance Group PLC | | | 1,764 | | | | 13,221 | |
Sampo OYJ, Class A | | | 1,239 | | | | 54,099 | |
SCOR SE | | | 271 | | | | 11,408 | |
Sompo Holdings, Inc. | | | 500 | | | | 19,635 | |
Sony Financial Holdings, Inc. | | | 200 | | | | 4,801 | |
Swiss Life Holding AG, Registered Shares | | | 59 | | | | 29,599 | |
Swiss Re AG | | | 798 | | | | 89,649 | |
T&D Holdings, Inc. | | | 900 | | | | 11,381 | |
| | | | | | | | |
| Security | | Shares | | | Value | |
|
| Insurance (continued) | |
Tokio Marine Holdings, Inc. | | | 2,000 | | | $ | 111,978 | |
Travelers Cos., Inc. | | | 1,431 | | | | 195,975 | |
United Insurance Holdings Corp. | | | 1,995 | | | | 25,157 | |
Universal Insurance Holdings, Inc. | | | 1,903 | | | | 53,265 | |
Unum Group | | | 7,443 | | | | 217,038 | |
W.R. Berkley Corp. | | | 960 | | | | 66,336 | |
Watford Holdings Ltd.(a) | | | 548 | | | | 13,788 | |
Willis Towers Watson PLC | | | 750 | | | | 151,455 | |
Zurich Insurance Group AG | | | 407 | | | | 166,951 | |
| | | | | | | | |
| | | | 13,066,317 | |
|
| Interactive Media & Services — 3.4% | |
Alphabet, Inc., Class A(a) | | | 2,094 | | | | 2,804,683 | |
Alphabet, Inc., Class C(a) | | | 2,141 | | | | 2,862,560 | |
Auto Trader Group PLC(c) | | | 367 | | | | 2,898 | |
Baidu, Inc. — ADR(a) | | | 5,181 | | | | 654,878 | |
Care.com, Inc.(a) | | | 1,192 | | | | 17,916 | |
Cargurus, Inc.(a)(b) | | | 10,451 | | | | 367,666 | |
Cars.com, Inc.(a) | | | 9,462 | | | | 115,626 | |
EverQuote, Inc., Class A(a) | | | 3,920 | | | | 134,652 | |
Facebook, Inc., Class A(a) | | | 17,359 | | | | 3,562,935 | |
IAC/InterActiveCorp.(a) | | | 170 | | | | 42,349 | |
JOYY, Inc., ADR(a) | | | 782 | | | | 41,282 | |
Just Dial Ltd.(a) | | | 22,976 | | | | 183,913 | |
Momo, Inc., ADR | | | 2,461 | | | | 82,443 | |
Pinterest, Inc., Class A, Class A(a) | | | 4,705 | | | | 87,701 | |
Snap, Inc., Class A(a) | | | 2,176 | | | | 35,534 | |
Tencent Holdings Ltd. | | | 110,000 | | | | 5,299,374 | |
TripAdvisor, Inc. | | | 3,996 | | | | 121,398 | |
TrueCar, Inc.(a) | | | 23,092 | | | | 109,687 | |
Twitter, Inc.(a) | | | 6,273 | | | | 201,050 | |
Yandex NV, Class A(a) | | | 2,534 | | | | 110,204 | |
Yelp, Inc.(a) | | | 15,317 | | | | 533,491 | |
Z Holdings Corp. | | | 4,500 | | | | 18,999 | |
Zillow Group, Inc., Class C(a)(b) | | | 293 | | | | 13,460 | |
| | | | | | | | |
| | | | 17,404,699 | |
|
| Internet & Direct Marketing Retail — 3.3% | |
1-800-Flowers.com, Inc., Class A(a) | | | 12,050 | | | | 174,725 | |
Alibaba Group Holding Ltd.(a) | | | 19,500 | | | | 518,512 | |
Alibaba Group Holding Ltd. — ADR(a) | | | 31,651 | | | | 6,713,177 | |
Amazon.com, Inc.(a) | | | 3,244 | | | | 5,994,393 | |
Booking Holdings, Inc.(a)(b) | | | 184 | | | | 377,886 | |
eBay, Inc. | | | 929 | | | | 33,546 | |
Expedia Group, Inc. | | | 410 | | | | 44,337 | |
GrubHub, Inc.(a)(b) | | | 405 | | | | 19,699 | |
JD.com, Inc. — ADR(a) | | | 50,584 | | | | 1,782,074 | |
Meituan Dianping, Class B(a) | | | 3,100 | | | | 40,505 | |
MercadoLibre, Inc.(a) | | | 109 | | | | 62,341 | |
Naspers Ltd., Class N | | | 4,275 | | | | 699,591 | |
Prosus NV(a) | | | 956 | | | | 71,549 | |
Qurate Retail, Inc., Series A(a) | | | 2,289 | | | | 19,296 | |
Stitch Fix, Inc., Class A(a)(b) | | | 801 | | | | 20,554 | |
Vipshop Holdings Ltd. — ADR(a) | | | 20,988 | | | | 297,400 | |
Wayfair, Inc., Class A(a)(b) | | | 342 | | | | 30,907 | |
| | | | | | | | |
| | | | 16,900,492 | |
|
| IT Services — 3.3% | |
Accenture PLC, Class A | | | 2,575 | | | | 542,218 | |
Adyen NV(a)(c) | | | 34 | | | | 27,968 | |
Alliance Data Systems Corp. | | | 75 | | | | 8,415 | |
Amadeus IT Group SA | | | 1,212 | | | | 99,259 | |
Automatic Data Processing, Inc. | | | 7,109 | | | | 1,212,084 | |
Black Knight, Inc.(a)(b) | | | 474 | | | | 30,564 | |
Broadridge Financial Solutions, Inc.(b) | | | 3,233 | | | | 399,405 | |
Cognizant Technology Solutions Corp., Class A | | | 1,805 | | | | 111,946 | |
| | | | |
| SCHEDULE OF INVESTMENTS | | | 11 | |
| | |
Schedule of Investments (continued) December 31, 2019 | | Active Stock Master Portfolio (Percentages shown are based on Net Assets) |
| | | | | | | | |
| Security | | Shares | | | Value | |
|
| IT Services (continued) | |
CSG Systems International, Inc. | | | 13,997 | | | $ | 724,765 | |
Fidelity National Information Services, Inc. | | | 2,646 | | | | 368,032 | |
Fiserv, Inc.(a)(b) | | | 2,150 | | | | 248,604 | |
FleetCor Technologies, Inc.(a) | | | 60 | | | | 17,263 | |
Fujitsu Ltd. | | | 300 | | | | 28,217 | |
Genpact Ltd. | | | 13,173 | | | | 555,505 | |
Global Payments, Inc. | | | 952 | | | | 173,797 | |
GoDaddy, Inc., Class A(a) | | | 3,091 | | | | 209,941 | |
Hackett Group, Inc. | | | 17,257 | | | | 278,528 | |
Infosys Ltd. | | | 103,706 | | | | 1,067,967 | |
Infosys Ltd. — ADR(b) | | | 88,052 | | | | 908,697 | |
International Business Machines Corp. | | | 4,190 | | | | 561,628 | |
International Money Express, Inc.(a)(b) | | | 6,289 | | | | 75,720 | |
Jack Henry & Associates, Inc.(b) | | | 2,353 | | | | 342,761 | |
LiveRamp Holdings, Inc.(a)(b) | | | 6,210 | | | | 298,515 | |
ManTech International Corp., Class A | | | 10,495 | | | | 838,341 | |
Mastercard, Inc., Class A | | | 9,964 | | | | 2,975,151 | |
Mphasis Ltd. | | | 12,282 | | | | 158,691 | |
NEC Corp. | | | 300 | | | | 12,415 | |
Okta, Inc.(a)(b) | | | 311 | | | | 35,880 | |
Paychex, Inc.(b) | | | 12,769 | | | | 1,086,131 | |
PayPal Holdings, Inc.(a) | | | 5,232 | | | | 565,945 | |
Perficient, Inc.(a)(b) | | | 4,215 | | | | 194,185 | |
Perspecta, Inc. | | | 620 | | | | 16,393 | |
Samsung SDS Co. Ltd. | | | 1,182 | | | | 198,369 | |
Square, Inc., Class A(a) | | | 1,091 | | | | 68,253 | |
Tech Mahindra Ltd. | | | 6,702 | | | | 71,576 | |
Twilio, Inc., Class A(a) | | | 300 | | | | 29,484 | |
VeriSign, Inc.(a) | | | 189 | | | | 36,416 | |
Verra Mobility Corp.(a)(b) | | | 1,605 | | | | 22,454 | |
Visa, Inc., Class A | | | 9,928 | | | | 1,865,471 | |
Wipro Ltd. | | | 19,262 | | | | 66,326 | |
Wipro Ltd. — ADR | | | 52,692 | | | | 197,595 | |
Wirecard AG | | | 145 | | | | 17,484 | |
Worldline SA(a)(c) | | | 250 | | | | 17,723 | |
| | | | | | | | |
| | | | 16,766,082 | |
|
| Leisure Products — 0.1% | |
Malibu Boats, Inc., Class A(a) | | | 7,453 | | | | 305,200 | |
| | | | | | | | |
|
| Life Sciences Tools & Services — 0.4% | |
10X Genomics, Inc., Class A(a) | | | 1,664 | | | | 126,880 | |
Adaptive Biotechnologies Corp.(a) | | | 1,018 | | | | 30,459 | |
Agilent Technologies, Inc. | | | 480 | | | | 40,949 | |
Illumina, Inc.(a)(b) | | | 421 | | | | 139,663 | |
IQVIA Holdings, Inc.(a) | | | 387 | | | | 59,795 | |
Lonza Group AG, Registered Shares(a) | | | 103 | | | | 37,575 | |
Medpace Holdings, Inc.(a) | | | 4,005 | | | | 336,660 | |
Mettler-Toledo International, Inc.(a)(b) | | | 34 | | | | 26,971 | |
NanoString Technologies, Inc.(a) | | | 3,857 | | | | 107,302 | |
NeoGenomics, Inc.(a)(b) | | | 2,534 | | | | 74,119 | |
Personalis, Inc.(a) | | | 3,251 | | | | 35,436 | |
QIAGEN NV(a) | | | 383 | | | | 13,050 | |
Repligen Corp.(a) | | | 978 | | | | 90,465 | |
Syneos Health, Inc.(a) | | | 5,587 | | | | 332,287 | |
Thermo Fisher Scientific, Inc. | | | 2,092 | | | | 679,628 | |
Waters Corp.(a) | | | 84 | | | | 19,627 | |
| | | | | | | | |
| | | | 2,150,866 | |
|
| Machinery — 2.1% | |
AGCO Corp. | | | 2,182 | | | | 168,560 | |
Albany International Corp., Class A | | | 2,456 | | | | 186,460 | |
Alfa Laval AB | | | 223 | | | | 5,616 | |
ANDRITZ AG | | | 1,348 | | | | 57,951 | |
Atlas Copco AB, A Shares | | | 3,897 | | | | 155,551 | |
Atlas Copco AB, Class B | | | 881 | | | | 30,589 | |
| | | | | | | | |
| Security | | Shares | | | Value | |
|
| Machinery (continued) | |
Blue Bird Corp.(a) | | | 7,049 | | | $ | 161,563 | |
Cummins, Inc. | | | 1,246 | | | | 222,984 | |
Daifuku Co. Ltd. | | | 700 | | | | 42,304 | |
Deere & Co. | | | 2,018 | | | | 349,639 | |
Doosan Infracore Co. Ltd.(a) | | | 51,964 | | | | 248,737 | |
Epiroc AB, Class A | | | 4,839 | | | | 59,177 | |
Epiroc AB, Class B | | | 1,012 | | | | 12,027 | |
ESCO Technologies, Inc. | | | 10,869 | | | | 1,005,383 | |
Evoqua Water Technologies Corp.(a) | | | 22,994 | | | | 435,736 | |
FANUC Corp. | | | 700 | | | | 129,265 | |
GEA Group AG | | | 257 | | | | 8,498 | |
Greenbrier Cos., Inc. | | | 1,168 | | | | 37,878 | |
Hillenbrand, Inc. | | | 10,069 | | | | 335,398 | |
IDEX Corp. | | | 2,044 | | | | 351,568 | |
Illinois Tool Works, Inc. | | | 759 | | | | 136,339 | |
Ingersoll-Rand PLC | | | 711 | | | | 94,506 | |
Iochpe-Maxion SA | | | 47,806 | | | | 277,849 | |
John Bean Technologies Corp.(b) | | | 599 | | | | 67,483 | |
JTEKT Corp. | | | 600 | | | | 7,088 | |
KION Group AG | | | 190 | | | | 13,066 | |
Knorr-Bremse AG | | | 958 | | | | 97,519 | |
Komatsu Ltd. | | | 600 | | | | 14,401 | |
Kone OYJ, Class B | | | 3,168 | | | | 207,149 | |
Kubota Corp. | | | 3,400 | | | | 53,391 | |
Kurita Water Industries Ltd. | | | 1,400 | | | | 41,545 | |
Lonking Holdings Ltd. | | | 371,000 | | | | 111,471 | |
Miller Industries, Inc. | | | 8,335 | | | | 309,479 | |
MINEBEA MITSUMI, Inc. | | | 2,200 | | | | 45,444 | |
MISUMI Group, Inc. | | | 1,600 | | | | 39,600 | |
Mitsubishi Heavy Industries Ltd. | | | 1,600 | | | | 62,043 | |
Nabtesco Corp. | | | 200 | | | | 5,893 | |
NSK Ltd. | | | 5,400 | | | | 51,047 | |
Oshkosh Corp. | | | 6,778 | | | | 641,538 | |
PACCAR, Inc.(b) | | | 15,877 | | | | 1,255,871 | |
Parker-Hannifin Corp. | | | 14 | | | | 2,882 | |
Rexnord Corp.(a) | | | 11,638 | | | | 379,632 | |
Schindler Holding AG, Participation Certificates | | | 390 | | | | 99,177 | |
Schindler Holding AG, Registered Shares | | | 280 | | | | 68,570 | |
Sinotruk Hong Kong Ltd. | | | 13,500 | | | | 28,813 | |
SMC Corp. | | | 200 | | | | 91,463 | |
Snap-on, Inc.(b) | | | 1,344 | | | | 227,674 | |
Spirax-Sarco Engineering PLC | | | 120 | | | | 14,126 | |
Techtronic Industries Co. Ltd. | | | 3,000 | | | | 24,485 | |
Wabash National Corp. | | | 8,355 | | | | 122,735 | |
WABCO Holdings, Inc.(a) | | | 360 | | | | 48,780 | |
Wartsila OYJ Abp | | �� | 674 | | | | 7,450 | |
Weichai Power Co. Ltd., Class H | | | 377,000 | | | | 795,743 | |
Westinghouse Air Brake Technologies Corp. | | | 1,984 | | | | 154,355 | |
Woodward, Inc. | | | 3,927 | | | | 465,114 | |
Xylem, Inc.(b) | | | 157 | | | | 12,370 | |
Yaskawa Electric Corp. | | | 200 | | | | 7,534 | |
Zoomlion Heavy Industry Science and Technology Co. Ltd., Class A | | | 283,098 | | | | 272,248 | |
Zoomlion Heavy Industry Science and Technology Co. Ltd., Class H | | | 436,000 | | | | 365,474 | |
| | | | | | | | |
| | | | 10,726,231 | |
|
| Marine — 0.1% | |
AP Moeller — Maersk A/S, Class A | | | 23 | | | | 31,176 | |
Kuehne + Nagel International AG, Registered Shares | | | 335 | | | | 56,503 | |
MISC Bhd | | | 124,500 | | | | 254,374 | |
| | | | | | | | |
| | | | 342,053 | |
|
| Media — 0.7% | |
AMC Networks, Inc., Class A(a) | | | 4,087 | | | | 161,436 | |
| | |
| 12 | | 2019 BLACKROCK ANNUAL REPORTTO SHAREHOLDERS |
| | |
Schedule of Investments (continued) December 31, 2019 | | Active Stock Master Portfolio (Percentages shown are based on Net Assets) |
| | | | | | | | |
| Security | | Shares | | | Value | |
|
| Media (continued) | |
Cardlytics, Inc.(a) | | | 460 | | | $ | 28,916 | |
Cheil Worldwide, Inc. | | | 2,585 | | | | 53,759 | |
Comcast Corp., Class A | | | 15,121 | | | | 679,991 | |
Discovery, Inc., Class A(a)(b) | | | 7,939 | | | | 259,923 | |
Discovery, Inc., Class C(a) | | | 892 | | | | 27,197 | |
Emerald Expositions Events, Inc. | | | 2,571 | | | | 27,124 | |
Entravision Communications Corp., Class A | | | 23,429 | | | | 61,384 | |
EW Scripps Co., Class A | | | 4,565 | | | | 71,716 | |
Gray Television, Inc.(a) | | | 6,598 | | | | 141,461 | |
iHeartMedia, Inc., Class A(a)(b) | | | 27,754 | | | | 469,043 | |
Interpublic Group of Cos., Inc. | | | 22,012 | | | | 508,477 | |
Liberty Media Corp. — Liberty SiriusXM, Class A(a) | | | 337 | | | | 16,291 | |
Marchex, Inc., Class B(a) | | | 5,595 | | | | 21,149 | |
McClatchy Co., Class A(a) | | | 3,156 | | | | 1,515 | |
MSG Networks, Inc., Class A(a) | | | 4,505 | | | | 78,387 | |
MultiChoice Group Ltd.(a) | | | 29,749 | | | | 247,846 | |
Sirius XM Holdings, Inc. | | | 76,812 | | | | 549,206 | |
Townsquare Media, Inc., Class A(b) | | | 4,560 | | | | 45,463 | |
ViacomCBS, Inc., Class B Class B(b) | | | 1,833 | | | | 76,931 | |
Zee Entertainment Enterprises Ltd. | | | 15,988 | | | | 65,450 | |
| | | | | | | | |
| | | | 3,592,665 | |
|
| Metals & Mining — 1.9% | |
Alcoa Corp.(a)(b) | | | 8,775 | | | | 188,750 | |
Anglo American Platinum Ltd. | | | 13,678 | | | | 1,276,714 | |
AngloGold Ashanti Ltd. | | | 8,536 | | | | 193,902 | |
ArcelorMittal SA | | | 2,648 | | | | 46,657 | |
Carpenter Technology Corp. | | | 1,031 | | | | 51,323 | |
Fortescue Metals Group Ltd. | | | 12,712 | | | | 95,828 | |
Glencore PLC(a) | | | 26,441 | | | | 82,330 | |
Gold Fields Ltd. | | | 15,095 | | | | 103,033 | |
Gold Fields Ltd. — ADR | | | 45,262 | | | | 298,729 | |
Hindalco Industries Ltd. | | | 128,016 | | | | 388,097 | |
Hochschild Mining PLC | | | 52,450 | | | | 127,154 | |
Hyundai Steel Co. | | | 987 | | | | 26,760 | |
Impala Platinum Holdings Ltd.(a) | | | 8,069 | | | | 82,444 | |
Industrias Penoles SAB de CV | | | 3 | | | | 31 | |
Jiangxi Copper Co. Ltd., Class H | | | 40,000 | | | | 55,015 | |
Kaiser Aluminum Corp. | | | 168 | | | | 18,630 | |
Korea Zinc Co. Ltd. | | | 141 | | | | 51,814 | |
Magnitogorsk Iron & Steel Works PJSC | | | 434,684 | | | | 293,976 | |
Magnitogorsk Iron & Steel Works PJSC, — GDR | | | 4,861 | | | | 42,163 | |
Maruichi Steel Tube Ltd. | | | 300 | | | | 8,431 | |
Materion Corp.(b) | | | 9,342 | | | | 555,382 | |
MMC Norilsk Nickel PJSC | | | 1,429 | | | | 439,629 | |
MMC Norilsk Nickel PJSC, ADR | | | 20,494 | | | | 626,732 | |
Nippon Steel Corp. | | | 4,000 | | | | 60,292 | |
Nucor Corp. | | | 11,728 | | | | 660,052 | |
Olympic Steel, Inc. | | | 2,566 | | | | 45,983 | |
POSCO | | | 6,712 | | | | 1,364,305 | |
POSCO — ADR | | | 5,906 | | | | 298,962 | |
Reliance Steel & Aluminum Co. | | | 1,460 | | | | 174,850 | |
Rio Tinto Ltd. | | | 2,778 | | | | 196,543 | |
Rio Tinto PLC | | | 6,898 | | | | 408,327 | |
Ryerson Holding Corp.(a) | | | 12,781 | | | | 151,199 | |
Schnitzer Steel Industries, Inc., Class A | | | 713 | | | | 15,458 | |
Severstal PAO — GDR | | | 7,444 | | | | 112,654 | |
Severstal PJSC | | | 41,415 | | | | 626,346 | |
Steel Dynamics, Inc. | | | 13,982 | | | | 475,947 | |
Warrior Met Coal, Inc.(b) | | | 712 | | | | 15,045 | |
Zijin Mining Group Co. Ltd., Class H | | | 214,000 | | | | 106,287 | |
| | | | | | | | |
| | | | 9,765,774 | |
|
| Mortgage Real Estate Investment Trusts (REITs) — 0.2% | |
AGNC Investment Corp. | | | 1,341 | | | | 23,709 | |
| | | | | | | | |
| Security | | Shares | | | Value | |
|
| Mortgage Real Estate Investment Trusts (REITs) (continued) | |
Annaly Capital Management, Inc. | | | 2,760 | | | $ | 25,999 | |
Ellington Financial, Inc. | | | 628 | | | | 11,511 | |
Great Ajax Corp. | | | 5,098 | | | | 75,502 | |
Invesco Mortgage Capital, Inc.(b) | | | 47,362 | | | | 788,577 | |
KKR Real Estate Finance Trust, Inc.(b) | | | 2,439 | | | | 49,804 | |
| | | | | | | | |
| | | | 975,102 | |
|
| Multi-Utilities — 0.4% | |
Ameren Corp. | | | 8,369 | | | | 642,739 | |
Avista Corp. | | | 6,836 | | | | 328,743 | |
Consolidated Edison, Inc. | | | 2,858 | | | | 258,563 | |
DTE Energy Co. | | | 5,484 | | | | 712,207 | |
E.ON SE | | | 3,765 | | | | 40,236 | |
Engie SA | | | 3,124 | | | | 50,604 | |
National Grid PLC | | | 1,140 | | | | 14,247 | |
Public Service Enterprise Group, Inc. | | | 1,058 | | | | 62,475 | |
| | | | | | | | |
| | | | 2,109,814 | |
|
| Multiline Retail — 0.2% | |
Dollar General Corp. | | | 3,623 | | | | 565,115 | |
Kohl’s Corp. | | | 249 | | | | 12,687 | |
Target Corp. | | | 1,789 | | | | 229,368 | |
| | | | | | | | |
| | | | 807,170 | |
|
| Oil, Gas & Consumable Fuels — 4.0% | |
Aker BP ASA | | | 185 | | | | 6,072 | |
Apache Corp.(b) | | | 2,061 | | | | 52,741 | |
Arch Coal, Inc., Class A(b) | | | 1,666 | | | | 119,519 | |
Ardmore Shipping Corp.(a) | | | 7,033 | | | | 63,649 | |
BP PLC | | | 44,642 | | | | 280,834 | |
Brigham Minerals, Inc., Class A | | | 610 | | | | 13,078 | |
Cabot Oil & Gas Corp. | | | 2,564 | | | | 44,639 | |
Callon Petroleum Co.(a) | | | 17,433 | | | | 84,201 | |
Cheniere Energy, Inc.(a) | | | 58 | | | | 3,542 | |
Chevron Corp. | | | 6,970 | | | | 839,955 | |
China Coal Energy Co. Ltd., Class H | | | 102,000 | | | | 40,479 | |
China Petroleum & Chemical Corp., Class H | | | 60,000 | | | | 36,128 | |
China Shenhua Energy Co. Ltd., Class H | | | 182,500 | | | | 381,590 | |
CNOOC Ltd. | | | 631,000 | | | | 1,049,245 | |
CNOOC Ltd. — ADR | | | 1,231 | | | | 205,171 | |
Concho Resources, Inc.(b) | | | 1,143 | | | | 100,093 | |
ConocoPhillips | | | 10,064 | | | | 654,462 | |
Continental Resources, Inc.(b) | | | 6,560 | | | | 225,008 | |
Cosan Ltd., Class A(a) | | | 2,782 | | | | 63,541 | |
CVR Energy, Inc. | | | 1,214 | | | | 49,082 | |
Delek US Holdings, Inc.(b) | | | 2,547 | | | | 85,401 | |
Devon Energy Corp. | | | 4,583 | | | | 119,021 | |
Diamondback Energy, Inc. | | | 920 | | | | 85,431 | |
Eni SpA | | | 9,729 | | | | 151,103 | |
EOG Resources, Inc. | | | 10,545 | | | | 883,249 | |
Equinor ASA | | | 3,943 | | | | 78,632 | |
Evolution Petroleum Corp.(b) | | | 40,922 | | | | 223,843 | |
Exxon Mobil Corp. | | | 41,468 | | | | 2,893,637 | |
Galp Energia SGPS SA | | | 1,390 | | | | 23,335 | |
Geopark Ltd. | | | 10,087 | | | | 222,923 | |
Hess Corp. | | | 1,485 | | | | 99,213 | |
HollyFrontier Corp. | | | 136 | | | | 6,897 | |
Inpex Corp. | | | 3,800 | | | | 39,367 | |
JXTG Holdings, Inc. | | | 5,500 | | | | 24,962 | |
Kinder Morgan, Inc. | | | 14,724 | | | | 311,707 | |
Koninklijke Vopak NV | | | 120 | | | | 6,521 | |
Laredo Petroleum, Inc.(a) | | | 49,833 | | | | 143,021 | |
LUKOIL PJSC | | | 9,459 | | | | 938,815 | |
Lukoil PJSC — ADR | | | 16,419 | | | | 1,635,440 | |
Lundin Petroleum AB | | | 101 | | | | 3,429 | |
Marathon Oil Corp. | | | 7,725 | | | | 104,906 | |
| | | | |
| SCHEDULE OF INVESTMENTS | | | 13 | |
| | |
Schedule of Investments (continued) December 31, 2019 | | Active Stock Master Portfolio (Percentages shown are based on Net Assets) |
| | | | | | | | |
| Security | | Shares | | | Value | |
|
| Oil, Gas & Consumable Fuels (continued) | |
Marathon Petroleum Corp. | | | 10,535 | | | $ | 634,734 | |
Matador Resources Co.(a)(b) | | | 18,805 | | | | 337,926 | |
MOL Hungarian Oil & Gas PLC | | | 8,898 | | | | 88,696 | |
Neste OYJ | | | 1,052 | | | | 36,604 | |
Noble Energy, Inc.(b) | | | 25,553 | | | | 634,737 | |
Nordic American Tankers Ltd. | | | 18,788 | | | | 92,437 | |
Novatek PJSC — GDR | | | 1,627 | | | | 330,281 | |
Occidental Petroleum Corp. | | | 3,677 | | | | 151,529 | |
Oil Search Ltd. | | | 2,696 | | | | 13,747 | |
OMV AG | | | 761 | | | | 42,635 | |
ONEOK, Inc. | | | 1,047 | | | | 79,226 | |
Penn Virginia Corp.(a)(b) | | | 657 | | | | 19,940 | |
PetroChina Co. Ltd., Class H | | | 1,268,000 | | | | 638,305 | |
Petronas Dagangan Bhd | | | 7,600 | | | | 42,919 | |
Petronet LNG Ltd. | | | 110,942 | | | | 416,612 | |
Phillips 66 | | | 2,407 | | | | 268,164 | |
Pioneer Natural Resources Co.(b) | | | 877 | | | | 132,752 | |
Polski Koncern Naftowy ORLEN SA | | | 16,730 | | | | 378,425 | |
Reliance Industries Ltd. | | | 9,978 | | | | 211,654 | |
Repsol SA | | | 3,312 | | | | 52,032 | |
S-Oil Corp. | | | 2,974 | | | | 244,260 | |
Santos Ltd. | | | 6,394 | | | | 36,784 | |
Scorpio Tankers, Inc. | | | 8,746 | | | | 344,068 | |
Shaanxi Coal Industry Co. Ltd. | | | 125,000 | | | | 161,612 | |
Star Petroleum Refining PCL | | | 128,600 | | | | 45,882 | |
Tatneft PAO — ADR | | | 3,068 | | | | 226,602 | |
Tatneft PJSC | | | 28,364 | | | | 347,472 | |
Teekay Corp.(b) | | | 3,448 | | | | 18,343 | |
TOTAL SA | | | 5,388 | | | | 298,983 | |
Tupras Turkiye Petrol Rafinerileri AS | | | 5,638 | | | | 120,130 | |
Ultrapar Participacoes SA | | | 74,555 | | | | 472,235 | |
Valero Energy Corp. | | | 4,333 | | | | 405,785 | |
Williams Cos., Inc. | | | 13,725 | | | | 325,557 | |
Woodside Petroleum Ltd. | | | 3,369 | | | | 81,458 | |
| | | | | | | | |
| | | | 20,126,408 | |
|
| Paper & Forest Products — 0.2% | |
Boise Cascade Co. | | | 23,133 | | | | 845,048 | |
Clearwater Paper Corp.(a) | | | 2,742 | | | | 58,569 | |
Domtar Corp. | | | 8,241 | | | | 315,136 | |
| | | | | | | | |
| | | | 1,218,753 | |
|
| Personal Products — 0.4% | |
Amorepacific Corp. | | | 2,068 | | | | 356,145 | |
Beiersdorf AG | | | 466 | | | | 55,747 | |
Coty, Inc., Class A | | | 1,936 | | | | 21,780 | |
elf Beauty, Inc.(a) | | | 1,891 | | | | 30,502 | |
Estee Lauder Cos., Inc., Class A(b) | | | 4,697 | | | | 970,118 | |
Kao Corp. | | | 800 | | | | 65,980 | |
L’Oreal SA | | | 500 | | | | 147,854 | |
Natural Health Trends Corp. | | | 3,327 | | | | 17,899 | |
Shiseido Co. Ltd. | | | 500 | | | | 35,505 | |
Unilever NV | | | 2,965 | | | | 170,163 | |
Unilever PLC | | | 2,768 | | | | 158,448 | |
USANA Health Sciences, Inc.(a) | | | 809 | | | | 63,547 | |
| | | | | | | | |
| | | | 2,093,688 | |
|
| Pharmaceuticals — 3.8% | |
Acer Therapeutics, Inc.(a)(b) | | | 8,356 | | | | 33,508 | |
Ajanta Pharma Ltd. | | | 2,386 | | | | 32,579 | |
Allergan PLC | | | 2,575 | | | | 492,263 | |
Amneal Pharmaceuticals, Inc.(a) | | | 36,680 | | | | 176,798 | |
Amphastar Pharmaceuticals, Inc.(a)(b) | | | 7,033 | | | | 135,667 | |
Astellas Pharma, Inc. | | | 4,500 | | | | 76,815 | |
AstraZeneca PLC | | | 2,547 | | | | 254,934 | |
Asymchem Laboratories Tianjin Co. Ltd., Class A | | | 1,800 | | | | 33,509 | |
| | | | | | | | |
| Security | | Shares | | | Value | |
|
| Pharmaceuticals (continued) | |
Aurobindo Pharma Ltd. | | | 5,568 | | | $ | 35,638 | |
Bristol-Myers Squibb Co. | | | 26,957 | | | | 1,730,370 | |
Cara Therapeutics, Inc.(a)(b) | | | 2,377 | | | | 38,293 | |
Changchun High & New Technology Industry Group, Inc., Class A | | | 2,800 | | | | 179,967 | |
China Medical System Holdings Ltd. | | | 56,000 | | | | 80,606 | |
China Resources Pharmaceutical Group Ltd.(c) | | | 44,000 | | | | 40,790 | |
Chugai Pharmaceutical Co. Ltd. | | | 900 | | | | 82,886 | |
Cipla Ltd. | | | 96,451 | | | | 646,278 | |
Corcept Therapeutics, Inc.(a) | | | 10,322 | | | | 124,896 | |
Daiichi Sankyo Co. Ltd. | | | 1,200 | | | | 79,253 | |
Dr. Reddy’s Laboratories Ltd. | | | 3,612 | | | | 145,582 | |
Eisai Co. Ltd. | | | 500 | | | | 37,413 | |
Elanco Animal Health, Inc.(a)(b) | | | 4,156 | | | | 122,394 | |
Eli Lilly & Co. | | | 5,370 | | | | 705,779 | |
Endo International PLC(a) | | | 9,589 | | | | 44,972 | |
GlaxoSmithKline PLC | | | 10,401 | | | | 244,393 | |
Glenmark Pharmaceuticals Ltd. | | | 70,165 | | | | 341,545 | |
Guangzhou Baiyunshan Pharmaceutical Holdings Co. Ltd., Class H | | | 8,000 | | | | 27,330 | |
H Lundbeck A/S | | | 155 | | | | 5,926 | |
Horizon Therapeutics PLC(a) | | | 7,732 | | | | 279,898 | |
Innoviva, Inc.(a) | | | 3,846 | | | | 54,459 | |
Intersect ENT, Inc.(a) | | | 7,608 | | | | 189,439 | |
Intra-Cellular Therapies, Inc.(a) | | | 3,891 | | | | 133,500 | |
Jazz Pharmaceuticals PLC(a) | | | 674 | | | | 100,615 | |
Jiangsu Hengrui Medicine Co. Ltd., Class A | | | 25,600 | | | | 322,263 | |
Johnson & Johnson | | | 24,051 | | | | 3,508,319 | |
Kyowa Kirin Co. Ltd. | | | 1,000 | | | | 23,560 | |
Merck & Co., Inc. | | | 27,351 | | | | 2,487,573 | |
Merck KGaA | | | 529 | | | | 62,366 | |
Mitsubishi Tanabe Pharma Corp. | | | 700 | | | | 12,842 | |
Mylan NV(a) | | | 13,753 | | | | 276,435 | |
NGM Biopharmaceuticals, Inc.(a) | | | 9,986 | | | | 184,641 | |
Novo Nordisk A/S, Class B | | | 4,185 | | | | 242,516 | |
Ono Pharmaceutical Co. Ltd. | | | 1,000 | | | | 22,830 | |
Orion OYJ, Class B | | | 179 | | | | 8,290 | |
Otsuka Holdings Co. Ltd. | | | 1,000 | | | | 44,574 | |
Pacira BioSciences, Inc.(a)(b) | | | 3,112 | | | | 140,974 | |
Perrigo Co. PLC | | | 1,737 | | | | 89,733 | |
Pfizer, Inc. | | | 44,217 | | | | 1,732,422 | |
Prestige Consumer Healthcare, Inc.(a)(b) | | | 16,989 | | | | 688,054 | |
Reata Pharmaceuticals, Inc., Class A(a)(b) | | | 1,790 | | | | 365,930 | |
Recordati SpA | | | 180 | | | | 7,588 | |
Richter Gedeon Nyrt | | | 10,933 | | | | 237,701 | |
Roche Holding AG | | | 1,600 | | | | 520,004 | |
Sanofi | | | 2,274 | | | | 228,372 | |
Santen Pharmaceutical Co. Ltd. | | | 600 | | | | 11,426 | |
Shionogi & Co. Ltd. | | | 800 | | | | 49,489 | |
Sino Biopharmaceutical Ltd. | | | 41,000 | | | | 57,360 | |
Sumitomo Dainippon Pharma Co. Ltd. | | | 300 | | | | 5,813 | |
Supernus Pharmaceuticals, Inc.(a) | | | 5,981 | | | | 141,869 | |
Taisho Pharmaceutical Holdings Co. Ltd. | | | 100 | | | | 7,380 | |
Takeda Pharmaceutical Co. Ltd. | | | 2,900 | | | | 114,701 | |
Teva Pharmaceutical Industries Ltd. — ADR(a) | | | 1,869 | | | | 18,316 | |
TherapeuticsMD, Inc.(a)(b) | | | 4,394 | | | | 10,633 | |
Tricida, Inc.(a) | | | 315 | | | | 11,888 | |
UCB SA | | | 216 | | | | 17,188 | |
Zoetis, Inc. | | | 8,259 | | | | 1,093,079 | |
| | | | | | | | |
| | | | 19,454,424 | |
|
| Professional Services — 0.7% | |
ASGN, Inc.(a)(b) | | | 8,796 | | | | 624,252 | |
Centre Testing International Group Co. Ltd. | | | 35,600 | | | | 76,363 | |
CoStar Group, Inc.(a) | | | 18 | | | | 10,770 | |
| | |
| 14 | | 2019 BLACKROCK ANNUAL REPORTTO SHAREHOLDERS |
| | |
Schedule of Investments (continued) December 31, 2019 | | Active Stock Master Portfolio (Percentages shown are based on Net Assets) |
| | | | | | | | |
| Security | | Shares | | | Value | |
|
| Professional Services (continued) | |
CRA International, Inc. | | | 3,909 | | | $ | 212,923 | |
Experian PLC | | | 1,704 | | | | 57,765 | |
Forrester Research, Inc. | | | 761 | | | | 31,734 | |
IHS Markit Ltd.(a) | | | 2,025 | | | | 152,584 | |
Insperity, Inc.(b) | | | 10,348 | | | | 890,342 | |
Kforce, Inc. | | | 14,386 | | | | 571,124 | |
Recruit Holdings Co. Ltd. | | | 1,900 | | | | 71,165 | |
RELX PLC | | | 1,929 | | | | 48,694 | |
Robert Half International, Inc.(b) | | | 6,562 | | | | 414,390 | |
SEEK Ltd. | | | 7,591 | | | | 120,148 | |
SGS SA, Registered Shares | | | 37 | | | | 101,331 | |
Teleperformance | | | 415 | | | | 101,392 | |
TriNet Group, Inc.(a) | | | 4,893 | | | | 276,993 | |
| | | | | | | | |
| | | | 3,761,970 | |
|
| Real Estate Management & Development — 0.4% | |
Aroundtown SA | | | 2,580 | | | | 23,173 | |
Azrieli Group Ltd. | | | 264 | | | | 19,339 | |
Beijing Capital Development Co. Ltd. | | | 58,200 | | | | 66,684 | |
CBRE Group, Inc., Class A(a)(b) | | | 230 | | | | 14,097 | |
China Aoyuan Group Ltd. | | | 39,000 | | | | 63,638 | |
CK Asset Holdings Ltd. | | | 5,500 | | | | 39,689 | |
Daito Trust Construction Co. Ltd. | | | 100 | | | | 12,358 | |
Daiwa House Industry Co. Ltd. | | | 1,300 | | | | 40,244 | |
Dar Al Arkan Real Estate Development Co.(a) | | | 13,465 | | | | 39,514 | |
Deutsche Wohnen SE, Bearer Shares | | | 782 | | | | 31,809 | |
Emaar Properties PJSC | | | 94,788 | | | | 103,851 | |
Greenland Holdings Corp. Ltd., Class A | | | 245,000 | | | | 244,662 | |
Hang Lung Properties Ltd. | | | 3,000 | | | | 6,587 | |
Hemisphere Properties India Ltd.(a) | | | 27,195 | | | | 58,662 | |
Henderson Land Development Co. Ltd. | | | 6,000 | | | | 29,442 | |
Hongkong Land Holdings Ltd. | | | 4,200 | | | | 24,159 | |
Hulic Co. Ltd. | | | 500 | | | | 6,020 | |
Jinke Properties Group Co. Ltd. | | | 95,100 | | | | 104,900 | |
Kerry Properties Ltd. | | | 1,000 | | | | 3,176 | |
Lendlease Group | | | 527 | | | | 6,516 | |
Mitsubishi Estate Co. Ltd. | | | 3,000 | | | | 57,405 | |
Mitsui Fudosan Co. Ltd. | | | 2,000 | | | | 48,880 | |
Multiplan Empreendimentos Imobiliarios SA | | | 7,900 | | | | 65,004 | |
New World Development Co. Ltd. | | | 10,000 | | | | 13,707 | |
RE/MAX Holdings, Inc., Class A(b) | | | 12,166 | | | | 468,269 | |
RMR Group, Inc., Class A | | | 4,071 | | | | 185,800 | |
Sino Land Co. Ltd. | | | 4,000 | | | | 5,806 | |
SM Prime Holdings, Inc. | | | 52,100 | | | | 43,243 | |
Sumitomo Realty & Development Co. Ltd. | | | 800 | | | | 27,912 | |
Sun Hung Kai Properties Ltd. | | | 4,000 | | | | 61,259 | |
Swire Pacific Ltd., Class A | | | 500 | | | | 4,645 | |
Swire Properties Ltd. | | | 5,400 | | | | 17,889 | |
Swiss Prime Site AG, Registered Shares(a) | | | 130 | | | | 15,040 | |
Vonovia SE | | | 1,375 | | | | 73,850 | |
Wharf Real Estate Investment Co. Ltd. | | | 2,000 | | | | 12,203 | |
Wheelock & Co. Ltd. | | | 1,000 | | | | 6,666 | |
| | | | | | | | |
| | | | 2,046,098 | |
|
| Road & Rail — 0.5% | |
AMERCO(b) | | | 101 | | | | 37,958 | |
Central Japan Railway Co. | | | 400 | | | | 80,428 | |
Covenant Transportation Group, Inc., Class A(a)(b) | | | 18,895 | | | | 244,218 | |
CSX Corp. | | | 5,269 | | | | 381,265 | |
East Japan Railway Co. | | | 1,000 | | | | 90,262 | |
Hankyu Hanshin Holdings, Inc. | | | 400 | | | | 17,110 | |
JB Hunt Transport Services, Inc. | | | 309 | | | | 36,085 | |
Landstar System, Inc.(b) | | | 2,890 | | | | 329,084 | |
Lyft, Inc., Class A(a) | | | 465 | | | | 20,004 | |
Marten Transport Ltd. | | | 5,858 | | | | 125,889 | |
| | | | | | | | |
| Security | | Shares | | | Value | |
|
| Road & Rail (continued) | |
Norfolk Southern Corp. | | | 739 | | | $ | 143,462 | |
Old Dominion Freight Line, Inc.(b) | | | 781 | | | | 148,218 | |
Saia, Inc.(a)(b) | | | 853 | | | | 79,431 | |
Tokyu Corp. | | | 900 | | | | 16,643 | |
Uber Technologies, Inc.(a)(b) | | | 1,526 | | | | 45,383 | |
Union Pacific Corp. | | | 2,477 | | | | 447,817 | |
Universal Logistics Holdings, Inc. | | | 11,266 | | | | 213,603 | |
US Xpress Enterprises, Inc., Class A(a) | | | 7,689 | | | | 38,676 | |
West Japan Railway Co. | | | 200 | | | | 17,299 | |
| | | | | | | | |
| | | | 2,512,835 | |
|
| Semiconductors & Semiconductor Equipment — 3.6% | |
Advantest Corp. | | | 400 | | | | 22,559 | |
Ambarella, Inc.(a) | | | 14,764 | | | | 894,108 | |
Amkor Technology, Inc.(a) | | | 64,740 | | | | 841,620 | |
Analog Devices, Inc. | | | 171 | | | | 20,322 | |
Applied Materials, Inc. | | | 8,845 | | | | 539,899 | |
ASM Pacific Technology Ltd. | | | 1,500 | | | | 20,821 | |
ASML Holding NV | | | 423 | | | | 125,232 | |
Broadcom, Inc. | | | 620 | | | | 195,932 | |
Brooks Automation, Inc. | | | 380 | | | | 15,945 | |
Cirrus Logic, Inc.(a) | | | 22,367 | | | | 1,843,264 | |
Cypress Semiconductor Corp. | | | 1,467 | | | | 34,225 | |
Elan Microelectronics Corp. | | | 48,000 | | | | 146,232 | |
FormFactor, Inc.(a) | | | 6,722 | | | | 174,570 | |
Inphi Corp.(a) | | | 2,582 | | | | 191,120 | |
Intel Corp. | | | 26,949 | | | | 1,612,898 | |
Lam Research Corp. | | | 2,146 | | | | 627,490 | |
MediaTek, Inc. | | | 100,000 | | | | 1,481,708 | |
Micron Technology, Inc.(a) | | | 3,913 | | | | 210,441 | |
Novatek Microelectronics Corp. | | | 7,000 | | | | 51,289 | |
NVIDIA Corp. | | | 3,470 | | | | 816,491 | |
Parade Technologies Ltd. | | | 2,000 | | | | 41,112 | |
Pixart Imaging, Inc. | | | 12,000 | | | | 59,262 | |
Power Integrations, Inc. | | | 535 | | | | 52,917 | |
QUALCOMM, Inc.(b) | | | 4,480 | | | | 395,270 | |
Radiant Opto-Electronics Corp. | | | 56,000 | | | | 224,217 | |
Realtek Semiconductor Corp. | | | 128,000 | | | | 1,005,853 | |
Skyworks Solutions, Inc. | | | 1,273 | | | | 153,880 | |
SunPower Corp.(a) | | | 1,795 | | | | 14,001 | |
Taiwan Semiconductor Manufacturing Co. Ltd. | | | 511,000 | | | | 5,655,658 | |
Texas Instruments, Inc. | | | 3,589 | | | | 460,433 | |
Tokyo Electron Ltd. | | | 100 | | | | 21,833 | |
United Microelectronics Corp. | | | 512,000 | | | | 280,550 | |
| | | | | | | | |
| | | | 18,231,152 | |
|
| Software — 4.1% | |
Adobe, Inc.(a) | | | 3,588 | | | | 1,183,358 | |
Alarm.com Holdings, Inc.(a)(b) | | | 4,610 | | | | 198,092 | |
Autodesk, Inc.(a) | | | 270 | | | | 49,534 | |
Benefitfocus, Inc.(a) | | | 43,830 | | | | 961,630 | |
Bill.Com Holdings, Inc.(a) | | | 712 | | | | 27,092 | |
Birlasoft Ltd.(a) | | | 35,982 | | | | 35,640 | |
Bottomline Technologies DE, Inc.(a)(b) | | | 11,963 | | | | 641,217 | |
Box, Inc., Class A(a)(b) | | | 7,818 | | | | 131,186 | |
Cadence Design Systems, Inc.(a)(b) | | | 919 | | | | 63,742 | |
Cloudera, Inc.(a)(b) | | | 13,728 | | | | 159,657 | |
Cloudflare, Inc., Class A(a) | | | 3,841 | | | | 65,527 | |
CommVault Systems, Inc.(a) | | | 9,291 | | | | 414,750 | |
Cornerstone OnDemand, Inc.(a) | | | 2,633 | | | | 154,162 | |
Dassault Systemes SE | | | 301 | | | | 49,643 | |
Dropbox, Inc., Class A(a) | | | 3,046 | | | | 54,554 | |
Five9, Inc.(a) | | | 1,379 | | | | 90,435 | |
Fortinet, Inc.(a) | | | 101 | | | | 10,783 | |
Intuit, Inc. | | | 4,161 | | | | 1,089,891 | |
| | | | |
| SCHEDULE OF INVESTMENTS | | | 15 | |
| | |
Schedule of Investments (continued) December 31, 2019 | | Active Stock Master Portfolio (Percentages shown are based on Net Assets) |
| | | | | | | | |
| Security | | Shares | | | Value | |
|
| Software (continued) | |
Manhattan Associates, Inc.(a) | | | 1,745 | | | $ | 139,164 | |
Microsoft Corp. | | | 50,904 | | | | 8,027,561 | |
Model N, Inc.(a) | | | 3,978 | | | | 139,508 | |
Oracle Corp. | | | 5,990 | | | | 317,350 | |
Oracle Corp. Japan | | | 100 | | | | 9,076 | |
Paycom Software, Inc.(a) | | | 57 | | | | 15,091 | |
Paylocity Holding Corp.(a)(b) | | | 11,320 | | | | 1,367,682 | |
PROS Holdings, Inc.(a)(b) | | | 974 | | | | 58,362 | |
Q2 Holdings, Inc.(a)(b) | | | 1,103 | | | | 89,431 | |
Rapid7, Inc.(a) | | | 2,197 | | | | 123,076 | |
RingCentral, Inc., Class A(a)(b) | | | 4,587 | | | | 773,689 | |
Sage Group PLC | | | 605 | | | | 6,002 | |
salesforce.com, Inc.(a) | | | 7,830 | | | | 1,273,471 | |
SAP SE | | | 1,868 | | | | 251,429 | |
ServiceNow, Inc.(a)(b) | | | 2,838 | | | | 801,224 | |
Splunk, Inc.(a) | | | 236 | | | | 35,346 | |
SPS Commerce, Inc.(a) | | | 12,404 | | | | 687,430 | |
SVMK, Inc.(a) | | | 6,523 | | | | 116,566 | |
Totvs SA | | | 26,373 | | | | 423,193 | |
Tyler Technologies, Inc.(a) | | | 55 | | | | 16,501 | |
VMware, Inc., Class A(a) | | | 36 | | | | 5,464 | |
Workday, Inc., Class A(a)(b) | | | 2,368 | | | | 389,418 | |
Yext, Inc.(a)(b) | | | 19,125 | | | | 275,783 | |
| | | | | | | | |
| | | | 20,722,710 | |
|
| Specialty Retail — 1.7% | |
Advance Auto Parts, Inc. | | | 1,448 | | | | 231,912 | |
America’sCar-Mart, Inc.(a) | | | 1,097 | | | | 120,297 | |
American Eagle Outfitters, Inc.(b) | | | 839 | | | | 12,333 | |
Asbury Automotive Group, Inc.(a) | | | 9,008 | | | | 1,007,004 | |
AutoNation, Inc.(a)(b) | | | 943 | | | | 45,858 | |
AutoZone, Inc.(a) | | | 356 | | | | 424,106 | |
Best Buy Co., Inc. | | | 3,921 | | | | 344,264 | |
CarMax, Inc.(a) | | | 2,855 | | | | 250,298 | |
Children’s Place, Inc. | | | 507 | | | | 31,698 | |
Designer Brands, Inc., Class A | | | 2,029 | | | | 31,937 | |
Fast Retailing Co. Ltd. | | | 100 | | | | 59,407 | |
Five Below, Inc.(a) | | | 27 | | | | 3,452 | |
Home Depot, Inc. | | | 13,485 | | | | 2,944,854 | |
Home Product Center PCL — NVDR | | | 552,800 | | | | 294,820 | |
Industria de Diseno Textil SA | | | 1,771 | | | | 62,588 | |
JUMBO SA | | | 2,026 | | | | 42,156 | |
Lithia Motors, Inc., Class A | | | 1,971 | | | | 289,737 | |
Lowe’s Cos., Inc. | | | 7,605 | | | | 910,775 | |
MarineMax, Inc.(a) | | | 7,616 | | | | 127,111 | |
O’Reilly Automotive, Inc.(a) | | | 1,269 | | | | 556,152 | |
Ross Stores, Inc.(b) | | | 660 | | | | 76,837 | |
Shoe Carnival, Inc.(b) | | | 1,767 | | | | 65,874 | |
Signet Jewelers Ltd.(b) | | | 4,267 | | | | 92,765 | |
Sonic Automotive, Inc., Class A(b) | | | 9,322 | | | | 288,982 | |
Tilly’s, Inc., Class A | | | 5,473 | | | | 67,044 | |
Tractor Supply Co. | | | 232 | | | | 21,678 | |
Zumiez, Inc.(a) | | | 5,350 | | | | 184,789 | |
| | | | | | | | |
| | | | 8,588,728 | |
|
| Technology Hardware, Storage & Peripherals — 2.7% | |
Acer, Inc. | | | 354,000 | | | | 210,992 | |
Apple, Inc. | | | 29,656 | | | | 8,708,484 | |
Asustek Computer, Inc. | | | 44,000 | | | | 339,586 | |
Chicony Electronics Co. Ltd. | | | 32,000 | | | | 95,094 | |
HP, Inc. | | | 6,956 | | | | 142,946 | |
Lenovo Group Ltd. | | | 782,000 | | | | 525,155 | |
Pegatron Corp. | | | 66,000 | | | | 150,936 | |
Quanta Computer, Inc. | | | 230,000 | | | | 494,066 | |
Samsung Electronics Co. Ltd. | | | 62,764 | | | | 3,024,399 | |
| | | | | | | | |
| Security | | Shares | | | Value | |
|
| Technology Hardware, Storage & Peripherals (continued) | |
Simplo Technology Co. Ltd. | | | 9,000 | | | $ | 91,120 | |
| | | | | | | | |
| | | | 13,782,778 | |
|
| Textiles, Apparel & Luxury Goods — 0.9% | |
adidas AG | | | 142 | | | | 46,160 | |
ANTA Sports Products Ltd. | | | 21,000 | | | | 188,017 | |
Arvind Ltd. | | | 13,505 | | | | 7,561 | |
Bosideng International Holdings Ltd. | | | 70,000 | | | | 25,252 | |
Cie Financiere Richemont SA, Registered Shares | | | 88 | | | | 6,877 | |
Crocs, Inc.(a) | | | 10,770 | | | | 451,155 | |
EssilorLuxottica SA | | | 201 | | | | 30,729 | |
Feng TAY Enterprise Co. Ltd. | | | 12,100 | | | | 78,753 | |
G-III Apparel Group Ltd.(a)(b) | | | 5,193 | | | | 173,966 | |
Hermes International | | | 189 | | | | 141,581 | |
Kering SA | | | 131 | | | | 86,318 | |
Li Ning Co. Ltd. | | | 260,000 | | | | 779,814 | |
Lululemon Athletica, Inc.(a) | | | 849 | | | | 196,688 | |
LVMH Moet Hennessy Louis Vuitton SE | | | 405 | | | | 188,711 | |
NIKE, Inc., Class B(b) | | | 11,248 | | | | 1,139,535 | |
Oxford Industries, Inc.(b) | | | 9,171 | | | | 691,677 | |
Ralph Lauren Corp.(b) | | | 1,072 | | | | 125,660 | |
Steven Madden Ltd.(b) | | | 5,532 | | | | 237,931 | |
Swatch Group AG, Bearer Shares | | | 8 | | | | 2,234 | |
Wolverine World Wide, Inc.(b) | | | 5,382 | | | | 181,589 | |
| | | | | | | | |
| | | | 4,780,208 | |
|
| Thrifts & Mortgage Finance — 0.8% | |
Entegra Financial Corp.(a) | | | 119 | | | | 3,589 | |
Essent Group Ltd. | | | 15,250 | | | | 792,848 | |
Federal Agricultural Mortgage Corp., Class C | | | 2,997 | | | | 250,250 | |
Housing Development Finance Corp. Ltd. | | | 30,701 | | | | 1,038,076 | |
Merchants Bancorp(b) | | | 7,933 | | | | 156,359 | |
OceanFirst Financial Corp. | | | 13,812 | | | | 352,759 | |
Radian Group, Inc. | | | 12,890 | | | | 324,312 | |
Riverview Bancorp, Inc. | | | 46,822 | | | | 384,409 | |
Timberland Bancorp, Inc. | | | 1,091 | | | | 32,446 | |
United Community Financial Corp. | | | 10,134 | | | | 118,162 | |
Washington Federal, Inc. | | | 12,142 | | | | 445,004 | |
| | | | | | | | |
| | | | 3,898,214 | |
|
| Tobacco — 0.3% | |
Altria Group, Inc. | | | 7,504 | | | | 374,525 | |
Gudang Garam Tbk PT | | | 63,900 | | | | 243,756 | |
ITC Ltd. | | | 137,531 | | | | 458,092 | |
Philip Morris International, Inc. | | | 2,632 | | | | 223,957 | |
Vector Group Ltd. | | | 5,013 | | | | 67,124 | |
| | | | | | | | |
| | | | 1,367,454 | |
|
| Trading Companies & Distributors — 0.8% | |
Applied Industrial Technologies, Inc.(b) | | | 9,839 | | | | 656,163 | |
Ashtead Group PLC | | | 1,327 | | | | 42,430 | |
Barloworld Ltd. | | | 33,450 | | | | 269,229 | |
Beacon Roofing Supply, Inc.(a) | | | 1,126 | | | | 36,010 | |
BMC Stock Holdings, Inc.(a) | | | 18,771 | | | | 538,540 | |
Brenntag AG | | | 230 | | | | 12,479 | |
Fastenal Co. | | | 324 | | | | 11,972 | |
Ferguson PLC | | | 793 | | | | 72,168 | |
Foundation Building Materials, Inc.(a)(b) | | | 12,543 | | | | 242,707 | |
GATX Corp.(b) | | | 5,857 | | | | 485,252 | |
GMS, Inc.(a)(b) | | | 6,363 | | | | 172,310 | |
H&E Equipment Services, Inc. | | | 12,040 | | | | 402,497 | |
Herc Holdings, Inc.(a)(b) | | | 6,370 | | | | 311,748 | |
ITOCHU Corp. | | | 3,700 | | | | 85,754 | |
Marubeni Corp. | | | 6,800 | | | | 50,241 | |
Mitsubishi Corp. | | | 4,500 | | | | 119,211 | |
Mitsui & Co. Ltd. | | | 500 | | | | 8,888 | |
| | |
| 16 | | 2019 BLACKROCK ANNUAL REPORTTO SHAREHOLDERS |
| | |
Schedule of Investments (continued) December 31, 2019 | | Active Stock Master Portfolio (Percentages shown are based on Net Assets) |
| | | | | | | | |
| Security | | Shares | | | Value | |
|
| Trading Companies & Distributors (continued) | |
Posco International Corp. | | | 4,483 | | | $ | 72,118 | |
Rush Enterprises, Inc., Class A | | | 4,602 | | | | 213,993 | |
SiteOne Landscape Supply, Inc.(a) | | | 224 | | | | 20,306 | |
Sumitomo Corp. | | | 4,800 | | | | 71,296 | |
Titan Machinery, Inc.(a) | | | 3,677 | | | | 54,346 | |
Toyota Tsusho Corp. | | | 600 | | | | 21,077 | |
W.W. Grainger, Inc. | | | 25 | | | | 8,463 | |
Watsco, Inc. | | | 82 | | | | 14,772 | |
| | | | | | | | |
| | | | 3,993,970 | |
|
| Transportation Infrastructure — 0.3% | |
Aena SME SA(c) | | | 478 | | | | 91,641 | |
Aeroports de Paris | | | 536 | | | | 106,125 | |
Atlantia SpA | | | 1,842 | | | | 42,990 | |
Auckland International Airport Ltd. | | | 3,058 | | | | 18,025 | |
DP World PLC | | | 3,095 | | | | 40,573 | |
Fraport AG Frankfurt Airport Services Worldwide | | | 272 | | | | 23,089 | |
Grupo Aeroportuario del Centro Norte SAB de CV | | | 51,705 | | | | 387,853 | |
Grupo Aeroportuario del Centro Norte SAB de CV, ADR | | | 1,414 | | | | 84,755 | |
Grupo Aeroportuario del Pacifico SAB de CV, ADR | | | 2,631 | | | | 312,063 | |
Grupo Aeroportuario del Pacifico SAB de CV, Class B | | | 36,800 | | | | 437,279 | |
Transurban Group | | | 3,242 | | | | 33,934 | |
| | | | | | | | |
| | | | 1,578,327 | |
|
| Water Utilities — 0.1% | |
American States Water Co. | | | 223 | | | | 19,320 | |
American Water Works Co., Inc. | | | 5,335 | | | | 655,405 | |
Global Water Resources, Inc. | | | 1,899 | | | | 24,972 | |
| | | | | | | | |
| | | | 699,697 | |
|
| Wireless Telecommunication Services — 0.7% | |
Advanced Info Service PCL — NVDR | | | 17,400 | | | | 123,555 | |
America Movil SAB de CV, Series L | | | 606,569 | | | | 484,421 | |
Boingo Wireless, Inc.(a) | | | 1,809 | | | | 19,809 | |
China Mobile Ltd. | | | 110,000 | | | | 929,484 | |
Etihad Etisalat Co.(a) | | | 10,447 | | | | 69,610 | |
Gogo, Inc.(a) | | | 3,675 | | | | 23,520 | |
KDDI Corp. | | | 1,800 | | | | 53,705 | |
Maxis Bhd | | | 95,100 | | | | 123,810 | |
Mobile TeleSystems PJSC — ADR | | | 9,288 | | | | 94,273 | |
NTT DOCOMO, Inc. | | | 500 | | | | 13,928 | |
Sistema JSFC | | | 257,977 | | | | 63,453 | |
SoftBank Group Corp. | | | 1,900 | | | | 82,492 | |
Sprint Corp.(a) | | | 41,214 | | | | 214,725 | |
T-Mobile U.S., Inc.(a) | | | 5,567 | | | | 436,564 | |
Telephone & Data Systems, Inc. | | | 10,467 | | | | 266,176 | |
Turkcell Iletisim Hizmetleri AS | | | 22,361 | | | | 51,862 | |
United States Cellular Corp.(a) | | | 6,074 | | | | 220,061 | |
Vodafone Group PLC | | | 34,012 | | | | 66,030 | |
| | | | | | | | |
| | | | 3,337,478 | |
| | | | | |
| |
Total Common Stocks — 87.4%
(Cost — $376,267,463) | | | | 443,306,131 | |
| | | | | |
|
Preferred Stocks — 0.8% | |
|
Banks — 0.8% | |
Banco Bradesco SA, Preference Shares, 0.00%(a) | | | 279,137 | | | | 2,509,853 | |
Itau Unibanco Holding SA, Preference Shares, 0.00% | | | 168,741 | | | | 1,556,241 | |
| | | | | | | | |
| | | | 4,066,094 | |
|
| Health Care Equipment & Supplies — 0.0% | |
Sartorius AG, Preference Shares, 0.00% | | | 26 | | | | 5,558 | |
| | | | | | | | |
|
| Household Products — 0.0% | |
Henkel AG & Co. KGaA, Preference Shares, 0.00% | | | 87 | | | | 8,987 | |
| | | | | | | | |
| | | | | | | | |
| Security | | Shares | | | Value | |
|
| Metals & Mining — 0.0% | |
Gerdau SA, Preference Shares, 0.00% | | | 24,360 | | | $ | 121,113 | |
| | | | | | | | |
|
| Oil, Gas & Consumable Fuels — 0.0% | |
Petroleo Brasileiro SA, Preference Shares, 0.00% | | | 10,100 | | | | 75,774 | |
| | | | | | | | |
| |
Total Preferred Stocks — 0.8%
(Cost — $3,783,504) | | | | 4,277,526 | |
| | | | | |
|
Rights — 0.0% | |
|
Metals & Mining — 0.0% | |
Pan American Silver Corp., (Expires 02/22/29)(a)(d) | | | 16,660 | | | | 3,499 | |
| | | | | | | | |
|
| Oil, Gas & Consumable Fuels — 0.0% | |
Repsol SA, (Expires 01/21/20)(a) | | | 3,312 | | | | 1,571 | |
| | | | | | | | |
|
| Pharmaceuticals — 0.0% | |
Bristol-Myers Squibb Co., (Expires 03/31/21)(a) | | | 4,640 | | | | 13,966 | |
| | | | | | | | |
| |
Total Rights — 0.0%
(Cost — $14,989) | | | | 19,036 | |
| | | | | |
| |
Total Long-Term Investments — 88.2%
(Cost — $380,065,956) | | | | 447,602,693 | |
| | | | | |
|
Short-Term Securities — 15.4% | |
BlackRock Cash Funds: Institutional,
SL Agency Shares,
1.84%(e)(f)(g) | | | 34,053,507 | | | | 34,067,128 | |
BlackRock Cash Funds: Treasury,
SL Agency Shares,
1.52%(f)(g) | | | 43,836,183 | | | | 43,836,183 | |
| | | | | | | | |
| |
Total Short-Term Securities — 15.4%
(Cost — $77,898,420) | | | | 77,903,311 | |
| | | | | |
| |
Total Investments — 103.6%
(Cost — $457,964,376) | | | | 525,506,004 | |
| |
Liabilities in Excess of Other Assets — (3.6)% | | | | (18,368,036 | ) |
| | | | | | | | |
| |
Net Assets — 100.0% | | | $ | 507,137,968 | |
| | | | | | | | |
| (a) | Non-income producing security. |
| (b) | Security, or a portion of the security, is on loan. |
| (c) | Security exempt from registration pursuant to Rule 144A under the Securities Act of 1933, as amended. These securities may be resold in transactions exempt from registration to qualified institutional investors. |
| (d) | Security is valued using significant unobservable inputs and is classified as Level 3 in the fair value hierarchy. |
| (e) | All or a portion of the security was purchased with the cash collateral from loaned securities. |
| (f) | Annualized7-day yield as of period end. |
| | | | |
| SCHEDULE OF INVESTMENTS | | | 17 | |
| | |
Schedule of Investments (continued) December 31, 2019 | | Active Stock Master Portfolio |
| (g) | During the year ended December 31, 2019, investments in issuers considered to be an affiliate/affiliates of the Master Portfolio for purposes of Section 2(a)(3) of the Investment Company Act of 1940, as amended, were as follows: |
| | | | | | | | | | | | | | | | | | | | | | | | | | | | |
| Affiliate | | Shares
Held at
12/31/18 | | | Net
Activity | | | Shares
Held at
12/31/19 | | | Value at
12/31/19 | | | Income | | | Net
Realized
Gain (Loss) (a) | | | Change in
Unrealized
Appreciation
(Depreciation) | |
BlackRock Cash Funds:
Institutional, SL Agency Shares | | | 29,237,013 | | | | 4,816,494 | | | | 34,053,507 | | | $ | 34,067,128 | | | $ | 135,153 | (b) | | $ | 4,137 | | | $ | 3,959 | |
BlackRock Cash Funds:
Treasury, SL Agency Shares | | | 24,397,577 | | | | 19,438,606 | | | | 43,836,183 | | | | 43,836,183 | | | | 798,965 | | | | — | | | | — | |
| | | | | | | | | | | | | | | | | | | | | | | | | | | | |
| | | $ | 77,903,311 | | | $ | 934,118 | | | $ | 4,137 | | | $ | 3,959 | |
| | | | | | | | | | | | | | | | | |
| | (a) | Includes net capital gain distributions, if applicable. | |
| | (b) | Represents securities lending income earned from the reinvestment of cash collateral from loaned securities, net of fees and collateral investment expenses, and other payments to and from borrowers of securities. | |
For Master Portfolio compliance purposes, the Master Portfolio’s industry classifications refer to one or more of the industry sub-classifications used by one or more widely recognized market indexes or rating group indexes, and/or as defined by the investment adviser. These definitions may not apply for purposes of this report, which may combine such industry sub-classifications for reporting ease.
Derivative Financial Instruments Outstanding as of Year End
Futures Contracts
| | | | | | | | | | | | | | | | |
| Description | | Number of
Contracts | | | Expiration
Date | | | Notional
Amount (000) | | | Value/
Unrealized
Appreciation
(Depreciation) | |
Long Contracts | | | | | | | | | | | | | | | | |
MSCI Emerging Markets Index | | | 47 | | | | 03/20/20 | | | $ | 2,632 | | | $ | 63,536 | |
Russell 2000E-Mini Index | | | 12 | | | | 03/20/20 | | | | 1,002 | | | | 10,573 | |
S&P 500E-Mini Index | | | 1,802 | | | | 03/20/20 | | | | 291,122 | | | | 8,284,791 | |
| | | | | | | | | | | | | | | | |
| | | | | | | | | | | | | | | 8,358,900 | |
| | | | | | | | | | | | | | | | |
Short Contracts | | | | | | | | | | | | | | | | |
MSCI EAFE Index | | | 253 | | | | 03/20/20 | | | | 25,762 | | | | (682,282 | ) |
MSCI Emerging MarketsE-Mini Index | | | 2,020 | | | | 03/20/20 | | | | 113,140 | | | | (6,681,668 | ) |
Russell 2000E-Mini Index | | | 1,160 | | | | 03/20/20 | | | | 96,895 | | | | (1,992,568 | ) |
| | | | | | | | | | | | | | | | |
| | | | | | | | | | | | | | | (9,356,518 | ) |
| | | | | | | | | | | | | | | | |
| | | | | | | | | | | | | | $ | (997,618 | ) |
| | | | | | | | | | | | | | | | |
Derivative Financial Instruments Categorized by Risk Exposure
As of period end, the fair values of derivative financial instruments located in the Statement of Assets and Liabilities were as follows:
| | | | | | | | | | | | | | | | | | | | | | | | | | | | |
| | | Commodity
Contracts | | | Credit
Contracts | | | Equity
Contracts | | | Foreign
Currency
Exchange
Contracts | | | Interest
Rate
Contracts | | | Other
Contracts | | | Total | |
Assets — Derivative Financial Instruments | | | | | |
Futures contracts | | | | | | | | | | | | | | | | | | | | | | | | | | | | |
Unrealized appreciation on futures contracts(a) | | $ | — | | | $ | — | | | $ | 8,358,900 | | | $ | — | | | $ | — | | | $ | — | | | $ | 8,358,900 | |
| | | | | | | | | | | | | | | | | | | | | | | | | | | | |
Liabilities — Derivative Financial Instruments | | | | | |
Futures contracts | | | | | | | | | | | | | | | | | | | | | | | | | | | | |
Unrealized depreciation on futures contracts(a) | | $ | — | | | $ | — | | | $ | 9,356,518 | | | $ | — | | | $ | — | | | $ | — | | | $ | 9,356,518 | |
| | | | | | | | | | | | | | | | | | | | | | | | | | | | |
| | (a) | Net cumulative unrealized appreciation (depreciation) on futures contracts, if any, are reported in the Schedule of Investments. In Statement of Assets and Liabilities, only current day’s variation margin is reported in receivables or payables and the net cumulative unrealized appreciation (depreciation) is included in net unrealized appreciation (depreciation). | |
| | |
| 18 | | 2019 BLACKROCK ANNUAL REPORTTO SHAREHOLDERS |
| | |
Schedule of Investments (continued) December 31, 2019 | | Active Stock Master Portfolio |
Derivative Financial Instruments Categorized by Risk Exposure (continued)
For the year ended December 31, 2019, the effect of derivative financial instruments in the Statement of Operations was as follows:
| | | | | | | | | | | | | | | | | | | | | | | | | | | | |
| | | Commodity
Contracts | | | Credit
Contracts | | | Equity
Contracts | | | Foreign
Currency
Exchange
Contracts | | | Interest
Rate
Contracts | | | Other
Contracts | | | Total | |
Net Realized Gain (Loss) from: | | | | | | | | | | | | | | | | | | | | | | | | | | | | |
Futures contracts | | $ | — | | | $ | — | | | $ | 25,804,744 | | | $ | — | | | $ | — | | | $ | — | | | $ | 25,804,744 | |
| | | | | | | | | | | | | | | | | | | | | | | | | | | | |
| | | | | | | |
| Net Change in Unrealized Appreciation (Depreciation) on: | | | | | | | | | | | | | | | | | | | | | |
Futures contracts | | $ | — | | | $ | — | | | $ | 3,214,066 | | | $ | — | | | $ | — | | | $ | — | | | $ | 3,214,066 | |
| | | | | | | | | | | | | | | | | | | | | | | | | | | | |
Average Quarterly Balances of Outstanding Derivative Financial Instruments
| | | | |
Futures contracts: | |
Average notional value of contracts — long | | $ | 260,227,199 | |
Average notional value of contracts — short | | $ | 204,932,945 | |
For more information about the Master Portfolio’s investment risks regarding derivative financial instruments, refer to the Notes to Financial Statements.
Fair Value Hierarchy as of Period End
Various inputs are used in determining the fair value of investments and derivative financial instruments. For information about the Master Portfolio’s policy regarding valuation of investments and derivative financial instruments, refer to the Notes to Financial Statements.
The following tables summarize the Master Portfolio’s investments and derivative financial instruments categorized in the disclosure hierarchy:
| | | | | | | | | | | | | | | | |
| | | Level 1 | | | Level 2 | | | Level 3 | | | Total | |
Assets: | |
Investments: | |
Common Stocks: | |
Aerospace & Defense | | $ | 4,202,146 | | | $ | 45,725 | | | $ | — | | | $ | 4,247,871 | |
Air Freight & Logistics | | | 2,708,558 | | | | 118,649 | | | | — | | | | 2,827,207 | |
Airlines | | | 4,224,825 | | | | — | | | | — | | | | 4,224,825 | |
Auto Components | | | 2,075,501 | | | | 416,528 | | | | — | | | | 2,492,029 | |
Automobiles | | | 1,793,669 | | | | 1,817,591 | | | | — | | | | 3,611,260 | |
Banks | | | 21,364,400 | | | | 12,310,916 | | | | — | | | | 33,675,316 | |
Beverages | | | 6,248,686 | | | | 1,788,634 | | | | — | | | | 8,037,320 | |
Biotechnology | | | 15,720,882 | | | | 731,382 | | | | 3,470 | | | | 16,455,734 | |
Building Products | | | 1,989,487 | | | | 244,459 | | | | — | | | | 2,233,946 | |
Capital Markets | | | 9,007,563 | | | | 1,571,712 | | | | — | | | | 10,579,275 | |
Chemicals | | | 7,258,965 | | | | 1,520,748 | | | | — | | | | 8,779,713 | |
Commercial Services & Supplies | | | 3,648,330 | | | | 225,369 | | | | — | | | | 3,873,699 | |
Communications Equipment | | | 2,009,236 | | | | 116,783 | | | | — | | | | 2,126,019 | |
Construction & Engineering | | | 2,333,400 | | | | 2,085,985 | | | | — | | | | 4,419,385 | |
Construction Materials | | | 778,121 | | | | 1,231,029 | | | | — | | | | 2,009,150 | |
Consumer Finance | | | 3,161,733 | | | | 280,280 | | | | — | | | | 3,442,013 | |
Containers & Packaging | | | 195,260 | | | | — | | | | — | | | | 195,260 | |
Distributors | | | 266,673 | | | | 30,428 | | | | — | | | | 297,101 | |
Diversified Consumer Services | | | 1,890,573 | | | | — | | | | — | | | | 1,890,573 | |
Diversified Financial Services | | | 2,156,860 | | | | 1,505,051 | | | | — | | | | 3,661,911 | |
Diversified Telecommunication Services | | | 3,908,138 | | | | 1,390,012 | | | | — | | | | 5,298,150 | |
Electric Utilities | | | 4,495,416 | | | | 890,920 | | | | — | | | | 5,386,336 | |
Electrical Equipment | | | 1,690,718 | | | | 757,610 | | | | — | | | | 2,448,328 | |
Electronic Equipment, Instruments & Components | | | 3,984,056 | | | | 3,342,201 | | | | — | | | | 7,326,257 | |
Energy Equipment & Services | | | 1,859,777 | | | | 23,589 | | | | — | | | | 1,883,366 | |
Entertainment | | | 3,224,472 | | | | 316,906 | | | | — | | | | 3,541,378 | |
Equity Real Estate Investment Trusts (REITs) | | | 15,018,335 | | | | 323,028 | | | | — | | | | 15,341,363 | |
Food & Staples Retailing | | | 4,633,572 | | | | 958,212 | | | | — | | | | 5,591,784 | |
Food Products | | | 5,121,289 | | | | 2,781,392 | | | | — | | | | 7,902,681 | |
Gas Utilities | | | 1,378,845 | | | | 2,142,630 | | | | — | | | | 3,521,475 | |
Health Care Equipment & Supplies | | | 7,697,156 | | | | 651,806 | | | | — | | | | 8,348,962 | |
Health Care Providers & Services | | | 8,830,176 | | | | 806,947 | | | | — | | | | 9,637,123 | |
Health Care Technology | | | 2,847,943 | | | | 24,124 | | | | — | | | | 2,872,067 | |
Hotels, Restaurants & Leisure | | | 6,899,180 | | | | 732,989 | | | | — | | | | 7,632,169 | |
| | | | |
| SCHEDULE OF INVESTMENTS | | | 19 | |
| | |
Schedule of Investments (continued) December 31, 2019 | | Active Stock Master Portfolio |
Fair Value Hierarchy as of Period End (continued)
| | | | | | | | | | | | | | | | |
| | | Level 1 | | | Level 2 | | | Level 3 | | | Total | |
Household Durables | | $ | 2,994,456 | | | $ | 1,030,245 | | | $ | — | | | $ | 4,024,701 | |
Household Products | | | 3,511,985 | | | | 644,072 | | | | — | | | | 4,156,057 | |
Independent Power and Renewable Electricity Producers | | | 180,433 | | | | 53,087 | | | | — | | | | 233,520 | |
Industrial Conglomerates | | | 1,215,686 | | | | 757,764 | | | | — | | | | 1,973,450 | |
Insurance | | | 7,413,635 | | | | 5,652,682 | | | | — | | | | 13,066,317 | |
Interactive Media & Services | | | 12,083,428 | | | | 5,321,271 | | | | — | | | | 17,404,699 | |
Internet & Direct Marketing Retail | | | 16,088,847 | | | | 811,645 | | | | — | | | | 16,900,492 | |
IT Services | | | 15,247,838 | | | | 1,518,244 | | | | — | | | | 16,766,082 | |
Leisure Products | | | 305,200 | | | | — | | | | — | | | | 305,200 | |
Life Sciences Tools & Services | | | 2,100,241 | | | | 50,625 | | | | — | | | | 2,150,866 | |
Machinery | | | 7,557,793 | | | | 3,168,438 | | | | — | | | | 10,726,231 | |
Marine | | | 31,176 | | | | 310,877 | | | | — | | | | 342,053 | |
Media | | | 3,344,819 | | | | 247,846 | | | | — | | | | 3,592,665 | |
Metals & Mining | | | 4,227,055 | | | | 5,538,719 | | | | — | | | | 9,765,774 | |
Mortgage Real Estate Investment Trusts (REITs) | | | 975,102 | | | | — | | | | — | | | | 975,102 | |
Multi-Utilities | | | 2,004,727 | | | | 105,087 | | | | — | | | | 2,109,814 | |
Multiline Retail | | | 807,170 | | | | — | | | | — | | | | 807,170 | |
Oil, Gas & Consumable Fuels | | | 12,251,769 | | | | 7,874,639 | | | | — | | | | 20,126,408 | |
Paper & Forest Products | | | 1,218,753 | | | | — | | | | — | | | | 1,218,753 | |
Personal Products | | | 1,159,593 | | | | 934,095 | | | | — | | | | 2,093,688 | |
Pharmaceuticals | | | 15,727,601 | | | | 3,726,823 | | | | — | | | | 19,454,424 | |
Professional Services | | | 3,185,112 | | | | 576,858 | | | | — | | | | 3,761,970 | |
Real Estate Management & Development | | | 733,170 | | | | 1,312,928 | | | | — | | | | 2,046,098 | |
Road & Rail | | | 2,291,093 | | | | 221,742 | | | | — | | | | 2,512,835 | |
Semiconductors & Semiconductor Equipment | | | 9,094,826 | | | | 9,136,326 | | | | — | | | | 18,231,152 | |
Software | | | 20,406,560 | | | | 316,150 | | | | — | | | | 20,722,710 | |
Specialty Retail | | | 8,171,913 | | | | 416,815 | | | | — | | | | 8,588,728 | |
Technology Hardware, Storage & Peripherals | | | 8,851,430 | | | | 4,931,348 | | | | — | | | | 13,782,778 | |
Textiles, Apparel & Luxury Goods | | | 3,244,361 | | | | 1,535,847 | | | | — | | | | 4,780,208 | |
Thrifts & Mortgage Finance | | | 2,860,138 | | | | 1,038,076 | | | | — | | | | 3,898,214 | |
Tobacco | | | 665,606 | | | | 701,848 | | | | — | | | | 1,367,454 | |
Trading Companies & Distributors | | | 3,438,308 | | | | 555,662 | | | | — | | | | 3,993,970 | |
Transportation Infrastructure | | | 1,221,950 | | | | 356,377 | | | | — | | | | 1,578,327 | |
Water Utilities | | | 699,697 | | | | — | | | | — | | | | 699,697 | |
Wireless Telecommunication Services | | | 1,759,549 | | | | 1,577,929 | | | | — | | | | 3,337,478 | |
Preferred Stocks | | | 4,262,981 | | | | 14,545 | | | | — | | | | 4,277,526 | |
Rights | | | 15,537 | | | | — | | | | 3,499 | | | | 19,036 | |
Short-Term Securities | | | 77,903,311 | | | | — | | | | — | | | | 77,903,311 | |
| | | | | | | | | | | | | | | | |
| | $ | 423,876,790 | | | $ | 101,622,245 | | | $ | 6,969 | | | $ | 525,506,004 | |
| | | | | | | | | | | | | | | | |
Derivative Financial Instruments(a) | |
Assets: | |
Equity contracts | | $ | 8,358,900 | | | $ | — | | | $ | — | | | $ | 8,358,900 | |
Liabilities: | |
Equity contracts | | | (9,356,518 | ) | | | — | | | | — | | | | (9,356,518 | ) |
| | | | | | | | | | | | | | | | |
| | $ | (997,618 | ) | | $ | — | | | $ | — | | | $ | (997,618 | ) |
| | | | | | | | | | | | | | | | |
| | (a) | Derivative financial instruments are futures contracts. Futures contracts are valued at the unrealized appreciation (depreciation) on the instrument. | |
See notes to financial statements.
| | |
| 20 | | 2019 BLACKROCK ANNUAL REPORTTO SHAREHOLDERS |
Statement of Assets and Liabilities
December 31, 2019
| | | | |
| | | Active Stock
Master Portfolio | |
|
ASSETS | |
Investments at value — unaffiliated (including securities loaned at value of $33,274,990, cost — $380,065,956) | | $ | 447,602,693 | |
Investments at value — affiliated (cost — $77,898,420) | | | 77,903,311 | |
Cash pledged for futures contracts | | | 17,270,000 | |
Foreign currency at value (cost — $787,658) | | | 798,762 | |
Receivables: | |
Investments sold | | | 9,972 | |
Securities lending income — affiliated | | | 13,378 | |
Dividends — affiliated | | | 55,945 | |
Dividends — unaffiliated | | | 720,550 | |
Variation margin on futures contracts | | | 703,074 | |
Prepaid expenses | | | 5,744 | |
| | | | |
Total assets | | | 545,083,429 | |
| | | | |
|
LIABILITIES | |
Cash collateral on securities loaned at value | | | 34,064,801 | |
Payables: | |
Administration fees | | | 83,655 | |
Deferred foreign capital gain tax | | | 11,255 | |
Trustees’ fees | | | 3,743 | |
Investment advisory fees | | | 40,391 | |
Other accrued expenses | | | 22,820 | |
Variation margin on futures contracts | | | 563,875 | |
Withdrawals to investors | | | 3,154,921 | |
| | | | |
Total liabilities | | | 37,945,461 | |
| | | | |
| |
NET ASSETS | | $ | 507,137,968 | |
| | | | |
|
NET ASSETS CONSIST OF | |
Investors’ capital | | $ | 440,594,622 | |
Net unrealized appreciation (depreciation) | | | 66,543,346 | |
| | | | |
NET ASSETS | | $ | 507,137,968 | |
| | | | |
See notes to financial statements.
Statement of Operations
Year Ended December 31, 2019
| | | | |
| | | Active Stock Master Portfolio | |
|
INVESTMENT INCOME | |
Dividends — affiliated | | $ | 798,965 | |
Dividends — unaffiliated | | | 8,493,899 | |
Interest — unaffiliated | | | 261,527 | |
Securities lending income — affiliated — net | | | 135,153 | |
Foreign taxes withheld | | | (399,165 | ) |
| | | | |
Total investment income | | | 9,290,379 | |
| | | | |
|
EXPENSES | |
Investment advisory | | | 1,161,050 | |
Administration | | | 464,420 | |
Professional | | | 22,903 | |
Trustees | | | 17,564 | |
| | | | |
Total expenses | | | 1,665,937 | |
Less: | |
Fees waived and/or reimbursed by the Manager | | | (508,390 | ) |
Fees waived and/or reimbursed by the Administrator | | | (464,420 | ) |
| | | | |
Total expenses after fees waived and/or reimbursed | | | 693,127 | |
| | | | |
Net investment income | | | 8,597,252 | |
| | | | |
|
REALIZED AND UNREALIZED GAIN (LOSS) | |
Net realized gain (loss) from: | |
Futures contracts | | | 25,804,744 | |
Foreign currency transactions | | | (140,485 | ) |
Investments — affiliated | | | 4,137 | |
Investments — unaffiliated (including $141,131 foreign capital gain tax) | | | 19,812,363 | |
| | | | |
| | | 45,480,759 | |
| | | | |
Net change in unrealized appreciation (depreciation) on: | |
Futures contracts | | | 3,214,066 | |
Foreign currency translations | | | 11,710 | |
Investments — affiliated | | | 3,959 | |
Investments — unaffiliated (including $32,657 foreign capital gain tax) | | | 72,114,450 | |
| | | | |
| | | 75,344,185 | |
| | | | |
Net realized and unrealized gain | | | 120,824,944 | |
| | | | |
NET INCREASE IN NET ASSETS RESULTING FROM OPERATIONS | | $ | 129,422,196 | |
| | | | |
See notes to financial statements.
| | |
| 22 | | 2019 BLACKROCK ANNUAL REPORTTO SHAREHOLDERS |
Statements of Changes in Net Assets
| | | | | | | | |
| | | Active Stock Master Portfolio | |
| | | Year Ended December 31, | |
| | | 2019 | | | 2018 | |
|
INCREASE (DECREASE) IN NET ASSETS | |
|
OPERATIONS | |
Net investment income | | $ | 8,597,252 | | | $ | 9,668,652 | |
Net realized gain | | | 45,480,759 | | | | 45,014,797 | |
Net change in unrealized appreciation (depreciation) | | | 75,344,185 | | | | (66,244,769 | ) |
| | | | | | | | |
Net increase (decrease) in net assets resulting from operations | | | 129,422,196 | | | | (11,561,320 | ) |
| | | | | | | | |
|
CAPITAL TRANSACTIONS | |
Proceeds from contributions | | | 76,298,543 | | | | 28,030,716 | |
Value of withdrawals | | | (127,680,923 | ) | | | (122,827,185 | ) |
| | | | | | | | |
Net decrease in net assets derived from capital transactions | | | (51,382,380 | ) | | | (94,796,469 | ) |
| | | | | | | | |
|
NET ASSETS | |
Total increase (decrease) in net assets | | | 78,039,816 | | | | (106,357,789 | ) |
Beginning of year | | | 429,098,152 | | | | 535,455,941 | |
| | | | | | | | |
End of year | | $ | 507,137,968 | | | $ | 429,098,152 | |
| | | | | | | | |
See notes to financial statements.
Financial Highlights
| | | | | | | | | | | | | | | | | | | | |
| | | Active Stock Master Portfolio | |
| |
| | | Year Ended December 31, | |
| | | 2019 | | | 2018 | | | 2017 | | | 2016 | | | 2015 | |
|
Total Return | |
Total return | | | 31.98 | % | | | (3.90 | )% | | | 22.15 | % | | | 12.45 | % | | | (1.20 | )% |
| | | | | | | | | | | | | | | | | | | | |
|
Ratios to Average Net Assets | |
Total expenses | | | 0.36 | %(a) | | | 0.36 | % | | | 0.36 | % | | | 0.36 | % | | | 0.35 | % |
| | | | | | | | | | | | | | | | | | | | |
Total expenses after fees waived and/or reimbursed | | | 0.15 | %(a) | | | 0.15 | % | | | 0.15 | % | | | 0.15 | % | | | 0.15 | % |
| | | | | | | | | | | | | | | | | | | | |
Net investment income | | | 1.85 | %(a) | | | 1.88 | % | | | 1.69 | % | | | 1.66 | % | | | 1.65 | % |
| | | | | | | | | | | | | | | | | | | | |
|
Supplemental Data | |
Net assets, end of year (000) | | $ | 507,138 | | | $ | 429,098 | | | $ | 535,456 | | | $ | 503,047 | | | $ | 445,996 | |
| | | | | | | | | | | | | | | | | | | | |
Portfolio turnover rate | | | 172 | % | | | 150 | % | | | 252 | % | | | 115 | % | | | 132 | % |
| | | | | | | | | | | | | | | | | | | | |
| (a) | Excludes expenses incurred indirectly as a result of investments in underlying funds of 0.01%. |
See notes to financial statements.
| | |
| 24 | | 2019 BLACKROCK ANNUAL REPORTTO SHAREHOLDERS |
Notes to Financial Statements
Master Investment Portfolio (“MIP”) is registered under the Investment Company Act of 1940, as amended (the “1940 Act”), as anopen-end management investment company. MIP is organized as a Delaware statutory trust. Active Stock Master Portfolio (the “Master Portfolio”) is a series of MIP. The Master Portfolio is classified as diversified.
The Master Portfolio, together with certain other registered investment companies advised by BlackRock Fund Advisors (the “Manager”) or its affiliates, is included in a complex of equity, multi-asset, index and money market funds referred to as the BlackRock Multi-Asset Complex.
| 2. | SIGNIFICANT ACCOUNTING POLICIES |
The financial statements are prepared in conformity with accounting principles generally accepted in the United States of America (“U.S. GAAP”), which may require management to make estimates and assumptions that affect the reported amounts of assets and liabilities in the financial statements, disclosure of contingent assets and liabilities at the date of the financial statements and the reported amounts of increases and decreases in net assets from operations during the reporting period. Actual results could differ from those estimates. The Master Portfolio is considered an investment company under U.S. GAAP and follows the accounting and reporting guidance applicable to investment companies. Below is a summary of significant accounting policies:
Investment Transactions and Income Recognition:For financial reporting purposes, investment transactions are recorded on the dates the transactions are executed. Realized gains and losses on investment transactions are determined on the identified cost basis. Dividend income is recorded on theex-dividend date. Dividends from foreign securities where theex-dividend date may have passed are subsequently recorded when the Master Portfolio is informed of theex-dividend date. Under the applicable foreign tax laws, a withholding tax at various rates may be imposed on capital gains, dividends and interest. Upon notification from issuers, a portion of the dividend income received from a real estate investment trust may be redesignated as a reduction of cost of the related investment and/or realized gain. Interest income, including amortization and accretion of premiums and discounts on debt securities is recognized on an accrual basis.
Foreign Currency Translation:The Master Portfolio’s books and records are maintained in U.S. dollars. Securities and other assets and liabilities denominated in foreign currencies are translated into U.S. dollars using exchange rates determined as of the close of trading on the New York Stock Exchange (“NYSE”). Purchases and sales of investments are recorded at the rates of exchange prevailing on the respective dates of such transactions. Generally, when the U.S. dollar rises in value against a foreign currency, the investments denominated in that currency will lose value; the opposite effect occurs if the U.S. dollar falls in relative value.
The Master Portfolio does not isolate the portion of the results of operations arising as a result of changes in the exchange rates from the changes in the market prices of investments held or sold for financial reporting purposes. Accordingly, the effects of changes in exchange rates on investments are not segregated in the Statement of Operations from the effects of changes in market prices of those investments, but are included as a component of net realized and unrealized gain (loss) from investments. The Master Portfolio reports realized currency gains (losses) on foreign currency related transactions as components of net realized gain (loss) for financial reporting purposes, whereas such components are generally treated as ordinary income for U.S. federal income tax purposes.
Segregation and Collateralization:In cases where the Master Portfolio enters into certain investments (e.g., futures contracts) that would be treated as “senior securities” for 1940 Act purposes, the Master Portfolio may segregate or designate on itsbooks and records cash or liquid assets having a market value at least equal to the amount of its future obligations under such investments. Doing so allows the investment to be excluded from treatment as a “senior security.” Furthermore, if required by an exchange or counterparty agreement, the Master Portfolio may be required to deliver/deposit cash and/or securities to/with an exchange, or broker-dealer or custodian as collateral for certain investments or obligations.
Indemnifications:In the normal course of business, the Master Portfolio enters into contracts that contain a variety of representations that provide general indemnification. The Master Portfolio’s maximum exposure under these arrangements is unknown because it involves future potential claims against the Master Portfolio, which cannot be predicted with any certainty.
Other: Expenses directly related to the Master Portfolio are charged to the Master Portfolio. Other operating expenses shared by several funds, including other funds managed by the Manager, are prorated among those funds on the basis of relative net assets or other appropriate methods.
| 3. | INVESTMENT VALUATION AND FAIR VALUE MEASUREMENTS |
Investment Valuation Policies: The Master Portfolio’s investments are valued at fair value (also referred to as “market value” within the financial statements) as of the close of trading on the NYSE (generally 4:00 p.m., Eastern time). U.S. GAAP defines fair value as the price the Master Portfolio would receive to sell an asset or pay to transfer a liability in an orderly transaction between market participants at the measurement date. The Master Portfolio determines the fair values of its financial instruments using various independent dealers or pricing services under policies approved by the Board of Trustees of MIP (the “Board”). The BlackRock Global Valuation Methodologies Committee (the “Global Valuation Committee”) is the committee formed by management to develop global pricing policies and procedures and to oversee the pricing function for all financial instruments.
Fair Value Inputs and Methodologies: The following methods and inputs are used to establish the fair value of the Master Portfolio’s assets and liabilities:
| | • | | Equity investments traded on a recognized securities exchange are valued at the official closing price each day, if available. For equity investments traded on more than one exchange, the official closing price on the exchange where the stock is primarily traded is used. Equity investments traded on a recognized exchange for which there were no sales on that day may be valued at the last available bid (long positions) or ask (short positions) price. |
Generally, trading in foreign instruments is substantially completed each day at various times prior to the close of trading on the NYSE. Occasionally, events affecting the values of such instruments may occur between the foreign market close and the close of trading on the NYSE that may not be reflected in the
| | | | |
| NOTESTO FINANCIAL STATEMENTS | | | 25 | |
Notes to Financial Statements (continued)
computation of the Master Portfolio’s net assets. Each business day, the Master Portfolio uses a pricing service to assist with the valuation of certain foreign exchange-traded equity securities and foreign exchange-traded andover-the-counter (“OTC”) options (the “Systematic Fair Value Price”). Using current market factors, the Systematic Fair Value Price is designed to value such foreign securities and foreign options at fair value as of the close of trading on the NYSE, which follows the close of the local markets.
| | • | | Investments inopen-end U.S. mutual funds are valued at net asset value (“NAV”) each business day. |
| | • | | Futures contracts traded on exchanges are valued at their last sale price. |
If events (e.g., a company announcement, market volatility or a natural disaster) occur that are expected to materially affect the value of such investments, or in the event that the application of these methods of valuation results in a price for an investment that is deemed not to be representative of the market value of such investment, or if a price is not available, the investment will be valued by the Global Valuation Committee, or its delegate, in accordance with a policy approved by the Board as reflecting fair value (“Fair Valued Investments”). The fair valuation approaches that may be used by the Global Valuation Committee will include market approach, income approach and cost approach. Valuation techniques such as discounted cash flow, use of market comparables and matrix pricing are types of valuation approaches and are typically used in determining fair value. When determining the price for Fair Valued Investments, the Global Valuation Committee, or its delegate, seeks to determine the price that the Master Portfolio might reasonably expect to receive or pay from the current sale or purchase of that asset or liability in anarm’s-length transaction. Fair value determinations shall be based upon all available factors that the Global Valuation Committee, or its delegate, deems relevant and consistent with the principles of fair value measurement. The pricing of all Fair Valued Investments is subsequently reported to the Board or a committee thereof on a quarterly basis.
For investments in equity or debt issued by privately held companies or funds (“Private Company” or collectively, the “Private Companies”) and other Fair Valued Investments, the fair valuation approaches that are used by the Global Valuation Committee and third party pricing services utilize one or a combination of, but not limited to, the following inputs.
| | |
| | | Standard Inputs Generally Considered By Third Party Pricing Services |
Market approach | | (i) recent market transactions, including subsequent rounds of financing, in the underlying investment or comparable issuers; (ii) recapitalizations and other transactions across the capital structure; and (iii) market multiples of comparable issuers. |
Income approach | | (i) future cash flows discounted to present and adjusted as appropriate for liquidity, credit, and/or market risks; (ii) quoted prices for similar investments or assets in active markets; and (iii) other risk factors, such as interest rates, yield curves, volatilities, prepayment speeds, loss severities, credit risks, recovery rates, liquidation amounts and/or default rates. |
Cost approach | | (i) audited or unaudited financial statements, investor communications and financial or operational metrics issued by the Private Company; (ii) changes in the valuation of relevant indices or publicly traded companies comparable to the Private Company; (iii) relevant news and other public sources; and (iv) known secondary market transactions in the Private Company’s interests and merger or acquisition activity in companies comparable to the Private Company. |
Investments in series of preferred stock issued by Private Companies are typically valued utilizing market approach in determining the enterprise value of the company. Such investments often contain rights and preferences that differ from other series of preferred and common stock of the same issuer. Valuation techniques such as an option pricing model (“OPM”), a probability weighted expected return model (“PWERM”) or a hybrid of those techniques are used in allocating enterprise value of the company, as deemed appropriate under the circumstances. The use of OPM and PWERM techniques involve a determination of the exit scenarios of the investment in order to appropriately allocate the enterprise value of the company among the various parts of its capital structure.
The Private Companies are not subject to the public company disclosure, timing, and reporting standards as other investments held by a Trust. Typically, the most recently available information by a Private Company is as of a date that is earlier than the date a Trust is calculating its NAV. This factor may result in a difference between the value of the investment and the price a Trust could receive upon the sale of the investment.
Fair Value Hierarchy: Various inputs are used in determining the fair value of investments and derivative financial instruments. These inputs to valuation techniques are categorized into a fair value hierarchy consisting of three broad levels for financial statement purposes as follows:
| | • | | Level 1 — Unadjusted price quotations in active markets/exchanges for identical assets or liabilities that the Master Portfolio has the ability to access |
| | • | | Level 2 — Other observable inputs (including, but not limited to, quoted prices for similar assets or liabilities in markets that are active, quoted prices for identical or similar assets or liabilities in markets that are not active, inputs other than quoted prices that are observable for the assets or liabilities (such as interest rates, yield curves, volatilities, prepayment speeds, loss severities, credit risks and default rates) or other market–corroborated inputs) |
| | • | | Level 3 — Unobservable inputs based on the best information available in the circumstances, to the extent observable inputs are not available (including the Global Valuation Committee’s assumptions used in determining the fair value of investments and derivative financial instruments) |
The hierarchy gives the highest priority to unadjusted quoted prices in active markets for identical assets or liabilities (Level 1 measurements) and the lowest priority to unobservable inputs (Level 3 measurements). Accordingly, the degree of judgment exercised in determining fair value is greatest for instruments categorized in Level 3. The inputs used to measure fair value may fall into different levels of the fair value hierarchy. In such cases, for disclosure purposes, the fair value hierarchy classification is determined based on the lowest level input that is significant to the fair value measurement in its entirety. Investments classified within Level 3 have significant unobservable inputs used by the Global Valuation Committee in determining the price for Fair Valued Investments. Level 3 investments include equity or debt issued by privately held companies or funds. There may not be a secondary market, and/or there are a limited number of investors. The categorization of a value determined for
| | |
| 26 | | 2019 BLACKROCK ANNUAL REPORTTO SHAREHOLDERS |
Notes to Financial Statements (continued)
investments and derivative financial instruments is based on the pricing transparency of the investments and derivative financial instruments and is not necessarily an indication of the risks associated with investing in those securities.
| 4. | SECURITIES AND OTHER INVESTMENTS |
Preferred Stocks:Preferred stock has a preference over common stock in liquidation (and generally in receiving dividends as well), but is subordinated to the liabilities of the issuer in all respects. As a general rule, the market value of preferred stock with a fixed dividend rate and no conversion element varies inversely with interest rates and perceived credit risk, while the market price of convertible preferred stock generally also reflects some element of conversion value. Because preferred stock is junior to debt securities and other obligations of the issuer, deterioration in the credit quality of the issuer will cause greater changes in the value of a preferred stock than in a more senior debt security with similar stated yield characteristics. Unlike interest payments on debt securities, preferred stock dividends are payable only if declared by the issuer’s board of directors. Preferred stock also may be subject to optional or mandatory redemption provisions.
Securities Lending:The Master Portfolio may lend its securities to approved borrowers, such as brokers, dealers and other financial institutions. The borrower pledges and maintains with the Master Portfolio collateral consisting of cash, an irrevocable letter of credit issued by a bank, or securities issued or guaranteed by the U.S. Government. The initial collateral received by the Master Portfolio is required to have a value of at least 102% of the current value of the loaned securities for securities traded on U.S. exchanges and a value of at least 105% for all other securities. The collateral is maintained thereafter at a value equal to at least 100% of the current market value of the securities on loan. The market value of the loaned securities is determined at the close of each business day of the Master Portfolio and any additional required collateral is delivered to the Master Portfolio, or excess collateral returned by the Master Portfolio, on the next business day. During the term of the loan, the Master Portfolio is entitled to all distributions made on or in respect of the loaned securities, but does not receive interest income on securities received as collateral. Loans of securities are terminable at any time and the borrower, after notice, is required to return borrowed securities within the standard time period for settlement of securities transactions.
The market value of any securities on loan, all of which were classified as common stocks in the Master Portfolio’s Schedule of Investments, and the value of any related collateral are shown separately in the Statement of Assets and Liabilities as a component of investments at value-unaffiliated, and collateral on securities loaned at value, respectively. As of period end, any securities on loan were collateralized by cash and/or U.S. Government obligations. Cash collateral invested by the securities lending agent, BlackRock Institutional Trust Company, N.A. (“BTC”), if any, is disclosed in the Schedule of Investments.
Securities lending transactions are entered into by the Master Portfolio under Master Securities Lending Agreements (each, an “MSLA”), which provide the right, in the event of default (including bankruptcy or insolvency), for thenon-defaulting party to liquidate the collateral and calculate a net exposure to the defaulting party or request additional collateral. In the event that a borrower defaults, the Master Portfolio, as lender, would offset the market value of the collateral received against the market value of the securities loaned. When the value of the collateral is greater than that of the market value of the securities loaned, the lender is left with a net amount payable to the defaulting party. However, bankruptcy or insolvency laws of a particular jurisdiction may impose restrictions on or prohibitions against such a right of offset in the event of an MSLA counterparty’s bankruptcy or insolvency. Under the MSLA, absent an event of default, the borrower can resell orre-pledge the loaned securities, and the Master Portfolio can reinvest cash collateral received in connection with loaned securities. Upon an event of default, the parties’ obligations to return the securities or collateral to the other party are extinguished, and the parties can resell orre-pledge the loaned securities or the collateral received in connection with the loaned securities in order to satisfy the defaulting party’s net payment obligation for all transactions under the MSLA. The defaulting party remains liable for any deficiency.
As of period end, the following table is a summary of the Master Portfolio’s securities lending agreements by counterparty which are subject to offset under an MSLA:
| | | | | | | | | | | | |
| Counterparty | | Securities
Loaned at Value | | | Cash Collateral
Received (a) | | | Net
Amount (b) | |
Barclays Bank PLC | | $ | 1,473,793 | | | $ | (1,473,793 | ) | | $ | — | |
BNP Paribas S.A. | | | 3,800,557 | | | | (3,800,557 | ) | | | — | |
Bank of America N.A. | | | 695,194 | | | | (695,194 | ) | | | — | |
Citigroup Global Markets Inc. | | | 1,340,962 | | | | (1,340,962 | ) | | | — | |
Credit Suisse Securities (USA) LLC | | | 3,797,279 | | | | (3,797,279 | ) | | | — | |
Deutsche Bank Securities Inc. | | | 14,126 | | | | (14,126 | ) | | | — | |
Goldman Sachs & Co. | | | 1,303,788 | | | | (1,303,788 | ) | | | — | |
HSBC Bank PLC | | | 1,075,955 | | | | (1,075,955 | ) | | | — | |
ING Financial Markets LLC | | | 140,091 | | | | (140,091 | ) | | | — | |
Jefferies LLC | | | 375,650 | | | | (375,650 | ) | | | — | |
JP Morgan Securities LLC | | | 5,123,356 | | | | (5,123,356 | ) | | | — | |
Morgan Stanley | | | 5,905,649 | | | | (5,905,649 | ) | | | — | |
National Financial Services LLC | | | 273,387 | | | | (273,387 | ) | | | — | |
Scotia Capital (USA) Inc. | | | 1,264,625 | | | | (1,264,625 | ) | | | — | |
Toronto-Dominion Bank | | | 534,586 | | | | (524,626 | ) | | | 9,960 | |
UBS AG | | | 4,570,210 | | | | (4,570,210 | ) | | | — | |
Virtu Americas LLC | | | 1,195,861 | | | | (1,195,861 | ) | | | — | |
Wells Fargo Securities LLC | | | 389,921 | | | | (389,921 | ) | | | — | |
| | | | | | | | | | | | |
| | $ | 33,274,990 | | | $ | (33,265,030 | ) | | $ | 9,960 | |
| | | | | | | | | | | | |
| | (a) | Collateral received in excess of the market value of securities on loan is not presented in this table. The total cash collateral received by Master Portfolio is disclosed in the Master Portfolio’s Statement of Assets and Liabilities. | |
| | (b) | The market value of the loaned securities is determined as of December 31, 2019. Additional collateral is delivered to the Master Portfolio on the next business day in accordance with the MSLA. The net amount would be subject to the borrower default indemnity in the event of default by the counterparty. | |
| | | | |
| NOTESTO FINANCIAL STATEMENTS | | | 27 | |
Notes to Financial Statements (continued)
The risks of securities lending include the risk that the borrower may not provide additional collateral when required or may not return the securities when due. To mitigate these risks, the Master Portfolio benefits from a borrower default indemnity provided by BlackRock, Inc. (“BlackRock”). BlackRock’s indemnity allows for full replacement of the securities loaned to the extent the collateral received does not cover the value on the securities loaned in the event of borrower default. The Master Portfolio could incur a loss if the value of an investment purchased with cash collateral falls below the market value of loaned securities or if the value of an investment purchased with cash collateral falls below the value of the original cash collateral received. Such losses are borne entirely by the Master Portfolio.
| 5. | DERIVATIVE FINANCIAL INSTRUMENTS |
The Master Portfolio engages in various portfolio investment strategies using derivative contracts both to increase the returns of the Master Portfolio and/or to manage its exposure to certain risks such as credit risk, equity risk, interest rate risk, foreign currency exchange rate risk, commodity price risk or other risks (e.g., inflation risk). Derivative financial instruments categorized by risk exposure are included in the Schedule of Investments. These contracts may be transacted on an exchange or OTC.
Futures Contracts: Futures contracts are purchased or sold to gain exposure to, or manage exposure to, changes in interest rates (interest rate risk) and changes in the value of equity securities (equity risk) or foreign currencies (foreign currency exchange rate risk).
Futures contracts are agreements between the Master Portfolio and a counterparty to buy or sell a specific quantity of an underlying instrument at a specified price and on a specified date. Depending on the terms of a contract, it is settled either through physical delivery of the underlying instrument on the settlement date or by payment of a cash amount on the settlement date. Upon entering into a futures contract, the Master Portfolio is required to deposit initial margin with the broker in the form of cash or securities in an amount that varies depending on a contract’s size and risk profile. The initial margin deposit must then be maintained at an established level over the life of the contract. Amounts pledged, which are considered restricted, are included in cash pledged for futures contracts in the Statement of Assets and Liabilities.
Securities deposited as initial margin are designated in the Schedule of Investments and cash deposited, if any, are shown as cash pledged for futures contracts in the Statement of Assets and Liabilities. Pursuant to the contract, the Master Portfolio agrees to receive from or pay to the broker an amount of cash equal to the daily fluctuation in market value of the contract (“variation margin”). Variation margin is recorded as unrealized appreciation (depreciation) and, if any, shown as variation margin receivable (or payable) on futures contracts in the Statement of Assets and Liabilities. When the contract is closed, a realized gain or loss is recorded in the Statement of Operations equal to the difference between the notional amount of the contract at the time it was opened and the notional amount at the time it was closed. The use of futures contracts involves the risk of an imperfect correlation in the movements in the price of futures contracts and interest, foreign currency exchange rates or underlying assets.
| 6. | INVESTMENT ADVISORY AGREEMENT AND OTHER TRANSACTIONS WITH AFFILIATES |
Investment Advisory: MIP, on behalf of the Master Portfolio, entered into an Investment Advisory Agreement with the Manager, the Master Portfolio’s investment adviser and an indirect, wholly-owned subsidiary of BlackRock, to provide investment advisory services. The Manager is responsible for the management of the Master Portfolio’s portfolio and provides the personnel, facilities, equipment and certain other services necessary to the operations of the Master Portfolio.
For such services, the Master Portfolio pays the Manager a monthly fee at an annual rate equal to the following percentages of the average daily value of the Master Portfolio’s net assets.
| | | | |
| Average Daily Net Assets | | Investment Advisory Fee | |
First $1 Billion | | | 0.25 | % |
$1 Billion — $3 Billion | | | 0.24 | |
$3 Billion — $5 Billion | | | 0.23 | |
$5 Billion — $10 Billion | | | 0.22 | |
Greater than $10 Billion | | | 0.21 | |
Administration: MIP, on behalf of the Master Portfolio, entered into an Administration Agreement with BlackRock Advisors, LLC (“BAL” or the “Administrator”), which has agreed to provide general administrative services (other than investment advice and related portfolio activities). BAL has agreed to bear all of the Master Portfolio’s ordinary operating expenses, excluding, generally, investment advisory fees, distribution fees, brokerage and other expenses related to the execution of portfolio transactions, extraordinary expenses and certain other expenses which are borne by the Master Portfolio. BAL is entitled to receive for these administrative services an annual fee of 0.10% based on the average daily net assets of the Master Portfolio.
From time to time, BAL may waive such fees in whole or in part. Any such waiver will reduce the expenses of the Master Portfolio and, accordingly, have a favorable impact on its performance. BAL may delegate certain of its administration duties tosub-administrators.
Expense Waivers and Reimbursements:The Manager has voluntarily agreed to waive a portion of the investment advisory fees payable by the Master Portfolio. This voluntary waiver may be terminated at any time. This amount is included in fees waived and/or reimbursed by the Manager in the Statement of Operations. For the year ended December 31, 2019, the Manager waived $441,199 pursuant to this arrangement.
BAL voluntarily agreed to waive a portion of its administration fees payable by the Master Portfolio. This arrangement is voluntary and may be terminated by BAL at any time. This amount is included in fees waived and/or reimbursed by the Administrator in the Statement of Operations. For the year ended December 31, 2019, the amount waived was $464,420.
The fees and expenses of MIP’s trustees who are not “interested persons” of MIP, as defined in the 1940 Act (“Independent Trustees”), counsel to the Independent Trustees and MIP’s independent registered public accounting firm (together, the “independent expenses”) are paid directly by the Master Portfolio. BAL has contractually
| | |
| 28 | | 2019 BLACKROCK ANNUAL REPORTTO SHAREHOLDERS |
Notes to Financial Statements (continued)
agreed to reimburse the Master Portfolio or provide an offsetting credit against these administration fees paid by the Master Portfolio in an amount equal to the independent expenses through April 30, 2020. For the year ended December 31, 2019, the amount waived was $40,470.
With respect to the Master Portfolio, the Manager voluntarily agreed to waive its investment advisory fees by the amount of investment advisory fees the Master Portfolio pays to the Manager indirectly through its investment in affiliated money market funds (the “affiliated money market fund waiver”). This amount is included in fees waived and/or reimbursed by the Manager in the Statement of Operations. For the year ended December 31, 2019, the amount waived was $26,721.
The Manager has contractually agreed to waive its investment advisory fee with respect to any portion of the Master Portfolio’s assets invested in affiliated equity and fixed-income mutual funds and affiliated exchange-traded funds that have a contractual management fee through April 30, 2020. The contractual agreement may be terminated upon 90 days’ notice by a majority of the Independent Trustees or by a vote of a majority of the outstanding voting securities of the Master Portfolio. For the year ended December 31, 2019, there were no fees waived and/or reimbursed by the Manager pursuant to this arrangement.
Securities Lending:The U.S. Securities and Exchange Commission (“SEC”) has issued an exemptive order which permits BTC, an affiliate of the Manager, to serve as securities lending agent for the Master Portfolio, subject to applicable conditions. As securities lending agent, BTC bears all operational costs directly related to securities lending. The Master Portfolio is responsible for fees in connection with the investment of cash collateral received for securities on loan (the “collateral investment fees”). The cash collateral is invested in a money market fund managed by the Manager or its affiliates. However, BTC has agreed to reduce the amount of securities lending income it receives in order to effectively limit the collateral investment fees the Master Portfolio bears to an annual rate of 0.04%. The shares of such money market fund will not be subject to a sales load, distribution fee or service fee. The money market fund in which the cash collateral has been invested may, under certain circumstances, impose a liquidity fee of up to 2% of the value redeemed or temporarily restrict redemptions for up to 10 business days during a 90 day period, in the event that the money market fund’s weekly liquid assets fall below certain thresholds.
Securities lending income is equal to the total of income earned from the reinvestment of cash collateral, net of fees and other payments to and from borrowers of securities, and less the collateral investment fees. The Master Portfolio retains a portion of securities lending income and remits a remaining portion to BTC as compensation for its services as securities lending agent.
Pursuant to the current securities lending agreement, the Master Portfolio retains 73.5% of securities lending income (which excludes collateral investment fees), and this amount retained can never be less than 70% of the total of securities lending income plus the collateral investment fees.
In addition, commencing the business day following the date that the aggregate securities lending income earned across the BlackRock Multi-Asset Complex in a calendar year exceeds a specified threshold, the Master Portfolio, pursuant to the securities lending agreement, will retain for the remainder of that calendar year securities lending income in an amount equal to 80% of securities lending income (which excludes collateral investment fees), and this amount retained can never be less than 70% of the total of securities lending income plus the collateral investment fees.
The share of securities lending income earned by the Master Portfolio is shown as securities lending income — affiliated — net in the Statement of Operations. For the year ended December 31, 2019, the Master Portfolio paid BTC $40,184 in total for securities lending agent services.
Interfund Lending: In accordance with an exemptive order (the “Order”) from the SEC, the Master Portfolio may participate in a joint lending and borrowing facility for temporary purposes (the “Interfund Lending Program”), subject to compliance with the terms and conditions of the Order, and to the extent permitted by the Master Portfolio’s investment policies and restrictions. The Master Portfolio is currently permitted to borrow and lend under the Interfund Lending Program.
A lending BlackRock fund may lend in aggregate up to 15% of its net assets, but may not lend more than 5% of its net assets to any one borrowing fund through the Interfund Lending Program. A borrowing BlackRock fund may not borrow through the Interfund Lending Program or from any other source more than 33 1/3% of its total assets (or any lower threshold provided for by the fund’s investment restrictions). If a borrowing BlackRock fund’s total outstanding borrowings exceed 10% of its total assets, each of its outstanding interfund loans will be subject to collateralization of at least 102% of the outstanding principal value of the loan. All interfund loans are for temporary or emergency purposes and the interest rate to be charged will be the average of the highest current overnight repurchase agreement rate available to a lending fund and the bank loan rate, as calculated according to a formula established by the Board.
During the year ended December 31, 2019, the Master Portfolio did not participate in the Interfund Lending Program.
Trustees and Officers:Certain trustees and/or officers of MIP are directors and/or officers of BlackRock or its affiliates.
For the year ended December 31, 2019, purchases and sales of investments excluding short-term securities, were $703,913,478 and $722,548,219, respectively.
The Master Portfolio is classified as a partnership for U.S. federal income tax purposes. As such, each investor in the Master Portfolio is treated as the owner of its proportionate share of net assets, income, expenses and realized and unrealized gains and losses of the Master Portfolio. Therefore, no U.S. federal income tax provision is required. It is intended that the Master Portfolio’s assets will be managed so an investor in the Master Portfolio can satisfy the requirements of Subchapter M of the Internal Revenue Code of 1986, as amended.
The Master Portfolio files U.S. federal and various state and local tax returns. No income tax returns are currently under examination. The statute of limitations on the Master Portfolio’s U.S. federal tax returns generally remains open for each of the four years ended December 31, 2019. The statutes of limitations on the Master Portfolio’s state and local tax returns may remain open for an additional year depending upon the jurisdiction.
Management has analyzed tax laws and regulations and their application to the Master Portfolio as of December 31, 2019, inclusive of the open tax return years, and does not believe that there are any uncertain tax positions that require recognition of a tax liability in the Master Portfolio’s financial statements.
| | | | |
| NOTESTO FINANCIAL STATEMENTS | | | 29 | |
Notes to Financial Statements (continued)
As of December 31, 2019, gross unrealized appreciation and depreciation for investments and derivatives based on cost for U.S. federal income tax purposes were as follows:
| | | | |
Tax Cost | | $ | 462,717,387 | |
| | | | |
Gross unrealized appreciation | | $ | 82,765,756 | �� |
Gross unrealized depreciation | | | (19,977,139 | ) |
| | | | |
Net unrealized appreciation | | $ | 62,788,617 | |
| | | | |
MIP, on behalf of the Master Portfolio, along with certain other funds managed by the Manager and its affiliates (“Participating Funds”), is a party to a364-day, $2.25 billion credit agreement with a group of lenders. Under this agreement, the Master Portfolio may borrow to fund shareholder redemptions. Excluding commitments designated for certain individual funds, the Participating Funds, including the Master Portfolio, can borrow up to an aggregate commitment amount of $1.75 billion at any time outstanding, subject to asset coverage and other limitations as specified in the agreement. The credit agreement has the following terms: a fee of 0.10% per annum on unused commitment amounts and interest at a rate equal to the higher of (a)one-month LIBOR (but, in any event, not less than 0.00%) on the date the loan is made plus 0.80% per annum or (b) the Fed Funds rate (but, in any event, not less than 0.00%) in effect from time to time plus 0.80% per annum on amounts borrowed. The agreement expires in April 2020 unless extended or renewed. Prior to April 18, 2019, Participating Funds paid an upfront commitment fee of 0.02% on the total commitment amounts, in addition to administration, legal and arrangement fees, which are included in miscellaneous expenses in the Statement of Operations. These fees were allocated among such funds based upon portions of the aggregate commitment available to them and relative net assets of Participating Funds. During the year ended December 31, 2019, the Master Portfolio did not borrow under the credit agreement.
In the normal course of business, the Master Portfolio invests in securities or other instruments and may enter into certain transactions, and such activities subject the Master Portfolio to various risks, including among others, fluctuations in the market (market risk) or failure of an issuer to meet all of its obligations. The value of securities or other instruments may also be affected by various factors, including, without limitation: (i) the general economy; (ii) the overall market as well as local, regional or global political and/or social instability; (iii) regulation, taxation or international tax treaties between various countries; or (iv) currency, interest rate and price fluctuations. The Master Portfolio’s prospectus provides details of the risks to which the Master Portfolio is subject.
The Master Portfolio may be exposed to additional risks when reinvesting cash collateral in money market funds that do not seek to maintain a stable NAV per share of $1.00, which may be subject to redemption gates or liquidity fees under certain circumstances.
Valuation Risk: The market values of equities, such as common stocks and preferred securities or equity related investments, such as futures and options, may decline due to general market conditions which are not specifically related to a particular company. They may also decline due to factors which affect a particular industry or industries. The Master Portfolio may invest in illiquid investments. An illiquid investment is any investment that the Master Portfolio reasonably expects cannot be sold or disposed of in current market conditions in seven calendar days or less without the sale or disposition significantly changing the market value of the investment. The Master Portfolio may experience difficulty in selling illiquid investments in a timely manner at the price that it believes the investments are worth. Prices may fluctuate widely over short or extended periods in response to company, market or economic news. Markets also tend to move in cycles, with periods of rising and falling prices. This volatility may cause the Master Portfolio’s NAV to experience significant increases or decreases over short periods of time. If there is a general decline in the securities and other markets, the NAV of the Master Portfolio may lose value, regardless of the individual results of the securities and other instruments in which the Master Portfolio invests.
Counterparty Credit Risk:The Master Portfolio may be exposed to counterparty credit risk, or the risk that an entity may fail to or be unable to perform on its commitments related to unsettled or open transactions. The Master Portfolio manages counterparty credit risk by entering into transactions only with counterparties that the Manager believes have the financial resources to honor their obligations and by monitoring the financial stability of those counterparties. Financial assets, which potentially expose the Master Portfolio to market, issuer and counterparty credit risks, consist principally of financial instruments and receivables due from counterparties. The extent of the Master Portfolio’s exposure to market, issuer and counterparty credit risks with respect to these financial assets is approximately their value recorded in the Statement of Assets and Liabilities, less any collateral held by the Master Portfolio.
A derivative contract may suffer amark-to-market loss if the value of the contract decreases due to an unfavorable change in the market rates or values of the underlying instrument. Losses can also occur if the counterparty does not perform under the contract.
With exchange-traded futures, there is less counterparty credit risk to the Master Portfolio since the exchange or clearinghouse, as counterparty to such instruments, guarantees against a possible default. The clearinghouse stands between the buyer and the seller of the contract; therefore, credit risk is limited to failure of the clearinghouse. While offset rights may exist under applicable law, the Master Portfolio does not have a contractual right of offset against a clearing broker or clearinghouse in the event of a default (including the bankruptcy or insolvency). Additionally, credit risk exists inexchange-traded futures with respect to initial and variation margin that is held in a clearing broker’s customer accounts. While clearing brokers are required to segregate customer margin from their own assets, in the event that a clearing broker becomes insolvent or goes into bankruptcy and at that time there is a shortfall in the aggregate amount of margin held by the clearing broker for all its clients, typically the shortfall would be allocated on a pro rata basis across all the clearing broker’s customers, potentially resulting in losses to the Master Portfolio.
Management has evaluated the impact of all subsequent events on the Master Portfolio through the date the financial statements were issued and has determined that there were no subsequent events requiring adjustment or additional disclosure in the financial statements.
| | |
| 30 | | 2019 BLACKROCK ANNUAL REPORTTO SHAREHOLDERS |
Report of Independent Registered Public Accounting Firm
To the Board of Trustees of
Master Investment Portfolio and Investors of Active Stock Master Portfolio
Opinion on the Financial Statements
We have audited the accompanying statement of assets and liabilities, including the schedule of investments, of Active Stock Master Portfolio (one of the series constituting Master Investment Portfolio, referred to hereafter as the “Master Portfolio”) as of December 31, 2019, the related statement of operations for the year ended December 31, 2019, the statements of changes in net assets for each of the two years in the period ended December 31, 2019, including the related notes, and the financial highlights for each of the five years in the period ended December 31, 2019 (collectively referred to as the “financial statements”). In our opinion, the financial statements present fairly, in all material respects, the financial position of the Master Portfolio as of December 31, 2019, the results of its operations for the year then ended, the changes in its net assets for each of the two years in the period ended December 31, 2019 and the financial highlights for each of the five years in the period ended December 31, 2019 in conformity with accounting principles generally accepted in the United States of America.
Basis for Opinion
These financial statements are the responsibility of the Master Portfolio’s management. Our responsibility is to express an opinion on the Master Portfolio’s financial statements based on our audits. We are a public accounting firm registered with the Public Company Accounting Oversight Board (United States) (“PCAOB”) and are required to be independent with respect to the Master Portfolio in accordance with the U.S. federal securities laws and the applicable rules and regulations of the Securities and Exchange Commission and the PCAOB.
We conducted our audits of these financial statements in accordance with the standards of the PCAOB. Those standards require that we plan and perform the audit to obtain reasonable assurance about whether the financial statements are free of material misstatement, whether due to error or fraud.
Our audits included performing procedures to assess the risks of material misstatement of the financial statements, whether due to error or fraud, and performing procedures that respond to those risks. Such procedures included examining, on a test basis, evidence regarding the amounts and disclosures in the financial statements. Our audits also included evaluating the accounting principles used and significant estimates made by management, as well as evaluating the overall presentation of the financial statements. Our procedures included confirmation of securities owned as of December 31, 2019 by correspondence with the custodian, transfer agent and brokers. We believe that our audits provide a reasonable basis for our opinion.
/s/PricewaterhouseCoopers LLP
Philadelphia, Pennsylvania
February 27, 2020
We have served as the auditor of one or more BlackRock investment companies since 2000.
| | | | |
| REPORT OF INDEPENDENT REGISTERED PUBLIC ACCOUNTING FIRM | | | 31 | |
Statement Regarding Liquidity Risk Management Program
The Securities and Exchange Commission adopted Rule 22e-4 under the Investment Company Act of 1940, as amended (the “Liquidity Rule”) to promote effective liquidity risk management throughout the open-end investment company industry, thereby reducing the risk that funds will be unable to meet their redemption obligations and mitigating dilution of the interests of fund shareholders.
The Board of Trustees (the “Board”) of Master Investment Portfolio (“MIP”), on behalf of Active Stock Master Portfolio, met on November 12-13, 2019 (the “Meeting”) to review the liquidity risk management program (the “Program”) applicable to the BlackRock open-end funds, excluding money market funds (each, a “Fund”), pursuant to the Liquidity Rule. The Board has appointed BlackRock Advisors, LLC or BlackRock Fund Advisors (“BlackRock”), each an investment adviser to certain Funds, as the program administrator for each Fund’s Program, as applicable. BlackRock has delegated oversight of the Program to the 40 Act Liquidity Risk Management Committee (the “Committee”). At the Meeting, the Committee, on behalf of BlackRock, provided the Board with a report that addressed the operation of the Program and assessed its adequacy and effectiveness of implementation, including the operation of each Fund’s Highly Liquid Investment Minimum (“HLIM”) where applicable, and any material changes to the Program (the “Report”). The Report covered the period from December 1, 2018 through September 30, 2019 (the “Program Reporting Period”).
The Report described the Program’s liquidity classification methodology for categorizing a Fund’s investments (including derivative transactions) into one of four liquidity buckets. It also described BlackRock’s methodology in establishing a Fund’s HLIM and noted that the Committee reviews and ratifies the HLIM assigned to each Fund no less frequently than annually.
The Report noted that the Program complied with the key factors for consideration under the Liquidity Rule for assessing, managing and periodically reviewing a Fund’s liquidity risk, as follows:
A. The Fund’s investment strategy and liquidity of portfolio investments during both normal and reasonably foreseeable stressed conditions. During the Program Reporting Period, the Committee reviewed whether each Fund’s strategy is appropriate for an open-end fund structure with a focus on Funds with more significant and consistent holdings of less liquid and illiquid assets. The Committee also factored a Fund’s concentration in an issuer into the liquidity classification methodology by taking issuer position sizes into account. Where a Fund participated in borrowings for investment purposes (such as tender option bonds and reverse repurchase agreements), such borrowings were factored into the Program’s calculation of a Fund’s liquidity bucketing. Derivative exposure was also considered in such calculation.
B. Short-term and long-term cash flow projections during both normal and reasonably foreseeable stressed conditions. During the Program Reporting Period, the Committee reviewed historical net redemption activity and used this information as a component to establish each Fund’s reasonably anticipated trading size (“RATS”). Each Fund has adopted an in-kind redemption policy which may be utilized to meet larger redemption requests. The Committee may also take into consideration a Fund’s shareholder ownership concentration (which, depending on product type and distribution channel, may or may not be available), a Fund’s distribution channels, and the degree of certainty associated with a Fund’s short-term and long-term cash flow projections.
C. Holdings of cash and cash equivalents, as well as borrowing arrangements. The Committee considered the terms of the credit facility applicable to the Funds, the financial health of the institution providing the facility and the fact that the credit facility is shared among multiple Funds (including that a portion of the aggregate commitment amount is specifically designated for BlackRock Floating Rate Income Portfolio and BlackRock Credit Strategies Income Fund, each a series of BlackRock Funds V). The Committee also considered other types of borrowing available to the Funds, such as the ability to use reverse repurchase agreements and interfund lending, as applicable.
There were no material changes to the Program during the Program Reporting Period. The Report provided to the Board stated that the Committee concluded that based on the operation of the functions, as described in the Report, the Program is operating as intended and is effective in implementing the requirements of the Liquidity Rule.
| | |
| 32 | | 2019 BLACKROCK ANNUAL REPORTTO SHAREHOLDERS |
Trustee and Officer Information
| | | | | | | | |
| Independent Trustees (a) |
| | | | | |
Name
Year of Birth (b) | | Position(s) Held
(Length of Service) (c) | | Principal Occupation(s) During Past Five Years | | Number of BlackRock-Advised
Registered Investment Companies
(“RICs”) Consisting of
Investment Portfolios
(“Portfolios”) Overseen | | Public Company and
Other Investment Company
Directorships Held During
Past Five Years |
Mark Stalnecker 1951 | | Chair of the Board (Since 2019) and Trustee (Since 2015) | | Chief Investment Officer, University of Delaware from 1999 to 2013; Trustee and Chair of the Finance and Investment Committees, Winterthur Museum and Country Estate from 2005 to 2016; Member of the Investment Committee, Delaware Public Employees’ Retirement System since 2002; Member of the Investment Committee, Christiana Care Health System from 2009 to 2017; Member of the Investment Committee, Delaware Community Foundation from 2013 to 2014; Director and Chair of the Audit Committee, SEI Private Trust Co. from 2001 to 2014. | | 37 RICs consisting of 177 Portfolios | | None |
Bruce R. Bond 1946 | | Trustee (Since 2019) | | Board Member, Amsphere Limited (software) since 2018; Trustee and Member of the Governance Committee, State Street Research Mutual Funds from 1997 to 2005; Board Member of Governance, Audit and Finance Committee, Avaya Inc. (computer equipment) from 2003 to 2007. | | 37 RICs consisting of 177 Portfolios | | None |
Susan J. Carter 1956 | | Trustee (Since 2016) | | Director, Pacific Pension Institute from 2014 to 2018; Advisory Board Member, Center for Private Equity and Entrepreneurship at Tuck School of Business since 1997; Senior Advisor, Commonfund Capital, Inc. (“CCI”) (investment adviser) in 2015; Chief Executive Officer, CCI from 2013 to 2014; President & Chief Executive Officer, CCI from 1997 to 2013; Advisory Board Member, Girls Who Invest from 2015 to 2018 and Board Member thereof since 2018; Advisory Board Member, Bridges Fund Management since 2016; Trustee, Financial Accounting Foundation since 2017; Practitioner Advisory Board Member, Private Capital Research Institute (“PCRI”) since 2017. | | 37 RICs consisting of 177 Portfolios | | None |
Collette Chilton 1958 | | Trustee (Since 2015) | | Chief Investment Officer, Williams College since 2006; Chief Investment Officer, Lucent Asset Management Corporation from 1998 to 2006. | | 37 RICs consisting of 177 Portfolios | | None |
Neil A. Cotty 1954 | | Trustee (Since 2016) | | Bank of America Corporation from 1996 to 2015, serving in various senior finance leadership roles, including Chief Accounting Officer from 2009 to 2015, Chief Financial Officer of Global Banking, Markets and Wealth Management from 2008 to 2009, Chief Accounting Officer from 2004 to 2008, Chief Financial Officer of Consumer Bank from 2003 to 2004, Chief Financial Officer of Global Corporate Investment Bank from 1999 to 2002. | | 37 RICs consisting of 177 Portfolios | | None |
Lena G. Goldberg 1949 | | Trustee (Since 2019) | | Senior Lecturer, Harvard Business School, since 2008; Director, Charles Stark Draper Laboratory, Inc. since 2013; FMR LLC/Fidelity Investments (financial services) from 1996 to 2008, serving in various senior roles including Executive Vice President — Strategic Corporate Initiatives and Executive Vice President and General Counsel; Partner, Sullivan & Worcester LLP from 1985 to 1996 and Associate thereof from 1979 to 1985. | | 37 RICs consisting of 177 Portfolios | | None |
Robert M. Hernandez 1944 | | Trustee (Since 2019) | | Director, Vice Chairman and Chief Financial Officer of USX Corporation (energy and steel business) from 1991 to 2001; Director andnon-executive Chairman, RTI International Metals, Inc. from 1990 to 2015; Director, TE Connectivity (electronics) from 2006 to 2012. | | 37 RICs consisting of 177 Portfolios | | Chubb Limited (insurance company); Eastman Chemical Company
|
| | | | |
| TRUSTEEAND OFFICER INFORMATION | | | 33 | |
Trustee and Officer Information (continued)
| | | | | | | | |
| Independent Trustees (a)(continued) |
| | | | | |
Name
Year of Birth (b) | | Position(s) Held
(Length of Service) (c) | | Principal Occupation(s) During Past Five Years | | Number of BlackRock-Advised
Registered Investment Companies
(“RICs”) Consisting of
Investment Portfolios
(“Portfolios”) Overseen | | Public Company and
Other Investment Company
Directorships Held During
Past Five Years |
Henry R. Keizer 1956 | | Trustee (Since 2019) | | Director, Park Indemnity Ltd. (captive insurer) since 2010; Director, MUFG Americas Holdings Corporation and MUFG Union Bank, N.A. (financial and bank holding company) from 2014 to 2016; Director, American Institute of Certified Public Accountants from 2009 to 2011; Director, KPMG LLP (audit, tax and advisory services) from 2004 to 2005 and 2010 to 2012; Director, KPMG International in 2012, Deputy Chairman and Chief Operating Officer thereof from 2010 to 2012 and U.S. Vice Chairman of Audit thereof from 2005 to 2010; Global Head of Audit, KPMGI (consortium of KPMG firms) from 2006 to 2010; Director, YMCA of Greater New York from 2006 to 2010. | | 37 RICs consisting of 177 Portfolios | | Hertz Global Holdings (car rental); Montpelier Re Holdings, Ltd. (publicly held property and casualty reinsurance) from 2013 until 2015; Sealed Air Corp. (packaging); WABCO (commercial vehicle safety systems) |
Cynthia A. Montgomery 1952 | | Trustee (Since 2009) | | Professor, Harvard Business School since 1989. | | 37 RICs consisting of 177 Portfolios | | Newell Rubbermaid, Inc. (manufacturing) |
Donald C. Opatrny 1952 | | Trustee (Since 2019) | | Trustee, Vice Chair, Member of the Executive Committee and Chair of the Investment Committee, Cornell University since 2004; President, Trustee and Member of the Investment Committee, The Aldrich Contemporary Art Museum from 2007 to 2014; Member of the Board and Investment Committee, University School from 2007 to 2018; Member of the Investment Committee, Mellon Foundation from 2009 to 2015; Trustee, Artstor (a Mellon Foundation affiliate) from 2010 to 2015; President and Trustee, the Center for the Arts, Jackson Hole from 2011 to 2018; Director, Athena Capital Advisors LLC (investment management firm) since 2013; Trustee and Chair of the Investment Committee, Community Foundation of Jackson Hole since 2014; Member of Affordable Housing Supply Board of Jackson, Wyoming since 2018; Member, Investment Funds Committee, State of Wyoming since 2017; Trustee, Phoenix Art Museum since 2018. | | 37 RICs consisting of 177 Portfolios | | None |
Joseph P. Platt 1947 | | Trustee (Since 2009) | | General Partner, Thorn Partners, LP (private investments) since 1998; Director, WQED Multi-Media (public broadcastingnot-for-profit) since 2001; Chair, Basic Health International(non-profit) since 2015. | | 37 RICs consisting of 177 Portfolios | | Greenlight Capital Re, Ltd. (reinsurance company); Consol Energy Inc. |
Kenneth L. Urish 1951 | | Trustee (Since 2009) | | Managing Partner, Urish Popeck & Co., LLC (certified public accountants and consultants) since 1976; Past-Chairman of the Professional Ethics Committee of the Pennsylvania Institute of Certified Public Accountants and Committee Member thereof since 2007; Member of External Advisory Board, The Pennsylvania State University Accounting Department since founding in 2001; Principal, UP Strategic Wealth Investment Advisors, LLC since 2013; Trustee, The Holy Family Institute from 2001 to 2010; President and Trustee, Pittsburgh Catholic Publishing Associates from 2003 to 2008; Director,Inter-Tel from 2006 to 2007. | | 37 RICs consisting of 177 Portfolios | | None |
Claire A. Walton 1957 | | Trustee (Since 2016) | | Chief Operating Officer and Chief Financial Officer of Liberty Square Asset Management, LP from 1998 to 2015; General Partner of Neon Liberty Capital Management, LLC since 2003; Director, Boston Hedge Fund Group from 2009 to 2018; Director, Woodstock Ski Runners since 2013; Director, Massachusetts Council on Economic Education from 2013 to 2015. | | 37 RICs consisting of 177 Portfolios | | None |
| | |
| 34 | | 2019 BLACKROCK ANNUAL REPORTTO SHAREHOLDERS |
Trustee and Officer Information (continued)
| | | | | | | | |
| Interested Trustees (a)(d) |
| | | | | |
Name
Year of Birth (b) | | Position(s) Held
(Length of Service) (c) | | Principal Occupation(s) During Past Five Years | | Number of BlackRock-Advised
Registered Investment Companies
(“RICs”) Consisting of
Investment Portfolios
(“Portfolios”) Overseen | | Public Company and
Other Investment Company
Directorships Held During
Past Five Years |
Robert Fairbairn 1965 | | Trustee (Since 2018) | | Vice Chairman of BlackRock, Inc. since 2019; Member of BlackRock’s Global Executive and Global Operating Committees;Co-Chair of BlackRock’s Human Capital Committee; Senior Managing Director of BlackRock, Inc. from 2010 to 2019; oversaw BlackRock’s Strategic Partner Program and Strategic Product Management Group from 2012 to 2019; Member of the Board of Managers of BlackRock Investments, LLC from 2011 to 2018; Global Head of BlackRock’s Retail and iShares® businesses from 2012 to 2016. | | 123 RICs consisting of 287 Portfolios | | None |
John M. Perlowski (e) 1964 | | Trustee
(Since 2015) President and Chief Executive Officer (Since 2010) | | Managing Director of BlackRock, Inc. since 2009; Head of BlackRock Global Accounting and Product Services since 2009; Advisory Director of Family Resource Network (charitable foundation) since 2009. | | 124 RICs consisting of 288 Portfolios | | None |
(a) The address of each Trustee is c/o BlackRock, Inc.,55 East 52nd Street, New York, New York 10055. (b) Independent Trustees serve until their resignation, retirement, removal or death, or until December 31 of the year in which they turn 75. The Board may determine to extend the terms of Independent Trustees on acase-by-case basis, as appropriate. (c) In connection with the acquisition of Barclays Global Investors by BlackRock, Inc. in December 2009, certain Independent Trustees were elected to the Board. Furthermore, effective January 1, 2019, three BlackRock Fund Complexes were realigned and consolidated into two BlackRock Fund Complexes. As a result, although the chart shows the year that each Independent Trustee joined the Board, certain Independent Trustees first became members of the boards of other BlackRock-advised Funds or legacy BlackRock funds as follows: Bruce R. Bond, 2005; Robert M. Hernandez, 1996; Cynthia A. Montgomery, 1994; Joseph P. Platt, 1999; Kenneth L. Urish, 1999; Lena G. Goldberg, 2016; Henry R. Keizer, 2016; Donald C. Opatrny, 2015. (d) Mr. Fairbairn and Mr. Perlowski are both “interested persons,” as defined in the 1940 Act, of MIP based on their positions with BlackRock, Inc. and its affiliates. Mr. Fairbairn and Mr. Perlowski are also board members of the BlackRock Fixed-Income Complex. (e) Mr. Perlowski is also a trustee of the BlackRock Credit Strategies Fund. |
| | | | |
| TRUSTEEAND OFFICER INFORMATION | | | 35 | |
Trustee and Officer Information (continued)
| | | | |
| Officers Who Are Not Trustees (a) |
| | | |
Name
Year of Birth (b) | | Position(s) Held
(Length of Service) | | Principal Occupation(s) During Past Five Years |
Thomas Callahan 1968 | | Vice President (Since 2016) | | Managing Director of BlackRock, Inc. since 2013; Member of the Board of Managers of BlackRock Investments, LLC (principal underwriter) since 2019 and Managing Director thereof since 2017; Head of BlackRock’s Global Cash Management Business since 2016;Co-Head of the Global Cash Management Business from 2014 to 2016; Deputy Head of the Global Cash Management Business from 2013 to 2014; Member of the Cash Management Group Executive Committee since 2013; Chief Executive Officer of NYSE Liffe U.S. from 2008 to 2013. |
Jennifer McGovern 1977 | | Vice President (Since 2014) | | Managing Director of BlackRock, Inc. since 2016; Director of BlackRock, Inc. from 2011 to 2015; Head of Product Development and Oversight for BlackRock’s Strategic Product Management Group since 2019; Head of Product Structure and Oversight for BlackRock’s U.S. Wealth Advisory Group from 2013 to 2019. |
Neal J. Andrews 1966 | | Chief Financial Officer (Since 2009) | | Chief Financial Officer of the iShares® exchange traded funds since 2019; Managing Director of BlackRock, Inc. since 2006. |
Jay M. Fife 1970 | | Treasurer (Since 2009) | | Managing Director of BlackRock, Inc. since 2007. |
Charles Park 1967 | | Chief Compliance Officer (Since 2014) | | Anti-Money Laundering Compliance Officer for certain BlackRock-advised Funds from 2014 to 2015; Chief Compliance Officer of BlackRock Advisors, LLC and the BlackRock-advised Funds in the BlackRock Multi-Asset Complex and the BlackRock Fixed-Income Complex since 2014; Principal of and Chief Compliance Officer for iShares® Delaware Trust Sponsor LLC since 2012 and BlackRock Fund Advisors (“BFA”) since 2006; Chief Compliance Officer for theBFA-advised iShares® exchange traded funds since 2006; Chief Compliance Officer for BlackRock Asset Management International Inc. since 2012. |
Lisa Belle 1968 | | Anti-Money Laundering Compliance Officer (Since 2019) | | Managing Director of BlackRock, Inc. since 2019; Global Financial Crime Head for Asset and Wealth Management of JP Morgan from 2013 to 2019; Managing Director of RBS Securities from 2012 to 2013; Head of Financial Crimes for Barclays Wealth Americas from 2010 to 2012. |
Janey Ahn 1975 | | Secretary (Since 2019) | | Managing Director of BlackRock, Inc. since 2018; Director of BlackRock, Inc. from 2009 to 2017. |
(a) The address of each Officer is c/o BlackRock, Inc., 55 East 52nd Street, New York, New York 10055. (b) Officers of MIP serve at the pleasure of the Board. |
Further information about MIP’s Trustees and Officers is available in MIP’s Statement of Additional Information, which can be obtained without charge by calling (800)441-7762.
Effective September 19, 2019, Lisa Belle replaced John MacKessy as the Anti-Money Laundering Compliance Officer of MIP.
Effective September 19, 2019, Janey Ahn replaced Benjamin Archibald as the Secretary of MIP.
Effective December 31, 2019, Robert M. Hernandez retired as Trustee of MIP.
Investment Adviser
BlackRock Fund Advisors
San Francisco, CA 94105
Administrator
BlackRock Advisors, LLC
Wilmington, DE 19809
Accounting Agent and Custodian
State Street Bank and Trust Company
Boston, MA 02111
Independent Registered Public Accounting Firm
PricewaterhouseCoopers LLP
Philadelphia, PA 19103
Legal Counsel
Sidley Austin LLP
New York, NY 10019
Address of MIP
400 Howard Street
San Francisco, CA 94105
| | |
| 36 | | 2019 BLACKROCK ANNUAL REPORTTO SHAREHOLDERS |
Additional Information
General Information
Householding
The Master Portfolio will mail only one copy of shareholder documents, including prospectuses, annual and semi-annual reports and proxy statements, to shareholders with multiple accounts at the same address. This practice is commonly called “householding” and is intended to reduce expenses and eliminate duplicate mailings of shareholder documents. Mailings of your shareholder documents may be householded indefinitely unless you instruct us otherwise. If you do not want the mailing of these documents to be combined with those for other members of your household, please call the Master Portfolio at (800) 441-7762.
Availability of Quarterly Schedule of Investments
The Master Portfolio files its complete schedule of portfolio holdings with the SEC for the first and third quarters of each fiscal year as an exhibit to its reports onForm N-PORT, and for reporting periods ended prior to March 31, 2019, filed such information on Form N-Q. The Master Portfolio’s Forms N-PORT and N-Q are available on the SEC’s website at sec.gov. The Master Portfolio’s Form N-Q may also be obtained upon request and without charge by calling(800) 441-7762.
Availability of Proxy Voting Policies and Procedures
A description of the policies and procedures that the Master Portfolio uses to determine how to vote proxies relating to portfolio securities is available upon request and without charge (1) by calling (800) 441-7762; (2) atblackrock.com; and (3) on the SEC’s website at sec.gov.
Availability of Proxy Voting Record
Information about how the Master Portfolio voted proxies relating to securities held in the Master Portfolio’s portfolio during the most recent 12-month period ended June 30 is available upon request and without charge (1) atblackrock.com or by calling (800) 441-7762; and (2) on the SEC’s website at sec.gov.
Glossary of Terms Used in this Report
| | |
| |
| ADR | | American Depositary Receipts |
| |
| GDR | | Global Depositary Receipt |
| |
| NVDR | | Non-voting Depository Receipts |
| |
| PCL | | Public Company Limited |
| |
| REIT | | Real Estate Investment Trust |
| |
| S&P | | Standard & Poor’s |
| | | | |
| ADDITIONAL INFORMATION / GLOSSARYOF TERMS USEDINTHIS REPORT | | | 37 | |
| | |
| Portfolio Information as of December 31, 2019 | | International Tilts Master Portfolio |
TEN LARGEST HOLDINGS
| | | | |
| Security | | Percent of
Net Assets | |
Roche Holding AG | | | 2 | % |
Novartis AG, Registered Shares | | | 2 | |
LVMH Moet Hennessy Louis Vuitton SE | | | 2 | |
SAP SE | | | 2 | |
Nestle SA, Registered Shares | | | 2 | |
GlaxoSmithKline PLC | | | 1 | |
Allianz SE, Registered Shares | | | 1 | |
HSBC Holdings PLC | | | 1 | |
L’Oreal SA | | | 1 | |
Diageo PLC | | | 1 | |
GEOGRAPHIC ALLOCATION
| | | | |
| Country | | Percent of
Net Assets | |
Japan | | | 22 | % |
United Kingdom | | | 15 | |
France | | | 12 | |
Switzerland | | | 10 | |
Germany | | | 10 | |
Australia | | | 8 | |
Netherlands | | | 6 | |
United States | | | 3 | |
Sweden | | | 2 | |
Denmark | | | 2 | |
Finland | | | 2 | |
Spain | | | 2 | |
Hong Kong | | | 2 | |
Belgium | | | 1 | |
Italy | | | 1 | |
Other(a) | | | 2 | |
Other Assets Less Liabilities | | | — | (b) |
| | (a) | Other includes a less than 1% investment in each of the following countries: Austria, China, Ireland, Israel, Luxembourg, Singapore, Macau, Norway, New Zealand, South Africa. | |
| | (b) | Represents less than 1% of Net Assets. | |
Derivative Financial Instruments
International Tilts Master Portfolio (the “Master Portfolio”) may invest in various derivative financial instruments. These instruments are used to obtain exposure to a security, commodity, index, market, and/or other assets without owning or taking physical custody of securities, commodities and/or other referenced assets or to manage market, equity, credit, interest rate, foreign currency exchange rate, commodity and/or other risks. Derivative financial instruments may give rise to a form of economic leverage and involve risks, including the imperfect correlation between the value of a derivative financial instrument and the underlying asset, possible default of the counterparty to the transaction or illiquidity of the instrument. The Master Portfolio’s successful use of a derivative financial instrument depends on the investment adviser’s ability to predict pertinent market movements accurately, which cannot be assured. The use of these instruments may result in losses greater than if they had not been used, may limit the amount of appreciation the Master Portfolio can realize on an investment and/or may result in lower distributions paid to shareholders. The Master Portfolio’s investments in these instruments, if any, are discussed in detail in the Notes to Financial Statements.
| | | | |
| PORTFOLIO INFORMATION / DERIVATIVE FINANCIAL INSTRUMENTS | | | 1 | |
| | |
Schedule of Investments December 31, 2019 | | International Tilts Master Portfolio (Percentages shown are based on Net Assets) |
| | | | | | | | |
| Security | | Shares | | | Value | |
|
Common Stocks — 96.5% | |
|
| Australia — 7.7% | |
AGL Energy Ltd.(a) | | | 18,072 | | | $ | 260,121 | |
ALS Ltd. | | | 21,307 | | | | 137,183 | |
Altium Ltd. | | | 1,559 | | | | 37,987 | |
Ansell Ltd. | | | 17,178 | | | | 349,794 | |
Aristocrat Leisure Ltd. | | | 64,930 | | | | 1,534,241 | |
AusNet Services | | | 122,037 | | | | 145,527 | |
Australia & New Zealand Banking Group Ltd. | | | 39,134 | | | | 674,904 | |
Bendigo & Adelaide Bank Ltd. | | | 9,556 | | | | 65,572 | |
BHP Group Ltd. | | | 46,974 | | | | 1,286,256 | |
BHP Group PLC | | | 297 | | | | 6,960 | |
Brambles Ltd. | | | 9,071 | | | | 74,661 | |
Carsales.com Ltd. | | | 4,386 | | | | 51,149 | |
Challenger Ltd. | | | 4,370 | | | | 24,868 | |
CIMIC Group Ltd. | | | 6,210 | | | | 144,380 | |
Coca-Cola Amatil Ltd. | | | 4,839 | | | | 37,578 | |
Cochlear Ltd. | | | 3,450 | | | | 543,741 | |
Commonwealth Bank of Australia | | | 20,542 | | | | 1,152,361 | |
Computershare Ltd. | | | 19,439 | | | | 229,184 | |
Crown Resorts Ltd. | | | 4,738 | | | | 39,947 | |
CSL Ltd. | | | 5,245 | | | | 1,016,911 | |
Domino’s Pizza Enterprises Ltd. | | | 606 | | | | 22,274 | |
Goodman Group | | | 1,153 | | | | 10,835 | |
IDP Education Ltd. | | | 17,634 | | | | 212,566 | |
Macquarie Group Ltd. | | | 9,794 | | | | 948,493 | |
Magellan Financial Group Ltd. | | | 6,484 | | | | 259,781 | |
Orica Ltd. | | | 12,137 | | | | 187,158 | |
Orora Ltd. | | | 18 | | | | 40 | |
Platinum Asset Management Ltd. | | | 23 | | | | 73 | |
QBE Insurance Group Ltd. | | | 6,579 | | | | 59,451 | |
REA Group Ltd.(a) | | | 4,796 | | | | 348,414 | |
Rio Tinto PLC | | | 3,118 | | | | 184,570 | |
Scentre Group(a) | | | 519,185 | | | | 1,397,259 | |
Sonic Healthcare Ltd. | | | 2,765 | | | | 55,750 | |
Spark Infrastructure Group(b) | | | 34,941 | | | | 51,223 | |
Tabcorp Holdings Ltd. | | | 61,609 | | | | 195,861 | |
Treasury Wine Estates Ltd. | | | 72,128 | | | | 821,591 | |
Vicinity Centres | | | 8,553 | | | | 14,960 | |
Westpac Banking Corp. | | | 51,591 | | | | 881,006 | |
WiseTech Global Ltd.(a) | | | 788 | | | | 12,941 | |
| | | | | | | | |
| | | | 13,477,571 | |
|
| Austria — 0.1% | |
Raiffeisen Bank International AG | | | 1,742 | | | | 43,602 | |
Vienna Insurance Group AG Wiener Versicherung Gruppe | | | 1,945 | | | | 55,098 | |
Wienerberger AG | | | 4,765 | | | | 141,212 | |
| | | | | | | | |
| | | | 239,912 | |
|
| Belgium — 0.9% | |
Ackermans & van Haaren NV | | | 87 | | | | 13,642 | |
Galapagos NV(c) | | | 486 | | | | 101,208 | |
Groupe Bruxelles Lambert SA | | | 5,149 | | | | 543,327 | |
Solvay SA | | | 2,950 | | | | 343,359 | |
UCB SA | | | 8,067 | | | | 641,928 | |
| | | | | | | | |
| | | | 1,643,464 | |
|
| China — 0.4% | |
BOC Hong Kong Holdings Ltd. | | | 224,500 | | | | 779,335 | |
| | | | | | | | |
|
| Denmark — 2.4% | |
Carlsberg A/S, Class B | | | 6,281 | | | | 937,351 | |
Chr Hansen Holding A/S | | | 15,798 | | | | 1,255,426 | |
Coloplast A/S, Class B | | | 678 | | | | 84,113 | |
FLSmidth & Co. A/S | | | 3,018 | | | | 120,354 | |
Genmab A/S(c) | | | 740 | | | | 164,579 | |
GN Store Nord A/S | | | 7,035 | | | | 330,931 | |
| | | | | | | | |
| Security | | Shares | | | Value | |
|
| Denmark (continued) | |
H Lundbeck A/S | | | 3,396 | | | $ | 129,831 | |
Novo Nordisk A/S, Class B | | | 2,217 | | | | 128,473 | |
Novozymes A/S, Class B | | | 263 | | | | 12,870 | |
Royal Unibrew A/S | | | 2,767 | | | | 253,454 | |
SimCorp A/S | | | 6,362 | | | | 723,405 | |
Tryg A/S | | | 1,885 | | | | 55,883 | |
| | | | | | | | |
| | | | 4,196,670 | |
|
| Finland — 2.3% | |
Fortum OYJ | | | 32,720 | | | | 807,641 | |
Huhtamaki OYJ | | | 886 | | | | 41,125 | |
Kone OYJ, Class B | | | 26,455 | | | | 1,729,835 | |
Metso OYJ | | | 865 | | | | 34,172 | |
Nordea Bank Abp | | | 37,458 | | | | 303,042 | |
Sampo OYJ, Class A | | | 13,745 | | | | 600,149 | |
TietoEVRY OYJ | | | 2,135 | | | | 66,385 | |
UPM-Kymmene OYJ | | | 8,396 | | | | 291,295 | |
Valmet OYJ | | | 7,149 | | | | 171,432 | |
| | | | | | | | |
| | | | 4,045,076 | |
|
| France — 11.8% | |
Air Liquide SA | | | 1,460 | | | | 206,985 | |
Arkema SA | | | 343 | | | | 36,676 | |
BNP Paribas SA | | | 2,031 | | | | 120,719 | |
Bouygues SA | | | 9,998 | | | | 426,184 | |
Capgemini SE | | | 865 | | | | 105,794 | |
Christian Dior SE | | | 2,229 | | | | 1,145,686 | |
Cie de Saint-Gobain | | | 1,730 | | | | 70,871 | |
CNP Assurances | | | 3,059 | | | | 60,951 | |
Credit Agricole SA | | | 25,912 | | | | 377,054 | |
Dassault Aviation SA | | | 55 | | | | 72,181 | |
Dassault Systemes SE | | | 5,780 | | | | 953,268 | |
Edenred | | | 8,286 | | | | 429,417 | |
Electricite de France SA | | | 2,647 | | | | 29,536 | |
Engie SA | | | 29,222 | | | | 473,347 | |
EssilorLuxottica SA | | | 3,378 | | | | 516,434 | |
Gaztransport Et Technigaz SA | | | 2 | | | | 193 | |
Hermes International | | | 138 | | | | 103,377 | |
Imerys SA | | | 1,707 | | | | 72,458 | |
Ingenico Group SA | | | 224 | | | | 24,366 | |
Kering SA | | | 213 | | | | 140,349 | |
Korian SA | | | 435 | | | | 20,506 | |
L’Oreal SA | | | 7,530 | | | | 2,226,677 | |
Lagardere SCA | | | 14,331 | | | | 312,339 | |
Legrand SA | | | 1,299 | | | | 106,081 | |
LVMH Moet Hennessy Louis Vuitton SE | | | 6,239 | | | | 2,907,085 | |
Natixis SA | | | 9,611 | | | | 42,812 | |
Nexity SA | | | 1,020 | | | | 51,267 | |
Pernod Ricard SA | | | 10,151 | | | | 1,816,395 | |
Peugeot SA | | | 6,777 | | | | 163,171 | |
Publicis Groupe SA | | | 11,002 | | | | 498,846 | |
Renault SA | | | 6,362 | | | | 302,115 | |
Rexel SA | | | 40,292 | | | | 535,911 | |
Rubis SCA | | | 1,350 | | | | 83,074 | |
Safran SA | | | 12,564 | | | | 1,940,626 | |
Sanofi | | | 2,822 | | | | 283,406 | |
Sartorius Stedim Biotech | | | 819 | | | | 135,944 | |
Schneider Electric SE | | | 4,535 | | | | 465,925 | |
SCOR SE | | | 8,374 | | | | 352,510 | |
SPIE SA | | | 1,066 | | | | 21,787 | |
Teleperformance | | | 1,654 | | | | 404,102 | |
TOTAL SA | | | 27,606 | | | | 1,531,871 | |
Veolia Environnement SA | | | 15,778 | | | | 419,827 | |
Vinci SA | | | 6,542 | | | | 728,606 | |
Wendel SA | | | 88 | | | | 11,722 | |
| | | | | | | | |
| | | | 20,728,451 | |
| | |
| 2 | | 2019 BLACKROCK ANNUAL REPORTTO SHAREHOLDERS |
| | |
Schedule of Investments (continued) December 31, 2019 | | International Tilts Master Portfolio (Percentages shown are based on Net Assets) |
| | | | | | | | |
| Security | | Shares | | | Value | |
|
| Germany — 9.1% | |
adidas AG | | | 1,746 | | | $ | 567,570 | |
Allianz SE, Registered Shares | | | 9,485 | | | | 2,324,089 | |
alstria officeREIT-AG | | | 1,037 | | | | 19,484 | |
Aroundtown SA | | | 13,734 | | | | 123,356 | |
BASF SE | | | 9,492 | | | | 715,095 | |
Bayer AG, Registered Shares | | | 6,454 | | | | 524,688 | |
Bayerische Motoren Werke AG | | | 13,003 | | | | 1,065,020 | |
CANCOM SE | | | 831 | | | | 48,832 | |
Carl Zeiss Meditec AG, Bearer Shares | | | 1,420 | | | | 180,524 | |
CompuGroup Medical SE | | | 2,259 | | | | 161,537 | |
Continental AG | | | 5,398 | | | | 697,585 | |
Covestro AG(d) | | | 460 | | | | 21,404 | |
CTS Eventim AG & Co. KGaA | | | 3,465 | | | | 217,406 | |
Daimler AG, Registered Shares | | | 4,716 | | | | 260,721 | |
Deutsche Pfandbriefbank AG(d) | | | 18,415 | | | | 299,918 | |
Deutsche Post AG, Registered Shares | | | 47,030 | | | | 1,788,276 | |
DWS Group GmbH & Co. KGaA(d) | | | 458 | | | | 16,262 | |
Evonik Industries AG | | | 1,625 | | | | 49,631 | |
Fielmann AG | | | 136 | | | | 10,977 | |
Freenet AG | | | 6,222 | | | | 142,655 | |
GEA Group AG | | | 2,036 | | | | 67,326 | |
HeidelbergCement AG | | | 769 | | | | 55,879 | |
Hella GmbH & Co. KGaA | | | 351 | | | | 19,397 | |
Hochtief AG | | | 860 | | | | 109,492 | |
Jenoptik AG | | | 2 | | | | 57 | |
Merck KGaA | | | 4,675 | | | | 551,153 | |
MTU Aero Engines AG | | | 50 | | | | 14,246 | |
Puma SE | | | 1,506 | | | | 115,483 | |
Rational AG | | | 435 | | | | 348,486 | |
SAP SE | | | 21,551 | | | | 2,900,724 | |
Siemens AG, Registered Shares | | | 8,416 | | | | 1,099,058 | |
Software AG | | | 12,417 | | | | 432,329 | |
Stroeer SE & Co. KGaA | | | 220 | | | | 17,725 | |
TAG Immobilien AG(c) | | | 1,537 | | | | 38,172 | |
Talanx AG(c) | | | 395 | | | | 19,549 | |
Telefonica Deutschland Holding AG | | | 193,041 | | | | 559,524 | |
Uniper SE | | | 2,343 | | | | 77,440 | |
Volkswagen AG | | | 2,184 | | | | 423,008 | |
| | | | | | | | |
| | | | 16,084,078 | |
|
| Hong Kong — 1.7% | |
AIA Group Ltd. | | | 40,600 | | | | 427,029 | |
ASM Pacific Technology Ltd. | | | 1,700 | | | | 23,597 | |
CK Asset Holdings Ltd. | | | 8,000 | | | | 57,730 | |
CLP Holdings Ltd. | | | 9,500 | | | | 99,725 | |
Hang Lung Group Ltd. | | | 5,000 | | | | 12,369 | |
Henderson Land Development Co. Ltd. | | | 39,404 | | | | 193,358 | |
HKT Trust & HKT Ltd.(b) | | | 36,000 | | | | 50,734 | |
Hongkong Land Holdings Ltd. | | | 109,900 | | | | 632,151 | |
Kerry Properties Ltd. | | | 74,500 | | | | 236,618 | |
Swire Pacific Ltd., Class A | | | 61,000 | | | | 566,671 | |
Swire Properties Ltd. | | | 61,800 | | | | 204,734 | |
Techtronic Industries Co. Ltd.(a) | | | 32,000 | | | | 261,174 | |
Wheelock & Co. Ltd. | | | 47,000 | | | | 313,315 | |
| | | | | | | | |
| | | | 3,079,205 | |
|
| Ireland — 0.1% | |
Kingspan Group PLC | | | 1,899 | | | | 115,984 | |
Smurfit Kappa Group PLC | | | 1,925 | | | | 74,223 | |
UDG Healthcare PLC | | | 6,843 | | | | 73,162 | |
| | | | | | | | |
| | | | 263,369 | |
|
| Israel — 0.1% | |
Bank LeumiLe-Israel BM | | | 17,252 | | | | 125,818 | |
Delek Group Ltd. | | | 98 | | | | 14,926 | |
First International Bank of Israel Ltd. | | | 1,166 | | | | 33,771 | |
| | | | | | | | |
| Security | | Shares | | | Value | |
|
| Israel (continued) | |
Gazit-Globe Ltd. | | | 1,345 | | | $ | 14,908 | |
Israel Chemicals Ltd.(a) | | | 9,734 | | | | 45,969 | |
| | | | | | | | |
| | | | 235,392 | |
|
| Italy — 0.8% | |
A2A SpA | | | 17,064 | | | | 32,044 | |
Ferrari NV | | | 7,422 | | | | 1,232,316 | |
Interpump Group SpA | | | 1,105 | | | | 35,003 | |
Italgas SpA | | | 5,611 | | | | 34,304 | |
Mediobanca Banca di Credito Finanziario SpA | | | 2,388 | | | | 26,293 | |
| | | | | | | | |
| | | | 1,359,960 | |
|
| Japan — 22.4% | |
Advantest Corp. | | | 1,900 | | | | 107,156 | |
AEON Financial Service Co. Ltd. | | | 600 | | | | 9,454 | |
AGC, Inc. | | | 8,400 | | | | 300,367 | |
Aica Kogyo Co. Ltd. | | | 600 | | | | 19,799 | |
Aisin Seiki Co. Ltd. | | | 1,000 | | | | 37,040 | |
Amada Holdings Co. Ltd. | | | 24,700 | | | | 280,931 | |
Amano Corp. | | | 400 | | | | 12,189 | |
Aozora Bank Ltd. | | | 5,300 | | | | 140,019 | |
Astellas Pharma, Inc. | | | 24,600 | | | | 419,922 | |
Benesse Holdings, Inc. | | | 6,600 | | | | 173,479 | |
Calbee, Inc. | | | 700 | | | | 22,807 | |
Canon, Inc.(a) | | | 13,700 | | | | 374,948 | |
Central Japan Railway Co. | | | 2,100 | | | | 422,244 | |
Chubu Electric Power Co., Inc. | | | 9,900 | | | | 139,945 | |
Citizen Watch Co. Ltd.(a) | | | 41,700 | | | | 227,102 | |
Dai-ichi Life Holdings, Inc. | | | 54,000 | | | | 889,935 | |
Daicel Corp. | | | 7,700 | | | | 73,615 | |
Daikin Industries Ltd. | | | 4,200 | | | | 592,577 | |
Daito Trust Construction Co. Ltd. | | | 2,300 | | | | 284,225 | |
Denka Co. Ltd. | | | 3,200 | | | | 95,128 | |
Denso Corp. | | | 9,100 | | | | 410,977 | |
Dentsu, Inc. | | | 3,700 | | | | 127,487 | |
DIC Corp. | | | 6,900 | | | | 190,429 | |
Dip Corp. | | | 500 | | | | 14,770 | |
DMG Mori Co. Ltd. | | | 1,300 | | | | 19,890 | |
East Japan Railway Co. | | | 5,200 | | | | 469,362 | |
Eisai Co. Ltd. | | | 4,400 | | | | 329,234 | |
Electric Power Development Co. Ltd. | | | 4,500 | | | | 109,227 | |
Fancl Corp. | | | 1,200 | | | | 31,949 | |
FANUC Corp. | | | 200 | | | | 36,933 | |
Fast Retailing Co. Ltd.(a) | | | 2,900 | | | | 1,722,814 | |
Fuji Electric Co. Ltd. | | | 400 | | | | 12,151 | |
Fuji Media Holdings, Inc. | | | 2,500 | | | | 35,496 | |
Fuji Seal International, Inc. | | | 500 | | | | 11,090 | |
FUJIFILM Holdings Corp. | | | 7,200 | | | | 343,842 | |
Fujikura Ltd. | | | 2,500 | | | | 10,287 | |
Furukawa Electric Co. Ltd. | | | 500 | | | | 12,800 | |
Glory Ltd. | | | 1,000 | | | | 30,219 | |
GS Yuasa Corp. | | | 1,100 | | | | 23,710 | |
Honda Motor Co. Ltd. | | | 20,500 | | | | 580,182 | |
Hoshizaki Corp. | | | 1,300 | | | | 115,908 | |
Idemitsu Kosan Co. Ltd. | | | 500 | | | | 13,816 | |
Isetan Mitsukoshi Holdings Ltd.(a) | | | 9,200 | | | | 82,613 | |
Isuzu Motors Ltd. | | | 5,900 | | | | 69,743 | |
Izumi Co. Ltd. | | | 2,100 | | | | 75,639 | |
Japan Airlines Co. Ltd. | | | 8,800 | | | | 273,996 | |
Japan Post Bank Co. Ltd. | | | 12,400 | | | | 118,975 | |
Japan Post Holdings Co. Ltd. | | | 41,500 | | | | 390,285 | |
Japan Post Insurance Co. Ltd. | | | 600 | | | | 10,228 | |
Japan Tobacco, Inc. | | | 14,900 | | | | 332,219 | |
JFE Holdings, Inc. | | | 19,500 | | | | 250,213 | |
JSR Corp. | | | 2,600 | | | | 47,561 | |
| | | | |
| SCHEDULES OF INVESTMENTS | | | 3 | |
| | |
Schedule of Investments (continued) December 31, 2019 | | International Tilts Master Portfolio (Percentages shown are based on Net Assets) |
| | | | | | | | |
| Security | | Shares | | | Value | |
|
| Japan (continued) | |
JTEKT Corp. | | | 15,300 | | | $ | 180,740 | |
JXTG Holdings, Inc. | | | 152,650 | | | | 692,814 | |
Kajima Corp. | | | 14,100 | | | | 187,462 | |
Kakaku.com, Inc. | | | 6,400 | | | | 163,412 | |
Kaneka Corp. | | | 8,900 | | | | 285,034 | |
Kansai Electric Power Co., Inc. | | | 7,400 | | | | 85,728 | |
Kao Corp. | | | 20,600 | | | | 1,698,986 | |
Kawasaki Heavy Industries Ltd. | | | 2,100 | | | | 45,899 | |
KDDI Corp. | | | 28,400 | | | | 847,352 | |
Kewpie Corp. | | | 500 | | | | 11,234 | |
Keyence Corp. | | | 1,000 | | | | 351,138 | |
Kirin Holdings Co. Ltd. | | | 29,200 | | | | 637,336 | |
Kobe Steel Ltd. | | | 12,300 | | | | 65,905 | |
Komatsu Ltd.(a) | | | 6,600 | | | | 158,409 | |
Konami Holdings Corp. | | | 1,600 | | | | 65,748 | |
Konica Minolta, Inc. | | | 36,800 | | | | 239,718 | |
Kyowa Exeo Corp. | | | 500 | | | | 12,648 | |
Lintec Corp. | | | 4,300 | | | | 95,729 | |
Mabuchi Motor Co. Ltd. | | | 700 | | | | 26,429 | |
Marubeni Corp. | | | 31,100 | | | | 229,778 | |
Maruha Nichiro Corp. | | | 400 | | | | 10,240 | |
Maruichi Steel Tube Ltd. | | | 500 | | | | 14,051 | |
Mazda Motor Corp. | | | 23,800 | | | | 202,810 | |
MEIJI Holdings Co. Ltd. | | | 1,800 | | | | 121,644 | |
Miraca Holdings, Inc. | | | 4,600 | | | | 112,668 | |
Mitsubishi Corp. | | | 4,600 | | | | 121,860 | |
Mitsubishi Electric Corp. | | | 12,500 | | | | 170,196 | |
Mitsubishi Gas Chemical Co., Inc. | | | 17,900 | | | | 272,692 | |
Mitsubishi Heavy Industries Ltd. | | | 9,200 | | | | 356,747 | |
Mitsubishi Motors Corp. | | | 59,500 | | | | 248,012 | |
Mitsubishi UFJ Financial Group, Inc. | | | 221,000 | | | | 1,194,800 | |
Mitsui Chemicals, Inc. | | | 3,400 | | | | 82,822 | |
Mitsui Mining & Smelting Co. Ltd. | | | 600 | | | | 15,912 | |
Mizuho Financial Group, Inc. | | | 140,500 | | | | 216,429 | |
MS&AD Insurance Group Holdings, Inc. | | | 23,300 | | | | 769,102 | |
Nagase & Co. Ltd. | | | 600 | | | | 8,898 | |
NEC Corp. | | | 2,100 | | | | 86,907 | |
NGK Spark Plug Co. Ltd. | | | 600 | | | | 11,630 | |
Nichirei Corp. | | | 1,100 | | | | 25,696 | |
Nidec Corp. | | | 3,500 | | | | 478,043 | |
Nifco, Inc. | | | 500 | | | | 13,655 | |
Nihon Kohden Corp. | | | 600 | | | | 16,640 | |
Nikon Corp.(a) | | | 9,100 | | | | 111,290 | |
Nintendo Co. Ltd. | | | 1,200 | | | | 479,952 | |
Nippon Electric Glass Co. Ltd. | | | 10,500 | | | | 233,099 | |
Nippon Shokubai Co. Ltd. | | | 900 | | | | 55,772 | |
Nippon Television Holdings, Inc. | | | 1,700 | | | | 22,680 | |
Nissan Chemical Corp. | | | 4,400 | | | | 184,262 | |
Nissan Motor Co. Ltd. | | | 121,200 | | | | 702,322 | |
Nitori Holdings Co. Ltd. | | | 1,100 | | | | 173,636 | |
Nitto Denko Corp. | | | 5,100 | | | | 286,762 | |
NOK Corp. | | | 1,200 | | | | 17,899 | |
NTN Corp.(a) | | | 35,500 | | | | 111,012 | |
NTT Data Corp. | | | 12,600 | | | | 168,512 | |
Oji Holdings Corp. | | | 36,200 | | | | 195,769 | |
Ono Pharmaceutical Co. Ltd. | | | 4,100 | | | | 93,604 | |
Otsuka Corp. | | | 300 | | | | 11,980 | |
Otsuka Holdings Co. Ltd.(a) | | | 11,500 | | | | 512,604 | |
Park24 Co. Ltd. | | | 400 | | | | 9,794 | |
PeptiDream, Inc.(c) | | | 1,000 | | | | 51,103 | |
Persol Holdings Co. Ltd. | | | 1,800 | | | | 33,734 | |
Pola Orbis Holdings, Inc.(a) | | | 18,100 | | | | 431,125 | |
Recruit Holdings Co. Ltd. | | | 33,100 | | | | 1,239,771 | |
Rengo Co. Ltd. | | | 1,400 | | | | 10,666 | |
| | | | | | | | |
| Security | | Shares | | | Value | |
|
| Japan (continued) | |
Resona Holdings, Inc. | | | 115,200 | | | $ | 502,102 | |
Sanwa Holdings Corp. | | | 4,100 | | | | 45,944 | |
SCSK Corp. | | | 700 | | | | 36,298 | |
Secom Co. Ltd. | | | 5,000 | | | | 446,213 | |
Seino Holdings Co Ltd. | | | 700 | | | | 9,457 | |
Seria Co. Ltd. | | | 400 | | | | 10,897 | |
Seven & i Holdings Co. Ltd. | | | 21,900 | | | | 802,753 | |
Shimadzu Corp. | | | 4,000 | | | | 125,093 | |
Shimizu Corp. | | | 9,900 | | | | 100,850 | |
Shin-Etsu Chemical Co. Ltd. | | | 100 | | | | 10,997 | |
Shionogi & Co. Ltd. | | | 8,000 | | | | 494,892 | |
SMC Corp. | | | 400 | | | | 182,926 | |
Sojitz Corp. | | | 8,000 | | | | 25,785 | |
Sompo Holdings, Inc. | | | 900 | | | | 35,343 | |
Subaru Corp. | | | 7,100 | | | | 175,866 | |
Sumitomo Chemical Co. Ltd.(a) | | | 52,100 | | | | 236,563 | |
Sumitomo Heavy Industries Ltd. | | | 3,900 | | | | 110,779 | |
Sumitomo Mitsui Financial Group, Inc. | | | 29,400 | | | | 1,085,899 | |
Sumitomo Mitsui Trust Holdings, Inc. | | | 6,200 | | | | 245,092 | |
Sumitomo Realty & Development Co. Ltd. | | | 300 | | | | 10,467 | |
Sumitomo Rubber Industries Ltd. | | | 8,600 | | | | 104,866 | |
Sundrug Co. Ltd. | | | 5,900 | | | | 213,473 | |
Suntory Beverage & Food Ltd. | | | 6,800 | | | | 283,891 | |
T&D Holdings, Inc. | | | 43,900 | | | | 555,147 | |
Taisei Corp. | | | 6,900 | | | | 285,805 | |
Taisho Pharmaceutical Holdings Co. Ltd. | | | 200 | | | | 14,759 | |
Takeda Pharmaceutical Co. Ltd. | | | 43,800 | | | | 1,732,386 | |
TIS, Inc. | | | 400 | | | | 23,645 | |
Tokio Marine Holdings, Inc. | | | 9,000 | | | | 503,899 | |
Tokyo Electron Ltd. | | | 4,500 | | | | 982,485 | |
Topcon Corp. | | | 600 | | | | 7,755 | |
Toshiba Corp. | | | 3,200 | | | | 108,614 | |
Toyota Motor Corp. | | | 13,100 | | | | 923,045 | |
Trend Micro, Inc. | | | 7,000 | | | | 358,189 | |
TS Tech Co. Ltd. | | | 5,300 | | | | 164,507 | |
TV Asahi Holdings Corp. | | | 600 | | | | 11,079 | |
Ube Industries Ltd.(a) | | | 23,100 | | | | 500,305 | |
Ulvac, Inc. | | | 500 | | | | 19,732 | |
Yakult Honsha Co. Ltd. | | | 600 | | | | 33,068 | |
Yamaguchi Financial Group, Inc. | | | 4,800 | | | | 32,462 | |
Yamaha Motor Co. Ltd. | | | 10,800 | | | | 216,356 | |
Yamato Holdings Co. Ltd. | | | 17,800 | | | | 303,483 | |
Yamato Kogyo Co. Ltd. | | | 400 | | | | 10,016 | |
Yokogawa Electric Corp. | | | 3,900 | | | | 68,488 | |
Z Holdings Corp. | | | 93,200 | | | | 393,501 | |
Zenkoku Hosho Co. Ltd. | | | 2,900 | | | | 123,141 | |
Zeon Corp. | | | 11,900 | | | | 148,090 | |
| | | | | | | | |
| | | | 39,513,631 | |
|
| Luxembourg — 0.1% | |
APERAM SA | | | 2,337 | | | | 75,071 | |
RTL Group SA | | | 1,696 | | | | 83,565 | |
| | | | | | | | |
| | | | 158,636 | |
|
| Macau — 0.2% | |
Sands China Ltd. | | | 51,600 | | | | 275,702 | |
| | | | | | | | |
|
| Netherlands — 5.6% | |
ABN AMRO Group NV CVA(d) | | | 51,585 | | | | 940,205 | |
Aegon NV | | | 280,480 | | | | 1,283,926 | |
Akzo Nobel NV | | | 5,073 | | | | 518,075 | |
ASM International NV | | | 3,185 | | | | 359,499 | |
ASML Holding NV | | | 1,403 | | | | 415,367 | |
ASR Nederland NV | | | 18,785 | | | | 703,977 | |
Euronext NV(d) | | | 1,703 | | | | 139,203 | |
ING Groep NV | | | 99,534 | | | | 1,196,638 | |
| | |
| 4 | | 2019 BLACKROCK ANNUAL REPORTTO SHAREHOLDERS |
| | |
Schedule of Investments (continued) December 31, 2019 | | International Tilts Master Portfolio (Percentages shown are based on Net Assets) |
| | | | | | | | |
| Security | | Shares | | | Value | |
|
| Netherlands (continued) | |
NN Group NV | | | 39,342 | | | $ | 1,495,892 | |
Royal Dutch Shell PLC, B Shares | | | 38,859 | | | | 1,153,477 | |
Royal Dutch Shell PLC, Class A | | | 53,808 | | | | 1,593,482 | |
Wolters Kluwer NV | | | 678 | | | | 49,504 | |
| | | | | | | | |
| | | | 9,849,245 | |
|
| New Zealand — 0.1% | |
Contact Energy Ltd. | | | 1,970 | | | | 9,463 | |
Vector Ltd. | | | 5,687 | | | | 14,286 | |
Xero Ltd.(c) | | | 1,303 | | | | 73,205 | |
| | | | | | | | |
| | | | 96,954 | |
|
| Norway — 0.1% | |
Aker Solutions ASA(c) | | | 13 | | | | 37 | |
DNB ASA | | | 10,926 | | | | 204,457 | |
Dolphin Drilling ASA(c)(e) | | | 8 | | | | 1 | |
| | | | | | | | |
| | | | 204,495 | |
|
| Singapore — 0.4% | |
CapitaLand Mall Trust | | | 7,600 | | | | 13,912 | |
DBS Group Holdings Ltd. | | | 19,100 | | | | 368,272 | |
Singapore Technologies Engineering Ltd. | | | 44,200 | | | | 129,446 | |
Suntec Real Estate Investment Trust | | | 147,200 | | | | 201,508 | |
| | | | | | | | |
| | | | 713,138 | |
|
| South Africa — 0.1% | |
Anglo American PLC | | | 5,216 | | | | 149,845 | |
| | | | | | | | |
|
| Spain — 1.8% | |
Acerinox SA | | | 11,486 | | | | 129,788 | |
ACS Actividades de Construccion y Servicios SA | | | 12,784 | | | | 512,819 | |
Amadeus IT Group SA | | | 6,385 | | | | 522,911 | |
Banco Bilbao Vizcaya Argentaria SA | | | 46,693 | | | | 262,150 | |
CaixaBank SA | | | 60,608 | | | | 190,858 | |
CIE Automotive SA | | | 426 | | | | 10,110 | |
Grifols SA | | | 3,259 | | | | 115,145 | |
Mediaset Espana Comunicacion SA | | | 9 | | | | 57 | |
Telefonica SA | | | 197,089 | | | | 1,378,263 | |
| | | | | | | | |
| | | | 3,122,101 | |
|
| Sweden — 2.5% | |
Assa Abloy AB, Class B | | | 42,012 | | | | 982,049 | |
Investor AB, Class B | | | 16,641 | | | | 908,495 | |
Kinnevik AB | | | 24,711 | | | | 605,544 | |
SSAB AB, A Shares | | | 25,106 | | | | 88,216 | |
Telia Co. AB | | | 2 | | | | 9 | |
Volvo AB, Class B | | | 104,755 | | | | 1,753,723 | |
| | | | | | | | |
| | | | 4,338,036 | |
|
| Switzerland — 10.3% | |
Banque Cantonale Vaudoise, Registered Shares | | | 69 | | | | 56,324 | |
Bucher Industries AG, Registered Shares | | | 426 | | | | 149,508 | |
Cie Financiere Richemont SA, Registered Shares | | | 5,635 | | | | 440,380 | |
Clariant AG, Registered Shares(c) | | | 1,140 | | | | 25,477 | |
Dufry AG, Registered Shares(c) | | | 1,408 | | | | 139,619 | |
Flughafen Zuerich AG, Registered Shares | | | 1,079 | | | | 196,950 | |
Galenica AG(c)(d) | | | 1,572 | | | | 97,089 | |
Geberit AG, Registered Shares | | | 526 | | | | 295,234 | |
Givaudan SA, Registered Shares | | | 193 | | | | 604,668 | |
LafargeHolcim Ltd., Registered Shares(c) | | | 31,401 | | | | 1,742,048 | |
Logitech International SA, Registered Shares | | | 21,987 | | | | 1,041,585 | |
Nestle SA, Registered Shares | | | 24,586 | | | | 2,661,808 | |
Novartis AG, Registered Shares | | | 34,823 | | | | 3,297,375 | |
Pargesa Holding SA, Bearer Shares | | | 1,568 | | | | 130,271 | |
PSP Swiss Property AG, Registered Shares | | | 649 | | | | 89,610 | |
Roche Holding AG | | | 12,508 | | | | 4,065,133 | |
Schindler Holding AG, Participation Certificates | | | 358 | | | | 91,040 | |
Sika AG, Registered Shares | | | 1,999 | | | | 375,403 | |
| | | | | | | | |
| Security | | Shares | | | Value | |
|
| Switzerland (continued) | |
Straumann Holding AG, Registered Shares | | | 707 | | | $ | 693,519 | |
Sunrise Communications Group AG(c)(d) | | | 8,213 | | | | 645,235 | |
UBS Group AG, Registered Shares(c) | | | 50,260 | | | | 634,250 | |
Zurich Insurance Group AG | | | 1,825 | | | | 748,614 | |
| | | | | | | | |
| | | | 18,221,140 | |
|
| United Kingdom — 15.2% | |
Ashtead Group PLC | | | 15,252 | | | | 487,678 | |
Associated British Foods PLC | | | 1 | | | | 34 | |
AstraZeneca PLC | | | 12,613 | | | | 1,262,460 | |
Auto Trader Group PLC(d) | | | 74,921 | | | | 591,662 | |
Aviva PLC | | | 8,203 | | | | 45,531 | |
Bellway PLC | | | 2,299 | | | | 116,036 | |
boohoo Group PLC(c) | | | 11,269 | | | | 44,467 | |
BP PLC | | | 172,543 | | | | 1,085,434 | |
British American Tobacco PLC | | | 47,293 | | | | 2,010,050 | |
British Land Co. PLC | | | 31,182 | | | | 263,848 | |
Britvic PLC | | | 1,502 | | | | 18,001 | |
Centrica PLC | | | 239,078 | | | | 282,798 | |
Cineworld Group PLC(a) | | | 12,915 | | | | 37,448 | |
CK Hutchison Holdings Ltd. | | | 81,000 | | | | 772,374 | |
Compass Group PLC | | | 56,429 | | | | 1,414,211 | |
DCC PLC | | | 1,719 | | | | 149,104 | |
Dechra Pharmaceuticals PLC | | | 2,288 | | | | 87,974 | |
Diageo PLC | | | 51,045 | | | | 2,150,866 | |
Direct Line Insurance Group PLC | | | 46,147 | | | | 190,935 | |
Electrocomponents PLC | | | 3,010 | | | | 27,072 | |
Experian PLC | | | 50,774 | | | | 1,721,211 | |
GlaxoSmithKline PLC | | | 110,795 | | | | 2,603,353 | |
Great Portland Estates PLC | | | 2,381 | | | | 27,176 | |
Greggs PLC | | | 5,847 | | | | 178,347 | |
Halma PLC | | | 3,383 | | | | 94,733 | |
Hargreaves Lansdown PLC | | | 835 | | | | 21,419 | |
HomeServe PLC | | | 14,146 | | | | 236,846 | |
Howden Joinery Group PLC | | | 8,898 | | | | 79,274 | |
HSBC Holdings PLC | | | 295,736 | | | | 2,315,150 | |
IG Group Holdings PLC | | | 27,122 | | | | 249,684 | |
Imperial Brands PLC | | | 3,590 | | | | 88,818 | |
Intertek Group PLC | | | 5,533 | | | | 428,742 | |
ITV PLC | | | 41,996 | | | | 84,025 | |
J. Sainsbury PLC | | | 120,997 | | | | 368,950 | |
JD Sports Fashion PLC | | | 25,596 | | | | 284,310 | |
John Wood Group PLC | | | 5,538 | | | | 29,372 | |
Lloyds Banking Group PLC | | | 648,664 | | | | 537,367 | |
London Stock Exchange Group PLC | | | 430 | | | | 44,192 | |
Man Group PLC | | | 34,488 | | | | 72,230 | |
Moneysupermarket.com Group PLC | | | 38,392 | | | | 168,534 | |
National Grid PLC | | | 55,987 | | | | 699,679 | |
Pearson PLC | | | 9,814 | | | | 82,910 | |
Pennon Group PLC | | | 3,893 | | | | 52,803 | |
Prudential PLC | | | 1,331 | | | | 25,503 | |
Reckitt Benckiser Group PLC | | | 1,915 | | | | 155,552 | |
RELX PLC | | | 14,383 | | | | 363,075 | |
Rentokil Initial PLC | | | 29,844 | | | | 178,872 | |
Rightmove PLC | | | 21,699 | | | | 182,079 | |
Rotork PLC | | | 3,418 | | | | 15,194 | |
Royal Mail PLC | | | 38,677 | | | | 116,320 | |
Severn Trent PLC | | | 8,921 | | | | 297,191 | |
SSP Group PLC | | | 26,738 | | | | 230,198 | |
Subsea 7 SA | | | 5,937 | | | | 71,025 | |
Taylor Wimpey PLC | | | 5,871 | | | | 15,054 | |
Unilever NV | | | 17,300 | | | | 992,859 | |
Unilever PLC | | | 10,726 | | | | 613,984 | |
Vodafone Group PLC | | | 598,171 | | | | 1,161,273 | |
WH Smith PLC | | | 2,492 | | | | 85,884 | |
| | | | |
| SCHEDULES OF INVESTMENTS | | | 5 | |
| | |
Schedule of Investments (continued) December 31, 2019 | | International Tilts Master Portfolio (Percentages shown are based on Net Assets) |
| | | | | | | | |
| Security | | Shares | | | Value | |
|
| United Kingdom (continued) | |
WM Morrison Supermarkets PLC | | | 255,908 | | | $ | 677,273 | |
WPP PLC | | | 3,283 | | | | 46,199 | |
| | | | | | | | |
| | | | 26,734,643 | |
|
| United States — 0.3% | |
James Hardie Industries PLC | | | 23,044 | | | | 450,382 | |
| | | | | | | | |
| |
Total Common Stocks — 96.5%
(Cost — $153,426,002) | | | | 169,960,431 | |
| | | | | | | | |
|
Preferred Stocks — 0.5% | |
|
| Germany — 0.5% | |
Bayerische Motoren Werke AG, Preference Shares, 0.00% | | | 254 | | | | 15,637 | |
Henkel AG & Co. KGaA, Preference Shares, 0.00% | | | 3,501 | | | | 361,655 | |
Sartorius AG, Preference Shares, 0.00% | | | 1,938 | | | | 414,270 | |
| | | | | | | | |
| |
Total Preferred Stocks — 0.5%
(Cost — $748,191) | | | | 791,562 | |
| | | | | | | | |
| |
Total Long-Term Investments — 97.0%
(Cost — $154,174,193) | | | | 170,751,993 | |
| | | | | | | | |
| | | | | | | | |
| Security | | Shares | | | Value | |
|
Short-Term Securities — 2.7% | |
BlackRock Cash Funds: Institutional, SL Agency Shares, 1.84%(f)(g)(h) | | | 3,502,221 | | | $ | 3,503,622 | |
BlackRock Cash Funds: Treasury, SL Agency Shares, 1.52%(f)(h) | | | 1,224,018 | | | | 1,224,018 | |
| | | | | | | | |
| |
Total Short-Term Securities — 2.7%
(Cost — $4,727,142) | | | | 4,727,640 | |
| | | | | | | | |
| |
Total Investments — 99.7%
(Cost — $158,901,335) | | | | 175,479,633 | |
| |
Other Assets Less Liabilities — 0.3% | | | | 586,244 | |
| | | | | | | | |
| |
Net Assets — 100.0% | | | $ | 176,065,877 | |
| | | | | | | | |
| (a) | Security, or a portion of the security, is on loan. |
| (b) | A security contractually bound to one or more other securities to form a single saleable unit which cannot be sold separately. |
| (c) | Non-income producing security. |
| (d) | Security exempt from registration pursuant to Rule 144A under the Securities Act of 1933, as amended. These securities may be resold in transactions exempt from registration to qualified institutional investors. |
| (e) | Security is valued using significant unobservable inputs and is classified as Level 3 in the fair value hierarchy. |
| (f) | Annualized7-day yield as of period end. |
| (g) | All or a portion of the security was purchased with the cash collateral from loaned securities. |
| (h) | During the year ended December 31, 2019, investments in issuers considered to be an affiliate/affiliates of the Master Portfolio for purposes of Section 2(a)(3) of the Investment Company Act of 1940, as amended, were as follows: |
| | | | | | | | | | | | | | | | | | | | | | | | | | | | |
| Affiliate | |
| Shares
Held at
12/31/18 |
| |
| Net
Activity |
| |
| Shares
Held at
12/31/19 |
| |
| Value at
12/31/19 |
| | | Income | | |
| Net
Realized
Gain (Loss) |
(a) | |
| Change in
Unrealized
Appreciation
(Depreciation) |
|
BlackRock Cash Funds: Institutional, SL Agency Shares | | | 6,307,282 | | | | (2,805,061 | ) | | | 3,502,221 | | | $ | 3,503,622 | | | $ | 26,388 | (b) | | $ | 527 | | | $ | 361 | |
BlackRock Cash Funds: Treasury, SL Agency Shares | | | 1,531,004 | | | | (306,986 | ) | | | 1,224,018 | | | | 1,224,018 | | | | 34,778 | | | | — | | | | — | |
| | | | | | | | | | | | | | | | | | | | | | | | | | | | |
| | | $ | 4,727,640 | | | $ | 61,166 | | | $ | 527 | | | $ | 361 | |
| | | | | | | | | | | | | | | | | |
| | (a) | Includes net capital gain distributions, if applicable. | |
| | (b) | All or a portion represents securities lending income earned from the reinvestment of cash collateral from loaned securities, net of fees and collateral investment expenses, and other payments to and from borrowers of securities. | |
Derivative Financial Instruments Outstanding as of Period End
Futures Contracts
| | | | | | | | | | | | | | | | |
| Description | | Number of
Contracts | | | Expiration
Date | | | Notional
Amount (000) | | | Value/
Unrealized
Appreciation
(Depreciation) | |
Long Contracts | | | | | | | | | | | | | | | | |
Yen Denom Nikkei Index | | | 11 | | | | 03/12/20 | | | $ | 1,186 | | | $ | (1,280 | ) |
SPI 200 Index | | | 3 | | | | 03/19/20 | | | | 348 | | | | (8,514 | ) |
Euro Stoxx 50 Index | | | 61 | | | | 03/20/20 | | | | 2,552 | | | | (5,340 | ) |
FTSE 100 Index | | | 10 | | | | 03/20/20 | | | | 993 | | | | 4,944 | |
| | | | | | | | | | | | | | | | |
| | | | | | | | | | | | | | $ | (10,190 | ) |
| | | | | | | | | | | | | | | | |
| | |
| 6 | | 2019 BLACKROCK ANNUAL REPORTTO SHAREHOLDERS |
| | |
Schedule of Investments (continued) December 31, 2019 | | International Tilts Master Portfolio |
Derivative Financial Instruments Categorized by Risk Exposure
As of period end, the fair values of derivative financial instruments located in the Statement of Assets and Liabilities were as follows:
| | | | | | | | | | | | | | | | | | | | | | | | | | | | |
| | | Commodity Contracts | | | Credit
Contracts | | | Equity
Contracts | | | Foreign
Currency
Exchange
Contracts | | | Interest Rate Contracts | | | Other
Contracts | | | Total | |
Assets — Derivative Financial Instrument | | | | | | | | | | | | | | | | | | | | | | | | | | | | |
Futures contracts | | | | | | | | | | | | | | | | | | | | | | | | | | | | |
Unrealized appreciation on futures contracts(a) | | $ | — | | | $ | — | | | $ | 4,944 | | | $ | — | | | $ | — | | | $ | — | | | $ | 4,944 | |
| | | | | | | | | | | | | | | | | | | | | | | | | | | | |
Liabilities — Derivative Financial Instrument | | | | | | | | | | | | | | | | | | | | | | | | | | | | |
Futures contracts | | | | | | | | | | | | | | | | | | | | | | | | | | | | |
Unrealized depreciation on futures contracts(a) | | $ | — | | | $ | — | | | $ | 15,134 | | | $ | — | | | $ | — | | | $ | — | | | $ | 15,134 | |
| | | | | | | | | | | | | | | | | | | | | | | | | | | | |
| | (a) | Net cumulative unrealized appreciation (depreciation) on futures contracts, if any, are reported in the Schedule of Investments. In the Statement of Assets and Liabilities, only current day’s variation margin is reported in receivables or payables and the net cumulative unrealized appreciation (depreciation) is included in accumulated earnings (loss). | |
For the period ended December 31, 2019, the effect of derivative financial instruments in the Statement of Operations was as follows:
| | | | | | | | | | | | | | | | | | | | | | | | | | | | |
| | | Commodity Contracts | | | Credit Contracts | | | Equity Contracts | | | Foreign
Currency
Exchange
Contracts | | | Interest
Rate
Contracts | | | Other
Contracts | | | Total | |
Net Realized Gain (Loss) from: | | | | | | | | | | | | | | | | | | | | | | | | | | | | |
Future contracts | | $ | — | | | $ | — | | | $ | 1,112,191 | | | $ | — | | | $ | — | | | $ | — | | | $ | 1,112,191 | |
| | | | | | | | | | | | | | | | | | | | | | | | | | | | |
| | | | | | | | | | | | | | | | | | | | | | | | | | | | |
| | | Commodity Contracts | | | Credit Contracts | | | Equity Contracts | | | Foreign
Currency
Exchange
Contracts | | | Interest
Rate
Contracts | | | Other
Contracts | | | Total | |
Net Change in Unrealized Appreciation (Depreciation) on: | | | | | | | | | | | | | | | | | | | | | | | | | | | | |
Future contracts | | $ | — | | | $ | — | | | $ | 47,911 | | | $ | — | | | $ | — | | | $ | — | | | $ | 47,911 | |
| | | | | | | | | | | | | | | | | | | | | | | | | | | | |
Average Quarterly Balances of Outstanding Derivative Financial Instruments
| | | | |
Futures contracts: | |
Average notional value of contracts — long | | $ | 7,874,358 | |
Average notional value of contracts — short | | | — | (a) |
| | (a) | Derivative not held atquarter-end. The risk exposure table serves as an indicator of activity during the period. | |
For more information about the Master Portfolio’s investment risks regarding derivative financial instruments, refer to the Notes to Financial Statements.
Fair Value Hierarchy as of Period End
Various inputs are used in determining the fair value of investments and derivative financial instruments. For information about the Master Portfolio’s policy regarding valuation of investments and derivative financial instruments, refer to the Notes to Financial Statements.
The following tables summarize the Master Portfolio’s investments and derivative financial instruments categorized in the disclosure hierarchy:
| | | | | | | | | | | | | | | | |
| | | Level 1 | | | Level 2 | | | Level 3 | | | Total | |
Assets: | |
Investments: | |
Common Stocks: | |
Australia | | $ | — | | | $ | 13,477,571 | | | $ | — | | | $ | 13,477,571 | |
Austria | | | 141,212 | | | | 98,700 | | | | — | | | | 239,912 | |
Belgium | | | — | | | | 1,643,464 | | | | — | | | | 1,643,464 | |
China | | | — | | | | 779,335 | | | | — | | | | 779,335 | |
Denmark | | | 2,047,584 | | | | 2,149,086 | | | | — | | | | 4,196,670 | |
Finland | | | 107,510 | | | | 3,937,566 | | | | — | | | | 4,045,076 | |
France | | | 384,520 | | | | 20,343,931 | | | | — | | | | 20,728,451 | |
Germany | | | 1,518,096 | | | | 14,565,982 | | | | — | | | | 16,084,078 | |
Hong Kong | | | — | | | | 3,079,205 | | | | — | | | | 3,079,205 | |
Ireland | | | 115,984 | | | | 147,385 | | | | — | | | | 263,369 | |
| | | | |
| SCHEDULES OF INVESTMENTS | | | 7 | |
| | |
Schedule of Investments (continued) December 31, 2019 | | International Tilts Master Portfolio |
Fair Value Hierarchy as of Period End (continued)
| | | | | | | | | | | | | | | | |
| | | Level 1 | | | Level 2 | | | Level 3 | | | Total | |
Israel | | $ | — | | | $ | 235,392 | | | $ | — | | | $ | 235,392 | |
Italy | | | — | | | | 1,359,960 | | | | — | | | | 1,359,960 | |
Japan | | | — | | | | 39,513,631 | | | | — | | | | 39,513,631 | |
Luxembourg | | | — | | | | 158,636 | | | | — | | | | 158,636 | |
Macau | | | — | | | | 275,702 | | | | — | | | | 275,702 | |
Netherlands | | | — | | | | 9,849,245 | | | | — | | | | 9,849,245 | |
New Zealand | | | — | | | | 96,954 | | | | — | | | | 96,954 | |
Norway | | | — | | | | 204,494 | | | | 1 | | | | 204,495 | |
Singapore | | | — | | | | 713,138 | | | | — | | | | 713,138 | |
South Africa | | | — | | | | 149,845 | | | | — | | | | 149,845 | |
Spain | | | — | | | | 3,122,101 | | | | — | | | | 3,122,101 | |
Sweden | | | — | | | | 4,338,036 | | | | — | | | | 4,338,036 | |
Switzerland | | | 56,324 | | | | 18,164,816 | | | | — | | | | 18,221,140 | |
United Kingdom | | | 2,052,107 | | | | 24,682,536 | | | | — | | | | 26,734,643 | |
United States | | | — | | | | 450,382 | | | | — | | | | 450,382 | |
Preferred Stocks | | | — | | | | 791,562 | | | | — | | | | 791,562 | |
Short-Term Securities | | | 4,727,640 | | | | — | | | | — | | | | 4,727,640 | |
| | | | | | | | | | | | | | | | |
| | $ | 11,150,977 | | | $ | 164,328,655 | | | $ | 1 | | | $ | 175,479,633 | |
| | | | | | | | | | | | | | | | |
Derivative Financial Instruments(a) | |
Assets: | |
Other contracts | | $ | 4,944 | | | $ | — | | | $ | — | | | $ | 4,944 | |
Liabilities: | |
Equity contracts | | | (15,134 | ) | | | — | | | | — | | | | (15,134 | ) |
| | | | | | | | | | | | | | | | |
| | $ | (10,190 | ) | | $ | — | | | $ | — | | | $ | (10,190 | ) |
| | | | | | | | | | | | | | | | |
| | (a) | Derivative financial instruments are futures contracts. Futures contracts are valued at the unrealized appreciation (depreciation) on the instrument. | |
See notes to financial statements.
| | |
| 8 | | 2019 BLACKROCK ANNUAL REPORTTO SHAREHOLDERS |
Statement of Assets and Liabilities
December 31, 2019
| | | | |
| | | International Tilts Master Portfolio | |
|
ASSETS | |
Investments at value — unaffiliated (including securities loaned at value of $3,314,009, cost — $154,174,193) | | $ | 170,751,993 | |
Investments at value — affiliated (cost — $4,727,142) | | | 4,727,640 | |
Cash pledged for futures contracts | | | 312,910 | |
Foreign currency at value (cost — $4,337,889) | | | 4,396,276 | |
Receivables: | |
Securities lending income — affiliated | | | 963 | |
Dividends — affiliated | | | 1,616 | |
Dividends — unaffiliated | | | 215,190 | |
Variation margin on futures contracts | | | 724 | |
Prepaid expenses | | | 5,545 | |
| | | | |
Total assets | | | 180,412,857 | |
| | | | |
|
LIABILITIES | |
Cash collateral on securities loaned at value | | | 3,500,238 | |
Payables: | |
Administration fees | | | 14,552 | |
Investment advisory fees | | | 101,713 | |
Other accrued expenses | | | 22,290 | |
Trustees’ fees | | | 2,587 | |
Variation margin on futures contracts | | | 46,814 | |
Withdrawals to investors | | | 658,786 | |
| | | | |
Total liabilities | | | 4,346,980 | |
| | | | |
| |
NET ASSETS | | $ | 176,065,877 | |
| | | | |
|
NET ASSETS CONSIST OF | |
Investors’ capital | | $ | 159,435,883 | |
Net unrealized appreciation (depreciation) | | | 16,629,994 | |
| | | | |
NET ASSETS | | $ | 176,065,877 | |
| | | | |
See notes to financial statements.
Statement of Operations
Year Ended December 31, 2019
| | | | |
| | | International Tilts Master Portfolio | |
|
INVESTMENT INCOME | |
Dividends — affiliated | | $ | 34,778 | |
Dividends — unaffiliated | | | 5,985,697 | |
Securities lending income — affiliated — net | | | 26,388 | |
Foreign taxes withheld | | | (242,768 | ) |
| | | | |
Total investment income | | | 5,804,095 | |
| | | | |
|
EXPENSES | |
Investment advisory | | | 642,081 | |
Administration | | | 80,260 | |
Professional | | | 22,689 | |
Trustees | | | 13,012 | |
| | | | |
Total expenses | | | 758,042 | |
Less fees waived and/or reimbursed by the Manager | | | (117,129 | ) |
| | | | |
Total expenses after fees waived and/or reimbursed | | | 640,913 | |
| | | | |
Net investment income | | | 5,163,182 | |
| | | | |
|
REALIZED AND UNREALIZED GAIN (LOSS) | |
Net realized gain from: | |
Futures contracts | | | 1,112,191 | |
Foreign currency transactions | | | 14,121 | |
Investments — affiliated | | | 527 | |
Investments — unaffiliated | | | 3,765,818 | |
| | | | |
| | | 4,892,657 | |
| | | | |
Net change in unrealized appreciation (depreciation) on: | |
Futures contracts | | | 47,911 | |
Foreign currency translations | | | 69,934 | |
Investments — affiliated | | | 361 | |
Investments — unaffiliated | | | 22,631,149 | |
| | | | |
| | | 22,749,355 | |
| | | | |
Net realized and unrealized gain | | | 27,642,012 | |
| | | | |
NET INCREASE IN NET ASSETS RESULTING FROM OPERATIONS | | $ | 32,805,194 | |
| | | | |
See notes to financial statements.
| | |
| 10 | | 2019 BLACKROCK ANNUAL REPORTTO SHAREHOLDERS |
Statements of Changes in Net Assets
| | | | | | | | |
| | | International Tilts Master Portfolio | |
| | | Year Ended December 31, | |
| | | 2019 | | | 2018 | |
|
INCREASE (DECREASE) IN NET ASSETS | |
|
OPERATIONS | |
Net investment income | | $ | 5,163,182 | | | $ | 4,508,257 | |
Net realized gain (loss) | | | 4,892,657 | | | | (914,470 | ) |
Net change in unrealized appreciation (depreciation) | | | 22,749,355 | | | | (30,450,447 | ) |
| | | | | | | | |
Net increase (decrease) in net assets resulting from operations | | | 32,805,194 | | | | (26,856,660 | ) |
| | | | | | | | |
|
CAPITAL TRANSACTIONS | |
Proceeds from contributions | | | 39,066,209 | | | | 63,886,547 | |
Value of withdrawals | | | (43,182,203 | ) | | | (53,622,664 | ) |
| | | | | | | | |
Net increase (decrease) in net assets derived from capital transactions | | | (4,115,994 | ) | | | 10,263,883 | |
| | | | | | | | |
|
NET ASSETS | |
Total increase (decrease) in net assets | | | 28,689,200 | | | | (16,592,777 | ) |
Beginning of year | | | 147,376,677 | | | | 163,969,454 | |
| | | | | | | | |
End of year | | $ | 176,065,877 | | | $ | 147,376,677 | |
| | | | | | | | |
See notes to financial statements.
Financial Highlights
(For a share outstanding throughout each period)
| | | | | | | | | | | | | | | | | | | | |
| | | International Tilts Master Portfolio | |
| |
| | | Year Ended December 31, | |
| | | 2019 | | | 2018 | | | 2017 | | | 2016 | | | 2015 | |
| | | | | |
Total Return | | | | | | | | | | | | | | | | | | | | |
Total return | | | 22.30 | % | | | (15.06 | )% | | | 29.06 | % | | | 0.00 | % | | | 2.25 | % |
| | | | | | | | | | | | | | | | | | | | |
| | | | | |
Ratios to Average Net Assets | | | | | | | | | | | | | | | | | | | | |
Total expenses | | | 0.47 | % | | | 0.46 | % | | | 0.47 | % | | | 0.46 | % | | | 0.45 | % |
| | | | | | | | | | | | | | | | | | | | |
Total expenses after fees waived and/or reimbursed | | | 0.40 | % | | | 0.40 | % | | | 0.40 | % | | | 0.40 | % | | | 0.43 | % |
| | | | | | | | | | | | | | | | | | | | |
Net investment income | | | 3.22 | % | | | 2.68 | %(a) | | | 2.81 | % | | | 2.91 | % | | | 2.65 | % |
| | | | | | | | | | | | | | | | | | | | |
| | | | | |
Supplemental Data | | | | | | | | | | | | | | | | | | | | |
Net assets, end of year (000) | | $ | 176,066 | | | $ | 147,377 | | | $ | 163,969 | | | $ | 187,213 | | | $ | 304,851 | |
| | | | | | | | | | | | | | | | | | | | |
Portfolio turnover rate | | | 151 | % | | | 130 | % | | | 106 | % | | | 98 | % | | | 107 | % |
| | | | | | | | | | | | | | | | | | | | |
| (a) | The ratio of net investment income to average net assets includes 0.04% resulting from a special dividend. |
See notes to financial statements.
| | |
| 12 | | 2019 BLACKROCK ANNUAL REPORTTO SHAREHOLDERS |
Notes to Financial Statements
Master Investment Portfolio (“MIP”) is registered under the Investment Company Act of 1940, as amended (the “1940 Act”), as anopen-end management investment company. MIP is organized as a Delaware statutory trust. International Tilts Master Portfolio (the “Master Portfolio”) is a series of MIP. The Master Portfolio is classified as diversified.
The Master Portfolio, together with certain other registered investment companies advised by BlackRock Advisors, LLC (the “Manager”) or its affiliates, is included in a complex of equity, multi-asset, index and money market funds referred to as the BlackRock Multi-Asset Complex.
| 2. | SIGNIFICANT ACCOUNTING POLICIES |
The financial statements are prepared in conformity with accounting principles generally accepted in the United States of America (“U.S. GAAP”), which may require management to make estimates and assumptions that affect the reported amounts of assets and liabilities in the financial statements, disclosure of contingent assets and liabilities at the date of the financial statements and the reported amounts of increases and decreases in net assets from operations during the reporting period. Actual results could differ from those estimates. The Master Portfolio is considered an investment company under U.S. GAAP and follows the accounting and reporting guidance applicable to investment companies. Below is a summary of significant accounting policies:
Investment Transactions and Income Recognition:For financial reporting purposes, investment transactions are recorded on the dates the transactions are executed. Realized gains and losses on investment transactions are determined on the identified cost basis. Dividend income is recorded on theex-dividend date. Dividends from foreign securities where theex-dividend date may have passed are subsequently recorded when the Master Portfolio is informed of theex-dividend date. Under the applicable foreign tax laws, a withholding tax at various rates may be imposed on capital gains, dividends and interest. Upon notification from issuers, a portion of the dividend income received from a real estate investment trust may be redesignated as a reduction of cost of the related investment and/or realized gain.
Foreign Currency Translation:The Master Portfolio’s books and records are maintained in U.S. dollars. Securities and other assets and liabilities denominated in foreign currencies are translated into U.S. dollars using exchange rates determined as of the close of trading on the New York Stock Exchange (“NYSE”). Purchases and sales of investments are recorded at the rates of exchange prevailing on the respective dates of such transactions. Generally, when the U.S. dollar rises in value against a foreign currency, the investments denominated in that currency will lose value; the opposite effect occurs if the U.S. dollar falls in relative value.
The Master Portfolio does not isolate the portion of the results of operations arising as a result of changes in the exchange rates from the changes in the market prices of investments held or sold for financial reporting purposes. Accordingly, the effects of changes in exchange rates on investments are not segregated in the Statement of Operations from the effects of changes in market prices of those investments, but are included as a component of net realized and unrealized gain (loss) from investments. The Master Portfolio reports realized currency gains (losses) on foreign currency related transactions as components of net realized gain (loss) for financial reporting purposes, whereas such components are generally treated as ordinary income for U.S. federal income tax purposes.
Segregation and Collateralization:In cases where the Master Portfolio enters into certain investments (e.g., futures contracts) that would be treated as “senior securities” for 1940 Act purposes, the Master Portfolio may segregate or designate on itsbooks and records cash or liquid assets having a market value at least equal to the amount of its future obligations under such investments. Doing so allows the investment to be excluded from treatment as a “senior security.” Furthermore, if required by an exchange or counterparty agreement, the Master Portfolio may be required to deliver/deposit cash and/or securities to/with an exchange, or broker-dealer or custodian as collateral for certain investments or obligations.
Indemnifications:In the normal course of business, the Master Portfolio enters into contracts that contain a variety of representations that provide general indemnification. The Master Portfolio’s maximum exposure under these arrangements is unknown because it involves future potential claims against the Master Portfolio, which cannot be predicted with any certainty.
Other: Expenses directly related to the Master Portfolio are charged to the Master Portfolio. Other operating expenses shared by several funds, including other funds managed by the Manager, are prorated among those funds on the basis of relative net assets or other appropriate methods.
| 3. | INVESTMENT VALUATION AND FAIR VALUE MEASUREMENTS |
Investment Valuation Policies: The Master Portfolio’s investments are valued at fair value (also referred to as “market value” within the financial statements) as of the close of trading on the NYSE (generally 4:00 p.m., Eastern time). U.S. GAAP defines fair value as the price the Master Portfolio would receive to sell an asset or pay to transfer a liability in an orderly transaction between market participants at the measurement date. The Master Portfolio determines the fair values of its financial instruments using various independent dealers or pricing services under policies approved by the Board of Trustees of MIP (the “Board”). The BlackRock Global Valuation Methodologies Committee (the “Global Valuation Committee”) is the committee formed by management to develop global pricing policies and procedures and to oversee the pricing function for all financial instruments.
Fair Value Inputs and Methodologies: The following methods and inputs are used to establish the fair value of the Master Portfolio’s assets and liabilities:
| | • | | Equity investments traded on a recognized securities exchange are valued at the official closing price each day, if available. For equity investments traded on more than one exchange, the official closing price on the exchange where the stock is primarily traded is used. Equity investments traded on a recognized exchange for which there were no sales on that day may be valued at the last available bid (long positions) or ask (short positions) price. |
Generally, trading in foreign instruments is substantially completed each day at various times prior to the close of trading on the NYSE. Occasionally, events affecting the values of such instruments may occur between the foreign market close and the close of trading on the NYSE that may not be reflected in the computation of the Master Portfolio’s net assets. Each business day, the Master Portfolio uses a pricing service to assist with the valuation of certain foreign
| | | | |
| NOTESTO FINANCIAL STATEMENTS | | | 13 | |
Notes to Financial Statements (continued)
exchange-traded equity securities and foreign exchange-traded andover-the-counter (“OTC”) options (the “Systematic Fair Value Price”). Using current market factors, the Systematic Fair Value Price is designed to value such foreign securities and foreign options at fair value as of the close of trading on the NYSE, which follows the close of the local markets.
| | • | | Investments inopen-end U.S. mutual funds are valued at net asset value (“NAV”) each business day. |
| | • | | Futures contracts traded on exchanges are valued at their last sale price. |
If events (e.g., a company announcement, market volatility or a natural disaster) occur that are expected to materially affect the value of such investments, or in the event that the application of these methods of valuation results in a price for an investment that is deemed not to be representative of the market value of such investment, or if a price is not available, the investment will be valued by the Global Valuation Committee, or its delegate, in accordance with a policy approved by the Board as reflecting fair value (“Fair Valued Investments”). The fair valuation approaches that may be used by the Global Valuation Committee will include market approach, income approach and cost approach. Valuation techniques such as discounted cash flow, use of market comparables and matrix pricing are types of valuation approaches and are typically used in determining fair value. When determining the price for Fair Valued Investments, the Global Valuation Committee, or its delegate, seeks to determine the price that the Master Portfolio might reasonably expect to receive or pay from the current sale or purchase of that asset or liability in anarm’s-length transaction. Fair value determinations shall be based upon all available factors that the Global Valuation Committee, or its delegate, deems relevant and consistent with the principles of fair value measurement. The pricing of all Fair Valued Investments is subsequently reported to the Board or a committee thereof on a quarterly basis.
For investments in equity or debt issued by privately held companies or funds (“Private Company” or collectively, the “Private Companies”) and other Fair Valued Investments, the fair valuation approaches that are used by the Global Valuation Committee and third party pricing services utilize one or a combination of, but not limited to, the following inputs.
| | |
| | | Standard Inputs Generally Considered By Third Party Pricing Services |
Market approach | | (i) recent market transactions, including subsequent rounds of financing, in the underlying investment or comparable issuers; (ii) recapitalizations and other transactions across the capital structure; and (iii) market multiples of comparable issuers. |
Income approach | | (i) future cash flows discounted to present and adjusted as appropriate for liquidity, credit, and/or market risks; (ii) quoted prices for similar investments or assets in active markets; and (iii) other risk factors, such as interest rates, yield curves, volatilities, prepayment speeds, loss severities, credit risks, recovery rates, liquidation amounts and/or default rates. |
Cost approach | | (i) audited or unaudited financial statements, investor communications and financial or operational metrics issued by the Private Company; (ii) changes in the valuation of relevant indices or publicly traded companies comparable to the Private Company; (iii) relevant news and other public sources; and (iv) known secondary market transactions in the Private Company’s interests and merger or acquisition activity in companies comparable to the Private Company. |
Investments in series of preferred stock issued by Private Companies are typically valued utilizing market approach in determining the enterprise value of the company. Such investments often contain rights and preferences that differ from other series of preferred and common stock of the same issuer. Valuation techniques such as an option pricing model (“OPM”), a probability weighted expected return model (“PWERM”) or a hybrid of those techniques are used in allocating enterprise value of the company, as deemed appropriate under the circumstances. The use of OPM and PWERM techniques involve a determination of the exit scenarios of the investment in order to appropriately allocate the enterprise value of the company among the various parts of its capital structure.
The Private Companies are not subject to the public company disclosure, timing, and reporting standards as other investments held by the Fund. Typically, the most recently available information by a Private Company is as of a date that is earlier than the date the Fund is calculating its NAV. This factor may result in a difference between the value of the investment and the price the Fund could receive upon the sale of the investment.
Fair Value Hierarchy: Various inputs are used in determining the fair value of investments and derivative financial instruments. These inputs to valuation techniques are categorized into a fair value hierarchy consisting of three broad levels for financial statement purposes as follows:
| | • | | Level 1 — Unadjusted price quotations in active markets/exchanges for identical assets or liabilities that the Master Portfolio has the ability to access |
| | • | | Level 2 — Other observable inputs (including, but not limited to, quoted prices for similar assets or liabilities in markets that are active, quoted prices for identical or similar assets or liabilities in markets that are not active, inputs other than quoted prices that are observable for the assets or liabilities (such as interest rates, yield curves, volatilities, prepayment speeds, loss severities, credit risks and default rates) or other market–corroborated inputs) |
| | • | | Level 3 — Unobservable inputs based on the best information available in the circumstances, to the extent observable inputs are not available (including the Global Valuation Committee’s assumptions used in determining the fair value of investments and derivative financial instruments) |
The hierarchy gives the highest priority to unadjusted quoted prices in active markets for identical assets or liabilities (Level 1 measurements) and the lowest priority to unobservable inputs (Level 3 measurements). Accordingly, the degree of judgment exercised in determining fair value is greatest for instruments categorized in Level 3. The inputs used to measure fair value may fall into different levels of the fair value hierarchy. In such cases, for disclosure purposes, the fair value hierarchy classification is determined based on the lowest level input that is significant to the fair value measurement in its entirety. Investments classified within Level 3 have significant unobservable inputs used by the Global Valuation Committee in determining the price for Fair Valued Investments. Level 3 investments include equity or debt issued by Private Companies. There may not be a secondary market, and/or there are a limited number of investors. The categorization of a value determined for investments and derivative financial instruments is based on the pricing transparency of the investments and derivative financial instruments and is not necessarily an indication of the risks associated with investing in those securities.
| | |
| 14 | | 2019 BLACKROCK ANNUAL REPORTTO SHAREHOLDERS |
Notes to Financial Statements (continued)
| 4. | SECURITIES AND OTHER INVESTMENTS |
Preferred Stocks: Preferred stock has a preference over common stock in liquidation (and generally in receiving dividends as well), but is subordinated to the liabilities of the issuer in all respects. As a general rule, the market value of preferred stock with a fixed dividend rate and no conversion element varies inversely with interest rates and perceived credit risk, while the market price of convertible preferred stock generally also reflects some element of conversion value. Because preferred stock is junior to debt securities and other obligations of the issuer, deterioration in the credit quality of the issuer will cause greater changes in the value of a preferred stock than in a more senior debt security with similar stated yield characteristics. Unlike interest payments on debt securities, preferred stock dividends are payable only if declared by the issuer’s board of directors. Preferred stock also may be subject to optional or mandatory redemption provisions.
Securities Lending:The Master Portfolio may lend its securities to approved borrowers, such as brokers, dealers and other financial institutions. The borrower pledges and maintains with the Master Portfolio collateral consisting of cash, an irrevocable letter of credit issued by a bank, or securities issued or guaranteed by the U.S. Government. The initial collateral received by the Master Portfolio is required to have a value of at least 102% of the current value of the loaned securities for securities traded on U.S. exchanges and a value of at least 105% for all other securities. The collateral is maintained thereafter at a value equal to at least 100% of the current market value of the securities on loan. The market value of the loaned securities is determined at the close of each business day of the Master Portfolio and any additional required collateral is delivered to the Master Portfolio, or excess collateral returned by the Master Portfolio, on the next business day. During the term of the loan, the Master Portfolio is entitled to all distributions made on or in respect of the loaned securities, but does not receive interest income on securities received as collateral. Loans of securities are terminable at any time and the borrower, after notice, is required to return borrowed securities within the standard time period for settlement of securities transactions.
The market value of any securities on loan, all of which were classified as common stocks in the Master Portfolio’s Schedule of Investments, and the value of any related collateral are shown separately in the Statement of Assets and Liabilities as a component of investments at value-unaffiliated, and collateral on securities loaned at value, respectively. As of period end, any securities on loan were collateralized by cash and/or U.S. Government obligations. Cash collateral invested by the securities lending agent, BlackRock Institutional Trust Company, N.A. (“BTC”), if any, is disclosed in the Schedule of Investments.
Securities lending transactions are entered into by the Master Portfolio under Master Securities Lending Agreements (each, an “MSLA”), which provide the right, in the event of default (including bankruptcy or insolvency), for thenon-defaulting party to liquidate the collateral and calculate a net exposure to the defaulting party or request additional collateral. In the event that a borrower defaults, the Master Portfolio, as lender, would offset the market value of the collateral received against the market value of the securities loaned. When the value of the collateral is greater than that of the market value of the securities loaned, the lender is left with a net amount payable to the defaulting party. However, bankruptcy or insolvency laws of a particular jurisdiction may impose restrictions on or prohibitions against such a right of offset in the event of an MSLA counterparty’s bankruptcy or insolvency. Under the MSLA, absent an event of default, the borrower can resell orre-pledge the loaned securities, and the Master Portfolio can reinvest cash collateral received in connection with loaned securities. Upon an event of default, the parties’ obligations to return the securities or collateral to the other party are extinguished, and the parties can resell orre-pledge the loaned securities or the collateral received in connection with the loaned securities in order to satisfy the defaulting party’s net payment obligation for all transactions under the MSLA. The defaulting party remains liable for any deficiency.
As of period end, the following table is a summary of the Master Portfolio’s securities lending agreements by counterparty which are subject to offset under an MSLA:
| | | | | | | | | | | | |
| Counterparty | | Securities
Loaned at Value | | | Cash Collateral
Received (a) | | | Net
Amount | |
Goldman Sachs & Co. | | $ | 145,294 | | | $ | (145,294 | ) | | $ | — | |
Jefferies LLC | | | 237,630 | | | | (237,630 | ) | | | — | |
J.P. Morgan Securities LLC | | | 100,283 | | | | (100,283 | ) | | | — | |
Morgan Stanley & Co. LLC | | | 1,564,694 | | | | (1,564,694 | ) | | | — | |
State Street Bank and Trust Co. | | | 815,216 | | | | (815,216 | ) | | | — | |
UBS AG | | | 450,892 | | | | (450,892 | ) | | | — | |
| | | | | | | | | | | | |
| | $ | 3,314,009 | | | $ | (3,314,009 | ) | | $ | — | |
| | | | | | | | | | | | |
| | (a) | Collateral received in excess of the market value of securities on loan is not presented in this table. The total cash collateral received by the Fund is disclosed in the Fund’s Statement of Assets and Liabilities. | |
The risks of securities lending include the risk that the borrower may not provide additional collateral when required or may not return the securities when due. To mitigate these risks, the Master Portfolio benefits from a borrower default indemnity provided by BlackRock, Inc. (“BlackRock”).BlackRock’s indemnity allows for full replacement of the securities loaned to the extent the collateral received does not cover the value on the securities loaned in the event of borrower default. The Master Portfolio could incur a loss if the value of an investment purchased with cash collateral falls below the market value of loaned securities or if the value of an investment purchased with cash collateral falls below the value of the original cash collateral received. Such losses are borne entirely by the Master Portfolio.
| 5. | DERIVATIVE FINANCIAL INSTRUMENTS |
The Master Portfolio engages in various portfolio investment strategies using derivative contracts both to increase the returns of the Master Portfolio and/or to manage its exposure to certain risks such as credit risk, equity risk, interest rate risk, foreign currency exchange rate risk, commodity price risk or other risks (e.g., inflation risk). Derivative financial instruments categorized by risk exposure are included in the Schedule of Investments. These contracts may be transacted on an exchange or OTC.
Futures Contracts: Futures contracts are purchased or sold to gain exposure to, or manage exposure to, changes in interest rates (interest rate risk) and changes in the value of equity securities (equity risk) or foreign currencies (foreign currency exchange rate risk).
| | | | |
| NOTESTO FINANCIAL STATEMENTS | | | 15 | |
Notes to Financial Statements (continued)
Futures contracts are agreements between the Master Portfolio and a counterparty to buy or sell a specific quantity of an underlying instrument at a specified price and on a specified date. Depending on the terms of a contract, it is settled either through physical delivery of the underlying instrument on the settlement date or by payment of a cash amount on the settlement date. Upon entering into a futures contract, the Master Portfolio is required to deposit initial margin with the broker in the form of cash or securities in an amount that varies depending on a contract’s size and risk profile. The initial margin deposit must then be maintained at an established level over the life of the contract. Amounts pledged, which are considered restricted, are included in cash pledged for futures contracts in the Statement of Assets and Liabilities.
Securities deposited as initial margin are designated in the Schedule of Investments and cash deposited, if any, are shown as cash pledged for futures contracts in the Statement of Assets and Liabilities. Pursuant to the contract, the Master Portfolio agrees to receive from or pay to the broker an amount of cash equal to the daily fluctuation in market value of the contract (“variation margin”). Variation margin is recorded as unrealized appreciation (depreciation) and, if any, shown as variation margin receivable (or payable) on futures contracts in the Statement of Assets and Liabilities. When the contract is closed, a realized gain or loss is recorded in the Statement of Operations equal to the difference between the notional amount of the contract at the time it was opened and the notional amount at the time it was closed. The use of futures contracts involves the risk of an imperfect correlation in the movements in the price of futures contracts and interest, foreign currency exchange rates or underlying assets.
| 6. | INVESTMENT ADVISORY AGREEMENT AND OTHER TRANSACTIONS WITH AFFILIATES |
Investment Advisory: MIP, on behalf of the Master Portfolio, entered into an Investment Advisory Agreement with the Manager, the Master Portfolio’s investment adviser and an indirect, wholly-owned subsidiary of BlackRock, to provide investment advisory services. The Manager is responsible for the management of the Master Portfolio’s portfolio and provides the personnel, facilities, equipment and certain other services necessary to the operations of the Master Portfolio.
For such services, the Master Portfolio pays the Manager a monthly fee at an annual rate equal to the following percentages of the average daily value of the Master Portfolio’s net assets.
| | | | |
| Average Daily Net Assets | | Investment
Advisory Fee | |
First $1 Billion | | | 0.40 | % |
$1 Billion — $3 Billion | | | 0.38 | |
$3 Billion — $5 Billion | | | 0.36 | |
$5 Billion — $10 Billion | | | 0.35 | |
Greater than $10 Billion | | | 0.34 | |
The Manager entered into separatesub-advisory agreements with BlackRock Fund Advisors (“BFA”) and BlackRock International Limited (“BIL”), each an affiliate of the Manager. The Manager pays each of BFA and BIL for services it provides for that portion of the Master Portfolio for which it acts assub-adviser, a monthly fee that is equal to a percentage of the investment advisory fees paid by the Master Portfolio to the Manager.
Administration: MIP, on behalf of the Master Portfolio, entered into an Administration Agreement with the Manager, which has agreed to provide general administrative services (other than investment advice and related portfolio activities). The Manager has agreed to bear all of the Master Portfolio’s ordinary operating expenses, excluding, generally, investment advisory fees, distribution fees, brokerage and other expenses related to the execution of portfolio transactions, extraordinary expenses and certain other expenses which are borne by the Master Portfolio. The Manager is entitled to receive for these administrative services an annual fee of 0.05% based on the average daily net assets of the Master Portfolio.
From time to time, the Manager may waive such fees in whole or in part. Any such waiver will reduce the expenses of the Master Portfolio and, accordingly, have a favorable impact on its performance. The Manager may delegate certain of its administration duties tosub-administrators. For the year ended December 31, 2019, the Manager waived $80,260.
Expense Waivers and Reimbursements: The fees and expenses of MIP’s trustees who are not “interested persons” of MIP, as defined in the 1940 Act (“Independent Trustees”), counsel to the Independent Trustees and the Master Portfolio’s independent registered public accounting firm (together, the “independent expenses”) are paid directly by the Master Portfolio. The Manager has contractually agreed to reimburse the Master Portfolio or provide an offsetting credit against the administration fees paid by the Master Portfolio in an amount equal to the independent expenses through April 30, 2020. For the year ended December 31, 2019, the amount waived was $35,701.
The Manager voluntarily agreed to waive its investment advisory fees by the amount of investment advisory fees the Master Portfolio pays to the Manager indirectly through its investment in affiliated money market funds (the “affiliated money market fund waiver”). This amount is included in fees waived and/or reimbursed by the Manager in the Statement of Operations. For the year ended December 31, 2019, the amounts waived were $1,168.
The Manager has contractually agreed to waive its investment advisory fee with respect to any portion of the Master Portfolio’s assets invested in affiliated equity and fixed-income mutual funds and affiliated exchange-traded funds that have a contractual management fee through April 30, 2020. The contractual agreement may be terminated upon 90 days’ notice by a majority of the Independent Trustees or by a vote of a majority of the outstanding voting securities of the Master Portfolio. For the year ended December 31, 2019, there were no fees waived and/or reimbursed by the Manager pursuant to this arrangement.
The Manager is entitled to receive an annual administrative fee of 0.05% of the Master Portfolio’s average daily net assets for providing administration services. The Manager has contractually agreed to waive this administration fee through April 30, 2020. This waiver agreement may be terminated upon 90 days’ notice by a majority of the Independent Trustees or by a majority of the outstanding voting securities of the Master Portfolio.
Securities Lending:The U.S. Securities and Exchange Commission (“SEC”) has issued an exemptive order which permits BTC, an affiliate of the Manager, to serve as securities lending agent for the Master Portfolio, subject to applicable conditions. As securities lending agent, BTC bears all operational costs directly related to securities
| | |
| 16 | | 2019 BLACKROCK ANNUAL REPORTTO SHAREHOLDERS |
Notes to Financial Statements (continued)
lending. The Master Portfolio is responsible for fees in connection with the investment of cash collateral received for securities on loan (the “collateral investment fees”). The cash collateral is invested in a money market fund managed by the Manager or its affiliates. However, BTC has agreed to reduce the amount of securities lending income it receives in order to effectively limit the collateral investment fees the Master Portfolio bears to an annual rate of 0.04%. The shares of such money market fund will not be subject to a sales load, distribution fee or service fee. The money market fund in which the cash collateral has been invested may, under certain circumstances, impose a liquidity fee of up to 2% of the value redeemed or temporarily restrict redemptions for up to 10 business days during a 90 day period, in the event that the money market fund’s weekly liquid assets fall below certain thresholds.
Securities lending income is equal to the total of income earned from the reinvestment of cash collateral, net of fees and other payments to and from borrowers of securities, and less the collateral investment fees. The Master Portfolio retains a portion of securities lending income and remits a remaining portion to BTC as compensation for its services as securities lending agent.
Pursuant to the current securities lending agreement, the Master Portfolio retains 82% of securities lending income (which excludes collateral investment fees), and this amount retained can never be less than 70% of the total of securities lending income plus the collateral investment fees.
In addition, commencing the business day following the date that the aggregate securities lending income earned across the BlackRock Multi-Asset Complex in a calendar year exceeds a specified threshold, the Master Portfolio, pursuant to the securities lending agreement, will retain for the remainder of that calendar year securities lending income in an amount equal to 85% of securities lending income (which excludes collateral investment fees), and this amount retained can never be less than 70% of the total of securities lending income plus the collateral investment fees.
The share of securities lending income earned by the Master Portfolio is shown as securities lending income — affiliated — net in the Statement of Operations. For the year ended December 31, 2019, the Master Portfolio paid BTC $5,641 for securities lending agent services.
Interfund Lending: In accordance with an exemptive order (the “Order”) from the SEC, the Master Portfolio may participate in a joint lending and borrowing facility for temporary purposes (the “Interfund Lending Program”), subject to compliance with the terms and conditions of the Order, and to the extent permitted by the Master Portfolio’s investment policies and restrictions. The Master Portfolio is currently permitted to borrow and lend under the Interfund Lending Program.
A lending BlackRock fund may lend in aggregate up to 15% of its net assets, but may not lend more than 5% of its net assets to any one borrowing fund through the Interfund Lending Program. A borrowing BlackRock fund may not borrow through the Interfund Lending Program or from any other source more than 33 1/3% of its total assets (or any lower threshold provided for by the fund’s investment restrictions). If a borrowing BlackRock fund’s total outstanding borrowings exceed 10% of its total assets, each of its outstanding interfund loans will be subject to collateralization of at least 102% of the outstanding principal value of the loan. All interfund loans are for temporary or emergency purposes and the interest rate to be charged will be the average of the highest current overnight repurchase agreement rate available to a lending fund and the bank loan rate, as calculated according to a formula established by the Board.
During the year ended December 31, 2019, the Master Portfolio did not participate in the Interfund Lending Program.
Trustees and Officers:Certain trustees and/or officers of MIP are directors and/or officers of BlackRock or its affiliates.
Other Transactions: The Master Portfolio may purchase securities from, or sell securities to, an affiliated fund provided the affiliation is due solely to having a common investment adviser, common officers, or common trustees. For the year ended December 31, 2019, the purchase and sale transactions and any net realized gains (losses) with an affiliated funds in compliance with Rule17a-7 under the 1940 Act were as follows:
| | | | | | |
| Purchases | | Sales | | | Net Realized Gain (Loss) |
| $353,985 | | $ | 208,804 | | | $(6,351) |
For the year ended December 31, 2019, purchases and sales of investments excluding short-term securities, were $233,493,909 and $235,264,036, respectively.
The Master Portfolio is classified as a partnership for U.S. federal income tax purposes. As such, each investor in the Master Portfolio is treated as the owner of its proportionate share of net assets, income, expenses and realized and unrealized gains and losses of the Master Portfolio. Therefore, no U.S. federal income tax provision is required. It is intended that the Master Portfolio’s assets will be managed so an investor in the Master Portfolio can satisfy the requirements of Subchapter M of the Internal Revenue Code of 1986, as amended.
The Master Portfolio files U.S. federal and various state and local tax returns. No income tax returns are currently under examination. The statute of limitations on the Master Portfolio’s U.S. federal tax returns generally remains open for each of the four years ended December 31, 2019. The statutes of limitations on the Master Portfolio’s state and local tax returns may remain open for an additional year depending upon the jurisdiction.
Management has analyzed tax laws and regulations and their application to the Master Portfolio as of December 31, 2019, inclusive of the open tax return years, and does not believe that there are any uncertain tax positions that require recognition of a tax liability in the Master Portfolio’s financial statements.
| | | | |
| NOTESTO FINANCIAL STATEMENTS | | | 17 | |
Notes to Financial Statements (continued)
As of December 31, 2019, gross unrealized appreciation and depreciation for investments and derivatives based on cost for U.S. federal income tax purposes were as follows:
| | | | |
Tax cost | | $ | 162,322,081 | |
| | | | |
Gross unrealized appreciation | | $ | 18,832,816 | |
Gross unrealized depreciation | | | (5,683,778 | ) |
| | | | |
Net unrealized appreciation | | $ | 13,149,038 | |
| | | | |
MIP, on behalf of the Master Portfolio, along with certain other funds managed by the Manager and its affiliates (“Participating Funds”), is a party to a364-day, $2.25 billion credit agreement with a group of lenders. Under this agreement, the Master Portfolio may borrow to fund shareholder redemptions. Excluding commitments designated for certain individual funds, the Participating Funds, including the Master Portfolio, can borrow up to an aggregate commitment amount of $1.75 billion at any time outstanding, subject to asset coverage and other limitations as specified in the agreement. The credit agreement has the following terms: a fee of 0.10% per annum on unused commitment amounts and interest at a rate equal to the higher of(a) one-month LIBOR (but, in any event, not less than 0.00%) on the date the loan is made plus 0.80% per annum or (b) the Fed Funds rate (but, in any event, not less than 0.00%) in effect from time to time plus 0.80% per annum on amounts borrowed. The agreement expires in April 2020 unless extended or renewed. Prior to April 18, 2019, Participating Funds paid an upfront commitment fee of 0.02% on the total commitment amounts, in addition to administration, legal and arrangement fees, which are included in miscellaneous expenses in the Statement of Operations. These fees were allocated among such funds based upon portions of the aggregate commitment available to them and relative net assets of Participating Funds. During the year ended December 31, 2019, the Master Portfolio did not borrow under the credit agreement.
In the normal course of business, the Master Portfolio invests in securities or other instruments and may enter into certain transactions, and such activities subject the Master Portfolio to various risks, including among others, fluctuations in the market (market risk) or failure of an issuer to meet all of its obligations. The value of securities or other instruments may also be affected by various factors, including, without limitation: (i) the general economy; (ii) the overall market as well as local, regional or global political and/or social instability; (iii) regulation, taxation or international tax treaties between various countries; or (iv) currency, interest rate and price fluctuations. The Master Portfolio’s prospectus provides details of the risks to which the Master Portfolio is subject.
The Master Portfolio may be exposed to additional risks when reinvesting cash collateral in money market funds that do not seek to maintain a stable NAV per share of $1.00, which may be subject to redemption gates or liquidity fees under certain circumstances.
Valuation Risk: The market values of equities, such as common stocks and preferred securities or equity related investments, such as futures and options, may decline due to general market conditions which are not specifically related to a particular company. They may also decline due to factors which affect a particular industry or industries. The Master Portfolio may invest in illiquid investments. An illiquid investment is any investment that the Master Portfolio reasonably expects cannot be sold or disposed of in current market conditions in seven calendar days or less without the sale or disposition significantly changing the market value of the investment. The Master Portfolio may experience difficulty in selling illiquid investments in a timely manner at the price that it believes the investments are worth. Prices may fluctuate widely over short or extended periods in response to company, market or economic news. Markets also tend to move in cycles, with periods of rising and falling prices. This volatility may cause the Master Portfolio’s NAV to experience significant increases or decreases over short periods of time. If there is a general decline in the securities and other markets, the NAV of the Master Portfolio may lose value, regardless of the individual results of the securities and other instruments in which the Master Portfolio invests.
The price the Master Portfolio could receive upon the sale of any particular portfolio investment may differ from the Master Portfolio’s valuation of the investment, particularly for securities that trade in thin or volatile markets or that are valued using a fair valuation technique or a price provided by an independent pricing service. Changes to significant unobservable inputs and assumptions (i.e., publicly traded company multiples, growth rate, time to exit) due to the lack of observable inputs may significantly impact the resulting fair value and therefore the Master Portfolio’s results of operations. As a result, the price received upon the sale of an investment may be less than the value ascribed by the Master Portfolio, and the Master Portfolio could realize a greater than expected loss or lesser than expected gain upon the sale of the investment. The Master Portfolio’s ability to value its investments may also be impacted by technological issues and/or errors by pricing services or other third party service providers.
Counterparty Credit Risk:The Master Portfolio may be exposed to counterparty credit risk, or the risk that an entity may fail to or be unable to perform on its commitments related to unsettled or open transactions. The Master Portfolio manages counterparty credit risk by entering into transactions only with counterparties that the Manager believes have the financial resources to honor their obligations and by monitoring the financial stability of those counterparties. Financial assets, which potentially expose the Master Portfolio to market, issuer and counterparty credit risks, consist principally of financial instruments and receivables due from counterparties. The extent of the Master Portfolio’s exposure to market, issuer and counterparty credit risks with respect to these financial assets is approximately their value recorded in the Statement of Assets and Liabilities, less any collateral held by the Master Portfolio.
A derivative contract may suffer amark-to-market loss if the value of the contract decreases due to an unfavorable change in the market rates or values of the underlying instrument. Losses can also occur if the counterparty does not perform under the contract.
With exchange-traded futures, there is less counterparty credit risk to the Master Portfolio since the exchange or clearinghouse, as counterparty to such instruments, guarantees against a possible default. The clearinghouse stands between the buyer and the seller of the contract; therefore, credit risk is limited to failure of the clearinghouse. While offset rights may exist under applicable law, the Master Portfolio does not have a contractual right of offset against a clearing broker or clearinghouse
| | |
| 18 | | 2019 BLACKROCK ANNUAL REPORTTO SHAREHOLDERS |
Notes to Financial Statements (continued)
in the event of a default (including the bankruptcy or insolvency). Additionally, credit risk exists inexchange-traded futures with respect to initial and variation margin that is held in a clearing broker’s customer accounts. While clearing brokers are required to segregate customer margin from their own assets, in the event that a clearing broker becomes insolvent or goes into bankruptcy and at that time there is a shortfall in the aggregate amount of margin held by the clearing broker for all its clients, typically the shortfall would be allocated on a pro rata basis across all the clearing broker’s customers, potentially resulting in losses to the Master Portfolio.
Concentration Risk:The Master Portfolio invests a substantial amount of its assets in issuers located in a single country or a limited number of countries. When the Master Portfolio concentrates its investments in this manner, it assumes the risk that economic, political and social conditions in those countries may have a significant impact on their investment performance. Foreign issuers may not be subject to the same uniform accounting, auditing and financial reporting standards and practices as used in the United States. Foreign securities markets may also be less liquid, more volatile, and less subject to governmental supervision not typically associated with investing in U.S. securities. Investment percentages in specific countries are presented in the Schedule of Investments.
The Master Portfolio invests a significant portion of its assets in securities of issuers located in Europe or with significant exposure to European issuers or countries. The European financial markets have recently experienced volatility and adverse trends due to concerns about economic downturns in, or rising government debt levels of, several European countries. These events may spread to other countries in Europe and may affect the value and liquidity of certain of the Master Portfolio’s investments.
Responses to the financial problems by European governments, central banks and others, including austerity measures and reforms, may not work, may result in social unrest and may limit future growth and economic recovery or have other unintended consequences. Further defaults or restructurings by governments and others of their debt could have additional adverse effects on economies, financial markets and asset valuations around the world. In addition, the United Kingdom has voted to withdraw from the European Union, and one or more other countries may withdraw from the European Union and/or abandon the Euro, the common currency of the European Union. The impact of these actions, especially if they occur in a disorderly fashion, is not clear but could be significant and far reaching.
The Master Portfolio invests a significant portion of its assets in securities of issuers located in Asia or with significant exposure to Asian issuers or countries. The Asian financial markets have recently experienced volatility and adverse trends due to concerns in several Asian countries regarding monetary policy, government intervention in the markets, rising government debt levels or economic downturns. These events may spread to other countries in Asia and may affect the value and liquidity of certain of the Master Portfolio’s investments.
Management has evaluated the impact of all subsequent events on the Master Portfolio through the date the financial statements were issued and has determined that there were no subsequent events requiring adjustment or additional disclosure in the financial statements.
| | | | |
| NOTESTO FINANCIAL STATEMENTS | | | 19 | |
Report of Independent Registered Public Accounting Firm
To the Board of Trustees of
Master Investment Portfolio and Investors of International Tilts Master Portfolio
Opinion on the Financial Statements
We have audited the accompanying statement of assets and liabilities, including the schedule of investments, of International Tilts Master Portfolio (one of the series constituting Master Investment Portfolio, referred to hereafter as the “Master Portfolio”) as of December 31, 2019, the related statement of operations for the year ended December 31, 2019, the statements of changes in net assets for each of the two years in the period ended December 31, 2019, including the related notes, and the financial highlights for each of the five years in the period ended December 31, 2019 (collectively referred to as the “financial statements”). In our opinion, the financial statements present fairly, in all material respects, the financial position of the Master Portfolio as of December 31, 2019, the results of its operations for the year then ended, the changes in its net assets for each of the two years in the period ended December 31, 2019 and the financial highlights for each of the five years in the period ended December 31, 2019 in conformity with accounting principles generally accepted in the United States of America.
Basis for Opinion
These financial statements are the responsibility of the Master Portfolio’s management. Our responsibility is to express an opinion on the Master Portfolio’s financial statements based on our audits. We are a public accounting firm registered with the Public Company Accounting Oversight Board (United States) (“PCAOB”) and are required to be independent with respect to the Master Portfolio in accordance with the U.S. federal securities laws and the applicable rules and regulations of the Securities and Exchange Commission and the PCAOB.
We conducted our audits of these financial statements in accordance with the standards of the PCAOB. Those standards require that we plan and perform the audit to obtain reasonable assurance about whether the financial statements are free of material misstatement, whether due to error or fraud.
Our audits included performing procedures to assess the risks of material misstatement of the financial statements, whether due to error or fraud, and performing procedures that respond to those risks. Such procedures included examining, on a test basis, evidence regarding the amounts and disclosures in the financial statements. Our audits also included evaluating the accounting principles used and significant estimates made by management, as well as evaluating the overall presentation of the financial statements. Our procedures included confirmation of securities owned as of December 31, 2019 by correspondence with the custodian, transfer agent and brokers. We believe that our audits provide a reasonable basis for our opinion.
/s/PricewaterhouseCoopers LLP
Philadelphia, Pennsylvania
February 27, 2020
We have served as the auditor of one or more BlackRock investment companies since 2000.
| | |
| 20 | | 2019 BLACKROCK ANNUAL REPORTTO SHAREHOLDERS |
Statement Regarding Liquidity Risk Management Program
The Securities and Exchange Commission adopted Rule 22e-4 under the Investment Company Act of 1940, as amended (the “Liquidity Rule”) to promote effective liquidity risk management throughout the open-end investment company industry, thereby reducing the risk that funds will be unable to meet their redemption obligations and mitigating dilution of the interests of fund shareholders.
The Board of Trustees (the “Board”) of Master Investment Portfolio (“MIP”), on behalf of International Tilts Master Portfolio, met on November 12-13, 2019 (the “Meeting”) to review the liquidity risk management program (the “Program”) applicable to the BlackRock open-end funds, excluding money market funds (each, a “Fund”), pursuant to the Liquidity Rule. The Board has appointed BlackRock Advisors, LLC or BlackRock Fund Advisors (“BlackRock”), each an investment adviser to certain Funds, as the program administrator for each Fund’s Program, as applicable. BlackRock has delegated oversight of the Program to the 40 Act Liquidity Risk Management Committee (the “Committee”). At the Meeting, the Committee, on behalf of BlackRock, provided the Board with a report that addressed the operation of the Program and assessed its adequacy and effectiveness of implementation, including the operation of each Fund’s Highly Liquid Investment Minimum (“HLIM”) where applicable, and any material changes to the Program (the “Report”). The Report covered the period from December 1, 2018 through September 30, 2019 (the “Program Reporting Period”).
The Report described the Program’s liquidity classification methodology for categorizing a Fund’s investments (including derivative transactions) into one of four liquidity buckets. It also described BlackRock’s methodology in establishing a Fund’s HLIM and noted that the Committee reviews and ratifies the HLIM assigned to each Fund no less frequently than annually.
The Report noted that the Program complied with the key factors for consideration under the Liquidity Rule for assessing, managing and periodically reviewing a Fund’s liquidity risk, as follows:
A. The Fund’s investment strategy and liquidity of portfolio investments during both normal and reasonably foreseeable stressed conditions:During the Program Reporting Period, the Committee reviewed whether each Fund’s strategy is appropriate for an open-end fund structure with a focus on Funds with more significant and consistent holdings of less liquid and illiquid assets. The Committee also factored a Fund’s concentration in an issuer into the liquidity classification methodology by taking issuer position sizes into account. Where a Fund participated in borrowings for investment purposes (such as tender option bonds and reverse repurchase agreements), such borrowings were factored into the Program’s calculation of a Fund’s liquidity bucketing. Derivative exposure was also considered in such calculation.
B. Short-term and long-term cash flow projections during both normal and reasonably foreseeable stressed conditions:During the Program Reporting Period, the Committee reviewed historical net redemption activity and used this information as a component to establish each Fund’s reasonably anticipated trading size (“RATS”). Each Fund has adopted an in-kind redemption policy which may be utilized to meet larger redemption requests. The Committee may also take into consideration a Fund’s shareholder ownership concentration (which, depending on product type and distribution channel, may or may not be available), a Fund’s distribution channels, and the degree of certainty associated with a Fund’s short-term and long-term cash flow projections.
C. Holdings of cash and cash equivalents, as well as borrowing arrangements:The Committee considered the terms of the credit facility applicable to the Funds, the financial health of the institution providing the facility and the fact that the credit facility is shared among multiple Funds (including that a portion of the aggregate commitment amount is specifically designated for BlackRock Floating Rate Income Portfolio and BlackRock Credit Strategies Income Fund, each a series of BlackRock Funds V). The Committee also considered other types of borrowing available to the Funds, such as the ability to use reverse repurchase agreements and interfund lending, as applicable.
There were no material changes to the Program during the Program Reporting Period. The Report provided to the Board stated that the Committee concluded that based on the operation of the functions, as described in the Report, the Program is operating as intended and is effective in implementing the requirements of the Liquidity Rule.
| | | | |
| STATEMENT REGARDING LIQUIDITY RISK MANAGEMENT PROGRAM | | | 21 | |
Trustee and Officer Information
| | | | | | | | |
| Independent Trustees (a) |
| | | | | |
Name
Year of Birth (b) | | Position(s) Held
(Length of Service) (c) | | Principal Occupation(s) During Past Five Years | | Number of BlackRock-Advised
Registered Investment Companies
(“RICs”) Consisting of
Investment Portfolios
(“Portfolios”) Overseen | | Public Company and
Other Investment Company
Directorships Held During
Past Five Years |
Mark Stalnecker 1951 | | Chair of the Board (Since 2019); Trustee
(Since 2015) | | Chief Investment Officer, University of Delaware from 1999 to 2013; Trustee and Chair of the Finance and Investment Committees, Winterthur Museum and Country Estate from 2005 to 2016; Member of the Investment Committee, Delaware Public Employees’ Retirement System since 2002; Member of the Investment Committee, Christiana Care Health System from 2009 to 2017; Member of the Investment Committee, Delaware Community Foundation from 2013 to 2014; Director and Chair of the Audit Committee, SEI Private Trust Co. from 2001 to 2014. | | 37 RICs consisting of 177 Portfolios | | None |
Bruce R. Bond 1946 | | Trustee
(Since 2019) | | Board Member, Amsphere Limited (software) since 2018; Trustee and Member of the Governance Committee, State Street Research Mutual Funds from 1997 to 2005; Board Member of Governance, Audit and Finance Committee, Avaya Inc. (computer equipment) from 2003 to 2007. | | 37 RICs consisting of 177 Portfolios | | None |
Susan J. Carter 1956 | | Trustee
(Since 2016) | | Director, Pacific Pension Institute from 2014 to 2018; Advisory Board Member, Center for Private Equity and Entrepreneurship at Tuck School of Business since 1997; Senior Advisor, Commonfund Capital, Inc. (“CCI”) (investment adviser) in 2015; Chief Executive Officer, CCI from 2013 to 2014; President & Chief Executive Officer, CCI from 1997 to 2013; Advisory Board Member, Girls Who Invest from 2015 to 2018 and Board Member thereof since 2018; Advisory Board Member, Bridges Fund Management since 2016; Trustee, Financial Accounting Foundation since 2017; Practitioner Advisory Board Member, Private Capital Research Institute (“PCRI”) since 2017. | | 37 RICs consisting of 177 Portfolios | | None |
Collette Chilton 1958 | | Trustee
(Since 2015) | | Chief Investment Officer, Williams College since 2006; Chief Investment Officer, Lucent Asset Management Corporation from 1998 to 2006. | | 37 RICs consisting of 177 Portfolios | | None |
Neil A. Cotty 1954 | | Trustee
(Since 2016) | | Bank of America Corporation from 1996 to 2015, serving in various senior finance leadership roles, including Chief Accounting Officer from 2009 to 2015, Chief Financial Officer of Global Banking, Markets and Wealth Management from 2008 to 2009, Chief Accounting Officer from 2004 to 2008, Chief Financial Officer of Consumer Bank from 2003 to 2004, Chief Financial Officer of Global Corporate Investment Bank from 1999 to 2002. | | 37 RICs consisting of 177 Portfolios | | None |
Lena G. Goldberg 1949 | | Trustee
(Since 2019) | | Senior Lecturer, Harvard Business School, since 2008; Director, Charles Stark Draper Laboratory, Inc. since 2013; FMR LLC/Fidelity Investments (financial services) from 1996 to 2008, serving in various senior roles including Executive Vice President — Strategic Corporate Initiatives and Executive Vice President and General Counsel; Partner, Sullivan & Worcester LLP from 1985 to 1996 and Associate thereof from 1979 to 1985. | | 37 RICs consisting of 177 Portfolios | | None |
Robert M. Hernandez 1944 | | Trustee
(Since 2019) | | Director, Vice Chairman and Chief Financial Officer of USX Corporation (energy and steel business) from 1991 to 2001; Director andnon-executive Chairman, RTI International Metals, Inc. from 1990 to 2015; Director, TE Connectivity (electronics) from 2006 to 2012. | | 37 RICs consisting of 177 Portfolios | | Chubb Limited (insurance company); Eastman Chemical Company |
| | |
| 22 | | 2019 BLACKROCK ANNUAL REPORTTO SHAREHOLDERS |
Trustee and Officer Information (continued)
| | | | | | | | |
| Independent Trustees (a)(continued) |
| | | | | |
Name
Year of Birth (b) | | Position(s) Held
(Length of Service) (c) | | Principal Occupation(s) During Past Five Years | | Number of BlackRock-Advised
Registered Investment Companies
(“RICs”) Consisting of
Investment Portfolios
(“Portfolios”) Overseen | | Public Company and
Other Investment Company
Directorships Held During
Past Five Years |
Henry R. Keizer 1956 | | Trustee
(Since 2019) | | Director, Park Indemnity Ltd. (captive insurer) since 2010; Director, MUFG Americas Holdings Corporation and MUFG Union Bank, N.A. (financial and bank holding company) from 2014 to 2016; Director, American Institute of Certified Public Accountants from 2009 to 2011; Director, KPMG LLP (audit, tax and advisory services) from 2004 to 2005 and 2010 to 2012; Director, KPMG International in 2012, Deputy Chairman and Chief Operating Officer thereof from 2010 to 2012 and U.S. Vice Chairman of Audit thereof from 2005 to 2010; Global Head of Audit, KPMGI (consortium of KPMG firms) from 2006 to 2010; Director, YMCA of Greater New York from 2006 to 2010. | | 37 RICs consisting of 177 Portfolios | | Hertz Global Holdings (car rental); Montpelier Re Holdings, Ltd. (publicly held property and casualty reinsurance) from 2013 until 2015; Sealed Air Corp. (packaging); WABCO (commercial vehicle safety systems) |
Cynthia A. Montgomery 1952 | | Trustee
(Since 2009) | | Professor, Harvard Business School since 1989. | | 37 RICs consisting of 177 Portfolios | | Newell Rubbermaid, Inc. (manufacturing) |
Donald C. Opatrny 1952 | | Trustee
(Since 2019) | | Trustee, Vice Chair, Member of the Executive Committee and Chair of the Investment Committee, Cornell University since 2004; President, Trustee and Member of the Investment Committee, The Aldrich Contemporary Art Museum from 2007 to 2014; Member of the Board and Investment Committee, University School from 2007 to 2018; Member of the Investment Committee, Mellon Foundation from 2009 to 2015; Trustee, Artstor (a Mellon Foundation affiliate) from 2010 to 2015; President and Trustee, the Center for the Arts, Jackson Hole from 2011 to 2018; Director, Athena Capital Advisors LLC (investment management firm) since 2013; Trustee and Chair of the Investment Committee, Community Foundation of Jackson Hole since 2014; Member of Affordable Housing Supply Board of Jackson, Wyoming since 2018; Member, Investment Funds Committee, State of Wyoming since 2017; Trustee, Phoenix Art Museum since 2018. | | 37 RICs consisting of 177 Portfolios | | None |
Joseph P. Platt 1947 | | Trustee
(Since 2009) | | General Partner, Thorn Partners, LP (private investments) since 1998; Director, WQED Multi-Media (public broadcastingnot-for-profit) since 2001; Chair, Basic Health International(non-profit) since 2015. | | 37 RICs consisting of 177 Portfolios | | Greenlight Capital Re, Ltd. (reinsurance company); Consol Energy Inc. |
Kenneth L. Urish 1951 | | Trustee
(Since 2009) | | Managing Partner, Urish Popeck & Co., LLC (certified public accountants and consultants) since 1976; Past-Chairman of the Professional Ethics Committee of the Pennsylvania Institute of Certified Public Accountants and Committee Member thereof since 2007; Member of External Advisory Board, The Pennsylvania State University Accounting Department since founding in 2001; Principal, UP Strategic Wealth Investment Advisors, LLC since 2013; Trustee, The Holy Family Institute from 2001 to 2010; President and Trustee, Pittsburgh Catholic Publishing Associates from 2003 to 2008; Director,Inter-Tel from 2006 to 2007. | | 37 RICs consisting of 177 Portfolios | | None |
Claire A. Walton 1957 | | Trustee
(Since 2016) | | Chief Operating Officer and Chief Financial Officer of Liberty Square Asset Management, LP from 1998 to 2015; General Partner of Neon Liberty Capital Management, LLC since 2003; Director, Boston Hedge Fund Group from 2009 to 2018; Director, Woodstock Ski Runners since 2013; Director, Massachusetts Council on Economic Education from 2013 to 2015. | | 37 RICs consisting of 177 Portfolios | | None |
| | | | |
| TRUSTEEAND OFFICER INFORMATION | | | 23 | |
Trustee and Officer Information (continued)
| | | | | | | | |
| Interested Trustees (a)(d) |
| | | | | |
Name
Year of Birth (b) | | Position(s) Held
(Length of Service) (c) | | Principal Occupation(s) During Past Five Years | | Number of BlackRock-Advised
Registered Investment Companies
(“RICs”) Consisting of
Investment Portfolios
(“Portfolios”) Overseen | | Public Company and
Other Investment Company
Directorships Held During
Past Five Years |
Robert Fairbairn 1965 | | Trustee
(Since 2018) | | Vice Chairman of BlackRock, Inc. since 2019; Member of BlackRock’s Global Executive and Global Operating Committees;Co-Chair of BlackRock’s Human Capital Committee; Senior Managing Director of BlackRock, Inc. from 2010 to 2019; oversaw BlackRock’s Strategic Partner Program and Strategic Product Management Group from 2012 to 2019; Member of the Board of Managers of BlackRock Investments, LLC from 2011 to 2018; Global Head of BlackRock’s Retail and iShares® businesses from 2012 to 2016. | | 123 RICs consisting of 287 Portfolios | | None |
John M. Perlowski (e) 1964 | | Trustee
(Since 2015); President and Chief Executive Officer
(Since 2010) | | Managing Director of BlackRock, Inc. since 2009; Head of BlackRock Global Accounting and Product Services since 2009; Advisory Director of Family Resource Network (charitable foundation) since 2009. | | 124 RICs consisting of 288 Portfolios | | None |
(a) The address of each Trustee is c/o BlackRock, Inc., 55 East 52nd Street, New York, New York 10055. (b) Independent Trustee serve until their resignation, retirement, removal or death, or until December 31 of the year in which they turn 75. The Board may determine to extend the terms of Independent Trustees on acase-by-case basis, as appropriate. (c) In connection with the acquisition of Barclays Global Investors by BlackRock, Inc. in December 2009, certain Independent Trustees were elected to the Board. Furthermore, effective January 1, 2019, three BlackRock Fund Complexes were realigned and consolidated into two BlackRock Fund Complexes. As a result, although the chart shows the year that each Independent Trustee joined the Board, certain Independent Trustees first became members of the boards of other BlackRock-advised Funds or legacy BlackRock funds as follows: Bruce R. Bond, 2005; Robert M. Hernandez, 1996; Cynthia A. Montgomery, 1994; Joseph P. Platt, 1999; Kenneth L. Urish, 1999; Lena G. Goldberg, 2016; Henry R. Keizer, 2016; Donald C. Opatrny, 2015. (d) Mr. Fairbairn and Mr. Perlowski are both “interested persons,” as defined in the 1940 Act, of MIP based on their positions with BlackRock, Inc. and its affiliates. Mr. Fairbairn and Mr. Perlowski are also board members of the BlackRock Fixed-Income Complex. (e) Mr. Perlowski is also a trustee of the BlackRock Credit Strategies Fund. |
| | |
| 24 | | 2019 BLACKROCK ANNUAL REPORTTO SHAREHOLDERS |
Trustee and Officer Information (continued)
| | | | |
| Officers Who Are Not Trustees (a) |
| | | |
Name
Year of Birth (b) | | Position(s) Held
(Length of Service) | | Principal Occupation(s) During Past Five Years |
Thomas Callahan 1968 | | Vice President
(Since 2016) | | Managing Director of BlackRock, Inc. since 2013; Member of the Board of Managers of BlackRock Investments, LLC (principal underwriter) since 2019 and Managing Director thereof since 2017; Head of BlackRock’s Global Cash Management Business since 2016;Co-Head of the Global Cash Management Business from 2014 to 2016; Deputy Head of the Global Cash Management Business from 2013 to 2014; Member of the Cash Management Group Executive Committee since 2013; Chief Executive Officer of NYSE Liffe U.S. from 2008 to 2013. |
Jennifer McGovern 1977 | | Vice President
(Since 2014) | | Managing Director of BlackRock, Inc. since 2016; Director of BlackRock, Inc. from 2011 to 2015; Head of Product Development and Oversight for BlackRock’s Strategic Product Management Group since 2019; Head of Product Structure and Oversight for BlackRock’s U.S. Wealth Advisory Group from 2013 to 2019. |
Neal J. Andrews 1966 | | Chief Financial Officer
(Since 2009) | | Chief Financial Officer of the iShares® exchange traded funds since 2019; Managing Director of BlackRock, Inc. since 2006. |
Jay M. Fife 1970 | | Treasurer
(Since 2009) | | Managing Director of BlackRock, Inc. since 2007. |
Charles Park 1967 | | Chief Compliance Officer
(Since 2014) | | Anti-Money Laundering Compliance Officer for certain BlackRock-advised Funds from 2014 to 2015; Chief Compliance Officer of BlackRock Advisors, LLC and the BlackRock-advised Funds in the BlackRock Multi-Asset Complex and the BlackRock Fixed-Income Complex since 2014; Principal of and Chief Compliance Officer for iShares® Delaware Trust Sponsor LLC since 2012 and BlackRock Fund Advisors (“BFA”) since 2006; Chief Compliance Officer for theBFA-advised iShares® exchange traded funds since 2006; Chief Compliance Officer for BlackRock Asset Management International Inc. since 2012. |
Lisa Belle 1968 | | Anti-Money Laundering Compliance Officer
(Since 2019) | | Managing Director of BlackRock, Inc. since 2019; Global Financial Crime Head for Asset and Wealth Management of JP Morgan from 2013 to 2019; Managing Director of RBS Securities from 2012 to 2013; Head of Financial Crimes for Barclays Wealth Americas from 2010 to 2012. |
Janey Ahn 1975 | | Secretary
(Since 2019) | | Managing Director of BlackRock, Inc. since 2018; Director of BlackRock, Inc. from 2009 to 2017. |
(a) The address of each Officer is c/o BlackRock, Inc., 55 East 52nd Street, New York, New York 10055. (b) Officers of MIP serve at the pleasure of the Board. |
Further information about MIP’s Trustees and Officers is available in the Master Portfolio’s Statement of Additional Information, which can be obtained without charge by calling (800)441-7762.
Effective September 19, 2019, Lisa Belle replaced John MacKessy as the Anti-Money Laundering Compliance Officer of MIP.
Effective September 19, 2019, Janey Ahn replaced Benjamin Archibald as the Secretary of MIP.
Effective December 31, 2019, Robert M. Hernandez retired as Trustee of MIP.
Investment Adviser and Administrator
BlackRock Advisors, LLC
Wilmington, DE 19809
Sub-Advisers
BlackRock Fund Advisors
San Francisco, CA 94105
BlackRock International Limited
Edinburgh EH3 8BL, United Kingdom
Accounting Agent and Custodian
State Street Bank and Trust Company
Boston, MA 02111
Transfer Agent
BNY Mellon Investment Servicing (US) Inc.
Wilmington, DE 19809
Independent Registered Public Accounting Firm
PricewaterhouseCoopers LLP
Philadelphia, PA 19103
Legal Counsel
Sidley Austin LLP
New York, NY 10019
Address of MIP
400 Howard Street
San Francisco, CA 94105
| | | | |
| TRUSTEEAND OFFICER INFORMATION | | | 25 | |
Additional Information
Availability of Quarterly Schedule of Investments
The Master Portfolio files its complete schedule of portfolio holdings with the SEC for the first and third quarters of each fiscal year as an exhibit to its reports onForm N-PORT, and for reporting periods ended prior to March 31, 2019, filed such information onForm N-Q. The Master Portfolio’s Forms N-PORT andN-Q are available on the SEC’s website at sec.gov. The Master Portfolio’s FormN-Q may also be obtained upon request and without charge by calling(800) 441-7762.
Availability of Proxy Voting Policies and Procedures
A description of the policies and procedures that the Master Portfolio uses to determine how to vote proxies relating to portfolio securities is available upon request and without charge (1) by calling(800) 441-7762; (2) atblackrock.com; and (3) on the SEC’s website at sec.gov.
Availability of Proxy Voting Record
Information about how the Master Portfolio voted proxies relating to securities held in the Master Portfolio’s portfolio during the most recent12-month period ended June 30 is available upon request and without charge (1) atblackrock.com or by calling(800) 441-7762 and (2) on the SEC’s website at sec.gov.
| | | | |
| ADDITIONAL INFORMATION | | | 26 | |
| | |
| Item 2 – | | Code of Ethics – Each registrant (or each, a “Fund”) has adopted a code of ethics, as of the end of the period covered by this report, applicable to the registrants’ principal executive officer, principal financial officer, principal accounting officer or controller, or persons performing similar functions. During the period covered by this report, the code of ethics was amended to update certain information and to make othernon-material changes. During the period covered by this report, there have been no waivers granted under the code of ethics. The registrants undertake to provide a copy of the code of ethics to any person upon request, without charge, who calls1-800-441-7762. |
| |
| Item 3 – | | Audit Committee Financial Expert – Each registrant’s board of directors (the “board of directors”), has determined that (i) the registrant has the following audit committee financial expert serving on its audit committee and (ii) each audit committee financial expert is independent: |
| |
| | Neil A. Cotty Robert M. Hernandez Henry R. Keizer Kenneth L. Urish Claire A. Walton |
| |
| | Under applicable securities laws, a person determined to be an audit committee financial expert will not be deemed an “expert” for any purpose, including without limitation for the purposes of Section 11 of the Securities Act of 1933, as a result of being designated or identified as an audit committee financial expert. The designation or identification of a person as an audit committee financial expert does not impose on such person any duties, obligations, or liabilities greater than the duties, obligations, and liabilities imposed on such person as a member of the audit committee and board of directors in the absence of such designation or identification. The designation or identification of a person as an audit committee financial expert does not affect the duties, obligations, or liability of any other member of the audit committee or board of directors. |
| | |
| Item 4 – | | Principal Accountant Fees and Services |
| |
| | The following table presents fees billed by PricewaterhouseCoopers LLP (“PwC”) in each of the last two fiscal years for the services rendered to the Funds: |
| | | | | | | | | | | | | | | | |
| | | | | |
| | | (a) Audit Fees | | (b) Audit-Related Fees1 | | (c) Tax Fees2 | | (d) All Other Fees |
| | | | | | | | | |
Entity Name | | Current
Fiscal Year End | | Previous Fiscal Year
End | | Current Fiscal Year End | | Previous Fiscal Year End | | Current
Fiscal
Year End | | Previous
Fiscal Year End | | Current Fiscal
Year End | | Previous Fiscal Year End |
| BlackRock Cash Funds: Institutional | | $11,000 | | $11,000 | | $0 | | $0 | | $2,900 | | $2,900 | | $0 | | $0 |
| | | | | | | | | |
| BlackRock Cash Funds: Treasury | | $11,000 | | $11,000 | | $0 | | $0 | | $2,900 | | $2,900 | | $0 | | $0 |
| BlackRock LifePath Dynamic Retirement Fund | | $11,000 | | $11,000 | | $0 | | $0 | | $8,100 | | $8,100 | | $0 | | $0 |
| BlackRock LifePath Dynamic 2025 Fund | | $11,000 | | $11,000 | | $0 | | $0 | | $8,100 | | $8,100 | | $0 | | $0 |
| BlackRock LifePath Dynamic 2030 Fund | | $11,000 | | $11,000 | | $0 | | $0 | | $8,100 | | $8,100 | | $0 | | $0 |
| BlackRock LifePath Dynamic 2035 Fund | | $11,000 | | $11,000 | | $0 | | $0 | | $8,100 | | $8,100 | | $0 | | $0 |
| BlackRock LifePath Dynamic 2040 Fund | | $11,000 | | $11,000 | | $0 | | $0 | | $8,100 | | $8,100 | | $0 | | $0 |
| BlackRock LifePath Dynamic 2045 Fund | | $11,000 | | $11,000 | | $0 | | $0 | | $8,100 | | $8,100 | | $0 | | $0 |
| BlackRock LifePath Dynamic 2050 Fund | | $11,000 | | $11,023 | | $0 | | $0 | | $8,100 | | $8,100 | | $0 | | $0 |
3
| | | | | | | | | | | | | | | | |
| BlackRock LifePath Dynamic 2055 Fund | | $11,000 | | $11,000 | | $0 | | $0 | | $8,100 | | $8,100 | | $0 | | $0 |
| BlackRock LifePath Dynamic 2060 Fund | | $11,000 | | $9,921 | | $0 | | $0 | | $8,100 | | $8,100 | | $0 | | $0 |
| Blackrock LifePath Dynamic 2065 Fund | | $9,900 | | N/A | | $0 | | N/A | | $11,000 | | N/A | | $0 | | N/A |
| iShares MSCI Total International Index Fund | | $11,000 | | $11,000 | | $0 | | $0 | | $8,100 | | $8,100 | | $0 | | $0 |
| iShares Russell 1000Large-Cap Index Fund | | $11,000 | | $11,000 | | $0 | | $0 | | $8,100 | | $8,100 | | $0 | | $0 |
| | | | | | | | | |
| iShares S&P 500 Index Fund | | $12,200 | | $11,000 | | $0 | | $0 | | $8,100 | | $8,100 | | $0 | | $0 |
| iShares U.S. Aggregate Bond Index Fund | | $12,200 | | $11,000 | | $0 | | $0 | | $8,100 | | $8,100 | | $0 | | $0 |
| | | | | | | | | |
| Active Stock Master Portfolio | | $22,000 | | $22,000 | | $0 | | $0 | | $20,700 | | $20,700 | | $0 | | $0 |
| | | | | | | | | |
| International Tilts Master Portfolio | | $22,000 | | $22,000 | | $0 | | $0 | | $15,600 | | $15,600 | | $0 | | $0 |
| | | | | | | | | |
| Large Cap Index Master Portfolio | | $22,000 | | $22,000 | | $0 | | $0 | | $17,600 | | $15,600 | | $0 | | $0 |
| LifePath Dynamic Retirement Master Portfolio | | $15,300 | | $15,300 | | $0 | | $0 | | $15,600 | | $15,600 | | $0 | | $0 |
| LifePath Dynamic 2025 Master Portfolio | | $15,300 | | $15,300 | | $0 | | $0 | | $15,600 | | $15,600 | | $0 | | $0 |
| LifePath Dynamic 2030 Master Portfolio | | $15,300 | | $15,300 | | $0 | | $0 | | $15,600 | | $15,600 | | $0 | | $0 |
| LifePath Dynamic 2035 Master Portfolio | | $15,300 | | $15,300 | | $0 | | $0 | | $15,600 | | $15,600 | | $0 | | $0 |
| LifePath Dynamic 2040 Master Portfolio | | $15,300 | | $15,300 | | $0 | | $0 | | $15,600 | | $15,600 | | $0 | | $0 |
| LifePath Dynamic 2045 Master Portfolio | | $15,300 | | $15,300 | | $0 | | $0 | | $15,600 | | $15,600 | | $0 | | $0 |
| LifePath Dynamic 2050 Master Portfolio | | $15,300 | | $15,300 | | $0 | | $0 | | $15,600 | | $15,600 | | $0 | | $0 |
| LifePath Dynamic 2055 Master Portfolio | | $15,300 | | $15,300 | | $0 | | $0 | | $15,600 | | $15,600 | | $0 | | $0 |
| LifePath Dynamic 2060 Master Portfolio | | $15,300 | | $15,300 | | $0 | | $0 | | $15,600 | | $15,600 | | $0 | | $0 |
| LifePath Dynamic 2065 Master Portfolio | | $13,770 | | N/A | | $0 | | N/A | | $0 | | N/A | | $0 | | N/A |
| | | | | | | | | |
| Money Market Master Portfolio | | $12,400 | | $12,400 | | $0 | | $0 | | $0 | | $0 | | $0 | | $0 |
| | | | | | | | | |
| S&P 500 Index Master Portfolio | | $22,000 | | $20,000 | | $0 | | $0 | | $15,600 | | $15,600 | | $0 | | $0 |
| Total International ex U.S. Index Master Portfolio | | $22,000 | | $22,000 | | $0 | | $0 | | $15,600 | | $15,600 | | $0 | | $0 |
| Treasury Money Market Master Portfolio | | $12,400 | | $12,400 | | $0 | | $0 | | $7,100 | | $7,100 | | $0 | | $0 |
| U.S. Total Bond Index Master Portfolio | | $24,100 | | $24,100 | | $0 | | $0 | | $17,600 | | $15,600 | | $0 | | $0 |
The following table presents fees billed by PwC that were required to be approved by each registrant’s audit committee (each a “Committee”) for services that relate directly to the operations or financial reporting of each Fund and that are rendered on behalf of BlackRock Advisors, LLC (the “investment adviser” or “BlackRock”) and entities controlling, controlled by, or under common control with BlackRock (not including anysub-adviser whose role is primarily portfolio management and is subcontracted with or overseen by another investment adviser) that provide ongoing services to each Fund (“Affiliated Service Providers”):
| | | | |
| | | Current Fiscal Year End | | Previous Fiscal Year End |
(b) Audit-Related Fees1 | | $0 | | $0 |
(c) Tax Fees2 | | $0 | | $0 |
(d) All Other Fees3 | | $0 | | $0 |
4
1 The nature of the services includes assurance and related services reasonably related to the performance of the audit or review of financial statements not included in Audit Fees, including accounting consultations, agreed-upon procedure reports, attestation reports, comfort letters,out-of-pocket expenses and internal control reviews not required by regulators.
2 The nature of the services includes tax compliance and/or tax preparation, including services relating to the filing or amendment of federal, state or local income tax returns, regulated investment company qualification reviews, taxable income and tax distribution calculations.
3 Aggregate fees borne by BlackRock in connection with the review of compliance procedures and attestation thereto performed by PwC with respect to all of the registeredclosed-end funds and some of the registeredopen-end funds advised by BlackRock.
(e)(1) Audit CommitteePre-Approval Policies and Procedures:
Each Committee has adopted policies and procedures with regard to thepre-approval of services. Audit, audit-related and tax compliance services provided to the registrant on an annual basis require specificpre-approval by the registrant’s Committee. The Committee also must approve othernon-audit services provided to the registrant and thosenon-audit services provided to the Investment Adviser and Affiliated Service Providers that relate directly to the operations and the financial reporting of the registrant. Certain of thesenon-audit services that the Committee believes are (a) consistent with the SEC’s auditor independence rules and (b) routine and recurring services that will not impair the independence of the independent accountants may be approved by the Committee without consideration on a specificcase-by-case basis (“generalpre-approval”). The term of any generalpre-approval is 12 months from the date of thepre-approval, unless the Committee provides for a different period. Tax or othernon-audit services provided to the registrant which have a direct impact on the operations or financial reporting of the registrant will only be deemedpre-approved provided that any individual project does not exceed $10,000 attributable to the registrant or $50,000 per project. For this purpose, multiple projects will be aggregated to determine if they exceed the previously mentioned cost levels.
Any proposed services exceeding thepre-approved cost levels will require specificpre-approval by the registrant’s Committee, as will any other services not subject to generalpre-approval (e.g., unanticipated but permissible services). The Committee is informed of each service approved subject to generalpre-approval at the next regularly scheduledin-person board meeting. At this meeting, an analysis of such services is presented to the Committee for ratification. The Committee may delegate to the Committee Chairman the authority to approve the provision of and fees for any specific engagement of permittednon-audit services, including services exceedingpre-approved cost levels.
(e)(2) None of the services described in each of Items 4(b) through (d) were approved by either Committee pursuant to the de minimus exception in paragraph (c)(7)(i)(C) of Rule2-01 of RegulationS-X.
(f) Not Applicable
(g) The aggregatenon-audit fees, defined as the sum of the fees shown under “Audit-Related Fees,” “Tax Fees” and “All Other Fees,” paid to the accountant for services rendered by the accountant to the registrant, the Investment Adviser and the Affiliated Service Providers were:
| | | | | | | | |
| | | Entity Name | | Current Fiscal Year End | | Previous Fiscal Year End | | |
| | | | |
| | BlackRock Cash Funds: Institutional | | $2,900 | | $2,900 | | |
| | | | |
| | | BlackRock Cash Funds: Treasury | | $2,900 | | $2,900 | | |
| | | | |
| | BlackRock LifePath Dynamic Retirement Fund | | $8,100 | | $8,100 | | |
| | | | |
| | BlackRock LifePath Dynamic 2025 Fund | | $8,100 | | $8,100 | | |
| | | | |
| | BlackRock LifePath Dynamic 2030 Fund | | $8,100 | | $8,100 | | |
| | | | |
| | BlackRock LifePath Dynamic 2035 Fund | | $8,100 | | $8,100 | | |
| | | | |
| | BlackRock LifePath Dynamic 2040 Fund | | $8,100 | | $8,100 | | |
| | | | |
| | BlackRock LifePath Dynamic 2045 Fund | | $8,100 | | $8,100 | | |
5
| | | | | | | | |
| | | | |
| | BlackRock LifePath Dynamic 2050 Fund | | $8,100 | | $8,100 | | |
| | | | |
| | BlackRock LifePath Dynamic 2055 Fund | | $8,100 | | $8,100 | | |
| | | | |
| | BlackRock LifePath Dynamic 2060 Fund | | $8,100 | | $8,100 | | |
| | | | |
| | BlackRock LifePath Dynamic 2065 Fund | | $11,000 | | N/A | | |
| | | | |
| | iShares MSCI Total International Index Fund | | $8,100 | | $8,100 | | |
| | | | |
| | iShares Russell 1000Large-Cap Index Fund | | $8,100 | | $8,100 | | |
| | | | |
| | iShares S&P 500 Index Fund | | $8,100 | | $8,100 | | |
| | | | |
| | iShares U. S. Aggregate Bond Index Fund | | $8,100 | | $8,100 | | |
| | | | |
| | Active Stock Master Portfolio | | $20,700 | | $20,700 | | |
| | | | |
| | International Tilts Master Portfolio | | $15,600 | | $15,600 | | |
| | | | |
| | Large Cap Index Master Portfolio | | $17,600 | | $15,600 | | |
| | | | |
| | LifePath Dynamic Retirement Master Portfolio | | $15,600 | | $15,600 | | |
| | | | |
| | LifePath Dynamic 2025 Master Portfolio | | $15,600 | | $15,600 | | |
| | | | |
| | LifePath Dynamic 2030 Master Portfolio | | $15,600 | | $15,600 | | |
| | | | |
| | LifePath Dynamic 2035 Master Portfolio | | $15,600 | | $15,600 | | |
| | | | |
| | LifePath Dynamic 2040 Master Portfolio | | $15,600 | | $15,600 | | |
| | | | |
| | LifePath Dynamic 2045 Master Portfolio | | $15,600 | | $15,600 | | |
| | | | |
| | LifePath Dynamic 2050 Master Portfolio | | $15,600 | | $15,600 | | |
| | | | |
| | LifePath Dynamic 2055 Master Portfolio | | $15,600 | | $15,600 | | |
| | | | |
| | LifePath Dynamic 2060 Master Portfolio | | $15,600 | | $15,600 | | |
| | | | |
| | LifePath Dynamic 2065 Master Portfolio | | $0 | | N/A | | |
| | | | |
| | Money Market Master Portfolio | | $0 | | $0 | | |
| | | | |
| | S&P 500 Index Master Portfolio | | $15,600 | | $15,600 | | |
| | | | |
| | Total International ex U.S. Index Master Portfolio | | $15,600 | | $15,600 | | |
| | | | |
| | Treasury Money Market Master Portfolio | | $7,100 | | $7,100 | | |
| | | | |
| | U.S. Total Bond Index Master Portfolio | | $17,600 | | $15,600 | | |
(h) Each Committee has considered and determined that the provision ofnon-audit services that were rendered to the Investment Adviser and the Affiliated Service Providers that were notpre-approved pursuant to paragraph (c)(7)(ii) ofRule 2-01 of RegulationS-X is compatible with maintaining the principal accountant’s independence.
| Item 5 – | Audit Committee of Listed Registrants – Not Applicable |
(a) The registrants’ Schedules of Investments are included as part of the Report to Stockholders filed under Item 1 of this Form.
(b) Not Applicable due to no such divestments during the semi-annual period covered since the previous FormN-CSR filing.
| Item 7 – | Disclosure of Proxy Voting Policies and Procedures forClosed-End Management Investment Companies – Not Applicable |
| Item 8 – | Portfolio Managers ofClosed-End Management Investment Companies – Not Applicable |
| Item 9 – | Purchases of Equity Securities byClosed-End Management Investment Company and Affiliated Purchasers – Not Applicable |
6
| Item 10 – | Submission of Matters to a Vote of Security Holders – There have been no material changes to these procedures. |
| Item 11 – | Controls and Procedures |
(a) – The registrants’ principal executive and principal financial officers, or persons performing similar functions, have concluded that the registrants’ disclosure controls and procedures (as defined in Rule30a-3(c) under the Investment Company Act of 1940, as amended (the “1940 Act”)) are effective as of a date within 90 days of the filing of this report based on the evaluation of these controls and procedures required by Rule30a-3(b) under the 1940 Act and Rule 15(d)-15(b) under the Securities Exchange Act of 1934, as amended.
(b) – There were no changes in the registrants’ internal control over financial reporting (as defined in Rule30a-3(d) under the 1940 Act) that occurred during the period covered by this report that have materially affected, or are reasonably likely to materially affect, the registrants’ internal control over financial reporting.
| Item 12 – | Disclosure of Securities Lending Activities forClosed-End Management Investment Companies – Not Applicable to the registrants. |
| Item 13 – | Exhibits attached hereto |
(a)(1) Code of Ethics – See Item 2
(a)(2) Certifications – Attached hereto
(a)(3) Not Applicable
(a)(4) Not Applicable
(b) Certifications – Attached hereto
7
| | |
| Pursuant to the requirements of the Securities Exchange Act of 1934 and the Investment Company Act of 1940, each registrant has duly caused this report to be signed on its behalf by the undersigned, thereunto duly authorized. |
BlackRock Funds III and Master Investment Portfolio |
| |
| By: | | /s/ John M. Perlowski |
| | John M. Perlowski |
| | Chief Executive Officer (principal executive officer) of |
| | BlackRock Funds III and Master Investment Portfolio |
|
| Date: March 6, 2020 |
|
| Pursuant to the requirements of the Securities Exchange Act of 1934 and the Investment Company Act of 1940, this report has been signed below by the following persons on behalf of each registrant and in the capacities and on the dates indicated. |
| |
| By: | | /s/ John M. Perlowski |
| | John M. Perlowski |
| | Chief Executive Officer (principal executive officer) of |
| | BlackRock Funds III and Master Investment Portfolio |
|
| Date: March 6, 2020 |
| |
| By: | | /s/ Neal J. Andrews |
| | Neal J. Andrews |
| | Chief Financial Officer (principal financial officer) of |
| | BlackRock Funds III and Master Investment Portfolio |
|
| Date: March 6, 2020 |
8