UNITED STATES
SECURITIES AND EXCHANGE COMMISSION
Washington, D.C. 20549
FORM N-CSR
CERTIFIED SHAREHOLDER REPORT OF REGISTERED MANAGEMENT
INVESTMENT COMPANIES
Investment Company Act file number: 811-07332 and 811-08162
| Name of Fund: | | BlackRock Funds III |
| | | BlackRock Cash Funds: Institutional |
| | | BlackRock Cash Funds: Treasury |
| | | BlackRock LifePath® Dynamic 2025 Fund |
| | | BlackRock LifePath® Dynamic 2030 Fund |
| | | BlackRock LifePath® Dynamic 2035 Fund |
| | | BlackRock LifePath® Dynamic 2040 Fund |
| | | BlackRock LifePath® Dynamic 2045 Fund |
| | | BlackRock LifePath® Dynamic 2050 Fund |
| | | BlackRock LifePath® Dynamic 2055 Fund |
| | | BlackRock LifePath® Dynamic 2060 Fund |
| | | BlackRock LifePath® Dynamic 2065 Fund |
| | | BlackRock LifePath® Dynamic Retirement Fund |
| | | iShares MSCI Total International Index Fund |
| | | iShares Russell 1000 Large-Cap Index Fund |
| | | iShares S&P 500 Index Fund |
| | | iShares U.S. Aggregate Bond Index Fund |
| | | Master Investment Portfolio |
| | | Diversified Equity Master Portfolio |
| | | International Tilts Master Portfolio |
| | | Large Cap Index Master Portfolio |
| | | Money Market Master Portfolio |
| | | S&P 500 Index Master Portfolio |
| | | Total International ex U.S. Index Master Portfolio |
| | | Treasury Money Market Master Portfolio |
| | | U.S. Total Bond Index Master Portfolio |
| Fund Address: 100 | | Bellevue Parkway, Wilmington, DE 19809 |
Name and address of agent for service: John M. Perlowski, Chief Executive Officer, BlackRock Funds III
and Master Investment Portfolio, 55 East 52nd Street, New York, NY 10055
Registrants’ telephone number, including area code: (800) 537-4942
Date of fiscal year end: 12/31/2021
Date of reporting period: 12/31/2021
Item 1 – Report to Stockholders
(a) The Report to Shareholders is attached herewith.
| | |

| | DECEMBER 31, 2021 |
BlackRock Funds III
| · | | BlackRock Cash Funds: Institutional |
| · | | BlackRock Cash Funds: Treasury |
|
Not FDIC Insured • May Lose Value • No Bank Guarantee |
The Markets in Review
Dear Shareholder,
The 12-month reporting period as of December 31, 2021 saw a continuation of the resurgent growth that followed the initial coronavirus (or “COVID-19”) pandemic reopening, albeit at a slower pace. The global economy weathered the emergence of several variant strains and the resulting peaks and troughs in infections amid optimism that increasing vaccinations and economic adaptation could help contain the pandemic’s disruptions. Continued growth meant that the U.S. economy regained and then surpassed its pre-pandemic output. However, a rapid rebound in consumer spending pushed up against supply constraints and led to elevated inflation.
Equity prices rose with the broader economy, as the implementation of mass vaccination campaigns and passage of an additional fiscal stimulus package and infrastructure bill further boosted stocks. In the United States, both large- and small-capitalization stocks posted a strong advance, and many equity indices neared or surpassed all-time highs late in the reporting period. International equities from developed markets also gained, although emerging market stocks declined, pressured by a strengthening U.S. dollar.
The 10-year U.S. Treasury yield (which is inversely related to bond prices) rose during the reporting period as the economy expanded rapidly and inflation reached its highest annualized reading in decades. In the corporate bond market, support from the U.S. Federal Reserve (the “Fed”) assuaged credit concerns and led to solid returns for high-yield corporate bonds, outpacing investment-grade corporate bonds, which declined.
The Fed maintained accommodative monetary policy during the reporting period by maintaining near-zero interest rates and by asserting that inflation could exceed its 2% target for a sustained period without triggering a rate increase. However, the Fed’s tone shifted late in the year, as it reduced its bond-buying program and used its market guidance to raise the prospect of higher rates in 2022.
Looking ahead, we believe that the global expansion will continue to broaden as Europe and other developed market economies gain momentum, although the Delta and Omicron variants of the coronavirus remain a threat, particularly in emerging markets. While we expect inflation to abate somewhat as supply bottlenecks are resolved, we anticipate that inflation will remain higher than the pre-COVID norm. The Fed is poised to raise interest rates next year in response, but the Fed’s policy shift means that tightening is likely to be less aggressive than what we’ve seen in previous cycles.
In this environment, we favor an overweight to equities, as we believe low interest rates and continued economic growth will support further gains, albeit likely more modest than what we saw in 2021. Sectors that are better poised to manage the transition to a lower-carbon world, such as technology and health care, are particularly attractive in the long term. U.S. and other developed-market equities have room for further growth, while we believe Chinese equities stand to gain from a more accommodative monetary and fiscal environment as the Chinese economy slows. We are underweight long-term credit, but inflation-protected U.S. Treasuries, Asian fixed income, and emerging market local-currency bonds offer potential opportunities. We believe that international diversification and a focus on sustainability can help provide portfolio resilience, and the disruption created by the coronavirus appears to be accelerating the shift toward sustainable investments.
In this environment, our view is that investors need to think globally, extend their scope across a broad array of asset classes, and be nimble as market conditions change. We encourage you to talk with your financial advisor and visit blackrock.com for further insight about investing in today’s markets.
Sincerely,

Rob Kapito
President, BlackRock Advisors, LLC

Rob Kapito
President, BlackRock Advisors, LLC
| | | | |
| Total Returns as of December 31, 2021 |
| | | |
| | | 6-Month | | 12-Month |
| | |
U.S. large cap equities
(S&P 500® Index) | | 11.67% | | 28.71% |
| | |
U.S. small cap equities
(Russell 2000® Index) | | (2.31) | | 14.82 |
| | |
International equities
(MSCI Europe, Australasia, Far East Index) | | 2.24 | | 11.26 |
| | |
Emerging market equities
(MSCI Emerging Markets Index) | | (9.30) | | (2.54) |
| | |
3-month Treasury bills
(ICE BofA 3-Month
U.S. Treasury Bill Index) | | 0.02 | | 0.05 |
| | |
U.S. Treasury securities
(ICE BofA 10-Year
U.S. Treasury Index) | | 0.44 | | (3.68) |
| | |
U.S. investment grade bonds
(Bloomberg U.S. Aggregate Bond Index) | | 0.06 | | (1.54) |
| | |
Tax-exempt municipal bonds
(S&P Municipal Bond Index) | | 0.52 | | 1.77 |
| | |
U.S. high yield bonds
(Bloomberg U.S. Corporate High Yield 2% Issuer Capped Index) | | 1.59 | | 5.26 |
Past performance is not an indication of future results. Index performance is shown for illustrative purposes only. You cannot invest directly in an index. |
| | |
| 2 | | T H I S P A G E I S N O T P A R T O F Y O U R F U N D R E P O R T |
Table of Contents

| | |
Money Market Overview For the 12-Month Period Ended December 31, 2021 |
Market Review
2021 began with the transition to the Biden-Harris administration, passage of the $1.9 trillion American Rescue Plan Act of 2021, and an acceleration of Covid-19 vaccination programs. Throughout the second quarter much of the United States began to reopen as vaccination efforts ramped up and Covid-19 cases plummeted. The second half of the year, however, was dominated by the Delta and Omicron variants as cases skyrocketed into year-end.
Economic conditions in the United States vastly improved in year two of the coronavirus pandemic. The unemployment rate fell from 6.3% in January 2021 to 3.9% at the end of December 2021. At the end of the second and third quarters in 2021, real gross domestic product increased at an annual rate of 6.7% and 2.3%, respectively.
On the topic of inflation, several key barometers indicated that inflation had risen and was elevated throughout the year. The Consumer Price Index rose 7% in 2021, the largest increase since 1982.
At their June meeting, the Federal Open Market Committee (the “FOMC” or the “Committee”) made upward “technical” adjustments of 0.05% to the interest rate paid on required and excess reserves (“IOER”) and the offering rate on overnight reverse repurchase agreement (“RRP”) operations, bringing these “administered rates” to 0.15% and 0.05%, respectively. Fed Chair Powell noted that these adjustments were made “in order to keep the Federal Funds rate well within the target range and to support smooth functioning in money markets.”
The FOMC noted at their September meeting that “if progress (toward its maximum employment and price stability goals) continues broadly as expected, the Committee judges that a moderation in the pace of asset purchases may soon be warranted.” Fed Chair Powell made sure to differentiate the timing and pace of the reduction in asset purchases from the timing of interest rate liftoff.
At their December meeting, the FOMC acknowledged that employment and economic conditions have improved in recent months and simultaneously removed the word “transitory” when referring to inflation. As was widely expected, the FOMC elected to double the monthly pace of reduction of its asset purchases of Treasury and agency mortgage-backed securities at their December meeting, to at least $40 billion and $20 billion, respectively. To no surprise, the FOMC left the range of 0.00% - 0.25% for the Federal Funds target rate unchanged throughout the year.
The so-called “dot plot” median interest rate forecast reflected three 0.25% interest rate hikes in 2022, another three in 2023, and two more in 2024. The Summary of Economic Projections reflected a near-term decline in the unemployment rate relative to the September 2021 forecast and a firming of core inflation over the intermediate term.
On December 16, 2021, President Biden signed legislation to raise the debt limit by $2.5 trillion, an amount expected to provide the U.S. government with borrowing authority into at least early 2023. The resolution of the debt ceiling saga should result in a rise in Treasury bill (“T-bill”) supply and a meaningful increase in the Treasury General Account at the Fed. Net T-bill issuance for 2021 was approximately $1.2 trillion as of December 31, 2021.
Daily utilization of the Fed’s RRP facility surged following the adjustment in the program’s offering rate in June 2021, averaging $1.23 trillion per day for the remainder of the year. On December 31, 2021, the RRP facility hit an all-time high with a balance of over $1.9 trillion.
The secured overnight financing rate (“SOFR”)—a broad measure of the cost of borrowing cash overnight collateralized by Treasury securities—had been pegged at 0.01% from March 2021 until the FOMC’s “technical” adjustments in June 2021, when it rose to 0.05%. SOFR closed 2021 at 0.05% and averaged 0.04% for the year.
The three-month London Inter-bank Offered Rate (“LIBOR”), which started the year at 0.24%, trended downward for most of the year but rebounded to 0.21% at year end. The three-month LIBOR averaged 0.16% throughout 2021 and hit an all-time low of 0.11% on September 9, 2021. The three-month LIBOR overnight indexed swap (“L-OIS”) spread—a gauge of stress in the financial system—hit an all-time low of 0.02% on June 16, 2021 and averaged 0.08% for the year. L-OIS fell from 0.16% at the beginning of the year to 0.09% at year end.
Industry-wide money market mutual funds (“MMFs”) experienced net inflows of approximately $408 billion during the year. Of this, assets of prime and municipal MMFs fell $19 billion and $3 billion, respectively, while government MMFs experienced $193 billion of inflows.
Portfolio Review
The prevailing investment themes in 2021 included the ultra-accommodative policy put in place by the FOMC, the large and growing supply versus demand imbalance for front-end securities, and the debt ceiling impasse toward the later part of the year. The duration of the Fund’s portfolio was managed to best take advantage of yield movements in this environment.
Although it was a relatively flat curve, yields still did move within that tight range. Duration was managed lower at the mid-year point with the expectation that the FOMC would adjust the RRP and IOER rates. After their technical adjustment, a slightly longer duration profile was employed to take advantage of the back-up in yields that followed.
The debt ceiling impasse dominated headlines for much of the second half of 2021. The general market avoidance of U.S. Treasury securities, which may have matured inside of the default date range, pushed yields on surrounding maturities through the RRP rate. Positioning around the debt ceiling dominated our strategy during this time as we targeted securities that matured outside of what we believed to be the most vulnerable period.
Following the debt ceiling resolution, the U.S. Treasury Department was free to increase issuance of T-bills, which helped support yields in the front-end. Furthermore, the FOMC’s hawkish tilt caused the T-bill yield curve to reprice higher as the market incorporated the possibility of multiple rate hikes in 2022. We took advantage of this repricing to add duration to the portfolio.
| | |
| 4 | | 2 0 2 1 BLACK ROCK ANNUAL REPORT TO SHAREHOLDERS |
| | |
Money Market Overview For the 12-Month Period Ended December 31, 2021 (continued) |
Outlook
With the debt ceiling impasse now resolved, the U.S. Treasury quickly increased debt issuance to build back its general account balance which had been depleted due to the limitations placed on it. The return of supply has helped support yields in the front end. Overall, net new T-bill supply is expected to be positive going forward. This new supply will be well received as there is still excess liquidity in the front-end.
The FOMC’s hawkish pivot at their December meeting has the market presently pricing in multiple rate hikes in 2022. The timing of these hikes remains unknown and market pricing will remain volatile as new economic data is released. The repricing of FOMC rate hike expectations will likely dominate market pricing through 2022.
Past performance is not an indication of future results. Index performance is shown for illustrative purposes only. You cannot invest directly in an index
| | |
M O N E Y M A R K E T O V E R V I E W | | 5 |
| | |
| Fund Summary as of December 31, 2021 | | BlackRock Cash Funds: Institutional |
Investment Objective
BlackRock Cash Funds: Institutional’s (the “Fund”) investment objective is to seek a high level of income consistent with liquidity and the preservation of capital.
| | | | | | | | |
CURRENT SEVEN-DAY YIELDS | |
| | | |
| | | 7-Day
SEC Yield | | | 7-Day
Yield | |
| | |
SL Agency | | | 0.10 | % | | | 0.10 | % |
The 7-Day SEC Yields may differ from the 7-Day Yields shown due to the fact that the 7-Day SEC Yields exclude distributed capital gains.
Expense Example
| | | | | | | | | | | | | | | | | | | | | | | | | | | | | | | | |
| | | Actual | | | Hypothetical(a) | | | | |
| | |
| Beginning
Account Value (07/01/21) |
| |
| Ending
Account Value (12/31/21) |
| |
| Expenses
Paid During the Period |
(b) | |
| Beginning
Account Value (07/01/21) |
| | | | | |
| Ending
Account Value (12/31/21) |
| |
| Expenses
Paid During the Period |
(b) | |
| Annualized
Expense Ratio |
|
SL Agency | | $ | 1,000.00 | | | $ | 1,000.20 | | | $ | 0.45 | | | $ | 1,000.00 | | | | | | | $ | 1,024.75 | | | $ | 0.46 | | | | 0.09 | % |
| | (a) | Hypothetical 5% annual return before expenses is calculated by prorating the number of days in the most recent fiscal half year divided by 365. | |
| | (b) | For each class of the Fund, expenses are equal to the annualized expense ratio for the class, multiplied by the average account value over the period, multiplied by 184/365 (to reflect the one-half year period shown). Because the Fund invests all of its assets in the Money Market Master Portfolio (the “Master Portfolio”), the expense example reflects the net expenses of both the Fund and the Master Portfolio in which it invests. | |
See “Disclosure of Expenses” for further information on how expenses were calculated.
Past performance is not an indication of future results.
| | |
| 6 | | 2 0 2 1 BLACK ROCK ANNUAL REPORT TO SHAREHOLDERS |
| | |
| Fund Summary as of December 31, 2021 | | BlackRock Cash Funds: Treasury |
Investment Objective
BlackRock Cash Funds: Treasury’s (the “Fund”) investment objective is to seek current income as is consistent with liquidity and stability of principal.
| | | | | | | | | | | | | | | | | | |
| CURRENT SEVEN-DAY YIELDS | |
| | | |
| | | 7-Day SEC Yield | | | 7-Day Yield | |
| | |
Institutional | | | 0.01 | % | | | 0.01 | % |
SL Agency | | | 0.01 | | | | 0.01 | |
The 7-Day SEC Yields may differ from the 7-Day Yields shown due to the fact that the 7-Day SEC Yields exclude distributed capital gains.
Expense Example
| | | | | | | | | | | | | | | | | | | | | | | | | | | | | | | | |
| | | Actual | | | | | | Hypothetical(a) | | | | |
| | | Beginning Account Value (07/01/21) | | | Ending Account Value (12/31/21) | | | Expenses Paid During the Period(b) | | | | | | Beginning Account Value (07/01/21) | | | Ending Account Value (12/31/21) | | | Expenses Paid During the Period(b) | | | Annualized Expense Ratio | |
Institutional | | $ | 1,000.00 | | | $ | 1,000.00 | | | $ | 0.30 | | | | | | | $ | 1,000.00 | | | $ | 1,024.90 | | | $ | 0.31 | | | | 0.06 | % |
SL Agency | | | 1,000.00 | | | | 1,000.00 | | | | 0.30 | | | | | | | | 1,000.00 | | | | 1,024.90 | | | | 0.31 | | | | 0.06 | |
| | (a) | Hypothetical 5% annual return before expenses is calculated by prorating the number of days in the most recent fiscal half year divided by 365. | |
| | (b) | For each class of the Fund, expenses are equal to the annualized expense ratio for the class, multiplied by the average account value over the period, multiplied by 184/365 (to reflect the one-half year period shown). Because the Fund invests all of its assets in the Treasury Money Market Master Portfolio (the “Master Portfolio”), the expense example reflects the net expenses of both the Fund and the Master Portfolio in which it invests. | |
See “Disclosure of Expenses” for further information on how expenses were calculated.
Past performance is not an indication of future results.
Shareholders of each Fund may incur the following charges: (a) transactional expenses; and (b) operating expenses, including administration fees, service and distribution fees, and other fund expenses. The expense examples shown (which are based on a hypothetical investment of $1,000 invested at the beginning of the period (or from the commencement of operations if less than 6 months) and held through the end of the period) are intended to assist shareholders both in calculating expenses based on an investment in each Fund and in comparing these expenses with similar costs of investing in other mutual funds.
The expense examples provide information about actual account values and actual expenses. Annualized expense ratios reflect contractual and voluntary fee waivers, if any. In order to estimate the expenses a shareholder paid during the period covered by this report, shareholders can divide their account value by $1,000 and then multiply the result by the number corresponding to their Fund and share class under the heading entitled “Expenses Paid During the Period.”
The expense examples also provide information about hypothetical account values and hypothetical expenses based on a Fund’s actual expense ratio and an assumed rate of return of 5% per year before expenses. In order to assist shareholders in comparing the ongoing expenses of investing in these Funds and other funds, compare the 5% hypothetical examples with the 5% hypothetical examples that appear in shareholder reports of other funds.
The expenses shown in the expense examples are intended to highlight shareholders’ ongoing costs only and do not reflect transactional expenses, such as sales charges, if any. Therefore, the hypothetical examples are useful in comparing ongoing expenses only and will not help shareholders determine the relative total expenses of owning different funds. If these transactional expenses were included, shareholder expenses would have been higher.
| | |
| 8 | | 2 0 2 1 BLACK ROCK ANNUAL REPORT TO SHAREHOLDERS |
Statements of Assets and Liabilities
December 31, 2021
| | | | | | | | |
| | | BlackRock Cash Funds:
Institutional | | | BlackRock Cash Funds: Treasury | |
| |
| | |
ASSETS | | | | | | | | |
Investments, at value — from the applicable Master Portfolio | | $ | 65,672,659,782 | | | $ | 23,172,056,570 | |
| | | | | | | | |
| | |
Total assets | | | 65,672,659,782 | | | | 23,172,056,570 | |
| | | | | | | | |
| | |
LIABILITIES | | | | | | | | |
Payables: | | | | | | | | |
Administration fees | | | 1,139,203 | | | | 7,461 | |
Income dividend distributions | | | 5,905,802 | | | | 67,532 | |
Professional fees | | | 11,667 | | | | 11,673 | |
| | | | | | | | |
Total liabilities | | | 7,056,672 | | | | 86,666 | |
| | | | | | | | |
| | |
NET ASSETS | | $ | 65,665,603,110 | | | $ | 23,171,969,904 | |
| | | | | | | | |
| | |
NET ASSETS CONSIST OF | | | | | | | | |
Paid-in capital | | $ | 65,668,734,200 | | | $ | 23,171,687,084 | |
Accumulated earnings (loss) | | | (3,131,090 | ) | | | 282,820 | |
| | | | | | | | |
| | |
NET ASSETS | | $ | 65,665,603,110 | | | $ | 23,171,969,904 | |
| | | | | | | | |
| | |
NET ASSET VALUE | | | | | | | | |
| | |
Institutional | | | | | | | | |
Net assets | | | N/A | | | $ | 4,357,983,087 | |
| | | | | | | | |
Shares outstanding | | | N/A | | | | 4,357,924,133 | |
| | | | | | | | |
Net asset value | | | N/A | | | $ | 1.00 | |
| | | | | | | | |
Shares authorized | | | N/A | | | | Unlimited | |
| | | | | | | | |
Par value | | | N/A | | | | No par value | |
| | | | | | | | |
| | |
SL Agency | | | | | | | | |
| | |
Net assets | | $ | 65,665,603,110 | | | $ | 18,813,986,817 | |
| | | | | | | | |
| | |
Shares outstanding | | | 65,646,475,306 | | | | 18,813,762,953 | |
| | | | | | | | |
| | |
Net asset value | | $ | 1.0003 | | | $ | 1.00 | |
| | | | | | | | |
| | |
Shares authorized | | | Unlimited | | | | Unlimited | |
| | | | | | | | |
| | |
Par value | | | No par value | | | | No par value | |
| | | | | | | | |
See notes to financial statements.
| | |
FUND FINANCIAL STATEMENTS | | 9 |
Statements of Operations
Year Ended December 31, 2021
| | | | | | | | |
| | | BlackRock Cash Funds: Institutional | | | BlackRock Cash Funds: Treasury | |
| |
| | |
INVESTMENT INCOME | | | | | | | | |
Other income — unaffiliated | | $ | 16,047 | | | $ | — | |
Net investment income allocated from the applicable Master Portfolio: | | | | | | | | |
Interest - unaffliated | | | 133,393,317 | | | | 12,874,103 | |
Expenses | | | (66,945,064 | ) | | | (20,696,390 | ) |
Fees waived | | | 20,362,408 | | | | 8,847,570 | |
| | | | | | | | |
Total investment income | | | 86,826,708 | | | | 1,025,283 | |
| | | | | | | | |
| | |
FUND EXPENSES | | | | | | | | |
Administration — class specific | | | 13,307,773 | | | | 5,706,724 | |
Professional | | | 11,661 | | | | 11,688 | |
Miscellaneous | | | 5,000 | | | | 2,380 | |
| | | | | | | | |
Total expenses | | | 13,324,434 | | | | 5,720,792 | |
Less: | | | | | | | | |
Fees waived and/or reimbursed by the Administrator | | | (11,661 | ) | | | (5,262,873 | ) |
| | | | | | | | |
Total expenses after fees waived and/or reimbursed | | | 13,312,773 | | | | 457,919 | |
| | | | | | | | |
Net investment income | | | 73,513,935 | | | | 567,364 | |
| | | | | | | | |
| | |
REALIZED AND UNREALIZED GAIN (LOSS) ALLOCATED FROM THE MASTER PORTFOLIO | | | | | | | | |
Net realized gain from: | | | | | | | | |
Investments — unaffiliated | | | 127,838 | | | | 613,425 | |
Net change in unrealized appreciation (depreciation) on: | | | | | | | | |
Investments — unaffiliated | | | (13,855,488 | ) | | | — | |
| | | | | | | | |
| | |
Net realized and unrealized gain (loss) | | | (13,727,650 | ) | | | 613,425 | |
| | | | | | | | |
| | |
NET INCREASE IN NET ASSETS RESULTING FROM OPERATIONS | | $ | 59,786,285 | | | $ | 1,180,789 | |
| | | | | | | | |
See notes to financial statements.
| | |
| 10 | | 2 0 2 1 BLACK ROCK ANNUAL REPORT TO SHAREHOLDERS |
Statements of Changes in Net Assets
| | | | | | | | | | | | | | | | | | | | |
| | | BlackRock Cash Funds: Institutional | | | BlackRock Cash Funds: Treasury | |
| | | Year Ended December 31, | | | Year Ended December 31, | |
| | | | | | | | |
| | | | | |
| | | 2021 | | | | | | 2020 | | | 2021 | | | 2020 | |
| |
| | | | | |
INCREASE (DECREASE) IN NET ASSETS | | | | | | | | | | | | | | | | | | | | |
| | | | | |
OPERATIONS | | | | | | | | | | | | | | | | | | | | |
Net investment income | | $ | 73,513,935 | | | | | | | $ | 432,581,685 | | | $ | 567,364 | | | $ | 49,610,248 | |
Net realized gain | | | 127,838 | | | | | | | | 2,445,662 | | | | 613,425 | | | | 2,438,929 | |
Net change in unrealized appreciation (depreciation) | | | (13,855,488 | ) | | | | | | | (3,672,403 | ) | | | — | | | | — | |
| | | | | | | | | | | | | | | | | | | | |
| | | | | |
Net increase in net assets resulting from operations | | | 59,786,285 | | | | | | | | 431,354,944 | | | | 1,180,789 | | | | 52,049,177 | |
| | | | | | | | | | | | | | | | | | | | |
| | | | | |
DISTRIBUTIONS TO SHAREHOLDERS(a) | | | | | | | | | | | | | | | | | | | | |
Institutional | | | — | | | | | | | | — | | | | (520,307 | ) | | | (8,320,736 | ) |
SL Agency | | | (79,345,112 | ) | | | | | | | (432,685,382 | ) | | | (1,468,203 | ) | | | (44,103,830 | ) |
| | | | | | | | | | | | | | | | | | | | |
| | | | | |
Decrease in net assets resulting from distributions to shareholders | | | (79,345,112 | ) | | | | | | | (432,685,382 | ) | | | (1,988,510 | ) | | | (52,424,566 | ) |
| | | | | | | | | | | | | | | | | | | | |
| | | | | |
CAPITAL SHARE TRANSACTIONS | | | | | | | | | | | | | | | | | | | | |
Net increase in net assets derived from capital share transactions | | | 5,092,739,270 | | | | | | | | 6,235,934,178 | | | | 3,152,790,946 | | | | 7,586,962,283 | |
| | | | | | | | | | | | | | | | | | | | |
| | | | | |
NET ASSETS | | | | | | | | | | | | | | | | | | | | |
Total increase in net assets | | | 5,073,180,443 | | | | | | | | 6,234,603,740 | | | | 3,151,983,225 | | | | 7,586,586,894 | |
Beginning of year | | | 60,592,422,667 | | | | | | | | 54,357,818,927 | | | | 20,019,986,679 | | | | 12,433,399,785 | |
| | | | | | | | | | | | | | | | | | | | |
| | | | | |
End of year | | $ | 65,665,603,110 | | | | | | | $ | 60,592,422,667 | | | $ | 23,171,969,904 | | | $ | 20,019,986,679 | |
| | | | | | | | | | | | | | | | | | | | |
| (a) | Distributions for annual periods determined in accordance with U.S. federal income tax regulations. |
See notes to financial statements.
| | |
FUND FINANCIAL STATEMENTS | | 11 |
Financial Highlights
(For a share outstanding throughout each period)
| | | | | | | | | | | | | | | | | | | | |
| |
| | | BlackRock Cash Funds: Institutional | |
| |
| | | SL Agency | |
| |
| | | Year Ended December 31, | |
| | | | | |
| | | 2021 | | | 2020 | | | 2019 | | | 2018 | | | 2017 | |
| | | | | | |
Net asset value, beginning of year. | | $ | 1.0006 | | | $ | 1.0004 | | | $ | 1.0001 | | | $ | 1.0001 | | | $ | 1.0002 | |
| | | | | | | | | | | | | | | | | | | | |
| | | | | |
Net investment income | | | 0.0012 | | | | 0.0078 | | | | 0.0238 | | | | 0.0206 | | | | 0.0121 | |
Net realized and unrealized gain (loss) | | | (0.0003 | ) | | | 0.0002 | | | | 0.0003 | | | | 0.0000 | (a) | | | (0.0001 | ) |
| | | | | | | | | | | | | | | | | | | | |
| | | | | |
Net increase from investment operations | | | 0.0009 | | | | 0.0080 | | | | 0.0241 | | | | 0.0206 | | | | 0.0120 | |
| | | | | | | | | | | | | | | | | | | | |
| | | | | |
Distributions(b) | | | | | | | | | | | | | | | | | | | | |
From net investment income | | | (0.0012 | ) | | | (0.0078 | ) | | | (0.0238 | ) | | | (0.0206 | ) | | | (0.0121 | ) |
From net realized gain | | | (0.0000 | )(c) | | | (0.0000 | )(c) | | | — | | | | — | | | | (0.0000 | )(c) |
| | | | | | | | | | | | | | | | | | | | |
| | | | | |
Total distributions | | | (0.0012 | ) | | | (0.0078 | ) | | | (0.0238 | ) | | | (0.0206 | ) | | | (0.0121 | ) |
| | | | | | | | | | | | | | | | | | | | |
| | | | | |
Net asset value, end of year | | $ | 1.0003 | | | $ | 1.0006 | | | $ | 1.0004 | | | $ | 1.0001 | | | $ | 1.0001 | |
| | | | | | | | | | | | | | | | | | | | |
| | | | | |
Total Return(d) | | | | | | | | | | | | | | | | | | | | |
Based on net asset value | | | 0.09 | % | | | 0.80 | % | | | 2.43 | % | | | 2.08 | % | | | 1.21 | % |
| | | | | | | | | | | | | | | | | | | | |
| | | | | |
Ratios to Average Net Assets | | | | | | | | | | | | | | | | | | | | |
Total expenses | | | 0.09 | % | | | 0.09 | % | | | 0.09 | % | | | 0.09 | % | | | 0.09 | % |
| | | | | | | | | | | | | | | | | | | | |
| | | | | |
Total expenses after fees waived and/or reimbursed. | | | 0.09 | % | | | 0.09 | % | | | 0.09 | % | | | 0.09 | % | | | 0.09 | % |
| | | | | | | | | | | | | | | | | | | | |
| | | | | |
Net investment income | | | 0.11 | % | | | 0.75 | % | | | 2.36 | % | | | 2.05 | % | | | 1.23 | % |
| | | | | | | | | | | | | | | | | | | | |
| | | | | |
Supplemental Data | | | | | | | | | | | | | | | | | | | | |
Net assets, end of year (000) | | $ | 65,665,603 | | | $ | 60,592,423 | | | $ | 54,357,819 | | | $ | 47,238,155 | | | $ | 56,065,762 | |
| | | | | | | | | | | | | | | | | | | | |
| (a) | Amount is less than $0.00005 per share. |
| (b) | Distributions for annual periods determined in accordance with U.S. federal income tax regulations. |
| (c) | Amount is greater than $(0.00005) per share. |
| (d) | Where applicable, assumes the reinvestment of distributions. |
See notes to financial statements.
| | |
| 12 | | 2 0 2 1 BLACK ROCK ANNUAL REPORT TO SHAREHOLDERS |
Financial Highlights (continued)
(For a share outstanding throughout each period)
| | | | | | | | | | | | | | | | | | | | | | | | |
| |
| | | BlackRock Cash Funds: Treasury | |
| |
| | | Institutional | |
| |
| | | Year Ended December 31, | |
| | | | | | |
| | | 2021 | | | 2020 | | | | | | 2019 | | | 2018 | | | 2017 | |
| | | | | | | |
Net asset value, beginning of year | | $ | 1.00 | | | $ | 1.00 | | | | | | | $ | 1.00 | | | $ | 1.00 | | | $ | 1.00 | |
| | | | | | | | | | | | | | | | | | | | | | | | |
| | | | | | |
Net investment income | | | 0.0001 | | | | 0.0040 | | | | | | | | 0.0210 | | | | 0.0175 | | | | 0.0079 | |
Net realized and unrealized gain | | | 0.0000 | (a) | | | 0.0001 | | | | | | | | 0.0000 | (a) | | | 0.0000 | (a) | | | 0.0000 | (a) |
| | | | | | | | | | | | | | | | | | | | | | | | |
| | | | | | |
Net increase from investment operations | | | 0.0001 | | | | 0.0041 | | | | | | | | 0.0210 | | | | 0.0175 | | | | 0.0079 | |
| | | | | | | | | | | | | | | | | | | | | | | | |
| | | | | | |
Distributions(b) | | | | | | | | | | | | | | | | | | | | | | | | |
From net investment income | | | (0.0001 | ) | | | (0.0040 | ) | | | | | | | (0.0210 | ) | | | (0.0175 | ) | | | (0.0079 | ) |
From net realized gain | | | (0.0000 | )(c) | | | (0.0001 | ) | | | | | | | (0.0000 | )(c) | | | — | | | | (0.0000 | )(c) |
| | | | | | | | | | | | | | | | | | | | | | | | |
Total distributions | | | (0.0001 | ) | | | (0.0041 | ) | | | | | | | (0.0210 | ) | | | (0.0175 | ) | | | (0.0079 | ) |
| | | | | | | | | | | | | | | | | | | | | | | | |
| | | | | | |
Net asset value, end of year | | $ | 1.00 | | | $ | 1.00 | | | | | | | $ | 1.00 | | | $ | 1.00 | | | $ | 1.00 | |
| | | | | | | | | | | | | | | | | | | | | | | | |
| | | | | | |
Total Return(d) | | | | | | | | | | | | | | | | | | | | | | | | |
Based on net asset value | | | 0.01 | % | | | 0.41 | % | | | | | | | 2.12 | % | | | 1.76 | % | | | 0.79 | % |
| | | | | | | | | | | | | | | | | | | | | | | | |
| | | | | | |
Ratios to Average Net Assets | | | | | | | | | | | | | | | | | | | | | | | | |
Total expenses | | | 0.12 | % | | | 0.12 | % | | | | | | | 0.12 | % | | | 0.12 | % | | | 0.12 | % |
| | | | | | | | | | | | | | | | | | | | | | | | |
| | | | | | |
Total expenses after fees waived and/or reimbursed. | | | 0.06 | % | | | 0.12 | % | | | | | | | 0.12 | % | | | 0.12 | % | | | 0.12 | % |
| | | | | | | | | | | | | | | | | | | | | | | | |
| | | | | | |
Net investment income | | | 0.00 | %(e) | | | 0.23 | % | | | | | | | 2.06 | % | | | 1.76 | % | | | 0.93 | % |
| | | | | | | | | | | | | | | | | | | | | | | | |
| | | | | | |
Supplemental Data | | | | | | | | | | | | | | | | | | | | | | | | |
Net assets, end of year (000) | | $ | 4,357,983 | | | $ | 9,011,269 | | | | | | | $ | 1,813,191 | | | $ | 1,182,627 | | | $ | 467,589 | |
| | | | | | | | | | | | | | | | | | | | | | | | |
| (a) | Amount is less than $0.00005 per share. |
| (b) | Distributions for annual periods determined in accordance with U.S. federal income tax regulations. |
| (c) | Amount is greater than $(0.00005) per share. |
| (d) | Where applicable, assumes the reinvestment of distributions. |
| (e) | Amount is less than 0.005%. |
See notes to financial statements.
| | |
FUND FINANCIAL HIGHLIGHTS | | 13 |
Financial Highlights (continued)
(For a share outstanding throughout each period)
| | | | | | | | | | | | | | | | | | | | |
| |
| | | BlackRock Cash Funds: Treasury (continued) | |
| |
| | | SL Agency | |
| |
| | | Year Ended December 31, | |
| | | | | |
| | | 2021 | | | 2020 | | | 2019 | | | 2018 | | | 2017 | |
| | | | | | |
Net asset value, beginning of year | | $ | 1.00 | | | $ | 1.00 | | | $ | 1.00 | | | $ | 1.00 | | | $ | 1.00 | |
| | | | | | | | | | | | | | | | | | | | |
Net investment income | | | 0.0001 | | | | 0.0042 | | | | 0.0213 | | | | 0.0178 | | | | 0.0082 | |
Net realized and unrealized gain | | | 0.0000 | (a) | | | 0.0001 | | | | 0.0000 | (a) | | | 0.0000 | (a) | | | 0.0000 | (a) |
| | | | | | | | | | | | | | | | | | | | |
Net increase from investment operations | | | 0.0001 | | | | 0.0043 | | | | 0.0213 | | | | 0.0178 | | | | 0.0082 | |
| | | | | | | | | | | | | | | | | | | | |
| | | | | |
Distributions(b) | | | | | | | | | | | | | | | | | | | | |
From net investment income | | | (0.0001 | ) | | | (0.0042 | ) | | | (0.0213 | ) | | | (0.0178 | ) | | | (0.0082 | ) |
From net realized gain | | | (0.0000 | )(c) | | | (0.0001 | ) | | | (0.0000 | )(c) | | | — | | | | (0.0000 | )(c) |
| | | | | | | | | | | | | | | | | | | | |
Total distributions | | | (0.0001 | ) | | | (0.0043 | ) | | | (0.0213 | ) | | | (0.0178 | ) | | | (0.0082 | ) |
| | | | | | | | | | | | | | | | | | | | |
| | | | | |
Net asset value, end of year. | | $ | 1.00 | | | $ | 1.00 | | | $ | 1.00 | | | $ | 1.00 | | | $ | 1.00 | |
| | | | | | | | | | | | | | | | | | | | |
| | | | | |
Total Return(d) | | | | | | | | | | | | | | | | | | | | |
Based on net asset value. | | | 0.01 | % | | | 0.43 | % | | | 2.15 | % | | | 1.79 | % | | | 0.82 | % |
| | | | | | | | | | | | | | | | | | | | |
| | | | | |
Ratios to Average Net Assets | | | | | | | | | | | | | | | | | | | | |
Total expenses. | | | 0.09 | % | | | 0.09 | % | | | 0.09 | % | | | 0.09 | % | | | 0.09 | % |
| | | | | | | | | | | | | | | | | | | | |
Total expenses after fees waived and/or reimbursed | | | 0.06 | % | | | 0.09 | % | | | 0.09 | % | | | 0.09 | % | | | 0.09 | % |
| | | | | | | | | | | | | | | | | | | | |
Net investment income | | | 0.00 | %(e) | | | 0.37 | % | | | 2.10 | % | | | 1.78 | % | | | 0.85 | % |
| | | | | | | | | | | | | | | | | | | | |
| | | | | |
Supplemental Data | | | | | | | | | | | | | | | | | | | | |
Net assets, end of year (000) | | $ | 18,813,987 | | | $ | 11,008,718 | | | $ | 10,620,209 | | | $ | 5,399,030 | | | $ | 4,204,767 | |
| | | | | | | | | | | | | | | | | | | | |
| (a) | Amount is less than $0.00005 per share. |
| (b) | Distributions for annual periods determined in accordance with U.S. federal income tax regulations. |
| (c) | Amount is greater than $(0.00005) per share. |
| (d) | Where applicable, assumes the reinvestment of distributions. |
| (e) | Amount is less than 0.005%. |
See notes to financial statements.
| | |
| 14 | | 2 0 2 1 BLACK ROCK ANNUAL REPORT TO SHAREHOLDERS |
Notes to Financial Statements
BlackRock Funds III (the “Trust”) is registered under the Investment Company Act of 1940, as amended (the “1940 Act”), as an open-end management investment company. The Trust is organized as a Delaware statutory trust. The following, each of which is a series of the Trust, are referred to herein collectively as the “Funds” or individually as a “Fund”:
| | | | |
| | | |
| Fund Name | | Herein Referred To As | | Diversification
Classification |
| | |
BlackRock Cash Funds: Institutional | | Institutional | | Diversified |
BlackRock Cash Funds: Treasury | | Treasury | | Diversified |
Each Fund seeks to achieve its investment objective by investing all of its assets in a corresponding series of Master Investment Portfolio (“MIP”): Money Market Master Portfolio and Treasury Money Market Master Portfolio (each, a “Master Portfolio” and together, the “Master Portfolios”). MIP is an affiliate of the Trust. Each Master Portfolio has the same investment objective and strategies as its corresponding Fund. The value of each Fund’s investment in its corresponding Master Portfolio reflects the Fund’s proportionate interest in the net assets of the Master Portfolio. The performance of each Fund is directly affected by the performance of the Master Portfolios. At December 31, 2021, the percentage of each Master Portfolio owned by its corresponding Fund was as follows: Institutional owned 100% of Money Market Master Portfolio and Treasury owned 94.4% of Treasury Money Market Master Portfolio. The financial statements of the Master Portfolios, including the Schedules of Investments, are included elsewhere in this report and should be read in conjunction with the Funds’ financial statements.
Institutional only offers SL Agency Shares and is only available for certain eligible investors. Treasury offers multiple classes of shares. Institutional, Select, SL Agency, Capital, Premium and Trust Shares are sold without a sales charge and only to certain eligible investors. All classes of shares have identical voting, dividend, liquidation and other rights and are subject to the same terms and conditions, and differ principally with respect to administration fees.
The Board of Trustees of the Trust and Board of Directors of MIP are referred to throughout this report as the “Board” and the members are referred to as “Trustees”.
Treasury operates as a “government money market fund” under Rule 2a-7 under the 1940 Act. The Fund is not subject to liquidity fees or temporary suspensions of redemptions due to declines in the Fund’s weekly liquid assets.
Institutional prices and transacts its shares at a net asset value (“NAV”) per share calculated to four decimal places, reflecting market-based values of its portfolio holdings (i.e., at a “floating” NAV).
With respect to Institutional, the Board is permitted to impose a liquidity fee of up to 2% on the value of shares redeemed or temporarily restrict redemptions from Institutional for up to 10 business days during a 90 day period, in the event that Institutional’s weekly liquid assets fall below certain thresholds.
The Funds, together with certain other registered investment companies advised by BlackRock Fund Advisors (“BFA” or the “Manager”) or its affiliates,are included in a complex ofopen-end equity, multi-asset, index and money market funds referred to as the BlackRock Multi-Asset Complex.
2. SIGNIFICANT ACCOUNTING POLICIES
The financial statements are prepared in conformity with accounting principles generally accepted in the United States of America (“U.S. GAAP”), which may require management to make estimates and assumptions that affect the reported amounts of assets and liabilities in the financial statements, disclosure of contingent assets and liabilities at the date of the financial statements and the reported amounts of increases and decreases in net assets from operations during the reporting period. Actual results could differ from those estimates. Each Fund is considered an investment company under U.S. GAAP and follows the accounting and reporting guidance applicable to investment companies. Below is a summary of significant accounting policies:
Investment Transactions and Income Recognition: For financial reporting purposes, contributions to and withdrawals from each Master Portfolio are accounted for on a trade date basis. The Funds record their proportionate share of the Master Portfolio’s income, expenses and realized and unrealized gains and losses on a daily basis. In addition, the Funds accrue their own expenses. Income, expenses and realized and unrealized gains and losses are allocated daily to each class based on its relative net assets.
Distributions: Distributions from net investment income are declared daily and paid monthly. Distributions of capital gains are distributed at least annually and are recorded on the ex-dividend dates. The character and timing of distributions are determined in accordance with U.S. federal income tax regulations, which may differ from U.S. GAAP.
Liquidity Fees: Any liquidity fees imposed on the value of shares redeemed in the event that Institutional’s weekly liquid assets fall below certain thresholds are recorded as paid-in-capital. The liquidity fees are collected and retained by Institutional for the benefit of Institutional’s remaining interest holders.
Indemnifications: In the normal course of business, a Fund enters into contracts that contain a variety of representations that provide general indemnification. A Fund’s maximum exposure under these arrangements is unknown because it involves future potential claims against a Fund, which cannot be predicted with any certainty.
Other: Expenses directly related to a Fund or its classes are charged to that Fund or the applicable class. Expenses directly related to the Funds and other shared expenses prorated to the Funds are allocated daily to each class based on their relative net assets or other appropriate methods. Other operating expenses shared by several funds, including other funds managed by the BlackRock Advisors, LLC (the “Administrator”), are prorated among those funds on the basis of relative net assets or other appropriate methods.
| | |
FUND NOTES TO FINANCIAL STATEMENTS | | 15 |
Notes to Financial Statements (continued)
| 3. | INVESTMENT VALUATION AND FAIR VALUE MEASUREMENTS |
Investment Valuation Policies: Each Fund’s policy is to value its financial instruments at fair value. Each Fund records its investment in the Master Portfolio at fair value based on the Funds’ proportionate interest in the net assets of the Master Portfolio. Valuation of securities held by the Master Portfolio is discussed in Note 3 of the Master Portfolio’s Notes to Financial Statements, which are included elsewhere in this report.
| 4. | ADMINISTRATION AGREEMENT AND OTHER TRANSACTIONS WITH AFFILIATES |
Administration: The Trust, on behalf of the Funds, entered into an Administration Agreement with the Administrator, which has agreed to provide general administrative services (other than investment advice and related portfolio activities). The Administrator has agreed to bear all of the Funds’ ordinary operating expenses, excluding, generally, investment advisory fees, distribution fees, brokerage and other expenses related to the execution of portfolio transactions, extraordinary expenses and certain other expenses which are borne by the Funds. The Administrator is entitled to receive for these administrative services an annual fee based on the average daily net assets of each Fund as follows:
| | | | | | | | | | | | | | | | | | | | | | | | |
| | | | | | | |
| Fund Name | | Capital | | | Institutional | | | Premium | | | Select | | | SL Agency | | | Trust | |
| | | | | | |
Institutional | | | N/A | | | | N/A | | | | N/A | | | | N/A | | | | 0.02 | % | | | N/A | |
Treasury | | | 0.07 | %(a) | | | 0.05 | % | | | 0.10 | %(a) | | | 0.15 | %(a) | | | 0.02 | | | | 0.38 | %(a) |
| | (a) | No shares outstanding as of December 31, 2021. | |
From time to time, the Administrator may waive such fees in whole or in part. Any such waiver will reduce the expenses of the Funds and, accordingly, have a favorable impact on their performance. The Administrator may delegate certain of its administration duties to sub-administrators.
For the year ended December 31, 2021, the following table shows the class specific administration fees borne directly by each share class of each Fund:
| | | | | | | | | | | | |
| | | | |
| Fund Name | | Institutional | | | SL Agency | | | Total | |
Institutional | | $ | — | | | $ | 13,307,773 | | | $ | 13,307,773 | |
Treasury | | | 2,674,171 | | | | 3,032,553 | | | | 5,706,724 | |
As of December 31, 2021, the only investors for the SL Agency Shares of Institutional are investment companies for which (i) BFA, BlackRock Institutional Trust Company, N.A. (“BTC”), or an affiliate provides investment advisory or administration services, or (ii) BTC acts as securities lending agent and which have directed BTC on their behalf to invest securities lending cash collateral in SL Agency Shares of Institutional. Affiliated shareholders in the SL Agency Shares of the Funds represent a significant portion of the outstanding shares and net assets of Institutional and Treasury.
Distribution Fees: The Trust, on behalf of the Funds, entered into a Distribution Agreement with BlackRock Investments, LLC (“BRIL”), an affiliate of the Administrator. Shareholders of Capital, Institutional, Premium, Select, SL Agency and Trust Shares of the Funds do not pay any fees for distribution services.
Expense Waivers and Reimbursements: The Administrator contractually agreed to waive a portion of its administration fees for the Select Shares of Treasury through June 30, 2023. After giving effect to such contractual expense waiver, the administration fees for the Select Shares of Treasury will be 0.13%.
The fees and expenses of the Fund’s trustees who are not “interested persons” of the Trust, as defined in the 1940 Act (“Independent Trustees”), counsel to the Independent Trustees and the Funds’ independent registered public accounting firm (together, the “independent expenses”) are paid directly by the Funds. The Administrator has contractually agreed to reimburse the Funds or provide an offsetting credit against the administration fees paid by the Funds in an amount equal to these independent expenses through June 30, 2023. These amounts are included in fees waived and/or reimbursed by the Administrator in the Statements of Operations. For the year ended December 31, 2021, the amounts waived were as follows:
| | | | |
| | |
| Fund Name | | Fees Waived and/or Reimbursed by the Administrator | |
| |
Institutional | | $ | 11,661 | |
Treasury | | | 11,688 | |
The Administrator has also voluntarily agreed to waive and/or reimburse a portion of their respective administration fees to enable the Fund to maintain minimum levels of daily net investment income if applicable. These amounts, if any, are reported in the Statement of Operations as fees waived and/or reimbursed by the Administrator. The Administrator may discontinue the waiver and/or reimbursement at any time. With respect to Treasury, for the year ended December 31, 2021, the amounts waived and/or reimbursed was $5,251,185.
Interfund Lending: In accordance with an exemptive order (the “Order”) from the U.S. Securities and Exchange Commission (“SEC”), each Fund may participate in a joint lending and borrowing facility for temporary purposes (the “Interfund Lending Program”), subject to compliance with the terms and conditions of the Order, and to the extent permitted by each Fund’s investment policies and restrictions. Each Fund is currently permitted to borrow and lend under the Interfund Lending Program.
A lending BlackRock fund may lend in aggregate up to 15% of its net assets but may not lend more than 5% of its net assets to any one borrowing fund through the Interfund Lending Program. A borrowing BlackRock fund may not borrow through the Interfund Lending Program or from any other source more than 33 1/3% of its total assets (or any lower threshold provided for by the fund’s investment restrictions). If a borrowing BlackRock fund’s total outstanding borrowings exceed 10% of its total assets, each of its outstanding interfund loans will be subject to collateralization of at least 102% of the outstanding principal value of the loan. All interfund loans are for temporary or emergency purposes and the interest rate to be charged will be the average of the highest current overnight repurchase agreement rate available to a lending fund and the bank loan rate, as calculated according to a formula established by the Board.
| | |
| 16 | | 2 0 2 1 BLACK ROCK ANNUAL REPORT TO SHAREHOLDERS |
Notes to Financial Statements (continued)
During the year ended December 31, 2021, the Funds did not participate in the Interfund Lending Program.
Trustees and Officers: Certain trustees and/or officers of the Trust are directors and/or officers of BlackRock, Inc. (“BlackRock”) or its affiliates.
It is each Fund’s policy to comply with the requirements of the Internal Revenue Code of 1986, as amended, applicable to regulated investment companies, and to distribute substantially all of its taxable income to its shareholders. Therefore, no U.S. federal income tax provision is required.
Each Fund files U.S. federal and various state and local tax returns. No income tax returns are currently under examination. The statute of limitations on each Fund’s U.S. federal tax returns generally remains open for a period of three fiscal years after they are filed. The statutes of limitations on each Fund’s state and local tax returns may remain open for an additional year depending upon the jurisdiction.
Management has analyzed tax laws and regulations and their application to the Funds as of December 31, 2021, inclusive of the open tax return years, and does not believe that there are any uncertain tax positions that require recognition of a tax liability in the Funds’ financial statements.
The tax character of distributions paid was as follows:
| | | | | | | | |
| |
| | |
Fund Name | | Year Ended
12/31/21 | | | Year Ended
12/31/20 | |
| |
| | |
Institutional | | | | | | | | |
Ordinary income | | $ | 79,345,112 | | | $ | 432,685,382 | |
| | | | | | | | |
Treasury | | | | | | | | |
Ordinary income | | $ | 1,942,772 | | | $ | 52,418,268 | |
Long-term capital gains | | | 45,738 | | | | 6,298 | |
| | | | | | | | |
| | $ | 1,988,510 | | | $ | 52,424,566 | |
| | | | | | | | |
As of December 31, 2021, the tax components of accumulated earnings (loss) were as follows:
| | | | | | | | | | | | | | | | |
| | | | | |
Fund Name | | Undistributed
Ordinary Income | | | Undistributed
Long-Term
Capital Gains | | | Net Unrealized
Gains (Losses) | | | Total | |
Institutional | | $ | 813,219 | | | $ | — | | | $ | (3,944,309 | ) | | $ | (3,131,090 | ) |
Treasury | | | 267,333 | | | | 15,487 | | | | — | | | | 282,820 | |
| 6. | CAPITAL SHARE TRANSACTIONS |
The number of shares sold, reinvested and redeemed for Institutional were transacted at each class’s floating NAV per share calculated to four decimal places.
Transactions in capital shares for each class of Institutional were as follows:
| | | | | | | | | | | | | | | | | | |
| |
| | | |
| | | Year Ended
12/31/21 | | | | | Year Ended
12/31/20 | |
| | | | | |
Fund Name / Share Class | | Shares | | | Amounts | | | | | Shares | | | Amounts | |
| |
| | | | | |
Institutional | | | | | | | | | | | | | | | | | | |
SL Agency | | | | | | | | | | | | | | | | | | |
Shares sold | | | 295,375,820,800 | | | $ | 295,532,215,106 | | | | | | 286,070,086,969 | | | $ | 286,294,830,540 | |
Shares issued in reinvestment of distributions | | | — | | | | — | | | | | | 1,600 | | | | 1,598 | |
Shares redeemed | | | (290,286,668,679 | ) | | | (290,439,475,836 | ) | | | | | (279,847,452,816 | ) | | | (280,058,897,960 | ) |
| | | | | | | | | | | | | | | | | | |
| | | 5,089,152,121 | | | $ | 5,092,739,270 | | | | | | 6,222,635,753 | | | $ | 6,235,934,178 | |
| | | | | | | | | | | | | | | | | | |
| | | 5,089,152,121 | | | $ | 5,092,739,270 | | | | | | 6,222,635,753 | | | $ | 6,235,934,178 | |
| | | | | | | | | | | | | | | | | | |
The number of shares sold, reinvested and redeemed corresponds to the net proceeds from the sale of shares, reinvestment of all distributions and cost of shares redeemed, respectively, since shares are sold and redeemed at $1.00 per share for Treasury.
| | |
FUND NOTES TO FINANCIAL STATEMENTS | | 17 |
Notes to Financial Statements (continued)
Transactions in capital shares for each class of Treasury were as follows:
| | | | | | | | |
| |
| Fund Name / Share Class | | Year Ended
12/31/21 | | | Year Ended
12/31/20 | |
| | |
Institutional | | | | | | | | |
Shares sold | | | 15,745,033,072 | | | | 18,403,885,010 | |
Shares issued in reinvestment of distributions | | | 516,489 | | | | 4,326,346 | |
Shares redeemed | | | (20,398,402,430 | ) | | | (11,210,411,510 | ) |
| | | | | | | | |
| | | (4,652,852,869 | ) | | | 7,197,799,846 | |
| | | | | | | | |
| | |
SL Agency | | | | | | | | |
Shares sold | | | 266,853,258,115 | | | | 212,451,150,761 | |
Shares issued in reinvestment of distributions | | | 42,778 | | | | 1,425,029 | |
Shares redeemed | | | (259,047,657,078 | ) | | | (212,063,413,353 | ) |
| | | | | | | | |
| | |
| | | 7,805,643,815 | | | | 389,162,437 | |
| | | | | | | | |
| | |
| | | 3,152,790,946 | | | | 7,586,962,283 | |
| | | | | | | | |
Management has evaluated the impact of all subsequent events on the Funds through the date the financial statements were issued and has determined that there were no subsequent events requiring adjustment or additional disclosure in the financial statements.
| | |
| 18 | | 2 0 2 1 BLACK ROCK ANNUAL REPORT TO SHAREHOLDERS |
Report of Independent Registered Public Accounting Firm
To the Board of Trustees of BlackRock Funds III and Shareholders of BlackRock Cash Funds: Institutional and BlackRock Cash Funds: Treasury
Opinions on the Financial Statements
We have audited the accompanying statements of assets and liabilities of BlackRock Cash Funds: Institutional and BlackRock Cash Funds: Treasury (two of the series constituting BlackRock Funds III, hereafter collectively referred to as the “Funds”) as of December 31, 2021, the related statements of operations for the year ended December 31, 2021, the statements of changes in net assets for each of the two years in the period ended December 31, 2021, including the related notes, and the financial highlights for each of the five years in the period ended December 31, 2021 (collectively referred to as the “financial statements”). In our opinion, the financial statements present fairly, in all material respects, the financial position of each of the Funds as of December 31, 2021, the results of each of their operations for the year then ended, the changes in each of their net assets for each of the two years in the period ended December 31, 2021 and each of the financial highlights for each of the five years in the period ended December 31, 2021 in conformity with accounting principles generally accepted in the United States of America.
Basis for Opinions
These financial statements are the responsibility of the Funds’ management. Our responsibility is to express an opinion on the Funds’ financial statements based on our audits. We are a public accounting firm registered with the Public Company Accounting Oversight Board (United States) (PCAOB) and are required to be independent with respect to the Funds in accordance with the U.S. federal securities laws and the applicable rules and regulations of the Securities and Exchange Commission and the PCAOB.
We conducted our audits of these financial statements in accordance with the standards of the PCAOB. Those standards require that we plan and perform the audit to obtain reasonable assurance about whether the financial statements are free of material misstatement, whether due to error or fraud.
Our audits included performing procedures to assess the risks of material misstatement of the financial statements, whether due to error or fraud, and performing procedures that respond to those risks. Such procedures included examining, on a test basis, evidence regarding the amounts and disclosures in the financial statements. Our audits also included evaluating the accounting principles used and significant estimates made by management, as well as evaluating the overall presentation of the financial statements. Our procedures included confirmation of securities owned as of December 31, 2021 by correspondence with the administrator of the Master Portfolios. We believe that our audits provide a reasonable basis for our opinions.
/s/PricewaterhouseCoopers LLP
Philadelphia, Pennsylvania
February 15, 2022
We have served as the auditor of one or more BlackRock investment companies since 2000.
| | |
FUND REPORT OF INDEPENDENT REGISTERED PUBLIC ACCOUNTING FIRM | | 19 |
Important Tax Information (unaudited)
The Funds hereby designate the following amounts, or maximum amounts allowable by law, as capital gain dividends, subject to a long-term capital gains tax rate of not greater than 20%, for the fiscal year ended December 31, 2021:
| | | | |
| |
| |
| Fund Name | | 20% Rate Long-Term Capital Gain Dividends | |
| |
Treasury | | $ | 45,738 | |
| |
The Funds hereby designate the following amounts, or maximum amounts allowable by law, of distributions from direct federal obligation interest for the fiscal year ended December 31, 2021:
| | | | |
| |
| |
| Fund Name | | Federal Obligation
Interest | |
| |
Institutional | | $ | 6,118,675 | |
Treasury | | | 418,461 | |
| |
The law varies in each state as to whether and what percent of ordinary income dividends attributable to federal obligations is exempt from state income tax. Shareholders are advised to check with their tax advisers to determine if any portion of the dividends received is exempt from state income tax.
The Funds hereby designate the following amounts, or maximum amounts allowable by law, as interest income eligible to be treated as a Section 163(j) interest dividend for the fiscal year ended December 31, 2021:
| | | | |
| |
| |
| Fund Name | | Interest Dividend | |
| |
Institutional | | $ | 76,845,089 | |
Treasury | | | 587,614 | |
| |
The Funds hereby designate the following amounts, or maximum amounts allowable by law, as interest-related dividends and qualified short-term capital gains eligible for exemption from U.S. withholding tax for nonresident aliens and foreign corporations for the fiscal year ended December 31, 2021:
| | | | | | | | |
| |
| | |
| Fund Name | | Interest
Related
Dividends | | | Qualified
Short-Term
Capital Gains | |
| |
Institutional | | $ | 50,865,764 | | | $ | 2,500,024 | |
Treasury | | | 798,822 | | | | 1,143,950 | |
| |
| | |
| 20 | | 2 0 2 1 BLACK ROCK ANNUAL REPORT TO SHAREHOLDERS |
Master Portfolio Information as of December 31, 2021
PORTFOLIO ALLOCATION
| | | | |
| | |
| Money Market Master Portfolio | | Percent of
Net Assets | |
| |
Repurchase Agreements | | | 41 | % |
| |
Certificates of Deposit | | | 26 | |
| |
Commercial Paper | | | 25 | |
| |
Time Deposits | | | 6 | |
| |
Municipal Bonds | | | 3 | |
| |
Corporate Bonds | | | 1 | |
| |
U.S. Treasury Obligations | | | — | (a) |
| |
Liabilities in Excess of Other Assets | | | (2 | ) |
| (a) | Rounds to less than 1% of net assets. |
PORTFOLIO ALLOCATION
| | | | |
| | |
| Treasury Money Market Master Portfolio | | Percent of
Net Assets | |
| |
Repurchase Agreements | | | 71 | % |
| |
U.S. Treasury Obligations | | | 32 | |
| |
Liabilities in Excess of Other Assets | | | (3 | ) |
| | |
MASTER PORTFOLIO INFORMATION | | 21 |
| | |
Schedule of Investments December 31, 2021 | | Money Market Master Portfolio (Percentages shown are based on Net Assets) |
| | | | | | | | |
Security | | Par (000) | | | Value | |
|
Short-Term Securities | |
| | |
| Certificates of Deposit — 25.9% | | | | | | |
| | |
| Domestic — 1.2% | | | | | | |
Bank of America N.A., 0.20%, 10/11/22(a) | | $ | 130,000 | | | $ | 129,929,320 | |
Citibank NA, 0.16%, 06/06/22 | | | 125,000 | | | | 124,958,056 | |
Goldman Sachs Bank USA, (SOFR + 0.17%), 0.27%, 07/26/22(a) | | | 140,000 | | | | 139,944,508 | |
HSBC Bank USA N.A. | | | | | | | | |
0.38%, 01/03/22 | | | 92,875 | | | | 92,877,397 | |
(SOFR + 0.21%), 0.26%, 02/04/22(a) | | | 170,000 | | | | 170,019,326 | |
(SOFR + 0.25%), 0.30%, 01/07/22(a) | | | 166,750 | | | | 166,756,807 | |
| | | | | | | | |
| | | | | | | 824,485,414 | |
| | |
Euro — 0.5% | | | | | | | | |
Bank of Montreal, London, 0.28%, 03/09/22 | | | 129,800 | | | | 129,761,273 | |
Credit Industriel et Commercial, London, 0.01%, 01/28/22 | | | 174,000 | | | | 173,986,468 | |
| | | | | | | | |
| | | | | | | 303,747,741 | |
| | |
Yankee — 24.2% | | | | | | | | |
Bank of Montreal, Chicago(a)(b) | | | | | | | | |
0.16%, 08/15/22 | | | 321,000 | | | | 320,973,530 | |
0.35%, 01/09/23 | | | 334,000 | | | | 334,013,848 | |
(3 mo. LIBOR US + 0.05%), 0.21%, 02/23/22 | | | 110,000 | | | | 110,012,046 | |
(3 mo. LIBOR US + 0.05%), 0.21%, 05/16/22 | | | 303,000 | | | | 303,007,378 | |
(3 mo. LIBOR US + 0.05%), 0.24%, 06/06/22 | | | 305,000 | | | | 305,060,436 | |
(3 mo. LIBOR US + 0.10%), 0.23%, 01/04/22 | | | 372,000 | | | | 372,000,000 | |
(SOFR + 0.20%), 0.25%, 02/11/22 | | | 214,000 | | | | 214,032,941 | |
Bank of Nova Scotia, Houston(a)(b) | | | | | | | | |
0.20%, 10/28/22 | | | 50,000 | | | | 49,962,433 | |
0.24%, 06/30/22 | | | 100,000 | | | | 99,964,840 | |
(SOFR + 0.16%), 0.21%, 07/08/22 | | | 242,000 | | | | 241,932,712 | |
(SOFR + 0.20%), 0.26%, 06/17/22 | | | 200,000 | | | | 200,009,306 | |
Barclays Bank PLC, New York(b) | | | | | | | | |
0.23%, 09/01/22 | | | 239,000 | | | | 238,678,041 | |
0.27%, 03/03/22 | | | 160,000 | | | | 160,022,774 | |
0.27%, 03/21/22 | | | 100,000 | | | | 100,005,107 | |
0.29%, 03/04/22 | | | 281,000 | | | | 281,048,931 | |
0.30%, 05/06/22 | | | 300,000 | | | | 299,965,746 | |
0.31%, 04/19/22 | | | 200,000 | | | | 200,002,618 | |
Bayerische Landesbank, New York, 0.20%, 02/25/22(b) | | | 100,000 | | | | 100,006,035 | |
BNP Paribas SA, New York, 0.19%, 06/03/22(b) | | | 288,000 | | | | 287,965,238 | |
Canadian Imperial Bank of Commerce, New York(a)(b) | | | | | | | | |
(3 mo. LIBOR US + 0.05%), 0.24%, 06/07/22 | | | 325,000 | | | | 325,039,052 | |
(3 mo. LIBOR US + 0.11%), 0.24%, 01/03/22 | | | 100,000 | | | | 100,000,000 | |
(3 mo. LIBOR US + 0.11%), 0.33%, 01/14/22 | | | 268,100 | | | | 268,110,030 | |
(SOFR + 0.30%), 0.38%, 01/06/23 | | | 335,000 | | | | 334,986,215 | |
Credit Industriel et Commercial, New York, (3 mo. LIBOR US + 0.05%), 0.19%, 05/06/22(a)(b) | | | 350,000 | | | | 350,050,578 | |
Credit Suisse AG, New York(b) | | | | | | | | |
0.24%, 02/15/22 | | | 93,000 | | | | 93,010,537 | |
(SOFR + 0.30%), 0.35%, 05/09/22(a) | | | 250,000 | | | | 250,085,027 | |
Kookmin Bank, New York(a)(b) | | | | | | | | |
0.34%, 11/17/22 | | | 96,000 | | | | 96,011,370 | |
0.34%, 11/21/22 | | | 145,000 | | | | 144,903,263 | |
0.36%, 12/02/22 | | | 106,000 | | | | 106,057,982 | |
(1 mo. LIBOR US + 0.23%), 0.33%, 02/07/22 | | | 60,000 | | | | 60,014,600 | |
Landesbank Baden-Wurttemberg, New York(b) | | | | | | | | |
0.07%, 01/06/22 | | | 215,000 | | | | 214,999,641 | |
0.15%, 01/03/22 | | | 386,000 | | | | 386,002,250 | |
0.16%, 01/03/22 | | | 482,000 | | | | 482,003,012 | |
0.17%, 02/07/22 | | | 146,500 | | | | 146,508,491 | |
Mizuho Bank Ltd., New York(b) | | | | | | | | |
0.15%, 01/26/22 | | | 285,000 | | | | 285,014,811 | |
| | | | | | | | |
Security | | Par (000) | | | Value | |
| | |
Yankee (continued) | | | | | | | | |
Mizuho Bank Ltd., New York(b) (continued) | |
0.16%, 02/10/22 | | $ | 409,000 | | | $ | 409,023,722 | |
0.16%, 03/04/22 | | | 144,000 | | | | 143,998,461 | |
MUFG Bank Ltd., New York(b) | | | | | | | | |
0.23%, 01/28/22 | | | 193,000 | | | | 193,020,091 | |
0.24%, 01/13/22 | | | 49,000 | | | | 49,003,130 | |
0.30%, 10/31/22 | | | 147,500 | | | | 147,311,050 | |
0.32%, 10/24/22 | | | 263,000 | | | | 262,729,210 | |
Natixis, New York(b) | | | | | | | | |
0.22%, 08/05/22(a) | | | 375,000 | | | | 374,882,565 | |
0.27%, 07/07/22(a) | | | 493,000 | | | | 492,889,381 | |
0.30%, 10/20/22 | | | 140,000 | | | | 139,832,809 | |
(3 mo. LIBOR US + 0.07%), 0.27%, 03/10/22(a) | | | 280,000 | | | | 280,098,613 | |
Norinchukin Bank, New York(b) | | | | | | | | |
0.11%, 01/06/22 | | | 235,000 | | | | 235,001,605 | |
0.11%, 01/07/22 | | | 157,000 | | | | 157,001,220 | |
0.15%, 01/07/22(a) | | | 250,000 | | | | 250,001,457 | |
0.18%, 02/25/22 | | | 290,000 | | | | 290,019,778 | |
0.23%, 03/29/22 | | | 192,000 | | | | 192,002,813 | |
Oversea Chinese Banking Corp. Ltd. New York, 0.36%, 12/23/22(a)(b) | | | 144,000 | | | | 144,006,624 | |
Standard Chartered Bank, New York(b) | | | | | | | | |
0.24%, 02/01/22 | | | 150,000 | | | | 150,005,957 | |
0.25%, 01/20/22 | | | 189,000 | | | | 189,010,367 | |
0.29%, 09/02/22(a) | | | 300,000 | | | | 299,914,341 | |
(3 mo. LIBOR US + 0.06%), 0.19%, 02/01/22(a) | | | 216,000 | | | | 216,002,225 | |
Sumitomo Mitsui Banking Corp., New York(b) | | | | | | | | |
0.16%, 02/04/22(a) | | | 200,000 | | | | 200,009,138 | |
0.22%, 05/05/22 | | | 100,000 | | | | 99,981,574 | |
0.22%, 06/27/22(a) | | | 145,000 | | | | 144,973,493 | |
0.22%, 09/23/22(a) | | | 134,700 | | | | 134,641,345 | |
0.23%, 07/29/22(a) | | | 178,000 | | | | 177,968,877 | |
0.36%, 01/03/23(a) | | | 475,000 | | | | 474,947,137 | |
0.36%, 01/20/23(a) | | | 240,000 | | | | 239,956,805 | |
0.36%, 01/23/23(a) | | | 397,000 | | | | 396,923,752 | |
0.36%, 01/30/23(a) | | | 239,000 | | | | 239,000,000 | |
(3 mo. LIBOR US + 0.04%), 0.20%, 02/14/22(a) | | | 241,000 | | | | 241,022,427 | |
Sumitomo Mitsui Trust Bank Ltd., New York(b) | | | | | | | | |
0.15%, 01/19/22(a) | | | 150,000 | | | | 150,004,196 | |
0.15%, 01/20/22(a) | | | 300,000 | | | | 300,008,664 | |
0.16%, 01/03/22 | | | 90,000 | | | | 90,000,674 | |
0.16%, 01/28/22 | | | 100,000 | | | | 100,004,119 | |
Toronto-Dominion Bank, New York, 0.19%, 08/15/22(a)(b) | | | 279,000 | | | | 278,896,393 | |
Westpac Banking Corp., New York(b) | | | | | | | | |
0.34%, 11/04/22 | | | 35,500 | | | | 35,478,142 | |
(3 mo. LIBOR US + 0.04%), 0.25%, 03/16/22(a) | | | 89,250 | | | | 89,271,928 | |
| | | | | | | | |
| | | | | | | 15,870,304,902 | |
| | | | | | | | |
| | | | | | | 16,998,538,057 | |
| | |
Commercial Paper — 24.7% | | | | | | | | |
Alinghi Funding Co. LLC | | | | | | | | |
0.23%, 04/25/22(c) | | | 112,000 | | | | 111,897,317 | |
0.23%, 06/09/22 | | | 100,000 | | | | 99,845,778 | |
Antalis SA, 0.07%, 01/06/22(c) | | | 90,000 | | | | 89,998,800 | |
ANZ New Zealand International Ltd., London(c) | | | | | | | | |
0.25%, 04/26/22 | | | 100,000 | | | | 99,946,511 | |
0.25%, 05/03/22 | | | 36,000 | | | | 35,978,844 | |
Banco Santander SA, 0.25%, 04/18/22(c) | | | 244,000 | | | | 243,796,504 | |
Bank of Montreal, Chicago | | | | | | | | |
0.08%, 01/03/22(c) | | | 300,000 | | | | 299,997,999 | |
0.43%, 01/13/23(a)(d) | | | 336,000 | | | | 336,016,128 | |
Bank of Nova Scotia, Houston, 0.25%, 04/05/22(c) | | | 314,000 | | | | 313,821,849 | |
| | |
| 22 | | 2 0 2 1 BLACK ROCK ANNUAL REPORT TO SHAREHOLDERS |
| | |
Schedule of Investments (continued) December 31, 2021 | | Money Market Master Portfolio (Percentages shown are based on Net Assets) |
| | | | | | | | |
Security | | Par (000) | | | Value | |
| | |
| Commercial Paper (continued) | | | | | | |
Bedford Row Funding Corp., 0.07%, 01/05/22(c) | | $ | 268,000 | | | $ | 267,997,395 | |
Bennington Stark Capital Co.(c) | | | | | | | | |
0.12%, 01/04/22 | | | 285,000 | | | | 284,997,150 | |
0.11%, 01/05/22 | | | 691,147 | | | | 691,138,361 | |
BNZ International Funding Ltd., London,
0.21%, 01/25/22(c) | | | 148,500 | | | | 148,492,369 | |
Chesham Finance Ltd.(c) | | | | | | | | |
0.08%, 01/04/22 | | | 336,000 | | | | 335,995,968 | |
0.08%, 01/06/22 | | | 70,000 | | | | 69,999,067 | |
Citigroup Global Markets, Inc.(c) | | | | | | | | |
0.19%, 06/03/22 | | | 237,000 | | | | 236,717,141 | |
0.19%, 06/06/22 | | | 42,400 | | | | 42,347,115 | |
Crown Point Capital LLC | | | | | | | | |
0.30%, 04/14/22 | | | 300,000 | | | | 300,000,000 | |
0.27%, 06/28/22 | | | 359,000 | | | | 358,738,127 | |
0.30%, 10/03/22(d) | | | 476,000 | | | | 475,298,071 | |
0.30%, 10/04/22 | | | 100,000 | | | | 99,851,240 | |
Dexia Credit Local SA, 0.17%, 03/01/22(c) | | | 150,000 | | | | 149,962,500 | |
Equinor ASA, 0.09%, 01/05/22(c) | | | 436,000 | | | | 435,996,368 | |
Fidelity National Information Service Ltd., 0.29%, 01/10/22(c) | | | 49,000 | | | | 48,997,577 | |
Goldman Sachs International(c) | | | | | | | | |
0.12%, 01/12/22 | | | 55,836 | | | | 55,834,586 | |
0.33%, 01/14/22 | | | 84,000 | | | | 83,997,420 | |
0.25%, 09/23/22 | | | 350,000 | | | | 348,895,729 | |
Hitachi America Capital Ltd., 0.35%, 01/05/22(c) | | | 304,000 | | | | 303,993,370 | |
HSBC Bank PLC(c) | | | | | | | | |
0.33%, 01/03/22 | | | 319,000 | | | | 318,997,343 | |
0.31%, 01/07/22 | | | 281,000 | | | | 280,994,537 | |
0.27%, 02/02/22 | | | 400,000 | | | | 399,929,600 | |
ING US Funding LLC, 0.25%, 04/05/22(c) | | | 130,000 | | | | 129,926,243 | |
Legacy Capital LLC, 0.30%, 05/06/22 | | | 300,000 | | | | 299,898,600 | |
Macquarie Bank Ltd. | | | | | | | | |
0.20%, 03/25/22(a) | | | 110,000 | | | | 109,992,496 | |
0.20%, 04/01/22(a) | | | 100,000 | | | | 99,967,200 | |
0.31%, 10/17/22(c) | | | 130,000 | | | | 129,531,892 | |
0.41%, 12/14/22(a) | | | 100,000 | | | | 100,004,200 | |
0.41%, 12/15/22(a) | | | 192,000 | | | | 192,000,000 | |
0.43%, 01/04/23(a) | | | 400,000 | | | | 399,998,780 | |
0.43%, 01/09/23(a) | | | 455,000 | | | | 455,058,930 | |
Mizuho Bank Ltd.(c) | | | | | | | | |
0.14%, 01/06/22 | | | 190,000 | | | | 189,996,833 | |
0.15%, 01/07/22 | | | 392,000 | | | | 391,992,380 | |
National Australia Bank Ltd.(a) | | | | | | | | |
(3 mo. LIBOR US + 0.04%), 0.24%, 03/29/22 | | | 150,000 | | | | 150,047,525 | |
(SOFR + 0.20%), 0.27%, 04/14/22 | | | 118,000 | | | | 118,028,965 | |
Nordea Bank ABP, 0.31%, 10/21/22(c) | | | 70,000 | | | | 69,807,920 | |
Ridgefield Funding Co. LLC(c) | | | | | | | | |
0.21%, 02/18/22 | | | 35,000 | | | | 34,991,854 | |
0.17%, 03/02/22 | | | 238,000 | | | | 237,918,537 | |
0.17%, 03/07/22 | | | 50,000 | | | | 49,980,750 | |
0.17%, 03/14/22 | | | 120,000 | | | | 119,945,980 | |
0.27%, 04/01/22 | | | 97,030 | | | | 96,968,437 | |
0.20%, 05/03/22 | | | 155,000 | | | | 154,855,424 | |
0.25%, 05/09/22 | | | 153,000 | | | | 152,847,038 | |
0.25%, 05/10/22 | | | 200,000 | | | | 199,797,778 | |
Skandinaviska Enskilda Banken AB(c) | | | | | | | | |
0.15%, 02/18/22 | | | 110,000 | | | | 109,983,232 | |
0.24%, 04/21/22 | | | 245,000 | | | | 244,833,052 | |
Societe Generale SA(c) | | | | | | | | |
0.32%, 01/10/22(d) | | | 470,000 | | | | 469,962,400 | |
| | | | | | | | |
Security | | Par (000) | | | Value | |
| | |
| Commercial Paper (continued) | | | | | | |
Societe Generale SA(c) (continued) | | | | | | | | |
0.18%, 03/31/22 | | $ | 382,000 | | | $ | 381,866,300 | |
0.31%, 10/21/22 | | | 177,000 | | | | 176,276,424 | |
SPIRE, Inc., 0.31%, 01/20/22(c) | | | 45,000 | | | | 44,994,000 | |
Standard Chartered Bank(c) | | | | | | | | |
0.25%, 05/04/22 | | | 192,000 | | | | 191,814,165 | |
0.22%, 05/20/22 | | | 194,000 | | | | 193,783,475 | |
Sumitomo Mitsui Trust Bank Ltd., 0.13%, 01/12/22(c) | | | 240,000 | | | | 239,993,921 | |
Toyota Credit Canada, Inc., 0.25%, 05/18/22(c) | | | 90,000 | | | | 89,911,680 | |
UBS AG, London | | | | | | | | |
0.30%, 03/11/22(c) | | | 90,000 | | | | 89,963,250 | |
0.25%, 07/12/22(c) | | | 205,000 | | | | 204,563,686 | |
0.29%, 07/13/22(a)(d) | | | 430,000 | | | | 430,022,829 | |
0.22%, 09/22/22(a)(d) | | | 168,000 | | | | 167,866,648 | |
0.38%, 12/02/22(a) | | | 481,000 | | | | 480,999,071 | |
(SOFR + 0.20%), 0.28%, 02/08/22(a)(d) | | | 108,000 | | | | 108,009,819 | |
(SOFR + 0.20%), 0.28%, 02/10/22(a)(d) | | | 135,000 | | | | 135,000,265 | |
(SOFR + 0.24%), 0.31%, 04/05/22(a) | | | 200,000 | | | | 200,013,002 | |
United Overseas Bank Ltd.(c) | | | | | | | | |
0.15%, 03/08/22 | | | 100,000 | | | | 99,969,106 | |
0.18%, 05/31/22 | | | 291,000 | | | | 290,655,796 | |
Versailles Com Paper LLC, 0.30%, 04/18/22(c) | | | 100,000 | | | | 99,921,400 | |
Washington Morgan Capital Ltd. | | | | | | | | |
0.40%, 06/09/22 | | | 190,000 | | | | 189,991,486 | |
0.50%, 09/01/22 | | | 40,000 | | | | 39,991,774 | |
0.60%, 11/30/22 | | | 95,000 | | | | 94,921,700 | |
Westpac Banking Corp. | | | | | | | | |
0.27%, 10/14/22(c) | | | 100,000 | | | | 99,693,867 | |
(3 mo. LIBOR US + 0.04%), 0.23%, 03/10/22(a) | | | 92,000 | | | | 92,002,024 | |
| | | | | | | | |
| | | | | | | 16,221,032,898 | |
Corporate Bonds — 1.3% | | | | | | | | |
| | |
| Automobiles — 1.1% | | | | | | |
Toyota Motor Credit Corp.(a) | | | | | | | | |
0.27%, 03/28/22 | | | 234,000 | | | | 234,021,261 | |
0.05%, 08/15/22 | | | 339,881 | | | | 339,529,094 | |
0.05%, 12/14/22 | | | 134,008 | | | | 134,107,166 | |
| | | | | | | | |
| | | | | | | 707,657,521 | |
| | |
Banks — 0.2% | | | | | | | | |
Kookmin Bank, (SOFR + 0.32%), 0.40%, 11/03/22(a)(d) | | | 168,000 | | | | 167,986,063 | |
| | | | | | | | |
| | | | | | | 875,643,584 | |
| | | | | | | | |
| | |
Municipal Bonds — 3.0% | | | | | | | | |
| | |
Arizona — 0.1% | | | | | | | | |
Mizuho Floater/Residual Trust, RB, VRDN, 0.34%, 02/15/41(a)(d)(e) | | | 69,489 | | | | 69,489,104 | |
| | | | | | | | |
| | |
California — 0.3% | | | | | | | | |
Mizuho Floater/Residual Trust, RB, VRDN, 0.37%, 07/01/39(a)(d)(e) | | | 115,400 | | | | 115,400,000 | |
Taxable Municipal Funding Trust, RB, Series 2020-001, VRDN, 0.28%, 02/01/31(a)(d)(e) | | | 41,915 | | | | 41,915,000 | |
| | | | | | | | |
| | | | | | | 157,315,000 | |
| | |
Montana — 0.0% | | | | | | | | |
Rib Floater Trust Various States, RB,
Series 19W, VRDN, 0.28%, 08/15/22(a)(d)(e) | | | 15,695 | | | | 15,695,000 | |
Taxable Municipal Funding Trust, RB(a)(d)(e) | | | | | | | | |
Series 2018, VRDN, 0.28%, 03/01/47 | | | 4,000 | | | | 4,000,000 | |
Series 2018-4, VRDN, (AGM-CR), 0.14%, 11/01/28 | | | 3,170 | | | | 3,170,000 | |
| | | | | | | | |
| | | | | | | 22,865,000 | |
| | |
MASTER PORTFOLIO SCHEDULE OF INVESTMENTS | | 23 |
| | |
Schedule of Investments (continued) December 31, 2021 | | Money Market Master Portfolio (Percentages shown are based on Net Assets) |
| | | | | | | | |
Security | | Par (000) | | | Value | |
| | |
| New Hampshire — 0.0% | | | | | | |
New Hampshire Business Finance Authority, RB, Series A, VRDN, 0.16%, 07/01/29(a)(d)(e) | | $ | 12,500 | | | $ | 12,500,000 | |
| | | | | | | | |
| | |
New York — 2.5% | | | | | | | | |
Jets Stadium Development LLC(a)(e) | | | | | | | | |
Series A-4A, VRDN, 0.17%, 04/01/47 | | | 39,155 | | | | 39,155,000 | |
Series A-4B, VRDN, 0.17%, 04/01/47 | | | 2,400 | | | | 2,400,000 | |
Series A-4C, VRDN, 0.17%, 04/01/47 | | | 34,100 | | | | 34,100,000 | |
Jets Stadium Finance Issuer 2015 LLC, VRDN, 0.17%, 04/01/47(a)(d)(e) | | | 119,470 | | | | 119,470,000 | |
Metropolitan Transportation Authority Refunding RB, Series A, 0.78%, 11/15/22 | | | 219,520 | | | | 219,779,253 | |
Mizuho Floater/Residual Trust, RB(a)(d)(e) | | | | | | | | |
VRDN, 0.34%, 05/01/23 | | | 6,905 | | | | 6,905,000 | |
VRDN, 0.49%, 09/01/26 | | | 109,000 | | | | 109,000,000 | |
VRDN, 0.34%, 10/01/60 | | | 7,680 | | | | 7,680,000 | |
Series 2020, VRDN, 0.49%, 09/01/27 | | | 37,000 | | | | 37,000,000 | |
Mizuho Floater/Residual Trust, RB, M/F Housing, Series 2020, VRDN, 0.34%, 12/01/58(a)(d)(e) | | | 42,500 | | | | 42,500,000 | |
Taxable Municipal Funding Trust, RB(a)(d)(e) | | | | | | | | |
VRDN, 0.28%, 12/31/23 | | | 25,000 | | | | 25,000,000 | |
VRDN, 0.28%, 01/16/25 | | | 2,375 | | | | 2,375,000 | |
VRDN, 0.28%, 12/15/25 | | | 555,995 | | | | 555,995,000 | |
VRDN, 0.28%, 09/01/30 | | | 101,340 | | | | 101,340,000 | |
VRDN, 0.28%, 05/15/56 | | | 71,300 | | | | 71,300,000 | |
Series 20, VRDN, 0.28%, 05/01/29 | | | 66,820 | | | | 66,820,000 | |
Series 2019, VRDN, 0.14%, 06/01/47 | | | 59,710 | | | | 59,710,000 | |
Taxable Municipal Funding Trust, Refunding RB(a)(d)(e) | | | | | | | | |
VRDN, 0.12%, 05/15/50 | | | 16,005 | | | | 16,005,000 | |
VRDN, 0.12%, 11/01/52 | | | 2,500 | | | | 2,500,000 | |
VRDN, 0.12%, 11/15/52 | | | 32,865 | | | | 32,865,000 | |
VRDN, 0.28%, 11/15/54 | | | 34,720 | | | | 34,720,000 | |
Series 2019-F, VRDN, 0.28%, 12/01/30 | | | 8,155 | | | | 8,155,000 | |
Series 2020-012, VRDN, 0.14%, 09/01/30 | | | 35,885 | | | | 35,885,000 | |
| | | | | | | | |
| | | | | | | 1,630,659,253 | |
| | |
Ohio — 0.1% | | | | | | | | |
Mizuho Floater/Residual Trust, RB,
Series 2020, VRDN, 0.18%, 11/01/49(a)(d)(e) | | | 34,170 | | | | 34,170,000 | |
| | | | | | | | |
| | |
Texas — 0.0% | | | | | | | | |
Mizuho Floater/Residual Trust, RB, VRDN, 0.34%, 11/01/56(a)(d)(e) | | | 2,905 | | | | 2,905,000 | |
| | | | | | | | |
| | |
Wisconsin — 0.0% | | | | | | | | |
Taxable Municipal Funding Trust, RB, Series 2019-B, VRDN, 0.28%, 11/01/24(a)(d)(e) | | | 6,145 | | | | 6,145,000 | |
| | | | | | | | |
| | | | | | | 1,936,048,357 | |
| | | | | | | | |
| | | | | | | | |
Security | | Par (000) | | | Value | |
| | |
| Time Deposits — 5.9% | | | | | | |
ABN Amro Bank NV | | | | | | | | |
0.08%, 01/03/22 | | $ | 226,000 | | | $ | 226,000,000 | |
0.08%, 01/05/22 | | | 149,000 | | | | 149,000,000 | |
Australia & New Zealand Bank, 0.07%, 01/03/22 | | | 396,000 | | | | 396,000,000 | |
Bank of Nova Scotia, 0.07%, 01/06/22 | | | 360,000 | | | | 360,000,000 | |
Credit Agricole CIB, 0.04%, 01/03/22 | | | 5,400 | | | | 5,400,000 | |
ING Bank NV, 0.08%, 01/05/22 | | | 723,000 | | | | 723,000,000 | |
Landesbank Hessen-Thueringen Girozentrale, 0.12%, 01/07/22 | | | 275,000 | | | | 275,000,000 | |
Mizuho Bank Ltd., New York, 0.07%, 01/03/22 | | | 483,000 | | | | 483,000,000 | |
National Bank of Canada, 0.06%, 01/03/22 | | | 411,000 | | | | 411,000,000 | |
National Bank Of Canada, 0.06%, 01/05/22 | | | 410,000 | | | | 410,000,000 | |
Royal Bank of Canada, 0.05%, 01/03/22 | | | 200,000 | | | | 200,000,000 | |
Toronto-Dominion Bank, 0.07%, 01/04/22 | | | 215,000 | | | | 215,000,000 | |
| | | | | | | | |
| | | | | | | 3,853,400,000 | |
| | | | | | | | |
| | |
U.S. Treasury Obligations — 0.3% | | | | | | | | |
U.S. Treasury Bills, 0.11%, 04/26/22(c) | | | 216,290 | | | | 216,243,635 | |
| | | | | | | | |
| | | | | | | 216,243,635 | |
| | | | | | | | |
| | |
Total Short-Term Securities — 61.1%
(Cost: $40,104,850,840) | | | | | | | 40,100,906,531 | |
| | | | | | | | |
| | |
Total Repurchase Agreements — 40.6%
(Cost: $26,669,000,000) | | | | | | | 26,669,000,000 | |
| | | | | | | | |
| | |
Total Investments — 101.7%
(Cost: $66,773,850,840(f)) | | | | | | | 66,769,906,531 | |
Liabilities in Excess of Other Assets — (1.7)% | | | | (1,097,246,749 | ) |
| | | | | | | | |
| | |
Net Assets — 100.0% | | | | | | $ | 65,672,659,782 | |
| | | | | | | | |
| (a) | Variable rate security. Interest rate resets periodically. The rate shown is the effective interest rate as of period end. Security description also includes the reference rate and spread if published and available. |
| (b) | Issuer is a U.S. branch of foreign domiciled bank. |
| (c) | Rates are the current rate or a range of current rates as of period end. |
| (d) | Security exempt from registration pursuant to Rule 144A under the Securities Act of 1933, as amended. These securities may be resold in transactions exempt from registration to qualified institutional investors. |
| (e) | Variable rate security. Rate as of period end and maturity is the date the principal owed can be recovered through demand. |
| (f) | Cost for U.S. federal income tax purposes. |
Repurchase Agreements
| | | | | | | | | | | | | | | | | | | | | | | | | | | | | | | | | | | | |
| |
| | | Repurchase Agreements | | | | | Collateral | |
| | | | | | | | | | |
Counterparty | | Coupon Rate | | | Purchase Date | | | Maturity Date | | | Par (000) | | | At Value (000) | | | Proceeds Including Interest | | | | | Position | | Original Par | | | Position Received, at Value | |
| |
| | | | | | | | | | |
Barclays Bank PLC | | | 0.17 | %(a) | | | 12/31/21 | | | | 01/03/22 | | | $ | 460,000 | | | $ | 460,000 | | | $ | 460,006,517 | | | | | Corporate Debt/Obligation,
0.00% to 8.35%,
due 6/01/24 to 2/08/61 | | $ | 436,211,000 | | | $ | 483,000,192 | |
| | |
| 24 | | 2 0 2 1 BLACK ROCK ANNUAL REPORT TO SHAREHOLDERS |
| | |
Schedule of Investments (continued) December 31, 2021 | | Money Market Master Portfolio |
Repurchase Agreements (continued)
| | | | | | | | | | | | | | | | | | | | | | | | | | | | | | |
|
| | | |
| | | Repurchase Agreements | | | | Collateral |
| | | | | | | | | | |
| Counterparty | | Coupon
Rate | | | Purchase
Date | | | Maturity
Date | | | Par (000) | | | At Value
(000) | | | Proceeds
Including
Interest | | | | Position | | Original Par | | Position
Received,
at Value |
| | | | | | | | | | |
Barclays Bank PLC (continued) | | | 0.29 | %(a) | | | 12/31/21 | | | | 01/03/22 | | | $ | 30,000 | | | $ | 30,000 | | | $ 30,000,725 | | | | Corporate Debt/Obligation, 1.64% to 10.50%, due 2/15/22 to 6/04/81 | | $ 32,604,000 | | $ 33,829,676 |
| | | 0.57 | (a) | | | 12/31/21 | | | | 04/05/22 | | | | 71,500 | | | | 71,500 | | | 71,607,548 | | | | Corporate Debt/Obligation, 0.92% to 5.14%, due 4/01/33 to 7/15/60 | | 64,470,000 | | 76,507,460 |
| | | | | | | | | | | | | | | | | | | | | | | | | | | | | | |
Total Barclays Bank PLC. | | | $ | 561,500 | | | | | | | | | | | $ 593,337,328 |
| | | | | | | | | | | | | | | | | | | | | | | | | | | | | | |
Barclays Capital, Inc. | | | 0.30 | (a) | | | 12/31/21 | | | | 02/04/22 | | | | 116,000 | | | | 116,000 | | | 116,033,833 | | | | U.S. Treasury Obligation, 4.38%, due 11/15/39 | | 84,886,100 | | 118,320,052 |
| | | 0.57 | (a) | | | 12/31/21 | | | | 04/05/22 | | | | 71,500 | | | | 71,500 | | | 71,607,548 | | | | Corporate Debt/Obligation, 0.00% to 8.62%, due
10/17/24 to 4/15/2119 | | 558,972,718 | | 83,595,670 |
| | | 0.42 | | | | 12/13/21 | | | | 03/17/22 | | | | 75,000 | | | | 75,000 | | | 75,082,250 | | | | Corporate Debt/Obligation, 0.00% to 1.92%, due
1/03/22 to 12/15/59 | | 6,182,214,677 | | 80,250,000 |
| | | | | | | | | | | | | | | | | | | | | | | | | | | | | | |
Total Barclays Capital, Inc. | | | $ | 262,500 | | | | | | | | | | | $ 282,165,722 |
| | | | | | | | | | | | | | | | | | | | | | | | | | | | | | |
BNP Paribas S.A | | | 0.17 | (a) | | | 12/31/21 | | | | 01/03/22 | | | | 219,000 | | | | 219,000 | | | 219,003,102 | | | | Corporate Debt/Obligation, 0.00% to 6.00%, due 10/31/22 to 10/25/68 | | 742,744,305 | | 229,421,155 |
| | | 0.42 | (a) | | | 12/31/21 | | | | 04/05/22 | | | | 85,000 | | | | 85,000 | | | 85,094,208 | | | | Corporate Debt/Obligation, 1.20% to 15.50%, due 1/12/23 to 12/31/49 | | 92,072,370 | | 95,692,880 |
| | | | | | | | | | | | | | | | | | | | | | | | | | | | | | |
Total BNP Paribas S.A. | | | $ | 304,000 | | | | | | | | | | | $ 325,114,035 |
| | | | | | | | | | | | | | | | | | | | | | | | | | | | | | |
Bofa Securities, Inc. | | | 0.17 | (a) | | | 12/31/21 | | | | 01/03/22 | | | | 115,000 | | | | 115,000 | | | 115,001,629 | | | | U.S. Government Sponsored Agency Obligation, 2.00% to 3.00%, due 12/01/41 to 11/01/51 | | 112,519,187 | | 118,450,001 |
| | | 0.32 | (a) | | | 12/31/21 | | | | 02/04/22 | | | | 100,000 | | | | 100,000 | | | 100,031,111 | | | | Corporate Debt/Obligation, 0.65% to 6.63%,
due 7/31/23 to 11/15/60 | | 97,048,000 | | 105,000,066 |
| | | 0.39 | (a) | | | 12/31/21 | | | | 02/04/22 | | | | 305,000 | | | | 305,000 | | | 305,115,646 | | | | Corporate Debt/Obligation, 0.00% to 6.10%,
due 1/03/22 to 1/25/70 | | 470,919,440 | | 326,350,314 |
| | | 0.67 | (a) | | | 12/31/21 | | | | 03/06/22 | | | | 198,000 | | | | 198,000 | | | 198,239,525 | | | | Corporate Debt/Obligation, 3.00% to 10.38%,
due 3/11/22 to 10/25/58 | | 266,689,360 | | 232,708,288 |
| | | | | | | | | | | | | | | | | | | | | | | | | | | | | | |
Total Bofa Securities, Inc. | | | $ | 718,000 | | | | | | | | | | | $ 782,508,669 |
| | | | | | | | | | | | | | | | | | | | | | | | | | | | | | |
Citigroup Global Markets, Inc.(b) | | | 0.12 | (a) | | | 12/31/21 | | | | 01/03/22 | | | | 150,000 | | | | 150,000 | | | 150,001,500 | | | | U.S. Treasury Obligation, 3.00%, due 2/15/47 | | 125,623,200 | | 153,000,013 |
| | | 0.38 | (a) | | | 12/31/21 | | | | 04/02/22 | | | | 179,000 | | | | 179,000 | | | 179,173,829 | | | | U.S. Treasury Obligation, 2.00% to 4.50%, due
2/15/29 to 8/15/51 | | 151,633,000 | | 182,580,021 |
| | | 0.05 | | | | 12/31/21 | | | | 01/03/22 | | | | 50,000 | | | | 50,000 | | | 50,000,208 | | | | U.S. Treasury Obligation, 1.25% to 2.38%, due
2/15/50 to 5/15/51 | | 48,931,508 | | 51,000,014 |
| | | | | | | | | | | | | | | | | | | | | | | | | | | | | | |
Total Citigroup Global Markets, Inc | | | $ | 379,000 | | | | | | | | | | | $ 386,580,048 |
| | | | | | | | | | | | | | | | | | | | | | | | | | | | | | |
Credit Agricole Corp.(b) | | | 0.14 | | | | 12/27/21 | | | | 01/03/22 | | | | 285,000 | | | | 285,000 | | | 285,007,758 | | | | Corporate Debt/Obligation, 0.00% to 8.10%, due
1/03/22 to 5/15/97 | | 285,713,205 | | 298,755,298 |
| | | 0.05 | | | | 12/31/21 | | | | 01/03/22 | | | | 1,000 | | | | 1,000 | | | 1,000,004 | | | | U.S. Government Sponsored Agency Obligation, 2.00%, due 1/20/51 | | 1,127,544 | | 1,020,001 |
| | |
MASTER PORTFOLIO SCHEDULE OF INVESTMENTS | | 25 |
| | |
Schedule of Investments (continued) December 31, 2021 | | Money Market Master Portfolio |
Repurchase Agreements (continued)
| | | | | | | | | | | | | | | | | | | | | | | | | | | | | | | | | | | | | | |
| | | | |
| | | Repurchase Agreements | | | | | | Collateral | |
| | | | | | | | | | |
| Counterparty | | Coupon
Rate | | | Purchase
Date | | | Maturity
Date | | | Par (000) | | | At Value
(000) | | | Proceeds Including Interest | | | | | | Position | | Original Par | | | Position Received, at Value | |
| | | | | | | | | | |
Credit Agricole
Corp.(b) (continued) | | | 0.14 | %(a) | | | 12/31/21 | | | | 01/07/22 | | | $ | 871,000 | | | $ | 871,000 | | | $ | 871,023,711 | | | | | | | U.S. Treasury Obligation,
0.00% to 9.38%,
due 1/03/22 to 5/15/97 | | $ | 897,267,024 | | | $ | 919,007,965 | |
| | | | | | | | | | |
| | | 0.05 | | | | 12/31/21 | | | | 01/03/22 | | | | 108,000 | | | | 108,000 | | | | 108,000,450 | | | | | | | U.S. Treasury Obligation,
0.25% to 3.00%,
due 12/31/23 to 1/31/28 | | | 110,633,976 | | | | 110,160,014 | |
| | | | | | | | | | | | | | | | | | | | | | | | | | | | | | | | | | | | | | |
Total Credit Agricole Corp. | | | | | | | | | | | $ | 1,265,000 | | | | | | | | | | | | | | | | | $ | 1,328,943,278 | |
| | | | | | | | | | | | | | | | | | | | | | | | | | | | | | | | | | | | | | |
| | | | | | | | | | |
Credit Suisse Securities (USA) LLC | | | 0.66 | (a) | | | 12/31/21 | | | | 04/05/22 | | | | 550,000 | | | | 550,000 | | | | 550,957,917 | | | | | | | Corporate Debt/Obligation, 0.00% to 33.11%, due 2/02/22 to 4/15/73 | | | 4,220,500,005 | | | | 610,613,045 | |
| | | | | | | | | | |
Federal Reserve Bank of New York | | | 0.05 | | | | 12/31/21 | | | | 01/03/22 | | | | 18,900,000 | | | | 18,900,000 | | | | 18,900,078,750 | | | | | | | U.S. Treasury Obligation, 0.13% to 2.88%, due
7/31/22 to 5/15/30 | | | 18,622,847,100 | | | | 18,900,078,768 | |
| | | | | | | | | | |
Fixed Income Clearing Corporation - BNYM | | | 0.01 | | | | 12/31/21 | | | | 01/03/22 | | | | 300,000 | | | | 300,000 | | | | 300,000,250 | | | | | | | U.S. Treasury Obligation, 0.50%, due 3/31/25 | | | 310,878,100 | | | | 306,000,030 | |
| | | | | | | | | | |
HSBC Securities (USA), Inc. | | | 0.19 | (a) | | | 12/31/21 | | | | 01/03/22 | | | | 59,000 | | | | 59,000 | | | | 59,000,934 | | | | | | | Corporate Debt/Obligation, 1.90% to 4.95%, due 1/27/23 to 8/15/60 | | | 61,220,389 | | | | 61,689,713 | |
| | | 0.27 | (a) | | | 12/31/21 | | | | 01/03/22 | | | | 29,500 | | | | 29,500 | | | | 29,500,664 | | | | | | | Corporate Debt/Obligation,
1.10% to 5.20%, due 4/16/22 to 10/01/49 | | | 27,363,000 | | | | 30,975,220 | |
| | | | | | | | | | | | | | | | | | | | | | | | | | | | | | | | | | | | | | |
Total HSBC Securities (USA), Inc. | | | | | | | $ | 88,500 | | | | | | | | | | | | | | | | | $ | 92,664,933 | |
| | | | | | | | | | | | | | | | | | | | | | | | | | | | | | | | | | | | | | |
| | | | | | | | | | |
J.P. Morgan Securities LLC | | | 0.15 | (a) | | | 12/31/21 | | | | 01/03/22 | | | | 97,000 | | | | 97,000 | | | | 97,001,213 | | | | | | | U.S. Government Sponsored Agency Obligation, 0.05% to 6.50%, due 8/20/35 to 3/16/60 | | | 1,115,705,954 | | | | 101,850,000 | |
| | | 0.17 | (a) | | | 12/31/21 | | | | 01/03/22 | | | | 285,000 | | | | 285,000 | | | | 285,004,037 | | | | | | | U.S. Government Sponsored Agency Obligation, 0.00% to 6.70%, due 1/15/33 to 6/16/63 | | | 4,855,564,500 | | | | 299,250,000 | |
| | | 0.19 | (a) | | | 12/31/21 | | | | 01/03/22 | | | | 115,000 | | | | 115,000 | | | | 115,001,821 | | | | | | | U.S. Government Sponsored Agency Obligation, 0.50% to 18.16%, due 2/25/26 to 11/16/61 | | | 1,179,034,916 | | | | 120,750,000 | |
| | | 0.25 | (a) | | | 12/31/21 | | | | 01/03/22 | | | | 90,000 | | | | 90,000 | | | | 90,001,875 | | | | | | | Corporate Debt/Obligation, 0.25% to 4.89%, due 4/17/30 to 5/17/62 | | | 307,453,994 | | | | 96,300,000 | |
| | | 0.42 | (a) | | | 12/31/21 | | | | 01/03/22 | | | | 90,000 | | | | 90,000 | | | | 90,003,150 | | | | | | | Corporate Debt/Obligation, 2.50% to 5.88%, due 2/15/25 to 2/25/52 | | | 97,116,000 | | | | 96,323,888 | |
| | | 0.10 | (a) | | | 12/31/21 | | | | 01/07/22 | | | | 249,000 | | | | 249,000 | | | | 249,004,842 | | | | | | | U.S. Government Sponsored Agency Obligation, 0.00% to 6.49%, due 6/25/27 to 7/16/62 | | | 3,165,932,526 | | | | 261,450,000 | |
| | | 0.37 | (a) | | | 12/31/21 | | | | 01/07/22 | | | | 581,000 | | | | 581,000 | | | | 581,041,800 | | | | | | | Corporate Debt/Obligation, 2.87% to 13.88%, due 1/09/22 to 12/31/00 | | | 631,308,312 | | | | 651,373,989 | |
| | | 0.42 | (a) | | | 12/31/21 | | | | 01/07/22 | | | | 400,000 | | | | 400,000 | | | | 400,032,667 | | | | | | | Corporate Debt/Obligation, 0.10% to 7.50%, due 6/01/23 to 12/31/00 | | | 2,274,702,880 | | | | 431,243,056 | |
| | | 0.53 | (a) | | | 12/31/21 | | | | 03/31/22 | | | | 205,000 | | | | 205,000 | | | | 205,271,625 | | | | | | | Corporate Debt/Obligation, 0.00% to 8.36%, due 1/03/22 to 1/25/61 | | | 1,798,857,070 | | | | 221,171,153 | |
| | |
| 26 | | 2 0 2 1 BLACK ROCK ANNUAL REPORT TO SHAREHOLDERS |
| | |
Schedule of Investments (continued) December 31, 2021 | | Money Market Master Portfolio |
Repurchase Agreements (continued)
| | | | | | | | | | | | | | | | | | | | | | | | | | | | | | | | | | |
| | | | |
| | | Repurchase Agreements | | | | | | Collateral |
| | | | | | | | | | |
| Counterparty | | Coupon
Rate | | | Purchase
Date | | | Maturity
Date | | | Par (000) | | | At Value
(000) | | | Proceeds
Including
Interest | | | | | | Position | | Original Par | | Position
Received, at
Value |
| | | | | | | | | | |
J.P. Morgan Securities LLC (continued) | | | 0.48 | %(a) | | | 12/31/21 | | | | 04/01/22 | | | $ | 175,000 | | | $ | 175,000 | | | $ | 175,212,333 | | | | | | | Corporate Debt/Obligation, 0.00% to 9.00%, due 7/06/22 to 10/25/69 | | $1,499,640,790 | | $ 189,263,603 |
| | | 0.35 | | | | 12/31/21 | | | | 01/07/22 | | | | 400,000 | | | | 400,000 | | | | 400,027,222 | | | | | | | Corporate Debt/Obligation, 0.00% to 8.13%, due 4/15/22 to 12/31/2500 | | 4,417,804,812 | | 431,659,793 |
| | | | | | | | | | | | | | | | | | | | | | | | | | | | | | | | | | |
Total J.P. Morgan Securities LLC | | | | | | | | | | | | | | | | | | $ | 2,687,000 | | | | | | | | | | | | | | | $ 2,900,635,482 |
| | | | | | | | | | | | | | | | | | | | | | | | | | | | | | | | | | |
Mizuho Security USA, Inc. | | | 0.22 | (a) | | | 12/31/21 | | | | 01/03/22 | | | | 24,000 | | | | 24,000 | | | | 24,000,440 | | | | | | | Corporate Debt/Obligation, 4.00% to 5.00%, due 10/01/39 to 2/15/43 | | 20,740,000 | | 25,681,824 |
| | | 0.52 | (a) | | | 12/31/21 | | | | 02/04/22 | | | | 67,000 | | | | 67,000 | | | | 67,033,872 | | | | | | | Corporate Debt/Obligation, 4.00% to 5.00%, due 6/01/32 to 1/01/51 | | 55,140,000 | | 71,695,833 |
| | | 0.62 | (a) | | | 12/31/21 | | | | 04/01/22 | | | | 40,000 | | | | 40,000 | | | | 40,062,689 | | | | | | | Corporate Debt/Obligation, 4.00% to 5.00%, due 3/01/31 to 1/01/56 | | 33,905,000 | | 42,802,273 |
| | | | | | | | | | | | | | | | | | | | | | | | | | | | | | | | | | |
Total Mizuho Security USA, Inc. | | | | | | | | | | | | | | | | | | $ | 131,000 | | | | | | | | | | | | | | | $ 140,179,930 |
| | | | | | | | | | | | | | | | | | | | | | | | | | | | | | | | | | |
TD Securities (USA) LLC | | | 0.19 | | | | 12/29/21 | | | | 01/05/22 | | | | 131,000 | | | | 131,000 | | | | 131,004,840 | | | | | | | Corporate Debt/Obligation, 3.88% to 11.00%, due 11/15/22 to 8/15/29 | | 142,399,000 | | 152,138,899 |
| | | 0.15 | (a) | | | 12/31/21 | | | | 01/03/22 | | | | 99,000 | | | | 99,000 | | | | 99,001,238 | | | | | | | Corporate Debt/Obligation, 0.41% to 5.88%, due 4/20/23 to 1/11/36 | | 119,929,186 | | 106,123,353 |
| | | | | | | | | | | | | | | | | | | | | | | | | | | | | | | | | | |
Total TD Securities (USA) LLC | | | | | | | | | | | | | | | | | | $ | 230,000 | | | | | | | | | | | | | | | $ 258,262,252 |
| | | | | | | | | | | | | | | | | | | | | | | | | | | | | | | | | | |
Wells Fargo Securities LLC | | | 0.31 | | | | 11/12/21 | | | | 02/10/22 | | | | 126,000 | | | | 126,000 | | | | 126,097,650 | | | | | | | Corporate Debt/Obligation, 0.00%, due 1/03/22 | | 132,511,527 | | 132,300,001 |
| | | 0.54 | | | | 12/06/21 | | | | 03/07/22 | | | | 85,000 | | | | 85,000 | | | | 85,116,025 | | | | | | | Corporate Debt/Obligation, 0.00% to 6.66%, due 6/10/26 to 11/25/59 | | 113,434,480 | | 97,750,000 |
| | | 0.22 | | | | 12/30/21 | | | | 01/06/22 | | | | 81,500 | | | | 81,500 | | | | 81,503,486 | | | | | | | Corporate Debt/Obligation, 0.00%, due 1/03/22 | | 85,709,371 | | 85,575,001 |
| | | | | | | | | | | | | | | | | | | | | | | | | | | | | | | | | | |
Total Wells Fargo Securities LLC | | | | | | | | | | | | | | | | | | | 292,500 | | | | | | | | | | | | | | | 315,625,002 |
| | | | | | | | | | | | | | | | | | | | | | | | | | | | | | | | | | |
| | | | | | | | | | | | | | | | | | $ | 26,669,000 | | | | | | | | | | | | | | | $ 27,222,708,522 |
| | | | | | | | | | | | | | | | | | | | | | | | | | | | | | | | | | |
| (a) | Variable rate security. Rate as of period end and maturity is the date the principal owed can be recovered through demand. |
| (b) | Traded in a joint account. |
Fair Value Hierarchy as of Period End
Various inputs are used in determining the fair value of financial instruments. For a description of the input levels and information about the Fund’s policy regarding valuation of financial instruments, refer to the Notes to Financial Statements.
The following table summarizes the Fund’s financial instruments categorized in the fair value hierarchy. The breakdown of the Fund’s financial instruments into major categories is disclosed in the Schedule of Investments above.
| | | | | | | | | | | | | | | | |
| | | | | |
| | | Level 1 | | | Level 2 | | | Level 3 | | | Total | |
Assets | | | | | | | | | | | | | | | | |
Investments | | | | | | | | | | | | | | | | |
Short-Term Securities | | | | | | | | | | | | | | | | |
Certificates of Deposit | | $ | — | | | $ | 16,998,538,057 | | | $ | — | | | $ | 16,998,538,057 | |
Commercial Paper | | | — | | | | 16,221,032,898 | | | | — | | | | 16,221,032,898 | |
Corporate Bonds | | | — | | | | 875,643,584 | | | | — | | | | 875,643,584 | |
Municipal Bonds | | | — | | | | 1,936,048,357 | | | | — | | | | 1,936,048,357 | |
Repurchase Agreements | | | — | | | | 26,669,000,000 | | | | — | | | | 26,669,000,000 | |
| | |
MASTER PORTFOLIO SCHEDULE OF INVESTMENTS | | 27 |
| | |
Schedule of Investments (continued) December 31, 2021 | | Money Market Master Portfolio |
Fair Value Hierarchy as of Period End (continued)
| | | | | | | | | | | | | | | | |
| | | | | |
| | | Level 1 | | | Level 2 | | | Level 3 | | | Total | |
Time Deposits | | $ | — | | | $ | 3,853,400,000 | | | $ | — | | | $ | 3,853,400,000 | |
U.S. Treasury Obligations | | | — | | | | 216,243,635 | | | | — | | | | 216,243,635 | |
| | | | | | | | | | | | | | | | |
| | $ | — | | | $ | 66,769,906,531 | | | $ | — | | | $ | 66,769,906,531 | |
| | | | | | | | | | | | | | | | |
See notes to financial statements.
| | |
| 28 | | 2 0 2 1 BLACK ROCK ANNUAL REPORT TO SHAREHOLDERS |
| | |
Schedule of Investments December 31, 2021 | | Treasury Money Market Master Portfolio (Percentages shown are based on Net Assets) |
| | | | | | | | |
Security | | Par (000) | | | Value | |
| | |
Short-Term Securities | | | | | | | | |
| | |
| U.S. Treasury Obligations — 31.6% | | | | | | |
Cash Management Bills, 0.13%, 05/03/22(a) | | $ | 451,120 | | | $ | 450,933,833 | |
U. S. Treasury Cash Management Bill(a)
0.06%, 03/22/22 | | | 20,640 | | | | 20,637,484 | |
0.07%, 04/05/22 | | | 25,040 | | | | 25,035,359 | |
0.09%, 04/12/22 | | | 128,656 | | | | 128,623,514 | |
U.S. Treasury Bills(a)
0.06%, 03/01/22 | | | 220,993 | | | | 220,973,992 | |
0.06%, 03/10/22 | | | 1,206,852 | | | | 1,206,716,490 | |
0.07%, 03/24/22 | | | 50,040 | | | | 50,031,766 | |
0.09%, 03/31/22 | | | 296,580 | | | | 296,517,677 | |
0.06%, 04/14/22 | | | 141,012 | | | | 140,989,510 | |
0.11%, 04/26/22 | | | 228,405 | | | | 228,324,785 | |
0.13%, 06/16/22 | | | 515,690 | | | | 515,381,042 | |
0.15%, 06/23/22 | | | 270,715 | | | | 270,521,863 | |
0.21%, 06/30/22 | | | 88,065 | | | | 87,972,531 | |
0.08%, 09/08/22 | | | 147,550 | | | | 147,473,151 | |
0.16%, 11/03/22 | | | 453,271 | | | | 452,656,213 | |
0.24%, 12/01/22 | | | 141,435 | | | | 141,120,071 | |
0.40%, 12/29/22 | | | 38,450 | | | | 38,299,212 | |
U.S. Treasury Notes | | | | | | | | |
2.50%, 01/15/22 | | | 143,000 | | | | 143,131,764 | |
1.38%, 01/31/22 | | | 160,085 | | | | 160,257,392 | |
1.75%, 02/28/22 | | | 5,325 | | | | 5,339,028 | |
0.38%, 03/31/22 | | | 5,325 | | | | 5,328,656 | |
0.13%, 04/30/22 | | | 4,075 | | | | 4,075,342 | |
2.13%, 05/15/22 | | | 37,810 | | | | 38,095,081 | |
0.13%, 05/31/22 | | | 122,190 | | | | 122,212,049 | |
1.75%, 06/15/22 | | | 4,675 | | | | 4,710,466 | |
0.13%, 06/30/22 | | | 16,805 | | | | 16,809,482 | |
0.13%, 12/31/22 | | | 35,865 | | | | 35,793,027 | |
| | | | | | | | |
Security | | Par (000) | | | Value | |
| | |
| U.S. Treasury Obligations (continued) | | | | | | |
U.S. Treasury Notes (continued)
2.13%, 12/31/22 | | $ | 22,665 | | | $ | 23,062,452 | |
(3 mo.Treasury money market yield + 0.03%), 0.12%, 04/30/23(b) | | | 177,030 | | | | 177,039,512 | |
(3 mo.Treasury money market yield + 0.03%), 0.11%, 07/31/23(b) | | | 322,485 | | | | 322,495,791 | |
(3 mo.Treasury money market yield + 0.04%), 0.12%, 10/31/23(b) | | | 150,000 | | | | 149,999,999 | |
(3 mo.Treasury money market yield + 0.05%), 0.13%, 01/31/23(b) | | | 741,925 | | | | 742,003,259 | |
(3 mo.Treasury money market yield + 0.06%), 0.14%, 07/31/22(b) | | | 380,082 | | | | 380,078,926 | |
(3 mo.Treasury money market yield + 0.06%), 0.14%, 10/31/22(b) | | | 750,000 | | | | 749,992,007 | |
(3 mo.Treasury money market yield + 0.11%), 0.20%, 04/30/22(b) | | | 264,835 | | | | 264,833,191 | |
| | | | | | | | |
| | |
Total Short-Term Securities — 31.6%
(Cost: $7,767,465,917) | | | | | | | 7,767,465,917 | |
| | | | | | | | |
| |
Total Repurchase Agreements — 71.1%
(Cost: $17,447,000,417) | | | | 17,447,000,417 | |
| | | | | | | | |
| | |
Total Investments — 102.7%
(Cost: $25,214,466,334(c)) | | | | | | | 25,214,466,334 | |
| | | | | | | | |
| |
Liabilities in Excess of Other Assets — (2.7)% | | | | (669,742,942 | ) |
| | | | | | | | |
| | |
Net Assets — 100.0% | | | | | | $ | 24,544,723,392 | |
| | | | | | | | |
| (a) | Rates are the current rate or a range of current rates as of period end. |
| (b) | Variable rate security. Interest rate resets periodically. The rate shown is the effective interest rate as of period end. Security description also includes the reference rate and spread if published and available. |
| (c) | Cost for U.S. federal income tax purposes. |
Repurchase Agreements
| | | | | | | | | | | | | | | | | | | | | | | | | | | | | | |
|
| | | |
| | | Repurchase Agreements | | | | Collateral |
| | | | | | | | | | |
Counterparty | | Coupon Rate | | | Purchase Date | | | Maturity Date | | | Par (000) | | | At Value (000) | | | Proceeds Including Interest | | | | Position | | Original Par | | Position Received, at Value |
|
| | | | | | | | | | |
Bank of Nova Scotia | | | 0.05 | % | | | 12/31/21 | | | | 01/03/22 | | | $ | 5,000 | | | $ | 5,000 | | | $ 5,000,021 | | | | U.S. Treasury Obligation, 0.13% to 1.38%, due 10/15/24 to 2/15/51 | | $ 4,555,400 | | $ 5,100,097 |
Barclays Bank PLC | | | 0.05 | | | | 12/31/21 | | | | 01/03/22 | | | | 250,000 | | | | 250,000 | | | 250,001,042 | | | | U.S. Treasury Obligation, 0.00% to 3.13%, due 2/17/22 to 2/15/43 | | 247,890,100 | | 255,000,119 |
BNP Paribas S.A. | | | 0.05 | | | | 12/31/21 | | | | 01/03/22 | | | | 1,615,000 | | | | 1,615,000 | | | 1,615,006,729 | | | | U.S. Treasury Obligation, 0.00% to 6.38%, due 10/31/22 to 11/15/51 | | 1,468,803,231 | | 1,647,300,009 |
Citigroup Global Markets,
Inc.(a) | | | 0.05 | | | | 12/31/21 | | | | 01/03/22 | | | | 5,000 | | | | 5,000 | | | 5,000,021 | | | | U.S. Treasury Obligation, 0.00%, due 5/12/22 | | 5,102,100 | | 5,100,034 |
| | | 0.05 | | | | 12/31/21 | | | | 01/03/22 | | | | 225,000 | | | | 225,000 | | | 225,000,937 | | | | U.S. Treasury Obligation, 1.25% to 2.38%, due 2/15/50 to 5/15/51 | | 220,191,792 | | 229,500,068 |
| | | | | | | | | | | | | | | | | | | | | | | | | | | | | | |
Total Citigroup Global Markets, Inc. | | | | | | | | | | | $ | 230,000 | | | | | | | | | | | $ 234,600,102 |
| | | | | | | | | | | | | | | | | | | | | | | | | | | | | | |
Credit Agricole Corp.(a) | | | 0.05 | | | | 12/31/21 | | | | 01/03/22 | | | | 492,000 | | | | 492,000 | | | 492,002,050 | | | | U.S. Treasury Obligation, 0.25% to 3.00%, due 12/31/23 to 1/31/28 | | 503,999,224 | | 501,840,062 |
Federal Reserve Bank of New York | | | 0.05 | | | | 12/31/21 | | | | 01/03/22 | | | | 12,790,000 | | | | 12,790,000 | | | 12,790,053,292 | | | | U.S. Treasury Obligation, 0.63% to 1.75%, due 7/15/22 to 8/15/30 | | 13,486,552,600 | | 12,790,053,328 |
| | |
MASTER PORTFOLIO SCHEDULE OF INVESTMENTS | | 29 |
| | |
Schedule of Investments (continued) December 31, 2021 | | Treasury Money Market Master Portfolio |
Repurchase Agreements (continued)
| | | | | | | | | | | | | | | | | | | | | | | | | | | | | | |
|
| | | |
| | | Repurchase Agreements | | | | Collateral |
| | | | | | | | | | |
Counterparty | | Coupon Rate | | | Purchase Date | | | Maturity Date | | | Par (000) | | | At Value (000) | | | Proceeds Including Interest | | | | Position | | Original Par | | Position Received, at Value |
|
Fixed Income Clearing Corporation - JPM | | | 0.05 | % | | | 12/31/21 | | | | 01/03/22 | | | $ | 1,300,000 | | | $ | 1,300,000 | | | $ 1,300,005,833 | | | | U.S. Treasury Obligation, 0.13%, due 12/31/26 | | $ 1,300,000,417 | | $ 1,326,000,425 |
HSBC Securities (USA), Inc. | | | 0.05 | (b) | | | 12/31/21 | | | | 01/03/22 | | | | 225,000 | | | | 225,000 | | | 225,000,937 | | | | U.S. Treasury Obligation, 0.00% to 2.88%, due 6/30/22 to 2/15/51 | | 290,825,836 | | 229,500,000 |
J.P. Morgan Securities LLC | | | 0.05 | | | | 12/31/21 | | | | 01/03/22 | | | | 50,000 | | | | 50,000 | | | 50,000,208 | | | | U.S. Treasury Obligation, 0.00% to 1.88%, due 1/27/22 to 5/15/44 | | 51,315,315 | | 51,000,006 |
Merrill Lynch, Pierce, Fenner & Smith, Inc. | | | 0.05 | | | | 12/31/21 | | | | 01/03/22 | | | | 10,000 | | | | 10,000 | | | 10,000,042 | | | | U.S. Treasury Obligation, 1.25%, due 6/30/28 | | 10,306,700 | | 10,200,026 |
Natixis SA | | | 0.05 | | | | 12/31/21 | | | | 01/03/22 | | | | 175,000 | | | | 175,000 | | | 175,000,729 | | | | U.S. Treasury Obligation, 0.13% to 2.88%, due 1/31/22 to 5/15/29 | | 173,779,500 | | 178,500,104 |
| |
| 0.05
| (b)
| | | 12/31/21 | | | | 01/03/22 | | | | 290,000 | | | | 290,000 | | | 290,001,208 | | | | U.S. Treasury Obligation, 0.00% to 6.00%, due 4/21/22 to 5/15/51 | | 295,760,000 | | 295,800,044 |
| | | | | | | | | | | | | | | | | | | | | | | | | | | | | | |
Total Natixis SA | | | | | | | | | | | | | | | | | | $ | 465,000 | | | | | | | | | | | $ 474,300,148 |
| | | | | | | | | | | | | | | | | | | | | | | | | | | | | | |
SG Americas Securities LLC | | | 0.05 | | | | 12/31/21 | | | | 01/03/22 | | | | 10,000 | | | | 10,000 | | | 10,000,042 | | | | U.S. Treasury Obligation, 0.00% to 6.88%, due 1/27/22 to 11/15/50 | | 8,664,877 | | 10,200,000 |
TD Securities (USA) LLC | | | 0.05 | | | | 12/31/21 | | | | 01/03/22 | | | | 5,000 | | | | 5,000 | | | 5,000,021 | | | | U.S. Treasury Obligation, 2.50%, due 3/31/23 | | 4,946,300 | | 5,100,074 |
| | | | | | | | | | | | | | | | | | | | | | | | | | | | | | |
| | | | | | | | | | | | | | | | | | $ | 17,447,000 | | | | | | | | | | | $17,540,194,396 |
| | | | | | | | | | | | | | | | | | | | | | | | | | | | | | |
| | (a) | Traded in a joint account. |
| | (b) | Variable rate security. Rate as of period end and maturity is the date the principal owed can be recovered through demand. |
Fair Value Hierarchy as of Period End
Various inputs are used in determining the fair value of financial instruments. For a description of the input levels and information about the Master Portfolio’s policy regarding valuation of financial instruments, refer to the Notes to Financial Statements.
The following table summarizes the Master Portfolio’s financial instruments categorized in the fair value hierarchy. The breakdown of the Master Portfolio’s financial instruments into major categories is disclosed in the Schedule of Investments above.
| | | | | | | | | | | | | | | | |
| |
| | | | |
| | | Level 1 | | | Level 2 | | | Level 3 | | | Total | |
| |
| | | | |
Assets | | | | | | | | | | | | | | | | |
Investments | | | | | | | | | | | | | | | | |
Short-Term Securities | | | | | | | | | | | | | | | | |
Repurchase Agreements | | $ | — | | | $ | 17,447,000,417 | | | $ | — | | | $ | 17,447,000,417 | |
U.S. Treasury Obligations | | | — | | | | 7,767,465,917 | | | | — | | | | 7,767,465,917 | |
| | | | | | | | | | | | | | | | |
| | | | |
| | $ | — | | | $ | 25,214,466,334 | | | $ | — | | | $ | 25,214,466,334 | |
| | | | | | | | | | | | | | | | |
See notes to financial statements.
| | |
| 30 | | 2 0 2 1 BLACK ROCK ANNUAL REPORT TO SHAREHOLDERS |
Statements of Assets and Liabilities
December 31, 2021
| | | | | | | | |
| | | Money Market Master Portfolio | | | Treasury Money Market Master Portfolio | |
| |
| | |
ASSETS | | | | | | | | |
Investments, at value — unaffiliated(a) | | $ | 40,100,906,531 | | | $ | 7,767,465,917 | |
Cash | | | 246,894,049 | | | | 215,999 | |
Repurchase agreements, at value(b) | | | 26,669,000,000 | | | | 17,447,000,417 | |
Receivables: | | | | | | | | |
Interest — unaffiliated | | | 11,175,032 | | | | 3,278,885 | |
| | | | | | | | |
| | |
Total assets | | | 67,027,975,612 | | | | 25,217,961,218 | |
| | | | | | | | |
| | |
LIABILITIES | | | | | | | | |
Payables: | | | | | | | | |
Investments purchased | | | 1,351,000,000 | | | | 671,907,825 | |
Investment advisory fees | | | 3,979,912 | | | | 1,227,840 | |
Trustees’ fees | | | 84,084 | | | | 41,954 | |
Professional fees | | | 251,834 | | | | 60,207 | |
| | | | | | | | |
| | |
Total liabilities | | | 1,355,315,830 | | | | 673,237,826 | |
| | | | | | | | |
| | |
NET ASSETS | | $ | 65,672,659,782 | | | $ | 24,544,723,392 | |
| | | | | | | | |
| | |
NET ASSETS CONSIST OF | | | | | | | | |
Investors’ capital | | $ | 65,676,604,091 | | | $ | 24,544,723,392 | |
Net unrealized appreciation (depreciation) | | | (3,944,309 | ) | | | — | |
| | | | | | | | |
| | |
NET ASSETS | | $ | 65,672,659,782 | | | $ | 24,544,723,392 | |
| | | | | | | | |
| | |
(a) Investments, at cost — unaffiliated | | $ | 40,104,850,840 | | | $ | 7,767,465,917 | |
(b) Repurchase agreements, at cost | | $ | 26,669,000,000 | | | $ | 17,447,000,417 | |
See notes to financial statements.
| | |
MASTER PORTFOLIO FINANCIAL STATEMENTS | | 31 |
Statements of Operations
Year Ended December 31, 2021
| | | | | | | | |
| | | Money Market Master Portfolio | | | Treasury Money Market Master Portfolio | |
| | |
INVESTMENT INCOME | | | | | | | | |
Interest — unaffiliated | | $ | 133,393,317 | | | $ | 13,712,085 | |
| | | | | | | | |
| | |
Total investment income | | | 133,393,317 | | | | 13,712,085 | |
| | | | | | | | |
| | |
EXPENSES | | | | | | | | |
Investment advisory | | | 66,542,177 | | | | 21,827,335 | |
Trustees | | | 304,098 | | | | 161,160 | |
Professional | | | 95,657 | | | | 32,298 | |
Miscellaneous | | | 3,132 | | | | 3,757 | |
| | | | | | | | |
Total expenses | | | 66,945,064 | | | | 22,024,550 | |
Less: | | | | | | | | |
Fees waived and/or reimbursed by the Manager | | | (20,362,408 | ) | | | (9,403,889 | ) |
| | | | | | | | |
Total expenses after fees waived and/or reimbursed | | | 46,582,656 | | | | 12,620,661 | |
| | | | | | | | |
Net investment income | | | 86,810,661 | | | | 1,091,424 | |
| | | | | | | | |
| | |
REALIZED AND UNREALIZED GAIN (LOSS) | | | | | | | | |
Net realized gain from: | | | | | | | | |
Investments — unaffiliated | | | 127,838 | | | | 655,711 | |
Net change in unrealized appreciation (depreciation) on: | | | | | | | | |
Investments — unaffiliated | | | (13,855,488 | ) | | | — | |
| | | | | | | | |
Net realized and unrealized gain (loss) | | | (13,727,650 | ) | | | 655,711 | |
| | | | | | | | |
| | |
NET INCREASE IN NET ASSETS RESULTING FROM OPERATIONS | | $ | 73,083,011 | | | $ | 1,747,135 | |
| | | | | | | | |
See notes to financial statements.
| | |
| 32 | | 2 0 2 1 BLACK ROCK ANNUAL REPORT TO SHAREHOLDERS |
Statements of Changes in Net Assets
| | | | | | | | | | | | | | | | |
| | |
| | | Money Market Master Portfolio | | | Treasury Money Market Master Portfolio | |
| | |
| | | Year Ended December 31, | | | Year Ended December 31, | |
| | | | | | | | |
| | | | |
| | | 2021 | | | 2020 | | | 2021 | | | 2020 | |
| |
| | | | |
INCREASE (DECREASE) IN NET ASSETS | | | | | | | | | | | | | | | | |
| | | | |
OPERATIONS | | | | | | | | | | | | | | | | |
Net investment income | | $ | 86,810,661 | | | $ | 444,102,384 | | | $ | 1,091,424 | | | $ | 58,335,961 | |
Net realized gain | | | 127,838 | | | | 2,445,662 | | | | 655,711 | | | | 2,634,886 | |
Net change in unrealized appreciation (depreciation) | | | (13,855,488 | ) | | | (3,672,403 | ) | | | — | | | | — | |
| | | | | | | | | | | | | | | | |
Net increase in net assets resulting from operations | | | 73,083,011 | | | | 442,875,643 | | | | 1,747,135 | | | | 60,970,847 | |
| | | | | | | | | | | | | | | | |
| | | | |
CAPITAL TRANSACTIONS | | | | | | | | | | | | | | | | |
Proceeds from contributions | | | 295,532,215,106 | | | | 286,294,830,540 | | | | 284,012,686,597 | | | | 232,611,625,885 | |
Value of withdrawals | | | (290,536,982,552 | ) | | | (280,577,047,683 | ) | | | (280,628,392,519 | ) | | | (225,213,163,827 | ) |
| | | | | | | | | | | | | | | | |
Net increase in net assets derived from capital transactions | | | 4,995,232,554 | | | | 5,717,782,857 | | | | 3,384,294,078 | | | | 7,398,462,058 | |
| | | | | | | | | | | | | | | | |
| | | | |
NET ASSETS | | | | | | | | | | | | | | | | |
Total increase in net assets | | | 5,068,315,565 | | | | 6,160,658,500 | | | | 3,386,041,213 | | | | 7,459,432,905 | |
Beginning of year | | | 60,604,344,217 | | | | 54,443,685,717 | | | | 21,158,682,179 | | | | 13,699,249,274 | |
| | | | | | | | | | | | | | | | |
End of year | | $ | 65,672,659,782 | | | $ | 60,604,344,217 | | | $ | 24,544,723,392 | | | $ | 21,158,682,179 | |
| | | | | | | | | | | | | | | | |
See notes to financial statements.
| | |
MASTER PORTFOLIO FINANCIAL STATEMENTS | | 33 |
Financial Highlights
| | | | | | | | | | | | | | | | | | | | |
| | | Money Market Master Portfolio | |
| |
| | | Year Ended December 31, | |
| | | | | |
| | | 2021 | | | 2020 | | | 2019 | | | 2018 | | | 2017 | |
| | | | | |
Total Return | | | | | | | | | | | | | | | | | | | | |
Total return | | | 0.11 | % | | | 0.82 | % | | | 2.45 | % | | | 2.10 | % | | | 1.23 | % |
| | | | | | | | | | | | | | | | | | | | |
| | | | | |
Ratios to Average Net Assets | | | | | | | | | | | | | | | | | | | | |
Total expenses | | | 0.10 | % | | | 0.10 | % | | | 0.10 | % | | | 0.10 | % | | | 0.10 | % |
| | | | | | | | | | | | | | | | | | | | |
Total expenses after fees waived and/or reimbursed | | | 0.07 | % | | | 0.07 | % | | | 0.07 | % | | | 0.07 | % | | | 0.07 | % |
| | | | | | | | | | | | | | | | | | | | |
Net investment income | | | 0.13 | % | | | 0.77 | % | | | 2.38 | % | | | 2.06 | % | | | 1.25 | % |
| | | | | | | | | | | | | | | | | | | | |
| | | | | |
Supplemental Data | | | | | | | | | | | | | | | | | | | | |
Net assets, end of year (000) | | $ | 65,672,660 | | | $ | 60,604,344 | | | $ | 54,443,686 | | | $ | 47,340,213 | | | $ | 56,134,571 | |
| | | | | | | | | | | | | | | | | | | | |
See notes to financial statements.
| | |
| 34 | | 2 0 2 1 BLACK ROCK ANNUAL REPORT TO SHAREHOLDERS |
Financial Highlights (continued)
| | | | | | | | | | | | | | | | | | | | |
| | | Treasury Money Market Master Portfolio | |
| |
| | | Year Ended December 31, | |
| | | | | |
| | | 2021 | | | 2020 | | | 2019 | | | 2018 | | | 2017 | |
| | | | | |
Total Return | | | | | | | | | | | | | | | | | | | | |
Total return | | | 0.03 | % | | | 0.45 | % | | | 2.17 | % | | | 1.81 | % | | | 0.84 | % |
| | | | | | | | | | | | | | | | | | | | |
| | | | | |
Ratios to Average Net Assets | | | | | | | | | | | | | | | | | | | | |
Total expenses | | | 0.10 | % | | | 0.10 | % | | | 0.10 | % | | | 0.10 | % | | | 0.10 | % |
| | | | | | | | | | | | | | | | | | | | |
Total expenses after fees waived and/or reimbursed | | | 0.06 | % | | | 0.07 | % | | | 0.07 | % | | | 0.07 | % | | | 0.07 | % |
| | | | | | | | | | | | | | | | | | | | |
Net investment income | | | 0.01 | % | | | 0.37 | % | | | 2.12 | % | | | 1.76 | % | | | 0.87 | % |
| | | | | | | | | | | | | | | | | | | | |
| | | | | |
Supplemental Data | | | | | | | | | | | | | | | | | | | | |
Net assets, end of year (000) | | $ | 24,544,723 | | | $ | 21,158,682 | | | $ | 13,699,249 | | | $ | 8,052,437 | | | $ | 9,348,334 | |
| | | | | | | | | | | | | | | | | | | | |
See notes to financial statements.
| | |
MASTER PORTFOLIO FINANCIAL HIGHLIGHTS | | 35 |
| | |
| Notes to Financial Statements | | |
Master Investment Portfolio (“MIP”) is registered under the Investment Company Act of 1940, as amended (the “1940 Act”), as an open-end management investment company. MIP is organized as a Delaware statutory trust. The financial statements and these accompanying notes relate to two series of MIP: Money Market Master Portfolio and Treasury Money Market Master Portfolio (each, a “Master Portfolio” and together, the “Master Portfolios”). Each Master Portfolio is classified as diversified.
Treasury Money Market Master Portfolio operates as a “government money market fund” under Rule 2a-7 under the 1940 Act. The Master Portfolio is not subject to liquidity fees or temporary suspensions of redemptions due to declines in the Master Portfolio’s weekly liquid assets.
With respect to Money Market Master Portfolio, the Board of Trustees of MIP (the “Board”) is permitted to impose a liquidity fee of up to 2% on the value of shares redeemed or temporarily restrict redemptions from Money Market Master Portfolio for up to 10 business days during a 90 day period, in the event that such Money Market Master Portfolio’s weekly liquid assets fall below certain thresholds.
The Master Portfolios, together with certain other registered investment companies advised by BlackRock Fund Advisors (“BFA” or the “Manager”) or its affiliates, are included in a complex of open-end equity, multi-asset, index and money market funds referred to as the BlackRock Multi-Asset Complex.
| 2. | SIGNIFICANT ACCOUNTING POLICIES |
The financial statements are prepared in conformity with accounting principles generally accepted in the United States of America (“U.S. GAAP”), which may require management to make estimates and assumptions that affect the reported amounts of assets and liabilities in the financial statements, disclosure of contingent assets and liabilities at the date of the financial statements and the reported amounts of increases and decreases in net assets from operations during the reporting period. Actual results could differ from those estimates. Each Master Portfolio is considered an investment company under U.S. GAAP and follows the accounting and reporting guidance applicable to investment companies. Below is a summary of significant accounting policies:
Investment Transactions and Income Recognition: For financial reporting purposes, investment transactions are recorded on the dates the transactions are executed. Realized gains and losses on investment transactions are determined using the specific identification method. Interest income, including amortization and accretion of premiums and discounts on debt securities, is recognized daily on an accrual basis.
Liquidity Fees: Any liquidity fees imposed on the value of shares redeemed in the event that the Money Market Master Portfolio’s weekly liquid assets fall below certain thresholds are recorded as paid-in-capital. The liquidity fees are collected and retained by the Money Market Master Portfolio for the benefit of the Money Market Master Portfolio’s remaining interest holders.
Indemnifications: In the normal course of business, a Master Portfolio enters into contracts that contain a variety of representations that provide general indemnification. A Master Portfolio’s maximum exposure under these arrangements is unknown because it involves future potential claims against a Master Portfolio, which cannot be predicted with any certainty.
Other: Expenses directly related to a Master Portfolio are charged to that Master Portfolio. Other operating expenses shared by several funds, including other funds managed by the Manager, are prorated among those funds on the basis of relative net assets or other appropriate methods.
| 3. | INVESTMENT VALUATION AND FAIR VALUE MEASUREMENTS |
Investment Valuation Policies (Money Market Master Portfolio): The Master Portfolio’s investments are valued at fair value (also referred to as “market value” within the financial statements) each day that the Master Portfolio is open for business and, for financial reporting purposes, as of the report date. U.S. GAAP defines fair value as the price a fund would receive to sell an asset or pay to transfer a liability in an orderly transaction between market participants at the measurement date. The Master Portfolio determines the fair values of its financial instruments using various independent dealers or pricing services under policies approved by the Board. If a security’s market price is not readily available or does not otherwise accurately represent the fair value of the security, the security will be valued in accordance with a policy approved by the Board as reflecting fair value. The BlackRock Global Valuation Methodologies Committee (the “Global Valuation Committee”) is the committee formed by management to develop global pricing policies and procedures and to oversee the pricing function for all financial instruments.
Investment Valuation Policies (Treasury Money Market Master Portfolio): U.S. GAAP defines fair value as the price the Master Portfolio would receive to sell an asset or pay to transfer a liability in an orderly transaction between market participants at the measurement date. The Master Portfolio’s investments are valued under the amortized cost method which approximates current market value in accordance with Rule 2a-7 under the 1940 Act. Under this method, investments are valued at cost when purchased and, thereafter, a constant proportionate accretion of discounts and amortization of premiums are recorded until the maturity of the security. The Master Portfolio seeks to maintain the net asset value (“NAV”) per share of its feeder funds at $1.00, although there is no assurance that it will be able to do so on a continuing basis.
Fair Value Inputs and Methodologies: The following methods and inputs are used to establish the fair value of the Money Market Master Portfolio’s assets and liabilities:
| | • | | Investments are valued on the basis of prices provided by dealers or pricing services. In determining the value of a particular investment, pricing services may use certain information with respect to transactions in such investments, quotations from dealers, pricing matrixes, market transactions in comparable investments and information with respect to various relationships between investments. |
| | • | | Fixed-income investments for which market quotations are readily available are generally valued using the last available bid price or current market quotations provided by independent dealers or third-party pricing services. Floating rate loan interests are valued at the mean of the bid prices from one or more independent brokers or dealers as obtained from a third-party pricing service. Pricing services generally value fixed-income securities assuming orderly transactions of an institutional round lot |
| | |
| 36 | | 2 0 2 1 BLACK ROCK ANNUAL REPORT TO SHAREHOLDERS |
| | |
| Notes to Financial Statements (continued) | | |
| | size, but a fund may hold or transact in such securities in smaller, odd lot sizes. Odd lots may trade at lower prices than institutional round lots. The pricing services may use matrix pricing or valuation models that utilize certain inputs and assumptions to derive values, including transaction data (e.g., recent representative bids and offers), market data, credit quality information, perceived market movements, news, and other relevant information. Certain fixed-income securities, including asset-backed and mortgage related securities may be valued based on valuation models that consider the estimated cash flows of each tranche of the entity, establish a benchmark yield and develop an estimated tranche specific spread to the benchmark yield based on the unique attributes of the tranche. The amortized cost method of valuation may be used with respect to debt obligations with sixty days or less remaining to maturity unless the Manager determines such method does not represent fair value. |
| | • | | Repurchase agreements are valued at amortized cost, which approximates market value. |
Fair Value Hierarchy: Various inputs are used in determining the fair value of financial instruments. These inputs to valuation techniques are categorized into a fair value hierarchy consisting of three broad levels for financial reporting purposes as follows:
| | • | | Level 1 – Unadjusted price quotations in active markets/exchanges for identical assets or liabilities that each Master Portfolio has the ability to access; |
| | • | | Level 2 – Other observable inputs (including, but not limited to, quoted prices for similar assets or liabilities in markets that are active, quoted prices for identical or similar assets or liabilities in markets that are not active, inputs other than quoted prices that are observable for the assets or liabilities (such as interest rates, yield curves, volatilities, prepayment speeds, loss severities, credit risks and default rates) or other market–corroborated inputs); and |
| | • | | Level 3 – Unobservable inputs based on the best information available in the circumstances, to the extent observable inputs are not available (including the Global Valuation Committee’s assumptions used in determining the fair value of financial instruments). |
The hierarchy gives the highest priority to unadjusted quoted prices in active markets for identical assets or liabilities (Level 1 measurements) and the lowest priority to unobservable inputs (Level 3 measurements). Accordingly, the degree of judgment exercised in determining fair value is greatest for instruments categorized in Level 3. The inputs used to measure fair value may fall into different levels of the fair value hierarchy. In such cases, for disclosure purposes, the fair value hierarchy classification is determined based on the lowest level input that is significant to the fair value measurement in its entirety. The categorization of a value determined for financial instruments is based on the pricing transparency of the financial instruments and is not necessarily an indication of the risks associated with investing in those securities.
| 4. | SECURITIES AND OTHER INVESTMENTS |
Repurchase Agreements: Repurchase agreements are commitments to purchase a security from a counterparty who agrees to repurchase the same security at a mutually agreed upon date and price. On a daily basis, the counterparty is required to maintain eligible collateral subject to the agreement and in value no less than the agreed upon repurchase amount. Repurchase agreements may be traded bilaterally, in a tri-party arrangement or may be centrally cleared through a sponsoring agent. Subject to the custodial undertaking associated with a tri-party repurchase arrangement and for centrally cleared repurchase agreements, a third-party custodian maintains accounts to hold collateral for a fund and its counterparties. Typically, a fund and counterparty are not permitted to sell, re-pledge or use the collateral absent a default by the counterparty or a fund, respectively. The Master Portfolios, along with other registered investment companies advised by the Manager, may transfer uninvested cash into a single joint trading account which is then invested in one or more repurchase agreements.
In the event the counterparty defaults and the fair value of the collateral declines, a fund could experience losses, delays and costs in liquidating the collateral.
Repurchase agreements are entered into by a fund under Master Repurchase Agreements (each, an “MRA”). The MRA permits a fund, under certain circumstances including an event of default (such as bankruptcy or insolvency), to offset payables and/or receivables with collateral held by and/or posted to the counterparty. As a result, one single net payment is created. Bankruptcy or insolvency laws of a particular jurisdiction may impose restrictions on or prohibitions against such a right of offset in the event of the MRA counterparty’s bankruptcy or insolvency. Based on the terms of the MRA, the fund receives collateral with a market value in excess of the repurchase price at maturity. Upon a bankruptcy or insolvency of the MRA counterparty, the fund would recognize a liability with respect to such excess collateral. The liability reflects a fund’s obligation under bankruptcy law to return the excess to the counterparty.
| 5. | INVESTMENT ADVISORY AGREEMENT AND OTHER TRANSACTIONS WITH AFFILIATES |
Investment Advisory: MIP, on behalf of each Master Portfolio, entered into an Investment Advisory Agreement with the Manager, the Master Portfolios’ investment adviser and an indirect, wholly-owned subsidiary of BlackRock, Inc. (“BlackRock”), to provide investment advisory services. The Manager is responsible for the management of each Master Portfolio’s portfolio and provides the personnel, facilities, equipment and certain other services necessary to the operations of each Master Portfolio.
For such services, each Master Portfolio pays the Manager a monthly fee at an annual rate equal to 0.10% of the average daily value of each Master Portfolio’s net assets.
Administration: MIP, on behalf of the Master Portfolios, entered into an Administration Agreement with BlackRock Advisors, LLC (“BAL”), which has agreed to provide general administrative services (other than investment advice and related portfolio activities). BAL has agreed to bear all of the Master Portfolios’ ordinary operating expenses, excluding, generally, investment advisory fees, distribution fees, brokerage and other expenses related to the execution of portfolio transactions, extraordinary expenses and certain other expenses which are borne by the Master Portfolios.
BAL is not entitled to compensation for providing administrative services to the Master Portfolios, for so long as BAL (or an affiliate) is entitled to compensation for providing administrative services to corresponding feeder funds that invest substantially all of their assets in the Master Portfolios, or BAL (or an affiliate) receives investment advisory fees from the Master Portfolios.
| | |
MASTER PORTFOLIO NOTES TO FINANCIAL STATEMENTS | | 37 |
| | |
| Notes to Financial Statements (continued) | | |
Effective February 26, 2021, with respect to Money Market Master Portfolio, the Manager entered into a sub-advisory agreement with BlackRock International Limited (“BIL”), an affiliate of the Manager. The Manager pays BIL for services it provides for that portion of the Master Portfolio for which BIL acts as sub-adviser, a monthly fee that is equal to a percentage of the investment advisory fees paid by the Master Portfolio to the Manger.
Expense Waivers and Reimbursements: The Manager contractually agreed to waive a portion of its investment advisory fees equal to the annual rate of 0.03% of the average daily value of each Master Portfolio’s net assets through June 30, 2023. These amounts are included in fees waived and/or reimbursed by the Manager in the Statements of Operations. For the year ended December 31, 2021, the amounts waived were as follows:
| | | | |
| | |
| Master Portfolio Name | | Fees Waived and/or Reimbursed by the Manager | |
Money Market Master Portfolio | | $ | 19,962,653 | |
Treasury Money Market Master Portfolio | | | 6,548,201 | |
| | | | | |
The Manager and BAL have also voluntarily agreed to waive a portion of their respective management investments advisory fees to enable the feeders that invest in the Master Portfolios to maintain minimum levels of daily net investment income, if applicable. The Manager and BAL may discontinue the waiver at any time. The amount waived is included in fees waived and/or reimbursed by the Manager in the Statements of Operations. With respect to Treasury Money Market Master Portfolio, for the year ended December 31, 2021, the amount waived and/or reimbursed was $2,662,230.
The fees and expenses of the MIP’s trustees who are not “interested persons” of MIP, as defined in the 1940 Act (“Independent Trustees”), counsel to the Independent Trustees and the Master Portfolios’ independent registered public accounting firm (together, the “independent expenses”) are paid directly by the Master Portfolios. The Manager has contractually agreed to reimburse the Master Portfolios or provide an offsetting credit against the investment advisory fees paid by the Master Portfolios in an amount equal to these independent expenses through June 30, 2023. These amounts waived are included in fees waived and/or reimbursed by the Manager in the Statements of Operations. For the year ended December 31, 2021, the amounts waived were as follows:
| | | | |
| | |
| Fund Name | | Fees Waived and/or Reimbursed by the Manager | |
Money Market Master Portfolio | | $ | 399,755 | |
Treasury Money Market Master Portfolio | | | 193,458 | |
| | | | | |
Interfund Lending: In accordance with an exemptive order (the “Order”) from the SEC, the Master Portfolios may participate in a joint lending and borrowing facility for temporary purposes (the “Interfund Lending Program”), subject to compliance with the terms and conditions of the Order, and to the extent permitted by each Master Portfolio’s investment policies and restrictions. Each Master Portfolio is currently permitted to borrow and lend under the Interfund Lending Program.
A lending BlackRock fund may lend in aggregate up to 15% of its net assets but may not lend more than 5% of its net assets to any one borrowing fund through the Interfund Lending Program. A borrowing BlackRock fund may not borrow through the Interfund Lending Program or from any other source more than 33 1/3% of its total assets (or any lower threshold provided for by the fund’s investment restrictions). If a borrowing BlackRock fund’s total outstanding borrowings exceed 10% of its total assets, each of its outstanding interfund loans will be subject to collateralization of at least 102% of the outstanding principal value of the loan. All interfund loans are for temporary or emergency purposes and the interest rate to be charged will be the average of the highest current overnight repurchase agreement rate available to a lending fund and the bank loan rate, as calculated according to a formula established by the Board.
During the year ended December 31, 2021, the Master Portfolios did not participate in the Interfund Lending Program.
Trustees and Officers: Certain trustees and/or officers of MIP are directors and/or officers of BlackRock or its affiliates.
Other Transactions: The Master Portfolios may purchase securities from, or sell securities to, an affiliated fund provided the affiliation is due solely to having a common investment adviser, common officers, or common trustees. For the year ended December 31, 2021, the purchase and sale transactions and any net realized gains (losses) with affiliated funds in compliance with Rule 17a-7 under the 1940 Act were as follows:
| | | | | | | | | | | | |
| Fund Name | | Purchases | | | Sales | | | Net Realized
Gain (Loss) | |
Money Market Master Portfolio | | $ | 20,006,945 | | | $ | 564,788,759 | | | $ | — | |
| | | | | | | | | | | | | |
Treasury Money Market Master Portfolio is classified as a partnership for U.S. federal income tax purposes. As such, each investor in the Master Portfolio is treated as the owner of its proportionate share of net assets, income, expenses and realized and unrealized gains and losses of the Master Portfolio. Therefore, no U.S. federal income tax provision is required. It is intended that the Master Portfolio’s assets will be managed so an investor in the Master Portfolio can satisfy the requirements of Subchapter M of the Internal Revenue Code of 1986, as amended.
Treasury Money Market Master Portfolio files U.S. federal and various state and local tax returns. No income tax returns are currently under examination. The statute of limitations on the Master Portfolio’s U.S. federal tax returns generally remains open for a period of three fiscal years after they are filed. The statutes of limitations on the Master Portfolio’s state and local tax returns may remain open for an additional year depending upon the jurisdiction.
| | |
| 38 | | 2 0 2 1 BLACK ROCK ANNUAL REPORT TO SHAREHOLDERS |
| | |
| Notes to Financial Statements (continued) | | |
Management has analyzed tax laws and regulations and their application to the Treasury Money Market Master Portfolio as of December 31, 2021, inclusive of the open tax return years, and does not believe that there are any uncertain tax positions that require recognition of a tax liability in the Master Portfolio’s financial statements.
Money Market Master Portfolio is disregarded as an entity separate from its owner for tax purposes. As such, the owner of the Master Portfolio is treated as the owner of the net assets, income, expenses and realized and unrealized gains and losses of the Master Portfolio. Therefore, no U.S. federal income tax provision is required. It is intended that the Master Portfolio’s assets will be managed so the owner of the Master Portfolio can satisfy the requirements of Subchapter M of the Internal Revenue Code of 1986, as amended.
In the normal course of business, the Master Portfolios invest in securities or other instruments and may enter into certain transactions, and such activities subject each Master Portfolio to various risks, including among others, fluctuations in the market (market risk) or failure of an issuer to meet all of its obligations. The value of securities or other instruments may also be affected by various factors, including, without limitation: (i) the general economy; (ii) the overall market as well as local, regional or global political and/or social instability; (iii) regulation, taxation or international tax treaties between various countries; or (iv) currency, interest rate and price fluctuations. Local, regional or global events such as war, acts of terrorism, the spread of infectious illness or other public health issues, recessions, or other events could have a significant impact on the Master Portfolios and their investments. Each Master Portfolio’s prospectus provides details of the risks to which each Master Portfolio is subject.
Certain obligations held by the Money Market Master Portfolio have a credit enhancement or liquidity feature that may, under certain circumstances, provide for repayment of principal and interest on the obligation when due. These enhancements, which may include letters of credit, stand-by bond purchase agreements and/or third-party insurance, are issued by financial institutions. The value of the obligations may be affected by changes in creditworthiness of the entities that provide the credit enhancements or liquidity features. The Money Market Master Portfolio monitors its exposure by reviewing the creditworthiness of the issuers, as well as the financial institutions issuing the credit enhancements and by limiting the amount of holdings with credit enhancements from one financial institution.
Certain affiliates indirectly invest in the Master Portfolios through the SL Agency Shares of BlackRock Cash Funds. As of period end, these affiliated investors represent a significant portion of the net assets of Money Market Master Portfolio and Treasury Money Market Master Portfolio.
Market Risk: Each Master Portfolio may be exposed to prepayment risk, which is the risk that borrowers may exercise their option to prepay principal earlier than scheduled during periods of declining interest rates, which would force each Master Portfolio to reinvest in lower yielding securities. Each Master Portfolio may also be exposed to reinvestment risk, which is the risk that income from each Master Portfolio’s portfolio will decline if each Master Portfolio invests the proceeds from matured, traded or called fixed-income securities at market interest rates that are below each Master Portfolio portfolio’s current earnings rate.
Municipal securities are subject to the risk that litigation, legislation or other political events, local business or economic conditions, credit rating downgrades, or the bankruptcy of the issuer could have a significant effect on an issuer’s ability to make payments of principal and/or interest or otherwise affect the value of such securities. Municipal securities can be significantly affected by political or economic changes, including changes made in the law after issuance of the securities, as well as uncertainties in the municipal market related to, taxation, legislative changes or the rights of municipal security holders, including in connection with an issuer insolvency. Municipal securities backed by current or anticipated revenues from a specific project or specific assets can be negatively affected by the discontinuance of the tax benefits supporting the project or assets or the inability to collect revenues for the project or from the assets. Municipal securities may be less liquid than taxable bonds, and there may be less publicly available information on the financial condition of municipal security issuers than for issuers of other securities.
An outbreak of respiratory disease caused by a novel coronavirus has developed into a global pandemic and has resulted in closing borders, quarantines, disruptions to supply chains and customer activity, as well as general concern and uncertainty. The impact of this pandemic, and other global health crises that may arise in the future, could affect the economies of many nations, individual companies and the market in general in ways that cannot necessarily be foreseen at the present time. This pandemic may result in substantial market volatility and may adversely impact the prices and liquidity of a fund’s investments. The duration of this pandemic and its effects cannot be determined with certainty.
Valuation Risk: The price the Money Market Master Portfolio could receive upon the sale of any particular portfolio investment may differ from the Money Market Master Portfolio’s valuation of the investment, particularly for securities that trade in thin or volatile markets or that are valued using a fair valuation technique or a price provided by an independent pricing service. Changes to significant unobservable inputs and assumptions (i.e., publicly traded company multiples, growth rate, time to exit) due to the lack of observable inputs may significantly impact the resulting fair value and therefore the Money Market Master Portfolio’s results of operations. As a result, the price received upon the sale of an investment may be less than the value ascribed by the Money Market Master Portfolio, and the Money Market Master Portfolio could realize a greater than expected loss or lesser than expected gain upon the sale of the investment. The Money Market Master Portfolio’s ability to value its investments may also be impacted by technological issues and/or errors by pricing services or other third-party service providers.
Counterparty Credit Risk: The Master Portfolios may be exposed to counterparty credit risk, or the risk that an entity may fail to or be unable to perform on its commitments related to unsettled or open transactions, including making timely interest and/or principal payments or otherwise honoring its obligations. The Master Portfolios manage counterparty credit risk by entering into transactions only with counterparties that the Manager believes have the financial resources to honor their obligations and by monitoring the financial stability of those counterparties. Financial assets, which potentially expose the Master Portfolios to market, issuer and counterparty credit risks, consist principally of financial instruments and receivables due from counterparties. The extent of the Master Portfolios’ exposure to market, issuer and counterparty credit risks with respect to these financial assets is approximately their value recorded in the Statements of Assets and Liabilities, less any collateral held by the Master Portfolios.
Concentration Risk: A diversified portfolio, where this is appropriate and consistent with a fund’s objectives, minimizes the risk that a price change of a particular investment will have a material impact on the NAV of a fund. The investment concentrations within each Master Portfolio’s portfolio are disclosed in its Schedule of Investments.
| | |
MASTER PORTFOLIO NOTES TO FINANCIAL STATEMENTS | | 39 |
| | |
| Notes to Financial Statements (continued) | | |
Certain Master Portfolios invest a significant portion of their assets in fixed-income securities and/or use derivatives tied to the fixed-income markets. Changes in market interest rates or economic conditions may affect the value and/or liquidity of such investments. Interest rate risk is the risk that prices of bonds and other fixed-income securities will increase as interest rates fall and decrease as interest rates rise. The Master Portfolios may be subject to a greater risk of rising interest rates due to the current period of historically low rates.
LIBOR Transition Risk: The United Kingdom’s Financial Conduct Authority announced a phase out of the London Interbank Offered Rate (“LIBOR”). Although many LIBOR rates will cease to be published or no longer will be representative of the underlying market they seek to measure after December 31, 2021, a selection of widely used USD LIBOR rates will continue to be published through June 2023 in order to assist with the transition. The Master Portfolios may be exposed to financial instruments tied to LIBOR to determine payment obligations, financing terms, hedging strategies or investment value. The transition process away from LIBOR might lead to increased volatility and illiquidity in markets for, and reduce the effectiveness of new hedges placed against instruments whose terms currently include LIBOR. The ultimate effect of the LIBOR transition process on the Master Portfolios is uncertain.
Management has evaluated the impact of all subsequent events on the Master Portfolios through the date the financial statements were issued and has determined that there were no subsequent events requiring adjustment or additional disclosure in the financial statements.
| | |
| 40 | | 2 0 2 1 BLACK ROCK ANNUAL REPORT TO SHAREHOLDERS |
Report of Independent Registered Public Accounting Firm
To the Board of Trustees of Master Investment Portfolio and Investors of Money Market Master Portfolio and Treasury Money Market Master Portfolio
Opinions on the Financial Statements
We have audited the accompanying statements of assets and liabilities, including the schedules of investments, of Money Market Master Portfolio and Treasury Money Market Master Portfolio (two of the series constituting Master Investment Portfolio, hereafter collectively referred to as the “Master Portfolios”) as of December 31, 2021, the related statements of operations for the year ended December 31, 2021, the statements of changes in net assets for each of the two years in the period ended December 31, 2021, including the related notes, and the financial highlights for each of the five years in the period ended December 31, 2021 (collectively referred to as the “financial statements”). In our opinion, the financial statements present fairly, in all material respects, the financial position of each of the Master Portfolios as of December 31, 2021, the results of each of their operations for the year then ended, the changes in each of their net assets for each of the two years in the period ended December 31, 2021 and each of the financial highlights for each of the five years in the period ended December 31, 2021 in conformity with accounting principles generally accepted in the United States of America.
Basis for Opinions
These financial statements are the responsibility of the Master Portfolios’ management. Our responsibility is to express an opinion on the Master Portfolios’ financial statements based on our audits. We are a public accounting firm registered with the Public Company Accounting Oversight Board (United States) (PCAOB) and are required to be independent with respect to the Master Portfolios in accordance with the U.S. federal securities laws and the applicable rules and regulations of the Securities and Exchange Commission and the PCAOB.
We conducted our audits of these financial statements in accordance with the standards of the PCAOB. Those standards require that we plan and perform the audit to obtain reasonable assurance about whether the financial statements are free of material misstatement, whether due to error or fraud.
Our audits included performing procedures to assess the risks of material misstatement of the financial statements, whether due to error or fraud, and performing procedures that respond to those risks. Such procedures included examining, on a test basis, evidence regarding the amounts and disclosures in the financial statements. Our audits also included evaluating the accounting principles used and significant estimates made by management, as well as evaluating the overall presentation of the financial statements. Our procedures included confirmation of securities owned as of December 31, 2021 by correspondence with the custodian and brokers; when replies were not received from brokers, we performed other auditing procedures. We believe that our audits provide a reasonable basis for our opinions.
/s/PricewaterhouseCoopers LLP
Philadelphia, Pennsylvania
February 15, 2022
We have served as the auditor of one or more BlackRock investment companies since 2000.
| | |
M A S T E R P O R T F O L I O R E P O R T O F I N D E P E N D E N T R E G I S T E R E D P U B L I C A C C O U N T I N G F I R M | | 41 |
Trustee and Officer Information
| | | | | | | | |
| Independent Trustees(a) |
| | | | | |
Name Year of Birth(b) | | Position(s) Held (Length of Service)(c) | | Principal Occupation(s) During Past Five Years | | Number of BlackRock-Advised Registered Investment Companies (“RICs”) Consisting of Investment Portfolios (“Portfolios”) Overseen | | Public Company
and Other
Investment
Company
Directorships Held
During Past Five Years |
| | | | |
Mark Stalnecker 1951 | | Chair of the Board (Since 2019) and Trustee (Since 2015) | | Chief Investment Officer, University of Delaware from 1999 to 2013; Trustee and Chair of the Finance and Investment Committees, Winterthur Museum and Country Estate from 2005 to 2016; Member of the Investment Committee, Delaware Public Employees’ Retirement System since 2002; Member of the Investment Committee, Christiana Care Health System from 2009 to 2017; Member of the Investment Committee, Delaware Community Foundation from 2013 to 2014; Director and Chair of the Audit Committee, SEI Private Trust Co. from 2001 to 2014. | | 30 RICs consisting of 159 Portfolios | | None |
| | | | |
Bruce R. Bond 1946 | | Trustee (Since 2019) | | Board Member, Amsphere Limited (software) since 2018; Trustee and Member of the Governance Committee, State Street Research Mutual Funds from 1997 to 2005; Board Member of Governance, Audit and Finance Committee, Avaya Inc. (computer equipment) from 2003 to 2007. | | 30 RICs consisting of 159 Portfolios | | None |
| | | | |
Susan J. Carter 1956 | | Trustee (Since 2016) | | Director, Pacific Pension Institute from 2014 to 2018; Advisory Board Member, Center for Private Equity and Entrepreneurship at Tuck School of Business since 1997; Senior Advisor, Commonfund Capital, Inc. (“CCI”) (investment adviser) in 2015; Chief Executive Officer, CCI from 2013 to 2014; President & Chief Executive Officer, CCI from 1997 to 2013; Advisory Board Member, Girls Who Invest from 2015 to 2018 and Board Member thereof since 2018; Advisory Board Member, Bridges Fund Management since 2016; Trustee, Financial Accounting Foundation since 2017; Practitioner Advisory Board Member, Private Capital Research Institute (“PCRI”) since 2017; Lecturer in the Practice of Management, Yale School of Management since 2019; Advisor to Finance Committee, Altman Foundation since 2020. | | 30 RICs consisting of 159 Portfolios | | None |
| | | | |
Collette Chilton 1958 | | Trustee (Since 2015) | | Chief Investment Officer, Williams College since 2006; Chief Investment Officer, Lucent Asset Management Corporation from 1998 to 2006; Director, Boys and Girls Club of Boston since 2017; Director, B1 Capital since 2018; Director, David and Lucile Packard Foundation since 2020. | | 30 RICs consisting of 159 Portfolios | | None |
| | | | |
Neil A. Cotty 1954 | | Trustee (Since 2016) | | Bank of America Corporation from 1996 to 2015, serving in various senior finance leadership roles, including Chief Accounting Officer from 2009 to 2015, Chief Financial Officer of Global Banking, Markets and Wealth Management from 2008 to 2009, Chief Accounting Officer from 2004 to 2008, Chief Financial Officer of Consumer Bank from 2003 to 2004, Chief Financial Officer of Global Corporate Investment Bank from 1999 to 2002. | | 30 RICs consisting of 159 Portfolios | | None |
| | | | |
Lena G. Goldberg 1949 | | Trustee (Since 2019) | | Director, Charles Stark Draper Laboratory, Inc. since 2013; Senior Lecturer, Harvard Business School, from 2008 to 2021; FMR LLC/Fidelity Investments (financial services) from 1996 to 2008, serving in various senior roles including Executive Vice President - Strategic Corporate Initiatives and Executive Vice President and General Counsel; Partner, Sullivan & Worcester LLP from 1985 to 1996 and Associate thereof from 1979 to 1985. | | 30 RICs consisting of 159 Portfolios | | None |
| | |
| 42 | | 2 0 2 1 BLACK ROCK ANNUAL REPORT TO SHAREHOLDERS |
Trustee and Officer Information (continued)
| | | | | | | | |
| Independent Trustees(a) (continued) |
| | | | | |
Name Year of Birth(b) | | Position(s) Held (Length of Service)(c) | | Principal Occupation(s) During Past Five Years | | Number of BlackRock-Advised Registered Investment Companies (“RICs”) Consisting of Investment Portfolios (“Portfolios”) Overseen | | Public Company
and Other
Investment
Company
Directorships Held
During Past Five Years |
| | | | |
Henry R. Keizer 1956 | | Trustee
(Since 2019) | | Director, Park Indemnity Ltd. (captive insurer) since 2010; Director, MUFG Americas Holdings Corporation and MUFG Union Bank, N.A. (financial and bank holding company) from 2014 to 2016; Director, American Institute of Certified Public Accountants from 2009 to 2011; Director, KPMG LLP (audit, tax and advisory services) from 2004 to 2005 and 2010 to 2012; Director, KPMG International in 2012, Deputy Chairman and Chief Operating Officer thereof from 2010 to 2012 and U.S. Vice Chairman of Audit thereof from 2005 to 2010; Global Head of Audit, KPMGI (consortium of KPMG firms) from 2006 to 2010; Director, YMCA of Greater New York from 2006 to 2010. | | 30 RICs consisting of 159 Portfolios | | Hertz Global Holdings (car rental); Sealed Air Corp. (packaging); GrafTech International Ltd. (materials manufacturing); Montpelier Re Holdings, Ltd. (publicly held property and casualty reinsurance) from 2013 to 2015; WABCO (commercial vehicle safety systems) from 2015 to 2020. |
| | | | |
Cynthia A. Montgomery 1952 | | Trustee
(Since 2009) | | Professor, Harvard Business School since 1989. | | 30 RICs consisting of 159 Portfolios | | Newell Rubbermaid, Inc. (manufacturing) from 1995 to 2016. |
| | | | |
Donald C. Opatrny 1952 | | Trustee
(Since 2019) | | Trustee, Vice Chair, Member of the Executive Committee and Chair of the Investment Committee, Cornell University from 2004 to 2019; President, Trustee and Member of the Investment Committee, The Aldrich Contemporary Art Museum from 2007 to 2014; Member of the Board and Investment Committee, University School from 2007 to 2018; Member of the Investment Committee, Mellon Foundation from 2009 to 2015; Trustee, Artstor (a Mellon Foundation affiliate) from 2010 to 2015; President and Trustee, the Center for the Arts, Jackson Hole from 2011 to 2018; Director, Athena Capital Advisors LLC (investment management firm) since 2013; Trustee and Chair of the Investment Committee, Community Foundation of Jackson Hole since 2014; Member of Affordable Housing Supply Board of Jackson, Wyoming since 2017; Member, Investment Funds Committee, State of Wyoming since 2017; Trustee, Phoenix Art Museum since 2018; Trustee, Arizona Community Foundation and Member of Investment Committee since 2020. | | 30 RICs consisting of 159 Portfolios | | None |
| | | | |
Joseph P. Platt 1947 | | Trustee
(Since 2009) | | General Partner, Thorn Partners, LP (private investments) since 1998; Director, WQED Multi-Media (public broadcasting not-for-profit) since 2001; Chair, Basic Health International (non-profit) since 2015. | | 30 RICs consisting of 159 Portfolios | | Greenlight Capital Re, Ltd. (reinsurance company); Consol Energy Inc. |
| | |
TRUSTEE AND OFFICER INFORMATION | | 43 |
Trustee and Officer Information (continued)
| | | | | | | | |
| Independent Trustees(a) (continued) |
| | | | | |
Name Year of Birth(b) | | Position(s) Held (Length of Service)(c) | | Principal Occupation(s) During Past Five Years | | Number of BlackRock-Advised Registered Investment Companies (“RICs”) Consisting of Investment Portfolios (“Portfolios”) Overseen | | Public Company
and Other
Investment
Company
Directorships Held
During Past Five Years |
| | | | |
Kenneth L. Urish 1951 | | Trustee (Since 2009) | | Managing Partner, Urish Popeck & Co., LLC (certified public accountants and consultants) since 1976; Past- Chairman of the Professional Ethics Committee of the Pennsylvania Institute of Certified Public Accountants and Committee Member thereof since 2007; Member of External Advisory Board, The Pennsylvania State University Accounting Department since founding in 2001; Principal, UP Strategic Wealth Investment Advisors, LLC since 2013; Trustee, The Holy Family Institute from 2001 to 2010; President and Trustee, Pittsburgh Catholic Publishing Associates from 2003 to 2008; Director, Inter- Tel from 2006 to 2007; Member, Advisory Board, ESG Competent Boards since 2020. | | 30 RICs consisting of 159 Portfolios | | None |
| | | | |
Claire A. Walton 1957 | | Trustee (Since 2016) | | Chief Operating Officer and Chief Financial Officer of Liberty Square Asset Management, LP from 1998 to 2015; General Partner of Neon Liberty Capital Management, LLC since 2003; Director, Boston Hedge Fund Group from 2009 to 2018; Director, Woodstock Ski Runners since 2013; Director, Massachusetts Council on Economic Education from 2013 to 2015. | | 30 RICs consisting of 159 Portfolios | | None |
|
| Interested Trustees(a)(d) |
| | | | | |
Name Year of Birth(b) | | Position(s) Held (Length of Service)(c) | | Principal Occupation(s) During Past Five Years | | Number of BlackRock-Advised Registered Investment Companies
(“RICs”) Consisting of Investment Portfolios (“Portfolios”) Overseen | | Public Company
and Other
Investment
Company
Directorships Held During Past Five Years |
| | | | |
Robert Fairbairn 1965 | | Trustee (Since 2018) | | Vice Chairman of BlackRock, Inc. since 2019; Member of BlackRock’s Global Executive and Global Operating Committees; Co-Chair of BlackRock’s Human Capital Committee; Senior Managing Director of BlackRock, Inc. from 2010 to 2019; oversaw BlackRock’s Strategic Partner Program and Strategic Product Management Group from 2012 to 2019; Member of the Board of Managers of BlackRock Investments, LLC from 2011 to 2018; Global Head of BlackRock’s Retail and iShares® businesses from 2012 to 2016. | | 103 RICs consisting of 261 Portfolios | | None |
| | | | |
John M. Perlowski(e) 1964 | | Trustee (Since 2015) President and Chief Executive Officer (Since 2010) | | Managing Director of BlackRock, Inc. since 2009; Head of BlackRock Global Accounting and Product Services since 2009; Advisory Director of Family Resource Network (charitable foundation) since 2009. | | 105 RICs consisting of 263 Portfolios | | None |
| (a) | The address of each Trustee is c/o BlackRock, Inc., 55 East 52nd Street, New York, New York 10055. |
| (b) | Independent Trustees serve until their resignation, retirement, removal or death, or until December 31 of the year in which they turn 75. The Board may determine to extend the terms of Independent Trustees on a case-by-case basis, as appropriate. |
| (c) | In connection with the acquisition of Barclays Global Investors by BlackRock, Inc. in December 2009, certain Independent Trustees were elected to the Board. Furthermore, effective January 1, 2019, three BlackRock Fund Complexes were realigned and consolidated into two BlackRock Fund Complexes. As a result, although the chart shows the year that each Independent Trustee joined the Board, certain Independent Trustees first became members of the boards of other BlackRock-advised Funds or legacy BlackRock funds as follows: Bruce R. Bond, 2005; Cynthia A. Montgomery, 1994; Joseph P. Platt, 1999; Kenneth L. Urish, 1999; Lena G. Goldberg, 2016; Henry R. Keizer, 2016; Donald C. Opatrny, 2015. |
| (d) | Mr. Fairbairn and Mr. Perlowski are both “interested persons,” as defined in the 1940 Act, of the Trust/MIP based on their positions with BlackRock, Inc. and its affiliates. Mr. Fairbairn and Mr. Perlowski are also board members of the BlackRock Fixed-Income Complex. |
| (e) | Mr. Perlowski is also a trustee of the BlackRock Credit Strategies Fund and BlackRock Private Investments Fund. |
| | |
| 44 | | 2 0 2 1 BLACK ROCK ANNUAL REPORT TO SHAREHOLDERS |
Trustee and Officer Information (continued)
| | | | |
| Officers Who Are Not Trustees(a) |
| | | |
Name Year of Birth(b) | | Position(s) Held (Length of Service) | | Principal Occupation(s) During Past Five Years |
| | |
Thomas Callahan 1968 | | Vice President (Since 2016) | | Managing Director of BlackRock, Inc. since 2013; Member of the Board of Managers of BlackRock Investments, LLC (principal underwriter) since 2019 and Managing Director thereof since 2017; Head of BlackRock’s Global Cash Management Business since 2016; Co-Head of the Global Cash Management Business from 2014 to 2016; Deputy Head of the Global Cash Management Business from 2013 to 2014; Member of the Cash Management Group Executive Committee since 2013; Chief Executive Officer of NYSE Liffe U.S. from 2008 to 2013. |
| | |
Jennifer McGovern 1977 | | Vice President (Since 2014) | | Managing Director of BlackRock, Inc. since 2016; Director of BlackRock, Inc. from 2011 to 2015; Head of Americas Product Development and Governance for BlackRock’s Global Product Group since 2019; Head of Product Structure and Oversight for BlackRock’s U.S. Wealth Advisory Group from 2013 to 2019. |
| | |
Trent Walker 1974 | | Chief Financial Officer (Since 2021) | | Managing Director of BlackRock, Inc. since September 2019; Executive Vice President of PIMCO from 2016 to 2019; Senior Vice President of PIMCO from 2008 to 2015; Treasurer from 2013 to 2019 and Assistant Treasurer from 2007 to 2017 of PIMCO Funds, PIMCO Variable Insurance Trust, PIMCO ETF Trust, PIMCO Equity Series, PIMCO Equity Series VIT, PIMCO Managed Accounts Trust, 2 PIMCO-sponsored interval funds and 21 PIMCO-sponsored closed-end funds. |
| | |
Jay M. Fife 1970 | | Treasurer (Since 2009) | | Managing Director of BlackRock, Inc. since 2007. |
| | |
Charles Park 1967 | | Chief Compliance Officer (Since 2014) | | Anti-Money Laundering Compliance Officer for certain BlackRock-advised Funds from 2014 to 2015; Chief Compliance Officer of BlackRock Advisors, LLC and the BlackRock-advised Funds in the BlackRock Multi-Asset Complex and the BlackRock Fixed-Income Complex since 2014; Principal of and Chief Compliance Officer for iShares® Delaware Trust Sponsor LLC since 2012 and BlackRock Fund Advisors (“BFA”) since 2006; Chief Compliance Officer for the BFA-advised iShares® exchange traded funds since 2006; Chief Compliance Officer for BlackRock Asset Management International Inc. since 2012. |
| | |
Lisa Belle 1968 | | Anti-Money Laundering Compliance Officer (Since 2019) | | Managing Director of BlackRock, Inc. since 2019; Global Financial Crime Head for Asset and Wealth Management of JP Morgan from 2013 to 2019; Managing Director of RBS Securities from 2012 to 2013; Head of Financial Crimes for Barclays Wealth Americas from 2010 to 2012. |
| | |
Janey Ahn 1975 | | Secretary (Since 2019) | | Managing Director of BlackRock, Inc. since 2018; Director of BlackRock, Inc. from 2009 to 2017. |
| (a) | The address of each Officer is c/o BlackRock, Inc., 55 East 52nd Street, New York, New York 10055. |
| (b) | Officers of the Trust/MIP serve at the pleasure of the Board. |
Further information about the Trust’s/MIP’s Trustees and Officers is available in the Trust’s/MIP’s Statement of Additional Information, which can be obtained without charge by calling (800) 441-7762.
Effective December 31, 2021, Bruce R. Bond retired as a Trustee of the Trust/MIP.
| | |
TRUSTEE AND OFFICER INFORMATION | | 45 |
Additional Information
Householding
The Funds will mail only one copy of shareholder documents, including prospectuses, annual and semi-annual reports, Rule 30e-3 notices and proxy statements, to shareholders with multiple accounts at the same address. This practice is commonly called “householding” and is intended to reduce expenses and eliminate duplicate mailings of shareholder documents. Mailings of your shareholder documents may be householded indefinitely unless you instruct us otherwise. If you do not want the mailing of these documents to be combined with those for other members of your household, please call the Transfer Agent at (888) 204-3956.
Availability of Quarterly Schedule of Investments
The Funds/Master Portfolios file their complete schedules of portfolio holdings with the SEC each month on Form N-MFP. The Funds’/Master Portfolios’ reports on Form N-MFP are available on the SEC’s website at sec.gov. Additionally, each Fund/Master Portfolio makes portfolio holdings available to shareholders/interest holders on its website at blackrock.com.
Availability of Proxy Voting Policies, Procedures and Voting Records
A description of the policies and procedures that the Funds/Master Portfolios use to determine how to vote proxies relating to portfolio securities and information about how the Funds/Master Portfolios voted proxies relating to securities held in the Funds’/Master Portfolios’ portfolios during the most recent 12-month period ended June 30 is available without charge, upon request (1) by calling (800) 626-1960; (2) on the BlackRock website at blackrock.com; and (3) on the SEC’s website at sec.gov.
BlackRock Privacy Principles
BlackRock is committed to maintaining the privacy of its current and former fund investors and individual clients (collectively, “Clients”) and to safeguarding their non-public personal information. The following information is provided to help you understand what personal information BlackRock collects, how we protect that information and why in certain cases we share such information with select parties.
If you are located in a jurisdiction where specific laws, rules or regulations require BlackRock to provide you with additional or different privacy-related rights beyond what is set forth below, then BlackRock will comply with those specific laws, rules or regulations.
BlackRock obtains or verifies personal non-public information from and about you from different sources, including the following: (i) information we receive from you or, if applicable, your financial intermediary, on applications, forms or other documents; (ii) information about your transactions with us, our affiliates, or others; (iii) information we receive from a consumer reporting agency; and (iv) from visits to our websites.
BlackRock does not sell or disclose to non-affiliated third parties any non-public personal information about its Clients, except as permitted by law or as is necessary to respond to regulatory requests or to service Client accounts. These non-affiliated third parties are required to protect the confidentiality and security of this information and to use it only for its intended purpose.
We may share information with our affiliates to service your account or to provide you with information about other BlackRock products or services that may be of interest to you. In addition, BlackRock restricts access to non-public personal information about its Clients to those BlackRock employees with a legitimate business need for the information. BlackRock maintains physical, electronic and procedural safeguards that are designed to protect the non-public personal information of its Clients, including procedures relating to the proper storage and disposal of such information.
| | |
| 46 | | 2 0 2 1 BLACK ROCK ANNUAL REPORT TO SHAREHOLDERS |
Additional Information (continued)
Fund and /or MIP Service Providers
| | |
| Investment Adviser | | Distributor |
| BlackRock Fund Advisors | | BlackRock Investments, LLC |
| San Francisco, CA 94105 | | New York, NY 10022 |
| |
| Administrator | | Independent Registered Public Accounting Firm |
| BlackRock Advisors, LLC | | PricewaterhouseCoopers LLP |
| Wilmington, DE 19809 | | Philadelphia, PA 19103 |
| |
| Sub-Adviser | | Legal Counsel |
| BlackRock International Limited(a) | | Sidley Austin LLP |
Edinburgh, EH3 8BL United Kingdom | | New York, NY 10019 |
| |
| Accounting Agent and Custodian | | Address of the Trust/MIP |
| State Street Bank and Trust Company | | 400 Howard Street |
| Boston, MA 02111 | | San Francisco, CA 94105 |
| |
| Transfer Agent | | |
| State Street Bank and Trust Company | | |
| North Quincy, MA 02171 | | |
| |
| (a)For Money Market Master Portfolio. | | |
| | |
ADDITIONAL INFORMATION | | 47 |
Glossary of Terms Used in this Report
| | |
| Portfolio Abbreviation |
| |
| AGM-CR | | AGM Insured Custodial Receipt |
| |
| CR | | Custodian Receipt |
| |
| LIBOR | | London Interbank Offered Rate |
| |
| M/F | | Multi-Family |
| |
| RB | | Revenue Bond |
| |
| SOFR | | Secured Overnight Financing Rate |
| |
| VRDN | | Variable Rate Demand Note |
Important Fund Information
The following applies to BlackRock Cash Funds: Institutional and its corresponding Master Portfolio: This report is intended for current holders. It is not authorized for use as an offer of sale or a solicitation of an offer to buy shares of the Fund unless preceded or accompanied by the Fund’s current prospectus. You could lose money by investing in the Fund. Because the share price of the Fund will fluctuate, when you sell your shares they may be worth more or less than what you originally paid for them. The Fund may impose a fee upon sale of your shares or may temporarily suspend your ability to sell shares if the Fund’s liquidity falls below required minimums because of market conditions or other factors. An investment in the Fund is not insured or guaranteed by the Federal Deposit Insurance Corporation or any other government agency. The Fund’s sponsor has no legal obligation to provide financial support to the Fund at any time. Performance data quoted represents past performance and does not guarantee future results. Total return information assumes reinvestment of all distributions. Current performance may be higher or lower than the performance data quoted. For current month-end performance information, call (800) 626-1960. The Fund’s current 7-day yield more closely reflects the current earnings of the Fund than the total returns quoted. Statements and other information herein are as dated and are subject to change.
The following applies to BlackRock Cash Funds: Treasury and its corresponding Master Portfolio: This report is intended for current holders. It is not authorized for use as an offer of sale or a solicitation of an offer to buy shares of the Fund unless preceded or accompanied by the Fund’s current prospectus. You could lose money by investing in the Fund. Although the Fund seeks to preserve the value of your investment at $1.00 per share, it cannot guarantee it will do so. An investment in the Fund is not insured or guaranteed by the Federal Deposit Insurance Corporation or any other government agency. The Fund’s sponsor has no legal obligation to provide financial support to the Fund at any time. Performance data quoted represents past performance and does not guarantee future results. Total return information assumes reinvestment of all distributions. Current performance may be higher or lower than the performance data quoted. For current month-end performance information, call (800) 626-1960. The Fund’s current 7-day yield more closely reflects the current earnings of the Fund than the total returns quoted. Statements and other information herein are as dated and are subject to change.
| | |
| 48 | | 2 0 2 1 BLACK ROCK ANNUAL REPORT TO SHAREHOLDERS |
Want to know more?
blackrock.com | 888-204-3956
MMF3-12/21-AR
| | |

| | DECEMBER 31, 2021 |
BlackRock Funds III
· BlackRock LifePath® Dynamic Retirement Fund
· BlackRock LifePath® Dynamic 2025 Fund
· BlackRock LifePath® Dynamic 2030 Fund
· BlackRock LifePath® Dynamic 2035 Fund
· BlackRock LifePath® Dynamic 2040 Fund
· BlackRock LifePath® Dynamic 2045 Fund
· BlackRock LifePath® Dynamic 2050 Fund
· BlackRock LifePath® Dynamic 2055 Fund
· BlackRock LifePath® Dynamic 2060 Fund
· BlackRock LifePath® Dynamic 2065 Fund
|
Not FDIC Insured • May Lose Value • No Bank Guarantee |
The Markets in Review
Dear Shareholder,
The 12-month reporting period as of December 31, 2021 saw a continuation of the resurgent growth that followed the initial coronavirus (or “COVID-19”) pandemic reopening, albeit at a slower pace. The global economy weathered the emergence of several variant strains and the resulting peaks and troughs in infections amid optimism that increasing vaccinations and economic adaptation could help contain the pandemic’s disruptions. Continued growth meant that the U.S. economy regained and then surpassed its pre-pandemic output. However, a rapid rebound in consumer spending pushed up against supply constraints and led to elevated inflation.
Equity prices rose with the broader economy, as the implementation of mass vaccination campaigns and passage of an additional fiscal stimulus package and infrastructure bill further boosted stocks. In the United States, both large- and small-capitalization stocks posted a strong advance, and many equity indices neared or surpassed all-time highs late in the reporting period. International equities from developed markets also gained, although emerging market stocks declined, pressured by a strengthening U.S. dollar.
The 10-year U.S. Treasury yield (which is inversely related to bond prices) rose during the reporting period as the economy expanded rapidly and inflation reached its highest annualized reading in decades. In the corporate bond market, support from the U.S. Federal Reserve (the “Fed”) assuaged credit concerns and led to solid returns for high-yield corporate bonds, outpacing investment-grade corporate bonds, which declined.
The Fed maintained accommodative monetary policy during the reporting period by maintaining near-zero interest rates and by asserting that inflation could exceed its 2% target for a sustained period without triggering a rate increase. However, the Fed’s tone shifted late in the year, as it reduced its bond-buying program and used its market guidance to raise the prospect of higher rates in 2022.
Looking ahead, we believe that the global expansion will continue to broaden as Europe and other developed market economies gain momentum, although the Delta and Omicron variants of the coronavirus remain a threat, particularly in emerging markets. While we expect inflation to abate somewhat as supply bottlenecks are resolved, we anticipate that inflation will remain higher than the pre-COVID norm. The Fed is poised to raise interest rates next year in response, but the Fed’s policy shift means that tightening is likely to be less aggressive than what we’ve seen in previous cycles.
In this environment, we favor an overweight to equities, as we believe low interest rates and continued economic growth will support further gains, albeit likely more modest than what we saw in 2021. Sectors that are better poised to manage the transition to a lower-carbon world, such as technology and health care, are particularly attractive in the long term. U.S. and other developed-market equities have room for further growth, while we believe Chinese equities stand to gain from a more accommodative monetary and fiscal environment as the Chinese economy slows. We are underweight long-term credit, but inflation-protected U.S. Treasuries, Asian fixed income, and emerging market local-currency bonds offer potential opportunities. We believe that international diversification and a focus on sustainability can help provide portfolio resilience, and the disruption created by the coronavirus appears to be accelerating the shift toward sustainable investments.
In this environment, our view is that investors need to think globally, extend their scope across a broad array of asset classes, and be nimble as market conditions change. We encourage you to talk with your financial advisor and visit blackrock.com for further insight about investing in today’s markets.
Sincerely,

Rob Kapito
President, BlackRock Advisors, LLC

Rob Kapito
President, BlackRock Advisors, LLC
| | | | |
| Total Returns as of December 31, 2021 |
| | | |
| | | 6-Month | | 12-Month |
| | |
U.S. large cap equities (S&P 500® Index) | | 11.67% | | 28.71% |
| | |
U.S. small cap equities (Russell 2000® Index) | | (2.31) | | 14.82 |
| | |
International equities (MSCI Europe, Australasia, Far East Index) | | 2.24 | | 11.26 |
| | |
Emerging market equities (MSCI Emerging Markets Index) | | (9.30) | | (2.54) |
| | |
3-month Treasury bills (ICE BofA 3-Month U.S. Treasury Bill Index) | | 0.02 | | 0.05 |
| | |
U.S. Treasury securities (ICE BofA 10-Year U.S. Treasury Index) | | 0.44 | | (3.68) |
| | |
U.S. investment grade bonds (Bloomberg U.S. Aggregate Bond Index) | | 0.06 | | (1.54) |
| | |
Tax-exempt municipal bonds (S&P Municipal Bond Index) | | 0.52 | | 1.77 |
| | |
U.S. high yield bonds (Bloomberg U.S. Corporate High Yield 2% Issuer Capped Index) | | 1.59 | | 5.26 |
|
| Past performance is not an indication of future results. Index performance is shown for illustrative purposes only. You cannot invest directly in an index. |
| | |
| 2 | | THIS PAGE IS NOT PART OF YOUR FUND REPORT |
Table of Contents

| | |
| Fund Summary as of December 31, 2021 | | BlackRock LifePath® Dynamic Funds |
Portfolio Management Commentary
How did each Fund perform?
The BlackRock LifePath® Dynamic Retirement Fund along with the BlackRock LifePath® Dynamic Funds with target dates of 2025, 2030, 2035, 2040, 2045, 2050, 2055, 2060 and 2065 are referred to as the “LifePath Dynamic Funds.”
For the 12-month period ended December 31, 2021, for the LifePath Dynamic Funds across the Retirement Fund and vintage of 2025, each Fund’s Class K Shares performed in line with its respective benchmark, while all other of each Fund’s shares classes underperformed.
For the LifePath Dynamic Funds with vintages of 2030 and 2040, each Fund’s Class K Shares outperformed, and Institutional Shares performed in line with its respective benchmark, while all other shares classes of each Fund underperformed its respective custom benchmark.
For the LifePath Dynamic Funds with vintages of 2035 and 2045, each Fund’s Class K Shares outperformed its respective custom benchmark, while all other of each Fund’s share classes underperformed.
For the LifePath Dynamic Funds with vintages of 2050, 2055, 2060 and 2065, all of each Fund’s share classes underperformed its respective custom benchmark.
The returns for the LifePath Dynamic Funds include fund expenses. The custom benchmarks have no expenses associated with performance.
What factors influenced performance?
With regards to macro themes, positioning in equities was the largest contributor to returns for the period. An overall overweight to equities added significant value due to stocks’ strong performance in 2021. Within equities, overweights in Italy, Japan and Spain were key contributors.
Among the LifePath Dynamic Funds’ underlying actively managed strategies, the Diversified Equity Master Portfolio (a U.S.-focused equity strategy) and International Tilts Master Portfolio (an international developed markets equity strategy) were key contributors. Master Total Return Portfolio, a domestic fixed-income strategy, also contributed positively.
In terms of macro themes, currency positioning hurt performance. An overweight in the euro (paired against the U.S. dollar earlier in the period and against a developed market basket later in the year) was the most notable detractor. Positioning in fixed income further pressured returns in the aggregate, driven by a relative value underweight in U.S.10-year bonds versus other developed markets that was held early in the year.
With respect to underlying actively managed strategies, the BlackRock Advantage Emerging Markets Fund (an emerging markets equity strategy) was the most significant detractor. The Advantage CoreAlpha Master Bond Portfolio (a domestic fixed-income strategy) also weighed on returns.
During the period, the LifePath Dynamic Funds with vintages of 2050, 2055, 2060 and 2065 at times had elevated exposures to cash as collateral for their respective derivatives positions. These cash positions had no material impact to the performance of each of the LifePath Dynamic Funds with vintages of 2050, 2055, 2060 and 2065 for the period.
Describe recent portfolio activity.
The LifePath Dynamic Funds entered the period with an overweight in developed market equities, as well as an overweight in peripheral European stocks versus a basket of certain developed market peers. The LifePath Dynamic Funds were underweight in U.S. 10-year bond futures versus Australian, Canadian and German 10-year bond futures, and were underweight in the U.S. dollar against a basket of developed market currencies.
At the start of the year, the investment adviser expected that economic activity would accelerate as vaccination rates picked up and economies reopened. This view broadly played out during the first half of 2021, benefiting the overweight in stocks. The investment adviser reduced the extent of the overweight in March by removing an overweight in the Eurozone and trimming each portfolio’s allocations to the United Kingdom and Japan.
In April, the LifePath Dynamic Funds Fund moved to overweight positions in French and German equities versus the United States and Japan, driven by a positive view on Europe’s growth outlook. The LifePath Dynamic Funds increased the extent of its overweights in Spain and Italy, and added to the United Kingdom due to a similar pro-cyclical view. Given the rally in stocks, as well as the desire to reduce risk in advance of the June Federal Open Market Committee (“FOMC”) meeting, the investment adviser removed the French and German equity overweights late in the second quarter of 2021. However, the investment adviser retained the other positions as of the end of June 2021.
In fixed income, the LifePath Dynamic Funds entered 2021 with an underweight in U.S. 10-year bond futures versus Australian, Canadian and German 10-year bond futures. This stance reflected the investment adviser’s belief that U.S. fiscal stimulus was likely to outpace that of other developed-market nations. The investment adviser removed the position in Germany in early February on the view that the country’s yield curve would steepen and increased the portfolios’ overweights in Australian and Canadian 10-year bonds. The investment adviser closed this trade in April 2021, as a large amount of U.S. fiscal stimulus had been priced into the markets. In addition, the investment adviser saw the potential for the Bank of Canada to turn more hawkish.
The Fed’s tone changed at the June 2021 FOMC meeting. Believing this would pose a headwind to the LifePath Dynamic Funds’ underweight in the U.S. dollar, the investment adviser closed the underweight in the currency against the global basket. However, the LifePath Dynamic Funds maintained an underweight in the U.S. dollar versus the euro. The Fed’s more hawkish stance, together with more attractive prices brought about by a sizable flattening of the U.S. yield curve, also prompted the investment adviser to introduce an underweight in U.S. 30-year bond futures.
| | |
4 | | 2 0 2 1 BLACK ROCK ANNUAL REPORT TO SHAREHOLDERS |
| | |
| Fund Summary as of December 31, 2021 (continued) | | BlackRock LifePath® Dynamic Funds |
In August 2021, in anticipation of Fed policy normalization in reaction to strong inflation and growth data, the investment adviser added to the underweight in U.S. bond futures. At this time, the five-year segment of the curve was targeted in response to the scope for upward pressure on short-term U.S. rates. The investment adviser also adjusted the LifePath Dynamic Funds’ currency positioning given the potential tighter monetary policy to act as a tailwind for the U.S. dollar. While the investment adviser maintained its conviction in the euro overweight, it changed the underweight side of the trade from the U.S. dollar to a basket consisting of the Australian dollar, Canadian dollar and yen. The investment adviser closed the underweight in U.S. five-year bond futures in November 2021 as pricing moved in line with its expectations.
Later in the period, investment adviser trimmed the size of the overweights in Italian and Spanish equities due to the prospect for reduced central bank support. However, the decline in equity markets late in 2021 was used as an opportunity to increase the LifePath Dynamic Funds’ overall equity weighting. The primary addition was to Japan, which tends to outperform during periods of rising real interest rates.
Describe portfolio positioning at period end.
The LifePath Dynamic Funds were overweight in Japanese, Italian, Spanish and U.K. equities and underweight in U.S. equities. The LifePath Dynamic Funds were overweight in the euro versus the Australian dollar, Canadian dollar and yen, and they were underweight in U.S. 30-year bond futures.
At period end, each of the LifePath Dynamic Funds was invested according to its respective strategic allocation benchmark within tolerance limits.
The views expressed reflect the opinions of BlackRock as of the date of this report and are subject to change based on changes in market, economic or other conditions. These views are not intended to be a forecast of future events and are no guarantee of future results.
Glide Path Evolution
Under normal circumstances, the asset allocation of each LifePath Dynamic Fund will change over time according to a predetermined “glide path” as each LifePath Dynamic Fund approaches its respective target date. The glide path represents the shifting of asset classes over time. Each LifePath Dynamic Fund’s asset allocations become more conservative prior to retirement as time elapses. This reflects the need for reduced investment risks as retirement approaches and the need for lower volatility of each LifePath Dynamic Fund, which may be a primary source of income after retirement. As each LifePath Dynamic Fund approaches its target date, its asset allocation will shift so that each LifePath Dynamic Fund invests a greater percentage of its assets in fixed-income index funds. The asset allocation targets are established by the portfolio managers. The investment team, including the portfolio managers, meets regularly to assess market conditions, review the asset allocation targets of each LifePath Dynamic Fund, and determine whether any changes are required to enable each LifePath Dynamic Fund to achieve its investment objective. Because the BlackRock LifePath Dynamic Retirement Fund is in its most conservative phase, its allocation generally does not become more conservative over time, although its allocation may change to maintain its risk profile.
Although the asset allocation targets listed for the glide path are general, long-term targets, BlackRock Fund Advisors (“BFA” or the “Manager”) may periodically adjust the proportion of equity index funds and fixed-income index funds in each LifePath Dynamic Fund, based on an assessment of the current market conditions, the potential contribution of each asset class to the expected risk and return characteristics of each LifePath Dynamic Fund, reallocations of each LifePath Dynamic Fund’s composition to reflect intra-year movement along the glide path and other factors. In general, such adjustments will be limited; however, BFA may determine that a greater degree of variation is warranted to protect a LifePath Dynamic Fund or achieve its investment objective.
| | |
| Fund Summary as of December 31, 2021 | | BlackRock LifePath® Dynamic Retirement Fund |
Investment Objective
The investment objective of BlackRock LifePath® Dynamic Retirement Fund (“LifePath Dynamic Retirement Fund” or the “LifePath Dynamic Fund”) is to seek to provide for retirement outcomes based on quantitatively measured risk. In pursuit of this objective, LifePath Dynamic Retirement Fund will be broadly diversified across global asset classes.
TOTAL RETURN BASED ON A $10,000 INVESTMENT
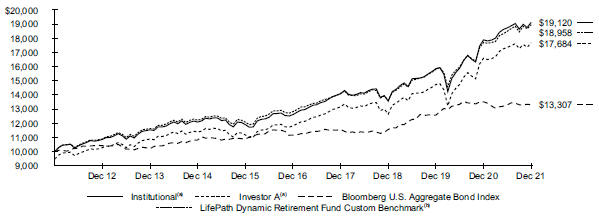
| | (a) | Assuming maximum sales charges, transaction costs and other operating expenses, including advisory fees, if any. Institutional Shares do not have a sales charge. | |
| | (b) | The LifePath Dynamic Fund compares its performance to that of a customized weighted index (the “LifePath Dynamic Retirement Fund Custom Benchmark”) comprised of the indexes indicated below, which reflects the investment adviser’s changes to the benchmark’s weightings over time. The investment adviser adjusts the weightings of these indexes periodically based upon its evaluation and adjustment of the LifePath Dynamic Fund’s asset allocation strategy. The weightings are presented annually but they are adjusted quarterly. | |
The LifePath Dynamic Fund’s custom benchmark consists of the following:
| | | | | | | | | | | | | | | | | | | | | | | | | | | | |
| | | | | | | |
| Period | | Bloomberg U.S. Aggregate Bond Index(a) | | | Bloomberg U.S. Treasury Inflation Protected
Securities
(TIPS) Index (Series-L)(b) | | | Bloomberg Commodity Index(c) | | | FTSE EPRA Nareit Developed Index | | | MSCI ACWI ex USA IMI Index | | | Russell 1000® Index | | | Russell 2000® Index | |
| | | | | | | |
01/01/12 to 12/31/12 | | | 52.9 | % | | | 9.1 | % | | | 1.0 | % | | | 0.3 | % | | | 11.3 | % | | | 21.2 | % | | | 4.2 | % |
01/01/13 to 12/31/13 | | | 52.9 | | | | 9.1 | | | | 3.7 | | | | 0.1 | | | | 10.1 | | | | 19.7 | | | | 4.4 | |
01/01/14 to 12/31/14 | | | 52.6 | | | | 9.0 | | | | 3.8 | | | | 0.2 | | | | 10.2 | | | | 19.9 | | | | 4.3 | |
01/01/15 to 12/31/15 | | | 51.1 | | | | 8.8 | | | | 3.8 | | | | 0.5 | | | | 11.0 | | | | 21.0 | | | | 3.8 | |
01/01/16 to 12/31/16 | | | 51.1 | | | | 8.8 | | | | 3.7 | | | | 0.5 | | | | 11.3 | | | | 20.9 | | | | 3.7 | |
01/01/17 to 12/31/17 | | | 51.2 | | | | 8.8 | | | | 3.7 | | | | 0.5 | | | | 11.3 | | | | 20.3 | | | | 4.2 | |
01/01/18 to 12/31/18 | | | 51.2 | | | | 8.8 | | | | N/A | | | | 0.5 | | | | 13.7 | | | | 21.8 | | | | 4.0 | |
01/01/19 to 12/31/19 | | | 52.0 | | | | 8.0 | | | | N/A | | | | 2.3 | | | | 12.3 | | | | 22.1 | | | | 3.3 | |
01/01/20 to 12/31/20 | | | 52.0 | | | | 8.0 | | | | N/A | | | | 2.2 | | | | 12.9 | | | | 21.6 | | | | 3.3 | |
01/01/21 to 12/31/21 | | | 52.0 | | | | 8.0 | | | | N/A | | | | 2.2 | | | | 13.3 | | | | 20.9 | | | | 3.6 | |
| | (a) | Prior to August 24, 2021, the Bloomberg U.S. Aggregate Bond Index was known as the Bloomberg Barclays U.S. Aggregate Bond Index. | |
| | (b) | Prior to August 24, 2021, the Bloomberg U.S. Treasury Inflation Protected Securities (TIPS) Index (Series-L) was known as the Bloomberg Barclays U.S. Treasury Inflation Protected Securities (TIPS) Index (Series-L). | |
| | (c) | Prior to July 1, 2014, the Bloomberg Commodity Index was known as the Dow Jones-UBS Commodity Index. | |
See “About Fund Performance” for descriptions of the indexes.
| | |
6 | | 2 0 2 1 BLACK ROCK ANNUAL REPORT TO SHAREHOLDERS |
| | |
| Fund Summary as of December 31, 2021 (continued) | | BlackRock LifePath® Dynamic Retirement Fund |
Performance
| | | | | | | | | | | | | | | | | | | | | | | | |
| | | Average Annual Total Returns(a)(b) | |
| | | | | | | | | | | | | | | | | | | |
| | | |
| | | 1 Year | | | 5 Years | | | 10 Years | |
| | | | | | | | | | | | | | | | | | | |
| | | | | | |
| | | Without Sales Charge | | | With Sales Charge | | | Without Sales Charge | | | With Sales Charge | | | Without Sales Charge | | | With Sales Charge | |
| | | | | | |
Institutional | | | 6.88 | % | | | N/A | | | | 8.68 | % | | | N/A | | | | 6.70 | % | | | N/A | |
Investor A | | | 6.61 | | | | 1.01 | % | | | 8.40 | | | | 7.24 | % | | | 6.44 | | | | 5.87 | % |
Investor C | | | 5.83 | | | | 4.90 | | | | 7.54 | | | | 7.54 | | | | 5.76 | | | | 5.76 | |
Class K | | | 7.11 | | | | N/A | | | | 8.91 | | | | N/A | | | | 6.98 | | | | N/A | |
Class R | | | 6.41 | | | | N/A | | | | 8.18 | | | | N/A | | | | 6.20 | | | | N/A | |
| | | | | | |
LifePath Dynamic Retirement Fund Custom Benchmark | | | 7.06 | | | | N/A | | | | 8.13 | | | | N/A | | | | 6.61 | | | | N/A | |
Bloomberg U.S. Aggregate Bond Index | | | (1.54 | ) | | | N/A | | | | 3.57 | | | | N/A | | | | 2.90 | | | | N/A | |
Bloomberg U.S. TIPS Index (Series-L) | | | 5.96 | | | | N/A | | | | 5.34 | | | | N/A | | | | 3.09 | | | | N/A | |
FTSE EPRA Nareit Developed Index | | | 26.09 | | | | N/A | | | | 7.81 | | | | N/A | | | | 8.64 | | | | N/A | |
MSCI ACWI ex USA IMI Index | | | 8.53 | | | | N/A | | | | 9.83 | | | | N/A | | | | 7.57 | | | | N/A | |
Russell 1000® Index | | | 26.45 | | | | N/A | | | | 18.43 | | | | N/A | | | | 16.54 | | | | N/A | |
Russell 2000® Index | | | 14.82 | | | | N/A | | | | 12.02 | | | | N/A | | | | 13.23 | | | | N/A | |
| | (a) | Assuming maximum sales charges, if any. Average annual total returns with and without sales charges reflect reductions for distribution and service fees. See “About Fund Performance” for a detailed description of share classes, including any related sales charges and fees. | |
| | (b) | LifePath Dynamic Retirement Fund normally invests its assets in underlying funds according to an asset allocation strategy designed for investors who are currently withdrawing, or plan in the near future to begin withdrawing, a substantial portion of their investment. LifePath Dynamic Retirement Fund’s returns prior to March 31, 2018 are the returns of LifePath Dynamic Retirement Fund when its assets could be allocated to underlying funds that invest primarily in commodities. LifePath Dynamic Retirement Fund’s returns between December 14, 2015 and November 7, 2016 are the returns of LifePath Dynamic Retirement Fund when it incorporated different allocations in its glidepath and had a different investment strategy. LifePath Dynamic Retirement Fund’s returns prior to December 14, 2015 are the returns of LifePath Dynamic Retirement Fund under a different investment strategy. LifePath Dynamic Retirement Fund’s returns prior to November 28, 2014 are the returns of LifePath Dynamic Retirement Fund when it had a different target asset allocation. | |
N/A — Not applicable as the share class and index do not have a sales charge.
Past performance is not an indication of future results.
Performance results may include adjustments made for financial reporting purposes in accordance with U.S. generally accepted accounting principles.
PORTFOLIO ALLOCATION
| | | | |
| | |
| Asset Type | | Percent of Net Assets | |
| |
Fixed-Income Funds | | | 57 | % |
Equity Funds | | | 42 | |
Money Market Funds | | | 4 | |
Liabilities in Excess of Other Assets | | | (3 | ) |
TEN LARGEST HOLDINGS
| | | | |
| | |
| Security | | Percent of Net Assets | |
| |
Diversified Equity Master Portfolio | | | 23 | % |
Advantage CoreAlpha Bond Master Portfolio | | | 18 | |
iShares Core U.S. Aggregate Bond ETF | | | 16 | |
Master Total Return Portfolio | | | 13 | |
iShares TIPS Bond ETF | | | 8 | |
International Tilts Master Portfolio | | | 5 | |
BlackRock Tactical Opportunities Fund, Class K | | | 5 | |
BlackRock Advantage Emerging Markets Fund, Class K | | | 4 | |
BlackRock Cash Funds: Institutional, SL Agency Shares | | | 3 | |
iShares Developed Real Estate Index Fund, Class K | | | 2 | |
| | |
| Fund Summary as of December 31, 2021 | | BlackRock LifePath® Dynamic 2025 Fund |
Investment Objective
The investment objective of BlackRock LifePath® Dynamic 2025 Fund (“LifePath Dynamic 2025 Fund” or the “LifePath Dynamic Fund”) is to seek to provide for retirement outcomes based on quantitatively measured risk. In pursuit of this objective, LifePath Dynamic 2025 Fund will be broadly diversified across global asset classes, with asset allocations becoming more conservative over time.
TOTAL RETURN BASED ON A $10,000 INVESTMENT
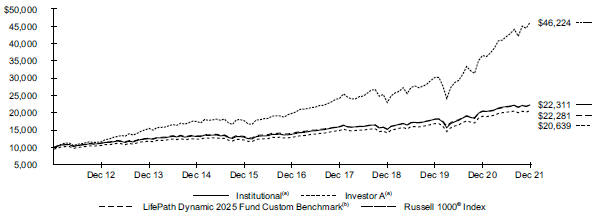
| | (a) | Assuming maximum sales charges, transaction costs and other operating expenses, including advisory fees, if any. Institutional Shares do not have a sales charge. | |
| | (b) | The LifePath Dynamic Fund compares its performance to that of a customized weighted index (the “LifePath Dynamic 2025 Fund Custom Benchmark”) comprised of the indexes indicated below, which reflects the investment adviser’s changes to the benchmark’s weightings over time. The investment adviser adjusts the weightings of these indexes periodically based upon its evaluation and adjustment of the LifePath Dynamic Fund’s asset allocation strategy. The weightings are presented annually but they are adjusted quarterly. | |
The LifePath Dynamic Fund’s custom benchmark consists of the following:
| | | | | | | | | | | | | | | | | | | | | | | | | | | | |
| | | | | | | |
| Period | | Bloomberg U.S. Aggregate Bond Index(a) | | | Bloomberg U.S. Treasury Inflation Protected Securities (TIPS) Index (Series-L)(b) | | | Bloomberg Commodity Index(c) | | | FTSE EPRA Nareit Developed Index | | | MSCI ACWI ex USA IMI Index | | | Russell 1000® Index | | | Russell 2000® Index | |
| | | | | | | |
01/01/12 to 12/31/12 | | | 31.9 | % | | | 5.0 | % | | | 1.0 | % | | | 4.7 | % | | | 18.2 | % | | | 35.9 | % | | | 3.3 | % |
01/01/13 to 12/31/13 | | | 33.7 | | | | 5.2 | | | | 3.8 | | | | 4.3 | | | | 17.1 | | | | 32.6 | | | | 3.3 | |
01/01/14 to 12/31/14 | | | 34.3 | | | | 5.3 | | | | 3.8 | | | | 4.5 | | | | 17.3 | | | | 31.5 | | | | 3.3 | |
01/01/15 to 12/31/15 | | | 31.0 | | | | 5.0 | | | | 3.8 | | | | 5.3 | | | | 18.8 | | | | 33.1 | | | | 3.0 | |
01/01/16 to 12/31/16 | | | 32.4 | | | | 5.2 | | | | 3.8 | | | | 5.2 | | | | 18.5 | | | | 32.0 | | | | 2.9 | |
01/01/17 to 12/31/17 | | | 34.9 | | | | 5.7 | | | | 3.8 | | | | 4.7 | | | | 18.0 | | | | 29.8 | | | | 3.1 | |
01/01/18 to 12/31/18 | | | 36.5 | | | | 5.9 | | | | N/A | | | | 4.5 | | | | 19.3 | | | | 30.7 | | | | 3.1 | |
01/01/19 to 12/31/19 | | | 38.1 | | | | 7.1 | | | | N/A | | | | 2.5 | | | | 19.5 | | | | 29.8 | | | | 3.0 | |
01/01/20 to 12/31/20 | | | 40.9 | | | | 7.3 | | | | N/A | | | | 2.4 | | | | 18.5 | | | | 28.0 | | | | 2.9 | |
01/01/21 to 12/31/21 | | | 43.3 | | | | 7.5 | | | | N/A | | | | 2.2 | | | | 17.6 | | | | 26.2 | | | | 3.2 | |
| | (a) | Prior to August 24, 2021, the Bloomberg U.S. Aggregate Bond Index was known as the Bloomberg Barclays U.S. Aggregate Bond Index. | |
| | (b) | Prior to August 24, 2021, the Bloomberg U.S. Treasury Inflation Protected Securities (TIPS) Index (Series-L) was known as the Bloomberg Barclays U.S. Treasury Inflation Protected Securities (TIPS) Index (Series-L). | |
| | (c) | Prior to July 1, 2014, the Bloomberg Commodity Index was known as the Dow Jones-UBS Commodity Index. | |
See “About Fund Performance” for descriptions of the indexes.
| | |
8 | | 2 0 2 1 BLACK ROCK ANNUAL REPORT TO SHAREHOLDERS |
| | |
| Fund Summary as of December 31, 2021 (continued) | | BlackRock LifePath® Dynamic 2025 Fund |
Performance
| | | | | | | | | | | | | | | | | | | | | | | | |
| | | Average Annual Total Returns(a)(b) | |
| | | | | | | | | | | | | | | | | | | |
| | | |
| | | 1 Year | | | 5 Years | | | 10 Years | |
| | | | | | | | | | | | | | | | | | | |
| | | | | | |
| | | Without Sales
Charge | | | With Sales Charge | | | Without Sales Charge | | | With Sales Charge | | | Without Sales Charge | | | With Sales Charge | |
| | | | | | |
Institutional | | | 8.82 | % | | | N/A | | | | 10.06 | % | | | N/A | | | | 8.36 | % | | | N/A | |
Investor A | | | 8.56 | | | | 2.86 | % | | | 9.81 | | | | 8.63 | % | | | 8.10 | | | | 7.51 | % |
Investor C | | | 7.70 | | | | 6.72 | | | | 8.95 | | | | 8.95 | | | | 7.42 | | | | 7.42 | |
Class K | | | 9.05 | | | | N/A | | | | 10.32 | | | | N/A | | | | 8.57 | | | | N/A | |
Class R | | | 8.30 | | | | N/A | | | | 9.59 | | | | N/A | | | | 7.85 | | | | N/A | |
| | | | | | |
LifePath Dynamic 2025 Fund Custom Benchmark | | | 9.04 | | | | N/A | | | | 9.56 | | | | N/A | | | | 8.34 | | | | N/A | |
Bloomberg U.S. Aggregate Bond Index | | | (1.54 | ) | | | N/A | | | | 3.57 | | | | N/A | | | | 2.90 | | | | N/A | |
Bloomberg U.S. TIPS Index (Series-L) | | | 5.96 | | | | N/A | | | | 5.34 | | | | N/A | | | | 3.09 | | | | N/A | |
FTSE EPRA Nareit Developed Index | | | 26.09 | | | | N/A | | | | 7.81 | | | | N/A | | | | 8.64 | | | | N/A | |
MSCI ACWI ex USA IMI Index | | | 8.53 | | | | N/A | | | | 9.83 | | | | N/A | | | | 7.57 | | | | N/A | |
Russell 1000® Index | | | 26.45 | | | | N/A | | | | 18.43 | | | | N/A | | | | 16.54 | | | | N/A | |
Russell 2000® Index | | | 14.82 | | | | N/A | | | | 12.02 | | | | N/A | | | | 13.23 | | | | N/A | |
| | (a) | Assuming maximum sales charges, if any. Average annual total returns with and without sales charges reflect reductions for distribution and service fees. See “About Fund Performance” for a detailed description of share classes, including any related sales charges and fees. | |
| | (b) | LifePath Dynamic 2025 Fund normally invests its assets in underlying funds according to an asset allocation strategy designed for investors expecting to retire or begin withdrawing assets around the year 2025. Effective November 7, 2016, the LifePath Dynamic Fund changed its investment strategy to (i) incorporate a Global Tactical Asset Allocation into its glidepath, (ii) increase the flexibility of its equity allocations and (iii) diversify its fixed-income strategies. Performance for the periods shown between December 14, 2015 and November 7, 2016 is based on the prior investment strategy. Effective December 14, 2015, the LifePath Dynamic Fund changed its investment strategy to (i) incorporate a dynamic glidepath and (ii) invest directly in securities and derivatives, as well as in underlying funds. Performance for the periods shown prior to December 14, 2015 is based on the prior investment strategy. Effective November 28, 2014, the Fund changed its glide path and target asset allocation to target higher levels of equity exposure for the LifePath Dynamic Fund throughout the glide path. Performance for the periods shown prior to November 28, 2014 is based on the prior glide path and target asset allocation. | |
N/A — Not applicable as the share class and index do not have a sales charge.
Past performance is not an indication of future results.
Performance results may include adjustments made for financial reporting purposes in accordance with U.S. generally accepted accounting principles.
PORTFOLIO ALLOCATION
| | | | |
| | |
| Asset Type | | Percent of Net Assets | |
| |
Equity Funds | | | 51 | % |
Fixed-Income Funds | | | 45 | |
Money Market Funds | | | 8 | |
Liabilities in Excess of Other Assets | | | (4 | ) |
TEN LARGEST HOLDINGS
| | | | |
| | |
| Security | | Percent of Net Assets | |
| |
Diversified Equity Master Portfolio | | | 28 | % |
Advantage CoreAlpha Bond Master Portfolio | | | 14 | |
iShares Core U.S. Aggregate Bond ETF | | | 12 | |
Master Total Return Portfolio | | | 10 | |
International Tilts Master Portfolio | | | 8 | |
iShares TIPS Bond ETF | | | 7 | |
BlackRock Tactical Opportunities Fund, Class K | | | 5 | |
BlackRock Advantage Emerging Markets Fund, Class K | | | 5 | |
BlackRock Cash Funds: Institutional, SL Agency Shares | | | 5 | |
BlackRock Cash Funds: Treasury, SL Agency Shares | | | 4 | |
| | |
| Fund Summary as of December 31, 2021 | | BlackRock LifePath® Dynamic 2030 Fund |
Investment Objective
The investment objective of BlackRock LifePath® Dynamic 2030 Fund (“LifePath Dynamic 2030 Fund” or the “LifePath Dynamic Fund”) is to seek to provide for retirement outcomes based on quantitatively measured risk. In pursuit of this objective, LifePath Dynamic 2030 Fund will be broadly diversified across global asset classes, with asset allocations becoming more conservative over time.
TOTAL RETURN BASED ON A $10,000 INVESTMENT
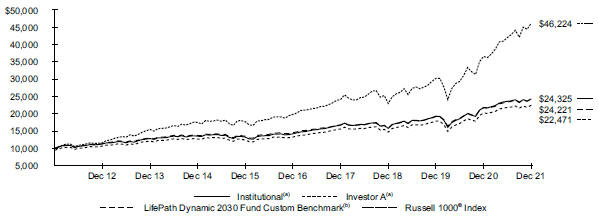
| | (a) | Assuming maximum sales charges, transaction costs and other operating expenses, including advisory fees, if any. Institutional Shares do not have a sales charge. | |
| | (b) | The LifePath Dynamic Fund compares its performance to that of a customized weighted index (the “LifePath Dynamic 2030 Fund Custom Benchmark”) comprised of the indexes indicated below, which reflects the investment adviser’s changes to the benchmark’s weightings over time. The investment adviser adjusts the weightings of these indexes periodically based upon its evaluation and adjustment of the LifePath Dynamic Fund’s asset allocation strategy. The weightings are presented annually but they are adjusted quarterly. | |
The LifePath Dynamic Fund’s custom benchmark consists of the following:
| | | | | | | | | | | | | | | | | | | | | | | | | | | | |
| | | | | | | |
| Period | | Bloomberg U.S. Aggregate Bond Index(a) | | | Bloomberg U.S. Treasury Inflation Protected Securities (TIPS) Index (Series-L)(b) | | | Bloomberg Commodity Index(c) | | | FTSE EPRA Nareit Developed Index | | | MSCI ACWI ex USA IMI Index | | | Russell 1000® Index | | | Russell 2000® Index | |
| | | | | | | |
01/01/12 to 12/31/12 | | | 25.8 | % | | | 3.8 | % | | | 1.0 | % | | | 6.0 | % | | | 20.2 | % | | | 40.2 | % | | | 3.0 | % |
01/01/13 to 12/31/13 | | | 27.6 | | | | 4.0 | | | | 3.9 | | | | 5.7 | | | | 19.3 | | | | 36.6 | | | | 2.9 | |
01/01/14 to 12/31/14 | | | 27.5 | | | | 4.0 | | | | 3.9 | | | | 6.1 | | | | 19.8 | | | | 35.8 | | | | 2.9 | |
01/01/15 to 12/31/15 | | | 21.8 | | | | 3.4 | | | | 3.9 | | | | 7.7 | | | | 22.2 | | | | 38.5 | | | | 2.5 | |
01/01/16 to 12/31/16 | | | 24.5 | | | | 3.6 | | | | 3.9 | | | | 7.6 | | | | 21.9 | | | | 36.0 | | | | 2.5 | |
01/01/17 to 12/31/17 | | | 25.9 | | | | 4.0 | | | | 3.9 | | | | 7.4 | | | | 21.4 | | | | 35.0 | | | | 2.4 | |
01/01/18 to 12/31/18 | | | 27.1 | | | | 4.2 | | | | N/A | | | | 7.5 | | | | 22.5 | | | | 36.2 | | | | 2.5 | |
01/01/19 to 12/31/19 | | | 27.0 | | | | 6.0 | | | | N/A | | | | 3.1 | | | | 25.2 | | | | 36.0 | | | | 2.7 | |
01/01/20 to 12/31/20 | | | 29.9 | | | | 6.2 | | | | N/A | | | | 3.0 | | | | 23.9 | | | | 34.5 | | | | 2.5 | |
01/01/21 to 12/31/21 | | | 32.1 | | | | 6.5 | | | | N/A | | | | 2.9 | | | | 22.9 | | | | 33.1 | | | | 2.5 | |
| | (a) | Prior to August 24, 2021, the Bloomberg U.S. Aggregate Bond Index was known as the Bloomberg Barclays U.S. Aggregate Bond Index. | |
| | (b) | Prior to August 24, 2021, the Bloomberg U.S. Treasury Inflation Protected Securities (TIPS) Index (Series-L) was known as the Bloomberg Barclays U.S. Treasury Inflation Protected Securities (TIPS) Index (Series-L). | |
| | (c) | Prior to July 1, 2014, the Bloomberg Commodity Index was known as the Dow Jones-UBS Commodity Index. | |
See “About Fund Performance” for descriptions of the indexes.
| | |
10 | | 2 0 2 1 BLACK ROCK ANNUAL REPORT TO SHAREHOLDERS |
| | |
| Fund Summary as of December 31, 2021 (continued) | | BlackRock LifePath® Dynamic 2030 Fund |
Performance
| | | | | | | | | | | | | | | | | | | | | | | | |
| | | Average Annual Total Returns(a)(b) | |
| | | | |
| | | |
| | | 1 Year | | | 5 Years | | | 10 Years | |
| | | | | | | | | | | | |
| | | | | | |
| | | Without Sales Charge | | | With Sales Charge | | | Without Sales Charge | | | With Sales Charge | | | Without Sales Charge | | | With Sales Charge | |
| | | | | | |
Institutional | | | 11.46 | % | | | N/A | | | | 11.33 | % | | | N/A | | | | 9.30 | % | | | N/A | |
Investor A | | | 11.13 | | | | 5.30 | % | | | 11.06 | | | | 9.87 | % | | | 9.02 | | | | 8.43 | % |
Investor C | | | 10.29 | | | | 9.34 | | | | 10.18 | | | | 10.18 | | | | 8.34 | | | | 8.34 | |
Class K | | | 11.70 | | | | N/A | | | | 11.58 | | | | N/A | | | | 9.59 | | | | N/A | |
Class R | | | 10.93 | | | | N/A | | | | 10.83 | | | | N/A | | | | 8.78 | | | | N/A | |
| | | | | | |
LifePath Dynamic 2030 Fund Custom Benchmark | | | 11.49 | | | | N/A | | | | 10.74 | | | | N/A | | | | 9.25 | | | | N/A | |
Bloomberg U.S. Aggregate Bond Index | | | (1.54 | ) | | | N/A | | | | 3.57 | | | | N/A | | | | 2.90 | | | | N/A | |
Bloomberg U.S. TIPS Index (Series-L) | | | 5.96 | | | | N/A | | | | 5.34 | | | | N/A | | | | 3.09 | | | | N/A | |
FTSE EPRA Nareit Developed Index | | | 26.09 | | | | N/A | | | | 7.81 | | | | N/A | | | | 8.64 | | | | N/A | |
MSCI ACWI ex USA IMI Index | | | 8.53 | | | | N/A | | | | 9.83 | | | | N/A | | | | 7.57 | | | | N/A | |
Russell 1000® Index | | | 26.45 | | | | N/A | | | | 18.43 | | | | N/A | | | | 16.54 | | | | N/A | |
Russell 2000® Index | | | 14.82 | | | | N/A | | | | 12.02 | | | | N/A | | | | 13.23 | | | | N/A | |
| | (a) | Assuming maximum sales charges, if any. Average annual total returns with and without sales charges reflect reductions for distribution and service fees. See “About Fund Performance” for a detailed description of share classes, including any related sales charges and fees. | |
| | (b) | LifePath Dynamic 2030 Fund normally invests its assets in underlying funds according to an asset allocation strategy designed for investors expecting to retire or begin withdrawing assets around the year 2030. LifePath Dynamic 2030 Fund’s returns prior to March 31, 2018 are the returns of LifePath Dynamic 2030 Fund when its assets could be allocated to underlying funds that invest primarily in commodities. LifePath Dynamic 2030 Fund’s returns between December 14, 2015 and November 7, 2016 are the returns of LifePath Dynamic 2030 Fund when it incorporated different allocations in its glidepath and had a different investment strategy. LifePath Dynamic 2030 Fund’s returns prior to December 14, 2015 are the returns of LifePath Dynamic 2030 Fund under a different investment strategy. LifePath Dynamic 2030 Fund’s returns prior to November 28, 2014 are the returns of LifePath Dynamic 2030 Fund when it had a different target asset allocation. | |
N/A — Not applicable as the share class and index do not have a sales charge.
Past performance is not an indication of future results.
Performance results may include adjustments made for financial reporting purposes in accordance with U.S. generally accepted accounting principles.
PORTFOLIO ALLOCATION
| | | | |
| | |
| Asset Type | | Percent of Net Assets | |
| |
Equity Funds | | | 63 | % |
Fixed-Income Funds | | | 35 | |
Money Market Funds | | | 8 | |
Liabilities in Excess of Other Assets | | | (6 | ) |
TEN LARGEST HOLDINGS
| | | | |
| | |
| Security | | Percent of Net Assets | |
| |
Diversified Equity Master Portfolio | | | 35 | % |
Advantage CoreAlpha Bond Master Portfolio | | | 11 | |
International Tilts Master Portfolio | | | 10 | |
iShares Core U.S. Aggregate Bond ETF | | | 9 | |
Master Total Return Portfolio | | | 8 | |
iShares TIPS Bond ETF | | | 6 | |
BlackRock Advantage Emerging Markets Fund, Class K | | | 6 | |
BlackRock Cash Funds: Institutional, SL Agency Shares | | | 6 | |
BlackRock Tactical Opportunities Fund, Class K | | | 5 | |
iShares MSCI EAFE Small-Cap ETF | | | 4 | |
| | |
| Fund Summary as of December 31, 2021 | | BlackRock LifePath® Dynamic 2035 Fund |
Investment Objective
The investment objective of BlackRock LifePath® Dynamic 2035 Fund (“LifePath Dynamic 2035 Fund” or the “LifePath Dynamic Fund”) is to seek to provide for retirement outcomes based on quantitatively measured risk. In pursuit of this objective, LifePath Dynamic 2035 Fund will be broadly diversified across global asset classes, with asset allocations becoming more conservative over time.
TOTAL RETURN BASED ON A $10,000 INVESTMENT
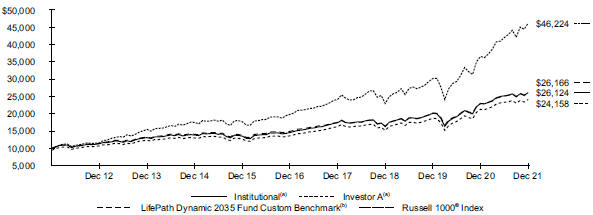
| | (a) | Assuming maximum sales charges, transaction costs and other operating expenses, including advisory fees, if any. Institutional Shares do not have a sales charge. | |
| | (b) | The LifePath Dynamic Fund compares its performance to that of a customized weighted index (the “LifePath Dynamic 2035 Fund Custom Benchmark”) comprised of the indexes indicated below, which reflects the investment adviser’s changes to the benchmark’s weightings over time. The investment adviser adjusts the weightings of these indexes periodically based upon its evaluation and adjustment of the LifePath Dynamic Fund’s asset allocation strategy. The weightings are presented annually but they are adjusted quarterly. | |
The LifePath Dynamic Fund’s custom benchmark consists of the following:
| | | | | | | | | | | | | | | | | | | | | | | | | | | | |
| Period | | Bloomberg U.S. Aggregate Bond Index(a) | | | Bloomberg U.S. Treasury Inflation Protected Securities (TIPS) Index (Series-L)(b) | | | Bloomberg Commodity Index(c) | | | FTSE EPRA Nareit Developed Index | | | MSCI ACWI ex USA IMI Index | | | Russell 1000® Index | | | Russell 2000® Index | |
| | | | | | | |
01/01/12 to 12/31/12 | | | 20.3 | % | | | 2.6 | % | | | 1.0 | % | | | 7.2 | % | | | 21.1 | % | | | 45.1 | % | | | 2.7 | % |
01/01/13 to 12/31/13 | | | 22.1 | | | | 2.9 | | | | 3.9 | | | | 6.9 | | | | 21.3 | | | | 40.3 | | | | 2.6 | |
01/01/14 to 12/31/14 | | | 21.4 | | | | 2.8 | | | | 3.9 | | | | 7.6 | | | | 22.2 | | | | 39.6 | | | | 2.5 | |
01/01/15 to 12/31/15 | | | 13.2 | | | | 1.9 | | | | 3.9 | | | | 9.8 | | | | 25.4 | | | | 43.6 | | | | 2.2 | |
01/01/16 to 12/31/16 | | | 14.7 | | | | 2.2 | | | | 3.9 | | | | 9.9 | | | | 25.1 | | | | 42.1 | | | | 2.1 | |
01/01/17 to 12/31/17 | | | 17.1 | | | | 2.5 | | | | 4.0 | | | | 10.0 | | | | 24.6 | | | | 40.1 | | | | 1.7 | |
01/01/18 to 12/31/18 | | | 18.4 | | | | 2.7 | | | | N/A | | | | 10.3 | | | | 25.5 | | | | 41.3 | | | | 1.8 | |
01/01/19 to 12/31/19 | | | 17.1 | | | | 4.6 | | | | N/A | | | | 3.7 | | | | 30.4 | | | | 41.8 | | | | 2.4 | |
01/01/20 to 12/31/20 | | | 19.7 | | | | 4.9 | | | | N/A | | | | 3.6 | | | | 29.1 | | | | 40.6 | | | | 2.1 | |
01/01/21 to 12/31/21 | | | 21.8 | | | | 5.2 | | | | N/A | | | | 3.5 | | | | 28.0 | | | | 39.6 | | | | 1.9 | |
| | (a) | Prior to August 24, 2021, the Bloomberg U.S. Aggregate Bond Index was known as the Bloomberg Barclays U.S. Aggregate Bond Index. | |
| | (b) | Prior to August 24, 2021, the Bloomberg U.S. Treasury Inflation Protected Securities (TIPS) Index (Series-L) was known as the Bloomberg Barclays U.S. Treasury Inflation Protected Securities (TIPS) Index (Series-L). | |
| | (c) | Prior to July 1, 2014, the Bloomberg Commodity Index was known as the Dow Jones-UBS Commodity Index. | |
| | | See “About Fund Performance” for descriptions of the indexes. | |
| | |
12 | | 2 0 2 1 BLACK ROCK ANNUAL REPORT TO SHAREH OLDERS |
| | |
| Fund Summary as of December 31, 2021 (continued) | | BlackRock LifePath® Dynamic 2035 Fund |
Performance
| | | | | | | | | | | | | | | | | | | | | | | | |
| | | Average Annual Total Returns(a)(b) | |
| | | | |
| | | |
| | | 1 Year | | | 5 Years | | | 10 Years | |
| | | | | | | | | | | | |
| | | | | | |
| | | Without Sales Charge | | | With Sales Charge | | | Without Sales Charge | | | With Sales Charge | | | Without Sales Charge | | | With Sales Charge | |
| | | | | | |
Institutional | | | 13.76 | % | | | N/A | | | | 12.36 | % | | | N/A | | | | 10.08 | % | | | N/A | |
Investor A | | | 13.46 | | | | 7.51 | % | | | 12.09 | | | | 10.88 | % | | | 9.81 | | | | 9.22 | % |
Investor C | | | 12.56 | | | | 11.56 | | | | 11.21 | | | | 11.21 | | | | 9.13 | | | | 9.13 | |
Class K | | | 13.96 | | | | N/A | | | | 12.60 | | | | N/A | | | | 10.42 | | | | N/A | |
Class R | | | 13.19 | | | | N/A | | | | 11.87 | | | | N/A | | | | 9.57 | | | | N/A | |
| | | | | | |
LifePath Dynamic 2035 Fund Custom Benchmark | | | 13.85 | | | | N/A | | | | 11.87 | | | | N/A | | | | 10.10 | | | | N/A | |
Bloomberg U.S. Aggregate Bond Index | | | (1.54 | ) | | | N/A | | | | 3.57 | | | | N/A | | | | 2.90 | | | | N/A | |
Bloomberg U.S. TIPS Index (Series-L) | | | 5.96 | | | | N/A | | | | 5.34 | | | | N/A | | | | 3.09 | | | | N/A | |
FTSE EPRA Nareit Developed Index | | | 26.09 | | | | N/A | | | | 7.81 | | | | N/A | | | | 8.64 | | | | N/A | |
MSCI ACWI ex USA IMI Index | | | 8.53 | | | | N/A | | | | 9.83 | | | | N/A | | | | 7.57 | | | | N/A | |
Russell 1000® Index | | | 26.45 | | | | N/A | | | | 18.43 | | | | N/A | | | | 16.54 | | | | N/A | |
Russell 2000® Index | | | 14.82 | | | | N/A | | | | 12.02 | | | | N/A | | | | 13.23 | | | | N/A | |
| | (a) | Assuming maximum sales charges, if any. Average annual total returns with and without sales charges reflect reductions for distribution and service fees. See “About Fund Performance” for a detailed description of share classes, including any related sales charges and fees. | |
| | (b) | LifePath Dynamic 2035 Fund normally invests its assets in underlying funds according to an asset allocation strategy designed for investors expecting to retire or begin withdrawing assets around the year 2035. Effective November 7, 2016, the LifePath Dynamic Fund changed its investment strategy to (i) incorporate a Global Tactical Asset Allocation into its glidepath, (ii) increase the flexibility of its equity allocations and (iii) diversify its fixed-income strategies. Performance for the periods shown between December 14, 2015 and November 7, 2016 is based on the prior investment strategy. Effective December 14, 2015, the LifePath Dynamic Fund changed its investment strategy to (i) incorporate a dynamic glidepath and (ii) invest directly in securities and derivatives, as well as in underlying funds. Performance for the periods shown prior to December 14, 2015 is based on the prior investment strategy. Effective November 28, 2014, the Fund changed its glide path and target asset allocation to target higher levels of equity exposure for the LifePath Dynamic Fund throughout the glide path. Performance for the periods shown prior to November 28, 2014 is based on the prior glide path and target asset allocation. | |
N/A — Not applicable as the share class and index do not have a sales charge.
Past performance is not an indication of future results.
Performance results may include adjustments made for financial reporting purposes in accordance with U.S. generally accepted accounting principles.
PORTFOLIO ALLOCATION
| | | | |
| | |
| Asset Type | | Percent of Net Assets | |
| |
Equity Funds | | | 73 | % |
Fixed-Income Funds | | | 23 | |
Money Market Funds | | | 6 | |
Liabilities in Excess of Other Assets | | | (2 | ) |
TEN LARGEST HOLDINGS
| | | | |
| | |
| Security | | Percent of Net Assets | |
| |
Diversified Equity Master Portfolio | | | 40 | % |
International Tilts Master Portfolio | | | 12 | |
BlackRock Advantage Emerging Markets Fund, Class K | | | 8 | |
Advantage CoreAlpha Bond Master Portfolio | | | 6 | |
iShares Core U.S. Aggregate Bond ETF | | | 6 | |
iShares TIPS Bond ETF | | | 5 | |
BlackRock Tactical Opportunities Fund, Class K | | | 5 | |
iShares MSCI EAFE Small-Cap ETF | | | 5 | |
Master Total Return Portfolio | | | 5 | |
BlackRock Cash Funds: Treasury, SL Agency Shares | | | 4 | |
| | |
| Fund Summary as of December 31, 2021 | | BlackRock LifePath® Dynamic 2040 Fund |
Investment Objective
The investment objective of BlackRock LifePath® Dynamic 2040 Fund (“LifePath Dynamic 2040 Fund” or the “LifePath Dynamic Fund”) is to seek to provide for retirement outcomes based on quantitatively measured risk. In pursuit of this objective, LifePath Dynamic 2040 Fund will be broadly diversified across global asset classes, with asset allocations becoming more conservative over time.
TOTAL RETURN BASED ON A $10,000 INVESTMENT
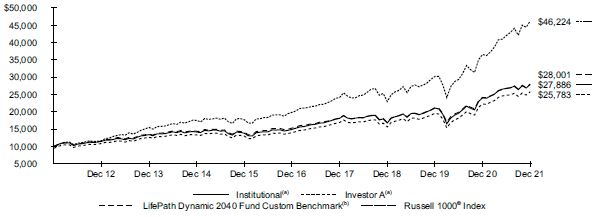
| | (a) | Assuming maximum sales charges, transaction costs and other operating expenses, including advisory fees, if any. Institutional Shares do not have a sales charge. | |
| | (b) | The LifePath Dynamic Fund compares its performance to that of a customized weighted index (the “LifePath Dynamic 2040 Fund Custom Benchmark”) comprised of the indexes indicated below, which reflects the investment adviser’s changes to the benchmark’s weightings over time. The investment adviser adjusts the weightings of these indexes periodically based upon its evaluation and adjustment of the LifePath Dynamic Fund’s asset allocation strategy. The weightings are presented annually but they are adjusted quarterly. | |
The LifePath Dynamic Fund’s custom benchmark consists of the following:
| | | | | | | | | | | | | | | | | | | | | | | | | | | | |
| Period | | Bloomberg U.S. Aggregate Bond Index(a) | | | Bloomberg U.S. Treasury Inflation Protected Securities (TIPS) Index (Series-L)(b) | | | Bloomberg Commodity Index(c) | | | FTSE EPRA Nareit Developed Index | | | MSCI ACWI ex USA IMI Index | | | Russell 1000® Index | | | Russell 2000® Index | |
| | | | | | | |
01/01/12 to 12/31/12 | | | 15.3 | % | | | 1.6 | % | | | 1.0 | % | | | 8.2 | % | | | 23.7 | % | | | 47.7 | % | | | 2.5 | % |
01/01/13 to 12/31/13 | | | 17.3 | | | | 1.7 | | | | 3.9 | | | | 8.1 | | | | 23.1 | | | | 43.6 | | | | 2.3 | |
01/01/14 to 12/31/14 | | | 16.1 | | | | 1.6 | | | | 3.9 | | | | 9.0 | | | | 24.2 | | | | 42.9 | | | | 2.3 | |
01/01/15 to 12/31/15 | | | 5.7 | | | | 0.7 | | | | 4.1 | | | | 12.1 | | | | 28.1 | | | | 47.3 | | | | 2.0 | |
01/01/16 to 12/31/16 | | | 8.4 | | | | 0.9 | | | | 4.1 | | | | 12.1 | | | | 28.0 | | | | 44.0 | | | | 2.5 | |
01/01/17 to 12/31/17 | | | 9.2 | | | | 1.2 | | | | 4.1 | | | | 12.3 | | | | 27.6 | | | | 44.4 | | | | 1.2 | |
01/01/18 to 12/31/18 | | | 10.3 | | | | 1.4 | | | | N/A | | | | 12.8 | | | | 28.2 | | | | 46.0 | | | | 1.3 | |
01/01/19 to 12/31/19 | | | 8.4 | | | | 3.0 | | | | N/A | | | | 4.2 | | | | 35.2 | | | | 47.0 | | | | 2.2 | |
01/01/20 to 12/31/20 | | | 10.8 | | | | 3.2 | | | | N/A | | | | 4.1 | | | | 33.9 | | | | 46.2 | | | | 1.8 | |
01/01/21 to 12/31/21 | | | 12.6 | | | | 3.6 | | | | N/A | | | | 4.0 | | | | 32.7 | | | | 45.7 | | | | 1.4 | |
| | (a) | Prior to August 24, 2021, the Bloomberg U.S. Aggregate Bond Index was known as the Bloomberg Barclays U.S. Aggregate Bond Index. | |
| | (b) | Prior to August 24, 2021, the Bloomberg U.S. Treasury Inflation Protected Securities (TIPS) Index (Series-L) was known as the Bloomberg Barclays U.S. Treasury Inflation Protected Securities (TIPS) Index (Series-L). | |
| | (c) | Prior to July 1, 2014, the Bloomberg Commodity Index was known as the Dow Jones-UBS Commodity Index. | |
| | | See “About Fund Performance” for descriptions of the indexes. | |
| | |
14 | | 2 0 2 1 BLACK ROCK ANNUAL REPORT TO SHAREH OLDERS |
| | |
| Fund Summary as of December 31, 2021 (continued) | | BlackRock LifePath® Dynamic 2040 Fund |
Performance
| | | | | | | | | | | | | | | | | | | | | | | | |
| | | Average Annual Total Returns(a)(b) | |
| | | | |
| | | |
| | | 1 Year | | | 5 Years | | | 10 Years | |
| | | | | | | | | | | | |
| | | | | | |
| | | Without Sales Charge | | | With Sales Charge | | | Without Sales Charge | | | With Sales Charge | | | Without Sales Charge | | | With Sales Charge | |
| | | | | | |
Institutional | | | 16.04 | % | | | N/A | | | | 13.31 | % | | | N/A | | | | 10.80 | % | | | N/A | |
Investor A | | | 15.84 | | | | 9.76 | % | | | 13.04 | | | | 11.83 | % | | | 10.53 | | | | 9.93 | % |
Investor C | | | 14.97 | | | | 14.01 | | | | 12.15 | | | | 12.15 | | | | 9.85 | | | | 9.85 | |
Class K | | | 16.38 | | | | N/A | | | | 13.56 | | | | N/A | | | | 11.10 | | | | N/A | |
Class R | | | 15.55 | | | | N/A | | | | 12.79 | | | | N/A | | | | 10.28 | | | | N/A | |
| | | | | | |
LifePath Dynamic 2040 Fund Custom Benchmark | | | 16.00 | | | | N/A | | | | 12.86 | | | | N/A | | | | 10.85 | | | | N/A | |
Bloomberg U.S. Aggregate Bond Index | | | (1.54 | ) | | | N/A | | | | 3.57 | | | | N/A | | | | 2.90 | | | | N/A | |
Bloomberg U.S. TIPS Index (Series-L) | | | 5.96 | | | | N/A | | | | 5.34 | | | | N/A | | | | 3.09 | | | | N/A | |
FTSE EPRA Nareit Developed Index | | | 26.09 | | | | N/A | | | | 7.81 | | | | N/A | | | | 8.64 | | | | N/A | |
MSCI ACWI ex USA IMI Index | | | 8.53 | | | | N/A | | | | 9.83 | | | | N/A | | | | 7.57 | | | | N/A | |
Russell 1000® Index | | | 26.45 | | | | N/A | | | | 18.43 | | | | N/A | | | | 16.54 | | | | N/A | |
Russell 2000® Index | | | 14.82 | | | | N/A | | | | 12.02 | | | | N/A | | | | 13.23 | | | | N/A | |
| | (a) | Assuming maximum sales charges, if any. Average annual total returns with and without sales charges reflect reductions for distribution and service fees. See “About Fund Performance” for a detailed description of share classes, including any related sales charges and fees. | |
| | (b) | LifePath Dynamic 2040 Fund normally invests its assets in underlying funds according to an asset allocation strategy designed for investors expecting to retire or begin withdrawing assets around the year 2040. LifePath Dynamic 2040 Fund’s returns prior to March 31, 2018 are the returns of LifePath Dynamic 2040 Fund when its assets could be allocated to underlying funds that invest primarily in commodities. LifePath Dynamic 2040 Fund’s returns between December 14, 2015 and November 7, 2016 are the returns of LifePath Dynamic 2040 Fund when it incorporated different allocations in its glidepath and had a different investment strategy. LifePath Dynamic 2040 Fund’s returns prior to December 14, 2015 are the returns of LifePath Dynamic 2040 Fund under a different investment strategy. LifePath Dynamic 2040 Fund’s returns prior to November 28, 2014 are the returns of LifePath Dynamic 2040 Fund when it had a different target asset allocation. | |
N/A — Not applicable as the share class and index do not have a sales charge.
Past performance is not an indication of future results.
Performance results may include adjustments made for financial reporting purposes in accordance with U.S. generally accepted accounting principles.
PORTFOLIO ALLOCATION
| | | | |
| | |
| Asset Type | | Percent of Net Assets | |
| |
Equity Funds | | | 83 | % |
Fixed-Income Funds | | | 13 | |
Money Market Funds | | | 4 | |
Liabilities in Excess of Other Assets | | | (— | )(a) |
TEN LARGEST HOLDINGS
| | | | |
| | |
| Security | | Percent of Net Assets | |
| |
Diversified Equity Master Portfolio | | | 45 | % |
International Tilts Master Portfolio | | | 14 | |
BlackRock Advantage Emerging Markets Fund, Class K | | | 9 | |
iShares MSCI EAFE Small-Cap ETF | | | 5 | |
BlackRock Tactical Opportunities Fund, Class K | | | 5 | |
iShares Developed Real Estate Index Fund, Class K | | | 4 | |
Advantage CoreAlpha Bond Master Portfolio | | | 4 | |
iShares TIPS Bond ETF | | | 4 | |
iShares Core U.S. Aggregate Bond ETF | | | 3 | |
BlackRock Cash Funds: Treasury, SL Agency Shares | | | 3 | |
| (a) | Rounds to more than (1)% of net assets. |
| | |
| Fund Summary as of December 31, 2021 | | BlackRock LifePath® Dynamic 2045 Fund |
Investment Objective
The investment objective of BlackRock LifePath® Dynamic 2045 Fund (“LifePath Dynamic 2045 Fund” or the “LifePath Dynamic Fund”) is to seek to provide for retirement outcomes based on quantitatively measured risk. In pursuit of this objective, LifePath Dynamic 2045 Fund will be broadly diversified across global asset classes, with asset allocations becoming more conservative over time.
TOTAL RETURN BASED ON A $10,000 INVESTMENT
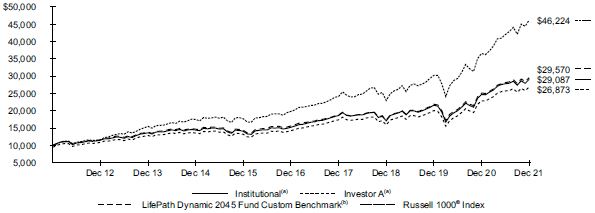
| | (a) | Assuming maximum sales charges, transaction costs and other operating expenses, including advisory fees, if any. Institutional Shares do not have a sales charge. | |
| | (b) | The LifePath Dynamic Fund compares its performance to that of a customized weighted index (the “LifePath Dynamic 2045 Fund Custom Benchmark”) comprised of the indexes indicated below, which reflects the investment adviser’s changes to the benchmark’s weightings over time. The investment adviser adjusts the weightings of these indexes periodically based upon its evaluation and adjustment of the LifePath Dynamic Fund’s asset allocation strategy. The weightings are presented annually but they are adjusted quarterly. | |
The LifePath Dynamic Fund’s custom benchmark consists of the following:
| | | | | | | | | | | | | | | | | | | | | | | | | | | | |
| Period | | Bloomberg U.S. Aggregate Bond Index(a) | | | Bloomberg U.S. Treasury Inflation Protected Securities (TIPS) Index (Series-L)(b) | | | Bloomberg Commodity Index(c) | | | FTSE EPRA Nareit Developed Index | | | MSCI ACWI ex USA IMI Index | | | Russell 1000® Index | | | Russell 2000® Index | |
| | | | | | | |
01/01/12 to 12/31/12 | | | 11.2 | % | | | N/A | | | | 1.0 | % | | | 9.2 | % | | | 25.3 | % | | | 51.0 | % | | | 2.3 | % |
01/01/13 to 12/31/13 | | | 13.5 | | | | N/A | | | | 3.9 | | | | 9.1 | | | | 24.8 | | | | 46.7 | | | | 2.0 | |
01/01/14 to 12/31/14 | | | 12.5 | | | | N/A | | | | 3.9 | | | | 10.1 | | | | 25.9 | | | | 45.6 | | | | 2.0 | |
01/01/15 to 12/31/15 | | | 1.8 | | | | 0.2 | % | | | 4.2 | | | | 13.4 | | | | 29.6 | | | | 48.8 | | | | 2.0 | |
01/01/16 to 12/31/16 | | | 2.3 | | | | 0.2 | | | | 4.3 | | | | 13.6 | | | | 29.8 | | | | 48.0 | | | | 1.8 | |
01/01/17 to 12/31/17 | | | 3.4 | | | | 0.3 | | | | 4.3 | | | | 14.4 | | | | 29.9 | | | | 46.7 | | | | 1.0 | |
01/01/18 to 12/31/18 | | | 4.0 | | | | 0.4 | | | | N/A | | | | 15.0 | | | | 30.6 | | | | 48.9 | | | | 1.1 | |
01/01/19 to 12/31/19 | | | 3.0 | | | | 1.4 | | | | N/A | | | | 4.6 | | | | 38.5 | | | | 50.5 | | | | 2.0 | |
01/01/20 to 12/31/20 | | | 4.3 | | | | 1.6 | | | | N/A | | | | 4.5 | | | | 37.6 | | | | 50.5 | | | | 1.5 | |
01/01/21 to 12/31/21 | | | 5.3 | | | | 1.9 | | | | N/A | | | | 4.5 | | | | 36.6 | | | | 50.6 | | | | 1.1 | |
| | (a) | Prior to August 24, 2021, the Bloomberg U.S. Aggregate Bond Index was known as the Bloomberg Barclays U.S. Aggregate Bond Index. | |
| | (b) | Prior to August 24, 2021, the Bloomberg U.S. Treasury Inflation Protected Securities (TIPS) Index (Series-L) was known as the Bloomberg Barclays U.S. Treasury Inflation Protected Securities (TIPS) Index (Series-L). | |
| | (c) | Prior to July 1, 2014, the Bloomberg Commodity Index was known as the Dow Jones-UBS Commodity Index. | |
| | | See “About Fund Performance” for descriptions of the indexes. | |
| | |
16 | | 2 0 2 1 BLACK ROCK ANNUAL REPORT TO SHAREHOLDERS |
| | |
| Fund Summary as of December 31, 2021 (continued) | | BlackRock LifePath® Dynamic 2045 Fund |
Performance
| | | | | | | | | | | | | | | | | | | | | | | | |
| | | Average Annual Total Returns(a)(b) | |
| | | | |
| | | |
| | | 1 Year | | | 5 Years | | | 10 Years | |
| | | | | | | | | | | | |
| | | | | | |
| | | Without Sales Charge | | | With Sales Charge | | | Without Sales Charge | | | With Sales Charge | | | Without Sales Charge | | | With Sales Charge | |
| | | | | | |
Institutional | | | 17.61 | % | | | N/A | | | | 13.79 | % | | | N/A | | | | 11.27 | % | | | N/A | |
Investor A | | | 17.33 | | | | 11.17 | % | | | 13.51 | | | | 12.29 | % | | | 10.99 | | | | 10.39 | % |
Investor C | | | 16.40 | | | | 15.40 | | | | 12.64 | | | | 12.64 | | | | 10.31 | | | | 10.31 | |
Class K | | | 17.93 | | | | N/A | | | | 14.05 | | | | N/A | | | | 11.57 | | | | N/A | |
Class R | | | 17.10 | | | | N/A | | | | 13.28 | | | | N/A | | | | 10.75 | | | | N/A | |
| | | | | | |
LifePath Dynamic 2045 Fund Custom Benchmark | | | 17.72 | | | | N/A | | | | 13.59 | | | | N/A | | | | 11.45 | | | | N/A | |
Bloomberg U.S. Aggregate Bond Index | | | (1.54 | ) | | | N/A | | | | 3.57 | | | | N/A | | | | 2.90 | | | | N/A | |
Bloomberg U.S. TIPS Index (Series-L) | | | 5.96 | | | | N/A | | | | 5.34 | | | | N/A | | | | 3.09 | | | | N/A | |
FTSE EPRA Nareit Developed Index | | | 26.09 | | | | N/A | | | | 7.81 | | | | N/A | | | | 8.64 | | | | N/A | |
MSCI ACWI ex USA IMI Index | | | 8.53 | | | | N/A | | | | 9.83 | | | | N/A | | | | 7.57 | | | | N/A | |
Russell 1000® Index | | | 26.45 | | | | N/A | | | | 18.43 | | | | N/A | | | | 16.54 | | | | N/A | |
Russell 2000® Index | | | 14.82 | | | | N/A | | | | 12.02 | | | | N/A | | | | 13.23 | | | | N/A | |
| | (a) | Assuming maximum sales charges, if any. Average annual total returns with and without sales charges reflect reductions for distribution and service fees. See “About Fund Performance” for a detailed description of share classes, including any related sales charges and fees. | |
| | (b) | LifePath Dynamic 2045 Fund normally invests its assets in underlying funds according to an asset allocation strategy designed for investors expecting to retire or begin withdrawing assets around the year 2045. Effective November 7, 2016, the LifePath Dynamic Fund changed its investment strategy to (i) incorporate a Global Tactical Asset Allocation into its glidepath, (ii) increase the flexibility of its equity allocations and (iii) diversify its fixed-income strategies. Performance for the periods shown between December 14, 2015 and November 7, 2016 is based on the prior investment strategy. Effective December 14, 2015, the LifePath Dynamic Fund changed its investment strategy to (i) incorporate a dynamic glidepath and (ii) invest directly in securities and derivatives, as well as in underlying funds. Performance for the periods shown prior to December 14, 2015 is based on the prior investment strategy. Effective November 28, 2014, the Fund changed its glide path and target asset allocation to target higher levels of equity exposure for the LifePath Dynamic Fund throughout the glide path. Performance for the periods shown prior to November 28, 2014 is based on the prior glide path and target asset allocation. | |
N/A — Not applicable as the share class and index do not have a sales charge.
Past performance is not an indication of future results.
Performance results may include adjustments made for financial reporting purposes in accordance with U.S. generally accepted accounting principles.
PORTFOLIO ALLOCATION
| | | | |
| | |
| Asset Type | | Percent of Net Assets | |
| |
Equity Funds | | | 91 | % |
Money Market Funds | | | 10 | |
Fixed-Income Funds | | | 6 | |
Liabilities in Excess of Other Assets | | | (7 | ) |
TEN LARGEST HOLDINGS
| | | | |
| | |
| Security | | Percent of Net Assets | |
| |
Diversified Equity Master Portfolio | | | 51 | % |
International Tilts Master Portfolio | | | 15 | |
BlackRock Advantage Emerging Markets Fund, Class K | | | 10 | |
BlackRock Cash Funds: Institutional, SL Agency Shares | | | 7 | |
iShares MSCI EAFE Small-Cap ETF | | | 6 | |
BlackRock Tactical Opportunities Fund, Class K | | | 5 | |
iShares Developed Real Estate Index Fund, Class K | | | 4 | |
BlackRock Cash Funds: Treasury, SL Agency Shares | | | 3 | |
iShares TIPS Bond ETF | | | 2 | |
Advantage CoreAlpha Bond Master Portfolio | | | 1 | |
| | |
| Fund Summary as of December 31, 2021 | | BlackRock LifePath® Dynamic 2050 Fund |
Investment Objective
The investment objective of BlackRock LifePath® Dynamic 2050 Fund (“LifePath Dynamic 2050 Fund” or the “LifePath Dynamic Fund”) is to seek to provide for retirement outcomes based on quantitatively measured risk. In pursuit of this objective, LifePath Dynamic 2050 Fund will be broadly diversified across global asset classes, with asset allocations becoming more conservative over time.
TOTAL RETURN BASED ON A $10,000 INVESTMENT
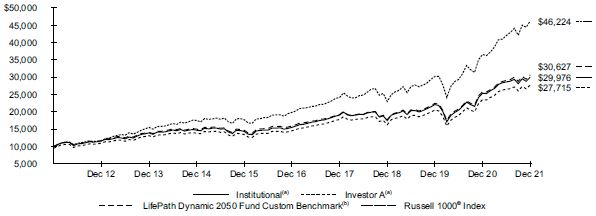
| | (a) | Assuming maximum sales charges, transaction costs and other operating expenses, including advisory fees, if any. Institutional Shares do not have a sales charge. | |
| | (b) | The LifePath Dynamic Fund compares its performance to that of a customized weighted index (the “LifePath Dynamic 2050 Fund Custom Benchmark”) comprised of the indexes indicated below, which reflects the investment adviser’s changes to the benchmark’s weightings over time. The investment adviser adjusts the weightings of these indexes periodically based upon its evaluation and adjustment of the LifePath Dynamic Fund’s asset allocation strategy. The weightings are presented annually but they are adjusted quarterly. | |
The LifePath Dynamic Fund’s custom benchmark consists of the following:
| | | | | | | | | | | | | | | | | | | | | | | | | | | | |
| Period | | Bloomberg U.S. Aggregate Bond Index(a) | | | Bloomberg U.S. Treasury Inflation Protected Securities (TIPS) Index (Series-L)(b) | | | Bloomberg Commodity Index(c) | | | FTSE EPRA Nareit Developed Index | | | MSCI ACWI ex USA IMI Index | | | Russell 1000® Index | | | Russell 2000®
Index | |
| | | | | | | |
01/01/12 to 12/31/12 | | | 5.9 | % | | | N/A | | | | 1.0 | % | | | 10.2 | % | | | 26.8 | % | | | 54.0 | % | | | 2.1 | % |
01/01/13 to 12/31/13 | | | 8.2 | | | | N/A | | | | 4.0 | | | | 10.1 | | | | 26.3 | | | | 49.6 | | | | 1.8 | |
01/01/14 to 12/31/14 | | | 8.2 | | | | N/A | | | | 3.9 | | | | 11.0 | | | | 27.3 | | | | 47.8 | | | | 1.8 | |
01/01/15 to 12/31/15 | | | 1.0 | | | | N/A | | | | 4.2 | | | | 13.7 | | | | 29.9 | | | | 49.2 | | | | 2.0 | |
01/01/16 to 12/31/16 | | | 1.0 | | | | N/A | | | | 4.4 | | | | 14.1 | | | | 30.3 | | | | 48.4 | | | | 1.8 | |
01/01/17 to 12/31/17 | | | 1.0 | | | | N/A | | | | 4.3 | | | | 15.3 | | | | 30.9 | | | | 47.5 | | | | 1.0 | |
01/01/18 to 12/31/18 | | | 1.2 | | | | N/A | | | | N/A | | | | 16.0 | | | | 31.7 | | | | 50.1 | | | | 1.0 | |
01/01/19 to 12/31/19 | | | 1.0 | | | | 0.4 | % | | | N/A | | | | 4.8 | | | | 39.9 | | | | 52.0 | | | | 1.9 | |
01/01/20 to 12/31/20 | | | 1.3 | | | | 0.5 | | | | N/A | | | | 4.7 | | | | 39.5 | | | | 52.7 | | | | 1.3 | |
01/01/21 to 12/31/21 | | | 1.6 | | | | 0.6 | | | | N/A | | | | 4.7 | | | | 38.8 | | | | 53.3 | | | | 1.0 | |
| | (a) | Prior to August 24, 2021, the Bloomberg U.S. Aggregate Bond Index was known as the Bloomberg Barclays U.S. Aggregate Bond Index. | |
| | (b) | Prior to August 24, 2021, the Bloomberg U.S. Treasury Inflation Protected Securities (TIPS) Index (Series-L) was known as the Bloomberg Barclays U.S. Treasury Inflation Protected Securities (TIPS) Index (Series-L). | |
| | (c) | Prior to July 1, 2014, the Bloomberg Commodity Index was known as the Dow Jones-UBS Commodity Index. | |
| | | See “About Fund Performance” for descriptions of the indexes. | |
| | |
18 | | 2 0 2 1 BLACK ROCK ANNUAL REPORT TO SHAREHOLDERS |
| | |
| Fund Summary as of December 31, 2021 (continued) | | BlackRock LifePath® Dynamic 2050 Fund |
Performance
| | | | | | | | | | | | | | | | | | | | | | | | |
| | | Average Annual Total Returns(a)(b) | |
| | | | |
| | | |
| | | 1 Year | | | 5 Years | | | 10 Years | |
| | | | | | | | | | | | |
| | | | | | |
| | | Without Sales Charge | | | With Sales Charge | | | Without Sales Charge | | | With Sales Charge | | | Without Sales Charge | | | With Sales Charge | |
| | | | | | |
Institutional | | | 18.15 | % | | | N/A | | | | 14.08 | % | | | N/A | | | | 11.60 | % | | | N/A | |
Investor A | | | 17.88 | | | | 11.69 | % | | | 13.79 | | | | 12.57 | % | | | 11.33 | | | | 10.73 | % |
Investor C | | | 17.00 | | | | 16.00 | | | | 12.89 | | | | 12.89 | | | | 10.64 | | | | 10.64 | |
Class K | | | 18.45 | | | | N/A | | | | 14.32 | | | | N/A | | | | 11.91 | | | | N/A | |
Class R | | | 17.65 | | | | N/A | | | | 13.55 | | | | N/A | | | | 11.09 | | | | N/A | |
| | | | | | |
LifePath Dynamic 2050 Fund Custom Benchmark | | | 18.62 | | | | N/A | | | | 13.95 | | | | N/A | | | | 11.84 | | | | N/A | |
Bloomberg U.S. Aggregate Bond Index | | | (1.54 | ) | | | N/A | | | | 3.57 | | | | N/A | | | | 2.90 | | | | N/A | |
Bloomberg U.S. TIPS Index (Series-L) | | | 5.96 | | | | N/A | | | | 5.34 | | | | N/A | | | | 3.09 | | | | N/A | |
FTSE EPRA Nareit Developed Index | | | 26.09 | | | | N/A | | | | 7.81 | | | | N/A | | | | 8.64 | | | | N/A | |
MSCI ACWI ex USA IMI Index | | | 8.53 | | | | N/A | | | | 9.83 | | | | N/A | | | | 7.57 | | | | N/A | |
Russell 1000® Index | | | 26.45 | | | | N/A | | | | 18.43 | | | | N/A | | | | 16.54 | | | | N/A | |
Russell 2000® Index | | | 14.82 | | | | N/A | | | | 12.02 | | | | N/A | | | | 13.23 | | | | N/A | |
| | (a) | Assuming maximum sales charges, if any. Average annual total returns with and without sales charges reflect reductions for distribution and service fees. See “About Fund Performance” for a detailed description of share classes, including any related sales charges and fees. | |
| | (b) | LifePath Dynamic 2050 Fund normally invests its assets in underlying funds according to an asset allocation strategy designed for investors expecting to retire or begin withdrawing assets around the year 2050. LifePath Dynamic 2050 Fund’s returns prior to March 31, 2018 are the returns of LifePath Dynamic 2050 Fund when its assets could be allocated to underlying funds that invest primarily in commodities. LifePath Dynamic 2050 Fund’s returns between December 14, 2015 and November 7, 2016 are the returns of LifePath Dynamic 2050 Fund when it incorporated different allocations in its glidepath and had a different investment strategy. LifePath Dynamic 2050 Fund’s returns prior to December 14, 2015 are the returns of LifePath Dynamic 2050 Fund under a different investment strategy. LifePath Dynamic 2050 Fund’s returns prior to November 28, 2014 are the returns of LifePath Dynamic 2050 Fund when it had a different target asset allocation. | |
N/A — Not applicable as the share class and index do not have a sales charge.
Past performance is not an indication of future results.
Performance results may include adjustments made for financial reporting purposes in accordance with U.S. generally accepted accounting principles.
PORTFOLIO ALLOCATION
| | | | |
| | |
| Asset Type | | Percent of Net Assets | |
| |
Equity Funds | | | 92 | % |
Money Market Funds | | | 6 | |
Fixed-Income Funds | | | 2 | |
Other Assets Less Liabilities | | | — | (a) |
TEN LARGEST HOLDINGS
| | | | |
| | |
| Security | | Percent of Net Assets | |
| |
Diversified Equity Master Portfolio | | | 55 | % |
International Tilts Master Portfolio | | | 15 | |
BlackRock Advantage Emerging Markets Fund, Class K | | | 11 | |
iShares MSCI EAFE Small-Cap ETF | | | 6 | |
BlackRock Cash Funds: Treasury, SL Agency Shares | | | 6 | |
iShares Developed Real Estate Index Fund, Class K | | | 5 | |
iShares Core U.S. Aggregate Bond ETF | | | 1 | |
iShares TIPS Bond ETF | | | 1 | |
Advantage CoreAlpha Bond Master Portfolio | | | — | (a) |
Master Total Return Portfolio | | | — | (a) |
| (a) | Rounds to less than 1% of net assets. |
| | |
| Fund Summary as of December 31, 2021 | | BlackRock LifePath® Dynamic 2055 Fund |
Investment Objective
The investment objective of BlackRock LifePath® Dynamic 2055 Fund (“LifePath Dynamic 2055 Fund” or the “LifePath Dynamic Fund”) is to seek to provide for retirement outcomes based on quantitatively measured risk. In pursuit of this objective, LifePath Dynamic 2055 Fund will be broadly diversified across global asset classes, with asset allocations becoming more conservative over time.
TOTAL RETURN BASED ON A $10,000 INVESTMENT
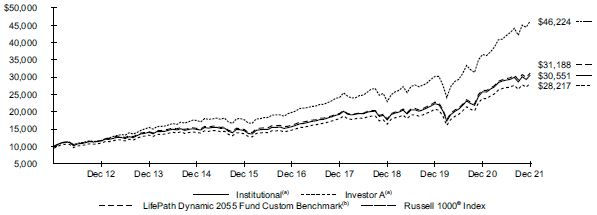
| | (a) | Assuming maximum sales charges, transaction costs and other operating expenses, including advisory fees, if any. Institutional Shares do not have a sales charge. | |
| | (b) | The LifePath Dynamic Fund compares its performance to that of a customized weighted index (the “LifePath Dynamic 2055 Fund Custom Benchmark”) comprised of the indexes indicated below, which reflects the investment adviser’s changes to the benchmark’s weightings over time. The investment adviser adjusts the weightings of these indexes periodically based upon its evaluation and adjustment of the LifePath Dynamic Fund’s asset allocation strategy. The weightings are presented annually but they are adjusted quarterly. | |
The LifePath Dynamic Fund’s custom benchmark consists of the following:
| | | | | | | | | | | | | | | | | | | | | | | | | | | | |
| Period | | Bloomberg U.S. Aggregate Bond Index(a) | | | Bloomberg U.S. Treasury Inflation Protected Securities (TIPS) Index (Series-L)(b) | | | Bloomberg Commodity Index(c) | | | FTSE EPRA Nareit Developed Index | | | MSCI ACWI ex USA IMI Index | | | Russell 1000® Index | | | Russell 2000® Index | |
| | | | | | | |
01/01/12 to 12/31/12 | | | 1.3 | % | | | N/A | | | | 1.0 | % | | | 11.3 | % | | | 28.6 | % | | | 54.5 | % | | | 3.3 | % |
01/01/13 to 12/31/13 | | | 3.1 | | | | N/A | | | | 4.1 | | | | 11.5 | | | | 27.8 | | | | 51.7 | | | | 1.8 | |
01/01/14 to 12/31/14 | | | 4.0 | | | | N/A | | | | 4.0 | | | | 12.2 | | | | 28.6 | | | | 49.4 | | | | 1.8 | |
01/01/15 to 12/31/15 | | | 1.0 | | | | N/A | | | | 4.2 | | | | 13.7 | | | | 29.9 | | | | 49.2 | | | | 2.0 | |
01/01/16 to 12/31/16 | | | 1.0 | | | | N/A | | | | 4.4 | | | | 14.1 | | | | 30.4 | | | | 48.3 | | | | 1.8 | |
01/01/17 to 12/31/17 | | | 1.0 | | | | N/A | | | | 4.3 | | | | 15.3 | | | | 30.9 | | | | 47.5 | | | | 1.0 | |
01/01/18 to 12/31/18 | | | 1.0 | | | | N/A | | | | N/A | | | | 16.1 | | | | 31.8 | | | | 50.1 | | | | 1.0 | |
01/01/19 to 12/31/19 | | | 0.8 | | | | 0.2 | % | | | N/A | | | | 4.8 | | | | 40.2 | | | | 52.0 | | | | 2.0 | |
01/01/20 to 12/31/20 | | | 0.8 | | | | 0.2 | | | | N/A | | | | 4.8 | | | | 39.9 | | | | 52.9 | | | | 1.4 | |
01/01/21 to 12/31/21 | | | 0.9 | | | | 0.2 | | | | N/A | | | | 4.8 | | | | 39.3 | | | | 53.8 | | | | 1.0 | |
| | (a) | Prior to August 24, 2021, the Bloomberg U.S. Aggregate Bond Index was known as the Bloomberg Barclays U.S. Aggregate Bond Index. | |
| | (b) | Prior to August 24, 2021, the Bloomberg U.S. Treasury Inflation Protected Securities (TIPS) Index (Series-L) was known as the Bloomberg Barclays U.S. Treasury Inflation Protected Securities (TIPS) Index (Series-L). | |
| | (c) | Prior to July 1, 2014, the Bloomberg Commodity Index was known as the Dow Jones-UBS Commodity Index. | |
| | | See “About Fund Performance” for descriptions of the indexes. | |
| | |
20 | | 2 0 2 1 BLACK ROCK ANNUAL REPORT TO SHAREHOLDERS |
| | |
| Fund Summary as of December 31, 2021 (continued) | | BlackRock LifePath® Dynamic 2055 Fund |
Performance
| | | | | | | | | | | | | | | | | | | | | | | | |
| | | Average Annual Total Returns(a)(b) | |
| | | | | | | | | | | | | | | | | | | |
| | | |
| | | 1 Year | | | 5 Years | | | 10 Years | |
| | | | | | | | | | | | | | | | | | | |
| | | | | | |
| | | Without Sales Charge | | | With Sales Charge | | | Without
Sales
Charge | | | With Sales Charge | | | Without Sales Charge | | | With Sales Charge | |
| | | | | | |
Institutional | | | 18.43 | % | | | N/A | | | | 14.19 | % | | | N/A | | | | 11.82 | % | | | N/A | |
Investor A | | | 18.13 | | | | 11.93 | % | | | 13.90 | | | | 12.67 | % | | | 11.53 | | | | 10.93 | % |
Investor C | | | 17.19 | | | | 16.19 | | | | 13.00 | | | | 13.00 | | | | 10.84 | | | | 10.84 | |
Class K | | | 18.72 | | | | N/A | | | | 14.43 | | | | N/A | | | | 12.14 | | | | N/A | |
Class R | | | 17.83 | | | | N/A | | | | 13.64 | | | | N/A | | | | 11.27 | | | | N/A | |
| | | | | | |
LifePath Dynamic 2055 Fund Custom Benchmark | | | 18.80 | | | | N/A | | | | 14.00 | | | | N/A | | | | 12.05 | | | | N/A | |
Bloomberg U.S. Aggregate Bond Index | | | (1.54 | ) | | | N/A | | | | 3.57 | | | | N/A | | | | 2.90 | | | | N/A | |
Bloomberg U.S. TIPS Index (Series-L) | | | 5.96 | | | | N/A | | | | 5.34 | | | | N/A | | | | 3.09 | | | | N/A | |
FTSE EPRA Nareit Developed Index | | | 26.09 | | | | N/A | | | | 7.81 | | | | N/A | | | | 8.64 | | | | N/A | |
MSCI ACWI ex USA IMI Index | | | 8.53 | | | | N/A | | | | 9.83 | | | | N/A | | | | 7.57 | | | | N/A | |
Russell 1000® Index | | | 26.45 | | | | N/A | | | | 18.43 | | | | N/A | | | | 16.54 | | | | N/A | |
Russell 2000® Index | | | 14.82 | | | | N/A | | | | 12.02 | | | | N/A | | | | 13.23 | | | | N/A | |
| | (a) | Assuming maximum sales charges, if any. Average annual total returns with and without sales charges reflect reductions for distribution and service fees. See “About Fund Performance” for a detailed description of share classes, including any related sales charges and fees. | |
| | (b) | LifePath Dynamic 2055 Fund normally invests its assets in underlying funds according to an asset allocation strategy designed for investors expecting to retire or begin withdrawing assets around the year 2055. Effective November 7, 2016, the LifePath Dynamic Fund changed its investment strategy to (i) incorporate a Global Tactical Asset Allocation into its glidepath, (ii) increase the flexibility of its equity allocations and (iii) diversify its fixed-income strategies. Performance for the periods shown between December 14, 2015 and November 7, 2016 is based on the prior investment strategy. Effective December 14, 2015, the LifePath Dynamic Fund changed its investment strategy to (i) incorporate a dynamic glidepath and (ii) invest directly in securities and derivatives, as well as in underlying funds. Performance for the periods shown prior to December 14, 2015 is based on the prior investment strategy. Effective November 28, 2014, the Fund changed its glide path and target asset allocation to target higher levels of equity exposure for the LifePath Dynamic Fund throughout the glide path. Performance for the periods shown prior to November 28, 2014 is based on the prior glide path and target asset allocation. | |
N/A — Not applicable as the share class and index do not have a sales charge.
Past performance is not an indication of future results.
Performance results may include adjustments made for financial reporting purposes in accordance with U.S. generally accepted accounting principles.
PORTFOLIO ALLOCATION
| | | | |
| | |
| Asset Type | | Percent of Net Assets | |
| |
Equity Funds | | | 89 | % |
Money Market Funds | | | 16 | |
Fixed-Income Funds | | | 1 | |
Liabilities in Excess of Other Assets | | | (6 | ) |
| (a) | Rounds to less than 1% of net assets. | |
TEN LARGEST HOLDINGS
| | | | |
| | |
| Security | | Percent of Net Assets | |
| |
Diversified Equity Master Portfolio | | | 53 | % |
International Tilts Master Portfolio | | | 15 | |
BlackRock Advantage Emerging Markets Fund, Class K | | | 11 | |
BlackRock Cash Funds: Treasury, SL Agency Shares | | | 9 | |
BlackRock Cash Funds: Institutional, SL Agency Shares | | | 6 | |
iShares MSCI EAFE Small-Cap ETF | | | 6 | |
iShares Developed Real Estate Index Fund, Class K | | | 5 | |
iShares Core U.S. Aggregate Bond ETF | | | — | (a) |
Advantage CoreAlpha Bond Master Portfolio | | | — | (a) |
iShares TIPS Bond ETF | | | — | (a) |
| | |
| Fund Summary as of December 31, 2021 | | BlackRock LifePath® Dynamic 2060 Fund |
Investment Objective
The investment objective of BlackRock LifePath® Dynamic 2060 Fund (“LifePath Dynamic 2060 Fund” or the “LifePath Dynamic Fund”) is to seek to provide for retirement outcomes based on quantitatively measured risk. In pursuit of this objective, LifePath Dynamic 2060 Fund will be broadly diversified across global asset classes, with asset allocations becoming more conservative over time.
TOTAL RETURN BASED ON A $10,000 INVESTMENT
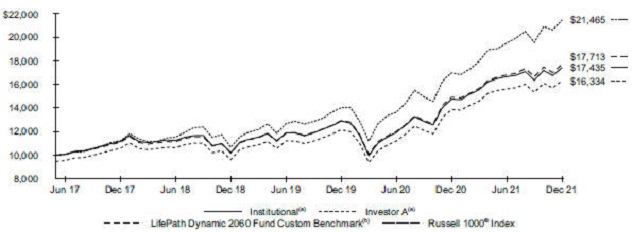
The LifePath Dynamic Fund commenced operations on May 31, 2017.
| | (a) | Assuming maximum sales charges, transaction costs and other operating expenses, including advisory fees, if any. Institutional Shares do not have a sales charge. | |
| | (b) | The LifePath Dynamic Fund compares its performance to that of a customized weighted index (the “LifePath Dynamic 2060 Fund Custom Benchmark”) comprised of the indexes indicated below, which reflects the investment adviser’s changes to the benchmark’s weightings over time. The investment adviser adjusts the weightings of these indexes periodically based upon its evaluation and adjustment of the LifePath Dynamic Fund’s asset allocation strategy. The weightings are presented annually but they are adjusted quarterly. | |
The LifePath Dynamic Fund’s custom benchmark consists of the following:
| | | | | | | | | | | | | | | | | | | | | | | | | | | | |
| Period(a) | | Bloomberg U.S. Aggregate Bond Index(b) | | | Bloomberg U.S. Treasury Inflation Protected Securities (TIPS) Index (Series-L)(c) | | | Bloomberg Commodity Index | | | FTSE EPRA Nareit Developed Index | | | MSCI ACWI ex USA IMI Index | | | Russell 1000® Index | | | Russell 2000® Index | |
| | | | | | | |
05/31/17 to 12/31/17 | | | 1.0 | % | | | N/A | | | | 4.3 | % | | | 15.3 | % | | | 30.9 | % | | | 47.5 | % | | | 1.0 | % |
01/01/18 to 12/31/18 | | | 1.0 | | | | N/A | | | | N/A | | | | 16.1 | | | | 31.8 | | | | 50.1 | | | | 1.0 | |
01/01/19 to 12/31/19 | | | 1.0 | | | | 0.1 | % | | | N/A | | | | 4.8 | | | | 40.1 | | | | 52.0 | | | | 2.0 | |
01/01/20 to 12/31/20 | | | 0.9 | | | | 0.1 | | | | N/A | | | | 4.8 | | | | 39.9 | | | | 52.9 | | | | 1.4 | |
01/01/21 to 12/31/21 | | | 0.9 | | | | 0.1 | | | | N/A | | | | 4.8 | | | | 39.3 | | | | 53.9 | | | | 1.0 | |
| | (a) | The LifePath Dynamic Fund commenced operations on May 31, 2017. | |
| | (b) | Prior to August 24, 2021, the Bloomberg U.S. Aggregate Bond Index was known as the Bloomberg Barclays U.S. Aggregate Bond Index. | |
| | (c) | Prior to August 24, 2021, the Bloomberg U.S. Treasury Inflation Protected Securities (TIPS) Index (Series-L) was known as the Bloomberg Barclays U.S. Treasury Inflation Protected Securities (TIPS) Index (Series-L). | |
See “About Fund Performance” for descriptions of the indexes.
| | |
22 | | 2 0 2 1 BLACK ROCK ANNUAL REPORT TO SHAREHOLDERS |
| | |
| Fund Summary as of December 31, 2021 (continued) | | BlackRock LifePath® Dynamic 2060 Fund |
Performance
| | | | | | | | | | | | | | | | |
| | | Average Annual Total Returns(a)(b) | |
| | | | | | | | | | | | | |
| | |
| | | 1 Year | | | Since
Inception(c) | |
| | | | | | | | | | | | | |
| | | | |
| | | Without Sales Charge | | | With Sales Charge | | | Without Sales Charge | | | With Sales Charge | |
| | | | |
Institutional | | | 18.14 | % | | | N/A | | | | 12.88 | % | | | N/A | |
Investor A | | | 17.87 | | | | 11.69 | % | | | 12.60 | | | | 11.29 | % |
Investor C | | | 16.98 | | | | 15.98 | | | | 11.71 | | | | 11.71 | |
Class K | | | 18.43 | | | | N/A | | | | 13.13 | | | | N/A | |
Class R | | | 17.63 | | | | N/A | | | | 12.38 | | | | N/A | |
| | | | |
LifePath Dynamic 2060 Fund Custom Benchmark | | | 18.79 | | | | N/A | | | | 13.28 | | | | N/A | |
Bloomberg U.S. Aggregate Bond Index | | | (1.54 | ) | | | N/A | | | | 3.37 | | | | N/A | |
Bloomberg U.S. TIPS Index (Series-L) | | | 5.96 | | | | N/A | | | | 5.42 | | | | N/A | |
FTSE EPRA Nareit Developed Index | | | 26.09 | | | | N/A | | | | 7.61 | | | | N/A | |
MSCI ACWI ex USA IMI Index | | | 8.53 | | | | N/A | | | | 7.66 | | | | N/A | |
Russell 1000® Index | | | 26.45 | | | | N/A | | | | 18.14 | | | | N/A | |
Russell 2000® Index | | | 14.82 | | | | N/A | | | | 12.82 | | | | N/A | |
| | (a) | Assuming maximum sales charges, if any. Average annual total returns with and without sales charges reflect reductions for distribution and service fees. See “About Fund Performance” for a detailed description of share classes, including any related sales charges and fees. | |
| | (b) | LifePath Dynamic 2060 Fund normally invests its assets in underlying funds according to an asset allocation strategy designed for investors planning to retire or begin withdrawing assets around the year 2060. LifePath Dynamic 2060 Fund’s returns prior to March 31, 2018 are the returns of LifePath Dynamic 2060 Fund when its assets could be allocated to underlying funds that invest primarily in commodities. | |
| | (c) | The LifePath Dynamic Fund commenced operations on May 31, 2017. | |
N/A — Not applicable as the share class and index do not have a sales charge.
Past performance is not an indication of future results.
Performance results may include adjustments made for financial reporting purposes in accordance with U.S. generally accepted accounting principles.
PORTFOLIO ALLOCATION
| | | | |
| | |
| Asset Type | | Percent of Net Assets | |
| |
Equity Funds | | | 94 | % |
Money Market Funds | | | 5 | |
Fixed-Income Funds | | | 1 | |
Liabilities in Excess of Other Assets | | | (— | )(a) |
| (a) | Rounds to more than (1)% of net assets. | |
| (b) | Rounds to less than 1% of net assets. | |
TEN LARGEST HOLDINGS
| | | | |
| | |
| Security | | Percent of Net Assets | |
| |
Diversified Equity Master Portfolio | | | 55 | % |
International Tilts Master Portfolio | | | 14 | |
BlackRock Advantage Emerging Markets Fund, Class K | | | 11 | |
iShares MSCI EAFE Small-Cap ETF | | | 6 | |
iShares Developed Real Estate Index Fund, Class K | | | 5 | |
BlackRock Cash Funds: Treasury, SL Agency Shares | | | 5 | |
iShares MSCI Canada ETF | | | 2 | |
iShares Russell 2000 ETF | | | 1 | |
iShares Core U.S. Aggregate Bond ETF | | | 1 | |
Advantage CoreAlpha Bond Master Portfolio | | | — | (b) |
| | |
| Fund Summary as of December 31, 2021 | | BlackRock LifePath® Dynamic 2065 Fund |
Investment Objective
The investment objective of BlackRock LifePath® Dynamic 2065 Fund (“LifePath Dynamic 2065 Fund” or the “LifePath Dynamic Fund”) is to seek to provide for retirement outcomes based on quantitatively measured risk. In pursuit of this objective, LifePath Dynamic 2065 Fund will be broadly diversified across global asset classes, with asset allocations becoming more conservative over time.
TOTAL RETURN BASED ON A $10,000 INVESTMENT
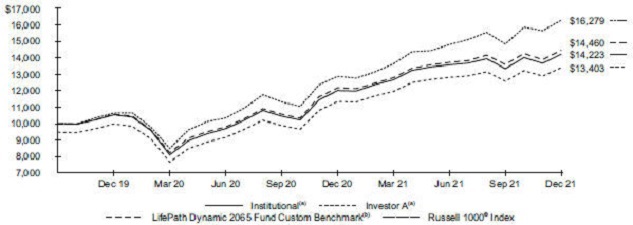
The LifePath Dynamic Fund commenced operations on October 30, 2019.
| | (a) | Assuming maximum sales charges, transaction costs and other operating expenses, including advisory fees, if any. Institutional Shares do not have a sales charge. | |
| | (b) | The LifePath Dynamic Fund compares its performance to that of a customized weighted index (the “LifePath Dynamic 2065 Fund Custom Benchmark”) comprised of the indexes indicated below, which reflects the investment adviser’s changes to the benchmark’s weightings over time. The investment adviser adjusts the weightings of these indexes periodically based upon its evaluation and adjustment of the LifePath Dynamic Fund’s asset allocation strategy. The weightings are presented annually but they are adjusted quarterly. | |
The LifePath Dynamic Fund’s custom benchmark consists of the following:
| | | | | | | | | | | | | | | | | | | | | | | | |
| Period(a) | | Bloomberg U.S. Aggregate Bond Index(b) | | | Bloomberg U.S. Treasury Inflation Protected Securities (TIPS) Index (Series-L)(c) | | | FTSE EPRA Nareit Developed Index | | | MSCI ACWI ex USA IMI Index | | | Russell 1000® Index | | | Russell 2000® Index | |
| | | | | | |
10/30/19 to 12/31/19 | | | 1.0 | % | | | 0.0 | % | | | 4.8 | % | | | 40.2 | % | | | 52.0 | % | | | 2.0 | % |
01/01/20 to 12/31/20 | | | 1.0 | | | | 0.0 | | | | 4.8 | | | | 39.9 | | | | 52.9 | | | | 1.4 | |
01/01/21 to 12/31/21 | | | 1.1 | | | | 0.0 | | | | 4.8 | | | | 39.3 | | | | 53.8 | | | | 1.0 | |
| | (a) | The LifePath Dynamic Fund commenced operations on October 30, 2019. | |
| | (b) | Prior to August 24, 2021, the Bloomberg U.S. Aggregate Bond Index was known as the Bloomberg Barclays U.S. Aggregate Bond Index. | |
| | (c) | Prior to August 24, 2021, the Bloomberg U.S. Treasury Inflation Protected Securities (TIPS) Index (Series-L) was known as the Bloomberg Barclays U.S. Treasury Inflation Protected Securities (TIPS) Index (Series-L). | |
See “About Fund Performance” for descriptions of the indexes.
| | |
24 | | 2 0 2 1 BLACK ROCK ANNUAL REPORT TO SHAREHOLDERS |
| | |
| Fund Summary as of December 31, 2021 (continued) | | BlackRock LifePath® Dynamic 2065 Fund |
Performance
| | | | | | | | | | | | | | | | |
| | | Average Annual Total Returns(a)(b) | |
| | | | | | | | | | | | | |
| | |
| | | 1 Year | | | Since
Inception(c) | |
| | | | | | | | | | | | | |
| | | | |
| | | Without Sales Charge | | | With Sales Charge | | | Without Sales Charge | | | With Sales Charge | |
| | | | |
Institutional | | | 18.43 | % | | | N/A | | | | 17.60 | % | | | N/A | |
Investor A | | | 18.13 | | | | 11.93 | % | | | 17.31 | | | | 14.43 | % |
Investor C | | | 17.30 | | | | 16.30 | | | | 16.44 | | | | 16.44 | |
Class K | | | 18.72 | | | | N/A | | | | 17.88 | | | | N/A | |
Class R | | | 17.86 | | | | N/A | | | | 17.06 | | | | N/A | |
| | | | |
LifePath Dynamic 2065 Fund Custom Benchmark | | | 18.79 | | | | N/A | | | | 18.56 | | | | N/A | |
Bloomberg U.S. Aggregate Bond Index | | | (1.54 | ) | | | N/A | | | | 2.85 | | | | N/A | |
Bloomberg U.S. TIPS Index (Series-L) | | | 5.96 | | | | N/A | | | | 8.30 | | | | N/A | |
FTSE EPRA Nareit Developed Index | | | 26.09 | | | | N/A | | | | 6.28 | | | | N/A | |
MSCI ACWI ex USA IMI Index | | | 8.53 | | | | N/A | | | | 11.78 | | | | N/A | |
Russell 1000® Index | | | 26.45 | | | | N/A | | | | 25.22 | | | | N/A | |
Russell 2000® Index | | | 14.82 | | | | N/A | | | | 19.30 | | | | N/A | |
| | (a) | Assuming maximum sales charges, if any. Average annual total returns with and without sales charges reflect reductions for distribution and service fees. See “About Fund Performance” for a detailed description of share classes, including any related sales charges and fees. | |
| | (b) | LifePath Dynamic 2065 Fund normally invests its assets in underlying funds according to an asset allocation strategy designed for investors planning to retire or begin withdrawing assets around the year 2065. | |
| | (c) | The LifePath Dynamic Fund commenced operations on October 30, 2019. | |
N/A — Not applicable as the share class and index do not have a sales charge.
Past performance is not an indication of future results.
Performance results may include adjustments made for financial reporting purposes in accordance with U.S. generally accepted accounting principles.
PORTFOLIO ALLOCATION
| | | | |
| | |
| Asset Type | | Percent of Net Assets | |
| |
Equity Funds | | | 98 | % |
Money Market Funds | | | 7 | |
Fixed-Income Funds | | | 2 | |
Liabilities in Excess of Other Assets | | | (7 | ) |
| (a) | Rounds to less than 1% of net assets. | |
TEN LARGEST HOLDINGS
| | | | |
| | |
| Security | | Percent of Net Assets | |
| |
Diversified Equity Master Portfolio | | | 56 | % |
International Tilts Master Portfolio | | | 15 | |
BlackRock Advantage Emerging Markets Fund, Class K | | | 12 | |
BlackRock Cash Funds: Treasury, SL Agency Shares | | | 7 | |
iShares MSCI EAFE Small-Cap ETF | | | 6 | |
iShares Developed Real Estate Index Fund, Class K | | | 5 | |
iShares MSCI Canada ETF | | | 3 | |
iShares Core U.S. Aggregate Bond ETF | | | 1 | |
iShares Russell 2000 ETF | | | 1 | |
Advantage CoreAlpha Bond Master Portfolio | | | — | (a) |
About Fund Performance
Institutional and Class K Shares are not subject to any sales charge. These shares bear no ongoing distribution or service fees and are available only to certain eligible investors.
Investor A Shares are subject to a maximum initial sales charge (front-end load) of 5.25% and a service fee of 0.25% per year (but no distribution fee). Certain redemptions of these shares may be subject to a contingent deferred sales charge (“CDSC”) where no initial sales charge was paid at the time of purchase. These shares are generally available through financial intermediaries.
Investor C Shares are subject to a 1.00% CDSC if redeemed within one year of purchase. In addition, these shares are subject to a distribution fee of 0.75% per year and a service fee of 0.25% per year. These shares are generally available through financial intermediaries. These shares automatically convert to Investor A Shares after approximately eight years.
Class R Shares are not subject to any sales charge. These shares are subject to a distribution fee of 0.25% per year and a service fee of 0.25% per year. These shares are available only to certain employer-sponsored retirement plans.
Past performance is not an indication of future results. Financial markets have experienced extreme volatility and trading in many instruments has been disrupted. These circumstances may continue for an extended period of time, and may continue to affect adversely the value and liquidity of the LifePath Dynamic Funds’ investments. As a result, current performance may be lower or higher than the performance data quoted. Refer to blackrock.com to obtain performance data current to the most recent month-end. Performance results do not reflect the deduction of taxes that a shareholder would pay on LifePath Dynamic Fund distributions or the redemption of LifePath Dynamic Fund shares. Figures shown in the performance tables assume reinvestment of all distributions, if any, at net asset value (“NAV”) on the ex-dividend date or payable date, as applicable. Investment return and principal value of shares will fluctuate so that shares, when redeemed, may be worth more or less than their original cost. Distributions paid to each class of shares will vary because of the different levels of service, distribution and transfer agency fees applicable to each class, which are deducted from the income available to be paid to shareholders.
BlackRock Fund Advisors (“BFA” or the “Manager”) and BlackRock Advisors, LLC (“BAL” or the “Administrator”), LifePath Dynamic Funds’ Manager and Administrator respectively, have contractually and/or voluntarily agreed to waive and/or reimburse a portion of each LifePath Dynamic Fund’s expenses. Without such waivers and/or reimbursements, each LifePath Dynamic Fund’s performance would have been lower. With respect to each LifePath Dynamic Fund’s voluntary waivers, if any, the Manager and Administrator are under no obligation to waive and/or reimburse or to continue waiving and/or reimbursing its fees and such voluntary waivers may be reduced or discontinued at any time. With respect to each LifePath Dynamic Fund’s contractual waivers, if any, the Manager and the Administrator are under no obligation to continue waiving and/or reimbursing their fees after the applicable termination date of such agreement. See the Notes to Financial Statements for additional information on waivers and/or reimbursements.
The LifePath Dynamic Funds’ custom benchmarks are hypothetical representations of the performance of the respective LifePath Dynamic Fund’s asset classes according to their weightings as of the most recent quarter-end. The weightings of the various indexes that are included in the LifePath Dynamic Funds’ custom benchmarks are adjusted quarterly to reflect the LifePath Dynamic Funds’ changing asset allocations over time. As of December 31, 2021, the following indexes are used to calculate the LifePath Dynamic Funds’ custom benchmarks: Bloomberg U.S. Aggregate Bond Index, Bloomberg U.S. Treasury Inflation Protected Securities (TIPS) Index (Series-L), FTSE EPRA Nareit Developed Index, MSCI ACWI ex USA IMI Index, Russell 1000® Index and Russell 2000® Index.
The Bloomberg U.S. Aggregate Bond Index is a broad-based flagship benchmark that measures the investment grade, U.S. dollar-denominated, fixed-rate taxable bond market. The Bloomberg U.S. Treasury Inflation Protected Securities (TIPS) Index (Series-L) is an unmanaged index that measures the performance of the inflation-protected public obligations of the U.S. Treasury. The FTSE EPRA Nareit Developed Index is a global market capitalization weighted index composed of listed real estate securities from developed market countries in North America, Europe, and Asia. The MSCI ACWI ex USA IMI Index is a free float-adjusted market capitalization weighted index that measures the equity market performance of the developed (excluding the U.S.) and emerging investable market universe. The Russell 1000® Index is an index that measures the performance of the large-cap segment of the U.S. equity universe. It is a subset of the Russell 3000® Index and includes approximately 1,000 of the largest securities based on a combination of their market capitalization and current index membership. The Index represents approximately 93% of the U.S. market. The Russell 2000® Index is an index that measures the performance of the small-cap segment of the U.S. equity universe. It is a subset of the Russell 3000® Index representing approximately 10% of the total market capitalization of that index. It includes approximately 2,000 of the smallest securities based on a combination of their market cap and current index membership.
Disclosure of Expenses
Shareholders of each LifePath Dynamic Fund may incur the following charges: (a) transactional expenses, such as sales charges; and (b) operating expenses, including investment advisory fees, administration fees, service and distribution fees, including 12b-1 fees, acquired fund fees and expenses, and other fund expenses. The expense examples shown (which are based on a hypothetical investment of $1,000 invested at the beginning of the period (or from commencement of operations if less than 6 months)
| | |
26 | | 2 0 2 1 BLACK ROCK ANNUAL REPORT TO SHAREHOLDERS |
| | |
| Disclosure of Expenses (continued) | | |
and held through the end of the period) are intended to assist shareholders both in calculating expenses based on an investment in each LifePath Dynamic Fund and in comparing these expenses with similar costs of investing in other mutual funds.
The expense examples provide information about actual account values and actual expenses. Annualized expense ratios reflect contractual and voluntary fee waivers, if any. In order to estimate the expenses a shareholder paid during the period covered by this report, shareholders can divide their account value by $1,000 and then multiply the result by the number corresponding to their LifePath Dynamic Fund and share class under the heading entitled “Expenses Paid During the Period.”
The expense examples also provide information about hypothetical account values and hypothetical expenses based on a LifePath Dynamic Fund’s actual expense ratio and an assumed rate of return of 5% per year before expenses. In order to assist shareholders in comparing the ongoing expenses of investing in these LifePath Dynamic Funds and other funds, compare the 5% hypothetical examples with the 5% hypothetical examples that appear in shareholder reports of other funds.
The expenses shown in the expense examples are intended to highlight shareholders’ ongoing costs only and do not reflect transactional expenses, such as sales charges, if any. Therefore, the hypothetical examples are useful in comparing ongoing expenses only and will not help shareholders determine the relative total expenses of owning different funds. If these transactional expenses were included, shareholder expenses would have been higher.
Expense Example
| | | | | | | | | | | | | | | | | | | | | | | | | | | | |
| | | Actual | | | Hypothetical (a) | | | | |
| | | | | | | | | | | | |
| | | | | | | |
| | | Beginning Account Value (07/01/21) | | | Ending Account Value (12/31/21) | | | Expenses Paid During the Period (b) | | | Beginning Account Value (07/01/21) | | | Ending Account Value (12/31/21) | | | Expenses Paid During the Period (b) | | | Annualized Expense Ratio | |
| | | | | | | |
LifePath Dynamic Retirement Fund | | | | | | | | | | | | | | | | | | | | | | | | | | | | |
Institutional | | | $ 1,000.00 | | | | $ 1,020.30 | | | | $ 2.70 | | | | $ 1,000.00 | | | | $ 1,022.53 | | | | $ 2.70 | | | | 0.53 | % |
Investor A | | | 1,000.00 | | | | 1,018.70 | | | | 3.97 | | | | 1,000.00 | | | | 1,021.27 | | | | 3.97 | | | | 0.78 | |
Investor C | | | 1,000.00 | | | | 1,015.00 | | | | 7.82 | | | | 1,000.00 | | | | 1,017.44 | | | | 7.83 | | | | 1.54 | |
Class K | | | 1,000.00 | | | | 1,020.90 | | | | 1.48 | | | | 1,000.00 | | | | 1,023.74 | | | | 1.48 | | | | 0.29 | |
Class R | | | 1,000.00 | | | | 1,017.20 | | | | 4.98 | | | | 1,000.00 | | | | 1,020.27 | | | | 4.99 | | | | 0.98 | |
LifePath Dynamic 2025 Fund | | | | | | | | | | | | | | | | | | | | | | | | | | | | |
Institutional | | | 1,000.00 | | | | 1,023.90 | | | | 2.75 | | | | 1,000.00 | | | | 1,022.48 | | | | 2.75 | | | | 0.54 | |
Investor A | | | 1,000.00 | | | | 1,022.80 | | | | 4.03 | | | | 1,000.00 | | | | 1,021.22 | | | | 4.02 | | | | 0.79 | |
Investor C | | | 1,000.00 | | | | 1,018.50 | | | | 7.84 | | | | 1,000.00 | | | | 1,017.44 | | | | 7.83 | | | | 1.54 | |
Class K | | | 1,000.00 | | | | 1,024.90 | | | | 1.48 | | | | 1,000.00 | | | | 1,023.74 | | | | 1.48 | | | | 0.29 | |
Class R | | | 1,000.00 | | | | 1,021.80 | | | | 5.05 | | | | 1,000.00 | | | | 1,020.21 | | | | 5.04 | | | | 0.99 | |
LifePath Dynamic 2030 Fund | | | | | | | | | | | | | | | | | | | | | | | | | | | | |
Institutional | | | 1,000.00 | | | | 1,030.90 | | | | 2.66 | | | | 1,000.00 | | | | 1,022.58 | | | | 2.65 | | | | 0.52 | |
Investor A | | | 1,000.00 | | | | 1,029.20 | | | | 3.99 | | | | 1,000.00 | | | | 1,021.27 | | | | 3.97 | | | | 0.78 | |
Investor C | | | 1,000.00 | | | | 1,025.60 | | | | 7.76 | | | | 1,000.00 | | | | 1,017.54 | | | | 7.73 | | | | 1.52 | |
Class K | | | 1,000.00 | | | | 1,032.40 | | | | 1.43 | | | | 1,000.00 | | | | 1,023.79 | | | | 1.43 | | | | 0.28 | |
Class R | | | 1,000.00 | | | | 1,028.40 | | | | 5.01 | | | | 1,000.00 | | | | 1,020.27 | | | | 4.99 | | | | 0.98 | |
LifePath Dynamic 2035 Fund | | | | | | | | | | | | | | | | | | | | | | | | | | | | |
Institutional | | | 1,000.00 | | | | 1,036.60 | | | | 2.62 | | | | 1,000.00 | | | | 1,022.63 | | | | 2.60 | | | | 0.51 | |
Investor A | | | 1,000.00 | | | | 1,035.50 | | | | 3.90 | | | | 1,000.00 | | | | 1,021.37 | | | | 3.87 | | | | 0.76 | |
Investor C | | | 1,000.00 | | | | 1,030.90 | | | | 7.73 | | | | 1,000.00 | | | | 1,017.59 | | | | 7.68 | | | | 1.51 | |
Class K | | | 1,000.00 | | | | 1,037.50 | | | | 1.34 | | | | 1,000.00 | | | | 1,023.89 | | | | 1.33 | | | | 0.26 | |
Class R | | | 1,000.00 | | | | 1,034.40 | | | | 4.92 | | | | 1,000.00 | | | | 1,020.37 | | | | 4.89 | | | | 0.96 | |
LifePath Dynamic 2040 Fund | | | | | | | | | | | | | | | | | | | | | | | | | | | | |
Institutional | | | 1,000.00 | | | | 1,042.00 | | | | 2.57 | | | | 1,000.00 | | | | 1,022.68 | | | | 2.55 | | | | 0.50 | |
Investor A | | | 1,000.00 | | | | 1,041.20 | | | | 3.86 | | | | 1,000.00 | | | | 1,021.42 | | | | 3.82 | | | | 0.75 | |
Investor C | | | 1,000.00 | | | | 1,037.10 | | | | 7.70 | | | | 1,000.00 | | | | 1,017.64 | | | | 7.63 | | | | 1.50 | |
Class K | | | 1,000.00 | | | | 1,043.40 | | | | 1.34 | | | | 1,000.00 | | | | 1,023.89 | | | | 1.33 | | | | 0.26 | |
Class R | | | 1,000.00 | | | | 1,039.90 | | | | 4.88 | | | | 1,000.00 | | | | 1,020.42 | | | | 4.84 | | | | 0.95 | |
LifePath Dynamic 2045 Fund | | | | | | | | | | | | | | | | | | | | | | | | | | | | |
Institutional | | | 1,000.00 | | | | 1,045.60 | | | | 2.53 | | | | 1,000.00 | | | | 1,022.74 | | | | 2.50 | | | | 0.49 | |
Investor A | | | 1,000.00 | | | | 1,044.00 | | | | 3.81 | | | | 1,000.00 | | | | 1,021.48 | | | | 3.77 | | | | 0.74 | |
Investor C | | | 1,000.00 | | | | 1,040.00 | | | | 7.66 | | | | 1,000.00 | | | | 1,017.69 | | | | 7.58 | | | | 1.49 | |
Class K | | | 1,000.00 | | | | 1,046.90 | | | | 1.29 | | | | 1,000.00 | | | | 1,023.95 | | | | 1.28 | | | | 0.25 | |
Class R | | | 1,000.00 | | | | 1,043.10 | | | | 4.84 | | | | 1,000.00 | | | | 1,020.47 | | | | 4.79 | | | | 0.94 | |
LifePath Dynamic 2050 Fund | | | | | | | | | | | | | | | | | | | | | | | | | | | | |
Institutional | | | 1,000.00 | | | | 1,046.60 | | | | 2.68 | | | | 1,000.00 | | | | 1,022.58 | | | | 2.65 | | | | 0.52 | |
Investor A | | | 1,000.00 | | | | 1,045.40 | | | | 3.97 | | | | 1,000.00 | | | | 1,021.32 | | | | 3.92 | | | | 0.77 | |
Investor C | | | 1,000.00 | | | | 1,041.30 | | | | 7.82 | | | | 1,000.00 | | | | 1,017.54 | | | | 7.73 | | | | 1.52 | |
Class K | | | 1,000.00 | | | | 1,048.00 | | | | 1.39 | | | | 1,000.00 | | | | 1,023.84 | | | | 1.38 | | | | 0.27 | |
Class R | | | 1,000.00 | | | | 1,044.60 | | | | 5.00 | | | | 1,000.00 | | | | 1,020.32 | | | | 4.94 | | | | 0.97 | |
LifePath Dynamic 2055 Fund | | | | | | | | | | | | | | | | | | | | | | | | | | | | |
Institutional | | | 1,000.00 | | | | 1,047.50 | | | | 2.68 | | | | 1,000.00 | | | | 1,022.58 | | | | 2.65 | | | | 0.52 | |
Investor A | | | 1,000.00 | | | | 1,046.10 | | | | 3.97 | | | | 1,000.00 | | | | 1,021.32 | | | | 3.92 | | | | 0.77 | |
Investor C | | | 1,000.00 | | | | 1,042.30 | | | | 7.82 | | | | 1,000.00 | | | | 1,017.54 | | | | 7.73 | | | | 1.52 | |
Class K | | | 1,000.00 | | | | 1,048.50 | | | | 1.39 | | | | 1,000.00 | | | | 1,023.84 | | | | 1.38 | | | | 0.27 | |
Class R | | | 1,000.00 | | | | 1,045.10 | | | | 5.00 | | | | 1,000.00 | | | | 1,020.32 | | | | 4.94 | | | | 0.97 | |
LifePath Dynamic 2060 Fund | | | | | | | | | | | | | | | | | | | | | | | | | | | | |
Institutional | | | 1,000.00 | | | | 1,046.40 | | | | 2.58 | | | | 1,000.00 | | | | 1,022.68 | | | | 2.55 | | | | 0.50 | |
Investor A | | | 1,000.00 | | | | 1,045.80 | | | | 3.87 | | | | 1,000.00 | | | | 1,021.42 | | | | 3.82 | | | | 0.75 | |
Investor C | | | 1,000.00 | | | | 1,041.10 | | | | 7.72 | | | | 1,000.00 | | | | 1,017.64 | | | | 7.63 | | | | 1.50 | |
Class K | | | 1,000.00 | | | | 1,048.70 | | | | 1.29 | | | | 1,000.00 | | | | 1,023.95 | | | | 1.28 | | | | 0.25 | |
Class R | | | 1,000.00 | | | | 1,044.60 | | | | 4.90 | | | | 1,000.00 | | | | 1,020.42 | | | | 4.84 | | | | 0.95 | |
LifePath Dynamic 2065 Fund | | | | | | | | | | | | | | | | | | | | | | | | | | | | |
Institutional | | | 1,000.00 | | | | 1,047.90 | | | | 2.58 | | | | 1,000.00 | | | | 1,022.68 | | | | 2.55 | | | | 0.50 | |
Investor A | | | 1,000.00 | | | | 1,046.40 | | | | 3.87 | | | | 1,000.00 | | | | 1,021.42 | | | | 3.82 | | | | 0.75 | |
| | |
DISCLOSURE OF EXPENSES | | 27 |
| | |
| Disclosure of Expenses (continued) | | |
| | | | | | | | | | | | | | | | | | | | | | | | | | | | |
| | | Actual | | | Hypothetical (a) | | | | |
| | | | | | | | | | | | |
| | | Beginning Account Value (07/01/21) | | | Ending Account Value (12/31/21) | | | Expenses Paid During the Period (b) | | | Beginning Account Value (07/01/21) | | | Ending Account Value (12/31/21) | | | Expenses
Paid During
the Period (b) | | | Annualized Expense Ratio | |
Investor C | | | $ 1,000.00 | | | | $ 1,042.80 | | | | $ 7.72 | | | | $ 1,000.00 | | | | $ 1,017.64 | | | | $ 7.63 | | | | 1.50 | % |
Class K | | | 1,000.00 | | | | 1,049.20 | | | | 1.29 | | | | 1,000.00 | | | | 1,023.95 | | | | 1.28 | | | | 0.25 | |
Class R | | | 1,000.00 | | | | 1,045.10 | | | | 4.90 | | | | 1,000.00 | | | | 1,020.42 | | | | 4.84 | | | | 0.95 | |
| (a) | Hypothetical 5% annual return before expenses is calculated by prorating the number of days in the most recent fiscal half year divided by 365. |
| (b) | For each class of the LifePath Dynamic Funds, expenses are equal to the annualized expense ratio for the class, multiplied by the average account value over the period, multiplied by 184/365 (to reflect the one-half year period shown). |
| | |
| 28 | | 2 0 2 1 BLACK ROCK ANNUAL REPORT TO SHAREHOLDERS |
| | |
| Derivative Financial Instruments | | |
The LifePath Dynamic Funds may invest in various derivative financial instruments. These instruments are used to obtain exposure to a security, commodity, index, market, and/or other assets without owning or taking physical custody of securities, commodities and/or other referenced assets or to manage market, equity, credit, interest rate, foreign currency exchange rate, commodity and/or other risks. Derivative financial instruments may give rise to a form of economic leverage and involve risks, including the imperfect correlation between the value of a derivative financial instrument and the underlying asset, possible default of the counterparty to the transaction or illiquidity of the instrument. The LifePath Dynamic Funds’ successful use of a derivative financial instrument depends on the investment adviser’s ability to predict pertinent market movements accurately, which cannot be assured. The use of these instruments may result in losses greater than if they had not been used, may limit the amount of appreciation a LifePath Dynamic Fund can realize on an investment and/or may result in lower distributions paid to shareholders. The LifePath Dynamic Funds’ investments in these instruments, if any, are discussed in detail in the Notes to Financial Statements.
| | |
DERIVATIVE FINANCIAL INSTRUMENTS | | 29 |
| | |
Schedule of Investments December 31, 2021 | | BlackRock LifePath® Dynamic Retirement Fund (Percentages shown are based on Net Assets) |
| | | | | | | | |
| Security | | Shares/
Investment Value | | | Value | |
|
Investment Companies(a) | |
|
Equity Funds — 42.1% | |
BlackRock Advantage Emerging Markets Fund, Class K | | | 995,477 | | | $ | 11,776,496 | |
BlackRock Tactical Opportunities Fund, Class K | | | 1,143,115 | | | | 16,072,201 | |
Diversified Equity Master Portfolio | | $ | 69,392,534 | | | | 69,392,534 | |
International Tilts Master Portfolio | | $ | 16,178,960 | | | | 16,178,960 | |
iShares Developed Real Estate Index Fund, Class K | | | 598,564 | | | | 7,152,836 | |
iShares MSCI EAFE Small-Cap ETF(b) | | | 89,072 | | | | 6,510,272 | |
| | | | | | | | |
| | |
| | | | | | | 127,083,299 | |
|
| Fixed-Income Funds — 56.6% | |
Advantage CoreAlpha Bond Master Portfolio | | $ | 55,070,280 | | | | 55,070,280 | |
iShares Core U.S. Aggregate Bond ETF | | | 412,062 | | | | 47,008,033 | |
iShares iBoxx $Investment Grade Corporate Bond ETF(b) | | | 39,978 | | | | 5,297,885 | |
iShares TIPS Bond ETF(b) | | | 186,282 | | | | 24,067,634 | |
Master Total Return Portfolio | | $ | 39,411,367 | | | | 39,411,367 | |
| | | | | | | | |
| | |
| | | | | | | 170,855,199 | |
| | | | | | | | |
| Security | | Shares | | | Value | |
| |
|
| Money Market Funds — 4.0% | |
BlackRock Cash Funds: Institutional, SL Agency Shares, 0.10%(c)(d) | | | 7,811,194 | | | | $ 7,813,537 | |
BlackRock Cash Funds: Treasury, SL Agency Shares, 0.01%(c) | | | 4,135,736 | | | | 4,135,736 | |
| | | | | | | | |
| | |
| | | | | | | 11,949,273 | |
| | | | | | | | |
Total Investments — 102.7%
(Cost: $215,443,945) | | | | 309,887,771 | |
| |
Liabilities in Excess of Other Assets — (2.7)% | | | | (8,116,260 | ) |
| | | | | | | | |
| | |
Net Assets — 100.0% | | | | | | | $ 301,771,511 | |
| | | | | | | | |
| (a) | Affiliate of the Fund. |
| (b) | All or a portion of this security is on loan. |
| (c) | Annualized 7-day yield as of period end. |
| (d) | All or a portion of this security was purchased with the cash collateral from loaned securities. |
Affiliates
Investments in issuers considered to be affiliate(s) of the LifePath Dynamic Fund during the year ended December 31, 2021 for purposes of Section 2(a)(3) of the Investment Company Act of 1940, as amended, were as follows:
| | | | | | | | | | | | | | | | | | | | | | | | | | | | | | | | | | | | | | | | | | |
| | | | | | | | | | | |
| | | Affiliated Issuer | | Value at 12/31/20 | | | Purchases at Cost | | | Proceeds from Sales | | | Net Realized Gain (Loss) | | | Change in Unrealized Appreciation (Depreciation) | | | Value at 12/31/21 | | | Shares/ Investment Value Held at 12/31/21 | | | Income | | | Capital Gain Distributions from Underlying Funds | | | | |
| | | | | | | | | | | |
| | Advantage CoreAlpha Bond Master Portfolio | | $ | 60,643,448 | | | $ | — | | | $ | (3,271,814 | )(a)(b) | | $ | 966,606 | | | $ | (3,267,960 | ) | | $ | 55,070,280 | | | $ | 55,070,280 | | | $ | 1,192,149 | | | $ | — | | | | | |
| | BlackRock Advantage Emerging Markets Fund, Class K | | | 13,468,789 | | | | 729,797 | | | | (1,870,041 | ) | | | 371,842 | | | | (923,891 | ) | | | 11,776,496 | | | | 995,477 | | | | 165,623 | | | | — | | | | | |
| | BlackRock Cash Funds: Institutional, SL Agency Shares | | | 10,334,909 | | | | — | | | | (2,517,263 | )(a) | | | (4,109 | ) | | | — | | | | 7,813,537 | | | | 7,811,194 | | | | 39,779 | (c) | | | — | | | | | |
| | BlackRock Cash Funds: Treasury, SL Agency Shares | | | 1,179,214 | | | | 2,956,522 | (a) | | | — | | | | — | | | | — | | | | 4,135,736 | | | | 4,135,736 | | | | 467 | | | | — | | | | | |
| | BlackRock Tactical Opportunities Fund, Class K | | | 16,802,575 | | | | — | | | | (830,272 | ) | | | (14,845 | ) | | | 114,743 | | | | 16,072,201 | | | | 1,143,115 | | | | — | | | | — | | | | | |
| | Diversified Equity Master Portfolio | | | 71,669,041 | | | | — | | | | (18,721,429 | )(a)(b) | | | 21,980,092 | | | | (5,535,170 | ) | | | 69,392,534 | | | $ | 69,392,534 | | | | 671,147 | | | | — | | | | | |
| | International Tilts Master Portfolio | | | 17,413,189 | | | | — | | | | (2,961,366 | )(a)(b) | | | 2,055,711 | | | | (328,574 | ) | | | 16,178,960 | | | $ | 16,178,960 | | | | 317,464 | | | | — | | | | | |
| | iShares Core U.S. Aggregate Bond ETF | | | 52,544,201 | | | | 1,828,630 | | | | (5,576,656 | ) | | | (146,985 | ) | | | (1,641,157 | ) | | | 47,008,033 | | | | 412,062 | | | | 870,718 | | | | — | | | | | |
| | iShares Developed Real Estate Index Fund, Class K | | | 7,662,142 | | | | 326,662 | | | | (2,282,364 | ) | | | (71,322 | ) | | | 1,517,718 | | | | 7,152,836 | | | | 598,564 | | | | 315,542 | | | | 11,120 | | | | | |
| | iShares iBoxx $Investment Grade Corporate Bond ETF | | | 5,416,768 | | | | 144,930 | | | | (46,606 | ) | | | 604 | | | | (217,811 | ) | | | 5,297,885 | | | | 39,978 | | | | 120,881 | | | | — | | | | | |
| | iShares MSCI EAFE Small-Cap ETF | | | 7,405,928 | | | | — | | | | (1,382,323 | ) | | | 342,781 | | | | 143,886 | | | | 6,510,272 | | | | 89,072 | | | | 199,909 | | | | — | | | | | |
| | iShares TIPS Bond ETF | | | 26,547,626 | | | | 1,452,537 | | | | (4,240,625 | ) | | | 267,880 | | | | 40,216 | | | | 24,067,634 | | | | 186,282 | | | | 1,082,200 | | | | — | | | | | |
| | Master Total Return Portfolio | | | 44,153,198 | | | | — | | | | (3,849,142 | )(a)(b) | | | 328,328 | | | | (1,221,017 | ) | | | 39,411,367 | | | $ | 39,411,367 | | | | 733,824 | | | | — | | | | | |
| | | | | | | | | | | | | | | | | | | | | | | | | | | | | | | | | | | | | | | | | | |
| | | | | | | | | | | |
| | | | | | | | | | | | | | | | $ | 26,076,583 | | | $ | (11,319,017 | ) | | $ | 309,887,771 | | | | | | | $ | 5,709,703 | | | $ | 11,120 | | | | | |
| | | | | | | | | | | | | | | | | | | | | | | | | | | | | | | | | | | | | | | | | | |
| | (a) | Represents net amount purchased (sold). | |
| | (b) | Inclusive of income and expense allocated from the Master Portfolio. | |
| | (c) | All or a portion represents securities lending income earned from the reinvestment of cash collateral from loaned securities, net of fees and collateral investment expenses, and other payments to and from borrowers of securities. | |
| | |
| 30 | | 2 0 2 1 BLACK ROCK ANNUAL REPORT TO SHAREHOLDERS |
| | |
Schedule of Investments (continued) December 31, 2021 | | BlackRock LifePath® Dynamic Retirement Fund |
Derivative Financial Instruments Outstanding as of Period End
Futures Contracts
| | | | | | | | | | | | | | | | |
| | | | | |
| Description | | Number of Contracts | | | Expiration Date | | | Notional Amount (000) | | | Value/ Unrealized Appreciation (Depreciation) | |
| | | | |
Long Contracts | | | | | | | | | | | | | | | | |
IBEX 35 Index | | | 14 | | | | 01/21/22 | | | $ | 1,378 | | | $ | 50,152 | |
TOPIX Index | | | 53 | | | | 03/10/22 | | | | 9,191 | | | | 45,767 | |
S&P/TSE 60 Index | | | 16 | | | | 03/17/22 | | | | 3,240 | | | | 55,194 | |
FTSE 100 Index | | | 33 | | | | 03/18/22 | | | | 3,275 | | | | 75,314 | |
FTSE/MIB Index | | | 9 | | | | 03/18/22 | | | | 1,391 | | | | 32,899 | |
MSCI EAFE Index | | | 35 | | | | 03/18/22 | | | | 4,063 | | | | 56,848 | |
Russell 2000 E-Mini Index | | | 96 | | | | 03/18/22 | | | | 10,765 | | | | 162,898 | |
10-Year U.S. Treasury Note | | | 61 | | | | 03/22/22 | | | | 7,950 | | | | 60,023 | |
| | | | | | | | | | | | | | | | |
| | | | |
| | | | | | | | | | | | | | | 539,095 | |
| | | | | | | | | | | | | | | | |
Short Contracts | | | | | | | | | | | | | | | | |
S&P 500 E-Mini Index | | | 13 | | | | 03/18/22 | | | | 3,093 | | | | (36,045 | ) |
S&P 500 Micro E-Mini Index | | | 255 | | | | 03/18/22 | | | | 6,067 | | | | (54,732 | ) |
Ultra U.S. Treasury Bond | | | 28 | | | | 03/22/22 | | | | 5,491 | | | | (86,476 | ) |
| | | | | | | | | | | | | | | | |
| | | | |
| | | | | | | | | | | | | | | (177,253 | ) |
| | | | | | | | | | | | | | | | |
| | | | |
| | | | | | | | | | | | | | $ | 361,842 | |
| | | | | | | | | | | | | | | | |
Forward Foreign Currency Exchange Contracts
| | | | | | | | | | | | | | | | | | | | | | | | |
| | | | | | | |
| Currency Purchased | | | | | Currency Sold | | | Counterparty | | Settlement Date | | | | | Unrealized Appreciation (Depreciation) | |
| | | | | | | | |
CAD | | | 3,504,169 | | | | | USD | | | 2,736,066 | | | Bank of America N.A. | | | 03/16/22 | | | | | $ | 33,730 | |
EUR | | | 405,000 | | | | | USD | | | 457,014 | | | Deutsche Bank AG | | | 03/16/22 | | | | | | 4,756 | |
EUR | | | 8,891,905 | | | | | USD | | | 10,094,357 | | | Deutsche Bank AG | | | 03/16/22 | | | | | | 43,944 | |
USD | | | 3,428,559 | | | | | JPY | | | 386,159,796 | | | Morgan Stanley & Co. International PLC | | | 03/16/22 | | | | | | 69,608 | |
| | | | | | | | | | | | | | | | | | | | | | | | |
| | | | | | | | |
| | | | | | | | | | | | | | | | | | | | | | | 152,038 | |
| | | | | | | | | | | | | | | | | | | | | | | | |
| | | | | | | | |
USD | | | 1,462,118 | | | | | AUD | | | 2,054,356 | | | Morgan Stanley & Co. International PLC | | | 03/16/22 | | | | | | (32,787 | ) |
USD | | | 1,486,155 | | | | | CAD | | | 1,903,368 | | | Bank of America N.A. | | | 03/16/22 | | | | | | (18,321 | ) |
USD | | | 501,773 | | | | | EUR | | | 442,000 | | | Bank of America N.A. | | | 03/16/22 | | | | | | (2,183 | ) |
| | | | | | | | | | | | | | | | | | | | | | | | |
| | | | | | | | |
| | | | | | | | | | | | | | | | | | | | | | | (53,291 | ) |
| | | | | | | | | | | | | | | | | | | | | | | | |
| | | | | | | | |
| | | | | | | | | | | | | | | | | | | | | | $ | 98,747 | |
| | | | | | | | | | | | | | | | | | | | | | | | |
| | |
SCHEDULE OF INVESTMENTS | | 31 |
| | |
Schedule of Investments (continued) December 31, 2021 | | BlackRock LifePath® Dynamic Retirement Fund |
Derivative Financial Instruments Categorized by Risk Exposure
As of period end, the fair values of derivative financial instruments located in the Statements of Assets and Liabilities were as follows:
| | | | | | | | | | | | | | | | | | | | | | | | | | | | |
| |
| | | | | | | |
| | | Commodity Contracts | | | Credit Contracts | | | Equity Contracts | | | Foreign Currency Exchange Contracts | | | Interest Rate Contracts | | | Other Contracts | | | Total | |
| |
| | | | | | | |
Assets — Derivative Financial Instruments | | | | | | | | | | | | | | | | | | | | | | | | | | | | |
Futures contracts | | | | | | | | | | | | | | | | | | | | | | | | | | | | |
Unrealized appreciation on futures contracts(a) | | $ | — | | | $ | — | | | $ | 479,072 | | | $ | — | | | $ | 60,023 | | | $ | — | | | $ | 539,095 | |
Forward foreign currency exchange contracts | | | | | | | | | | | | | | | | | | | | | | | | | | | | |
Unrealized appreciation on forward foreign currency exchange contracts | | | — | | | | — | | | | — | | | | 152,038 | | | | — | | | | — | | | | 152,038 | |
| | | | | | | | | | | | | | | | | | | | | | | | | | | | |
| | | | | | | |
| | $ | — | | | $ | — | | | $ | 479,072 | | | $ | 152,038 | | | $ | 60,023 | | | $ | — | | | $ | 691,133 | |
| | | | | | | | | | | | | | | | | | | | | | | | | | | | |
| | | | | | | |
Liabilities — Derivative Financial Instruments | | | | | | | | | | | | | | | | | | | | | | | | | | | | |
Futures contracts | | | | | | | | | | | | | | | | | | | | | | | | | | | | |
Unrealized depreciation on futures contracts(a) | | $ | — | | | $ | — | | | $ | 90,777 | | | $ | — | | | $ | 86,476 | | | $ | — | | | $ | 177,253 | |
Forward foreign currency exchange contracts | | | | | | | | | | | | | | | | | | | | | | | | | | | | |
Unrealized depreciation on forward foreign currency exchange contracts | | | — | | | | — | | | | — | | | | 53,291 | | | | — | | | | — | | | | 53,291 | |
| | | | | | | | | | | | | | | | | | | | | | | | | | | | |
| | | | | | | |
| | $ | — | | | $ | — | | | $ | 90,777 | | | $ | 53,291 | | | $ | 86,476 | | | $ | — | | | $ | 230,544 | |
| | | | | | | | | | | | | | | | | | | | | | | | | | | | |
| | (a) | Net cumulative unrealized appreciation (depreciation) on futures contracts and centrally cleared swaps, if any, are reported in the Schedule of Investments. In the Statements of Assets and Liabilities, only current day’s variation margin is reported in receivables or payables and the net cumulative unrealized appreciation (depreciation) is included in accumulated earnings (loss). | |
For the period ended December 31, 2021, the effect of derivative financial instruments in the Statements of Operations was as follows:
| | | | | | | | | | | | | | | | | | | | | | | | | | | | |
| |
| | | | | | | |
| | | Commodity Contracts | | | Credit Contracts | | | Equity Contracts | | | Foreign Currency Exchange Contracts | | | Interest Rate Contracts | | | Other Contracts | | | Total | |
| |
| | | | | | | |
Net Realized Gain (Loss) from: | | | | | | | | | | | | | | | | | | | | | | | | | | | | |
Futures contracts | | $ | — | | | $ | — | | | $ | 3,665,103 | | | $ | — | | | $ | (359,968 | ) | | $ | — | | | $ | 3,305,135 | |
Forward foreign currency exchange contracts | | | — | | | | — | | | | — | | | | (767,732 | ) | | | — | | | | — | | | | (767,732 | ) |
| | | | | | | | | | | | | | | | | | | | | | | | | | | | |
| | | | | | | |
| | $ | — | | | $ | — | | | $ | 3,665,103 | | | $ | (767,732 | ) | | $ | (359,968 | ) | | $ | — | | | $ | 2,537,403 | |
| | | | | | | | | | | | | | | | | | | | | | | | | | | | |
| | | | | | | |
Net Change in Unrealized Appreciation (Depreciation) on: | | | | | | | | | | | | | | | | | | | | | | | | | | | | |
Futures contracts | | $ | — | | | $ | — | | | $ | (57,874 | ) | | $ | — | | | $ | (117,262 | ) | | $ | — | | | $ | (175,136 | ) |
Forward foreign currency exchange contracts | | | — | | | | — | | | | — | | | | (138,959 | ) | | | — | | | | — | | | | (138,959 | ) |
| | | | | | | | | | | | | | | | | | | | | | | | | | | | |
| | | | | | | |
| | $ | — | | | $ | — | | | $ | (57,874 | ) | | $ | (138,959 | ) | | $ | (117,262 | ) | | $ | — | | | $ | (314,095 | ) |
| | | | | | | | | | | | | | | | | | | | | | | | | | | | |
Average Quarterly Balances of Outstanding Derivative Financial Instruments
| | | | |
| |
| |
Futures contracts: | | | | |
Average notional value of contracts — long | | $ | 45,966,664 | |
Average notional value of contracts — short | | $ | 21,043,943 | |
Forward foreign currency exchange contracts: | | | | |
Average amounts purchased — in USD | | $ | 6,739,668 | |
Average amounts sold — in USD | | $ | 19,893,143 | |
| |
For more information about the LifePath Dynamic Fund’s investment risks regarding derivative financial instruments, refer to the Notes to Financial Statements.
| | |
| 32 | | 2 0 2 1 BLACK ROCK ANNUAL REPORT TO SHAREHOLDERS |
| | |
Schedule of Investments (continued) December 31, 2021 | | BlackRock LifePath® Dynamic Retirement Fund |
Derivative Financial Instruments — Offsetting as of Period End
The LifePath Dynamic Fund’s derivative assets and liabilities (by type) were as follows:
| | | | | | | | |
| | | |
| | | Assets | | | Liabilities | |
| | |
Derivative Financial Instruments | | | | | | | | |
Futures contracts | | $ | 33,301 | | | $ | 94,513 | |
Forward foreign currency exchange contracts | | | 152,038 | | | | 53,291 | |
| | | | | | | | |
| | |
Total derivative assets and liabilities in the Statements of Assets and Liabilities | | | 185,339 | | | | 147,804 | |
| | | | | | | | |
| | |
Derivatives not subject to a Master Netting Agreement or similar agreement (“MNA”) | | | (33,301 | ) | | | (94,513 | ) |
| | | | | | | | |
| | |
Total derivative assets and liabilities subject to an MNA | | $ | 152,038 | | | $ | 53,291 | |
| | | | | | | | |
The following table presents the LifePath Dynamic Fund’s derivative assets and liabilities by counterparty net of amounts available for offset under an MNA and net of the related collateral received (and pledged) by the LifePath Dynamic Fund:
| | | | | | | | | | | | | | | | | | | | |
| | | | | | |
| Counterparty | |
| Derivative
Assets Subject to an MNA by Counterparty |
| |
| Derivatives
Available for Offset |
(a) | |
| Non-Cash
Collateral Received |
| |
| Cash
Collateral Received |
| |
| Net Amount
of Derivative Assets |
(b)(c) |
| | | | | |
Bank of America N.A. | | $ | 33,730 | | | $ | (20,504 | ) | | $ | — | | | $ | — | | | $ | 13,226 | |
Deutsche Bank AG | | | 48,700 | | | | — | | | | — | | | | — | | | | 48,700 | |
Morgan Stanley & Co. International PLC | | | 69,608 | | | | (32,787 | ) | | | — | | | | — | | | | 36,821 | |
| | | | | | | | | | | | | | | | | | | | |
| | | | | |
| | $ | 152,038 | | | $ | (53,291 | ) | | $ | — | | | $ | — | | | $ | 98,747 | |
| | | | | | | | | | | | | | | | | | | | |
| | | | | | | | | | | | | | | | | | | | |
| | | | | | | | | | | | | | | | | | | | |
| | | | | | |
| Counterparty | |
| Derivative
Liabilities Subject to an MNA by Counterparty |
| |
| Derivatives
Available for Offset |
(a) | |
| Non-Cash
Collateral Pledged |
| |
| Cash
Collateral
Pledged |
| |
| Net Amount
of Derivative Liabilities |
|
| | | | | |
Bank of America N.A. | | $ | 20,504 | | | $ | (20,504 | ) | | $ | — | | | $ | — | | | $ | — | |
Morgan Stanley & Co. International PLC | | | 32,787 | | | | (32,787 | ) | | | — | | | | — | | | | — | |
| | | | | | | | | | | | | | | | | | | | |
| | | | | |
| | $ | 53,291 | | | $ | (53,291 | ) | | $ | — | | | $ | — | | | $ | — | |
| | | | | | | | | | | | | | | | | | | | |
| | (a) | The amount of derivatives available for offset is limited to the amount of derivative asset and/or liabilities that are subject to an MNA. | |
| | (b) | Net amount may also include forward foreign currency exchange contracts that are not required to be collateralized. | |
| | (c) | Net amount represents the net amount receivable from the counterparty in the event of default. | |
Fair Value Hierarchy as of Period End
Various inputs are used in determining the fair value of financial instruments. For a description of the input levels and information about the LifePath Dynamic Fund’s policy regarding valuation of financial instruments, refer to the Notes to Financial Statements.
The following table summarizes the LifePath Dynamic Fund’s financial instruments categorized in the fair value hierarchy. The breakdown of the LifePath Dynamic Fund’s financial instruments into major categories is disclosed in the Schedule of Investments above.
| | | | | | | | | | | | | | | | |
| |
| | | | |
| | | Level 1 | | | Level 2 | | | Level 3 | | | Total | |
| |
| | | | |
Assets | | | | | | | | | | | | | | | | |
Investments | | | | | | | | | | | | | | | | |
Investment Companies | | | | | | | | | | | | | | | | |
Equity Funds | | $ | 41,511,805 | | | $ | — | | | $ | — | | | $ | 41,511,805 | |
Fixed-Income Funds | | | 76,373,552 | | | | — | | | | — | | | | 76,373,552 | |
Money Market Funds | | | 11,949,273 | | | | — | | | | — | | | | 11,949,273 | |
| | | | | | | | | | | | | | | | |
| | | | |
| | $ | 129,834,630 | | | $ | — | | | $ | — | | | | 129,834,630 | |
| | | | | | | | | | | | | | | | |
| | | | |
Investments Valued at NAV(a) | | | | | | | | | | | | | | | 180,053,141 | |
| | | | | | | | | | | | | | | | |
| | | | |
| | | | | | | | | | | | | | $ | 309,887,771 | |
| | | | | | | | | | | | | | | | |
Derivative Financial Instruments(b) | | | | | | | | | | | | | | | | |
Assets | | | | | | | | | | | | | | | | |
Equity Contracts | | $ | 274,940 | | | $ | 204,132 | | | $ | — | | | $ | 479,072 | |
| | |
SCHEDULE OF INVESTMENTS | | 33 |
| | |
Schedule of Investments (continued) December 31, 2021 | | BlackRock LifePath® Dynamic Retirement Fund |
Fair Value Hierarchy as of Period End (continued)
| | | | | | | | | | | | | | | | |
| |
| | | | |
| | | Level 1 | | | Level 2 | | | Level 3 | | | Total | |
| |
| | | | |
Assets (continued) | | | | | | | | | | | | | | | | |
Foreign Currency Exchange Contracts | | $ | — | | | $ | 152,038 | | | $ | — | | | $ | 152,038 | |
Interest Rate Contracts | | | 60,023 | | | | — | | | | — | | | | 60,023 | |
Liabilities | | | | | | | | | | | | | | | | |
Equity Contracts | | | (90,777 | ) | | | — | | | | — | | | | (90,777 | ) |
Foreign Currency Exchange Contracts | | | — | | | | (53,291 | ) | | | — | | | | (53,291 | ) |
Interest Rate Contracts | | | (86,476 | ) | | | — | | | | — | | | | (86,476 | ) |
| | | | | | | | | | | | | | | | |
| | | | |
| | $ | 157,710 | | | $ | 302,879 | | | $ | — | | | $ | 460,589 | |
| | | | | | | | | | | | | | | | |
| | (a) | Certain investments of the Fund were fair valued using NAV per share or its equivalent as no quoted market value is available and therefore have been excluded from the fair value hierarchy. | |
| | (b) | Derivative financial instruments are futures contracts and forward foreign currency exchange contracts. Futures contracts and forward foreign currency exchange contracts are valued at the unrealized appreciation (depreciation) on the instrument. | |
See notes to financial statements.
| | |
| 34 | | 2 0 2 1 BLACK ROCK ANNUAL REPORT TO SHAREHOLDERS |
| | |
Schedule of Investments December 31, 2021 | | BlackRock LifePath® Dynamic 2025 Fund (Percentages shown are based on Net Assets) |
| | | | | | | | |
| Security | | Shares/ Investment Value | | | Value | |
|
Investment Companies(a) | |
| |
| Equity Funds — 51.0% | | | | |
BlackRock Advantage Emerging Markets Fund, Class K | | | 504,036 | | | $ | 5,962,749 | |
BlackRock Tactical Opportunities Fund, Class K | | | 424,574 | | | | 5,969,512 | |
Diversified Equity Master Portfolio | | $ | 33,067,999 | | | | 33,067,999 | |
International Tilts Master Portfolio | | $ | 9,029,397 | | | | 9,029,397 | |
iShares Developed Real Estate Index Fund, Class K | | | 227,941 | | | | 2,723,889 | |
iShares MSCI EAFE Small-Cap ETF(b) | | | 47,862 | | | | 3,498,234 | |
| | | | | | | | |
| | |
| | | | | | | 60,251,780 | |
| |
| Fixed-Income Funds — 44.9% | | | | |
Advantage CoreAlpha Bond Master Portfolio | | $ | 16,890,299 | | | | 16,890,298 | |
iShares Core U.S. Aggregate Bond ETF(b) | | | 126,828 | | | | 14,468,538 | |
iShares iBoxx $Investment Grade Corporate Bond ETF(b) | | | 10,259 | | | | 1,359,523 | |
iShares TIPS Bond ETF(b) | | | 67,059 | | | | 8,664,023 | |
Master Total Return Portfolio | | $ | 11,677,402 | | | | 11,677,402 | |
| | | | | | | | |
| | |
| | | | | | | 53,059,784 | |
| | | | | | | | |
| Security | | Shares | | | Value | |
| |
| |
| Money Market Funds — 8.2% | | | | |
BlackRock Cash Funds: Institutional, SL Agency Shares, 0.10%(c)(d) | | | 5,470,929 | | | $ | 5,472,571 | |
BlackRock Cash Funds: Treasury, SL Agency Shares, 0.01%(c) | | | 4,272,517 | | | | 4,272,517 | |
| | | | | | | | |
| | |
| | | | | | | 9,745,088 | |
| | | | | | | | |
| |
Total Investments — 104.1%
(Cost: $111,395,675) | | | | 123,056,652 | |
| |
Liabilities in Excess of Other Assets — (4.1)% | | | | (4,833,084 | ) |
| | | | | | | | |
| |
Net Assets — 100.0% | | | $ | 118,223,568 | |
| | | | | | | | |
| (a) | Affiliate of the Fund. |
| (b) | All or a portion of this security is on loan. |
| (c) | Annualized 7-day yield as of period end. |
| (d) | All or a portion of this security was purchased with the cash collateral from loaned securities. |
Affiliates
Investments in issuers considered to be affiliate(s) of the LifePath Dynamic Fund during the year ended December 31, 2021 for purposes of Section 2(a)(3) of the Investment Company Act of 1940, as amended, were as follows:
| | | | | | | | | | | | | | | | | | | | | | | | | | | | | | | | | | | | | | | | |
| | | | | |
| | | | | | | | | | | |
| | | Affiliated Issuer | | Value at 12/31/20 | | | Purchases at Cost | | | Proceeds from Sales | | | Net Realized Gain (Loss) | | | Change in Unrealized Appreciation (Depreciation) | | | Value at
12/31/21 | | | Shares/ Investment Value Held at 12/31/21 | | | Income | | | Capital Gain Distributions from Underlying Funds | | | |
| | | | | |
| | Advantage CoreAlpha Bond Master Portfolio | | $ | 14,328,474 | | | $ | 3,159,358 | (a)(b) | | $ | — | | | $ | (16,179 | ) | | $ | (581,355 | ) | | $ | 16,890,298 | | | $ | 16,890,298 | | | $ | 329,198 | | | $ | — | | | |
| | BlackRock Advantage Emerging Markets Fund, Class K | | | 5,603,740 | | | | 977,798 | | | | (278,281 | ) | | | (16,040 | ) | | | (324,468 | ) | | | 5,962,749 | | | | 504,036 | | | | 82,393 | | | | — | | | |
| | BlackRock Cash Funds: Institutional, SL Agency Shares | | | 3,373,808 | | | | 2,101,053 | (a) | | | — | | | | (2,290 | ) | | | — | | | | 5,472,571 | | | | 5,470,929 | | | | 13,454 | (c) | | | — | | | |
| | BlackRock Cash Funds: Treasury, SL Agency Shares | | | 2,042,706 | | | | 2,229,811 | (a) | | | — | | | | — | | | | — | | | | 4,272,517 | | | | 4,272,517 | | | | 404 | | | | — | | | |
| | BlackRock Tactical Opportunities Fund, Class K | | | 5,176,584 | | | | 748,048 | | | | — | | | | — | | | | 44,880 | | | | 5,969,512 | | | | 424,574 | | | | — | | | | — | | | |
| | Diversified Equity Master Portfolio | | | 27,839,641 | | | | — | | | | (2,041,643 | )(a)(b) | | | 7,809,173 | | | | (539,172 | ) | | | 33,067,999 | | | $ | 33,067,999 | | | | 301,468 | | | | — | | | |
| | International Tilts Master Portfolio | | | 7,644,872 | | | | 530,314 | (a)(b) | | | — | | | | 842,203 | | | | 12,008 | | | | 9,029,397 | | | $ | 9,029,397 | | | | 157,345 | | | | — | | | |
| | iShares Core U.S. Aggregate Bond ETF | | | 12,277,341 | | | | 3,073,142 | | | | (436,252 | ) | | | (14,251 | ) | | | (431,442 | ) | | | 14,468,538 | | | | 126,828 | | | | 245,246 | | | | — | | | |
| | iShares Developed Real Estate Index Fund, Class K | | | 2,339,931 | | | | 359,291 | | | | (483,826 | ) | | | 5,973 | | | | 502,520 | | | | 2,723,889 | | | | 227,941 | | | | 115,389 | | | | 4,235 | | | |
| | iShares iBoxx $ Investment Grade Corporate Bond ETF | | | 1,083,077 | | | | 313,040 | | | | — | | | | — | | | | (36,594 | ) | | | 1,359,523 | | | | 10,259 | | | | 29,947 | | | | — | | | |
| | iShares MSCI EAFE Small-Cap ETF | | | 3,271,368 | | | | — | | | | — | | | | — | | | | 226,866 | | | | 3,498,234 | | | | 47,862 | | | | 103,528 | | | | — | | | |
| | iShares TIPS Bond ETF | | | 7,430,889 | | | | 2,236,567 | | | | (1,120,403 | ) | | | 1,282 | | | | 115,688 | | | | 8,664,023 | | | | 67,059 | | | | 374,588 | | | | — | | | |
| | Master Total Return Portfolio | | | 10,291,413 | | | | 1,614,166 | (a)(b) | | | — | | | | 98,079 | | | | (326,256 | ) | | | 11,677,402 | | | $ | 11,677,402 | | | | 214,314 | | | | — | | | |
| | | | | | | | | | | | | | | | | | | | | | | | | | | | | | | | | | | | | | | | |
| | | | | | | | | | | |
| | | | | | | | | | | | | | | | $ | 8,707,950 | | | $ | (1,337,325 | ) | | $ | 123,056,652 | | | | | | | $ | 1,967,274 | | | $ | 4,235 | | | |
| | | | | | | | | | | | | | | | | | | | | | | | | | | | | | | | | | | | | | | | |
| | (a) | Represents net amount purchased (sold). | |
| | (b) | Inclusive of income and expense allocated from the Master Portfolio. | |
| | (c) | All or a portion represents securities lending income earned from the reinvestment of cash collateral from loaned securities, net of fees and collateral investment expenses, and other payments to and from borrowers of securities. | |
| | |
SCHEDULE OF INVESTMENTS | | 35 |
| | |
Schedule of Investments (continued) December 31, 2021 | | BlackRock LifePath® Dynamic 2025 Fund |
Derivative Financial Instruments Outstanding as of Period End
Futures Contracts
| | | | | | | | | | | | | | | | |
| | | | | |
| Description | | Number of Contracts | | | Expiration Date | | | Notional
Amount (000) | | | Value/ Unrealized Appreciation (Depreciation) | |
| | | | |
Long Contracts | | | | | | | | | | | | | | | | |
IBEX 35 Index | | | 5 | | | | 01/21/22 | | | $ | 492 | | | $ | 15,672 | |
TOPIX Index | | | 20 | | | | 03/10/22 | | | | 3,468 | | | | 14,337 | |
S&P/TSE 60 Index | | | 8 | | | | 03/17/22 | | | | 1,620 | | | | 27,597 | |
FTSE 100 Index | | | 12 | | | | 03/18/22 | | | | 1,191 | | | | 27,382 | |
FTSE/MIB Index | | | 3 | | | | 03/18/22 | | | | 464 | | | | 11,564 | |
MSCI EAFE Index | | | 6 | | | | 03/18/22 | | | | 697 | | | | 9,745 | |
Russell 2000 E-Mini Index | | | 32 | | | | 03/18/22 | | | | 3,588 | | | | 54,299 | |
10-Year U.S. Treasury Note | | | 47 | | | | 03/22/22 | | | | 6,125 | | | | 46,247 | |
| | | | | | | | | | | | | | | | |
| | | | |
| | | | | | | | | | | | | | | 206,843 | |
| | | | | | | | | | | | | | | | |
Short Contracts | | | | | | | | | | | | | | | | |
S&P 500 E-Mini Index | | | 5 | | | | 03/18/22 | | | | 1,190 | | | | (14,188 | ) |
S&P 500 Micro E-Mini Index | | | 107 | | | | 03/18/22 | | | | 2,546 | | | | (15,921 | ) |
Ultra U.S. Treasury Bond | | | 11 | | | | 03/22/22 | | | | 2,157 | | | | (30,286 | ) |
| | | | | | | | | | | | | | | | |
| | | | |
| | | | | | | | | | | | | | | (60,395 | ) |
| | | | | | | | | | | | | | | | |
| | | | |
| | | | | | | | | | | | | | $ | 146,448 | |
| | | | | | | | | | | | | | | | |
Forward Foreign Currency Exchange Contracts
| | | | | | | | | | | | | | | | | | | | | | | | |
| | | | | | | |
| Currency Purchased | | | | | Currency Sold | | | Counterparty | | Settlement Date | | | | | Unrealized Appreciation (Depreciation) | |
| | | | | | | | |
CAD | | | 1,744,518 | | | | | USD | | | 1,362,125 | | | Bank of America N.A. | | | 03/16/22 | | | | | $ | 16,792 | |
CAD | | | 886,000 | | | | | USD | | | 690,941 | | | Morgan Stanley & Co. International PLC | | | 03/16/22 | | | | | | 9,379 | |
EUR | | | 3,422,419 | | | | | USD | | | 3,885,162 | | | Morgan Stanley & Co. International PLC | | | 03/16/22 | | | | | | 16,984 | |
USD | | | 16,692 | | | | | JPY | | | 1,880,000 | | | Morgan Stanley & Co. International PLC | | | 03/16/22 | | | | | | 340 | |
USD | | | 1,275,668 | | | | | JPY | | | 143,672,618 | | | Morgan Stanley & Co. International PLC | | | 03/16/22 | | | | | | 25,955 | |
| | | | | | | | | | | | | | | | | | | | | | | | |
| | | | | | | | |
| | | | | | | | | | | | | | | | | | | | | | | 69,450 | |
| | | | | | | | | | | | | | | | | | | | | | | | |
| | | | | | | | |
CAD | | | 159,000 | | | | | USD | | | 125,782 | | | Bank of America N.A. | | | 03/16/22 | | | | | | (104 | ) |
USD | | | 539,689 | | | | | AUD | | | 758,389 | | | Bank of America N.A. | | | 03/16/22 | | | | | | (12,173 | ) |
USD | | | 1,276,465 | | | | | CAD | | | 1,634,810 | | | Bank of America N.A. | | | 03/16/22 | | | | | | (15,736 | ) |
USD | | | 188,449 | | | | | EUR | | | 166,000 | | | Bank of America N.A. | | | 03/16/22 | | | | | | (820 | ) |
| | | | | | | | | | | | | | | | | | | | | | | | |
| | | | | | | | |
| | | | | | | | | | | | | | | | | | | | | | | (28,833 | ) |
| | | | | | | | | | | | | | | | | | | | | | | | |
| | | | | | | | |
| | | | | | | | | | | | | | | | | | | | | | $ | 40,617 | |
| | | | | | | | | | | | | | | | | | | | | | | | |
| | |
| 36 | | 2 0 2 1 BLACK ROCK ANNUAL REPORT TO SHAREHOLDERS |
| | |
Schedule of Investments (continued) December 31, 2021 | | BlackRock LifePath® Dynamic 2025 Fund |
Derivative Financial Instruments Categorized by Risk Exposure
As of period end, the fair values of derivative financial instruments located in the Statements of Assets and Liabilities were as follows:
| | | | | | | | | | | | | | | | | | | | | | | | | | | | |
| | | | | | | | |
| | | Commodity Contracts | | | Credit Contracts | | | Equity
Contracts | | | Foreign Currency Exchange Contracts | | | Interest Rate Contracts | | | Other Contracts | | | Total | |
| | | | | | | |
Assets — Derivative Financial Instruments | | | | | | | | | | | | | | | | | | | | | | | | | | | | |
Futures contracts | | | | | | | | | | | | | | | | | | | | | | | | | | | | |
Unrealized appreciation on futures contracts(a) | | $ | — | | | $ | — | | | $ | 160,596 | | | $ | — | | | $ | 46,247 | | | $ | — | | | $ | 206,843 | |
Forward foreign currency exchange contracts | | | | | | | | | | | | | | | | | | | | | | | | | | | | |
Unrealized appreciation on forward foreign currency exchange contracts | | | — | | | | — | | | | — | | | | 69,450 | | | | — | | | | — | | | | 69,450 | |
| | | | | | | | | | | | | | | | | | | | | | | | | | | | |
| | | | | | | |
| | $ | — | | | $ | — | | | $ | 160,596 | | | $ | 69,450 | | | $ | 46,247 | | | $ | — | | | $ | 276,293 | |
| | | | | | | | | | | | | | | | | | | | | | | | | | | | |
Liabilities — Derivative Financial Instruments | | | | | | | | | | | | | | | | | | | | | | | | | | | | |
Futures contracts | | | | | | | | | | | | | | | | | | | | | | | | | | | | |
Unrealized depreciation on futures contracts(a) | | $ | — | | | $ | — | | | $ | 30,109 | | | $ | — | | | $ | 30,286 | | | $ | — | | | $ | 60,395 | |
Forward foreign currency exchange contracts | | | | | | | | | | | | | | | | | | | | | | | | | | | | |
Unrealized depreciation on forward foreign currency exchange contracts | | | — | | | | — | | | | — | | | | 28,833 | | | | — | | | | — | | | | 28,833 | |
| | | | | | | | | | | | | | | | | | | | | | | | | | | | |
| | | | | | | |
| | $ | — | | | $ | — | | | $ | 30,109 | | | $ | 28,833 | | | $ | 30,286 | | | $ | — | | | $ | 89,228 | |
| | | | | | | | | | | | | | | | | | | | | | | | | | | | |
| | (a) | Net cumulative unrealized appreciation (depreciation) on futures contracts and centrally cleared swaps, if any, are reported in the Schedule of Investments. In the Statements of Assets and Liabilities, only current day’s variation margin is reported in receivables or payables and the net cumulative unrealized appreciation (depreciation) is included in accumulated earnings (loss). | |
For the period ended December 31, 2021, the effect of derivative financial instruments in the Statements of Operations was as follows:
| | | | | | | | | | | | | | | | | | | | | | | | | | | | |
| | | | | | | | |
| | | Commodity Contracts | | | Credit Contracts | | | Equity Contracts | | | Foreign Currency Exchange Contracts | | | Interest Rate Contracts | | | Other Contracts | | | Total | |
| | | | | | | |
Net Realized Gain (Loss) from: | | | | | | | | | | | | | | | | | | | | | | | | | | | | |
Futures contracts | | $ | — | | | $ | — | | | $ | 1,176,444 | | | $ | — | | | $ | (212,521 | ) | | $ | — | | | $ | 963,923 | |
Forward foreign currency exchange contracts | | | — | | | | — | | | | — | | | | (292,271 | ) | | | — | | | | — | | | | (292,271 | ) |
| | | | | | | | | | | | | | | | | | | | | | | | | | | | |
| | | | | | | |
| | $ | — | | | $ | — | | | $ | 1,176,444 | | | $ | (292,271 | ) | | $ | (212,521 | ) | | $ | — | | | $ | 671,652 | |
| | | | | | | | | | | | | | | | | | | | | | | | | | | | |
Net Change in Unrealized Appreciation (Depreciation) on: | | | | | | | | | | | | | | | | | | | | | | | | | | | | |
Futures contracts | | $ | — | | | $ | — | | | $ | 11,829 | | | $ | — | | | $ | (10,862 | ) | | $ | — | | | $ | 967 | |
Forward foreign currency exchange contracts | | | — | | | | — | | | | — | | | | (27,801 | ) | | | — | | | | — | | | | (27,801 | ) |
| | | | | | | | | | | | | | | | | | | | | | | | | | | | |
| | | | | | | |
| | $ | — | | | $ | — | | | $ | 11,829 | | | $ | (27,801 | ) | | $ | (10,862 | ) | | $ | — | | | $ | (26,834 | ) |
| | | | | | | | | | | | | | | | | | | | | | | | | | | | |
Average Quarterly Balances of Outstanding Derivative Financial Instruments
| | | | |
| |
| |
Futures contracts: | | | | |
Average notional value of contracts — long | | $ | 18,611,793 | |
Average notional value of contracts — short | | $ | 6,796,280 | |
Forward foreign currency exchange contracts: | | | | |
Average amounts purchased — in USD | | $ | 2,827,580 | |
Average amounts sold — in USD | | $ | 7,487,543 | |
| |
For more information about the LifePath Dynamic Fund’s investment risks regarding derivative financial instruments, refer to the Notes to Financial Statements.
| | |
SCHEDULE OF INVESTMENTS | | 37 |
| | |
Schedule of Investments (continued) December 31, 2021 | | BlackRock LifePath® Dynamic 2025 Fund |
Derivative Financial Instruments — Offsetting as of Period End
The LifePath Dynamic Fund’s derivative assets and liabilities (by type) were as follows:
| | | | | | | | |
| | | |
| | | Assets | | | Liabilities | |
| | |
Derivative Financial Instruments | | | | | | | | |
Futures contracts | | $ | 12,371 | | | $ | 38,060 | |
Forward foreign currency exchange contracts | | | 69,450 | | | | 28,833 | |
| | | | | | | | |
| | |
Total derivative assets and liabilities in the Statements of Assets and Liabilities | | | 81,821 | | | | 66,893 | |
| | | | | | | | |
| | |
Derivatives not subject to a Master Netting Agreement or similar agreement (“MNA”) | | | (12,371 | ) | | | (38,060 | ) |
| | | | | | | | |
| | |
Total derivative assets and liabilities subject to an MNA | | $ | 69,450 | | | $ | 28,833 | |
| | | | | | | | |
The following table presents the LifePath Dynamic Fund’s derivative assets and liabilities by counterparty net of amounts available for offset under an MNA and net of the related collateral received (and pledged) by the LifePath Dynamic Fund:
| | | | | | | | | | | | | | | | | | | | |
| | | | | | |
| Counterparty | |
| Derivative
Assets Subject to an MNA by Counterparty |
| |
| Derivatives
Available for Offset |
(a) | |
| Non-Cash
Collateral Received |
| |
| Cash
Collateral Received |
| |
| Net Amount
of Derivative Assets |
(b)(c) |
| | | | | |
Bank of America N.A. | | $ | 16,792 | | | $ | (16,792 | ) | | $ | — | | | $ | — | | | $ | — | |
Morgan Stanley & Co. International PLC | | | 52,658 | | | | — | | | | — | | | | — | | | | 52,658 | |
| | | | | | | | | | | | | | | | | | | | |
| | | | | |
| | $ | 69,450 | | | $ | (16,792 | ) | | $ | — | | | $ | — | | | $ | 52,658 | |
| | | | | | | | | | | | | | | | | | | | |
| | | | | | | | | | | | | | | | | | | | |
| | | | | | |
| Counterparty | |
| Derivative
Liabilities Subject to an MNA by Counterparty |
| |
| Derivatives
Available for Offset |
(a) | |
| Non-Cash
Collateral Pledged |
| |
| Cash
Collateral Pledged |
| |
| Net Amount
of Derivative Liabilities |
(b)(d) |
| | | | | |
Bank of America N.A. | | $ | 28,833 | | | $ | (16,792 | ) | | $ | — | | | $ | — | | | $ | 12,041 | |
| | | | | | | | | | | | | | | | | | | | |
| | (a) | The amount of derivatives available for offset is limited to the amount of derivative asset and/or liabilities that are subject to an MNA. | |
| | (b) | Net amount may also include forward foreign currency exchange contracts that are not required to be collateralized. | |
| | (c) | Net amount represents the net amount receivable from the counterparty in the event of default. | |
| | (d) | Net amount represents the net amount payable due to counterparty in the event of default. | |
Fair Value Hierarchy as of Period End
Various inputs are used in determining the fair value of financial instruments. For a description of the input levels and information about the LifePath Dynamic Fund’s policy regarding valuation of financial instruments, refer to the Notes to Financial Statements.
The following table summarizes the LifePath Dynamic Fund’s financial instruments categorized in the fair value hierarchy. The breakdown of the LifePath Dynamic Fund’s financial instruments into major categories is disclosed in the Schedule of Investments above.
| | | | | | | | | | | | | | | | |
| | | | | |
| | | Level 1 | | | Level 2 | | | Level 3 | | | Total | |
| | | | |
Assets | | | | | | | | | | | | | | | | |
Investments | | | | | | | | | | | | | | | | |
Investment Companies | | | | | | | | | | | | | | | | |
Equity Funds | | $ | 18,154,384 | | | $ | — | | | $ | — | | | $ | 18,154,384 | |
Fixed-Income Funds | | | 24,492,084 | | | | — | | | | — | | | | 24,492,084 | |
Money Market Funds | | | 9,745,088 | | | | — | | | | — | | | | 9,745,088 | |
| | | | | | | | | | | | | | | | |
| | | | |
| | $ | 52,391,556 | | | $ | — | | | $ | — | | | | 52,391,556 | |
| | | | | | | | | | | | | | | | |
| | | | |
Investments Valued at NAV(a) | | | | | | | | | | | | | | | 70,665,096 | |
| | | | | | | | | | | | | | | | |
| | | | |
| | | | | | | | | | | | | | $ | 123,056,652 | |
| | | | | | | | | | | | | | | | |
| | | | |
Derivative Financial Instruments(b) | | | | | | | | | | | | | | | | |
Assets | | | | | | | | | | | | | | | | |
Equity Contracts | | $ | 91,641 | | | $ | 68,955 | | | $ | — | | | $ | 160,596 | |
Foreign Currency Exchange Contracts | | | — | | | | 69,450 | | | | — | | | | 69,450 | |
Interest Rate Contracts | | | 46,247 | | | | — | | | | — | | | | 46,247 | |
Liabilities | | | | | | | | | | | | | | | | |
Equity Contracts | | | (30,109 | ) | | | — | | | | — | | | | (30,109 | ) |
| | |
| 38 | | 2 0 2 1 BLACK ROCK ANNUAL REPORT TO SHAREHOLDERS |
| | |
Schedule of Investments (continued) December 31, 2021 | | BlackRock LifePath® Dynamic 2025 Fund |
Fair Value Hierarchy as of Period End (continued)
| | | | | | | | | | | | | | | | |
| | | | | |
| | | Level 1 | | | Level 2 | | | Level 3 | | | Total | |
| | | | |
Liabilities (continued) | | | | | | | | | | | | | | | | |
Foreign Currency Exchange Contracts | | $ | — | | | $ | (28,833 | ) | | $ | — | | | $ | (28,833 | ) |
Interest Rate Contracts | | | (30,286 | ) | | | — | | | | — | | | | (30,286 | ) |
| | | | | | | | | | | | | | | | |
| | | | |
| | $ | 77,493 | | | $ | 109,572 | | | $ | — | | | $ | 187,065 | |
| | | | | | | | | | | | | | | | |
| | (a) | Certain investments of the Fund were fair valued using NAV per share or its equivalent as no quoted market value is available and therefore have been excluded from the fair value hierarchy. | |
| | (b) | Derivative financial instruments are futures contracts and forward foreign currency exchange contracts. Futures contracts and forward foreign currency exchange contracts are valued at the unrealized appreciation (depreciation) on the instrument. | |
See notes to financial statements.
| | |
SCHEDULE OF INVESTMENTS | | 39 |
| | |
Schedule of Investments December 31, 2021 | | BlackRock LifePath® Dynamic 2030 Fund (Percentages shown are based on Net Assets) |
| | | | | | | | |
| | |
| Security | | Shares/ Investment Value | | | Value | |
|
Investment Companies(a) | |
| | |
Equity Funds — 63.4% | | | | | | | | |
BlackRock Advantage Emerging Markets Fund, Class K | | | 1,807,265 | | | $ | 21,379,944 | |
BlackRock Tactical Opportunities Fund, Class K | | | 1,262,376 | | | | 17,749,006 | |
Diversified Equity Master Portfolio | | $ | 116,363,571 | | | | 116,363,571 | |
International Tilts Master Portfolio | | $ | 34,138,077 | | | | 34,138,077 | |
iShares Developed Real Estate Index Fund, Class K | | | 846,418 | | | | 10,114,689 | |
iShares MSCI EAFE Small-Cap ETF(b) | | | 186,594 | | | | 13,638,155 | |
| | | | | | | | |
| | |
| | | | | | | 213,383,442 | |
| | |
Fixed-Income Funds — 34.5% | | | | | | | | |
Advantage CoreAlpha Bond Master Portfolio | | $ | 35,607,173 | | | | 35,607,173 | |
iShares Core U.S. Aggregate Bond ETF | | | 265,863 | | | | 30,329,651 | |
iShares iBoxx $ Investment Grade Corporate Bond ETF(b) | | | 24,056 | | | | 3,187,901 | |
iShares TIPS Bond ETF(b) | | | 169,054 | | | | 21,841,777 | |
Master Total Return Portfolio | | $ | 25,389,129 | | | | 25,389,129 | |
| | | | | | | | |
| | |
| | | | | | | 116,355,631 | |
| | | | | | | | |
| | |
| Security | | Shares | | | Value | |
| |
| | |
Money Market Funds — 7.6% | | | | | | | | |
BlackRock Cash Funds: Institutional, SL Agency Shares, 0.10%(c)(d) | | | 19,316,514 | | | $ | 19,322,309 | |
BlackRock Cash Funds: Treasury, SL Agency Shares, 0.01%(c) | | | 6,201,970 | | | | 6,201,970 | |
| | | | | | | | |
| | |
| | | | | | | 25,524,279 | |
| | | | | | | | |
| | |
Total Investments — 105.5%
(Cost: $311,777,081) | | | | | | | 355,263,352 | |
Liabilities in Excess of Other Assets — (5.5)% | | | | (18,524,152 | ) |
| | | | | | | | |
| | |
Net Assets — 100.0% | | | | | | $ | 336,739,200 | |
| | | | | | | | |
| (a) | Affiliate of the Fund. |
| (b) | All or a portion of this security is on loan. |
| (c) | Annualized 7-day yield as of period end. |
| (d) | All or a portion of this security was purchased with the cash collateral from loaned securities. |
Affiliates
Investments in issuers considered to be affiliate(s) of the LifePath Dynamic Fund during the year ended December 31, 2021 for purposes of Section 2(a)(3) of the Investment Company Act of 1940, as amended, were as follows:
| | | | | | | | | | | | | | | | | | | | | | | | | | | | | | | | | | | | | | | | | | |
| | | | | | | |
| | | | | | | | | | | |
| | | Affiliated Issuer | | Value at 12/31/20 | | | Purchases at Cost | | | Proceeds from Sales | | | Net Realized Gain (Loss) | | | Change in Unrealized Appreciation (Depreciation) | | | Value at 12/31/21 | | | Shares/ Investment Value Held at 12/31/21 | | | Income | | | Capital Gain Distributions from Underlying Funds | | | | |
| | | | | | | |
| | | | | | | | | | | |
| | Advantage CoreAlpha Bond Master Portfolio | | $ | 34,145,665 | | | $ | 2,817,299 | (a)(b) | | $ | — | | | $ | 209,022 | | | $ | (1,564,813 | ) | | $ | 35,607,173 | | | $ | 35,607,173 | | | $ | 723,379 | | | $ | — | | | | | |
| | BlackRock Advantage Emerging Markets Fund, Class K | | | 23,215,542 | | | | 3,125,613 | | | | (3,815,641 | ) | | | 197,308 | | | | (1,342,878 | ) | | | 21,379,944 | | | | 1,807,265 | | | | 311,348 | | | | — | | | | | |
| | BlackRock Cash Funds: Institutional, SL Agency Shares | | | 7,590,826 | | | | 11,736,934 | (a) | | | — | | | | (5,134 | ) | | | (317 | ) | | | 19,322,309 | | | | 19,316,514 | | | | 32,040 | (c) | | | — | | | | | |
| | BlackRock Cash Funds: Treasury, SL Agency Shares | | | 247,923 | | | | 5,954,047 | (a) | | | — | | | | — | | | | — | | | | 6,201,970 | | | | 6,201,970 | | | | 582 | | | | — | | | | | |
| | BlackRock Tactical Opportunities Fund, Class K | | | 16,300,117 | | | | 1,340,054 | | | | — | | | | — | | | | 108,835 | | | | 17,749,006 | | | | 1,262,376 | | | | — | | | | — | | | | | |
| | Diversified Equity Master Portfolio | | | 112,360,816 | | | | — | | | | (23,587,095 | )(a)(b) | | | 32,901,965 | | | | (5,312,115 | ) | | | 116,363,571 | | | $ | 116,363,571 | | | | 1,128,908 | | | | — | | | | | |
| | International Tilts Master Portfolio | | | 31,897,005 | | | | — | | | | (1,180,567 | )(a)(b) | | | 3,734,622 | | | | (312,983 | ) | | | 34,138,077 | | | $ | 34,138,077 | | | | 626,179 | | | | — | | | | | |
| | iShares Core U.S. Aggregate Bond ETF | | | 28,914,002 | | | | 3,271,492 | | | | (836,918 | ) | | | (17,546 | ) | | | (1,001,379 | ) | | | 30,329,651 | | | | 265,863 | | | | 534,618 | | | | — | | | | | |
| | iShares Developed Real Estate Index Fund, Class K | | | 9,892,302 | | | | 452,659 | | | | (2,214,262 | ) | | | (21,558 | ) | | | 2,005,548 | | | | 10,114,689 | | | | 846,418 | | | | 436,937 | | | | 15,725 | | | | | |
| | iShares iBoxx $ Investment Grade Corporate Bond ETF | | | 2,927,942 | | | | 371,450 | | | | — | | | | — | | | | (111,491 | ) | | | 3,187,901 | | | | 24,056 | | | | 71,533 | | | | — | | | | | |
| | iShares MSCI EAFE Small-Cap ETF | | | 13,683,328 | | | | — | | | | (954,749 | ) | | | 79,874 | | | | 829,702 | | | | 13,638,155 | | | | 186,594 | | | | 403,611 | | | | — | | | | | |
| | iShares TIPS Bond ETF | | | 20,260,353 | | | | 4,090,107 | | | | (2,803,445 | ) | | | 10,865 | | | | 283,897 | | | | 21,841,777 | | | | 169,054 | | | | 953,916 | | | | — | | | | | |
| | Master Total Return Portfolio | | | 23,719,845 | | | | 2,176,592 | (a)(b) | | | — | | | | 210,807 | | | | (718,115 | ) | | | 25,389,129 | | | $ | 25,389,129 | | | | 450,493 | | | | — | | | | | |
| | | | | | | | | | | | | | | | | | | | | | | | | | | | | | | | | | | | | | | | | | |
| | | | | | | | | | | |
| | | | | | | | | | | | | | | | $ | 37,300,225 | | | $ | (7,136,109 | ) | | $ | 355,263,352 | | | | | | | $ | 5,673,544 | | | $ | 15,725 | | | | | |
| | | | | | | | | | | | | | | | | | | | | | | | | | | | | | | | | | | | | | | | | | |
| | (a) | Represents net amount purchased (sold). | |
| | (b) | Inclusive of income and expense allocated from the Master Portfolio. | |
| | (c) | All or a portion represents securities lending income earned from the reinvestment of cash collateral from loaned securities, net of fees and collateral investment expenses, and other payments to and from borrowers of securities. | |
| | |
| 40 | | 2 0 2 1 BLACK ROCK ANNUAL REPORT TO SHAREHOLDERS |
| | |
Schedule of Investments (continued) December 31, 2021 | | BlackRock LifePath® Dynamic 2030 Fund |
Derivative Financial Instruments Outstanding as of Period End
Futures Contracts
| | | | | | | | | | | | | | | | |
| | | | | |
| Description | | Number of Contracts | | | Expiration Date | | | Notional Amount (000) | | | Value/ Unrealized Appreciation (Depreciation) | |
| | | | |
Long Contracts | | | | | | | | | | | | | | | | |
IBEX 35 Index | | | 16 | | | | 01/21/22 | | | $ | 1,575 | | | $ | 57,171 | |
TOPIX Index | | | 59 | | | | 03/10/22 | | | | 10,232 | | | | 49,921 | |
S&P/TSE 60 Index | | | 29 | | | | 03/17/22 | | | | 5,873 | | | | 100,038 | |
FTSE 100 Index | | | 36 | | | | 03/18/22 | | | | 3,572 | | | | 82,156 | |
FTSE/MIB Index | | | 10 | | | | 03/18/22 | | | | 1,546 | | | | 36,526 | |
MSCI EAFE Index | | | 13 | | | | 03/18/22 | | | | 1,509 | | | | 21,115 | |
Russell 2000 E-Mini Index | | | 75 | | | | 03/18/22 | | | | 8,411 | | | | 127,454 | |
10-Year U.S. Treasury Note | | | 104 | | | | 03/22/22 | | | | 13,554 | | | | 102,335 | |
| | | | | | | | | | | | | | | | |
| | | | |
| | | | | | | | | | | | | | | 576,716 | |
| | | | | | | | | | | | | | | | |
Short Contracts | | | | | | | | | | | | | | | | |
S&P 500 E-Mini Index | | | 14 | | | | 03/18/22 | | | | 3,331 | | | | (38,381 | ) |
S&P 500 Micro E-Mini Index | | | 210 | | | | 03/18/22 | | | | 4,996 | | | | (43,065 | ) |
Ultra U.S. Treasury Bond | | | 30 | | | | 03/22/22 | | | | 5,883 | | | | (92,653 | ) |
| | | | | | | | | | | | | | | | |
| | | | |
| | | | | | | | | | | | | | | (174,099 | ) |
| | | | | | | | | | | | | | | | |
| | | | |
| | | | | | | | | | | | | | $ | 402,617 | |
| | | | | | | | | | | | | | | | |
Forward Foreign Currency Exchange Contracts
| | | | | | | | | | | | | | | | | | | | | | |
| | | | | | | |
| Currency Purchased | | | | | Currency Sold | | | Counterparty | | Settlement Date | | | | | | Unrealized
Appreciation
(Depreciation) | |
| | | | | | |
| CAD | 7,103,116 | | | | | USD | 5,546,135 | | | Bank of America N.A. | | | 03/16/22 | | | | | | | $ | 68,373 | |
| EUR | 441,000 | | | | | USD | 497,634 | | | Bank of America N.A. | | | 03/16/22 | | | | | | | | 5,182 | |
| EUR | 9,865,115 | | | | | USD | 11,198,984 | | | Morgan Stanley & Co. International PLC | | | 03/16/22 | | | | | | | | 48,944 | |
| USD | 3,689,075 | | | | | JPY | 415,501,872 | | | Morgan Stanley & Co. International PLC | | | 03/16/22 | | | | | | | | 74,897 | |
| | | | | | | | | | | | | | | | | | | | | | |
| | | | | | |
| | | | | | | | | | | | | | | | | | | | | 197,396 | |
| | | | | | | | | | | | | | | | | | | | | | |
| | | | | | |
| USD | 3,635,784 | | | | | AUD | 5,108,984 | | | Bank of America N.A. | | | 03/16/22 | | | | | | | | (81,901 | ) |
| USD | 3,691,876 | | | | | CAD | 4,728,306 | | | Bank of America N.A. | | | 03/16/22 | | | | | | | | (45,514 | ) |
| USD | 548,317 | | | | | EUR | 483,000 | | | Bank of America N.A. | | | 03/16/22 | | | | | | | | (2,386 | ) |
| | | | | | | | | | | | | | | | | | | | | | |
| | | | | | |
| | | | | | | | | | | | | | | | | | | | | (129,801 | ) |
| | | | | | | | | | | | | | | | | | | | | | |
| | | | | | |
| | | | | | | | | | | | | | | | | | | | $ | 67,595 | |
| | | | | | | | | | | | | | | | | | | | | | |
| | |
SCHEDULE OF INVESTMENTS | | 41 |
| | |
Schedule of Investments (continued) December 31, 2021 | | BlackRock LifePath® Dynamic 2030 Fund |
Derivative Financial Instruments Categorized by Risk Exposure
As of period end, the fair values of derivative financial instruments located in the Statements of Assets and Liabilities were as follows:
| | | | | | | | | | | | | | | | | | | | | | | | | | | | |
| | | | | | | | |
| | | Commodity Contracts | | | Credit Contracts | | | Equity Contracts | | | Foreign Currency Exchange Contracts | | | Interest Rate Contracts | | | Other Contracts | | | Total | |
| | | | | | | |
Assets — Derivative Financial Instruments | | | | | | | | | | | | | | | | | | | | | | | | | | | | |
Futures contracts | | | | | | | | | | | | | | | | | | | | | | | | | | | | |
Unrealized appreciation on futures contracts(a) | | $ | — | | | $ | — | | | $ | 474,381 | | | $ | — | | | $ | 102,335 | | | $ | — | | | $ | 576,716 | |
Forward foreign currency exchange contracts | | | | | | | | | | | | | | | | | | | | | | | | | | | | |
Unrealized appreciation on forward foreign currency exchange contracts | | | — | | | | — | | | | — | | | | 197,396 | | | | — | | | | — | | | | 197,396 | |
| | | | | | | | | | | | | | | | | | | | | | | | | | | | |
| | | | | | | |
| | $ | — | | | $ | — | | | $ | 474,381 | | | $ | 197,396 | | | $ | 102,335 | | | $ | — | | | $ | 774,112 | |
| | | | | | | | | | | | | | | | | | | | | | | | | | | | |
Liabilities — Derivative Financial Instruments | | | | | | | | | | | | | | | | | | | | | | | | | | | | |
Futures contracts | | | | | | | | | | | | | | | | | | | | | | | | | | | | |
Unrealized depreciation on futures contracts(a) | | $ | — | | | $ | — | | | $ | 81,446 | | | $ | — | | | $ | 92,653 | | | $ | — | | | $ | 174,099 | |
Forward foreign currency exchange contracts | | | | | | | | | | | | | | | | | | | | | | | | | | | | |
Unrealized depreciation on forward foreign currency exchange contracts | | | — | | | | — | | | | — | | | | 129,801 | | | | — | | | | — | | | | 129,801 | |
| | | | | | | | | | | | | | | | | | | | | | | | | | | | |
| | | | | | | |
| | $ | — | | | $ | — | | | $ | 81,446 | | | $ | 129,801 | | | $ | 92,653 | | | $ | — | | | $ | 303,900 | |
| | | | | | | | | | | | | | | | | | | | | | | | | | | | |
| | (a) | Net cumulative unrealized appreciation (depreciation) on futures contracts and centrally cleared swaps, if any, are reported in the Schedule of Investments. In the Statements of Assets and Liabilities, only current day’s variation margin is reported in receivables or payables and the net cumulative unrealized appreciation (depreciation) is included in accumulated earnings (loss). | |
For the period ended December 31, 2021, the effect of derivative financial instruments in the Statements of Operations was as follows:
| | | | | | | | | | | | | | | | | | | | | | | | | | | | |
| | | | | | | | |
| | | Commodity Contracts | | | Credit Contracts | | | Equity Contracts | | | Foreign Currency Exchange Contracts | | | Interest Rate Contracts | | | Other Contracts | | | Total | |
| | | | | | | |
Net Realized Gain (Loss) from: | | | | | | | | | | | | | | | | | | | | | | | | | | | | |
Futures contracts | | $ | — | | | $ | — | | | $ | 3,589,107 | | | $ | — | | | $ | (407,978 | ) | | $ | — | | | $ | 3,181,129 | |
Forward foreign currency exchange contracts | | | — | | | | — | | | | — | | | | (752,714 | ) | | | — | | | | — | | | | (752,714 | ) |
| | | | | | | | | | | | | | | | | | | | | | | | | | | | |
| | | | | | | |
| | $ | — | | | $ | — | | | $ | 3,589,107 | | | $ | (752,714 | ) | | $ | (407,978 | ) | | $ | — | | | $ | 2,428,415 | |
| | | | | | | | | | | | | | | | | | | | | | | | | | | | |
Net Change in Unrealized Appreciation (Depreciation) on: | | | | | | | | | | | | | | | | | | | | | | | | | | | | |
Futures contracts | | $ | — | | | $ | — | | | $ | 51,077 | | | $ | — | | | $ | (80,311 | ) | | $ | — | | | $ | (29,234 | ) |
Forward foreign currency exchange contracts | | | — | | | | — | | | | — | | | | (177,708 | ) | | | — | | | | — | | | | (177,708 | ) |
| | | | | | | | | | | | | | | | | | | | | | | | | | | | |
| | | | | | | |
| | $ | — | | | $ | — | | | $ | 51,077 | | | $ | (177,708 | ) | | $ | (80,311 | ) | | $ | — | | | $ | (206,942 | ) |
| | | | | | | | | | | | | | | | | | | | | | | | | | | | |
Average Quarterly Balances of Outstanding Derivative Financial Instruments
| | | | |
| | |
Futures contracts: | | | | |
Average notional value of contracts — long | | $ | 50,007,801 | |
Average notional value of contracts — short | | $ | 21,760,436 | |
Forward foreign currency exchange contracts: | | | | |
Average amounts purchased — in USD | | $ | 9,262,980 | |
Average amounts sold — in USD | | $ | 23,216,860 | |
For more information about the LifePath Dynamic Fund’s investment risks regarding derivative financial instruments, refer to the Notes to Financial Statements.
| | |
| 42 | | 2 0 2 1 BLACK ROCK ANNUAL REPORT TO SHAREHOLDERS |
| | |
Schedule of Investments (continued) December 31, 2021 | | BlackRock LifePath® Dynamic 2030 Fund |
Derivative Financial Instruments — Offsetting as of Period End
The LifePath Dynamic Fund’s derivative assets and liabilities (by type) were as follows:
| | | | | | | | | | | | |
| | | | |
| | | Assets | | | | | | Liabilities | |
| | | |
Derivative Financial Instruments | | | | | | | | | | | | |
Futures contracts | | $ | 30,897 | | | | | | | $ | 108,991 | |
Forward foreign currency exchange contracts | | | 197,396 | | | | | | | | 129,801 | |
| | | | | | | | | | | | |
| | | |
Total derivative assets and liabilities in the Statements of Assets and Liabilities | | | 228,293 | | | | | | | | 238,792 | |
| | | | | | | | | | | | |
| | | |
Derivatives not subject to a Master Netting Agreement or similar agreement (“MNA”) | | | (30,897 | ) | | | | | | | (108,991 | ) |
| | | | | | | | | | | | |
| | | |
Total derivative assets and liabilities subject to an MNA | | $ | 197,396 | | | | | | | $ | 129,801 | |
| | | | | | | | | | | | |
The following table presents the LifePath Dynamic Fund’s derivative assets and liabilities by counterparty net of amounts available for offset under an MNA and net of the related collateral received (and pledged) by the LifePath Dynamic Fund:
| | | | | | | | | | | | | | | | | | | | |
| | | | | | |
| Counterparty | |
| Derivative
Assets Subject to an MNA by Counterparty |
| |
| Derivatives
Available for Offset |
(a) | |
| Non-Cash
Collateral Received |
| |
| Cash
Collateral Received |
| |
| Net Amount
of Derivative Assets |
(b)(c) |
| | | | | |
Bank of America N.A. | | $ | 73,555 | | | $ | (73,555 | ) | | $ | — | | | $ | — | | | $ | — | |
Morgan Stanley & Co. International PLC | | | 123,841 | | | | — | | | | — | | | | — | | | | 123,841 | |
| | | | | | | | | | | | | | | | | | | | |
| | | | | |
| | $ | 197,396 | | | $ | (73,555 | ) | | $ | — | | | $ | — | | | $ | 123,841 | |
| | | | | | | | | | | | | | | | | | | | |
| | | | | | | | | | | | | | | | | | | | |
| | | | | | |
| Counterparty | |
| Derivative
Liabilities Subject to an MNA by Counterparty |
| |
| Derivatives
Available for Offset |
(a) | |
| Non-Cash
Collateral Pledged |
| |
| Cash
Collateral Pledged |
| |
| Net Amount
of Derivative Liabilities |
(b)(d) |
| | | | | |
Bank of America N.A. | | $ | 129,801 | | | $ | (73,555 | ) | | $ | — | | | $ | — | | | $ | 56,246 | |
| | | | | | | | | | | | | | | | | | | | |
| | (a) | The amount of derivatives available for offset is limited to the amount of derivative asset and/or liabilities that are subject to an MNA. | |
| | (b) | Net amount may also include forward foreign currency exchange contracts that are not required to be collateralized. | |
| | (c) | Net amount represents the net amount receivable from the counterparty in the event of default. | |
| | (d) | Net amount represents the net amount payable due to counterparty in the event of default. | |
Fair Value Hierarchy as of Period End
Various inputs are used in determining the fair value of financial instruments. For a description of the input levels and information about the LifePath Dynamic Fund’s policy regarding valuation of financial instruments, refer to the Notes to Financial Statements.
The following table summarizes the LifePath Dynamic Fund’s financial instruments categorized in the fair value hierarchy. The breakdown of the LifePath Dynamic Fund’s financial instruments into major categories is disclosed in the Schedule of Investments above.
| | | | | | | | | | | | | | | | |
| | | | | |
| | | Level 1 | | | Level 2 | | | Level 3 | | | Total | |
| | | | |
Assets | | | | | | | | | | | | | | | | |
Investments | | | | | | | | | | | | | | | | |
Investment Companies | | | | | | | | | | | | | | | | |
Equity Funds | | $ | 62,881,794 | | | $ | — | | | $ | — | | | $ | 62,881,794 | |
Fixed-Income Funds | | | 55,359,329 | | | | — | | | | — | | | | 55,359,329 | |
Money Market Funds | | | 25,524,279 | | | | — | | | | — | | | | 25,524,279 | |
| | | | | | | | | | | | | | | | |
| | | | |
| | $ | 143,765,402 | | | $ | — | | | $ | — | | | | 143,765,402 | |
| | | | | | | | | | | | | | | | |
| | | | |
Investments Valued at NAV(a) | | | | | | | | | | | | | | | 211,497,950 | |
| | | | | | | | | | | | | | | | |
| | | | |
| | | | | | | | | | | | | | $ | 355,263,352 | |
| | | | | | | | | | | | | | | | |
Derivative Financial Instruments(b) | | | | | | | | | | | | | | | | |
Assets | | | | | | | | | | | | | | | | |
Equity Contracts | | $ | 248,607 | | | $ | 225,774 | | | $ | — | | | $ | 474,381 | |
Foreign Currency Exchange Contracts | | | — | | | | 197,396 | | | | — | | | | 197,396 | |
Interest Rate Contracts | | | 102,335 | | | | — | | | | — | | | | 102,335 | |
Liabilities | | | | | | | | | | | | | | | | |
Equity Contracts | | | (81,446 | ) | | | — | | | | — | | | | (81,446 | ) |
| | |
SCHEDULE OF INVESTMENTS | | 43 |
| | |
Schedule of Investments (continued) December 31, 2021 | | BlackRock LifePath® Dynamic 2030 Fund |
Fair Value Hierarchy as of Period End (continued)
| | | | | | | | | | | | | | | | |
| | | | | |
| | | Level 1 | | | Level 2 | | | Level 3 | | | Total | |
| | | | |
Liabilities (continued) | | | | | | | | | | | | | | | | |
Foreign Currency Exchange Contracts | | $ | — | | | $ | (129,801 | ) | | $ | — | | | $ | (129,801 | ) |
Interest Rate Contracts | | | (92,653 | ) | | | — | | | | — | | | | (92,653 | ) |
| | | | | | | | | | | | | | | | |
| | | | |
| | $ | 176,843 | | | $ | 293,369 | | | $ | — | | | $ | 470,212 | |
| | | | | | | | | | | | | | | | |
| | (a) | Certain investments of the Fund were fair valued using NAV per share or its equivalent as no quoted market value is available and therefore have been excluded from the fair value hierarchy. | |
| | (b) | Derivative financial instruments are futures contracts and forward foreign currency exchange contracts. Futures contracts and forward foreign currency exchange contracts are valued at the unrealized appreciation (depreciation) on the instrument. | |
See notes to financial statements.
| | |
| 44 | | 2 0 2 1 BLACK ROCK ANNUAL REPORT TO SHAREHOLDERS |
| | |
Schedule of Investments December 31, 2021 | | BlackRock LifePath® Dynamic 2035 Fund (Percentages shown are based on Net Assets) |
| | | | | | | | |
| Security | | Shares/ Investment Value | | | Value | |
| | |
Investment Companies(a) | | | | | | | | |
| | |
Equity Funds — 73.0% | | | | | | | | |
BlackRock Advantage Emerging Markets Fund, Class K | | | 942,379 | | | $ | 11,148,347 | |
BlackRock Tactical Opportunities Fund, Class K | | | 495,088 | | | | 6,960,939 | |
Diversified Equity Master Portfolio | | $ | 57,118,326 | | | | 57,118,326 | |
International Tilts Master Portfolio | | $ | 16,570,955 | | | | 16,570,955 | |
iShares Developed Real Estate Index Fund, Class K | | | 423,237 | | | | 5,057,687 | |
iShares MSCI EAFE Small-Cap ETF(b) | | | 90,015 | | | | 6,579,196 | |
| | | | | | | | |
| | |
| | | | | | | 103,435,450 | |
| | |
| Fixed-Income Funds — 22.6% | | | | | | |
Advantage CoreAlpha Bond Master Portfolio | | $ | 9,268,834 | | | | 9,268,834 | |
iShares Core U.S. Aggregate Bond ETF | | | 68,925 | | | | 7,862,964 | |
iShares iBoxx $Investment Grade Corporate Bond ETF(b) | | | 6,913 | | | | 916,111 | |
iShares TIPS Bond ETF | | | 58,371 | | | | 7,541,533 | |
Master Total Return Portfolio | | $ | 6,463,902 | | | | 6,463,902 | |
| | | | | | | | |
| | |
| | | | | | | 32,053,344 | |
| | | | | | | | |
| Security | | Shares | | | Value | |
| |
| | |
| Money Market Funds — 6.3% | | | | | | |
BlackRock Cash Funds: Institutional, SL Agency Shares, 0.10%(c)(d) | | | 2,729,656 | | | $ | 2,730,475 | |
BlackRock Cash Funds: Treasury, SL Agency Shares, 0.01%(c) | | | 6,179,482 | | | | 6,179,482 | |
| | | | | | | | |
| | |
| | | | | | | 8,909,957 | |
| | | | | | | | |
| | |
Total Investments — 101.9%
(Cost: $126,163,449) | | | | | | | 144,398,751 | |
| |
Liabilities in Excess of Other Assets — (1.9)% | | | | (2,719,451 | ) |
| | | | | | | | |
| | |
Net Assets — 100.0% | | | | | | $ | 141,679,300 | |
| | | | | | | | |
| (a) | Affiliate of the Fund. |
| (b) | All or a portion of this security is on loan. |
| (c) | Annualized 7-day yield as of period end. |
| (d) | All or a portion of this security was purchased with the cash collateral from loaned securities. |
Affiliates
Investments in issuers considered to be affiliate(s) of the LifePath Dynamic Fund during the year ended December 31, 2021 for purposes of Section 2(a)(3) of the Investment Company Act of 1940, as amended, were as follows:
| | | | | | | | | | | | | | | | | | | | | | | | | | | | | | | | | | | | | | | | | | |
| | | | | | | | | | | |
| | | Affiliated Issuer | | Value at 12/31/20 | | | Purchases
at Cost | | | Proceeds from Sales | | | Net Realized Gain (Loss) | | | Change in Unrealized Appreciation (Depreciation) | | | Value at 12/31/21 | | | Shares/ Investment Value Held at 12/31/21 | | | Income | | | Capital Gain Distributions from Underlying Funds | | | | |
| | | | | | | | | | | |
| | Advantage CoreAlpha Bond Master Portfolio | | $ | 7,527,166 | | | $ | 2,066,102 | (a)(b) | | $ | — | | | $ | (58,280 | ) | | $ | (266,154 | ) | | $ | 9,268,834 | | | $ | 9,268,834 | | | $ | 179,576 | | | $ | — | | | | | |
| | BlackRock Advantage Emerging Markets Fund, Class K | | | 9,818,402 | | | | 2,508,956 | | | | (482,620 | ) | | | (11,207 | ) | | | (685,184 | ) | | | 11,148,347 | | | | 942,379 | | | | 153,226 | | | | — | | | | | |
| | BlackRock Cash Funds: Institutional, SL Agency Shares | | | — | | | | 2,731,385 | (a) | | | — | | | | (910 | ) | | | — | | | | 2,730,475 | | | | 2,729,656 | | | | 10,953 | (c) | | | — | | | | | |
| | BlackRock Cash Funds: Treasury, SL Agency Shares | | | 1,618,846 | | | | 4,560,636 | (a) | | | — | | | | — | | | | — | | | | 6,179,482 | | | | 6,179,482 | | | | 340 | | | | — | | | | | |
| | BlackRock Tactical Opportunities Fund, Class K | | | 5,803,574 | | | | 1,108,673 | | | | — | | | | — | | | | 48,692 | | | | 6,960,939 | | | | 495,088 | | | | — | | | | — | | | | | |
| | Diversified Equity Master Portfolio | | | 46,138,534 | | | | — | | | | (1,213,714 | )(a)(b) | | | 12,034,211 | | | | 159,295 | | | | 57,118,326 | | | $ | 57,118,326 | | | | 509,491 | | | | — | | | | | |
| | International Tilts Master Portfolio | | | 13,566,273 | | | | 1,476,508 | (a)(b) | | | — | | | | 1,389,149 | | | | 139,025 | | | | 16,570,955 | | | $ | 16,570,955 | | | | 282,067 | | | | — | | | | | |
| | iShares Core U.S. Aggregate Bond ETF | | | 6,556,117 | | | | 1,547,487 | | | | — | | | | — | | | | (240,640 | ) | | | 7,862,964 | | | | 68,925 | | | | 130,561 | | | | — | | | | | |
| | iShares Developed Real Estate Index Fund, Class K | | | 4,006,799 | | | | 342,313 | | | | (178,408 | ) | | | 3,900 | | | | 883,083 | | | | 5,057,687 | | | | 423,237 | | | | 205,490 | | | | 7,863 | | | | | |
| | iShares iBoxx $ Investment Grade Corporate Bond ETF | | | 774,357 | | | | 169,842 | | | | — | | | | — | | | | (28,088 | ) | | | 916,111 | | | | 6,913 | | | | 20,258 | | | | — | | | | | |
| | iShares MSCI EAFE Small-Cap ETF | | | 5,050,792 | | | | 1,164,695 | | | | — | | | | — | | | | 363,709 | | | | 6,579,196 | | | | 90,015 | | | | 188,957 | | | | — | | | | | |
| | iShares TIPS Bond ETF | | | 5,682,723 | | | | 2,119,937 | | | | (360,503 | ) | | | 1,394 | | | | 97,982 | | | | 7,541,533 | | | | 58,371 | | | | 299,251 | | | | — | | | | | |
| | Master Total Return Portfolio | | | 5,543,138 | | | | 1,040,599 | (a)(b) | | | — | | | | 53,949 | | | | (173,784 | ) | | | 6,463,902 | | | $ | 6,463,902 | | | | 116,751 | | | | — | | | | | |
| | | | | | | | | | | | | | | | | | | | | | | | | | | | | | | | | | | | | | | | | | |
| | | | | | | | | | | |
| | | | | | | | | | | | | | | | $ | 13,412,206 | | | $ | 297,936 | | | $ | 144,398,751 | | | | | | | $ | 2,096,921 | | | $ | 7,863 | | | | | |
| | | | | | | | | | | | | | | | | | | | | | | | | | | | | | | | | | | | | | | | | | |
| | (a) | Represents net amount purchased (sold). | |
| | (b) | Inclusive of income and expense allocated from the Master Portfolio. | |
| | (c) | All or a portion represents securities lending income earned from the reinvestment of cash collateral from loaned securities, net of fees and collateral investment expenses, and other payments to and from borrowers of securities. | |
| | |
SCHEDULE OF INVESTMENTS | | 45 |
| | |
Schedule of Investments (continued) December 31, 2021 | | BlackRock LifePath® Dynamic 2035 Fund |
Derivative Financial Instruments Outstanding as of Period End
Futures Contracts
| | | | | | | | | | | | | | | | |
| | | | | |
| Description | | Number of Contracts | | | Expiration Date | | | Notional Amount (000) | | | Value/ Unrealized Appreciation (Depreciation) | |
| | | | |
Long Contracts | | | | | | | | | | | | | | | | |
IBEX 35 Index | | | 6 | | | | 01/21/22 | | | $ | 590 | | | $ | 21,439 | |
TOPIX Index | | | 25 | | | | 03/10/22 | | | | 4,335 | | | | 21,707 | |
S&P/TSE 60 Index | | | 15 | | | | 03/17/22 | | | | 3,038 | | | | 53,841 | |
FTSE 100 Index | | | 15 | | | | 03/18/22 | | | | 1,489 | | | | 34,235 | |
FTSE/MIB Index | | | 4 | | | | 03/18/22 | | | | 618 | | | | 14,593 | |
MSCI EAFE Index | | | 19 | | | | 03/18/22 | | | | 2,206 | | | | 33,938 | |
Russell 2000 E-Mini Index | | | 23 | | | | 03/18/22 | | | | 2,579 | | | | 39,082 | |
10-Year U.S. Treasury Note | | | 37 | | | | 03/22/22 | | | | 4,822 | | | | 36,408 | |
| | | | | | | | | | | | | | | | |
| | | | |
| | | | | | | | | | | | | | | 255,243 | |
| | | | | | | | | | | | | | | | |
Short Contracts | | | | | | | | | | | | | | | | |
S&P 500 E-Mini Index | | | 6 | | | | 03/18/22 | | | | 1,428 | | | | (16,603 | ) |
S&P 500 Micro E-Mini Index | | | 35 | | | | 03/18/22 | | | | 833 | | | | (226 | ) |
Ultra U.S. Treasury Bond | | | 13 | | | | 03/22/22 | | | | 2,549 | | | | (36,463 | ) |
| | | | | | | | | | | | | | | | |
| | | | |
| | | | | | | | | | | | | | | (53,292 | ) |
| | | | | | | | | | | | | | | | |
| | | | |
| | | | | | | | | | | | | | $ | 201,951 | |
| | | | | | | | | | | | | | | | |
Forward Foreign Currency Exchange Contracts
| | | | | | | | | | | | | | | | | | | | | | |
| | | | | | | |
Currency Purchased | | | | | Currency Sold | | | Counterparty | | Settlement Date | | | | Unrealized Appreciation (Depreciation) | |
| | | | | | | | |
CAD | | | 229,000 | | | | | USD | | | 179,120 | | | Bank of America N.A. | | 03/16/22 | | | | $ | 1,889 | |
CAD | | | 3,407,099 | | | | | USD | | | 2,660,273 | | | Bank of America N.A. | | 03/16/22 | | | | | 32,796 | |
EUR | | | 115,000 | | | | | USD | | | 130,312 | | | Bank of America N.A. | | 03/16/22 | | | | | 807 | |
EUR | | | 4,010,042 | | | | | USD | | | 4,552,237 | | | Morgan Stanley & Co. International PLC | | 03/16/22 | | | | | 19,901 | |
USD | | | 119,962 | | | | | JPY | | | 13,779,000 | | | Bank of America N.A. | | 03/16/22 | | | | | 108 | |
USD | | | 1,487,334 | | | | | JPY | | | 167,511,533 | | | Morgan Stanley & Co. International PLC | | 03/16/22 | | | | | 30,261 | |
| | | | | | | | | | | | | | | | | | | | | | |
| | | | | | | | |
| | | | | | | | | | | | | | | | | | | | | 85,762 | |
| | | | | | | | | | | | | | | | | | | | | | |
| | | | | | | | |
USD | | | 1,465,962 | | | | | AUD | | | 2,059,962 | | | Bank of America N.A. | | 03/16/22 | | | | | (33,023 | ) |
USD | | | 1,488,489 | | | | | CAD | | | 1,906,357 | | | Bank of America N.A. | | 03/16/22 | | | | | (18,350 | ) |
USD | | | 214,559 | | | | | EUR | | | 189,000 | | | Bank of America N.A. | | 03/16/22 | | | | | (934 | ) |
| | | | | | | | | | | | | | | | | | | | | | |
| | | | | | | | |
| | | | | | | | | | | | | | | | | | | | | (52,307 | ) |
| | | | | | | | | | | | | | | | | | | | | | |
| | | | | | | | |
| | | | | | | | | | | | | | | | | | | | $ | 33,455 | |
| | | | | | | | | | | | | | | | | | | | | | |
| | |
| 46 | | 2 0 2 1 BLACK ROCK ANNUAL REPORT TO SHAREHOLDERS |
| | |
Schedule of Investments (continued) December 31, 2021 | | BlackRock LifePath® Dynamic 2035 Fund |
Derivative Financial Instruments Categorized by Risk Exposure
As of period end, the fair values of derivative financial instruments located in the Statements of Assets and Liabilities were as follows:
| | | | | | | | | | | | | | | | | | | | | | | | | | | | |
| | | | | | | | |
| | | Commodity Contracts | | | Credit Contracts | | | Equity Contracts | | | Foreign Currency Exchange Contracts | | | Interest Rate Contracts | | | Other Contracts | | | Total | |
| | | | | | | |
Assets — Derivative Financial Instruments | | | | | | | | | | | | | | | | | | | | | | | | | | | | |
Futures contracts | | | | | | | | | | | | | | | | | | | | | | | | | | | | |
Unrealized appreciation on futures contracts(a) | | $ | — | | | $ | — | | | $ | 218,835 | | | $ | — | | | $ | 36,408 | | | $ | — | | | $ | 255,243 | |
Forward foreign currency exchange contracts | | | | | | | | | | | | | | | | | | | | | | | | | | | | |
Unrealized appreciation on forward foreign currency exchange contracts | | | — | | | | — | | | | — | | | | 85,762 | | | | — | | | | — | | | | 85,762 | |
| | | | | | | | | | | | | | | | | | | | | | | | | | | | |
| | | | | | | |
| | $ | — | | | $ | — | | | $ | 218,835 | | | $ | 85,762 | | | $ | 36,408 | | | $ | — | | | $ | 341,005 | |
| | | | | | | | | | | | | | | | | | | | | | | | | | | | |
Liabilities — Derivative Financial Instruments | | | | | | | | | | | | | | | | | | | | | | | | | | | | |
Futures contracts | | | | | | | | | | | | | | | | | | | | | | | | | | | | |
Unrealized depreciation on futures contracts(a) | | $ | — | | | $ | — | | | $ | 16,829 | | | $ | — | | | $ | 36,463 | | | $ | — | | | $ | 53,292 | |
Forward foreign currency exchange contracts | | | | | | | | | | | | | | | | | | | | | | | | | | | | |
Unrealized depreciation on forward foreign currency exchange contracts | | | — | | | | — | | | | — | | | | 52,307 | | | | — | | | | — | | | | 52,307 | |
| | | | | | | | | | | | | | | | | | | | | | | | | | | | |
| | | | | | | |
| | $ | — | | | $ | — | | | $ | 16,829 | | | $ | 52,307 | | | $ | 36,463 | | | $ | — | | | $ | 105,599 | |
| | | | | | | | | | | | | | | | | | | | | | | | | | | | |
| | (a) | Net cumulative unrealized appreciation (depreciation) on futures contracts and centrally cleared swaps, if any, are reported in the Schedule of Investments. In the Statements of Assets and Liabilities, only current day’s variation margin is reported in receivables or payables and the net cumulative unrealized appreciation (depreciation) is included in accumulated earnings (loss). | |
For the period ended December 31, 2021, the effect of derivative financial instruments in the Statements of Operations was as follows:
| | | | | | | | | | | | | | | | | | | | | | | | | | | | |
| | | | | | | | |
| | | Commodity Contracts | | | Credit Contracts | | | Equity Contracts | | | Foreign Currency Exchange Contracts | | | Interest Rate Contracts | | | Other Contracts | | | Total | |
| | | | | | | |
Net Realized Gain (Loss) from: | | | | | | | | | | | | | | | | | | | | | | | | | | | | |
Futures contracts | | $ | — | | | $ | — | | | $ | 1,632,319 | | | $ | — | | | $ | (178,869 | ) | | $ | — | | | $ | 1,453,450 | |
Forward foreign currency exchange contracts | | | — | | | | — | | | | — | | | | (333,906 | ) | | | — | | | | — | | | | (333,906 | ) |
| | | | | | | | | | | | | | | | | | | | | | | | | | | | |
| | | | | | | |
| | $ | — | | | $ | — | | | $ | 1,632,319 | | | $ | (333,906 | ) | | $ | (178,869 | ) | | $ | — | | | $ | 1,119,544 | |
| | | | | | | | | | | | | | | | | | | | | | | | | | | | |
Net Change in Unrealized Appreciation (Depreciation) on: | | | | | | | | | | | | | | | | | | | | | | | | | | | | |
Futures contracts | | $ | — | | | $ | — | | | $ | 77,447 | | | $ | — | | | $ | (28,541 | ) | | $ | — | | | $ | 48,906 | |
Forward foreign currency exchange contracts | | | — | | | | — | | | | — | | | | (51,733 | ) | | | — | | | | — | | | | (51,733 | ) |
| | | | | | | | | | | | | | | | | | | | | | | | | | | | |
| | | | | | | |
| | $ | — | | | $ | — | | | $ | 77,447 | | | $ | (51,733 | ) | | $ | (28,541 | ) | | $ | — | | | $ | (2,827 | ) |
| | | | | | | | | | | | | | | | | | | | | | | | | | | | |
Average Quarterly Balances of Outstanding Derivative Financial Instruments
| | | | | | | | |
| | | |
Futures contracts: | | | | | | | | |
Average notional value of contracts — long | | | | | | $ | 20,315,658 | |
Average notional value of contracts — short | | | | | | $ | 7,463,919 | |
Forward foreign currency exchange contracts: | | | | | | | | |
Average amounts purchased — in USD | | | | | | $ | 3,716,471 | |
Average amounts sold — in USD | | | | | | $ | 9,329,055 | |
For more information about the LifePath Dynamic Fund’s investment risks regarding derivative financial instruments, refer to the Notes to Financial Statements.
| | |
SCHEDULE OF INVESTMENTS | | 47 |
| | |
Schedule of Investments (continued) December 31, 2021 | | BlackRock LifePath® Dynamic 2035 Fund |
Derivative Financial Instruments — Offsetting as of Period End
The LifePath Dynamic Fund’s derivative assets and liabilities (by type) were as follows:
| | | | | | | | |
| | | |
| | | Assets | | | Liabilities | |
| | |
Derivative Financial Instruments | | | | | | | | |
Futures contracts | | $ | 10,416 | | | $ | 45,630 | |
Forward foreign currency exchange contracts | | | 85,762 | | | | 52,307 | |
| | | | | | | | |
| | |
Total derivative assets and liabilities in the Statements of Assets and Liabilities | | | 96,178 | | | | 97,937 | |
| | | | | | | | |
| | |
Derivatives not subject to a Master Netting Agreement or similar agreement (“MNA”) | | | (10,416 | ) | | | (45,630 | ) |
| | | | | | | | |
| | |
Total derivative assets and liabilities subject to an MNA | | $ | 85,762 | | | $ | 52,307 | |
| | | | | | | | |
The following table presents the LifePath Dynamic Fund’s derivative assets and liabilities by counterparty net of amounts available for offset under an MNA and net of the related collateral received (and pledged) by the LifePath Dynamic Fund:
| | | | | | | | | | | | | | | | | | | | |
| | | | | | |
| Counterparty | |
| Derivative
Assets Subject to an MNA by Counterparty |
| |
| Derivatives
Available for Offset |
(a) | |
| Non-Cash
Collateral Received |
| |
| Cash
Collateral Received |
| |
| Net Amount
of Derivative Assets |
(b)(c) |
| | | | | |
Bank of America N.A. | | $ | 35,600 | | | $ | (35,600 | ) | | $ | — | | | $ | — | | | $ | — | |
Morgan Stanley & Co. International PLC | | | 50,162 | | | | — | | | | — | | | | — | | | | 50,162 | |
| | | | | | | | | | | | | | | | | | | | |
| | | | | |
| | $ | 85,762 | | | $ | (35,600 | ) | | $ | — | | | $ | — | | | $ | 50,162 | |
| | | | | | | | | | | | | | | | | | | | |
| | | | | | | | | | | | | | | | | | | | |
| | | | | | |
| Counterparty | |
| Derivative
Liabilities Subject to an MNA by Counterparty |
| |
| Derivatives
Available for Offset |
(a) | |
| Non-Cash
Collateral Pledged |
| |
| Cash
Collateral Pledged |
| |
| Net Amount
of Derivative Liabilities |
(b)(d) |
| | | | | |
Bank of America N.A. | | $ | 52,307 | | | $ | (35,600 | ) | | $ | — | | | $ | — | | | $ | 16,707 | |
| | | | | | | | | | | | | | | | | | | | |
| | (a) | The amount of derivatives available for offset is limited to the amount of derivative asset and/or liabilities that are subject to an MNA. | |
| | (b) | Net amount may also include forward foreign currency exchange contracts that are not required to be collateralized. | |
| | (c) | Net amount represents the net amount receivable from the counterparty in the event of default. | |
| | (d) | Net amount represents the net amount payable due to counterparty in the event of default. | |
Fair Value Hierarchy as of Period End
Various inputs are used in determining the fair value of financial instruments. For a description of the input levels and information about the LifePath Dynamic Fund’s policy regarding valuation of financial instruments, refer to the Notes to Financial Statements.
The following table summarizes the LifePath Dynamic Fund’s financial instruments categorized in the fair value hierarchy. The breakdown of the LifePath Dynamic Fund’s financial instruments into major categories is disclosed in the Schedule of Investments above.
| | | | | | | | | | | | | | | | |
| | | | | |
| | | Level 1 | | | Level 2 | | | Level 3 | | | Total | |
| | | | |
Assets | | | | | | | | | | | | | | | | |
Investments | | | | | | | | | | | | | | | | |
Investment Companies | | | | | | | | | | | | | | | | |
Equity Funds | | $ | 29,746,169 | | | $ | — | | | $ | — | | | $ | 29,746,169 | |
Fixed-Income Funds | | | 16,320,608 | | | | — | | | | — | | | | 16,320,608 | |
Money Market Funds | | | 8,909,957 | | | | — | | | | — | | | | 8,909,957 | |
| | | | | | | | | | | | | | | | |
| | | | |
| | $ | 54,976,734 | | | $ | — | | | $ | — | | | | 54,976,734 | |
| | | | | | | | | | | | | | | | |
| | | | |
Investments Valued at NAV(a) | | | | | | | | | | | | | | | 89,422,017 | |
| | | | | | | | | | | | | | | | |
| | | | |
| | | | | | | | | | | | | | $ | 144,398,751 | |
| | | | | | | | | | | | | | | | |
Derivative Financial Instruments(b) | | | | | | | | | | | | | | | | |
Assets | | | | | | | | | | | | | | | | |
Equity Contracts | | $ | 126,861 | | | $ | 91,974 | | | $ | — | | | $ | 218,835 | |
Foreign Currency Exchange Contracts | | | — | | | | 85,762 | | | | — | | | | 85,762 | |
Interest Rate Contracts | | | 36,408 | | | | — | | | | — | | | | 36,408 | |
Liabilities | | | | | | | | | | | | | | | | |
Equity Contracts | | | (16,829 | ) | | | — | | | | — | | | | (16,829 | ) |
| | |
| 48 | | 2 0 2 1 BLACK ROCK ANNUAL REPORT TO SHAREHOLDERS |
| | |
Schedule of Investments (continued) December 31, 2021 | | BlackRock LifePath® Dynamic 2035 Fund |
Fair Value Hierarchy as of Period End (continued)
| | | | | | | | | | | | | | | | |
| | | | | |
| | | Level 1 | | | Level 2 | | | Level 3 | | | Total | |
| | | | |
Liabilities (continued) | | | | | | | | | | | | | | | | |
Foreign Currency Exchange Contracts | | $ | — | | | $ | (52,307 | ) | | $ | — | | | $ | (52,307 | ) |
Interest Rate Contracts | | | (36,463 | ) | | | — | | | | — | | | | (36,463 | ) |
| | | | | | | | | | | | | | | | |
| | | | |
| | $ | 109,977 | | | $ | 125,429 | | | $ | — | | | $ | 235,406 | |
| | | | | | | | | | | | | | | | |
| | (a) | Certain investments of the Fund were fair valued using NAV per share or its equivalent as no quoted market value is available and therefore have been excluded from the fair value hierarchy. | |
| | (b) | Derivative financial instruments are futures contracts and forward foreign currency exchange contracts. Futures contracts and forward foreign currency exchange contracts are valued at the unrealized appreciation (depreciation) on the instrument. | |
See notes to financial statements.
| | |
SCHEDULE OF INVESTMENTS | | 49 |
| | |
Schedule of Investments December 31, 2021 | | BlackRock LifePath® Dynamic 2040 Fund (Percentages shown are based on Net Assets) |
| | | | | | | | |
| Security | | Shares/ Investment Value | | | Value | |
| |
Investment Companies(a) | | | | | |
| |
| Equity Funds — 83.0% | | | | |
BlackRock Advantage Emerging Markets Fund, Class K | | | 2,305,297 | | | $ | 27,271,662 | |
BlackRock Tactical Opportunities Fund, Class K | | | 1,054,568 | | | | 14,827,225 | |
Diversified Equity Master Portfolio | | $ | 137,197,917 | | | | 137,197,917 | |
International Tilts Master Portfolio | | $ | 41,922,691 | | | | 41,922,691 | |
iShares Developed Real Estate Index Fund, Class K | | | 1,046,918 | | | | 12,510,663 | |
iShares MSCI EAFE Small-Cap ETF(b) | | | 222,764 | | | | 16,281,821 | |
| | | | | | | | |
| | |
| | | | | | | 250,011,979 | |
| |
| Fixed-Income Funds — 13.5% | | | | |
Advantage CoreAlpha Bond Master Portfolio | | $ | 11,010,625 | | | | 11,010,625 | |
iShares Core U.S. Aggregate Bond ETF | | | 79,653 | | | | 9,086,814 | |
iShares iBoxx $Investment Grade Corporate Bond ETF(b) | | | 11,267 | | | | 1,493,103 | |
iShares TIPS Bond ETF | | | 83,478 | | | | 10,785,358 | |
Master Total Return Portfolio | | $ | 8,151,206 | | | | 8,151,206 | |
| | | | | | | | |
| | |
| | | | | | | 40,527,106 | |
| | | | | | | | |
| Security | | Shares | | | Value | |
| |
| |
| Money Market Funds — 3.8% | | | | |
BlackRock Cash Funds: Institutional, SL Agency Shares, 0.10%(c)(d) | | | 2,807,640 | | | | $ 2,808,483 | |
BlackRock Cash Funds: Treasury, SL Agency Shares, 0.01%(c) | | | 8,643,640 | | | | 8,643,640 | |
| | | | | | | | |
| | |
| | | | | | | 11,452,123 | |
| | | | | | | | |
| |
Total Investments — 100.3%
(Cost: $237,094,124) | | | | 301,991,208 | |
| |
Liabilities in Excess of Other Assets — (0.3)% | | | | (914,993 | ) |
| | | | | | | | |
| |
Net Assets — 100.0% | | | | $ 301,076,215 | |
| | | | | | | | |
| (a) | Affiliate of the Fund. |
| (b) | All or a portion of this security is on loan. |
| (c) | Annualized 7-day yield as of period end. |
| (d) | All or a portion of this security was purchased with the cash collateral from loaned securities. |
Affiliates
Investments in issuers considered to be affiliate(s) of the LifePath Dynamic Fund during the year ended December 31, 2021 for purposes of Section 2(a)(3) of the Investment Company Act of 1940, as amended, were as follows:
| | | | | | | | | | | | | | | | | | | | | | | | | | | | | | | | | | | | | | | | | | |
| | | | | | | |
| | | | | | | | | | | |
| | | Affiliated Issuer | | Value at 12/31/20 | | | Purchases at Cost | | | Proceeds from Sales | | | Net Realized Gain (Loss) | | | Change in Unrealized Appreciation (Depreciation) | | | Value at 12/31/21 | | | Shares/ Investment Value Held at 12/31/21 | | | Income | | | Capital Gain
Distributions from Underlying Funds | | | | |
| | | | | | | |
| | | | | | | | | | | |
| | Advantage CoreAlpha Bond Master Portfolio | | $ | 10,280,183 | | | $ | 1,131,948 | (a)(b) | | $ | — | | | $ | 45,709 | | | $ | (447,215 | ) | | $ | 11,010,625 | | | $ | 11,010,625 | | | $ | 223,637 | | | $ | — | | | | | |
| | BlackRock Advantage Emerging Markets Fund, Class K | | | 24,589,996 | | | | 8,116,250 | | | | (3,813,826 | ) | | | (69,037 | ) | | | (1,551,721 | ) | | | 27,271,662 | | | | 2,305,297 | | | | 389,285 | | | | — | | | | | |
| | BlackRock Cash Funds: Institutional, SL Agency Shares | | | 12,820,646 | | | | — | | | | (10,009,279 | )(a) | | | (2,884 | ) | | | — | | | | 2,808,483 | | | | 2,807,640 | | | | 15,507 | (c) | | | — | | | | | |
| | BlackRock Cash Funds: Treasury, SL Agency Shares | | | 1,641,951 | | | | 7,001,689 | (a) | | | — | | | | — | | | | — | | | | 8,643,640 | | | | 8,643,640 | | | | 420 | | | | — | | | | | |
| | BlackRock Tactical Opportunities Fund, Class K | | | 13,928,644 | | | | 782,960 | | | | — | | | | — | | | | 115,621 | | | | 14,827,225 | | | | 1,054,568 | | | | — | | | | — | | | | | |
| | Diversified Equity Master Portfolio | | | 130,367,106 | | | | — | | | | (25,211,122 | )(a)(b) | | | 37,398,149 | | | | (5,356,216 | ) | | | 137,197,917 | | | $ | 137,197,917 | | | | 1,311,092 | | | | — | | | | | |
| | International Tilts Master Portfolio | | | 38,908,496 | | | | — | | | | (1,206,190 | )(a)(b) | | | 4,290,791 | | | | (70,406 | ) | | | 41,922,691 | | | $ | 41,922,691 | | | | 763,367 | | | | — | | | | | |
| | iShares Core U.S. Aggregate Bond ETF | | | 8,931,027 | | | | 1,215,744 | | | | (750,805 | ) | | | (24,651 | ) | | | (284,501 | ) | | | 9,086,814 | | | | 79,653 | | | | 161,983 | | | | — | | | | | |
| | iShares Developed Real Estate Index Fund, Class K | | | 11,718,788 | | | | 556,035 | | | | (2,139,595 | ) | | | (30,591 | ) | | | 2,406,026 | | | | 12,510,663 | | | | 1,046,918 | | | | 536,058 | | | | 19,976 | | | | | |
| | iShares iBoxx $ Investment Grade Corporate Bond ETF | | | 1,348,701 | | | | 194,582 | | | | — | | | | — | | | | (50,180 | ) | | | 1,493,103 | | | | 11,267 | | | | 33,508 | | | | — | | | | | |
| | iShares MSCI EAFE Small-Cap ETF | | | 16,014,952 | | | | — | | | | (895,256 | ) | | | 106,131 | | | | 1,055,994 | | | | 16,281,821 | | | | 222,764 | | | | 490,037 | | | | — | | | | | |
| | iShares TIPS Bond ETF | | | 9,391,211 | | | | 2,397,793 | | | | (1,147,678 | ) | | | 435 | | | | 143,597 | | | | 10,785,358 | | | | 83,478 | | | | 459,566 | | | | — | | | | | |
| | Master Total Return Portfolio | | | 7,318,766 | | | | 989,857 | (a)(b) | | | — | | | | 69,435 | | | | (226,852 | ) | | | 8,151,206 | | | $ | 8,151,206 | | | | 143,153 | | | | — | | | | | |
| | | | | | | | | | | | | | | | | | | | | | | | | | | | | | | | | | | | | | | | | | |
| | | | | | | | | | | |
| | | | | | | | | | | | | | | | $ | 41,783,487 | | | $ | (4,265,853 | ) | | $ | 301,991,208 | | | | | | | $ | 4,527,613 | | | $ | 19,976 | | | | | |
| | | | | | | | | | | | | | | | | | | | | | | | | | | | | | | | | | | | | | | | | | |
| | (a) | Represents net amount purchased (sold). | |
| | (b) | Inclusive of income and expense allocated from the Master Portfolio. | |
| | (c) | All or a portion represents securities lending income earned from the reinvestment of cash collateral from loaned securities, net of fees and collateral investment expenses, and other payments to and from borrowers of securities. | |
| | |
| 50 | | 2 0 2 1 BLACK ROCK ANNUAL REPORT TO SHAREHOLDERS |
| | |
Schedule of Investments (continued) December 31, 2021 | | BlackRock LifePath® Dynamic 2040 Fund |
Derivative Financial Instruments Outstanding as of Period End
Futures Contracts
| | | | | | | | | | | | | | | | |
| |
| | | | |
| Description | | Number of
Contracts | | | Expiration
Date | | | Notional
Amount (000) | | | Value/
Unrealized
Appreciation
(Depreciation) | |
| |
| | | | |
Long Contracts | | | | | | | | | | | | | | | | |
IBEX 35 Index | | | 14 | | | | 01/21/22 | | | $ | 1,378 | | | $ | 50,025 | |
TOPIX Index | | | 52 | | | | 03/10/22 | | | | 9,018 | | | | 46,046 | |
S&P/TSE 60 Index | | | 36 | | | | 03/17/22 | | | | 7,291 | | | | 124,280 | |
FTSE 100 Index | | | 32 | | | | 03/18/22 | | | | 3,176 | | | | 73,028 | |
FTSE/MIB Index | | | 9 | | | | 03/18/22 | | | | 1,391 | | | | 32,899 | |
MSCI EAFE Index | | | 40 | | | | 03/18/22 | | | | 4,644 | | | | 64,969 | |
Russell 2000 E-Mini Index | | | 32 | | | | 03/18/22 | | | | 3,588 | | | | 54,299 | |
S&P 500 E-Mini Index | | | 11 | | | | 03/18/22 | | | | 2,617 | | | | 30,723 | |
10-Year U.S. Treasury Note | | | 67 | | | | 03/22/22 | | | | 8,732 | | | | 65,927 | |
| | | | | | | | | | | | | | | | |
| | | | |
| | | | | | | | | | | | | | | 542,196 | |
| | | | | | | | | | | | | | | | |
Short Contracts | | | | | | | | | | | | | | | | |
S&P 500 Micro E-Mini Index | | | 195 | | | | 03/18/22 | | | | 4,640 | | | | (69,674 | ) |
Ultra U.S. Treasury Bond | | | 28 | | | | 03/22/22 | | | | 5,491 | | | | (82,427 | ) |
| | | | | | | | | | | | | | | | |
| | | | |
| | | | | | | | | | | | | | | (152,101 | ) |
| | | | | | | | | | | | | | | | |
| | | | |
| | | | | | | | | | | | | | $ | 390,095 | |
| | | | | | | | | | | | | | | | |
Forward Foreign Currency Exchange Contracts
| | | | | | | | | | | | | | | | | | | | | | | | |
| |
| Currency Purchased | | | | | Currency Sold | | | Counterparty | | Settlement Date | | | | | Unrealized
Appreciation
(Depreciation) | |
| |
| | | | | | | | |
CAD | | | 9,065,946 | | | | | USD | | | 7,078,718 | | | Bank of America N.A. | | | 03/16/22 | | | | | $ | 87,267 | |
EUR | | | 8,702,014 | | | | | USD | | | 9,878,787 | | | Deutsche Bank AG | | | 03/16/22 | | | | | | 43,006 | |
USD | | | 3,453,594 | | | | | JPY | | | 388,979,565 | | | Morgan Stanley & Co. International PLC | | | 03/16/22 | | | | | | 70,116 | |
| | | | | | | | | | | | | | | | | | | | | | | | |
| | | | | | | | |
| | | | | | | | | | | | | | | | | | | | | | | 200,389 | |
| | | | | | | | | | | | | | | | | | | | | | | | |
| | | | | | | | |
USD | | | 3,168,224 | | | | | AUD | | | 4,451,909 | | | Bank of America N.A. | | | 03/16/22 | | | | | | (71,323 | ) |
USD | | | 342,696 | | | | | CAD | | | 439,000 | | | Bank of America N.A. | | | 03/16/22 | | | | | | (4,303 | ) |
USD | | | 3,216,877 | | | | | CAD | | | 4,119,960 | | | Bank of America N.A. | | | 03/16/22 | | | | | | (39,658 | ) |
USD | | | 474,527 | | | | | EUR | | | 418,000 | | | Bank of America N.A. | | | 03/16/22 | | | | | | (2,065 | ) |
| | | | | | | | | | | | | | | | | | | | | | | | |
| | | | | | | | |
| | | | | | | | | | | | | | | | | | | | | | | (117,349 | ) |
| | | | | | | | | | | | | | | | | | | | | | | | |
| | | | | | | | |
| | | | | | | | | | | | | | | | | | | | | | $ | 83,040 | |
| | | | | | | | | | | | | | | | | | | | | | | | |
| | |
SCHEDULE OF INVESTMENTS | | 51 |
| | |
Schedule of Investments (continued) December 31, 2021 | | BlackRock LifePath® Dynamic 2040 Fund |
Derivative Financial Instruments Categorized by Risk Exposure
As of period end, the fair values of derivative financial instruments located in the Statements of Assets and Liabilities were as follows:
| | | | | | | | | | | | | | | | | | | | | | | | | | | | |
| |
| | | | | | | |
| | | Commodity
Contracts | | | Credit
Contracts | | | Equity
Contracts | | | Foreign
Currency
Exchange
Contracts | | | Interest
Rate
Contracts | | | Other
Contracts | | | Total | |
| |
Assets — Derivative Financial Instruments | | | | | | | | | | | | | | | | | | | | | | | | | | | | |
Futures contracts | | | | | | | | | | | | | | | | | | | | | | | | | | | | |
Unrealized appreciation on futures contracts(a) | | $ | — | | | $ | — | | | $ | 476,269 | | | $ | — | | | $ | 65,927 | | | $ | — | | | $ | 542,196 | |
Forward foreign currency exchange contracts | | | | | | | | | | | | | | | | | | | | | | | | | | | | |
Unrealized appreciation on forward foreign currency exchange contracts | | | — | | | | — | | | | — | | | | 200,389 | | | | — | | | | — | | | | 200,389 | |
| | | | | | | | | | | | | | | | | | | | | | | | | | | | |
| | | | | | | |
| | $ | — | | | $ | — | | | $ | 476,269 | | | $ | 200,389 | | | $ | 65,927 | | | $ | — | | | $ | 742,585 | |
| | | | | | | | | | | | | | | | | | | | | | | | | | | | |
Liabilities — Derivative Financial Instruments | | | | | | | | | | | | | | | | | | | | | | | | | | | | |
Futures contracts | | | | | | | | | | | | | | | | | | | | | | | | | | | | |
Unrealized depreciation on futures contracts(a) | | $ | — | | | $ | — | | | $ | 69,674 | | | $ | — | | | $ | 82,427 | | | $ | — | | | $ | 152,101 | |
Forward foreign currency exchange contracts | | | | | | | | | | | | | | | | | | | | | | | | | | | | |
Unrealized depreciation on forward foreign currency exchange contracts | | | — | | | | — | | | | — | | | | 117,349 | | | | — | | | | — | | | | 117,349 | |
| | | | | | | | | | | | | | | | | | | | | | | | | | | | |
| | | | | | | |
| | $ | — | | | $ | — | | | $ | 69,674 | | | $ | 117,349 | | | $ | 82,427 | | | $ | — | | | $ | 269,450 | |
| | | | | | | | | | | | | | | | | | | | | | | | | | | | |
| | (a) | Net cumulative unrealized appreciation (depreciation) on futures contracts and centrally cleared swaps, if any, are reported in the Schedule of Investments. In the Statements of Assets and Liabilities, only current day’s variation margin is reported in receivables or payables and the net cumulative unrealized appreciation (depreciation) is included in accumulated earnings (loss). | |
For the period ended December 31, 2021, the effect of derivative financial instruments in the Statements of Operations was as follows:
| | | | | | | | | | | | | | | | | | | | | | | | | | | | |
| |
| | | | | | | |
| | | Commodity
Contracts | | | Credit
Contracts | | | Equity
Contracts | | | Foreign
Currency
Exchange
Contracts | | | Interest
Rate
Contracts | | | Other
Contracts | | | Total | |
| |
| | | | | | | |
Net Realized Gain (Loss) from: | | | | | | | | | | | | | | | | | | | | | | | | | | | | |
Futures contracts | | $ | — | | | $ | — | | | $ | 4,138,698 | | | $ | — | | | $ | (145,656 | ) | | $ | — | | | $ | 3,993,042 | |
Forward foreign currency exchange contracts | | | — | | | | — | | | | — | | | | (684,040 | ) | | | — | | | | — | | | | (684,040 | ) |
| | | | | | | | | | | | | | | | | | | | | | | | | | | | |
| | | | | | | |
| | $ | — | | | $ | — | | | $ | 4,138,698 | | | $ | (684,040 | ) | | $ | (145,656 | ) | | $ | — | | | $ | 3,309,002 | |
| | | | | | | | | | | | | | | | | | | | | | | | | | | | |
Net Change in Unrealized Appreciation (Depreciation) on: | | | | | | | | | | | | | | | | | | | | | | | | | | | | |
Futures contracts | | $ | — | | | $ | — | | | $ | 116,110 | | | $ | — | | | $ | (17,090 | ) | | $ | — | | | $ | 99,020 | |
Forward foreign currency exchange contracts | | | — | | | | — | | | | — | | | | (135,181 | ) | | | — | | | | — | | | | (135,181 | ) |
| | | | | | | | | | | | | | | | | | | | | | | | | | | | |
| | | | | | | |
| | $ | — | | | $ | — | | | $ | 116,110 | | | $ | (135,181 | ) | | $ | (17,090 | ) | | $ | — | | | $ | (36,161 | ) |
| | | | | | | | | | | | | | | | | | | | | | | | | | | | |
Average Quarterly Balances of Outstanding Derivative Financial Instruments
| | | | |
| |
| |
Futures contracts: | | | | |
Average notional value of contracts — long | | $ | 36,570,771 | |
Average notional value of contracts — short | | $ | 11,785,971 | |
Forward foreign currency exchange contracts: | | | | |
Average amounts purchased — in USD | | $ | 8,297,955 | |
Average amounts sold — in USD | | $ | 21,733,580 | |
| |
For more information about the LifePath Dynamic Fund’s investment risks regarding derivative financial instruments, refer to the Notes to Financial Statements.
| | |
| 52 | | 2 0 2 1 BLACK ROCK ANNUAL REPORT TO SHAREHOLDERS |
| | |
Schedule of Investments (continued) December 31, 2021 | | BlackRock LifePath® Dynamic 2040 Fund |
Derivative Financial Instruments — Offsetting as of Period End
The LifePath Dynamic Fund’s derivative assets and liabilities (by type) were as follows:
| | | | | | | | |
| | | |
| | | Assets | | | Liabilities | |
| | |
Derivative Financial Instruments | | | | | | | | |
Futures contracts | | $ | 22,543 | | | $ | 104,785 | |
Forward foreign currency exchange contracts | | | 200,389 | | | | 117,349 | |
| | | | | | | | |
| | |
Total derivative assets and liabilities in the Statements of Assets and Liabilities | | | 222,932 | | | | 222,134 | |
| | | | | | | | |
| | |
Derivatives not subject to a Master Netting Agreement or similar agreement (“MNA”) | | | (22,543 | ) | | | (104,785 | ) |
| | | | | | | | |
| | |
Total derivative assets and liabilities subject to an MNA | | $ | 200,389 | | | $ | 117,349 | |
| | | | | | | | |
The following table presents the LifePath Dynamic Fund’s derivative assets and liabilities by counterparty net of amounts available for offset under an MNA and net of the related collateral received (and pledged) by the LifePath Dynamic Fund:
| | | | | | | | | | | | | | | | | | | | |
| | | | | | |
Counterparty | |
| Derivative
Assets Subject to an MNA by Counterparty |
| |
| Derivatives
Available for Offset |
(a) | |
| Non-Cash
Collateral Received |
| |
| Cash
Collateral Received |
| |
| Net Amount
of Derivative Assets |
(b)(c) |
| | | | | |
Bank of America N.A | | $ | 87,267 | | | $ | (87,267) | | | $ | — | | | $ | — | | | $ | — | |
Deutsche Bank AG | | | 43,006 | | | | — | | | | — | | | | — | | | | 43,006 | |
Morgan Stanley & Co. International PLC | | | 70,116 | | | | — | | | | — | | | | — | | | | 70,116 | |
| | | | | | | | | | | | | | | | | | | | |
| | | | | |
| | $ | 200,389 | | | $ | (87,267) | | | $ | — | | | $ | — | | | $ | 113,122 | |
| | | | | | | | | | | | | | | | | | | | |
| | | | | | | | | | | | | | | | | | | | |
| | | | | | |
Counterparty | |
| Derivative
Liabilities Subject to an MNA by Counterparty |
| |
| Derivatives
Available for Offset |
(a) | |
| Non-Cash
Collateral Pledged |
| |
| Cash
Collateral Pledged |
| |
| Net Amount
of Derivative Liabilities |
(b)(d) |
| | | | | |
Bank of America N.A. | | $ | 117,349 | | | $ | (87,267) | | | $ | — | | | $ | — | | | $ | 30,082 | |
| | | | | | | | | | | | | | | | | | | | |
| | (a) | The amount of derivatives available for offset is limited to the amount of derivative asset and/or liabilities that are subject to an MNA. | |
| | (b) | Net amount may also include forward foreign currency exchange contracts that are not required to be collateralized. | |
| | (c) | Net amount represents the net amount receivable from the counterparty in the event of default. | |
| | (d) | Net amount represents the net amount payable due to counterparty in the event of default. | |
Fair Value Hierarchy as of Period End
Various inputs are used in determining the fair value of financial instruments. For a description of the input levels and information about the LifePath Dynamic Fund’s policy regarding valuation of financial instruments, refer to the Notes to Financial Statements.
The following table summarizes the LifePath Dynamic Fund’s financial instruments categorized in the fair value hierarchy. The breakdown of the LifePath Dynamic Fund’s financial instruments into major categories is disclosed in the Schedule of Investments above.
| | | | | | | | | | | | | | | | |
| | | | | |
| | | Level 1 | | | Level 2 | | | Level 3 | | | Total | |
| | | | |
Assets | | | | | | | | | | | | | | | | |
Investments | | | | | | | | | | | | | | | | |
Investment Companies | | | | | | | | | | | | | | | | |
Equity Funds | | $ | 70,891,371 | | | $ | — | | | $ | — | | | $ | 70,891,371 | |
Fixed-Income Funds | | | 21,365,275 | | | | — | | | | — | | | | 21,365,275 | |
Money Market Funds | | | 11,452,123 | | | | — | | | | — | | | | 11,452,123 | |
| | | | | | | | | | | | | | | | |
| | | | |
| | $ | 103,708,769 | | | $ | — | | | $ | — | | | | 103,708,769 | |
| | | | | | | | | | | | | | | | |
| | | | |
Investments Valued at NAV(a) | | | | | | | | | | | | | | | 198,282,439 | |
| | | | | | | | | | | | | | | | |
| | | | |
| | | | | | | | | | | | | | $ | 301,991,208 | |
| | | | | | | | | | | | | | | | |
Derivative Financial Instruments(b) | | | | | | | | | | | | | | | | |
Assets | | | | | | | | | | | | | | | | |
Equity Contracts | | $ | 274,271 | | | $ | 201,998 | | | $ | — | | | $ | 476,269 | |
Foreign Currency Exchange Contracts | | | — | | | | 200,389 | | | | — | | | | 200,389 | |
Interest Rate Contracts | | | 65,927 | | | | — | | | | — | | | | 65,927 | |
| | |
SCHEDULE OF INVESTMENTS | | 53 |
| | |
Schedule of Investments (continued) December 31, 2021 | | BlackRock LifePath® Dynamic 2040 Fund |
Fair Value Hierarchy as of Period End (continued)
| | | | | | | | | | | | | | | | |
| |
| | | | |
| | | Level 1 | | | Level 2 | | | Level 3 | | | Total | |
| |
| | | | |
Liabilities | | | | | | | | | | | | | | | | |
Equity Contracts | | $ | (69,674 | ) | | $ | — | | | $ | — | | | $ | (69,674 | ) |
Foreign Currency Exchange Contracts | | | — | | | | (117,349 | ) | | | — | | | | (117,349 | ) |
Interest Rate Contracts | | | (82,427 | ) | | | — | | | | — | | | | (82,427 | ) |
| | | | | | | | | | | | | | | | |
| | | | |
| | $ | 188,097 | | | $ | 285,038 | | | $ | — | | | $ | 473,135 | |
| | | | | | | | | | | | | | | | |
| | (a) | Certain investments of the Fund were fair valued using NAV per share or its equivalent as no quoted market value is available and therefore have been excluded from the fair value hierarchy. | |
| | (b) | Derivative financial instruments are futures contracts and forward foreign currency exchange contracts. Futures contracts and forward foreign currency exchange contracts are valued at the unrealized appreciation (depreciation) on the instrument. | |
See notes to financial statements.
| | |
| 54 | | 2 0 2 1 BLACK ROCK ANNUAL REPORT TO SHAREHOLDERS |
| | |
Schedule of Investments December 31, 2021 | | BlackRock LifePath® Dynamic 2045 Fund (Percentages shown are based on Net Assets) |
| | | | | | | | |
| Security | | Shares/
Investment Value | | | Value | |
| |
| | |
Investment Companies(a) | | | | | | | | |
| | |
Equity Funds — 91.3% | | | | | | | | |
BlackRock Advantage Emerging Markets Fund, Class K | | | 1,031,949 | | | $ | 12,207,963 | |
BlackRock Tactical Opportunities Fund, Class K | | | 394,145 | | | | 5,541,674 | |
Diversified Equity Master Portfolio | | $ | 60,217,695 | | | | 60,217,695 | |
International Tilts Master Portfolio | | $ | 17,360,706 | | | | 17,360,706 | |
iShares Developed Real Estate Index Fund, Class K | | | 454,127 | | | | 5,426,822 | |
iShares MSCI EAFE Small-Cap ETF(b) | | | 92,136 | | | | 6,734,220 | |
| | | | | | | | |
| | |
| | | | | | | 107,489,080 | |
| | |
Fixed-Income Funds — 5.3% | | | | | | | | |
Advantage CoreAlpha Bond Master Portfolio | | $ | 1,551,682 | | | | 1,551,682 | |
iShares Core U.S. Aggregate Bond ETF | | | 9,972 | | | | 1,137,606 | |
iShares iBoxx $Investment Grade Corporate Bond ETF(b) | | | 2,347 | | | | 311,024 | |
iShares TIPS Bond ETF(b) | | | 17,010 | | | | 2,197,692 | |
Master Total Return Portfolio | | $ | 1,053,452 | | | | 1,053,452 | |
| | | | | | | | |
| | |
| | | | | | | 6,251,456 | |
| | | | | | | | |
| | | | | | | | |
| Security | | Shares | | | Value | |
| |
| | |
Money Market Funds — 10.0% | | | | | | | | |
BlackRock Cash Funds: Institutional, SL Agency Shares, 0.10%(c)(d) | | | 8,370,571 | | | $ | 8,373,082 | |
BlackRock Cash Funds: Treasury, SL Agency Shares, 0.01%(c) | | | 3,338,716 | | | | 3,338,716 | |
| | | | | | | | |
| | |
| | | | | | | 11,711,798 | |
| | | | | | | | |
| |
Total Investments — 106.6%
(Cost: $108,340,097) | | | | 125,452,334 | |
| |
Liabilities in Excess of Other Assets — (6.6)% | | | | (7,720,571 | ) |
| | | | | | | | |
| |
Net Assets — 100.0% | | | $ | 117,731,763 | |
| | | | | | | | |
| (a) | Affiliate of the Fund. |
| (b) | All or a portion of this security is on loan. |
| (c) | Annualized 7-day yield as of period end. |
| (d) | All or a portion of this security was purchased with the cash collateral from loaned securities. |
Affiliates
Investments in issuers considered to be affiliate(s) of the LifePath Dynamic Fund during the year ended December 31, 2021 for purposes of Section 2(a)(3) of the Investment Company Act of 1940, as amended, were as follows:
| | | | | | | | | | | | | | | | | | | | | | | | | | | | | | | | | | | | | | | | |
| | | | | |
| | | | | | | | | | | |
| | | Affiliated Issuer | | Value at 12/31/20 | | | Purchases at Cost | | | Proceeds from Sales | | | Net Realized Gain (Loss) | | | Change in Unrealized Appreciation (Depreciation) | | | Value at 12/31/21 | | | Shares/ Investment Value Held at 12/31/21 | | | Income | | | Capital Gain Distributions from Underlying Funds | | | |
| | | | | |
| | | | | | | | | | | |
| | Advantage CoreAlpha Bond Master Portfolio | | $ | 1,216,067 | | | $ | 385,448 | (a)(b) | | $ | — | | | $ | (13,174 | ) | | $ | (36,659 | ) | | $ | 1,551,682 | | | $ | 1,551,682 | | | $ | 30,026 | | | $ | — | | | |
| | BlackRock Advantage Emerging Markets Fund, Class K | | | 9,546,725 | | | | 3,737,004 | | | | (288,215 | ) | | | 8,770 | | | | (796,321 | ) | | | 12,207,963 | | | | 1,031,949 | | | | 165,105 | | | | — | | | |
| | BlackRock Cash Funds: Institutional, SL Agency Shares | | | — | | | | 8,373,980 | (a) | | | — | | | | (301 | ) | | | (597 | ) | | | 8,373,082 | | | | 8,370,571 | | | | 6,358 | (c) | | | — | | | |
| | BlackRock Cash Funds: Treasury, SL Agency Shares | | | 1,012,127 | | | | 2,326,589 | (a) | | | — | | | | — | | | | — | | | | 3,338,716 | | | | 3,338,716 | | | | 237 | | | | — | | | |
| | BlackRock Tactical Opportunities Fund, Class K | | | 4,369,482 | | | | 1,128,636 | | | | — | | | | — | | | | 43,556 | | | | 5,541,674 | | | | 394,145 | | | | — | | | | — | | | |
| | Diversified Equity Master Portfolio | | | 43,785,735 | | | | 4,254,298 | (a)(b) | | | — | | | | 11,027,636 | | | | 1,150,026 | | | | 60,217,695 | | | $ | 60,217,695 | | | | 512,857 | | | | — | | | |
| | International Tilts Master Portfolio | | | 13,166,933 | | | | 2,664,566 | (a)(b) | | | — | | | | 1,291,557 | | | | 237,650 | | | | 17,360,706 | | | $ | 17,360,706 | | | | 284,211 | | | | — | | | |
| | iShares Core U.S. Aggregate Bond ETF | | | 1,021,280 | | | | 151,692 | | | | — | | | | — | | | | (35,366 | ) | | | 1,137,606 | | | | 9,972 | | | | 19,640 | | | | — | | | |
| | iShares Developed Real Estate Index Fund, Class K | | | 3,914,605 | | | | 615,222 | | | | — | | | | — | | | | 896,995 | | | | 5,426,822 | | | | 454,127 | | | | 211,077 | | | | 8,437 | | | |
| | iShares iBoxx $Investment Grade Corporate Bond ETF | | | 250,706 | | | | 69,131 | | | | — | | | | — | | | | (8,813 | ) | | | 311,024 | | | | 2,347 | | | | 6,824 | | | | — | | | |
| | iShares MSCI EAFE Small-Cap ETF | | | 4,570,974 | | | | 1,794,124 | | | | — | | | | — | | | | 369,122 | | | | 6,734,220 | | | | 92,136 | | | | 192,035 | | | | — | | | |
| | iShares TIPS Bond ETF | | | 1,401,342 | | | | 765,620 | | | | — | | | | — | | | | 30,730 | | | | 2,197,692 | | | | 17,010 | | | | 87,062 | | | | — | | | |
| | Master Total Return Portfolio | | | 839,121 | | | | 231,974 | (a)(b) | | | — | | | | 9,015 | | | | (26,658 | ) | | | 1,053,452 | | | $ | 1,053,452 | | | | 19,094 | | | | — | | | |
| | | | | | | | | | | | | | | | | | | | | | | | | | | | | | | | | | | | | | | | |
| | | | | | | | | | | |
| | | | | | | | | | | | | | | | $ | 12,323,503 | | | $ | 1,823,665 | | | $ | 125,452,334 | | | | | | | $ | 1,534,526 | | | $ | 8,437 | | | |
| | | | | | | | | | | | | | | | | | | | | | | | | | | | | | | | | | | | | | | | |
| | (a) | Represents net amount purchased (sold). | |
| | (b) | Inclusive of income and expense allocated from the Master Portfolio. | |
| | (c) | All or a portion represents securities lending income earned from the reinvestment of cash collateral from loaned securities, net of fees and collateral investment expenses, and other payments to and from borrowers of securities. | |
| | |
SCHEDULE OF INVESTMENTS | | 55 |
| | |
Schedule of Investments (continued) December 31, 2021 | | BlackRock LifePath® Dynamic 2045 Fund |
Derivative Financial Instruments Outstanding as of Period End
Futures Contracts
| | | | | | | | | | | | | | | | |
| | | | | |
| Description | | Number of Contracts | | | Expiration Date | | | Notional Amount (000) | | | Value/ Unrealized Appreciation (Depreciation) | |
| | | | |
Long Contracts | | | | | | | | | | | | | | | | |
IBEX 35 Index | | | 5 | | | | 01/21/22 | | | $ | 492 | | | $ | 15,566 | |
TOPIX Index | | | 20 | | | | 03/10/22 | | | | 3,468 | | | | 15,467 | |
S&P/TSE 60 Index | | | 16 | | | | 03/17/22 | | | | 3,240 | | | | 55,194 | |
FTSE 100 Index | | | 12 | | | | 03/18/22 | | | | 1,191 | | | | 27,385 | |
FTSE/MIB Index | | | 3 | | | | 03/18/22 | | | | 464 | | | | 10,966 | |
MSCI EAFE Index | | | 32 | | | | 03/18/22 | | | | 3,715 | | | | 51,975 | |
Russell 2000 E-Mini Index | | | 11 | | | | 03/18/22 | | | | 1,234 | | | | 18,665 | |
10-Year U.S. Treasury Note | | | 18 | | | | 03/22/22 | | | | 2,346 | | | | 17,712 | |
| | | | | | | | | | | | | | | | |
| | | | |
| | | | | | | | | | | | | | | 212,930 | |
| | | | | | | | | | | | | | | | |
Short Contracts | | | | | | | | | | | | | | | | |
S&P 500 E-Mini Index | | | 5 | | | | 03/18/22 | | | | 1,190 | | | | (13,766 | ) |
S&P 500 Micro E-Mini Index | | | 12 | | | | 03/18/22 | | | | 286 | | | | 19 | |
Ultra U.S. Treasury Bond | | | 11 | | | | 03/22/22 | | | | 2,157 | | | | (30,286 | ) |
| | | | | | | | | | | | | | | | |
| | | | |
| | | | | | | | | | | | | | | (44,033 | ) |
| | | | | | | | | | | | | | | | |
| | | | |
| | | | | | | | | | | | | | $ | 168,897 | |
| | | | | | | | | | | | | | | | |
Forward Foreign Currency Exchange Contracts
| | | | | | | | | | | | | | | | | | | | | | | | |
| Currency Purchased | | | | Currency Sold | | | Counterparty | | Settlement Date | | | | | Unrealized Appreciation (Depreciation) | |
| | | | | | | | |
CAD | | 3,853,994 | | | | | USD | | | | 3,009,211 | | | Bank of America N.A. | | | 03/16/22 | | | | | $ | 37,098 | |
EUR | | 141,000 | | | | | USD | | | | 159,798 | | | Bank of America N.A. | | | 03/16/22 | | | | | | 966 | |
EUR | | 3,348,263 | | | | | USD | | | | 3,800,979 | | | Morgan Stanley & Co. International PLC | | | 03/16/22 | | | | | | 16,616 | |
USD | | 1,288,200 | | | | | JPY | | | | 145,083,938 | | | Morgan Stanley & Co. International PLC | | | 03/16/22 | | | | | | 26,210 | |
| | | | | | | | | | | | | | | | | | | | | | | | |
| | | | | | | | |
| | | | | | | | | | | | | | | | | | | | | | | 80,890 | |
| | | | | | | | | | | | | | | | | | | | | | | | |
USD | | 1,270,988 | | | | | AUD | | | | 1,785,532 | | | Morgan Stanley & Co. International PLC | | | 03/16/22 | | | | | | (28,300 | ) |
USD | | 101,231 | | | | | CAD | | | | 130,000 | | | Bank of America N.A. | | | 03/16/22 | | | | | | (1,525 | ) |
USD | | 1,198,914 | | | | | CAD | | | | 1,535,488 | | | Bank of America N.A. | | | 03/16/22 | | | | | | (14,780 | ) |
USD | | 172,555 | | | | | EUR | | | | 152,000 | | | Bank of America N.A. | | | 03/16/22 | | | | | | (751 | ) |
| | | | | | | | | | | | | | | | | | | | | | | | |
| | | | | | | | |
| | | | | | | | | | | | | | | | | | | | | | | (45,356 | ) |
| | | | | | | | | | | | | | | | | | | | | | | | |
| | | | | | | | |
| | | | | | | | | | | | | | | | | | | | | | $ | 35,534 | |
| | | | | | | | | | | | | | | | | | | | | | | | |
| | |
| 56 | | 2 0 2 1 BLACK ROCK ANNUAL REPORT TO SHAREHOLDERS |
| | |
Schedule of Investments (continued) December 31, 2021 | | BlackRock LifePath® Dynamic 2045 Fund |
Derivative Financial Instruments Categorized by Risk Exposure
As of period end, the fair values of derivative financial instruments located in the Statements of Assets and Liabilities were as follows:
| | | | | | | | | | | | | | | | | | | | | | | | | | | | |
| | | | | | | | |
| | | Commodity Contracts | | | Credit Contracts | | | Equity Contracts | | | Foreign Currency Exchange Contracts | | | Interest Rate Contracts | | | Other Contracts | | | Total | |
| | | | | | | |
Assets — Derivative Financial Instruments | | | | | | | | | | | | | | | | | | | | | | | | | | | | |
Futures contracts | | | | | | | | | | | | | | | | | | | | | | | | | | | | |
Unrealized appreciation on futures contracts(a) | | $ | — | | | $ | — | | | $ | 195,237 | | | $ | — | | | $ | 17,712 | | | $ | — | | | $ | 212,949 | |
Forward foreign currency exchange contracts | | | | | | | | | | | | | | | | | | | | | | | | | | | | |
Unrealized appreciation on forward foreign currency exchange contracts | | | — | | | | — | | | | — | | | | 80,890 | | | | — | | | | — | | | | 80,890 | |
| | | | | | | | | | | | | | | | | | | | | | | | | | | | |
| | | | | | | |
| | $ | — | | | $ | — | | | $ | 195,237 | | | $ | 80,890 | | | $ | 17,712 | | | $ | — | | | $ | 293,839 | |
| | | | | | | | | | | | | | | | | | | | | | | | | | | | |
Liabilities — Derivative Financial Instruments | | | | | | | | | | | | | | | | | | | | | | | | | | | | |
Futures contracts | | | | | | | | | | | | | | | | | | | | | | | | | | | | |
Unrealized depreciation on futures contracts(a) | | $ | — | | | $ | — | | | $ | 13,766 | | | $ | — | | | $ | 30,286 | | | $ | — | | | $ | 44,052 | |
Forward foreign currency exchange contracts | | | | | | | | | | | | | | | | | | | | | | | | | | | | |
Unrealized depreciation on forward foreign currency exchange contracts | | | — | | | | — | | | | — | | | | 45,356 | | | | — | | | | — | | | | 45,356 | |
| | | | | | | | | | | | | | | | | | | | | | | | | | | | |
| | | | | | | |
| | $ | — | | | $ | — | | | $ | 13,766 | | | $ | 45,356 | | | $ | 30,286 | | | $ | — | | | $ | 89,408 | |
| | | | | | | | | | | | | | | | | | | | | | | | | | | | |
| | (a) | Net cumulative unrealized appreciation (depreciation) on futures contracts and centrally cleared swaps, if any, are reported in the Schedule of Investments. In the Statements of Assets and Liabilities, only current day’s variation margin is reported in receivables or payables and the net cumulative unrealized appreciation (depreciation) is included in accumulated earnings (loss). | |
For the period ended December 31, 2021, the effect of derivative financial instruments in the Statements of Operations was as follows:
| | | | | | | | | | | | | | | | | | | | | | | | | | | | |
| | | | | | | | |
| | | Commodity Contracts | | | Credit Contracts | | | Equity Contracts | | | Foreign Currency Exchange Contracts | | | Interest Rate Contracts | | | Other Contracts | | | Total | |
| | | | | | | |
Net Realized Gain (Loss) from: | | | | | | | | | | | | | | | | | | | | | | | | | | | | |
Futures contracts | | $ | — | | | $ | — | | | $ | 1,498,154 | | | $ | — | | | $ | (91,713 | ) | | $ | — | | | $ | 1,406,441 | |
Forward foreign currency exchange contracts | | | — | | | | — | | | | — | | | | (294,424 | ) | | | — | | | | — | | | | (294,424 | ) |
| | | | | | | | | | | | | | | | | | | | | | | | | | | | |
| | | | | | | |
| | $ | — | | | $ | — | | | $ | 1,498,154 | | | $ | (294,424 | ) | | $ | (91,713 | ) | | $ | — | | | $ | 1,112,017 | |
| | | | | | | | | | | | | | | | | | | | | | | | | | | | |
Net Change in Unrealized Appreciation (Depreciation) on: | | | | | | | | | | | | | | | | | | | | | | | | | | | | |
Futures contracts | | $ | — | | | $ | — | | | $ | 104,441 | | | $ | — | | | $ | (12,574 | ) | | $ | — | | | $ | 91,867 | |
Forward foreign currency exchange contracts | | | — | | | | — | | | | — | | | | (32,923 | ) | | | — | | | | — | | | | (32,923 | ) |
| | | | | | | | | | | | | | | | | | | | | | | | | | | | |
| | | | | | | |
| | $ | — | | | $ | — | | | $ | 104,441 | | | $ | (32,923 | ) | | $ | (12,574 | ) | | $ | — | | | $ | 58,944 | |
| | | | | | | | | | | | | | | | | | | | | | | | | | | | |
Average Quarterly Balances of Outstanding Derivative Financial Instruments
| | | | |
| | |
Futures contracts: | | | | |
Average notional value of contracts — long | | $ | 14,325,783 | |
Average notional value of contracts — short | | $ | 3,036,757 | |
Forward foreign currency exchange contracts: | | | | |
Average amounts purchased — in USD | | $ | 3,069,752 | |
Average amounts sold — in USD | | $ | 7,985,100 | |
For more information about the LifePath Dynamic Fund’s investment risks regarding derivative financial instruments, refer to the Notes to Financial Statements.
| | |
SCHEDULE OF INVESTMENTS | | 57 |
| | |
Schedule of Investments (continued) December 31, 2021 | | BlackRock LifePath® Dynamic 2045 Fund |
Derivative Financial Instruments — Offsetting as of Period End
The LifePath Dynamic Fund’s derivative assets and liabilities (by type) were as follows:
| | | | | | | | |
| | | |
| | | Assets | | | Liabilities | |
| | |
Derivative Financial Instruments | | | | | | | | |
Futures contracts | | $ | 8,372 | | | $ | 38,863 | |
Forward foreign currency exchange contracts | | | 80,890 | | | | 45,356 | |
| | | | | | | | |
| | |
Total derivative assets and liabilities in the Statements of Assets and Liabilities | | | 89,262 | | | | 84,219 | |
| | | | | | | | |
| | |
Derivatives not subject to a Master Netting Agreement or similar agreement (“MNA”) | | | (8,372 | ) | | | (38,863 | ) |
| | | | | | | | |
| | |
Total derivative assets and liabilities subject to an MNA | | $ | 80,890 | | | $ | 45,356 | |
| | | | | | | | |
The following table presents the LifePath Dynamic Fund’s derivative assets and liabilities by counterparty net of amounts available for offset under an MNA and net of the related collateral received (and pledged) by the LifePath Dynamic Fund:
| | | | | | | | | | | | | | | | | | | | |
| | | | | | |
| Counterparty | |
| Derivative
Assets Subject to an MNA by Counterparty |
| |
| Derivatives
Available for Offset |
(a) | |
| Non-Cash
Collateral Received |
| |
| Cash
Collateral Received |
| |
| Net Amount
of Derivative Assets |
(b)(c) |
| | | | | |
Bank of America N.A. | | $ | 38,064 | | | $ | (17,056) | | | $ | — | | | $ | — | | | $ | 21,008 | |
Morgan Stanley & Co. International PLC | | | 42,826 | | | | (28,300) | | | | — | | | | — | | | | 14,526 | |
| | | | | | | | | | | | | | | | | | | | |
| | | | | |
| | $ | 80,890 | | | $ | (45,356) | | | $ | — | | | $ | — | | | $ | 35,534 | |
| | | | | | | | | | | | | | | | | | | | |
| | | | | | | | | | | | | | | | | | | | |
| | | | | | |
| Counterparty | |
| Derivative
Liabilities Subject to an MNA by Counterparty |
| |
| Derivatives
Available for Offset |
(a) | |
| Non-Cash
Collateral Pledged |
| |
| Cash
Collateral Pledged |
| |
| Net Amount
of Derivative Liabilities |
(b)(d) |
| | | | | |
Bank of America N.A. | | $ | 17,056 | | | $ | (17,056) | | | $ | — | | | $ | — | | | $ | — | |
Morgan Stanley & Co. International PLC | | | 28,300 | | | | (28,300) | | | | — | | | | — | | | | — | |
| | | | | | | | | | | | | | | | | | | | |
| | | | | |
| | $ | 45,356 | | | $ | (45,356) | | | $ | — | | | $ | — | | | $ | — | |
| | | | | | | | | | | | | | | | | | | | |
| | (a) | The amount of derivatives available for offset is limited to the amount of derivative asset and/or liabilities that are subject to an MNA. | |
| | (b) | Net amount may also include forward foreign currency exchange contracts that are not required to be collateralized. | |
| | (c) | Net amount represents the net amount receivable from the counterparty in the event of default. | |
| | (d) | Net amount represents the net amount payable due to counterparty in the event of default. | |
Fair Value Hierarchy as of Period End
Various inputs are used in determining the fair value of financial instruments. For a description of the input levels and information about the LifePath Dynamic Fund’s policy regarding valuation of financial instruments, refer to the Notes to Financial Statements.
The following table summarizes the LifePath Dynamic Fund’s financial instruments categorized in the fair value hierarchy. The breakdown of the LifePath Dynamic Fund’s financial instruments into major categories is disclosed in the Schedule of Investments above.
| | | | | | | | | | | | | | | | |
| | | | | |
| | | Level 1 | | | Level 2 | | | Level 3 | | | Total | |
| | | | |
Assets | | | | | | | | | | | | | | | | |
Investments | | | | | | | | | | | | | | | | |
Investment Companies | | | | | | | | | | | | | | | | |
Equity Funds | | $ | 29,910,679 | | | $ | — | | | $ | — | | | $ | 29,910,679 | |
Fixed-Income Funds | | | 3,646,322 | | | | — | | | | — | | | | 3,646,322 | |
Money Market Funds | | | 11,711,798 | | | | — | | | | — | | | | 11,711,798 | |
| | | | | | | | | | | | | | | | |
| | | | |
| | $ | 45,268,799 | | | $ | — | | | $ | — | | | | 45,268,799 | |
| | | | | | | | | | | | | | | | |
| | | | |
Investments Valued at NAV(a) | | | | | | | | | | | | | | | 80,183,535 | |
| | | | | | | | | | | | | | | | |
| | | | |
| | | | | | | | | | | | | | $ | 125,452,334 | |
| | | | | | | | | | | | | | | | |
Derivative Financial Instruments(b) | | | | | | | | | | | | | | | | |
Assets | | | | | | | | | | | | | | | | |
Equity Contracts | | $ | 125,853 | | | $ | 69,384 | | | $ | — | | | $ | 195,237 | |
| | |
| 58 | | 2 0 2 1 BLACK ROCK ANNUAL REPORT TO SHAREHOLDERS |
| | |
Schedule of Investments (continued) December 31, 2021 | | BlackRock LifePath® Dynamic 2045 Fund |
Fair Value Hierarchy as of Period End (continued)
| | | | | | | | | | | | | | | | |
| | | | | |
| | | Level 1 | | | Level 2 | | | Level 3 | | | Total | |
Assets (continued) | | | | | | | | | | | | | | | | |
Foreign Currency Exchange Contracts | | $ | — | | | $ | 80,890 | | | $ | — | | | $ | 80,890 | |
Interest Rate Contracts | | | 17,712 | | | | — | | | | — | | | | 17,712 | |
Liabilities | | | | | | | | | | | | | | | | |
Equity Contracts | | | (13,766 | ) | | | — | | | | — | | | | (13,766 | ) |
Foreign Currency Exchange Contracts | | | — | | | | (45,356 | ) | | | — | | | | (45,356 | ) |
Interest Rate Contracts | | | (30,286 | ) | | | — | | | | — | | | | (30,286 | ) |
| | | | | | | | | | | | | | | | |
| | | | |
| | $ | 99,513 | | | $ | 104,918 | | | $ | — | | | $ | 204,431 | |
| | | | | | | | | | | | | | | | |
| | (a) | Certain investments of the Fund were fair valued using NAV per share or its equivalent as no quoted market value is available and therefore have been excluded from the fair value hierarchy. | |
| | (b) | Derivative financial instruments are futures contracts and forward foreign currency exchange contracts. Futures contracts and forward foreign currency exchange contracts are valued at the unrealized appreciation (depreciation) on the instrument. | |
See notes to financial statements.
| | |
SCHEDULE OF INVESTMENTS | | 59 |
| | |
Schedule of Investments December 31, 2021 | | BlackRock LifePath® Dynamic 2050 Fund (Percentages shown are based on Net Assets) |
| | | | | | | | |
| | |
| Security | | Shares/
Investment Value | | | Value | |
| | |
Investment Companies(a) | | | | | | | | |
|
Equity Funds — 91.5% | |
BlackRock Advantage Emerging Markets Fund, Class K | | | 1,570,207 | | | $ | 18,575,551 | |
Diversified Equity Master Portfolio | | $ | 92,923,674 | | | | 92,923,674 | |
International Tilts Master Portfolio | | $ | 25,941,682 | | | | 25,941,682 | |
iShares Developed Real Estate Index Fund, Class K | | | 700,010 | | | | 8,365,119 | |
iShares MSCI EAFE Small-Cap ETF | | | 140,886 | | | | 10,297,358 | |
| | | | | | | | |
| | |
| | | | | | | 156,103,384 | |
|
Fixed-Income Funds — 2.2% | |
Advantage CoreAlpha Bond Master Portfolio | | $ | 627,347 | | | | 627,347 | |
iShares Core U.S. Aggregate Bond ETF | | | 11,490 | | | | 1,310,779 | |
iShares iBoxx $ Investment Grade Corporate Bond ETF(b) | | | 2,373 | | | | 314,470 | |
iShares TIPS Bond ETF | | | 7,991 | | | | 1,032,437 | |
Master Total Return Portfolio | | $ | 467,731 | | | | 467,731 | |
| | | | | | | | |
| | |
| | | | | | | 3,752,764 | |
| | | | | | | | |
| | |
| Security | | Shares | | | Value | |
| |
| | |
Money Market Funds — 6.2% | | | | | | | | |
BlackRock Cash Funds: Institutional, SL Agency Shares, 0.10%(c)(d) | | | 320,243 | | | $ | 320,339 | |
BlackRock Cash Funds: Treasury, SL Agency Shares, 0.01%(c) | | | 10,214,291 | | | | 10,214,291 | |
| | | | | | | | |
| | |
| | | | | | | 10,534,630 | |
| | | | | | | | |
| |
Total Investments — 99.9%
(Cost: $129,239,553) | | | | 170,390,778 | |
| |
Other Assets Less Liabilities — 0.1% | | | | 97,589 | |
| | | | | | | | |
| |
Net Assets — 100.0% | | | $ | 170,488,367 | |
| | | | | | | | |
| (a) | Affiliate of the Fund. |
| (b) | All or a portion of this security is on loan. |
| (c) | Annualized 7-day yield as of period end. |
| (d) | All or a portion of this security was purchased with the cash collateral from loaned securities. |
Affiliates
Investments in issuers considered to be affiliate(s) of the LifePath Dynamic Fund during the year ended December 31, 2021 for purposes of Section 2(a)(3) of the Investment Company Act of 1940, as amended, were as follows:
| | | | | | | | | | | | | | | | | | | | | | | | | | | | | | | | | | | | | | | | |
| | | | | | | | | | | |
| | | Affiliated Issuer | | Value at 12/31/20 | | | Purchases at Cost | | | Proceeds from Sales | | | Net Realized Gain (Loss) | | | Change in Unrealized Appreciation (Depreciation) | | | Value at 12/31/21 | | | Shares/ Investment Value Held at 12/31/21 | | | Income | | | Capital Gain Distributions from Underlying Funds | | | |
| | Advantage CoreAlpha Bond Master Portfolio | | $ | 474,526 | | | $ | 172,755 | (a)(b) | | $ | — | | | $ | (471 | ) | | $ | (19,463 | ) | | $ | 627,347 | | | $ | 627,347 | | | $ | 11,735 | | | $ | — | | | |
| | BlackRock Advantage Emerging Markets Fund, Class K | | | 15,602,715 | | | | 5,244,068 | | | | (1,117,558 | ) | | | (32,303 | ) | | | (1,121,371 | ) | | | 18,575,551 | | | | 1,570,207 | | | | 254,735 | | | | — | | | |
| | BlackRock Cash Funds: Institutional, SL Agency Shares | | | 9,400,514 | | | | — | | | | (9,078,868 | )(a) | | | (1,276 | ) | | | (31 | ) | | | 320,339 | | | | 320,243 | | | | 4,912 | (c) | | | — | | | |
| | BlackRock Cash Funds: Treasury, SL Agency Shares | | | 6,121,146 | | | | 4,093,145 | (a) | | | — | | | | — | | | | — | | | | 10,214,291 | | | | 10,214,291 | | | | 862 | | | | — | | | |
| | Diversified Equity Master Portfolio | | | 70,677,755 | | | | 2,999,750 | (a)(b) | | | — | | | | 19,558,200 | | | | (312,031 | ) | | | 92,923,674 | | | $ | 92,923,674 | | | | 803,966 | | | | — | | | |
| | International Tilts Master Portfolio | | | 21,173,512 | | | | 2,340,005 | (a)(b) | | | — | �� | | | 2,334,834 | | | | 93,331 | | | | 25,941,682 | | | $ | 25,941,682 | | | | 446,873 | | | | — | | | |
| | iShares Core U.S. Aggregate Bond ETF | | | 396,764 | | | | 925,690 | | | | — | | | | — | | | | (11,675 | ) | | | 1,310,779 | | | | 11,490 | | | | 20,111 | | | | — | | | |
| | iShares Developed Real Estate Index Fund, Class K | | | 6,282,444 | | | | 1,069,826 | | | | (405,703 | ) | | | (2,489 | ) | | | 1,421,041 | | | | 8,365,119 | | | | 700,010 | | | | 326,353 | | | | 13,004 | | | |
| | iShares iBoxx $ Investment Grade Corporate Bond ETF | | | 245,871 | | | | 77,777 | | | | — | | | | — | | | | (9,178 | ) | | | 314,470 | | | | 2,373 | | | | 6,758 | | | | — | | | |
| | iShares MSCI EAFE Small-Cap ETF | | | 8,891,925 | | | | 801,701 | | | | — | | | | — | | | | 603,732 | | | | 10,297,358 | | | | 140,886 | | | | 297,087 | | | | — | | | |
| | iShares TIPS Bond ETF | | | 541,747 | | | | 478,539 | | | | — | | | | — | | | | 12,151 | | | | 1,032,437 | | | | 7,991 | | | | 37,338 | | | | — | | | |
| | Master Total Return Portfolio | | | 340,639 | | | | 133,672 | (a)(b) | | | — | | | | 4,444 | | | | (11,024 | ) | | | 467,731 | | | $ | 467,731 | | | | 7,953 | | | | — | | | |
| | | | | | | | | | | | | | | | | | | | | | | | | | | | | | | | | | | | | | | | |
| | | | | | | | | | | |
| | | | | | | | | | | | | | | | $ | 21,860,939 | | | $ | 645,482 | | | $ | 170,390,778 | | | | | | | $ | 2,218,683 | | | $ | 13,004 | | | |
| | | | | | | | | | | | | | | | | | | | | | | | | | | | | | | | | | | | | | | | |
| | (a) | Represents net amount purchased (sold). | |
| | (b) | Inclusive of income and expense allocated from the Master Portfolio. | |
| | (c) | All or a portion represents securities lending income earned from the reinvestment of cash collateral from loaned securities, net of fees and collateral investment expenses, and other payments to and from borrowers of securities. | |
| | |
| 60 | | 2 0 2 1 BLACK ROCK ANNUAL REPORT TO SHAREHOLDERS |
| | |
Schedule of Investments (continued) December 31, 2021 | | BlackRock LifePath® Dynamic 2050 Fund |
Derivative Financial Instruments Outstanding as of Period End
Futures Contracts
| | | | | | | | | | | | | | | | |
| | | | | |
| Description | | Number of Contracts | | | Expiration Date | | | Notional Amount (000) | | | Value/ Unrealized Appreciation (Depreciation) | |
| | | | |
Long Contracts | | | | | | | | | | | | | | | | |
S&P/TSE 60 Index | | | 24 | | | | 03/17/22 | | | $ | 4,861 | | | $ | 82,791 | |
MSCI EAFE Index | | | 57 | | | | 03/18/22 | | | | 6,617 | | | | 97,198 | |
Russell 2000 E-Mini Index | | | 15 | | | | 03/18/22 | | | | 1,682 | | | | 25,453 | |
| | | | | | | | | | | | | | | | |
| | | | |
| | | | | | | | | | | | | | | 205,442 | |
| | | | | | | | | | | | | | | | |
Short Contracts | | | | | | | | | | | | | | | | |
S&P 500 Micro E-Mini Index | | | 65 | | | | 03/18/22 | | | | 1,547 | | | | (36,755 | ) |
| | | | | | | | | | | | | | | | |
| | | | |
| | | | | | | | | | | | | | $ | 168,687 | |
| | | | | | | | | | | | | | | | |
Forward Foreign Currency Exchange Contracts
| | | | | | | | | | | | | | | | | | | | | | | | | | |
| | | | | | | |
| Currency Purchased | | | | | Currency Sold | | | Counterparty | | Settlement Date | | | | | | Unrealized Appreciation (Depreciation) | |
| | | | | | | | |
CAD | | | 6,024,444 | | | | | USD | | | 4,703,905 | | | Bank of America N.A. | | | 03/16/22 | | | | | | | $ | 57,990 | |
EUR | | | 114,000 | | | | | USD | | | 129,196 | | | Bank of America N.A. | | | 03/16/22 | | | | | | | | 783 | |
EUR | | | 218,000 | | | | | USD | | | 247,230 | | | Bank of America N.A. | | | 03/16/22 | | | | | | | | 1,327 | |
EUR | | | 4,976,931 | | | | | USD | | | 5,649,859 | | | Morgan Stanley & Co. International PLC | | | 03/16/22 | | | | | | | | 24,699 | |
USD | | | 1,853,802 | | | | | JPY | | | 208,785,060 | | | Morgan Stanley & Co. International PLC | | | 03/16/22 | | | | | | | | 37,717 | |
| | | | | | | | | | | | | | | | | | | | | | | | | | |
| | | | | | | | |
| | | | | | | | | | | | | | | | | | | | | | | | | 122,516 | |
| | | | | | | | | | | | | | | | | | | | | | | | | | |
CAD | | | 266,000 | | | | | USD | | | 210,426 | | | Bank of America N.A. | | | 03/16/22 | | | | | | | | (172 | ) |
USD | | | 1,832,976 | | | | | AUD | | | 2,575,111 | | | Bank of America N.A. | | | 03/16/22 | | | | | | | | (40,871 | ) |
USD | | | 214,589 | | | | | CAD | | | 275,000 | | | Bank of America N.A. | | | 03/16/22 | | | | | | | | (2,779 | ) |
USD | | | 1,854,141 | | | | | CAD | | | 2,374,659 | | | Bank of America N.A. | | | 03/16/22 | | | | | | | | (22,858 | ) |
USD | | | 228,464 | | | | | EUR | | | 201,000 | | | Bank of America N.A. | | | 03/16/22 | | | | | | | | (710 | ) |
USD | | | 233,858 | | | | | EUR | | | 206,000 | | | Bank of America N.A. | | | 03/16/22 | | | | | | | | (1,017 | ) |
USD | | | 173,025 | | | | | EUR | | | 153,000 | | | Morgan Stanley & Co. International PLC | | | 03/16/22 | | | | | | | | (1,421 | ) |
| | | | | | | | | | | | | | | | | | | | | | | | | | |
| | | | | | | | |
| | | | | | | | | | | | | | | | | | | | | | | | | (69,828 | ) |
| | | | | | | | | | | | | | | | | | | | | | | | | | |
| | | | | | | | |
| | | | | | | | | | | | | | | | | | | | | | | | $ | 52,688 | |
| | | | | | | | | | | | | | | | | | | | | | | | | | |
| | |
SCHEDULE OF INVESTMENTS | | 61 |
| | |
Schedule of Investments (continued) December 31, 2021 | | BlackRock LifePath® Dynamic 2050 Fund |
Derivative Financial Instruments Categorized by Risk Exposure
As of period end, the fair values of derivative financial instruments located in the Statements of Assets and Liabilities were as follows:
| | | | | | | | | | | | | | | | | | | | | | | | | | | | |
| | | | | | | | |
| | | Commodity Contracts | | | Credit Contracts | | | Equity Contracts | | | Foreign Currency Exchange Contracts | | | Interest Rate Contracts | | | Other Contracts | | | Total | |
| | | | | | | |
Assets — Derivative Financial Instruments | | | | | | | | | | | | | | | | | | | | | | | | | | | | |
Futures contracts | | | | | | | | | | | | | | | | | | | | | | | | | | | | |
Unrealized appreciation on futures contracts(a) | | $ | — | | | $ | — | | | $ | 205,442 | | | $ | — | | | $ | — | | | $ | — | | | $ | 205,442 | |
Forward foreign currency exchange contracts | | | | | | | | | | | | | | | | | | | | | | | | | | | | |
Unrealized appreciation on forward foreign currency exchange contracts | | | — | | | | — | | | | — | | | | 122,516 | | | | — | | | | — | | | | 122,516 | |
| | | | | | | | | | | | | | | | | | | | | | | | | | | | |
| | | | | | | |
| | $ | — | | | $ | — | | | $ | 205,442 | | | $ | 122,516 | | | $ | — | | | $ | — | | | $ | 327,958 | |
| | | | | | | | | | | | | | | | | | | | | | | | | | | | |
Liabilities — Derivative Financial Instruments | | | | | | | | | | | | | | | | | | | | | | | | | | | | |
Futures contracts | | | | | | | | | | | | | | | | | | | | | | | | | | | | |
Unrealized depreciation on futures contracts(a) | | $ | — | | | $ | — | | | $ | 36,755 | | | $ | — | | | $ | — | | | $ | — | | | $ | 36,755 | |
Forward foreign currency exchange contracts | | | | | | | | | | | | | | | | | | | | | | | | | | | | |
Unrealized depreciation on forward foreign currency exchange contracts | | | — | | | | — | | | | — | | | | 69,828 | | | | — | | | | — | | | | 69,828 | |
| | | | | | | | | | | | | | | | | | | | | | | | | | | | |
| | | | | | | |
| | $ | — | | | $ | — | | | $ | 36,755 | | | $ | 69,828 | | | $ | — | | | $ | — | | | $ | 106,583 | |
| | | | | | | | | | | | | | | | | | | | | | | | | | | | |
| | (a) | Net cumulative unrealized appreciation (depreciation) on futures contracts and centrally cleared swaps, if any, are reported in the Schedule of Investments. In the Statements of Assets and Liabilities, only current day’s variation margin is reported in receivables or payables and the net cumulative unrealized appreciation (depreciation) is included in accumulated earnings (loss). | |
For the period ended December 31, 2021, the effect of derivative financial instruments in the Statements of Operations was as follows:
| | | | | | | | | | | | | | | | | | | | | | | | | | | | |
| | | | | | | | |
| | | Commodity Contracts | | | Credit Contracts | | | Equity Contracts | | | Foreign Currency Exchange Contracts | | | Interest Rate Contracts | | | Other Contracts | | | Total | |
Net Realized Gain (Loss) from: | | | | | | | | | | | | | | | | | | | | | | | | | | | | |
Futures contracts | | $ | — | | | $ | — | | | $ | 1,346,460 | | | $ | — | | | $ | — | | | $ | — | | | $ | 1,346,460 | |
Forward foreign currency exchange contracts | | | — | | | | — | | | | — | | | | (412,724 | ) | | | — | | | | — | | | | (412,724 | ) |
| | | | | | | | | | | | | | | | | | | | | | | | | | | | |
| | $ | — | | | $ | — | | | $ | 1,346,460 | | | $ | (412,724 | ) | | $ | — | | | $ | — | | | $ | 933,736 | |
| | | | | | | | | | | | | | | | | | | | | | | | | | | | |
Net Change in Unrealized Appreciation (Depreciation) on: | | | | | | | | | | | | | | | | | | | | | | | | | | | | |
Futures contracts | | $ | — | | | $ | — | | | $ | 124,433 | | | $ | — | | | $ | — | | | $ | — | | | $ | 124,433 | |
Forward foreign currency exchange contracts | | | — | | | | — | | | | — | | | | (47,668 | ) | | | — | | | | — | | | | (47,668 | ) |
| | | | | | | | | | �� | | | | | | | | | | | | | | | | | | |
| | $ | — | | | $ | — | | | $ | 124,433 | | | $ | (47,668 | ) | | $ | — | | | $ | — | | | $ | 76,765 | |
| | | | | | | | | | | | | | | | | | | | | | | | | | | | |
Average Quarterly Balances of Outstanding Derivative Financial Instruments
| | | | |
| | |
Futures contracts: | | | | |
Average notional value of contracts — long | | $ | 14,492,360 | |
Average notional value of contracts — short | | $ | 4,133,600 | |
Forward foreign currency exchange contracts: | | | | |
Average amounts purchased — in USD | | $ | 4,517,416 | |
Average amounts sold — in USD | | $ | 12,077,594 | |
For more information about the LifePath Dynamic Fund’s investment risks regarding derivative financial instruments, refer to the Notes to Financial Statements.
| | |
| 62 | | 2 0 2 1 BLACK ROCK ANNUAL REPORT TO SHAREHOLDERS |
| | |
Schedule of Investments (continued) December 31, 2021 | | BlackRock LifePath® Dynamic 2050 Fund |
Derivative Financial Instruments — Offsetting as of Period End
The LifePath Dynamic Fund’s derivative assets and liabilities (by type) were as follows:
| | | | | | | | |
| | | |
| | | Assets | | | Liabilities | |
| | |
Derivative Financial Instruments | | | | | | | | |
Futures contracts | | $ | 4,469 | | | $ | 24,696 | |
Forward foreign currency exchange contracts | | | 122,516 | | | | 69,828 | |
| | | | | | | | |
| | |
Total derivative assets and liabilities in the Statements of Assets and Liabilities | | | 126,985 | | | | 94,524 | |
| | | | | | | | |
| | |
Derivatives not subject to a Master Netting Agreement or similar agreement (“MNA”) | | | (4,469 | ) | | | (24,696 | ) |
| | | | | | | | |
| | |
Total derivative assets and liabilities subject to an MNA | | $ | 122,516 | | | $ | 69,828 | |
| | | | | | | | |
The following table presents the LifePath Dynamic Fund’s derivative assets and liabilities by counterparty net of amounts available for offset under an MNA and net of the related collateral received (and pledged) by the LifePath Dynamic Fund:
| | | | | | | | | | | | | | | | | | | | |
| | | | | | |
| Counterparty | |
| Derivative
Assets Subject to an MNA by Counterparty |
| |
| Derivatives
Available for Offset |
(a) | |
| Non-Cash
Collateral Received |
| |
| Cash
Collateral Received |
| |
| Net Amount
of Derivative Assets |
(b)(c) |
| | | | | |
Bank of America N.A. | | $ | 60,100 | | | $ | (60,100 | ) | | $ | — | | | $ | — | | | $ | — | |
Morgan Stanley & Co. International PLC | | | 62,416 | | | | (1,421 | ) | | | — | | | | — | | | | 60,995 | |
| | | | | | | | | | | | | | | | | | | | |
| | | | | |
| | $ | 122,516 | | | $ | (61,521 | ) | | $ | — | | | $ | — | | | $ | 60,995 | |
| | | | | | | | | | | | | | | | | | | | |
| | | | | | | | | | | | | | | | | | | | |
| | | | | | |
| Counterparty | |
| Derivative
Liabilities Subject to an MNA by Counterparty |
| |
| Derivatives
Available for Offset |
(a) | |
| Non-Cash
Collateral Pledged |
| |
| Cash
Collateral Pledged |
| |
| Net Amount
of Derivative Liabilities |
(b)(d) |
| | | | | |
Bank of America N.A. | | $ | 68,407 | | | $ | (60,100 | ) | | $ | — | | | $ | — | | | $ | 8,307 | |
Morgan Stanley & Co. International PLC | | | 1,421 | | | | (1,421 | ) | | | — | | | | — | | | | — | |
| | | | | | | | | | | | | | | | | | | | |
| | | | | |
| | $ | 69,828 | | | $ | (61,521 | ) | | $ | — | | | $ | — | | | $ | 8,307 | |
| | | | | | | | | | | | | | | | | | | | |
| | (a) | The amount of derivatives available for offset is limited to the amount of derivative asset and/or liabilities that are subject to an MNA. | |
| | (b) | Net amount may also include forward foreign currency exchange contracts that are not required to be collateralized. | |
| | (c) | Net amount represents the net amount receivable from the counterparty in the event of default. | |
| | (d) | Net amount represents the net amount payable due to counterparty in the event of default. | |
Fair Value Hierarchy as of Period End
Various inputs are used in determining the fair value of financial instruments. For a description of the input levels and information about the LifePath Dynamic Fund’s policy regarding valuation of financial instruments, refer to the Notes to Financial Statements.
The following table summarizes the LifePath Dynamic Fund’s financial instruments categorized in the fair value hierarchy. The breakdown of the LifePath Dynamic Fund’s financial instruments into major categories is disclosed in the Schedule of Investments above.
| | | | | | | | | | | | | | | | |
| | | | | |
| | | Level 1 | | | Level 2 | | | Level 3 | | | Total | |
| | | | |
Assets | | | | | | | | | | | | | | | | |
Investments | | | | | | | | | | | | | | | | |
Investment Companies | | | | | | | | | | | | | | | | |
Equity Funds | | $ | 37,238,028 | | | $ | — | | | $ | — | | | $ | 37,238,028 | |
Fixed-Income Funds | | | 2,657,686 | | | | — | | | | — | | | | 2,657,686 | |
Money Market Funds | | | 10,534,630 | | | | — | | | | — | | | | 10,534,630 | |
| | | | | | | | | | | | | | | | |
| | | | |
| | $ | 50,430,344 | | | $ | — | | | $ | — | | | | 50,430,344 | |
| | | | | | | | | | | | | | | | |
| | | | |
Investments Valued at NAV(a) | | | | | | | | | | | | | | | 119,960,434 | |
| | | | | | | | | | | | | | | | |
| | | | |
| | | | | | | | | | | | | | $ | 170,390,778 | |
| | | | | | | | | | | | | | | | |
Derivative Financial Instruments(b) | | | | | �� | | | | | | | | | | | |
Assets | | | | | | | | | | | | | | | | |
Equity Contracts | | $ | 205,442 | | | $ | — | | | $ | — | | | $ | 205,442 | |
Foreign Currency Exchange Contracts | | | — | | | | 122,516 | | | | — | | | | 122,516 | |
| | |
SCHEDULE OF INVESTMENTS | | 63 |
| | |
Schedule of Investments (continued) December 31, 2021 | | BlackRock LifePath® Dynamic 2050 Fund |
Fair Value Hierarchy as of Period End (continued)
| | | | | | | | | | | | | | | | |
| | | | | |
| | | Level 1 | | | Level 2 | | | Level 3 | | | Total | |
| | | | |
Liabilities | | | | | | | | | | | | | | | | |
Equity Contracts | | $ | (36,755 | ) | | $ | — | | | $ | — | | | $ | (36,755 | ) |
Foreign Currency Exchange Contracts | | | — | | | | (69,828 | ) | | | — | | | | (69,828 | ) |
| | | | | | | | | | | | | | | | |
| | | | |
| | $ | 168,687 | | | $ | 52,688 | | | $ | — | | | $ | 221,375 | |
| | | | | | | | | | | | | | | | |
| | (a) | Certain investments of the Fund were fair valued using NAV per share or its equivalent as no quoted market value is available and therefore have been excluded from the fair value hierarchy. | |
| | (b) | Derivative financial instruments are futures contracts and forward foreign currency exchange contracts. Futures contracts and forward foreign currency exchange contracts are valued at the unrealized appreciation (depreciation) on the instrument. | |
See notes to financial statements.
| | |
| 64 | | 2 0 2 1 BLACK ROCK ANNUAL REPORT TO SHAREHOLDERS |
| | |
Schedule of Investments December 31, 2021 | | BlackRock LifePath® Dynamic 2055 Fund (Percentages shown are based on Net Assets) |
| | | | | | | | |
| Security | | Shares/ Investment Value | | | Value | |
| | |
Investment Companies(a) | | | | | | | | |
| | |
| Equity Funds — 89.0% | | | | | | |
BlackRock Advantage Emerging Markets Fund, Class K | | | 757,478 | | | $ | 8,960,966 | |
Diversified Equity Master Portfolio | | $ | 43,149,867 | | | | 43,149,867 | |
International Tilts Master Portfolio | | $ | 12,088,942 | | | | 12,088,942 | |
iShares Developed Real Estate Index Fund, Class K | | | 329,484 | | | | 3,937,332 | |
iShares MSCI EAFE Small-Cap ETF(b) | | | 64,167 | | | | 4,689,966 | |
| | | | | | | | |
| | |
| | | | | | | 72,827,073 | |
| | |
| Fixed-Income Funds — 1.3% | | | | | | |
Advantage CoreAlpha Bond Master Portfolio | | $ | 202,531 | | | | 202,531 | |
iShares Core U.S. Aggregate Bond ETF | | | 4,216 | | | | 480,961 | |
iShares iBoxx $Investment Grade Corporate Bond ETF(b) | | | 1,021 | | | | 135,303 | |
iShares TIPS Bond ETF | | | 1,139 | | | | 147,159 | |
Master Total Return Portfolio | | $ | 136,828 | | | | 136,828 | |
| | | | | | | | |
| | |
| | | | | | | 1,102,782 | |
| | | | | | | | |
| Security | | Shares | | | Value | |
| |
| | |
| Money Market Funds — 15.4% | | | | | | |
BlackRock Cash Funds: Institutional, SL Agency Shares, 0.10%(c)(d) | | | 4,932,875 | | | | $ 4,934,355 | |
BlackRock Cash Funds: Treasury, SL Agency Shares, 0.01%(c) | | | 7,640,006 | | | | 7,640,006 | |
| | | | | | | | |
| | |
| | | | | | | 12,574,361 | |
| | | | | | | | |
| | |
Total Investments — 105.7%
(Cost: $75,000,668) | | | | | | | 86,504,216 | |
| |
Liabilities in Excess of Other Assets — (5.7)% | | | | (4,682,687 | ) |
| | | | | | | | |
| |
Net Assets — 100.0% | | | | $ 81,821,529 | |
| | | | | | | | |
| (a) | Affiliate of the Fund. |
| (b) | All or a portion of this security is on loan. |
| (c) | Annualized 7-day yield as of period end. |
| (d) | All or a portion of this security was purchased with the cash collateral from loaned securities. |
Affiliates
Investments in issuers considered to be affiliate(s) of the LifePath Dynamic Fund during the year ended December 31, 2021 for purposes of Section 2(a)(3) of the Investment Company Act of 1940, as amended, were as follows:
| | | | | | | | | | | | | | | | | | | | | | | | | | | | | | | | | | | | |
| | | | | | | | | | |
| Affiliated Issuer | | Value at 12/31/20 | | | Purchases at Cost | | | Proceeds from Sales | | | Net Realized Gain (Loss) | | | Change in Unrealized Appreciation (Depreciation) | | | Value at
12/31/21 | | | Shares/ Investment Value Held at 12/31/21 | | | Income | | | Capital Gain Distributions from Underlying Funds | |
| | | | | | | | | |
Advantage CoreAlpha Bond Master Portfolio | | $ | 118,480 | | | $ | 89,402 | (a)(b) | | $ | — | | | $ | 138 | | | $ | (5,489 | ) | | $ | 202,531 | | | $ | 202,531 | | | $ | 3,540 | | | $ | — | |
BlackRock Advantage Emerging Markets Fund, Class K | | | 6,484,713 | | | | 3,553,752 | | | | (487,789 | ) | | | (22,853 | ) | | | (566,857 | ) | | | 8,960,966 | | | | 757,478 | | | | 119,153 | | | | — | |
BlackRock Cash Funds: Institutional, SL Agency Shares | | | — | | | | 4,934,868 | (a) | | | — | | | | (39 | ) | | | (474 | ) | | | 4,934,355 | | | | 4,932,875 | | | | 2,899 | (c) | | | — | |
BlackRock Cash Funds: Treasury, SL Agency Shares | | | 2,766,111 | | | | 4,873,895 | (a) | | | — | | | | — | | | | — | | | | 7,640,006 | | | | 7,640,006 | | | | 451 | | | | — | |
Diversified Equity Master Portfolio | | | 29,604,285 | | | | 5,144,095 | (a)(b) | | | — | | | | 7,345,807 | | | | 1,055,680 | | | | 43,149,867 | | | $ | 43,149,867 | | | | 355,756 | | | | — | |
International Tilts Master Portfolio | | | 8,751,561 | | | | 2,290,713 | (a)(b) | | | — | | | | 875,852 | | | | 170,816 | | | | 12,088,942 | | | $ | 12,088,942 | | | | 194,417 | | | | — | |
iShares Core U.S. Aggregate Bond ETF | | | 272,309 | | | | 554,285 | | | | (335,350 | ) | | | (3,853 | ) | | | (6,430 | ) | | | 480,961 | | | | 4,216 | | | | 5,562 | | | | — | |
iShares Developed Real Estate Index Fund, Class K | | | 2,614,055 | | | | 700,735 | | | | — | | | | — | | | | 622,542 | | | | 3,937,332 | | | | 329,484 | | | | 149,895 | | | | 6,121 | |
iShares iBoxx $ Investment Grade Corporate Bond ETF | | | 75,419 | | | | 61,629 | | | | — | | | | — | | | | (1,745 | ) | | | 135,303 | | | | 1,021 | | | | 2,835 | | | | — | |
iShares MSCI EAFE Small-Cap ETF | | | 3,758,088 | | | | 843,227 | | | | (160,185 | ) | | | 24,229 | | | | 224,607 | | | | 4,689,966 | | | | 64,167 | | | | 130,744 | | | | — | |
iShares TIPS Bond ETF | | | 71,229 | | | | 74,116 | | | | — | | | | — | | | | 1,814 | | | | 147,159 | | | | 1,139 | | | | 3,721 | | | | — | |
Master Total Return Portfolio | | | 79,521 | | | | 58,694 | (a)(b) | | | — | | | | 1,404 | | | | (2,791 | ) | | | 136,828 | | | $ | 136,828 | | | | 2,276 | | | | — | |
| | | | | | | | | | | | | | | | | | | | | | | | | | | | | | | | | | | | |
| | | | | | | | | |
| | | | | | | | | | | | | | $ | 8,220,685 | | | $ | 1,491,673 | | | $ | 86,504,216 | | | | | | | $ | 971,249 | | | $ | 6,121 | |
| | | | | | | | | | | | | | | | | | | | | | | | | | | | | | | | | | | | |
| | (a) | Represents net amount purchased (sold). | |
| | (b) | Inclusive of income and expense allocated from the Master Portfolio. | |
| | (c) | All or a portion represents securities lending income earned from the reinvestment of cash collateral from loaned securities, net of fees and collateral investment expenses, and other payments to and from borrowers of securities. | |
| | |
SCHEDULE OF INVESTMENTS | | 65 |
| | |
Schedule of Investments (continued) December 31, 2021 | | BlackRock LifePath® Dynamic 2055 Fund |
Derivative Financial Instruments Outstanding as of Period End
Futures Contracts
| | | | | | | | | | | | | | | | |
| | | | | |
| Description | | Number of Contracts | | | Expiration Date | | | Notional Amount (000) | | | Value/ Unrealized Appreciation (Depreciation) | |
| | | | |
Long Contracts | | | | | | | | | | | | | | | | |
S&P/TSE 60 Index | | | 12 | | | | 03/17/22 | | | $ | 2,430 | | | $ | 41,395 | |
MSCI EAFE Index | | | 34 | | | | 03/18/22 | | | | 3,947 | | | | 58,303 | |
Russell 2000 E-Mini Index | | | 7 | | | | 03/18/22 | | | | 785 | | | | 11,878 | |
S&P 500 Micro E-Mini Index | | | 40 | | | | 03/18/22 | | | | 952 | | | | 14,287 | |
| | | | | | | | | | | | | | | | |
| | | | |
| | | | | | | | | | | | | | $ | 125,863 | |
| | | | | | | | | | | | | | | | |
Forward Foreign Currency Exchange Contracts
| | | | | | | | | | | | | | | | | | | | | | | | |
| | | | | | | |
| Currency Purchased | | | | | | Currency Sold | | | Counterparty | | Settlement Date | | | | | | Unrealized Appreciation (Depreciation) | |
| | | | | | |
| CAD | 105,000 | | | | | | | USD | 82,095 | | | Bank of America N.A. | | | 03/16/22 | | | | | | | $ | 900 | |
| CAD | 2,859,734 | | | | | | | USD | 2,232,889 | | | Bank of America N.A. | | | 03/16/22 | | | | | | | | 27,527 | |
| EUR | 60,000 | | | | | | | USD | 67,999 | | | Bank of America N.A. | | | 03/16/22 | | | | | | | | 411 | |
| EUR | 71,000 | | | | | | | USD | 80,513 | | | Bank of America N.A. | | | 03/16/22 | | | | | | | | 439 | |
| EUR | 2,279,554 | | | | | | | USD | 2,587,771 | | | Morgan Stanley & Co. International PLC | | | 03/16/22 | | | | | | | | 11,313 | |
| USD | 68,509 | | | | | | | JPY | 7,869,000 | | | Bank of America N.A. | | | 03/16/22 | | | | | | | | 62 | |
| USD | 855,992 | | | | | | | JPY | 96,406,392 | | | Morgan Stanley & Co. International PLC | | | 03/16/22 | | | | | | | | 17,416 | |
| | | | | | | | | | | | | | | | | | | | | | | | |
| | | | | | |
| | | | | | | | | | | | | | | | | | | | | | | 58,068 | |
| | | | | | | | | | | | | | | | | | | | | | | | |
| USD | 842,041 | | | | | | | AUD | 1,183,232 | | | Bank of America N.A. | | | 03/16/22 | | | | | | | | (18,968 | ) |
| USD | 95,236 | | | | | | | CAD | 122,000 | | | Bank of America N.A. | | | 03/16/22 | | | | | | | | (1,196 | ) |
| USD | 852,299 | | | | | | | CAD | 1,091,567 | | | Bank of America N.A. | | | 03/16/22 | | | | | | | | (10,507 | ) |
| USD | 111,253 | | | | | | | EUR | 98,000 | | | Bank of America N.A. | | | 03/16/22 | | | | | | | | (484 | ) |
| | | | | | | | | | | | | | | | | | | | | | | | |
| | | | | | |
| | | | | | | | | | | | | | | | | | | | | | | (31,155 | ) |
| | | | | | | | | | | | | | | | | | | | | | | | |
| | | | | | |
| | | | | | | | | | | | | | | | | | | | | | $ | 26,913 | |
| | | | | | | | | | | | | | | | | | | | | | | | |
Derivative Financial Instruments Categorized by Risk Exposure
As of period end, the fair values of derivative financial instruments located in the Statements of Assets and Liabilities were as follows:
| | | | | | | | | | | | | | | | | | | | | | | | | | | | |
| | | | | | | | |
| | | Commodity Contracts | | | Credit Contracts | | | Equity Contracts | | | Foreign Currency Exchange Contracts | | | Interest Rate Contracts | | | Other Contracts | | | Total | |
| | | | | | | |
Assets — Derivative Financial Instruments | | | | | | | | | | | | | | | | | | | | | | | | | | | | |
Futures contracts | | | | | | | | | | | | | | | | | | | | | | | | | | | | |
Unrealized appreciation on futures contracts(a) | | $ | — | | | $ | — | | | $ | 125,863 | | | $ | — | | | $ | — | | | $ | — | | | $ | 125,863 | |
Forward foreign currency exchange contracts | | | | | | | | | | | | | | | | | | | | | | | | | | | | |
Unrealized appreciation on forward foreign currency exchange contracts | | | — | | | | — | | | | — | | | | 58,068 | | | | — | | | | — | | | | 58,068 | |
| | | | | | | | | | | | | | | | | | | | | | | | | | | | |
| | | | | | | |
| | $ | — | | | $ | — | | | $ | 125,863 | | | $ | 58,068 | | | $ | — | | | $ | — | | | $ | 183,931 | |
| | | | | | | | | | | | | | | | | | | | | | | | | | | | |
Liabilities — Derivative Financial Instruments | | | | | | | | | | | | | | | | | | | | | | | | | | | | |
Forward foreign currency exchange contracts | | | | | | | | | | | | | | | | | | | | | | | | | | | | |
Unrealized depreciation on forward foreign currency exchange contracts | | $ | — | | | $ | — | | | $ | — | | | $ | 31,155 | | | $ | — | | | $ | — | | | $ | 31,155 | |
| | | | | | | | | | | | | | | | | | | | | | | | | | | | |
| | (a) | Net cumulative unrealized appreciation (depreciation) on futures contracts and centrally cleared swaps, if any, are reported in the Schedule of Investments. In the Statements of Assets and Liabilities, only current day’s variation margin is reported in receivables or payables and the net cumulative unrealized appreciation (depreciation) is included in accumulated earnings (loss). | |
| | |
| 66 | | 2 0 2 1 BLACK ROCK ANNUAL REPORT TO SHAREHOLDERS |
| | |
Schedule of Investments (continued) December 31, 2021 | | BlackRock LifePath® Dynamic 2055 Fund |
For the period ended December 31, 2021, the effect of derivative financial instruments in the Statements of Operations was as follows:
| | | | | | | | | | | | | | | | | | | | | | | | | | | | |
| | | | | | | | |
| | | Commodity Contracts | | | Credit Contracts | | | Equity Contracts | | | Foreign Currency Exchange Contracts | | | Interest Rate Contracts | | | Other Contracts | | | Total | |
| | | | | | | |
Net Realized Gain (Loss) from: | | | | | | | | | | | | | | | | | | | | | | | | | | | | |
Futures contracts | | $ | — | | | $ | — | | | $ | 841,862 | | | $ | — | | | $ | — | | | $ | — | | | $ | 841,862 | |
Forward foreign currency exchange contracts | | | — | | | | — | | | | — | | | | (202,635 | ) | | | — | | | | — | | | | (202,635 | ) |
| | | | | | | | | | | | | | | | | | | | | | | | | | | | |
| | | | | | | |
| | $ | — | | | $ | — | | | $ | 841,862 | | | $ | (202,635 | ) | | $ | — | | | $ | — | | | $ | 639,227 | |
| | | | | | | | | | | | | | | | | | | | | | | | | | | | |
Net Change in Unrealized Appreciation (Depreciation) on: | | | | | | | | | | | | | | | | | | | | | | | | | | | | |
Futures contracts | | $ | — | | | $ | — | | | $ | 100,257 | | | $ | — | | | $ | — | | | $ | — | | | $ | 100,257 | |
Forward foreign currency exchange contracts | | | — | | | | — | | | | — | | | | (10,725 | ) | | | — | | | | — | | | | (10,725 | ) |
| | | | | | | | | | | | | | | | | | | | | | | | | | | | |
| | | | | | | |
| | $ | — | | | $ | — | | | $ | 100,257 | | | $ | (10,725 | ) | | $ | — | | | $ | — | | | $ | 89,532 | |
| | | | | | | | | | | | | | | | | | | | | | | | | | | | |
Average Quarterly Balances of Outstanding Derivative Financial Instruments
| | | | |
| | |
Futures contracts: | | | | |
Average notional value of contracts — long | | $ | 8,085,815 | |
Average notional value of contracts — short | | $ | 1,548,824 | |
Forward foreign currency exchange contracts: | | | | |
Average amounts purchased — in USD | | $ | 2,024,660 | |
Average amounts sold — in USD | | $ | 5,419,067 | |
For more information about the LifePath Dynamic Fund’s investment risks regarding derivative financial instruments, refer to the Notes to Financial Statements.
Derivative Financial Instruments — Offsetting as of Period End
The LifePath Dynamic Fund’s derivative assets and liabilities (by type) were as follows:
| | | | | | | | | | | | |
| | | | |
| | | Assets | | | | | | Liabilities | |
| | | |
Derivative Financial Instruments | | | | | | | | | | | | |
Futures contracts | | $ | — | | | | | | | $ | 15,409 | |
Forward foreign currency exchange contracts | | | 58,068 | | | | | | | | 31,155 | |
| | | | | | | | | | | | |
| | | |
Total derivative assets and liabilities in the Statements of Assets and Liabilities | | | 58,068 | | | | | | | | 46,564 | |
| | | | | | | | | | | | |
| | | |
Derivatives not subject to a Master Netting Agreement or similar agreement (“MNA”) | | | — | | | | | | | | (15,409 | ) |
| | | | | | | | | | | | |
| | | |
Total derivative assets and liabilities subject to an MNA | | $ | 58,068 | | | | | | | $ | 31,155 | |
| | | | | | | | | | | | |
The following table presents the LifePath Dynamic Fund’s derivative assets and liabilities by counterparty net of amounts available for offset under an MNA and net of the related collateral received (and pledged) by the LifePath Dynamic Fund:
| | | | | | | | | | | | | | | | | | | | |
| | | | | | |
| Counterparty | |
| Derivative
Assets Subject to an MNA by Counterparty |
| |
| Derivatives
Available for Offset |
(a) | |
| Non-Cash
Collateral Received |
| |
| Cash
Collateral Received |
| |
| Net Amount
of Derivative Assets |
(b)(c) |
| | | | | |
Bank of America N.A. | | $ | 29,339 | | | $ | (29,339 | ) | | $ | — | | | $ | — | | | $ | — | |
Morgan Stanley & Co. International PLC | | | 28,729 | | | | — | | | | — | | | | — | | | | 28,729 | |
| | | | | | | | | | | | | | | | | | | | |
| | | | | |
| | $ | 58,068 | | | $ | (29,339 | ) | | $ | — | | | $ | — | | | $ | 28,729 | |
| | | | | | | | | | | | | | | | | | | | |
| | | | | | | | | | | | | | | | | | | | |
| | | | | | |
| Counterparty | |
| Derivative
Liabilities Subject to an MNA by Counterparty |
| |
| Derivatives
Available for Offset |
(a) | |
| Non-Cash
Collateral Pledged |
| |
| Cash
Collateral Pledged |
| |
| Net Amount
of Derivative Liabilities |
(b)(d) |
| | | | | |
Bank of America N.A. | | $ | 31,155 | | | $ | (29,339 | ) | | $ | — | | | $ | — | | | $ | 1,816 | |
| | | | | | | | | | | | | | | | | | | | |
| | (a) | The amount of derivatives available for offset is limited to the amount of derivative asset and/or liabilities that are subject to an MNA. | |
| | (b) | Net amount may also include forward foreign currency exchange contracts that are not required to be collateralized. | |
| | (c) | Net amount represents the net amount receivable from the counterparty in the event of default. | |
| | (d) | Net amount represents the net amount payable due to counterparty in the event of default. | |
| | |
SCHEDULE OF INVESTMENTS | | 67 |
| | |
Schedule of Investments (continued) December 31, 2021 | | BlackRock LifePath® Dynamic 2055 Fund |
Fair Value Hierarchy as of Period End
Various inputs are used in determining the fair value of financial instruments. For a description of the input levels and information about the LifePath Dynamic Fund’s policy regarding valuation of financial instruments, refer to the Notes to Financial Statements.
The following table summarizes the LifePath Dynamic Fund’s financial instruments categorized in the fair value hierarchy. The breakdown of the LifePath Dynamic Fund’s financial instruments into major categories is disclosed in the Schedule of Investments above.
| | | | | | | | | | | | | | | | |
| | | | | |
| | | Level 1 | | | Level 2 | | | Level 3 | | | Total | |
| | | | |
Assets | | | | | | | | | | | | | | | | |
Investments | | | | | | | | | | | | | | | | |
Investment Companies | | | | | | | | | | | | | | | | |
Equity Funds | | $ | 17,588,264 | | | $ | — | | | $ | — | | | $ | 17,588,264 | |
Fixed-Income Funds | | | 763,423 | | | | — | | | | — | | | | 763,423 | |
Money Market Funds | | | 12,574,361 | | | | — | | | | — | | | | 12,574,361 | |
| | | | | | | | | | | | | | | | |
| | | | |
| | $ | 30,926,048 | | | $ | — | | | $ | — | | | | 30,926,048 | |
| | | | | | | | | | | | | | | | |
| | | | |
Investments Valued at NAV(a) | | | | | | | | | | | | | | | 55,578,168 | |
| | | | | | | | | | | | | | | | |
| | | | |
| | | | | | | | | | | | | | $ | 86,504,216 | |
| | | | | | | | | | | | | | | | |
Derivative Financial Instruments(b) | | | | | | | | | | | | | | | | |
Assets | | | | | | | | | | | | | | | | |
Equity Contracts | | $ | 125,863 | | | $ | — | | | $ | — | | | $ | 125,863 | |
Foreign Currency Exchange Contracts | | | — | | | | 58,068 | | | | — | | | | 58,068 | |
Liabilities | | | | | | | | | | | | | | | | |
Foreign Currency Exchange Contracts | | | — | | | | (31,155 | ) | | | — | | | | (31,155 | ) |
| | | | | | | | | | | | | | | | |
| | | | |
| | $ | 125,863 | | | $ | 26,913 | | | $ | — | | | $ | 152,776 | |
| | | | | | | | | | | | | | | | |
| | (a) | Certain investments of the Fund were fair valued using NAV per share or its equivalent as no quoted market value is available and therefore have been excluded from the fair value hierarchy. | |
| | (b) | Derivative financial instruments are futures contracts and forward foreign currency exchange contracts. Futures contracts and forward foreign currency exchange contracts are valued at the unrealized appreciation (depreciation) on the instrument. | |
See notes to financial statements.
| | |
| 68 | | 2 0 2 1 BLACK ROCK ANNUAL REPORT TO SHAREHOLDERS |
| | |
Schedule of Investments December 31, 2021 | | BlackRock LifePath® Dynamic 2060 Fund (Percentages shown are based on Net Assets) |
| | | | | | | | |
| Security | | Shares/ Investment Value | | | Value | |
| |
| | |
Investment Companies(a) | | | | | | | | |
| | |
| Equity Funds — 94.1% | | | | | | |
BlackRock Advantage Emerging Markets Fund, Class K | | | 189,604 | | | $ | 2,243,016 | |
Diversified Equity Master Portfolio | | $ | 11,090,476 | | | | 11,090,476 | |
International Tilts Master Portfolio | | $ | 2,913,606 | | | | 2,913,606 | |
iShares Developed Real Estate Index Fund, Class K | | | 84,492 | | | | 1,009,671 | |
iShares MSCI Canada ETF | | | 13,635 | | | | 523,993 | |
iShares MSCI EAFE Small-Cap ETF | | | 15,800 | | | | 1,154,822 | |
iShares Russell 2000 ETF | | | 756 | | | | 168,172 | |
| | | | | | | | |
| | |
| | | | | | | 19,103,756 | |
| | |
| Fixed-Income Funds — 1.3% | | | | | | |
Advantage CoreAlpha Bond Master Portfolio | | $ | 44,304 | | | | 44,304 | |
iShares Core U.S. Aggregate Bond ETF | | | 1,467 | | | | 167,356 | |
iShares iBoxx $ Investment Grade Corporate Bond ETF(b) | | | 223 | | | | 29,552 | |
iShares TIPS Bond ETF | | | 70 | | | | 9,044 | |
Master Total Return Portfolio | | $ | 16,426 | | | | 16,426 | |
| | | | | | | | |
| | |
| | | | | | | 266,682 | |
| | | | | | | | |
| Security | | Shares | | | Value | |
| |
| | |
| Money Market Funds — 5.0% | | | | | | |
BlackRock Cash Funds: Institutional, SL Agency Shares, 0.10%(c)(d) | | | 29,966 | | | $ | 29,974 | |
BlackRock Cash Funds: Treasury, SL Agency Shares, 0.01%(c) | | | 985,996 | | | | 985,996 | |
| | | | | | | | |
| | |
| | | | | | | 1,015,970 | |
| | | | | | | | |
| | |
Total Investments — 100.4%
(Cost: $17,795,551) | | | | | | | 20,386,408 | |
| |
Liabilities in Excess of Other Assets — (0.4)% | | | | (74,636 | ) |
| | | | | | | | |
| | |
Net Assets — 100.0% | | | | | | $ | 20,311,772 | |
| | | | | | | | |
| (a) | Affiliate of the Fund. |
| (b) | All or a portion of this security is on loan. |
| (c) | Annualized 7-day yield as of period end. |
| (d) | All or a portion of this security was purchased with the cash collateral from loaned securities. |
Affiliates
Investments in issuers considered to be affiliate(s) of the LifePath Dynamic Fund during the year ended December 31, 2021 for purposes of Section 2(a)(3) of the Investment Company Act of 1940, as amended, were as follows:
| | | | | | | | | | | | | | | | | | | | | | | | | | | | | | | | | | | | | | | | |
| | | | | | | | | | | |
| | | Affiliated Issuer | | Value at 12/31/20 | | | Purchases at Cost | | | Proceeds from Sales | | | Net Realized Gain (Loss) | | | Change in Unrealized Appreciation (Depreciation) | | | Value at 12/31/21 | | | Shares/ Investment Value Held at 12/31/21 | | | Income | | | Capital Gain Distributions from Underlying Funds | | | |
| | | | | | | | | | | |
| | Advantage CoreAlpha Bond Master Portfolio | | $ | 26,876 | | | $ | 18,672 | (a)(b) | | $ | — | | | $ | 39 | | | $ | (1,283 | ) | | $ | 44,304 | | | $ | 44,304 | | | $ | 825 | | | $ | — | | | |
| | BlackRock Advantage Emerging Markets Fund, Class K | | | 1,306,936 | | | | 1,229,689 | | | | (140,440 | ) | | | (14,180 | ) | | | (138,989 | ) | | | 2,243,016 | | | | 189,604 | | | | 29,353 | | | | — | | | |
| | BlackRock Cash Funds: Institutional, SL Agency Shares | | | 916,440 | | | | — | | | | (886,236 | )(a) | | | (230 | ) | | | — | | | | 29,974 | | | | 29,966 | | | | 1,734 | (c) | | | — | | | |
| | BlackRock Cash Funds: Treasury, SL Agency Shares | | | 298,259 | | | | 687,737 | (a) | | | — | | | | — | | | | — | | | | 985,996 | | | | 985,996 | | | | 96 | | | | — | | | |
| | Diversified Equity Master Portfolio | | | 5,851,950 | | | | 3,360,210 | (a)(b) | | | — | | | | 1,495,640 | | | | 382,676 | | | | 11,090,476 | | | $ | 11,090,476 | | | | 80,421 | | | | — | | | |
| | International Tilts Master Portfolio | | | 1,739,277 | | | | 964,064 | (a)(b) | | | — | | | | 167,034 | | | | 43,231 | | | | 2,913,606 | | | $ | 2,913,606 | | | | 39,870 | | | | — | | | |
| | iShares Core U.S. Aggregate Bond ETF | | | 53,776 | | | | 134,421 | | | | (18,353 | ) | | | (355 | ) | | | (2,133 | ) | | | 167,356 | | | | 1,467 | | | | 1,731 | | | | — | | | |
| | iShares Developed Real Estate Index Fund, Class K | | | 521,849 | | | | 371,770 | | | | (24,511 | ) | | | 128 | | | | 140,435 | | | | 1,009,671 | | | | 84,491 | | | | 35,657 | | | | 1,569 | | | |
| | iShares iBoxx $ Investment Grade Corporate Bond ETF | | | 25,692 | | | | 4,853 | | | | — | | | | — | | | | (993 | ) | | | 29,552 | | | | 223 | | | | 650 | | | | — | | | |
| | iShares MSCI Canada ETF | | | 258,161 | | | | 188,033 | | | | — | | | | — | | | | 77,799 | | | | 523,993 | | | | 13,635 | | | | 9,122 | | | | — | | | |
| | iShares MSCI EAFE Small-Cap ETF | | | 712,959 | | | | 957,557 | | | | (541,667 | ) | | | 20,302 | | | | 5,671 | | | | 1,154,822 | | | | 15,800 | | | | 33,634 | | | | — | | | |
| | iShares Russell 2000 ETF | | | 139,399 | | | | 37,180 | | | | (26,733 | ) | | | 2,881 | | | | 15,445 | | | | 168,172 | | | | 756 | | | | 1,554 | | | | — | | | |
| | iShares TIPS Bond ETF | | | 8,936 | | | | — | | | | — | | | | — | | | | 108 | | | | 9,044 | | | | 70 | | | | 387 | | | | — | | | |
| | Master Total Return Portfolio | | | 16,486 | | | | 292 | (a)(b) | | | — | | | | 133 | | | | (485 | ) | | | 16,426 | | | $ | 16,426 | | | | 292 | | | | — | | | |
| | | | | | | | | | | | | | | | | | | | | | | | | | | | | | | | | | | | | | | | |
| | | | | | | | | | | |
| | | | | | | | | | | | | | | | $ | 1,671,392 | | | $ | 521,482 | | | $ | 20,386,408 | | | | | | | $ | 235,326 | | | $ | 1,569 | | | |
| | | | | | | | | | | | | | | | | | | | | | | | | | | | | | | | | | | | | | | | |
| | (a) | Represents net amount purchased (sold). | |
| | (b) | Inclusive of income and expense allocated from the Master Portfolio. | |
| | (c) | All or a portion represents securities lending income earned from the reinvestment of cash collateral from loaned securities, net of fees and collateral investment expenses, and other payments to and from borrowers of securities. | |
| | |
SCHEDULE OF INVESTMENTS | | 69 |
| | |
Schedule of Investments (continued) December 31, 2021 | | BlackRock LifePath® Dynamic 2060 Fund |
Derivative Financial Instruments Outstanding as of Period End
Futures Contracts
| | | | | | | | | | | | | | | | |
| | | | | |
| Description | | Number of Contracts | | | Expiration Date | | | Notional Amount (000) | | | Value/ Unrealized Appreciation (Depreciation) | |
| | | | |
Long Contracts | | | | | | | | | | | | | | | | |
MSCI EAFE Index | | | 10 | | | | 03/18/22 | | | $ | 1,161 | | | $ | 16,242 | |
| | | | | | | | | | | | | | | | |
Short Contracts | | | | | | | | | | | | | | | | |
S&P 500 Micro E-Mini Index | | | 3 | | | | 03/18/22 | | | | 71 | | | | (1,999 | ) |
| | | | | | | | | | | | | | | | |
| | | | |
| | | | | | | | | | | | | | $ | 14,243 | |
| | | | | | | | | | | | | | | | |
Forward Foreign Currency Exchange Contracts
| | | | | | | | | | | | | | | | | | | | | | | | | | | | |
| | | | | | | |
Currency Purchased | | | | | Currency Sold | | | Counterparty | | Settlement Date | | | | | | Unrealized Appreciation (Depreciation) | |
| | | | | | | | |
CAD | | | 26,000 | | | | | | USD | | | | 20,301 | | | Bank of America N.A. | | | 03/16/22 | | | | | | | $ | 250 | |
CAD | | | 27,000 | | | | | | USD | | | | 21,189 | | | Standard Chartered Bank | | | 03/16/22 | | | | | | | | 153 | |
EUR | | | 584,849 | | | | | | USD | | | | 663,926 | | | Morgan Stanley & Co. International PLC | | | 03/16/22 | | | | | | | | 2,902 | |
EUR | | | 15,000 | | | | | | USD | | | | 16,997 | | | Standard Chartered Bank | | | 03/16/22 | | | | | | | | 105 | |
EUR | | | 28,000 | | | | | | USD | | | | 31,751 | | | Standard Chartered Bank | | | 03/16/22 | | | | | | | | 173 | |
USD | | | 217,951 | | | | | | JPY | | | | 24,543,341 | | | Morgan Stanley & Co. International PLC | | | 03/16/22 | | | | | | | | 4,465 | |
| | | | | | | | | | | | | | | | | | | | | | | | | | | | |
| | | | | | | | |
| | | | | | | | | | | | | | | | | | | | | | | | | | | 8,048 | |
| | | | | | | | | | | | | | | | | | | | | | | | | | | | |
USD | | | 212,888 | | | | | | AUD | | | | 299,103 | | | State Street Bank and Trust Co. | | | 03/16/22 | | | | | | | | (4,762 | ) |
USD | | | 216,685 | | | | | | CAD | | | | 277,516 | | | Bank of America N.A. | | | 03/16/22 | | | | | | | | (2,671 | ) |
USD | | | 27,144 | | | | | | EUR | | | | 24,000 | | | Bank of America N.A. | | | 03/16/22 | | | | | | | | (220 | ) |
USD | | | 14,773 | | | | | | EUR | | | | 13,000 | | | Standard Chartered Bank | | | 03/16/22 | | | | | | | | (49 | ) |
USD | | | 26,111 | | | | | | EUR | | | | 23,000 | | | State Street Bank and Trust Co. | | | 03/16/22 | | | | | | | | (113 | ) |
| | | | | | | | | | | | | | | | | | | | | | | | | | | | |
| | | | | | | | |
| | | | | | | | | | | | | | | | | | | | | | | | | | | (7,815 | ) |
| | | | | | | | | | | | | | | | | | | | | | | | | | | | |
| | | | | | | | |
| | | | | | | | | | | | | | | | | | | | | | | | | | $ | 233 | |
| | | | | | | | | | | | | | | | | | | | | | | | | | | | |
Derivative Financial Instruments Categorized by Risk Exposure
As of period end, the fair values of derivative financial instruments located in the Statements of Assets and Liabilities were as follows:
| | | | | | | | | | | | | | | | | | | | | | | | | | | | |
| | | | | | | | |
| | | Commodity Contracts | | | Credit Contracts | | | Equity Contracts | | | Foreign Currency Exchange Contracts | | | Interest Rate Contracts | | | Other Contracts | | | Total | |
| | | | | | | |
Assets — Derivative Financial Instruments | | | | | | | | | | | | | | | | | | | | | | | | | | | | |
Futures contracts | | | | | | | | | | | | | | | | | | | | | | | | | | | | |
Unrealized appreciation on futures contracts(a) | | $ | — | | | $ | — | | | $ | 16,242 | | | $ | — | | | $ | — | | | $ | — | | | $ | 16,242 | |
Forward foreign currency exchange contracts | | | | | | | | | | | | | | | | | | | | | | | | | | | | |
Unrealized appreciation on forward foreign currency exchange contracts | | | — | | | | — | | | | — | | | | 8,048 | | | | — | | | | — | | | | 8,048 | |
| | | | | | | | | | | | | | | | | | | | | | | | | | | | |
| | | | | | | |
| | $ | — | | | $ | — | | | $ | 16,242 | | | $ | 8,048 | | | $ | — | | | $ | — | | | $ | 24,290 | |
| | | | | | | | | | | | | | | | | | | | | | | | | | | | |
Liabilities — Derivative Financial Instruments | | | | | | | | | | | | | | | | | | | | | | | | | | | | |
Futures contracts | | | | | | | | | | | | | | | | | | | | | | | | | | | | |
Unrealized depreciation on futures contracts(a) | | $ | — | | | $ | — | | | $ | 1,999 | | | $ | — | | | $ | — | | | $ | — | | | $ | 1,999 | |
Forward foreign currency exchange contracts | | | | | | | | | | | | | | | | | | | | | | | | | | | | |
Unrealized depreciation on forward foreign currency exchange contracts | | | — | | | | — | | | | — | | | | 7,815 | | | | — | | | | — | | | | 7,815 | |
| | | | | | | | | | | | | | | | | | | | | | | | | | | | |
| | | | | | | |
| | $ | — | | | $ | — | | | $ | 1,999 | | | $ | 7,815 | | | $ | — | | | $ | — | | | $ | 9,814 | |
| | | | | | | | | | | | | | | | | | | | | | | | | | | | |
| | (a) | Net cumulative unrealized appreciation (depreciation) on futures contracts and centrally cleared swaps, if any, are reported in the Schedule of Investments. In the Statements of Assets and Liabilities, only current day’s variation margin is reported in receivables or payables and the net cumulative unrealized appreciation (depreciation) is included in accumulated earnings (loss). | |
| | |
| 70 | | 2 0 2 1 BLACK ROCK ANNUAL REPORT TO SHAREHOLDERS |
| | |
Schedule of Investments (continued) December 31, 2021 | | BlackRock LifePath® Dynamic 2060 Fund |
For the period ended December 31, 2021, the effect of derivative financial instruments in the Statements of Operations was as follows:
| | | | | | | | | | | | | | | | | | | | | | | | | | | | |
| |
| | | | | | | |
| | | Commodity
Contracts | | | Credit
Contracts | | | Equity
Contracts | | | Foreign
Currency
Exchange
Contracts | | | Interest
Rate
Contracts | | | Other
Contracts | | | Total | |
| |
| | | | | | | |
Net Realized Gain (Loss) from: | | | | | | | | | | | | | | | | | | | | | | | | | | | | |
Futures contracts | | $ | — | | | $ | — | | | $ | 133,953 | | | $ | — | | | $ | — | | | $ | — | | | $ | 133,953 | |
Forward foreign currency exchange contracts | | | — | | | | — | | | | — | | | | (38,093 | ) | | | — | | | | — | | | | (38,093 | ) |
| | | | | | | | | | | | | | | | | | | | | | | | | | | | |
| | | | | | | |
| | $ | — | | | $ | — | | | $ | 133,953 | | | $ | (38,093 | ) | | $ | — | | | $ | — | | | $ | 95,860 | |
| | | | | | | | | | | | | | | | | | | | | | | | | | | | |
Net Change in Unrealized Appreciation (Depreciation) on: | | | | | | | | | | | | | | | | | | | | | | | | | | | | |
Futures contracts | | $ | — | | | $ | — | | | $ | 7,394 | | | $ | — | | | $ | — | | | $ | — | | | $ | 7,394 | |
Forward foreign currency exchange contracts | | | — | | | | — | | | | — | | | | (5,916 | ) | | | — | | | | — | | | | (5,916 | ) |
| | | | | | | | | | | | | | | | | | | | | | | | | | | | |
| | | | | | | |
| | $ | — | | | $ | — | | | $ | 7,394 | | | $ | (5,916 | ) | | $ | — | | | $ | — | | | $ | 1,478 | |
| | | | | | | | | | | | | | | | | | | | | | | | | | | | |
Average Quarterly Balances of Outstanding Derivative Financial Instruments
| | | | |
| |
| |
Futures contracts: | | | | |
Average notional value of contracts — long | | $ | 1,408,499 | |
Average notional value of contracts — short | | $ | 178,269 | |
Forward foreign currency exchange contracts: | | | | |
Average amounts purchased — in USD | | $ | 502,241 | |
Average amounts sold — in USD | | $ | 856,136 | |
| |
For more information about the LifePath Dynamic Fund’s investment risks regarding derivative financial instruments, refer to the Notes to Financial Statements.
Derivative Financial Instruments — Offsetting as of Period End
The LifePath Dynamic Fund’s derivative assets and liabilities (by type) were as follows:
| | | | | | | | |
| | | |
| | | Assets | | | Liabilities | |
| | |
Derivative Financial Instruments | | | | | | | | |
Futures contracts | | $ | 206 | | | $ | 617 | |
Forward foreign currency exchange contracts | | | 8,048 | | | | 7,815 | |
| | | | | | | | |
| | |
Total derivative assets and liabilities in the Statements of Assets and Liabilities | | | 8,254 | | | | 8,432 | |
| | | | | | | | |
| | |
Derivatives not subject to a Master Netting Agreement or similar agreement (“MNA”) | | | (206 | ) | | | (617 | ) |
| | | | | | | | |
| | |
Total derivative assets and liabilities subject to an MNA | | $ | 8,048 | | | $ | 7,815 | |
| | | | | | | | |
The following table presents the LifePath Dynamic Fund’s derivative assets and liabilities by counterparty net of amounts available for offset under an MNA and net of the related collateral received (and pledged) by the LifePath Dynamic Fund:
| | | | | | | | | | | | | | | | | | | | |
| | | | | | |
Counterparty | |
| Derivative
Assets Subject to an MNA by Counterparty |
| |
| Derivatives
Available for Offset |
(a) | |
| Non-Cash
Collateral Received |
| |
| Cash
Collateral Received |
| |
| Net Amount
of Derivative Assets |
(b)(c) |
| | | | | |
Bank of America N.A. | | $ | 250 | | | $ | (250) | | | $ | — | | | $ | — | | | $ | — | |
Morgan Stanley & Co. International PLC | | | 7,367 | | | | — | | | | — | | | | — | | | | 7,367 | |
Standard Chartered Bank | | | 431 | | | | (49 | ) | | | — | | | | — | | | | 382 | |
| | | | | | | | | | | | | | | | | | | | |
| | | | | |
| | $ | 8,048 | | | $ | (299) | | | $ | — | | | $ | — | | | $ | 7,749 | |
| | | | | | | | | | | | | | | | | | | | |
| | |
SCHEDULE OF INVESTMENTS | | 71 |
| | |
Schedule of Investments (continued) December 31, 2021 | | BlackRock LifePath® Dynamic 2060 Fund |
| | | | | | | | | | | | | | | | | | | | |
| | | | | | |
Counterparty | |
| Derivative
Liabilities Subject to an MNA by Counterparty |
| |
| Derivatives
Available for Offset |
(a) | |
| Non-Cash
Collateral Pledged |
| |
| Cash
Collateral Pledged |
| |
| Net Amount
of Derivative Liabilities |
(b)(d) |
| | | | | |
Bank of America N.A. | | $ | 2,891 | | | $ | (250) | | | $ | — | | | $ | — | | | $ | 2,641 | |
Standard Chartered Bank | | | 49 | | | | (49 | ) | | | — | | | | — | | | | — | |
State Street Bank and Trust Co. | | | 4,875 | | | | — | | | | — | | | | — | | | | 4,875 | |
| | | | | | | | | | | | | | | | | | | | |
| | | | | |
| | $ | 7,815 | | | $ | (299) | | | $ | — | | | $ | — | | | $ | 7,516 | |
| | | | | | | | | | | | | | | | | | | | |
| | (a) | The amount of derivatives available for offset is limited to the amount of derivative asset and/or liabilities that are subject to an MNA. | |
| | (b) | Net amount may also include forward foreign currency exchange contracts that are not required to be collateralized. | |
| | (c) | Net amount represents the net amount receivable from the counterparty in the event of default. | |
| | (d) | Net amount represents the net amount payable due to counterparty in the event of default. | |
Fair Value Hierarchy as of Period End
Various inputs are used in determining the fair value of financial instruments. For a description of the input levels and information about the LifePath Dynamic Fund’s policy regarding valuation of financial instruments, refer to the Notes to Financial Statements.
The following table summarizes the LifePath Dynamic Fund’s financial instruments categorized in the fair value hierarchy. The breakdown of the LifePath Dynamic Fund’s financial instruments into major categories is disclosed in the Schedule of Investments above.
| | | | | | | | | | | | | | | | |
| |
| | | | |
| | | Level 1 | | | Level 2 | | | Level 3 | | | Total | |
| |
| | | | |
Assets | | | | | | | | | | | | | | | | |
Investments | | | | | | | | | | | | | | | | |
Investment Companies | | | | | | | | | | | | | | | | |
Equity Funds | | $ | 5,099,674 | | | $ | — | | | $ | — | | | $ | 5,099,674 | |
Fixed-Income Funds | | | 205,952 | | | | — | | | | — | | | | 205,952 | |
Money Market Funds | | | 1,015,970 | | | | — | | | | — | | | | 1,015,970 | |
| | | | | | | | | | | | | | | | |
| | | | |
| | $ | 6,321,596 | | | $ | — | | | $ | — | | | | 6,321,596 | |
| | | | | | | | | | | | | | | | |
| | | | |
Investments Valued at NAV(a) | | | | | | | | | | | | | | | 14,064,812 | |
| | | | | | | | | | | | | | | | |
| | | | |
| | | | | | | | | | | | | | $ | 20,386,408 | |
| | | | | | | | | | | | | | | | |
Derivative Financial Instruments(b) | | | | | | | | | | | | | | | | |
Assets | | | | | | | | | | | | | | | | |
Equity Contracts | | $ | 16,242 | | | $ | — | | | $ | — | | | $ | 16,242 | |
Foreign Currency Exchange Contracts | | | — | | | | 8,048 | | | | — | | | | 8,048 | |
Liabilities | | | | | | | | | | | | | | | | |
Equity Contracts | | | (1,999 | ) | | | — | | | | — | | | | (1,999 | ) |
Foreign Currency Exchange Contracts | | | — | | | | (7,815 | ) | | | — | | | | (7,815 | ) |
| | | | | | | | | | | | | | | | |
| | | | |
| | $ | 14,243 | | | $ | 233 | | | $ | — | | | $ | 14,476 | |
| | | | | | | | | | | | | | | | |
| | (a) | Certain investments of the Fund were fair valued using NAV per share or its equivalent as no quoted market value is available and therefore have been excluded from the fair value hierarchy. | |
| | (b) | Derivative financial instruments are futures contracts and forward foreign currency exchange contracts. Futures contracts and forward foreign currency exchange contracts are valued at the unrealized appreciation (depreciation) on the instrument. | |
See notes to financial statements.
| | |
| 72 | | 2 0 2 1 BLACK ROCK ANNUAL REPORT TO SHAREHOLDERS |
| | |
Schedule of Investments December 31, 2021 | | BlackRock LifePath® Dynamic 2065 Fund (Percentages shown are based on Net Assets) |
| | | | | | | | |
| Security | | Shares/
Investment Value | | | Value | |
|
Investment Companies(a) | |
|
Equity Funds — 98.2% | |
BlackRock Advantage Emerging Markets Fund, Class K | | | 65,103 | | | $ | 770,169 | |
Diversified Equity Master Portfolio | | $ | 3,713,727 | | | | 3,713,727 | |
International Tilts Master Portfolio | | $ | 1,025,426 | | | | 1,025,426 | |
iShares Developed Real Estate Index Fund, Class K | | | 28,643 | | | | 342,280 | |
iShares MSCI Canada ETF | | | 4,852 | | | | 186,462 | |
iShares MSCI EAFE Small-Cap ETF | | | 5,305 | | | | 387,742 | |
iShares Russell 2000 ETF | | | 255 | | | | 56,725 | |
| | | | | | | | |
| | |
| | | | | | | 6,482,531 | |
|
Fixed-Income Funds — 1.5% | |
Advantage CoreAlpha Bond Master Portfolio | | $ | 17,289 | | | | 17,289 | |
iShares Core U.S. Aggregate Bond ETF | | | 509 | | | | 58,067 | |
iShares iBoxx $ Investment Grade Corporate Bond ETF(b) | | | 85 | | | | 11,264 | |
Master Total Return Portfolio | | $ | 11,651 | | | | 11,651 | |
| | | | | | | | |
| | |
| | | | | | | 98,271 | |
| | | | | | | | |
| Security | | Shares | | | Value | |
| |
|
Money Market Funds — 7.0% | |
BlackRock Cash Funds: Institutional, SL Agency Shares, 0.10%(c)(d) | | | 11,446 | | | $ | 11,449 | |
BlackRock Cash Funds: Treasury, SL Agency Shares, 0.01%(c) | | | 449,277 | | | | 449,277 | |
| | | | | | | | |
| | |
| | | | | | | 460,726 | |
| | | | | | | | |
| |
Total Investments — 106.7%
(Cost: $5,959,685) | | | | 7,041,528 | |
| |
Liabilities in Excess of Other Assets — (6.7)% | | | | (444,768 | ) |
| | | | | | | | |
| | |
Net Assets — 100.0% | | | | | | $ | 6,596,760 | |
| | | | | | | | |
| (a) | Affiliate of the Fund. |
| (b) | All or a portion of this security is on loan. |
| (c) | Annualized 7-day yield as of period end. |
| (d) | All or a portion of this security was purchased with the cash collateral from loaned securities. |
Affiliates
Investments in issuers considered to be affiliate(s) of the LifePath Dynamic Fund during the year ended December 31, 2021 for purposes of Section 2(a)(3) of the Investment Company Act of 1940, as amended, were as follows:
| | | | | | | | | | | | | | | | | | | | | | | | | | | | | | | | | | | | | | | | |
| | | | | |
| | | | | | | | | | | |
| | | Affiliated Issuer | | Value at 12/31/20 | | | Purchases at Cost | | | Proceeds from Sales | | | Net Realized Gain (Loss) | | | Change in Unrealized Appreciation (Depreciation) | | | Value at 12/31/21 | | | Shares/ Investment
Value Held at 12/31/21 | | | Income | | | Capital Gain Distributions from Underlying Funds | | | |
| | | | | |
| | Advantage CoreAlpha Bond Master Portfolio | | $ | 12,681 | | | $ | 5,171 | (a)(b) | | $ | — | | | $ | 183 | | | $ | (746 | ) | | $ | 17,289 | | | $ | 17,289 | | | $ | 347 | | | $ | — | | | |
| | BlackRock Advantage Emerging Markets Fund, Class K | | | 578,368 | | | | 274,512 | | | | (35,504 | ) | | | (821 | ) | | | (46,386 | ) | | | 770,169 | | | | 65,103 | | | | 10,205 | | | | — | | | |
| | BlackRock Cash Funds: Institutional, SL Agency Shares | | | 413,766 | | | | — | | | | (402,248 | )(a) | | | (69 | ) | | | — | | | | 11,449 | | | | 11,446 | | | | 481 | (c) | | | — | | | |
| | BlackRock Cash Funds: Treasury, SL Agency Shares | | | 108,621 | | | | 340,656 | (a) | | | — | | | | — | | | | — | | | | 449,277 | | | | 449,277 | | | | 22 | | | | — | | | |
| | Diversified Equity Master Portfolio | | | 2,631,746 | | | | 366,666 | (a)(b) | | | — | | | | 702,782 | | | | 12,533 | | | | 3,713,727 | | | $ | 3,713,727 | | | | 30,297 | | | | — | | | |
| | International Tilts Master Portfolio | | | 798,753 | | | | 135,694 | (a)(b) | | | — | | | | 80,412 | | | | 10,567 | | | | 1,025,426 | | | $ | 1,025,426 | | | | 16,855 | | | | — | | | |
| | iShares Core U.S. Aggregate Bond ETF | | | 28,247 | | | | 31,130 | | | | — | | | | — | | | | (1,310 | ) | | | 58,067 | | | | 509 | | | | 737 | | | | — | | | |
| | iShares Developed Real Estate Index Fund, Class K | | | 233,080 | | | | 68,799 | | | | (13,930 | ) | | | (159 | ) | | | 54,490 | | | | 342,280 | | | | 28,643 | | | | 12,901 | | | | 531 | | | |
| | iShares iBoxx $ Investment Grade Corporate Bond ETF | | | 11,741 | | | | — | | | | — | | | | — | | | | (477 | ) | | | 11,264 | | | | 85 | | | | 259 | | | | — | | | |
| | iShares MSCI Canada ETF | | | 125,611 | | | | 29,231 | | | | — | | | | — | | | | 31,620 | | | | 186,462 | | | | 4,852 | | | | 3,269 | | | | — | | | |
| | iShares MSCI EAFE Small-Cap ETF | | | 329,721 | | | | 414,565 | | | | (370,511 | ) | | | 13,169 | | | | 798 | | | | 387,742 | | | | 5,305 | | | | 12,021 | | | | — | | | |
| | iShares Russell 2000 ETF | | | 72,150 | | | | — | | | | (24,838 | ) | | | 7,173 | | | | 2,240 | | | | 56,725 | | | | 255 | | | | 554 | | | | — | | | |
| | Master Total Return Portfolio | | | 10,075 | | | | 1,793 | (a)(b) | | | — | | | | 102 | | | | (319 | ) | | | 11,651 | | | $ | 11,651 | | | | 204 | | | | — | | | |
| | | | | | | | | | | | | | | | | | | | | | | | | | | | | | | | | | | | | | | | |
| | | | | | | | | | | |
| | | | | | | | | | | | | | | | $ | 802,772 | | | $ | 63,010 | | | $ | 7,041,528 | | | | | | | $ | 88,152 | | | $ | 531 | | | |
| | | | | | | | | | | | | | | | | | | | | | | | | | | | | | | | | | | | | | | | |
| | (a) | Represents net amount purchased (sold). | |
| | (b) | Inclusive of income and expense allocated from the Master Portfolio. | |
| | (c) | All or a portion represents securities lending income earned from the reinvestment of cash collateral from loaned securities, net of fees and collateral investment expenses, and other payments to and from borrowers of securities. | |
| | |
SCHEDULE OF INVESTMENTS | | 73 |
| | |
Schedule of Investments (continued) December 31, 2021 | | BlackRock LifePath® Dynamic 2065 Fund |
Derivative Financial Instruments Outstanding as of Period End
Futures Contracts
| | | | | | | | | | | | | | | | |
| | | | | |
| Description | | Number of
Contracts | | | Expiration
Date | | | Notional
Amount (000) | | | Value/
Unrealized
Appreciation
(Depreciation) | |
| | | | |
Long Contracts | | | | | | | | | | | | | | | | |
MSCI EAFE Index | | | 3 | | | | 03/18/22 | | | $ | 348 | | | $ | 4,865 | |
S&P 500 Micro E-Mini Index | | | 4 | | | | 03/18/22 | | | | 95 | | | | 1,583 | |
| | | | | | | | | | | | | | | | |
| | | | |
| | | | | | | | | | | | | | $ | 6,448 | |
| | | | | | | | | | | | | | | | |
Forward Foreign Currency Exchange Contracts
| | | | | | | | | | | | | | | | | | | | | | |
| | | | | | | |
| Currency Purchased | | | | | Currency Sold | | | Counterparty | | Settlement Date | | | | | | Unrealized
Appreciation
(Depreciation) | |
| | | | | | |
| CAD | 1,000 | | | | | USD | 781 | | | Bank of America N.A. | | | 03/16/22 | | | | | | | $ | 10 | |
| CAD | 10,000 | | | | | USD | 7,789 | | | Bank of America N.A. | | | 03/16/22 | | | | | | | | 115 | |
| EUR | 161,195 | | | | | USD | 182,990 | | | Morgan Stanley & Co. International PLC | | | 03/16/22 | | | | | | | | 800 | |
| USD | 68,065 | | | | | JPY | 7,664,728 | | | Morgan Stanley & Co. International PLC | | | 03/16/22 | | | | | | | | 1,394 | |
| | | | | | | | | | | | | | | | | | | | | | |
| | | | | | |
| | | | | | | | | | | | | | | | | | | | | 2,319 | |
| | | | | | | | | | | | | | | | | | | | | | |
| USD | 67,115 | | | | | AUD | 94,290 | | | Bank of America N.A. | | | 03/16/22 | | | | | | | | (1,497 | ) |
| USD | 67,838 | | | | | CAD | 86,883 | | | Bank of America N.A. | | | 03/16/22 | | | | | | | | (836 | ) |
| USD | 9,082 | | | | | EUR | 8,000 | | | Bank of America N.A. | | | 03/16/22 | | | | | | | | (40 | ) |
| | | | | | | | | | | | | | | | | | | | | | |
| | | | | | |
| | | | | | | | | | | | | | | | | | | | | (2,373 | ) |
| | | | | | | | | | | | | | | | | | | | | | |
| | | | | | |
| | | | | | | | | | | | | | | | | | | | $ | (54 | ) |
| | | | | | | | | | | | | | | | | | | | | | |
Derivative Financial Instruments Categorized by Risk Exposure
As of period end, the fair values of derivative financial instruments located in the Statements of Assets and Liabilities were as follows:
| | | | | | | | | | | | | | | | | | | | | | | | | | | | |
| | | | | | | | |
| | | Commodity
Contracts | | | Credit
Contracts | | | Equity Contracts | | | Foreign
Currency
Exchange
Contracts | | | Interest
Rate
Contracts | | | Other
Contracts | | | Total | |
| | | | | | | |
Assets — Derivative Financial Instruments | | | | | | | | | | | | | | | | | | | | | | | | | | | | |
Futures contracts | | | | | | | | | | | | | | | | | | | | | | | | | | | | |
Unrealized appreciation on futures contracts(a) | | $ | — | | | $ | — | | | $ | 6,448 | | | $ | — | | | $ | — | | | $ | — | | | $ | 6,448 | |
Forward foreign currency exchange contracts | | | | | | | | | | | | | | | | | | | | | | | | | | | | |
Unrealized appreciation on forward foreign currency exchange contracts | | | — | | | | — | | | | — | | | | 2,319 | | | | — | | | | — | | | | 2,319 | |
| | | | | | | | | | | | | | | | | | | | | | | | | | | | |
| | | | | | | |
| | $ | — | | | $ | — | | | $ | 6,448 | | | $ | 2,319 | | | $ | — | | | $ | — | | | $ | 8,767 | |
| | | | | | | | | | | | | | | | | | | | | | | | | | | | |
Liabilities — Derivative Financial Instruments | | | | | | | | | | | | | | | | | | | | | | | | | | | | |
Forward foreign currency exchange contracts | | | | | | | | | | | | | | | | | | | | | | | | | | | | |
Unrealized depreciation on forward foreign currency exchange contracts | | $ | — | | | $ | — | | | $ | — | | | $ | 2,373 | | | $ | — | | | $ | — | | | $ | 2,373 | |
| | | | | | | | | | | | | | | | | | | | | | | | | | | | |
| | (a) | Net cumulative unrealized appreciation (depreciation) on futures contracts and centrally cleared swaps, if any, are reported in the Schedule of Investments. In the Statements of Assets and Liabilities, only current day’s variation margin is reported in receivables or payables and the net cumulative unrealized appreciation (depreciation) is included in accumulated earnings (loss). | |
| | |
| 74 | | 2 0 2 1 BLACK ROCK ANNUAL REPORT TO SHAREHOLDERS |
| | |
Schedule of Investments (continued) December 31, 2021 | | BlackRock LifePath® Dynamic 2065 Fund |
For the period ended December 31, 2021, the effect of derivative financial instruments in the Statements of Operations was as follows:
| | | | | | | | | | | | | | | | | | | | | | | | | | | | |
| | | | | | | | |
| | | Commodity
Contracts | | | Credit
Contracts | | | Equity Contracts | | | Foreign
Currency
Exchange
Contracts | | | Interest
Rate
Contracts | | | Other
Contracts | | | Total | |
| | | | | | | |
Net Realized Gain (Loss) from: | | | | | | | | | | | | | | | | | | | | | | | | | | | | |
Futures contracts | | $ | — | | | $ | — | | | $ | 50,315 | | | $ | — | | | $ | — | | | $ | — | | | $ | 50,315 | |
Forward foreign currency exchange contracts | | | — | | | | — | | | | — | | | | (12,023 | ) | | | — | | | | — | | | | (12,023 | ) |
| | | | | | | | | | | | | | | | | | | | | | | | | | | | |
| | | | | | | |
| | $ | — | | | $ | — | | | $ | 50,315 | | | $ | (12,023 | ) | | $ | — | | | $ | — | | | $ | 38,292 | |
| | | | | | | | | | | | | | | | | | | | | | | | | | | | |
Net Change in Unrealized Appreciation (Depreciation) on: | | | | | | | | | | | | | | | | | | | | | | | | | | | | |
Futures contracts | | $ | — | | | $ | — | | | $ | 3,967 | | | $ | — | | | $ | — | | | $ | — | | | $ | 3,967 | |
Forward foreign currency exchange contracts | | | — | | | | — | | | | — | | | | (3,084 | ) | | | — | | | | — | | | | (3,084 | ) |
| | | | | | | | | | | | | | | | | | | | | | | | | | | | |
| | | | | | | |
| | $ | — | | | $ | — | | | $ | 3,967 | | | $ | (3,084 | ) | | $ | — | | | $ | — | | | $ | 883 | |
| | | | | | | | | | | | | | | | | | | | | | | | | | | | |
Average Quarterly Balances of Outstanding Derivative Financial Instruments
| | | | |
| | |
Futures contracts: | | | | |
Average notional value of contracts — long | | $ | 362,916 | |
Average notional value of contracts — short | | $ | 27,366 | |
Forward foreign currency exchange contracts: | | | | |
Average amounts purchased — in USD | | $ | 166,161 | |
Average amounts sold — in USD | | $ | 296,391 | |
For more information about the LifePath Dynamic Fund’s investment risks regarding derivative financial instruments, refer to the Notes to Financial Statements.
Derivative Financial Instruments — Offsetting as of Period End
The LifePath Dynamic Fund’s derivative assets and liabilities (by type) were as follows:
| | | | | | | | | | | | |
| | | | |
| | | Assets | | | | | | Liabilities | |
| | | |
Derivative Financial Instruments | | | | | | | | | | | | |
Futures contracts | | $ | — | | | | | | | $ | 464 | |
Forward foreign currency exchange contracts | | | 2,319 | | | | | | | | 2,373 | |
| | | | | | | | | | | | |
| | | |
Total derivative assets and liabilities in the Statements of Assets and Liabilities | | | 2,319 | | | | | | | | 2,837 | |
| | | | | | | | | | | | |
Derivatives not subject to a Master Netting Agreement or similar agreement (“MNA”) | | | — | | | | | | | | (464 | ) |
| | | | | | | | | | | | |
| | | |
Total derivative assets and liabilities subject to an MNA | | $ | 2,319 | | | | | | | $ | 2,373 | |
| | | | | | | | | | | | |
The following table presents the LifePath Dynamic Fund’s derivative assets and liabilities by counterparty net of amounts available for offset under an MNA and net of the related collateral received (and pledged) by the LifePath Dynamic Fund:
| | | | | | | | | | | | | | | | | | | | |
| | | | | | |
Counterparty | |
| Derivative
Assets Subject to an MNA by Counterparty |
| |
| Derivatives
Available for Offset |
(a) | |
| Non-Cash
Collateral Received |
| |
| Cash
Collateral Received |
| |
| Net Amount
of Derivative Assets |
(b)(c) |
| | | | | |
Bank of America N.A. | | $ | 125 | | | $ | (125) | | | $ | — | | | $ | — | | | $ | — | |
Morgan Stanley & Co. International PLC | | | 2,194 | | | | — | | | | — | | | | — | | | | 2,194 | |
| | | | | | | | | | | | | | | | | | | | |
| | | | | |
| | $ | 2,319 | | | $ | (125) | | | $ | — | | | $ | — | | | $ | 2,194 | |
| | | | | | | | | | | | | | | | | | | | |
| | | | | | | | | | | | | | | | | | | | |
| | | | | | |
Counterparty | |
| Derivative
Liabilities Subject to an MNA by Counterparty |
| |
| Derivatives
Available for Offset |
(a) | |
| Non-Cash
Collateral Pledged |
| |
| Cash
Collateral Pledged |
| |
| Net Amount
of Derivative Liabilities |
(b)(d) |
| | | | | |
Bank of America N.A | | $ | 2,373 | | | $ | (125) | | | $ | — | | | $ | — | | | $ | 2,248 | |
| | | | | | | | | | | | | | | | | | | | |
| | (a) | The amount of derivatives available for offset is limited to the amount of derivative asset and/or liabilities that are subject to an MNA. | |
| | (b) | Net amount may also include forward foreign currency exchange contracts that are not required to be collateralized. | |
| | (c) | Net amount represents the net amount receivable from the counterparty in the event of default. | |
| | (d) | Net amount represents the net amount payable due to counterparty in the event of default. | |
| | |
SCHEDULE OF INVESTMENTS | | 75 |
| | |
Schedule of Investments (continued) December 31, 2021 | | BlackRock LifePath® Dynamic 2065 Fund |
Fair Value Hierarchy as of Period End
Various inputs are used in determining the fair value of financial instruments. For a description of the input levels and information about the LifePath Dynamic Fund’s policy regarding valuation of financial instruments, refer to the Notes to Financial Statements.
The following table summarizes the LifePath Dynamic Fund’s financial instruments categorized in the fair value hierarchy. The breakdown of the LifePath Dynamic Fund’s financial instruments into major categories is disclosed in the Schedule of Investments above.
| | | | | | | | | | | | | | | | |
| | | | | |
| | | Level 1 | | | Level 2 | | | Level 3 | | | Total | |
| | | | |
Assets | | | | | | | | | | | | | | | | |
Investments | | | | | | | | | | | | | | | | |
Investment Companies | | | | | | | | | | | | | | | | |
Equity Funds | | $ | 1,743,378 | | | $ | — | | | $ | — | | | $ | 1,743,378 | |
Fixed-Income Funds | | | 69,331 | | | | — | | | | — | | | | 69,331 | |
Money Market Funds | | | 460,726 | | | | — | | | | — | | | | 460,726 | |
| | | | | | | | | | | | | | | | |
| | | | |
| | $ | 2,273,435 | | | $ | — | | | $ | — | | | | 2,273,435 | |
| | | | | | | | | | | | | | | | |
| | | | |
Investments Valued at NAV(a) | | | | | | | | | | | | | | | 4,768,093 | |
| | | | | | | | | | | | | | | | |
| | | | |
| | | | | | | | | | | | | | $ | 7,041,528 | |
| | | | | | | | | | | | | | | | |
Derivative Financial Instruments(b) | | | | | | | | | | | | | | | | |
Assets | | | | | | | | | | | | | | | | |
Equity Contracts | | $ | 6,448 | | | $ | — | | | $ | — | | | $ | 6,448 | |
Foreign Currency Exchange Contracts | | | — | | | | 2,319 | | | | — | | | | 2,319 | |
Liabilities | | | | | | | | | | | | | | | | |
Foreign Currency Exchange Contracts | | | — | | | | (2,373 | ) | | | — | | | | (2,373 | ) |
| | | | | | | | | | | | | | | | |
| | | | |
| | $ | 6,448 | | | $ | (54 | ) | | $ | — | | | $ | 6,394 | |
| | | | | | | | | | | | | | | | |
| | (a) | Certain investments of the Fund were fair valued using NAV per share or its equivalent as no quoted market value is available and therefore have been excluded from the fair value hierarchy. | |
| | (b) | Derivative financial instruments are futures contracts and forward foreign currency exchange contracts. Futures contracts and forward foreign currency exchange contracts are valued at the unrealized appreciation (depreciation) on the instrument. | |
See notes to financial statements.
| | |
| 76 | | 2 0 2 1 BLACK ROCK ANNUAL REPORT TO SHAREHOLDERS |
Statements of Assets and Liabilities
December 31, 2021
| | | | | | | | | | | | | | | | | | | | | | | | | | | | | | | | |
| | | BlackRock
LifePath® Dynamic
Retirement Fund | | | BlackRock LifePath® Dynamic 2025 Fund | | | BlackRock LifePath® Dynamic 2030 Fund | | | BlackRock LifePath® Dynamic 2035 Fund | |
| |
| | | | | | | | |
ASSETS | | | | | | | | | | | | | | | | | | | | | | | | | | | | | | | | |
Investments, at value — affiliated(a)(b) | | | | | | $ | 309,887,771 | | | | | | | $ | 123,056,652 | | | | | | | $ | 355,263,352 | | | | | | | $ | 144,398,751 | |
Cash pledged for futures contracts | | | | | | | 1,848,000 | | | | | | | | 649,000 | | | | | | | | 1,899,000 | | | | | | | | 857,000 | |
Foreign currency, at value(c) | | | | | | | 695,512 | | | | | | | | 317,515 | | | | | | | | 980,520 | | | | | | | | 400,329 | |
Receivables: | | | | | | | | | | | | | | | | | | | | | | | | | | | | | | | | |
Investments sold | | | | | | | — | | | | | | | | — | | | | | | | | 1,060,071 | | | | | | | | — | |
Securities lending income — affiliated | | | | | | | 3,224 | | | | | | | | 1,049 | | | | | | | | 3,261 | | | | | | | | 1,093 | |
Capital shares sold | | | | | | | 1,037,129 | | | | | | | | 415,321 | | | | | | | | 993,190 | | | | | | | | 583,456 | |
Dividends — affiliated | | | | | | | 6,285 | | | | | | | | 3,488 | | | | | | | | 13,688 | | | | | | | | 6,086 | |
Variation margin on futures contracts | | | | | | | 33,301 | | | | | | | | 12,371 | | | | | | | | 30,897 | | | | | | | | 10,416 | |
Unrealized appreciation on forward foreign currency exchange contracts | | | | | | | 152,038 | | | | | | | | 69,450 | | | | | | | | 197,396 | | | | | | | | 85,762 | |
| | | | | | | | | | | | | | | | | | | | | | | | | | | | | | | | |
| | | | | | | | |
Total assets | | | | | | | 313,663,260 | | | | | | | | 124,524,846 | | | | | | | | 360,441,375 | | | | | | | | 146,342,893 | |
| | | | | | | | | | | | | | | | | | | | | | | | | | | | | | | | |
| | | | | | | | |
LIABILITIES | | | | | | | | | | | | | | | | | | | | | | | | | | | | | | | | |
Collateral on securities loaned | | | | | | | 7,816,077 | | | | | | | | 5,474,318 | | | | | | | | 19,324,843 | | | | | | | | 2,731,608 | |
Payables: | | | | | | | | | | | | | | | | | | | | | | | | | | | | | | | | |
Investments purchased | | | | | | | — | | | | | | | | — | | | | | | | | — | | | | | | | | 355,952 | |
Administration fees | | | | | | | 57,634 | | | | | | | | 9,942 | | | | | | | | 60,592 | | | | | | | | 11,787 | |
Capital gains distributions | | | | | | | 659,691 | | | | | | | | 233,001 | | | | | | | | 593,492 | | | | | | | | 280,822 | |
Capital shares redeemed | | | | | | | 2,880,840 | | | | | | | | 339,420 | | | | | | | | 3,110,498 | | | | | | | | 942,077 | |
Income dividend distributions | | | | | | | 224,828 | | | | | | | | 129,051 | | | | | | | | 273,871 | | | | | | | | 195,486 | |
Investment advisory fees | | | | | | | 36,778 | | | | | | | | 12,724 | | | | | | | | 29,753 | | | | | | | | 10,716 | |
Trustees’ and Officer’s fees | | | | | | | 3,516 | | | | | | | | 3,395 | | | | | | | | 3,548 | | | | | | | | 3,385 | |
Professional fees | | | | | | | 23,927 | | | | | | | | 23,423 | | | | | | | | 24,752 | | | | | | | | 23,443 | |
Service and distribution fees | | | | | | | 40,654 | | | | | | | | 9,111 | | | | | | | | 42,034 | | | | | | | | 10,380 | |
Variation margin on futures contracts | | | | | | | 94,513 | | | | | | | | 38,060 | | | | | | | | 108,991 | | | | | | | | 45,630 | |
Unrealized depreciation on forward foreign currency exchange contracts | | | | | | | 53,291 | | | | | | | | 28,833 | | | | | | | | 129,801 | | | | | | | | 52,307 | |
| | | | | | | | | | | | | | | | | | | | | | | | | | | | | | | | |
| | | | | | | | |
Total liabilities | | | | | | | 11,891,749 | | | | | | | | 6,301,278 | | | | | | | | 23,702,175 | | | | | | | | 4,663,593 | |
| | | | | | | | | | | | | | | | | | | | | | | | | | | | | | | | |
| | | | | | | | |
NET ASSETS | | | | | | $ | 301,771,511 | | | | | | | $ | 118,223,568 | | | | | | | $ | 336,739,200 | | | | | | | $ | 141,679,300 | |
| | | | | | | | | | | | | | | | | | | | | | | | | | | | | | | | |
| | | | | | | | |
NET ASSETS CONSIST OF | | | | | | | | | | | | | | | | | | | | | | | | | | | | | | | | |
Paid-in capital | | | | | | $ | 203,056,014 | | | | | | | $ | 106,998,132 | | | | | | | $ | 301,119,515 | | | | | | | $ | 123,410,448 | |
Accumulated earnings | | | | | | | 98,715,497 | | | | | | | | 11,225,436 | | | | | | | | 35,619,685 | | | | | | | | 18,268,852 | |
| | | | | | | | | | | | | | | | | | | | | | | | | | | | | | | | |
| | | | | | | | |
NET ASSETS | | | | | | $ | 301,771,511 | | | | | | | $ | 118,223,568 | | | | | | | $ | 336,739,200 | | | | | | | $ | 141,679,300 | |
| | | | | | | | | | | | | | | | | | | | | | | | | | | | | | | | |
| | | | | | | | |
(a) Investments, at cost — affiliated | | | | | | $ | 215,443,945 | | | | | | | $ | 111,395,675 | | | | | | | $ | 311,777,081 | | | | | | | $ | 126,163,449 | |
(b) Securities loaned, at value | | | | | | $ | 7,649,619 | | | | | | | $ | 5,357,811 | | | | | | | $ | 18,912,976 | | | | | | | $ | 2,671,148 | |
(c) Foreign currency, at cost | | | | | | $ | 692,692 | | | | | | | $ | 323,016 | | | | | | | $ | 996,892 | | | | | | | $ | 406,310 | |
Statements of Assets and Liabilities (continued)
December 31, 2021
| | | | | | | | | | | | | | | | | | | | | | | | | | | | | | |
| | | BlackRock LifePath® Dynamic Retirement Fund | | | BlackRock LifePath® Dynamic 2025 Fund | | | BlackRock LifePath® Dynamic 2030 Fund | | | BlackRock LifePath® Dynamic 2035 Fund | |
| |
| | | | | | | | |
NET ASSET VALUE | | | | | | | | | | | | | | | | | | | | | | | | | | | | | | |
| | | | | | | | |
| Institutional | | | | | | | | | | | | | | | | | | | | | | | |
| | | | | | | | |
Net assets | | | | $ | 49,942,583 | | | | | | | $ | 11,871,792 | | | | | | | $ | 55,606,200 | | | | | | | $ | 12,897,568 | |
| | | | | | | | | | | | | | | | | | | | | | | | | | | | | | |
| | | | | | | | |
Shares outstanding | | | | | 4,588,046 | | | | | | | | 822,666 | | | | | | | | 3,944,533 | | | | | | | | 799,830 | |
| | | | | | | | | | | | | | | | | | | | | | | | | | | | | | |
| | | | | | | | |
Net asset value | | | | $ | 10.89 | | | | | | | $ | 14.43 | | | | | | | $ | 14.10 | | | | | | | $ | 16.13 | |
| | | | | | | | | | | | | | | | | | | | | | | | | | | | | | |
| | | | | | | | |
Shares authorized | | | | | Unlimited | | | | | | | | Unlimited | | | | | | | | Unlimited | | | | | | | | Unlimited | |
| | | | | | | | | | | | | | | | | | | | | | | | | | | | | | |
| | | | | | | | |
Par value | | | | | No par value | | | | | | | | No par value | | | | | | | | No par value | | | | | | | | No par value | |
| | | | | | | | | | | | | | | | | | | | | | | | | | | | | | |
| | | | | | | | |
Investor A | | | | | | | | | | | | | | | | | | | | | | | | | | | | | | |
| | | | | | | | |
Net assets | | | | $ | 164,480,645 | | | | | | | $ | 23,787,600 | | | | | | | $ | 172,296,184 | | | | | | | $ | 26,303,938 | |
| | | | | | | | | | | | | | | | | | | | | | | | | | | | | | |
| | | | | | | | |
Shares outstanding | | | | | 18,042,836 | | | | | | | | 1,666,200 | | | | | | | | 12,955,806 | | | | | | | | 1,639,258 | |
| | | | | | | | | | | | | | | | | | | | | | | | | | | | | | |
| | | | | | | | |
Net asset value | | | | $ | 9.12 | | | | | | | $ | 14.28 | | | | | | | $ | 13.30 | | | | | | | $ | 16.05 | |
| | | | | | | | | | | | | | | | | | | | | | | | | | | | | | |
| | | | | | | | |
Shares authorized | | | | | Unlimited | | | | | | | | Unlimited | | | | | | | | Unlimited | | | | | | | | Unlimited | |
| | | | | | | | | | | | | | | | | | | | | | | | | | | | | | |
| | | | | | | | |
Par value | | | | | No par value | | | | | | | | No par value | | | | | | | | No par value | | | | | | | | No par value | |
| | | | | | | | | | | | | | | | | | | | | | | | | | | | | | |
| | | | | | | | |
Investor C | | | | | | | | | | | | | | | | | | | | | | | | | | | | | | |
| | | | | | | | |
Net assets | | | | $ | 2,248,707 | | | | | | | $ | 2,762,617 | | | | | | | $ | 2,697,907 | | | | | | | $ | 3,637,343 | |
| | | | | | | | | | | | | | | | | | | | | | | | | | | | | | |
| | | | | | | | |
Shares outstanding | | | | | 210,437 | | | | | | | | 195,054 | | | | | | | | 196,819 | | | | | | | | 230,171 | |
| | | | | | | | | | | | | | | | | | | | | | | | | | | | | | |
| | | | | | | | |
Net asset value | | | | $ | 10.69 | | | | | | | $ | 14.16 | | | | | | | $ | 13.71 | | | | | | | $ | 15.80 | |
| | | | | | | | | | | | | | | | | | | | | | | | | | | | | | |
| | | | | | | | |
Shares authorized | | | | | Unlimited | | | | | | | | Unlimited | | | | | | | | Unlimited | | | | | | | | Unlimited | |
| | | | | | | | | | | | | | | | | | | | | | | | | | | | | | |
| | | | | | | | |
Par value | | | | | No par value | | | | | | | | No par value | | | | | | | | No par value | | | | | | | | No par value | |
| | | | | | | | | | | | | | | | | | | | | | | | | | | | | | |
| | | | | | | | |
Class K | | | | | | | | | | | | | | | | | | | | | | | | | | | | | | |
| | | | | | | | |
Net assets | | | | $ | 78,916,083 | | | | | | | $ | 75,926,586 | | | | | | | $ | 100,749,500 | | | | | | | $ | 95,153,605 | |
| | | | | | | | | | | | | | | | | | | | | | | | | | | | | | |
| | | | | | | | |
Shares outstanding | | | | | 7,288,562 | | | | | | | | 5,323,961 | | | | | | | | 7,167,816 | | | | | | | | 5,808,668 | |
| | | | | | | | | | | | | | | | | | | | | | | | | | | | | | |
| | | | | | | | |
Net asset value | | | | $ | 10.83 | | | | | | | $ | 14.26 | | | | | | | $ | 14.06 | | | | | | | $ | 16.38 | |
| | | | | | | | | | | | | | | | | | | | | | | | | | | | | | |
| | | | | | | | |
Shares authorized | | | | | Unlimited | | | | | | | | Unlimited | | | | | | | | Unlimited | | | | | | | | Unlimited | |
| | | | | | | | | | | | | | | | | | | | | | | | | | | | | | |
| | | | | | | | |
Par value | | | | | No par value | | | | | | | | No par value | | | | | | | | No par value | | | | | | | | No par value | |
| | | | | | | | | | | | | | | | | | | | | | | | | | | | | | |
| | | | | | | | |
Class R | | | | | | | | | | | | | | | | | | | | | | | | | | | | | | |
| | | | | | | | |
Net assets | | | | $ | 6,183,493 | | | | | | | $ | 3,874,973 | | | | | | | $ | 5,389,409 | | | | | | | $ | 3,686,846 | |
| | | | | | | | | | | | | | | | | | | | | | | | | | | | | | |
| | | | | | | | |
Shares outstanding | | | | | 575,998 | | | | | | | | 271,951 | | | | | | | | 388,885 | | | | | | | | 230,051 | |
| | | | | | | | | | | | | | | | | | | | | | | | | | | | | | |
| | | | | | | | |
Net asset value | | | | $ | 10.74 | | | | | | | $ | 14.25 | | | | | | | $ | 13.86 | | | | | | | $ | 16.03 | |
| | | | | | | | | | | | | | | | | | | | | | | | | | | | | | |
| | | | | | | | |
Shares authorized | | | | | Unlimited | | | | | | | | Unlimited | | | | | | | | Unlimited | | | | | | | | Unlimited | |
| | | | | | | | | | | | | | | | | | | | | | | | | | | | | | |
| | | | | | | | |
Par value | | | | | No par value | | | | | | | | No par value | | | | | | | | No par value | | | | | | | | No par value | |
| | | | | | | | | | | | | | | | | | | | | | | | | | | | | | |
| | |
| 78 | | 2 0 2 1 BLACK ROCK ANNUAL REPORT TO SHAREHOLDERS |
Statements of Assets and Liabilities (continued)
December 31, 2021
| | | | | | | | | | | | | | | | | | | | | | | | | | | | | | |
| | | BlackRock LifePath® Dynamic 2040 Fund | | | BlackRock LifePath® Dynamic 2045 Fund | | | BlackRock LifePath® Dynamic 2050 Fund | | | BlackRock LifePath® Dynamic 2055 Fund | |
| |
| | | | | | | | |
ASSETS | | | | | | | | | | | | | | | | | | | | | | | | | | | | | | |
Investments, at value — affiliated(a)(b) | | | | $ | 301,991,208 | | | | | | | $ | 125,452,334 | | | | | | | $ | 170,390,778 | | | | | | | $ | 86,504,216 | |
Cash pledged for futures contracts | | | | | 1,857,000 | | | | | | | | 791,000 | | | | | | | | 651,000 | | | | | | | | 416,000 | |
Foreign currency, at value(c) | | | | | 764,533 | | | | | | | | 302,796 | | | | | | | | 233,343 | | | | | | | | 110,195 | |
Receivables: | | | | | | | | | | | | | | | | | | | | | | | | | | | | | | |
Investments sold | | | | | 973,875 | | | | | | | | — | | | | | | | | — | | | | | | | | — | |
Securities lending income — affiliated | | | | | 980 | | | | | | | | 983 | | | | | | | | 230 | | | | | | | | 602 | |
Capital shares sold | | | | | 960,763 | | | | | | | | 418,732 | | | | | | | | 563,256 | | | | | | | | 398,334 | |
Dividends — affiliated | | | | | 14,703 | | | | | | | | 6,494 | | | | | | | | 9,188 | | | | | | | | 4,537 | |
Variation margin on futures contracts | | | | | 22,543 | | | | | | | | 8,372 | | | | | | | | 4,469 | | | | | | | | — | |
Unrealized appreciation on forward foreign currency exchange contracts | | | | | 200,389 | | | | | | | | 80,890 | | | | | | | | 122,516 | | | | | | | | 58,068 | |
| | | | | | | | | | | | | | | | | | | | | | | | | | | | | | |
| | | | | | | | |
Total assets | | | | | 306,785,994 | | | | | | | | 127,061,601 | | | | | | | | 171,974,780 | | | | | | | | 87,491,952 | |
| | | | | | | | | | | | | | | | | | | | | | | | | | | | | | |
| | | | | | | | |
LIABILITIES | | | | | | | | | | | | | | | | | | | | | | | | | | | | | | |
Collateral on securities loaned | | | | | 2,809,807 | | | | | | | | 8,374,027 | | | | | | | | 321,539 | | | | | | | | 4,934,829 | |
Payables: | | | | | | | | | | | | | | | | | | | | | | | | | | | | | | |
Administration fees | | | | | 54,513 | | | | | | | | 8,311 | | | | | | | | 25,384 | | | | | | | | 5,534 | |
Capital gains distributions | | | | | 510,320 | | | | | | | | 166,878 | | | | | | | | 214,236 | | | | | | | | 110,768 | |
Capital shares redeemed | | | | | 1,721,927 | | | | | | | | 502,316 | | | | | | | | 597,077 | | | | | | | | 422,934 | |
Income dividend distributions | | | | | 307,726 | | | | | | | | 154,116 | | | | | | | | 175,335 | | | | | | | | 111,463 | |
Investment advisory fees | | | | | 18,247 | | | | | | | | 6,090 | | | | | | | | 11,958 | | | | | | | | 5,879 | |
Trustees’ and Officer’s fees | | | | | 3,519 | | | | | | | | 3,373 | | | | | | | | 3,412 | | | | | | | | 3,341 | |
Professional fees | | | | | 24,525 | | | | | | | | 23,419 | | | | | | | | 23,550 | | | | | | | | 23,372 | |
Service and distribution fees | | | | | 37,061 | | | | | | | | 7,089 | | | | | | | | 19,398 | | | | | | | | 5,739 | |
Variation margin on futures contracts | | | | | 104,785 | | | | | | | | 38,863 | | | | | | | | 24,696 | | | | | | | | 15,409 | |
Unrealized depreciation on forward foreign currency exchange contracts | | | | | 117,349 | | | | | | | | 45,356 | | | | | | | | 69,828 | | | | | | | | 31,155 | |
| | | | | | | | | | | | | | | | | | | | | | | | | | | | | | |
| | | | | | | | |
Total liabilities | | | | | 5,709,779 | | | | | | | | 9,329,838 | | | | | | | | 1,486,413 | | | | | | | | 5,670,423 | |
| | | | | | | | | | | | | | | | | | | | | | | | | | | | | | |
| | | | | | | | |
NET ASSETS | | | | $ | 301,076,215 | | | | | | | $ | 117,731,763 | | | | | | | $ | 170,488,367 | | | | | | | $ | 81,821,529 | |
| | | | | | | | | | | | | | | | | | | | | | | | | | | | | | |
| | | | | | | | |
NET ASSETS CONSIST OF | | | | | | | | | | | | | | | | | | | | | | | | | | | | | | |
Paid-in capital | | | | $ | 228,686,971 | | | | | | | $ | 100,511,056 | | | | | | | $ | 134,693,335 | | | | | | | $ | 70,034,393 | |
Accumulated earnings | | | | | 72,389,244 | | | | | | | | 17,220,707 | | | | | | | | 35,795,032 | | | | | | | | 11,787,136 | |
| | | | | | | | | | | | | | | | | | | | | | | | | | | | | | |
| | | | | | | | |
NET ASSETS | | | | $ | 301,076,215 | | | | | | | $ | 117,731,763 | | | | | | | $ | 170,488,367 | | | | | | | $ | 81,821,529 | |
| | | | | | | | | | | | | | | | | | | | | | | | | | | | | | |
| | | | | | | | |
(a) Investments, at cost — affiliated | | | | $ | 237,094,124 | | | | | | | $ | 108,340,097 | | | | | | | $ | 129,239,553 | | | | | | | $ | 75,000,668 | |
(b) Securities loaned, at value | | | | $ | 2,750,251 | | | | | | | $ | 8,190,367 | | | | | | | $ | 314,470 | | | | | | | $ | 4,825,269 | |
(c) Foreign currency, at cost | | | | $ | 770,566 | | | | | | | $ | 304,163 | | | | | | | $ | 235,513 | | | | | | | $ | 110,571 | |
Statements of Assets and Liabilities (continued)
December 31, 2021
| | | | | | | | | | | | | | | | | | | | | | | | | | | | | | |
| | | BlackRock LifePath® Dynamic 2040 Fund | | | BlackRock LifePath® Dynamic 2045 Fund | | | BlackRock LifePath® Dynamic 2050 Fund | | | BlackRock LifePath® Dynamic 2055 Fund | |
| |
| | | | | | | | |
NET ASSET VALUE | | | | | | | | | | | | | | | | | | | | | | | | | | | | | | |
| | | | | | | | |
| Institutional | | | | | | | | | | | | | | | | | | | | | | | |
| | | | | | | | |
Net assets | | | | $ | 54,508,720 | | | | | | | $ | 8,640,548 | | | | | | | $ | 21,290,046 | | | | | | | $ | 7,813,964 | |
| | | | | | | | | | | | | | | | | | | | | | | | | | | | | | |
| | | | | | | | |
Shares outstanding | | | | | 3,024,499 | | | | | | | | 485,118 | | | | | | | | 926,065 | | | | | | | | 413,460 | |
| | | | | | | | | | | | | | | | | | | | | | | | | | | | | | |
| | | | | | | | |
Net asset value | | | | $ | 18.02 | | | | | | | $ | 17.81 | | | | | | | $ | 22.99 | | | | | | | $ | 18.90 | |
| | | | | | | | | | | | | | | | | | | | | | | | | | | | | | |
| | | | | | | | |
Shares authorized | | | | | Unlimited | | | | | | | | Unlimited | | | | | | | | Unlimited | | | | | | | | Unlimited | |
| | | | | | | | | | | | | | | | | | | | | | | | | | | | | | |
| | | | | | | | |
Par value | | | | | No par value | | | | | | | | No par value | | | | | | | | No par value | | | | | | | | No par value | |
| | | | | | | | | | | | | | | | | | | | | | | | | | | | | | |
| | | | | | | | |
Investor A | | | | | | | | | | | | | | | | | | | | | | | | | | | | | | |
| | | | | | | | |
Net assets | | | | $ | 153,955,113 | | | | | | | $ | 21,856,216 | | | | | | | $ | 77,982,474 | | | | | | | $ | 17,422,434 | |
| | | | | | | | | | | | | | | | | | | | | | | | | | | | | | |
| | | | | | | | |
Shares outstanding | | | | | 9,833,685 | | | | | | | | 1,231,023 | | | | | | | | 3,410,095 | | | | | | | | 927,708 | |
| | | | | | | | | | | | | | | | | | | | | | | | | | | | | | |
| | | | | | | | |
Net asset value | | | | $ | 15.66 | | | | | | | $ | 17.75 | | | | | | | $ | 22.87 | | | | | | | $ | 18.78 | |
| | | | | | | | | | | | | | | | | | | | | | | | | | | | | | |
| | | | | | | | |
Shares authorized | | | | | Unlimited | | | | | | | | Unlimited | | | | | | | | Unlimited | | | | | | | | Unlimited | |
| | | | | | | | | | | | | | | | | | | | | | | | | | | | | | |
| | | | | | | | |
Par value | | | | | No par value | | | | | | | | No par value | | | | | | | | No par value | | | | | | | | No par value | |
| | | | | | | | | | | | | | | | | | | | | | | | | | | | | | |
| | | | | | | | |
Investor C | | | | | | | | | | | | | | | | | | | | | | | | | | | | | | |
| | | | | | | | |
Net assets | | | | $ | 2,486,095 | | | | | | | $ | 1,392,338 | | | | | | | $ | 2,001,957 | | | | | | | $ | 1,340,471 | |
| | | | | | | | | | | | | | | | | | | | | | | | | | | | | | |
| | | | | | | | |
Shares outstanding | | | | | 141,601 | | | | | | | | 79,913 | | | | | | | | 89,279 | | | | | | | | 72,763 | |
| | | | | | | | | | | | | | | | | | | | | | | | | | | | | | |
| | | | | | | | |
Net asset value | | | | $ | 17.56 | | | | | | | $ | 17.42 | | | | | | | $ | 22.42 | | | | | | | $ | 18.42 | |
| | | | | | | | | | | | | | | | | | | | | | | | | | | | | | |
| | | | | | | | |
Shares authorized | | | | | Unlimited | | | | | | | | Unlimited | | | | | | | | Unlimited | | | | | | | | Unlimited | |
| | | | | | | | | | | | | | | | | | | | | | | | | | | | | | |
| | | | | | | | |
Par value | | | | | No par value | | | | | | | | No par value | | | | | | | | No par value | | | | | | | | No par value | |
| | | | | | | | | | | | | | | | | | | | | | | | | | | | | | |
| | | | | | | | |
Class K | | | | | | | | | | | | | | | | | | | | | | | | | | | | | | |
| | | | | | | | |
Net assets | | | | $ | 85,149,726 | | | | | | | $ | 82,853,456 | | | | | | | $ | 66,064,850 | | | | | | | $ | 53,040,892 | |
| | | | | | | | | | | | | | | | | | | | | | | | | | | | | | |
| | | | | | | | |
Shares outstanding | | | | | 4,688,659 | | | | | | | | 4,589,419 | | | | | | | | 2,859,712 | | | | | | | | 2,760,609 | |
| | | | | | | | | | | | | | | | | | | | | | | | | | | | | | |
| | | | | | | | |
Net asset value | | | | $ | 18.16 | | | | | | | $ | 18.05 | | | | | | | $ | 23.10 | | | | | | | $ | 19.21 | |
| | | | | | | | | | | | | | | | | | | | | | | | | | | | | | |
| | | | | | | | |
Shares authorized | | | | | Unlimited | | | | | | | | Unlimited | | | | | | | | Unlimited | | | | | | | | Unlimited | |
| | | | | | | | | | | | | | | | | | | | | | | | | | | | | | |
| | | | | | | | |
Par value | | | | | No par value | | | | | | | | No par value | | | | | | | | No par value | | | | | | | | No par value | |
| | | | | | | | | | | | | | | | | | | | | | | | | | | | | | |
| | | | | | | | |
Class R | | | | | | | | | | | | | | | | | | | | | | | | | | | | | | |
| | | | | | | | |
Net assets | | | | $ | 4,976,561 | | | | | | | $ | 2,989,205 | | | | | | | $ | 3,149,040 | | | | | | | $ | 2,203,768 | |
| | | | | | | | | | | | | | | | | | | | | | | | | | | | | | |
| | | | | | | | |
Shares outstanding | | | | | 280,651 | | | | | | | | 169,041 | | | | | | | | 138,493 | | | | | | | | 117,708 | |
| | | | | | | | | | | | | | | | | | | | | | | | | | | | | | |
| | | | | | | | |
Net asset value | | | | $ | 17.73 | | | | | | | $ | 17.68 | | | | | | | $ | 22.74 | | | | | | | $ | 18.72 | |
| | | | | | | | | | | | | | | | | | | | | | | | | | | | | | |
| | | | | | | | |
Shares authorized | | | | | Unlimited | | | | | | | | Unlimited | | | | | | | | Unlimited | | | | | | | | Unlimited | |
| | | | | | | | | | | | | | | | | | | | | | | | | | | | | | |
| | | | | | | | |
Par value | | | | | No par value | | | | | | | | No par value | | | | | | | | No par value | | | | | | | | No par value | |
| | | | | | | | | | | | | | | | | | | | | | | | | | | | | | |
| | |
| 80 | | 2 0 2 1 BLACK ROCK ANNUAL REPORT TO SHAREHOLDERS |
Statements of Assets and Liabilities (continued)
December 31, 2021
| | | | | | | | | | | | |
| | | BlackRock LifePath® Dynamic
2060 Fund | | | BlackRock LifePath® Dynamic 2065 Fund | |
| |
| | | | |
ASSETS | | | | | | | | | | | | |
Investments, at value — affiliated(a)(b) | | | | $ | 20,386,408 | | | | | $ | 7,041,528 | |
Cash | | | | | — | | | | | | 780 | |
Cash pledged for futures contracts | | | | | 65,000 | | | | | | 26,000 | |
Foreign currency, at value(c) | | | | | 28,608 | | | | | | 10,239 | |
Receivables: | | | | | | | | | | | | |
| | | | |
Securities lending income — affiliated | | | | | 80 | | | | | | 29 | |
Capital shares sold | | | | | 120,592 | | | | | | 13,702 | |
Dividends — affiliated | | | | | 1,077 | | | | | | 362 | |
From the Administrator | | | | | 2,407 | | | | | | 2,956 | |
Variation margin on futures contracts | | | | | 206 | | | | | | — | |
Unrealized appreciation on forward foreign currency exchange contracts | | | | | 8,048 | | | | | | 2,319 | |
| | | | | | | | | | | | |
| | | | |
Total assets | | | | | 20,612,426 | | | | | | 7,097,915 | |
| | | | | | | | | | | | |
| | | | |
LIABILITIES | | | | | | | | | | | | |
Collateral on securities loaned | | | | | 30,204 | | | | | | 11,518 | |
Payables: | | | | | | | | | | | | |
Capital gains distributions | | | | | 103,566 | | | | | | 178,595 | |
Capital shares redeemed | | | | | 1,795 | | | | | | 8,254 | |
Income dividend distributions | | | | | 127,983 | | | | | | 273,241 | |
Investment advisory fees | | | | | 1,299 | | | | | | 431 | |
Trustees’ and Officer’s fees | | | | | 3,334 | | | | | | 3,331 | |
Professional fees | | | | | 23,442 | | | | | | 22,110 | |
Service and distribution fees | | | | | 599 | | | | | | 838 | |
Variation margin on futures contracts | | | | | 617 | | | | | | 464 | |
Unrealized depreciation on forward foreign currency exchange contracts | | | | | 7,815 | | | | | | 2,373 | |
| | | | | | | | | | | | |
| | | | |
Total liabilities | | | | | 300,654 | | | | | | 501,155 | |
| | | | | | | | | | | | |
| | | | |
NET ASSETS | | | | $ | 20,311,772 | | | | | $ | 6,596,760 | |
| | | | | | | | | | | | |
| | | | |
NET ASSETS CONSIST OF | | | | | | | | | | | | |
Paid-in capital | | | | $ | 17,615,896 | | | | | $ | 5,525,760 | |
Accumulated earnings | | | | | 2,695,876 | | | | | | 1,071,000 | |
| | | | | | | | | | | | |
| | | | |
NET ASSETS | | | | $ | 20,311,772 | | | | | $ | 6,596,760 | |
| | | | | | | | | | | | |
| | | | |
(a) Investments, at cost — affiliated | | | | $ | 17,795,551 | | | | | $ | 5,959,685 | |
(b) Securities loaned, at value | | | | $ | 29,552 | | | | | $ | 11,264 | |
(c) Foreign currency, at cost | | | | $ | 29,228 | | | | | $ | 10,265 | |
Statements of Assets and Liabilities (continued)
December 31, 2021
| | | | | | | | | | | | |
| | | BlackRock LifePath® Dynamic 2060 Fund | | | BlackRock LifePath® Dynamic 2065 Fund | |
| |
| | | | |
NET ASSET VALUE | | | | | | | | | | | | |
| | | | |
| Institutional | | | | | | | | | | |
Net assets | | | | $ | 1,314,221 | | | | | $ | 595,774 | |
| | | | | | | | | | | | |
| | | | |
Shares outstanding | | | | | 94,337 | | | | | | 47,023 | |
| | | | | | | | | | | | |
| | | | |
Net asset value | | | | $ | 13.93 | | | | | $ | 12.67 | |
| | | | | | | | | | | | |
| | | | |
Shares authorized | | | | | Unlimited | | | | | | Unlimited | |
| | | | | | | | | | | | |
| | | | |
Par value | | | | | No par value | | | | | | No par value | |
| | | | | | | | | | | | |
| | | | |
| Investor A | | | | | | | | | | |
Net assets | | | | $ | 1,054,187 | | | | | $ | 721,816 | |
| | | | | | | | | | | | |
| | | | |
Shares outstanding | | | | | 75,792 | | | | | | 57,015 | |
| | | | | | | | | | | | |
| | | | |
Net asset value | | | | $ | 13.91 | | | | | $ | 12.66 | |
| | | | | | | | | | | | |
| | | | |
Shares authorized | | | | | Unlimited | | | | | | Unlimited | |
| | | | | | | | | | | | |
| | | | |
Par value | | | | | No par value | | | | | | No par value | |
| | | | | | | | | | | | |
| | | | |
| Investor C | | | | | | | | | | |
Net assets | | | | $ | 96,262 | | | | | $ | 528,385 | |
| | | | | | | | | | | | |
| | | | |
Shares outstanding | | | | | 6,943 | | | | | | 41,819 | |
| | | | | | | | | | | | |
| | | | |
Net asset value | | | | $ | 13.86 | | | | | $ | 12.64 | |
| | | | | | | | | | | | |
| | | | |
Shares authorized | | | | | Unlimited | | | | | | Unlimited | |
| | | | | | | | | | | | |
| | | | |
Par value | | | | | No par value | | | | | | No par value | |
| | | | | | | | | | | | |
| | | | |
| Class K | | | | | | | | | | |
Net assets | | | | $ | 17,029,733 | | | | | $ | 4,241,592 | |
| | | | | | | | | | | | |
| | | | |
Shares outstanding | | | | | 1,220,998 | | | | | | 334,750 | |
| | | | | | | | | | | | |
| | | | |
Net asset value | | | | $ | 13.95 | | | | | $ | 12.67 | |
| | | | | | | | | | | | |
| | | | |
Shares authorized | | | | | Unlimited | | | | | | Unlimited | |
| | | | | | | | | | | | |
| | | | |
Par value | | | | | No par value | | | | | | No par value | |
| | | | | | | | | | | | |
| | | | |
| Class R | | | | | | | | | | |
Net assets | | | | $ | 817,369 | | | | | $ | 509,193 | |
| | | | | | | | | | | | |
| | | | |
Shares outstanding | | | | | 58,766 | | | | | | 40,238 | |
| | | | | | | | | | | | |
| | | | |
Net asset value | | | | $ | 13.91 | | | | | $ | 12.65 | |
| | | | | | | | | | | | |
| | | | |
Shares authorized | | | | | Unlimited | | | | | | Unlimited | |
| | | | | | | | | | | | |
| | | | |
Par value | | | | | No par value | | | | | | No par value | |
| | | | | | | | | | | | |
See notes to financial statements.
| | |
| 82 | | 2 0 2 1 BLACK ROCK ANNUAL REPORT TO SHAREHOLDERS |
Statements of Operations
Year Ended December 31, 2021
| | | | | | | | | | | | | | | | | | | | | | | | |
| | | BlackRock LifePath® Dynamic Retirement Fund | | | BlackRock LifePath® Dynamic 2025 Fund | | | BlackRock LifePath® Dynamic 2030 Fund | | | BlackRock LifePath® Dynamic 2035 Fund | |
| |
| | | | | | | | |
INVESTMENT INCOME | | | | | | | | | | | | | | | | | | | | | | | | |
Dividends — affiliated | | | | $ | 2,755,901 | | | | | $ | 951,918 | | | | | $ | 2,714,251 | | | | | $ | 998,380 | |
Securities lending income — affiliated — net | | | | | 39,218 | | | | | | 13,031 | | | | | | 30,334 | | | | | | 10,656 | |
Net investment income allocated from the applicable affiliated Underlying Master Portfolio | | | | | | | | | | | | | | | | | | | | | | | | |
Dividends — affiliated | | | | | 1,341,064 | | | | | | 621,455 | | | | | | 2,373,468 | | | | | | 1,070,863 | |
Interest — affiliated | | | | | 1,912,381 | | | | | | 510,580 | | | | | | 993,256 | | | | | | 195,605 | |
Expenses | | | | | (604,322 | ) | | | | | (241,602 | ) | | | | | (846,232 | ) | | | | | (355,926 | ) |
Fees waived | | | | | 265,461 | | | | | | 111,892 | | | | | | 408,467 | | | | | | 177,343 | |
| | | | | | | | | | | | | | | | | | | | | | | | |
| | | | | | | | |
Total investment income | | | | | 5,709,703 | | | | | | 1,967,274 | | | | | | 5,673,544 | | | | | | 2,096,921 | |
| | | | | | | | | | | | | | | | | | | | | | | | |
| | | | | | | | |
EXPENSES | | | | | | | | | | | | | | | | | | | | | | | | |
Investment advisory | | | | | 1,115,701 | | | | | | 400,187 | | | | | | 1,192,436 | | | | | | 460,723 | |
Administration — class specific | | | | | 755,886 | | | | | | 161,728 | | | | | | 787,674 | | | | | | 180,430 | |
Service and distribution — class specific | | | | | 495,034 | | | | | | 106,519 | | | | | | 508,740 | | | | | | 117,779 | |
Professional | | | | | 18,615 | | | | | | 32,805 | | | | | | 33,101 | | | | | | 32,875 | |
Trustees and Officer | | | | | 8,277 | | | | | | 7,952 | | | | | | 8,380 | | | | | | 7,983 | |
Miscellaneous | | | | | 2,132 | | | | | | 396 | | | | | | 2,507 | | | | | | 396 | |
| | | | | | | | | | | | | | | | | | | | | | | | |
Total expenses | | | | | 2,395,645 | | | | | | 709,587 | | | | | | 2,532,838 | | | | | | 800,186 | |
Less: | | | | | | | | | | | | | | | | | | | | | | | | |
Fees waived and/or reimbursed by the Administrator/Manager | | | | | (685,716 | ) | | | | | (295,948 | ) | | | | | (882,622 | ) | | | | | (387,834 | ) |
| | | | | | | | | | | | | | | | | | | | | | | | |
| | | | | | | | |
Total expenses after fees waived and/or reimbursed | | | | | 1,709,929 | | | | | | 413,639 | | | | | | 1,650,216 | | | | | | 412,352 | |
| | | | | | | | | | | | | | | | | | | | | | | | |
| | | | | | | | |
Net investment income | | | | | 3,999,774 | | | | | | 1,553,635 | | | | | | 4,023,328 | | | | | | 1,684,569 | |
| | | | | | | | | | | | | | | | | | | | | | | | |
| | | | | | | | |
REALIZED AND UNREALIZED GAIN (LOSS) | | | | | | | | | | | | | | | | | | | | | | | | |
Net realized gain (loss) from: | | | | | | | | | | | | | | | | | | | | | | | | |
Investments — unaffiliated | | | | | 1,046 | | | | | | (557 | ) | | | | | (5,054 | ) | | | | | (512 | ) |
Investments — affiliated | | | | | 745,846 | | | | | | (25,326 | ) | | | | | 243,809 | | | | | | (6,823 | ) |
Capital gain distributions from underlying funds — affiliated | | | | | 11,120 | | | | | | 4,235 | | | | | | 15,725 | | | | | | 7,863 | |
Forward foreign currency exchange contracts | | | | | (767,732 | ) | | | | | (292,271 | ) | | | | | (752,714 | ) | | | | | (333,906 | ) |
Foreign currency transactions | | | | | 76,869 | | | | | | 24,034 | | | | | | 55,994 | | | | | | 24,087 | |
Futures contracts | | | | | 3,305,135 | | | | | | 963,923 | | | | | | 3,181,129 | | | | | | 1,453,450 | |
Net realized gain (loss) from investments, futures contracts, forward foreign currency exchange contracts and foreign currency transactions allocated from the applicable affiliated Underlying | | | | | | | | | | | | | | | | | | | | | | | | |
Master Portfolio | | | | | 25,330,737 | | | | | | 8,733,276 | | | | | | 37,056,416 | | | | | | 13,419,029 | |
| | | | | | | | | | | | | | | | | | | | | | | | |
| | | | | | | | |
| | | | | 28,703,021 | | | | | | 9,407,314 | | | | | | 39,795,305 | | | | | | 14,563,188 | |
| | | | | | | | | | | | | | | | | | | | | | | | |
Net change in unrealized appreciation (depreciation) on: | | | | | | | | | | | | | | | | | | | | | | | | |
Investments — affiliated | | | | | (966,296 | ) | | | | | 97,450 | | | | | | 771,917 | | | | | | 439,554 | |
Forward foreign currency exchange contracts | | | | | (138,959 | ) | | | | | (27,801 | ) | | | | | (177,708 | ) | | | | | (51,733 | ) |
Foreign currency translations | | | | | (111,545 | ) | | | | | (39,688 | ) | | | | | (89,042 | ) | | | | | (42,155 | ) |
Futures contracts | | | | | (175,136 | ) | | | | | 967 | | | | | | (29,234 | ) | | | | | 48,906 | |
Net change in unrealized appreciation (depreciation) from investments, futures contracts, forward foreign currency exchange contracts and foreign currency translations allocated from the applicable affiliated Underlying Master Portfolio | | | | | (10,352,721 | ) | | | | | (1,434,775 | ) | | | | | (7,908,026 | ) | | | | | (141,618 | ) |
| | | | | | | | | | | | | | | | | | | | | | | | |
| | | | | | | | |
| | | | | (11,744,657 | ) | | | | | (1,403,847 | ) | | | | | (7,432,093 | ) | | | | | 252,954 | |
| | | | | | | | | | | | | | | | | | | | | | | | |
| | | | | | | | |
Net realized and unrealized gain | | | | | 16,958,364 | | | | | | 8,003,467 | | | | | | 32,363,212 | | | | | | 14,816,142 | |
| | | | | | | | | | | | | | | | | | | | | | | | |
| | | | | | | | |
NET INCREASE IN NET ASSETS RESULTING FROM OPERATIONS | | | | $ | 20,958,138 | | | | | $ | 9,557,102 | | | | | $ | 36,386,540 | | | | | $ | 16,500,711 | |
| | | | | | | | | | | | | | | | | | | | | | | | |
See notes to financial statements.
Statements of Operations (continued)
Year Ended December 31, 2021
| | | | | | | | | | | | | | | | | | | | | | | | |
| | | BlackRock LifePath® Dynamic 2040 Fund | | | BlackRock LifePath® Dynamic 2045 Fund | | | BlackRock LifePath® Dynamic 2050 Fund | | | BlackRock LifePath® Dynamic 2055 Fund | |
| |
| | | | | | | | |
INVESTMENT INCOME | | | | | | | | | | | | | | | | | | | | | | | | |
Dividends — affiliated | | | | $ | 2,071,247 | | | | | $ | 682,553 | | | | | $ | 943,356 | | | | | $ | 412,753 | |
Securities lending income — affiliated — net | | | | | 15,117 | | | | | | 5,785 | | | | | | 4,800 | | | | | | 2,507 | |
Net investment income allocated from the applicable affiliated Underlying Master Portfolio | | | | | | | | | | | | | | | | | | | | | | | | |
Dividends — affiliated | | | | | 2,799,637 | | | | | | 1,078,442 | | | | | | 1,692,673 | | | | | | 744,783 | |
Interest — affiliated | | | | | 83,223 | | | | | | (70,886 | ) | | | | | (171,936 | ) | | | | | (79,755 | ) |
Expenses | | | | | (896,197 | ) | | | | | (333,668 | ) | | | | | (520,066 | ) | | | | | (227,348 | ) |
Fees waived | | | | | 454,586 | | | | | | 172,300 | | | | | | 269,856 | | | | | | 118,309 | |
| | | | | | | | | | | | | | | | | | | | | | | | |
| | | | | | | | |
Total investment income | | | | | 4,527,613 | | | | | | 1,534,526 | | | | | | 2,218,683 | | | | | | 971,249 | |
| | | | | | | | | | | | | | | | | | | | | | | | |
| | | | | | | | |
EXPENSES | | | | | | | | | | | | | | | | | | | | | | | | |
Investment advisory | | | | | 1,042,250 | | | | | | 369,914 | | | | | | 543,457 | | | | | | 243,443 | |
Administration — class specific | | | | | 706,560 | | | | | | 132,761 | | | | | | 334,872 | | | | | | 100,224 | |
Service and distribution — class specific | | | | | 440,131 | | | | | | 76,345 | | | | | | 224,691 | | | | | | 61,470 | |
Professional | | | | | 32,953 | | | | | | 32,890 | | | | | | 32,760 | | | | | | 32,929 | |
Trustees and Officer | | | | | 8,301 | | | | | | 7,940 | | | | | | 8,014 | | | | | | 7,847 | |
Miscellaneous | | | | | 2,508 | | | | | | 170 | | | | | | 396 | | | | | | 170 | |
| | | | | | | | | | | | | | | | | | | | | | | | |
Total expenses | | | | | 2,232,703 | | | | | | 620,020 | | | | | | 1,144,190 | | | | | | 446,083 | |
Less: | | | | | | | | | | | | | | | | | | | | | | | | |
Fees waived and/or reimbursed by the Administrator/Manager | | | | | (882,395 | ) | | | | | (350,272 | ) | | | | | (464,795 | ) | | | | | (229,285 | ) |
| | | | | | | | | | | | | | | | | | | | | | | | |
| | | | | | | | |
Total expenses after fees waived and/or reimbursed | | | | | 1,350,308 | | | | | | 269,748 | | | | | | 679,395 | | | | | | 216,798 | |
| | | | | | | | | | | | | | | | | | | | | | | | |
| | | | | | | | |
Net investment income | | | | | 3,177,305 | | | | | | 1,264,778 | | | | | | 1,539,288 | | | | | | 754,451 | |
| | | | | | | | | | | | | | | | | | | | | | | | |
| | | | | | | | |
REALIZED AND UNREALIZED GAIN (LOSS) | | | | | | | | | | | | | | | | | | | | | | | | |
Net realized gain (loss) from: | | | | | | | | | | | | | | | | | | | | | | | | |
Investments — unaffiliated | | | | | (4,057 | ) | | | | | (324 | ) | | | | | (946 | ) | | | | | (109 | ) |
Investments — affiliated | | | | | (20,597 | ) | | | | | 8,469 | | | | | | (36,068 | ) | | | | | (2,516 | ) |
Capital gain distributions from underlying funds — affiliated | | | | | 19,976 | | | | | | 8,437 | | | | | | 13,004 | | | | | | 6,121 | |
Forward foreign currency exchange contracts | | | | | (684,040 | ) | | | | | (294,424 | ) | | | | | (412,724 | ) | | | | | (202,635 | ) |
Foreign currency transactions | | | | | 47,359 | | | | | | 7,221 | | | | | | 27,054 | | | | | | 13,353 | |
Futures contracts | | | | | 3,993,042 | | | | | | 1,406,441 | | | | | | 1,346,460 | | | | | | 841,862 | |
Net realized gain (loss) from investments, futures contracts, forward foreign currency exchange contracts and foreign currency transactions allocated from the applicable affiliated Underlying | | | | | | | | | | | | | | | | | | | | | | | | |
Master Portfolio | | | | | 41,804,084 | | | | | | 12,315,034 | | | | | | 21,897,007 | | | | | | 8,223,201 | |
| | | | | | | | | | | | | | | | | | | | | | | | |
| | | | | | | | |
| | | | | 45,155,767 | | | | | | 13,450,854 | | | | | | 22,833,787 | | | | | | 8,879,277 | |
| | | | | | | | | | | | | | | | | | | | | | | | |
Net change in unrealized appreciation (depreciation) on: | | | | | | | | | | | | | | | | | | | | | | | | |
Investments — affiliated | | | | | 1,834,836 | | | | | | 499,306 | | | | | | 894,669 | | | | | | 273,457 | |
Forward foreign currency exchange contracts | | | | | (135,181 | ) | | | | | (32,923 | ) | | | | | (47,668 | ) | | | | | (10,725 | ) |
Foreign currency translations | | | | | (54,851 | ) | | | | | (16,285 | ) | | | | | (31,960 | ) | | | | | (19,266 | ) |
Futures contracts | | | | | 99,020 | | | | | | 91,867 | | | | | | 124,433 | | | | | | 100,257 | |
Net change in unrealized appreciation (depreciation) from investments, futures contracts, forward foreign currency exchange contracts and foreign currency translations allocated from the applicable affiliated Underlying Master Portfolio | | | | | (6,100,689 | ) | | | | | 1,324,359 | | | | | | (249,187 | ) | | | | | 1,218,216 | |
| | | | | | | | | | | | | | | | | | | | | | | | |
| | | | | | | | |
| | | | | (4,356,865 | ) | | | | | 1,866,324 | | | | | | 690,287 | | | | | | 1,561,939 | |
| | | | | | | | | | | | | | | | | | | | | | | | |
| | | | | | | | |
Net realized and unrealized gain | | | | | 40,798,902 | | | | | | 15,317,178 | | | | | | 23,524,074 | | | | | | 10,441,216 | |
| | | | | | | | | | | | | | | | | | | | | | | | |
| | | | | | | | |
NET INCREASE IN NET ASSETS RESULTING FROM OPERATIONS | | | | $ | 43,976,207 | | | | | $ | 16,581,956 | | | | | $ | 25,063,362 | | | | | $ | 11,195,667 | |
| | | | | | | | | | | | | | | | | | | | | | | | |
See notes to financial statements.
| | |
| 84 | | 2 0 2 1 BLACK ROCK ANNUAL REPORT TO SHAREHOLDERS |
Statements of Operations (continued)
Year Ended December 31, 2021
| | | | | | | | | | | | |
| | | BlackRock LifePath® Dynamic 2060 Fund | | | BlackRock LifePath® Dynamic 2065 Fund | |
| |
| | | | |
INVESTMENT INCOME | | | | | | | | | | | | |
Dividends — affiliated | | | | $ | 112,244 | | | | | $ | 39,989 | |
Securities lending income — affiliated — net | | | | | 1,674 | | | | | | 460 | |
Net investment income allocated from the applicable affiliated Underlying Master Portfolio | | | | | | | | | | | | |
Dividends — affiliated | | | | | 163,422 | | | | | | 63,777 | |
Interest — affiliated | | | | | (18,492 | ) | | | | | (6,740 | ) |
Expenses | | | | | (49,585 | ) | | | | | (19,438 | ) |
Fees waived | | | | | 26,063 | | | | | | 10,104 | |
| | | | | | | | | | | | |
| | | | |
Total investment income | | | | | 235,326 | | | | | | 88,152 | |
| | | | | | | | | | | | |
| | | | |
EXPENSES | | | | | | | | | | | | |
Investment advisory | | | | | 56,345 | | | | | | 21,061 | |
Professional | | | | | 33,028 | | | | | | 31,668 | |
Administration — class specific | | | | | 15,158 | | | | | | 8,395 | |
Trustees and Officer | | | | | 7,756 | | | | | | 7,724 | |
Service and distribution — class specific | | | | | 5,634 | | | | | | 9,514 | |
Miscellaneous | | | | | 57 | | | | | | 396 | |
| | | | | | | | | | | | |
Total expenses | | | | | 117,978 | | | | | | 78,758 | |
Less: | | | | | | | | | | | | |
Fees waived and/or reimbursed by the Administrator/Manager | | | | | (85,780 | ) | | | | | (56,576 | ) |
| | | | | | | | | | | | |
| | | | |
Total expenses after fees waived and/or reimbursed | | | | | 32,198 | | | | | | 22,182 | |
| | | | | | | | | | | | |
| | | | |
Net investment income | | | | | 203,128 | | | | | | 65,970 | |
| | | | | | | | | | | | |
| | | | |
REALIZED AND UNREALIZED GAIN (LOSS) | | | | | | | | | | | | |
Net realized gain (loss) from: | | | | | | | | | | | | |
Investments — unaffiliated | | | | | 2 | | | | | | — | |
Investments — affiliated | | | | | 8,546 | | | | | | 19,293 | |
Capital gain distributions from underlying funds — affiliated | | | | | 1,569 | | | | | | 531 | |
Forward foreign currency exchange contracts | | | | | (38,093 | ) | | | | | (12,023 | ) |
Foreign currency transactions | | | | | (341 | ) | | | | | (440 | ) |
Futures contracts | | | | | 133,953 | | | | | | 50,315 | |
Net realized gain (loss) from investments, futures contracts, forward foreign currency exchange contracts and foreign currency transactions allocated from the applicable affiliated Underlying Master Portfolio | | | | | 1,662,846 | | | | | | 783,479 | |
| | | | | | | | | | | | |
| | | | |
| | | | | 1,768,482 | | | | | | 841,155 | |
| | | | | | | | | | | | |
Net change in unrealized appreciation (depreciation) on: | | | | | | | | | | | | |
Investments — affiliated | | | | | 97,343 | | | | | | 40,975 | |
Forward foreign currency exchange contracts | | | | | (5,916 | ) | | | | | (3,084 | ) |
Foreign currency translations | | | | | (1,057 | ) | | | | | (26 | ) |
Futures contracts | | | | | 7,394 | | | | | | 3,967 | |
Net change in unrealized appreciation (depreciation) from investments, futures contracts, forward foreign currency exchange contracts and foreign currency translations allocated from the applicable affiliated Underlying Master Portfolio | | | | | 424,139 | | | | | | 22,035 | |
| | | | | | | | | | | | |
| | | | |
| | | | | 521,903 | | | | | | 63,867 | |
| | | | | | | | | | | | |
| | | | |
Net realized and unrealized gain | | | | | 2,290,385 | | | | | | 905,022 | |
| | | | | | | | | | | | |
| | | | |
NET INCREASE IN NET ASSETS RESULTING FROM OPERATIONS | | | | $ | 2,493,513 | | | | | $ | 970,992 | |
| | | | | | | | | | | | |
See notes to financial statements.
Statements of Changes in Net Assets
| | | | | | | | | | | | | | | | |
| | | BlackRock LifePath® Dynamic Retirement Fund | | | BlackRock LifePath® Dynamic 2025 Fund | |
| | | | | | | | |
| | |
| | | Year Ended December 31, | | | Year Ended December 31, | |
| | | | | | | | |
| | | | |
| | | 2021 | | | 2020 | | | 2021 | | | 2020 | |
| |
| | | | |
INCREASE (DECREASE) IN NET ASSETS | | | | | | | | | | | | | | | | |
| | | | |
OPERATIONS | | | | | | | | | | | | | | | | |
Net investment income | | $ | 3,999,774 | | | $ | 5,483,556 | | | $ | 1,553,635 | | | $ | 1,427,984 | |
Net realized gain | | | 28,703,021 | | | | 96,303,063 | | | | 9,407,314 | | | | 1,566,956 | |
Net change in unrealized appreciation (depreciation) | | | (11,744,657 | ) | | | (63,113,376 | ) | | | (1,403,847 | ) | | | 7,965,256 | |
| | | | | | | | | | | | | | | | |
| | | | |
Net increase in net assets resulting from operations | | | 20,958,138 | | | | 38,673,243 | | | | 9,557,102 | | | | 10,960,196 | |
| | | | | | | | | | | | | | | | |
| | | | |
DISTRIBUTIONS TO SHAREHOLDERS(a) | | | | | | | | | | | | | | | | |
Institutional | | | (6,734,988 | ) | | | (3,645,572 | ) | | | (1,217,834 | ) | | | (288,931 | ) |
Investor A | | | (26,074,393 | ) | | | (13,755,754 | ) | | | (2,387,906 | ) | | | (561,895 | ) |
Investor C | | | (281,301 | ) | | | (129,725 | ) | | | (259,045 | ) | | | (49,190 | ) |
Class K | | | (10,784,844 | ) | | | (5,203,342 | ) | | | (7,903,323 | ) | | | (1,627,680 | ) |
Class R | | | (813,866 | ) | | | (363,397 | ) | | | (390,478 | ) | | | (84,357 | ) |
| | | | | | | | | | | | | | | | |
| | | | |
Decrease in net assets resulting from distributions to shareholders | | | (44,689,392 | ) | | | (23,097,790 | ) | | | (12,158,586 | ) | | | (2,612,053 | ) |
| | | | | | | | | | | | | | | | |
| | | | |
CAPITAL SHARE TRANSACTIONS | | | | | | | | | | | | | | | | |
Net increase (decrease) in net assets derived from capital share transactions | | | (8,118,381 | ) | | | (90,010,559 | ) | | | 19,720,651 | | | | 23,627,611 | |
| | | | | | | | | | | | | | | | |
| | | | |
NET ASSETS | | | | | | | | | | | | | | | | |
Total increase (decrease) in net assets | | | (31,849,635 | ) | | | (74,435,106 | ) | | | 17,119,167 | | | | 31,975,754 | |
Beginning of year | | | 333,621,146 | | | | 408,056,252 | | | | 101,104,401 | | | | 69,128,647 | |
| | | | | | | | | | | | | | | | |
| | | | |
End of year | | $ | 301,771,511 | | | $ | 333,621,146 | | | $ | 118,223,568 | | | $ | 101,104,401 | |
| | | | | | | | | | | | | | | | |
| (a) | Distributions for annual periods determined in accordance with U.S. federal income tax regulations. |
See notes to financial statements.
| | |
| 86 | | 2 0 2 1 BLACK ROCK ANNUAL REPORT TO SHAREHOLDERS |
Statements of Changes in Net Assets (continued)
| | | | | | | | | | | | | | | | |
| | | BlackRock LifePath® Dynamic 2030 Fund | | | BlackRock LifePath® Dynamic 2035 Fund | |
| | | | | | | | |
| | |
| | | Year Ended December 31, | | | Year Ended December 31, | |
| | | | | | | | |
| | | | |
| | | 2021 | | | 2020 | | | 2021 | | | 2020 | |
| |
| | | | |
INCREASE (DECREASE) IN NET ASSETS | | | | | | | | | | | | | | | | |
| | | | |
OPERATIONS | | | | | | | | | | | | | | | | |
Net investment income | | $ | 4,023,328 | | | $ | 4,473,842 | | | $ | 1,684,569 | | | $ | 1,331,519 | |
Net realized gain (loss) | | | 39,795,305 | | | | 39,956,119 | | | | 14,563,188 | | | | (150,329 | ) |
Net change in unrealized appreciation (depreciation) | | | (7,432,093 | ) | | | (8,745,795 | ) | | | 252,954 | | | | 11,917,188 | |
| | | | | | | | | | | | | | | | |
| | | | |
Net increase in net assets resulting from operations | | | 36,386,540 | | | | 35,684,166 | | | | 16,500,711 | | | | 13,098,378 | |
| | | | | | | | | | | | | | | | |
| | | | |
DISTRIBUTIONS TO SHAREHOLDERS(a) | | | | | | | | | | | | | | | | |
Institutional | | | (8,379,543 | ) | | | (2,302,385 | ) | | | (1,438,930 | ) | | | (231,317 | ) |
Investor A | | | (27,647,575 | ) | | | (7,330,812 | ) | | | (2,965,279 | ) | | | (560,680 | ) |
Investor C | | | (391,404 | ) | | | (102,579 | ) | | | (380,761 | ) | | | (42,592 | ) |
Class K | | | (15,168,553 | ) | | | (3,401,010 | ) | | | (10,464,211 | ) | | | (1,333,582 | ) |
Class R | | | (792,846 | ) | | | (146,307 | ) | | | (385,910 | ) | | | (55,615 | ) |
| | | | | | | | | | | | | | | | |
| | | | |
Decrease in net assets resulting from distributions to shareholders | | | (52,379,921 | ) | | | (13,283,093 | ) | | | (15,635,091 | ) | | | (2,223,786 | ) |
| | | | | | | | | | | | | | | | |
| | | | |
CAPITAL SHARE TRANSACTIONS | | | | | | | | | | | | | | | | |
Net increase (decrease) in net assets derived from capital share transactions | | | 25,459,944 | | | | (45,318,665 | ) | | | 27,236,204 | | | | 33,609,858 | |
| | | | | | | | | | | | | | | | |
| | | | |
NET ASSETS | | | | | | | | | | | | | | | | |
Total increase (decrease) in net assets | | | 9,466,563 | | | | (22,917,592 | ) | | | 28,101,824 | | | | 44,484,450 | |
Beginning of year | | | 327,272,637 | | | | 350,190,229 | | | | 113,577,476 | | | | 69,093,026 | |
| | | | | | | | | | | | | | | | |
| | | | |
End of year | | $ | 336,739,200 | | | $ | 327,272,637 | | | $ | 141,679,300 | | | $ | 113,577,476 | |
| | | | | | | | | | | | | | | | |
| (a) | Distributions for annual periods determined in accordance with U.S. federal income tax regulations. |
See notes to financial statements.
Statements of Changes in Net Assets (continued)
| | | | | | | | | | | | | | | | |
| | | BlackRock LifePath® Dynamic 2040 Fund | | | BlackRock LifePath® Dynamic 2045 Fund | |
| | | | | | | | |
| | |
| | | Year Ended December 31, | | | Year Ended December 31, | |
| | | | | | | | |
| | | | |
| | | 2021 | | | 2020 | | | 2021 | | | 2020 | |
| |
| | | | |
INCREASE (DECREASE) IN NET ASSETS | | | | | | | | | | | | | | | | |
| | | | |
OPERATIONS | | | | | | | | | | | | | | | | |
Net investment income | | $ | 3,177,305 | | | $ | 3,498,032 | | | $ | 1,264,778 | | | $ | 930,119 | |
Net realized gain (loss) | | | 45,155,767 | | | | 58,636,042 | | | | 13,450,854 | | | | (1,121,358 | ) |
Net change in unrealized appreciation (depreciation) | | | (4,356,865 | ) | | | (29,434,701 | ) | | | 1,866,324 | | | | 10,185,490 | |
| | | | | | | | | | | | | | | | |
| | | | |
Net increase in net assets resulting from operations | | | 43,976,207 | | | | 32,699,373 | | | | 16,581,956 | | | | 9,994,251 | |
| | | | | | | | | | | | | | | | |
| | | | |
DISTRIBUTIONS TO SHAREHOLDERS(a) | | | | | | | | | | | | | | | | |
Institutional | | | (9,839,631 | ) | | | (2,555,740 | ) | | | (980,686 | ) | | | (153,135 | ) |
Investor A | | | (30,980,877 | ) | | | (7,421,538 | ) | | | (2,459,605 | ) | | | (364,948 | ) |
Investor C | | | (430,701 | ) | | | (90,499 | ) | | | (150,555 | ) | | | (19,283 | ) |
Class K | | | (14,800,890 | ) | | | (2,907,766 | ) | | | (9,293,659 | ) | | | (1,048,480 | ) |
Class R | | | (860,820 | ) | | | (148,197 | ) | | | (330,305 | ) | | | (55,707 | ) |
| | | | | | | | | | | | | | | | |
| | | | |
Decrease in net assets resulting from distributions to shareholders | | | (56,912,919 | ) | | | (13,123,740 | ) | | | (13,214,810 | ) | | | (1,641,553 | ) |
| | | | | | | | | | | | | | | | |
| | | | |
CAPITAL SHARE TRANSACTIONS | | | | | | | | | | | | | | | | |
Net increase (decrease) in net assets derived from capital share transactions | | | 33,393,775 | | | | (27,835,429 | ) | | | 28,612,165 | | | | 27,160,195 | |
| | | | | | | | | | | | | | | | |
| | | | |
NET ASSETS | | | | | | | | | | | | | | | | |
Total increase (decrease) in net assets | | | 20,457,063 | | | | (8,259,796 | ) | | | 31,979,311 | | | | 35,512,893 | |
Beginning of year | | | 280,619,152 | | | | 288,878,948 | | | | 85,752,452 | | | | 50,239,559 | |
| | | | | | | | | | | | | | | | |
| | | | |
End of year | | $ | 301,076,215 | | | $ | 280,619,152 | | | $ | 117,731,763 | | | $ | 85,752,452 | |
| | | | | | | | | | | | | | | | |
| (a) | Distributions for annual periods determined in accordance with U.S. federal income tax regulations. |
See notes to financial statements.
| | |
| 88 | | 2 0 2 1 BLACK ROCK ANNUAL REPORT TO SHAREHOLDERS |
Statements of Changes in Net Assets (continued)
| | | | | | | | | | | | | | | | |
| | | BlackRock LifePath® Dynamic 2050 Fund | | | BlackRock LifePath® Dynamic 2055 Fund | |
| | | | | | | | |
| | |
| | | Year Ended December 31, | | | Year Ended December 31, | |
| | | | | | | | |
| | | | |
| | | 2021 | | | 2020 | | | 2021 | | | 2020 | |
| |
| | | | |
INCREASE (DECREASE) IN NET ASSETS | | | | | | | | | | | | | | | | |
| | | | |
OPERATIONS | | | | | | | | | | | | | | | | |
Net investment income | | $ | 1,539,288 | | | $ | 1,302,358 | | | $ | 754,451 | | | $ | 495,957 | |
Net realized gain (loss) | | | 22,833,787 | | | | 2,076,909 | | | | 8,879,277 | | | | (363,900 | ) |
Net change in unrealized appreciation (depreciation) | | | 690,287 | | | | 13,777,507 | | | | 1,561,939 | | | | 7,220,009 | |
| | | | | | | | | | | | | | | | |
| | | | |
Net increase in net assets resulting from operations | | | 25,063,362 | | | | 17,156,774 | | | | 11,195,667 | | | | 7,352,066 | |
| | | | | | | | | | | | | | | | |
| | | | |
DISTRIBUTIONS TO SHAREHOLDERS(a) | | | | | | | | | | | | | | | | |
Institutional | | | (3,203,659 | ) | | | (389,427 | ) | | | (867,256 | ) | | | (107,752 | ) |
Investor A | | | (11,591,100 | ) | | | (1,645,183 | ) | | | (1,941,240 | ) | | | (269,078 | ) |
Investor C | | | (286,706 | ) | | | (24,477 | ) | | | (141,992 | ) | | | (14,761 | ) |
Class K | | | (9,511,477 | ) | | | (898,405 | ) | | | (5,712,311 | ) | | | (459,897 | ) |
Class R | | | (466,707 | ) | | | (54,817 | ) | | | (234,446 | ) | | | (28,273 | ) |
| | | | | | | | | | | | | | | | |
| | | | |
Decrease in net assets resulting from distributions to shareholders | | | (25,059,649 | ) | | | (3,012,309 | ) | | | (8,897,245 | ) | | | (879,761 | ) |
| | | | | | | | | | | | | | | | |
| | | | |
CAPITAL SHARE TRANSACTIONS | | | | | | | | | | | | | | | | |
Net increase in net assets derived from capital share transactions | | | 37,963,599 | | | | 4,804,994 | | | | 24,778,285 | | | | 20,922,860 | |
| | | | | | | | | | | | | | | | |
| | | | |
NET ASSETS | | | | | | | | | | | | | | | | |
Total increase in net assets | | | 37,967,312 | | | | 18,949,459 | | | | 27,076,707 | | | | 27,395,165 | |
Beginning of year | | | 132,521,055 | | | | 113,571,596 | | | | 54,744,822 | | | | 27,349,657 | |
| | | | | | | | | | | | | | | | |
| | | | |
End of year | | $ | 170,488,367 | | | $ | 132,521,055 | | | $ | 81,821,529 | | | $ | 54,744,822 | |
| | | | | | | | | | | | | | | | |
| (a) | Distributions for annual periods determined in accordance with U.S. federal income tax regulations. |
See notes to financial statements.
Statements of Changes in Net Assets (continued)
| | | | | | | | | | | | | | | | |
| | | BlackRock LifePath® Dynamic 2060 Fund | | | BlackRock LifePath® Dynamic 2065 Fund | |
| | | | | | | | |
| | |
| | | Year Ended December 31, | | | Year Ended December 31, | |
| | | | | | | | |
| | | | |
| | | 2021 | | | 2020 | | | 2021 | | | 2020 | |
| |
|
INCREASE (DECREASE) IN NET ASSETS | |
| | | | |
OPERATIONS | | | | | | | | | | | | | | | | |
Net investment income | | $ | 203,128 | | | $ | 112,805 | | | $ | 65,970 | | | $ | 53,936 | |
Net realized gain (loss) | | | 1,768,482 | | | | (150,112 | ) | | | 841,155 | | | | (288,925 | ) |
Net change in unrealized appreciation (depreciation) | | | 521,903 | | | | 1,689,179 | | | | 63,867 | | | | 832,389 | |
| | | | | | | | | | | | | | | | |
| | | | |
Net increase in net assets resulting from operations | | | 2,493,513 | | | | 1,651,872 | | | | 970,992 | | | | 597,400 | |
| | | | | | | | | | | | | | | | |
| | | | |
DISTRIBUTIONS TO SHAREHOLDERS(a) | | | | | | | | | | | | | | | | |
Institutional | | | (109,730 | ) | | | (13,449 | ) | | | (56,505 | ) | | | (6,592 | ) |
Investor A | | | (84,115 | ) | | | (8,387 | ) | | | (66,727 | ) | | | (5,811 | ) |
Investor C | | | (7,496 | ) | | | (327 | ) | | | (46,986 | ) | | | (2,461 | ) |
Class K | | | (1,421,206 | ) | | | (142,211 | ) | | | (403,884 | ) | | | (46,211 | ) |
Class R | | | (63,969 | ) | | | (3,654 | ) | | | (47,496 | ) | | | (4,693 | ) |
| | | | | | | | | | | | | | | | |
| | | | |
Decrease in net assets resulting from distributions to shareholders | | | (1,686,516 | ) | | | (168,028 | ) | | | (621,598 | ) | | | (65,768 | ) |
| | | | | | | | | | | | | | | | |
| | | | |
CAPITAL SHARE TRANSACTIONS | | | | | | | | | | | | | | | | |
Net increase in net assets derived from capital share transactions | | | 8,576,625 | | | | 5,215,907 | | | | 1,351,671 | | | | 174,089 | |
| | | | | | | | | | | | | | | | |
| | | | |
NET ASSETS | | | | | | | | | | | | | | | | |
Total increase in net assets | | | 9,383,622 | | | | 6,699,751 | | | | 1,701,065 | | | | 705,721 | |
Beginning of year | | | 10,928,150 | | | | 4,228,399 | | | | 4,895,695 | | | | 4,189,974 | |
| | | | | | | | | | | | | | | | |
| | | | |
End of year | | $ | 20,311,772 | | | $ | 10,928,150 | | | $ | 6,596,760 | | | $ | 4,895,695 | |
| | | | | | | | | | | | | | | | |
| (a) | Distributions for annual periods determined in accordance with U.S. federal income tax regulations. |
See notes to financial statements.
| | |
| 90 | | 2 0 2 1 BLACK ROCK ANNUAL REPORT TO SHAREHOLDERS |
Financial Highlights
(For a share outstanding throughout each period)
| | | | | | | | | | | | | | | | | | | | | | |
| | | BlackRock LifePath® Dynamic Retirement Fund | |
| |
| | | Institutional | |
| |
| | | Year Ended December 31, | |
| | | | | | |
| | | | | 2021 | | | 2020 | | | 2019 | | | 2018 | | | 2017 | |
| | | | | | | |
Net asset value, beginning of year | | | | $ | 11.68 | | | $ | 11.04 | | | $ | 9.69 | | | $ | 11.00 | | | $ | 10.78 | |
| | | | | | | | | | | | | | | | | | | | | | |
| | | | | | |
Net investment income(a) | | | | | 0.16 | | | | 0.19 | | | | 0.28 | | | | 0.25 | | | | 0.19 | |
Net realized and unrealized gain (loss) | | | | | 0.63 | | | | 1.20 | | | | 1.35 | | | | (0.64 | ) | | | 1.05 | |
| | | | | | | | | | | | | | | | | | | | | | |
| | | | | | |
Net increase (decrease) from investment operations | | | | | 0.79 | | | | 1.39 | | | | 1.63 | | | | (0.39 | ) | | | 1.24 | |
| | | | | | | | | | | | | | | | | | | | | | |
| | | | | | |
Distributions(b) | | | | | | | | | | | | | | | | | | | | | | |
From net investment income | | | | | (0.43 | ) | | | (0.22 | ) | | | (0.19 | ) | | | (0.27 | ) | | | (0.15 | ) |
From net realized gain | | | | | (1.15 | ) | | | (0.53 | ) | | | (0.09 | ) | | | (0.65 | ) | | | (0.87 | ) |
| | | | | | | | | | | | | | | | | | | | | | |
| | | | | | |
Total distributions | | | | | (1.58 | ) | | | (0.75 | ) | | | (0.28 | ) | | | (0.92 | ) | | | (1.02 | ) |
| | | | | | | | | | | | | | | | | | | | | | |
| | | | | | |
Net asset value, end of year | | | | $ | 10.89 | | | $ | 11.68 | | | $ | 11.04 | | | $ | 9.69 | | | $ | 11.00 | |
| | | | | | | | | | | | | | | | | | | | | | |
| | | | | | |
Total Return(c) | | | | | | | | | | | | | | | | | | | | | | |
Based on net asset value | | | | | 6.88 | % | | | 12.82 | % | | | 16.91 | % | | | (3.68 | )% | | | 11.68 | % |
| | | | | | | | | | | | | | | | | | | | | | |
| | | | | | |
Ratios to Average Net Assets(d) | | | | | | | | | | | | | | | | | | | | | | |
Total expenses | | | | | 0.77 | % | | | 0.73 | % | | | 0.57 | % | | | 0.58 | % | | | 0.57 | % |
| | | | | | | | | | | | | | | | | | | | | | |
| | | | | | |
Total expenses after fees waived and/or reimbursed | | | | | 0.55 | % | | | 0.56 | % | | | 0.55 | % | | | 0.57 | % | | | 0.56 | % |
| | | | | | | | | | | | | | | | | | | | | | |
| | | | | | |
Net investment income | | | | | 1.34 | % | | | 1.68 | % | | | 2.61 | % | | | 2.26 | % | | | 1.66 | % |
| | | | | | | | | | | | | | | | | | | | | | |
| | | | | | |
Supplemental Data | | | | | | | | | | | | | | | | | | | | | | |
Net assets, end of year (000) | | | | $ | 49,943 | | | $ | 59,201 | | | $ | 99,249 | | | $ | 25,343 | | | $ | 38,119 | |
| | | | | | | | | | | | | | | | | | | | | | |
| | | | | | |
Portfolio turnover rate | | | | | 2 | %(e) | | | 43 | %(f) | | | 35 | %(g) | | | 38 | %(g) | | | 6 | %(g) |
| | | | | | | | | | | | | | | | | | | | | | |
| (a) | Based on average shares outstanding. |
| (b) | Distributions for annual periods determined in accordance with U.S. federal income tax regulations. |
| (c) | Where applicable, assumes the reinvestment of distributions. |
| (d) | Excludes fees and expenses incurred indirectly as a result of investments in underlying funds. |
| (e) | Includes the purchases and sales of the underlying funds and the Underlying Master Portfolios. |
| (f) | From January 1, 2020 through March 8, 2020, the rate includes the LifePath Dynamic Master Portfolio’s purchases and sales of the underlying funds and the Underlying Master Portfolios. Beginning March 9, 2020, the rate includes the LifePath Dynamic Fund’s purchases and sales of the underlying funds and the Underlying Master Portfolios. |
| (g) | Includes the LifePath Dynamic Master Portfolio’s purchases and sales of the underlying funds and Diversified Equity Master Portfolio, Advantage CoreAlpha Bond Master Portfolio, International Tilts Master Portfolio and Master Total Return Portfolio. |
See notes to financial statements.
Financial Highlights (continued)
(For a share outstanding throughout each period)
| | | | | | | | | | | | | | | | | | | | | | |
| | | BlackRock LifePath® Dynamic Retirement Fund (continued) | |
| |
| | | Investor A | |
| |
| | | Year Ended December 31, | |
| | | | | | |
| | | | | 2021 | | | 2020 | | | 2019 | | | 2018 | | | 2017 | |
| | | | | | | |
Net asset value, beginning of year | | | | $ | 10.03 | | | $ | 9.58 | | | $ | 8.45 | | | $ | 9.72 | | | $ | 9.64 | |
| | | | | | | | | | | | | | | | | | | | | | |
| | | | | | |
Net investment income(a) | | | | | 0.11 | | | | 0.13 | | | | 0.23 | | | | 0.20 | | | | 0.14 | |
Net realized and unrealized gain (loss) | | | | | 0.54 | | | | 1.05 | | | | 1.16 | | | | (0.57 | ) | | | 0.94 | |
| | | | | | | | | | | | | | | | | | | | | | |
| | | | | | |
Net increase (decrease) from investment operations | | | | | 0.65 | | | | 1.18 | | | | 1.39 | | | | (0.37 | ) | | | 1.08 | |
| | | | | | | | | | | | | | | | | | | | | | |
| | | | | | |
Distributions(b) | | | | | | | | | | | | | | | | | | | | | | |
From net investment income | | | | | (0.40 | ) | | | (0.20 | ) | | | (0.17 | ) | | | (0.25 | ) | | | (0.13 | ) |
From net realized gain | | | | | (1.16 | ) | | | (0.53 | ) | | | (0.09 | ) | | | (0.65 | ) | | | (0.87 | ) |
| | | | | | | | | | | | | | | | | | | | | | |
| | | | | | |
Total distributions | | | | | (1.56 | ) | | | (0.73 | ) | | | (0.26 | ) | | | (0.90 | ) | | | (1.00 | ) |
| | | | | | | | | | | | | | | | | | | | | | |
| | | | | | |
Net asset value, end of year | | | | $ | 9.12 | | | $ | 10.03 | | | $ | 9.58 | | | $ | 8.45 | | | $ | 9.72 | |
| | | | | | | | | | | | | | | | | | | | | | |
| | | | | | |
Total Return(c) | | | | | | | | | | | | | | | | | | | | | | |
Based on net asset value | | | | | 6.61 | % | | | 12.56 | % | | | 16.56 | % | | | (3.93 | )% | | | 11.40 | % |
| | | | | | | | | | | | | | | | | | | | | | |
| | | | | | |
Ratios to Average Net Assets(d) | | | | | | | | | | | | | | | | | | | | | | |
Total expenses | | | | | 1.02 | % | | | 0.98 | % | | | 0.82 | % | | | 0.83 | % | | | 0.82 | % |
| | | | | | | | | | | | | | | | | | | | | | |
| | | | | | |
Total expenses after fees waived and/or reimbursed | | | | | 0.80 | % | | | 0.81 | % | | | 0.80 | % | | | 0.82 | % | | | 0.82 | % |
| | | | | | | | | | | | | | | | | | | | | | |
| | | | | | |
Net investment income | | | | | 1.09 | % | | | 1.40 | % | | | 2.43 | % | | | 2.05 | % | | | 1.46 | % |
| | | | | | | | | | | | | | | | | | | | | | |
| | | | | | |
Supplemental Data | | | | | | | | | | | | | | | | | | | | | | |
Net assets, end of year (000) | | | | $ | 164,481 | | | $ | 190,948 | | | $ | 234,757 | | | $ | 65,509 | | | $ | 81,900 | |
| | | | | | | | | | | | | | | | | | | | | | |
| | | | | | |
Portfolio turnover rate | | | | | 2 | %(e) | | | 43 | %(f) | | | 35 | %(g) | | | 38 | %(g) | | | 6 | %(g) |
| | | | | | | | | | | | | | | | | | | | | | |
| (a) | Based on average shares outstanding. |
| (b) | Distributions for annual periods determined in accordance with U.S. federal income tax regulations. |
| (c) | Where applicable, excludes the effects of any sales charges and assumes the reinvestment of distributions. |
| (d) | Excludes fees and expenses incurred indirectly as a result of investments in underlying funds. |
| (e) | Includes the purchases and sales of the underlying funds and the Underlying Master Portfolios. |
| (f) | From January 1, 2020 through March 8, 2020, the rate includes the LifePath Dynamic Master Portfolio’s purchases and sales of the underlying funds and the Underlying Master Portfolios. Beginning March 9, 2020, the rate includes the LifePath Dynamic Fund’s purchases and sales of the underlying funds and the Underlying Master Portfolios. |
| (g) | Includes the LifePath Dynamic Master Portfolio’s purchases and sales of the underlying funds and Diversified Equity Master Portfolio, Advantage CoreAlpha Bond Master Portfolio, International Tilts Master Portfolio and Master Total Return Portfolio. |
See notes to financial statements.
| | |
| 92 | | 2 0 2 1 BLACK ROCK ANNUAL REPORT TO SHAREHOLDERS |
Financial Highlights (continued)
(For a share outstanding throughout each period)
| | | | | | | | | | | | | | | | | | | | | | |
| | | BlackRock LifePath® Dynamic Retirement Fund (continued) | |
| |
| | | Investor C | |
| |
| | | Year Ended December 31, | |
| | | | | | |
| | | | | 2021 | | | 2020 | | | 2019 | | | 2018 | | | 2017 | |
| | | | | | | |
Net asset value, beginning of year | | | | $ | 11.50 | | | $ | 10.87 | | | $ | 9.57 | | | $ | 10.87 | | | $ | 10.67 | |
| | | | | | | | | | | | | | | | | | | | | | |
| | | | | | |
Net investment income(a) | | | | | 0.04 | | | | 0.06 | | | | 0.18 | | | | 0.13 | | | | 0.07 | |
Net realized and unrealized gain (loss) | | | | | 0.63 | | | | 1.20 | | | | 1.30 | | | | (0.63 | ) | | | 1.03 | |
| | | | | | | | | | | | | | | | | | | | | | |
| | | | | | |
Net increase (decrease) from investment operations | | | | | 0.67 | | | | 1.26 | | | | 1.48 | | | | (0.50 | ) | | | 1.10 | |
| | | | | | | | | | | | | | | | | | | | | | |
| | | | | | |
Distributions(b) | | | | | | | | | | | | | | | | | | | | | | |
From net investment income | | | | | (0.33 | ) | | | (0.10 | ) | | | (0.09 | ) | | | (0.15 | ) | | | (0.04 | ) |
From net realized gain | | | | | (1.15 | ) | | | (0.53 | ) | | | (0.09 | ) | | | (0.65 | ) | | | (0.86 | ) |
| | | | | | | | | | | | | | | | | | | | | | |
| | | | | | |
Total distributions | | | | | (1.48 | ) | | | (0.63 | ) | | | (0.18 | ) | | | (0.80 | ) | | | (0.90 | ) |
| | | | | | | | | | | | | | | | | | | | | | |
| | | | | | |
Net asset value, end of year | | | | $ | 10.69 | | | $ | 11.50 | | | $ | 10.87 | | | $ | 9.57 | | | $ | 10.87 | |
| | | | | | | | | | | | | | | | | | | | | | |
| | | | | | |
Total Return(c) | | | | | | | | | | | | | | | | | | | | | | |
Based on net asset value | | | | | 5.83 | % | | | 11.72 | % | | | 15.54 | % | | | (4.67 | )% | | | 10.47 | % |
| | | | | | | | | | | | | | | | | | | | | | |
| | | | | | |
Ratios to Average Net Assets(d) | | | | | | | | | | | | | | | | | | | | | | |
Total expenses | | | | | 1.77 | % | | | 1.73 | % | | | 1.62 | % | | | 1.63 | % | | | 1.62 | % |
| | | | | | | | | | | | | | | | | | | | | | |
| | | | | | |
Total expenses after fees waived and/or reimbursed | | | | | 1.55 | % | | | 1.57 | % | | | 1.60 | % | | | 1.62 | % | | | 1.62 | % |
| | | | | | | | | | | | | | | | | | | | | | |
| | | | | | |
Net investment income | | | | | 0.35 | % | | | 0.55 | % | | | 1.66 | % | | | 1.20 | % | | | 0.65 | % |
| | | | | | | | | | | | | | | | | | | | | | |
| | | | | | |
Supplemental Data | | | | | | | | | | | | | | | | | | | | | | |
Net assets, end of year (000) | | | | $ | 2,249 | | | $ | 2,303 | | | $ | 3,846 | | | $ | 672 | | | $ | 1,034 | |
| | | | | | | | | | | | | | | | | | | | | | |
| | | | | | |
Portfolio turnover rate | | | | | 2 | %(e) | | | 43 | %(f) | | | 35 | %(g) | | | 38 | %(g) | | | 6 | %(g) |
| | | | | | | | | | | | | | | | | | | | | | |
| (a) | Based on average shares outstanding. |
| (b) | Distributions for annual periods determined in accordance with U.S. federal income tax regulations. |
| (c) | Where applicable, excludes the effects of any sales charges and assumes the reinvestment of distributions. |
| (d) | Excludes fees and expenses incurred indirectly as a result of investments in underlying funds. |
| (e) | Includes the purchases and sales of the underlying funds and the Underlying Master Portfolios. |
| (f) | From January 1, 2020 through March 8, 2020, the rate includes the LifePath Dynamic Master Portfolio’s purchases and sales of the underlying funds and the Underlying Master Portfolios. Beginning March 9, 2020, the rate includes the LifePath Dynamic Fund’s purchases and sales of the underlying funds and the Underlying Master Portfolios. |
| (g) | Includes the LifePath Dynamic Master Portfolio’s purchases and sales of the underlying funds and Diversified Equity Master Portfolio, Advantage CoreAlpha Bond Master Portfolio, International Tilts Master Portfolio and Master Total Return Portfolio. |
See notes to financial statements.
Financial Highlights (continued)
(For a share outstanding throughout each period)
| | | | | | | | | | | | | | | | | | | | | | | | |
| | | | | | BlackRock LifePath® Dynamic Retirement Fund (continued) | |
| | |
| | | | | | Class K | |
| | |
| | | | | | Year Ended December 31, | |
| | | | | | |
| | | | | | 2021 | | | 2020 | | | 2019 | | | 2018 | | | 2017 | |
| | | | | | | |
Net asset value, beginning of year | | | | | | $ | 11.63 | | | $ | 10.99 | | | $ | 9.65 | | | $ | 10.96 | | | $ | 10.75 | |
| | | | | | | | | | | | | | | | | | | | | | | | |
| | | | | | |
Net investment income(a) | | | | | | | 0.19 | | | | 0.21 | | | | 0.32 | | | | 0.27 | | | | 0.22 | |
Net realized and unrealized gain (loss) | | | | | | | 0.63 | | | | 1.21 | | | | 1.32 | | | | (0.64 | ) | | | 1.03 | |
| | | | | | | | | | | | | | | | | | | | | | | | |
| | | | | | |
Net increase (decrease) from investment operations | | | | | | | 0.82 | | | | 1.42 | | | | 1.64 | | | | (0.37 | ) | | | 1.25 | |
| | | | | | | | | | | | | | | | | | | | | | | | |
| | | | | | |
Distributions(b) | | | | | | | | | | | | | | | | | | | | | | | | |
From net investment income | | | | | | | (0.47 | ) | | | (0.25 | ) | | | (0.21 | ) | | | (0.29 | ) | | | (0.17 | ) |
From net realized gain | | | | | | | (1.15 | ) | | | (0.53 | ) | | | (0.09 | ) | | | (0.65 | ) | | | (0.87 | ) |
| | | | | | | | | | | | | | | | | | | | | | | | |
| | | | | | |
Total distributions | | | | | | | (1.62 | ) | | | (0.78 | ) | | | (0.30 | ) | | | (0.94 | ) | | | (1.04 | ) |
| | | | | | | | | | | | | | | | | | | | | | | | |
| | | | | | |
Net asset value, end of year | | | | | | $ | 10.83 | | | $ | 11.63 | | | $ | 10.99 | | | $ | 9.65 | | | $ | 10.96 | |
| | | | | | | | | | | | | | | | | | | | | | | | |
| | | | | | |
Total Return(c) | | | | | | | | | | | | | | | | | | | | | | | | |
Based on net asset value | | | | | | | 7.11 | % | | | 13.17 | % | | | 17.07 | % | | | (3.47 | )% | | | 11.87 | % |
| | | | | | | | | | | | | | | | | | | | | | | | |
| | | | | | |
Ratios to Average Net Assets(d) | | | | | | | | | | | | | | | | | | | | | | | | |
Total expenses | | | | | | | 0.52 | % | | | 0.50 | % | | | 0.37 | % | | | 0.38 | % | | | 0.37 | % |
| | | | | | | | | | | | | | | | | | | | | | | | |
| | | | | | |
Total expenses after fees waived and/or reimbursed | | | | | | | 0.30 | % | | | 0.32 | % | | | 0.35 | % | | | 0.37 | % | | | 0.36 | % |
| | | | | | | | | | | | | | | | | | | | | | | | |
| | | | | | |
Net investment income | | | | | | | 1.61 | % | | | 1.88 | % | | | 2.99 | % | | | 2.54 | % | | | 1.93 | % |
| | | | | | | | | | | | | | | | | | | | | | | | |
| | | | | | |
Supplemental Data | | | | | | | | | | | | | | | | | | | | | | | | |
Net assets, end of year (000) | | | | | | $ | 78,916 | | | $ | 74,809 | | | $ | 64,913 | | | $ | 14,901 | | | $ | 15,965 | |
| | | | | | | | | | | | | | | | | | | | | | | | |
| | | | | | |
Portfolio turnover rate | | | | | | | 2 | %(e) | | | 43 | %(f) | | | 35 | %(g) | | | 38 | %(g) | | | 6 | %(g) |
| | | | | | | | | | | | | | | | | | | | | | | | |
| (a) | Based on average shares outstanding. |
| (b) | Distributions for annual periods determined in accordance with U.S. federal income tax regulations. |
| (c) | Where applicable, assumes the reinvestment of distributions. |
| (d) | Excludes fees and expenses incurred indirectly as a result of investments in underlying funds. |
| (e) | Includes the purchases and sales of the underlying funds and the Underlying Master Portfolios. |
| (f) | From January 1, 2020 through March 8, 2020, the rate includes the LifePath Dynamic Master Portfolio’s purchases and sales of the underlying funds and the Underlying Master Portfolios. Beginning March 9, 2020, the rate includes the LifePath Dynamic Fund’s purchases and sales of the underlying funds and the Underlying Master Portfolios. |
| (g) | Includes the LifePath Dynamic Master Portfolio’s purchases and sales of the underlying funds and Diversified Equity Master Portfolio, Advantage CoreAlpha Bond Master Portfolio, International Tilts Master Portfolio and Master Total Return Portfolio. |
See notes to financial statements.
| | |
| 94 | | 2 0 2 1 BLACK ROCK ANNUAL REPORT TO SHAREHOLDERS |
Financial Highlights (continued)
(For a share outstanding throughout each period)
| | | | | | | | | | | | | | | | | | | | | | | | |
| | | BlackRock LifePath® Dynamic Retirement Fund (continued) | |
| |
| | | Class R | |
| |
| | | Year Ended December 31, | |
| | | | | | |
| | | | | | 2021 | | | 2020 | | | 2019 | | | 2018 | | | 2017 | |
| | | | | | | |
Net asset value, beginning of year | | | | | | $ | 11.54 | | | $ | 10.91 | | | $ | 9.60 | | | $ | 10.91 | | | $ | 10.71 | |
| | | | | | | | | | | | | | | | | | | | | | | | |
| | | | | | |
Net investment income(a) | | | | | | | 0.11 | | | | 0.14 | | | | 0.23 | | | | 0.20 | | | | 0.14 | |
Net realized and unrealized gain (loss) | | | | | | | 0.62 | | | | 1.19 | | | | 1.32 | | | | (0.64 | ) | | | 1.03 | |
| | | | | | | | | | | | | | | | | | | | | | | | |
| | | | | | |
Net increase (decrease) from investment operations | | | | | | | 0.73 | | | | 1.33 | | | | 1.55 | | | | (0.44 | ) | | | 1.17 | |
| | | | | | | | | | | | | | | | | | | | | | | | |
| | | | | | |
Distributions(b) | | | | | | | | | | | | | | | | | | | | | | | | |
From net investment income | | | | | | | (0.38 | ) | | | (0.17 | ) | | | (0.15 | ) | | | (0.22 | ) | | | (0.10 | ) |
From net realized gain | | | | | | | (1.15 | ) | | | (0.53 | ) | | | (0.09 | ) | | | (0.65 | ) | | | (0.87 | ) |
| | | | | | | | | | | | | | | | | | | | | | | | |
| | | | | | |
Total distributions | | | | | | | (1.53 | ) | | | (0.70 | ) | | | (0.24 | ) | | | (0.87 | ) | | | (0.97 | ) |
| | | | | | | | | | | | | | | | | | | | | | | | |
| | | | | | |
Net asset value, end of year | | | | | | $ | 10.74 | | | $ | 11.54 | | | $ | 10.91 | | | $ | 9.60 | | | $ | 10.91 | |
| | | | | | | | | | | | | | | | | | | | | | | | |
| | | | | | |
Total Return(c) | | | | | | | | | | | | | | | | | | | | | | | | |
Based on net asset value | | | | | | | 6.41 | % | | | 12.41 | % | | | 16.24 | % | | | (4.11 | )% | | | 11.11 | % |
| | | | | | | | | | | | | | | | | | | | | | | | |
| | | | | | |
Ratios to Average Net Assets(d) | | | | | | | | | | | | | | | | | | | | | | | | |
Total expenses | | | | | | | 1.22 | % | | | 1.19 | % | | | 1.02 | % | | | 1.03 | % | | | 1.02 | % |
| | | | | | | | | | | | | | | | | | | | | | | | |
| | | | | | |
Total expenses after fees waived and/or reimbursed | | | | | | | 1.00 | % | | | 1.01 | % | | | 1.00 | % | | | 1.02 | % | | | 1.02 | % |
| | | | | | | | | | | | | | | | | | | | | | | | |
| | | | | | |
Net investment income | | | | | | | 0.91 | % | | | 1.29 | % | | | 2.19 | % | | | 1.87 | % | | | 1.27 | % |
| | | | | | | | | | | | | | | | | | | | | | | | |
| | | | | | |
Supplemental Data | | | | | | | | | | | | | | | | | | | | | | | | |
Net assets, end of year (000) | | | | | | $ | 6,183 | | | $ | 6,360 | | | $ | 5,291 | | | $ | 1,036 | | | $ | 1,167 | |
| | | | | | | | | | | | | | | | | | | | | | | | |
| | | | | | |
Portfolio turnover rate | | | | | | | 2 | %(e) | | | 43 | %(f) | | | 35 | %(g) | | | 38 | %(g) | | | 6 | %(g) |
| | | | | | | | | | | | | | | | | | | | | | | | |
| (a) | Based on average shares outstanding. |
| (b) | Distributions for annual periods determined in accordance with U.S. federal income tax regulations. |
| (c) | Where applicable, assumes the reinvestment of distributions. |
| (d) | Excludes fees and expenses incurred indirectly as a result of investments in underlying funds. |
| (e) | Includes the purchases and sales of the underlying funds and the Underlying Master Portfolios. |
| (f) | From January 1, 2020 through March 8, 2020, the rate includes the LifePath Dynamic Master Portfolio’s purchases and sales of the underlying funds and the Underlying Master Portfolios. Beginning March 9, 2020, the rate includes the LifePath Dynamic Fund’s purchases and sales of the underlying funds and the Underlying Master Portfolios. |
| (g) | Includes the LifePath Dynamic Master Portfolio’s purchases and sales of the underlying funds and Diversified Equity Master Portfolio, Advantage CoreAlpha Bond Master Portfolio, International Tilts Master Portfolio and Master Total Return Portfolio. |
See notes to financial statements.
Financial Highlights (continued)
(For a share outstanding throughout each period)
| | | | | | | | | | | | | | | | | | | | | | | | |
| | | BlackRock LifePath® Dynamic 2025 Fund | |
| |
| | | Institutional | |
| |
| | | Year Ended December 31, | |
| | | | | | |
| | | | | | 2021 | | | 2020 | | | 2019 | | | 2018 | | | 2017 | |
| | | | | | | |
Net asset value, beginning of year | | | | | | $ | 14.72 | | | $ | 13.42 | | | $ | 11.81 | | | $ | 13.52 | | | $ | 12.66 | |
| | | | | | | | | | | | | | | | | | | | | | | | |
| | | | | | |
Net investment income(a) | | | | | | | 0.20 | | | | 0.22 | | | | 0.30 | | | | 0.25 | | | | 0.22 | |
Net realized and unrealized gain (loss) | | | | | | | 1.08 | | | | 1.47 | | | | 1.99 | | | | (0.87 | ) | | | 1.71 | |
| | | | | | | | | | | | | | | | | | | | | | | | |
| | | | | | |
Net increase (decrease) from investment operations | | | | | | | 1.28 | | | | 1.69 | | | | 2.29 | | | | (0.62 | ) | | | 1.93 | |
| | | | | | | | | | | | | | | | | | | | | | | | |
| | | | | | |
Distributions(b) | | | | | | | | | | | | | | | | | | | | | | | | |
From net investment income | | | | | | | (0.58 | ) | | | (0.26 | ) | | | (0.27 | ) | | | (0.24 | ) | | | (0.21 | ) |
From net realized gain | | | | | | | (0.99 | ) | | | (0.13 | ) | | | (0.41 | ) | | | (0.85 | ) | | | (0.86 | ) |
| | | | | | | | | | | | | | | | | | | | | | | | |
| | | | | | |
Total distributions | | | | | | | (1.57 | ) | | | (0.39 | ) | | | (0.68 | ) | | | (1.09 | ) | | | (1.07 | ) |
| | | | | | | | | | | | | | | | | | | | | | | | |
| | | | | | |
Net asset value, end of year | | | | | | $ | 14.43 | | | $ | 14.72 | | | $ | 13.42 | | | $ | 11.81 | | | $ | 13.52 | |
| | | | | | | | | | | | | | | | | | | | | | | | |
| | | | | | |
Total Return(c) | | | | | | | | | | | | | | | | | | | | | | | | |
Based on net asset value | | | | | | | 8.82 | % | | | 12.87 | % | | | 19.46 | % | | | (4.66 | )% | | | 15.45 | % |
| | | | | | | | | | | | | | | | | | | | | | | | |
| | | | | | |
Ratios to Average Net Assets(d) | | | | | | | | | | | | | | | | | | | | | | | | |
Total expenses | | | | | | | 0.80 | % | | | 0.78 | % | | | 0.57 | % | | | 0.57 | % | | | 0.56 | % |
| | | | | | | | | | | | | | | | | | | | | | | | |
| | | | | | |
Total expenses after fees waived and/or reimbursed | | | | | | | 0.54 | % | | | 0.55 | % | | | 0.55 | % | | | 0.55 | % | | | 0.54 | % |
| | | | | | | | | | | | | | | | | | | | | | | | |
| | | | | | |
Net investment income | | | | | | | 1.29 | % | | | 1.65 | % | | | 2.32 | % | | | 1.87 | % | | | 1.66 | % |
| | | | | | | | | | | | | | | | | | | | | | | | |
| | | | | | |
Supplemental Data | | | | | | | | | | | | | | | | | | | | | | | | |
Net assets, end of year (000) | | | | | | $ | 11,872 | | | $ | 10,690 | | | $ | 2,908 | | | $ | 1,519 | | | $ | 19,134 | |
| | | | | | | | | | | | | | | | | | | | | | | | |
| | | | | | |
Portfolio turnover rate | | | | | | | 6 | %(e) | | | 45 | %(f) | | | 35 | %(g) | | | 38 | %(g) | | | 32 | %(g) |
| | | | | | | | | | | | | | | | | | | | | | | | |
| (a) | Based on average shares outstanding. |
| (b) | Distributions for annual periods determined in accordance with U.S. federal income tax regulations. |
| (c) | Where applicable, assumes the reinvestment of distributions. |
| (d) | Excludes fees and expenses incurred indirectly as a result of investments in underlying funds. |
| (e) | Includes the purchases and sales of the underlying funds and the Underlying Master Portfolios. |
| (f) | From January 1, 2020 through March 8, 2020, the rate includes the LifePath Dynamic Master Portfolio’s purchases and sales of the underlying funds and the Underlying Master Portfolios. Beginning March 9, 2020, the rate includes the LifePath Dynamic Fund’s purchases and sales of the underlying funds and the Underlying Master Portfolios. |
| (g) | Includes the LifePath Dynamic Master Portfolio’s purchases and sales of the underlying funds and Diversified Equity Master Portfolio, Advantage CoreAlpha Bond Master Portfolio, International Tilts Master Portfolio, Large Cap Index Master Portfolio, Master Small Cap Index Series and Master Total Return Portfolio. |
See notes to financial statements.
| | |
| 96 | | 2 0 2 1 BLACK ROCK ANNUAL REPORT TO SHAREHOLDERS |
Financial Highlights (continued)
(For a share outstanding throughout each period)
| | | | | | | | | | | | | | | | | | | | | | | | |
| | | BlackRock LifePath® Dynamic 2025 Fund (continued) | |
| |
| | | Investor A | |
| |
| | | Year Ended December 31, | |
| | | | | | |
| | | | | | 2021 | | | 2020 | | | 2019 | | | 2018 | | | 2017 | |
| | | | | | | |
Net asset value, beginning of year | | | | | | $ | 14.58 | | | $ | 13.29 | | | $ | 11.70 | | | $ | 13.50 | | | $ | 12.64 | |
| | | | | | | | | | | | | | | | | | | | | | | | |
| | | | | | |
Net investment income(a) | | | | | | | 0.15 | | | | 0.18 | | | | 0.26 | | | | 0.26 | | | | 0.20 | |
Net realized and unrealized gain (loss) | | | | | | | 1.08 | | | | 1.46 | | | | 1.98 | | �� | | (0.91 | ) | | | 1.70 | |
| | | | | | | | | | | | | | | | | | | | | | | | |
| | | | | | |
Net increase (decrease) from investment operations | | | | | | | 1.23 | | | | 1.64 | | | | 2.24 | | | | (0.65 | ) | | | 1.90 | |
| | | | | | | | | | | | | | | | | | | | | | | | |
| | | | | | |
Distributions(b) | | | | | | | | | | | | | | | | | | | | | | | | |
From net investment income | | | | | | | (0.54 | ) | | | (0.22 | ) | | | (0.24 | ) | | | (0.30 | ) | | | (0.18 | ) |
From net realized gain | | | | | | | (0.99 | ) | | | (0.13 | ) | | | (0.41 | ) | | | (0.85 | ) | | | (0.86 | ) |
| | | | | | | | | | | | | | | | | | | | | | | | |
| | | | | | |
Total distributions | | | | | | | (1.53 | ) | | | (0.35 | ) | | | (0.65 | ) | | | (1.15 | ) | | | (1.04 | ) |
| | | | | | | | | | | | | | | | | | | | | | | | |
| | | | | | |
Net asset value, end of year | | | | | | $ | 14.28 | | | $ | 14.58 | | | $ | 13.29 | | | $ | 11.70 | | | $ | 13.50 | |
| | | | | | | | | | | | | | | | | | | | | | | | |
| | | | | | |
Total Return(c) | | | | | | | | | | | | | | | | | | | | | | | | |
Based on net asset value | | | | | | | 8.56 | % | | | 12.60 | % | | | 19.16 | % | | | (4.87 | )% | | | 15.21 | % |
| | | | | | | | | | | | | | | | | | | | | | | | |
| | | | | | |
Ratios to Average Net Assets(d) | | | | | | | | | | | | | | | | | | | | | | | | |
Total expenses | | | | | | | 1.05 | % | | | 1.01 | % | | | 0.82 | % | | | 0.83 | % | | | 0.81 | % |
| | | | | | | | | | | | | | | | | | | | | | | | |
| | | | | | |
Total expenses after fees waived and/or reimbursed | | | | | | | 0.79 | % | | | 0.80 | % | | | 0.80 | % | | | 0.81 | % | | | 0.79 | % |
| | | | | | | | | | | | | | | | | | | | | | | | |
| | | | | | |
Net investment income | | | | | | | 1.02 | % | | | 1.34 | % | | | 1.97 | % | | | 1.94 | % | | | 1.45 | % |
| | | | | | | | | | | | | | | | | | | | | | | | |
| | | | | | |
Supplemental Data | | | | | | | | | | | | | | | | | | | | | | | | |
Net assets, end of year (000) | | | | | | $ | 23,788 | | | $ | 24,518 | | | $ | 23,298 | | | $ | 25,940 | | | $ | 31,393 | |
| | | | | | | | | | | | | | | | | | | | | | | | |
| | | | | | |
Portfolio turnover rate | | | | | | | 6 | %(e) | | | 45 | %(f) | | | 35 | %(g) | | | 38 | %(g) | | | 32 | %(g) |
| | | | | | | | | | | | | | | | | | | | | | | | |
| (a) | Based on average shares outstanding. |
| (b) | Distributions for annual periods determined in accordance with U.S. federal income tax regulations. |
| (c) | Where applicable, excludes the effects of any sales charges and assumes the reinvestment of distributions. |
| (d) | Excludes fees and expenses incurred indirectly as a result of investments in underlying funds. |
| (e) | Includes the purchases and sales of the underlying funds and the Underlying Master Portfolios. |
| (f) | From January 1, 2020 through March 8, 2020, the rate includes the LifePath Dynamic Master Portfolio’s purchases and sales of the underlying funds and the Underlying Master Portfolios. Beginning March 9, 2020, the rate includes the LifePath Dynamic Fund’s purchases and sales of the underlying funds and the Underlying Master Portfolios. |
| (g) | Includes the LifePath Dynamic Master Portfolio’s purchases and sales of the underlying funds and Diversified Equity Master Portfolio, Advantage CoreAlpha Bond Master Portfolio, International Tilts Master Portfolio, Large Cap Index Master Portfolio, Master Small Cap Index Series and Master Total Return Portfolio. |
See notes to financial statements.
Financial Highlights (continued)
(For a share outstanding throughout each period)
| | | | | | | | | | | | | | | | | | | | | | | | |
| | | BlackRock LifePath® Dynamic 2025 Fund (continued) | |
| |
| | | Investor C | |
| |
| | | Year Ended December 31, | |
| | | | | | |
| | | | | | 2021 | | | 2020 | | | 2019 | | | 2018 | | | 2017 | |
| | | | | | |
Net asset value, beginning of year | | | | | | $ | 14.49 | | | $ | 13.20 | | | $ | 11.63 | | | $ | 13.44 | | | $ | 12.58 | |
| | | | | | | | | | | | | | | | | | | | | | | | |
| | | | | | |
Net investment income(a) | | | | | | | 0.04 | | | | 0.06 | | | | 0.16 | | | | 0.16 | | | | 0.09 | |
Net realized and unrealized gain (loss) | | | | | | | 1.07 | | | | 1.47 | | | | 1.96 | | | | (0.92 | ) | | | 1.70 | |
| | | | | | | | | | | | | | | | | | | | | | | | |
| | | | | | |
Net increase (decrease) from investment operations | | | | | | | 1.11 | | | | 1.53 | | | | 2.12 | | | | (0.76 | ) | | | 1.79 | |
| | | | | | | | | | | | | | | | | | | | | | | | |
| | | | | | |
Distributions(b) | | | | | | | | | | | | | | | | | | | | | | | | |
From net investment income | | | | | | | (0.45 | ) | | | (0.11 | ) | | | (0.14 | ) | | | (0.20 | ) | | | (0.07 | ) |
From net realized gain | | | | | | | (0.99 | ) | | | (0.13 | ) | | | (0.41 | ) | | | (0.85 | ) | | | (0.86 | ) |
| | | | | | | | | | | | | | | | | | | | | | | | |
| | | | | | |
Total distributions | | | | | | | (1.44 | ) | | | (0.24 | ) | | | (0.55 | ) | | | (1.05 | ) | | | (0.93 | ) |
| | | | | | | | | | | | | | | | | | | | | | | | |
| | | | | | |
Net asset value, end of year | | | | | | $ | 14.16 | | | $ | 14.49 | | | $ | 13.20 | | | $ | 11.63 | | | $ | 13.44 | |
| | | | | | | | | | | | | | | | | | | | | | | | |
| | | | | | |
Total Return(c) | | | | | | | | | | | | | | | | | | | | | | | | |
Based on net asset value | | | | | | | 7.70 | % | | | 11.76 | % | | | 18.25 | % | | | (5.70 | )% | | | 14.39 | % |
| | | | | | | | | | | | | | | | | | | | | | | | |
| | | | | | |
Ratios to Average Net Assets(d) | | | | | | | | | | | | | | | | | | | | | | | | |
Total expenses | | | | | | | 1.80 | % | | | 1.77 | % | | | 1.62 | % | | | 1.63 | % | | | 1.61 | % |
| | | | | | | | | | | | | | | | | | | | | | | | |
| | | | | | |
Total expenses after fees waived and/or reimbursed | | | | | | | 1.54 | % | | | 1.56 | % | | | 1.60 | % | | | 1.61 | % | | | 1.59 | % |
| | | | | | | | | | | | | | | | | | | | | | | | |
| | | | | | |
Net investment income | | | | | | | 0.28 | % | | | 0.49 | % | | | 1.25 | % | | | 1.17 | % | | | 0.66 | % |
| | | | | | | | | | | | | | | | | | | | | | | | |
| | | | | | |
Supplemental Data | | | | | | | | | | | | | | | | | | | | | | | | |
Net assets, end of year (000) | | | | | | $ | 2,763 | | | $ | 2,610 | | | $ | 3,416 | | | $ | 2,434 | | | $ | 2,583 | |
| | | | | | | | | | | | | | | | | | | | | | | | |
| | | | | | |
Portfolio turnover rate | | | | | | | 6 | %(e) | | | 45 | %(f) | | | 35 | %(g) | | | 38 | %(g) | | | 32 | %(g) |
| | | | | | | | | | | | | | | | | | | | | | | | |
| (a) | Based on average shares outstanding. |
| (b) | Distributions for annual periods determined in accordance with U.S. federal income tax regulations. |
| (c) | Where applicable, excludes the effects of any sales charges and assumes the reinvestment of distributions. |
| (d) | Excludes fees and expenses incurred indirectly as a result of investments in underlying funds. |
| (e) | Includes the purchases and sales of the underlying funds and the Underlying Master Portfolios. |
| (f) | From January 1, 2020 through March 8, 2020, the rate includes the LifePath Dynamic Master Portfolio’s purchases and sales of the underlying funds and the Underlying Master Portfolios. Beginning March 9, 2020, the rate includes the LifePath Dynamic Fund’s purchases and sales of the underlying funds and the Underlying Master Portfolios. |
| (g) | Includes the LifePath Dynamic Master Portfolio’s purchases and sales of the underlying funds and Diversified Equity Master Portfolio, Advantage CoreAlpha Bond Master Portfolio, International Tilts Master Portfolio, Large Cap Index Master Portfolio, Master Small Cap Index Series and Master Total Return Portfolio. |
See notes to financial statements.
| | |
| 98 | | 2 0 2 1 BLACK ROCK ANNUAL REPORT TO SHAREHOLDERS |
Financial Highlights (continued)
(For a share outstanding throughout each period)
| | | | | | | | | | | | | | | | | | | | | | | | |
| | | | | | BlackRock LifePath® Dynamic 2025 Fund (continued) | |
| | |
| | | | | | Class K | |
| | |
| | | | | | Year Ended December 31, | |
| | | | | | |
| | | | | | 2021 | | | 2020 | | | 2019 | | | 2018 | | | 2017 | |
| | | | | | |
Net asset value, beginning of year | | | | | | $ | 14.57 | | | $ | 13.28 | | | $ | 11.69 | | | $ | 13.49 | | | $ | 12.63 | |
| | | | | | | | | | | | | | | | | | | | | | | | |
| | | | | | |
Net investment income(a) | | | | | | | 0.23 | | | | 0.24 | | | | 0.34 | | | | 0.33 | | | | 0.27 | |
Net realized and unrealized gain (loss) | | | | | | | 1.07 | | | | 1.47 | | | | 1.96 | | | | (0.91 | ) | | | 1.69 | |
| | | | | | | | | | | | | | | | | | | | | | | | |
| | | | | | |
Net increase (decrease) from investment operations | | | | | | | 1.30 | | | | 1.71 | | | | 2.30 | | | | (0.58 | ) | | | 1.96 | |
| | | | | | | | | | | | | | | | | | | | | | | | |
| | | | | | |
Distributions(b) | | | | | | | | | | | | | | | | | | | | | | | | |
From net investment income | | | | | | | (0.62 | ) | | | (0.29 | ) | | | (0.30 | ) | | | (0.37 | ) | | | (0.24 | ) |
From net realized gain | | | | | | | (0.99 | ) | | | (0.13 | ) | | | (0.41 | ) | | | (0.85 | ) | | | (0.86 | ) |
| | | | | | | | | | | | | | | | | | | | | | | | |
| | | | | | |
Total distributions | | | | | | | (1.61 | ) | | | (0.42 | ) | | | (0.71 | ) | | | (1.22 | ) | | | (1.10 | ) |
| | | | | | | | | | | | | | | | | | | | | | | | |
| | | | | | |
Net asset value, end of year | | | | | | $ | 14.26 | | | $ | 14.57 | | | $ | 13.28 | | | $ | 11.69 | | | $ | 13.49 | |
| | | | | | | | | | | | | | | | | | | | | | | | |
| | | | | | |
Total Return(c) | | | | | | | | | | | | | | | | | | | | | | | | |
Based on net asset value | | | | | | | 9.05 | % | | | 13.17 | % | | | 19.72 | % | | | (4.43 | )% | | | 15.75 | % |
| | | | | | | | | | | | | | | | | | | | | | | | |
| | | | | | |
Ratios to Average Net Assets(d) | | | | | | | | | | | | | | | | | | | | | | | | |
Total expenses | | | | | | | 0.55 | % | | | 0.52 | % | | | 0.37 | % | | | 0.38 | % | | | 0.36 | % |
| | | | | | | | | | | | | | | | | | | | | | | | |
| | | | | | |
Total expenses after fees waived and/or reimbursed | | | | | | | 0.29 | % | | | 0.31 | % | | | 0.35 | % | | | 0.36 | % | | | 0.34 | % |
| | | | | | | | | | | | | | | | | | | | | | | | |
| | | | | | |
Net investment income | | | | | | | 1.55 | % | | | 1.84 | % | | | 2.62 | % | | | 2.44 | % | | | 2.01 | % |
| | | | | | | | | | | | | | | | | | | | | | | | |
| | | | | | |
Supplemental Data | | | | | | | | | | | | | | | | | | | | | | | | |
Net assets, end of year (000) | | | | | | $ | 75,927 | | | $ | 59,727 | | | $ | 34,027 | | | $ | 9,062 | | | $ | 7,919 | |
| | | | | | | | | | | | | | | | | | | | | | | | |
| | | | | | |
Portfolio turnover rate | | | | | | | 6 | %(e) | | | 45 | %(f) | | | 35 | %(g) | | | 38 | %(g) | | | 32 | %(g) |
| | | | | | | | | | | | | | | | | | | | | | | | |
| (a) | Based on average shares outstanding. |
| (b) | Distributions for annual periods determined in accordance with U.S. federal income tax regulations. |
| (c) | Where applicable, assumes the reinvestment of distributions. |
| (d) | Excludes fees and expenses incurred indirectly as a result of investments in underlying funds. |
| (e) | Includes the purchases and sales of the underlying funds and the Underlying Master Portfolios. |
| (f) | From January 1, 2020 through March 8, 2020, the rate includes the LifePath Dynamic Master Portfolio’s purchases and sales of the underlying funds and the Underlying Master Portfolios. Beginning March 9, 2020, the rate includes the LifePath Dynamic Fund’s purchases and sales of the underlying funds and the Underlying Master Portfolios. |
| (g) | Includes the LifePath Dynamic Master Portfolio’s purchases and sales of the underlying funds and Diversified Equity Master Portfolio, Advantage CoreAlpha Bond Master Portfolio, International Tilts Master Portfolio, Large Cap Index Master Portfolio, Master Small Cap Index Series and Master Total Return Portfolio. |
See notes to financial statements.
Financial Highlights (continued)
(For a share outstanding throughout each period)
| | | | | | | | | | | | | | | | | | | | | | | | |
| | | | | | BlackRock LifePath® Dynamic 2025 Fund (continued) | |
| | |
| | | | | | Class R | |
| | |
| | | | | | Year Ended December 31, | |
| | | | | | |
| | | | | | 2021 | | | 2020 | | | 2019 | | | 2018 | | | 2017 | |
| | | | | | |
Net asset value, beginning of year | | | | | | $ | 14.56 | | | $ | 13.26 | | | $ | 11.68 | | | $ | 13.49 | | | $ | 12.63 | |
| | | | | | | | | | | | | | | | | | | | | | | | |
| | | | | | |
Net investment income(a) | | | | | | | 0.13 | | | | 0.14 | | | | 0.24 | | | | 0.24 | | | | 0.17 | |
Net realized and unrealized gain (loss) | | | | | | | 1.07 | | | | 1.48 | | | | 1.97 | | | | (0.92 | ) | | | 1.71 | |
| | | | | | | | | | | | | | | | | | | | | | | | |
| | | | | | |
Net increase (decrease) from investment operations | | | | | | | 1.20 | | | | 1.62 | | | | 2.21 | | | | (0.68 | ) | | | 1.88 | |
| | | | | | | | | | | | | | | | | | | | | | | | |
| | | | | | |
Distributions(b) | | | | | | | | | | | | | | | | | | | | | | | | |
From net investment income | | | | | | | (0.52 | ) | | | (0.19 | ) | | | (0.22 | ) | | | (0.28 | ) | | | (0.16 | ) |
From net realized gain | | | | | | | (0.99 | ) | | | (0.13 | ) | | | (0.41 | ) | | | (0.85 | ) | | | (0.86 | ) |
| | | | | | | | | | | | | | | | | | | | | | | | |
| | | | | | |
Total distributions | | | | | | | (1.51 | ) | | | (0.32 | ) | | | (0.63 | ) | | | (1.13 | ) | | | (1.02 | ) |
| | | | | | | | | | | | | | | | | | | | | | | | |
| | | | | | |
Net asset value, end of year | | | | | | $ | 14.25 | | | $ | 14.56 | | | $ | 13.26 | | | $ | 11.68 | | | $ | 13.49 | |
| | | | | | | | | | | | | | | | | | | | | | | | |
| | | | | | |
Total Return(c) | | | | | | | | | | | | | | | | | | | | | | | | |
Based on net asset value | | | | | | | 8.30 | % | | | 12.44 | % | | | 18.91 | % | | | (5.10 | )% | | | 15.02 | % |
| | | | | | | | | | | | | | | | | | | | | | | | |
| | | | | | |
Ratios to Average Net Assets(d) | | | | | | | | | | | | | | | | | | | | | | | | |
Total expenses | | | | | | | 1.25 | % | | | 1.20 | % | | | 1.02 | % | | | 1.03 | % | | | 1.01 | % |
| | | | | | | | | | | | | | | | | | | | | | | | |
| | | | | | |
Total expenses after fees waived and/or reimbursed | | | | | | | 0.99 | % | | | 1.00 | % | | | 1.00 | % | | | 1.01 | % | | | 0.99 | % |
| | | | | | | | | | | | | | | | | | | | | | | | |
| | | | | | |
Net investment income | | | | | | | 0.85 | % | | | 1.05 | % | | | 1.82 | % | | | 1.77 | % | | | 1.27 | % |
| | | | | | | | | | | | | | | | | | | | | | | | |
| | | | | | |
Supplemental Data | | | | | | | | | | | | | | | | | | | | | | | | |
Net assets, end of year (000) | | | | | | $ | 3,875 | | | $ | 3,559 | | | $ | 5,479 | | | $ | 5,003 | | | $ | 4,308 | |
| | | | | | | | | | | | | | | | | | | | | | | | |
| | | | | | |
Portfolio turnover rate | | | | | | | 6 | %(e) | | | 45 | %(f) | | | 35 | %(g) | | | 38 | %(g) | | | 32 | %(g) |
| | | | | | | | | | | | | | | | | | | | | | | | |
| (a) | Based on average shares outstanding. |
| (b) | Distributions for annual periods determined in accordance with U.S. federal income tax regulations. |
| (c) | Where applicable, assumes the reinvestment of distributions. |
| (d) | Excludes fees and expenses incurred indirectly as a result of investments in underlying funds. |
| (e) | Includes the purchases and sales of the underlying funds and the Underlying Master Portfolios. |
| (f) | From January 1, 2020 through March 8, 2020, the rate includes the LifePath Dynamic Master Portfolio’s purchases and sales of the underlying funds and the Underlying Master Portfolios. Beginning March 9, 2020, the rate includes the LifePath Dynamic Fund’s purchases and sales of the underlying funds and the Underlying Master Portfolios. |
| (g) | Includes the LifePath Dynamic Master Portfolio’s purchases and sales of the underlying funds and Diversified Equity Master Portfolio, Advantage CoreAlpha Bond Master Portfolio, International Tilts Master Portfolio, Large Cap Index Master Portfolio, Master Small Cap Index Series and Master Total Return Portfolio. |
See notes to financial statements.
| | |
| 100 | | 2 0 2 1 BLACK ROCK ANNUAL REPORT TO SHAREHOLDERS |
Financial Highlights (continued)
(For a share outstanding throughout each period)
| | | | | | | | | | | | | | | | | | | | | | | | |
| | | | | | BlackRock LifePath® Dynamic 2030 Fund | |
| | |
| | | | | | Institutional | |
| | |
| | | | | | Year Ended December 31, | |
| | | | | | |
| | | | | | 2021 | | | 2020 | | | 2019 | | | 2018 | | | 2017 | |
| | | | | | |
Net asset value, beginning of year | | | | | | $ | 14.80 | | | $ | 13.65 | | | $ | 11.90 | | | $ | 14.26 | | | $ | 13.79 | |
| | | | | | | | | | | | | | | | | | | | | | | | |
| | | | | | |
Net investment income(a) | | | | | | | 0.19 | | | | 0.20 | | | | 0.29 | | | | 0.29 | | | | 0.24 | |
Net realized and unrealized gain (loss) | | | | | | | 1.48 | | | | 1.52 | | | | 2.32 | | | | (1.04 | ) | | | 2.13 | |
| | | | | | | | | | | | | | | | | | | | | | | | |
| | | | | | |
Net increase (decrease) from investment operations | | | | | | | 1.67 | | | | 1.72 | | | | 2.61 | | | | (0.75 | ) | | | 2.37 | |
| | | | | | | | | | | | | | | | | | | | | | | | |
| | | | | | |
Distributions(b) | | | | | | | | | | | | | | | | | | | | | | | | |
From net investment income | | | | | | | (0.75 | ) | | | (0.23 | ) | | | (0.30 | ) | | | (0.31 | ) | | | (0.25 | ) |
From net realized gain | | | | | | | (1.62 | ) | | | (0.34 | ) | | | (0.56 | ) | | | (1.30 | ) | | | (1.65 | ) |
| | | | | | | | | | | | | | | | | | | | | | | | |
| | | | | | |
Total distributions | | | | | | | (2.37 | ) | | | (0.57 | ) | | | (0.86 | ) | | | (1.61 | ) | | | (1.90 | ) |
| | | | | | | | | | | | | | | | | | | | | | | | |
| | | | | | |
Net asset value, end of year | | | | | | $ | 14.10 | | | $ | 14.80 | | | $ | 13.65 | | | $ | 11.90 | | | $ | 14.26 | |
| | | | | | | | | | | | | | | | | | | | | | | | |
| | | | | | |
Total Return(c) | | | | | | | | | | | | | | | | | | | | | | | | |
Based on net asset value | | | | | | | 11.46 | % | | | 13.05 | % | | | 22.07 | % | | | (5.48 | )% | | | 17.67 | % |
| | | | | | | | | | | | | | | | | | | | | | | | |
| | | | | | |
Ratios to Average Net Assets(d) | | | | | | | | | | | | | | | | | | | | | | | | |
Total expenses | | | | | | | 0.79 | % | | | 0.75 | % | | | 0.56 | % | | | 0.56 | % | | | 0.55 | % |
| | | | | | | | | | | | | | | | | | | | | | | | |
| | | | | | |
Total expenses after fees waived and/or reimbursed | | | | | | | 0.53 | % | | | 0.54 | % | | | 0.55 | % | | | 0.56 | % | | | 0.55 | % |
| | | | | | | | | | | | | | | | | | | | | | | | |
| | | | | | |
Net investment income | | | | | | | 1.25 | % | | | 1.51 | % | | | 2.18 | % | | | 2.01 | % | | | 1.64 | % |
| | | | | | | | | | | | | | | | | | | | | | | | |
| | | | | | |
Supplemental Data | | | | | | | | | | | | | | | | | | | | | | | | |
Net assets, end of year (000) | | | | | | $ | 55,606 | | | $ | 58,905 | | | $ | 73,530 | | | $ | 59,749 | | | $ | 90,086 | |
| | | | | | | | | | | | | | | | | | | | | | | | |
| | | | | | |
Portfolio turnover rate | | | | | | | 5 | %(e) | | | 38 | %(f) | | | 32 | %(g) | | | 29 | %(g) | | | 21 | %(g) |
| | | | | | | | | | | | | | | | | | | | | | | | |
| (a) | Based on average shares outstanding. |
| (b) | Distributions for annual periods determined in accordance with U.S. federal income tax regulations. |
| (c) | Where applicable, assumes the reinvestment of distributions. |
| (d) | Excludes fees and expenses incurred indirectly as a result of investments in underlying funds. |
| (e) | Includes the purchases and sales of the underlying funds and the Underlying Master Portfolios. |
| (f) | From January 1, 2020 through March 8, 2020, the rate includes the LifePath Dynamic Master Portfolio’s purchases and sales of the underlying funds and the Underlying Master Portfolios. Beginning March 9, 2020, the rate includes the LifePath Dynamic Fund’s purchases and sales of the underlying funds and the Underlying Master Portfolios. |
| (g) | Includes the LifePath Dynamic Master Portfolio’s purchases and sales of the underlying funds and Diversified Equity Master Portfolio, Advantage CoreAlpha Bond Master Portfolio, International Tilts Master Portfolio and Master Total Return Portfolio. |
See notes to financial statements.
Financial Highlights (continued)
(For a share outstanding throughout each period)
| | | | | | | | | | | | | | | | | | | | | | | | |
| | | | | | BlackRock LifePath® Dynamic 2030 Fund (continued) | |
| | |
| | | | | | Investor A | |
| | |
| | | | | | Year Ended December 31, | |
| | | | | | |
| | | | | | 2021 | | | 2020 | | | 2019 | | | 2018 | | | 2017 | |
| | | | | | |
Net asset value, beginning of year | | | | | | $ | 14.09 | | | $ | 13.02 | | | $ | 11.39 | | | $ | 13.72 | | | $ | 13.33 | |
| | | | | | | | | | | | | | | | | | | | | | | | |
| | | | | | |
Net investment income(a) | | | | | | | 0.15 | | | | 0.16 | | | | 0.24 | | | | 0.25 | | | | 0.20 | |
Net realized and unrealized gain (loss) | | | | | | | 1.40 | | | | 1.45 | | | | 2.22 | | | | (1.00 | ) | | | 2.06 | |
| | | | | | | | | | | | | | | | | | | | | | | | |
| | | | | | |
Net increase (decrease) from investment operations | | | | | | | 1.55 | | | | 1.61 | | | | 2.46 | | | | (0.75 | ) | | | 2.26 | |
| | | | | | | | | | | | | | | | | | | | | | | | |
| | | | | | |
Distributions(b) | | | | | | | | | | | | | | | | | | | | | | | | |
From net investment income | | | | | | | (0.72 | ) | | | (0.20 | ) | | | (0.27 | ) | | | (0.28 | ) | | | (0.22 | ) |
From net realized gain | | | | | | | (1.62 | ) | | | (0.34 | ) | | | (0.56 | ) | | | (1.30 | ) | | | (1.65 | ) |
| | | | | | | | | | | | | | | | | | | | | | | | |
| | | | | | |
Total distributions | | | | | | | (2.34 | ) | | | (0.54 | ) | | | (0.83 | ) | | | (1.58 | ) | | | (1.87 | ) |
| | | | | | | | | | | | | | | | | | | | | | | | |
| | | | | | |
Net asset value, end of year | | | | | | $ | 13.30 | | | $ | 14.09 | | | $ | 13.02 | | | $ | 11.39 | | | $ | 13.72 | |
| | | | | | | | | | | | | | | | | | | | | | | | |
| | | | | | |
Total Return(c) | | | | | | | | | | | | | | | | | | | | | | | | |
Based on net asset value | | | | | | | 11.13 | % | | | 12.79 | % | | | 21.72 | % | | | (5.69 | )% | | | 17.43 | % |
| | | | | | | | | | | | | | | | | | | | | | | | |
| | | | | | |
Ratios to Average Net Assets(d) | | | | | | | | | | | | | | | | | | | | | | | | |
Total expenses | | | | | | | 1.04 | % | | | 1.00 | % | | | 0.81 | % | | | 0.81 | % | | | 0.80 | % |
| | | | | | | | | | | | | | | | | | | | | | | | |
| | | | | | |
Total expenses after fees waived and/or reimbursed | | | | | | | 0.78 | % | | | 0.79 | % | | | 0.80 | % | | | 0.81 | % | | | 0.80 | % |
| | | | | | | | | | | | | | | | | | | | | | | | |
| | | | | | |
Net investment income | | | | | | | 1.00 | % | | | 1.24 | % | | | 1.89 | % | | | 1.80 | % | | | 1.44 | % |
| | | | | | | | | | | | | | | | | | | | | | | | |
| | | | | | |
Supplemental Data | | | | | | | | | | | | | | | | | | | | | | | | |
Net assets, end of year (000) | | | | | | $ | 172,296 | | | $ | 183,497 | | | $ | 212,100 | | | $ | 212,050 | | | $ | 265,932 | |
| | | | | | | | | | | | | | | | | | | | | | | | |
| | | | | | |
Portfolio turnover rate | | | | | | | 5 | %(e) | | | 38 | %(f) | | | 32 | %(g) | | | 29 | %(g) | | | 21 | %(g) |
| | | | | | | | | | | | | | | | | | | | | | | | |
| (a) | Based on average shares outstanding. |
| (b) | Distributions for annual periods determined in accordance with U.S. federal income tax regulations. |
| (c) | Where applicable, excludes the effects of any sales charges and assumes the reinvestment of distributions. |
| (d) | Excludes fees and expenses incurred indirectly as a result of investments in underlying funds. |
| (e) | Includes the purchases and sales of the underlying funds and the Underlying Master Portfolios. |
| (f) | From January 1, 2020 through March 8, 2020, the rate includes the LifePath Dynamic Master Portfolio’s purchases and sales of the underlying funds and the Underlying Master Portfolios. Beginning March 9, 2020, the rate includes the LifePath Dynamic Fund’s purchases and sales of the underlying funds and the Underlying Master Portfolios. |
| (g) | Includes the LifePath Dynamic Master Portfolio’s purchases and sales of the underlying funds and Diversified Equity Master Portfolio, Advantage CoreAlpha Bond Master Portfolio, International Tilts Master Portfolio and Master Total Return Portfolio. |
See notes to financial statements.
| | |
| 102 | | 2 0 2 1 BLACK ROCK ANNUAL REPORT TO SHAREHOLDERS |
Financial Highlights (continued)
(For a share outstanding throughout each period)
| | | | | | | | | | | | | | | | | | | | | | | | |
| | | | | | BlackRock LifePath® Dynamic 2030 Fund (continued) | |
| | |
| | | | | | Investor C | |
| | |
| | | | | | Year Ended December 31, | |
| | | | | | |
| | | | | | 2021 | | | 2020 | | | 2019 | | | 2018 | | | 2017 | |
| | | | | | |
Net asset value, beginning of year | | | | | | $ | 14.47 | | | $ | 13.34 | | | $ | 11.65 | | | $ | 14.01 | | | $ | 13.58 | |
| | | | | | | | | | | | | | | | | | | | | | | | |
| | | | | | |
Net investment income(a) | | | | | | | 0.04 | | | | 0.06 | | | | 0.14 | | | | 0.15 | | | | 0.10 | |
Net realized and unrealized gain (loss) | | | | | | | 1.43 | | | | 1.50 | | | | 2.27 | | | | (1.04 | ) | | | 2.08 | |
| | | | | | | | | | | | | | | | | | | | | | | | |
| | | | | | |
Net increase (decrease) from investment operations | | | | | | | 1.47 | | | | 1.56 | | | | 2.41 | | | | (0.89 | ) | | | 2.18 | |
| | | | | | | | | | | | | | | | | | | | | | | | |
| | | | | | |
Distributions(b) | | | | | | | | | | | | | | | | | | | | | | | | |
From net investment income | | | | | | | (0.61 | ) | | | (0.09 | ) | | | (0.16 | ) | | | (0.17 | ) | | | (0.10 | ) |
From net realized gain | | | | | | | (1.62 | ) | | | (0.34 | ) | | | (0.56 | ) | | | (1.30 | ) | | | (1.65 | ) |
| | | | | | | | | | | | | | | | | | | | | | | | |
| | | | | | |
Total distributions | | | | | | | (2.23 | ) | | | (0.43 | ) | | | (0.72 | ) | | | (1.47 | ) | | | (1.75 | ) |
| | | | | | | | | | | | | | | | | | | | | | | | |
| | | | | | |
Net asset value, end of year | | | | | | $ | 13.71 | | | $ | 14.47 | | | $ | 13.34 | | | $ | 11.65 | | | $ | 14.01 | |
| | | | | | | | | | | | | | | | | | | | | | | | |
| | | | | | |
Total Return(c) | | | | | | | | | | | | | | | | | | | | | | | | |
| | | | | | |
Based on net asset value | | | | | | | 10.29 | % | | | 12.00 | % | | | 20.76 | % | | | (6.53 | )% | | | 16.48 | % |
| | | | | | | | | | | | | | | | | | | | | | | | |
| | | | | | |
Ratios to Average Net Assets(d) | | | | | | | | | | | | | | | | | | | | | | | | |
Total expenses | | | | | | | 1.79 | % | | | 1.76 | % | | | 1.61 | % | | | 1.61 | % | | | 1.60 | % |
| | | | | | | | | | | | | | | | | | | | | | | | |
| | | | | | |
Total expenses after fees waived and/or reimbursed | | | | | | | 1.53 | % | | | 1.55 | % | | | 1.60 | % | | | 1.61 | % | | | 1.60 | % |
| | | | | | | | | | | | | | | | | | | | | | | | |
| | | | | | |
Net investment income | | | | | | | 0.23 | % | | | 0.44 | % | | | 1.08 | % | | | 1.05 | % | | | 0.67 | % |
| | | | | | | | | | | | | | | | | | | | | | | | |
| | | | | | |
Supplemental Data | | | | | | | | | | | | | | | | | | | | | | | | |
Net assets, end of year (000) | | | | | | $ | 2,698 | | | $ | 2,925 | | | $ | 3,746 | | | $ | 4,117 | | | $ | 3,888 | |
| | | | | | | | | | | | | | | | | | | | | | | | |
| | | | | | |
Portfolio turnover rate | | | | | | | 5 | %(e) | | | 38 | %(f) | | | 32 | %(g) | | | 29 | %(g) | | | 21 | %(g) |
| | | | | | | | | | | | | | | | | | | | | | | | |
| (a) | Based on average shares outstanding. |
| (b) | Distributions for annual periods determined in accordance with U.S. federal income tax regulations. |
| (c) | Where applicable, excludes the effects of any sales charges and assumes the reinvestment of distributions. |
| (d) | Excludes fees and expenses incurred indirectly as a result of investments in underlying funds. |
| (e) | Includes the purchases and sales of the underlying funds and the Underlying Master Portfolios. |
| (f) | From January 1, 2020 through March 8, 2020, the rate includes the LifePath Dynamic Master Portfolio’s purchases and sales of the underlying funds and the Underlying Master Portfolios. Beginning March 9, 2020, the rate includes the LifePath Dynamic Fund’s purchases and sales of the underlying funds and the Underlying Master Portfolios. |
| (g) | Includes the LifePath Dynamic Master Portfolio’s purchases and sales of the underlying funds and Diversified Equity Master Portfolio, Advantage CoreAlpha Bond Master Portfolio, International Tilts Master Portfolio and Master Total Return Portfolio. |
See notes to financial statements.
Financial Highlights (continued)
(For a share outstanding throughout each period)
| | | | | | | | | | | | | | | | | | | | | | |
| | | BlackRock LifePath® Dynamic 2030 Fund (continued) | |
| |
| | | Class K | |
| |
| | | Year Ended December 31, | |
| | | | | | |
| | | | | 2021 | | | 2020 | | | 2019 | | | 2018 | | | 2017 | |
| | | | | | | |
Net asset value, beginning of year | | | | $ | 14.77 | | | $ | 13.62 | | | $ | 11.88 | | | $ | 14.24 | | | $ | 13.77 | |
| | | | | | | | | | | | | | | | | | | | | | |
| | | | | | |
Net investment income(a) | | | | | 0.24 | | | | 0.23 | | | | 0.34 | | | | 0.32 | | | | 0.28 | |
Net realized and unrealized gain (loss) | | | | | 1.46 | | | | 1.52 | | | | 2.29 | | | | (1.04 | ) | | | 2.12 | |
| | | | | | | | | | | | | | | | | | | | | | |
| | | | | | |
Net increase (decrease) from investment operations | | | | | 1.70 | | | | 1.75 | | | | 2.63 | | | | (0.72 | ) | | | 2.40 | |
| | | | | | | | | | | | | | | | | | | | | | |
| | | | | | |
Distributions(b) | | | | | | | | | | | | | | | | | | | | | | |
From net investment income | | | | | (0.79 | ) | | | (0.26 | ) | | | (0.33 | ) | | | (0.34 | ) | | | (0.28 | ) |
From net realized gain | | | | | (1.62 | ) | | | (0.34 | ) | | | (0.56 | ) | | | (1.30 | ) | | | (1.65 | ) |
| | | | | | | | | | | | | | | | | | | | | | |
| | | | | | |
Total distributions | | | | | (2.41 | ) | | | (0.60 | ) | | | (0.89 | ) | | | (1.64 | ) | | | (1.93 | ) |
| | | | | | | | | | | | | | | | | | | | | | |
| | | | | | |
Net asset value, end of year | | | | $ | 14.06 | | | $ | 14.77 | | | $ | 13.62 | | | $ | 11.88 | | | $ | 14.24 | |
| | | | | | | | | | | | | | | | | | | | | | |
| | | | | | |
Total Return(c) | | | | | | | | | | | | | | | | | | | | | | |
Based on net asset value | | | | | 11.70 | % | | | 13.36 | % | | | 22.27 | % | | | (5.28 | )% | | | 17.96 | % |
| | | | | | | | | | | | | | | | | | | | | | |
| | | | | | |
Ratios to Average Net Assets(d) | | | | | | | | | | | | | | | | | | | | | | |
Total expenses | | | | | 0.54 | % | | | 0.51 | % | | | 0.36 | % | | | 0.36 | % | | | 0.35 | % |
| | | | | | | | | | | | | | | | | | | | | | |
| | | | | | |
Total expenses after fees waived and/or reimbursed | | | | | 0.28 | % | | | 0.30 | % | | | 0.36 | % | | | 0.36 | % | | | 0.35 | % |
| | | | | | | | | | | | | | | | | | | | | | |
| | | | | | |
Net investment income | | | | | 1.54 | % | | | 1.73 | % | | | 2.52 | % | | | 2.27 | % | | | 1.91 | % |
| | | | | | | | | | | | | | | | | | | | | | |
| | | | | | |
Supplemental Data | | | | | | | | | | | | | | | | | | | | | | |
Net assets, end of year (000) | | | | $ | 100,750 | | | $ | 77,510 | | | $ | 56,168 | | | $ | 28,121 | | | $ | 33,881 | |
| | | | | | | | | | | | | | | | | | | | | | |
| | | | | | |
Portfolio turnover rate | | | | | 5 | %(e) | | | 38 | %(f) | | | 32 | %(g) | | | 29 | %(g) | | | 21 | %(g) |
| | | | | | | | | | | | | | | | | | | | | | |
| (a) | Based on average shares outstanding. |
| (b) | Distributions for annual periods determined in accordance with U.S. federal income tax regulations. |
| (c) | Where applicable, assumes the reinvestment of distributions. |
| (d) | Excludes fees and expenses incurred indirectly as a result of investments in underlying funds. |
| (e) | Includes the purchases and sales of the underlying funds and the Underlying Master Portfolios. |
| (f) | From January 1, 2020 through March 8, 2020, the rate includes the LifePath Dynamic Master Portfolio’s purchases and sales of the underlying funds and the Underlying Master Portfolios. Beginning March 9, 2020, the rate includes the LifePath Dynamic Fund’s purchases and sales of the underlying funds and the Underlying Master Portfolios. |
| (g) | Includes the LifePath Dynamic Master Portfolio’s purchases and sales of the underlying funds and Diversified Equity Master Portfolio, Advantage CoreAlpha Bond Master Portfolio, International Tilts Master Portfolio and Master Total Return Portfolio. |
See notes to financial statements.
| | |
| 104 | | 2 0 2 1 BLACK ROCK ANNUAL REPORT TO SHAREHOLDERS |
Financial Highlights (continued)
(For a share outstanding throughout each period)
| | | | | | | | | | | | | | | | | | | | | | |
| | | BlackRock LifePath® Dynamic 2030 Fund (continued) | |
| |
| | | Class R | |
| |
| | | Year Ended December 31, | |
| | | | | | |
| | | | | 2021 | | | 2020 | | | 2019 | | | 2018 | | | 2017 | |
| | | | | | | |
Net asset value, beginning of year | | | | $ | 14.59 | | | $ | 13.46 | | | $ | 11.76 | | | $ | 14.12 | | | $ | 13.67 | |
| | | | | | | | | | | | | | | | | | | | | | |
| | | | | | |
Net investment income(a) | | | | | 0.13 | | | | 0.14 | | | | 0.24 | | | | 0.24 | | | | 0.18 | |
Net realized and unrealized gain (loss) | | | | | 1.45 | | | | 1.50 | | | | 2.27 | | | | (1.05 | ) | | | 2.10 | |
| | | | | | | | | | | | | | | | | | | | | | |
| | | | | | |
Net increase (decrease) from investment operations | | | | | 1.58 | | | | 1.64 | | | | 2.51 | | | | (0.81 | ) | | | 2.28 | |
| | | | | | | | | | | | | | | | | | | | | | |
| | | | | | |
Distributions(b) | | | | | | | | | | | | | | | | | | | | | | |
From net investment income | | | | | (0.69 | ) | | | (0.17 | ) | | | (0.25 | ) | | | (0.25 | ) | | | (0.18 | ) |
From net realized gain | | | | | (1.62 | ) | | | (0.34 | ) | | | (0.56 | ) | | | (1.30 | ) | | | (1.65 | ) |
| | | | | | | | | | | | | | | | | | | | | | |
| | | | | | |
Total distributions | | | | | (2.31 | ) | | | (0.51 | ) | | | (0.81 | ) | | | (1.55 | ) | | | (1.83 | ) |
| | | | | | | | | | | | | | | | | | | | | | |
| | | | | | |
Net asset value, end of year | | | | $ | 13.86 | | | $ | 14.59 | | | $ | 13.46 | | | $ | 11.76 | | | $ | 14.12 | |
| | | | | | | | | | | | | | | | | | | | | | |
| | | | | | |
Total Return(c) | | | | | | | | | | | | | | | | | | | | | | |
Based on net asset value | | | | | 10.93 | % | | | 12.58 | % | | | 21.44 | % | | | (5.92 | )% | | | 17.16 | % |
| | | | | | | | | | | | | | | | | | | | | | |
| | | | | | |
Ratios to Average Net Assets(d) | | | | | | | | | | | | | | | | | | | | | | |
Total expenses | | | | | 1.24 | % | | | 1.20 | % | | | 1.01 | % | | | 1.01 | % | | | 1.00 | % |
| | | | | | | | | | | | | | | | | | | | | | |
| | | | | | |
Total expenses after fees waived and/or reimbursed | | | | | 0.98 | % | | | 0.99 | % | | | 1.01 | % | | | 1.01 | % | | | 0.99 | % |
| | | | | | | | | | | | | | | | | | | | | | |
| | | | | | |
Net investment income | | | | | 0.84 | % | | | 1.10 | % | | | 1.78 | % | | | 1.70 | % | | | 1.21 | % |
| | | | | | | | | | | | | | | | | | | | | | |
| | | | | | |
Supplemental Data | | | | | | | | | | | | | | | | | | | | | | |
Net assets, end of year (000) | | | | $ | 5,389 | | | $ | 4,434 | | | $ | 4,646 | | | $ | 2,575 | | | $ | 2,169 | |
| | | | | | | | | | | | | | | | | | | | | | |
| | | | | | |
Portfolio turnover rate | | | | | 5 | %(e) | | | 38 | %(f) | | | 32 | %(g) | | | 29 | %(g) | | | 21 | %(g) |
| | | | | | | | | | | | | | | | | | | | | | |
| (a) | Based on average shares outstanding. |
| (b) | Distributions for annual periods determined in accordance with U.S. federal income tax regulations. |
| (c) | Where applicable, assumes the reinvestment of distributions. |
| (d) | Excludes fees and expenses incurred indirectly as a result of investments in underlying funds. |
| (e) | Includes the purchases and sales of the underlying funds and the Underlying Master Portfolios. |
| (f) | From January 1, 2020 through March 8, 2020, the rate includes the LifePath Dynamic Master Portfolio’s purchases and sales of the underlying funds and the Underlying Master Portfolios. Beginning March 9, 2020, the rate includes the LifePath Dynamic Fund’s purchases and sales of the underlying funds and the Underlying Master Portfolios. |
| (g) | Includes the LifePath Dynamic Master Portfolio’s purchases and sales of the underlying funds and Diversified Equity Master Portfolio, Advantage CoreAlpha Bond Master Portfolio, International Tilts Master Portfolio and Master Total Return Portfolio. |
See notes to financial statements.
Financial Highlights (continued)
(For a share outstanding throughout each period)
| | | | | | | | | | | | | | | | | | | | | | |
| | | BlackRock LifePath® Dynamic 2035 Fund | |
| |
| | | Institutional | |
| |
| | | Year Ended December 31, | |
| | | | | | |
| | | | | 2021 | | | 2020 | | | 2019 | | | 2018 | | | 2017 | |
| | | | | | | |
Net asset value, beginning of year | | | | $ | 15.92 | | | $ | 14.34 | | | $ | 12.21 | | | $ | 14.48 | | | $ | 13.28 | |
| | | | | | | | | | | | | | | | | | | | | | |
| | | | | | |
Net investment income(a) | | | | | 0.20 | | | | 0.22 | | | | 0.30 | | | | 0.25 | | | | 0.22 | |
Net realized and unrealized gain (loss) | | | | | 1.97 | | | | 1.71 | | | | 2.58 | | | | (1.15 | ) | | | 2.34 | |
| | | | | | | | | | | | | | | | | | | | | | |
| | | | | | |
Net increase (decrease) from investment operations | | | | | 2.17 | | | | 1.93 | | | | 2.88 | | | | (0.90 | ) | | | 2.56 | |
| | | | | | | | | | | | | | | | | | | | | | |
| | | | | | |
Distributions(b) | | | | | | | | | | | | | | | | | | | | | | |
From net investment income | | | | | (0.85 | ) | | | (0.23 | ) | | | (0.30 | ) | | | (0.27 | ) | | | (0.26 | ) |
From net realized gain | | | | | (1.11 | ) | | | (0.12 | ) | | | (0.45 | ) | | | (1.10 | ) | | | (1.10 | ) |
| | | | | | | | | | | | | | | | | | | | | | |
| | | | | | |
Total distributions | | | | | (1.96 | ) | | | (0.35 | ) | | | (0.75 | ) | | | (1.37 | ) | | | (1.36 | ) |
| | | | | | | | | | | | | | | | | | | | | | |
| | | | | | |
Net asset value, end of year | | | | $ | 16.13 | | | $ | 15.92 | | | $ | 14.34 | | | $ | 12.21 | | | $ | 14.48 | |
| | | | | | | | | | | | | | | | | | | | | | |
| | | | | | |
Total Return(c) | | | | | | | | | | | | | | | | | | | | | | |
Based on net asset value | | | | | 13.76 | % | | | 13.82 | % | | | 23.66 | % | | | (6.42 | )% | | | 19.51 | % |
| | | | | | | | | | | | | | | | | | | | | | |
| | | | | | |
Ratios to Average Net Assets(d) | | | | | | | | | | | | | | | | | | | | | | |
Total expenses | | | | | 0.82 | % | | | 0.80 | % | | | 0.57 | % | | | 0.57 | % | | | 0.56 | % |
| | | | | | | | | | | | | | | | | | | | | | |
| | | | | | |
Total expenses after fees waived and/or reimbursed | | | | | 0.52 | % | | | 0.54 | % | | | 0.55 | % | | | 0.55 | % | | | 0.53 | % |
| | | | | | | | | | | | | | | | | | | | | | |
| | | | | | |
Net investment income | | | | | 1.19 | % | | | 1.55 | % | | | 2.20 | % | | | 1.71 | % | | | 1.54 | % |
| | | | | | | | | | | | | | | | | | | | | | |
| | | | | | |
Supplemental Data | | | | | | | | | | | | | | | | | | | | | | |
Net assets, end of year (000) | | | | $ | 12,898 | | | $ | 11,677 | | | $ | 4,004 | | | $ | 2,231 | | | $ | 10,965 | |
| | | | | | | | | | | | | | | | | | | | | | |
| | | | | | |
Portfolio turnover rate | | | | | 3 | %(e) | | | 29 | %(f) | | | 42 | %(g) | | | 40 | %(g) | | | 35 | %(g) |
| | | | | | | | | | | | | | | | | | | | | | |
| (a) | Based on average shares outstanding. |
| (b) | Distributions for annual periods determined in accordance with U.S. federal income tax regulations. |
| (c) | Where applicable, assumes the reinvestment of distributions. |
| (d) | Excludes fees and expenses incurred indirectly as a result of investments in underlying funds. |
| (e) | Includes the purchases and sales of the underlying funds and the Underlying Master Portfolios. |
| (f) | From January 1, 2020 through March 8, 2020, the rate includes the LifePath Dynamic Master Portfolio’s purchases and sales of the underlying funds and the Underlying Master Portfolios. Beginning March 9, 2020, the rate includes the LifePath Dynamic Fund’s purchases and sales of the underlying funds and the Underlying Master Portfolios. |
| (g) | Includes the LifePath Dynamic Master Portfolio’s purchases and sales of the underlying funds and Diversified Equity Master Portfolio, Advantage CoreAlpha Bond Master Portfolio, International Tilts Master Portfolio, Large Cap Index Master Portfolio, Master Small Cap Index Series and Master Total Return Portfolio. |
See notes to financial statements.
| | |
| 106 | | 2 0 2 1 BLACK ROCK ANNUAL REPORT TO SHAREHOLDERS |
Financial Highlights (continued)
(For a share outstanding throughout each period)
| | | | | | | | | | | | | | | | | | | | | | |
| | | BlackRock LifePath® Dynamic 2035 Fund (continued) | |
| |
| | | Investor A | |
| |
| | | Year Ended December 31, | |
| | | | | | |
| | | | | 2021 | | | 2020 | | | 2019 | | | 2018 | | | 2017 | |
| | | | | | | |
Net asset value, beginning of year | | | | $ | 15.85 | | | $ | 14.27 | | | $ | 12.15 | | | $ | 14.46 | | | $ | 13.26 | |
| | | | | | | | | | | | | | | | | | | | | | |
| | | | | | |
Net investment income(a) | | | | | 0.16 | | | | 0.16 | | | | 0.25 | | | | 0.25 | | | | 0.20 | |
Net realized and unrealized gain (loss) | | | | | 1.96 | | | | 1.73 | | | | 2.58 | | | | (1.19 | ) | | | 2.33 | |
| | | | | | | | | | | | | | | | | | | | | | |
| | | | | | |
Net increase (decrease) from investment operations | | | | | 2.12 | | | | 1.89 | | | | 2.83 | | | | (0.94 | ) | | | 2.53 | |
| | | | | | | | | | | | | | | | | | | | | | |
| | | | | | |
Distributions(b) | | | | | | | | | | | | | | | | | | | | | | |
From net investment income | | | | | (0.81 | ) | | | (0.19 | ) | | | (0.26 | ) | | | (0.27 | ) | | | (0.23 | ) |
From net realized gain | | | | | (1.11 | ) | | | (0.12 | ) | | | (0.45 | ) | | | (1.10 | ) | | | (1.10 | ) |
| | | | | | | | | | | | | | | | | | | | | | |
| | | | | | |
Total distributions | | | | | (1.92 | ) | | | (0.31 | ) | | | (0.71 | ) | | | (1.37 | ) | | | (1.33 | ) |
| | | | | | | | | | | | | | | | | | | | | | |
| | | | | | |
Net asset value, end of year | | | | $ | 16.05 | | | $ | 15.85 | | | $ | 14.27 | | | $ | 12.15 | | | $ | 14.46 | |
| | | | | | | | | | | | | | | | | | | | | | |
| | | | | | |
Total Return(c) | | | | | | | | | | | | | | | | | | | | | | |
Based on net asset value | | | | | 13.46 | % | | | 13.55 | % | | | 23.37 | % | | | (6.69 | )% | | | 19.29 | % |
| | | | | | | | | | | | | | | | | | | | | | |
| | | | | | |
Ratios to Average Net Assets(d) | | | | | | | | | | | | | | | | | | | | | | |
Total expenses | | | | | 1.07 | % | | | 1.03 | % | | | 0.82 | % | | | 0.82 | % | | | 0.81 | % |
| | | | | | | | | | | | | | | | | | | | | | |
| | | | | | |
Total expenses after fees waived and/or reimbursed | | | | | 0.77 | % | | | 0.79 | % | | | 0.80 | % | | | 0.80 | % | | | 0.79 | % |
| | | | | | | | | | | | | | | | | | | | | | |
| | | | | | |
Net investment income | | | | | 0.93 | % | | | 1.18 | % | | | 1.85 | % | | | 1.75 | % | | | 1.38 | % |
| | | | | | | | | | | | | | | | | | | | | | |
| | | | | | |
Supplemental Data | | | | | | | | | | | | | | | | | | | | | | |
Net assets, end of year (000) | | | | $ | 26,304 | | | $ | 28,189 | | | $ | 28,656 | | | $ | 27,982 | | | $ | 32,083 | |
| | | | | | | | | | | | | | | | | | | | | | |
| | | | | | |
Portfolio turnover rate | | | | | 3 | %(e) | | | 29 | %(f) | | | 42 | %(g) | | | 40 | %(g) | | | 35 | %(g) |
| | | | | | | | | | | | | | | | | | | | | | |
| (a) | Based on average shares outstanding. |
| (b) | Distributions for annual periods determined in accordance with U.S. federal income tax regulations. |
| (c) | Where applicable, excludes the effects of any sales charges and assumes the reinvestment of distributions. |
| (d) | Excludes fees and expenses incurred indirectly as a result of investments in underlying funds. |
| (e) | Includes the purchases and sales of the underlying funds and the Underlying Master Portfolios. |
| (f) | From January 1, 2020 through March 8, 2020, the rate includes the LifePath Dynamic Master Portfolio’s purchases and sales of the underlying funds and the Underlying Master Portfolios. Beginning March 9, 2020, the rate includes the LifePath Dynamic Fund’s purchases and sales of the underlying funds and the Underlying Master Portfolios. |
| (g) | Includes the LifePath Dynamic Master Portfolio’s purchases and sales of the underlying funds and Diversified Equity Master Portfolio, Advantage CoreAlpha Bond Master Portfolio, International Tilts Master Portfolio, Large Cap Index Master Portfolio, Master Small Cap Index Series and Master Total Return Portfolio. |
See notes to financial statements.
Financial Highlights (continued)
(For a share outstanding throughout each period)
| | | | | | | | | | | | | | | | | | | | | | |
| | | BlackRock LifePath® Dynamic 2035 Fund (continued) | |
| |
| | | Investor C | |
| |
| | | Year Ended December 31, | |
| | | | | | |
| | | | | 2021 | | | 2020 | | | 2019 | | | 2018 | | | 2017 | |
| | | | | | | |
Net asset value, beginning of year | | | | $ | 15.67 | | | $ | 14.11 | | | $ | 12.02 | | | $ | 14.33 | | | $ | 13.15 | |
| | | | | | | | | | | | | | | | | | | | | | |
| | | | | | |
Net investment income(a) | | | | | 0.03 | | | | 0.06 | | | | 0.14 | | | | 0.14 | | | | 0.08 | |
Net realized and unrealized gain (loss) | | | | | 1.93 | | | | 1.70 | | | | 2.56 | | | | (1.19 | ) | | | 2.32 | |
| | | | | | | | | | | | | | | | | | | | | | |
| | | | | | |
Net increase (decrease) from investment operations | | | | | 1.96 | | | | 1.76 | | | | 2.70 | | | | (1.05 | ) | | | 2.40 | |
| | | | | | | | | | | | | | | | | | | | | | |
| | | | | | |
Distributions(b) | | | | | | | | | | | | | | | | | | | | | | |
From net investment income | | | | | (0.72 | ) | | | (0.08 | ) | | | (0.16 | ) | | | (0.16 | ) | | | (0.12 | ) |
From net realized gain | | | | | (1.11 | ) | | | (0.12 | ) | | | (0.45 | ) | | | (1.10 | ) | | | (1.10 | ) |
| | | | | | | | | | | | | | | | | | | | | | |
| | | | | | |
Total distributions | | | | | (1.83 | ) | | | (0.20 | ) | | | (0.61 | ) | | | (1.26 | ) | | | (1.22 | ) |
| | | | | | | | | | | | | | | | | | | | | | |
| | | | | | |
Net asset value, end of year | | | | $ | 15.80 | | | $ | 15.67 | | | $ | 14.11 | | | $ | 12.02 | | | $ | 14.33 | |
| | | | | | | | | | | | | | | | | | | | | | |
| | | | | | |
Total Return(c) | | | | | | | | | | | | | | | | | | | | | | |
Based on net asset value | | | | | 12.56 | % | | | 12.68 | % | | | 22.43 | % | | | (7.47 | )% | | | 18.41 | % |
| | | | | | | | | | | | | | | | | | | | | | |
| | | | | | |
Ratios to Average Net Assets(d) | | | | | | | | | | | | | | | | | | | | | | |
Total expenses | | | | | 1.82 | % | | | 1.79 | % | | | 1.62 | % | | | 1.62 | % | | | 1.61 | % |
| | | | | | | | | | | | | | | | | | | | | | |
| | | | | | |
Total expenses after fees waived and/or reimbursed | | | | | 1.52 | % | | | 1.55 | % | | | 1.60 | % | | | 1.60 | % | | | 1.59 | % |
| | | | | | | | | | | | | | | | | | | | | | |
| | | | | | |
Net investment income | | | | | 0.20 | % | | | 0.42 | % | | | 1.07 | % | | | 0.99 | % | | | 0.60 | % |
| | | | | | | | | | | | | | | | | | | | | | |
| | | | | | |
Supplemental Data | | | | | | | | | | | | | | | | | | | | | | |
Net assets, end of year (000) | | | | $ | 3,637 | | | $ | 3,123 | | | $ | 3,173 | | | $ | 2,609 | | | $ | 2,436 | |
| | | | | | | | | | | | | | | | | | | | | | |
| | | | | | |
Portfolio turnover rate | | | | | 3 | %(e) | | | 29 | %(f) | | | 42 | %(g) | | | 40 | %(g) | | | 35 | %(g) |
| | | | | | | | | | | | | | | | | | | | | | |
| (a) | Based on average shares outstanding. |
| (b) | Distributions for annual periods determined in accordance with U.S. federal income tax regulations. |
| (c) | Where applicable, excludes the effects of any sales charges and assumes the reinvestment of distributions. |
| (d) | Excludes fees and expenses incurred indirectly as a result of investments in underlying funds. |
| (e) | Includes the purchases and sales of the underlying funds and the Underlying Master Portfolios. |
| (f) | From January 1, 2020 through March 8, 2020, the rate includes the LifePath Dynamic Master Portfolio’s purchases and sales of the underlying funds and the Underlying Master Portfolios. Beginning March 9, 2020, the rate includes the LifePath Dynamic Fund’s purchases and sales of the underlying funds and the Underlying Master Portfolios. |
| (g) | Includes the LifePath Dynamic Master Portfolio’s purchases and sales of the underlying funds and Diversified Equity Master Portfolio, Advantage CoreAlpha Bond Master Portfolio, International Tilts Master Portfolio, Large Cap Index Master Portfolio, Master Small Cap Index Series and Master Total Return Portfolio. |
See notes to financial statements.
| | |
| 108 | | 2 0 2 1 BLACK ROCK ANNUAL REPORT TO SHAREHOLDERS |
Financial Highlights (continued)
(For a share outstanding throughout each period)
| | | | | | | | | | | | | | | | | | | | | | |
| | | BlackRock LifePath® Dynamic 2035 Fund (continued) | |
| |
| | | Class K | |
| |
| | | Year Ended December 31, | |
| | | | | | |
| | | | | 2021 | | | 2020 | | | 2019 | | | 2018 | | | 2017 | |
| | | | | | | |
Net asset value, beginning of year | | | | $ | 16.15 | | | $ | 14.53 | | | $ | 12.36 | | | $ | 14.68 | | | $ | 13.45 | |
| | | | | | | | | | | | | | | | | | | | | | |
| | | | | | |
Net investment income(a) | | | | | 0.25 | | | | 0.25 | | | | 0.37 | | | | 0.33 | | | | 0.28 | |
Net realized and unrealized gain (loss) | | | | | 1.99 | | | | 1.74 | | | | 2.58 | | | | (1.22 | ) | | | 2.34 | |
| | | | | | | | | | | | | | | | | | | | | | |
| | | | | | |
Net increase (decrease) from investment operations | | | | | 2.24 | | | | 1.99 | | | | 2.95 | | | | (0.89 | ) | | | 2.62 | |
| | | | | | | | | | | | | | | | | | | | | | |
| | | | | | |
Distributions(b) | | | | | | | | | | | | | | | | | | | | | | |
From net investment income | | | | | (0.90 | ) | | | (0.25 | ) | | | (0.33 | ) | | | (0.33 | ) | | | (0.29 | ) |
From net realized gain | | | | | (1.11 | ) | | | (0.12 | ) | | | (0.45 | ) | | | (1.10 | ) | | | (1.10 | ) |
| | | | | | | | | | | | | | | | | | | | | | |
| | | | | | |
Total distributions | | | | | (2.01 | ) | | | (0.37 | ) | | | (0.78 | ) | | | (1.43 | ) | | | (1.39 | ) |
| | | | | | | | | | | | | | | | | | | | | | |
| | | | | | |
Net asset value, end of year | | | | $ | 16.38 | | | $ | 16.15 | | | $ | 14.53 | | | $ | 12.36 | | | $ | 14.68 | |
| | | | | | | | | | | | | | | | | | | | | | |
| | | | | | |
Total Return(c) | | | | | | | | | | | | | | | | | | | | | | |
Based on net asset value | | | | | 13.96 | % | | | 14.14 | % | | | 23.92 | % | | | (6.23 | )% | | | 19.76 | % |
| | | | | | | | | | | | | | | | | | | | | | |
| | | | | | |
Ratios to Average Net Assets(d) | | | | | | | | | | | | | | | | | | | | | | |
Total expenses | | | | | 0.57 | % | | | 0.54 | % | | | 0.36 | % | | | 0.37 | % | | | 0.36 | % |
| | | | | | | | | | | | | | | | | | | | | | |
| | | | | | |
Total expenses after fees waived and/or reimbursed | | | | | 0.27 | % | | | 0.30 | % | | | 0.35 | % | | | 0.35 | % | | | 0.33 | % |
| | | | | | | | | | | | | | | | | | | | | | |
| | | | | | |
Net investment income | | | | | 1.47 | % | | | 1.77 | % | | | 2.63 | % | | | 2.25 | % | | | 1.92 | % |
| | | | | | | | | | | | | | | | | | | | | | |
| | | | | | |
Supplemental Data | | | | | | | | | | | | | | | | | | | | | | |
Net assets, end of year (000) | | | | $ | 95,154 | | | $ | 67,968 | | | $ | 27,720 | | | $ | 6,627 | | | $ | 5,882 | |
| | | | | | | | | | | | | | | | | | | | | | |
| | | | | | |
Portfolio turnover rate | | | | | 3 | %(e) | | | 29 | %(f) | | | 42 | %(g) | | | 40 | %(g) | | | 35 | %(g) |
| | | | | | | | | | | | | | | | | | | | | | |
| (a) | Based on average shares outstanding. |
| (b) | Distributions for annual periods determined in accordance with U.S. federal income tax regulations. |
| (c) | Where applicable, assumes the reinvestment of distributions. |
| (d) | Excludes fees and expenses incurred indirectly as a result of investments in underlying funds. |
| (e) | Includes the purchases and sales of the underlying funds and the Underlying Master Portfolios. |
| (f) | From January 1, 2020 through March 8, 2020, the rate includes the LifePath Dynamic Master Portfolio’s purchases and sales of the underlying funds and the Underlying Master Portfolios. Beginning March 9, 2020, the rate includes the LifePath Dynamic Fund’s purchases and sales of the underlying funds and the Underlying Master Portfolios. |
| (g) | Includes the LifePath Dynamic Master Portfolio’s purchases and sales of the underlying funds and Diversified Equity Master Portfolio, Advantage CoreAlpha Bond Master Portfolio, International Tilts Master Portfolio, Large Cap Index Master Portfolio, Master Small Cap Index Series and Master Total Return Portfolio. |
See notes to financial statements.
Financial Highlights (continued)
(For a share outstanding throughout each period)
| | | | | | | | | | | | | | | | | | | | | | |
| | | BlackRock LifePath® Dynamic 2035 Fund (continued) | |
| |
| | | Class R | |
| |
| | | Year Ended December 31, | |
| | | | | | |
| | | | | 2021 | | | 2020 | | | 2019 | | | 2018 | | | 2017 | |
| | | | | | | |
Net asset value, beginning of year | | | | $ | 15.85 | | | $ | 14.26 | | | $ | 12.15 | | | $ | 14.46 | | | $ | 13.26 | |
| | | | | | | | | | | | | | | | | | | | | | |
| | | | | | |
Net investment income(a) | | | | | 0.13 | | | | 0.13 | | | | 0.24 | | | | 0.22 | | | | 0.17 | |
Net realized and unrealized gain (loss) | | | | | 1.95 | | | | 1.73 | | | | 2.57 | | | | (1.19 | ) | | | 2.33 | |
| | | | | | | | | | | | | | | | | | | | | | |
| | | | | | |
Net increase (decrease) from investment operations | | | | | 2.08 | | | | 1.86 | | | | 2.81 | | | | (0.97 | ) | | | 2.50 | |
| | | | | | | | | | | | | | | | | | | | | | |
| | | | | | |
Distributions(b) | | | | | | | | | | | | | | | | | | | | | | |
From net investment income | | | | | (0.79 | ) | | | (0.15 | ) | | | (0.25 | ) | | | (0.24 | ) | | | (0.20 | ) |
From net realized gain | | | | | (1.11 | ) | | | (0.12 | ) | | | (0.45 | ) | | | (1.10 | ) | | | (1.10 | ) |
| | | | | | | | | | | | | | | | | | | | | | |
| | | | | | |
Total distributions | | | | | (1.90 | ) | | | (0.27 | ) | | | (0.70 | ) | | | (1.34 | ) | | | (1.30 | ) |
| | | | | | | | | | | | | | | | | | | | | | |
| | | | | | |
Net asset value, end of year | | | | $ | 16.03 | | | $ | 15.85 | | | $ | 14.26 | | | $ | 12.15 | | | $ | 14.46 | |
| | | | | | | | | | | | | | | | | | | | | | |
| | | | | | |
Total Return(c) | | | | | | | | | | | | | | | | | | | | | | |
Based on net asset value | | | | | 13.19 | % | | | 13.33 | % | | | 23.15 | % | | | (6.87 | )% | | | 19.08 | % |
| | | | | | | | | | | | | | | | | | | | | | |
| | | | | | |
Ratios to Average Net Assets(d) | | | | | | | | | | | | | | | | | | | | | | |
Total expenses | | | | | 1.27 | % | | | 1.21 | % | | | 1.02 | % | | | 1.02 | % | | | 1.01 | % |
| | | | | | | | | | | | | | | | | | | | | | |
| | | | | | |
Total expenses after fees waived and/or reimbursed | | | | | 0.97 | % | | | 0.99 | % | | | 1.00 | % | | | 1.00 | % | | | 0.99 | % |
| | | | | | | | | | | | | | | | | | | | | | |
| | | | | | |
Net investment income | | | | | 0.77 | % | | | 0.91 | % | | | 1.71 | % | | | 1.55 | % | | | 1.19 | % |
| | | | | | | | | | | | | | | | | | | | | | |
| | | | | | |
Supplemental Data | | | | | | | | | | | | | | | | | | | | | | |
Net assets, end of year (000) | | | | $ | 3,687 | | | $ | 2,620 | | | $ | 5,541 | | | $ | 3,131 | | | $ | 3,782 | |
| | | | | | | | | | | | | | | | | | | | | | |
| | | | | | |
Portfolio turnover rate | | | | | 3 | %(e) | | | 29 | %(f) | | | 42 | %(g) | | | 40 | %(g) | | | 35 | %(g) |
| | | | | | | | | | | | | | | | | | | | | | |
| (a) | Based on average shares outstanding. |
| (b) | Distributions for annual periods determined in accordance with U.S. federal income tax regulations. |
| (c) | Where applicable, assumes the reinvestment of distributions. |
| (d) | Excludes fees and expenses incurred indirectly as a result of investments in underlying funds. |
| (e) | Includes the purchases and sales of the underlying funds and the Underlying Master Portfolios. |
| (f) | From January 1, 2020 through March 8, 2020, the rate includes the LifePath Dynamic Master Portfolio’s purchases and sales of the underlying funds and the Underlying Master Portfolios. Beginning March 9, 2020, the rate includes the LifePath Dynamic Fund’s purchases and sales of the underlying funds and the Underlying Master Portfolios. |
| (g) | Includes the LifePath Dynamic Master Portfolio’s purchases and sales of the underlying funds and Diversified Equity Master Portfolio, Advantage CoreAlpha Bond Master Portfolio, International Tilts Master Portfolio, Large Cap Index Master Portfolio, Master Small Cap Index Series and Master Total Return Portfolio. |
See notes to financial statements.
| | |
| 110 | | 2 0 2 1 BLACK ROCK ANNUAL REPORT TO SHAREHOLDERS |
Financial Highlights (continued)
(For a share outstanding throughout each period)
| | | | | | | | | | | | | | | | | | | | | | |
| | | BlackRock LifePath® Dynamic 2040 Fund | |
| |
| | | Institutional | |
| |
| | | Year Ended December 31, | |
| | | | | | |
| | | | | 2021 | | | 2020 | | | 2019 | | | 2018 | | | 2017 | |
| | | | | | | |
Net asset value, beginning of year | | | | $ | 18.74 | | | $ | 17.22 | | | $ | 14.62 | | | $ | 18.04 | | | $ | 17.15 | |
| | | | | | | | | | | | | | | | | | | | | | |
| | | | | | |
Net investment income(a) | | | | | 0.23 | | | | 0.23 | | | | 0.35 | | | | 0.34 | | | | 0.29 | |
Net realized and unrealized gain (loss) | | | | | 2.73 | | | | 2.09 | | | | 3.39 | | | | (1.65 | ) | | | 3.27 | |
| | | | | | | | | | | | | | | | | | | | | | |
| | | | | | |
Net increase (decrease) from investment operations | | | | | 2.96 | | | | 2.32 | | | | 3.74 | | | | (1.31 | ) | | | 3.56 | |
| | | | | | | | | | | | | | | | | | | | | | |
| | | | | | |
Distributions(b) | | | | | | | | | | | | | | | | | | | | | | |
From net investment income | | | | | (1.29 | ) | | | (0.24 | ) | | | (0.37 | ) | | | (0.33 | ) | | | (0.36 | ) |
From net realized gain | | | | | (2.39 | ) | | | (0.56 | ) | | | (0.77 | ) | | | (1.78 | ) | | | (2.31 | ) |
| | | | | | | | | | | | | | | | | | | | | | |
| | | | | | |
Total distributions | | | | | (3.68 | ) | | | (0.80 | ) | | | (1.14 | ) | | | (2.11 | ) | | | (2.67 | ) |
| | | | | | | | | | | | | | | | | | | | | | |
| | | | | | |
Net asset value, end of year | | | | $ | 18.02 | | | $ | 18.74 | | | $ | 17.22 | | | $ | 14.62 | | | $ | 18.04 | |
| | | | | | | | | | | | | | | | | | | | | | |
| | | | | | |
Total Return(c) | | | | | | | | | | | | | | | | | | | | | | |
Based on net asset value | | | | | 16.04 | % | | | 13.98 | % | | | 25.72 | % | | | (7.49 | )% | | | 21.44 | % |
| | | | | | | | | | | | | | | | | | | | | | |
| | | | | | |
Ratios to Average Net Assets(d) | | | | | | | | | | | | | | | | | | | | | | |
Total expenses | | | | | 0.81 | % | | | 0.77 | % | | | 0.55 | % | | | 0.55 | % | | | 0.54 | % |
| | | | | | | | | | | | | | | | | | | | | | |
| | | | | | |
Total expenses after fees waived and/or reimbursed | | | | | 0.52 | % | | | 0.53 | % | | | 0.55 | % | | | 0.55 | % | | | 0.54 | % |
| | | | | | | | | | | | | | | | | | | | | | |
| | | | | | |
Net investment income | | | | | 1.13 | % | | | 1.41 | % | | | 2.10 | % | | | 1.87 | % | | | 1.57 | % |
| | | | | | | | | | | | | | | | | | | | | | |
| | | | | | |
Supplemental Data | | | | | | | | | | | | | | | | | | | | | | |
Net assets, end of year (000) | | | | $ | 54,509 | | | $ | 59,328 | | | $ | 60,508 | | | $ | 48,056 | | | $ | 67,358 | |
| | | | | | | | | | | | | | | | | | | | | | |
| | | | | | |
Portfolio turnover rate | | | | | 6 | %(e) | | | 39 | %(f) | | | 35 | %(g) | | | 39 | %(g) | | | 30 | %(g) |
| | | | | | | | | | | | | | | | | | | | | | |
| (a) | Based on average shares outstanding. |
| (b) | Distributions for annual periods determined in accordance with U.S. federal income tax regulations. |
| (c) | Where applicable, assumes the reinvestment of distributions. |
| (d) | Excludes fees and expenses incurred indirectly as a result of investments in underlying funds. |
| (e) | Includes the purchases and sales of the underlying funds and the Underlying Master Portfolios. |
| (f) | From January 1, 2020 through March 8, 2020, the rate includes the LifePath Dynamic Master Portfolio’s purchases and sales of the underlying funds and the Underlying Master Portfolios. Beginning March 9, 2020, the rate includes the LifePath Dynamic Fund’s purchases and sales of the underlying funds and the Underlying Master Portfolios. |
| (g) | Includes the LifePath Dynamic Master Portfolio’s purchases and sales of the underlying funds and Diversified Equity Master Portfolio, Advantage CoreAlpha Bond Master Portfolio, International Tilts Master Portfolio, Large Cap Index Master Portfolio, Master SmallCap Index Series and Master Total Return Portfolio. |
See notes to financial statements.
Financial Highlights (continued)
(For a share outstanding throughout each period)
| | | | | | | | | | | | | | | | | | | | | | |
| | | BlackRock LifePath® Dynamic 2040 Fund (continued) | |
| |
| | | Investor A | |
| |
| | | Year Ended December 31, | |
| | | | | | |
| | | | | 2021 | | | 2020 | | | 2019 | | | 2018 | | | 2017 | |
| | | | | | | |
Net asset value, beginning of year | | | | $ | 16.71 | | | $ | 15.44 | | | $ | 13.22 | | | $ | 16.53 | | | $ | 15.91 | |
| | | | | | | | | | | | | | | | | | | | | | |
| | | | | | |
Net investment income(a) | | | | | 0.16 | | | | 0.17 | | | | 0.27 | | | | 0.27 | | | | 0.24 | |
Net realized and unrealized gain (loss) | | | | | 2.45 | | | | 1.87 | | | | 3.06 | | | | (1.50 | ) | | | 3.01 | |
| | | | | | | | | | | | | | | | | | | | | | |
| | | | | | |
Net increase (decrease) from investment operations | | | | | 2.61 | | | | 2.04 | | | | 3.33 | | | | (1.23 | ) | | | 3.25 | |
| | | | | | | | | | | | | | | | | | | | | | |
| | | | | | |
Distributions(b) | | | | | | | | | | | | | | | | | | | | | | |
From net investment income | | | | | (1.26 | ) | | | (0.21 | ) | | | (0.34 | ) | | | (0.30 | ) | | | (0.32 | ) |
From net realized gain | | | | | (2.40 | ) | | | (0.56 | ) | | | (0.77 | ) | | | (1.78 | ) | | | (2.31 | ) |
| | | | | | | | | | | | | | | | | | | | | | |
| | | | | | |
Total distributions | | | | | (3.66 | ) | | | (0.77 | ) | | | (1.11 | ) | | | (2.08 | ) | | | (2.63 | ) |
| | | | | | | | | | | | | | | | | | | | | | |
| | | | | | |
Net asset value, end of year | | | | $ | 15.66 | | | $ | 16.71 | | | $ | 15.44 | | | $ | 13.22 | | | $ | 16.53 | |
| | | | | | | | | | | | | | | | | | | | | | |
| | | | | | |
Total Return(c) | | | | | | | | | | | | | | | | | | | | | | |
Based on net asset value | | | | | 15.84 | % | | | 13.72 | % | | | 25.29 | % | | | (7.70 | )% | | | 21.17 | % |
| | | | | | | | | | | | | | | | | | | | | | |
| | | | | | |
Ratios to Average Net Assets(d) | | | | | | | | | | | | | | | | | | | | | | |
Total expenses | | | | | 1.06 | % | | | 1.02 | % | | | 0.80 | % | | | 0.80 | % | | | 0.79 | % |
| | | | | | | | | | | | | | | | | | | | | | |
| | | | | | |
Total expenses after fees waived and/or reimbursed | | | | | 0.77 | % | | | 0.78 | % | | | 0.80 | % | | | 0.80 | % | | | 0.79 | % |
| | | | | | | | | | | | | | | | | | | | | | |
| | | | | | |
Net investment income | | | | | 0.89 | % | | | 1.14 | % | | | 1.81 | % | | | 1.66 | % | | | 1.41 | % |
| | | | | | | | | | | | | | | | | | | | | | |
| | | | | | |
Supplemental Data | | | | | | | | | | | | | | | | | | | | | | |
Net assets, end of year (000) | | | | $ | 153,955 | | | $ | 157,613 | | | $ | 173,103 | | | $ | 168,678 | | | $ | 204,321 | |
| | | | | | | | | | | | | | | | | | | | | | |
| | | | | | |
Portfolio turnover rate | | | | | 6 | %(e) | | | 39 | %(f) | | | 35 | %(g) | | | 39 | %(g) | | | 30 | %(g) |
| | | | | | | | | | | | | | | | | | | | | | |
| (a) | Based on average shares outstanding. |
| (b) | Distributions for annual periods determined in accordance with U.S. federal income tax regulations. |
| (c) | Where applicable, excludes the effects of any sales charges and assumes the reinvestment of distributions. |
| (d) | Excludes fees and expenses incurred indirectly as a result of investments in underlying funds. |
| (e) | Includes the purchases and sales of the underlying funds and the Underlying Master Portfolios. |
| (f) | From January 1, 2020 through March 8, 2020, the rate includes the LifePath Dynamic Master Portfolio’s purchases and sales of the underlying funds and the Underlying Master Portfolios. Beginning March 9, 2020, the rate includes the LifePath Dynamic Fund’s purchases and sales of the underlying funds and the Underlying Master Portfolios. |
| (g) | Includes the LifePath Dynamic Master Portfolio’s purchases and sales of the underlying funds and Diversified Equity Master Portfolio, Advantage CoreAlpha Bond Master Portfolio, International Tilts Master Portfolio, Large Cap Index Master Portfolio, Master SmallCap Index Series and Master Total Return Portfolio. |
See notes to financial statements.
| | |
| 112 | | 2 0 2 1 BLACK ROCK ANNUAL REPORT TO SHAREHOLDERS |
Financial Highlights (continued)
(For a share outstanding throughout each period)
| | | | | | | | | | | | | | | | | | | | | | |
| | | BlackRock LifePath® Dynamic 2040 Fund (continued) | |
| | | Investor C | |
| |
| | | Year Ended December 31, | |
| | | | | | |
| | | | | 2021 | | | 2020 | | | 2019 | | | 2018 | | | 2017 | |
| | | | | | | |
Net asset value, beginning of year | | | | $ | 18.38 | | | $ | 16.89 | | | $ | 14.37 | | | $ | 17.77 | | | $ | 16.93 | |
| | | | | | | | | | | | | | | | | | | | | | |
| | | | | | |
Net investment income(a) | | | | | 0.03 | | | | 0.05 | | | | 0.17 | | | | 0.15 | | | | 0.11 | |
Net realized and unrealized gain (loss) | | | | | 2.69 | | | | 2.06 | | | | 3.32 | | | | (1.62 | ) | | | 3.21 | |
| | | | | | | | | | | | | | | | | | | | | | |
| | | | | | |
Net increase (decrease) from investment operations | | | | | 2.72 | | | | 2.11 | | | | 3.49 | | | | (1.47 | ) | | | 3.32 | |
| | | | | | | | | | | | | | | | | | | | | | |
| | | | | | |
Distributions(b) | | | | | | | | | | | | | | | | | | | | | | |
From net investment income | | | | | (1.15 | ) | | | (0.06 | ) | | | (0.20 | ) | | | (0.15 | ) | | | (0.17 | ) |
From net realized gain | | | | | (2.39 | ) | | | (0.56 | ) | | | (0.77 | ) | | | (1.78 | ) | | | (2.31 | ) |
| | | | | | | | | | | | | | | | | | | | | | |
| | | | | | |
Total distributions | | | | | (3.54 | ) | | | (0.62 | ) | | | (0.97 | ) | | | (1.93 | ) | | | (2.48 | ) |
| | | | | | | | | | | | | | | | | | | | | | |
| | | | | | |
Net asset value, end of year | | | | $ | 17.56 | | | $ | 18.38 | | | $ | 16.89 | | | $ | 14.37 | | | $ | 17.77 | |
| | | | | | | | | | | | | | | | | | | | | | |
| | | | | | |
Total Return(c) | | | | | | | | | | | | | | | | | | | | | | |
Based on net asset value | | | | | 14.97 | % | | | 12.80 | % | | | 24.35 | % | | | (8.47 | )% | | | 20.21 | % |
| | | | | | | | | | | | | | | | | | | | | | |
| | | | | | |
Ratios to Average Net Assets(d) | | | | | | | | | | | | | | | | | | | | | | |
Total expenses | | | | | 1.81 | % | | | 1.77 | % | | | 1.60 | % | | | 1.60 | % | | | 1.59 | % |
| | | | | | | | | | | | | | | | | | | | | | |
| | | | | | |
Total expenses after fees waived and/or reimbursed | | | | | 1.52 | % | | | 1.55 | % | | | 1.60 | % | | | 1.60 | % | | | 1.59 | % |
| | | | | | | | | | | | | | | | | | | | | | |
| | | | | | |
Net investment income | | | | | 0.15 | % | | | 0.32 | % | | | 1.05 | % | | | 0.86 | % | | | 0.62 | % |
| | | | | | | | | | | | | | | | | | | | | | |
| | | | | | |
Supplemental Data | | | | | | | | | | | | | | | | | | | | | | |
Net assets, end of year (000) | | | | $ | 2,486 | | | $ | 2,325 | | | $ | 3,276 | | | $ | 2,541 | | | $ | 3,017 | |
| | | | | | | | | | | | | | | | | | | | | | |
| | | | | | |
Portfolio turnover rate | | | | | 6 | %(e) | | | 39 | %(f) | | | 35 | %(g) | | | 39 | %(g) | | | 30 | %(g) |
| | | | | | | | | | | | | | | | | | | | | | |
| (a) | Based on average shares outstanding. |
| (b) | Distributions for annual periods determined in accordance with U.S. federal income tax regulations. |
| (c) | Where applicable, excludes the effects of any sales charges and assumes the reinvestment of distributions. |
| (d) | Excludes fees and expenses incurred indirectly as a result of investments in underlying funds. |
| (e) | Includes the purchases and sales of the underlying funds and the Underlying Master Portfolios. |
| (f) | From January 1, 2020 through March 8, 2020, the rate includes the LifePath Dynamic Master Portfolio’s purchases and sales of the underlying funds and the Underlying Master Portfolios. Beginning March 9, 2020, the rate includes the LifePath Dynamic Fund’s purchases and sales of the underlying funds and the Underlying Master Portfolios. |
| (g) | Includes the LifePath Dynamic Master Portfolio’s purchases and sales of the underlying funds and Diversified Equity Master Portfolio, Advantage CoreAlpha Bond Master Portfolio, International Tilts Master Portfolio, Large Cap Index Master Portfolio, Master SmallCap Index Series and Master Total Return Portfolio. |
See notes to financial statements.
Financial Highlights (continued)
(For a share outstanding throughout each period)
| | | | | | | | | | | | | | | | | | | | | | |
| | | BlackRock LifePath® Dynamic 2040 Fund (continued) | |
| |
| | | Class K | |
| |
| | | Year Ended December 31, | |
| | | | | |
| | | 2021 | | | 2020 | | | 2019 | | | 2018 | | | 2017 | |
| | | | | | | |
Net asset value, beginning of year | | | | $ | 18.85 | | | $ | 17.32 | | | $ | 14.70 | | | $ | 18.13 | | | $ | 17.23 | |
| | | | | | | | | | | | | | | | | | | | | | |
| | | | | | |
Net investment income(a) | | | | | 0.29 | | | | 0.26 | | | | 0.41 | | | | 0.38 | | | | 0.35 | |
Net realized and unrealized gain (loss) | | | | | 2.75 | | | | 2.11 | | | | 3.38 | | | | (1.66 | ) | | | 3.26 | |
| | | | | | | | | | | | | | | | | | | | | | |
| | | | | | |
Net increase (decrease) from investment operations | | | | | 3.04 | | | | 2.37 | | | | 3.79 | | | | (1.28 | ) | | | 3.61 | |
| | | | | | | | | | | | | | | | | | | | | | |
| | | | | | |
Distributions(b) | | | | | | | | | | | | | | | | | | | | | | |
From net investment income | | | | | (1.34 | ) | | | (0.28 | ) | | | (0.40 | ) | | | (0.37 | ) | | | (0.40 | ) |
From net realized gain | | | | | (2.39 | ) | | | (0.56 | ) | | | (0.77 | ) | | | (1.78 | ) | | | (2.31 | ) |
| | | | | | | | | | | | | | | | | | | | | | |
| | | | | | |
Total distributions | | | | | (3.73 | ) | | | (0.84 | ) | | | (1.17 | ) | | | (2.15 | ) | | | (2.71 | ) |
| | | | | | | | | | | | | | | | | | | | | | |
| | | | | | |
Net asset value, end of year | | | | $ | 18.16 | | | $ | 18.85 | | | $ | 17.32 | | | $ | 14.70 | | | $ | 18.13 | |
| | | | | | | | | | | | | | | | | | | | | | |
| | | | | | |
Total Return(c) | | | | | | | | | | | | | | | | | | | | | | |
Based on net asset value | | | | | 16.38 | % | | | 14.23 | % | | | 25.96 | % | | | (7.31 | )% | | | 21.66 | % |
| | | | | | | | | | | | | | | | | | | | | | |
| | | | | | |
Ratios to Average Net Assets(d) | | | | | | | | | | | | | | | | | | | | | | |
Total expenses | | | | | 0.56 | % | | | 0.53 | % | | | 0.35 | % | | | 0.35 | % | | | 0.34 | % |
| | | | | | | | | | | | | | | | | | | | | | |
| | | | | | |
Total expenses after fees waived and/or reimbursed | | | | | 0.27 | % | | | 0.29 | % | | | 0.35 | % | | | 0.35 | % | | | 0.34 | % |
| | | | | | | | | | | | | | | | | | | | | | |
| | | | | | |
Net investment income | | | | | 1.44 | % | | | 1.58 | % | | | 2.42 | % | | | 2.09 | % | | | 1.87 | % |
| | | | | | | | | | | | | | | | | | | | | | |
| | | | | | |
Supplemental Data | | | | | | | | | | | | | | | | | | | | | | |
Net assets, end of year (000) | | | | $ | 85,150 | | | $ | 57,407 | | | $ | 47,987 | | | $ | 28,294 | | | $ | 40,407 | |
| | | | | | | | | | | | | | | | | | | | | | |
| | | | | | |
Portfolio turnover rate | | | | | 6 | %(e) | | | 39 | %(f) | | | 35 | %(g) | | | 39 | %(g) | | | 30 | %(g) |
| | | | | | | | | | | | | | | | | | | | | | |
| (a) | Based on average shares outstanding. |
| (b) | Distributions for annual periods determined in accordance with U.S. federal income tax regulations. |
| (c) | Where applicable, assumes the reinvestment of distributions. |
| (d) | Excludes fees and expenses incurred indirectly as a result of investments in underlying funds. |
| (e) | Includes the purchases and sales of the underlying funds and the Underlying Master Portfolios. |
| (f) | From January 1, 2020 through March 8, 2020, the rate includes the LifePath Dynamic Master Portfolio’s purchases and sales of the underlying funds and the Underlying Master Portfolios. Beginning March 9, 2020, the rate includes the LifePath Dynamic Fund’s purchases and sales of the underlying funds and the Underlying Master Portfolios. |
| (g) | Includes the LifePath Dynamic Master Portfolio’s purchases and sales of the underlying funds and Diversified Equity Master Portfolio, Advantage CoreAlpha Bond Master Portfolio, International Tilts Master Portfolio, Large Cap Index Master Portfolio, Master SmallCap Index Series and Master Total Return Portfolio. |
See notes to financial statements.
| | |
| 114 | | 2 0 2 1 BLACK ROCK ANNUAL REPORT TO SHAREHOLDERS |
Financial Highlights (continued)
(For a share outstanding throughout each period)
| | | | | | | | | | | | | | | | | | | | | | |
| | | BlackRock LifePath® Dynamic 2040 Fund (continued) | |
| |
| | | Class R | |
| |
| | | Year Ended December 31, | |
| | | | | |
| | | 2021 | | | 2020 | | | 2019 | | | 2018 | | | 2017 | |
| | | | | | | |
Net asset value, beginning of year | | | | $ | 18.51 | | | $ | 17.02 | | | $ | 14.48 | | | $ | 17.89 | | | $ | 17.04 | |
| | | | | | | | | | | | | | | | | | | | | | |
| | | | | | |
Net investment income(a) | | | | | 0.14 | | | | 0.16 | | | | 0.28 | | | | 0.25 | | | | 0.22 | |
Net realized and unrealized gain (loss) | | | | | 2.70 | | | | 2.06 | | | | 3.34 | | | | (1.63 | ) | | | 3.22 | |
| | | | | | | | | | | | | | | | | | | | | | |
| | | | | | |
Net increase (decrease) from investment operations | | | | | 2.84 | | | | 2.22 | | | | 3.62 | | | | (1.38 | ) | | | 3.44 | |
| | | | | | | | | | | | | | | | | | | | | | |
| | | | | | |
Distributions(b) | | | | | | | | | | | | | | | | | | | | | | |
From net investment income | | | | | (1.23 | ) | | | (0.17 | ) | | | (0.31 | ) | | | (0.25 | ) | | | (0.28 | ) |
From net realized gain | | | | | (2.39 | ) | | | (0.56 | ) | | | (0.77 | ) | | | (1.78 | ) | | | (2.31 | ) |
| | | | | | | | | | | | | | | | | | | | | | |
| | | | | | |
Total distributions | | | | | (3.62 | ) | | | (0.73 | ) | | | (1.08 | ) | | | (2.03 | ) | | | (2.59 | ) |
| | | | | | | | | | | | | | | | | | | | | | |
| | | | | | |
Net asset value, end of year | | | | $ | 17.73 | | | $ | 18.51 | | | $ | 17.02 | | | $ | 14.48 | | | $ | 17.89 | |
| | | | | | | | | | | | | | | | | | | | | | |
| | | | | | |
Total Return(c) | | | | | | | | | | | | | | | | | | | | | | |
Based on net asset value | | | | | 15.55 | % | | | 13.45 | % | | | 25.10 | % | | | (7.92 | )% | | | 20.86 | % |
| | | | | | | | | | | | | | | | | | | | | | |
| | | | | | |
Ratios to Average Net Assets(d) | | | | | | | | | | | | | | | | | | | | | | |
Total expenses | | | | | 1.26 | % | | | 1.21 | % | | | 1.01 | % | | | 1.00 | % | | | 0.99 | % |
| | | | | | | | | | | | | | | | | | | | | | |
| | | | | | |
Total expenses after fees waived and/or reimbursed | | | | | 0.97 | % | | | 0.98 | % | | | 1.00 | % | | | 1.00 | % | | | 0.99 | % |
| | | | | | | | | | | | | | | | | | | | | | |
| | | | | | |
Net investment income | | | | | 0.72 | % | | | 0.96 | % | | | 1.70 | % | | | 1.41 | % | | | 1.22 | % |
| | | | | | | | | | | | | | | | | | | | | | |
| | | | | | |
Supplemental Data | | | | | | | | | | | | | | | | | | | | | | |
Net assets, end of year (000) | | | | $ | 4,977 | | | $ | 3,946 | | | $ | 4,005 | | | $ | 2,078 | | | $ | 3,132 | |
| | | | | | | | | | | | | | | | | | | | | | |
| | | | | | |
Portfolio turnover rate | | | | | 6 | %(e) | | | 39 | %(f) | | | 35 | %(g) | | | 39 | %(g) | | | 30 | %(g) |
| | | | | | | | | | | | | | | | | | | | | | |
| (a) | Based on average shares outstanding. |
| (b) | Distributions for annual periods determined in accordance with U.S. federal income tax regulations. |
| (c) | Where applicable, assumes the reinvestment of distributions. |
| (d) | Excludes fees and expenses incurred indirectly as a result of investments in underlying funds. |
| (e) | Includes the purchases and sales of the underlying funds and the Underlying Master Portfolios. |
| (f) | From January 1, 2020 through March 8, 2020, the rate includes the LifePath Dynamic Master Portfolio’s purchases and sales of the underlying funds and the Underlying Master Portfolios. Beginning March 9, 2020, the rate includes the LifePath Dynamic Fund’s purchases and sales of the underlying funds and the Underlying Master Portfolios. |
| (g) | Includes the LifePath Dynamic Master Portfolio’s purchases and sales of the underlying funds and Diversified Equity Master Portfolio, Advantage CoreAlpha Bond Master Portfolio, International Tilts Master Portfolio, Large Cap Index Master Portfolio, Master SmallCap Index Series and Master Total Return Portfolio. |
See notes to financial statements.
Financial Highlights (continued)
(For a share outstanding throughout each period)
| | | | | | | | | | | | | | | | | | | | | | |
| | | BlackRock LifePath® Dynamic 2045 Fund | |
| |
| | | Institutional | |
| |
| | | Year Ended December 31, | |
| | | | | |
| | | 2021 | | | 2020 | | | 2019 | | | 2018 | | | 2017 | |
| | | | | | | |
Net asset value, beginning of year | | | | $ | 17.06 | | | $ | 15.31 | | | $ | 12.75 | | | $ | 15.41 | | | $ | 13.88 | |
| | | | | | | | | | | | | | | | | | | | | | |
| | | | | | |
Net investment income(a) | | | | | 0.20 | | | | 0.21 | | | | 0.31 | | | | 0.26 | | | | 0.23 | |
Net realized and unrealized gain (loss) | | | | | 2.79 | | | | 1.91 | | | | 3.04 | | | | (1.47 | ) | | | 2.83 | |
| | | | | | | | | | | | | | | | | | | | | | |
| | | | | | |
Net increase (decrease) from investment operations | | | | | 2.99 | | | | 2.12 | | | | 3.35 | | | | (1.21 | ) | | | 3.06 | |
| | | | | | | | | | | | | | | | | | | | | | |
| | | | | | |
Distributions(b) | | | | | | | | | | | | | | | | | | | | | | |
From net investment income | | | | | (1.16 | ) | | | (0.22 | ) | | | (0.31 | ) | | | (0.29 | ) | | | (0.29 | ) |
From net realized gain | | | | | (1.08 | ) | | | (0.15 | ) | | | (0.48 | ) | | | (1.16 | ) | | | (1.24 | ) |
| | | | | | | | | | | | | | | | | | | | | | |
| | | | | | |
Total distributions | | | | | (2.24 | ) | | | (0.37 | ) | | | (0.79 | ) | | | (1.45 | ) | | | (1.53 | ) |
| | | | | | | | | | | | | | | | | | | | | | |
| | | | | | |
Net asset value, end of year | | | | $ | 17.81 | | | $ | 17.06 | | | $ | 15.31 | | | $ | 12.75 | | | $ | 15.41 | |
| | | | | | | | | | | | | | | | | | | | | | |
| | | | | | |
Total Return(c) | | | | | | | | | | | | | | | | | | | | | | |
Based on net asset value | | | | | 17.61 | % | | | 14.31 | % | | | 26.38 | % | | | (8.18 | )% | | | 22.29 | % |
| | | | | | | | | | | | | | | | | | | | | | |
| | | | | | |
Ratios to Average Net Assets(d) | | | | | | | | | | | | | | | | | | | | | | |
Total expenses | | | | | 0.84 | % | | | 0.82 | % | | | 0.58 | % | | | 0.58 | % | | | 0.56 | % |
| | | | | | | | | | | | | | | | | | | | | | |
| | | | | | |
Total expenses after fees waived and/or reimbursed | | | | | 0.51 | % | | | 0.53 | % | | | 0.56 | % | | | 0.55 | % | | | 0.53 | % |
| | | | | | | | | | | | | | | | | | | | | | |
| | | | | | |
Net investment income | | | | | 1.07 | % | | | 1.43 | % | | | 2.13 | % | | | 1.68 | % | | | 1.54 | % |
| | | | | | | | | | | | | | | | | | | | | | |
| | | | | | |
Supplemental Data | | | | | | | | | | | | | | | | | | | | | | |
Net assets, end of year (000) | | | | $ | 8,641 | | | $ | 7,491 | | | $ | 4,656 | | | $ | 2,967 | | | $ | 8,267 | |
| | | | | | | | | | | | | | | | | | | | | | |
| | | | | | |
Portfolio turnover rate | | | | | — | %(e)(f) | | | 26 | %(g) | | | 49 | %(h) | | | 47 | %(h) | | | 46 | %(h) |
| | | | | | | | | | | | | | | | | | | | | | |
| (a) | Based on average shares outstanding. |
| (b) | Distributions for annual periods determined in accordance with U.S. federal income tax regulations. |
| (c) | Where applicable, assumes the reinvestment of distributions. |
| (d) | Excludes fees and expenses incurred indirectly as a result of investments in underlying funds. |
| (e) | Includes the purchases and sales of the underlying funds and the Underlying Master Portfolios. |
| (f) | Rounds to less than 1%. |
| (g) | From January 1, 2020 through March 8, 2020, the rate includes the LifePath Dynamic Master Portfolio’s purchases and sales of the underlying funds and the Underlying Master Portfolios. Beginning March 9, 2020, the rate includes the LifePath Dynamic Fund’s purchases and sales of the underlying funds and the Underlying Master Portfolios. |
| (h) | Includes the LifePath Dynamic Master Portfolio’s purchases and sales of the underlying funds and Diversified Equity Master Portfolio, Advantage CoreAlpha Bond Master Portfolio, International Tilts Master Portfolio, Large Cap Index Master Portfolio, Master Small Cap Index Series and Master Total Return Portfolio. |
See notes to financial statements.
| | |
| 116 | | 2 0 2 1 BLACK ROCK ANNUAL REPORT TO SHAREHOLDERS |
Financial Highlights (continued)
(For a share outstanding throughout each period)
| | | | | | | | | | | | | | | | | | | | | | |
| | | BlackRock LifePath® Dynamic 2045 Fund (continued) | |
| |
| | | Investor A | |
| |
| | | Year Ended December 31, | |
| | | | | |
| | | 2021 | | | 2020 | | | 2019 | | | 2018 | | | 2017 | |
| | | | | | | |
Net asset value, beginning of year | | | | $ | 17.02 | | | $ | 15.27 | | | $ | 12.72 | | | $ | 15.40 | | | $ | 13.87 | |
| | | | | | | | | | | | | | | | | | | | | | |
| | | | | | |
Net investment income(a) | | | | | 0.16 | | | | 0.16 | | | | 0.26 | | | | 0.24 | | | | 0.21 | |
Net realized and unrealized gain (loss) | | | | | 2.77 | | | | 1.92 | | | | 3.05 | | | | (1.50 | ) | | | 2.82 | |
| | | | | | | | | | | | | | | | | | | | | | |
| | | | | | |
Net increase (decrease) from investment operations | | | | | 2.93 | | | | 2.08 | | | | 3.31 | | | | (1.26 | ) | | | 3.03 | |
| | | | | | | | | | | | | | | | | | | | | | |
| | | | | | |
Distributions(b) | | | | | | | | | | | | | | | | | | | | | | |
From net investment income | | | | | (1.12 | ) | | | (0.18 | ) | | | (0.28 | ) | | | (0.26 | ) | | | (0.26 | ) |
From net realized gain | | | | | (1.08 | ) | | | (0.15 | ) | | | (0.48 | ) | | | (1.16 | ) | | | (1.24 | ) |
| | | | | | | | | | | | | | | | | | | | | | |
| | | | | | |
Total distributions | | | | | (2.20 | ) | | | (0.33 | ) | | | (0.76 | ) | | | (1.42 | ) | | | (1.50 | ) |
| | | | | | | | | | | | | | | | | | | | | | |
| | | | | | |
Net asset value, end of year | | | | $ | 17.75 | | | $ | 17.02 | | | $ | 15.27 | | | $ | 12.72 | | | $ | 15.40 | |
| | | | | | | | | | | | | | | | | | | | | | |
| | | | | | |
Total Return(c) | | | | | | | | | | | | | | | | | | | | | | |
Based on net asset value | | | | | 17.33 | % | | | 14.03 | % | | | 26.05 | % | | | (8.44 | )% | | | 22.05 | % |
| | | | | | | | | | | | | | | | | | | | | | |
| | | | | | |
Ratios to Average Net Assets(d) | | | | | | | | | | | | | | | | | | | | | | |
Total expenses | | | | | 1.09 | % | | | 1.05 | % | | | 0.84 | % | | | 0.83 | % | | | 0.82 | % |
| | | | | | | | | | | | | | | | | | | | | | |
| | | | | | |
Total expenses after fees waived and/or reimbursed | | | | | 0.76 | % | | | 0.79 | % | | | 0.81 | % | | | 0.80 | % | | | 0.78 | % |
| | | | | | | | | | | | | | | | | | | | | | |
| | | | | | |
Net investment income | | | | | 0.84 | % | | | 1.12 | % | | | 1.82 | % | | | 1.56 | % | | | 1.38 | % |
| | | | | | | | | | | | | | | | | | | | | | |
| | | | | | |
Supplemental Data | | | | | | | | | | | | | | | | | | | | | | |
Net assets, end of year (000) | | | | $ | 21,856 | | | $ | 17,996 | | | $ | 18,811 | | | $ | 17,742 | | | $ | 20,152 | |
| | | | | | | | | | | | | | | | | | | | | | |
| | | | | | |
Portfolio turnover rate | | | | | — | %(e)(f) | | | 26 | %(g) | | | 49 | %(h) | | | 47 | %(h) | | | 46 | %(h) |
| | | | | | | | | | | | | | | | | | | | | | |
| (a) | Based on average shares outstanding. |
| (b) | Distributions for annual periods determined in accordance with U.S. federal income tax regulations. |
| (c) | Where applicable, excludes the effects of any sales charges and assumes the reinvestment of distributions. |
| (d) | Excludes fees and expenses incurred indirectly as a result of investments in underlying funds. |
| (e) | Includes the purchases and sales of the underlying funds and the Underlying Master Portfolios. |
| (f) | Rounds to less than 1%. |
| (g) | From January 1, 2020 through March 8, 2020, the rate includes the LifePath Dynamic Master Portfolio’s purchases and sales of the underlying funds and the Underlying Master Portfolios. Beginning March 9, 2020, the rate includes the LifePath Dynamic Fund’s purchases and sales of the underlying funds and the Underlying Master Portfolios. |
| (h) | Includes the LifePath Dynamic Master Portfolio’s purchases and sales of the underlying funds and Diversified Equity Master Portfolio, Advantage CoreAlpha Bond Master Portfolio, International Tilts Master Portfolio, Large Cap Index Master Portfolio, Master Small Cap Index Series and Master Total Return Portfolio. |
See notes to financial statements.
Financial Highlights (continued)
(For a share outstanding throughout each period)
| | | | | | | | | | | | | | | | | | | | | | |
| | | BlackRock LifePath® Dynamic 2045 Fund (continued) | |
| |
| | | Investor C | |
| |
| | | Year Ended December 31, | |
| | | | | |
| | | 2021 | | | 2020 | | | 2019 | | | 2018 | | | 2017 | |
| | | | | | | |
Net asset value, beginning of year | | | | $ | 16.78 | | | $ | 15.04 | | | $ | 12.54 | | | $ | 15.20 | | | $ | 13.71 | |
| | | | | | | | | | | | | | | | | | | | | | |
| | | | | | |
Net investment income(a) | | | | | 0.02 | | | | 0.04 | | | | 0.15 | | | | 0.12 | | | | 0.08 | |
Net realized and unrealized gain (loss) | | | | | 2.72 | | | | 1.90 | | | | 2.99 | | | | (1.47 | ) | | | 2.79 | |
| | | | | | | | | | | | | | | | | | | | | | |
| | | | | | |
Net increase (decrease) from investment operations | | | | | 2.74 | | | | 1.94 | | | | 3.14 | | | | (1.35 | ) | | | 2.87 | |
| | | | | | | | | | | | | | | | | | | | | | |
| | | | | | |
Distributions(b) | | | | | | | | | | | | | | | | | | | | | | |
From net investment income | | | | | (1.02 | ) | | | (0.05 | ) | | | (0.16 | ) | | | (0.15 | ) | | | (0.14 | ) |
From net realized gain | | | | | (1.08 | ) | | | (0.15 | ) | | | (0.48 | ) | | | (1.16 | ) | | | (1.24 | ) |
| | | | | | | | | | | | | | | | | | | | | | |
| | | | | | |
Total distributions | | | | | (2.10 | ) | | | (0.20 | ) | | | (0.64 | ) | | | (1.31 | ) | | | (1.38 | ) |
| | | | | | | | | | | | | | | | | | | | | | |
| | | | | | |
Net asset value, end of year | | | | $ | 17.42 | | | $ | 16.78 | | | $ | 15.04 | | | $ | 12.54 | | | $ | 15.20 | |
| | | | | | | | | | | | | | | | | | | | | | |
| | | | | | |
Total Return(c) | | | | | | | | | | | | | | | | | | | | | | |
Based on net asset value | | | | | 16.40 | % | | | 13.16 | % | | | 25.07 | % | | | (9.13 | )% | | | 21.10 | % |
| | | | | | | | | | | | | | | | | | | | | | |
| | | | | | |
Ratios to Average Net Assets(d) | | | | | | | | | | | | | | | | | | | | | | |
Total expenses | | | | | 1.84 | % | | | 1.81 | % | | | 1.64 | % | | | 1.63 | % | | | 1.62 | % |
| | | | | | | | | | | | | | | | | | | | | | |
| | | | | | |
Total expenses after fees waived and/or reimbursed | | | | | 1.51 | % | | | 1.55 | % | | | 1.61 | % | | | 1.60 | % | | | 1.58 | % |
| | | | | | | | | | | | | | | | | | | | | | |
| | | | | | |
Net investment income | | | | | 0.08 | % | | | 0.29 | % | | | 1.04 | % | | | 0.78 | % | | | 0.56 | % |
| | | | | | | | | | | | | | | | | | | | | | |
| | | | | | |
Supplemental Data | | | | | | | | | | | | | | | | | | | | | | |
Net assets, end of year (000) | | | | $ | 1,392 | | | $ | 1,129 | | | $ | 1,732 | | | $ | 1,535 | | | $ | 1,375 | |
| | | | | | | | | | | | | | | | | | | | | | |
| | | | | | |
Portfolio turnover rate | | | | | — | %(e)(f) | | | 26 | %(g) | | | 49 | %(h) | | | 47 | %(h) | | | 46 | %(h) |
| | | | | | | | | | | | | | | | | | | | | | |
| (a) | Based on average shares outstanding. |
| (b) | Distributions for annual periods determined in accordance with U.S. federal income tax regulations. |
| (c) | Where applicable, excludes the effects of any sales charges and assumes the reinvestment of distributions. |
| (d) | Excludes fees and expenses incurred indirectly as a result of investments in underlying funds. |
| (e) | Includes the purchases and sales of the underlying funds and the Underlying Master Portfolios. |
| (f) | Rounds to less than 1%. |
| (g) | From January 1, 2020 through March 8, 2020, the rate includes the LifePath Dynamic Master Portfolio’s purchases and sales of the underlying funds and the Underlying Master Portfolios. Beginning March 9, 2020, the rate includes the LifePath Dynamic Fund’s purchases and sales of the underlying funds and the Underlying Master Portfolios. |
| (h) | Includes the LifePath Dynamic Master Portfolio’s purchases and sales of the underlying funds and Diversified Equity Master Portfolio, Advantage CoreAlpha Bond Master Portfolio, International Tilts Master Portfolio, Large Cap Index Master Portfolio, Master Small Cap Index Series and Master Total Return Portfolio. |
See notes to financial statements.
| | |
| 118 | | 2 0 2 1 BLACK ROCK ANNUAL REPORT TO SHAREHOLDERS |
Financial Highlights (continued)
(For a share outstanding throughout each period)
| | | | | | | | | | | | | | | | | | | | | | | | |
| | | | | | BlackRock LifePath® Dynamic 2045 Fund (continued) | |
| | |
| | | | | | Class K | |
| | |
| | | | | | Year Ended December 31, | |
| | | | | | |
| | | | | | 2021 | | | 2020 | | | 2019 | | | 2018 | | | 2017 | |
| | | | | | |
Net asset value, beginning of year | | | | | | $ | 17.25 | | | $ | 15.48 | | | $ | 12.88 | | | $ | 15.57 | | | $ | 14.01 | |
| | | | | | | | | | | | | | | | | | | | | | | | |
| | | | | | |
Net investment income(a) | | | | | | | 0.26 | | | | 0.26 | | | | 0.39 | | | | 0.32 | | | | 0.29 | |
Net realized and unrealized gain (loss) | | | | | | | 2.81 | | | | 1.91 | | | | 3.03 | | | | (1.52 | ) | | | 2.84 | |
| | | | | | | | | | | | | | | | | | | | | | | | |
| | | | | | |
Net increase (decrease) from investment operations | | | | | | | 3.07 | | | | 2.17 | | | | 3.42 | | | | (1.20 | ) | | | 3.13 | |
| | | | | | | | | | | | | | | | | | | | | | | | |
| | | | | | |
Distributions(b) | | | | | | | | | | | | | | | | | | | | | | | | |
From net investment income | | | | | | | (1.19 | ) | | | (0.25 | ) | | | (0.34 | ) | | | (0.33 | ) | | | (0.33 | ) |
From net realized gain | | | | | | | (1.08 | ) | | | (0.15 | ) | | | (0.48 | ) | | | (1.16 | ) | | | (1.24 | ) |
| | | | | | | | | | | | | | | | | | | | | | | | |
| | | | | | |
Total distributions | | | | | | | (2.27 | ) | | | (0.40 | ) | | | (0.82 | ) | | | (1.49 | ) | | | (1.57 | ) |
| | | | | | | | | | | | | | | | | | | | | | | | |
| | | | | | |
Net asset value, end of year | | | | | | $ | 18.05 | | | $ | 17.25 | | | $ | 15.48 | | | $ | 12.88 | | | $ | 15.57 | |
| | | | | | | | | | | | | | | | | | | | | | | | |
| | | | | | |
Total Return(c) | | | | | | | | | | | | | | | | | | | | | | | | |
Based on net asset value | | | | | | | 17.93 | % | | | 14.54 | % | | | 26.67 | % | | | (7.99 | )% | | | 22.58 | % |
| | | | | | | | | | | | | | | | | | | | | | | | |
| | | | | | |
Ratios to Average Net Assets(d) | | | | | | | | | | | | | | | | | | | | | | | | |
Total expenses | | | | | | | 0.59 | % | | | 0.57 | % | | | 0.37 | % | | | 0.38 | % | | | 0.37 | % |
| | | | | | | | | | | | | | | | | | | | | | | | |
| | | | | | |
Total expenses after fees waived and/or reimbursed | | | | | | | 0.26 | % | | | 0.29 | % | | | 0.34 | % | | | 0.35 | % | | | 0.33 | % |
| | | | | | | | | | | | | | | | | | | | | | | | |
| | | | | | |
Net investment income | | | | | | | 1.35 | % | | | 1.73 | % | | | 2.60 | % | | | 2.04 | % | | | 1.90 | % |
| | | | | | | | | | | | | | | | | | | | | | | | |
| | | | | | |
Supplemental Data | | | | | | | | | | | | | | | | | | | | | | | | |
Net assets, end of year (000) | | | | | | $ | 82,853 | | | $ | 56,683 | | | $ | 20,936 | | | $ | 4,471 | | | $ | 3,385 | |
| | | | | | | | | | | | | | | | | | | | | | | | |
| | | | | | |
Portfolio turnover rate | | | | | | | — | %(e)(f) | | | 26 | %(g) | | | 49 | %(h) | | | 47 | %(h) | | | 46 | %(h) |
| | | | | | | | | | | | | | | | | | | | | | | | |
| (a) | Based on average shares outstanding. |
| (b) | Distributions for annual periods determined in accordance with U.S. federal income tax regulations. |
| (c) | Where applicable, assumes the reinvestment of distributions. |
| (d) | Excludes fees and expenses incurred indirectly as a result of investments in underlying funds. |
| (e) | Includes the purchases and sales of the underlying funds and the Underlying Master Portfolios. |
| (f) | Rounds to less than 1%. |
| (g) | From January 1, 2020 through March 8, 2020, the rate includes the LifePath Dynamic Master Portfolio’s purchases and sales of the underlying funds and the Underlying Master Portfolios. Beginning March 9, 2020, the rate includes the LifePath Dynamic Fund’s purchases and sales of the underlying funds and the Underlying Master Portfolios. |
| (h) | Includes the LifePath Dynamic Master Portfolio’s purchases and sales of the underlying funds and Diversified Equity Master Portfolio, Advantage CoreAlpha Bond Master Portfolio, International Tilts Master Portfolio, Large Cap Index Master Portfolio, Master Small Cap Index Series and Master Total Return Portfolio. |
See notes to financial statements.
Financial Highlights (continued)
(For a share outstanding throughout each period)
| | | | | | | | | | | | | | | | | | | | | | | | |
| | | | | | BlackRock LifePath® Dynamic 2045 Fund (continued) | |
| | |
| | | | | | Class R | |
| | |
| | | | | | Year Ended December 31, | |
| | | | | | |
| | | | | | 2021 | | | 2020 | | | 2019 | | | 2018 | | | 2017 | |
| | | | | | |
Net asset value, beginning of year | | | | | | $ | 16.97 | | | $ | 15.23 | | | $ | 12.69 | | | $ | 15.37 | | | $ | 13.85 | |
| | | | | | | | | | | | | | | | | | | | | | | | |
| | | | | | |
Net investment income(a) | | | | | | | 0.12 | | | | 0.13 | | | | 0.24 | | | | 0.21 | | | | 0.19 | |
Net realized and unrealized gain (loss) | | | | | | | 2.77 | | | | 1.90 | | | | 3.03 | | | | (1.49 | ) | | | 2.80 | |
| | | | | | | | | | | | | | | | | | | | | | | | |
| | | | | | |
Net increase (decrease) from investment operations | | | | | | | 2.89 | | | | 2.03 | | | | 3.27 | | | | (1.28 | ) | | | 2.99 | |
| | | | | | | | | | | | | | | | | | | | | | | | |
| | | | | | |
Distributions(b) | | | | | | | | | | | | | | | | | | | | | | | | |
From net investment income | | | | | | | (1.10 | ) | | | (0.14 | ) | | | (0.25 | ) | | | (0.24 | ) | | | (0.23 | ) |
From net realized gain | | | | | | | (1.08 | ) | | | (0.15 | ) | | | (0.48 | ) | | | (1.16 | ) | | | (1.24 | ) |
| | | | | | | | | | | | | | | | | | | | | | | | |
| | | | | | |
Total distributions | | | | | | | (2.18 | ) | | | (0.29 | ) | | | (0.73 | ) | | | (1.40 | ) | | | (1.47 | ) |
| | | | | | | | | | | | | | | | | | | | | | | | |
| | | | | | |
Net asset value, end of year | | | | | | $ | 17.68 | | | $ | 16.97 | | | $ | 15.23 | | | $ | 12.69 | | | $ | 15.37 | |
| | | | | | | | | | | | | | | | | | | | | | | | |
| | | | | | |
Total Return(c) | | | | | | | | | | | | | | | | | | | | | | | | |
Based on net asset value | | | | | | | 17.10 | % | | | 13.73 | % | | | 25.83 | % | | | (8.63 | )% | | | 21.81 | % |
| | | | | | | | | | | | | | | | | | | | | | | | |
| | | | | | |
Ratios to Average Net Assets(d) | | | | | | | | | | | | | | | | | | | | | | | | |
Total expenses | | | | | | | 1.29 | % | | | 1.24 | % | | | 1.04 | % | | | 1.03 | % | | | 1.02 | % |
| | | | | | | | | | | | | | | | | | | | | | | | |
| | | | | | |
Total expenses after fees waived and/or reimbursed | | | | | | | 0.96 | % | | | 0.99 | % | | | 1.01 | % | | | 1.00 | % | | | 0.98 | % |
| | | | | | | | | | | | | | | | | | | | | | | | |
| | | | | | |
Net investment income | | | | | | | 0.64 | % | | | 0.87 | % | | | 1.65 | % | | | 1.38 | % | | | 1.24 | % |
| | | | | | | | | | | | | | | | | | | | | | | | |
| | | | | | |
Supplemental Data | | | | | | | | | | | | | | | | | | | | | | | | |
Net assets, end of year (000) | | | | | | $ | 2,989 | | | $ | 2,454 | | | $ | 4,104 | | | $ | 3,196 | | | $ | 3,039 | |
| | | | | | | | | | | | | | | | | | | | | | | | |
| | | | | | |
Portfolio turnover rate | | | | | | | — | %(e)(f) | | | 26 | %(g) | | | 49 | %(h) | | | 47 | %(h) | | | 46 | %(h) |
| | | | | | | | | | | | | | | | | | | | | | | | |
| (a) | Based on average shares outstanding. |
| (b) | Distributions for annual periods determined in accordance with U.S. federal income tax regulations. |
| (c) | Where applicable, assumes the reinvestment of distributions. |
| (d) | Excludes fees and expenses incurred indirectly as a result of investments in underlying funds. |
| (e) | Includes the purchases and sales of the underlying funds and the Underlying Master Portfolios. |
| (f) | Rounds to less than 1%. |
| (g) | From January 1, 2020 through March 8, 2020, the rate includes the LifePath Dynamic Master Portfolio’s purchases and sales of the underlying funds and the Underlying Master Portfolios. Beginning March 9, 2020, the rate includes the LifePath Dynamic Fund’s purchases and sales of the underlying funds and the Underlying Master Portfolios. |
| (h) | Includes the LifePath Dynamic Master Portfolio’s purchases and sales of the underlying funds and Diversified Equity Master Portfolio, Advantage CoreAlpha Bond Master Portfolio, International Tilts Master Portfolio, Large Cap Index Master Portfolio, Master Small Cap Index Series and Master Total Return Portfolio. |
See notes to financial statements.
| | |
| 120 | | 2 0 2 1 BLACK ROCK ANNUAL REPORT TO SHAREHOLDERS |
Financial Highlights (continued)
(For a share outstanding throughout each period)
| | | | | | | | | | | | | | | | | | | | | | | | |
| | | | | | BlackRock LifePath® Dynamic 2050 Fund | |
| | |
| | | | | | Institutional | |
| | |
| | | | | | Year Ended December 31, | |
| | | | | | |
| | | | | | 2021 | | | 2020 | | | 2019 | | | 2018 | | | 2017 | |
| | | | | | |
Net asset value, beginning of year | | | | | | $ | 22.78 | | | $ | 20.39 | | | $ | 17.13 | | | $ | 21.54 | | | $ | 18.58 | |
| | | | | | | | | | | | | | | | | | | | | | | | |
| | | | | | |
Net investment income(a) | | | | | | | 0.26 | | | | 0.24 | | | | 0.41 | | | | 0.36 | | | | 0.33 | |
Net realized and unrealized gain (loss) | | | | | | | 3.83 | | | | 2.67 | | | | 4.09 | | | | (2.07 | ) | | | 3.89 | |
| | | | | | | | | | | | | | | | | | | | | | | | |
| | | | | | |
Net increase (decrease) from investment operations | | | | | | | 4.09 | | | | 2.91 | | | | 4.50 | | | | (1.71 | ) | | | 4.22 | |
| | | | | | | | | | | | | | | | | | | | | | | | |
| | | | | | |
Distributions(b) | | | | | | | | | | | | | | | | | | | | | | | | |
From net investment income | | | | | | | (1.69 | ) | | | (0.26 | ) | | | (0.42 | ) | | | (0.42 | ) | | | (0.40 | ) |
From net realized gain | | | | | | | (2.19 | ) | | | (0.26 | ) | | | (0.82 | ) | | | (2.28 | ) | | | (0.86 | ) |
| | | | | | | | | | | | | | | | | | | | | | | | |
| | | | | | |
Total distributions | | | | | | | (3.88 | ) | | | (0.52 | ) | | | (1.24 | ) | | | (2.70 | ) | | | (1.26 | ) |
| | | | | | | | | | | | | | | | | | | | | | | | |
| | | | | | |
Net asset value, end of year | | | | | | $ | 22.99 | | | $ | 22.78 | | | $ | 20.39 | | | $ | 17.13 | | | $ | 21.54 | |
| | | | | | | | | | | | | | | | | | | | | | | | |
| | | | | | |
Total Return(c) | | | | | | | | | | | | | | | | | | | | | | | | |
Based on net asset value | | | | | | | 18.15 | % | | | 14.80 | % | | | 26.38 | % | | | (8.27 | )% | | | 22.85 | % |
| | | | | | | | | | | | | | | | | | | | | | | | |
| | | | | | |
Ratios to Average Net Assets(d) | | | | | | | | | | | | | | | | | | | | | | | | |
Total expenses | | | | | | | 0.84 | % | | | 0.79 | % | | | 0.56 | % | | | 0.56 | % | | | 0.54 | % |
| | | | | | | | | | | | | | | | | | | | | | | | |
| | | | | | |
Total expenses after fees waived and/or reimbursed | | | | | | | 0.54 | % | | | 0.54 | % | | | 0.55 | % | | | 0.55 | % | | | 0.53 | % |
| | | | | | | | | | | | | | | | | | | | | | | | |
| | | | | | |
Net investment income | | | | | | | 1.04 | % | | | 1.24 | % | | | 2.07 | % | | | 1.68 | % | | | 1.59 | % |
| | | | | | | | | | | | | | | | | | | | | | | | |
| | | | | | |
Supplemental Data | | | | | | | | | | | | | | | | | | | | | | | | |
Net assets, end of year (000) | | | | | | $ | 21,290 | | | $ | 19,215 | | | $ | 16,870 | | | $ | 11,376 | | | $ | 18,804 | |
| | | | | | | | | | | | | | | | | | | | | | | | |
| | | | | | |
Portfolio turnover rate | | | | | | | 1 | %(e) | | | 31 | %(f) | | | 42 | %(g) | | | 43 | %(g) | | | 35 | %(g) |
| | | | | | | | | | | | | | | | | | | | | | | | |
| (a) | Based on average shares outstanding. |
| (b) | Distributions for annual periods determined in accordance with U.S. federal income tax regulations. |
| (c) | Where applicable, assumes the reinvestment of distributions. |
| (d) | Excludes fees and expenses incurred indirectly as a result of investments in underlying funds. |
| (e) | Includes the purchases and sales of the underlying funds and the Underlying Master Portfolios. |
| (f) | From January 1, 2020 through March 8, 2020, the rate includes the LifePath Dynamic Master Portfolio’s purchases and sales of the underlying funds and the Underlying Master Portfolios. Beginning March 9, 2020, the rate includes the LifePath Dynamic Fund’s purchases and sales of the underlying funds and the Underlying Master Portfolios. |
| (g) | Includes the LifePath Dynamic Master Portfolio’s purchases and sales of the underlying funds and Diversified Equity Master Portfolio, Advantage CoreAlpha Bond Master Portfolio, International Tilts Master Portfolio, Large Cap Index Master Portfolio, Master SmallCap Index Series and Master Total Return Portfolio. |
See notes to financial statements.
Financial Highlights (continued)
(For a share outstanding throughout each period)
| | | | | | | | | | | | | | | | | | | | | | | | |
| | | | | | BlackRock LifePath® Dynamic 2050 Fund (continued) | |
| | |
| | | | | | Investor A | |
| | |
| | | | | | Year Ended December 31, | |
| | | | | | |
| | | | | | 2021 | | | 2020 | | | 2019 | | | 2018 | | | 2017 | |
| | | | | | |
Net asset value, beginning of year | | | | | | $ | 22.69 | | | $ | 20.31 | | | $ | 17.06 | | | $ | 21.47 | | | $ | 18.54 | |
| | | | | | | | | | | | | | | | | | | | | | | | |
| | | | | | |
Net investment income(a) | | | | | | | 0.19 | | | | 0.19 | | | | 0.34 | | | | 0.31 | | | | 0.29 | |
Net realized and unrealized gain (loss) | | | | | | | 3.82 | | | | 2.66 | | | | 4.10 | | | | (2.07 | ) | | | 3.86 | |
| | | | | | | | | | | | | | | | | | | | | | | | |
| | | | | | |
Net increase (decrease) from investment operations | | | | | | | 4.01 | | | | 2.85 | | | | 4.44 | | | | (1.76 | ) | | | 4.15 | |
| | | | | | | | | | | | | | | | | | | | | | | | |
| | | | | | |
Distributions(b) | | | | | | | | | | | | | | | | | | | | | | | | |
From net investment income | | | | | | | (1.64 | ) | | | (0.21 | ) | | | (0.37 | ) | | | (0.37 | ) | | | (0.36 | ) |
From net realized gain | | | | | | | (2.19 | ) | | | (0.26 | ) | | | (0.82 | ) | | | (2.28 | ) | | | (0.86 | ) |
| | | | | | | | | | | | | | | | | | | | | | | | |
| | | | | | |
Total distributions | | | | | | | (3.83 | ) | | | (0.47 | ) | | | (1.19 | ) | | | (2.65 | ) | | | (1.22 | ) |
| | | | | | | | | | | | | | | | | | | | | | | | |
| | | | | | |
Net asset value, end of year | | | | | | $ | 22.87 | | | $ | 22.69 | | | $ | 20.31 | | | $ | 17.06 | | | $ | 21.47 | |
| | | | | | | | | | | | | | | | | | | | | | | | |
| | | | | | |
Total Return(c) | | | | | | | | | | | | | | | | | | | | | | | | |
Based on net asset value | | | | | | | 17.88 | % | | | 14.50 | % | | | 26.11 | % | | | (8.51 | )% | | | 22.48 | % |
| | | | | | | | | | | | | | | | | | | | | | | | |
| | | | | | |
Ratios to Average Net Assets(d) | | | | | | | | | | | | | | | | | | | | | | | | |
Total expenses | | | | | | | 1.09 | % | | | 1.04 | % | | | 0.81 | % | | | 0.81 | % | | | 0.79 | % |
| | | | | | | | | | | | | | | | | | | | | | | | |
| | | | | | |
Total expenses after fees waived and/or reimbursed | | | | | | | 0.79 | % | | | 0.79 | % | | | 0.80 | % | | | 0.80 | % | | | 0.78 | % |
| | | | | | | | | | | | | | | | | | | | | | | | |
| | | | | | |
Net investment income | | | | | | | 0.78 | % | | | 0.96 | % | | | 1.76 | % | | | 1.47 | % | | | 1.43 | % |
| | | | | | | | | | | | | | | | | | | | | | | | |
| | | | | | |
Supplemental Data | | | | | | | | | | | | | | | | | | | | | | | | |
Net assets, end of year (000) | | | | | | $ | 77,982 | | | $ | 73,608 | | | $ | 75,986 | | | $ | 70,181 | | | $ | 82,949 | |
| | | | | | | | | | | | | | | | | | | | | | | | |
| | | | | | |
Portfolio turnover rate | | | | | | | 1 | %(e) | | | 31 | %(f) | | | 42 | %(g) | | | 43 | %(g) | | | 35 | %(g) |
| | | | | | | | | | | | | | | | | | | | | | | | |
| (a) | Based on average shares outstanding. |
| (b) | Distributions for annual periods determined in accordance with U.S. federal income tax regulations. |
| (c) | Where applicable, excludes the effects of any sales charges and assumes the reinvestment of distributions. |
| (d) | Excludes fees and expenses incurred indirectly as a result of investments in underlying funds. |
| (e) | Includes the purchases and sales of the underlying funds and the Underlying Master Portfolios. |
| (f) | From January 1, 2020 through March 8, 2020, the rate includes the LifePath Dynamic Master Portfolio’s purchases and sales of the underlying funds and the Underlying Master Portfolios. Beginning March 9, 2020, the rate includes the LifePath Dynamic Fund’s purchases and sales of the underlying funds and the Underlying Master Portfolios. |
| (g) | Includes the LifePath Dynamic Master Portfolio’s purchases and sales of the underlying funds and Diversified Equity Master Portfolio, Advantage CoreAlpha Bond Master Portfolio, International Tilts Master Portfolio, Large Cap Index Master Portfolio, Master SmallCap Index Series and Master Total Return Portfolio. |
See notes to financial statements.
| | |
| 122 | | 2 0 2 1 BLACK ROCK ANNUAL REPORT TO SHAREHOLDERS |
Financial Highlights (continued)
(For a share outstanding throughout each period)
| | | | | | | | | | | | | | | | | | | | | | | | |
| | | | | | BlackRock LifePath® Dynamic 2050 Fund (continued) | |
| | |
| | | | | | Investor C | |
| | |
| | | | | | Year Ended December 31, | |
| | | | | | |
| | | | | | 2021 | | | 2020 | | | 2019 | | | 2018 | | | 2017 | |
| | | | | | |
Net asset value, beginning of year | | | | | | $ | 22.36 | | | $ | 20.02 | | | $ | 16.86 | | | $ | 21.26 | | | $ | 18.38 | |
| | | | | | | | | | | | | | | | | | | | | | | | |
| | | | | | |
Net investment income(a) | | | | | | | 0.01 | | | | 0.04 | | | | 0.20 | | | | 0.14 | | | | 0.14 | |
Net realized and unrealized gain (loss) | | | | | | | 3.75 | | | | 2.62 | | | | 4.02 | | | | (2.05 | ) | | | 3.81 | |
| | | | | | | | | | | | | | | | | | | | | | | | |
| | | | | | |
Net increase (decrease) from investment operations | | | | | | | 3.76 | | | | 2.66 | | | | 4.22 | | | | (1.91 | ) | | | 3.95 | |
| | | | | | | | | | | | | | | | | | | | | | | | |
| | | | | | |
Distributions(b) | | | | | | | | | | | | | | | | | | | | | | | | |
From net investment income | | | | | | | (1.51 | ) | | | (0.06 | ) | | | (0.24 | ) | | | (0.21 | ) | | | (0.21 | ) |
From net realized gain | | | | | | | (2.19 | ) | | | (0.26 | ) | | | (0.82 | ) | | | (2.28 | ) | | | (0.86 | ) |
| | | | | | | | | | | | | | | | | | | | | | | | |
| | | | | | |
Total distributions | | | | | | | (3.70 | ) | | | (0.32 | ) | | | (1.06 | ) | | | (2.49 | ) | | | (1.07 | ) |
| | | | | | | | | | | | | | | | | | | | | | | | |
| | | | | | |
Net asset value, end of year | | | | | | $ | 22.42 | | | $ | 22.36 | | | $ | 20.02 | | | $ | 16.86 | | | $ | 21.26 | |
| | | | | | | | | | | | | | | | | | | | | | | | |
| | | | | | |
Total Return(c) | | | | | | | | | | | | | | | | | | | | | | | | |
Based on net asset value | | | | | | | 17.00 | % | | | 13.60 | % | | | 25.10 | % | | | (9.25 | )% | | | 21.53 | % |
| | | | | | | | | | | | | | | | | | | | | | | | |
| | | | | | |
Ratios to Average Net Assets(d) | | | | | | | | | | | | | | | | | | | | | | | | |
Total expenses | | | | | | | 1.84 | % | | | 1.80 | % | | | 1.61 | % | | | 1.61 | % | | | 1.59 | % |
| | | | | | | | | | | | | | | | | | | | | | | | |
| | | | | | |
Total expenses after fees waived and/or reimbursed | | | | | | | 1.54 | % | | | 1.55 | % | | | 1.60 | % | | | 1.60 | % | | | 1.58 | % |
| | | | | | | | | | | | | | | | | | | | | | | | |
| | | | | | |
Net investment income | | | | | | | 0.05 | % | | | 0.19 | % | | | 1.01 | % | | | 0.68 | % | | | 0.66 | % |
| | | | | | | | | | | | | | | | | | | | | | | | |
| | | | | | |
Supplemental Data | | | | | | | | | | | | | | | | | | | | | | | | |
Net assets, end of year (000) | | | | | | $ | 2,002 | | | $ | 1,477 | | | $ | 1,774 | | | $ | 1,299 | | | $ | 1,211 | |
| | | | | | | | | | | | | | | | | | | | | | | | |
| | | | | | |
Portfolio turnover rate | | | | | | | 1 | %(e) | | | 31 | %(f) | | | 42 | %(g) | | | 43 | %(g) | | | 35 | %(g) |
| | | | | | | | | | | | | | | | | | | | | | | | |
| (a) | Based on average shares outstanding. |
| (b) | Distributions for annual periods determined in accordance with U.S. federal income tax regulations. |
| (c) | Where applicable, excludes the effects of any sales charges and assumes the reinvestment of distributions. |
| (d) | Excludes fees and expenses incurred indirectly as a result of investments in underlying funds. |
| (e) | Includes the purchases and sales of the underlying funds and the Underlying Master Portfolios. |
| (f) | From January 1, 2020 through March 8, 2020, the rate includes the LifePath Dynamic Master Portfolio’s purchases and sales of the underlying funds and the Underlying Master Portfolios. Beginning March 9, 2020, the rate includes the LifePath Dynamic Fund’s purchases and sales of the underlying funds and the Underlying Master Portfolios. |
| (g) | Includes the LifePath Dynamic Master Portfolio’s purchases and sales of the underlying funds and Diversified Equity Master Portfolio, Advantage CoreAlpha Bond Master Portfolio, International Tilts Master Portfolio, Large Cap Index Master Portfolio, Master SmallCap Index Series and Master Total Return Portfolio. |
See notes to financial statements.
Financial Highlights (continued)
(For a share outstanding throughout each period)
| | | | | | | | | | | | | | | | | | | | | | | | |
| | | BlackRock LifePath® Dynamic 2050 Fund (continued) | |
| |
| | | Class K | |
| |
| | | Year Ended December 31, | |
| | | | | | |
| | | | | | 2021 | | | 2020 | | | 2019 | | | 2018 | | | 2017 | |
| | | | | | | |
Net asset value, beginning of year | | | | | | $ | 22.86 | | | $ | 20.46 | | | $ | 17.18 | | | $ | 21.59 | | | $ | 18.63 | |
| | | | | | | | | | | | | | | | | | | | | | | | |
| | | | | | |
Net investment income(a) | | | | | | | 0.33 | | | | 0.29 | | | | 0.50 | | | | 0.37 | | | | 0.39 | |
Net realized and unrealized gain (loss) | | | | | | | 3.83 | | | | 2.68 | | | | 4.06 | | | | (2.05 | ) | | | 3.88 | |
| | | | | | | | | | | | | | | | | | | | | | | | |
| | | | | | |
Net increase (decrease) from investment operations | | | | | | | 4.16 | | | | 2.97 | | | | 4.56 | | | | (1.68 | ) | | | 4.27 | |
| | | | | | | | | | | | | | | | | | | | | | | | |
| | | | | | |
Distributions(b) | | | | | | | | | | | | | | | | | | | | | | | | |
From net investment income | | | | | | | (1.73 | ) | | | (0.31 | ) | | | (0.46 | ) | | | (0.45 | ) | | | (0.45 | ) |
From net realized gain | | | | | | | (2.19 | ) | | | (0.26 | ) | | | (0.82 | ) | | | (2.28 | ) | | | (0.86 | ) |
| | | | | | | | | | | | | | | | | | | | | | | | |
| | | | | | |
Total distributions | | | | | | | (3.92 | ) | | | (0.57 | ) | | | (1.28 | ) | | | (2.73 | ) | | | (1.31 | ) |
| | | | | | | | | | | | | | | | | | | | | | | | |
| | | | | | |
Net asset value, end of year | | | | | | $ | 23.10 | | | $ | 22.86 | | | $ | 20.46 | | | $ | 17.18 | | | $ | 21.59 | |
| | | | | | | | | | | | | | | | | | | | | | | | |
| | | | | | |
Total Return(c) | | | | | | | | | | | | | | | | | | | | | | | | |
Based on net asset value | | | | | | | 18.45 | % | | | 15.07 | % | | | 26.67 | % | | | (8.11 | )% | | | 23.07 | % |
| | | | | | | | | | | | | | | | | | | | | | | | |
| | | | | | |
Ratios to Average Net Assets(d) | | | | | | | | | | | | | | | | | | | | | | | | |
Total expenses | | | | | | | 0.59 | % | | | 0.55 | % | | | 0.36 | % | | | 0.36 | % | | | 0.34 | % |
| | | | | | | | | | | | | | | | | | | | | | | | |
| | | | | | |
Total expenses after fees waived and/or reimbursed | | | | | | | 0.29 | % | | | 0.30 | % | | | 0.35 | % | | | 0.35 | % | | | 0.33 | % |
| | | | | | | | | | | | | | | | | | | | | | | | |
| | | | | | |
Net investment income | | | | | | | 1.34 | % | | | 1.47 | % | | | 2.54 | % | | | 1.69 | % | | | 1.89 | % |
| | | | | | | | | | | | | | | | | | | | | | | | |
| | | | | | |
Supplemental Data | | | | | | | | | | | | | | | | | | | | | | | | |
Net assets, end of year (000) | | | | | | $ | 66,065 | | | $ | 35,574 | | | $ | 16,383 | | | $ | 4,504 | | | $ | 17,057 | |
| | | | | | | | | | | | | | | | | | | | | | | | |
| | | | | | |
Portfolio turnover rate | | | | | | | 1 | %(e) | | | 31 | %(f) | | | 42 | %(g) | | | 43 | %(g) | | | 35 | %(g) |
| | | | | | | | | | | | | | | | | | | | | | | | |
| (a) | Based on average shares outstanding. |
| (b) | Distributions for annual periods determined in accordance with U.S. federal income tax regulations. |
| (c) | Where applicable, assumes the reinvestment of distributions. |
| (d) | Excludes fees and expenses incurred indirectly as a result of investments in underlying funds. |
| (e) | Includes the purchases and sales of the underlying funds and the Underlying Master Portfolios. |
| (f) | From January 1, 2020 through March 8, 2020, the rate includes the LifePath Dynamic Master Portfolio’s purchases and sales of the underlying funds and the Underlying Master Portfolios. Beginning March 9, 2020, the rate includes the LifePath Dynamic Fund’s purchases and sales of the underlying funds and the Underlying Master Portfolios. |
| (g) | Includes the LifePath Dynamic Master Portfolio’s purchases and sales of the underlying funds and Diversified Equity Master Portfolio, Advantage CoreAlpha Bond Master Portfolio, International Tilts Master Portfolio, Large Cap Index Master Portfolio, Master SmallCap Index Series and Master Total Return Portfolio. |
See notes to financial statements.
| | |
| 124 | | 2 0 2 1 BLACK ROCK ANNUAL REPORT TO SHAREHOLDERS |
Financial Highlights (continued)
(For a share outstanding throughout each period)
| | | | | | | | | | | | | | | | | | | | | | | | |
| | | BlackRock LifePath® Dynamic 2050 Fund (continued) | |
| |
| | | Class R | |
| |
| | | Year Ended December 31, | |
| | | | | | |
| | | | | | 2021 | | | 2020 | | | 2019 | | | 2018 | | | 2017 | |
| | | | | | | |
Net asset value, beginning of year | | | | | | $ | 22.59 | | | $ | 20.23 | | | $ | 17.00 | | | $ | 21.42 | | | $ | 18.50 | |
| | | | | | | | | | | | | | | | | | | | | | | | |
| | | | | | |
Net investment income(a) | | | | | | | 0.15 | | | | 0.15 | | | | 0.31 | | | | 0.27 | | | | 0.25 | |
Net realized and unrealized gain (loss) | | | | | | | 3.80 | | | | 2.64 | | | | 4.08 | | | | (2.08 | ) | | | 3.85 | |
| | | | | | | | | | | | | | | | | | | | | | | | |
| | | | | | |
Net increase (decrease) from investment operations | | | | | | | 3.95 | | | | 2.79 | | | | 4.39 | | | | (1.81 | ) | | | 4.10 | |
| | | | | | | | | | | | | | | | | | | | | | | | |
| | | | | | |
Distributions(b) | | | | | | | | | | | | | | | | | | | | | | | | |
From net investment income | | | | | | | (1.61 | ) | | | (0.17 | ) | | | (0.34 | ) | | | (0.33 | ) | | | (0.32 | ) |
From net realized gain | | | | | | | (2.19 | ) | | | (0.26 | ) | | | (0.82 | ) | | | (2.28 | ) | | | (0.86 | ) |
| | | | | | | | | | | | | | | | | | | | | | | | |
| | | | | | |
Total distributions | | | | | | | (3.80 | ) | | | (0.43 | ) | | | (1.16 | ) | | | (2.61 | ) | | | (1.18 | ) |
| | | | | | | | | | | | | | | | | | | | | | | | |
| | | | | | |
Net asset value, end of year | | | | | | $ | 22.74 | | | $ | 22.59 | | | $ | 20.23 | | | $ | 17.00 | | | $ | 21.42 | |
| | | | | | | | | | | | | | | | | | | | | | | | |
| | | | | | |
Total Return(c) | | | | | | | | | | | | | | | | | | | | | | | | |
Based on net asset value | | | | | | | 17.65 | % | | | 14.23 | % | | | 25.92 | % | | | (8.74 | )% | | | 22.24 | % |
| | | | | | | | | | | | | | | | | | | | | | | | |
| | | | | | |
Ratios to Average Net Assets(d) | | | | | | | | | | | | | | | | | | | | | | | | |
Total expenses | | | | | | | 1.29 | % | | | 1.24 | % | | | 1.01 | % | | | 1.01 | % | | | 0.99 | % |
| | | | | | | | | | | | | | | | | | | | | | | | |
| | | | | | |
Total expenses after fees waived and/or reimbursed | | | | | | | 0.99 | % | | | 1.00 | % | | | 1.00 | % | | | 1.00 | % | | | 0.98 | % |
| | | | | | | | | | | | | | | | | | | | | | | | |
| | | | | | |
Net investment income | | | | | | | 0.60 | % | | | 0.77 | % | | | 1.57 | % | | | 1.29 | % | | | 1.22 | % |
| | | | | | | | | | | | | | | | | | | | | | | | |
| | | | | | |
Supplemental Data | | | | | | | | | | | | | | | | | | | | | | | | |
Net assets, end of year (000) | | | | | | $ | 3,149 | | | $ | 2,647 | | | $ | 2,558 | | | $ | 1,620 | | | $ | 1,548 | |
| | | | | | | | | | | | | | | | | | | | | | | | |
| | | | | | |
Portfolio turnover rate | | | | | | | 1 | %(e) | | | 31 | %(f) | | | 42 | %(g) | | | 43 | %(g) | | | 35 | %(g) |
| | | | | | | | | | | | | | | | | | | | | | | | |
| (a) | Based on average shares outstanding. |
| (b) | Distributions for annual periods determined in accordance with U.S. federal income tax regulations. |
| (c) | Where applicable, assumes the reinvestment of distributions. |
| (d) | Excludes fees and expenses incurred indirectly as a result of investments in underlying funds. |
| (e) | Includes the purchases and sales of the underlying funds and the Underlying Master Portfolios. |
| (f) | From January 1, 2020 through March 8, 2020, the rate includes the LifePath Dynamic Master Portfolio’s purchases and sales of the underlying funds and the Underlying Master Portfolios. Beginning March 9, 2020, the rate includes the LifePath Dynamic Fund’s purchases and sales of the underlying funds and the Underlying Master Portfolios. |
| (g) | Includes the LifePath Dynamic Master Portfolio’s purchases and sales of the underlying funds and Diversified Equity Master Portfolio, Advantage CoreAlpha Bond Master Portfolio, International Tilts Master Portfolio, Large Cap Index Master Portfolio, Master SmallCap Index Series and Master Total Return Portfolio. |
See notes to financial statements.
Financial Highlights (continued)
(For a share outstanding throughout each period)
| | | | | | | | | | | | | | | | | | | | | | | | |
| | | BlackRock LifePath® Dynamic 2055 Fund | |
| |
| | | Institutional | |
| |
| | | Year Ended December 31, | |
| | | | | | |
| | | | | | 2021 | �� | | 2020 | | | 2019 | | | 2018 | | | 2017 | |
| | | | | | | |
Net asset value, beginning of year | | | | | | $ | 17.94 | | | $ | 15.90 | | | $ | 13.19 | | | $ | 15.86 | | | $ | 14.28 | |
| | | | | | | | | | | | | | | | | | | | | | | | |
| | | | | | |
Net investment income(a) | | | | | | | 0.20 | | | | 0.20 | | | | 0.32 | | | | 0.26 | | | | 0.24 | |
Net realized and unrealized gain (loss) | | | | | | | 3.07 | | | | 2.18 | | | | 3.16 | | | | (1.56 | ) | | | 2.93 | |
| | | | | | | | | | | | | | | | | | | | | | | | |
| | | | | | |
Net increase (decrease) from investment operations | | | | | | | 3.27 | | | | 2.38 | | | | 3.48 | | | | (1.30 | ) | | | 3.17 | |
| | | | | | | | | | | | | | | | | | | | | | | | |
| | | | | | |
Distributions(b) | | | | | | | | | | | | | | | | | | | | | | | | |
From net investment income | | | | | | | (1.24 | ) | | | (0.21 | ) | | | (0.31 | ) | | | (0.29 | ) | | | (0.29 | ) |
From net realized gain | | | | | | | (1.07 | ) | | | (0.13 | ) | | | (0.46 | ) | | | (1.08 | ) | | | (1.30 | ) |
| | | | | | | | | | | | | | | | | | | | | | | | |
| | | | | | |
Total distributions | | | | | | | (2.31 | ) | | | (0.34 | ) | | | (0.77 | ) | | | (1.37 | ) | | | (1.59 | ) |
| | | | | | | | | | | | | | | | | | | | | | | | |
| | | | | | |
Net asset value, end of year | | | | | | $ | 18.90 | | | $ | 17.94 | | | $ | 15.90 | | | $ | 13.19 | | | $ | 15.86 | |
| | | | | | | | | | | | | | | | | | | | | | | | |
| | | | | | |
Total Return(c) | | | | | | | | | | | | | | | | | | | | | | | | |
Based on net asset value | | | | | | | 18.43 | % | | | 15.47 | % | | | 26.48 | % | | | (8.43 | )% | | | 22.57 | % |
| | | | | | | | | | | | | | | | | | | | | | | | |
| | | | | | |
Ratios to Average Net Assets(d) | | | | | | | | | | | | | | | | | | | | | | | | |
Total expenses | | | | | | | 0.87 | % | | | 0.85 | % | | | 0.59 | % | | | 0.61 | % | | | 0.59 | % |
| | | | | | | | | | | | | | | | | | | | | | | | |
| | | | | | |
Total expenses after fees waived and/or reimbursed | | | | | | | 0.54 | % | | | 0.54 | % | | | 0.54 | % | | | 0.55 | % | | | 0.52 | % |
| | | | | | | | | | | | | | | | | | | | | | | | |
| | | | | | |
Net investment income | | | | | | | 0.99 | % | | | 1.30 | % | | | 2.14 | % | | | 1.65 | % | | | 1.54 | % |
| | | | | | | | | | | | | | | | | | | | | | | | |
| | | | | | |
Supplemental Data | | | | | | | | | | | | | | | | | | | | | | | | |
Net assets, end of year (000) | | | | | | $ | 7,814 | | | $ | 6,308 | | | $ | 3,461 | | | $ | 1,748 | | | $ | 4,863 | |
| | | | | | | | | | | | | | | | | | | | | | | | |
| | | | | | |
Portfolio turnover rate | | | | | | | 2 | %(e) | | | 23 | %(f) | | | 54 | %(g) | | | 57 | %(g) | | | 59 | %(g) |
| | | | | | | | | | | | | | | | | | | | | | | | |
| (a) | Based on average shares outstanding. |
| (b) | Distributions for annual periods determined in accordance with U.S. federal income tax regulations. |
| (c) | Where applicable, assumes the reinvestment of distributions. |
| (d) | Excludes fees and expenses incurred indirectly as a result of investments in underlying funds. |
| (e) | Includes the purchases and sales of the underlying funds and the Underlying Master Portfolios. |
| (f) | From January 1, 2020 through March 8, 2020, the rate includes the LifePath Dynamic Master Portfolio’s purchases and sales of the underlying funds and the Underlying Master Portfolios. Beginning March 9, 2020, the rate includes the LifePath Dynamic Fund’s purchases and sales of the underlying funds and the Underlying Master Portfolios. |
| (g) | Includes the LifePath Dynamic Master Portfolio’s purchases and sales of the underlying funds and Diversified Equity Master Portfolio, Advantage CoreAlpha Bond Master Portfolio, International Tilts Master Portfolio, Large Cap Index Master Portfolio, Master Small Cap Index Series and Master Total Return Portfolio. |
See notes to financial statements.
| | |
| 126 | | 2 0 2 1 BLACK ROCK ANNUAL REPORT TO SHAREHOLDERS |
Financial Highlights (continued)
(For a share outstanding throughout each period)
| | | | | | | | | | | | | | | | | | | | | | | | |
| | | BlackRock LifePath® Dynamic 2055 Fund (continued) | |
| |
| | | Investor A | |
| |
| | | Year Ended December 31, | |
| | | | | | |
| | | | | | 2021 | | | 2020 | | | 2019 | | | 2018 | | | 2017 | |
| | | | | | | |
Net asset value, beginning of year | | | | | | $ | 17.85 | | | $ | 15.82 | | | $ | 13.13 | | | $ | 15.81 | | | $ | 14.25 | |
| | | | | | | | | | | | | | | | | | | | | | | | |
| | | | | | |
Net investment income(a) | | | | | | | 0.15 | | | | 0.16 | | | | 0.27 | | | | 0.24 | | | | 0.22 | |
Net realized and unrealized gain (loss) | | | | | | | 3.06 | | | | 2.17 | | | | 3.15 | | | | (1.57 | ) | | | 2.90 | |
| | | | | | | | | | | | | | | | | | | | | | | | |
| | | | | | |
Net increase (decrease) from investment operations | | | | | | | 3.21 | | | | 2.33 | | | | 3.42 | | | | (1.33 | ) | | | 3.12 | |
| | | | | | | | | | | | | | | | | | | | | | | | |
| | | | | | |
Distributions(b) | | | | | | | | | | | | | | | | | | | | | | | | |
From net investment income | | | | | | | (1.21 | ) | | | (0.17 | ) | | | (0.27 | ) | | | (0.27 | ) | | | (0.26 | ) |
From net realized gain | | | | | | | (1.07 | ) | | | (0.13 | ) | | | (0.46 | ) | | | (1.08 | ) | | | (1.30 | ) |
| | | | | | | | | | | | | | | | | | | | | | | | |
| | | | | | |
Total distributions | | | | | | | (2.28 | ) | | | (0.30 | ) | | | (0.73 | ) | | | (1.35 | ) | | | (1.56 | ) |
| | | | | | | | | | | | | | | | | | | | | | | | |
| | | | | | |
Net asset value, end of year | | | | | | $ | 18.78 | | | $ | 17.85 | | | $ | 15.82 | | | $ | 13.13 | | | $ | 15.81 | |
| | | | | | | | | | | | | | | | | | | | | | | | |
| | | | | | |
Total Return(c) | | | | | | | | | | | | | | | | | | | | | | | | |
Based on net asset value | | | | | | | 18.13 | % | | | 15.17 | % | | | 26.12 | % | | | (8.63 | )% | | | 22.24 | % |
| | | | | | | | | | | | | | | | | | | | | | | | |
| | | | | | |
Ratios to Average Net Assets(d) | | | | | | | | | | | | | | | | | | | | | | | | |
Total expenses | | | | | | | 1.12 | % | | | 1.09 | % | | | 0.85 | % | | | 0.86 | % | | | 0.85 | % |
| | | | | | | | | | | | | | | | | | | | | | | | |
| | | | | | |
Total expenses after fees waived and/or reimbursed | | | | | | | 0.79 | % | | | 0.80 | % | | | 0.80 | % | | | 0.80 | % | | | 0.78 | % |
| | | | | | | | | | | | | | | | | | | | | | | | |
| | | | | | |
Net investment income | | | | | | | 0.75 | % | | | 1.05 | % | | | 1.81 | % | | | 1.53 | % | | | 1.39 | % |
| | | | | | | | | | | | | | | | | | | | | | | | |
| | | | | | |
Supplemental Data | | | | | | | | | | | | | | | | | | | | | | | | |
Net assets, end of year (000) | | | | | | $ | 17,422 | | | $ | 15,871 | | | $ | 13,347 | | | $ | 11,583 | | | $ | 11,416 | |
| | | | | | | | | | | | | | | | | | | | | | | | |
| | | | | | |
Portfolio turnover rate | | | | | | | 2 | %(e) | | | 23 | %(f) | | | 54 | %(g) | | | 57 | %(g) | | | 59 | %(g) |
| | | | | | | | | | | | | | | | | | | | | | | | |
| (a) | Based on average shares outstanding. |
| (b) | Distributions for annual periods determined in accordance with U.S. federal income tax regulations. |
| (c) | Where applicable, excludes the effects of any sales charges and assumes the reinvestment of distributions. |
| (d) | Excludes fees and expenses incurred indirectly as a result of investments in underlying funds. |
| (e) | Includes the purchases and sales of the underlying funds and the Underlying Master Portfolios. |
| (f) | From January 1, 2020 through March 8, 2020, the rate includes the LifePath Dynamic Master Portfolio’s purchases and sales of the underlying funds and the Underlying Master Portfolios. Beginning March 9, 2020, the rate includes the LifePath Dynamic Fund’s purchases and sales of the underlying funds and the Underlying Master Portfolios. |
| (g) | Includes the LifePath Dynamic Master Portfolio’s purchases and sales of the underlying funds and Diversified Equity Master Portfolio, Advantage CoreAlpha Bond Master Portfolio, International Tilts Master Portfolio, Large Cap Index Master Portfolio, Master Small Cap Index Series and Master Total Return Portfolio. |
See notes to financial statements.
Financial Highlights (continued)
(For a share outstanding throughout each period)
| | | | | | | | | | | | | | | | | | | | | | | | |
| | | BlackRock LifePath® Dynamic 2055 Fund (continued) | |
| |
| | | Investor C | |
| |
| | | Year Ended December 31, | |
| | | | | | |
| | | | | | 2021 | | | 2020 | | | 2019 | | | 2018 | | | 2017 | |
| | | | | | | |
Net asset value, beginning of year | | | | | | $ | 17.59 | | | $ | 15.58 | | | $ | 12.95 | | | $ | 15.62 | | | $ | 14.11 | |
| | | | | | | | | | | | | | | | | | | | | | | | |
| | | | | | |
Net investment income(a) | | | | | | | (0.00 | )(b) | | | 0.04 | | | | 0.16 | | | | 0.12 | | | | 0.10 | |
Net realized and unrealized gain (loss) | | | | | | | 3.00 | | | | 2.15 | | | | 3.10 | | | | (1.56 | ) | | | 2.86 | |
| | | | | | | | | | | | | | | | | | | | | | | | |
| | | | | | |
Net increase (decrease) from investment operations | | | | | | | 3.00 | | | | 2.19 | | | | 3.26 | | | | (1.44 | ) | | | 2.96 | |
| | | | | | | | | | | | | | | | | | | | | | | | |
| | | | | | |
Distributions(c) | | | | | | | | | | | | | | | | | | | | | | | | |
From net investment income | | | | | | | (1.10 | ) | | | (0.05 | ) | | | (0.17 | ) | | | (0.15 | ) | | | (0.15 | ) |
From net realized gain | | | | | | | (1.07 | ) | | | (0.13 | ) | | | (0.46 | ) | | | (1.08 | ) | | | (1.30 | ) |
| | | | | | | | | | | | | | | | | | | | | | | | |
| | | | | | |
Total distributions | | | | | | | (2.17 | ) | | | (0.18 | ) | | | (0.63 | ) | | | (1.23 | ) | | | (1.45 | ) |
| | | | | | | | | | | | | | | | | | | | | | | | |
| | | | | | |
Net asset value, end of year | | | | | | $ | 18.42 | | | $ | 17.59 | | | $ | 15.58 | | | $ | 12.95 | | | $ | 15.62 | |
| | | | | | | | | | | | | | | | | | | | | | | | |
| | | | | | |
Total Return(d) | | | | | | | | | | | | | | | | | | | | | | | | |
Based on net asset value | | | | | | | 17.19 | % | | | 14.32 | % | | | 25.17 | % | | | (9.36 | )% | | | 21.24 | % |
| | | | | | | | | | | | | | | | | | | | | | | | |
| | | | | | |
Ratios to Average Net Assets(e) | | | | | | | | | | | | | | | | | | | | | | | | |
Total expenses | | | | | | | 1.87 | % | | | 1.84 | % | | | 1.65 | % | | | 1.66 | % | | | 1.65 | % |
| | | | | | | | | | | | | | | | | | | | | | | | |
| | | | | | |
Total expenses after fees waived and/or reimbursed | | | | | | | 1.54 | % | | | 1.56 | % | | | 1.60 | % | | | 1.60 | % | | | 1.58 | % |
| | | | | | | | | | | | | | | | | | | | | | | | |
| | | | | | |
Net investment income | | | | | | | (0.00 | )% | | | 0.27 | % | | | 1.08 | % | | | 0.75 | % | | | 0.62 | % |
| | | | | | | | | | | | | | | | | | | | | | | | |
| | | | | | |
Supplemental Data | | | | | | | | | | | | | | | | | | | | | | | | |
Net assets, end of year (000) | | | | | | $ | 1,340 | | | $ | 1,071 | | | $ | 1,212 | | | $ | 862 | | | $ | 729 | |
| | | | | | | | | | | | | | | | | | | | | | | | |
| | | | | | |
Portfolio turnover rate | | | | | | | 2 | %(f) | | | 23 | %(g) | | | 54 | %(h) | | | 57 | %(h) | | | 59 | %(h) |
| | | | | | | | | | | | | | | | | | | | | | | | |
| (a) | Based on average shares outstanding. |
| (b) | Amount is greater than $(0.005) per share. |
| (c) | Distributions for annual periods determined in accordance with U.S. federal income tax regulations. |
| (d) | Where applicable, excludes the effects of any sales charges and assumes the reinvestment of distributions. |
| (e) | Excludes fees and expenses incurred indirectly as a result of investments in underlying funds. |
| (f) | Includes the purchases and sales of the underlying funds and the Underlying Master Portfolios. |
| (g) | From January 1, 2020 through March 8, 2020, the rate includes the LifePath Dynamic Master Portfolio’s purchases and sales of the underlying funds and the Underlying Master Portfolios. Beginning March 9, 2020, the rate includes the LifePath Dynamic Fund’s purchases and sales of the underlying funds and the Underlying Master Portfolios. |
| (h) | Includes the LifePath Dynamic Master Portfolio’s purchases and sales of the underlying funds and Diversified Equity Master Portfolio, Advantage CoreAlpha Bond Master Portfolio, International Tilts Master Portfolio, Large Cap Index Master Portfolio, Master Small Cap Index Series and Master Total Return Portfolio. |
See notes to financial statements.
| | |
| 128 | | 2 0 2 1 BLACK ROCK ANNUAL REPORT TO SHAREHOLDERS |
Financial Highlights (continued)
(For a share outstanding throughout each period)
| | | | | | | | | | | | | | | | | | | | | | |
| | | BlackRock LifePath® Dynamic 2055 Fund (continued) | |
| |
| | | Class K | |
| |
| | | Year Ended December 31, | |
| | | | | |
| | | 2021 | | | 2020 | | | 2019 | | | 2018 | | | 2017 | |
| | | | | | | |
Net asset value, beginning of year | | | | $ | 18.19 | | | $ | 16.12 | | | $ | 13.36 | | | $ | 16.06 | | | $ | 14.45 | |
| | | | | | | | | | | | | | | | | | | | | | |
| | | | | | |
Net investment income(a) | | | | | 0.26 | | | | 0.25 | | | | 0.40 | | | | 0.32 | | | | 0.30 | |
Net realized and unrealized gain (loss) | | | | | 3.11 | | | | 2.20 | | | | 3.16 | | | | (1.60 | ) | | | 2.94 | |
| | | | | | | | | | | | | | | | | | | | | | |
| | | | | | |
Net increase (decrease) from investment operations | | | | | 3.37 | | | | 2.45 | | | | 3.56 | | | | (1.28 | ) | | | 3.24 | |
| | | | | | | | | | | | | | | | | | | | | | |
| | | | | | |
Distributions(b) | | | | | | | | | | | | | | | | | | | | | | |
From net investment income | | | | | (1.28 | ) | | | (0.25 | ) | | | (0.34 | ) | | | (0.34 | ) | | | (0.33 | ) |
From net realized gain | | | | | (1.07 | ) | | | (0.13 | ) | | | (0.46 | ) | | | (1.08 | ) | | | (1.30 | ) |
| | | | | | | | | | | | | | | | | | | | | | |
| | | | | | |
Total distributions | | | | | (2.35 | ) | | | (0.38 | ) | �� | | (0.80 | ) | | | (1.42 | ) | | | (1.63 | ) |
| | | | | | | | | | | | | | | | | | | | | | |
| | | | | | |
Net asset value, end of year | | | | $ | 19.21 | | | $ | 18.19 | | | $ | 16.12 | | | $ | 13.36 | | | $ | 16.06 | |
| | | | | | | | | | | | | | | | | | | | | | |
| | | | | | |
Total Return(c) | | | | | | | | | | | | | | | | | | | | | | |
Based on net asset value | | | | | 18.72 | % | | | 15.69 | % | | | 26.75 | % | | | (8.21 | )% | | | 22.79 | % |
| | | | | | | | | | | | | | | | | | | | | | |
| | | | | | |
Ratios to Average Net Assets(d) | | | | | | | | | | | | | | | | | | | | | | |
Total expenses | | | | | 0.62 | % | | | 0.60 | % | | | 0.39 | % | | | 0.41 | % | | | 0.40 | % |
| | | | | | | | | | | | | | | | | | | | | | |
| | | | | | |
Total expenses after fees waived and/or reimbursed | | | | | 0.29 | % | | | 0.30 | % | | | 0.34 | % | | | 0.35 | % | | | 0.33 | % |
| | | | | | | | | | | | | | | | | | | | | | |
| | | | | | |
Net investment income | | | | | 1.28 | % | | | 1.58 | % | | | 2.58 | % | | | 1.99 | % | | | 1.88 | % |
| | | | | | | | | | | | | | | | | | | | | | |
| | | | | | |
Supplemental Data | | | | | | | | | | | | | | | | | | | | | | |
Net assets, end of year (000) | | | | $ | 53,041 | | | $ | 30,189 | | | $ | 7,240 | | | $ | 1,920 | | | $ | 1,426 | |
| | | | | | | | | | | | | | | | | | | | | | |
| | | | | | |
Portfolio turnover rate | | | | | 2 | %(e) | | | 23 | %(f) | | | 54 | %(g) | | | 57 | %(g) | | | 59 | %(g) |
| | | | | | | | | | | | | | | | | | | | | | |
| (a) | Based on average shares outstanding. |
| (b) | Distributions for annual periods determined in accordance with U.S. federal income tax regulations. |
| (c) | Where applicable, assumes the reinvestment of distributions. |
| (d) | Excludes fees and expenses incurred indirectly as a result of investments in underlying funds. |
| (e) | Includes the purchases and sales of the underlying funds and the Underlying Master Portfolios. |
| (f) | From January 1, 2020 through March 8, 2020, the rate includes the LifePath Dynamic Master Portfolio’s purchases and sales of the underlying funds and the Underlying Master Portfolios. Beginning March 9, 2020, the rate includes the LifePath Dynamic Fund’s purchases and sales of the underlying funds and the Underlying Master Portfolios. |
| (g) | Includes the LifePath Dynamic Master Portfolio’s purchases and sales of the underlying funds and Diversified Equity Master Portfolio, Advantage CoreAlpha Bond Master Portfolio, International Tilts Master Portfolio, Large Cap Index Master Portfolio, Master Small Cap Index Series and Master Total Return Portfolio. |
See notes to financial statements.
Financial Highlights (continued)
(For a share outstanding throughout each period)
| | | | | | | | | | | | | | | | | | | | | | |
| | | BlackRock LifePath® Dynamic 2055 Fund (continued) | |
| |
| | | Class R | |
| |
| | | Year Ended December 31, | |
| | | | | |
| | | 2021 | | | 2020 | | | 2019 | | | 2018 | | | 2017 | |
| | | | | | | |
Net asset value, beginning of year | | | | $ | 17.82 | | | $ | 15.78 | | | $ | 13.11 | | | $ | 15.80 | | | $ | 14.25 | |
| | | | | | | | | | | | | | | | | | | | | | |
| | | | | | |
Net investment income(a) | | | | | 0.12 | | | | 0.13 | | | | 0.24 | | | | 0.21 | | | | 0.19 | |
Net realized and unrealized gain (loss) | | | | | 3.03 | | | | 2.17 | | | | 3.15 | | | | (1.58 | ) | | | 2.89 | |
| | | | | | | | | | | | | | | | | | | | | | |
| | | | | | |
Net increase (decrease) from investment operations | | | | | 3.15 | | | | 2.30 | | | | 3.39 | | | | (1.37 | ) | | | 3.08 | |
| | | | | | | | | | | | | | | | | | | | | | |
| | | | | | |
Distributions(b) | | | | | | | | | | | | | | | | | | | | | | |
From net investment income | | | | | (1.18 | ) | | | (0.13 | ) | | | (0.26 | ) | | | (0.24 | ) | | | (0.23 | ) |
From net realized gain | | | | | (1.07 | ) | | | (0.13 | ) | | | (0.46 | ) | | | (1.08 | ) | | | (1.30 | ) |
| | | | | | | | | | | | | | | | | | | | | | |
| | | | | | |
Total distributions | | | | | (2.25 | ) | | | (0.26 | ) | | | (0.72 | ) | | | (1.32 | ) | | | (1.53 | ) |
| | | | | | | | | | | | | | | | | | | | | | |
| | | | | | |
Net asset value, end of year | | | | $ | 18.72 | | | $ | 17.82 | | | $ | 15.78 | | | $ | 13.11 | | | $ | 15.80 | |
| | | | | | | | | | | | | | | | | | | | | | |
| | | | | | |
Total Return(c) | | | | | | | | | | | | | | | | | | | | | | |
Based on net asset value | | | | | 17.83 | % | | | 14.96 | % | | | 25.89 | % | | | (8.87 | )% | | | 21.95 | % |
| | | | | | | | | | | | | | | | | | | | | | |
| | | | | | |
Ratios to Average Net Assets(d) | | | | | | | | | | | | | | | | | | | | | | |
Total expenses | | | | | 1.32 | % | | | 1.28 | % | | | 1.04 | % | | | 1.06 | % | | | 1.05 | % |
| | | | | | | | | | | | | | | | | | | | | | |
| | | | | | |
Total expenses after fees waived and/or reimbursed | | | | | 0.99 | % | | | 1.00 | % | | | 1.00 | % | | | 1.00 | % | | | 0.98 | % |
| | | | | | | | | | | | | | | | | | | | | | |
| | | | | | |
Net investment income | | | | | 0.59 | % | | | 0.85 | % | | | 1.59 | % | | | 1.34 | % | | | 1.20 | % |
| | | | | | | | | | | | | | | | | | | | | | |
| | | | | | |
Supplemental Data | | | | | | | | | | | | | | | | | | | | | | |
Net assets, end of year (000) | | | | $ | 2,204 | | | $ | 1,306 | | | $ | 2,088 | | | $ | 859 | | | $ | 768 | |
| | | | | | | | | | | | | | | | | | | | | | |
| | | | | | |
Portfolio turnover rate | | | | | 2 | %(e) | | | 23 | %(f) | | | 54 | %(g) | | | 57 | %(g) | | | 59 | %(g) |
| | | | | | | | | | | | | | | | | | | | | | |
| (a) | Based on average shares outstanding. |
| (b) | Distributions for annual periods determined in accordance with U.S. federal income tax regulations. |
| (c) | Where applicable, assumes the reinvestment of distributions. |
| (d) | Excludes fees and expenses incurred indirectly as a result of investments in underlying funds. |
| (e) | Includes the purchases and sales of the underlying funds and the Underlying Master Portfolios. |
| (f) | From January 1, 2020 through March 8, 2020, the rate includes the LifePath Dynamic Master Portfolio’s purchases and sales of the underlying funds and the Underlying Master Portfolios. Beginning March 9, 2020, the rate includes the LifePath Dynamic Fund’s purchases and sales of the underlying funds and the Underlying Master Portfolios. |
| (g) | Includes the LifePath Dynamic Master Portfolio’s purchases and sales of the underlying funds and Diversified Equity Master Portfolio, Advantage CoreAlpha Bond Master Portfolio, International Tilts Master Portfolio, Large Cap Index Master Portfolio, Master Small Cap Index Series and Master Total Return Portfolio. |
See notes to financial statements.
| | |
| 130 | | 2 0 2 1 BLACK ROCK ANNUAL REPORT TO SHAREHOLDERS |
Financial Highlights (continued)
(For a share outstanding throughout each period)
| | | | | | | | | | | | | | | | | | | | | | | | |
| | | BlackRock LifePath® Dynamic 2060 Fund | |
| |
| | | Institutional | |
| | |
| | | | | |
| Period from
05/31/17 to 12/31/17 |
(a) |
| | | Year Ended December 31, | |
| | | | 2021 | | | | 2020 | | | | 2019 | | | | 2018 | |
| | | | | | | |
Net asset value, beginning of period | | | | | | $ | 12.85 | | | $ | 11.47 | | | $ | 9.34 | | | $ | 11.02 | | | $ | 10.00 | |
| | | | | | | | | | | | | | | | | | | | | | | | |
| | | | | | |
Net investment income(b) | | | | | | | 0.16 | | | | 0.16 | | | | 0.26 | | | | 0.19 | | | | 0.13 | |
| | | | | | |
Net realized and unrealized gain (loss) | | | | | | | 2.17 | | | | 1.44 | | | | 2.20 | | | | (1.13 | ) | | | 1.04 | |
| | | | | | | | | | | | | | | | | | | | | | | | |
| | | | | | |
Net increase (decrease) from investment operations | | | | | | | 2.33 | | | | 1.60 | | | | 2.46 | | | | (0.94 | ) | | | 1.17 | |
| | | | | | | | | | | | | | | | | | | | | | | | |
| | | | | | |
Distributions(c) | | | | | | | | | | | | | | | | | | | | | | | | |
From net investment income | | | | | | | (0.73 | ) | | | (0.17 | ) | | | (0.21 | ) | | | (0.24 | ) | | | (0.15 | ) |
From net realized gain | | | | | | | (0.52 | ) | | | (0.05 | ) | | | (0.12 | ) | | | (0.50 | ) | | | — | |
| | | | | | | | | | | | | | | | | | | | | | | | |
| | | | | | |
Total distributions | | | | | | | (1.25 | ) | | | (0.22 | ) | | | (0.33 | ) | | | (0.74 | ) | | | (0.15 | ) |
| | | | | | | | | | | | | | | | | | | | | | | | |
| | | | | | |
Net asset value, end of period | | | | | | $ | 13.93 | | | $ | 12.85 | | | $ | 11.47 | | | $ | 9.34 | | | $ | 11.02 | |
| | | | | | | | | | | | | | | | | | | | | | | | |
| | | | | | |
Total Return(d) | | | | | | | | | | | | | | | | | | | | | | | | |
| | | | | | |
Based on net asset value | | | | | | | 18.14 | % | | | 14.34 | % | | | 26.47 | %(e) | | | (8.64 | )% | | | 11.71 | %(f) |
| | | | | | | | | | | | | | | | | | | | | | | | |
| | | | | | |
Ratios to Average Net Assets(g) | | | | | | | | | | | | | | | | | | | | | | | | |
| | | | | | |
Total expenses | | | | | | | 1.05 | % | | | 1.12 | % | | | 0.92 | % | | | 1.10 | % | | | 1.03 | %(h)(i) |
| | | | | | | | | | | | | | | | | | | | | | | | |
| | | | | | |
Total expenses after fees waived and/or reimbursed | | | | | | | 0.52 | % | | | 0.52 | % | | | 0.54 | % | | | 0.55 | % | | | 0.56 | %(h) |
| | | | | | | | | | | | | | | | | | | | | | | | |
| | | | | | |
Net investment income | | | | | | | 1.09 | % | | | 1.40 | % | | | 2.39 | % | | | 1.73 | % | | | 2.07 | %(h) |
| | | | | | | | | | | | | | | | | | | | | | | | |
| | | | | | |
Supplemental Data | | | | | | | | | | | | | | | | | | | | | | | | |
Net assets, end of period (000) | | | | | | $ | 1,314 | | | $ | 1,197 | | | $ | 237 | | | $ | 19 | | | $ | 27 | |
| | | | | | | | | | | | | | | | | | | | | | | | |
| | | | | | |
Portfolio turnover rate | | | | | | | 5 | %(j) | | | 18 | %(k) | | | 44 | %(l) | | | 58 | %(l) | | | 35 | %(l) |
| | | | | | | | | | | | | | | | | | | | | | | | |
| (a) | Commencement of operations. |
| (b) | Based on average shares outstanding. |
| (c) | Distributions for annual periods determined in accordance with U.S. federal income tax regulations. |
| (d) | Where applicable, assumes the reinvestment of distributions. |
| (e) | Includes payment received from an affiliate, which impacted the Fund’s total return. Excluding the payment from an affiliate, the Fund’s total return is 26.36%. |
| (f) | Aggregate total return. |
| (g) | Excludes fees and expenses incurred indirectly as a result of investments in underlying funds. |
| (i) | Audit costs were not annualized in the calculation of the expense ratio. If these expenses were annualized, the total expenses would have been 1.37%. |
| (j) | Includes the purchases and sales of the underlying funds and the Underlying Master Portfolios. |
| (k) | From January 1, 2020 through March 8, 2020, the rate includes the LifePath Dynamic Master Portfolio’s purchases and sales of the underlying funds and the Underlying Master Portfolios. Beginning March 9, 2020, the rate includes the LifePath Dynamic Fund’s purchases and sales of the underlying funds and the Underlying Master Portfolios. |
| (l) | Includes the LifePath Dynamic Master Portfolio’s purchases and sales of the underlying funds and Diversified Equity Master Portfolio, Advantage CoreAlpha Bond Master Portfolio, International Tilts Master Portfolio and Master Total Return Portfolio. |
See notes to financial statements.
Financial Highlights (continued)
(For a share outstanding throughout each period)
| | | | | | | | | | | | | | | | | | | | | | | | |
| | | BlackRock LifePath® Dynamic 2060 Fund (continued) | |
| |
| | | Investor A | |
| | |
| | | | | |
| Period from
05/31/17 to 12/31/17 |
(a) |
| | | Year Ended December 31, | |
| | | | 2021 | | | | 2020 | | | | 2019 | | | | 2018 | |
| | | | | | | |
Net asset value, beginning of period | | | | | | $ | 12.84 | | | $ | 11.46 | | | $ | 9.33 | | | $ | 11.02 | | | $ | 10.00 | |
| | | | | | | | | | | | | | | | | | | | | | | | |
| | | | | | |
Net investment income(b) | | | | | | | 0.12 | | | | 0.12 | | | | 0.23 | | | | 0.17 | | | | 0.11 | |
| | | | | | |
Net realized and unrealized gain (loss) | | | | | | | 2.17 | | | | 1.45 | | | | 2.21 | | | | (1.13 | ) | | | 1.04 | |
| | | | | | | | | | | | | | | | | | | | | | | | |
| | | | | | |
Net increase (decrease) from investment operations | | | | | | | 2.29 | | | | 1.57 | | | | 2.44 | | | | (0.96 | ) | | | 1.15 | |
| | | | | | | | | | | | | | | | | | | | | | | | |
| | | | | | |
Distributions(c) | | | | | | | | | | | | | | | | | | | | | | | | |
From net investment income | | | | | | | (0.70 | ) | | | (0.14 | ) | | | (0.19 | ) | | | (0.23 | ) | | | (0.13 | ) |
From net realized gain | | | | | | | (0.52 | ) | | | (0.05 | ) | | | (0.12 | ) | | | (0.50 | ) | | | — | |
| | | | | | | | | | | | | | | | | | | | | | | | |
| | | | | | |
Total distributions | | | | | | | (1.22 | ) | | | (0.19 | ) | | | (0.31 | ) | | | (0.73 | ) | | | (0.13 | ) |
| | | | | | | | | | | | | | | | | | | | | | | | |
| | | | | | |
Net asset value, end of period | | | | | | $ | 13.91 | | | $ | 12.84 | | | $ | 11.46 | | | $ | 9.33 | | | $ | 11.02 | |
| | | | | | | | | | | | | | | | | | | | | | | | |
| | | | | | |
Total Return(d) | | | | | | | | | | | | | | | | | | | | | | | | |
| | | | | | |
Based on net asset value | | | | | | | 17.87 | % | | | 14.03 | % | | | 26.20 | %(e) | | | (8.90 | )% | | | 11.56 | %(f) |
| | | | | | | | | | | | | | | | | | | | | | | | |
| | | | | | |
Ratios to Average Net Assets(g) | | | | | | | | | | | | | | | | | | | | | | | | |
| | | | | | |
Total expenses | | | | | | | 1.30 | % | | | 1.36 | % | | | 1.17 | % | | | 1.36 | % | | | 1.29 | %(h)(i) |
| | | | | | | | | | | | | | | | | | | | | | | | |
| | | | | | |
Total expenses after fees waived and/or reimbursed | | | | | | | 0.77 | % | | | 0.80 | % | | | 0.79 | % | | | 0.80 | % | | | 0.82 | %(h) |
| | | | | | | | | | | | | | | | | | | | | | | | |
| | | | | | |
Net investment income | | | | | | | 0.84 | % | | | 1.14 | % | | | 2.11 | % | | | 1.61 | % | | | 1.76 | %(h) |
| | | | | | | | | | | | | | | | | | | | | | | | |
| | | | | | |
Supplemental Data | | | | | | | | | | | | | | | | | | | | | | | | |
Net assets, end of period (000) | | | | | | $ | 1,054 | | | $ | 580 | | | $ | 390 | | | $ | 75 | | | $ | 28 | |
| | | | | | | | | | | | | | | | | | | | | | | | |
| | | | | | |
Portfolio turnover rate | | | | | | | 5 | %(j) | | | 18 | %(k) | | | 44 | %(l) | | | 58 | %(l) | | | 35 | %(l) |
| | | | | | | | | | | | | | | | | | | | | | | | |
| (a) | Commencement of operations. |
| (b) | Based on average shares outstanding. |
| (c) | Distributions for annual periods determined in accordance with U.S. federal income tax regulations. |
| (d) | Where applicable, excludes the effects of any sales charges and assumes the reinvestment of distributions. |
| (e) | Includes payment received from an affiliate, which impacted the Fund’s total return. Excluding the payment from an affiliate, the Fund’s total return is 26.09%. |
| (f) | Aggregate total return. |
| (g) | Excludes fees and expenses incurred indirectly as a result of investments in underlying funds. |
| (i) | Audit costs were not annualized in the calculation of the expense ratio. If these expenses were annualized, the total expenses would have been 1.62%. |
| (j) | Includes the purchases and sales of the underlying funds and the Underlying Master Portfolios. |
| (k) | From January 1, 2020 through March 8, 2020, the rate includes the LifePath Dynamic Master Portfolio’s purchases and sales of the underlying funds and the Underlying Master Portfolios. Beginning March 9, 2020, the rate includes the LifePath Dynamic Fund’s purchases and sales of the underlying funds and the Underlying Master Portfolios. |
| (l) | Includes the LifePath Dynamic Master Portfolio’s purchases and sales of the underlying funds and Diversified Equity Master Portfolio, Advantage CoreAlpha Bond Master Portfolio, International Tilts Master Portfolio and Master Total Return Portfolio. |
See notes to financial statements.
| | |
| 132 | | 2 0 2 1 BLACK ROCK ANNUAL REPORT TO SHAREHOLDERS |
Financial Highlights (continued)
(For a share outstanding throughout each period)
| | | | | | | | | | | | | | | | | | | | | | | | |
| | | BlackRock LifePath® Dynamic 2060 Fund (continued) | |
| |
| | | Investor C | |
| | |
| | | | | |
| Period from
05/31/17 to 12/31/17 |
(a) |
| | | Year Ended December 31, | |
| | | | 2021 | | | | 2020 | | | | 2019 | | | | 2018 | |
| | | | | | | |
Net asset value, beginning of period | | | | | | $ | 12.83 | | | $ | 11.45 | | | $ | 9.34 | | | $ | 11.02 | | | $ | 10.00 | |
| | | | | | | | | | | | | | | | | | | | | | | | |
| | | | | | |
Net investment income(b) | | | | | | | 0.02 | | | | 0.04 | | | | 0.11 | | | | 0.08 | | | | 0.06 | |
| | | | | | |
Net realized and unrealized gain (loss) | | | | | | | 2.16 | | | | 1.45 | | | | 2.23 | | | | (1.13 | ) | | | 1.05 | |
| | | | | | | | | | | | | | | | | | | | | | | | |
| | | | | | |
Net increase (decrease) from investment operations | | | | | | | 2.18 | | | | 1.49 | | | | 2.34 | | | | (1.05 | ) | | | 1.11 | |
| | | | | | | | | | | | | | | | | | | | | | | | |
| | | | | | |
Distributions(c) | | | | | | | | | | | | | | | | | | | | | | | | |
From net investment income | | | | | | | (0.63 | ) | | | (0.06 | ) | | | (0.11 | ) | | | (0.13 | ) | | | (0.09 | ) |
From net realized gain | | | | | | | (0.52 | ) | | | (0.05 | ) | | | (0.12 | ) | | | (0.50 | ) | | | — | |
| | | | | | | | | | | | | | | | | | | | | | | | |
| | | | | | |
Total distributions | | | | | | | (1.15 | ) | | | (0.11 | ) | | | (0.23 | ) | | | (0.63 | ) | | | (0.09 | ) |
| | | | | | | | | | | | | | | | | | | | | | | | |
| | | | | | |
Net asset value, end of period | | | | | | $ | 13.86 | | | $ | 12.83 | | | $ | 11.45 | | | $ | 9.34 | | | $ | 11.02 | |
| | | | | | | | | | | | | | | | | | | | | | | | |
| | | | | | |
Total Return(d) | | | | | | | | | | | | | | | | | | | | | | | | |
| | | | | | |
Based on net asset value | | | | | | | 16.98 | % | | | 13.16 | % | | | 25.09 | %(e) | | | (9.60 | )% | | | 11.07 | %(f) |
| | | | | | | | | | | | | | | | | | | | | | | | |
| | | | | | |
Ratios to Average Net Assets(g) | | | | | | | | | | | | | | | | | | | | | | | | |
| | | | | | |
Total expenses | | | | | | | 2.05 | % | | | 2.11 | % | | | 2.03 | % | | | 2.16 | % | | | 2.08 | %(h)(i) |
| | | | | | | | | | | | | | | | | | | | | | | | |
| | | | | | |
Total expenses after fees waived and/or reimbursed | | | | | | | 1.51 | % | | | 1.55 | % | | | 1.61 | % | | | 1.60 | % | | | 1.61 | %(h) |
| | | | | | | | | | | | | | | | | | | | | | | | |
| | | | | | |
Net investment income | | | | | | | 0.11 | % | | | 0.38 | % | | | 1.07 | % | | | 0.71 | % | | | 0.94 | %(h) |
| | | | | | | | | | | | | | | | | | | | | | | | |
| | | | | | |
Supplemental Data | | | | | | | | | | | | | | | | | | | | | | | | |
Net assets, end of period (000) | | | | | | $ | 96 | | | $ | 45 | | | $ | 33 | | | $ | 25 | | | $ | 28 | |
| | | | | | | | | | | | | | | | | | | | | | | | |
| | | | | | |
Portfolio turnover rate | | | | | | | 5 | %(j) | | | 18 | %(k) | | | 44 | %(l) | | | 58 | %(l) | | | 35 | %(l) |
| | | | | | | | | | | | | | | | | | | | | | | | |
| (a) | Commencement of operations. |
| (b) | Based on average shares outstanding. |
| (c) | Distributions for annual periods determined in accordance with U.S. federal income tax regulations. |
| (d) | Where applicable, excludes the effects of any sales charges and assumes the reinvestment of distributions. |
| (e) | Includes payment from an affiliate, which had no impact on the Fund’s total return. |
| (f) | Aggregate total return. |
| (g) | Excludes fees and expenses incurred indirectly as a result of investments in underlying funds. |
| (i) | Audit costs were not annualized in the calculation of the expense ratio. If these expenses were annualized, the total expenses would have been 2.41%. |
| (j) | Includes the purchases and sales of the underlying funds and the Underlying Master Portfolios. |
| (k) | From January 1, 2020 through March 8, 2020, the rate includes the LifePath Dynamic Master Portfolio’s purchases and sales of the underlying funds and the Underlying Master Portfolios. Beginning March 9, 2020, the rate includes the LifePath Dynamic Fund’s purchases and sales of the underlying funds and the Underlying Master Portfolios. |
| (l) | Includes the LifePath Dynamic Master Portfolio’s purchases and sales of the underlying funds and Diversified Equity Master Portfolio, Advantage CoreAlpha Bond Master Portfolio, International Tilts Master Portfolio and Master Total Return Portfolio. |
See notes to financial statements.
Financial Highlights (continued)
(For a share outstanding throughout each period)
| | | | | | | | | | | | | | | | | | | | | | | | |
| | | | | | BlackRock LifePath® Dynamic 2060 Fund (continued) | |
| | |
| | | | | | Class K | |
| | | | | | |
| | | | | | | | | | | | | | | | | | | | | |
| Period from
05/31/17 to 12/31/17 |
(a) |
| | | | | | | Year Ended December 31, | |
| | | | | | 2021 | | | 2020 | | | 2019 | | | 2018 | |
| | | | | | |
Net asset value, beginning of period | | | | | | $ | 12.87 | | | $ | 11.48 | | | $ | 9.34 | | | $ | 11.02 | | | $ | 10.00 | |
| | | | | | | | | | | | | | | | | | | | | | | | |
| | | | | | |
Net investment income(b) | | | | | | | 0.19 | | | | 0.18 | | | | 0.26 | | | | 0.22 | | | | 0.13 | |
Net realized and unrealized gain (loss) | | | | | | | 2.17 | | | | 1.45 | | | | 2.23 | | | | (1.13 | ) | | | 1.05 | |
| | | | | | | | | | | | | | | | | | | | | | | | |
| | | | | | |
Net increase (decrease) from investment operations | | | | | | | 2.36 | | | | 1.63 | | | | 2.49 | | | | (0.91 | ) | | | 1.18 | |
| | | | | | | | | | | | | | | | | | | | | | | | |
| | | | | | |
Distributions(c) | | | | | | | | | | | | | | | | | | | | | | | | |
From net investment income | | | | | | | (0.76 | ) | | | (0.19 | ) | | | (0.23 | ) | | | (0.27 | ) | | | (0.16 | ) |
From net realized gain | | | | | | | (0.52 | ) | | | (0.05 | ) | | | (0.12 | ) | | | (0.50 | ) | | | — | |
| | | | | | | | | | | | | | | | | | | | | | | | |
| | | | | | |
Total distributions | | | | | | | (1.28 | ) | | | (0.24 | ) | | | (0.35 | ) | | | (0.77 | ) | | | (0.16 | ) |
| | | | | | | | | | | | | | | | | | | | | | | | |
| | | | | | |
Net asset value, end of period. | | | | | | $ | 13.95 | | | $ | 12.87 | | | $ | 11.48 | | | $ | 9.34 | | | $ | 11.02 | |
| | | | | | | | | | | | | | | | | | | | | | | | |
| | | | | | |
Total Return(d) | | | | | | | | | | | | | | | | | | | | | | | | |
Based on net asset value | | | | | | | 18.43 | % | | | 14.62 | % | | | 26.74 | %(e) | | | (8.45 | )% | | | 11.82 | %(f) |
| | | | | | | | | | | | | | | | | | | | | | | | |
| | | | | | |
Ratios to Average Net Assets(g) | | | | | | | | | | | | | | | | | | | | | | | | |
Total expenses | | | | | | | 0.80 | % | | | 0.87 | % | | | 0.77 | % | | | 0.90 | % | | | 0.82 | %(h)(i) |
| | | | | | | | | | | | | | | | | | | | | | | | |
| | | | | | |
Total expenses after fees waived and/or reimbursed | | | | | | | 0.27 | % | | | 0.29 | % | | | 0.36 | % | | | 0.35 | % | | | 0.35 | %(h) |
| | | | | | | | | | | | | | | | | | | | | | | | |
| | | | | | |
Net investment income | | | | | | | 1.34 | % | | | 1.62 | % | | | 2.40 | % | | | 1.96 | % | | | 2.11 | %(h) |
| | | | | | | | | | | | | | | | | | | | | | | | |
| | | | | | |
Supplemental Data | | | | | | | | | | | | | | | | | | | | | | | | |
Net assets, end of period (000) | | | | | | $ | 17,030 | | | $ | 8,747 | | | $ | 3,384 | | | $ | 1,862 | | | $ | 2,116 | |
| | | | | | | | | | | | | | | | | | | | | | | | |
| | | | | | |
Portfolio turnover rate | | | | | | | 5 | %(j) | | | 18 | %(k) | | | 44 | %(l) | | | 58 | %(l) | | | 35 | %(l) |
| | | | | | | | | | | | | | | | | | | | | | | | |
| (a) | Commencement of operations. |
| (b) | Based on average shares outstanding. |
| (c) | Distributions for annual periods determined in accordance with U.S. federal income tax regulations. |
| (d) | Where applicable, assumes the reinvestment of distributions. |
| (e) | Includes payment received from an affiliate, which impacted the Fund’s total return. Excluding the payment from an affiliate, the Fund’s total return is 26.64%. |
| (f) | Aggregate total return. |
| (g) | Excludes fees and expenses incurred indirectly as a result of investments in underlying funds. |
| (i) | Audit costs were not annualized in the calculation of the expense ratio. If these expenses were annualized, the total expenses would have been 1.15%. |
| (j) | Includes the purchases and sales of the underlying funds and the Underlying Master Portfolios. |
| (k) | From January 1, 2020 through March 8, 2020, the rate includes the LifePath Dynamic Master Portfolio’s purchases and sales of the underlying funds and the Underlying Master Portfolios. Beginning March 9, 2020, the rate includes the LifePath Dynamic Fund’s purchases and sales of the underlying funds and the Underlying Master Portfolios. |
| (l) | Includes the LifePath Dynamic Master Portfolio’s purchases and sales of the underlying funds and Diversified Equity Master Portfolio, Advantage CoreAlpha Bond Master Portfolio, International Tilts Master Portfolio and Master Total Return Portfolio. |
See notes to financial statements.
| | |
| 134 | | 2 0 2 1 BLACK ROCK ANNUAL REPORT TO SHAREHOLDERS |
Financial Highlights (continued)
(For a share outstanding throughout each period)
| | | | | | | | | | | | | | | | | | | | | | | | |
| | | | | | BlackRock LifePath® Dynamic 2060 Fund (continued) | |
| | |
| | | | | | Class R | |
| | | | | | |
| | | | | | | | | | | | | | | | | | | | | |
| Period from
05/31/17 to 12/31/17 |
(a) |
| | | | | | | Year Ended December 31, | |
| | | | | | 2021 | | | 2020 | | | 2019 | | | 2018 | |
| | | | | | |
Net asset value, beginning of period | | | | | | $ | 12.85 | | | $ | 11.46 | | | $ | 9.34 | | | $ | 11.02 | | | $ | 10.00 | |
| | | | | | | | | | | | | | | | | | | | | | | | |
| | | | | | |
Net investment income(b) | | | | | | | 0.09 | | | | 0.10 | | | | 0.40 | | | | 0.15 | | | | 0.10 | |
Net realized and unrealized gain (loss) | | | | | | | 2.17 | | | | 1.45 | | | | 2.02 | | | | (1.13 | ) | | | 1.04 | |
| | | | | | | | | | | | | | | | | | | | | | | | |
| | | | | | |
Net increase (decrease) from investment operations | | | | | | | 2.26 | | | | 1.55 | | | | 2.42 | | | | (0.98 | ) | | | 1.14 | |
| | | | | | | | | | | | | | | | | | | | | | | | |
| | | | | | |
Distributions(c) | | | | | | | | | | | | | | | | | | | | | | | | |
From net investment income | | | | | | | (0.68 | ) | | | (0.11 | ) | | | (0.18 | ) | | | (0.20 | ) | | | (0.12 | ) |
From net realized gain | | | | | | | (0.52 | ) | | | (0.05 | ) | | | (0.12 | ) | | | (0.50 | ) | | | — | |
| | | | | | | | | | | | | | | | | | | | | | | | |
| | | | | | |
Total distributions | | | | | | | (1.20 | ) | | | (0.16 | ) | | | (0.30 | ) | | | (0.70 | ) | | | (0.12 | ) |
| | | | | | | | | | | | | | | | | | | | | | | | |
| | | | | | |
Net asset value, end of period | | | | | | $ | 13.91 | | | $ | 12.85 | | | $ | 11.46 | | | $ | 9.34 | | | $ | 11.02 | |
| | | | | | | | | | | | | | | | | | | | | | | | |
| | | | | | |
Total Return(d) | | | | | | | | | | | | | | | | | | | | | | | | |
Based on net asset value | | | | | | | 17.63 | % | | | 13.84 | % | | | 25.92 | %(e) | | | (9.05 | )% | | | 11.40 | %(f) |
| | | | | | | | | | | | | | | | | | | | | | | | |
| | | | | | |
Ratios to Average Net Assets(g) | | | | | | | | | | | | | | | | | | | | | | | | |
Total expenses | | | | | | | 1.50 | % | | | 1.56 | % | | | 1.37 | % | | | 1.55 | % | | | 1.49 | %(h)(i) |
| | | | | | | | | | | | | | | | | | | | | | | | |
| | | | | | |
Total expenses after fees waived and/or reimbursed | | | | | | | 0.97 | % | | | 0.98 | % | | | 0.99 | % | | | 1.00 | % | | | 1.01 | %(h) |
| | | | | | | | | | | | | | | | | | | | | | | | |
| | | | | | |
Net investment income | | | | | | | 0.66 | % | | | 0.89 | % | | | 3.67 | % | | | 1.30 | % | | | 1.55 | %(h) |
| | | | | | | | | | | | | | | | | | | | | | | | |
| | | | | | |
Supplemental Data | | | | | | | | | | | | | | | | | | | | | | | | |
Net assets, end of period (000) | | | | | | $ | 817 | | | $ | 359 | | | $ | 185 | | | $ | 19 | | | $ | 22 | |
| | | | | | | | | | | | | | | | | | | | | | | | |
| | | | | | |
Portfolio turnover rate | | | | | | | 5 | %(j) | | | 18 | %(k) | | | 44 | %(l) | | | 58 | %(l) | | | 35 | %(l) |
| | | | | | | | | | | | | | | | | | | | | | | | |
| (a) | Commencement of operations. |
| (b) | Based on average shares outstanding. |
| (c) | Distributions for annual periods determined in accordance with U.S. federal income tax regulations. |
| (d) | Where applicable, assumes the reinvestment of distributions. |
| (e) | Includes payment received from an affiliate, which impacted the Fund’s total return. Excluding the payment from an affiliate, the Fund’s total return is 25.81%. |
| (f) | Aggregate total return. |
| (g) | Excludes fees and expenses incurred indirectly as a result of investments in underlying funds. |
| (i) | Audit costs were not annualized in the calculation of the expense ratio. If these expenses were annualized, the total expenses would have been 1.82% |
| (j) | Includes the purchases and sales of the underlying funds and the Underlying Master Portfolios. |
| (k) | From January 1, 2020 through March 8, 2020, the rate includes the LifePath Dynamic Master Portfolio’s purchases and sales of the underlying funds and the Underlying Master Portfolios. Beginning March 9, 2020, the rate includes the LifePath Dynamic Fund’s purchases and sales of the underlying funds and the Underlying Master Portfolios. |
| (l) | Includes the LifePath Dynamic Master Portfolio’s purchases and sales of the underlying funds and Diversified Equity Master Portfolio, Advantage CoreAlpha Bond Master Portfolio, International Tilts Master Portfolio and Master Total Return Portfolio. |
See notes to financial statements.
Financial Highlights (continued)
(For a share outstanding throughout each period)
| | | | | | | | | | | | | | | | | | | | |
| | | | | | BlackRock LifePath® Dynamic 2065 Fund | |
| | |
| | | | | | Institutional | |
| | | |
| | | | | | | | | |
| Period from
10/30/19 to 12/31/19 |
(a) |
| | | | | | | Year Ended December 31, | |
| | | | | | 2021 | | | 2020 | |
| | | | | |
Net asset value, beginning of period | | | | | | $ | 11.74 | | | | | | | $ | 10.47 | | | $ | 10.00 | |
| | | | | | | | | | | | | | | | | | | | |
| | | | | |
Net investment income(b) | | | | | | | 0.14 | | | | | | | | 0.13 | | | | 0.07 | |
Net realized and unrealized gain | | | | | | | 2.02 | | | | | | | | 1.30 | | | | 0.47 | |
| | | | | | | | | | | | | | | | | | | | |
Net increase from investment operations | | | | | | | 2.16 | | | | | | | | 1.43 | | | | 0.54 | |
| | | | | | | | | | | | | | | | | | | | |
| | | | | |
Distributions(c) | | | | | | | | | | | | | | | | | | | | |
From net investment income | | | | | | | (0.78 | ) | | | | | | | (0.16 | ) | | | (0.07 | ) |
From net realized gain | | | | | | | (0.45 | ) | | | | | | | — | | | | — | |
| | | | | | | | | | | | | | | | | | | | |
| | | | | |
Total distributions | | | | | | | (1.23 | ) | | | | | | | (0.16 | ) | | | (0.07 | ) |
| | | | | | | | | | | | | | | | | | | | |
| | | | | |
Net asset value, end of period | | | | | | $ | 12.67 | | | | | | | $ | 11.74 | | | $ | 10.47 | |
| | | | | | | | | | | | | | | | | | | | |
| | | | | |
Total Return(d) | | | | | | | | | | | | | | | | | | | | |
Based on net asset value | | | | | | | 18.43 | % | | | | | | | 13.99 | % | | | 5.36 | %(e) |
| | | | | | | | | | | | | | | | | | | | |
| | | | | |
Ratios to Average Net Assets(f) | | | | | | | | | | | | | | | | | | | | |
Total expenses | | | | | | | 1.47 | % | | | | | | | 1.23 | % | | | 0.83 | %(g)(h) |
| | | | | | | | | | | | | | | | | | | | |
| | | | | |
Total expenses after fees waived and/or reimbursed | | | | | | | 0.53 | % | | | | | | | 0.54 | % | | | 0.56 | %(g) |
| | | | | | | | | | | | | | | | | | | | |
| | | | | |
Net investment income | | | | | | | 1.09 | % | | | | | | | 1.34 | % | | | 4.23 | %(g) |
| | | | | | | | | | | | | | | | | | | | |
| | | | | |
Supplemental Data | | | | | | | | | | | | | | | | | | | | |
Net assets, end of period (000) | | | | | | $ | 596 | | | | | | | $ | 486 | | | $ | 419 | |
| | | | | | | | | | | | | | | | | | | | |
| | | | | |
Portfolio turnover rate. | | | | | | | 8 | %(i) | | | | | | | 45 | %(j) | | | 3 | %(k) |
| | | | | | | | | | | | | | | | | | | | |
| (a) | Commencement of operations. |
| (b) | Based on average shares outstanding. |
| (c) | Distributions for annual periods determined in accordance with U.S. federal income tax regulations. |
| (d) | Where applicable, assumes the reinvestment of distributions. |
| (e) | Aggregate total return. |
| (f) | Excludes fees and expenses incurred indirectly as a result of investments in underlying funds. |
| (h) | Audit fees were not annualized in the calculation of expense ratios. If this expense was annualized, the total expenses would have been 2.14%. |
| (i) | Includes the purchases and sales of the underlying funds and the Underlying Master Portfolios. |
| (j) | From January 1, 2020 through March 8, 2020, the rate includes the LifePath Dynamic Master Portfolio’s purchases and sales of the underlying funds and the Underlying Master Portfolios. Beginning March 9, 2020, the rate includes the LifePath Dynamic Fund’s purchases and sales of the underlying funds and the Underlying Master Portfolios. |
| (k) | Includes the LifePath Dynamic Master Portfolio’s purchases and sales of the underlying funds and Diversified Equity Master Portfolio, Advantage CoreAlpha Bond Master Portfolio, International Tilts Master Portfolio and Master Total Return Portfolio. |
See notes to financial statements.
| | |
| 136 | | 2 0 2 1 BLACK ROCK ANNUAL REPORT TO SHAREHOLDERS |
Financial Highlights (continued)
(For a share outstanding throughout each period)
| | | | | | | | | | | | | | | | | | |
| | | | | | BlackRock LifePath® Dynamic 2065 Fund (continued) | |
| | |
| | | | | | Investor A | |
| | | |
| | | | | | | | | |
| Period from
10/30/19 to 12/31/19 |
(a) |
| | | | | | | Year Ended December 31, | |
| | | | | | 2021 | | | 2020 | |
| | | | | |
Net asset value, beginning of period | | | | | | $ | 11.74 | | | | | $ | 10.47 | | | $ | 10.00 | |
| | | | | | | | | | | | | | | | | | |
| | | | | |
Net investment income(b) | | | | | | | 0.11 | | | | | | 0.11 | | | | 0.07 | |
Net realized and unrealized gain | | | | | | | 2.02 | | | | | | 1.30 | | | | 0.46 | |
| | | | | | | | | | | | | | | | | | |
| | | | | |
Net increase from investment operations | | | | | | | 2.13 | | | | | | 1.41 | | | | 0.53 | |
| | | | | | | | | | | | | | | | | | |
| | | | | |
Distributions(c) | | | | | | | | | | | | | | | | | | |
From net investment income | | | | | | | (0.76 | ) | | | | | (0.14 | ) | | | (0.06 | ) |
From net realized gain | | | | | | | (0.45 | ) | | | | | — | | | | — | |
| | | | | | | | | | | | | | | | | | |
| | | | | |
Total distributions | | | | | | | (1.21 | ) | | | | | (0.14 | ) | | | (0.06 | ) |
| | | | | | | | | | | | | | | | | | |
| | | | | |
Net asset value, end of period | | | | | | $ | 12.66 | | | | | $ | 11.74 | | | $ | 10.47 | |
| | | | | | | | | | | | | | | | | | |
| | | | | |
Total Return(d) | | | | | | | | | | | | | | | | | | |
Based on net asset value | | | | | | | 18.13 | % | | | | | 13.70 | % | | | 5.32 | %(e) |
| | | | | | | | | | | | | | | | | | |
| | | | | |
Ratios to Average Net Assets(f) | | | | | | | | | | | | | | | | | | |
Total expenses | | | | | | | 1.72 | % | | | | | 1.48 | % | | | 1.08 | %(g)(h) |
| | | | | | | | | | | | | | | | | | |
| | | | | |
Total expenses after fees waived and/or reimbursed | | | | | | | 0.78 | % | | | | | 0.79 | % | | | 0.81 | %(g) |
| | | | | | | | | | | | | | | | | | |
| | | | | |
Net investment income | | | | | | | 0.85 | % | | | | | 1.10 | % | | | 3.98 | %(g) |
| | | | | | | | | | | | | | | | | | |
| | | | | |
Supplemental Data | | | | | | | | | | | | | | | | | | |
Net assets, end of period (000) | | | | | | $ | 722 | | | | | $ | 501 | | | $ | 419 | |
| | | | | | | | | | | | | | | | | | |
| | | | | |
Portfolio turnover rate | | | | | | | 8 | %(i) | | | | | 45 | %(j) | | | 3 | %(k) |
| | | | | | | | | | | | | | | | | | |
| (a) | Commencement of operations. |
| (b) | Based on average shares outstanding. |
| (c) | Distributions for annual periods determined in accordance with U.S. federal income tax regulations. |
| (d) | Where applicable, excludes the effects of any sales charges and assumes the reinvestment of distributions. |
| (e) | Aggregate total return. |
| (f) | Excludes fees and expenses incurred indirectly as a result of investments in underlying funds. |
| (h) | Audit fees were not annualized in the calculation of expense ratios. If this expense was annualized, the total expenses would have been 2.39%. |
| (i) | Includes the purchases and sales of the underlying funds and the Underlying Master Portfolios. |
| (j) | From January 1, 2020 through March 8, 2020, the rate includes the LifePath Dynamic Master Portfolio’s purchases and sales of the underlying funds and the Underlying Master Portfolios. Beginning March 9, 2020, the rate includes the LifePath Dynamic Fund’s purchases and sales of the underlying funds and the Underlying Master Portfolios. |
| (k) | Includes the LifePath Dynamic Master Portfolio’s purchases and sales of the underlying funds and Diversified Equity Master Portfolio, Advantage CoreAlpha Bond Master Portfolio, International Tilts Master Portfolio and Master Total Return Portfolio. |
See notes to financial statements.
Financial Highlights (continued)
(For a share outstanding throughout each period)
| | | | | | | | | | | | | | | | | | |
| | | | | | BlackRock LifePath® Dynamic 2065 Fund (continued) | |
| | |
| | | | | | Investor C | |
| | | | | |
| | | | | | | | | | | | | | | |
| Period from
10/30/19 to 12/31/19 |
(a) |
| | | | | | | Year Ended December 31, | |
| | | | | | 2021 | | | 2020 | |
| | | | | |
Net asset value, beginning of period | | | | | | $ | 11.74 | | | | | $ | 10.47 | | | $ | 10.00 | |
| | | | | | | | | | | | | | | | | | |
| | | | | |
Net investment income(b) | | | | | | | 0.01 | | | | | | 0.03 | | | | 0.05 | |
Net realized and unrealized gain | | | | | | | 2.02 | | | | | | 1.30 | | | | 0.47 | |
| | | | | | | | | | | | | | | | | | |
| | | | | |
Net increase from investment operations | | | | | | | 2.03 | | | | | | 1.33 | | | | 0.52 | |
| | | | | | | | | | | | | | | | | | |
| | | | | |
Distributions(c) | | | | | | | | | | | | | | | | | | |
From net investment income | | | | | | | (0.68 | ) | | | | | (0.06 | ) | | | (0.05 | ) |
From net realized gain | | | | | | | (0.45 | ) | | | | | — | | | | — | |
| | | | | | | | | | | | | | | | | | |
| | | | | |
Total distributions | | | | | | | (1.13 | ) | | | | | (0.06 | ) | | | (0.05 | ) |
| | | | | | | | | | | | | | | | | | |
| | | | | |
Net asset value, end of period | | | | | | $ | 12.64 | | | | | $ | 11.74 | | | $ | 10.47 | |
| | | | | | | | | | | | | | | | | | |
| | | | | |
Total Return(d) | | | | | | | | | | | | | | | | | | |
Based on net asset value | | | | | | | 17.30 | % | | | | | 12.83 | % | | | 5.18 | %(e) |
| | | | | | | | | | | | | | | | | | |
| | | | | |
Ratios to Average Net Assets(f) | | | | | | | | | | | | | | | | | | |
Total expenses | | | | | | | 2.47 | % | | | | | 2.24 | % | | | 1.88 | %(g)(h) |
| | | | | | | | | | | | | | | | | | |
| | | | | |
Total expenses after fees waived and/or reimbursed | | | | | | | 1.53 | % | | | | | 1.55 | % | | | 1.61 | %(g) |
| | | | | | | | | | | | | | | | | | |
| | | | | |
Net investment income | | | | | | | 0.08 | % | | | | | 0.33 | % | | | 3.13 | %(g) |
| | | | | | | | | | | | | | | | | | |
| | | | | |
Supplemental Data | | | | | | | | | | | | | | | | | | |
Net assets, end of period (000) | | | | | | $ | 528 | | | | | $ | 470 | | | $ | 419 | |
| | | | | | | | | | | | | | | | | | |
| | | | | |
Portfolio turnover rate | | | | | | | 8 | %(i) | | | | | 45 | %(j) | | | 3 | %(k) |
| | | | | | | | | | | | | | | | | | |
| (a) | Commencement of operations. |
| (b) | Based on average shares outstanding. |
| (c) | Distributions for annual periods determined in accordance with U.S. federal income tax regulations. |
| (d) | Where applicable, excludes the effects of any sales charges and assumes the reinvestment of distributions. |
| (e) | Aggregate total return. |
| (f) | Excludes fees and expenses incurred indirectly as a result of investments in underlying funds. |
| (h) | Audit fees were not annualized in the calculation of expense ratios. If this expense was annualized, the total expenses would have been 3.19%. |
| (i) | Includes the purchases and sales of the underlying funds and the Underlying Master Portfolios. |
| (j) | From January 1, 2020 through March 8, 2020, the rate includes the LifePath Dynamic Master Portfolio’s purchases and sales of the underlying funds and the Underlying Master Portfolios. Beginning March 9, 2020, the rate includes the LifePath Dynamic Fund’s purchases and sales of the underlying funds and the Underlying Master Portfolios. |
| (k) | Includes the LifePath Dynamic Master Portfolio’s purchases and sales of the underlying funds and Diversified Equity Master Portfolio, Advantage CoreAlpha Bond Master Portfolio, International Tilts Master Portfolio and Master Total Return Portfolio. |
See notes to financial statements.
| | |
| 138 | | 2 0 2 1 BLACK ROCK ANNUAL REPORT TO SHAREHOLDERS |
Financial Highlights (continued)
(For a share outstanding throughout each period)
| | | | | | | | | | | | | | | | | | | | |
| | | BlackRock LifePath® Dynamic 2065 Fund (continued) | |
| |
| | | Class K | |
| | |
| | | | | | | Period from | |
| | | Year Ended December 31, | | | | 10/30/19 | (a) |
| | | |
| | | 2021 | | | 2020 | | | to 12/31/19 | |
| | | | | | |
Net asset value, beginning of period | | | | | | $ | 11.74 | | | | | | | $ | 10.48 | | | $ | 10.00 | |
| | | | | | | | | | | | | | | | | | | | |
| | | | | |
Net investment income(b) | | | | | | | 0.18 | | | | | | | | 0.16 | | | | 0.08 | |
Net realized and unrealized gain | | | | | | | 2.01 | | | | | | | | 1.29 | | | | 0.47 | |
| | | | | | | | | | | | | | | | | | | | |
| | | | | |
Net increase from investment operations | | | | | | | 2.19 | | | | | | | | 1.45 | | | | 0.55 | |
| | | | | | | | | | | | | | | | | | | | |
| | | | | |
Distributions(c) | | | | | | | | | | | | | | | | | | | | |
From net investment income | | | | | | | (0.81 | ) | | | | | | | (0.19 | ) | | | (0.07 | ) |
From net realized gain | | | | | | | (0.45 | ) | | | | | | | — | | | | — | |
| | | | | | | | | | | | | | | | | | | | |
| | | | | |
Total distributions | | | | | | | (1.26 | ) | | | | | | | (0.19 | ) | | | (0.07 | ) |
| | | | | | | | | | | | | | | | | | | | |
| | | | | |
Net asset value, end of period | | | | | | $ | 12.67 | | | | | | | $ | 11.74 | | | $ | 10.48 | |
| | | | | | | | | | | | | | | | | | | | |
| | | | | |
Total Return(d) | | | | | | | | | | | | | | | | | | | | |
Based on net asset value | | | | | | | 18.72 | % | | | | | | | 14.15 | % | | | 5.49 | %(e) |
| | | | | | | | | | | | | | | | | | | | |
| | | | | |
Ratios to Average Net Assets(f) | | | | | | | | | | | | | | | | | | | | |
Total expenses | | | | | | | 1.22 | % | | | | | | | 0.99 | % | | | 0.63 | %(g)(h) |
| | | | | | | | | | | | | | | | | | | | |
| | | | | |
Total expenses after fees waived and/or reimbursed | | | | | | | 0.28 | % | | | | | | | 0.30 | % | | | 0.36 | %(g) |
| | | | | | | | | | | | | | | | | | | | |
| | | | | |
Net investment income | | | | | | | 1.35 | % | | | | | | | 1.59 | % | | | 4.43 | %(g) |
| | | | | | | | | | | | | | | | | | | | |
| | | | | |
Supplemental Data | | | | | | | | | | | | | | | | | | | | |
Net assets, end of period (000) | | | | | | $ | 4,242 | | | | | | | $ | 2,969 | | | $ | 2,514 | |
| | | | | | | | | | | | | | | | | | | | |
| | | | | |
Portfolio turnover rate | | | | | | | 8 | %(i) | | | | | | | 45 | %(j) | | | 3 | %(k) |
| | | | | | | | | | | | | | | | | | | | |
| (a) | Commencement of operations. |
| (b) | Based on average shares outstanding. |
| (c) | Distributions for annual periods determined in accordance with U.S. federal income tax regulations. |
| (d) | Where applicable, assumes the reinvestment of distributions. |
| (e) | Aggregate total return. |
| (f) | Excludes fees and expenses incurred indirectly as a result of investments in underlying funds. |
| (h) | Audit fees were not annualized in the calculation of expense ratios. If this expense was annualized, the total expenses would have been 1.94%. |
| (i) | Includes the purchases and sales of the underlying funds and the Underlying Master Portfolios. |
| (j) | From January 1, 2020 through March 8, 2020, the rate includes the LifePath Dynamic Master Portfolio’s purchases and sales of the underlying funds and the Underlying Master Portfolios. Beginning March 9, 2020, the rate includes the LifePath Dynamic Fund’s purchases and sales of the underlying funds and the Underlying Master Portfolios. |
| (k) | Includes the LifePath Dynamic Master Portfolio’s purchases and sales of the underlying funds and Diversified Equity Master Portfolio, Advantage CoreAlpha Bond Master Portfolio, International Tilts Master Portfolio and Master Total Return Portfolio. |
See notes to financial statements.
Financial Highlights (continued)
(For a share outstanding throughout each period)
| | | | | | | | | | | | | | | | | | | | |
| | | BlackRock LifePath® Dynamic 2065 Fund (continued) | |
| |
| | | Class R | |
| | |
| | | | | |
| Period from
10/30/19 to 12/31/19 |
(a) |
| | | Year Ended December 31, | |
| | | 2021 | | | 2020 | |
| | | | | | |
Net asset value, beginning of period | | | | | | $ | 11.74 | | | | | | | $ | 10.47 | | | $ | 10.00 | |
| | | | | | | | | | | | | | | | | | | | |
| | | | | |
Net investment income(b) | | | | | | | 0.08 | | | | | | | | 0.09 | | | | 0.07 | |
Net realized and unrealized gain | | | | | | | 2.01 | | | | | | | | 1.30 | | | | 0.46 | |
| | | | | | | | | | | | | | | | | | | | |
| | | | | |
Net increase from investment operations | | | | | | | 2.09 | | | | | | | | 1.39 | | | | 0.53 | |
| | | | | | | | | | | | | | | | | | | | |
| | | | | |
Distributions(c) | | | | | | | | | | | | | | | | | | | | |
From net investment income | | | | | | | (0.73 | ) | | | | | | | (0.12 | ) | | | (0.06 | ) |
From net realized gain | | | | | | | (0.45 | ) | | | | | | | — | | | | — | |
| | | | | | | | | | | | | | | | | | | | |
| | | | | |
Total distributions | | | | | | | (1.18 | ) | | | | | | | (0.12 | ) | | | (0.06 | ) |
| | | | | | | | | | | | | | | | | | | | |
| | | | | |
Net asset value, end of period | | | | | | $ | 12.65 | | | | | | | $ | 11.74 | | | $ | 10.47 | |
| | | | | | | | | | | | | | | | | | | | |
| | | | | |
Total Return(d) | | | | | | | | | | | | | | | | | | | | |
Based on net asset value | | | | | | | 17.86 | % | | | | | | | 13.47 | % | | | 5.28 | %(e) |
| | | | | | | | | | | | | | | | | | | | |
| | | | | |
Ratios to Average Net Assets(f) | | | | | | | | | | | | | | | | | | | | |
Total expenses | | | | | | | 1.92 | % | | | | | | | 1.68 | % | | | 1.28 | %(g)(h) |
| | | | | | | | | | | | | | | | | | | | |
| | | | | |
Total expenses after fees waived and/or reimbursed | | | | | | | 0.98 | % | | | | | | | 0.99 | % | | | 1.01 | %(g) |
| | | | | | | | | | | | | | | | | | | | |
| | | | | |
Net investment income | | | | | | | 0.63 | % | | | | | | | 0.89 | % | | | 3.78 | %(g) |
| | | | | | | | | | | | | | | | | | | | |
| | | | | |
Supplemental Data | | | | | | | | | | | | | | | | | | | | |
Net assets, end of period (000) | | | | | | $ | 509 | | | | | | | $ | 470 | | | $ | 419 | |
| | | | | | | | | | | | | | | | | | | | |
| | | | | |
Portfolio turnover rate | | | | | | | 8 | %(i) | | | | | | | 45 | %(j) | | | 3 | %(k) |
| | | | | | | | | | | | | | | | | | | | |
| (a) | Commencement of operations. |
| (b) | Based on average shares outstanding. |
| (c) | Distributions for annual periods determined in accordance with U.S. federal income tax regulations. |
| (d) | Where applicable, assumes the reinvestment of distributions. |
| (e) | Aggregate total return. |
| (f) | Excludes fees and expenses incurred indirectly as a result of investments in underlying funds. |
| (h) | Audit fees were not annualized in the calculation of expense ratios. If this expense was annualized, the total expenses would have been 2.59% |
| (i) | Includes the purchases and sales of the underlying funds and the Underlying Master Portfolios. |
| (j) | From January 1, 2020 through March 8, 2020, the rate includes the LifePath Dynamic Master Portfolio’s purchases and sales of the underlying funds and the Underlying Master Portfolios. Beginning March 9, 2020, the rate includes the LifePath Dynamic Fund’s purchases and sales of the underlying funds and the Underlying Master Portfolios. |
| (k) | Includes the LifePath Dynamic Master Portfolio’s purchases and sales of the underlying funds and Diversified Equity Master Portfolio, Advantage CoreAlpha Bond Master Portfolio, International Tilts Master Portfolio and Master Total Return Portfolio. |
See notes to financial statements.
| | |
| 140 | | 2 0 2 1 BLACK ROCK ANNUAL REPORT TO SHAREHOLDERS |
Notes to Financial Statements
BlackRock Funds III (the “Trust”) is registered under the Investment Company Act of 1940, as amended (the “1940 Act”), as an open-end management investment company. The Trust is organized as a Delaware statutory trust. The following, each of which is a series of the Trust, are referred to herein collectively as the “Funds” or individually as a “Fund”:
| | | | |
| | | |
| Fund Name | | Herein Referred To As | | Diversification Classification |
| | |
BlackRock LifePath® Dynamic Retirement Fund | | LifePath Dynamic Retirement Fund | | Diversified |
BlackRock LifePath® Dynamic 2025 Fund | | LifePath Dynamic 2025 Fund | | Diversified |
BlackRock LifePath® Dynamic 2030 Fund | | LifePath Dynamic 2030 Fund | | Diversified |
BlackRock LifePath® Dynamic 2035 Fund | | LifePath Dynamic 2035 Fund | | Diversified |
BlackRock LifePath® Dynamic 2040 Fund | | LifePath Dynamic 2040 Fund | | Diversified |
BlackRock LifePath® Dynamic 2045 Fund | | LifePath Dynamic 2045 Fund | | Diversified |
BlackRock LifePath® Dynamic 2050 Fund | | LifePath Dynamic 2050 Fund | | Diversified |
BlackRock LifePath® Dynamic 2055 Fund | | LifePath Dynamic 2055 Fund | | Diversified |
BlackRock LifePath® Dynamic 2060 Fund | | LifePath Dynamic 2060 Fund | | Diversified |
BlackRock LifePath® Dynamic 2065 Fund | | LifePath Dynamic 2065 Fund | | Diversified |
As of period end, the investment of LifePath Dynamic Retirement Fund, LifePath Dynamic 2025 Fund, LifePath Dynamic 2030 Fund, LifePath Dynamic 2035 Fund, LifePath Dynamic 2040 Fund, LifePath Dynamic 2045 Fund, LifePath Dynamic 2050 Fund, LifePath Dynamic 2055 Fund, LifePath Dynamic 2060 Fund and LifePath Dynamic 2065 Fund in the Diversified Equity Master Portfolio represented 23.0%, 28.0%, 34.6%, 40.3%, 45.6%, 51.1%, 54.5%, 52.7%, 54.6% and 56.3%, respectively, of net assets. As such, financial statements of the Diversified Equity Master Portfolio, including the Schedules of Investments, should be read in conjunction with the respective Fund’s financial statements. Diversified Equity Master Portfolio’s financial statements are available, without charge, on the U.S. Securities and Exchange Commission’s (“SEC’s”) website at sec.gov.
The Funds will generally invest in other registered investment companies (each, an “Underlying Fund” and collectively, the “Underlying Funds”) that are managed by subsidiaries of BlackRock, Inc. (“BlackRock”) and its affiliates, which are affiliates of the Funds. The Funds may also invest in other master portfolios (“Underlying Master Portfolios”) that are managed by subsidiaries of BlackRock.
The value of a Fund’s investment in each of Diversified Equity Master Portfolio, Advantage CoreAlpha Bond Master Portfolio, International Tilts Master Portfolio and Master Total Return Portfolio reflects that Fund’s proportionate interest in the net assets of that master portfolio. As of period end, the Funds held interests in Underlying Master Portfolios as follows:
| | | | | | | | | | | | | | | | |
| | | | | |
| Fund Name | | Diversified Equity Master Portfolio | | | Advantage CoreAlpha Bond Master Portfolio | | | International Tilts Master Portfolio | | | Master Total Return Portfolio | |
| | | | |
LifePath Dynamic Retirement Fund. | | | 7.2 | % | | | 3.7 | % | | | 5.6 | % | | | 0.2 | % |
LifePath Dynamic 2025 Fund | | | 3.5 | | | | 1.1 | | | | 3.1 | | | | 0.1 | |
LifePath Dynamic 2030 Fund | | | 12.1 | | | | 2.4 | | | | 11.9 | | | | 0.1 | |
LifePath Dynamic 2035 Fund | | | 6.0 | | | | 0.6 | | | | 5.8 | | | | —(a) | |
LifePath Dynamic 2040 Fund | | | 14.3 | | | | 0.7 | | | | 14.6 | | | | —(a) | |
LifePath Dynamic 2045 Fund | | | 6.3 | | | | 0.1 | | | | 6.1 | | | | —(a) | |
LifePath Dynamic 2050 Fund | | | 9.7 | | | | —(a) | | | | 9.0 | | | | —(a) | |
LifePath Dynamic 2055 Fund | | | 4.5 | | | | —(a) | | | | 4.2 | | | | —(a) | |
LifePath Dynamic 2060 Fund | | | 1.2 | | | | —(a) | | | | 1.0 | | | | —(a) | |
LifePath Dynamic 2065 Fund | | | 0.4 | | | | —(a) | | | | 0.4 | | | | —(a) | |
| | (a) | Amount is less than 0.1%. | |
Prior to March 9, 2020, each Fund was a “feeder” fund that invested all of its assets in a corresponding “master” portfolio (each, a “Master Portfolio”) of Master Investment Portfolio (“MIP”), each of which had the same objective and strategies as the applicable Fund. Each Fund sought to achieve its investment objective by investing all of its assets in a corresponding Master Portfolio: LifePath Dynamic Retirement Master Portfolio, LifePath Dynamic 2025 Master Portfolio, LifePath Dynamic 2030 Master Portfolio, LifePath Dynamic 2035 Master Portfolio, LifePath Dynamic 2040 Master Portfolio, LifePath Dynamic 2045 Master Portfolio, LifePath Dynamic 2050 Master Portfolio, LifePath Dynamic 2055 Master Portfolio, LifePath Dynamic 2060 Master Portfolio and LifePath Dynamic 2065 Master Portfolio (each, a “LifePath Dynamic Master Portfolio” and together, the “LifePath Dynamic Master Portfolios”). The value of each Fund’s investment in its corresponding Master Portfolio reflected the Fund’s proportionate interest in the net assets of the Master Portfolio. The performance of the Funds was directly affected by the performance of the Master Portfolios. As of March 9, 2020, the percentage of each Master Portfolio owned by the corresponding Fund was 100%.
| | |
NOTES TO FINANCIAL STATEMENTS | | 141 |
Notes to Financial Statements (continued)
On March 9, 2020, each Feeder Fund ceased to invest in its corresponding LifePath Dynamic Master Portfolio as part of a “master-feeder” structure and began to operate as a stand-alone fund. The change into a stand-alone structure did not result to a change in net assets of the Fund and did not create a taxable event for the Fund.
Each Fund offers multiple classes of shares. All classes of shares have identical voting, dividend, liquidation and other rights and are subject to the same terms and conditions, except that certain classes bear expenses related to the shareholder servicing and distribution of such shares. Institutional and Class K Shares are sold only to certain eligible investors. Investor A, Investor C and Class R Shares bear certain expenses related to shareholder servicing of such shares, and Investor C and Class R Shares also bear certain expenses related to the distribution of such shares. Investor A and Investor C Shares are generally available through financial intermediaries. Class R Shares are sold only to certain employer-sponsored retirement plans. Each class has exclusive voting rights with respect to matters relating to its shareholder servicing and distribution expenditures (except that Investor C shareholders may vote on material changes to the Investor A Shares distribution and service plan).
| | | | | | | | |
| | | | |
| Share Class | | Initial Sales Charge | | CDSC | | | Conversion Privilege |
| | | |
Institutional, Class K and Class R Shares | | No | | | No | | | None |
Investor A Shares | | Yes | | | No | (a) | | None |
Investor C Shares. | | No | | | Yes | (b) | | To Investor A Shares after approximately 8 years |
| | (a) | Investor A Shares may be subject to a contingent deferred sales charge (“CDSC”) for certain redemptions where no initial sales charge was paid at the time of purchase. | |
| | (b) | A CDSC of 1.00% is assessed on certain redemptions of Investor C Shares made within one year after purchase. | |
The Funds, together with certain other registered investment companies advised by BlackRock Fund Advisors (“BFA” or the “Manager”) or its affiliates, are included in a complex of open-end equity, multi-asset, index and money market funds referred to as the BlackRock Multi-Asset Complex.
| 2. | SIGNIFICANT ACCOUNTING POLICIES |
The financial statements are prepared in conformity with accounting principles generally accepted in the United States of America (“U.S. GAAP”), which may require management to make estimates and assumptions that affect the reported amounts of assets and liabilities in the financial statements, disclosure of contingent assets and liabilities at the date of the financial statements and the reported amounts of increases and decreases in net assets from operations during the reporting period. Actual results could differ from those estimates. Each Fund is considered an investment company under U.S. GAAP and follows the accounting and reporting guidance applicable to investment companies. Below is a summary of significant accounting policies:
Investment Transactions and Income Recognition: For financial reporting purposes, investment transactions are recorded on the dates the transactions are executed. Realized gains and losses on investment transactions are determined using the specific identification method. Dividend income and capital gain distributions, if any, are recorded on the ex-dividend dates. Non-cash dividends, if any, are recorded on the ex-dividend dates at fair value. Income, expenses and realized and unrealized gains and losses are allocated daily to each class based on its relative net assets.
Each Fund records daily its proportionate share of the Underlying Master Portfolios’ income, expenses and realized and unrealized gains and losses.
Foreign Currency Translation: Each Fund’s books and records are maintained in U.S. dollars. Securities and other assets and liabilities denominated in foreign currencies are translated into U.S. dollars using exchange rates determined as of the close of trading on the New York Stock Exchange (“NYSE”). Purchases and sales of investments are recorded at the rates of exchange prevailing on the respective dates of such transactions. Generally, when the U.S. dollar rises in value against a foreign currency, the investments denominated in that currency will lose value; the opposite effect occurs if the U.S. dollar falls in relative value.
Each Fund does not isolate the effect of fluctuations in foreign exchange rates from the effect of fluctuations in the market prices of investments for financial reporting purposes. Accordingly, the effects of changes in exchange rates on investments are not segregated in the Statements of Operations from the effects of changes in market prices of those investments, but are included as a component of net realized and unrealized gain (loss) from investments. Each Fund reports realized currency gains (losses) on foreign currency related transactions as components of net realized gain (loss) for financial reporting purposes, whereas such components are generally treated as ordinary income for U.S. federal income tax purposes.
Segregation and Collateralization: In cases where a Fund enters into certain investments (e.g., futures contracts and forward foreign currency exchange contracts) that would be treated as “senior securities” for 1940 Act purposes, a Fund may segregate or designate on its books and records cash or liquid assets having a market value at least equal to the amount of its future obligations under such investments. Doing so allows the investment to be excluded from treatment as a “senior security.” Furthermore, if required by an exchange or counterparty agreement, the Funds may be required to deliver/deposit cash and/or securities to/with an exchange, or broker-dealer or custodian as collateral for certain investments or obligations.
Distributions: Distributions paid by the Funds are recorded on the ex-dividend dates. Distributions from net investment income are declared quarterly and paid quarterly. Distributions of capital gains are recorded on the ex-dividend dates and made at least annually. The character and timing of distributions are determined in accordance with U.S. federal income tax regulations, which may differ from U.S. GAAP.
Indemnifications: In the normal course of business, a Fund enters into contracts that contain a variety of representations that provide general indemnification. A Fund’s maximum exposure under these arrangements is unknown because it involves future potential claims against a Fund, which cannot be predicted with any certainty.
Other: Expenses directly related to a Fund or its classes are charged to that Fund or the applicable class. Expenses directly related to the Funds and other shared expenses prorated to the Funds are allocated daily to each class based on their relative net assets or other appropriate methods. Other operating expenses shared by several funds, including other funds managed by the Manager, are prorated among those funds on the basis of relative net assets or other appropriate methods.
| | |
| 142 | | 2 0 2 1 BLACK ROCK ANNUAL REPORT TO SHAREHOLDERS |
Notes to Financial Statements (continued)
| 3. | INVESTMENT VALUATION AND FAIR VALUE MEASUREMENTS |
Investment Valuation Policies: Each Fund’s investments are valued at fair value (also referred to as “market value” within the financial statements) each day that the Fund is open for business and, for financial reporting purposes, as of the report date. U.S. GAAP defines fair value as the price a fund would receive to sell an asset or pay to transfer a liability in an orderly transaction between market participants at the measurement date. Each Fund determines the fair values of its financial instruments using various independent dealers or pricing services under policies approved by the Board of Trustees of the Trust (the “Board”). If a security’s market price is not readily available or does not otherwise accurately represent the fair value of the security, the security will be valued in accordance with a policy approved by the Board as reflecting fair value. The BlackRock Global Valuation Methodologies Committee (the “Global Valuation Committee”) is the committee formed by management to develop global pricing policies and procedures and to oversee the pricing function for all financial instruments.
Fair Value Inputs and Methodologies: The following methods and inputs are used to establish the fair value of each Fund’s assets and liabilities:
| | • | | Equity investments traded on a recognized securities exchange are valued at that day’s official closing price, as applicable, on the exchange where the stock is primarily traded. Equity investments traded on a recognized exchange for which there were no sales on that day may be valued at the last available bid (long positions) or ask (short positions) price. |
| | • | | Exchange-traded funds (“ETFs”) and closed-end funds traded on a recognized securities exchange are valued at that day’s official closing price, as applicable, on the exchange where the stock is primarily traded. ETFs and closed-end funds traded on a recognized exchange for which there were no sales on that day may be valued at the last available bid (long positions) or ask (short positions) price. |
| | • | | Investments in open-end U.S. mutual funds (including money market funds) are valued at that day’s published net asset value (“NAV”). |
| | • | | Futures contracts are valued based on that day’s last reported settlement or trade price on the exchange where the contract is traded. |
| | • | | Forward foreign currency exchange contracts are valued at the mean between the bid and ask prices and are determined as of the close of trading on the NYSE based on that day’s prevailing forward exchange rate for the underlying currencies. |
| | • | | The Funds record their proportionate investment in the Underlying Master Portfolios at fair value, which is based upon their pro rata ownership in the net assets of the Underlying Master Portfolios. |
Generally, trading in foreign instruments is substantially completed each day at various times prior to the close of trading on the NYSE. Each business day, the Funds use current market factors supplied by independent pricing services to value certain foreign instruments (“Systematic Fair Value Price”). The Systematic Fair Value Price is designed to value such foreign securities at fair value as of the close of trading on the NYSE, which follows the close of the local markets.
If events (e.g., market volatility, company announcement or a natural disaster) occur that are expected to materially affect the value of such investment, or in the event that application of these methods of valuation results in a price for an investment that is deemed not to be representative of the market value of such investment, or if a price is not available, the investment will be valued by the Global Valuation Committee, or its delegate, in accordance with a policy approved by the Board as reflecting fair value (“Fair Valued Investments”). The fair valuation approaches that may be used by the Global Valuation Committee include market approach, income approach and cost approach. Valuation techniques such as discounted cash flow, use of market comparables and matrix pricing are types of valuation approaches and are typically used in determining fair value. When determining the price for Fair Valued Investments, the Global Valuation Committee, or its delegate, seeks to determine the price that each Fund might reasonably expect to receive or pay from the current sale or purchase of that asset or liability in an arm’s-length transaction. Fair value determinations shall be based upon all available factors that the Global Valuation Committee, or its delegate, deems relevant and consistent with the principles of fair value measurement. The pricing of all Fair Valued Investments is subsequently reported to the Board or a committee thereof on a quarterly basis.
Fair Value Hierarchy: Various inputs are used in determining the fair value of financial instruments. These inputs to valuation techniques are categorized into a fair value hierarchy consisting of three broad levels for financial reporting purposes as follows:
| | • | | Level 1 – Unadjusted price quotations in active markets/exchanges for identical assets or liabilities that each Fund has the ability to access; |
| | • | | Level 2 – Other observable inputs (including, but not limited to, quoted prices for similar assets or liabilities in markets that are active, quoted prices for identical or similar assets or liabilities in markets that are not active, inputs other than quoted prices that are observable for the assets or liabilities (such as interest rates, yield curves, volatilities, prepayment speeds, loss severities, credit risks and default rates) or other market-corroborated inputs); and |
| | • | | Level 3 – Unobservable inputs based on the best information available in the circumstances, to the extent observable inputs are not available (including the Global Valuation Committee’s assumptions used in determining the fair value of financial instruments). |
The hierarchy gives the highest priority to unadjusted quoted prices in active markets for identical assets or liabilities (Level 1 measurements) and the lowest priority to unobservable inputs (Level 3 measurements). Accordingly, the degree of judgment exercised in determining fair value is greatest for instruments categorized in Level 3. The inputs used to measure fair value may fall into different levels of the fair value hierarchy. In such cases, for disclosure purposes, the fair value hierarchy classification is determined based on the lowest level input that is significant to the fair value measurement in its entirety. Investments classified within Level 3 have significant unobservable inputs used by the Global Valuation Committee in determining the price for Fair Valued Investments. Level 3 investments include equity or debt issued by privately held companies or funds that may not have a secondary market and/or may have a limited number of investors. The categorization of a value determined for financial instruments is based on the pricing transparency of the financial instruments and is not necessarily an indication of the risks associated with investing in those securities.
| | |
NOTES TO FINANCIAL STATEMENTS | | 143 |
Notes to Financial Statements (continued)
As of December 31, 2021, certain investments of the Funds were fair valued using NAV per share or its equivalent as no quoted market value is available and therefore have been excluded from the fair value hierarchy.
| 4. | SECURITIES AND OTHER INVESTMENTS |
Securities Lending: Certain Funds may lend their securities to approved borrowers, such as brokers, dealers and other financial institutions. The borrower pledges and maintains with the Funds collateral consisting of cash, an irrevocable letter of credit issued by a bank, or securities issued or guaranteed by the U.S. Government. The initial collateral received by each Fund is required to have a value of at least 102% of the current value of the loaned securities for securities traded on U.S. exchanges and a value of at least 105% for all other securities. The collateral is maintained thereafter at a value equal to at least 100% of the current market value of the securities on loan. The market value of the loaned securities is determined at the close of each business day of the Fund and any additional required collateral is delivered to the Fund, or excess collateral returned by the Fund, on the next business day. During the term of the loan, the Funds are entitled to all distributions made on or in respect of the loaned securities, but do not receive interest income on securities received as collateral. Loans of securities are terminable at any time and the borrower, after notice, is required to return borrowed securities within the standard time period for settlement of securities transactions.
As of period end, any securities on loan were collateralized by cash and/or U.S. Government obligations. Cash collateral invested by the securities lending agent, BlackRock Institutional Trust Company, N.A. (“BTC”), if any, is disclosed in the Schedules of Investments. Any non-cash collateral received cannot be sold, re-invested or pledged by the Fund, except in the event of borrower default. The securities on loan, if any, are disclosed in the Funds’ Schedules of Investments. The market value of any securities on loan and the value of any related collateral are shown separately in the Statements of Assets and Liabilities as a component of investments at value – affiliated and collateral on securities loaned at value, respectively.
Securities lending transactions are entered into by the Funds under Master Securities Lending Agreements (each, an “MSLA”), which provide the right, in the event of default (including bankruptcy or insolvency), for the non-defaulting party to liquidate the collateral and calculate a net exposure to the defaulting party or request additional collateral. In the event that a borrower defaults, the Funds, as lender, would offset the market value of the collateral received against the market value of the securities loaned. When the value of the collateral is greater than that of the market value of the securities loaned, the lender is left with a net amount payable to the defaulting party. However, bankruptcy or insolvency laws of a particular jurisdiction may impose restrictions on or prohibitions against such a right of offset in the event of an MSLA counterparty’s bankruptcy or insolvency. Under the MSLA, absent an event of default, the borrower can resell or re-pledge the loaned securities, and the Funds can reinvest cash collateral received in connection with loaned securities. Upon an event of default, the parties’ obligations to return the securities or collateral to the other party are extinguished, and the parties can resell or re-pledge the loaned securities or the collateral received in connection with the loaned securities in order to satisfy the defaulting party’s net payment obligation for all transactions under the MSLA. The defaulting party remains liable for any deficiency.
As of period end, the following table is a summary of the Funds’ securities on loan by counterparty which are subject to offset under an MSLA:
| | | | | | | | | | | | | | | | |
| |
| | | | |
LifePath Dynamic Fund Name/Counterparty | |
| Securities
Loaned at Value |
| |
| Cash Collateral
Received |
(a) | |
| Non-Cash Collateral
Received at Fair Value |
(a) | |
| Net
Amount |
|
| |
| | | | |
LifePath Dynamic Retirement Fund | | | | | | | | | | | | | | | | |
Citigroup Global Markets, Inc. | | $ | 5,297,885 | | | $ | (5,297,885 | ) | | $ | — | | | $ | — | |
Goldman Sachs & Co. LLC | | | 2,015,520 | | | | (2,015,520 | ) | | | — | | | | — | |
Morgan Stanley | | | 336,214 | | | | (336,214 | ) | | | — | | | | — | |
| | | | | | | | | | | | | | | | |
| | | | |
| | $ | 7,649,619 | | | $ | (7,649,619 | ) | | $ | — | | | $ | — | |
| | | | | | | | | | | | | | | | |
| | | | |
LifePath Dynamic 2025 Fund | | | | | | | | | | | | | | | | |
Barclays Bank PLC | | $ | 512 | | | $ | (512 | ) | | $ | — | | | $ | — | |
Citigroup Global Markets, Inc. | | | 795,120 | | | | (795,120 | ) | | | — | | | | — | |
Goldman Sachs & Co. LLC | | | 3,746,800 | | | | (3,746,800 | ) | | | — | | | | — | |
JPMorgan Securities LLC | | | 564,403 | | | | (564,403 | ) | | | — | | | | — | |
UBS Securities LLC | | | 250,976 | | | | (250,976 | ) | | | — | | | | — | |
| | | | | | | | | | | | | | | | |
| | | | |
| | $ | 5,357,811 | | | $ | (5,357,811 | ) | | $ | — | | | $ | — | |
| | | | | | | | | | | | | | | | |
| | | | |
LifePath Dynamic 2030 Fund | | | | | | | | | | | | | | | | |
Citigroup Global Markets, Inc. | | $ | 2,460,234 | | | $ | (2,460,234 | ) | | $ | — | | | $ | — | |
Goldman Sachs & Co. LLC | | | 14,533,708 | | | | (14,533,708 | ) | | | — | | | | — | |
JPMorgan Securities LLC | | | 727,667 | | | | (727,667 | ) | | | — | | | | — | |
Morgan Stanley | | | 1,191,367 | | | | (1,191,367 | ) | | | — | | | | — | |
| | | | | | | | | | | | | | | | |
| | | | |
| | $ | 18,912,976 | | | $ | (18,912,976 | ) | | $ | — | | | $ | — | |
| | | | | | | | | | | | | | | | |
| | | | |
LifePath Dynamic 2035 Fund | | | | | | | | | | | | | | | | |
Barclays Bank PLC | | $ | 1,755,037 | | | $ | (1,755,037 | ) | | $ | — | | | $ | — | |
Jefferies LLC | | | 916,111 | | | | (916,111 | ) | | | — | | | | — | |
| | | | | | | | | | | | | | | | |
| | | | |
| | $ | 2,671,148 | | | $ | (2,671,148 | ) | | $ | — | | | $ | — | |
| | | | | | | | | | | | | | | | |
| | | | |
LifePath Dynamic 2040 Fund | | | | | | | | | | | | | | | | |
Goldman Sachs & Co. LLC | | $ | 1,257,148 | | | $ | (1,257,148 | ) | | $ | — | | | $ | — | |
JPMorgan Securities LLC | | | 1,493,103 | | | | (1,493,103 | ) | | | — | | | | — | |
| | | | | | | | | | | | | | | | |
| | | | |
| | $ | 2,750,251 | | | $ | (2,750,251 | ) | | $ | — | | | $ | — | |
| | | | | | | | | | | | | | | | |
| | |
| 144 | | 2 0 2 1 BLACK ROCK ANNUAL REPORT TO SHAREHOLDERS |
Notes to Financial Statements (continued)
| | | | | | | | | | | | | | | | |
| |
LifePath Dynamic Fund Name/Counterparty | |
| Securities
Loaned at Value |
| |
| Cash Collateral
Received |
(a) | |
| Non-Cash Collateral
Received at Fair Value |
(a) | |
| Net
Amount |
|
| |
| | | | |
LifePath Dynamic 2045 Fund | | | | | | | | | | | | | | | | |
Barclays Bank PLC | | $ | 5,681,651 | | | $ | (5,681,651 | ) | | $ | — | | | $ | — | |
Citigroup Global Markets, Inc. | | | 2,915 | | | | (2,915 | ) | | | — | | | | — | |
Goldman Sachs & Co. LLC | | | 2,197,692 | | | | (2,197,692 | ) | | | — | | | | — | |
Jefferies LLC | | | 308,109 | | | | (308,109 | ) | | | — | | | | — | |
| | | | | | | | | | | | | | | | |
| | | | |
| | $ | 8,190,367 | | | $ | (8,190,367 | ) | | $ | — | | | $ | — | |
| | | | | | | | | | | | | | | | |
| | | | |
LifePath Dynamic 2050 Fund | | | | | | | | | | | | | | | | |
Citigroup Global Markets, Inc. | | $ | 9,674 | | | $ | (9,674 | ) | | $ | — | | | $ | — | |
Wells Fargo Securities LLC | | | 304,796 | | | | (304,796 | ) | | | — | | | | — | |
| | | | | | | | | | | | | | | | |
| | | | |
| | $ | 314,470 | | | $ | (314,470 | ) | | $ | — | | | $ | — | |
| | | | | | | | | | | | | | | | |
| | | | |
LifePath Dynamic 2055 Fund | | | | | | | | | | | | | | | | |
Barclays Bank PLC | | $ | 4,689,966 | | | $ | (4,689,966 | ) | | $ | — | | | $ | — | |
Jefferies LLC | | | 135,303 | | | | (135,303 | ) | | | — | | | | — | |
| | | | | | | | | | | | | | | | |
| | | | |
| | $ | 4,825,269 | | | $ | (4,825,269 | ) | | $ | — | | | $ | — | |
| | | | | | | | | | | | | | | | |
| | | | |
LifePath Dynamic 2060 Fund | | | | | | | | | | | | | | | | |
BNP Paribas SA | | $ | 12,722 | | | $ | (12,722 | ) | | $ | — | | | $ | — | |
Citigroup Global Markets, Inc. | | | 16,830 | | | | (16,830 | ) | | | — | | | | — | |
| | | | | | | | | | | | | | | | |
| | | | |
| | $ | 29,552 | | | $ | (29,552 | ) | | $ | — | | | $ | — | |
| | | | | | | | | | | | | | | | |
| | | | |
LifePath Dynamic 2065 Fund | | | | | | | | | | | | | | | | |
BNP Paribas SA | | $ | 11,264 | | | $ | (11,264 | ) | | $ | — | | | $ | — | |
| | | | | | | | | | | | | | | | |
| | (a) | Collateral received in excess of the market value of securities on loan is not presented in this table. The total cash collateral received by each Fund is disclosed in the Fund’s Statements of Assets and Liabilities. | |
The risks of securities lending include the risk that the borrower may not provide additional collateral when required or may not return the securities when due. To mitigate these risks, the Funds benefit from a borrower default indemnity provided by BlackRock. BlackRock’s indemnity allows for full replacement of the securities loaned to the extent the collateral received does not cover the value on the securities loaned in the event of borrower default. Each Fund could incur a loss if the value of an investment purchased with cash collateral falls below the market value of loaned securities or if the value of an investment purchased with cash collateral falls below the value of the original cash collateral received. Such losses are borne entirely by the Funds.
| 5. | DERIVATIVE FINANCIAL INSTRUMENTS |
The Funds engage in various portfolio investment strategies using derivative contracts both to increase the returns of the Funds and/or to manage their exposure to certain risks such as credit risk, equity risk, interest rate risk, foreign currency exchange rate risk, commodity price risk or other risks (e.g., inflation risk). Derivative financial instruments categorized by risk exposure are included in the Schedules of Investments. These contracts may be transacted on an exchange or OTC.
Futures Contracts: Futures contracts are purchased or sold to gain exposure to, or manage exposure to, changes in interest rates (interest rate risk) and changes in the value of equity securities (equity risk) or foreign currencies (foreign currency exchange rate risk).
Futures contracts are exchange-traded agreements between the Funds and a counterparty to buy or sell a specific quantity of an underlying instrument at a specified price and on a specified date. Depending on the terms of a contract, it is settled either through physical delivery of the underlying instrument on the settlement date or by payment of a cash amount on the settlement date. Upon entering into a futures contract, the Funds are required to deposit initial margin with the broker in the form of cash or securities in an amount that varies depending on a contract’s size and risk profile. The initial margin deposit must then be maintained at an established level over the life of the contract. Amounts pledged, which are considered restricted, are included in cash pledged for futures contracts in the Statements of Assets and Liabilities.
Securities deposited as initial margin are designated in the Schedules of Investments and cash deposited, if any, are shown as cash pledged for futures contracts in the Statements of Assets and Liabilities. Pursuant to the contract, the Funds agree to receive from or pay to the broker an amount of cash equal to the daily fluctuation in market value of the contract (“variation margin”). Variation margin is recorded as unrealized appreciation (depreciation) and, if any, shown as variation margin receivable (or payable) on futures contracts in the Statements of Assets and Liabilities. When the contract is closed, a realized gain or loss is recorded in the Statements of Operations equal to the difference between the notional amount of the contract at the time it was opened and the notional amount at the time it was closed. The use of futures contracts involves the risk of an imperfect correlation in the movements in the price of futures contracts and interest rates, foreign currency exchange rates or underlying assets.
Forward Foreign Currency Exchange Contracts: Forward foreign currency exchange contracts are entered into to gain or reduce exposure to foreign currencies (foreign currency exchange rate risk).
A forward foreign currency exchange contract is an agreement between two parties to buy and sell a currency at a set exchange rate on a specified date. These contracts help to manage the overall exposure to the currencies in which some of the investments held by the Funds are denominated and in some cases, may be used to obtain exposure to a particular market. The contracts are traded OTC and not on an organized exchange.
The contract is marked-to-market daily and the change in market value is recorded as unrealized appreciation (depreciation) in the Statements of Assets and Liabilities. When a contract is closed, a realized gain or loss is recorded in the Statements of Operations equal to the difference between the value at the time it was opened and the value at the
| | |
NOTES TO FINANCIAL STATEMENTS | | 145 |
Notes to Financial Statements (continued)
time it was closed. Non-deliverable forward foreign currency exchange contracts are settled with the counterparty in cash without the delivery of foreign currency. The use of forward foreign currency exchange contracts involves the risk that the value of a forward foreign currency exchange contract changes unfavorably due to movements in the value of the referenced foreign currencies, and such value may exceed the amount(s) reflected in the Statements of Assets and Liabilities. Cash amounts pledged for forward foreign currency exchange contracts are considered restricted and are included in cash pledged as collateral for OTC derivatives in the Statements of Assets and Liabilities. A Fund’s risk of loss from counterparty credit risk on OTC derivatives is generally limited to the aggregate unrealized gain netted against any collateral held by the Fund.
Master Netting Arrangements: In order to define its contractual rights and to secure rights that will help it mitigate its counterparty risk, a Fund may enter into an International Swaps and Derivatives Association, Inc. Master Agreement (“ISDA Master Agreement”) or similar agreement with its counterparties. An ISDA Master Agreement is a bilateral agreement between a Fund and a counterparty that governs certain OTC derivatives and typically contains, among other things, collateral posting terms and netting provisions in the event of a default and/or termination event. Under an ISDA Master Agreement, a Fund may, under certain circumstances, offset with the counterparty certain derivative financial instruments’ payables and/or receivables with collateral held and/or posted and create one single net payment. The provisions of the ISDA Master Agreement typically permit a single net payment in the event of default including the bankruptcy or insolvency of the counterparty. However, bankruptcy or insolvency laws of a particular jurisdiction may impose restrictions on or prohibitions against the right of offset in bankruptcy, insolvency or other events.
Collateral Requirements: For derivatives traded under an ISDA Master Agreement, the collateral requirements are typically calculated by netting the mark-to-market amount for each transaction under such agreement and comparing that amount to the value of any collateral currently pledged by the Fund and the counterparty.
Cash collateral that has been pledged to cover obligations of the Funds and cash collateral received from the counterparty, if any, is reported separately in the Statements of Assets and Liabilities as cash pledged as collateral and cash received as collateral, respectively. Non-cash collateral pledged by the Funds, if any, is noted in the Schedules of Investments. Generally, the amount of collateral due from or to a counterparty is subject to a certain minimum transfer amount threshold before a transfer is required, which is determined at the close of business of the Funds. Any additional required collateral is delivered to/pledged by the Funds on the next business day. Typically, the counterparty is not permitted to sell, re-pledge or use cash and non-cash collateral it receives. A Fund generally agrees not to use non-cash collateral that it receives but may, absent default or certain other circumstances defined in the underlying ISDA Master Agreement, be permitted to use cash collateral received. In such cases, interest may be paid pursuant to the collateral arrangement with the counterparty. To the extent amounts due to the Funds from the counterparties are not fully collateralized, each Fund bears the risk of loss from counterparty non-performance. Likewise, to the extent the Funds have delivered collateral to a counterparty and stand ready to perform under the terms of their agreement with such counterparty, each Fund bears the risk of loss from a counterparty in the amount of the value of the collateral in the event the counterparty fails to return such collateral. Based on the terms of agreements, collateral may not be required for all derivative contracts.
For financial reporting purposes, the Funds do not offset derivative assets and derivative liabilities that are subject to netting arrangements, if any, in the Statements of Assets and Liabilities.
| 6. | INVESTMENT ADVISORY AGREEMENT AND OTHER TRANSACTIONS WITH AFFILIATES |
Investment Advisory: The Trust, on behalf of the Funds, entered into an Investment Advisory Agreement with the Manager, the Funds’ investment adviser and an indirect, wholly-owned subsidiary of BlackRock, to provide investment advisory services. The Manager is responsible for the management of each Fund’s portfolio and provides the personnel, facilities, equipment and certain other services necessary to the operations of each Fund.
For such services, each Fund pays the Manager a monthly fee at an annual rate equal to 0.35% of the average daily value of each Fund’s net assets.
With respect to each Fund, the Manager entered into separate sub-advisory agreements with each of BlackRock International Limited (“BIL”) and BlackRock (Singapore) Limited (“BRS”) (collectively, the “Sub-Advisers”), each an affiliate of the Manager. The Manager pays each Sub-Adviser for services it provides for that portion of each Fund for which BIL and BRS acts as sub-adviser, a monthly fee that is equal to a percentage of the investment advisory fees paid by each Fund to the Manager.
Service and Distribution Fees: The Trust, on behalf of the Funds, entered into a Distribution Agreement and a Distribution and Service Plan with BlackRock Investments, LLC (“BRIL”), an affiliate of the Manager. Pursuant to the Distribution and Service Plan and in accordance with Rule 12b-1 under the 1940 Act, each Fund pays BRIL ongoing service and distribution fees. The fees are accrued daily and paid monthly at annual rates based upon the average daily net assets of the relevant share class of each Fund as follows:
| | | | | | | | |
| | | |
| Share Class | | Service Fees | | | Distribution Fees | |
| | |
Investor A | | | 0.25 | % | | | N/A | |
Investor C | | | 0.25 | | | | 0.75 | % |
Class R | | | 0.25 | | | | 0.25 | |
BRIL and broker-dealers, pursuant to sub-agreements with BRIL, provide shareholder servicing and distribution services to the Funds. The ongoing service and/or distribution fee compensates BRIL and each broker-dealer for providing shareholder servicing and/or distribution related services to shareholders.
For the year ended December 31, 2021, the following table shows the class specific service and distribution fees borne directly by each share class of each Fund:
| | | | | | | | | | | | | | | | |
| |
| | | | |
| Fund Name | | Investor A | | | Investor C | | | Class R | | | Total | |
| |
| | | | |
LifePath Dynamic Retirement Fund | | | $ 441,158 | | | | $ 22,353 | | | | $ 31,523 | | | | $ 495,034 | |
LifePath Dynamic 2025 Fund | | | 60,680 | | | | 26,623 | | | | 19,216 | | | | 106,519 | |
LifePath Dynamic 2030 Fund | | | 454,892 | | | | 28,380 | | | | 25,468 | | | | 508,740 | |
LifePath Dynamic 2035 Fund | | | 67,809 | | | | 34,216 | | | | 15,754 | | | | 117,779 | |
LifePath Dynamic 2040 Fund | | | 393,976 | | | | 23,769 | | | | 22,386 | | | | 440,131 | |
LifePath Dynamic 2045 Fund | | | 49,472 | | | | 12,769 | | | | 14,104 | | | | 76,345 | |
| |
| | |
| 146 | | 2 0 2 1 BLACK ROCK ANNUAL REPORT TO SHAREHOLDERS |
Notes to Financial Statements (continued)
| | | | | | | | | | | | | | | | |
| |
| | | | |
| Fund Name | | Investor A | | | Investor C | | | Class R | | | Total | |
| |
| | | | |
LifePath Dynamic 2050 Fund | | $ | 191,343 | | | $ | 17,542 | | | $ | 15,806 | | | $ | 224,691 | |
LifePath Dynamic 2055 Fund | | | 40,265 | | | | 11,949 | | | | 9,256 | | | | 61,470 | |
LifePath Dynamic 2060 Fund | | | 2,041 | | | | 697 | | | | 2,896 | | | | 5,634 | |
LifePath Dynamic 2065 Fund | | | 1,615 | | | | 5,298 | | | | 2,601 | | | | 9,514 | |
| |
Administration: The Trust, on behalf of the Funds, entered into an Administration Agreement with BlackRock Advisors, LLC (“BAL” or the “Administrator”), which has agreed to provide general administrative services (other than investment advice and related portfolio activities). BAL has agreed to bear all of the Funds’ ordinary operating expenses, excluding, generally, investment advisory fees, distribution fees, brokerage and other expenses related to the execution of portfolio transactions, extraordinary expenses and certain other expenses which are borne by the Funds. BAL is entitled to receive for these administrative services an annual fee of 0.30% based on the average daily net assets of each Fund’s Institutional, Investor A and Investor C Shares, 0.05% of the average daily net assets of Class K Shares and 0.25% of the average daily net assets of Class R Shares.
From time to time, BAL may waive such fees in whole or in part. Any such waiver will reduce the expenses of the Funds and, accordingly, have a favorable impact on their performance. BAL may delegate certain of its administration duties to sub-administrators.
For the year ended December 31, 2021, the following table shows the class specific administration fees borne directly by each share class of each Fund:
| | | | | | | | | | | | | | | | | | | | | | | | |
| |
| | | | | | |
| Fund Name | | Institutional | | | Investor A | | | Investor C | | | Class K | | | Class R | | | Total | |
| |
| | | | | | |
LifePath Dynamic Retirement Fund | | $ | 164,574 | | | $ | 529,389 | | | $ | 6,706 | | | $ | 39,455 | | | $ | 15,762 | | | $ | 755,886 | |
LifePath Dynamic 2025 Fund | | | 35,443 | | | | 72,817 | | | | 7,987 | | | | 35,873 | | | | 9,608 | | | | 161,728 | |
LifePath Dynamic 2030 Fund | | | 174,182 | | | | 545,871 | | | | 8,514 | | | | 46,373 | | | | 12,734 | | | | 787,674 | |
LifePath Dynamic 2035 Fund | | | 38,338 | | | | 81,371 | | | | 10,265 | | | | 42,580 | | | | 7,876 | | | | 180,430 | |
LifePath Dynamic 2040 Fund | | | 178,553 | | | | 472,771 | | | | 7,131 | | | | 36,912 | | | | 11,193 | | | | 706,560 | |
LifePath Dynamic 2045 Fund | | | 25,933 | | | | 59,366 | | | | 3,831 | | | | 36,580 | | | | 7,051 | | | | 132,761 | |
LifePath Dynamic 2050 Fund | | | 66,221 | | | | 229,611 | | | | 5,263 | | | | 25,874 | | | | 7,903 | | | | 334,872 | |
LifePath Dynamic 2055 Fund | | | 22,190 | | | | 48,317 | | | | 3,585 | | | | 21,503 | | | | 4,629 | | | | 100,224 | |
LifePath Dynamic 2060 Fund | | | 4,483 | | | | 2,449 | | | | 209 | | | | 6,570 | | | | 1,447 | | | | 15,158 | |
LifePath Dynamic 2065 Fund | | | 1,687 | | | | 1,939 | | | | 1,589 | | | | 1,879 | | | | 1,301 | | | | 8,395 | |
| |
Other Fees: For the year ended December 31, 2021, affiliates earned underwriting discounts, direct commissions and dealer concessions on sales of each Fund’s Investor A Shares as follows:
| | | | |
| |
| |
| Fund Name | | Investor A | |
| |
| |
LifePath Dynamic Retirement Fund | | $ | 866 | |
LifePath Dynamic 2025 Fund | | | 914 | |
LifePath Dynamic 2030 Fund | | | 1,107 | |
LifePath Dynamic 2035 Fund | | | 1,024 | |
LifePath Dynamic 2040 Fund | | | 1,507 | |
LifePath Dynamic 2045 Fund | | | 1,072 | |
LifePath Dynamic 2050 Fund | | | 1,256 | |
LifePath Dynamic 2055 Fund | | | 1,242 | |
LifePath Dynamic 2060 Fund | | | 311 | |
LifePath Dynamic 2065 Fund | | | 221 | |
| |
For the year ended December 31, 2021, affiliates received CDSCs as follows:
| | | | | | | | |
| |
| | |
| Fund Name | | Investor A | | | Investor C | |
| |
| | |
LifePath Dynamic Retirement Fund | | $ | 642 | | | $ | 324 | |
LifePath Dynamic 2030 Fund | | | 404 | | | | 146 | |
LifePath Dynamic 2035 Fund | | | — | | | | 64 | |
LifePath Dynamic 2040 Fund | | | — | | | | 18 | |
LifePath Dynamic 2045 Fund | | | — | | | | 27 | |
LifePath Dynamic 2050 Fund | | | — | | | | 43 | |
LifePath Dynamic 2055 Fund | | | — | | | | 16 | |
| |
Expense Waivers and Reimbursements: With respect to each Fund, the Manager contractually agreed to waive its investment advisory fees by the amount of investment advisory fees each Fund pays to the Manager indirectly through its investment in affiliated money market funds (the “affiliated money market fund waiver”) through June 30, 2023. The contractual agreement may be terminated upon 90 days’ notice by a majority of the trustees who are not “interested persons” of the Trust, as defined in the 1940 Act (“Independent Trustees”), or by a vote of a majority of the outstanding voting securities of a Fund. These amounts are included in fees waived and/or reimbursed by the Administrator/Manager in the Statements of Operations. For the year ended December 31, 2021, the amounts waived were as follows:
| | | | |
| |
| |
Fund Name | |
| Fees Waived and/or Reimbursed
by the Administrator/Manager |
|
| |
| |
LifePath Dynamic Retirement Fund | | $ | 3,668 | |
LifePath Dynamic 2025 Fund | | | 3,293 | |
| |
| | |
NOTES TO FINANCIAL STATEMENTS | | 147 |
Notes to Financial Statements (continued)
| | | | |
| |
| |
Fund Name | |
| Fees Waived and/or Reimbursed
by the Administrator/Manager |
|
| |
| |
LifePath Dynamic 2030 Fund | | $ | 4,266 | |
LifePath Dynamic 2035 Fund | | | 2,900 | |
LifePath Dynamic 2040 Fund | | | 3,235 | |
LifePath Dynamic 2045 Fund | | | 2,028 | |
LifePath Dynamic 2050 Fund | | | 6,111 | |
LifePath Dynamic 2055 Fund | | | 3,654 | |
LifePath Dynamic 2060 Fund | | | 820 | |
LifePath Dynamic 2065 Fund | | | 191 | |
| |
The Manager and the Administrator have contractually agreed to reimburse each Fund for acquired fund fees and expenses up to a maximum amount equal to the combined investment advisory fee and administration fee of each share class through June 30, 2023. The contractual agreement may be terminated upon 90 days’ notice by a majority of the Independent Trustees or by a vote of a majority of the outstanding voting securities of a Fund. These amounts are included in fees waived and/or reimbursed by the Administrator/Manager in the Statements of Operations. For the year ended December 31, 2021, the amounts waived were as follows:
| | | | |
| |
| |
| LifePath Dynamic Fund Name | | Fees Waived and/or Reimbursed by the Administrator/Manager | |
| |
| |
LifePath Dynamic Retirement Fund | | $ | 655,156 | |
LifePath Dynamic 2025 Fund | | | 251,898 | |
LifePath Dynamic 2030 Fund | | | 836,875 | |
LifePath Dynamic 2035 Fund | | | 344,076 | |
LifePath Dynamic 2040 Fund | | | 837,906 | |
LifePath Dynamic 2045 Fund | | | 307,415 | |
LifePath Dynamic 2050 Fund | | | 417,910 | |
LifePath Dynamic 2055 Fund | | | 184,855 | |
LifePath Dynamic 2060 Fund | | | 44,176 | |
LifePath Dynamic 2065 Fund | | | 16,994 | |
| |
The fees and expenses of the Trust’s Independent Trustees, counsel to the Independent Trustees and the Funds’ independent registered public accounting firm (together, the “independent expenses”) are paid directly by the Funds. Each of the Manager and the Administrator has contractually agreed to reimburse the Funds or provide an offsetting credit to the Funds in an amount equal to these independent expenses through June 30, 2031. These amounts are included in fees waived and/or reimbursed by the Administrator/Manager in the Statements of Operations. For the year ended December 31, 2021, the amounts waived were as follows:
| | | | |
| |
| |
| Fund Name | | Fees Waived and/or Reimbursed by the Administrator/Manager | |
| |
| |
LifePath Dynamic Retirement Fund | | $ | 26,892 | |
LifePath Dynamic 2025 Fund | | | 40,757 | |
LifePath Dynamic 2030 Fund | | | 41,481 | |
LifePath Dynamic 2035 Fund | | | 40,858 | |
LifePath Dynamic 2040 Fund | | | 41,254 | |
LifePath Dynamic 2045 Fund | | | 40,829 | |
LifePath Dynamic 2050 Fund | | | 40,774 | |
LifePath Dynamic 2055 Fund | | | 40,776 | |
LifePath Dynamic 2060 Fund | | | 40,784 | |
LifePath Dynamic 2065 Fund | | | 39,391 | |
| |
Securities Lending: The SEC has issued an exemptive order which permits BTC, an affiliate of the Manager, to serve as securities lending agent for the Funds, subject to applicable conditions. As securities lending agent, BTC bears all operational costs directly related to securities lending, including any custodial costs. The Funds are responsible for fees in connection with the investment of cash collateral received for securities on loan (the “collateral investment fees”). The cash collateral is invested in a money market fund, BlackRock Cash Funds: Institutional or BlackRock Cash Funds: Treasury, managed by the Manager or its affiliates. However, BTC has agreed to reduce the amount of securities lending income it receives in order to effectively limit the collateral investment fees the Funds bear to an annual rate of 0.04%. The SL Agency Shares of such money market fund will not be subject to a sales load, distribution fee or service fee. The money market fund in which the cash collateral has been invested may, under certain circumstances, impose a liquidity fee of up to 2% of the value redeemed or temporarily restrict redemptions for up to 10 business days during a 90 day period, in the event that the money market fund’s weekly liquid assets fall below certain thresholds.
Securities lending income is equal to the total of income earned from the reinvestment of cash collateral, net of fees and other payments to and from borrowers of securities, and less the collateral investment fees. Each Fund retains a portion of securities lending income and remits a remaining portion to BTC as compensation for its services as securities lending agent.
Pursuant to the current securities lending agreement, each Fund retains 82% of securities lending income (which excludes collateral investment fees), and this amount retained can never be less than 70% of the total of securities lending income plus the collateral investment fees.
In addition, commencing the business day following the date that the aggregate securities lending income earned across the BlackRock Multi-Asset Complex in a calendar year exceeds a specified threshold, each Fund, pursuant to the securities lending agreement, will retain for the remainder of that calendar year securities lending income in an
| | |
| 148 | | 2 0 2 1 BLACK ROCK ANNUAL REPORT TO SHAREHOLDERS |
Notes to Financial Statements (continued)
amount equal to 85% of securities lending income (which excludes collateral investment fees), and this amount retained can never be less than 70% of the total of securities lending income plus the collateral investment fees.
The share of securities lending income earned by each Fund is shown as securities lending income — affiliated — net in the Statements of Operations. For the year ended December 31, 2021, each Fund paid BTC the following amounts for securities lending agent services:
| | | | |
| |
| |
| Fund Name | | Amounts | |
| |
| |
LifePath Dynamic Retirement Fund | | $ | 14,102 | |
LifePath Dynamic 2025 Fund | | | 4,952 | |
LifePath Dynamic 2030 Fund | | | 11,309 | |
LifePath Dynamic 2035 Fund | | | 4,153 | |
LifePath Dynamic 2040 Fund | | | 5,687 | |
LifePath Dynamic 2045 Fund | | | 2,364 | |
LifePath Dynamic 2050 Fund | | | 1,797 | |
LifePath Dynamic 2055 Fund | | | 1,034 | |
LifePath Dynamic 2060 Fund | | | 605 | |
LifePath Dynamic 2065 Fund | | | 129 | |
| |
Interfund Lending: In accordance with an exemptive order (the “Order”) from the SEC, each Fund may participate in a joint lending and borrowing facility for temporary purposes (the “Interfund Lending Program”), subject to compliance with the terms and conditions of the Order, and to the extent permitted by each Fund’s investment policies and restrictions. Each Fund is currently permitted to borrow and lend under the Interfund Lending Program.
A lending BlackRock fund may lend in aggregate up to 15% of its net assets but may not lend more than 5% of its net assets to any one borrowing fund through the Interfund Lending Program. A borrowing BlackRock fund may not borrow through the Interfund Lending Program or from any other source more than 33 1/3% of its total assets (or any lower threshold provided for by the fund’s investment restrictions). If a borrowing BlackRock fund’s total outstanding borrowings exceed 10% of its total assets, each of its outstanding interfund loans will be subject to collateralization of at least 102% of the outstanding principal value of the loan. All interfund loans are for temporary or emergency purposes and the interest rate to be charged will be the average of the highest current overnight repurchase agreement rate available to a lending fund and the bank loan rate, as calculated according to a formula established by the Board.
During the year ended December 31, 2021, the Funds did not participate in the Interfund Lending Program.
Trustees and Officers: Certain trustees and/or officers of the Trust are directors and/or officers of BlackRock or its affiliates.
Other Transactions: Each Fund may invest its positive cash balances in certain money market funds managed by the Manager or an affiliate. The income earned on these temporary cash investments is shown as income-affiliated in the Statements of Operations.
The Funds may purchase securities from, or sell securities to, an affiliated fund provided the affiliation is due solely to having a common investment adviser, common officers, or common trustees. For the year ended December 31, 2021, the purchase and sale transactions and any net realized gains (losses) with affiliated funds in compliance with Rule 17a-7 under the 1940 Act were as follows:
| | | | | | | | | | | | |
| |
| | | |
| LifePath Dynamic Fund Name | | Purchases
| | | Sales | | | Net Realized
Gain (Loss) | |
| |
| | | |
LifePath Dynamic Retirement Fund | | $ | 723,740 | | | $ | 758,295 | | | $ | 210,034 | |
LifePath Dynamic 2030 Fund | | | — | | | | 1,754,394 | | | | 59,212 | |
LifePath Dynamic 2035 Fund | | | 714,436 | | | | — | | | | — | |
LifePath Dynamic 2045 Fund | | | 546,593 | | | | — | | | | — | |
LifePath Dynamic 2050 Fund | | | 202,197 | | | | — | | | | — | |
LifePath Dynamic 2055 Fund | | | 325,889 | | | | — | | | | — | |
| |
For the year ended December 31, 2021, purchases and sales of investments in the Underlying Funds and the Underlying Master Portfolios, excluding short-term investments, were as follows:
| | | | | | | | |
| |
| | |
| LifePath Dynamic Fund Name | | Purchases | | | Sales | |
| |
| | |
LifePath Dynamic Retirement Fund | | $ | 5,457,292 | | | $ | 48,921,957 | |
LifePath Dynamic 2025 Fund | | | 14,577,492 | | | | 6,928,503 | |
LifePath Dynamic 2030 Fund | | | 17,934,667 | | | | 38,611,037 | |
LifePath Dynamic 2035 Fund | | | 13,573,177 | | | | 3,351,195 | |
LifePath Dynamic 2040 Fund | | | 16,081,336 | | | | 38,301,889 | |
LifePath Dynamic 2045 Fund | | | 14,951,525 | | | | 288,215 | |
LifePath Dynamic 2050 Fund | | | 12,973,254 | | | | 1,523,261 | |
LifePath Dynamic 2055 Fund | | | 12,814,659 | | | | 983,324 | |
LifePath Dynamic 2060 Fund | | | 7,145,333 | | | | 751,703 | |
LifePath Dynamic 2065 Fund | | | 1,310,349 | | | | 475,275 | |
| |
| | |
NOTES TO FINANCIAL STATEMENTS | | 149 |
Notes to Financial Statements (continued)
It is each Fund’s policy to comply with the requirements of the Internal Revenue Code of 1986, as amended, applicable to regulated investment companies, and to distribute substantially all of its taxable income to its shareholders. Therefore, no U.S. federal income tax provision is required.
Each Fund files U.S. federal and various state and local tax returns. No income tax returns are currently under examination. The statute of limitations on each Fund’s U.S. federal tax returns generally remains open for a period of three fiscal years after they are filed. The statutes of limitations on each Fund’s state and local tax returns may remain open for an additional year depending upon the jurisdiction.
Management has analyzed tax laws and regulations and their application to the Funds as of December 31, 2021, inclusive of the open tax return years, and does not believe that there are any uncertain tax positions that require recognition of a tax liability in the Funds’ financial statements.
The tax character of distributions paid was as follows:
| | | | | | | | |
| |
| | |
| Fund Name | | Year Ended 12/31/21 | | | Year Ended 12/31/20 | |
| |
| | |
LifePath Dynamic Retirement Fund | | | | | | | | |
Ordinary income | | $ | 34,634,478 | | | $ | 15,622,861 | |
Long-term capital gains | | | 10,054,914 | | | | 7,474,929 | |
| | | | | | | | |
| | |
| | $ | 44,689,392 | | | $ | 23,097,790 | |
| | | | | | | | |
LifePath Dynamic 2025 Fund | | | | | | | | |
Ordinary income | | $ | 10,093,028 | | | $ | 2,183,034 | |
Long-term capital gains | | | 2,065,558 | | | | 429,019 | |
| | | | | | | | |
| | |
| | $ | 12,158,586 | | | $ | 2,612,053 | |
| | | | | | | | |
LifePath Dynamic 2030 Fund | | | | | | | | |
Ordinary income | | $ | 42,835,495 | | | $ | 9,660,504 | |
Long-term capital gains | | | 9,544,426 | | | | 3,622,589 | |
| | | | | | | | |
| | |
| | $ | 52,379,921 | | | $ | 13,283,093 | |
| | | | | | | | |
LifePath Dynamic 2035 Fund | | | | | | | | |
Ordinary income | | $ | 13,621,081 | | | $ | 1,849,650 | |
Long-term capital gains | | | 2,014,010 | | | | 374,136 | |
| | | | | | | | |
| | |
| | $ | 15,635,091 | | | $ | 2,223,786 | |
| | | | | | | | |
LifePath Dynamic 2040 Fund | | | | | | | | |
Ordinary income | | $ | 47,697,870 | | | $ | 8,130,567 | |
Long-term capital gains | | | 9,215,049 | | | | 4,993,173 | |
| | | | | | | | |
| | |
| | $ | 56,912,919 | | | $ | 13,123,740 | |
| | | | | | | | |
LifePath Dynamic 2045 Fund | | | | | | | | |
| | |
Ordinary income | | $ | 11,440,670 | | | $ | 1,276,545 | |
Long-term capital gains | | | 1,774,140 | | | | 365,008 | |
| | | | | | | | |
| | |
| | $ | 13,214,810 | | | $ | 1,641,553 | |
| | | | | | | | |
LifePath Dynamic 2050 Fund | | | | | | | | |
Ordinary income | | $ | 21,192,293 | | | $ | 2,287,063 | |
Long-term capital gains | | | 3,867,356 | | | | 725,246 | |
| | | | | | | | |
| | |
| | $ | 25,059,649 | | | $ | 3,012,309 | |
| | | | | | | | |
LifePath Dynamic 2055 Fund | | | | | | | | |
Ordinary income | | $ | 7,760,560 | | | $ | 610,343 | |
Long-term capital gains | | | 1,136,685 | | | | 269,418 | |
| | | | | | | | |
| | |
| | $ | 8,897,245 | | | $ | 879,761 | |
| | | | | | | | |
LifePath Dynamic 2060 Fund | | | | | | | | |
Ordinary income | | $ | 1,395,073 | | | $ | 133,302 | |
Long-term capital gains | | | 291,443 | | | | 34,726 | |
| | | | | | | | |
| | |
| | $ | 1,686,516 | | | $ | 168,028 | |
| | | | | | | | |
LifePath Dynamic 2065 Fund | | | | | | | | |
Ordinary income | | $ | 541,591 | | | $ | 65,768 | |
Long-term capital gains | | | 80,007 | | | | — | |
| | | | | | | | |
| | |
| | $ | 621,598 | | | $ | 65,768 | |
| | | | | | | | |
| | |
| 150 | | 2 0 2 1 BLACK ROCK ANNUAL REPORT TO SHAREHOLDERS |
Notes to Financial Statements (continued)
As of December 31, 2021, the tax components of accumulated earnings (loss) were as follows:
| | | | | | | | | | | | | | | | |
| |
| | | | |
Fund Name | |
| Undistributed
Ordinary Income |
| |
| Undistributed
Long-Term Capital Gains |
| |
| Net Unrealized
Gains (Losses)(a) |
| | | Total | |
| |
| | | | |
LifePath Dynamic Retirement Fund | | $ | 436,477 | | | $ | 1,030,832 | | | $ | 97,248,188 | | | $ | 98,715,497 | |
LifePath Dynamic 2025 Fund | | | 484,732 | | | | 356,772 | | | | 10,383,932 | | | | 11,225,436 | |
LifePath Dynamic 2030 Fund | | | 2,499,192 | | | | 1,597,383 | | | | 31,523,110 | | | | 35,619,685 | |
LifePath Dynamic 2035 Fund | | | 1,145,878 | | | | 673,676 | | | | 16,449,298 | | | | 18,268,852 | |
LifePath Dynamic 2040 Fund | | | 2,437,506 | | | | 2,057,022 | | | | 67,894,716 | | | | 72,389,244 | |
LifePath Dynamic 2045 Fund | | | 1,348,057 | | | | 690,172 | | | | 15,182,478 | | | | 17,220,707 | |
LifePath Dynamic 2050 Fund | | | 1,812,980 | | | | 1,081,170 | | | | 32,900,882 | | | | 35,795,032 | |
LifePath Dynamic 2055 Fund | | | 1,020,528 | | | | 491,539 | | | | 10,275,069 | | | | 11,787,136 | |
LifePath Dynamic 2060 Fund | | | 246,718 | | | | 92,602 | | | | 2,356,556 | | | | 2,695,876 | |
LifePath Dynamic 2065 Fund | | | 76,411 | | | | 48,606 | | | | 945,983 | | | | 1,071,000 | |
| |
| | (a) | The difference between book-basis and tax-basis net unrealized gains was attributable primarily to the tax deferral of losses on wash sales and the timing and recognition of partnerships. | |
During the year ended December 31, 2021, the Funds listed below utilized the following amounts of their respective capital loss carryforward:
| | | | |
| |
| |
LifePath Dynamic Fund Name | | | Amounts | |
| |
| |
LifePath Dynamic 2060 Fund | | $ | 908 | |
LifePath Dynamic 2065 Fund | | | 177,558 | |
| |
As of December 31, 2021, gross unrealized appreciation and depreciation based on cost of investments (including short positions and derivatives, if any) for U.S. federal income tax purposes were as follows:
| | | | | | | | | | | | | | | | |
| |
| | | | |
| Fund Name | | Tax Cost | | | Gross Unrealized Appreciation | | | Gross Unrealized
Depreciation | | | Net Unrealized Appreciation (Depreciation) | |
| |
| | | | |
LifePath Dynamic Retirement Fund | | $ | 212,849,366 | | | $ | 100,931,983 | | | $ | (3,685,924 | ) | | $ | 97,246,059 | |
LifePath Dynamic 2025 Fund | | | 112,737,821 | | | | 12,942,008 | | | | (2,554,007 | ) | | | 10,388,001 | |
LifePath Dynamic 2030 Fund | | | 323,967,519 | | | | 42,110,990 | | | | (10,571,311 | ) | | | 31,539,679 | |
LifePath Dynamic 2035 Fund | | | 128,053,743 | | | | 17,930,581 | | | | (1,473,937 | ) | | | 16,456,644 | |
LifePath Dynamic 2040 Fund | | | 234,343,887 | | | | 70,928,582 | | | | (3,028,011 | ) | | | 67,900,571 | |
LifePath Dynamic 2045 Fund | | | 110,361,485 | | | | 15,532,375 | | | | (344,334 | ) | | | 15,188,041 | |
LifePath Dynamic 2050 Fund | | | 137,570,541 | | | | 33,065,990 | | | | (162,982 | ) | | | 32,903,008 | |
LifePath Dynamic 2055 Fund | | | 76,228,794 | | | | 10,370,689 | | | | (53,871 | ) | | | 10,316,818 | |
LifePath Dynamic 2060 Fund | | | 18,027,538 | | | | 2,374,397 | | | | (15,527 | ) | | | 2,358,870 | |
LifePath Dynamic 2065 Fund | | | 6,095,513 | | | | 951,636 | | | | (5,628 | ) | | | 946,008 | |
| |
The Trust, on behalf of the Funds, along with certain other funds managed by the Manager and its affiliates (“Participating Funds”), is a party to a 364-day, $2.25 billion credit agreement with a group of lenders. Under this agreement, the Funds may borrow to fund shareholder redemptions. Excluding commitments designated for certain individual funds, the Participating Funds, including the Funds, can borrow up to an aggregate commitment amount of $1.75 billion at any time outstanding, subject to asset coverage and other limitations as specified in the agreement. The credit agreement has the following terms: a fee of 0.10% per annum on unused commitment amounts and interest at a rate equal to the higher of (a) one-month London Interbank Offered Rate (“LIBOR”) (but, in any event, not less than 0.00%) on the date the loan is made plus 0.80% per annum or (b) the Fed Funds rate (but, in any event, not less than 0.00%) in effect from time to time plus 0.80% per annum on amounts borrowed. The agreement expires in April 2022 unless extended or renewed. These fees were allocated among such funds based upon portions of the aggregate commitment available to them and relative net assets of Participating Funds. During the year ended December 31, 2021, the Funds did not borrow under the credit agreement.
In the normal course of business, the Funds invest in securities or other instruments and may enter into certain transactions, and such activities subject each Fund to various risks, including among others, fluctuations in the market (market risk) or failure of an issuer to meet all of its obligations. The value of securities or other instruments may also be affected by various factors, including, without limitation: (i) the general economy; (ii) the overall market as well as local, regional or global political and/or social instability; (iii) regulation, taxation or international tax treaties between various countries; or (iv) currency, interest rate and price fluctuations. Local, regional or global events such as war, acts of terrorism, the spread of infectious illness or other public health issues, recessions, or other events could have a significant impact on the Funds and their investments. Each Fund’s prospectus provides details of the risks to which each Fund is subject.
| | |
NOTES TO FINANCIAL STATEMENTS | | 151 |
Notes to Financial Statements (continued)
The Funds may be exposed to additional risks when reinvesting cash collateral in money market funds that do not seek to maintain a stable NAV per share of $1.00, which may be subject to redemption gates or liquidity fees under certain circumstances.
Market Risk: An outbreak of respiratory disease caused by a novel coronavirus has developed into a global pandemic and has resulted in closing borders, quarantines, disruptions to supply chains and customer activity, as well as general concern and uncertainty. The impact of this pandemic, and other global health crises that may arise in the future, could affect the economies of many nations, individual companies and the market in general in ways that cannot necessarily be foreseen at the present time. This pandemic may result in substantial market volatility and may adversely impact the prices and liquidity of a fund’s investments. The duration of this pandemic and its effects cannot be determined with certainty.
Valuation Risk: The market values of equities, such as common stocks and preferred securities or equity related investments, such as futures and options, may decline due to general market conditions which are not specifically related to a particular company. They may also decline due to factors which affect a particular industry or industries. A Fund may invest in illiquid investments. An illiquid investment is any investment that a Fund reasonably expects cannot be sold or disposed of in current market conditions in seven calendar days or less without the sale or disposition significantly changing the market value of the investment. A Fund may experience difficulty in selling illiquid investments in a timely manner at the price that it believes the investments are worth. Prices may fluctuate widely over short or extended periods in response to company, market or economic news. Markets also tend to move in cycles, with periods of rising and falling prices. This volatility may cause each Fund’s NAV to experience significant increases or decreases over short periods of time. If there is a general decline in the securities and other markets, the NAV of a Fund may lose value, regardless of the individual results of the securities and other instruments in which a Fund invests.
Counterparty Credit Risk: The Funds may be exposed to counterparty credit risk, or the risk that an entity may fail to or be unable to perform on its commitments related to unsettled or open transactions, including making timely interest and/or principal payments or otherwise honoring its obligations. The Funds manage counterparty credit risk by entering into transactions only with counterparties that the Manager believes have the financial resources to honor their obligations and by monitoring the financial stability of those counterparties. Financial assets, which potentially expose the Funds to market, issuer and counterparty credit risks, consist principally of financial instruments and receivables due from counterparties. The extent of the Funds’ exposure to market, issuer and counterparty credit risks with respect to these financial assets is approximately their value recorded in the Statements of Assets and Liabilities, less any collateral held by the Funds.
A derivative contract may suffer a mark-to-market loss if the value of the contract decreases due to an unfavorable change in the market rates or values of the underlying instrument. Losses can also occur if the counterparty does not perform under the contract.
With exchange-traded futures, there is less counterparty credit risk to the Funds since the exchange or clearinghouse, as counterparty to such instruments, guarantees against a possible default. The clearinghouse stands between the buyer and the seller of the contract; therefore, credit risk is limited to failure of the clearinghouse. While offset rights may exist under applicable law, a Fund does not have a contractual right of offset against a clearing broker or clearinghouse in the event of a default (including the bankruptcy or insolvency). Additionally, credit risk exists in exchange-traded futures with respect to initial and variation margin that is held in a clearing broker’s customer accounts. While clearing brokers are required to segregate customer margin from their own assets, in the event that a clearing broker becomes insolvent or goes into bankruptcy and at that time there is a shortfall in the aggregate amount of margin held by the clearing broker for all its clients, typically the shortfall would be allocated on a pro rata basis across all the clearing broker’s customers, potentially resulting in losses to the Funds.
Concentration Risk: A diversified portfolio, where this is appropriate and consistent with a fund’s objectives, minimizes the risk that a price change of a particular investment will have a material impact on the NAV of a fund. The investment concentrations within each Fund’s portfolio are disclosed in its Schedule of Investments.
Certain Funds invest a significant portion of their assets in fixed-income securities and/or use derivatives tied to the fixed-income markets. Changes in market interest rates or economic conditions may affect the value and/or liquidity of such investments. Interest rate risk is the risk that prices of bonds and other fixed-income securities will increase as interest rates fall and decrease as interest rates rise. The Funds may be subject to a greater risk of rising interest rates due to the current period of historically low rates.
LIBOR Transition Risk: The United Kingdom’s Financial Conduct Authority announced a phase out of the LIBOR. Although many LIBOR rates will cease to be published or no longer will be representative of the underlying market they seek to measure after December 31, 2021, a selection of widely used USD LIBOR rates will continue to be published through June 2023 in order to assist with the transition. The Funds may be exposed to financial instruments tied to LIBOR to determine payment obligations, financing terms, hedging strategies or investment value. The transition process away from LIBOR might lead to increased volatility and illiquidity in markets for, and reduce the effectiveness of new hedges placed against instruments whose terms currently include LIBOR. The ultimate effect of the LIBOR transition process on the Funds is uncertain.
| 11. | CAPITAL SHARE TRANSACTIONS |
Transactions in capital shares for each class were as follows:
| | | | | | | | | | | | | | | | |
| |
| | |
| | | Year Ended 12/31/21 | | | Year Ended 12/31/20 | |
| | | | | | | | |
| | | | |
LifePath Dynamic Fund Name / Share Class | | | Shares | | | | Amounts | | | | Shares | | | | Amounts | |
| |
| | | | |
LifePath Dynamic Retirement Fund | | | | | | | | | | | | | | | | |
Institutional | | | | | | | | | | | | | | | | |
Shares sold | | | 488,060 | | | $ | 5,807,239 | | | | 1,330,711 | | | $ | 14,827,207 | |
Shares issued in reinvestment of distributions | | | 602,777 | | | | 6,729,956 | | | | 319,690 | | | | 3,643,195 | |
Shares redeemed | | | (1,570,916 | ) | | | (18,746,467 | ) | | | (5,576,199 | ) | | | (61,625,389 | ) |
| | | | | | | | | | | | | | | | |
| | | | |
| | | (480,079 | ) | | $ | (6,209,272 | ) | | | (3,925,798 | ) | | $ | (43,154,987 | ) |
| | | | | | | | | | | | | | | | |
| | |
| 152 | | 2 0 2 1 BLACK ROCK ANNUAL REPORT TO SHAREHOLDERS |
Notes to Financial Statements (continued)
| | | | | | | | | | | | | | | | |
| |
| | |
| |
| Year Ended
12/31/21 |
| |
| Year Ended
12/31/20 |
|
| | | | | | | | |
| | | | |
LifePath Dynamic Fund Name / Share Class (continued) | | | Shares | | | | Amounts | | | | Shares | | | | Amounts | |
| |
| | | | |
LifePath Dynamic Retirement Fund (continued) | | | | | | | | | | | | | | | | |
Investor A | | | | | | | | | | | | | | | | |
Shares sold and automatic conversion of shares | | | 2,084,340 | | | $ | 21,156,438 | | | | 1,289,826 | | | $ | 12,480,972 | |
Shares issued in reinvestment of distributions | | | 2,771,959 | | | | 26,074,394 | | | | 1,404,154 | | | | 13,755,754 | |
Shares redeemed | | | (5,851,506 | ) | | | (59,028,728 | ) | | | (8,171,762 | ) | | | (78,187,972 | ) |
| | | | | | | | | | | | | | | | |
| | | | |
| | | (995,207 | ) | | $ | (11,797,896 | ) | | | (5,477,782 | ) | | $ | (51,951,246 | ) |
| | | | | | | | | | | | | | | | |
Investor C | | | | | | | | | | | | | | | | |
Shares sold | | | 37,075 | | | $ | 434,563 | | | | 44,105 | | | $ | 472,227 | |
Shares issued in reinvestment of distributions | | | 25,726 | | | | 281,301 | | | | 11,528 | | | | 129,725 | |
Shares redeemed and automatic conversion of shares | | | (52,604 | ) | | | (614,208 | ) | | | (209,277 | ) | | | (2,201,261 | ) |
| | | | | | | | | | | | | | | | |
| | | | |
| | | 10,197 | | | $ | 101,656 | | | | (153,644 | ) | | $ | (1,599,309 | ) |
| | | | | | | | | | | | | | | | |
Class K | | | | | | | | | | | | | | | | |
Shares sold | | | 1,819,072 | | | $ | 21,461,764 | | | | 4,150,218 | | | $ | 45,403,171 | |
Shares issued in reinvestment of distributions | | | 971,319 | | | | 10,784,844 | | | | 460,902 | | | | 5,203,342 | |
Shares redeemed | | | (1,935,290 | ) | | | (22,698,640 | ) | | | (4,085,339 | ) | | | (44,710,032 | ) |
| | | | | | | | | | | | | | | | |
| | | | |
| | | 855,101 | | | $ | 9,547,968 | | | | 525,781 | | | $ | 5,896,481 | |
| | | | | | | | | | | | | | | | |
| | | | |
Class R | | | | | | | | | | | | | | | | |
Shares sold | | | 128,160 | | | $ | 1,495,661 | | | | 196,466 | | | $ | 2,175,319 | |
Shares issued in reinvestment of distributions | | | 69,987 | | | | 771,413 | | | | 32,159 | | | | 363,407 | |
Shares redeemed | | | (173,180 | ) | | | (2,027,911 | ) | | | (162,360 | ) | | | (1,740,224 | ) |
| | | | | | | | | | | | | | | | |
| | | | |
| | | 24,967 | | | $ | 239,163 | | | | 66,265 | | | $ | 798,502 | |
| | | | | | | | | | | | | | | | |
| | | | |
| | | (585,021 | ) | | $ | (8,118,381 | ) | | | (8,965,178 | ) | | $ | (90,010,559 | ) |
| | | | | | | | | | | | | | | | |
| | | | | | | | | | | | | |
| |
| | |
| |
| Year Ended
12/31/21 |
| |
| Year Ended
12/31/20 |
|
| | | | | | | | |
| | | | |
LifePath Dynamic Fund Name / Share Class | | | Shares | | | | Amounts | | | | Shares | | | | Amounts | |
| |
| | | | |
LifePath Dynamic 2025 Fund | | | | | | | | | | | | | | | | |
Institutional | | | | | | | | | | | | | | | | |
Shares sold | | | 129,101 | | | $ | 1,966,729 | | | | 888,646 | | | $ | 11,673,760 | |
Shares issued in reinvestment of distributions | | | 83,250 | | | | 1,217,834 | | | | 21,384 | | | | 288,932 | |
Shares redeemed | | | (115,692 | ) | | | (1,765,047 | ) | | | (400,641 | ) | | | (5,305,987 | ) |
| | | | | | | | | | | | | | | | |
| | | | |
| | | 96,659 | | | $ | 1,419,516 | | | | 509,389 | | | $ | 6,656,705 | |
| | | | | | | | | | | | | | | | |
| | | | |
Investor A | | | | | | | | | | | | | | | | |
Shares sold and automatic conversion of shares | | | 447,327 | | | $ | 6,741,345 | | | | 636,798 | | | $ | 8,435,427 | |
Shares issued in reinvestment of distributions | | | 165,045 | | | | 2,387,829 | | | | 41,843 | | | | 561,896 | |
Shares redeemed | | | (627,726 | ) | | | (9,428,824 | ) | | | (750,001 | ) | | | (9,681,873 | ) |
| | | | | | | | | | | | | | | | |
| | | | |
| | | (15,354 | ) | | $ | (299,650 | ) | | | (71,360 | ) | | $ | (684,550 | ) |
| | | | | | | | | | | | | | | | |
| | | | |
Investor C | | | | | | | | | | | | | | | | |
Shares sold | | | 31,623 | | | $ | 476,473 | | | | 45,168 | | | $ | 579,626 | |
Shares issued in reinvestment of distributions | | | 18,078 | | | | 259,044 | | | | 3,687 | | | | 49,190 | |
Shares redeemed and automatic conversion of shares | | | (34,757 | ) | | | (520,097 | ) | | | (127,465 | ) | | | (1,643,028 | ) |
| | | | | | | | | | | | | | | | |
| | | | |
| | | 14,944 | | | $ | 215,420 | | | | (78,610 | ) | | $ | (1,014,212 | ) |
| | | | | | | | | | | | | | | | |
| | | | |
Class K | | | | | | | | | | | | | | | | |
Shares sold | | | 1,985,634 | | | $ | 29,873,204 | | | | 3,093,257 | | | $ | 41,393,406 | |
Shares issued in reinvestment of distributions | | | 546,510 | | | | 7,903,323 | | | | 121,859 | | | | 1,627,680 | |
Shares redeemed | | | (1,307,649 | ) | | | (19,779,402 | ) | | | (1,677,608 | ) | | | (22,161,954 | ) |
| | | | | | | | | | | | | | | | |
| | | | |
| | | 1,224,495 | | | $ | 17,997,125 | | | | 1,537,508 | | | $ | 20,859,132 | |
| | | | | | | | | | | | | | | | |
| | | | |
Class R | | | | | | | | | | | | | | | | |
Shares sold | | | 102,250 | | | $ | 1,536,990 | | | | 88,418 | | | $ | 1,078,919 | |
Shares issued in reinvestment of distributions | | | 26,436 | | | | 381,977 | | | | 6,234 | | | | 82,699 | |
Shares redeemed | | | (101,199 | ) | | | (1,530,727 | ) | | | (263,219 | ) | | | (3,351,082 | ) |
| | | | | | | | | | | | | | | | |
| | | | |
| | | 27,487 | | | $ | 388,240 | | | | (168,567 | ) | | $ | (2,189,464 | ) |
| | | | | | | | | | | | | | | | |
| | | | |
| | | 1,348,231 | | | $ | 19,720,651 | | | | 1,728,360 | | | $ | 23,627,611 | |
| | | | | | | | | | | | | | | | |
| | |
NOTES TO FINANCIAL STATEMENTS | | 153 |
Notes to Financial Statements (continued)
| | | | | | | | | | | | | | | | |
| |
| | |
| | | Year Ended | | | Year Ended | |
| | | 12/31/21 | | | 12/31/20 | |
| | | | | | | | |
| | | | |
| LifePath Dynamic Fund Name / Share Class | | Shares | | | Amounts | | | Shares | | | Amounts | |
| |
| | | | |
LifePath Dynamic 2030 Fund | | | | | | | | | | | | | | | | |
Institutional | | | | | | | | | | | | | | | | |
Shares sold | | | 457,588 | | | $ | 7,030,100 | | | | 1,111,830 | | | $ | 14,446,442 | |
Shares issued in reinvestment of distributions | | | 580,377 | | | | 8,372,161 | | | | 169,701 | | | | 2,300,605 | |
Shares redeemed | | | (1,072,915 | ) | | | (16,716,346 | ) | | | (2,690,429 | ) | | | (36,053,727 | ) |
| | | | | | | | | | | | | | | | |
| | | | |
| | | (34,950 | ) | | $ | (1,314,085 | ) | | | (1,408,898 | ) | | $ | (19,306,680 | ) |
| | | | | | | | | | | | | | | | |
Investor A | | | | | | | | | | | | | | | | |
Shares sold and automatic conversion of shares | | | 1,241,938 | | | $ | 18,268,932 | | | | 1,133,530 | | | $ | 14,351,731 | |
Shares issued in reinvestment of distributions | | | 2,027,350 | | | | 27,645,121 | | | | 568,502 | | | | 7,330,626 | |
Shares redeemed | | | (3,337,844 | ) | | | (48,673,951 | ) | | | (4,973,565 | ) | | | (62,154,118 | ) |
| | | | | | | | | | | | | | | | |
| | | | |
| | | (68,556 | ) | | $ | (2,759,898 | ) | | | (3,271,533 | ) | | $ | (40,471,761 | ) |
| | | | | | | | | | | | | | | | |
Investor C | | | | | | | | | | | | | | | | |
Shares sold | | | 33,067 | | | $ | 496,863 | | | | 44,725 | | | $ | 576,048 | |
Shares issued in reinvestment of distributions | | | 27,908 | | | | 390,879 | | | | 7,704 | | | | 102,091 | |
Shares redeemed and automatic conversion of shares | | | (66,384 | ) | | | (1,012,136 | ) | | | (130,982 | ) | | | (1,709,624 | ) |
| | | | | | | | | | | | | | | | |
| | | | |
| | | (5,409 | ) | | $ | (124,394 | ) | | | (78,553 | ) | | $ | (1,031,485 | ) |
| | | | | | | | | | | | | | | | |
Class K | | | | | | | | | | | | | | | | |
Shares sold | | | 2,167,704 | | | $ | 33,321,257 | | | | 3,321,635 | | | $ | 44,547,708 | |
Shares issued in reinvestment of distributions | | | 1,055,122 | | | | 15,168,552 | | | | 252,738 | | | | 3,401,010 | |
Shares redeemed | | | (1,303,916 | ) | | | (20,047,131 | ) | | | (2,450,871 | ) | | | (31,995,623 | ) |
| | | | | | | | | | | | | | | | |
| | | | |
| | | 1,918,910 | | | $ | 28,442,678 | | | | 1,123,502 | | | $ | 15,953,095 | |
| | | | | | | | | | | | | | | | |
Class R | | | | | | | | | | | | | | | | |
Shares sold | | | 144,805 | | | $ | 2,187,277 | | | | 129,339 | | | $ | 1,736,301 | |
Shares issued in reinvestment of distributions | | | 55,951 | | | | 792,671 | | | | 10,860 | | | | 146,268 | |
Shares redeemed | | | (115,770 | ) | | | (1,764,305 | ) | | | (181,463 | ) | | | (2,344,403 | ) |
| | | | | | | | | | | | | | | | |
| | | | |
| | | 84,986 | | | $ | 1,215,643 | | | | (41,264 | ) | | $ | (461,834 | ) |
| | | | | | | | | | | | | | | | |
| | | | |
| | | 1,894,981 | | | $ | 25,459,944 | | | | (3,676,746 | ) | | $ | (45,318,665 | ) |
| | | | | | | | | | | | | | | | |
| | | | | | | | | | | | | | | | |
| |
| | |
| | | Year Ended | | | Year Ended | |
| | | 12/31/21 | | | 12/31/20 | |
| | | | | | | | |
| | | | |
| LifePath Dynamic Fund Name / Share Class | | Shares | | | Amounts | | | Shares | | | Amounts | |
| |
| | | | |
LifePath Dynamic 2035 Fund | | | | | | | | | | | | | | | | |
Institutional | | | | | | | | | | | | | | | | |
Shares sold | | | 137,169 | | | $ | 2,331,790 | | | | 686,409 | | | $ | 9,434,424 | |
Shares issued in reinvestment of distributions | | | 88,487 | | | | 1,438,930 | | | | 16,611 | | | | 231,317 | |
Shares redeemed | | | (159,116 | ) | | | (2,694,922 | ) | | | (248,957 | ) | | | (3,499,406 | ) |
| | | | | | | | | | | | | | | | |
| | | | |
| | | 66,540 | | | $ | 1,075,798 | | | | 454,063 | | | $ | 6,166,335 | |
| | | | | | | | | | | | | | | | |
Investor A | | | | | | | | | | | | | | | | |
Shares sold and automatic conversion of shares | | | 300,647 | | | $ | 5,100,186 | | | | 283,156 | | | $ | 3,844,387 | |
Shares issued in reinvestment of distributions | | | 183,138 | | | | 2,961,409 | | | | 40,702 | | | | 560,632 | |
Shares redeemed | | | (622,675 | ) | | | (10,409,147 | ) | | | (553,874 | ) | | | (7,516,676 | ) |
| | | | | | | | | | | | | | | | |
| | | | |
| | | (138,890 | ) | | $ | (2,347,552 | ) | | | (230,016 | ) | | $ | (3,111,657 | ) |
| | | | | | | | | | | | | | | | |
Investor C | | | | | | | | | | | | | | | | |
Shares sold | | | 41,902 | | | $ | 697,692 | | | | 50,104 | | | $ | 696,856 | |
Shares issued in reinvestment of distributions | | | 23,931 | | | | 380,599 | | | | 3,106 | | | | 42,447 | |
Shares redeemed and automatic conversion of shares | | | (34,942 | ) | | | (589,940 | ) | | | (78,832 | ) | | | (1,087,914 | ) |
| | | | | | | | | | | | | | | | |
| | | | |
| | | 30,891 | | | $ | 488,351 | | | | (25,622 | ) | | $ | (348,611 | ) |
| | | | | | | | | | | | | | | | |
Class K | | | | | | | | | | | | | | | | |
Shares sold | | | 1,925,304 | | | $ | 33,068,576 | | | | 3,318,437 | | | $ | 48,044,512 | |
Shares issued in reinvestment of distributions | | | 633,873 | | | | 10,464,211 | | | | 94,266 | | | | 1,333,583 | |
Shares redeemed | | | (959,255 | ) | | | (16,595,771 | ) | | | (1,111,668 | ) | | | (15,435,233 | ) |
| | | | | | | | | | | | | | | | |
| | | | |
| | | 1,599,922 | | | $ | 26,937,016 | | | | 2,301,035 | | | $ | 33,942,862 | |
| | | | | | | | | | | | | | | | |
| | |
| 154 | | 2 0 2 1 BLACK ROCK ANNUAL REPORT TO SHAREHOLDERS |
Notes to Financial Statements (continued)
| | | | | | | | | | | | | | | | |
| |
| | |
| | | Year Ended | | | Year Ended | |
| | | 12/31/21 | | | 12/31/20 | |
| | | | | | | | |
| | | | |
| LifePath Dynamic Fund Name / Share Class (continued) | | Shares | | | Amounts | | | Shares | | | Amounts | |
| |
| | | | |
LifePath Dynamic 2035 Fund (continued) | | | | | | | | | | | | | | | | |
Class R | | | | | | | | | | | | | | | | |
Shares sold | | | 76,583 | | | $ | 1,296,077 | | | | 75,984 | | | $ | 1,034,741 | |
Shares issued in reinvestment of distributions | | | 23,922 | | | | 385,845 | | | | 4,077 | | | | 55,606 | |
Shares redeemed | | | (35,783 | ) | | | (599,331 | ) | | | (303,414 | ) | | | (4,129,418 | ) |
| | | | | | | | | | | | | | | | |
| | | | |
| | | 64,722 | | | $ | 1,082,591 | | | | (223,353 | ) | | $ | (3,039,071 | ) |
| | | | | | | | | | | | | | | | |
| | | | |
| | | 1,623,185 | | | $ | 27,236,204 | | | | 2,276,107 | | | $ | 33,609,858 | |
| | | | | | | | | | | | | | | | |
| | | | | | | | | | | | | | | | |
| |
| | |
| | | Year Ended | | | Year Ended | |
| | | 12/31/21 | | | 12/31/20 | |
| | | | | | | | |
| | | | |
| LifePath Dynamic Fund Name / Share Class | | Shares | | | Amounts | | | Shares | | | Amounts | |
| |
| | | | |
LifePath Dynamic 2040 Fund | | | | | | | | | | | | | | | | |
Institutional | | | | | | | | | | | | | | | | |
Shares sold | | | 329,218 | | | $ | 6,553,364 | | | | 726,062 | | | $ | 11,649,973 | |
Shares issued in reinvestment of distributions | | | 532,577 | | | | 9,838,851 | | | | 150,014 | | | | 2,555,571 | |
Shares redeemed | | | (1,003,772 | ) | | | (20,410,866 | ) | | | (1,224,317 | ) | | | (20,494,640 | ) |
| | | | | | | | | | | | | | | | |
| | | | |
| | | (141,977 | ) | | $ | (4,018,651 | ) | | | (348,241 | ) | | $ | (6,289,096 | ) |
| | | | | | | | | | | | | | | | |
Investor A | | | | | | | | | | | | | | | | |
Shares sold and automatic conversion of shares | | | 705,134 | | | $ | 12,521,448 | | | | 961,598 | | | $ | 13,999,619 | |
Shares issued in reinvestment of distributions | | | 1,922,347 | | | | 30,980,176 | | | | 488,068 | | | | 7,421,469 | |
Shares redeemed | | | (2,224,604 | ) | | | (39,351,209 | ) | | | (3,227,409 | ) | | | (47,302,352 | ) |
| | | | | | | | | | | | | | | | |
| | | | |
| | | 402,877 | | | $ | 4,150,415 | | | | (1,777,743 | ) | | $ | (25,881,264 | ) |
| | | | | | | | | | | | | | | | |
Investor C | | | | | | | | | | | | | | | | |
Shares sold | | | 17,643 | | | $ | 344,833 | | | | 28,242 | | | $ | 437,016 | |
Shares issued in reinvestment of distributions | | | 23,970 | | | | 430,556 | | | | 5,392 | | | | 90,304 | |
Shares redeemed and automatic conversion of shares | | | (26,516 | ) | | | (511,440 | ) | | | (101,124 | ) | | | (1,631,445 | ) |
| | | | | | | | | | | | | | | | |
| | | | |
| | | 15,097 | | | $ | 263,949 | | | | (67,490 | ) | | $ | (1,104,125 | ) |
| | | | | | | | | | | | | | | | |
Class K | | | | | | | | | | | | | | | | |
Shares sold | | | 1,435,124 | | | $ | 28,763,844 | | | | 2,089,339 | | | $ | 35,324,849 | |
Shares issued in reinvestment of distributions | | | 797,388 | | | | 14,800,890 | | | | 171,816 | | | | 2,907,765 | |
Shares redeemed | | | (588,910 | ) | | | (11,833,305 | ) | | | (1,987,238 | ) | | | (32,571,544 | ) |
| | | | | | | | | | | | | | | | |
| | | | |
| | | 1,643,602 | | | $ | 31,731,429 | | | | 273,917 | | | $ | 5,661,070 | |
| | | | | | | | | | | | | | | | |
Class R | | | | | | | | | | | | | | | | |
Shares sold | | | 93,641 | | | $ | 1,862,801 | | | | 75,701 | | | $ | 1,176,447 | |
Shares issued in reinvestment of distributions | | | 47,487 | | | | 860,820 | | | | 8,661 | | | | 147,061 | |
Shares redeemed | | | (73,655 | ) | | | (1,456,988 | ) | | | (106,501 | ) | | | (1,545,522 | ) |
| | | | | | | | | | | | | | | | |
| | | | |
| | | 67,473 | | | $ | 1,266,633 | | | | (22,139 | ) | | $ | (222,014 | ) |
| | | | | | | | | | | | | | | | |
| | | | |
| | | 1,987,072 | | | $ | 33,393,775 | | | | (1,941,696 | ) | | $ | (27,835,429 | ) |
| | | | | | | | | | | | | | | | |
| | | | | | | | | | | | | | | | |
| |
| | |
| | | Year Ended | | | Year Ended | |
| | | 12/31/21 | | | 12/31/20 | |
| | | | | | | | |
| | | | |
| LifePath Dynamic Fund Name / Share Class | | Shares | | | Amounts | | | Shares | | | Amounts | |
| |
| | | | |
LifePath Dynamic 2045 Fund | | | | | | | | | | | | | | | | |
Institutional | | | | | | | | | | | | | | | | |
Shares sold | | | 117,501 | | | $ | 2,190,996 | | | | 250,447 | | | $ | 3,658,392 | |
Shares issued in reinvestment of distributions | | | 54,880 | | | | 980,685 | | | | 10,575 | | | | 153,135 | |
Shares redeemed | | | (126,378 | ) | | | (2,372,547 | ) | | | (126,020 | ) | | | (1,880,638 | ) |
| | | | | | | | | | | | | | | | |
| | | | |
| | | 46,003 | | | $ | 799,134 | | | | 135,002 | | | $ | 1,930,889 | |
| | | | | | | | | | | | | | | | |
Investor A | | | | | | | | | | | | | | | | |
Shares sold and automatic conversion of shares | | | 316,774 | | | $ | 5,884,997 | | | | 205,905 | | | $ | 2,933,477 | |
Shares issued in reinvestment of distributions | | | 138,085 | | | | 2,457,831 | | | | 25,478 | | | | 364,949 | |
Shares redeemed | | | (281,044 | ) | | | (5,089,449 | ) | | | (405,721 | ) | | | (5,883,322 | ) |
| | | | | | | | | | | | | | | | |
| | | | |
| | | 173,815 | | | $ | 3,253,379 | | | | (174,338 | ) | | $ | (2,584,896 | ) |
| | | | | | | | | | | | | | | | |
| | |
NOTES TO FINANCIAL STATEMENTS | | 155 |
Notes to Financial Statements (continued)
| | | | | | | | | | | | | | | | |
| |
| | |
| | | Year Ended | | | Year Ended | |
| | | 12/31/21 | | | 12/31/20 | |
| | | | | | | | |
| | | | |
| LifePath Dynamic Fund Name / Share Class (continued) | | Shares | | | Amounts | | | Shares | | | Amounts | |
| |
| | | | |
LifePath Dynamic 2045 Fund (continued) | | | | | | | | | | | | | | | | |
Investor C | | | | | | | | | | | | | | | | |
Shares sold | | | 17,980 | | | $ | 333,815 | | | | 28,969 | | | $ | 409,685 | |
Shares issued in reinvestment of distributions | | | 8,624 | | | | 150,554 | | | | 1,380 | | | | 19,279 | |
Shares redeemed and automatic conversion of shares | | | (13,984 | ) | | | (262,071 | ) | | | (78,274 | ) | | | (1,134,872 | ) |
| | | | | | | | | | | | | | | | |
| | | | |
| | | 12,620 | | | $ | 222,298 | | | | (47,925 | ) | | $ | (705,908 | ) |
| | | | | | | | | | | | | | | | |
Class K | | | | | | | | | | | | | | | | |
Shares sold | | | 1,411,588 | | | $ | 26,489,500 | | | | 2,578,695 | | | $ | 39,845,566 | |
Shares issued in reinvestment of distributions | | | 513,064 | | | | 9,289,105 | | | | 71,091 | | | | 1,047,675 | |
Shares redeemed | | | (620,428 | ) | | | (11,861,968 | ) | | | (717,187 | ) | | | (10,686,485 | ) |
| | | | | | | | | | | | | | | | |
| | | | |
| | | 1,304,224 | | | $ | 23,916,637 | | | | 1,932,599 | | | $ | 30,206,756 | |
| | | | | | | | | | | | | | | | |
Class R | | | | | | | | | | | | | | | | |
Shares sold | | | 70,143 | | | $ | 1,291,442 | | | | 95,874 | | | $ | 1,379,186 | |
Shares issued in reinvestment of distributions | | | 18,628 | | | | 330,307 | | | | 3,933 | | | | 55,707 | |
Shares redeemed | | | (64,289 | ) | | | (1,201,032 | ) | | | (224,764 | ) | | | (3,121,539 | ) |
| | | | | | | | | | | | | | | | |
| | | | |
| | | 24,482 | | | $ | 420,717 | | | | (124,957 | ) | | $ | (1,686,646 | ) |
| | | | | | | | | | | | | | | | |
| | | | |
| | | 1,561,144 | | | $ | 28,612,165 | | | | 1,720,381 | | | $ | 27,160,195 | |
| | | | | | | | | | | | | | | | |
| | | | | | | | | | | | | | | | |
| |
| | |
| | | Year Ended | | | Year Ended | |
| | | 12/31/21 | | | 12/31/20 | |
| | | | | | | | |
| | | | |
| LifePath Dynamic Fund Name / Share Class | | Shares | | | Amounts | | | Shares | | | Amounts | |
| |
| | | | |
LifePath Dynamic 2050 Fund | | | | | | | | | | | | | | | | |
Institutional | | | | | | | | | | | | | | | | |
Shares sold | | | 191,098 | | | $ | 4,743,957 | | | | 428,231 | | | $ | 8,437,258 | |
Shares issued in reinvestment of distributions | | | 137,349 | | | | 3,201,622 | | | | 20,479 | | | | 389,156 | |
Shares redeemed | | | (246,052 | ) | | | (6,189,010 | ) | | | (432,317 | ) | | | (8,672,932 | ) |
| | | | | | | | | | | | | | | | |
| | | | |
| | | 82,395 | | | $ | 1,756,569 | | | | 16,393 | | | $ | 153,482 | |
| | | | | | | | | | | | | | | | |
Investor A | | | | | | | | | | | | | | | | |
Shares sold and automatic conversion of shares | | | 445,766 | | | $ | 10,944,830 | | | | 481,629 | | | $ | 9,103,334 | |
Shares issued in reinvestment of distributions | | | 500,139 | | | | 11,590,017 | | | | 87,855 | | | | 1,645,182 | |
Shares redeemed | | | (780,092 | ) | | | (19,077,560 | ) | | | (1,065,892 | ) | | | (20,728,384 | ) |
| | | | | | | | | | | | | | | | |
| | | | |
| | | 165,813 | | | $ | 3,457,287 | | | | (496,408 | ) | | $ | (9,979,868 | ) |
| | | | | | | | | | | | | | | | |
Investor C | | | | | | | | | | | | | | | | |
Shares sold | | | 16,983 | | | $ | 414,400 | | | | 19,331 | | | $ | 363,377 | |
Shares issued in reinvestment of distributions | | | 12,637 | | | | 286,706 | | | | 1,332 | | | | 24,478 | |
Shares redeemed and automatic conversion of shares | | | (6,384 | ) | | | (152,240 | ) | | | (43,236 | ) | | | (833,967 | ) |
| | | | | | | | | | | | | | | | |
| | | | |
| | | 23,236 | | | $ | 548,866 | | | | (22,573 | ) | | $ | (446,112 | ) |
| | | | | | | | | | | | | | | | |
Class K | | | | | | | | | | | | | | | | |
Shares sold | | | 1,225,420 | | | $ | 30,444,365 | | | | 1,396,534 | | | $ | 27,851,210 | |
Shares issued in reinvestment of distributions | | | 407,268 | | | | 9,511,477 | | | | 47,255 | | | | 898,405 | |
Shares redeemed | | | (329,285 | ) | | | (8,214,927 | ) | | | (688,100 | ) | | | (13,531,366 | ) |
| | | | | | | | | | | | | | | | |
| | | | |
| | | 1,303,403 | | | $ | 31,740,915 | | | | 755,689 | | | $ | 15,218,249 | |
| | | | | | | | | | | | | | | | |
Class R | | | | | | | | | | | | | | | | |
Shares sold | | | 53,662 | | | $ | 1,312,981 | | | | 70,083 | | | $ | 1,372,096 | |
Shares issued in reinvestment of distributions | | | 20,247 | | | | 466,707 | | | | 2,952 | | | | 54,812 | |
Shares redeemed | | | (52,572 | ) | | | (1,319,726 | ) | | | (82,369 | ) | | | (1,567,665 | ) |
| | | | | | | | | | | | | | | | |
| | | | |
| | | 21,337 | | | $ | 459,962 | | | | (9,334 | ) | | $ | (140,757 | ) |
| | | | | | | | | | | | | | | | |
| | | | |
| | | 1,596,184 | | | $ | 37,963,599 | | | | 243,767 | | | $ | 4,804,994 | |
| | | | | | | | | | | | | | | | |
| | |
| 156 | | 2 0 2 1 BLACK ROCK ANNUAL REPORT TO SHAREHOLDERS |
Notes to Financial Statements (continued)
| | | | | | | | | | | | | | | | |
| |
| | |
| | | Year Ended 12/31/21 | | | Year Ended 12/31/20 | |
| | | | | | | | |
| | | | |
| LifePath Dynamic Fund Name / Share Class | | Shares | | | Amounts | | | Shares | | | Amounts | |
| |
| | | | |
LifePath Dynamic 2055 Fund | | | | | | | | | | | | | | | | |
Institutional | | | | | | | | | | | | | | | | |
Shares sold | | | 93,975 | | | $ | 1,844,990 | | | | 231,024 | | | $ | 3,529,560 | |
Shares issued in reinvestment of distributions | | | 45,733 | | | | 867,256 | | | | 7,155 | | | | 107,753 | |
Shares redeemed | | | (77,814 | ) | | | (1,534,485 | ) | | | (104,273 | ) | | | (1,674,923 | ) |
| | | | | | | | | | | | | | | | |
| | | | |
| | | 61,894 | | | $ | 1,177,761 | | | | 133,906 | | | $ | 1,962,390 | |
| | | | | | | | | | | | | | | | |
Investor A | | | | | | | | | | | | | | | | |
Shares sold and automatic conversion of shares | | | 239,813 | | | $ | 4,711,448 | | | | 265,301 | | | $ | 3,843,823 | |
Shares issued in reinvestment of distributions | | | 103,053 | | | | 1,941,240 | | | | 18,239 | | | | 269,077 | |
Shares redeemed | | | (304,194 | ) | | | (5,792,539 | ) | | | (238,110 | ) | | | (3,606,263 | ) |
| | | | | | | | | | | | | | | | |
| | | | |
| | | 38,672 | | | $ | 860,149 | | | | 45,430 | | | $ | 506,637 | |
| | | | | | | | | | | | | | | | |
Investor C | | | | | | | | | | | | | | | | |
Shares sold | | | 17,104 | | | $ | 330,001 | | | | 33,356 | | | $ | 487,218 | |
Shares issued in reinvestment of distributions | | | 7,688 | | | | 141,992 | | | | 1,033 | | | | 14,754 | |
Shares redeemed and automatic conversion of shares | | | (12,914 | ) | | | (249,612 | ) | | | (51,319 | ) | | | (761,069 | ) |
| | | | | | | | | | | | | | | | |
| | | | |
| | | 11,878 | | | $ | 222,381 | | | | (16,930 | ) | | $ | (259,097 | ) |
| | | | | | | | | | | | | | | | |
Class K | | | | | | | | | | | | | | | | |
Shares sold | | | 1,096,274 | | | $ | 21,791,848 | | | | 1,564,824 | | | $ | 25,100,115 | |
Shares issued in reinvestment of distributions | | | 296,265 | | | | 5,707,601 | | | | 29,937 | | | | 459,140 | |
Shares redeemed | | | (291,185 | ) | | | (5,828,891 | ) | | | (384,754 | ) | | | (5,962,713 | ) |
| | | | | | | | | | | | | | | | |
| | | | |
| | | 1,101,354 | | | $ | 21,670,558 | | | | 1,210,007 | | | $ | 19,596,542 | |
| | | | | | | | | | | | | | | | |
Class R | | | | | | | | | | | | | | | | |
Shares sold | | | 59,037 | | | $ | 1,152,986 | | | | 50,352 | | | $ | 739,749 | |
Shares issued in reinvestment of distributions | | | 12,248 | | | | 229,938 | | | | 1,922 | | | | 27,746 | |
Shares redeemed | | | (26,887 | ) | | | (535,488 | ) | | | (111,316 | ) | | | (1,651,107 | ) |
| | | | | | | | | | | | | | | | |
| | | | |
| | | 44,398 | | | $ | 847,436 | | | | (59,042 | ) | | $ | (883,612 | ) |
| | | | | | | | | | | | | | | | |
| | | | |
| | | 1,258,196 | | | $ | 24,778,285 | | | | 1,313,371 | | | $ | 20,922,860 | |
| | | | | | | | | | | | | | | | |
| | | | | | | | | | | | | | | | |
| |
| | |
| | | Year Ended 12/31/21 | | | Year Ended 12/31/20 | |
| | | | | | | | |
| | | | |
| LifePath Dynamic Fund Name / Share Class | | Shares | | | Amounts | | | Shares | | | Amounts | |
| |
| | | | |
LifePath Dynamic 2060 Fund | | | | | | | | | | | | | | | | |
Institutional | | | | | | | | | | | | | | | | |
Shares sold | | | 69,072 | | | $ | 978,745 | | | | 84,992 | | | $ | 921,162 | |
Shares issued in reinvestment of distributions | | | 7,698 | | | | 107,244 | | | | 1,155 | | | | 13,008 | |
Shares redeemed | | | (75,613 | ) | | | (1,083,664 | ) | | | (13,594 | ) | | | (154,817 | ) |
| | | | | | | | | | | | | | | | |
| | | | |
| | | 1,157 | | | $ | 2,325 | | | | 72,553 | | | $ | 779,353 | |
| | | | | | | | | | | | | | | | |
Investor A | | | | | | | | | | | | | | | | |
Shares sold and automatic conversion of shares | | | 28,776 | | | $ | 409,834 | | | | 23,396 | | | $ | 247,271 | |
Shares issued in reinvestment of distributions | | | 5,872 | | | | 81,679 | | | | 741 | | | | 8,006 | |
Shares redeemed | | | (3,991 | ) | | | (57,692 | ) | | | (13,024 | ) | | | (137,906 | ) |
| | | | | | | | | | | | | | | | |
| | | | |
| | | 30,657 | | | $ | 433,821 | | | | 11,113 | | | $ | 117,371 | |
| | | | | | | | | | | | | | | | |
Investor C | | | | | | | | | | | | | | | | |
Shares sold | | | 3,180 | | | $ | 45,432 | | | | 604 | | | $ | 7,060 | |
Shares issued in reinvestment of distributions | | | 375 | | | | 5,205 | | | | 10 | | | | 112 | |
Shares redeemed and automatic conversion of shares. | | | (93 | ) | | | (1,314 | ) | | | (2 | ) | | | (15 | ) |
| | | | | | | | | | | | | | | | |
| | | | |
| | | 3,462 | | | $ | 49,323 | | | | 612 | | | $ | 7,157 | |
| | | | | | | | | | | | | | | | |
Class K | | | | | | | | | | | | | | | | |
Shares sold | | | 615,517 | | | $ | 8,761,533 | | | | 443,286 | | | $ | 4,845,082 | |
Shares issued in reinvestment of distributions | | | 84,225 | | | | 1,175,237 | | | | 8,693 | | | | 95,943 | |
Shares redeemed | | | (158,579 | ) | | | (2,283,677 | ) | | | (66,899 | ) | | | (749,101 | ) |
| | | | | | | | | | | | | | | | |
| | | | |
| | | 541,163 | | | $ | 7,653,093 | | | | 385,080 | | | $ | 4,191,924 | |
| | | | | | | | | | | | | | | | |
| | |
NOTES TO FINANCIAL STATEMENTS | | 157 |
Notes to Financial Statements (continued)
| | | | | | | | | | | | | | | | |
| |
| | |
| | | Year Ended 12/31/21 | | | Year Ended 12/31/20 | |
| | | | | | | | |
| | | | |
| LifePath Dynamic Fund Name / Share Class (continued) | | Shares | | | Amounts | | | Shares | | | Amounts | |
| |
| | | | |
LifePath Dynamic 2060 Fund (continued) | | | | | | | | | | | | | | | | |
Class R | | | | | | | | | | | | | | | | |
Shares sold | | | 28,241 | | | $ | 402,825 | | | | 40,572 | | | $ | 437,393 | |
Shares issued in reinvestment of distributions | | | 4,426 | | | | 61,570 | | | | 303 | | | | 3,327 | |
Shares redeemed | | | (1,833 | ) | | | (26,332 | ) | | | (29,080 | ) | | | (320,618 | ) |
| | | 30,834 | | | $ | 438,063 | | | | 11,795 | | | $ | 120,102 | |
| | | | | | | | | | | | | | | | |
| | | | |
| | | 607,273 | | | $ | 8,576,625 | | | | 481,153 | | | $ | 5,215,907 | |
| | | | | | | | | | | | | | | | |
| | | | | | | | | | | | | | | | |
| |
| | |
| | | Year Ended 12/31/21 | | | Year Ended 12/31/20 | |
| | | | | | | | |
| | | | |
| LifePath Dynamic Fund Name / Share Class | | Shares | | | Amounts | | | Shares | | | Amounts | |
| |
| | | | |
LifePath Dynamic 2065 Fund | | | | | | | | | | | | | | | | |
Institutional | | | | | | | | | | | | | | | | |
Shares sold | | | 5,727 | | | $ | 76,345 | | | | 1,612 | | | $ | 17,752 | |
Shares issued in reinvestment of distributions | | | 591 | | | | 7,490 | | | | 8 | | | | 97 | |
Shares redeemed | | | (678 | ) | | | (8,919 | ) | | | (237 | ) | | | (2,714 | ) |
| | | | | | | | | | | | | | | | |
| | | | |
| | | 5,640 | | | $ | 74,916 | | | | 1,383 | | | $ | 15,135 | |
| | | | | | | | | | | | | | | | |
Investor A | | | | | | | | | | | | | | | | |
Shares sold and automatic conversion of shares | | | 15,244 | | | $ | 198,794 | | | | 2,782 | | | $ | 25,235 | |
Shares issued in reinvestment of distributions | | | 1,474 | | | | 18,665 | | | | 29 | | | | 299 | |
Shares redeemed | | | (2,400 | ) | | | (31,710 | ) | | | (114 | ) | | | (1,213 | ) |
| | | | | | | | | | | | | | | | |
| | | | |
| | | 14,318 | | | $ | 185,749 | | | | 2,697 | | | $ | 24,321 | |
| | | | | | | | | | | | | | | | |
Investor C | | | | | | | | | | | | | | | | |
Shares sold | | | 1,674 | | | $ | 21,634 | | | | — | | | $ | — | |
Shares issued in reinvestment of distributions | | | 146 | | | | 1,844 | | | | — | | | | — | |
Shares redeemed and automatic conversion of shares | | | (1 | ) | | | (15 | ) | | | — | | | | — | |
| | | | | | | | | | | | | | | | |
| | | | |
| | | 1,819 | | | $ | 23,463 | | | | — | | | $ | — | |
| | | | | | | | | | | | | | | | |
Class K | | | | | | | | | | | | | | | | |
Shares sold | | | 89,648 | | | $ | 1,172,991 | | | | 21,545 | | | $ | 225,023 | |
Shares issued in reinvestment of distributions | | | 8,058 | | | | 102,152 | | | | 145 | | | | 1,507 | |
Shares redeemed | | | (15,781 | ) | | | (210,506 | ) | | | (8,865 | ) | | | (92,138 | ) |
| | | | | | | | | | | | | | | | |
| | | | |
| | | 81,925 | | | $ | 1,064,637 | | | | 12,825 | | | $ | 134,392 | |
| | | | | | | | | | | | | | | | |
Class R | | | | | | | | | | | | | | | | |
Shares sold | | | 201 | | | $ | 2,702 | | | | 21 | | | $ | 240 | |
Shares issued in reinvestment of distributions | | | 19 | | | | 245 | | | | — | | | | 1 | |
Shares redeemed | | | (3 | ) | | | (41 | ) | | | — | | | | — | |
| | | | | | | | | | | | | | | | |
| | | | |
| | | 217 | | | $ | 2,906 | | | | 21 | | | $ | 241 | |
| | | | | | | | | | | | | | | | |
| | | | |
| | | 103,919 | | | $ | 1,351,671 | | | | 16,926 | | | $ | 174,089 | |
| | | | | | | | | | | | | | | | |
As of December 31, 2021, shares owned by BlackRock HoldCo 2, Inc., an affiliate of the Funds, were as follows:
| | | | | | | | | | | | | | | | | | | | | | | | |
| |
| | | | | | |
| Fund Name | | Institutional | | | Investor A | | | Investor C | | | Class K | | | Class R | | | Total | |
| |
| | | | | | |
LifePath Dynamic 2045 Fund | | | — | | | | — | | | | — | | | | 2,003 | | | | — | | | | 2,003 | |
LifePath Dynamic 2055 Fund | | | — | | | | — | | | | — | | | | 2,001 | | | | 2,000 | | | | 4,001 | |
LifePath Dynamic 2060 Fund | | | 2,000 | | | | 2,000 | | | | 2,000 | | | | 192,000 | | | | 2,000 | | | | 200,000 | |
| |
As of December 31, 2021, shares owned by BlackRock Financial Management, Inc., an affiliate of the Funds, were as follows:
| | | | | | | | | | | | | | | | | | | | | | | | |
| |
| | | | | | |
| Fund Name | | Institutional | | | Investor A | | | Investor C | | | Class K | | | Class R | | | Total | |
| |
| | | | | | |
LifePath Dynamic 2065 Fund | | | 40,000 | | | | 40,000 | | | | 40,000 | | | | 240,000 | | | | 40,000 | | | | 400,000 | |
| |
Management has evaluated the impact of all subsequent events on the Funds through the date the financial statements were issued and has determined that there were no subsequent events requiring adjustment or additional disclosure in the financial statements.
| | |
| 158 | | 2 0 2 1 BLACK ROCK ANNUAL REPORT TO SHAREHOLDERS |
Report of Independent Registered Public Accounting Firm
To the Board of Trustees of BlackRock Funds III and Shareholders of BlackRock LifePath® Dynamic Retirement Fund, BlackRock LifePath® Dynamic 2025 Fund, BlackRock LifePath® Dynamic 2030 Fund, BlackRock LifePath® Dynamic 2035 Fund, BlackRock LifePath® Dynamic 2040 Fund, BlackRock LifePath® Dynamic 2045 Fund, BlackRock LifePath® Dynamic 2050 Fund, BlackRock LifePath® Dynamic 2055 Fund, BlackRock LifePath® Dynamic 2060 Fund and BlackRock LifePath® Dynamic 2065 Fund
Opinions on the Financial Statements
We have audited the accompanying statements of assets and liabilities, including the schedules of investments, of BlackRock LifePath® Dynamic Retirement Fund, BlackRock LifePath® Dynamic 2025 Fund, BlackRock LifePath® Dynamic 2030 Fund, BlackRock LifePath® Dynamic 2035 Fund, BlackRock LifePath® Dynamic 2040 Fund, BlackRock LifePath® Dynamic 2045 Fund, BlackRock LifePath® Dynamic 2050 Fund, BlackRock LifePath® Dynamic 2055 Fund, BlackRock LifePath® Dynamic 2060 Fund and BlackRock LifePath® Dynamic 2065 Fund (ten of the series constituting BlackRock Funds III, hereafter collectively referred to as the “Funds”) as of December 31, 2021, the related statements of operations for the year ended December 31, 2021, the statements of changes in net assets for each of the two years in the period ended December 31, 2021, including the related notes, and the financial highlights for each of the periods indicated therein (collectively referred to as the “financial statements”). In our opinion, the financial statements present fairly, in all material respects, the financial position of each of the Funds as of December 31, 2021, the results of each of their operations for the year then ended, the changes in each of their net assets for each of the two years in the period ended December 31, 2021 and each of the financial highlights for each of the periods indicated therein in conformity with accounting principles generally accepted in the United States of America.
Basis for Opinions
These financial statements are the responsibility of the Funds’ management. Our responsibility is to express an opinion on the Funds’ financial statements based on our audits. We are a public accounting firm registered with the Public Company Accounting Oversight Board (United States) (PCAOB) and are required to be independent with respect to the Funds in accordance with the U.S. federal securities laws and the applicable rules and regulations of the Securities and Exchange Commission and the PCAOB.
We conducted our audits of these financial statements in accordance with the standards of the PCAOB. Those standards require that we plan and perform the audit to obtain reasonable assurance about whether the financial statements are free of material misstatement, whether due to error or fraud.
Our audits included performing procedures to assess the risks of material misstatement of the financial statements, whether due to error or fraud, and performing procedures that respond to those risks. Such procedures included examining, on a test basis, evidence regarding the amounts and disclosures in the financial statements. Our audits also included evaluating the accounting principles used and significant estimates made by management, as well as evaluating the overall presentation of the financial statements. Our procedures included confirmation of securities owned as of December 31, 2021 by correspondence with the custodian, administrator of the Underlying Master Portfolios, transfer agents and brokers; when replies were not received from brokers, we performed other auditing procedures. We believe that our audits provide a reasonable basis for our opinions.
/s/PricewaterhouseCoopers LLP
Philadelphia, Pennsylvania
February 24, 2022
We have served as the auditor of one or more BlackRock investment companies since 2000.
| | |
REPORT OF INDEPENDENT REGISTERED PUBLIC ACCOUNTING FIRM | | 159 |
Important Tax Information (unaudited)
The following amounts, or maximum amounts allowable by law, are hereby designated as qualified dividend income for individuals for the fiscal year ended December 31, 2021:
| | | | |
| |
| |
| LifePath Dynamic Fund Name | | Qualified Dividend Income | |
| |
| |
LifePath Dynamic Retirement Fund | | $ | 1,407,722 | |
LifePath Dynamic 2025 Fund | | | 670,843 | |
LifePath Dynamic 2030 Fund | | | 2,565,210 | |
LifePath Dynamic 2035 Fund | | | 1,175,697 | |
LifePath Dynamic 2040 Fund | | | 3,060,236 | |
LifePath Dynamic 2045 Fund | | | 1,195,502 | |
LifePath Dynamic 2050 Fund | | | 1,864,371 | |
LifePath Dynamic 2055 Fund | | | 828,323 | |
LifePath Dynamic 2060 Fund | | | 197,103 | |
LifePath Dynamic 2065 Fund | | | 74,849 | |
| |
The following amounts, or maximum amounts allowable by law, are hereby designated as qualified business income for individuals for the fiscal year ended December 31, 2021:
| | | | |
| |
| |
| LifePath Dynamic Fund Name | | Qualified Business Income | |
| |
| |
LifePath Dynamic Retirement Fund | | $ | 125,750 | |
LifePath Dynamic 2025 Fund | | | 36,280 | |
LifePath Dynamic 2030 Fund | | | 160,313 | |
LifePath Dynamic 2035 Fund | | | 55,184 | |
LifePath Dynamic 2040 Fund | | | 186,743 | |
LifePath Dynamic 2045 Fund | | | 48,995 | |
LifePath Dynamic 2050 Fund | | | 91,633 | |
LifePath Dynamic 2055 Fund | | | 33,533 | |
LifePath Dynamic 2060 Fund | | | 7,215 | |
LifePath Dynamic 2065 Fund | | | 3,032 | |
| |
The LifePath Dynamic Funds hereby designate the following amounts, or maximum amounts allowable by law, as capital gain dividends, subject to a long-term capital gains tax rate of not greater than 20%, for the fiscal year ended December 31, 2021:
| | | | |
| |
| |
| LifePath Dynamic Fund Name | | 20% Rate Long-Term Capital Gain Dividends | |
| |
| |
LifePath Dynamic Retirement Fund | | $ | 10,054,914 | |
LifePath Dynamic 2025 Fund | | | 2,065,558 | |
LifePath Dynamic 2030 Fund | | | 9,544,426 | |
LifePath Dynamic 2035 Fund | | | 2,014,010 | |
LifePath Dynamic 2040 Fund | | | 9,215,049 | |
LifePath Dynamic 2045 Fund | | | 1,774,140 | |
LifePath Dynamic 2050 Fund | | | 3,867,356 | |
LifePath Dynamic 2055 Fund | | | 1,136,685 | |
LifePath Dynamic 2060 Fund | | | 291,443 | |
LifePath Dynamic 2065 Fund | | | 80,007 | |
| |
The LifePath Dynamic Funds hereby designate the following amounts, or maximum amounts allowable by law, of distributions from direct federal obligation interest for the fiscal year ended December 31, 2021:
| | | | |
| |
| |
| LifePath Dynamic Fund Name | | Federal Obligation Interest | |
| |
| |
LifePath Dynamic Retirement Fund | | $ | 1,349,140 | |
LifePath Dynamic 2025 Fund | | | 448,396 | |
LifePath Dynamic 2030 Fund | | | 1,114,684 | |
LifePath Dynamic 2035 Fund | | | 338,608 | |
LifePath Dynamic 2040 Fund | | | 508,418 | |
LifePath Dynamic 2045 Fund | | | 93,038 | |
LifePath Dynamic 2050 Fund | | | 43,472 | |
LifePath Dynamic 2055 Fund | | | 5,464 | |
LifePath Dynamic 2060 Fund | | | 915 | |
LifePath Dynamic 2065 Fund | | | 222 | |
| |
The law varies in each state as to whether and what percent of ordinary income dividends attributable to federal obligations is exempt from state income tax. Shareholders are advised to check with their tax advisers to determine if any portion of the dividends received is exempt from state income tax.
| | |
| 160 | | 2 0 2 1 BLACK ROCK ANNUAL REPORT TO SHAREHOLDERS |
Important Tax Information (unaudited) (continued)
The following percentages, or maximum percentages allowable by law, of ordinary income distributions paid during the fiscal year ended December 31, 2021 qualified for the dividends-received deduction for corporate shareholders:
| | | | |
| |
| |
| LifePath Dynamic Fund Name | | Dividends-Received Deduction | |
| |
| |
LifePath Dynamic Retirement Fund | | | 1.21% | |
LifePath Dynamic 2025 Fund | | | 1.87 | |
LifePath Dynamic 2030 Fund | | | 1.65 | |
LifePath Dynamic 2035 Fund | | | 2.33 | |
LifePath Dynamic 2040 Fund | | | 1.71 | |
LifePath Dynamic 2045 Fund | | | 2.79 | |
LifePath Dynamic 2050 Fund | | | 2.36 | |
LifePath Dynamic 2055 Fund | | | 2.85 | |
LifePath Dynamic 2060 Fund | | | 3.68 | |
LifePath Dynamic 2065 Fund | | | 3.57 | |
| |
The LifePath Dynamic Funds hereby designate the following amounts, or maximum amounts allowable by law, as interest income eligible to be treated as a Section 163(j) interest dividend for the fiscal year ended December 31, 2021:
| | | | |
| |
| |
| LifePath Dynamic Fund Name | | Interest Dividend | |
| |
| |
LifePath Dynamic Retirement Fund | | $ | 3,746,929 | |
LifePath Dynamic 2025 Fund | | | 1,113,886 | |
LifePath Dynamic 2030 Fund | | | 2,579,028 | |
LifePath Dynamic 2035 Fund | | | 703,954 | |
LifePath Dynamic 2040 Fund | | | 971,326 | |
LifePath Dynamic 2045 Fund | | | 155,691 | |
LifePath Dynamic 2050 Fund | | | 81,166 | |
LifePath Dynamic 2055 Fund | | | 17,259 | |
LifePath Dynamic 2060 Fund | | | 3,833 | |
LifePath Dynamic 2065 Fund | | | 1,439 | |
| |
The LifePath Dynamic Funds hereby designate the following amounts, or maximum amounts allowable by law, as interest-related dividends and qualified short-term capital gains eligible for exemption from U.S. withholding tax for nonresident aliens and foreign corporations for the fiscal year ended December 31, 2021:
| | | | | | | | |
| |
| | |
| LifePath Dynamic Fund Name | | Interest Related Dividends | | | Qualified Short-Term Capital Gains | |
| |
| | |
LifePath Dynamic Retirement Fund | | $ | 2,839,509 | | | $ | 23,313,868 | |
LifePath Dynamic 2025 Fund | | | 903,217 | | | | 5,621,088 | |
LifePath Dynamic 2030 Fund | | | 2,032,720 | | | | 26,986,684 | |
LifePath Dynamic 2035 Fund | | | 586,669 | | | | 6,782,138 | |
LifePath Dynamic 2040 Fund | | | 795,502 | | | | 28,312,062 | |
LifePath Dynamic 2045 Fund | | | 135,269 | | | | 4,609,494 | |
LifePath Dynamic 2050 Fund | | | 69,758 | | | | 10,324,736 | |
LifePath Dynamic 2055 Fund | | | 14,758 | | | | 3,016,254 | |
LifePath Dynamic 2060 Fund | | | 3,230 | | | | 408,672 | |
LifePath Dynamic 2065 Fund | | | 1,140 | | | | 147,929 | |
| |
| | |
IMPORTANT TAX INFORMATION | | 161 |
Statement Regarding Liquidity Risk Management Program
In compliance with Rule 22e-4 under the Investment Company Act of 1940, as amended (the “Liquidity Rule”), BlackRock Funds III (the “Trust”) has adopted and implemented a liquidity risk management program (the “Program”) for BlackRock LifePath® Dynamic Retirement Fund, BlackRock LifePath® Dynamic 2025 Fund, BlackRock LifePath® Dynamic 2030 Fund, BlackRock LifePath® Dynamic 2035 Fund, BlackRock LifePath® Dynamic 2040 Fund, BlackRock LifePath® Dynamic 2045 Fund, BlackRock LifePath® Dynamic 2050 Fund, BlackRock LifePath® Dynamic 2055 Fund, BlackRock LifePath® Dynamic 2060 Fund and BlackRock LifePath® Dynamic 2065 Fund (each, a “Fund” and collectively, the “Funds”), each a series of the Trust, which is reasonably designed to assess and manage each Fund’s liquidity risk.
The Board of Trustees (the “Board”) of the Trust, on behalf of the LifePath Dynamic Funds, met on November 9-10, 2021 (the “Meeting”) to review the Program. The Board previously appointed BlackRock Advisors, LLC or BlackRock Fund Advisors (“BlackRock”), each an investment adviser to certain BlackRock funds, as the program administrator for each Fund’s Program, as applicable. BlackRock also previously delegated oversight of the Program to the 40 Act Liquidity Risk Management Committee (the “Committee”). At the Meeting, the Committee, on behalf of BlackRock, provided the Board with a report that addressed the operation of the Program and assessed its adequacy and effectiveness of implementation, including the management of each Fund’s Highly Liquid Investment Minimum (“HLIM”) where applicable, and any material changes to the Program (the “Report”). The Report covered the period from October 1, 2020 through September 30, 2021 (the “Program Reporting Period”).
The Report described the Program’s liquidity classification methodology for categorizing each Fund’s investments (including derivative transactions) into one of four liquidity buckets. It also referenced the methodology used by BlackRock to establish each Fund’s HLIM and noted that the Committee reviews and ratifies the HLIM assigned to each Fund no less frequently than annually. The Report also discussed notable events affecting liquidity over the Program Reporting Period, including the imposition of capital controls in certain countries.
The Report noted that the Program complied with the key factors for consideration under the Liquidity Rule for assessing, managing and periodically reviewing each Fund’s liquidity risk, as follows:
| | a) | The Fund’s investment strategy and liquidity of portfolio investments during both normal and reasonably foreseeable stressed conditions. During the Program Reporting Period, the Committee reviewed whether each Fund’s strategy is appropriate for an open-end fund structure with a focus on funds with more significant and consistent holdings of less liquid and illiquid assets. The Committee also factored a fund’s concentration in an issuer into the liquidity classification methodology by taking issuer position sizes into account. Where a fund participated in borrowings for investment purposes (such as tender option bonds or reverse repurchase agreements), such borrowings were factored into the Program’s calculation of a fund’s liquidity bucketing. Derivative exposure was also considered in such calculation. |
| | b) | Short-term and long-term cash flow projections during both normal and reasonably foreseeable stressed conditions. During the Program Reporting Period, the Committee reviewed historical redemption activity and used this information as a component to establish each Fund’s reasonably anticipated trading size (“RATS”). Each Fund has adopted an in-kind redemption policy which may be utilized to meet larger redemption requests. The Committee may also take into consideration a fund’s shareholder ownership concentration (which, depending on product type and distribution channel, may or may not be available), a fund’s distribution channels, and the degree of certainty associated with a fund’s short-term and long-term cash flow projections. |
| | c) | Holdings of cash and cash equivalents, as well as borrowing arrangements. The Committee considered the terms of the credit facility committed to each Fund, the financial health of the institution providing the facility and the fact that the credit facility is shared among multiple funds (including that a portion of the aggregate commitment amount is specifically designated for BlackRock Floating Rate Income Portfolio, a series of BlackRock Funds V). The Committee also considered other types of borrowing available to the Funds, such as the ability to use reverse repurchase agreements and interfund lending, as applicable. |
There were no material changes to the Program during the Program Reporting Period other than the enhancement of certain model components in the Program’s methodology. The Report provided to the Board stated that the Committee concluded that based on the operation of the functions, as described in the Report, the Program is operating as intended and is effective in implementing the requirements of the Liquidity Rule.
| | |
| 162 | | 2 0 2 1 BLACK ROCK ANNUAL REPORT TO SHAREHOLDERS |
Trustee and Officer Information
| | | | | | | | |
| Independent Trustees(a) |
| | | | | |
Name Year of Birth(b) | | Position(s) Held (Length of Service)(c) | | Principal Occupation(s) During Past Five Years | | Number of BlackRock-Advised Registered Investment Companies (“RICs”) Consisting of Investment Portfolios (“Portfolios”) Overseen | | Public Company and Other Investment Company Directorships Held During Past Five Years |
| | | | |
Mark Stalnecker 1951 | | Chair of the Board (Since 2019) and Trustee
(Since 2015) | | Chief Investment Officer, University of Delaware from 1999 to 2013; Trustee and Chair of the Finance and Investment Committees, Winterthur Museum and Country Estate from 2005 to 2016; Member of the Investment Committee, Delaware Public Employees’ Retirement System since 2002; Member of the Investment Committee, Christiana Care Health System from 2009 to 2017; Member of the Investment Committee, Delaware Community Foundation from 2013 to 2014; Director and Chair of the Audit Committee, SEI Private Trust Co. from 2001 to 2014. | | 30 RICs consisting of 159 Portfolios | | None |
| | | | |
Bruce R. Bond 1946 | | Trustee
(Since 2019) | | Board Member, Amsphere Limited (software) since 2018; Trustee and Member of the Governance Committee, State Street Research Mutual Funds from 1997 to 2005; Board Member of Governance, Audit and Finance Committee, Avaya Inc. (computer equipment) from 2003 to 2007. | | 30 RICs consisting of 159 Portfolios | | None |
| | | | |
Susan J. Carter 1956 | | Trustee
(Since 2016) | | Director, Pacific Pension Institute from 2014 to 2018; Advisory Board Member, Center for Private Equity and Entrepreneurship at Tuck School of Business since 1997; Senior Advisor, Commonfund Capital, Inc. (“CCI”) (investment adviser) in 2015; Chief Executive Officer, CCI from 2013 to 2014; President & Chief Executive Officer, CCI from 1997 to 2013; Advisory Board Member, Girls Who Invest from 2015 to 2018 and Board Member thereof since 2018; Advisory Board Member, Bridges Fund Management since 2016; Trustee, Financial Accounting Foundation since 2017; Practitioner Advisory Board Member, Private Capital Research Institute (“PCRI”) since 2017; Lecturer in the Practice of Management, Yale School of Management since 2019; Advisor to Finance Committee, Altman Foundation since 2020. | | 30 RICs consisting of 159 Portfolios | | None |
| | | | |
Collette Chilton 1958 | | Trustee
(Since 2015) | | Chief Investment Officer, Williams College since 2006; Chief Investment Officer, Lucent Asset Management Corporation from 1998 to 2006; Director, Boys and Girls Club of Boston since 2017; Director, B1 Capital since 2018; Director, David and Lucile Packard Foundation since 2020. | | 30 RICs consisting of 159 Portfolios | | None |
| | | | |
Neil A. Cotty 1954 | | Trustee
(Since 2016) | | Bank of America Corporation from 1996 to 2015, serving in various senior finance leadership roles, including Chief Accounting Officer from 2009 to 2015, Chief Financial Officer of Global Banking, Markets and Wealth Management from 2008 to 2009, Chief Accounting Officer from 2004 to 2008, Chief Financial Officer of Consumer Bank from 2003 to 2004, Chief Financial Officer of Global Corporate Investment Bank from 1999 to 2002. | | 30 RICs consisting of 159 Portfolios | | None |
| | | | |
Lena G. Goldberg 1949 | | Trustee
(Since 2019) | | Director, Charles Stark Draper Laboratory, Inc. since 2013; Senior Lecturer, Harvard Business School, from 2008 to 2021; FMR LLC/Fidelity Investments (financial services) from 1996 to 2008, serving in various senior roles including Executive Vice President - Strategic Corporate Initiatives and Executive Vice President and General Counsel; Partner, Sullivan & Worcester LLP from 1985 to 1996 and Associate thereof from 1979 to 1985. | | 30 RICs consisting of 159 Portfolios | | None |
| | |
TRUSTEE AND OFFICER INFORMATION | | 163 |
Trustee and Officer Information (continued)
| | | | | | | | |
| Independent Trustees(a) (continued) |
| | | | | |
Name Year of Birth(b) | | Position(s) Held (Length of Service)(c) | | Principal Occupation(s) During Past Five Years | | Number of BlackRock-Advised Registered Investment Companies (“RICs”) Consisting of Investment Portfolios (“Portfolios”) Overseen | | Public Company and Other Investment Company Directorships Held During Past Five Years |
| | | | |
Henry R. Keizer 1956 | | Trustee
(Since 2019) | | Director, Park Indemnity Ltd. (captive insurer) since 2010; Director, MUFG Americas Holdings Corporation and MUFG Union Bank, N.A. (financial and bank holding company) from 2014 to 2016; Director, American Institute of Certified Public Accountants from 2009 to 2011; Director, KPMG LLP (audit, tax and advisory services) from 2004 to 2005 and 2010 to 2012; Director, KPMG International in 2012, Deputy Chairman and Chief Operating Officer thereof from 2010 to 2012 and U.S. Vice Chairman of Audit thereof from 2005 to 2010; Global Head of Audit, KPMGI (consortium of KPMG firms) from 2006 to 2010; Director, YMCA of Greater New York from 2006 to 2010. | | 30 RICs consisting of 159 Portfolios | | Hertz Global Holdings (car rental); Sealed Air Corp. (packaging); GrafTech International Ltd. (materials manufacturing); Montpelier Re Holdings, Ltd. (publicly held property and casualty reinsurance) from 2013 to 2015; WABCO (commercial vehicle safety systems) from 2015 to 2020. |
| | | | |
Cynthia A. Montgomery
1952 | | Trustee
(Since 2009) | | Professor, Harvard Business School since 1989. | | 30 RICs consisting of 159 Portfolios | | Newell Rubbermaid, Inc. (manufacturing) from 1995 to 2016. |
| | | | |
Donald C. Opatrny
1952 | | Trustee
(Since 2019) | | Trustee, Vice Chair, Member of the Executive Committee and Chair of the Investment Committee, Cornell University from 2004 to 2019; President, Trustee and Member of the Investment Committee, The Aldrich Contemporary Art Museum from 2007 to 2014; Member of the Board and Investment Committee, University School from 2007 to 2018; Member of the Investment Committee, Mellon Foundation from 2009 to 2015; Trustee, Artstor (a Mellon Foundation affiliate) from 2010 to 2015; President and Trustee, the Center for the Arts, Jackson Hole from 2011 to 2018; Director, Athena Capital Advisors LLC (investment management firm) since 2013; Trustee and Chair of the Investment Committee, Community Foundation of Jackson Hole since 2014; Member of Affordable Housing Supply Board of Jackson, Wyoming since 2017; Member, Investment Funds Committee, State of Wyoming since 2017; Trustee, Phoenix Art Museum since 2018; Trustee, Arizona Community Foundation and Member of Investment Committee since 2020. | | 30 RICs consisting of 159 Portfolios | | None |
| | | | |
Joseph P. Platt 1947 | | Trustee
(Since 2009) | | General Partner, Thorn Partners, LP (private investments) since 1998; Director, WQED Multi-Media (public broadcasting not-for-profit) since 2001; Chair, Basic Health International (non-profit) since 2015. | | 30 RICs consisting of 159 Portfolios | | Greenlight Capital Re, Ltd. (reinsurance company); Consol Energy Inc. |
| | |
| 164 | | 2 0 2 1 BLACK ROCK ANNUAL REPORT TO SHAREHOLDERS |
Trustee and Officer Information (continued)
| | | | | | | | |
| Independent Trustees(a) (continued) |
| | | | | |
Name Year of Birth(b) | | Position(s) Held (Length of Service)(c) | | Principal Occupation(s) During Past Five Years | | Number of BlackRock-Advised Registered Investment Companies (“RICs”) Consisting of Investment Portfolios (“Portfolios”) Overseen | | Public Company and Other Investment Company Directorships Held During Past Five Years |
| | | | |
Kenneth L. Urish 1951 | | Trustee
(Since 2009) | | Managing Partner, Urish Popeck & Co., LLC (certified public accountants and consultants) since 1976; Past-Chairman of the Professional Ethics Committee of the Pennsylvania Institute of Certified Public Accountants and Committee Member thereof since 2007; Member of External Advisory Board, The Pennsylvania State University Accounting Department since founding in 2001; Principal, UP Strategic Wealth Investment Advisors, LLC since 2013; Trustee, The Holy Family Institute from 2001 to 2010; President and Trustee, Pittsburgh Catholic Publishing Associates from 2003 to 2008; Director, Inter-Tel from 2006 to 2007; Member, Advisory Board, ESG Competent Boards since 2020. | | 30 RICs consisting of 159 Portfolios | | None |
| | | | |
Claire A. Walton 1957 | | Trustee
(Since 2016) | | Chief Operating Officer and Chief Financial Officer of Liberty Square Asset Management, LP from 1998 to 2015; General Partner of Neon Liberty Capital Management, LLC since 2003; Director, Boston Hedge Fund Group from 2009 to 2018; Director, Woodstock Ski Runners since 2013; Director, Massachusetts Council on Economic Education from 2013 to 2015. | | 30 RICs consisting of 159 Portfolios | | None |
|
| Interested Trustees(a)(d) |
| | | | | |
Name Year of Birth(b) | | Position(s) Held (Length of Service)(c) | | Principal Occupation(s) During Past Five Years | | Number of BlackRock-Advised Registered Investment Companies (“RICs”) Consisting of Investment Portfolios (“Portfolios”) Overseen | | Public Company and Other Investment Company Directorships Held During Past Five Years |
| | | | |
Robert Fairbairn 1965 | | Trustee
(Since 2018) | | Vice Chairman of BlackRock, Inc. since 2019; Member of BlackRock’s Global Executive and Global Operating Committees; Co-Chair of BlackRock’s Human Capital Committee; Senior Managing Director of BlackRock, Inc. from 2010 to 2019; oversaw BlackRock’s Strategic Partner Program and Strategic Product Management Group from 2012 to 2019; Member of the Board of Managers of BlackRock Investments, LLC from 2011 to 2018; Global Head of BlackRock’s Retail and iShares® businesses from 2012 to 2016. | | 103 RICs consisting of 261 Portfolios | | None |
| | | | |
John M. Perlowski(e) 1964 | | Trustee (Since 2015)
President and Chief Executive Officer
(Since 2010) | | Managing Director of BlackRock, Inc. since 2009; Head of BlackRock Global Accounting and Product Services since 2009; Advisory Director of Family Resource Network (charitable foundation) since 2009. | | 105 RICs consisting of 263 Portfolios | | None |
(a) The address of each Trustee is c/o BlackRock, Inc., 55 East 52nd Street, New York, New York 10055. (b) Independent Trustees serve until their resignation, retirement, removal or death, or until December 31 of the year in which they turn 75. The Board may determine to extend the terms of Independent Trustees on a case-by-case basis, as appropriate. (c) In connection with the acquisition of Barclays Global Investors by BlackRock, Inc. in December 2009, certain Independent Trustees were elected to the Board. Furthermore, effective January 1, 2019, three BlackRock Fund Complexes were realigned and consolidated into two BlackRock Fund Complexes. As a result, although the chart shows the year that each Independent Trustee joined the Board, certain Independent Trustees first became members of the boards of other BlackRock-advised Funds or legacy BlackRock funds as follows: Bruce R. Bond, 2005; Cynthia A. Montgomery, 1994; Joseph P. Platt, 1999; Kenneth L. Urish, 1999; Lena G. Goldberg, 2016; Henry R. Keizer, 2016; Donald C. Opatrny, 2015. (d) Mr. Fairbairn and Mr. Perlowski are both “interested persons,” as defined in the 1940 Act, of the Trust based on their positions with BlackRock, Inc. and its affiliates. Mr. Fairbairn and Mr. Perlowski are also board members of the BlackRock Fixed-Income Complex. (e) Mr. Perlowski is also a trustee of the BlackRock Credit Strategies Fund and BlackRock Private Investments Fund. |
| | |
TRUSTEE AND OFFICER INFORMATION | | 165 |
Trustee and Officer Information (continued)
| | | | |
| Officers Who Are Not Trustees(a) |
| | | |
Name Year of Birth(b) | | Position(s) Held (Length of Service) | | Principal Occupation(s) During Past Five Years |
| | |
Thomas Callahan 1968 | | Vice President
(Since 2016) | | Managing Director of BlackRock, Inc. since 2013; Member of the Board of Managers of BlackRock Investments, LLC (principal underwriter) since 2019 and Managing Director thereof since 2017; Head of BlackRock’s Global Cash Management Business since 2016; Co-Head of the Global Cash Management Business from 2014 to 2016; Deputy Head of the Global Cash Management Business from 2013 to 2014; Member of the Cash Management Group Executive Committee since 2013; Chief Executive Officer of NYSE Liffe U.S. from 2008 to 2013. |
| | |
Jennifer McGovern 1977 | | Vice President
(Since 2014) | | Managing Director of BlackRock, Inc. since 2016; Director of BlackRock, Inc. from 2011 to 2015; Head of Americas Product Development and Governance for BlackRock’s Global Product Group since 2019; Head of Product Structure and Oversight for BlackRock’s U.S. Wealth Advisory Group from 2013 to 2019. |
| | |
Trent Walker 1974 | | Chief Financial Officer
(Since 2021) | | Managing Director of BlackRock, Inc. since September 2019; Executive Vice President of PIMCO from 2016 to 2019; Senior Vice President of PIMCO from 2008 to 2015; Treasurer from 2013 to 2019 and Assistant Treasurer from 2007 to 2017 of PIMCO Funds, PIMCO Variable Insurance Trust, PIMCO ETF Trust, PIMCO Equity Series, PIMCO Equity Series VIT, PIMCO Managed Accounts Trust, 2 PIMCO-sponsored interval funds and 21 PIMCO-sponsored closed-end funds. |
| | |
Jay M. Fife 1970 | | Treasurer
(Since 2009) | | Managing Director of BlackRock, Inc. since 2007. |
| | |
Charles Park 1967 | | Chief Compliance Officer
(Since 2014) | | Anti-Money Laundering Compliance Officer for certain BlackRock-advised Funds from 2014 to 2015; Chief Compliance Officer of BlackRock Advisors, LLC and the BlackRock-advised Funds in the BlackRock Multi-Asset Complex and the BlackRock Fixed-Income Complex since 2014; Principal of and Chief Compliance Officer for iShares® Delaware Trust Sponsor LLC since 2012 and BlackRock Fund Advisors (“BFA”) since 2006; Chief Compliance Officer for the BFA-advised iShares® exchange traded funds since 2006; Chief Compliance Officer for BlackRock Asset Management International Inc. since 2012. |
| | |
Lisa Belle 1968 | | Anti-Money Laundering Compliance Officer
(Since 2019) | | Managing Director of BlackRock, Inc. since 2019; Global Financial Crime Head for Asset and Wealth Management of JP Morgan from 2013 to 2019; Managing Director of RBS Securities from 2012 to 2013; Head of Financial Crimes for Barclays Wealth Americas from 2010 to 2012. |
| | |
Janey Ahn 1975 | | Secretary
(Since 2019) | | Managing Director of BlackRock, Inc. since 2018; Director of BlackRock, Inc. from 2009 to 2017. |
(a) The address of each Officer is c/o BlackRock, Inc., 55 East 52nd Street, New York, New York 10055. (b) Officers of the Trust serve at the pleasure of the Board. |
Further information about the Trust’s Trustees and Officers is available in the Trust’s Statement of Additional Information, which can be obtained without charge by calling (800) 441-7762.
Effective December 31, 2021, Bruce R. Bond retired as a Trustee of the Trust.
| | |
| 166 | | 2 0 2 1 BLACK ROCK ANNUAL REPORT TO SHAREHOLDERS |
Additional Information
Regulation Regarding Derivatives
On October 28, 2020, the Securities and Exchange Commission (the “SEC”) adopted regulations governing the use of derivatives by registered investment companies (“Rule 18f-4”). The Funds will be required to implement and comply with Rule 18f-4 by August 19, 2022. Once implemented, Rule 18f-4 will impose limits on the amount of derivatives a fund can enter into, eliminate the asset segregation framework currently used by funds to comply with Section 18 of the 1940 Act, treat derivatives as senior securities and require funds whose use of derivatives is more than a limited specified exposure amount to establish and maintain a comprehensive derivatives risk management program and appoint a derivatives risk manager.
General Information
Quarterly performance, semi-annual and annual reports, current net asset value and other information regarding the Funds may be found on BlackRock’s website, which can be accessed at blackrock.com. Any reference to BlackRock’s website in this report is intended to allow investors public access to information regarding the Funds and does not, and is not intended to, incorporate BlackRock’s website in this report.
Householding
The Funds will mail only one copy of shareholder documents, including prospectuses, annual and semi-annual reports, Rule 30e-3 notices and proxy statements, to shareholders with multiple accounts at the same address. This practice is commonly called “householding” and is intended to reduce expenses and eliminate duplicate mailings of shareholder documents. Mailings of your shareholder documents may be householded indefinitely unless you instruct us otherwise. If you do not want the mailing of these documents to be combined with those for other members of your household, please call the Funds at (800) 441-7762.
Availability of Quarterly Schedule of Investments
The Funds file their complete schedules of portfolio holdings with the SEC for the first and third quarters of each fiscal year as an exhibit to their reports on Form N-PORT. The Funds’ Forms N-PORT are available on the SEC’s website at sec.gov. Additionally, each Fund makes its portfolio holdings for the first and third quarters of each fiscal year available at blackrock.com/fundreports.
Availability of Proxy Voting Policies, Procedures and Voting Records
A description of the policies and procedures that the Funds use to determine how to vote proxies relating to portfolio securities and information about how the Funds voted proxies relating to securities held in the Funds’ portfolios during the most recent 12-month period ended June 30 is available without charge, upon request (1) by calling (800) 441-7762; (2) on the BlackRock website at blackrock.com; and (3) on the SEC’s website at sec.gov.
BlackRock’s Mutual Fund Family
BlackRock offers a diverse lineup of open-end mutual funds crossing all investment styles and managed by experts in equity, fixed-income and tax-exempt investing. Visit blackrock.com for more information.
Shareholder Privileges
Account Information
Call us at (800) 441-7762 from 8:00 AM to 6:00 PM ET on any business day to get information about your account balances, recent transactions and share prices. You can also visit blackrock.com for more information.
Automatic Investment Plans
Investor class shareholders who want to invest regularly can arrange to have $50 or more automatically deducted from their checking or savings account and invested in any of the BlackRock funds.
Systematic Withdrawal Plans
Investor class shareholders can establish a systematic withdrawal plan and receive periodic payments of $50 or more from their BlackRock funds, as long as their account balance is at least $10,000.
Retirement Plans
Shareholders may make investments in conjunction with Traditional, Rollover, Roth, Coverdell, Simple IRAs, SEP IRAs and 403(b) Plans.
| | |
ADDITIONAL INFORMATION | | 167 |
Additional Information (continued)
BlackRock Privacy Principles
BlackRock is committed to maintaining the privacy of its current and former fund investors and individual clients (collectively, “Clients”) and to safeguarding their non-public personal information. The following information is provided to help you understand what personal information BlackRock collects, how we protect that information and why in certain cases we share such information with select parties.
If you are located in a jurisdiction where specific laws, rules or regulations require BlackRock to provide you with additional or different privacy-related rights beyond what is set forth below, then BlackRock will comply with those specific laws, rules or regulations.
BlackRock obtains or verifies personal non-public information from and about you from different sources, including the following: (i) information we receive from you or, if applicable, your financial intermediary, on applications, forms or other documents; (ii) information about your transactions with us, our affiliates, or others; (iii) information we receive from a consumer reporting agency; and (iv) from visits to our websites.
BlackRock does not sell or disclose to non-affiliated third parties any non-public personal information about its Clients, except as permitted by law or as is necessary to respond to regulatory requests or to service Client accounts. These non-affiliated third parties are required to protect the confidentiality and security of this information and to use it only for its intended purpose.
We may share information with our affiliates to service your account or to provide you with information about other BlackRock products or services that may be of interest to you. In addition, BlackRock restricts access to non-public personal information about its Clients to those BlackRock employees with a legitimate business need for the information. BlackRock maintains physical, electronic and procedural safeguards that are designed to protect the non-public personal information of its Clients, including procedures relating to the proper storage and disposal of such information.
LifePath Dynamic Fund and Service Providers
Investment Adviser
BlackRock Fund Advisors
San Francisco, CA 94105
Administrator
BlackRock Advisors, LLC
Wilmington, DE 19809
Sub-Adviser
BlackRock International Limited
Edinburgh, EH3 8BL
United Kingdom
BlackRock (Singapore) Limited
079912 Singapore
Accounting Agent and Custodian
State Street Bank and Trust Company
Boston, MA 02111
Transfer Agent
BNY Mellon Investment Servicing (US) Inc.
Wilmington, DE 19809
Distributor
BlackRock Investments, LLC
New York, NY 10022
Independent Registered Public Accounting Firm
PricewaterhouseCoopers LLP
Philadelphia, PA 19103
Legal Counsel
Sidley Austin LLP
New York, NY 10019
Address of the Funds
400 Howard Street
San Francisco, CA 94105
| | |
| 168 | | 2 0 2 1 BLACK ROCK ANNUAL REPORT TO SHAREHOLDERS |
Glossary of Terms Used in this Report
| | |
| Currency Abbreviation |
| |
| AUD | | Australian Dollar |
| |
| CAD | | Canadian Dollar |
| |
| EUR | | Euro |
| |
| JPY | | Japanese Yen |
| |
| USD | | United States Dollar |
| | |
| Portfolio Abbreviation |
| |
| ETF | | Exchange-Traded Fund |
| |
| FTSE | | Financial Times Stock Exchange |
| |
| MSCI | | Morgan Stanley Capital International |
| |
| S&P | | Standard & Poor’s |
| | |
GLOSSARY OF TERMS USED IN THIS REPORT | | 169 |
Want to know more?
blackrock.com | 800-441-7762
This report is intended for current holders. It is not authorized for use as an offer of sale or a solicitation of an offer to buy shares of the Funds unless preceded or accompanied by the Funds’ current prospectus. Past performance results shown in this report should not be considered a representation of future performance. Investment returns and principal value of shares will fluctuate so that shares, when redeemed, may be worth more or less than their original cost. Statements and other information herein are as dated and are subject to change.
LPDYN-12/21-AR
| | |

| | DECEMBER 31, 2021 |
BlackRock Funds III
| · | | iShares MSCI Total International Index Fund |
|
Not FDIC Insured • May Lose Value • No Bank Guarantee |
The Markets in Review
Dear Shareholder,
The 12-month reporting period as of December 31, 2021 saw a continuation of the resurgent growth that followed the initial coronavirus (or “COVID-19”) pandemic reopening, albeit at a slower pace. The global economy weathered the emergence of several variant strains and the resulting peaks and troughs in infections amid optimism that increasing vaccinations and economic adaptation could help contain the pandemic’s disruptions. Continued growth meant that the U.S. economy regained and then surpassed its pre-pandemic output. However, a rapid rebound in consumer spending pushed up against supply constraints and led to elevated inflation.
Equity prices rose with the broader economy, as the implementation of mass vaccination campaigns and passage of an additional fiscal stimulus package and infrastructure bill further boosted stocks. In the United States, both large- and small-capitalization stocks posted a strong advance, and many equity indices neared or surpassed all-time highs late in the reporting period. International equities from developed markets also gained, although emerging market stocks declined, pressured by a strengthening U.S. dollar.
The 10-year U.S. Treasury yield (which is inversely related to bond prices) rose during the reporting period as the economy expanded rapidly and inflation reached its highest annualized reading in decades. In the corporate bond market, support from the U.S. Federal Reserve (the “Fed”) assuaged credit concerns and led to solid returns for high-yield corporate bonds, outpacing investment-grade corporate bonds, which declined.
The Fed maintained accommodative monetary policy during the reporting period by maintaining near-zero interest rates and by asserting that inflation could exceed its 2% target for a sustained period without triggering a rate increase. However, the Fed’s tone shifted late in the year, as it reduced its bond-buying program and used its market guidance to raise the prospect of higher rates in 2022.
Looking ahead, we believe that the global expansion will continue to broaden as Europe and other developed market economies gain momentum, although the Delta and Omicron variants of the coronavirus remain a threat, particularly in emerging markets. While we expect inflation to abate somewhat as supply bottlenecks are resolved, we anticipate that inflation will remain higher than the pre-COVID norm. The Fed is poised to raise interest rates next year in response, but the Fed’s policy shift means that tightening is likely to be less aggressive than what we’ve seen in previous cycles.
In this environment, we favor an overweight to equities, as we believe low interest rates and continued economic growth will support further gains, albeit likely more modest than what we saw in 2021. Sectors that are better poised to manage the transition to a lower-carbon world, such as technology and health care, are particularly attractive in the long term. U.S. and other developed-market equities have room for further growth, while we believe Chinese equities stand to gain from a more accommodative monetary and fiscal environment as the Chinese economy slows. We are underweight long-term credit, but inflation-protected U.S. Treasuries, Asian fixed income, and emerging market local-currency bonds offer potential opportunities. We believe that international diversification and a focus on sustainability can help provide portfolio resilience, and the disruption created by the coronavirus appears to be accelerating the shift toward sustainable investments.
In this environment, our view is that investors need to think globally, extend their scope across a broad array of asset classes, and be nimble as market conditions change. We encourage you to talk with your financial advisor and visit blackrock.com for further insight about investing in today’s markets.
Sincerely,

Rob Kapito
President, BlackRock Advisors, LLC

Rob Kapito
President, BlackRock Advisors, LLC
| | | | |
| Total Returns as of December 31, 2021 |
| | | 6-Month | | 12-Month |
U.S. large cap equities (S&P 500® Index) | | 11.67% | | 28.71% |
U.S. small cap equities (Russell 2000® Index) | | (2.31)
| | 14.82
|
International equities (MSCI Europe, Australasia, Far East Index) | | 2.24 | | 11.26 |
Emerging market equities (MSCI Emerging Markets Index) | | (9.30) | | (2.54) |
3-month Treasury bills (ICE BofA 3-Month U.S. Treasury Bill Index) | | 0.02
| | 0.05
|
U.S. Treasury securities (ICE BofA 10-Year U.S. Treasury Index) | | 0.44
| | (3.68)
|
U.S. investment grade bonds (Bloomberg U.S. Aggregate Bond Index) | | 0.06
| | (1.54)
|
Tax-exempt municipal bonds (S&P Municipal Bond Index) | | 0.52
| | 1.77
|
U.S. high yield bonds (Bloomberg U.S. Corporate High Yield 2% Issuer Capped Index) | | 1.59
| | 5.26
|
| Past performance is not an indication of future results. Index performance is shown for illustrative purposes only. You cannot invest directly in an index. |
| | |
| 2 | | THIS PAGE IS NOT PART OF YOUR FUND REPORT |
Table of Contents

| | |
| Fund Summary as of December 31, 2021 | | iShares MSCI Total International Index Fund |
Investment Objective
iShares MSCI Total International Index Fund’s (the “Fund”) investment objective is to match the performance of the MSCI All Country World Index ex USA Index (the “MSCI ACWI ex USA Index”) in U.S. dollars with net dividends as closely as possible before the deduction of Fund expenses.
Portfolio Management Commentary
How did the Fund perform?
For the 12-month period ended December 31, 2021, the Fund’s Institutional Shares returned 7.60%, Investor A Shares returned 7.37% and Class K Shares returned 7.70%. The benchmark MSCI ACWI ex USA Index returned 7.82% for the same period.
The Fund invests all of its assets in Total International ex U.S. Index Master Portfolio (the “Master Portfolio”), a series of Master Investment Portfolio.
Describe the market environment.
The vaccination rollout in developed markets during the first quarter of 2021 boosted optimism for a global economic recovery. However, the reappearance of high numbers of daily COVID-19 cases across Europe weighed down on the general sentiment, especially as social restrictions were tightened again across Europe.
After a relatively slow start in the second quarter of 2021, the vaccination rate across developed markets picked up, leading to more economic activities restarting. The prospect for strong growth, signaled by strong economic data, also boosted European equities over the quarter. Strong corporate earnings in Europe supported market performance as companies benefited from a combination of demand recovery and supply constraints. Services increased over the quarter, as the ease of COVID-19 restrictions helped fuel higher demand. However, despite the improving economic outlook, the European Central Bank policy makers signaled that it was still too soon to withdraw stimulus measures, while despite the Bank of England announcing its plans to slow its quantitative easing program.
In Japan, the consistent increase in COVID-19 cases led the government to extend the state of emergency until June 20, 2021. While market performance was initially weighed down by the slow vaccination campaign, the market began to rally in the second quarter of 2021 as the government rolled out mass vaccination efforts throughout the country. The Japanese equity market started to recover by the end of May, but investors’ concerns over the low vaccination rate persisted, resulting in slight negative performance for the quarter.
In the third quarter of 2021, the COVID-19 pandemic continued to have a negative impact on economic recovery, but to a lesser degree in developed countries as vaccination rates increased. However, concerns regarding inflation, supply chain disruption, and rising energy prices hindered developed markets’ performance.
Strong earnings reports and easing of restrictions in Europe boosted market performance, and many economies began to recover in the first two months of the third quarter. However, an increase in energy prices due to energy shortages, along with concerns of inflation and supply chain disruption, hindered market performance and gross domestic product growth.
In Asia, the concerns regarding the debt crisis of the Chinese property developer Evergrande dampened market performance, especially in Hong Kong. The Japanese market continued its recovery throughout the third quarter of 2021 despite the state of emergency implemented in Tokyo. Japanese equities were supported by strong earnings reports and increased hopes of stimulus and economic reopening, as COVID-19 cases declined.
During the fourth quarter of 2021, developed non-U.S. equity markets posted a gain in October on the back of strong corporate earnings reports and robust economic data. However, the emergence of the new COVID-19 Omicron variant dampened markets performance in November and put pressure on central banks as they faced rising inflation rates on the back of supply chain disruptions. In December, markets rebounded as the new variant was reported to be less severe than expected despite higher transmissibility.
In Europe, the market recovered in December 2021 after concerns regarding the Omicron variant were lessened. The European Central Bank committed to end the emergency bond buying program in March 2022 but promised to keep low borrowing costs over 2022 and to keep the door open for restarting emergency support in the event of turbulence. On the other hand, the Bank of England raised the policy interest rate in December from 0.10% to 0.25%, signaling that inflation risk outweighed the disruptions risk of the Omicron variant.
Asian developed markets finished the fourth quarter of 2021 in negative territory. The uncertainty of the impact of the Omicron variant and higher commodity prices weighed down on the performance of Asian markets. Japanese equities were the worst performer on the back of a weakened yen and renewed ambiguity regarding new mobility restrictions.
Describe recent portfolio activity.
During the 12-month period, as changes were made to the composition of the MSCI ACWI ex USA Index, the Master Portfolio purchased and sold securities to maintain its objective of replicating the risks and return of the benchmark index.
Describe portfolio positioning at period end.
The Master Portfolio remains positioned to match the risk characteristics of its benchmark index, irrespective of the market’s future direction.
The views expressed reflect the opinions of BlackRock as of the date of this report and are subject to change based on changes in market, economic or other conditions. These views are not intended to be a forecast of future events and are no guarantee of future results.
| | |
| 4 | | 2 0 2 1 BLACK ROCK ANNUAL REPORT TO SHAREHOLDERS |
| | |
| Fund Summary as of December 31, 2021 (continued) | | iShares MSCI Total International Index Fund |
TOTAL RETURN BASED ON A $10,000 INVESTMENT
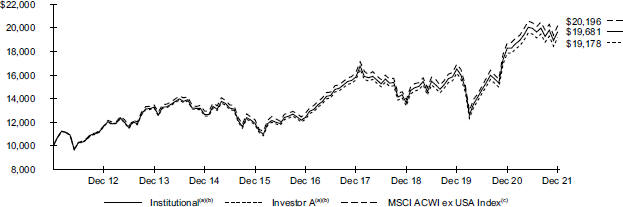
| | (a) | Assuming transaction costs and other operating expenses, including administration fees, if any. | |
| | (b) | The Fund invests all of its assets in the Master Portfolio. The Master Portfolio will be substantially invested in equity securities in the MSCI ACWI ex USA Index, and will invest, under normal circumstances, at least 80% of its assets in securities or other financial instruments that are components of or have economic characteristics similar to the securities included in the MSCI ACWI ex USA Index. | |
| | (c) | An index that captures large- and mid-cap representation across certain developed markets countries (excluding the U.S.) and certain emerging markets countries. | |
Performance
| | | | | | | | | | | | | | | | | | | | | | |
| | | | | Average Annual Total Returns(a) | |
| | | | | 1 Year | | | | | | 5 Years | | | | | | 10 Years | |
Institutional | | | | | 7.60 | % | | | | | | | 9.65 | % | | | | | | | 7.01 | % |
Investor A | | | | | 7.37 | | | | | | | | 9.38 | | | | | | | | 6.73 | |
Class K | | | | | 7.70 | | | | | | | | 9.70 | | | | | | | | 7.28 | |
MSCI ACWI ex USA Index | | | | | 7.82 | | | | | | | | 9.61 | | | | | | | | 7.28 | |
| | (a) | See “About Fund Performance” for a detailed description of share classes, including any related fees. | |
Past performance is not an indication of future results.
Performance results may include adjustments made for financial reporting purposes in accordance with U.S. generally accepted accounting principles.
Expense Example
| | | | | | | | | | | | | | | | | | | | | | | | | | | | | | | | |
| | | Actual | | | | | | Hypothetical(a) | | | | |
| | |
| Beginning
Account Value (07/01/21) |
| |
| Ending
Account Value (12/31/21) |
| |
| Expenses
Paid During the Period |
(b) | | | | | |
| Beginning
Account Value (07/01/21) |
| |
| Ending
Account Value (12/31/21) |
| |
| Expenses
Paid During the Period |
(b) | |
| Annualized
Expense Ratio |
|
Institutional | | $ | 1,000.00 | | | $ | 985.40 | | | $ | 0.75 | | | | | | | $ | 1,000.00 | | | $ | 1,024.45 | | | $ | 0.77 | | | | 0.15 | % |
Investor A | | | 1,000.00 | | | | 984.30 | | | | 2.00 | | | | | | | | 1,000.00 | | | | 1,023.19 | | | | 2.04 | | | | 0.40 | |
Class K | | | 1,000.00 | | | | 986.10 | | | | 0.50 | | | | | | | | 1,000.00 | | | | 1,024.70 | | | | 0.51 | | | | 0.10 | |
| | (a) | Hypothetical 5% annual return before expenses is calculated by prorating the number of days in the most recent fiscal half year divided by 365. | |
| | (b) | For each class of the Fund, expenses are equal to the annualized expense ratio for the class, multiplied by the average account value over the period, multiplied by 184/365 (to reflect the one-half year period shown). Because the Fund invests all of its assets in the Master Portfolio, the expense example reflects the net expenses of both the Fund and the Master Portfolio in which it invests. | |
See “Disclosure of Expenses” for further information on how expenses were calculated.
| | |
| About Fund Performance | | iShares MSCI Total International Index Fund |
Institutional and Class K Shares are not subject to any sales charge. These shares bear no ongoing distribution or service fees and are available only to certain eligible investors.
Investor A Shares are not subject to any sales charge and bear no ongoing distribution fee. These shares are subject to an ongoing service fee of 0.25% per year. These shares are generally available through financial intermediaries.
Past performance is not an indication of future results. Financial markets have experienced extreme volatility and trading in many instruments has been disrupted. These circumstances may continue for an extended period of time and may continue to affect adversely the value and liquidity of the Fund’s investments. As a result, current performance may be lower or higher than the performance data quoted. Refer to blackrock.com to obtain performance data current to the most recent month-end. Performance results do not reflect the deduction of taxes that a shareholder would pay on Fund distributions or the redemption of Fund shares. Figures shown in the performance table(s) assume reinvestment of all distributions, if any, at net asset value (“NAV”) on the ex-dividend date or payable date, as applicable. Investment return and principal value of shares will fluctuate so that shares, when redeemed, may be worth more or less than their original cost. Distributions paid to each class of shares will vary because of the different levels of service, distribution and transfer agency fees applicable to each class, which are deducted from the income available to be paid to shareholders.
BlackRock Advisors, LLC (the “Administrator”), the Fund’s administrator, has contractually and/or voluntarily agreed to waive and/or reimburse a portion of the Fund’s expenses. Without such waiver(s) and/or reimbursement(s), the Fund’s performance would have been lower. With respect to the Fund’s voluntary waiver(s), if any, the Administrator is under no obligation to waive and/or reimburse or to continue waiving and/or reimbursing its fees and such voluntary waiver(s) may be reduced or discontinued at any time. With respect to the Fund’s contractual waiver(s), if any, the Administrator is under no obligation to continue waiving and/or reimbursing its fees after the applicable termination date of such agreement. See the Notes to Financial Statements for additional information on waivers and/or reimbursements.
Disclosure of Expenses
Shareholders of the Fund may incur the following charges: (a) transactional expenses; and (b) operating expenses, including administration fees, service and distribution fees, including 12b-1 fees, acquired fund fees and expenses, and other fund expenses. The expense example shown (which is based on a hypothetical investment of $1,000 invested at the beginning of the period (or from the commencement of operations if less than 6 months) and held through the end of the period) is intended to assist shareholders both in calculating expenses based on an investment in the Fund and in comparing these expenses with similar costs of investing in other mutual funds.
The expense example provides information about actual account values and actual expenses. Annualized expense ratios reflect contractual and voluntary fee waivers, if any. In order to estimate the expenses a shareholder paid during the period covered by this report, shareholders can divide their account value by $1,000 and then multiply the result by the number corresponding to their Fund and share class under the heading entitled “Expenses Paid During the Period.”
The expense example also provides information about hypothetical account values and hypothetical expenses based on the Fund’s actual expense ratio and an assumed rate of return of 5% per year before expenses. In order to assist shareholders in comparing the ongoing expenses of investing in the Fund and other funds, compare the 5% hypothetical example with the 5% hypothetical examples that appear in shareholder reports of other funds.
The expenses shown in the expense example are intended to highlight shareholders’ ongoing costs only and do not reflect transactional expenses, such as sales charges, if any. Therefore, the hypothetical example is useful in comparing ongoing expenses only and will not help shareholders determine the relative total expenses of owning different funds. If these transactional expenses were included, shareholder expenses would have been higher.
Derivative Financial Instruments
The Total International ex-U.S. Index Master Portfolio (the “Master Portfolio”) may invest in various derivative financial instruments. These instruments are used to obtain exposure to a security, commodity, index, market, and/or other assets without owning or taking physical custody of securities, commodities and/or other referenced assets or to manage market, equity, credit, interest rate, foreign currency exchange rate, commodity and/or other risks. Derivative financial instruments may give rise to a form of economic leverage and involve risks, including the imperfect correlation between the value of a derivative financial instrument and the underlying asset, possible default of the counterparty to the transaction or illiquidity of the instrument. The Master Portfolio’s successful use of a derivative financial instrument depends on the investment adviser’s ability to predict pertinent market movements accurately, which cannot be assured. The use of these instruments may result in losses greater than if they had not been used, may limit the amount of appreciation the Master Portfolio can realize on an investment and/or may result in lower distributions paid to shareholders. The Master Portfolio’s investments in these instruments, if any, are discussed in detail in the Master Portfolio Notes to Financial Statements.
| | |
| 6 | | 2 0 2 1 BLACK ROCK ANNUAL REPORT TO SHAREHOLDERS |
Statement of Assets and Liabilities
December 31, 2021
| | | | |
| | | iShares MSCI Total International Index Fund | |
| |
ASSETS | | | | |
Investments, at value — Master Portfolio | | $ | 1,403,185,859 | |
Receivables: | | | | |
Capital shares sold | | | 2,390,935 | |
From the Manager | | | 12,931 | |
Prepaid expenses | | | 27,820 | |
| | | | |
Total assets | | | 1,405,617,545 | |
| | | | |
| |
LIABILITIES | | | | |
Payables: | | | | |
Accounting services fees | | | 2,080 | |
Capital shares redeemed | | | 1,367,272 | |
Contributions to the Master Portfolio | | | 1,023,663 | |
Officer’s fees | | | 410 | |
Other accrued expenses | | | 14,680 | |
Professional fees | | | 29,098 | |
Service fees | | | 12,912 | |
Transfer agent fees | | | 79,024 | |
| | | | |
Total liabilities | | | 2,529,139 | |
| | | | |
| |
NET ASSETS | | $ | 1,403,088,406 | |
| | | | |
| |
NET ASSETS CONSIST OF | | | | |
Paid-in capital | | $ | 1,122,687,991 | |
Accumulated earnings | | | 280,400,415 | |
| | | | |
NET ASSETS | | $ | 1,403,088,406 | |
| | | | |
| | |
FUND FINANCIAL STATEMENTS | | 7 |
Statement of Assets and Liabilities (continued)
December 31, 2021
| | | | |
| | | iShares MSCI Total International Index Fund | |
| |
NET ASSET VALUE | | | | |
| |
| Institutional | | | |
Net assets | | $ | 545,766,924 | |
| | | | |
Shares outstanding | | | 51,785,331 | |
| | | | |
Net asset value | | $ | 10.54 | |
| | | | |
Shares authorized | | | Unlimited | |
| | | | |
Par value | | | N/A | |
| | | | |
| |
| Investor A | | | |
Net assets | | $ | 63,213,866 | |
| | | | |
Shares outstanding | | | 5,994,510 | |
| | | | |
Net asset value | | $ | 10.55 | |
| | | | |
Shares authorized | | | Unlimited | |
| | | | |
Par value | | | N/A | |
| | | | |
| |
| Class K | | | |
Net assets | | $ | 794,107,616 | |
| | | | |
Shares outstanding | | | 72,936,959 | |
| | | | |
Net asset value | | $ | 10.89 | |
| | | | |
Shares authorized | | | Unlimited | |
| | | | |
Par value | | | N/A | |
| | | | |
See notes to financial statements.
| | |
| 8 | | 2 0 2 1 BLACK ROCK ANNUAL REPORT TO SHAREHOLDERS |
Statement of Operations
Year Ended December 31, 2021
| | | | |
| | | iShares MSCI Total International Index Fund | |
| |
INVESTMENT INCOME | | | | |
Net investment income allocated from the Master Portfolio: | | | | |
Dividends — unaffiliated | | $ | 36,079,640 | |
Dividends — affiliated | | | 1,344 | |
Securities lending income — affiliated — net | | | 187,461 | |
Non-cash dividends — unaffiliated | | | 2,042,890 | |
Foreign taxes withheld | | | (4,362,960 | ) |
Expenses | | | (1,007,794 | ) |
Fees waived | | | 29,134 | |
| | | | |
Total investment income | | | 32,969,715 | |
| | | | |
| |
FUND EXPENSES | | | | |
Service — class specific | | | 738,919 | |
Transfer agent — class specific | | | 336,935 | |
Administration | | | 135,024 | |
Registration | | | 65,048 | |
Professional | | | 64,903 | |
Accounting services | | | 4,975 | |
Officer | | | 366 | |
Miscellaneous | | | 24,244 | |
| | | | |
Total expenses | | | 1,370,414 | |
Less: | | | | |
Fees waived and/or reimbursed by the Administrator | | | (26,484 | ) |
Transfer agent fees waived and/or reimbursed — class specific | | | (7,897 | ) |
| | | | |
Total expenses after fees waived and/or reimbursed | | | 1,336,033 | |
| | | | |
Net investment income | | | 31,633,682 | |
| | | | |
| |
REALIZED AND UNREALIZED GAIN (LOSS) ALLOCATED FROM THE MASTER PORTFOLIO | | | | |
Net realized gain (loss) from: | | | | |
Investments — unaffiliated(a) | | | (8,019,534 | ) |
Investments — affiliated | | | 5,346 | |
Foreign currency transactions | | | (330,161 | ) |
Futures contracts | | | 130,792 | |
| | | | |
| | | (8,213,557 | ) |
| | | | |
Net change in unrealized appreciation (depreciation) on: | | | | |
Investments — unaffiliated(b) | | | 70,752,011 | |
Investments — affiliated | | | (11,043 | ) |
Foreign currency translations | | | 4,322 | |
Futures contracts | | | 105,786 | |
| | | | |
| | | 70,851,076 | |
| | | | |
Net realized and unrealized gain | | | 62,637,519 | |
| | | | |
| |
NET INCREASE IN NET ASSETS RESULTING FROM OPERATIONS | | $ | 94,271,201 | |
| | | | |
| |
(a) Net of foreign capital gain tax and capital gain tax refund, if applicable of | | $ | (126,879) | |
(b) Net of increase in deferred foreign capital gain tax of | | $ | (667,259) | |
See notes to financial statements.
| | |
FUND FINANCIAL STATEMENTS | | 9 |
Statements of Changes in Net Assets
| | | | | | | | |
| | | iShares MSCI Total International Index Fund | |
| | | | |
| |
| | | Year Ended December 31, | |
| | | | |
| | | 2021 | | | 2020 | |
| |
| | |
INCREASE (DECREASE) IN NET ASSETS | | | | | | | | |
| | |
OPERATIONS | | | | | | | | |
Net investment income | | $ | 31,633,682 | | | $ | 21,953,089 | |
Net realized loss | | | (8,213,557 | ) | | | (26,574,974 | ) |
Net change in unrealized appreciation (depreciation) | | | 70,851,076 | | | | 137,120,876 | |
| | | | | | | | |
Net increase in net assets resulting from operations | | | 94,271,201 | | | | 132,498,991 | |
| | | | | | | | |
| | |
DISTRIBUTIONS TO SHAREHOLDERS(a) | | | | | | | | |
Institutional | | | (10,919,966 | ) | | | (3,077,851 | ) |
Investor A | | | (5,863,998 | ) | | | (6,901,551 | ) |
Class K | | | (23,233,137 | ) | | | (12,453,612 | ) |
| | | | | | | | |
Decrease in net assets resulting from distributions to shareholders | | | (40,017,101 | ) | | | (22,433,014 | ) |
| | | | | | | | |
| | |
CAPITAL SHARE TRANSACTIONS | | | | | | | | |
Net increase in net assets derived from capital share transactions | | | 142,617,090 | | | | 1,422,751 | |
| | | | | | | | |
| | |
NET ASSETS | | | | | | | | |
Total increase in net assets | | | 196,871,190 | | | | 111,488,728 | |
Beginning of year | | | 1,206,217,216 | | | | 1,094,728,488 | |
| | | | | | | | |
End of year | | $ | 1,403,088,406 | | | $ | 1,206,217,216 | |
| | | | | | | | |
| (a) | Distributions for annual periods determined in accordance with U.S. federal income tax regulations. |
See notes to financial statements.
| | |
| 10 | | 2 0 2 1 BLACK ROCK ANNUAL REPORT TO SHAREHOLDERS |
Financial Highlights
(For a share outstanding throughout each period)
| | | | | | | | | | | | | | | | | | | | |
| | | iShares MSCI Total International Index Fund | |
| |
| | | Institutional | |
| |
| | | Year Ended December 31, | |
| | | 2021 | | | 2020 | | | 2019 | | | 2018 | | | 2017 | |
| | | | | |
Net asset value, beginning of year | | $ | 10.10 | | | $ | 9.35 | | | $ | 7.97 | | | $ | 9.54 | | | $ | 7.70 | |
| | | | | | | | | | | | | | | | | | | | |
Net investment income(a) | | | 0.25 | | | | 0.18 | | | | 0.27 | | | | 0.26 | | | | 0.24 | |
Net realized and unrealized gain (loss) | | | 0.51 | | | | 0.77 | | | | 1.40 | | | | (1.56 | ) | | | 1.86 | |
| | | | | | | | | | | | | | | | | | | | |
Net increase (decrease) from investment operations | | | 0.76 | | | | 0.95 | | | | 1.67 | | | | (1.30 | ) | | | 2.10 | |
| | | | | | | | | | | | | | | | | | | | |
| | | | | |
Distributions(b) | | | | | | | | | | | | | | | | | | | | |
From net investment income | | | (0.32 | ) | | | (0.20 | ) | | | (0.29 | ) | | | (0.25 | ) | | | (0.26 | ) |
From net realized gain | | | — | | | | — | | | | — | | | | — | | | | (0.00 | )(c) |
Return of capital | | | — | | | | — | | | | — | | | | (0.02 | ) | | | — | |
| | | | | | | | | | | | | | | | | | | | |
Total distributions | | | (0.32 | ) | | | (0.20 | ) | | | (0.29 | ) | | | (0.27 | ) | | | (0.26 | ) |
| | | | | | | | | | | | | | | | | | | | |
| | | | | |
Net asset value, end of year | | $ | 10.54 | | | $ | 10.10 | | | $ | 9.35 | | | $ | 7.97 | | | $ | 9.54 | |
| | | | | | | | | | | | | | | | | | | | |
| | | | | |
Total Return(d) | | | | | | | | | | | | | | | | | | | | |
Based on net asset value | | | 7.60 | % | | | 10.72 | % | | | 21.18 | % | | | (13.94 | )% | | | 27.57 | % |
| | | | | | | | | | | | | | | | | | | | |
| | | | | |
Ratios to Average Net Assets(e)(f)(g) | | | | | | | | | | | | | | | | | | | | |
Total expenses | | | 0.15 | % | | | 0.16 | % | | | 0.16 | %(h) | | | 0.17 | %(h) | | | 0.16 | % |
| | | | | | | | | | | | | | | | | | | | |
Total expenses after fees waived and/or reimbursed | | | 0.15 | % | | | 0.15 | % | | | 0.16 | % | | | 0.16 | % | | | 0.16 | % |
| | | | | | | | | | | | | | | | | | | | |
Net investment income | | | 2.31 | % | | | 2.08 | % | | | 3.08 | % | | | 2.83 | % | | | 2.69 | % |
| | | | | | | | | | | | | | | | | | | | |
| | | | | |
Supplemental Data | | | | | | | | | | | | | | | | | | | | |
Net assets, end of year (000) | | $ | 545,767 | | | $ | 156,711 | | | $ | 264,845 | | | $ | 159,351 | | | $ | 73,405 | |
| | | | | | | | | | | | | | | | | | | | |
Portfolio turnover rate of the Master Portfolio | | | 13 | % | | | 23 | % | | | 5 | % | | | 40 | % | | | 57 | % |
| | | | | | | | | | | | | | | | | | | | |
| (a) | Based on average shares outstanding. |
| (b) | Distributions for annual periods determined in accordance with U.S. federal income tax regulations. |
| (c) | Amount is greater than $(0.005) per share. |
| (d) | Where applicable, assumes the reinvestment of distributions. |
| (e) | Includes the Fund’s share of the Master Portfolio’s allocated net expenses and/or net investment income. |
| (f) | Includes the Fund’s share of the Master Portfolio’s allocated fees waived of less than 0.01%. |
| (g) | Excludes fees and expenses incurred indirectly as a result of investments in underlying funds. |
| (h) | Includes recoupment of past waived and/or reimbursed fees with no financial impact to the expense ratio. |
See notes to financial statements.
| | |
FUND FINANCIAL HIGHLIGHTS | | 11 |
Financial Highlights (continued)
(For a share outstanding throughout each period)
| | | | | | | | | | | | | | | | | | | | |
| | | iShares MSCI Total International Index Fund (continued) | |
| |
| | | Investor A | |
| |
| | | Year Ended December 31, | |
| | | 2021 | | | 2020 | | | 2019 | | | 2018 | | | 2017 | |
| | | | | |
Net asset value, beginning of year | | $ | 10.07 | | | $ | 9.32 | | | $ | 7.95 | | | $ | 9.52 | | | $ | 7.68 | |
| | | | | | | | | | | | | | | | | | | | |
Net investment income(a) | | | 0.23 | | | | 0.17 | | | | 0.25 | | | | 0.23 | | | | 0.22 | |
Net realized and unrealized gain (loss) | | | 0.51 | | | | 0.76 | | | | 1.39 | | | | (1.56 | ) | | | 1.86 | |
| | | | | | | | | | | | | | | | | | | | |
Net increase (decrease) from investment operations | | | 0.74 | | | | 0.93 | | | | 1.64 | | | | (1.33 | ) | | | 2.08 | |
| | | | | | | | | | | | | | | | | | | | |
| | | | | |
Distributions(b) | | | | | | | | | | | | | | | | | | | | |
From net investment income | | | (0.26 | ) | | | (0.18 | ) | | | (0.27 | ) | | | (0.22 | ) | | | (0.24 | ) |
From net realized gain | | | — | | | | — | | | | — | | | | — | | | | (0.00 | )(c) |
Return of capital | | | — | | | | — | | | | — | | | | (0.02 | ) | | | — | |
| | | | | | | | | | | | | | | | | | | | |
Total distributions | | | (0.26 | ) | | | (0.18 | ) | | | (0.27 | ) | | | (0.24 | ) | | | (0.24 | ) |
| | | | | | | | | | | | | | | | | | | | |
| | | | | |
Net asset value, end of year | | $ | 10.55 | | | $ | 10.07 | | | $ | 9.32 | | | $ | 7.95 | | | $ | 9.52 | |
| | | | | | | | | | | | | | | | | | | | |
| | | | | |
Total Return(d) | | | | | | | | | | | | | | | | | | | | |
Based on net asset value | | | 7.37 | % | | | 10.47 | % | | | 20.80 | % | | | (14.19 | )% | | | 27.32 | % |
| | | | | | | | | | | | | | | | | | | | |
| | | | | |
Ratios to Average Net Assets(e)(f)(g) | | | | | | | | | | | | | | | | | | | | |
Total expenses | | | 0.40 | % | | | 0.42 | % | | | 0.41 | %(h) | | | 0.42 | %(h) | | | 0.41 | % |
| | | | | | | | | | | | | | | | | | | | |
Total expenses after fees waived and/or reimbursed | | | 0.39 | % | | | 0.41 | % | | | 0.41 | % | | | 0.41 | % | | | 0.41 | % |
| | | | | | | | | | | | | | | | | | | | |
Net investment income | | | 2.14 | % | | | 2.01 | % | | | 2.84 | % | | | 2.55 | % | | | 2.47 | % |
| | | | | | | | | | | | | | | | | | | | |
| | | | | |
Supplemental Data | | | | | | | | | | | | | | | | | | | | |
Net assets, end of year (000) | | $ | 63,214 | | | $ | 383,705 | | | $ | 341,385 | | | $ | 272,066 | | | $ | 288,431 | |
| | | | | | | | | | | | | | | | | | | | |
Portfolio turnover rate of the Master Portfolio | | | 13 | % | | | 23 | % | | | 5 | % | | | 40 | % | | | 57 | % |
| | | | | | | | | | | | | | | | | | | | |
| (a) | Based on average shares outstanding. |
| (b) | Distributions for annual periods determined in accordance with U.S. federal income tax regulations. |
| (c) | Amount is greater than $(0.005) per share. |
| (d) | Where applicable, assumes the reinvestment of distributions. |
| (e) | Includes the Fund’s share of the Master Portfolio’s allocated net expenses and/or net investment income. |
| (f) | Includes the Fund’s share of the Master Portfolio’s allocated fees waived of less than 0.01%. |
| (g) | Excludes fees and expenses incurred indirectly as a result of investments in underlying funds. |
| (h) | Includes recoupment of past waived and/or reimbursed fees with no financial impact to the expense ratio. |
See notes to financial statements.
| | |
| 12 | | 2 0 2 1 BLACK ROCK ANNUAL REPORT TO SHAREHOLDERS |
Financial Highlights (continued)
(For a share outstanding throughout each period)
| | | | | | | | | | | | | | | | | | | | |
| | | iShares MSCI Total International Index Fund (continued) | |
| |
| | | Class K | |
| |
| | | Year Ended December 31, | |
| | | 2021 | | | 2020 | | | 2019 | | | 2018 | | | 2017 | |
| | | | | |
Net asset value, beginning of year | | $ | 10.42 | | | $ | 9.64 | | | $ | 8.21 | | | $ | 9.82 | | | $ | 7.92 | |
| | | | | | | | | | | | | | | | | | | | |
Net investment income(a) | | | 0.27 | | | | 0.20 | | | | 0.28 | | | | 0.27 | | | | 0.25 | |
Net realized and unrealized gain (loss) | | | 0.53 | | | | 0.79 | | | | 1.44 | | | | (1.61 | ) | | | 1.91 | |
| | | | | | | | | | | | | | | | | | | | |
Net increase (decrease) from investment operations | | | 0.80 | | | | 0.99 | | | | 1.72 | | | | (1.34 | ) | | | 2.16 | |
| | | | | | | | | | | | | | | | | | | | |
| | | | | |
Distributions(b) | | | | | | | | | | | | | | | | | | | | |
From net investment income | | | (0.33 | ) | | | (0.21 | ) | | | (0.29 | ) | | | (0.25 | ) | | | (0.26 | ) |
From net realized gain | | | — | | | | — | | | | — | | | | — | | | | (0.00 | )(c) |
Return of capital | | | — | | | | — | | | | — | | | | (0.02 | ) | | | — | |
| | | | | | | | | | | | | | | | | | | | |
Total distributions | | | (0.33 | ) | | | (0.21 | ) | | | (0.29 | ) | | | (0.27 | ) | | | (0.26 | ) |
| | | | | | | | | | | | | | | | | | | | |
| | | | | |
Net asset value, end of year | | $ | 10.89 | | | $ | 10.42 | | | $ | 9.64 | | | $ | 8.21 | | | $ | 9.82 | |
| | | | | | | | | | | | | | | | | | | | |
| | | | | |
Total Return(d) | | | | | | | | | | | | | | | | | | | | |
Based on net asset value | | | 7.70 | % | | | 10.76 | % | | | 21.22 | % | | | (13.91 | )% | | | 27.62 | % |
| | | | | | | | | | | | | | | | | | | | |
| | | | | |
Ratios to Average Net Assets(e)(f)(g) | | | | | | | | | | | | | | | | | | | | |
Total expenses | | | 0.10 | % | | | 0.12 | % | | | 0.11 | %(h) | | | 0.12 | %(h) | | | 0.11 | % |
| | | | | | | | | | | | | | | | | | | | |
Total expenses after fees waived and/or reimbursed | | | 0.10 | % | | | 0.11 | % | | | 0.11 | % | | | 0.11 | % | | | 0.11 | % |
| | | | | | | | | | | | | | | | | | | | |
Net investment income | | | 2.43 | % | | | 2.31 | % | | | 3.15 | % | | | 2.85 | % | | | 2.75 | % |
| | | | | | | | | | | | | | | | | | | | |
| | | | | |
Supplemental Data | | | | | | | | | | | | | | | | | | | | |
Net assets, end of year (000) | | $ | 794,108 | | | $ | 665,801 | | | $ | 488,498 | | | $ | 299,520 | | | $ | 263,532 | |
| | | | | | | | | | | | | | | | | | | | |
Portfolio turnover rate of the Master Portfolio | | | 13 | % | | | 23 | % | | | 5 | % | | | 40 | % | | | 57 | % |
| | | | | | | | | | | | | | | | | | | | |
| (a) | Based on average shares outstanding. |
| (b) | Distributions for annual periods determined in accordance with U.S. federal income tax regulations. |
| (c) | Amount is greater than $(0.005) per share. |
| (d) | Where applicable, assumes the reinvestment of distributions. |
| (e) | Includes the Fund’s share of the Master Portfolio’s allocated net expenses and/or net investment income. |
| (f) | Includes the Fund’s share of the Master Portfolio’s allocated fees waived of less than 0.01%. |
| (g) | Excludes fees and expenses incurred indirectly as a result of investments in underlying funds. |
| (h) | Includes recoupment of past waived and/or reimbursed fees with no financial impact to the expense ratio. |
See notes to financial statements.
| | |
FUND FINANCIAL HIGHLIGHTS | | 13 |
Notes to Financial Statements
BlackRock Funds III (the “Trust”) is registered under the Investment Company Act of 1940, as amended (the “1940 Act”), as an open-end management investment company. The Trust is organized as a Delaware statutory trust. iShares MSCI Total International Index Fund (the “Fund”) is a series of the Trust. The Fund is classified as diversified.
The Fund seeks to achieve its investment objective by investing all of its assets in Total International ex U.S. Index Master Portfolio (the “Master Portfolio”), a series of Master Investment Portfolio (“MIP”) and an affiliate of the Trust, which has the same investment objective and strategies as the Fund. The value of the Fund’s investment in the Master Portfolio reflects the Fund’s proportionate interest in the net assets of the Master Portfolio. The performance of the Fund is directly affected by the performance of the Master Portfolio. At December 31, 2021, the percentage of the Master Portfolio owned by the Fund was 99.9%. The financial statements of the Master Portfolio, including the Schedule of Investments, are included elsewhere in this report and should be read in conjunction with the Fund’s financial statements.
The Fund offers multiple classes of shares. All classes of shares have identical voting, dividend, liquidation and other rights and are subject to the same terms and conditions, except that certain classes bear expenses related to the shareholder servicing and distribution of such shares. Institutional and Class K Shares are sold only to certain eligible investors. Investor A Shares are generally available through financial intermediaries. Each class has exclusive voting rights with respect to matters relating to its shareholder servicing and distribution expenditures.
| | | | | | | | |
| Share Class | | Initial Sales Charge | | CDSC | | | Conversion
Privilege |
Institutional, Investor A and Class K Shares | | No | | | No | | | None |
The Board of Trustees of the Trust and Board of Directors of MIP are referred to throughout this report as the “Board” and the members are referred to as “Trustees”.
The Fund, together with certain other registered investment companies advised by BlackRock Fund Advisors (“BFA”)or its affiliates,is included in a complex ofopen-end equity, multi-asset, index and money market funds referred to as the BlackRock Multi-Asset Complex.
| 2. | SIGNIFICANT ACCOUNTING POLICIES |
The financial statements are prepared in conformity with accounting principles generally accepted in the United States of America (“U.S. GAAP”), which may require management to make estimates and assumptions that affect the reported amounts of assets and liabilities in the financial statements, disclosure of contingent assets and liabilities at the date of the financial statements and the reported amounts of increases and decreases in net assets from operations during the reporting period. Actual results could differ from those estimates. The Fund is considered an investment company under U.S. GAAP and follows the accounting and reporting guidance applicable to investment companies. Below is a summary of significant accounting policies:
Investment Transactions and Income Recognition: For financial reporting purposes, contributions to and withdrawals from the Master Portfolio are accounted for on a trade date basis. The Fund records its proportionate share of the Master Portfolio’s income, expenses and realized and unrealized gains and losses on a daily basis. Realized and unrealized gains and losses are adjusted utilizing partnership tax allocation rules. In addition, the Fund accrues its own expenses. Income, expenses and realized and unrealized gains and losses are allocated daily to each class based on its relative net assets.
Distributions: Distributions paid by the Fund are recorded on the ex-dividend dates. The character and timing of distributions are determined in accordance with U.S. federal income tax regulations, which may differ from U.S. GAAP.
Indemnifications: In the normal course of business, the Fund enters into contracts that contain a variety of representations that provide general indemnification. The Fund’s maximum exposure under these arrangements is unknown because it involves future potential claims against the Fund, which cannot be predicted with any certainty.
Other: Expenses directly related to the Fund or its classes are charged to the Fund or the applicable class. Expenses directly related to the Fund and other shared expenses prorated to the Fund are allocated daily to each class based on its relative net assets or other appropriate methods. Other operating expenses shared by several funds, including other funds managed by the BlackRock Advisors, LLC (the “Administrator”), are prorated among those funds on the basis of relative net assets or other appropriate methods.
| 3. | INVESTMENT VALUATION AND FAIR VALUE MEASUREMENTS |
Investment Valuation Policies: The Fund’s policy is to value its financial instruments at fair value. The Fund records its investment in the Master Portfolio at fair value based on the Fund’s proportionate interest in the net assets of the Master Portfolio. Valuation of securities held by the Master Portfolio is discussed in Note 3 of the Master Portfolio’s Notes to Financial Statements, which are included elsewhere in this report.
| 4. | ADMINISTRATION AGREEMENT AND OTHER TRANSACTIONS WITH AFFILIATES |
Administration: The Trust, on behalf of the Fund, entered into an Administration Agreement with the Administrator, an indirect, wholly-owned subsidiary of BlackRock, Inc. (“BlackRock”), to provide administrative services (other than investment advice and related portfolio activities). For such services, the Fund pays the Administrator a monthly fee at an annual rate of 0.01% of the average daily net assets of the Fund. The Fund does not pay an investment advisory fee or investment management fee.
Service Fees: The Trust, on behalf of the Fund, entered into a Distribution Agreement and a Distribution and Service Plan with BlackRock Investments, LLC (“BRIL”), an affiliate of the Administrator. Pursuant to the Distribution and Service Plan and in accordance with Rule 12b-1 under the 1940 Act, the Fund pays BRIL ongoing service fees. The fees are accrued daily and paid monthly at an annual rate of 0.25% based upon the average daily net assets of the Investor A Shares.
| | |
| 14 | | 2 0 2 1 BLACK ROCK ANNUAL REPORT TO SHAREHOLDERS |
Notes to Financial Statements (continued)
BRIL and broker-dealers, pursuant to sub-agreements with BRIL, provide shareholder servicing to the Fund. The ongoing service fee compensates BRIL and each broker-dealer for providing shareholder servicing related services to shareholders.
For the year ended December 31, 2021, the class specific service fees borne directly by Investor A Shares were $738,919.
Transfer Agent: Pursuant to written agreements, certain financial intermediaries, some of which may be affiliates, provide the Fund with sub-accounting, recordkeeping, sub-transfer agency and other administrative services with respect to servicing of underlying investor accounts. For these services, these entities receive an asset-based fee or an annual fee per shareholder account, which will vary depending on share class and/or net assets. For the year ended December 31, 2021, the Fund did not pay any amounts to affiliates in return for these services.
The Administrator maintains a call center that is responsible for providing certain shareholder services to the Fund. Shareholder services include responding to inquiries and processing purchases and sales based upon instructions from shareholders. For the year ended December 31, 2021, the Fund reimbursed the Administrator the following amounts for costs incurred in running the call center, which are included in transfer agent — class specific in the Statement of Operations:
| | | | | | | | | | | | | | | | |
| | | Institutional | | | Investor A | | | Class K | | | Total | |
Reimbursed amounts | | $ | 236 | | | $ | 4,315 | | | $ | 2,438 | | | $ | 6,989 | |
For the year ended December 31, 2021, the following table shows the class specific transfer agent fees borne directly by each share class of the Fund:
| | | | | | | | | | | | | | | | |
| | | Institutional | | | Investor A | | | Class K | | | Total | |
Transfer agent fees — class specific | | $ | 142,174 | | | $ | 163,776 | | | $ | 30,985 | | | $ | 336,935 | |
Expense Limitations, Waivers and Reimbursements: With respect to the Fund, the Administrator contractually agreed to waive and/or reimburse fees or expenses in order to limit expenses, excluding interest expense, dividend expense, tax expense, acquired fund fees and expenses, and certain other fund expenses, which constitute extraordinary expenses not incurred in the ordinary course of the Fund’s business (“expense limitation”). The expense limitations as a percentage of average daily net assets are as follows:
| | | | |
| Share Class | | Expense Limitation | |
Institutional | | | 0.16 | % |
Investor A | | | 0.41 | |
Class K | | | 0.11 | |
The Administrator has agreed not to reduce or discontinue the contractual expense limitations through June 30, 2023, unless approved by the Board, including a majority of the trustees who are not “interested persons” of the Trust, as defined in the 1940 Act (“Independent Trustees”), or by a vote of a majority of the outstanding voting securities of the Fund. For the year ended December 31, 2021, the Administrator waived and/or reimbursed investment advisory fees of $26,484 which is included in fees waived and/or reimbursed by the Administrator in the Statement of Operations.
In addition, these amounts waived and/or reimbursed by the Manager are included in transfer agent fees waived and/or reimbursed-class specific in the Statement of Operations. For the year ended December 31, 2021, class specific expense waivers and/or reimbursements are as follows:
| | | | | | | | | | | | | | | | |
| | | Institutional | | | Investor A | | | Class K | | | Total | |
Transfer agent fees waived and/or reimbursed — class specific | | $ | 554 | | | $ | 2,740 | | | $ | 4,603 | | | $ | 7,897 | |
Interfund Lending: In accordance with an exemptive order (the “Order”) from the U.S. Securities and Exchange Commission (“SEC”), the Fund may participate in a joint lending and borrowing facility for temporary purposes (the “Interfund Lending Program”), subject to compliance with the terms and conditions of the Order, and to the extent permitted by the Fund’s investment policies and restrictions. The Fund is currently permitted to borrow and lend under the Interfund Lending Program.
A lending BlackRock fund may lend in aggregate up to 15% of its net assets but may not lend more than 5% of its net assets to any one borrowing fund through the Interfund Lending Program. A borrowing BlackRock fund may not borrow through the Interfund Lending Program or from any other source more than 33 1/3% of its total assets (or any lower threshold provided for by the fund’s investment restrictions). If a borrowing BlackRock fund’s total outstanding borrowings exceed 10% of its total assets, each of its outstanding interfund loans will be subject to collateralization of at least 102% of the outstanding principal value of the loan. All interfund loans are for temporary or emergency purposes and the interest rate to be charged will be the average of the highest current overnight repurchase agreement rate available to a lending fund and the bank loan rate, as calculated according to a formula established by the Board.
During the year ended December 31, 2021, the Fund did not participate in the Interfund Lending Program.
Trustees and Officers: Certain trustees and/or officers of the Fund are directors and/or officers of BlackRock or its affiliates. The Fund reimburses the Administrator for a portion of the compensation paid to the Fund’s Chief Compliance Officer, which is included in Trustees and Officer in the Master Portfolio’s Statement of Operations.
It is the Fund’s policy to comply with the requirements of the Internal Revenue Code of 1986, as amended, applicable to regulated investment companies, and to distribute substantially all of its taxable income to its shareholders. Therefore, no U.S. federal income tax provision is required.
| | |
FUND NOTES TO FINANCIAL STATEMENTS | | 15 |
Notes to Financial Statements (continued)
The Fund files U.S. federal and various state and local tax returns. No income tax returns are currently under examination. The statute of limitations on the Fund’s U.S. federal tax returns generally remains open for a period of three fiscal years after they are filed. The statutes of limitations on the Fund’s state and local tax returns may remain open for an additional year depending upon the jurisdiction.
Management has analyzed tax laws and regulations and their application to the Fund as of December 31, 2021, inclusive of the open tax return years, and does not believe that there are any uncertain tax positions that require recognition of a tax liability in the Fund’s financial statements.
The tax character of distributions paid was as follows:
| | | | | | | | |
Fund Name | | Year Ended 12/31/21 | | | Year Ended 12/31/20 | |
iShares MSCI Total International Index Fund
Ordinary income | | $ | 40,017,101 | | | $ | 22,433,014 | |
As of December 31, 2021, the tax components of accumulated earnings (loss) were as follows:
| | | | | | | | | | | | | | | | |
Fund Name | | Undistributed Ordinary Income | | | Non-Expiring Capital Loss Carryforwards(a)
| | | Net Unrealized Gains (Losses)(b) | | | Total | |
iShares MSCI Total International Index Fund | | $ | 571,835 | | | $ | (32,656,691 | ) | | $ | 312,485,271 | | | $ | 280,400,415 | |
| | (a) | Amounts available to offset future realized capital gains. | |
| | (b) | The difference between book-basis and tax-basis net unrealized gains was attributable primarily to the timing and recognition of partnership income. | |
| 6. | CAPITAL SHARE TRANSACTIONS |
Transactions in capital shares for each class were as follows:
| | | | | | | | | | | | | | | | | | |
| | | | |
| | | Year Ended
12/31/21 | | | | | Year Ended 12/31/20 | |
| | | | | |
| Fund Name / Share Class | | Shares | | | Amounts | | | | | Shares | | | Amounts | |
| | | | | |
iShares MSCI Total International Index Fund | | | | | | | | | | | | | | | | | | |
Institutional | | | | | | | | | | | | | | | | | | |
Shares sold | | | 40,089,148 | | | $ | 436,234,144 | | | | | | 5,369,506 | | | $ | 44,417,496 | |
Shares issued in reinvestment of distributions | | | 1,042,707 | | | | 10,919,945 | | | | | | 375,684 | | | | 3,077,859 | |
Shares redeemed | | | (4,860,731 | ) | | | (51,608,254 | ) | | | | | (18,558,941 | ) | | | (167,688,463 | ) |
| | | | | | | | | | | | | | | | | | |
| | | | | |
| | | 36,271,124 | | | $ | 395,545,835 | | | | | | (12,813,751 | ) | | $ | (120,193,108 | ) |
| | | | | | | | | | | | | | | | | | |
Investor A | | | | | | | | | | | | | | | | | | |
Shares sold | | | 4,889,048 | | | $ | 51,983,230 | | | | | | 12,457,330 | | | $ | 96,930,463 | |
Shares issued in reinvestment of distributions | | | 553,580 | | | | 5,860,189 | | | | | | 849,395 | | | | 6,898,470 | |
Shares redeemed | | | (37,545,137 | ) | | | (407,588,212 | ) | | | | | (11,827,367 | ) | | | (101,027,463 | ) |
| | | | | | | | | | | | | | | | | | |
| | | | | |
| | | (32,102,509 | ) | | $ | (349,744,793 | ) | | | | | 1,479,358 | | | $ | 2,801,470 | |
| | | | | | | | | | | | | | | | | | |
Class K | | | | | | | | | | | | | | | | | | |
Shares sold | | | 37,491,001 | | | $ | 411,998,858 | | | | | | 41,606,576 | | | $ | 366,443,009 | |
Shares issued in reinvestment of distributions | | | 2,129,220 | | | | 23,135,434 | | | | | | 1,473,593 | | | | 12,420,242 | |
Shares redeemed | | | (30,555,030 | ) | | | (338,318,244 | ) | | | | | (29,889,303 | ) | | | (260,048,862 | ) |
| | | | | | | | | | | | | | | | | | |
| | | | | |
| | | 9,065,191 | | | $ | 96,816,048 | | | | | | 13,190,866 | | | $ | 118,814,389 | |
| | | | | | | | | | | | | | | | | | |
| | | | | |
| | | 13,233,806 | | | $ | 142,617,090 | | | | | | 1,856,473 | | | $ | 1,422,751 | |
| | | | | | | | | | | | | | | | | | |
Management has evaluated the impact of all subsequent events on the Fund through the date the financial statements were issued and has determined that there were no subsequent events requiring adjustment or additional disclosure in the financial statements.
| | |
| 16 | | 2 0 2 1 BLACK ROCK ANNUAL REPORT TO SHAREHOLDERS |
Report of Independent Registered Public Accounting Firm
To the Board of Trustees of BlackRock Funds III and Shareholders of iShares MSCI Total International Index Fund
Opinion on the Financial Statements
We have audited the accompanying statement of assets and liabilities of iShares MSCI Total International Index Fund (one of the series constituting BlackRock Funds III, referred to hereafter as the “Fund”) as of December 31, 2021, the related statement of operations for the year ended December 31, 2021, the statements of changes in net assets for each of the two years in the period ended December 31, 2021, including the related notes, and the financial highlights for each of the five years in the period ended December 31, 2021 (collectively referred to as the “financial statements”). In our opinion, the financial statements present fairly, in all material respects, the financial position of the Fund as of December 31, 2021, the results of its operations for the year then ended, the changes in its net assets for each of the two years in the period ended December 31, 2021 and the financial highlights for each of the five years in the period ended December 31, 2021 in conformity with accounting principles generally accepted in the United States of America.
Basis for Opinion
These financial statements are the responsibility of the Fund’s management. Our responsibility is to express an opinion on the Fund’s financial statements based on our audits. We are a public accounting firm registered with the Public Company Accounting Oversight Board (United States) (PCAOB) and are required to be independent with respect to the Fund in accordance with the U.S. federal securities laws and the applicable rules and regulations of the Securities and Exchange Commission and the PCAOB.
We conducted our audits of these financial statements in accordance with the standards of the PCAOB. Those standards require that we plan and perform the audit to obtain reasonable assurance about whether the financial statements are free of material misstatement, whether due to error or fraud.
Our audits included performing procedures to assess the risks of material misstatement of the financial statements, whether due to error or fraud, and performing procedures that respond to those risks. Such procedures included examining, on a test basis, evidence regarding the amounts and disclosures in the financial statements. Our audits also included evaluating the accounting principles used and significant estimates made by management, as well as evaluating the overall presentation of the financial statements. Our procedures included confirmation of securities owned as of December 31, 2021 by correspondence with the administrator of the Master Portfolio. We believe that our audits provide a reasonable basis for our opinion.
/s/PricewaterhouseCoopers LLP
Philadelphia, Pennsylvania
February 24, 2022
We have served as the auditor of one or more BlackRock investment companies since 2000.
| | |
FUND REPORT OF INDEPENDENT REGISTERED PUBLIC ACCOUNTING FIRM | | 17 |
| | |
| Important Tax Information (unaudited) | | |
The following amount, or maximum amount allowable by law, is hereby designated as qualified dividend income for individuals for the fiscal year ended December 31, 2021:
| | |
| | |
Fund Name | | Qualified Dividend Income |
| |
iShares MSCI Total International Index Fund | | $ 33,520,991 |
The Fund intends to pass through to its shareholders the following amount, or maximum amount allowable by law, of foreign source income earned and foreign taxes paid for the fiscal year ended December 31, 2021:
| | | | |
| | | |
| Fund Name | | Foreign Source
Income Earned | | Foreign
Taxes Paid |
| | |
iShares MSCI Total International Index Fund | | $ 37,794,312 | | $ 3,994,142 |
| | |
| 18 | | 2 0 2 1 BLACK ROCK ANNUAL REPORT TO SHAREHOLDERS |
| | |
| Master Portfolio Information as of December 31, 2021 | | Total International ex U.S. Index Master Portfolio |
TEN LARGEST HOLDINGS
| | | | |
| Security | | Percent of
Net Assets | |
| |
Taiwan Semiconductor Manufacturing Co. Ltd. | | | 2 | % |
| |
Nestle SA, Registered Shares | | | 1 | |
| |
Tencent Holdings Ltd. | | | 1 | |
| |
ASML Holding NV | | | 1 | |
| |
Samsung Electronics Co. Ltd. | | | 1 | |
| |
Roche Holding AG | | | 1 | |
| |
LVMH Moet Hennessy Louis Vuitton SE | | | 1 | |
| |
Alibaba Group Holding Ltd. | | | 1 | |
| |
Toyota Motor Corp. | | | 1 | |
| |
Novartis AG, Registered Shares | | | 1 | |
GEOGRAPHIC ALLOCATION
| | | | |
| Country/Geographic Region | | Percent of
Net Assets | |
| |
Japan | | | 14 | % |
| |
China | | | 9 | |
| |
United Kingdom | | | 8 | |
| |
Canada | | | 7 | |
| |
France | | | 7 | |
| |
Switzerland | | | 7 | |
| |
Germany | | | 5 | |
| |
Australia | | | 5 | |
| |
United States | | | 5 | |
| |
Taiwan | | | 5 | |
| |
Netherlands | | | 4 | |
| |
South Korea | | | 4 | |
| |
India | | | 4 | |
| |
Sweden | | | 2 | |
| |
Hong Kong | | | 2 | |
| |
Denmark | | | 2 | |
| |
Spain | | | 1 | |
| |
Italy | | | 1 | |
| |
Brazil | | | 1 | |
| |
Russia | | | 1 | |
| |
Saudi Arabia | | | 1 | |
| |
South Africa | | | 1 | |
| |
Finland | | | 1 | |
| |
Singapore | | | 1 | |
| |
Ireland | | | 1 | |
| |
Mexico | | | 1 | |
| |
Belgium | | | 1 | |
| |
Thailand | | | 1 | |
| |
Israel | | | 1 | |
| |
Other | | | — | (a) |
| |
Liabilities in Excess of Other Assets# | | | (3 | ) |
| (a) | Rounds to less than 1% of net assets. |
| # | Includes holdings within countries/geographic regions that are less than 1% of net assets. Please refer to the Schedule of Investments for such countries/geographic regions. |
| | |
MASTER PORTFOLIO INFORMATION | | 19 |
| | |
Schedule of Investments December 31, 2021 | | Total International ex U.S. Index Master Portfolio (Percentages shown are based on Net Assets) |
| | | | | | | | |
| Security | | Shares | | | Value | |
| | |
Common Stocks | | | | | | | | |
| | |
| Australia — 4.6% | | | | | | |
Afterpay Ltd.(a) | | | 10,494 | | | $ | 633,493 | |
Ampol Ltd. | | | 14,063 | | | | 303,662 | |
APA Group(b) | | | 76,671 | | | | 560,909 | |
Aristocrat Leisure Ltd. | | | 28,436 | | | | 902,063 | |
ASX Ltd. | | | 9,515 | | | | 643,064 | |
Aurizon Holdings Ltd. | | | 85,217 | | | | 216,505 | |
AusNet Services Ltd. | | | 88,260 | | | | 165,106 | |
Australia & New Zealand Banking Group Ltd. | | | 141,227 | | | | 2,828,965 | |
BHP Group Ltd. | | | 155,701 | | | | 4,700,882 | |
BHP Group PLC | | | 102,644 | | | | 3,054,143 | |
BlueScope Steel Ltd. | | | 28,378 | | | | 433,228 | |
Brambles Ltd. | | | 68,252 | | | | 528,020 | |
Cochlear Ltd. | | | 3,207 | | | | 503,340 | |
Coles Group Ltd. | | | 64,627 | | | | 843,258 | |
Commonwealth Bank of Australia | | | 90,948 | | | | 6,685,704 | |
Computershare Ltd. | | | 24,463 | | | | 356,111 | |
Crown Resorts Ltd.(a) | | | 17,839 | | | | 155,286 | |
CSL Ltd. | | | 24,360 | | | | 5,152,145 | |
Dexus | | | 50,184 | | | | 405,781 | |
Domino’s Pizza Enterprises Ltd. | | | 2,454 | | | | 210,631 | |
Endeavour Group Ltd. | | | 70,555 | | | | 346,238 | |
Evolution Mining Ltd. | | | 119,419 | | | | 354,291 | |
Fortescue Metals Group Ltd. | | | 86,608 | | | | 1,217,427 | |
Glencore PLC | | | 505,353 | | | | 2,574,914 | |
Goodman Group | | | 81,838 | | | | 1,577,576 | |
GPT Group | | | 129,031 | | | | 508,794 | |
IDP Education Ltd. | | | 11,418 | | | | 287,645 | |
Insurance Australia Group Ltd. | | | 128,895 | | | | 399,448 | |
Lendlease Corp. Ltd.(b) | | | 34,964 | | | | 272,249 | |
Macquarie Group Ltd. | | | 17,908 | | | | 2,676,982 | |
Magellan Financial Group Ltd. | | | 6,351 | | | | 98,139 | |
Medibank Pvt Ltd. | | | 164,677 | | | | 401,087 | |
Mirvac Group | | | 177,414 | | | | 375,545 | |
National Australia Bank Ltd. | | | 168,830 | | | | 3,544,941 | |
Newcrest Mining Ltd. | | | 45,528 | | | | 815,411 | |
Northern Star Resources Ltd. | | | 50,376 | | | | 346,453 | |
Orica Ltd. | | | 20,558 | | | | 205,010 | |
Origin Energy Ltd. | | | 90,631 | | | | 345,892 | |
Qantas Airways Ltd.(a) | | | 33,898 | | | | 123,655 | |
QBE Insurance Group Ltd. | | | 67,301 | | | | 555,754 | |
Ramsay Health Care Ltd. | | | 8,965 | | | | 465,911 | |
REA Group Ltd. | | | 2,994 | | | | 365,093 | |
Reece Ltd. | | | 18,949 | | | | 372,655 | |
Rio Tinto Ltd. | | | 20,715 | | | | 1,511,619 | |
Santos Ltd. | | | 148,103 | | | | 682,232 | |
Scentre Group | | | 238,120 | | | | 547,766 | |
SEEK Ltd. | | | 14,458 | | | | 344,674 | |
Sonic Healthcare Ltd. | | | 23,122 | | | | 784,213 | |
South32 Ltd. | | | 233,710 | | | | 683,504 | |
Stockland | | | 120,177 | | | | 370,748 | |
Suncorp Group Ltd. | | | 58,287 | | | | 469,273 | |
Sydney Airport(a)(b) | | | 68,930 | | | | 435,188 | |
Tabcorp Holdings Ltd. | | | 94,363 | | | | 344,737 | |
Telstra Corp. Ltd. | | | 212,153 | | | | 644,775 | |
Transurban Group(b) | | | 157,066 | | | | 1,577,617 | |
Treasury Wine Estates Ltd. | | | 31,026 | | | | 279,741 | |
Vicinity Centres | | | 223,827 | | | | 275,270 | |
Washington H Soul Pattinson & Co. Ltd. | | | 10,991 | | | | 236,885 | |
Wesfarmers Ltd. | | | 58,675 | | | | 2,531,617 | |
Westpac Banking Corp. | | | 183,412 | | | | 2,845,364 | |
| | | | | | | | |
| Security | | Shares | | | Value | |
| | |
| Australia (continued) | | | | | | |
WiseTech Global Ltd. | | | 7,407 | | | $ | 314,141 | |
Woodside Petroleum Ltd. | | | 51,295 | | | | 817,743 | |
Woolworths Group Ltd. | | | 64,177 | | | | 1,774,079 | |
| | | | | | | | |
| | |
| | | | | | | 64,984,592 | |
| | |
| Austria — 0.2% | | | | | | |
Erste Group Bank AG | | | 20,977 | | | | 983,409 | |
OMV AG | | | 7,068 | | | | 399,715 | |
Raiffeisen Bank International AG | | | 9,388 | | | | 275,730 | |
Verbund AG | | | 2,924 | | | | 328,612 | |
voestalpine AG | | | 5,074 | | | | 184,101 | |
| | | | | | | | |
| | |
| | | | | | | 2,171,567 | |
| | |
| Belgium — 0.5% | | | | | | |
Ageas SA | | | 9,563 | | | | 495,242 | |
Anheuser-Busch InBev SA/NV | | | 39,290 | | | | 2,368,792 | |
Elia Group SA/NV | | | 1,275 | | | | 168,053 | |
Etablissements Franz Colruyt NV | | | 4,592 | | | | 194,850 | |
Groupe Bruxelles Lambert SA | | | 5,769 | | | | 644,321 | |
KBC Group NV | | | 12,584 | | | | 1,081,233 | |
Proximus SADP | | | 7,301 | | | | 142,587 | |
Sofina SA | | | 925 | | | | 454,367 | |
Solvay SA | | | 3,386 | | | | 393,642 | |
UCB SA | | | 6,663 | | | | 760,421 | |
Umicore SA | | | 9,752 | | | | 397,827 | |
| | | | | | | | |
| | |
| | | | | | | 7,101,335 | |
| | |
| Brazil — 0.9% | | | | | | |
Alpargatas SA, Preference Shares | | | 14,945 | | | | 98,976 | |
Ambev SA | | | 242,318 | | | | 678,061 | |
Americanas SA(a) | | | 20,314 | | | | 114,470 | |
Atacadao SA | | | 19,425 | | | | 53,042 | |
B3 SA - Brasil Bolsa Balcao | | | 298,299 | | | | 594,028 | |
Banco Bradesco SA | | | 68,851 | | | | 199,579 | |
Banco BTG Pactual SA | | | 64,148 | | | | 240,945 | |
Banco do Brasil SA | | | 40,649 | | | | 210,090 | |
Banco Inter SA | | | 13,173 | | | | 66,981 | |
Banco Santander Brasil SA | | | 31,077 | | | | 167,160 | |
BB Seguridade Participacoes SA | | | 53,016 | | | | 196,245 | |
BRF SA(a) | | | 28,171 | | | | 114,203 | |
CCR SA | | | 52,990 | | | | 110,012 | |
Centrais Eletricas Brasileiras SA | | | 17,279 | | | | 105,332 | |
Cia de Saneamento Basico do Estado de Sao Paulo | | | 21,664 | | | | 158,203 | |
Cia Siderurgica Nacional SA | | | 38,838 | | | | 173,949 | |
Cosan SA | | | 67,148 | | | | 263,818 | |
Energisa SA | | | 7,713 | | | | 61,336 | |
Engie Brasil Energia SA | | | 6,487 | | | | 44,699 | |
Equatorial Energia SA | | | 36,500 | | | | 148,008 | |
Hapvida Participacoes e Investimentos SA(c) | | | 59,345 | | | | 110,160 | |
Hypera SA | | | 19,300 | | | | 97,704 | |
JBS SA | | | 44,372 | | | | 302,752 | |
Klabin SA | | | 50,466 | | | | 232,079 | |
Localiza Rent a Car SA | | | 30,475 | | | | 289,139 | |
Lojas Renner SA | | | 59,690 | | | | 258,317 | |
Magazine Luiza SA | | | 159,612 | | | | 205,737 | |
Natura & Co. Holding SA(a) | | | 42,818 | | | | 197,438 | |
Notre Dame Intermedica Participacoes SA | | | 25,117 | | | | 271,156 | |
Petroleo Brasileiro SA | | | 182,275 | | | | 1,003,806 | |
Raia Drogasil SA | | | 48,280 | | | | 210,197 | |
Rede D’Or Sao Luiz SA(c) | | | 18,795 | | | | 150,960 | |
Rumo SA(a) | | | 61,506 | | | | 195,770 | |
Suzano SA(a) | | | 45,386 | | | | 490,218 | |
Telefonica Brasil SA | | | 19,852 | | | | 172,336 | |
| | |
| 20 | | 2 0 2 1 BLACK ROCK ANNUAL REPORT TO SHAREHOLDERS |
| | |
Schedule of Investments (continued) December 31, 2021 | | Total International ex U.S. Index Master Portfolio (Percentages shown are based on Net Assets) |
| | | | | | | | |
| Security | | Shares | | | Value | |
| | |
| Brazil (continued) | | | | | | |
TIM SA | | | 41,040 | | | $ | 97,211 | |
TOTVS SA | | | 23,178 | | | | 117,793 | |
Ultrapar Participacoes SA | | | 45,628 | | | | 120,982 | |
Vale SA | | | 209,381 | | | | 2,917,368 | |
Via S/A(a) | | | 62,111 | | | | 58,293 | |
Vibra Energia SA | | | 56,729 | | | | 217,513 | |
WEG SA | | | 95,902 | | | | 564,878 | |
| | | | | | | | |
| | |
| | | | | | | 12,080,944 | |
| | |
| Canada — 7.3% | | | | | | |
Agnico Eagle Mines Ltd. | | | 11,562 | | | | 614,136 | |
Air Canada(a)(d) | | | 5,997 | | | | 100,175 | |
Algonquin Power & Utilities Corp.(d) | | | 29,406 | | | | 424,719 | |
Alimentation Couche-Tard, Inc. | | | 42,928 | | | | 1,798,677 | |
AltaGas Ltd. | | | 16,709 | | | | 360,744 | |
Ballard Power Systems, Inc.(a)(d) | | | 10,338 | | | | 129,864 | |
Bank of Montreal | | | 32,334 | | | | 3,481,219 | |
Bank of Nova Scotia(d) | | | 62,827 | | | | 4,447,731 | |
Barrick Gold Corp. | | | 92,287 | | | | 1,754,617 | |
BCE, Inc. | | | 5,059 | | | | 263,198 | |
BlackBerry Ltd.(a)(d) | | | 26,999 | | | | 252,285 | |
Brookfield Asset Management, Inc., Class A | | | 71,612 | | | | 4,324,630 | |
CAE, Inc.(a)(d) | | | 17,908 | | | | 451,753 | |
Cameco Corp. | | | 19,859 | | | | 432,990 | |
Canadian Apartment Properties REIT | | | 4,555 | | | | 215,912 | |
Canadian Imperial Bank of Commerce(d) | | | 23,946 | | | | 2,791,286 | |
Canadian National Railway Co. | | | 36,311 | | | | 4,460,258 | |
Canadian Natural Resources Ltd. | | | 59,218 | | | | 2,502,235 | |
Canadian Pacific Railway Ltd.(d) | | | 46,735 | | | | 3,361,358 | |
Canadian Tire Corp. Ltd., Class A | | | 3,022 | | | | 433,465 | |
Canadian Utilities Ltd., Class A | | | 5,686 | | | | 164,923 | |
Canopy Growth Corp.(a)(d) | | | 11,307 | | | | 98,683 | |
CCL Industries, Inc., Class B | | | 6,846 | | | | 367,101 | |
Cenovus Energy Inc. | | | 67,927 | | | | 832,877 | |
CGI, Inc.(a) | | | 11,239 | | | | 993,780 | |
Constellation Software, Inc.(d) | | | 1,030 | | | | 1,911,023 | |
Dollarama, Inc.(d) | | | 15,908 | | | | 796,186 | |
Emera, Inc. | | | 12,252 | | | | 612,334 | |
Empire Co. Ltd., Class A | | | 7,280 | | | | 221,804 | |
Enbridge, Inc. | | | 105,314 | | | | 4,113,653 | |
Fairfax Financial Holdings Ltd. | | | 1,310 | | | | 644,401 | |
First Quantum Minerals Ltd. | | | 29,878 | | | | 714,975 | |
FirstService Corp. | | | 2,229 | | | | 438,064 | |
Fortis, Inc. | | | 25,070 | | | | 1,209,551 | |
Franco-Nevada Corp. | | | 9,970 | | | | 1,378,831 | |
George Weston Ltd. | | | 4,143 | | | | 480,345 | |
GFL Environmental, Inc.(d) | | | 8,820 | | | | 333,500 | |
Gildan Activewear, Inc.(d) | | | 9,332 | | | | 395,648 | |
Great-West Lifeco, Inc. | | | 13,282 | | | | 398,581 | |
Hydro One Ltd.(c) | | | 14,809 | | | | 385,283 | |
iA Financial Corp., Inc. | | | 4,390 | | | | 251,194 | |
IGM Financial, Inc. | | | 4,062 | | | | 146,495 | |
Imperial Oil Ltd.(d) | | | 11,421 | | | | 411,895 | |
Intact Financial Corp. | | | 8,420 | | | | 1,094,444 | |
Ivanhoe Mines Ltd., Class A(a) | | | 38,741 | | | | 316,066 | |
Keyera Corp.(d) | | | 10,533 | | | | 237,564 | |
Kinross Gold Corp.(d) | | | 61,690 | | | | 357,962 | |
Kirkland Lake Gold Ltd. | | | 12,917 | | | | 541,310 | |
Lightspeed Commerce, Inc.(a) | | | 6,056 | | | | 244,548 | |
Loblaw Cos. Ltd.(d) | | | 8,981 | | | | 735,832 | |
Lundin Mining Corp.(d) | | | 38,227 | | | | 298,575 | |
Magna International, Inc. | | | 13,967 | | | | 1,130,102 | |
| | | | | | | | |
| Security | | Shares | | | Value | |
| | |
| Canada (continued) | | | | | | |
Manulife Financial Corp. | | | 95,589 | | | $ | 1,821,930 | |
Metro, Inc. | | | 11,759 | | | | 625,808 | |
National Bank of Canada | | | 16,527 | | | | 1,260,021 | |
Northland Power, Inc. | | | 10,159 | | | | 304,782 | |
Nutrien Ltd. | | | 28,151 | | | | 2,115,971 | |
Nuvei Corp.(a)(c) | | | 3,298 | | | | 213,792 | |
Onex Corp.(d) | | | 4,171 | | | | 327,362 | |
Open Text Corp. | | | 12,798 | | | | 607,449 | |
Pan American Silver Corp. | | | 10,536 | | | | 262,869 | |
Parkland Corp./Canada(d) | | | 7,050 | | | | 193,785 | |
Pembina Pipeline Corp.(d) | | | 25,441 | | | | 771,707 | |
Power Corp. of Canada(d) | | | 29,613 | | | | 978,555 | |
Quebecor, Inc., Class B | | | 7,485 | | | | 168,937 | |
Restaurant Brands International, Inc. | | | 14,066 | | | | 852,889 | |
RioCan Real Estate Investment Trust(d) | | | 9,233 | | | | 167,441 | |
Ritchie Bros. Auctioneers, Inc.(d) | | | 5,096 | | | | 311,855 | |
Rogers Communications, Inc., Class B | | | 19,147 | | | | 911,675 | |
Royal Bank of Canada | | | 71,758 | | | | 7,615,725 | |
Saputo, Inc. | | | 10,865 | | | | 244,794 | |
Shaw Communications, Inc., Class B | | | 22,087 | | | | 670,319 | |
Shopify, Inc., Class A(a) | | | 5,694 | | | | 7,839,980 | |
Sun Life Financial, Inc. | | | 29,092 | | | | 1,619,327 | |
Suncor Energy Inc. | | | 78,836 | | | | 1,972,536 | |
TC Energy Corp.(d) | | | 50,615 | | | | 2,353,991 | |
Teck Resources Ltd., Class B(a)(d) | | | 22,119 | | | | 637,017 | |
TELUS Corp. | | | 20,836 | | | | 490,695 | |
TFI International, Inc. | | | 4,269 | | | | 478,788 | |
Thomson Reuters Corp. | | | 9,346 | | | | 1,117,649 | |
TMX Group Ltd. | | | 2,646 | | | | 268,271 | |
Toromont Industries Ltd. | | | 3,706 | | | | 335,047 | |
Toronto-Dominion Bank | | | 92,160 | | | | 7,065,636 | |
Tourmaline Oil Corp. | | | 16,047 | | | | 518,091 | |
West Fraser Timber Co. Ltd.(d) | | | 5,398 | | | | 514,985 | |
Wheaton Precious Metals Corp. | | | 22,151 | | | | 950,517 | |
WSP Global, Inc. | | | 5,749 | | | | 834,570 | |
| | | | | | | | |
| | |
| | | | | | | 102,283,548 | |
| | |
| Chile — 0.1% | | | | | | |
Antofagasta PLC | | | 18,127 | | | | 329,678 | |
Banco de Chile | | | 1,960,832 | | | | 153,139 | |
Banco de Credito e Inversiones SA | | | 2,407 | | | | 70,317 | |
Banco Santander Chile | | | 3,205,454 | | | | 128,802 | |
Cencosud SA | | | 73,021 | | | | 122,130 | |
Cia Cervecerias Unidas SA | | | 4,404 | | | | 36,075 | |
Empresas CMPC SA | | | 65,894 | | | | 110,442 | |
Empresas COPEC SA | | | 18,259 | | | | 141,143 | |
Enel Americas SA | | | 1,752,619 | | | | 191,512 | |
Enel Chile SA | | | 1,792,039 | | | | 62,799 | |
Falabella SA | | | 52,829 | | | | 172,314 | |
| | | | | | | | |
| | |
| | | | | | | 1,518,351 | |
| | |
| China — 9.0% | | | | | | |
360 DigiTech, Inc.(a) | | | 5,031 | | | | 115,361 | |
3SBio, Inc.(a)(c) | | | 95,500 | | | | 79,586 | |
51job, Inc., ADR(a) | | | 1,550 | | | | 75,842 | |
AAC Technologies Holdings, Inc. | | | 49,000 | | | | 193,118 | |
Addsino Co. Ltd., Class A | | | 19,000 | | | | 49,929 | |
Advanced Micro-Fabrication Equipment, Inc. China, Class A(a) | | | 5,400 | | | | 107,583 | |
AECC Aviation Power Co. Ltd., Class A | | | 7,600 | | | | 75,863 | |
Agile Group Holdings Ltd. | | | 76,000 | | | | 41,255 | |
Agora, Inc., ADR(a) | | | 3,417 | | | | 55,390 | |
Agricultural Bank of China Ltd., Class A | | | 289,800 | | | | 134,024 | |
| | |
MASTER PORTFOLIO SCHEDULE OF INVESTMENTS | | 21 |
| | |
Schedule of Investments (continued) December 31, 2021 | | Total International ex U.S. Index Master Portfolio (Percentages shown are based on Net Assets) |
| | | | | | | | |
| Security | | Shares | | | Value | |
| | |
| China (continued) | | | | | | |
Agricultural Bank of China Ltd., Class H | | | 1,322,000 | | | $ | 454,817 | |
Aier Eye Hospital Group Co. Ltd., Class A | | | 16,383 | | | | 109,066 | |
Air China Ltd., Class A(a) | | | 111,198 | | | | 159,869 | |
Air China Ltd., Class H(a) | | | 62,000 | | | | 43,301 | |
Airtac International Group | | | 8,371 | | | | 307,373 | |
Alibaba Group Holding Ltd.(a) | | | 763,252 | | | | 11,216,431 | |
Alibaba Health Information Technology Ltd.(a) | | | 214,000 | | | | 181,249 | |
A-Living Smart City Services Co. Ltd., Class H(c) | | | 28,500 | | | | 48,689 | |
Aluminum Corp. of China Ltd., Class A(a) | | | 100,100 | | | | 96,434 | |
Aluminum Corp. of China Ltd., Class H(a) | | | 164,000 | | | | 90,365 | |
Anhui Conch Cement Co. Ltd., Class A | | | 17,700 | | | | 112,325 | |
Anhui Conch Cement Co. Ltd., Class H | | | 59,500 | | | | 297,605 | |
Anhui Gujing Distillery Co. Ltd., Class B | | | 8,500 | | | | 120,964 | |
Anta Sports Products Ltd. | | | 55,000 | | | | 826,008 | |
Asymchem Laboratories Tianjin Co. Ltd., Class A | | | 2,000 | | | | 136,846 | |
Autohome, Inc., ADR | | | 3,727 | | | | 109,872 | |
AviChina Industry & Technology Co. Ltd., Class H | | | 116,000 | | | | 80,254 | |
Baidu, Inc., ADR(a)(d) | | | 13,665 | | | | 2,033,215 | |
Bank of Beijing Co. Ltd., Class A | | | 100,100 | | | | 69,918 | |
Bank of China Ltd., Class A | | | 444,200 | | | | 213,114 | |
Bank of China Ltd., Class H | | | 3,783,000 | | | | 1,360,996 | |
Bank of Communications Co. Ltd., Class A | | | 130,900 | | | | 94,953 | |
Bank of Communications Co. Ltd., Class H | | | 468,700 | | | | 283,335 | |
Bank of Hangzhou Co. Ltd., Class A | | | 70,800 | | | | 142,800 | |
Bank of Jiangsu Co. Ltd., Class A | | | 103,740 | | | | 95,153 | |
Bank of Nanjing Co. Ltd., Class A | | | 57,500 | | | | 81,019 | |
Bank of Ningbo Co. Ltd., Class A | | | 28,160 | | | | 169,535 | |
Bank of Shanghai Co. Ltd., Class A | | | 76,510 | | | | 85,800 | |
Baoshan Iron & Steel Co. Ltd., Class A | | | 75,798 | | | | 85,654 | |
BBMG Corp., Class A | | | 45,700 | | | | 20,425 | |
BeiGene Ltd., ADR(a)(d) | | | 2,347 | | | | 635,873 | |
Beijing Capital International Airport Co. Ltd., Class H(a) | | | 100,000 | | | | 61,283 | |
Beijing Enterprises Holdings Ltd. | | | 21,000 | | | | 72,453 | |
Beijing Kingsoft Office Software, Inc. | | | 3,200 | | | | 133,562 | |
Beijing Wantai Biological Pharmacy Enterprise Co. Ltd. | | | 3,300 | | | | 115,093 | |
Beijing-Shanghai High Speed Railway Co. Ltd., Class A | | | 153,824 | | | | 116,836 | |
Bilibili, Inc., ADR(a)(d) | | | 7,879 | | | | 365,586 | |
BOC Hong Kong Holdings Ltd. | | | 187,500 | | | | 614,907 | |
BOE Technology Group Co. Ltd., Class A | | | 158,600 | | | | 126,000 | |
Budweiser Brewing Co. APAC Ltd.(c) | | | 114,100 | | | | 299,964 | |
BYD Co. Ltd., Class A | | | 5,900 | | | | 248,475 | |
BYD Co. Ltd., Class H | | | 40,500 | | | | 1,369,886 | |
BYD Electronic International Co. Ltd. | | | 23,500 | | | | 86,023 | |
CanSino Biologics, Inc., Class H(a)(c) | | | 3,200 | | | | 73,982 | |
CGN Power Co. Ltd., Class H(c) | | | 546,000 | | | | 165,990 | |
Changchun High & New Technology Industry Group, Inc., Class A | | | 2,200 | | | | 93,993 | |
China Bohai Bank Co. Ltd., Class H(c) | | | 242,000 | | | | 93,106 | |
China Cinda Asset Management Co. Ltd., Class H | | | 360,000 | | | | 65,571 | |
China CITIC Bank Corp. Ltd., Class H | | | 448,000 | | | | 194,329 | |
China Coal Energy Co. Ltd. | | | 231,000 | | | | 133,549 | |
China Common Rich Renewable Energy Investments Ltd.(a)(e) | | | 11,997 | | | | — | |
China Communications Services Corp. Ltd., Class H | | | 138,000 | | | | 67,255 | |
China Conch Venture Holdings Ltd. | | | 96,000 | | | | 469,559 | |
China Construction Bank Corp., Class A | | | 83,600 | | | | 77,071 | |
China Construction Bank Corp., Class H | | | 4,885,000 | | | | 3,385,042 | |
China CSSC Holdings Ltd., Class A | | | 30,600 | | | | 119,457 | |
China Everbright Bank Co. Ltd., Class A | | | 282,300 | | | | 136,153 | |
| | | | | | | | |
| Security | | Shares | | | Value | |
| | |
| China (continued) | | | | | | |
China Evergrande Group(d) | | | 103,000 | | | $ | 21,025 | |
China Feihe Ltd.(c) | | | 213,000 | | | | 285,782 | |
China Galaxy Securities Co. Ltd., Class A | | | 57,500 | | | | 101,243 | |
China Galaxy Securities Co. Ltd., Class H | | | 132,500 | | | | 76,157 | |
China Hongqiao Group Ltd. | | | 133,000 | | | | 140,575 | |
China Huarong Asset Management Co. Ltd., Class H(a)(c)(e) | | | 320,000 | | | | 31,394 | |
China Huishan Dairy Holdings Co. Ltd.(a)(e) | | | 109,840 | | | | — | |
China International Capital Corp. Ltd., Class A | | | 6,800 | | | | 52,483 | |
China International Capital Corp. Ltd., Class H(c) | | | 59,200 | | | | 163,376 | |
China Lesso Group Holdings Ltd. | | | 39,000 | | | | 56,069 | |
China Life Insurance Co. Ltd., Class A | | | 7,300 | | | | 34,544 | |
China Life Insurance Co. Ltd., Class H | | | 415,000 | | | | 687,934 | |
China Literature Ltd.(a)(c) | | | 21,400 | | | | 134,656 | |
China Longyuan Power Group Corp. Ltd., Class H | | | 194,000 | | | | 453,149 | |
China Medical System Holdings Ltd. | | | 61,000 | | | | 101,968 | |
China Meidong Auto Holdings Ltd. | | | 36,000 | | | | 185,539 | |
China Mengniu Dairy Co. Ltd. | | | 160,000 | | | | 907,020 | |
China Merchants Bank Co. Ltd., Class A | | | 65,200 | | | | 499,670 | |
China Merchants Bank Co. Ltd., Class H | | | 189,078 | | | | 1,470,947 | |
China Merchants Securities Co. Ltd., Class A | | | 26,300 | | | | 73,027 | |
China Merchants Shekou Industrial Zone Holdings Co. Ltd., Class A | | | 32,997 | | | | 69,327 | |
China Minsheng Banking Corp. Ltd., Class A | | | 159,000 | | | | 97,556 | |
China Minsheng Banking Corp. Ltd., Class H | | | 193,680 | | | | 74,057 | |
China Molybdenum Co. Ltd., Class H | | | 213,000 | | | | 112,516 | |
China National Building Material Co. Ltd., Class H | | | 228,000 | | | | 279,924 | |
China National Nuclear Power Co. Ltd., Class A | | | 102,500 | | | | 133,819 | |
China Northern Rare Earth Group High-Tech Co. Ltd., Class A | | | 7,700 | | | | 55,496 | |
China Oilfield Services Ltd., Class H | | | 64,000 | | | | 56,140 | |
China Overseas Land & Investment Ltd. | | | 188,000 | | | | 445,334 | |
China Overseas Property Holdings Ltd. | | | 85,000 | | | | 90,147 | |
China Pacific Insurance Group Co. Ltd., Class A | | | 15,500 | | | | 66,119 | |
China Pacific Insurance Group Co. Ltd., Class H | | | 137,000 | | | | 372,212 | |
China Petroleum & Chemical Corp., Class A | | | 90,900 | | | | 60,512 | |
China Petroleum & Chemical Corp., Class H | | | 1,212,400 | | | | 564,761 | |
China Railway Group Ltd., Class H | | | 230,000 | | | | 121,706 | |
China Resources Cement Holdings Ltd. | | | 122,000 | | | | 92,272 | |
China Resources Gas Group Ltd. | | | 48,000 | | | | 271,162 | |
China Resources Land Ltd. | | | 153,111 | | | | 645,148 | |
China Resources Mixc Lifestyle Services Ltd.(c) | | | 19,400 | | | | 90,525 | |
China Shenhua Energy Co. Ltd., Class A | | | 31,800 | | | | 112,766 | |
China Shenhua Energy Co. Ltd., Class H | | | 140,000 | | | | 327,640 | |
China Southern Airlines Co. Ltd., Class H(a) | | | 120,000 | | | | 71,897 | |
China State Construction Engineering Corp. Ltd., Class A | | | 105,700 | | | | 83,175 | |
China State Construction International Holdings Ltd. | | | 70,000 | | | | 87,116 | |
China Suntien Green Energy Corp. Ltd. | | | 182,000 | | | | 141,982 | |
China Tourism Group Duty Free Corp. Ltd., Class A | | | 5,900 | | | | 203,901 | |
China Tower Corp. Ltd., Class H(c) | | | 1,886,000 | | | | 208,095 | |
China Vanke Co. Ltd., Class A | | | 62,901 | | | | 195,643 | |
China Vanke Co. Ltd., Class H | | | 86,200 | | | | 200,721 | |
China Yangtze Power Co. Ltd., Class A | | | 90,600 | | | | 323,357 | |
China Yuhua Education Corp. Ltd.(c) | | | 92,000 | | | | 32,933 | |
China Zheshang Bank Co. Ltd., Class A | | | 198,400 | | | | 109,243 | |
Chinasoft International Ltd. | | | 150,000 | | | | 195,607 | |
Chindata Group Holdings Ltd., ADR(a)(d) | | | 8,939 | | | | 58,908 | |
Chongqing Changan Automobile Co. Ltd., Class A | | | 42,700 | | | | 102,006 | |
Chongqing Zhifei Biological Products Co. Ltd., Class A | | | 3,700 | | | | 72,487 | |
| | |
| 22 | | 2 0 2 1 BLACK ROCK ANNUAL REPORT TO SHAREHOLDERS |
| | |
Schedule of Investments (continued) December 31, 2021 | | Total International ex U.S. Index Master Portfolio (Percentages shown are based on Net Assets) |
| | | | | | | | |
| Security | | Shares | | | Value | |
| | |
| China (continued) | | | | | | |
Chow Tai Fook Jewellery Group Ltd. | | | 86,000 | | | $ | 154,962 | |
CIFI Ever Sunshine Services Group Ltd. | | | 58,000 | | | | 90,078 | |
CIFI Holdings Group Co. Ltd. | | | 178,500 | | | | 107,363 | |
CITIC Ltd. | | | 315,000 | | | | 311,641 | |
CITIC Securities Co. Ltd., Class A | | | 32,100 | | | | 133,408 | |
CITIC Securities Co. Ltd., Class H | | | 103,000 | | | | 269,022 | |
Contemporary Amperex Technology Co. Ltd., Class A | | | 8,400 | | | | 775,692 | |
COSCO SHIPPING Energy Transportation Co. Ltd., Class A | | | 78,900 | | | | 73,488 | |
COSCO SHIPPING Holdings Co. Ltd., Class A(a) | | | 52,777 | | | | 155,803 | |
COSCO SHIPPING Holdings Co. Ltd., Class H(a) | | | 148,850 | | | | 288,614 | |
Country Garden Holdings Co. Ltd. | | | 447,270 | | | | 397,209 | |
Country Garden Services Holdings Co. Ltd. | | | 80,000 | | | | 480,313 | |
CRRC Corp. Ltd., Class A | | | 206,600 | | | | 197,950 | |
CSC Financial Co. Ltd., Class A | | | 14,300 | | | | 65,812 | |
CSPC Pharmaceutical Group Ltd. | | | 422,400 | | | | 459,946 | |
Dada Nexus Ltd., ADR(a) | | | 5,547 | | | | 72,999 | |
Dali Foods Group Co. Ltd.(c) | | | 175,500 | | | | 91,829 | |
Daqo New Energy Corp., ADR(a) | | | 2,904 | | | | 117,089 | |
DiDi Global, Inc.(a)(d) | | | 15,254 | | | | 75,965 | |
Dongfeng Motor Group Co. Ltd., Class H | | | 138,000 | | | | 114,719 | |
Dongyue Group Ltd. | | | 93,000 | | | | 145,273 | |
East Money Information Co. Ltd., Class A | | | 59,896 | | | | 350,043 | |
Ecovacs Robotics Co. Ltd., Class A | | | 1,800 | | | | 42,739 | |
Enn Energy Holdings Ltd. | | | 43,800 | | | | 825,705 | |
Eve Energy Co. Ltd., Class A | | | 4,600 | | | | 85,543 | |
Everbright Securities Co. Ltd., Class A | | | 28,900 | | | | 67,923 | |
Fangda Carbon New Material Co. Ltd., Class A | | | 10,420 | | | | 17,746 | |
Flat Glass Group Co. Ltd., Class A | | | 18,000 | | | | 163,831 | |
Flat Glass Group Co. Ltd., Class H | | | 16,000 | | | | 81,450 | |
Focus Media Information Technology Co. Ltd., Class A | | | 37,300 | | | | 48,120 | |
Foshan Haitian Flavouring & Food Co. Ltd., Class A | | | 9,828 | | | | 162,349 | |
Fosun International Ltd. | | | 131,500 | | | | 141,929 | |
Founder Securities Co. Ltd., Class A | | | 107,800 | | | | 133,066 | |
Foxconn Industrial Internet Co. Ltd., Class A | | | 3,500 | | | | 6,563 | |
Futu Holdings Ltd., ADR(a) | | | 2,769 | | | | 119,898 | |
Fuyao Glass Industry Group Co. Ltd., Class A | | | 13,000 | | | | 96,301 | |
Fuyao Glass Industry Group Co. Ltd., Class H(c) | | | 22,400 | | | | 115,842 | |
Ganfeng Lithium Co. Ltd., Class A | | | 7,700 | | | | 173,394 | |
Ganfeng Lithium Co. Ltd., Class H(c) | | | 9,400 | | | | 148,017 | |
GDS Holdings Ltd., ADR(a)(d) | | | 4,184 | | | | 197,317 | |
Geely Automobile Holdings Ltd. | | | 285,000 | | | | 778,567 | |
Genscript Biotech Corp.(a) | | | 68,000 | | | | 300,862 | |
GF Securities Co. Ltd., Class H | | | 93,600 | | | | 178,496 | |
Gigadevice Semiconductor Beijing, Inc., Class A | | | 980 | | | | 27,118 | |
GoerTek, Inc., Class A | | | 17,700 | | | | 150,842 | |
GOME Retail Holdings Ltd.(a)(d) | | | 627,000 | | | | 53,098 | |
Gotion High-tech Co. Ltd., Class A(a) | | | 16,100 | | | | 129,962 | |
Great Wall Motor Co. Ltd., Class A | | | 13,605 | | | | 103,760 | |
Great Wall Motor Co. Ltd., Class H | | | 144,000 | | | | 494,700 | |
Greenland Holdings Corp. Ltd., Class A | | | 25,198 | | | | 17,207 | |
Greentown China Holdings Ltd. | | | 83,500 | | | | 134,610 | |
Greentown Service Group Co. Ltd. | | | 94,000 | | | | 86,797 | |
Guangdong Haid Group Co. Ltd., Class A | | | 10,700 | | | | 123,360 | |
Guangzhou Automobile Group Co. Ltd., Class H | | | 134,400 | | | | 132,643 | |
Guangzhou R&F Properties Co. Ltd., Class H | | | 34,400 | | | | 12,801 | |
Guangzhou Shiyuan Electronic Technology Co. Ltd., Class A | | | 5,700 | | | | 73,041 | |
Guangzhou Tinci Materials Technology Co. Ltd., Class A | | | 3,600 | | | | 64,921 | |
| | | | | | | | |
| Security | | Shares | | | Value | |
| | |
| China (continued) | | | | | | |
Guotai Junan Securities Co. Ltd., Class A | | | 55,544 | | | $ | 156,362 | |
Haidilao International Holding Ltd.(c)(d) | | | 66,000 | | | | 149,211 | |
Haier Smart Home Co. Ltd., Class A | | | 41,800 | | | | 196,576 | |
Haier Smart Home Co. Ltd., Class H | | | 112,000 | | | | 473,685 | |
Haitian International Holdings Ltd. | | | 51,000 | | | | 141,676 | |
Haitong Securities Co. Ltd., Class A | | | 45,000 | | | | 86,810 | |
Haitong Securities Co. Ltd., Class H | | | 144,400 | | | | 128,018 | |
Hangzhou First Applied Material Co. Ltd., Class A | | | 800 | | | | 16,410 | |
Hangzhou Tigermed Consulting Co. Ltd., Class H(c) | | | 6,200 | | | | 78,668 | |
Hansoh Pharmaceutical Group Co. Ltd.(c) | | | 56,000 | | | | 136,737 | |
Hello Group, Inc., ADR | | | 7,937 | | | | 71,274 | |
Henan Shuanghui Investment & Development Co. Ltd., Class A | | | 14,800 | | | | 73,448 | |
Hengan International Group Co. Ltd. | | | 39,000 | | | | 200,924 | |
Hengli Petrochemical Co. Ltd., Class A | | | 26,600 | | | | 96,184 | |
HengTen Networks Group Ltd.(a)(d) | | | 124,000 | | | | 47,013 | |
Hithink RoyalFlush Information Network Co. Ltd., Class A | | | 4,600 | | | | 104,600 | |
Hua Hong Semiconductor Ltd.(a)(c) | | | 21,000 | | | | 115,980 | |
Hualan Biological Engineering, Inc., Class A | | | 10,800 | | | | 49,448 | |
Huaneng Power International, Inc., Class A | | | 97,400 | | | | 148,456 | |
Huaneng Power International, Inc., Class H | | | 192,000 | | | | 128,232 | |
Huatai Securities Co. Ltd., Class A | | | 31,600 | | | | 88,310 | |
Huatai Securities Co. Ltd., Class H(c) | | | 68,800 | | | | 114,601 | |
Huaxia Bank Co. Ltd., Class A | | | 132,899 | | | | 117,086 | |
Huayu Automotive Systems Co. Ltd., Class A | | | 8,300 | | | | 36,951 | |
Huazhu Group Ltd., ADR(a)(d) | | | 8,961 | | | | 334,604 | |
Hygeia Healthcare Holdings Co. Ltd.(c) | | | 21,600 | | | | 135,288 | |
Iflytek Co. Ltd., Class A | | | 19,900 | | | | 164,362 | |
I-Mab, ADR(a) | | | 2,138 | | | | 101,320 | |
Imeik Technology Development Co. Ltd. | | | 1,400 | | | | 118,058 | |
Industrial & Commercial Bank of China Ltd., Class A | | | 231,800 | | | | 168,811 | |
Industrial & Commercial Bank of China Ltd., Class H | | | 2,776,000 | | | | 1,565,894 | |
Industrial Bank Co. Ltd., Class A | | | 73,700 | | | | 220,683 | |
Inner Mongolia BaoTou Steel Union Co. Ltd., Class A(a) | | | 191,700 | | | | 84,285 | |
Inner Mongolia Yili Industrial Group Co. Ltd., Class A | | | 19,400 | | | | 126,584 | |
Innovent Biologics, Inc.(a)(c) | | | 64,000 | | | | 396,312 | |
iQIYI, Inc., ADR(a) | | | 11,889 | | | | 54,214 | |
JA Solar Technology Co. Ltd. | | | 9,400 | | | | 136,864 | |
JD Health International, Inc.(a)(c) | | | 12,850 | | | | 101,366 | |
JD.com, Inc., ADR(a) | | | 8,570 | | | | 600,500 | |
JD.com, Inc., Class A(a) | | | 72,756 | | | | 2,506,615 | |
Jiangsu Expressway Co. Ltd., Class H | | | 26,000 | | | | 26,629 | |
Jiangsu Hengli Hydraulic Co. Ltd., Class A | | | 6,600 | | | | 84,834 | |
Jiangsu Hengrui Medicine Co. Ltd., Class A | | | 21,312 | | | | 170,236 | |
Jiangsu Yanghe Brewery Joint-Stock Co. Ltd., Class A | | | 5,200 | | | | 134,934 | |
Jiangsu Zhongtian Technology Co. Ltd. | | | 45,000 | | | | 120,031 | |
Jiangxi Copper Co. Ltd., Class A | | | 43,400 | | | | 153,269 | |
Jiangxi Copper Co. Ltd., Class H | | | 30,000 | | | | 48,196 | |
Jiangxi Zhengbang Technology Co. Ltd., Class A | | | 28,700 | | | | 43,609 | |
Jinxin Fertility Group Ltd.(a)(c) | | | 68,000 | | | | 76,021 | |
Jiumaojiu International Holdings Ltd.(c) | | | 34,000 | | | | 59,786 | |
JOYY, Inc., ADR(d) | | | 2,689 | | | | 122,161 | |
Kanzhun Ltd., ADR(a) | | | 4,535 | | | | 158,181 | |
KE Holdings, Inc., ADR(a) | | | 18,653 | | | | 375,298 | |
Kingboard Holdings Ltd. | | | 35,000 | | | | 170,522 | |
Kingdee International Software Group Co.
Ltd.(a) | | | 154,000 | | | | 474,036 | |
| | |
MASTER PORTFOLIO SCHEDULE OF INVESTMENTS | | 23 |
| | |
Schedule of Investments (continued) December 31, 2021 | | Total International ex U.S. Index Master Portfolio (Percentages shown are based on Net Assets) |
| | | | | | | | |
| Security | | Shares | | | Value | |
| | |
| China (continued) | | | | | | |
Kingfa Sci & Tech Co. Ltd., Class A | | | 25,700 | | | $ | 50,855 | |
Kingsoft Cloud Holdings Ltd., ADR(a)(d) | | | 3,200 | | | | 50,400 | |
Kingsoft Corp. Ltd. | | | 49,000 | | | | 215,520 | |
Kuaishou Technology(a)(c) | | | 28,300 | | | | 262,382 | |
Kunlun Energy Co. Ltd. | | | 268,000 | | | | 251,472 | |
Kweichow Moutai Co. Ltd., Class A | | | 3,716 | | | | 1,197,143 | |
KWG Group Holdings Ltd. | | | 74,000 | | | | 48,463 | |
Lenovo Group Ltd. | | | 442,000 | | | | 507,984 | |
Lens Technology Co. Ltd., Class A | | | 12,300 | | | | 44,477 | |
Li Auto, Inc., ADR(a)(d) | | | 28,498 | | | | 914,786 | |
Li Ning Co. Ltd. | | | 120,500 | | | | 1,321,889 | |
Lingyi iTech Guangdong Co., Class A(a) | | | 7,000 | | | | 8,115 | |
Logan Group Co. Ltd. | | | 72,000 | | | | 55,033 | |
Longfor Group Holdings Ltd.(c) | | | 91,500 | | | | 431,583 | |
LONGi Green Energy Technology Co. Ltd., Class A | | | 16,940 | | | | 229,771 | |
Luxshare Precision Industry Co. Ltd., Class A | | | 18,129 | | | | 140,368 | |
Luzhou Laojiao Co. Ltd., Class A | | | 3,900 | | | | 155,836 | |
Mango Excellent Media Co. Ltd., Class A | | | 11,800 | | | | 106,196 | |
Maxscend Microelectronics Co. Ltd., Class A | | | 2,340 | | | | 120,416 | |
Meituan, Class B(a)(c) | | | 205,700 | | | | 5,948,324 | |
Metallurgical Corp. of China Ltd., Class A | | | 138,300 | | | | 83,527 | |
Microport Scientific Corp. | | | 37,000 | | | | 134,865 | |
Ming Yuan Cloud Group Holdings Ltd. | | | 19,000 | | | | 43,333 | |
Minth Group Ltd. | | | 32,000 | | | | 140,972 | |
MMG Ltd.(a) | | | 232,000 | | | | 74,628 | |
Muyuan Foods Co. Ltd., Class A | | | 15,946 | | | | 134,008 | |
Nanjing Securities Co. Ltd., Class A | | | 33,000 | | | | 51,480 | |
NARI Technology Co. Ltd., Class A | | | 18,240 | | | | 114,979 | |
NAURA Technology Group Co. Ltd., Class A | | | 1,100 | | | | 60,101 | |
NetEase, Inc. | | | 82,840 | | | | 1,674,911 | |
NetEase, Inc., ADR(d) | | | 3,837 | | | | 390,530 | |
New China Life Insurance Co. Ltd., Class A | | | 7,700 | | | | 47,111 | |
New China Life Insurance Co. Ltd., Class H | | | 43,200 | | | | 115,586 | |
New Hope Liuhe Co. Ltd., Class A(a) | | | 12,700 | | | | 30,396 | |
New Oriental Education & Technology Group, Inc., ADR(a) | | | 81,222 | | | | 170,566 | |
Ningxia Baofeng Energy Group Co. Ltd., Class A | | | 5,000 | | | | 13,657 | |
NIO, Inc., ADR(a)(d) | | | 70,611 | | | | 2,236,956 | |
Noah Holdings Ltd., ADR(a)(d) | | | 1,707 | | | | 52,388 | |
Nongfu Spring Co. Ltd., Class H(c) | | | 100,400 | | | | 663,168 | |
Ovctek China, Inc. | | | 10,800 | | | | 97,613 | |
People’s Insurance Co. Group of China Ltd., Class H | | | 381,000 | | | | 115,375 | |
PetroChina Co. Ltd., Class H | | | 1,084,000 | | | | 480,099 | |
Pharmaron Beijing Co. Ltd., Class H(c) | | | 8,800 | | | | 135,895 | |
PICC Property & Casualty Co. Ltd., Class H | | | 320,298 | | | | 261,825 | |
Pinduoduo, Inc., ADR(a)(d) | | | 21,134 | | | | 1,232,112 | |
Ping An Bank Co. Ltd., Class A | | | 47,100 | | | | 122,077 | |
Ping An Healthcare and Technology Co.
Ltd.(a)(c) | | | 25,800 | | | | 94,044 | |
Ping An Insurance Group Co. of China Ltd., Class A | | | 49,000 | | | | 388,702 | |
Ping An Insurance Group Co. of China Ltd., Class H | | | 309,000 | | | | 2,226,689 | |
Poly Developments and Holdings Group Co. Ltd., Class A | | | 43,000 | | | | 105,716 | |
Postal Savings Bank of China Co. Ltd., Class A | | | 132,700 | | | | 106,494 | |
Postal Savings Bank of China Co. Ltd., Class H(c) | | | 453,000 | | | | 318,118 | |
Power Construction Corp. of China Ltd., Class A | | | 63,300 | | | | 80,493 | |
Powerlong Real Estate Holdings Ltd. | | | 182,000 | | | | 95,289 | |
RLX Technology, Inc., ADR(a) | | | 33,312 | | | | 129,917 | |
Rongsheng Petro Chemical Co. Ltd., Class A | | | 35,850 | | | | 102,541 | |
SAIC Motor Corp. Ltd., Class A | | | 30,300 | | | | 98,387 | |
Sangfor Technologies, Inc., Class A | | | 3,500 | | | | 105,214 | |
| | | | | | | | |
| Security | | Shares | | | Value | |
| | |
| China (continued) | | | | | | |
Sany Heavy Equipment International Holdings Co. Ltd. | | | 28,000 | | | $ | 27,129 | |
Sany Heavy Industry Co. Ltd., Class A | | | 32,700 | | | | 117,357 | |
Seazen Group Ltd. | | | 108,000 | | | | 73,048 | |
Seazen Holdings Co. Ltd., Class A | | | 17,500 | | | | 80,279 | |
SF Holding Co. Ltd., Class A | | | 15,900 | | | | 172,540 | |
SG Micro Corp., Class A | | | 2,500 | | | | 121,600 | |
Shaanxi Coal Industry Co. Ltd., Class A | | | 27,700 | | | | 53,250 | |
Shandong Gold Mining Co. Ltd., Class A | | | 29,204 | | | | 86,575 | |
Shandong Weigao Group Medical Polymer Co. Ltd., Class H | | | 132,000 | | | | 164,564 | |
Shanghai Baosight Software Co. Ltd. | | | 47,800 | | | | 230,635 | |
Shanghai Fosun Pharmaceutical Group Co. Ltd., Class A | | | 10,562 | | | | 81,218 | |
Shanghai Fosun Pharmaceutical Group Co. Ltd., Class H | | | 21,500 | | | | 94,659 | |
Shanghai International Airport Co. Ltd., Class A(a) | | | 11,200 | | | | 82,167 | |
Shanghai Lujiazui Finance & Trade Zone Development Co. Ltd., Class B | | | 60,800 | | | | 55,420 | |
Shanghai Pharmaceuticals Holding Co. Ltd., Class H | | | 62,000 | | | | 117,648 | |
Shanghai Pudong Development Bank Co. Ltd., Class A | | | 94,987 | | | | 127,455 | |
Shanghai Putailai New Energy Technology Co. Ltd., Class A | | | 4,700 | | | | 118,735 | |
Shanxi Xinghuacun Fen Wine Factory Co. Ltd., Class A | | | 2,800 | | | | 138,988 | |
Shengyi Technology Co. Ltd., Class A | | | 17,700 | | | | 65,546 | |
Shenwan Hongyuan Group Co. Ltd., Class A | | | 127,900 | | | | 103,021 | |
Shenzhen Goodix Technology Co. Ltd., Class A | | | 2,100 | | | | 35,640 | |
Shenzhen Inovance Technology Co. Ltd., Class A | | | 9,750 | | | | 105,313 | |
Shenzhen International Holdings Ltd. | | | 40,500 | | | | 42,073 | |
Shenzhen Kangtai Biological Products Co. Ltd., Class A | | | 4,700 | | | | 72,774 | |
Shenzhen Mindray Bio-Medical Electronics Co. Ltd., Class A | | | 4,300 | | | | 257,622 | |
Shenzhen Transsion Holdings Co. Ltd. | | | 6,290 | | | | 155,524 | |
Shenzhou International Group Holdings Ltd. | | | 40,800 | | | | 790,038 | |
Shimao Group Holdings Ltd. | | | 51,000 | | | | 33,389 | |
Shimao Services Holdings Ltd.(c) | | | 57,000 | | | | 39,675 | |
Silergy Corp. | | | 4,000 | | | | 723,985 | |
Sinopharm Group Co. Ltd., Class H | | | 56,800 | | | | 123,622 | |
Sinotruk Hong Kong Ltd. | | | 49,500 | | | | 76,213 | |
Smoore International Holdings Ltd.(c) | | | 96,000 | | | | 490,218 | |
Sunac China Holdings Ltd. | | | 130,000 | | | | 196,655 | |
Sunac Services Holdings Ltd.(a)(c) | | | 45,000 | | | | 45,932 | |
Sungrow Power Supply Co. Ltd., Class A | | | 3,800 | | | | 87,180 | |
Suning.com Co. Ltd., Class A(a) | | | 59,200 | | | | 38,365 | |
Sunny Optical Technology Group Co. Ltd. | | | 35,300 | | | | 1,118,112 | |
Sunwoda Electronic Co. Ltd. | | | 15,800 | | | | 104,831 | |
TAL Education Group, ADR(a)(d) | | | 19,208 | | | | 75,487 | |
TBEA Co. Ltd. | | | 36,500 | | | | 121,357 | |
TCL Technology Group Corp., Class A | | | 78,200 | | | | 75,932 | |
Tencent Holdings Ltd. | | | 292,100 | | | | 17,044,357 | |
Tencent Music Entertainment Group, ADR(a)(d) | | | 28,714 | | | | 196,691 | |
Thunder Software Technology Co. Ltd., Class A | | | 6,000 | | | | 130,515 | |
Tianjin Zhonghuan Semiconductor Co. Ltd., Class A | | | 18,100 | | | | 118,790 | |
Tingyi Cayman Islands Holding Corp | | | 88,000 | | | | 180,980 | |
Tongcheng-Elong Holdings Ltd.(a) | | | 52,400 | | | | 97,134 | |
Tongwei Co. Ltd., Class A | | | 11,600 | | | | 82,018 | |
Topchoice Medical Corp., Class A(a) | | | 900 | | | | 28,169 | |
Topsports International Holdings Ltd.(c) | | | 81,000 | | | | 82,040 | |
| | |
| 24 | | 2 0 2 1 BLACK ROCK ANNUAL REPORT TO SHAREHOLDERS |
| | |
Schedule of Investments (continued) December 31, 2021 | | Total International ex U.S. Index Master Portfolio (Percentages shown are based on Net Assets) |
| | | | | | | | |
| Security | | Shares | | | Value | |
| | |
| China (continued) | | | | | | |
TravelSky Technology Ltd., Class H | | | 59,000 | | | $ | 99,272 | |
Trip.com Group Ltd., ADR(a) | | | 24,955 | | | | 614,392 | |
Tsingtao Brewery Co. Ltd., Class H | | | 26,000 | | | | 243,304 | |
Unigroup Guoxin Microelectronics Co. Ltd., Class A | | | 4,900 | | | | 173,422 | |
Uni-President China Holdings Ltd. | | | 82,000 | | | | 79,487 | |
Unisplendour Corp. Ltd., Class A | | | 20,160 | | | | 72,526 | |
Venus MedTech Hangzhou, Inc., Class H(a)(c) | | | 15,500 | | | | 59,092 | |
Vipshop Holdings Ltd., ADR(a) | | | 23,411 | | | | 196,652 | |
Vnet Group, Inc., ADR(a)(d) | | | 3,916 | | | | 35,361 | |
Walvax Biotechnology Co. Ltd., Class A | | | 8,600 | | | | 75,822 | |
Wanhua Chemical Group Co. Ltd., Class A | | | 14,700 | | | | 233,436 | |
Want Want China Holdings Ltd.(d) | | | 192,000 | | | | 176,215 | |
Weibo Corp., ADR(a)(d) | | | 2,166 | | | | 67,103 | |
Weichai Power Co. Ltd., Class A | | | 33,300 | | | | 93,609 | |
Weichai Power Co. Ltd., Class H | | | 96,800 | | | | 189,845 | |
Weimob, Inc.(a)(c) | | | 80,000 | | | | 81,016 | |
Wens Foodstuffs Group Co. Ltd., Class A(a) | | | 20,160 | | | | 61,132 | |
Will Semiconductor Co. Ltd., Class A | | | 4,100 | | | | 200,391 | |
Wilmar International Ltd. | | | 97,900 | | | | 301,294 | |
Wingtech Technology Co. Ltd., Class A | | | 4,238 | | | | 86,181 | |
Wuchan Zhongda Group Co. Ltd., Class A | | | 25,699 | | | | 23,958 | |
Wuhu Sanqi Interactive Entertainment Network Technology Group Co. Ltd., Class A | | | 14,800 | | | | 62,913 | |
Wuliangye Yibin Co. Ltd., Class A | | | 11,500 | | | | 402,712 | |
WuXi AppTec Co. Ltd., Class A | | | 12,936 | | | | 241,367 | |
WuXi AppTec Co. Ltd., Class H(c) | | | 13,641 | | | | 235,693 | |
Wuxi Biologics Cayman, Inc.(a)(c) | | | 188,500 | | | | 2,231,632 | |
Xiaomi Corp., Class B(a)(c) | | | 713,800 | | | | 1,730,293 | |
Xinjiang Goldwind Science & Technology Co. Ltd., Class A | | | 64,400 | | | | 166,962 | |
Xinjiang Goldwind Science & Technology Co. Ltd., Class H | | | 15,800 | | | | 30,845 | |
Xinyi Solar Holdings Ltd. | | | 296,000 | | | | 502,532 | |
XPeng, Inc., ADR(a)(d) | | | 19,241 | | | | 968,400 | |
Yadea Group Holdings Ltd.(c) | | | 68,000 | | | | 132,525 | |
Yanzhou Coal Mining Co. Ltd., Class H | | | 108,000 | | | | 214,651 | |
Yihai International Holding Ltd.(d) | | | 23,000 | | | | 106,356 | |
Yihai Kerry Arawana Holdings Co. Ltd., Class A | | | 12,100 | | | | 119,929 | |
Yonghui Superstores Co. Ltd., Class A | | | 27,898 | | | | 17,768 | |
Yonyou Network Technology Co. Ltd., Class A | | | 7,800 | | | | 44,025 | |
Yum China Holdings, Inc.(d) | | | 22,092 | | | | 1,101,065 | |
Yunnan Baiyao Group Co. Ltd., Class A | | | 8,900 | | | | 146,600 | |
Yunnan Energy New Material Co. Ltd., Class A | | | 2,300 | | | | 90,486 | |
Zai Lab Ltd., ADR(a) | | | 3,905 | | | | 245,429 | |
Zhangzhou Pientzehuang Pharmaceutical Co. Ltd., Class A | | | 1,599 | | | | 110,130 | |
Zhejiang Chint Electrics Co. Ltd., Class A | | | 8,900 | | | | 75,422 | |
Zhejiang Expressway Co. Ltd., Class H | | | 54,000 | | | | 48,131 | |
Zhejiang Huayou Cobalt Co. Ltd., Class A | | | 2,900 | | | | 50,364 | |
ZhongAn Online P&C Insurance Co. Ltd., Class H(a)(c) | | | 23,500 | | | | 81,871 | |
Zhongsheng Group Holdings Ltd. | | | 30,000 | | | | 234,099 | |
Zhuzhou CRRC Times Electric Co. Ltd., Class H | | | 28,400 | | | | 164,615 | |
Zijin Mining Group Co. Ltd., Class A | | | 145,900 | | | | 223,239 | |
Zijin Mining Group Co. Ltd., Class H | | | 218,000 | | | | 260,355 | |
Zoomlion Heavy Industry Science and Technology Co. Ltd., Class H | | | 105,800 | | | | 66,646 | |
ZTE Corp., Class H | | | 14,400 | | | | 39,456 | |
ZTO Express Cayman, Inc., ADR(d) | | | 19,024 | | | | 536,857 | |
| | | | | | | | |
| | | | | | | 126,809,119 | |
| | | | | | | | |
| Security | | Shares | | | Value | |
| | |
| Colombia — 0.0% | | | | | | |
Bancolombia SA | | | 7,812 | | | $ | 66,669 | |
Ecopetrol SA | | | 242,372 | | | | 160,090 | |
Grupo de Inversiones Suramericana SA | | | 15,087 | | | | 111,316 | |
Interconexion Electrica SA ESP | | | 24,518 | | | | 134,905 | |
| | | | | | | | |
| | |
| | | | | | | 472,980 | |
| | |
| Czech Republic — 0.0% | | | | | | |
CEZ A/S | | | 10,005 | | | | 378,690 | |
Komercni banka A/S | | | 3,800 | | | | 162,473 | |
Moneta Money Bank A/S(c) | | | 25,594 | | | | 109,817 | |
| | | | | | | | |
| | |
| | | | | | | 650,980 | |
| | |
| Denmark — 1.7% | | | | | | |
Ambu A/S, B Shares | | | 7,759 | | | | 204,789 | |
AP Moeller - Maersk A/S, Class A | | | 197 | | | | 653,560 | |
AP Moeller - Maersk A/S, Class B | | | 287 | | | | 1,024,393 | |
Carlsberg A/S, Class B | | | 4,439 | | | | 766,383 | |
Chr Hansen Holding A/S | | | 5,169 | | | | 407,578 | |
Coloplast A/S, Class B | | | 5,770 | | | | 1,015,954 | |
Danske Bank A/S | | | 33,905 | | | | 585,336 | |
Demant A/S(a) | | | 6,675 | | | | 341,801 | |
DSV A/S | | | 10,634 | | | | 2,478,022 | |
Genmab A/S(a) | | | 3,415 | | | | 1,363,107 | |
GN Store Nord A/S | | | 5,785 | | | | 362,984 | |
Novo Nordisk A/S, Class B | | | 84,783 | | | | 9,523,324 | |
Novozymes A/S, B Shares | | | 9,670 | | | | 794,002 | |
Orsted A/S(c) | | | 9,392 | | | | 1,202,806 | |
Pandora A/S | | | 4,712 | | | | 586,130 | |
Rockwool International A/S, B Shares | | | 484 | | | | 211,352 | |
Tryg A/S(d) | | | 20,860 | | | | 514,775 | |
Vestas Wind Systems A/S | | | 52,318 | | | | 1,593,351 | |
| | | | | | | | |
| | |
| | | | | | | 23,629,647 | |
| | |
| Egypt — 0.0% | | | | | | |
Commercial International Bank Egypt SAE(a) | | | 67,142 | | | | 225,972 | |
| | | | | | | | |
| | |
| Finland — 0.8% | | | | | | |
Elisa OYJ | | | 8,704 | | | | 535,957 | |
Fortum OYJ | | | 21,500 | | | | 659,414 | |
Kesko OYJ, B Shares | | | 12,611 | | | | 420,335 | |
Kone OYJ, Class B | | | 18,652 | | | | 1,338,443 | |
Neste OYJ | | | 21,294 | | | | 1,048,000 | |
Nokia OYJ(a) | | | 275,276 | | | | 1,743,511 | |
Nordea Bank Abp | | | 160,628 | | | | 1,959,428 | |
Orion OYJ, Class B | | | 5,829 | | | | 242,129 | |
Sampo OYJ, A Shares | | | 27,051 | | | | 1,353,849 | |
Stora Enso OYJ, R Shares | | | 28,894 | | | | 530,302 | |
UPM-Kymmene OYJ | | | 26,372 | | | | 1,003,418 | |
Wartsila OYJ Abp | | | 20,628 | | | | 289,324 | |
| | | | | | | | |
| | |
| | | | | | | 11,124,110 | |
| | |
| France — 7.0% | | | | | | |
Accor SA(a) | | | 10,412 | | | | 337,488 | |
Aeroports de Paris(a)(d) | | | 1,364 | | | | 175,961 | |
Air Liquide SA | | | 24,384 | | | | 4,252,674 | |
Airbus SE(a) | | | 29,538 | | | | 3,779,205 | |
Alstom SA | | | 17,506 | | | | 621,646 | |
Amundi SA(c) | | | 2,625 | | | | 216,522 | |
Arkema SA | | | 2,938 | | | | 414,683 | |
AXA SA | | | 95,967 | | | | 2,856,290 | |
BioMerieux | | | 1,981 | | | | 281,695 | |
BNP Paribas SA | | | 57,435 | | | | 3,971,115 | |
Bollore SA | | | 36,855 | | | | 206,151 | |
Bouygues SA | | | 12,024 | | | | 430,411 | |
| | |
MASTER PORTFOLIO SCHEDULE OF INVESTMENTS | | 25 |
| | |
Schedule of Investments (continued) December 31, 2021 | | Total International ex U.S. Index Master Portfolio (Percentages shown are based on Net Assets) |
| | | | | | | | |
| Security | | Shares | | | Value | |
| | |
| France (continued) | | | | | | |
Bureau Veritas SA | | | 14,829 | | | $ | 492,307 | |
Capgemini SE | | | 7,964 | | | | 1,951,821 | |
Carrefour SA | | | 37,003 | | | | 678,394 | |
Cie de Saint-Gobain | | | 24,162 | | | | 1,699,713 | |
Cie Generale des Etablissements Michelin SCA | | | 8,485 | | | | 1,389,709 | |
CNP Assurances | | | 7,565 | | | | 187,121 | |
Covivio | | | 2,326 | | | | 190,931 | |
Credit Agricole SA | | | 63,262 | | | | 901,946 | |
Danone SA | | | 33,275 | | | | 2,068,356 | |
Dassault Aviation SA | | | 1,270 | | | | 137,360 | |
Dassault Systemes SE | | | 32,447 | | | | 1,925,578 | |
Edenred | | | 11,567 | | | | 534,145 | |
Eiffage SA | | | 3,691 | | | | 380,556 | |
Electricite de France SA | | | 23,627 | | | | 277,884 | |
Engie SA | | | 86,986 | | | | 1,287,861 | |
EssilorLuxottica SA | | | 14,211 | | | | 3,025,192 | |
Eurazeo SE | | | 2,062 | | | | 179,900 | |
Faurecia SE | | | 5,305 | | | | 252,391 | |
Gecina SA | | | 2,235 | | | | 312,745 | |
Getlink SE | | | 24,371 | | | | 403,639 | |
Hermes International | | | 1,629 | | | | 2,846,471 | |
Ipsen SA | | | 1,966 | | | | 179,908 | |
Kering SA | | | 3,731 | | | | 2,993,574 | |
Klepierre SA | | | 10,557 | | | | 249,802 | |
La Francaise des Jeux SAEM(c) | | | 3,884 | | | | 172,130 | |
Legrand SA | | | 13,210 | | | | 1,547,169 | |
L’Oreal SA | | | 12,735 | | | | 6,072,209 | |
LVMH Moet Hennessy Louis Vuitton SE | | | 14,184 | | | | 11,722,134 | |
Orange SA | | | 107,483 | | | | 1,148,153 | |
Orpea SA | | | 2,713 | | | | 272,082 | |
Pernod Ricard SA | | | 11,088 | | | | 2,667,525 | |
Publicis Groupe SA | | | 12,145 | | | | 818,258 | |
Remy Cointreau SA | | | 958 | | | | 232,860 | |
Renault SA(a) | | | 9,369 | | | | 325,014 | |
Safran SA | | | 18,005 | | | | 2,204,229 | |
Sanofi | | | 57,743 | | | | 5,794,161 | |
Sartorius Stedim Biotech | | | 1,419 | | | | 779,323 | |
Schneider Electric SE | | | 27,523 | | | | 5,410,895 | |
SEB SA | | | 1,139 | | | | 177,491 | |
Societe Generale SA | | | 39,306 | | | | 1,350,897 | |
Sodexo SA | | | 4,043 | | | | 354,442 | |
Suez SA | | | 18,443 | | | | 415,957 | |
Teleperformance | | | 2,820 | | | | 1,260,754 | |
Thales SA | | | 5,829 | | | | 495,853 | |
TotalEnergies SE | | | 126,931 | | | | 6,460,814 | |
Ubisoft Entertainment SA(a) | | | 4,663 | | | | 227,462 | |
Unibail-Rodamco-Westfield(a)(d) | | | 5,970 | | | | 417,776 | |
Valeo | | | 13,865 | | | | 418,118 | |
Veolia Environnement SA | | | 34,698 | | | | 1,274,245 | |
Vinci SA | | | 27,652 | | | | 2,920,460 | |
Vivendi SE | | | 43,169 | | | | 583,943 | |
Wendel SE | | | 1,358 | | | | 162,723 | |
Worldline SA(a)(c) | | | 11,732 | | | | 653,005 | |
| | | | | | | | |
| | |
| | | | | | | 98,431,227 | |
| | |
| Germany — 5.1% | | | | | | |
Adidas AG | | | 9,761 | | | | 2,810,634 | |
Allianz SE, Registered Shares | | | 20,971 | | | | 4,946,191 | |
BASF SE | | | 46,021 | | | | 3,230,000 | |
Bayer AG, Registered Shares | | | 49,216 | | | | 2,628,345 | |
Bayerische Motoren Werke AG | | | 16,791 | | | | 1,679,809 | |
Bechtle AG | | | 3,951 | | | | 281,152 | |
| | | | | | | | |
| Security | | Shares | | | Value | |
| | |
| Germany (continued) | | | | | | |
Beiersdorf AG | | | 5,990 | | | $ | 614,005 | |
Brenntag SE | | | 7,160 | | | | 646,575 | |
Carl Zeiss Meditec AG | | | 2,201 | | | | 461,718 | |
Commerzbank AG(a) | | | 61,651 | | | | 466,425 | |
Continental AG, Class A(a) | | | 5,218 | | | | 548,232 | |
Covestro AG(c) | | | 10,778 | | | | 663,364 | |
Daimler AG, Registered Shares | | | 42,790 | | | | 3,269,333 | |
Daimler Truck Holding AG(a) | | | 21,395 | | | | 786,526 | |
Delivery Hero SE(a)(c) | | | 8,672 | | | | 959,908 | |
Deutsche Bank AG, Registered Shares(a) | | | 111,294 | | | | 1,386,168 | |
Deutsche Boerse AG | | | 10,184 | | | | 1,700,467 | |
Deutsche Lufthansa AG, Registered Shares(a) | | | 31,510 | | | | 220,631 | |
Deutsche Post AG, Registered Shares | | | 49,260 | | | | 3,168,440 | |
Deutsche Telekom AG, Registered Shares | | | 171,784 | | | | 3,174,136 | |
E.ON SE | | | 108,097 | | | | 1,502,271 | |
Evonik Industries AG | | | 10,596 | | | | 342,309 | |
Fresenius Medical Care AG & Co. KGaA | | | 10,711 | | | | 694,375 | |
Fresenius SE & Co. KGaA | | | 19,807 | | | | 796,110 | |
GEA Group AG | | | 8,213 | | | | 448,589 | |
Hannover Rueck SE | | | 2,791 | | | | 529,164 | |
HeidelbergCement AG | | | 6,401 | | | | 433,201 | |
HelloFresh SE(a) | | | 8,733 | | | | 669,280 | |
Henkel AG & Co. KGaA | | | 5,146 | | | | 401,136 | |
Infineon Technologies AG | | | 65,966 | | | | 3,036,973 | |
KION Group AG | | | 3,490 | | | | 381,198 | |
Knorr-Bremse AG | | | 3,724 | | | | 367,799 | |
LANXESS AG | | | 3,663 | | | | 226,515 | |
LEG Immobilien SE | | | 3,461 | | | | 482,542 | |
Merck KGaA | | | 6,367 | | | | 1,637,956 | |
MTU Aero Engines AG | | | 2,452 | | | | 497,864 | |
Muenchener Rueckversicherungs-Gesellschaft AG in Muenchen, Registered Shares | | | 7,405 | | | | 2,186,020 | |
Nemetschek SE | | | 2,777 | | | | 355,078 | |
Puma SE | | | 5,468 | | | | 667,775 | |
Rational AG | | | 228 | | | | 233,190 | |
Rwe AG | | | 32,891 | | | | 1,332,629 | |
SAP SE | | | 52,706 | | | | 7,417,816 | |
Scout24 AG(c) | | | 4,929 | | | | 344,174 | |
Siemens AG, Registered Shares | | | 38,849 | | | | 6,728,755 | |
Siemens Energy AG(a) | | | 20,941 | | | | 534,295 | |
Siemens Healthineers AG(c) | | | 14,475 | | | | 1,079,244 | |
Symrise AG | | | 7,159 | | | | 1,058,778 | |
Telefonica Deutschland Holding AG | | | 31,100 | | | | 86,265 | |
Uniper SE | | | 5,363 | | | | 254,636 | |
United Internet AG, Registered Shares | | | 4,660 | | | | 184,752 | |
Volkswagen AG | | | 1,472 | | | | 430,315 | |
Vonovia SE | | | 36,192 | | | | 1,994,257 | |
Zalando SE(a)(c) | | | 11,430 | | | | 920,761 | |
| | | | | | | | |
| | |
| | | | | | | 71,898,081 | |
| | |
| Greece — 0.1% | | | | | | |
Alpha Services and Holdings SA(a) | | | 109,264 | | | | 133,904 | |
Eurobank Ergasias Services and Holdings SA(a) | | | 150,627 | | | | 152,601 | |
FF Group(a)(e) | | | 205 | (f) | | | 2 | |
Hellenic Telecommunications Organization SA | | | 12,770 | | | | 235,915 | |
JUMBO SA | | | 4,656 | | | | 66,791 | |
OPAP SA | | | 10,676 | | | | 151,209 | |
Public Power Corp. SA(a) | | | 12,105 | | | | 129,887 | |
| | | | | | | | |
| | |
| | | | | | | 870,309 | |
| | |
| Hong Kong — 1.9% | | | | | | |
AIA Group Ltd. | | | 602,000 | | | | 6,075,890 | |
Alibaba Pictures Group Ltd.(a) | | | 480,000 | | | | 43,731 | |
| | |
| 26 | | 2 0 2 1 BLACK ROCK ANNUAL REPORT TO SHAREHOLDERS |
| | |
Schedule of Investments (continued) December 31, 2021 | | Total International ex U.S. Index Master Portfolio (Percentages shown are based on Net Assets) |
| | | | | | | | |
| Security | | Shares | | | Value | |
| | |
| Hong Kong (continued) | | | | | | |
Beijing Enterprises Water Group Ltd.(d) | | | 232,000 | | | $ | 90,143 | |
Bosideng International Holdings Ltd. | | | 234,000 | | | | 147,421 | |
China Education Group Holdings Ltd. | | | 58,000 | | | | 94,250 | |
China Everbright Environment Group Ltd. | | | 146,629 | | | | 117,773 | |
China Gas Holdings Ltd. | | | 161,800 | | | | 336,558 | |
China Jinmao Holdings Group Ltd. | | | 192,000 | | | | 59,381 | |
China Merchants Port Holdings Co. Ltd. | | | 65,720 | | | | 119,944 | |
China Power International Development Ltd. | | | 228,000 | | | | 153,560 | |
China Resources Beer Holdings Co. Ltd. | | | 80,000 | | | | 655,125 | |
China Resources Power Holdings Co. Ltd. | | | 120,000 | | | | 401,356 | |
China Taiping Insurance Holdings Co. Ltd. | | | 72,672 | | | | 99,791 | |
China Traditional Chinese Medicine Holdings Co. Ltd. | | | 178,000 | | | | 117,942 | |
China Youzan Ltd.(a) | | | 760,000 | | | | 52,727 | |
CK Asset Holdings Ltd. | | | 102,008 | | | | 643,463 | |
CK Infrastructure Holdings Ltd. | | | 41,500 | | | | 264,405 | |
CLP Holdings Ltd. | | | 81,000 | | | | 818,486 | |
COSCO SHIPPING Ports Ltd. | | | 134,000 | | | | 116,463 | |
ESR Cayman Ltd.(a)(c) | | | 83,000 | | | | 280,757 | |
Far East Horizon Ltd. | | | 141,000 | | | | 125,132 | |
Galaxy Entertainment Group Ltd.(a) | | | 111,000 | | | | 575,824 | |
Guangdong Investment Ltd. | | | 164,000 | | | | 208,471 | |
Hang Lung Properties Ltd. | | | 113,000 | | | | 232,447 | |
Hang Seng Bank Ltd. | | | 43,400 | | | | 794,722 | |
Henderson Land Development Co. Ltd. | | | 74,800 | | | | 319,065 | |
HK Electric Investments & HK Electric Investments Ltd., Class SS(b) | | | 179,500 | | | | 176,103 | |
HKT Trust & HKT Ltd., Class SS(b) | | | 185,900 | | | | 249,788 | |
Hong Kong & China Gas Co. Ltd. | | | 538,176 | | | | 839,428 | |
Hong Kong Exchanges & Clearing Ltd. | | | 57,594 | | | | 3,368,325 | |
Hongkong Land Holdings Ltd.(d) | | | 51,500 | | | | 267,780 | |
Hopson Development Holdings Ltd. | | | 37,400 | | | | 77,922 | |
Huabao International Holdings Ltd. | | | 23,000 | | | | 42,507 | |
Hutchmed China Ltd., ADR(a)(d) | | | 6,525 | | | | 228,897 | |
Jardine Matheson Holdings Ltd. | | | 10,400 | | | | 571,871 | |
Kingboard Laminates Holdings Ltd. | | | 42,500 | | | | 72,285 | |
Lee & Man Paper Manufacturing Ltd. | | | 120,000 | | | | 83,445 | |
Link REIT | | | 119,700 | | | | 1,054,469 | |
Melco Resorts & Entertainment Ltd., ADR(a) | | | 11,155 | | | | 113,558 | |
MTR Corp. Ltd. | | | 66,000 | | | | 354,292 | |
New World Development Co. Ltd. | | | 70,166 | | | | 277,806 | |
Nine Dragons Paper Holdings Ltd. | | | 54,000 | | | | 57,992 | |
Power Assets Holdings Ltd. | | | 71,500 | | | | 445,683 | |
Sino Biopharmaceutical Ltd. | | | 574,750 | | | | 403,356 | |
Sino Land Co. Ltd. | | | 130,800 | | | | 162,867 | |
SITC International Holdings Co. Ltd. | | | 73,000 | | | | 264,018 | |
Sun Art Retail Group Ltd. | | | 110,000 | | | | 44,155 | |
Sun Hung Kai Properties Ltd. | | | 68,500 | | | | 831,196 | |
Swire Pacific Ltd., Class A | | | 21,000 | | | | 119,448 | |
Swire Properties Ltd. | | | 79,200 | | | | 198,545 | |
Techtronic Industries Co. Ltd. | | | 69,000 | | | | 1,375,508 | |
Vinda International Holdings Ltd.(d) | | | 31,000 | | | | 75,517 | |
WH Group Ltd.(c) | | | 460,000 | | | | 288,766 | |
Wharf Holdings Ltd. | | | 94,000 | | | | 288,741 | |
Wharf Real Estate Investment Co. Ltd. | | | 81,000 | | | | 411,580 | |
Xinyi Glass Holdings Ltd. | | | 78,000 | | | | 195,376 | |
Yuexiu Property Co. Ltd. | | | 135,000 | | | | 119,066 | |
| | | | | | | | |
| | |
| | | | | | | 26,005,117 | |
| | |
| Hungary — 0.1% | | | | | | |
MOL Hungarian Oil & Gas PLC | | | 16,294 | | | | 126,461 | |
| | | | | | | | |
| Security | | Shares | | | Value | |
| | |
| Hungary (continued) | | | | | | |
OTP Bank Nyrt(a) | | | 11,130 | | | $ | 567,533 | |
Richter Gedeon Nyrt | | | 8,007 | | | | 215,313 | |
| | | | | | | | |
| | |
| | | | | | | 909,307 | |
| | |
| India — 3.5% | | | | | | |
ACC Ltd. | | | 4,939 | | | | 146,883 | |
Adani Enterprises Ltd. | | | 8,673 | | | | 198,759 | |
Adani Green Energy Ltd.(a) | | | 19,426 | | | | 346,725 | |
Adani Ports & Special Economic Zone Ltd. | | | 27,638 | | | | 270,413 | |
Adani Total Gas Ltd. | | | 13,720 | | | | 317,790 | |
Adani Transmission Ltd.(a) | | | 12,713 | | | | 297,844 | |
Ambuja Cements Ltd. | | | 26,422 | | | | 133,742 | |
Apollo Hospitals Enterprise Ltd. | | | 6,490 | | | | 436,857 | |
Asian Paints Ltd. | | | 17,953 | | | | 815,779 | |
Aurobindo Pharma Ltd. | | | 13,516 | | | | 133,211 | |
Avenue Supermarts Ltd.(a)(c) | | | 7,036 | | | | 441,355 | |
Axis Bank Ltd.(a) | | | 109,944 | | | | 999,090 | |
Bajaj Auto Ltd. | | | 3,300 | | | | 143,817 | |
Bajaj Finance Ltd. | | | 13,264 | | | | 1,238,899 | |
Bajaj Finserv Ltd. | | | 1,711 | | | | 376,119 | |
Balkrishna Industries Ltd. | | | 5,542 | | | | 172,727 | |
Bandhan Bank Ltd.(c) | | | 58,169 | | | | 197,122 | |
Berger Paints India Ltd. | | | 8,379 | | | | 86,834 | |
Bharat Electronics Ltd. | | | 68,809 | | | | 193,771 | |
Bharat Forge Ltd. | | | 11,954 | | | | 111,727 | |
Bharat Petroleum Corp. Ltd. | | | 35,066 | | | | 181,304 | |
Bharti Airtel Ltd.(a) | | | 128,944 | | | | 1,184,333 | |
Biocon Ltd.(a) | | | 19,164 | | | | 93,797 | |
Britannia Industries Ltd. | | | 4,997 | | | | 241,842 | |
Cholamandalam Investment and Finance Co. Ltd. | | | 22,203 | | | | 154,852 | |
Cipla Ltd. | | | 24,583 | | | | 311,820 | |
Coal India Ltd. | | | 75,541 | | | | 148,093 | |
Colgate-Palmolive India Ltd. | | | 6,248 | | | | 124,302 | |
Container Corp. Of India Ltd. | | | 7,463 | | | | 61,532 | |
Dabur India Ltd. | | | 37,975 | | | | 295,913 | |
Divi’s Laboratories Ltd. | | | 6,478 | | | | 407,093 | |
DLF Ltd. | | | 33,599 | | | | 175,614 | |
Dr Reddy’s Laboratories Ltd. | | | 1,007 | | | | 66,356 | |
Dr Reddy’s Laboratories Ltd., ADR(d) | | | 4,517 | | | | 295,457 | |
Eicher Motors Ltd. | | | 6,440 | | | | 223,880 | |
GAIL India Ltd. | | | 64,983 | | | | 112,519 | |
Godrej Consumer Products Ltd.(a) | | | 15,068 | | | | 195,931 | |
Godrej Properties Ltd.(a) | | | 7,174 | | | | 180,291 | |
Grasim Industries Ltd. | | | 15,713 | | | | 341,739 | |
Havells India Ltd. | | | 16,163 | | | | 303,217 | |
HCL Technologies Ltd. | | | 59,861 | | | | 1,058,936 | |
HDFC Asset Management Co. Ltd.(c) | | | 2,674 | | | | 87,704 | |
HDFC Life Insurance Co. Ltd.(c) | | | 55,202 | | | | 481,149 | |
Hero MotoCorp Ltd. | | | 7,430 | | | | 245,206 | |
Hindalco Industries Ltd. | | | 85,181 | | | | 541,671 | |
Hindustan Petroleum Corp. Ltd. | | | 25,339 | | | | 99,391 | |
Hindustan Unilever Ltd. | | | 40,869 | | | | 1,293,729 | |
Housing Development Finance Corp. Ltd. | | | 85,788 | | | | 2,968,186 | |
ICICI Bank Ltd. | | | 222,896 | | | | 2,215,799 | |
ICICI Bank Ltd., ADR | | | 22,806 | | | | 451,331 | |
ICICI Lombard General Insurance Co. Ltd.(c) | | | 10,963 | | | | 206,195 | |
ICICI Prudential Life Insurance Co. Ltd.(c) | | | 12,623 | | | | 95,027 | |
Indian Oil Corp. Ltd. | | | 94,789 | | | | 141,826 | |
Indian Railway Catering & Tourism Corp. Ltd. | | | 14,747 | | | | 164,402 | |
Indraprastha Gas Ltd. | | | 14,609 | | | | 92,157 | |
Indus Towers Ltd. | | | 41,213 | | | | 137,418 | |
| | |
MASTER PORTFOLIO SCHEDULE OF INVESTMENTS | | 27 |
| | |
Schedule of Investments (continued) December 31, 2021 | | Total International ex U.S. Index Master Portfolio (Percentages shown are based on Net Assets) |
| | | | | | | | |
| Security | | Shares | | | Value | |
| | |
| India (continued) | | | | | | |
Info Edge India Ltd. | | | 4,063 | | | $ | 304,077 | |
Infosys Ltd. | | | 68,399 | | | | 1,732,254 | |
Infosys Ltd., ADR(d) | | | 97,713 | | | | 2,473,116 | |
InterGlobe Aviation Ltd.(a)(c) | | | 5,982 | | | | 162,131 | |
ITC Ltd. | | | 148,193 | | | | 433,597 | |
JSW Steel Ltd. | | | 33,857 | | | | 297,513 | |
Jubilant Foodworks Ltd. | | | 4,029 | | | | 193,850 | |
Kotak Mahindra Bank Ltd. | | | 31,483 | | | | 757,821 | |
Larsen & Toubro Infotech Ltd.(c) | | | 2,827 | | | | 278,041 | |
Larsen & Toubro Ltd. | | | 13,539 | | | | 343,889 | |
Larsen & Toubro Ltd., GDR, Registered Shares | | | 18,237 | | | | 464,132 | |
Lupin Ltd. | | | 11,830 | | | | 150,944 | |
Mahindra & Mahindra Ltd. | | | 23,090 | | | | 259,075 | |
Mahindra & Mahindra Ltd., GDR | | | 27,036 | | | | 308,388 | |
Marico Ltd. | | | 22,064 | | | | 151,911 | |
Maruti Suzuki India Ltd. | | | 7,232 | | | | 720,003 | |
Mindtree Ltd. | | | 3,781 | | | | 242,584 | |
Motherson Sumi Systems Ltd. | | | 67,315 | | | | 201,276 | |
Mphasis Ltd. | | | 4,649 | | | | 211,960 | |
MRF Ltd. | | | 105 | | | | 103,424 | |
Muthoot Finance Ltd. | | | 8,240 | | | | 165,300 | |
Nestle India Ltd. | | | 1,798 | | | | 475,878 | |
NTPC Ltd. | | | 269,224 | | | | 449,191 | |
Oil & Natural Gas Corp. Ltd. | | | 161,872 | | | | 309,866 | |
Page Industries Ltd. | | | 266 | | | | 144,274 | |
Petronet LNG Ltd. | | | 22,341 | | | | 64,875 | |
PI Industries Ltd. | | | 5,213 | | | | 212,300 | |
Pidilite Industries Ltd. | | | 5,574 | | | | 184,333 | |
Piramal Enterprises Ltd. | | | 4,721 | | | | 167,417 | |
Power Grid Corp. of India Ltd. | | | 180,796 | | | | 496,137 | |
Reliance Industries Ltd. | | | 142,005 | | | | 4,511,012 | |
SBI Cards & Payment Services Ltd.(a) | | | 10,550 | | | | 131,504 | |
SBI Life Insurance Co. Ltd.(c) | | | 24,669 | | | | 395,569 | |
Shree Cement Ltd. | | | 685 | | | | 247,982 | |
Shriram Transport Finance Co. Ltd. | | | 13,178 | | | | 214,499 | |
Siemens Ltd. | | | 4,979 | | | | 157,837 | |
SRF Ltd. | | | 8,155 | | | | 264,961 | |
State Bank of India | | | 27,343 | | | | 168,715 | |
State Bank of India, GDR, Registered Shares | | | 5,712 | | | | 352,430 | |
Sun Pharmaceutical Industries Ltd. | | | 43,350 | | | | 492,544 | |
Tata Consultancy Services Ltd. | | | 46,339 | | | | 2,324,156 | |
Tata Consumer Products Ltd. | | | 34,238 | | | | 341,565 | |
Tata Motors Ltd.(a) | | | 52,939 | | | | 341,258 | |
Tata Motors Ltd., ADR(a)(d) | | | 6,008 | | | | 192,797 | |
Tata Power Co. Ltd. | | | 80,464 | | | | 238,306 | |
Tata Steel Ltd. | | | 37,722 | | | | 560,919 | |
Tech Mahindra Ltd. | | | 29,414 | | | | 705,783 | |
Titan Co. Ltd. | | | 17,275 | | | | 584,395 | |
Torrent Pharmaceuticals Ltd. | | | 2,660 | | | | 117,302 | |
Trent Ltd. | | | 10,835 | | | | 154,706 | |
UltraTech Cement Ltd. | | | 5,995 | | | | 610,647 | |
United Spirits Ltd.(a) | | | 18,510 | | | | 223,107 | |
UPL Ltd. | | | 26,481 | | | | 265,111 | |
Vedanta Ltd. | | | 45,035 | | | | 205,969 | |
Wipro Ltd. | | | 51,676 | | | | 495,178 | |
Wipro Ltd., ADR(d) | | | 13,184 | | | | 128,676 | |
Yes Bank Ltd.(a) | | | 558,202 | | | | 102,657 | |
Zomato Ltd.(a) | | | 104,805 | | | | 193,719 | |
| | | | | | | | |
| | |
| | | | | | | 49,622,337 | |
| | |
| Indonesia — 0.4% | | | | | | |
Adaro Energy Tbk PT | | | 1,157,300 | | | | 183,532 | |
| | | | | | | | |
| Security | | Shares | | | Value | |
| | |
| Indonesia (continued) | | | | | | |
Aneka Tambang Tbk | | | 614,000 | | | $ | 97,176 | |
Astra International Tbk PT | | | 965,400 | | | | 386,403 | |
Bank Central Asia Tbk PT | | | 2,784,500 | | | | 1,426,083 | |
Bank Mandiri Persero Tbk PT | | | 892,400 | | | | 440,648 | |
Bank Negara Indonesia Persero Tbk PT | | | 405,600 | | | | 191,731 | |
Bank Rakyat Indonesia Persero Tbk PT | | | 3,446,328 | | | | 992,288 | |
Barito Pacific Tbk PT | | | 1,669,600 | | | | 99,990 | |
Charoen Pokphand Indonesia Tbk PT | | | 335,800 | | | | 139,957 | |
Gudang Garam Tbk PT | | | 22,300 | | | | 47,888 | |
Indah Kiat Pulp & Paper Tbk PT | | | 126,800 | | | | 69,652 | |
Indocement Tunggal Prakarsa Tbk PT | | | 88,600 | | | | 75,213 | |
Indofood CBP Sukses Makmur Tbk PT | | | 165,500 | | | | 101,087 | |
Indofood Sukses Makmur Tbk PT | | | 159,200 | | | | 70,689 | |
Kalbe Farma Tbk PT | | | 858,400 | | | | 97,268 | |
Merdeka Copper Gold Tbk PT(a) | | | 442,100 | | | | 121,019 | |
Sarana Menara Nusantara Tbk PT | | | 1,534,700 | | | | 121,017 | |
Semen Indonesia Persero Tbk PT | | | 106,000 | | | | 53,894 | |
Telkom Indonesia Persero Tbk PT | | | 2,296,400 | | | | 655,397 | |
Tower Bersama Infrastructure Tbk PT | | | 697,000 | | | | 144,416 | |
Unilever Indonesia Tbk PT | | | 374,500 | | | | 107,999 | |
United Tractors Tbk PT | | | 79,900 | | | | 124,051 | |
| | | | | | | | |
| | |
| | | | | | | 5,747,398 | |
| | |
| Ireland — 0.7% | | | | | | |
CRH PLC | | | 39,143 | | | | 2,072,231 | |
Experian PLC | | | 47,136 | | | | 2,321,724 | |
Flutter Entertainment PLC(a) | | | 8,663 | | | | 1,371,471 | |
James Hardie Industries PLC | | | 20,161 | | | | 811,524 | |
Kerry Group PLC, Class A | | | 7,914 | | | | 1,021,030 | |
Kingspan Group PLC | | | 7,457 | | | | 889,508 | |
Smurfit Kappa Group PLC | | | 12,493 | | | | 688,569 | |
| | | | | | | | |
| | |
| | | | | | | 9,176,057 | |
| | |
| Isle of Man — 0.0% | | | | | | |
Entain PLC(a) | | | 27,233 | | | | 622,456 | |
| | | | | | | | |
| | |
| Israel — 0.5% | | | | | | |
Azrieli Group Ltd. | | | 2,198 | | | | 209,712 | |
Bank Hapoalim BM | | | 64,127 | | | | 659,992 | |
Bank Leumi Le-Israel BM | | | 69,019 | | | | 740,299 | |
Check Point Software Technologies Ltd.(a) | | | 5,532 | | | | 644,810 | |
CyberArk Software Ltd.(a) | | | 2,248 | | | | 389,533 | |
Elbit Systems Ltd. | | | 1,528 | | | | 264,122 | |
Fiverr International Ltd.(a)(d) | | | 1,631 | | | | 185,445 | |
ICL Group Ltd.(d) | | | 34,017 | | | | 327,656 | |
Inmode Ltd.(a) | | | 2,772 | | | | 195,648 | |
Isracard Ltd. | | | 1 | | | | 2 | |
Israel Discount Bank Ltd., Class A | | | 49,699 | | | | 333,692 | |
Kornit Digital Ltd.(a) | | | 2,340 | | | | 356,265 | |
Mizrahi Tefahot Bank Ltd. | | | 7,034 | | | | 270,884 | |
Nice Ltd.(a) | | | 3,161 | | | | 958,591 | |
Teva Pharmaceutical Industries Ltd., ADR(a) | | | 63,845 | | | | 511,398 | |
Wix.com Ltd.(a) | | | 2,966 | | | | 468,005 | |
| | | | | | | | |
| | |
| | | | | | | 6,516,054 | |
| | |
| Italy — 1.3% | | | | | | |
Amplifon SpA | | | 5,862 | | | | 315,423 | |
Assicurazioni Generali SpA | | | 52,312 | | | | 1,105,599 | |
Atlantia SpA(a) | | | 23,054 | | | | 457,432 | |
Davide Campari-Milano NV | | | 28,673 | | | | 418,404 | |
DiaSorin SpA | | | 1,148 | | | | 218,402 | |
Enel SpA | | | 405,885 | | | | 3,245,488 | |
Eni SpA | | | 130,474 | | | | 1,813,298 | |
Ferrari NV | | | 6,287 | | | | 1,618,311 | |
| | |
| 28 | | 2 0 2 1 BLACK ROCK ANNUAL REPORT TO SHAREHOLDERS |
| | |
Schedule of Investments (continued) December 31, 2021 | | Total International ex U.S. Index Master Portfolio (Percentages shown are based on Net Assets) |
| | | | | | | | |
| Security | | Shares | | | Value | |
| | |
| Italy (continued) | | | | | | |
FinecoBank Banca Fineco SpA | | | 31,371 | | | $ | 549,385 | |
Infrastrutture Wireless Italiane SpA(c) | | | 18,443 | | | | 223,641 | |
Intesa Sanpaolo SpA | | | 817,970 | | | | 2,112,754 | |
Mediobanca Banca di Credito Finanziario SpA(d) | | | 28,749 | | | | 330,052 | |
Moncler SpA | | | 11,041 | | | | 797,914 | |
Nexi SpA(a)(c) | | | 23,897 | | | | 378,681 | |
Poste Italiane SpA(c) | | | 23,222 | | | | 304,214 | |
Prysmian SpA | | | 11,451 | | | | 430,743 | |
Recordati Industria Chimica e Farmaceutica SpA | | | 5,232 | | | | 335,968 | |
Snam SpA | | | 106,021 | | | | 638,583 | |
Telecom Italia SpA/Milano | | | 632,663 | | | | 311,255 | |
Terna SPA | | | 76,635 | | | | 619,950 | |
UniCredit SpA | | | 105,471 | | | | 1,621,231 | |
| | | | | | | | |
| | |
| | | | | | | 17,846,728 | |
| | |
| Japan — 14.1% | | | | | | |
Advantest Corp. | | | 10,000 | | | | 946,991 | |
Aeon Co. Ltd. | | | 36,500 | | | | 860,166 | |
AGC, Inc. | | | 10,500 | | | | 501,617 | |
Aisin Corp. | | | 7,800 | | | | 299,267 | |
Ajinomoto Co., Inc. | | | 21,500 | | | | 654,505 | |
ANA Holdings, Inc.(a) | | | 6,700 | | | | 140,063 | |
Asahi Group Holdings Ltd.(d) | | | 22,000 | | | | 856,433 | |
Asahi Intecc Co. Ltd. | | | 10,700 | | | | 229,874 | |
Asahi Kasei Corp. | | | 63,900 | | | | 601,960 | |
Astellas Pharma, Inc. | | | 96,400 | | | | 1,568,961 | |
Azbil Corp. | | | 6,700 | | | | 305,577 | |
Bandai Namco Holdings, Inc. | | | 9,500 | | | | 742,790 | |
Benefit One Inc. | | | 4,600 | | | | 197,637 | |
Bridgestone Corp.(d) | | | 28,700 | | | | 1,232,167 | |
Brother Industries Ltd. | | | 9,200 | | | | 177,325 | |
Canon, Inc.(d) | | | 50,500 | | | | 1,231,880 | |
Capcom Co. Ltd.(d) | | | 8,000 | | | | 188,411 | |
Central Japan Railway Co. | | | 7,200 | | | | 958,118 | |
Chiba Bank Ltd. | | | 26,100 | | | | 149,306 | |
Chubu Electric Power Co., Inc. | | | 31,400 | | | | 331,663 | |
Chugai Pharmaceutical Co. Ltd. | | | 36,500 | | | | 1,189,754 | |
Concordia Financial Group Ltd. | | | 48,900 | | | | 177,583 | |
Cosmos Pharmaceutical Corp. | | | 1,200 | | | | 176,415 | |
CyberAgent, Inc. | | | 21,600 | | | | 360,068 | |
Dai Nippon Printing Co. Ltd. | | | 9,800 | | | | 246,635 | |
Daifuku Co. Ltd. | | | 4,900 | | | | 400,697 | |
Dai-ichi Life Holdings, Inc. | | | 47,900 | | | | 966,141 | |
Daiichi Sankyo Co. Ltd. | | | 90,400 | | | | 2,300,808 | |
Daikin Industries Ltd. | | | 12,400 | | | | 2,808,838 | |
Daito Trust Construction Co. Ltd. | | | 3,400 | | | | 390,052 | |
Daiwa House Industry Co. Ltd. | | | 26,800 | | | | 770,207 | |
Daiwa House REIT Investment Corp. | | | 130 | | | | 393,819 | |
Daiwa Securities Group, Inc. | | | 65,000 | | | | 366,794 | |
Denso Corp. | | | 21,200 | | | | 1,756,861 | |
Dentsu Group, Inc. | | | 9,400 | | | | 334,576 | |
Disco Corp. | | | 1,400 | | | | 427,914 | |
East Japan Railway Co. | | | 15,200 | | | | 934,428 | |
Eisai Co. Ltd. | | | 12,800 | | | | 726,628 | |
ENEOS Holdings, Inc. | | | 150,100 | | | | 560,745 | |
FANUC Corp. | | | 9,700 | | | | 2,061,850 | |
Fast Retailing Co. Ltd. | | | 3,100 | | | | 1,762,178 | |
Fuji Electric Co. Ltd. | | | 5,300 | | | | 289,529 | |
FUJIFILM Holdings Corp. | | | 17,800 | | | | 1,319,590 | |
Fujitsu Ltd. | | | 9,800 | | | | 1,683,899 | |
GLP J-REIT | | | 231 | | | | 399,288 | |
GMO Payment Gateway, Inc. | | | 1,800 | | | | 224,148 | |
| | | | | | | | |
| Security | | Shares | | | Value | |
| | |
| Japan (continued) | | | | | | |
Hakuhodo DY Holdings, Inc. | | | 14,000 | | | $ | 232,959 | |
Hamamatsu Photonics KK | | | 6,400 | | | | 408,767 | |
Hankyu Hanshin Holdings, Inc. | | | 11,600 | | | | 329,658 | |
Hikari Tsushin, Inc. | | | 1,000 | | | | 154,008 | |
Hino Motors Ltd. | | | 12,500 | | | | 103,074 | |
Hirose Electric Co. Ltd. | | | 1,611 | | | | 270,744 | |
Hitachi Construction Machinery Co. Ltd. | | | 4,600 | | | | 132,917 | |
Hitachi Ltd. | | | 48,900 | | | | 2,649,076 | |
Hitachi Metals Ltd.(a) | | | 12,900 | | | | 239,025 | |
Honda Motor Co. Ltd. | | | 81,700 | | | | 2,324,425 | |
Hoshizaki Corp. | | | 2,500 | | | | 188,095 | |
Hoya Corp. | | | 18,200 | | | | 2,700,729 | |
Hulic Co. Ltd. | | | 19,700 | | | | 187,337 | |
Ibiden Co. Ltd. | | | 4,700 | | | | 279,112 | |
Idemitsu Kosan Co. Ltd. | | | 8,949 | | | | 228,376 | |
Iida Group Holdings Co. Ltd. | | | 6,800 | | | | 158,151 | |
Inpex Corp. | | | 45,900 | | | | 399,128 | |
Isuzu Motors Ltd. | | | 35,400 | | | | 440,605 | |
Ito En Ltd. | | | 3,700 | | | | 194,406 | |
ITOCHU Corp. | | | 58,600 | | | | 1,792,801 | |
Itochu Techno-Solutions Corp. | | | 3,800 | | | | 122,237 | |
Japan Airlines Co. Ltd.(a) | | | 5,700 | | | | 108,205 | |
Japan Exchange Group, Inc. | | | 24,400 | | | | 534,589 | |
Japan Metropolitan Fund Invest | | | 364 | | | | 313,585 | |
Japan Post Bank Co. Ltd. | | | 18,900 | | | | 173,250 | |
Japan Post Holdings Co. Ltd. | | | 121,300 | | | | 944,960 | |
Japan Post Insurance Co. Ltd. | | | 10,400 | | | | 167,064 | |
Japan Real Estate Investment Corp. | | | 59 | | | | 334,921 | |
Japan Tobacco, Inc.(d) | | | 63,900 | | | | 1,290,265 | |
JFE Holdings, Inc. | | | 29,000 | | | | 369,982 | |
JSR Corp. | | | 12,300 | | | | 467,443 | |
Kajima Corp. | | | 21,700 | | | | 249,388 | |
Kakaku.com, Inc. | | | 7,400 | | | | 197,826 | |
Kansai Electric Power Co., Inc. | | | 30,100 | | | | 281,344 | |
Kansai Paint Co. Ltd. | | | 7,600 | | | | 165,270 | |
Kao Corp.(d) | | | 24,600 | | | | 1,288,408 | |
KDDI Corp. | | | 81,000 | | | | 2,368,740 | |
Keio Corp. | | | 5,500 | | | | 242,672 | |
Keisei Electric Railway Co. Ltd. | | | 5,400 | | | | 146,084 | |
Keyence Corp. | | | 10,080 | | | | 6,337,881 | |
Kikkoman Corp. | | | 8,100 | | | | 682,109 | |
Kintetsu Group Holdings Co. Ltd.(a) | | | 8,500 | | | | 237,614 | |
Kirin Holdings Co. Ltd.(d) | | | 40,400 | | | | 650,718 | |
Kobayashi Pharmaceutical Co. Ltd. | | | 2,600 | | | | 204,510 | |
Kobe Bussan Co. Ltd. | | | 9,400 | | | | 363,944 | |
Koei Tecmo Holdings Co. Ltd. | | | 2,860 | | | | 112,297 | |
Koito Manufacturing Co. Ltd. | | | 4,500 | | | | 238,338 | |
Komatsu Ltd. | | | 45,500 | | | | 1,064,062 | |
Konami Holdings Corp. | | | 5,300 | | | | 254,397 | |
Kose Corp. | | | 1,700 | | | | 192,851 | |
Kubota Corp. | | | 56,100 | | | | 1,247,442 | |
Kurita Water Industries Ltd. | | | 4,000 | | | | 189,634 | |
Kyocera Corp. | | | 15,800 | | | | 987,911 | |
Kyowa Kirin Co. Ltd. | | | 12,600 | | | | 343,548 | |
Lasertec Corp. | | | 3,800 | | | | 1,163,945 | |
Lawson, Inc. | | | 1,900 | | | | 90,154 | |
Lion Corp. | | | 11,900 | | | | 159,079 | |
Lixil Corp. | | | 13,600 | | | | 362,806 | |
M3, Inc. | | | 22,500 | | | | 1,134,481 | |
Makita Corp. | | | 13,100 | | | | 556,091 | |
Marubeni Corp. | | | 70,300 | | | | 684,933 | |
Mazda Motor Corp.(a) | | | 30,300 | | | | 232,488 | |
| | |
MASTER PORTFOLIO SCHEDULE OF INVESTMENTS | | 29 |
| | |
Schedule of Investments (continued) December 31, 2021 | | Total International ex U.S. Index Master Portfolio (Percentages shown are based on Net Assets) |
| | | | | | | | |
| Security | | Shares | | | Value | |
| | |
| Japan (continued) | | | | | | |
McDonald’s Holdings Co. Japan Ltd.(d) | | | 5,200 | | | $ | 230,131 | |
Medipal Holdings Corp. | | | 9,800 | | | | 183,700 | |
MEIJI Holdings Co. Ltd. | | | 6,200 | | | | 370,101 | |
Mercari, Inc.(a) | | | 5,200 | | | | 264,563 | |
MINEBEA MITSUMI, Inc. | | | 19,200 | | | | 545,541 | |
MISUMI Group, Inc. | | | 12,300 | | | | 505,308 | |
Mitsubishi Chemical Holdings Corp. | | | 59,500 | | | | 441,333 | |
Mitsubishi Corp. | | | 63,200 | | | | 2,006,796 | |
Mitsubishi Electric Corp. | | | 90,500 | | | | 1,148,719 | |
Mitsubishi Estate Co. Ltd. | | | 58,900 | | | | 817,089 | |
Mitsubishi Gas Chemical Co., Inc. | | | 9,300 | | | | 157,649 | |
Mitsubishi HC Capital, Inc. | | | 37,900 | | | | 187,512 | |
Mitsubishi Heavy Industries Ltd. | | | 14,600 | | | | 337,558 | |
Mitsubishi UFJ Financial Group, Inc. | | | 611,600 | | | | 3,328,495 | |
Mitsui & Co. Ltd. | | | 78,500 | | | | 1,860,282 | |
Mitsui Chemicals, Inc. | | | 7,900 | | | | 212,354 | |
Mitsui Fudosan Co. Ltd. | | | 44,100 | | | | 874,096 | |
Miura Co. Ltd. | | | 3,700 | | | | 127,374 | |
Mizuho Financial Group, Inc. | | | 120,440 | | | | 1,529,739 | |
MonotaRO Co. Ltd. | | | 10,800 | | | | 194,249 | |
MS&AD Insurance Group Holdings, Inc. | | | 29,200 | | | | 899,135 | |
Murata Manufacturing Co. Ltd. | | | 28,900 | | | | 2,305,135 | |
NEC Corp. | | | 14,000 | | | | 647,356 | |
Nexon Co. Ltd. | | | 25,600 | | | | 495,008 | |
NGK Insulators Ltd. | | | 15,500 | | | | 262,338 | |
Nidec Corp. | | | 22,500 | | | | 2,661,622 | |
Nihon M&A Center Holdings, Inc. | | | 13,000 | | | | 318,879 | |
Nintendo Co. Ltd. | | | 5,600 | | | | 2,620,000 | |
Nippon Building Fund, Inc.(d) | | | 83 | | | | 483,446 | |
Nippon Express Co. Ltd.(a)(e) | | | 3,800 | | | | 225,133 | |
Nippon Paint Holdings Co. Ltd. | | | 39,700 | | | | 433,555 | |
Nippon Sanso Holdings Corp. | | | 9,300 | | | | 203,416 | |
Nippon Shinyaku Co. Ltd. | | | 1,900 | | | | 132,307 | |
Nippon Steel Corp. | | | 43,347 | | | | 708,118 | |
Nippon Telegraph & Telephone Corp. | | | 63,500 | | | | 1,736,614 | |
Nippon Yusen KK | | | 8,800 | | | | 671,025 | |
Nissan Chemical Corp. | | | 5,900 | | | | 343,144 | |
Nissan Motor Co. Ltd.(a) | | | 121,500 | | | | 585,210 | |
Nisshin Seifun Group, Inc. | | | 9,000 | | | | 129,837 | |
Nissin Foods Holdings Co. Ltd. | | | 3,500 | | | | 255,442 | |
Nitori Holdings Co. Ltd. | | | 4,100 | | | | 613,243 | |
Nitto Denko Corp. | | | 7,300 | | | | 563,943 | |
Nomura Holdings, Inc. | | | 162,300 | | | | 706,922 | |
Nomura Real Estate Holdings, Inc. | | | 5,200 | | | | 119,818 | |
Nomura Real Estate Master Fund, Inc. | | | 289 | | | | 406,721 | |
Nomura Research Institute Ltd. | | | 15,443 | | | | 660,200 | |
NTT Data Corp. | | | 33,500 | | | | 718,616 | |
Obayashi Corp. | | | 35,600 | | | | 275,521 | |
Obic Co. Ltd. | | | 3,400 | | | | 636,307 | |
Odakyu Electric Railway Co. Ltd. | | | 16,000 | | | | 297,464 | |
Oji Holdings Corp. | | | 39,000 | | | | 188,957 | |
Olympus Corp. | | | 54,900 | | | | 1,264,195 | |
Omron Corp. | | | 9,100 | | | | 906,790 | |
Ono Pharmaceutical Co. Ltd. | | | 19,100 | | | | 474,738 | |
Open House Co. Ltd. | | | 4,700 | | | | 245,606 | |
Oracle Corp. Japan | | | 2,000 | | | | 151,947 | |
Oriental Land Co. Ltd. | | | 10,100 | | | | 1,703,133 | |
ORIX Corp. | | | 66,500 | | | | 1,357,143 | |
Orix JREIT, Inc. | | | 142 | | | | 221,981 | |
Osaka Gas Co. Ltd. | | | 18,700 | | | | 309,284 | |
Otsuka Corp. | | | 5,800 | | | | 276,559 | |
Otsuka Holdings Co. Ltd.(d) | | | 21,500 | | | | 782,190 | |
Pan Pacific International Holdings Corp. | | | 20,000 | | | | 275,677 | |
| | | | | | | | |
| Security | | Shares | | | Value | |
| | |
| Japan (continued) | | | | | | |
Panasonic Corp. | | | 116,100 | | | $ | 1,276,263 | |
Persol Holdings Co. Ltd. | | | 8,300 | | | | 241,308 | |
Pola Orbis Holdings, Inc. | | | 5,600 | | | | 93,328 | |
Rakuten Group, Inc.(a) | | | 39,800 | | | | 399,324 | |
Recruit Holdings Co. Ltd. | | | 70,100 | | | | 4,265,984 | |
Renesas Electronics Corp.(a) | | | 67,900 | | | | 843,366 | |
Resona Holdings, Inc. | | | 95,100 | | | | 369,575 | |
Ricoh Co. Ltd. | | | 39,800 | | | | 370,980 | |
Rinnai Corp. | | | 2,100 | | | | 189,517 | |
Rohm Co. Ltd. | | | 4,200 | | | | 382,071 | |
Ryohin Keikaku Co. Ltd. | | | 11,000 | | | | 167,728 | |
Santen Pharmaceutical Co. Ltd. | | | 19,300 | | | | 235,629 | |
SBI Holdings, Inc. | | | 12,550 | | | | 342,308 | |
SCSK Corp. | | | 4,800 | | | | 95,530 | |
Secom Co. Ltd. | | | 10,400 | | | | 722,657 | |
Seiko Epson Corp. | | | 14,900 | | | | 268,355 | |
Sekisui Chemical Co. Ltd. | | | 21,100 | | | | 352,879 | |
Sekisui House Ltd. | | | 29,600 | | | | 636,866 | |
Seven & i Holdings Co. Ltd. | | | 39,100 | | | | 1,719,930 | |
SG Holdings Co. Ltd. | | | 17,100 | | | | 400,968 | |
Sharp Corp. | | | 12,500 | | | | 143,557 | |
Shimadzu Corp. | | | 11,000 | | | | 464,618 | |
Shimano, Inc. | | | 3,900 | | | | 1,038,645 | |
Shimizu Corp. | | | 31,400 | | | | 194,691 | |
Shin-Etsu Chemical Co. Ltd. | | | 17,700 | | | | 3,072,284 | |
Shionogi & Co. Ltd. | | | 12,800 | | | | 900,433 | |
Shiseido Co. Ltd. | | | 21,000 | | | | 1,171,516 | |
Shizuoka Bank Ltd.(d) | | | 15,700 | | | | 112,083 | |
SMC Corp. | | | 2,900 | | | | 1,959,988 | |
Softbank Corp. | | | 143,500 | | | | 1,812,486 | |
SoftBank Group Corp. | | | 60,100 | | | | 2,881,202 | |
Sohgo Security Services Co. Ltd. | | | 4,300 | | | | 170,864 | |
Sompo Holdings, Inc. | | | 15,000 | | | | 632,605 | |
Sony Group Corp. | | | 64,000 | | | | 8,081,803 | |
Square Enix Holdings Co. Ltd. | | | 4,200 | | | | 215,458 | |
Stanley Electric Co. Ltd. | | | 5,700 | | | | 143,110 | |
Subaru Corp. | | | 37,400 | | | | 668,256 | |
SUMCO Corp. | | | 15,500 | | | | 315,623 | |
Sumitomo Chemical Co. Ltd. | | | 79,700 | | | | 375,850 | |
Sumitomo Corp. | | | 59,300 | | | | 877,604 | |
Sumitomo Dainippon Pharma Co. Ltd. | | | 6,600 | | | | 76,147 | |
Sumitomo Electric Industries Ltd. | | | 33,500 | | | | 437,208 | |
Sumitomo Metal Mining Co. Ltd. | | | 18,000 | | | | 681,740 | |
Sumitomo Mitsui Financial Group, Inc. | | | 64,700 | | | | 2,209,329 | |
Sumitomo Mitsui Trust Holdings, Inc. | | | 19,100 | | | | 638,672 | |
Sumitomo Realty & Development Co. Ltd. | | | 16,400 | | | | 483,486 | |
Suntory Beverage & Food Ltd. | | | 6,300 | | | | 228,142 | |
Suzuki Motor Corp. | | | 19,700 | | | | 759,688 | |
Sysmex Corp. | | | 8,800 | | | | 1,187,837 | |
T&D Holdings, Inc. | | | 24,800 | | | | 316,839 | |
Taisei Corp. | | | 8,800 | | | | 267,609 | |
Taisho Pharmaceutical Holdings Co. Ltd. | | | 3,900 | | | | 180,024 | |
Takeda Pharmaceutical Co. Ltd. | | | 80,676 | | | | 2,203,124 | |
TDK Corp. | | | 19,800 | | | | 772,712 | |
Terumo Corp. | | | 31,500 | | | | 1,330,579 | |
TIS, Inc. | | | 9,900 | | | | 294,387 | |
Tobu Railway Co. Ltd. | | | 12,100 | | | | 276,121 | |
Toho Co. Ltd. | | | 5,500 | | | | 235,358 | |
Tokio Marine Holdings, Inc. | | | 32,100 | | | | 1,786,995 | |
Tokyo Century Corp. | | | 2,300 | | | | 111,650 | |
Tokyo Electric Power Co. Holdings, Inc.(a) | | | 85,500 | | | | 221,036 | |
Tokyo Electron Ltd. | | | 7,600 | | | | 4,374,350 | |
Tokyo Gas Co. Ltd. | | | 20,100 | | | | 360,802 | |
| | |
| 30 | | 2 0 2 1 BLACK ROCK ANNUAL REPORT TO SHAREHOLDERS |
| | |
Schedule of Investments (continued) December 31, 2021 | | Total International ex U.S. Index Master Portfolio (Percentages shown are based on Net Assets) |
| | | | | | | | |
| Security | | Shares | | | Value | |
| | |
| Japan (continued) | | | | | | |
Tokyu Corp. | | | 26,400 | | | $ | 350,953 | |
Toppan Inc. | | | 11,500 | | | | 215,806 | |
Toray Industries, Inc. | | | 70,500 | | | | 417,687 | |
Toshiba Corp. | | | 21,600 | | | | 888,806 | |
Tosoh Corp. | | | 10,700 | | | | 158,965 | |
TOTO Ltd. | | | 8,000 | | | | 369,100 | |
Toyo Suisan Kaisha Ltd. | | | 3,700 | | | | 156,874 | |
Toyota Industries Corp. | | | 7,800 | | | | 623,945 | |
Toyota Motor Corp.(d) | | | 536,830 | | | | 9,922,006 | |
Toyota Tsusho Corp. | | | 10,200 | | | | 470,187 | |
Trend Micro, Inc.(a)(d) | | | 8,300 | | | | 460,783 | |
Tsuruha Holdings, Inc. | | | 1,800 | | | | 172,834 | |
Unicharm Corp. | | | 19,200 | | | | 835,337 | |
USS Co. Ltd. | | | 12,100 | | | | 189,047 | |
Welcia Holdings Co. Ltd. | | | 5,000 | | | | 156,165 | |
West Japan Railway Co. | | | 11,800 | | | | 493,510 | |
Yakult Honsha Co. Ltd. | | | 7,800 | | | | 406,920 | |
Yamaha Corp. | | | 6,900 | | | | 340,414 | |
Yamaha Motor Co. Ltd. | | | 16,500 | | | | 396,315 | |
Yamato Holdings Co. Ltd. | | | 13,900 | | | | 326,532 | |
Yaskawa Electric Corp. | | | 13,000 | | | | 637,853 | |
Yokogawa Electric Corp. | | | 9,900 | | | | 178,689 | |
Z Holdings Corp. | | | 129,800 | | | | 748,945 | |
ZOZO, Inc. | | | 5,200 | | | | 162,137 | |
| | | | | | | | |
| | |
| | | | | | | 197,592,166 | |
| | |
| Jordan — 0.0% | | | | | | |
Hikma Pharmaceuticals PLC | | | 8,767 | | | | 263,282 | |
| | | | | | | | |
| | |
| Kuwait — 0.2% | | | | | | |
Agility Public Warehousing Co. KSC | | | 58,377 | | | | 182,223 | |
Boubyan Bank KSCP(a) | | | 58,039 | | | | 151,654 | |
Kuwait Finance House KSCP | | | 258,842 | | | | 712,096 | |
Mabanee Co. KPSC | | | 56,147 | | | | 147,261 | |
Mobile Telecommunications Co. KSC | | | 76,008 | | | | 149,679 | |
National Bank of Kuwait SAKP | | | 334,425 | | | | 1,102,621 | |
| | | | | | | | |
| | |
| | | | | | | 2,445,534 | |
| | |
| Luxembourg — 0.2% | | | | | | |
ArcelorMittal SA | | | 37,109 | | | | 1,190,406 | |
Aroundtown SA | | | 52,261 | | | | 315,258 | |
Eurofins Scientific SE | | | 7,109 | | | | 880,745 | |
Reinet Investments SCA | | | 5,889 | | | | 105,706 | |
Tenaris SA | | | 28,432 | | | | 296,745 | |
| | | | | | | | |
| | |
| | | | | | | 2,788,860 | |
| | |
| Macau — 0.0% | | | | | | |
Sands China Ltd.(a) | | | 130,800 | | | | 303,560 | |
| | | | | | | | |
| | |
| Malaysia — 0.4% | | | | | | |
AMMB Holdings Bhd(a) | | | 68,900 | | | | 52,427 | |
Axiata Group Bhd | | | 165,600 | | | | 165,361 | |
CIMB Group Holdings Bhd | | | 361,800 | | | | 473,261 | |
Dialog Group Bhd | | | 142,134 | | | | 89,358 | |
DiGi.Com Bhd | | | 144,300 | | | | 151,020 | |
Fraser & Neave Holdings Bhd | | | 12,300 | | | | 73,044 | |
Genting Bhd | | | 119,100 | | | | 133,407 | |
Genting Malaysia Bhd | | | 106,100 | | | | 73,294 | |
HAP Seng Consolidated Bhd(d) | | | 64,000 | | | | 118,291 | |
Hartalega Holdings Bhd | | | 88,200 | | | | 121,312 | |
Hong Leong Bank Bhd | | | 31,140 | | | | 139,112 | |
Hong Leong Financial Group Bhd | | | 7,000 | | | | 29,116 | |
IHH Healthcare Bhd | | | 133,900 | | | | 235,916 | |
Inari Amertron Bhd | | | 200,000 | | | | 191,586 | |
| | | | | | | | |
| Security | | Shares | | | Value | |
| | |
| Malaysia (continued) | | | | | | |
IOI Corp. Bhd | | | 102,200 | | | $ | 91,439 | |
Kuala Lumpur Kepong Bhd | | | 17,500 | | | | 91,491 | |
Malayan Banking Bhd | | | 203,800 | | | | 405,944 | |
Malaysia Airports Holdings Bhd(a) | | | 13,700 | | | | 19,663 | |
Maxis Bhd | | | 144,000 | | | | 167,611 | |
MISC Bhd | | | 83,600 | | | | 141,338 | |
Nestle Malaysia Bhd | | | 2,400 | | | | 77,296 | |
Petronas Chemicals Group Bhd | | | 122,200 | | | | 261,648 | |
Petronas Dagangan Bhd | | | 22,000 | | | | 108,710 | |
Petronas Gas Bhd | | | 34,000 | | | | 146,842 | |
PPB Group Bhd | | | 15,120 | | | | 62,062 | |
Press Metal Aluminium Holdings Bhd | | | 155,600 | | | | 215,883 | |
Public Bank Bhd | | | 793,400 | | | | 791,864 | |
QL Resources Bhd(d) | | | 80,400 | | | | 88,197 | |
RHB Bank Bhd | | | 82,424 | | | | 106,164 | |
Sime Darby Bhd | | | 159,000 | | | | 88,610 | |
Sime Darby Plantation Bhd | | | 79,200 | | | | 71,481 | |
Telekom Malaysia Bhd | | | 55,900 | | | | 73,743 | |
Tenaga Nasional Bhd | | | 95,300 | | | | 213,623 | |
Top Glove Corp. Bhd(d) | | | 348,400 | | | | 216,600 | |
Westports Holdings Bhd | | | 70,000 | | | | 68,051 | |
| | | | | | | | |
| | |
| | | | | | | 5,554,765 | |
| | |
| Mexico — 0.6% | | | | | | |
Alfa SAB de CV, Class A | | | 179,985 | | | | 132,030 | |
America Movil SAB de CV, Series L | | | 1,711,759 | | | | 1,813,292 | |
Arca Continental SAB de CV | | | 33,779 | | | | 215,322 | |
Becle SAB de CV | | | 5,783 | | | | 14,506 | |
Cemex SAB de CV(a) | | | 868,117 | | | | 593,146 | |
Coca-Cola Femsa SAB de CV | | | 24,300 | | | | 132,564 | |
Fibra Uno Administracion SA de CV | | | 143,017 | | | | 151,151 | |
Fomento Economico Mexicano SAB de CV | | | 103,621 | | | | 806,276 | |
Gruma SAB de CV, Class B | | | 9,959 | | | | 127,686 | |
Grupo Aeroportuario del Pacifico SAB de CV, Class B | | | 15,800 | | | | 217,730 | |
Grupo Aeroportuario del Sureste SAB de CV, Class B | | | 10,700 | | | | 220,924 | |
Grupo Bimbo SAB de CV, Series A | | | 112,360 | | | | 345,550 | |
Grupo Carso SAB de CV, Series A1 | | | 11,376 | | | | 36,774 | |
Grupo Financiero Banorte SAB de CV, Class O | | | 137,696 | | | | 894,548 | |
Grupo Financiero Inbursa SAB de CV, Class O(a) | | | 99,700 | | | | 119,394 | |
Grupo Mexico SAB de CV, Series B | | | 139,907 | | | | 610,109 | |
Grupo Televisa SAB, Series CPO | | | 109,894 | | | | 206,902 | |
Industrias Penoles SAB de CV | | | 7,755 | | | | 89,217 | |
Kimberly-Clark de Mexico SAB de CV, Class A | | | 78,500 | | | | 118,888 | |
Megacable Holdings SAB de CV, CPO | | | 21,129 | | | | 71,986 | |
Orbia Advance Corp. SAB de CV | | | 36,623 | | | | 93,491 | |
Promotora y Operadora de Infraestructura SAB de CV | | | 14,276 | | | | 111,556 | |
Telesites SAB de CV | | | 105,313 | | | | 107,805 | |
Wal-Mart de Mexico SAB de CV | | | 270,979 | | | | 1,006,998 | |
| | | | | | | | |
| | |
| | | | | | | 8,237,845 | |
| | |
| Netherlands — 3.9% | | | | | | |
ABN AMRO Bank NV(c) | | | 19,393 | | | | 285,071 | |
Adyen NV(a)(c) | | | 989 | | | | 2,596,125 | |
Aegon NV | | | 100,140 | | | | 497,852 | |
Akzo Nobel NV | | | 9,257 | | | | 1,017,019 | |
Argenx SE(a) | | | 2,565 | | | | 912,134 | |
ASM International NV | | | 2,212 | | | | 976,415 | |
ASML Holding NV | | | 20,877 | | | | 16,722,891 | |
Euronext NV(c) | | | 4,560 | | | | 474,076 | |
EXOR NV | | | 5,070 | | | | 453,855 | |
| | |
MASTER PORTFOLIO SCHEDULE OF INVESTMENTS | | 31 |
| | |
Schedule of Investments (continued) December 31, 2021 | | Total International ex U.S. Index Master Portfolio (Percentages shown are based on Net Assets) |
| | | | | | | | |
| Security | | Shares | | | Value | |
| | |
| Netherlands (continued) | | | | | | |
Heineken Holding NV | | | 5,886 | | | $ | 542,718 | |
Heineken NV | | | 13,361 | | | | 1,503,643 | |
IMCD NV | | | 2,928 | | | | 647,097 | |
ING Groep NV | | | 194,963 | | | | 2,710,571 | |
JDE Peet’s NV | | | 6,653 | | | | 205,923 | |
Just Eat Takeaway.com NV(a)(c) | | | 8,799 | | | | 478,058 | |
Koninklijke Ahold Delhaize NV | | | 50,931 | | | | 1,747,765 | |
Koninklijke DSM NV | | | 9,522 | | | | 2,144,414 | |
Koninklijke KPN NV | | | 155,619 | | | | 483,680 | |
Koninklijke Philips NV | | | 47,351 | | | | 1,752,536 | |
NN Group NV | | | 14,389 | | | | 778,161 | |
Prosus NV | | | 46,675 | | | | 3,865,857 | |
QIAGEN NV(a) | | | 12,758 | | | | 707,438 | |
Randstad NV | | | 6,023 | | | | 410,872 | |
Royal Dutch Shell PLC, A Shares | | | 214,262 | | | | 4,695,423 | |
Royal Dutch Shell PLC, B Shares | | | 180,262 | | | | 3,957,935 | |
Stellantis NV | | | 108,852 | | | | 2,054,971 | |
Universal Music Group NV | | | 37,479 | | | | 1,057,358 | |
Wolters Kluwer NV | | | 13,985 | | | | 1,646,047 | |
| | | | | | | | |
| | |
| | | | | | | 55,325,905 | |
| | |
| New Zealand — 0.2% | | | | | | |
Auckland International Airport Ltd.(a) | | | 55,568 | | | | 292,501 | |
Fisher & Paykel Healthcare Corp. Ltd. | | | 27,280 | | | | 611,169 | |
Mercury NZ Ltd. | | | 24,362 | | | | 102,062 | |
Meridian Energy Ltd. | | | 71,629 | | | | 237,756 | |
Ryman Healthcare Ltd. | | | 26,921 | | | | 225,741 | |
Spark New Zealand Ltd. | | | 83,974 | | | | 259,689 | |
Xero Ltd.(a) | | | 6,195 | | | | 634,115 | |
| | | | | | | | |
| | |
| | | | | | | 2,363,033 | |
| | |
| Norway — 0.4% | | | | | | |
Adevinta ASA(a) | | | 11,701 | | | | 155,437 | |
Aker BP ASA | | | 7,860 | | | | 241,684 | |
DNB Bank ASA | | | 48,153 | | | | 1,101,439 | |
Equinor ASA | | | 49,134 | | | | 1,301,033 | |
Gjensidige Forsikring ASA | | | 10,495 | | | | 254,618 | |
Mowi ASA | | | 20,651 | | | | 488,742 | |
Norsk Hydro ASA | | | 62,662 | | | | 493,061 | |
Orkla ASA | | | 34,581 | | | | 346,625 | |
Schibsted ASA, Class A | | | 4,584 | | | | 176,735 | |
Schibsted ASA, B Shares | | | 4,171 | | | | 140,667 | |
Telenor ASA | | | 29,787 | | | | 468,223 | |
Yara International ASA | | | 9,865 | | | | 497,375 | |
| | | | | | | | |
| | |
| | | | | | | 5,665,639 | |
| | |
| Peru — 0.1% | | | | | | |
Cia de Minas Buenaventura SAA, ADR(a) | | | 9,607 | | | | 70,323 | |
Credicorp Ltd. | | | 3,359 | | | | 410,033 | |
Southern Copper Corp.(d) | | | 5,366 | | | | 331,136 | |
| | | | | | | | |
| | |
| | | | | | | 811,492 | |
| | |
| Philippines — 0.2% | | | | | | |
Aboitiz Equity Ventures, Inc. | | | 70,570 | | | | 75,355 | |
AC Energy Corp. | | | 606,700 | | | | 130,876 | |
Ayala Corp. | | | 13,480 | | | | 219,736 | |
Ayala Land, Inc. | | | 317,200 | | | | 228,293 | |
Bank of the Philippine Islands | | | 94,032 | | | | 169,904 | |
BDO Unibank, Inc. | | | 93,622 | | | | 221,564 | |
Globe Telecom, Inc. | | | 905 | | | | 58,997 | |
GT Capital Holdings, Inc. | | | 3,701 | | | | 39,193 | |
International Container Terminal Services, Inc. | | | 41,800 | | | | 163,946 | |
JG Summit Holdings, Inc. | | | 164,265 | | | | 170,508 | |
Jollibee Foods Corp. | | | 45,180 | | | | 191,733 | |
| | | | | | | | |
| Security | | Shares | | | Value | |
| | |
| Philippines (continued) | | | | | | |
Manila Electric Co. | | | 11,960 | | | $ | 69,208 | |
Metro Pacific Investments Corp. | | | 584,000 | | | | 44,662 | |
Metropolitan Bank & Trust Co. | | | 96,987 | | | | 105,919 | |
Monde Nissin Corp.(a)(c) | | | 387,800 | | | | 123,202 | |
PLDT, Inc. | | | 6,295 | | | | 223,690 | |
SM Investments Corp. | | | 9,052 | | | | 167,398 | |
SM Prime Holdings, Inc. | | | 486,150 | | | | 323,161 | |
Universal Robina Corp. | | | 34,300 | | | | 86,099 | |
| | | | | | | | |
| | |
| | | | | | | 2,813,444 | |
| | |
| Poland — 0.2% | | | | | | |
Allegro.eu SA(a)(c) | | | 20,056 | | | | 193,071 | |
Bank Polska Kasa Opieki SA | | | 8,196 | | | | 247,385 | |
CD Projekt SA | | | 3,685 | | | | 175,268 | |
Cyfrowy Polsat SA | | | 8,953 | | | | 77,150 | |
Dino Polska SA(a)(c) | | | 3,219 | | | | 293,446 | |
InPost SA(a) | | | 8,911 | | | | 107,519 | |
KGHM Polska Miedz SA | | | 7,250 | | | | 251,656 | |
LPP SA | | | 55 | | | | 234,789 | |
mBank SA(a) | | | 1,117 | | | | 119,371 | |
Orange Polska SA(a) | | | 32,359 | | | | 67,864 | |
PGE Polska Grupa Energetyczna SA(a) | | | 38,915 | | | | 77,652 | |
Polski Koncern Naftowy ORLEN SA | | | 18,696 | | | | 344,603 | |
Polskie Gornictwo Naftowe i Gazownictwo SA | | | 93,796 | | | | 146,686 | |
Powszechna Kasa Oszczednosci Bank Polski SA(a) | | | 38,504 | | | | 427,075 | |
Powszechny Zaklad Ubezpieczen SA | | | 26,379 | | | | 230,353 | |
Santander Bank Polska SA | | | 1,611 | | | | 138,343 | |
| | | | | | | | |
| | |
| | | | | | | 3,132,231 | |
| | |
| Portugal — 0.1% | | | | | | |
EDP - Energias de Portugal SA. | | | 132,565 | | | | 728,220 | |
Galp Energia SGPS SA | | | 25,061 | | | | 243,170 | |
Jeronimo Martins SGPS SA | | | 17,151 | | | | 392,481 | |
| | | | | | | | |
| | |
| | | | | | | 1,363,871 | |
| | |
| Qatar — 0.2% | | | | | | |
Barwa Real Estate Co. | | | 109,970 | | | | 91,639 | |
Commercial Bank PSQC | | | 100,850 | | | | 185,354 | |
Industries Qatar QSC | | | 97,136 | | | | 409,748 | |
Masraf Al Rayan QSC | | | 154,440 | | | | 195,148 | |
Mesaieed Petrochemical Holding Co. | | | 245,102 | | | | 139,352 | |
Ooredoo QPSC | | | 63,062 | | | | 120,556 | |
Qatar Electricity & Water Co. QSC | | | 34,989 | | | | 158,170 | |
Qatar Fuel QSC | | | 23,217 | | | | 115,576 | |
Qatar Gas Transport Co. Ltd. | | | 132,108 | | | | 118,561 | |
Qatar International Islamic Bank QSC | | | 39,371 | | | | 98,746 | |
Qatar Islamic Bank SAQ | | | 52,150 | | | | 260,317 | |
Qatar National Bank QPSC | | | 225,476 | | | | 1,239,716 | |
| | | | | | | | |
| | |
| | | | | | | 3,132,883 | |
| | |
| Romania — 0.0% | | | | | | |
NEPI Rockcastle PLC | | | 22,422 | | | | 149,152 | |
| | | | | | | | |
| | |
| Russia — 1.0% | | | | | | |
Alrosa AO(a) | | | 105,373 | | | | 171,577 | |
Gazprom PJSC | | | 590,704 | | | | 2,704,774 | |
Inter RAO UES PJSC(a) | | | 2,890,341 | | | | 163,985 | |
LUKOIL PJSC | | | 21,213 | | | | 1,888,872 | |
Magnit PJSC, GDR, Registered Shares | | | 14,877 | | | | 223,127 | |
Mail.Ru Group Ltd., GDR, Registered Shares(a) | | | 5,177 | | | | 59,952 | |
MMC Norilsk Nickel PJSC | | | 3,587 | | | | 1,091,090 | |
Mobile TeleSystems PJSC, ADR | | | 25,223 | | | | 200,523 | |
Moscow Exchange MICEX-RTS PJSC(a) | | | 63,850 | | | | 129,822 | |
Novatek PJSC, GDR, Registered Shares | | | 4,413 | | | | 1,031,781 | |
| | |
| 32 | | 2 0 2 1 BLACK ROCK ANNUAL REPORT TO SHAREHOLDERS |
| | |
Schedule of Investments (continued) December 31, 2021 | | Total International ex U.S. Index Master Portfolio (Percentages shown are based on Net Assets) |
| | | | | | | | |
| Security | | Shares | | | Value | |
| | |
Russia (continued) | | | | | | | | |
Novolipetsk Steel PJSC(a) | | | 58,207 | | | $ | 168,337 | |
Ozon Holdings PLC, ADR(a) | | | 2,417 | | | | 73,061 | |
PhosAgro PJSC, GDR, Registered Shares | | | 7,652 | | | | 165,102 | |
Polymetal International PLC | | | 13,797 | | | | 241,335 | |
Polyus PJSC(a) | | | 1,590 | | | | 277,554 | |
Rosneft Oil Co. PJSC | | | 52,629 | | | | 419,289 | |
Sberbank of Russia PJSC | | | 534,519 | | | | 2,093,970 | |
Severstal PAO | | | 10,830 | | | | 231,029 | |
Surgutneftegas PJSC | | | 413,786 | | | | 218,330 | |
Tatneft PJSC | | | 79,440 | | | | 527,764 | |
TCS Group Holding PLC, Registered Shares | | | 6,905 | | | | 559,652 | |
United Co. RUSAL International(a) | | | 172,792 | | | | 169,971 | |
VTB Bank PJSC | | | 186,510,000 | | | | 119,243 | |
X5 Retail Group NV, GDR, Registered Shares | | | 9,876 | | | | 257,731 | |
Yandex NV, Class A(a) | | | 16,115 | | | | 963,912 | |
| | | | | | | | |
| | | | | | | 14,151,783 | |
| | |
| Saudi Arabia — 1.0% | | | | | | |
Advanced Petrochemical Co. | | | 6,265 | | | | 117,331 | |
Al Rajhi Bank | | | 61,598 | | | | 2,322,999 | |
Alinma Bank | | | 51,081 | | | | 325,406 | |
Almarai Co. JSC | | | 14,060 | | | | 182,776 | |
Arab National Bank | | | 31,320 | | | | 190,744 | |
Bank AlBilad(a) | | | 11,600 | | | | 142,969 | |
Bank Al-Jazira | | | 25,089 | | | | 128,708 | |
Banque Saudi Fransi | | | 38,664 | | | | 485,759 | |
Bupa Arabia for Cooperative Insurance Co. | | | 3,161 | | | | 110,632 | |
Co. for Cooperative Insurance | | | 5,107 | | | | 105,109 | |
Dar Al Arkan Real Estate Development Co.(a) | | | 26,789 | | | | 71,715 | |
Dr Sulaiman Al Habib Medical Services Group Co. | | | 3,988 | | | | 171,238 | |
Emaar Economic City(a) | | | 43,654 | | | | 138,831 | |
Etihad Etisalat Co. | | | 14,520 | | | | 120,436 | |
Jarir Marketing Co. | | | 2,022 | | | | 105,811 | |
Mobile Telecommunications Co. Saudi Arabia(a) | | | 32,501 | | | | 104,031 | |
Mouwasat Medical Services Co. | | | 2,638 | | | | 121,887 | |
National Industrialization Co.(a) | | | 29,825 | | | | 157,914 | |
Rabigh Refining & Petrochemical Co.(a) | | | 21,209 | | | | 116,519 | |
Riyad Bank | | | 75,342 | | | | 543,833 | |
SABIC Agri-Nutrients Co. | | | 11,261 | | | | 528,639 | |
Sahara International Petrochemical Co. | | | 14,239 | | | | 158,690 | |
Saudi Arabian Mining Co.(a) | | | 20,212 | | | | 421,820 | |
Saudi Arabian Oil Co.(c) | | | 110,453 | | | | 1,052,750 | |
Saudi Basic Industries Corp. | | | 42,762 | | | | 1,318,754 | |
Saudi British Bank | | | 49,635 | | | | 435,320 | |
Saudi Cement Co. | | | 5,760 | | | | 83,988 | |
Saudi Electricity Co. | | | 40,008 | | | | 255,173 | |
Saudi Industrial Investment Group | | | 15,022 | | | | 124,418 | |
Saudi Kayan Petrochemical Co.(a) | | | 43,107 | | | | 194,743 | |
Saudi National Bank | | | 113,203 | | | | 1,941,794 | |
Saudi Telecom Co. | | | 28,508 | | | | 852,711 | |
Savola Group | | | 12,960 | | | | 110,319 | |
Yanbu National Petrochemical Co. | | | 12,736 | | | | 232,534 | |
| | | | | | | | |
| | | | | | | 13,476,301 | |
| | |
| Singapore — 0.7% | | | | | | |
Ascendas Real Estate Investment Trust | | | 164,051 | | | | 359,433 | |
BOC Aviation Ltd.(c)(d) | | | 12,300 | | | | 90,117 | |
CapitaLand Integrated Commercial Trust | | | 242,723 | | | | 367,233 | |
Capitaland Investment Ltd.(a) | | | 122,500 | | | | 309,732 | |
City Developments Ltd.(d) | | | 17,400 | | | | 88,033 | |
DBS Group Holdings Ltd. | | | 91,984 | | | | 2,227,756 | |
Genting Singapore Ltd.(d) | | | 233,100 | | | | 134,081 | |
Keppel Corp. Ltd. | | | 81,000 | | | | 308,043 | |
Mapletree Commercial Trust | | | 114,900 | | | | 170,139 | |
| | | | | | | | |
| Security | | Shares | | | Value | |
| | |
Singapore (continued) | | | | | | | | |
Mapletree Logistics Trust | | | 200,049 | | | $ | 282,136 | |
Oversea-Chinese Banking Corp. Ltd.(d) | | | 168,449 | | | | 1,425,710 | |
Sea Ltd., ADR(a)(d) | | | 7,023 | | | | 1,571,115 | |
Singapore Airlines Ltd.(a) | | | 71,999 | | | | 266,954 | |
Singapore Exchange Ltd. | | | 42,100 | | | | 290,615 | |
Singapore Technologies Engineering Ltd. | | | 65,500 | | | | 182,792 | |
Singapore Telecommunications Ltd. | | | 435,300 | | | | 749,360 | |
United Overseas Bank Ltd. | | | 58,900 | | | | 1,176,334 | |
UOL Group Ltd. | | | 22,000 | | | | 115,804 | |
Venture Corp. Ltd. | | | 12,300 | | | | 167,143 | |
| | | | | | | | |
| | | | | | | 10,282,530 | |
| | |
South Africa — 0.9% | | | | | | | | |
Absa Group Ltd. | | | 39,136 | | | | 374,553 | |
African Rainbow Minerals Ltd. | | | 7,134 | | | | 103,516 | |
Anglo American Platinum Ltd. | | | 2,774 | | | | 316,394 | |
AngloGold Ashanti Ltd. | | | 19,921 | | | | 419,448 | |
Aspen Pharmacare Holdings Ltd. | | | 18,439 | | | | 259,708 | |
Bid Corp. Ltd. | | | 14,178 | | | | 290,493 | |
Bidvest Group Ltd. | | | 15,555 | | | | 184,932 | |
Capitec Bank Holdings Ltd. | | | 4,636 | | | | 593,443 | |
Clicks Group Ltd. | | | 17,239 | | | | 341,351 | |
Discovery Ltd.(a)(d) | | | 20,716 | | | | 186,646 | |
Exxaro Resources Ltd. | | | 14,243 | | | | 136,638 | |
FirstRand Ltd. | | | 244,686 | | | | 933,511 | |
Gold Fields Ltd. | | | 43,191 | | | | 477,874 | |
Growthpoint Properties Ltd. | | | 122,689 | | | | 118,339 | |
Harmony Gold Mining Co. Ltd. | | | 22,182 | | | | 93,032 | |
Impala Platinum Holdings Ltd. | | | 38,734 | | | | 546,410 | |
Kumba Iron Ore Ltd. | | | 2,943 | | | | 84,874 | |
Mr Price Group Ltd. | | | 10,819 | | | | 135,689 | |
MTN Group Ltd.(a) | | | 87,240 | | | | 935,121 | |
MultiChoice Group | | | 18,030 | | | | 138,211 | |
Naspers Ltd., N Shares | | | 10,794 | | | | 1,675,348 | |
Nedbank Group Ltd. | | | 31,069 | | | | 341,242 | |
Northam Platinum Holdings Ltd.(a) | | | 18,042 | | | | 237,201 | |
Old Mutual Ltd. | | | 220,791 | | | | 181,510 | |
Pepkor Holdings Ltd.(a)(c) | | | 96,071 | | | | 131,973 | |
Rand Merchant Investment Holdings Ltd. | | | 48,390 | | | | 137,392 | |
Remgro Ltd. | | | 22,131 | | | | 182,145 | |
Sanlam Ltd. | | | 86,962 | | | | 323,945 | |
Sasol Ltd.(a) | | | 32,748 | | | | 536,169 | |
Shoprite Holdings Ltd. | | | 22,378 | | | | 293,336 | |
Sibanye Stillwater Ltd. | | | 137,560 | | | | 427,718 | |
Spar Group Ltd. | | | 12,100 | | | | 126,900 | |
Standard Bank Group Ltd. | | | 59,536 | | | | 523,046 | |
Tiger Brands Ltd. | | | 7,701 | | | | 87,473 | |
Vodacom Group Ltd. | | | 34,946 | | | | 294,977 | |
Woolworths Holdings Ltd. | | | 55,517 | | | | 180,679 | |
| | | | | | | | |
| | | | | | | 12,351,237 | |
| | |
| South Korea — 3.4% | | | | | | |
Alteogen, Inc.(a) | | | 1,407 | | | | 89,475 | |
Amorepacific Corp. | | | 1,902 | | | | 266,918 | |
Amorepacific Group | | | 1,240 | | | | 46,203 | |
BGF retail Co. Ltd. | | | 426 | | | | 52,053 | |
Celltrion Healthcare Co. Ltd. | | | 4,593 | | | | 309,432 | |
Celltrion Pharm, Inc.(a) | | | 745 | | | | 77,874 | |
Celltrion, Inc. | | | 5,118 | | | | 851,986 | |
Cheil Worldwide, Inc. | | | 4,081 | | | | 78,310 | |
CJ CheilJedang Corp. | | | 487 | | | | 158,651 | |
CJ Corp. | | | 848 | | | | 59,423 | |
CJ ENM Co. Ltd. | | | 390 | | | | 45,466 | |
CJ Logistics Corp.(a) | | | 414 | | | | 43,844 | |
| | |
MASTER PORTFOLIO SCHEDULE OF INVESTMENTS | | 33 |
| | |
Schedule of Investments (continued) December 31, 2021 | | Total International ex U.S. Index Master Portfolio (Percentages shown are based on Net Assets) |
| | | | | | | | |
| Security | | Shares | | | Value | |
| | |
| South Korea (continued) | | | | | | |
Coway Co. Ltd. | | | 2,504 | | | $ | 156,879 | |
DB Insurance Co. Ltd. | | | 1,949 | | | | 88,490 | |
Doosan Bobcat, Inc.(a) | | | 2,907 | | | | 99,486 | |
Doosan Heavy Industries & Construction Co. Ltd.(a) | | | 16,537 | | | | 283,138 | |
Douzone Bizon Co. Ltd. | | | 1,032 | | | | 63,295 | |
Ecopro BM Co. Ltd. | | | 621 | | | | 260,910 | |
E-MART, Inc.(a) | | | 661 | | | | 83,796 | |
F&F Co. Ltd. / New(a) | | | 196 | | | | 155,611 | |
Green Cross Corp. | | | 457 | | | | 83,639 | |
GS Engineering & Construction Corp. | | | 4,354 | | | | 144,789 | |
GS Holdings Corp. | | | 2,934 | | | | 96,368 | |
Hana Financial Group, Inc. | | | 13,571 | | | | 479,451 | |
Hankook Tire & Technology Co. Ltd. | | | 4,552 | | | | 152,070 | |
Hanmi Pharm Co. Ltd. | | | 242 | | | | 56,139 | |
Hanon Systems | | | 6,705 | | | | 75,821 | |
Hanwha Solutions Corp.(a) | | | 7,333 | | | | 218,706 | |
HLB, Inc.(a) | | | 6,786 | | | | 198,548 | |
HMM Co. Ltd.(a) | | | 13,009 | | | | 294,271 | |
Hotel Shilla Co. Ltd. | | | 1,174 | | | | 76,943 | |
HYBE Co. Ltd.(a) | | | 1,064 | | | | 311,647 | |
Hyundai Engineering & Construction Co. Ltd. | | | 3,298 | | | | 123,058 | |
Hyundai Glovis Co. Ltd. | | | 1,004 | | | | 141,581 | |
Hyundai Heavy Industries Holdings Co. Ltd. | | | 2,110 | | | | 95,224 | |
Hyundai Mobis Co. Ltd. | | | 3,557 | | | | 760,333 | |
Hyundai Motor Co. | | | 7,239 | | | | 1,270,657 | |
Hyundai Steel Co. | | | 3,455 | | | | 118,984 | |
Iljin Materials Co. Ltd. | | | 1,243 | | | | 140,739 | |
Industrial Bank of Korea(a) | | | 10,461 | | | | 90,496 | |
Kakao Corp.(a) | | | 16,061 | | | | 1,516,676 | |
Kakao Games Corp.(a) | | | 1,768 | | | | 135,112 | |
KakaoBank Corp.(a) | | | 5,667 | | | | 281,264 | |
Kangwon Land, Inc.(a) | | | 4,062 | | | | 82,051 | |
KB Financial Group, Inc. | | | 19,522 | | | | 902,781 | |
Kia Corp. | | | 13,238 | | | | 913,595 | |
Korea Aerospace Industries Ltd. | | | 2,844 | | | | 77,490 | |
Korea Electric Power Corp.(a) | | | 10,419 | | | | 193,457 | |
Korea Investment Holdings Co. Ltd. | | | 1,488 | | | | 100,813 | |
Korea Shipbuilding & Offshore Engineering Co.
Ltd.(a) | | | 1,655 | | | | 131,555 | |
Korea Zinc Co. Ltd. | | | 398 | | | | 171,248 | |
Korean Air Lines Co. Ltd.(a) | | | 8,579 | | | | 211,261 | |
Krafton, Inc.(a) | | | 1,156 | | | | 446,787 | |
KT&G Corp.(a) | | | 6,333 | | | | 420,751 | |
Kumho Petrochemical Co. Ltd. | | | 1,183 | | | | 164,915 | |
L&F Co. Ltd.(a) | | | 1,254 | | | | 233,344 | |
LG Chem Ltd. | | | 2,512 | | | | 1,298,608 | |
LG Corp. | | | 3,510 | | | | 238,916 | |
LG Display Co. Ltd.(a) | | | 10,040 | | | | 207,002 | |
LG Electronics, Inc.(a) | | | 4,936 | | | | 571,493 | |
LG Household & Health Care Ltd. | | | 441 | | | | 407,028 | |
LG Innotek Co. Ltd. | | | 809 | | | | 247,327 | |
LG Uplus Corp. | | | 6,969 | | | | 79,519 | |
Lotte Chemical Corp. | | | 865 | | | | 157,794 | |
Lotte Shopping Co. Ltd. | | | 260 | | | | 19,051 | |
Meritz Securities Co. Ltd. | | | 25,240 | | | | 109,282 | |
Mirae Asset Securities Co. Ltd. | | | 9,107 | | | | 66,160 | |
NAVER Corp. | | | 6,006 | | | | 1,906,432 | |
NCSoft Corp. | | | 791 | | | | 427,241 | |
Netmarble Corp.(c) | | | 1,410 | | | | 148,093 | |
NH Investment & Securities Co. Ltd. | | | 5,312 | | | | 55,792 | |
Orion Corp./Republic of Korea | | | 907 | | | | 78,955 | |
| | | | | | | | |
| Security | | Shares | | | Value | |
| | |
South Korea (continued) | | | | | | | | |
Pan Ocean Co. Ltd. | | | 24,785 | | | $ | 112,725 | |
Pearl Abyss Corp.(a) | | | 1,729 | | | | 200,934 | |
POSCO | | | 3,587 | | | | 831,778 | |
POSCO Chemical Co. Ltd. | | | 2,049 | | | | 247,599 | |
S-1 Corp. | | | 442 | | | | 27,503 | |
Samsung Biologics Co. Ltd.(a)(c) | | | 944 | | | | 716,785 | |
Samsung C&T Corp. | | | 4,015 | | | | 401,179 | |
Samsung Electro-Mechanics Co. Ltd. | | | 3,088 | | | | 512,148 | |
Samsung Electronics Co. Ltd. | | | 242,549 | | | | 15,929,384 | |
Samsung Engineering Co. Ltd.(a) | | | 6,952 | | | | 133,665 | |
Samsung Fire & Marine Insurance Co. Ltd. | | | 1,332 | | | | 226,274 | |
Samsung Heavy Industries Co. Ltd.(a) | | | 32,333 | | | | 154,145 | |
Samsung Life Insurance Co. Ltd. | | | 3,145 | | | | 169,349 | |
Samsung SDI Co. Ltd.(a) | | | 2,838 | | | | 1,560,820 | |
Samsung SDS Co. Ltd. | | | 2,432 | | | | 319,459 | |
Samsung Securities Co. Ltd. | | | 2,723 | | | | 102,669 | |
SD Biosensor, Inc.(a) | | | 2,813 | | | | 132,279 | |
Seegene, Inc. | | | 1,744 | | | | 89,492 | |
Shin Poong Pharmaceutical Co. Ltd. | | | 1,384 | | | | 37,083 | |
Shinhan Financial Group Co. Ltd. | | | 22,744 | | | | 702,768 | |
SK Biopharmaceuticals Co. Ltd.(a) | | | 734 | | | | 59,957 | |
SK Bioscience Co. Ltd.(a) | | | 894 | | | | 169,211 | |
SK Chemicals Co. Ltd. | | | 589 | | | | 73,740 | |
SK Hynix, Inc.(a) | | | 27,563 | | | | 3,027,316 | |
SK IE Technology Co. Ltd.(a)(c) | | | 745 | | | | 105,195 | |
SK Innovation Co. Ltd.(a) | | | 2,876 | | | | 575,865 | |
SK Square Co. Ltd.(a) | | | 1,293 | | | | 72,223 | |
SK Telecom Co. Ltd. | | | 2,001 | | | | 97,241 | |
SK, Inc. | | | 2,218 | | | | 467,597 | |
SKC Co. Ltd. | | | 1,153 | | | | 168,519 | |
S-Oil Corp. | | | 2,657 | | | | 190,964 | |
Woori Financial Group, Inc. | | | 25,605 | | | | 273,060 | |
Yuhan Corp. | | | 2,039 | | | | 106,523 | |
| | | | | | | | |
| | | | | | | 48,197,946 | |
| | |
| Spain — 1.4% | | | | | | |
ACS Actividades de Construccion y Servicios SA | | | 13,008 | | | | 346,807 | |
Aena SME SA(a)(c) | | | 3,809 | | | | 599,856 | |
Amadeus IT Group SA(a) | | | 22,401 | | | | 1,515,746 | |
Banco Bilbao Vizcaya Argentaria SA | | | 339,942 | | | | 2,016,189 | |
Banco Santander SA | | | 857,572 | | | | 2,848,062 | |
CaixaBank SA | | | 237,510 | | | | 648,792 | |
Cellnex Telecom SA(c) | | | 25,790 | | | | 1,493,953 | |
EDP Renovaveis SA | | | 14,549 | | | | 361,797 | |
Enagas SA | | | 8,450 | | | | 196,305 | |
Endesa SA | | | 16,421 | | | | 378,035 | |
Ferrovial SA | | | 24,064 | | | | 752,569 | |
Grifols SA | | | 14,947 | | | | 287,620 | |
Iberdrola SA | | | 294,603 | | | | 3,488,092 | |
Industria de Diseno Textil SA | | | 53,944 | | | | 1,739,696 | |
Naturgy Energy Group SA | | | 14,040 | | | | 456,653 | |
Red Electrica Corp. SA | | | 20,753 | | | | 448,771 | |
Repsol SA | | | 69,044 | | | | 817,697 | |
Siemens Gamesa Renewable Energy SA(a) | | | 13,551 | | | | 321,807 | |
Telefonica SA | | | 271,300 | | | | 1,176,413 | |
| | | | | | | | |
| | | | | | | 19,894,860 | |
| | |
| Sweden — 2.3% | | | | | | |
Alfa Laval AB | | | 15,879 | | | | 637,852 | |
Assa Abloy AB, Class B | | | 48,687 | | | | 1,484,027 | |
Atlas Copco AB, A Shares | | | 36,213 | | | | 2,502,348 | |
Atlas Copco AB, B Shares | | | 19,330 | | | | 1,135,449 | |
Boliden AB | | | 15,302 | | | | 590,041 | |
Electrolux AB | | | 12,552 | | | | 304,005 | |
| | |
| 34 | | 2 0 2 1 BLACK ROCK ANNUAL REPORT TO SHAREHOLDERS |
| | |
Schedule of Investments (continued) December 31, 2021 | | Total International ex U.S. Index Master Portfolio (Percentages shown are based on Net Assets) |
| | | | | | | | |
| Security | | Shares | | | Value | |
| | |
| Sweden (continued) | | | | | | |
Embracer Group AB(a) | | | 27,798 | | | $ | 294,909 | |
Epiroc AB, Class A | | | 32,873 | | | | 831,220 | |
Epiroc AB, Class B | | | 21,727 | | | | 459,465 | |
EQT AB | | | 14,363 | | | | 778,619 | |
Essity AB, Class B | | | 30,432 | | | | 992,838 | |
Evolution AB(c) | | | 9,160 | | | | 1,294,683 | |
Fastighets AB Balder, B Shares(a) | | | 4,951 | | | | 356,293 | |
Getinge AB | | | 11,374 | | | | 495,703 | |
H & M Hennes & Mauritz AB, B Shares | | | 36,265 | | | | 711,596 | |
Hexagon AB, B Shares | | | 101,318 | | | | 1,604,932 | |
Husqvarna AB, B Shares | | | 19,743 | | | | 315,669 | |
Industrivarden AB, A Shares | | | 4,631 | | | | 147,146 | |
Industrivarden AB, C Shares | | | 8,883 | | | | 278,310 | |
Investment AB Latour, B Shares | | | 6,110 | | | | 248,240 | |
Investor AB | | | 17,036 | | | | 448,177 | |
Investor AB, B Shares | | | 102,401 | | | | 2,569,580 | |
Kinnevik AB, Class B(a) | | | 12,635 | | | | 449,220 | |
L E Lundbergforetagen AB, B Shares | | | 3,350 | | | | 187,686 | |
Lifco AB | | | 11,555 | | | | 345,132 | |
Lundin Energy AB | | | 9,142 | | | | 327,126 | |
Nibe Industrier AB, B Shares | | | 70,396 | | | | 1,063,679 | |
Sagax AB, Class B | | | 9,152 | | | | 307,850 | |
Sandvik AB | | | 55,974 | | | | 1,560,193 | |
Securitas AB, B Shares | | | 13,331 | | | | 183,387 | |
Sinch AB(a)(c) | | | 23,930 | | | | 301,957 | |
Skandinaviska Enskilda Banken AB, Class A | | | 84,633 | | | | 1,175,007 | |
Skanska AB, B Shares | | | 16,387 | | | | 423,459 | |
SKF AB, B Shares | | | 18,679 | | | | 441,753 | |
Svenska Cellulosa AB SCA, Class B | | | 32,013 | | | | 568,048 | |
Svenska Handelsbanken AB, A Shares | | | 76,947 | | | | 831,639 | |
Swedbank AB, A Shares | | | 48,976 | | | | 984,213 | |
Swedish Match AB | | | 86,180 | | | | 684,156 | |
Tele2 AB, B Shares | | | 26,650 | | | | 380,180 | |
Telefonaktiebolaget LM Ericsson, B Shares | | | 147,753 | | | | 1,625,732 | |
Telia Co. AB | | | 123,682 | | | | 483,716 | |
Volvo AB, A Shares | | | 10,115 | | | | 237,273 | |
Volvo AB, B Shares | | | 76,858 | | | | 1,777,455 | |
| | | | | | | | |
| | | | | | | 32,819,963 | |
| | |
| Switzerland — 6.7% | | | | | | |
ABB Ltd., Registered Shares | | | 83,465 | | | | 3,181,083 | |
Adecco Group AG, Registered Shares | | | 7,309 | | | | 372,447 | |
Alcon, Inc. | | | 24,882 | | | | 2,194,725 | |
Bachem Holding AG | | | 294 | | | | 230,216 | |
Baloise Holding AG, Registered Shares | | | 2,595 | | | | 423,537 | |
Barry Callebaut AG, Registered Shares | | | 155 | | | | 376,286 | |
Chocoladefabriken Lindt & Spruengli AG | | | 49 | | | | 679,181 | |
Chocoladefabriken Lindt & Spruengli AG, Registered Shares | | | 5 | | | | 670,544 | |
Cie Financiere Richemont SA, Class A, Registered Shares | | | 26,310 | | | | 3,931,630 | |
Clariant AG, Registered Shares | | | 8,166 | | | | 169,631 | |
Coca-Cola HBC AG | | | 8,866 | | | | 306,988 | |
Credit Suisse Group AG, Registered Shares | | | 137,334 | | | | 1,331,538 | |
EMS-Chemie Holding AG, Registered Shares | | | 333 | | | | 372,154 | |
Geberit AG, Registered Shares | | | 1,962 | | | | 1,599,292 | |
Givaudan SA, Registered Shares | | | 497 | | | | 2,607,562 | |
Holcim Ltd., Registered Shares | | | 24,381 | | | | 1,239,994 | |
Julius Baer Group Ltd. | | | 11,737 | | | | 784,880 | |
Kuehne + Nagel International AG, Registered Shares | | | 2,624 | | | | 845,078 | |
Logitech International SA, Registered Shares | | | 8,815 | | | | 739,469 | |
Lonza Group AG, Registered Shares | | | 3,793 | | | | 3,158,006 | |
| | | | | | | | |
| Security | | Shares | | | Value | |
| | |
| Switzerland (continued) | | | | | | |
Nestle SA, Registered Shares | | | 142,907 | | | $ | 19,952,288 | |
Novartis AG, Registered Shares | | | 111,212 | | | | 9,772,418 | |
Partners Group Holding AG | | | 1,146 | | | | 1,891,828 | |
Roche Holding AG | | | 37,042 | | | | 15,429,945 | |
Schindler Holding AG | | | 2,203 | | | | 591,351 | |
Schindler Holding AG, Registered Shares | | | 1,003 | | | | 268,039 | |
SGS SA, Registered Shares | | | 315 | | | | 1,050,114 | |
Sika AG, Registered Shares | | | 7,253 | | | | 3,014,471 | |
Sonova Holding AG, Registered Shares | | | 2,860 | | | | 1,117,679 | |
STMicroelectronics NV | | | 34,711 | | | | 1,706,911 | |
Straumann Holding AG, Registered Shares | | | 553 | | | | 1,169,369 | |
Swatch Group AG | | | 1,397 | | | | 425,437 | |
Swatch Group AG, Registered Shares | | | 3,546 | | | | 207,323 | |
Swiss Life Holding AG, Registered Shares | | | 1,650 | | | | 1,008,112 | |
Swiss Prime Site AG, Registered Shares | | | 3,151 | | | | 309,327 | |
Swiss Re AG | | | 15,887 | | | | 1,568,261 | |
Swisscom AG, Registered Shares | | | 1,435 | | | | 809,518 | |
Temenos AG, Registered Shares | | | 3,470 | | | | 478,309 | |
UBS Group AG, Registered Shares | | | 182,810 | | | | 3,281,309 | |
VAT Group AG(c) | | | 1,377 | | | | 682,336 | |
Vifor Pharma AG | | | 2,227 | | | | 395,621 | |
Zurich Insurance Group AG | | | 7,441 | | | | 3,259,746 | |
| | | | | | | | |
| | | | | | | 93,603,953 | |
| | |
| Taiwan — 4.5% | | | | | | |
Accton Technology Corp. | | | 27,000 | | | | 252,995 | |
Acer, Inc. | | | 179,504 | | | | 197,101 | |
Advantech Co. Ltd. | | | 15,157 | | | | 216,674 | |
ASE Technology Holding Co. Ltd. | | | 147,343 | | | | 569,365 | |
Asia Cement Corp. | | | 94,233 | | | | 150,663 | |
ASMedia Technology, Inc. | | | 2,000 | | | | 131,151 | |
Asustek Computer, Inc. | | | 38,220 | | | | 518,854 | |
AU Optronics Corp. | | | 414,000 | | | | 342,237 | |
Catcher Technology Co. Ltd. | | | 45,000 | | | | 254,393 | |
Cathay Financial Holding Co. Ltd. | | | 433,488 | | | | 976,584 | |
Chailease Holding Co. Ltd. | | | 58,716 | | | | 558,496 | |
Chang Hwa Commercial Bank Ltd. | | | 246,513 | | | | 151,388 | |
Cheng Shin Rubber Industry Co. Ltd. | | | 66,436 | | | | 86,580 | |
China Development Financial Holding Corp. | | | 694,191 | | | | 438,445 | |
China Steel Corp. | | | 635,638 | | | | 811,115 | |
Chunghwa Telecom Co. Ltd. | | | 187,000 | | | | 787,194 | |
Compal Electronics, Inc. | | | 192,000 | | | | 167,847 | |
CTBC Financial Holding Co. Ltd. | | | 1,005,601 | | | | 942,047 | |
Delta Electronics, Inc. | | | 101,000 | | | | 1,002,141 | |
E.Sun Financial Holding Co. Ltd. | | | 633,918 | | | | 642,512 | |
Eclat Textile Co. Ltd. | | | 6,303 | | | | 143,621 | |
eMemory Technology, Inc. | | | 3,000 | | | | 236,774 | |
Evergreen Marine Corp. Taiwan Ltd. | | | 144,139 | | | | 738,413 | |
Far Eastern New Century Corp. | | | 80,607 | | | | 85,244 | |
Far EasTone Telecommunications Co. Ltd. | | | 140,000 | | | | 326,607 | |
Feng TAY Enterprise Co. Ltd. | | | 21,318 | | | | 178,192 | |
First Financial Holding Co. Ltd. | | | 497,742 | | | | 440,277 | |
Formosa Chemicals & Fibre Corp. | | | 161,360 | | | | 470,622 | |
Formosa Petrochemical Corp. | | | 50,000 | | | | 172,889 | |
Formosa Plastics Corp. | | | 186,040 | | | | 698,258 | |
Foxconn Technology Co. Ltd. | | | 43,007 | | | | 100,714 | |
Fubon Financial Holding Co. Ltd. | | | 392,596 | | | | 1,080,630 | |
Giant Manufacturing Co. Ltd. | | | 21,000 | | | | 261,366 | |
Globalwafers Co. Ltd. | | | 12,000 | | | | 384,434 | |
Hiwin Technologies Corp. | | | 13,545 | | | | 149,904 | |
Hon Hai Precision Industry Co. Ltd. | | | 631,800 | | | | 2,369,337 | |
Hotai Motor Co. Ltd. | | | 13,000 | | | | 288,062 | |
Hua Nan Financial Holdings Co. Ltd. | | | 466,213 | | | | 356,854 | |
| | |
MASTER PORTFOLIO SCHEDULE OF INVESTMENTS | | 35 |
| | |
Schedule of Investments (continued) December 31, 2021 | | Total International ex U.S. Index Master Portfolio (Percentages shown are based on Net Assets) |
| | | | | | | | |
| Security | | Shares | | | Value | |
| | |
| Taiwan (continued) | | | | | | |
Innolux Corp. | | | 428,494 | | | $ | 302,796 | |
Inventec Corp. | | | 92,470 | | | | 83,282 | |
Largan Precision Co. Ltd. | | | 5,000 | | | | 444,829 | |
Lite-On Technology Corp. | | | 99,816 | | | | 229,851 | |
MediaTek, Inc. | | | 80,255 | | | | 3,443,702 | |
Mega Financial Holding Co. Ltd. | | | 502,110 | | | | 644,844 | |
Micro-Star International Co. Ltd. | | | 37,000 | | | | 214,303 | |
momo.com Inc. | | | 2,000 | | | | 117,092 | |
Nan Ya Plastics Corp. | | | 270,790 | | | | 834,234 | |
Nan Ya Printed Circuit Board Corp. | | | 12,000 | | | | 247,181 | |
Nanya Technology Corp. | | | 50,000 | | | | 140,831 | |
Nien Made Enterprise Co. Ltd. | | | 9,000 | | | | 134,008 | |
Novatek Microelectronics Corp. | | | 31,000 | | | | 601,967 | |
Oneness Biotech Co. Ltd.(a) | | | 11,000 | | | | 114,306 | |
Parade Technologies Ltd. | | | 4,000 | | | | 304,320 | |
Pegatron Corp. | | | 110,000 | | | | 274,461 | |
Pou Chen Corp. | | | 92,000 | | | | 110,062 | |
President Chain Store Corp. | | | 26,000 | | | | 256,726 | |
Quanta Computer, Inc. | | | 138,000 | | | | 471,301 | |
Realtek Semiconductor Corp. | | | 23,240 | | | | 485,560 | |
Ruentex Development Co. Ltd. | | | 72,206 | | | | 166,137 | |
Shanghai Commercial & Savings Bank Ltd. | | | 166,512 | | | | 284,038 | |
Shin Kong Financial Holding Co. Ltd. | | | 671,499 | | | | 267,600 | |
SinoPac Financial Holdings Co. Ltd. | | | 547,741 | | | | 319,438 | |
Synnex Technology International Corp. | | | 58,500 | | | | 139,774 | |
Taishin Financial Holding Co. Ltd. | | | 471,635 | | | | 322,655 | |
Taiwan Cement Corp. | | | 256,055 | | | | 443,780 | |
Taiwan Cooperative Financial Holding Co. Ltd. | | | 469,676 | | | | 431,554 | |
Taiwan High Speed Rail Corp. | | | 140,000 | | | | 149,590 | |
Taiwan Mobile Co. Ltd. | | | 63,800 | | | | 230,415 | |
Taiwan Semiconductor Manufacturing Co. Ltd. | | | 1,251,000 | | | | 27,673,364 | |
Unimicron Technology Corp. | | | 58,000 | | | | 482,674 | |
Uni-President Enterprises Corp. | | | 245,950 | | | | 608,927 | |
United Microelectronics Corp. | | | 605,000 | | | | 1,417,376 | |
Vanguard International Semiconductor Corp. | | | 38,000 | | | | 216,457 | |
Voltronic Power Technology Corp. | | | 3,000 | | | | 167,364 | |
Wan Hai Lines Ltd. | | | 34,100 | | | | 243,217 | |
Win Semiconductors Corp. | | | 16,000 | | | | 215,893 | |
Winbond Electronics Corp. | | | 163,000 | | | | 199,587 | |
Wistron Corp. | | | 133,161 | | | | 140,137 | |
Wiwynn Corp. | | | 6,000 | | | | 241,335 | |
WPG Holdings Ltd. | | | 78,448 | | | | 149,046 | |
Yageo Corp. | | | 19,783 | | | | 342,041 | |
Yang Ming Marine Transport Corp.(a) | | | 110,000 | | | | 478,448 | |
Yuanta Financial Holding Co. Ltd. | | | 449,550 | | | | 410,634 | |
Zhen Ding Technology Holding Ltd. | | | 37,710 | | | | 136,621 | |
| | | | | | | | |
| | | | | | | 63,013,738 | |
| | |
| Thailand — 0.5% | | | | | | |
Advanced Info Service PCL, NVDR | | | 61,700 | | | | 424,430 | |
Airports of Thailand PCL, NVDR(a) | | | 219,900 | | | | 400,418 | |
Asset World Corp. PCL, NVDR(a) | | | 606,100 | | | | 83,968 | |
B Grimm Power PCL, NVDR | | | 88,000 | | | | 106,863 | |
Bangkok Commercial Asset Management PCL, NVDR | | | 123,200 | | | | 79,565 | |
Bangkok Dusit Medical Services PCL, NVDR | | | 563,700 | | | | 387,716 | |
Bangkok Expressway & Metro PCL | | | 553,100 | | | | 139,946 | |
BTS Group Holdings PCL, NVDR(d) | | | 513,400 | | | | 143,502 | |
Bumrungrad Hospital PCL, NVDR | | | 22,400 | | | | 94,261 | |
Central Pattana PCL, NVDR | | | 102,400 | | | | 173,135 | |
Central Retail Corp. PCL, NVDR | | | 103,400 | | | | 98,958 | |
Charoen Pokphand Foods PCL, NVDR | | | 204,000 | | | | 155,870 | |
| | | | | | | | |
| Security | | Shares | | | Value | |
| | |
| Thailand (continued) | | | | | | |
CP ALL PCL, NVDR | | | 291,000 | | | $ | 513,591 | |
Delta Electronics Thailand PCL, NVDR | | | 14,000 | | | | 173,316 | |
Electricity Generating PCL, NVDR | | | 23,800 | | | | 124,908 | |
Energy Absolute PCL, NVDR | | | 98,300 | | | | 282,127 | |
Global Power Synergy PCL, NVDR | | | 42,200 | | | | 112,216 | |
Gulf Energy Development PCL, NVDR | | | 120,400 | | | | 164,906 | |
Home Product Center PCL, NVDR | | | 339,932 | | | | 147,471 | |
Indorama Ventures PCL, NVDR | | | 97,000 | | | | 125,410 | |
Intouch Holdings PCL, NVDR | | | 34,500 | | | | 82,842 | |
Krung Thai Bank PCL, NVDR | | | 285,275 | | | | 112,459 | |
Krungthai Card PCL, NVDR | | | 24,000 | | | | 42,572 | |
Land & Houses PCL, NVDR | | | 601,300 | | | | 158,088 | |
Minor International PCL, NVDR(a) | | | 146,680 | | | | 126,121 | |
Muangthai Capital PCL, NVDR | | | 57,700 | | | | 101,236 | |
Osotspa PCL, NVDR | | | 81,600 | | | | 83,630 | |
PTT Exploration & Production PCL, NVDR | | | 76,522 | | | | 269,772 | |
PTT Global Chemical PCL, NVDR | | | 115,068 | | | | 202,245 | |
PTT Oil & Retail Business PCL, NVDR | | | 127,800 | | | | 103,156 | |
PTT PCL, NVDR | | | 530,000 | | | | 601,462 | |
Siam Cement PCL, NVDR | | | 32,500 | | | | 375,736 | |
Siam Commercial Bank PCL, NVDR | | | 41,800 | | | | 158,662 | |
Sri Trang Gloves Thailand PCL, NVDR(d) | | | 105,700 | | | | 95,717 | |
Srisawad Corp. PCL, NVDR | | | 53,800 | | | | 99,228 | |
Thai Oil PCL, NVDR | | | 51,600 | | | | 76,358 | |
Thai Union Group PCL, NVDR | | | 228,000 | | | | 133,150 | |
True Corp. PCL, NVDR(d) | | | 783,140 | | | | 111,988 | |
| | | | | | | | |
| | | | | | | 6,866,999 | |
| | |
| Turkey — 0.0% | | | | | | |
Akbank TAS | | | 148,211 | | | | 80,041 | |
BIM Birlesik Magazalar A/S | | | 17,408 | | | | 80,665 | |
Eregli Demir ve Celik Fabrikalari TAS, Registered Shares | | | 51,754 | | | | 110,167 | |
Ford Otomotiv Sanayi A/S | | | 2,700 | | | | 48,596 | |
KOC Holding A/S | | | 17,992 | | | | 38,598 | |
Turkcell Iletisim Hizmetleri A/S | | | 33,444 | | | | 46,668 | |
Turkiye Garanti Bankasi A/S | | | 101,489 | | | | 86,372 | |
Turkiye Is Bankasi A/S, Class C | | | 88,347 | | | | 47,853 | |
Turkiye Petrol Rafinerileri A/S(a) | | | 5,076 | | | | 59,276 | |
| | | | | | | | |
| | | | | | | 598,236 | |
| | |
| United Arab Emirates — 0.3% | | | | | | |
Abu Dhabi Commercial Bank PJSC | | | 124,127 | | | | 287,985 | |
Abu Dhabi Islamic Bank PJSC | | | 34,506 | | | | 64,428 | |
Abu Dhabi National Oil Co. for Distribution PJSC | | | 126,679 | | | | 147,267 | |
Aldar Properties PJSC | | | 176,567 | | | | 191,731 | |
Dubai Islamic Bank PJSC | | | 174,226 | | | | 254,639 | |
Emaar Properties PJSC | | | 172,958 | | | | 229,840 | |
Emirates NBD Bank PJSC | | | 124,476 | | | | 458,830 | |
Emirates Telecommunications Group Co. PJSC | | | 177,970 | | | | 1,537,725 | |
First Abu Dhabi Bank PJSC | | | 229,078 | | | | 1,174,999 | |
| | | | | | | | |
| | | | | | | 4,347,444 | |
| | |
| United Kingdom — 8.0% | | | | | | |
3i Group PLC | | | 52,356 | | | | 1,026,348 | |
Abrdn PLC | | | 126,751 | | | | 412,957 | |
Admiral Group PLC | | | 11,740 | | | | 502,524 | |
Anglo American PLC | | | 64,084 | | | | 2,635,917 | |
Ashtead Group PLC | | | 23,604 | | | | 1,902,825 | |
Associated British Foods PLC | | | 15,776 | | | | 431,851 | |
AstraZeneca PLC | | | 77,965 | | | | 9,103,921 | |
Auto Trader Group PLC(c) | | | 58,215 | | | | 583,016 | |
AVEVA Group PLC | | | 6,894 | | | | 318,104 | |
Aviva PLC | | | 198,882 | | | | 1,108,603 | |
| | |
| 36 | | 2 0 2 1 BLACK ROCK ANNUAL REPORT TO SHAREHOLDERS |
| | |
Schedule of Investments (continued) December 31, 2021 | | Total International ex U.S. Index Master Portfolio (Percentages shown are based on Net Assets) |
| | | | | | | | |
| Security | | Shares | | | Value | |
| | |
| United Kingdom (continued) | | | | | | |
BAE Systems PLC | | | 176,432 | | | $ | 1,315,687 | |
Barclays PLC | | | 851,378 | | | | 2,168,682 | |
Barratt Developments PLC | | | 47,948 | | | | 486,887 | |
Berkeley Group Holdings PLC | | | 5,722 | | | | 370,529 | |
BP PLC | | | 1,010,441 | | | | 4,527,403 | |
British American Tobacco PLC | | | 112,128 | | | | 4,163,504 | |
British Land Co. PLC | | | 47,803 | | | | 345,201 | |
BT Group PLC | | | 467,577 | | | | 1,075,660 | |
Bunzl PLC | | | 15,923 | | | | 622,037 | |
Burberry Group PLC | | | 21,147 | | | | 521,956 | |
CK Hutchison Holdings Ltd. | | | 135,508 | | | | 872,458 | |
CNH Industrial NV | | | 55,358 | | | | 1,070,303 | |
Coca-Cola European Partners PLC | | | 10,271 | | | | 574,457 | |
Compass Group PLC(a) | | | 88,732 | | | | 1,997,684 | |
Croda International PLC | | | 6,884 | | | | 942,911 | |
DCC PLC | | | 4,685 | | | | 383,529 | |
Diageo PLC | | | 119,205 | | | | 6,517,657 | |
Evraz PLC | | | 27,295 | | | | 223,159 | |
Ferguson PLC | | | 11,390 | | | | 2,023,167 | |
GlaxoSmithKline PLC | | | 254,925 | | | | 5,550,418 | |
Halma PLC | | | 19,718 | | | | 854,950 | |
Hargreaves Lansdown PLC | | | 17,098 | | | | 314,196 | |
HSBC Holdings PLC | | | 1,037,011 | | | | 6,262,777 | |
Imperial Brands PLC | | | 46,724 | | | | 1,023,947 | |
Informa PLC(a) | | | 90,797 | | | | 635,722 | |
InterContinental Hotels Group PLC(a) | | | 9,063 | | | | 585,914 | |
Intertek Group PLC | | | 9,200 | | | | 701,844 | |
J Sainsbury PLC | | | 105,979 | | | | 396,146 | |
JD Sports Fashion PLC | | | 144,085 | | | | 424,835 | |
Johnson Matthey PLC | | | 10,313 | | | | 286,577 | |
Kingfisher PLC | | | 97,026 | | | | 446,295 | |
Land Securities Group PLC | | | 31,499 | | | | 332,439 | |
Legal & General Group PLC | | | 305,536 | | | | 1,233,843 | |
Lloyds Banking Group PLC | | | 3,536,830 | | | | 2,296,787 | |
London Stock Exchange Group PLC | | | 16,498 | | | | 1,551,969 | |
M&G PLC | | | 119,534 | | | | 323,377 | |
Melrose Industries PLC | | | 240,178 | | | | 522,335 | |
Mondi PLC | | | 27,075 | | | | 671,566 | |
National Grid PLC | | | 179,500 | | | | 2,588,262 | |
Natwest Group PLC | | | 274,853 | | | | 841,686 | |
Next PLC | | | 6,073 | | | | 671,692 | |
Ocado Group PLC(a) | | | 24,539 | | | | 558,295 | |
Pearson PLC | | | 45,043 | | | | 373,665 | |
Persimmon PLC | | | 15,288 | | | | 592,548 | |
Phoenix Group Holdings PLC | | | 27,913 | | | | 247,086 | |
Prudential PLC | | | 130,357 | | | | 2,254,243 | |
Reckitt Benckiser Group PLC | | | 37,174 | | | | 3,200,072 | |
RELX PLC | | | 96,818 | | | | 3,160,808 | |
Rentokil Initial PLC | | | 86,686 | | | | 686,184 | |
Rio Tinto PLC | | | 54,294 | | | | 3,580,485 | |
Rolls-Royce Holdings PLC(a) | | | 478,219 | | | | 798,212 | |
Sage Group PLC | | | 59,257 | | | | 685,659 | |
Schroders PLC | | | 7,593 | | | | 366,494 | |
Segro PLC | | | 62,242 | | | | 1,211,337 | |
Severn Trent PLC | | | 12,635 | | | | 504,540 | |
Smith & Nephew PLC | | | 47,556 | | | | 829,965 | |
Smiths Group PLC | | | 19,423 | | | | 415,755 | |
Spirax-Sarco Engineering PLC | | | 3,703 | | | | 805,885 | |
SSE PLC | | | 50,259 | | | | 1,123,549 | |
St James’s Place PLC | | | 24,806 | | | | 566,872 | |
Standard Chartered PLC | | | 131,932 | | | | 802,250 | |
| | | | | | | | |
| Security | | Shares | | | Value | |
| | |
| United Kingdom (continued) | | | | | | |
Taylor Wimpey PLC | | | 211,225 | | | $ | 503,587 | |
Tesco PLC | | | 382,866 | | | | 1,507,372 | |
Unilever PLC | | | 130,340 | | | | 6,992,278 | |
United Utilities Group PLC | | | 38,207 | | | | 563,761 | |
Vodafone Group PLC | | | 1,401,541 | | | | 2,111,051 | |
Whitbread PLC(a) | | | 11,605 | | | | 472,064 | |
WPP PLC | | | 56,546 | | | | 861,067 | |
| | | | | | | | |
| | | | | | | 112,521,598 | |
| | |
| United States — 0.1% | | | | | | |
Bausch Health Cos., Inc.(a) | | | 17,238 | | | | 476,142 | |
Brookfield Renewable Corp., Class A | | | 7,825 | | | | 287,959 | |
Legend Biotech Corp., ADR(a)(d) | | | 2,709 | | | | 126,266 | |
| | | | | | | | |
| | | | | | | 890,367 | |
| | | | | | | | |
| | |
| Total Common Stocks — 97.3% | | | | | | |
(Cost: $940,319,335) | | | | | | | 1,365,658,833 | |
| | | | | | | | |
| | |
| Preferred Securities | | | | | | |
| | |
| Preferred Stocks — 0.9% | | | | | | |
| | |
| Brazil — 0.3% | | | | | | |
Banco Bradesco SA, Preference Shares | | | 271,839 | | | | 942,414 | |
Braskem SA, Preference Shares, Class A | | | 16,049 | | | | 169,612 | |
Centrais Eletricas Brasileiras SA, Preference B Shares | | | 9,466 | | | | 55,930 | |
Cia Energetica de Minas Gerais, Preference Shares | | | 39,778 | | | | 94,936 | |
Gerdau SA, Preference Shares | | | 52,056 | | | | 255,897 | |
Itau Unibanco Holding SA, Preference Shares | | | 245,491 | | | | 925,167 | |
Itausa SA, Preference Shares | | | 225,674 | | | | 360,945 | |
Petroleo Brasileiro SA, Preference Shares | | | 224,252 | | | | 1,139,232 | |
| | | | | | | | |
| | | | | | | 3,944,133 | |
| | | | | | | | |
| | |
| Chile — 0.0% | | | | | | |
Sociedad Quimica y Minera de Chile SA, Preference Shares Class B | | | 5,827 | | | | 297,475 | |
| | | | | | | | |
| | |
| Colombia — 0.0% | | | | | | |
Bancolombia SA, Preference Shares | | | 21,944 | | | | 172,702 | |
| | | | | | | | |
| | |
| Germany — 0.4% | | | | | | |
Bayerische Motoren Werke AG, Preference Shares | | | 3,282 | | | | 272,165 | |
Fuchs Petrolub SE, Preference Shares | | | 3,377 | | | | 152,603 | |
Henkel AG & Co. KGaA, Preference Shares | | | 11,206 | | | | 904,224 | |
Porsche Automobil Holding SE, Preference Shares | | | 7,398 | | | | 698,466 | |
Sartorius AG, Preference Shares | | | 1,235 | | | | 835,280 | |
Volkswagen AG, Preference Shares | | | 9,487 | | | | 1,905,778 | |
| | | | | | | | |
| | | | | | | 4,768,516 | |
| | | | | | | | |
| | |
| Russia — 0.0% | | | | | | |
Surgutneftegas PJSC, Preference Shares | | | 376,618 | | | | 193,420 | |
| | | | | | | | |
| | |
| South Korea — 0.2% | | | | | | |
Hyundai Motor Co., Preference Shares | | | 2,624 | | | | 220,743 | |
LG Chem Ltd., Preference Shares | | | 208 | | | | 50,188 | |
LG Household & Health Care Ltd., Preference Shares | | | 199 | | | | 103,045 | |
Samsung Electronics Co. Ltd., Preference Shares | | | 41,666 | | | | 2,491,029 | |
| | | | | | | | |
| | | | | | | 2,865,005 | |
| | | | | | | | |
| | |
MASTER PORTFOLIO SCHEDULE OF INVESTMENTS | | 37 |
| | |
Schedule of Investments (continued) December 31, 2021 | | Total International ex U.S. Index Master Portfolio (Percentages shown are based on Net Assets) |
| | | | | | | | |
| Security | | Shares | | | Value | |
| | |
| Taiwan — 0.0% | | | | | | |
China Development Financial | | | 106,239 | | | $ | 36,825 | |
| | | | | | | | |
| | |
Total Preferred Securities — 0.9%
(Cost: $9,927,063) | | | | | | | 12,278,076 | |
| | | | | | | | |
| | |
Rights | | | | | | | | |
| | |
| China — 0.0% | | | | | | |
Seazen Group Ltd., (Expires: 03/28/22)(a) | | | 5,142 | | | | — | |
| | | | | | | | |
| | |
| South Korea — 0.0% | | | | | | |
Doosan Heavy Industries & Construction, (Expires: 02/09/22)(a) | | | 2,104 | | | | 7,787 | |
| | | | | | | | |
| | |
Total Rights — 0.0%
(Cost: $ — ) | | | | | | | 7,787 | |
| | | | | | | | |
| | |
Total Long-Term Investments — 98.2%
(Cost: $950,246,398) | | | | | | | 1,377,944,696 | |
| | | | | | | | |
| | |
Short-Term Securities | | | | | | | | |
| | |
| Money Market Funds — 4.6% | | | | | | |
BlackRock Cash Funds: Institutional, SL Agency Shares, 0.10%(g)(h)(i) | | | 39,388,840 | | | | 39,400,656 | |
BlackRock Cash Funds: Treasury, SL Agency Shares, 0.01%(g)(h) | | | 24,644,820 | | | | 24,644,820 | |
| | | | | | | | |
| | |
Total Short-Term Securities — 4.6%
(Cost: $64,047,966) | | | | | | | 64,045,476 | |
| | | | | | | | |
| | |
Total Investments — 102.8%
(Cost: $1,014,294,364) | | | | | | | 1,441,990,172 | |
| | |
Liabilities in Excess of Other
Assets — (2.8)% | | | | | | | (38,788,038 | ) |
| | | | | | | | |
| | |
Net Assets — 100.0% | | | | | | $ | 1,403,202,134 | |
| | | | | | | | |
| (a) | Non-income producing security. |
| (b) | A security contractually bound to one or more other securities to form a single saleable unit which cannot be sold separately. |
| (c) | Security exempt from registration pursuant to Rule 144A under the Securities Act of 1933, as amended. These securities may be resold in transactions exempt from registration to qualified institutional investors. |
| (d) | All or a portion of this security is on loan. |
| (e) | Security is valued using significant unobservable inputs and is classified as Level 3 in the fair value hierarchy. |
| (f) | Rounds to less than 1,000. |
| (g) | Affiliate of the Master Portfolio. |
| (h) | Annualized 7-day yield as of period end. |
| (i) | All or a portion of this security was purchased with the cash collateral from loaned securities. |
Affiliates
Investments in issuers considered to be affiliate(s) of the Master Portfolio during the year ended December 31, 2021 for purposes of Section 2(a)(3) of the Investment Company Act of 1940, as amended, were as follows:
| | | | | | | | | | | | | | | | | | | | | | | | | | | | | | | | | | | | |
| Affiliated Issuer | | Value at
12/31/20 | | | Purchases
at Cost | | | Proceeds
from Sales | | | Net
Realized
Gain (Loss) | | | Change in
Unrealized
Appreciation
(Depreciation) | | | Value at
12/31/21 | | | Shares
Held at
12/31/21 | | | Income | | | Capital Gain
Distributions
from
Underlying
Funds | |
BlackRock Cash Funds: Institutional, SL Agency Shares | | $ | 28,246,049 | | | $ | 11,162,794 | (a) | | $ | — | | | $ | 5,346 | | | $ | (13,533 | ) | | $ | 39,400,656 | | | | 39,388,840 | | | $ | 187,463 | (b) | | $ | — | |
BlackRock Cash Funds: Treasury, SL Agency Shares | | | 11,863,928 | | | | 12,780,892 | (a) | | | — | | | | — | | | | — | | | | 24,644,820 | | | | 24,644,820 | | | | 1,344 | | | | — | |
| | | | | | | | | | | | | | | | | | | | | | | | | | | | | | | | | | | | |
| | | | | | | | | | | | | | $ | 5,346 | | | $ | (13,533 | ) | | $ | 64,045,476 | | | | | | | $ | 188,807 | | | $ | — | |
| | | | | | | | | | | | | | | | | | | | | | | | | | | | | | | | | | | | |
| | (a) | Represents net amount purchased (sold). | |
| | (b) | All or a portion represents securities lending income earned from the reinvestment of cash collateral from loaned securities, net of fees and collateral investment expenses, and other payments to and from borrowers of securities. | |
| | |
| 38 | | 2 0 2 1 BLACK ROCK ANNUAL REPORT TO SHAREHOLDERS |
| | |
Schedule of Investments (continued) December 31, 2021 | | Total International ex U.S. Index Master Portfolio |
Derivative Financial Instruments Outstanding as of Period End
| | | | | | | | | | | | | | | | |
| Futures Contracts | | | | | | | | | | | | |
| Description | | Number of
Contracts | | | Expiration
Date | | | Notional
Amount (000) | | | Value/
Unrealized
Appreciation
(Depreciation) | |
Long Contracts | | | | | | | | | | | | | | | | |
S&P/TSE 60 Index Mini | | | 44 | | | | 03/17/22 | | | $ | 2,228 | | | $ | 19,620 | |
MSCI EAFE Index | | | 157 | | | | 03/18/22 | | | | 18,226 | | | | 186,229 | |
MSCI Emerging Markets Index | | | 72 | | | | 03/18/22 | | | | 4,415 | | | | 23,692 | |
| | | | | | | | | | | | | | | | |
| | | | | | | | | | | | | | $ | 229,541 | |
| | | | | | | | | | | | | | | | |
Derivative Financial Instruments Categorized by Risk Exposure
As of period end, the fair values of derivative financial instruments located in the Statement of Assets and Liabilities were as follows:
| | | | | | | | | | | | | | | | | | | | | | | | | | | | |
| | | Commodity
Contracts | | | Credit
Contracts | | | Equity
Contracts | | | Foreign
Currency
Exchange
Contracts | | | Interest
Rate
Contracts | | | Other
Contracts | | | Total | |
Assets — Derivative Financial Instruments | | | | | | | | | | | | | | | | | | | | | | | | | | | | |
Futures contracts | | | | | | | | | | | | | | | | | | | | | | | | | | | | |
Unrealized appreciation on futures contracts(a) | | $ | — | | | $ | — | | | $ | 229,541 | | | $ | — | | | $ | — | | | $ | — | | | $ | 229,541 | |
| | | | | | | | | | | | | | | | | | | | | | | | | | | | |
| | (a) | Net cumulative unrealized appreciation (depreciation) on futures contracts and centrally cleared swaps, if any, are reported in the Master Portfolio Schedule of Investments. In the Statement of Assets and Liabilities, only current day’s variation margin is reported in receivables or payables and the net cumulative unrealized appreciation (depreciation) is included in net unrealized appreciation (depreciation). | |
For the period ended December 31, 2021, the effect of derivative financial instruments in the Statement of Operations was as follows:
| | | | | | | | | | | | | | | | | | | | | | | | | | | | |
| | | Commodity
Contracts | | | Credit
Contracts | | | Equity
Contracts | | | Foreign
Currency
Exchange
Contracts | | | Interest
Rate
Contracts | | | Other
Contracts | | | Total | |
Net Realized Gain (Loss) from: | | | | | | | | | | | | | | | | | | | | | | | | | | | | |
Futures contracts | | $ | — | | | $ | — | | | $ | 130,794 | | | $ | — | | | $ | — | | | $ | — | | | $ | 130,794 | |
| | | | | | | | | | | | | | | | | | | | | | | | | | | | |
Net Change in Unrealized Appreciation (Depreciation) on: | | | | | | | | | | | | | | | | | | | | | | | | | | | | |
Futures contracts | | $ | — | | | $ | — | | | $ | 105,787 | | | $ | — | | | $ | — | | | $ | — | | | $ | 105,787 | |
| | | | | | | | | | | | | | | | | | | | | | | | | | | | |
Average Quarterly Balances of Outstanding Derivative Financial Instruments
| | | | |
| | | | |
Futures contracts: | | | | |
Average notional value of contracts — long | | $ | 17,878,434 | |
For more information about the Master Portfolio’s investment risks regarding derivative financial instruments, refer to the Notes to Financial Statements.
Fair Value Hierarchy as of Period End
Various inputs are used in determining the fair value of financial instruments. For a description of the input levels and information about the Master Portfolio’s policy regarding valuation of financial instruments, refer to the Notes to Financial Statements.
The following table summarizes the Master Portfolio’s financial instruments categorized in the fair value hierarchy. The breakdown of the Master Portfolio’s financial instruments into major categories is disclosed in the Schedule of Investments above.
| | | | | | | | | | | | | | | | |
| | | Level 1 | | | Level 2 | | | Level 3 | | | Total | |
Assets | | | | | | | | | | | | | | | | |
Investments | | | | | | | | | | | | | | | | |
Long-Term Investments | | | | | | | | | | | | | | | | |
Common Stocks | | | | | | | | | | | | | | | | |
Australia | | $ | — | | | $ | 64,984,592 | | | $ | — | | | $ | 64,984,592 | |
Austria | | | — | | | | 2,171,567 | | | | — | | | | 2,171,567 | |
Belgium | | | — | | | | 7,101,335 | | | | — | | | | 7,101,335 | |
| | |
MASTER PORTFOLIO SCHEDULE OF INVESTMENTS | | 39 |
| | |
Schedule of Investments (continued) December 31, 2021 | | Total International ex U.S. Index Master Portfolio |
Fair Value Hierarchy as of Period End (continued)
| | | | | | | | | | | | | | | | |
| | | Level 1 | | | Level 2 | | | Level 3 | | | Total | |
Common Stocks (continued) | | | | | | | | | | | | | | | | |
Brazil | | $ | — | | | $ | 12,080,944 | | | $ | — | | | $ | 12,080,944 | |
Canada | | | 102,283,548 | | | | — | | | | — | | | | 102,283,548 | |
Chile | | | 616,346 | | | | 902,005 | | | | — | | | | 1,518,351 | |
China | | | 16,350,312 | | | | 110,427,413 | | | | 31,394 | | | | 126,809,119 | |
Colombia | | | 177,985 | | | | 294,995 | | | | — | | | | 472,980 | |
Czech Republic | | | 488,507 | | | | 162,473 | | | | — | | | | 650,980 | |
Denmark | | | — | | | | 23,629,647 | | | | — | | | | 23,629,647 | |
Egypt | | | — | | | | 225,972 | | | | — | | | | 225,972 | |
Finland | | | — | | | | 11,124,110 | | | | — | | | | 11,124,110 | |
France | | | 697,652 | | | | 97,733,575 | | | | — | | | | 98,431,227 | |
Germany | | | 786,526 | | | | 71,111,555 | | | | — | | | | 71,898,081 | |
Greece | | | 66,791 | | | | 803,516 | | | | 2 | | | | 870,309 | |
Hong Kong | | | 876,137 | | | | 25,128,980 | | | | — | | | | 26,005,117 | |
Hungary | | | 215,313 | | | | 693,994 | | | | — | | | | 909,307 | |
India | | | 4,869,448 | | | | 44,752,889 | | | | — | | | | 49,622,337 | |
Indonesia | | | 97,268 | | | | 5,650,130 | | | | — | | | | 5,747,398 | |
Ireland | | | — | | | | 9,176,057 | | | | — | | | | 9,176,057 | |
Isle of Man | | | — | | | | 622,456 | | | | — | | | | 622,456 | |
Israel | | | 2,751,104 | | | | 3,764,950 | | | | — | | | | 6,516,054 | |
Italy | | | — | | | | 17,846,728 | | | | — | | | | 17,846,728 | |
Japan | | | — | | | | 197,367,033 | | | | 225,133 | | | | 197,592,166 | |
Jordan | | | — | | | | 263,282 | | | | — | | | | 263,282 | |
Kuwait | | | 147,261 | | | | 2,298,273 | | | | — | | | | 2,445,534 | |
Luxembourg | | | 105,706 | | | | 2,683,154 | | | | — | | | | 2,788,860 | |
Macau | | | — | | | | 303,560 | | | | — | | | | 303,560 | |
Malaysia | | | 1,992,784 | | | | 3,561,981 | | | | — | | | | 5,554,765 | |
Mexico | | | 8,237,845 | | | | — | | | | — | | | | 8,237,845 | |
Netherlands | | | 1,541,038 | | | | 53,784,867 | | | | — | | | | 55,325,905 | |
New Zealand | | | — | | | | 2,363,033 | | | | — | | | | 2,363,033 | |
Norway | | | 140,667 | | | | 5,524,972 | | | | — | | | | 5,665,639 | |
Peru | | | 811,492 | | | | — | | | | — | | | | 811,492 | |
Philippines | | | 1,429,785 | | | | 1,383,659 | | | | — | | | | 2,813,444 | |
Poland | | | 780,768 | | | | 2,351,463 | | | | — | | | | 3,132,231 | |
Portugal | | | 392,481 | | | | 971,390 | | | | — | | | | 1,363,871 | |
Qatar | | | 2,874,970 | | | | 257,913 | | | | — | | | | 3,132,883 | |
Romania | | | 149,152 | | | | — | | | | — | | | | 149,152 | |
Russia | | | 200,523 | | | | 13,951,260 | | | | — | | | | 14,151,783 | |
Saudi Arabia | | | 2,735,090 | | | | 10,741,211 | | | | — | | | | 13,476,301 | |
Singapore | | | 1,571,115 | | | | 8,711,415 | | | | — | | | | 10,282,530 | |
South Africa | | | 4,010,977 | | | | 8,340,260 | | | | — | | | | 12,351,237 | |
South Korea | | | 744,469 | | | | 47,453,477 | | | | — | | | | 48,197,946 | |
Spain | | | — | | | | 19,894,860 | | | | — | | | | 19,894,860 | |
Sweden | | | — | | | | 32,819,963 | | | | — | | | | 32,819,963 | |
Switzerland | | | 1,349,725 | | | | 92,254,228 | | | | — | | | | 93,603,953 | |
Taiwan | | | 114,306 | | | | 62,899,432 | | | | — | | | | 63,013,738 | |
Thailand | | | 95,717 | | | | 6,771,282 | | | | — | | | | 6,866,999 | |
Turkey | | | 324,694 | | | | 273,542 | | | | — | | | | 598,236 | |
United Arab Emirates | | | 1,322,266 | | | | 3,025,178 | | | | — | | | | 4,347,444 | |
United Kingdom | | | 574,457 | | | | 111,947,141 | | | | — | | | | 112,521,598 | |
United States | | | 890,367 | | | | — | | | | — | | | | 890,367 | |
Preferred Securities | | | | | | | | | | | | | | | | |
Preferred Stocks | | | | | | | | | | | | | | | | |
South Korea | | | — | | | | 2,865,005 | | | | — | | | | 2,865,005 | |
Brazil | | | — | | | | 3,944,133 | | | | — | | | | 3,944,133 | |
Chile | | | — | | | | 297,475 | | | | — | | | | 297,475 | |
Colombia | | | 172,702 | | | | — | | | | — | | | | 172,702 | |
Russia | | | — | | | | 193,420 | | | | — | | | | 193,420 | |
Germany | | | — | | | | 4,768,516 | | | | — | | | | 4,768,516 | |
Taiwan | | | 36,825 | | | | — | | | | — | | | | 36,825 | |
Rights | | | 7,787 | | | | — | | | | — | | | | 7,787 | |
| | |
| 40 | | 2 0 2 1 BLACK ROCK ANNUAL REPORT TO SHAREHOLDERS |
| | |
Schedule of Investments (continued) December 31, 2021 | | Total International ex U.S. Index Master Portfolio |
Fair Value Hierarchy as of Period End (continued)
| | | | | | | | | | | | | | | | |
| | | Level 1 | | | Level 2 | | | Level 3 | | | Total | |
Short-Term Securities | | | | | | | | | | | | | | | | |
Money Market Funds | | $ | 64,045,476 | | | $ | — | | | $ | — | | | $ | 64,045,476 | |
| | | | | | | | | | | | | | | | |
| | $ | 227,077,382 | | | $ | 1,214,656,261 | | | $ | 256,529 | | | $ | 1,441,990,172 | |
| | | | | | | | | | | | | | | | |
Derivative Financial Instruments(a) | | | | | | | | | | | | | | | | |
Assets | | | | | | | | | | | | | | | | |
Equity Contracts | | $ | 229,541 | | | $ | — | | | $ | — | | | $ | 229,541 | |
| | | | | | | | | | | | | | | | |
| | (a) | Derivative financial instruments are futures contracts. Futures contracts are valued at the unrealized appreciation (depreciation) on the instrument. | |
See notes to financial statements.
| | |
MASTER PORTFOLIO SCHEDULE OF INVESTMENTS | | 41 |
Statement of Assets and Liabilities
December 31, 2021
| | | | |
| | | Total International ex U.S. Index Master Portfolio | |
| |
ASSETS | | | | |
Investments, at value — unaffiliated(a)(b) | | $ | 1,377,944,696 | |
Investments, at value — affiliated(c) | | | 64,045,476 | |
Cash pledged for futures contracts | | | 878,000 | |
Foreign currency, at value(d) | | | 864,484 | |
Receivables: | | | | |
Investments sold | | | 3,921 | |
Securities lending income — affiliated | | | 14,330 | |
Contributions from investors | | | 1,023,663 | |
Dividends — unaffiliated | | | 1,628,456 | |
Dividends — affiliated | | | 61 | |
Prepaid expenses | | | 4,840 | |
| | | | |
Total assets | | | 1,446,407,927 | |
| | | | |
| |
LIABILITIES | | | | |
Collateral on securities loaned | | | 39,385,157 | |
Payables: | | | | |
Investments purchased | | | 2,411,813 | |
Accounting services fees | | | 147,462 | |
Deferred foreign capital gain tax | | | 1,077,232 | |
Investment advisory fees | | | 12,206 | |
Trustees’ fees | | | 4,289 | |
Other accrued expenses | | | 72,168 | |
Professional fees | | | 52,110 | |
Variation margin on futures contracts | | | 43,356 | |
| | | | |
Total liabilities | | | 43,205,793 | |
| | | | |
| |
NET ASSETS | | $ | 1,403,202,134 | |
| | | | |
| |
NET ASSETS CONSIST OF | | | | |
Investors’ capital | | $ | 976,347,723 | |
Net unrealized appreciation (depreciation) | | | 426,854,411 | |
| | | | |
NET ASSETS | | $ | 1,403,202,134 | |
| | | | |
| |
(a) Investments, at cost — unaffiliated | | $ | 950,246,398 | |
(b) Securities loaned, at value | | $ | 37,875,776 | |
(c) Investments, at cost — affiliated | | $ | 64,047,966 | |
(d) Foreign currency, at cost. | | $ | 866,410 | |
| |
| See notes to financial statements. | | | | |
| | |
| 42 | | 2 0 2 1 BLACK ROCK ANNUAL REPORT TO SHAREHOLDERS |
Statement of Operations
Year Ended December 31, 2021
| | | | | | | | |
| | | Total International ex U.S. Index Master Portfolio | |
| |
| | |
INVESTMENT INCOME | | | | | | | | |
Dividends — unaffiliated | | | | | | $ | 36,080,070 | |
Dividends — affiliated | | | | | | | 1,344 | |
Securities lending income — affiliated — net | | | | | | | 187,463 | |
Non-cash dividends — unaffiliated | | | | | | | 2,042,914 | |
Foreign taxes withheld | | | | | | | (4,363,011 | ) |
| | | | | | | | |
Total investment income | | | | | | | 33,948,780 | |
| | | | | | | | |
| | |
EXPENSES | | | | | | | | |
Accounting services | | | | | | | 405,690 | |
Investment advisory | | | | | | | 405,151 | |
Pricing | | | | | | | 81,345 | |
Professional | | | | | | | 75,945 | |
Trustees | | | | | | | 10,863 | |
Miscellaneous | | | | | | | 28,810 | |
| | | | | | | | |
Total expenses | | | | | | | 1,007,804 | |
Less: | | | | | | | | |
Fees waived and/or reimbursed by the Manager | | | | | | | (29,134 | ) |
| | | | | | | | |
Total expenses after fees waived and/or reimbursed | | | | | | | 978,670 | |
| | | | | | | | |
Net investment income | | | | | | | 32,970,110 | |
| | | | | | | | |
| | |
REALIZED AND UNREALIZED GAIN (LOSS) | | | | | | | | |
Net realized gain (loss) from: | | | | | | | | |
Investments — unaffiliated(a) | | | | | | | (8,019,627 | ) |
Investments — affiliated | | | | | | | 5,346 | |
Foreign currency transactions | | | | | | | (330,166 | ) |
Futures contracts | | | | | | | 130,794 | |
| | | | | | | | |
| | | | | | | (8,213,653 | ) |
| | | | | | | | |
Net change in unrealized appreciation (depreciation) on: | | | | | | | | |
Investments — unaffiliated(b) | | | | | | | 70,915,329 | |
Investments — affiliated | | | | | | | (13,533 | ) |
Foreign currency translations | | | | | | | (155,645 | ) |
Futures contracts | | | | | | | 105,787 | |
| | | | | | | | |
| | | | | | | 70,851,938 | |
| | | | | | | | |
Net realized and unrealized gain | | | | | | | 62,638,285 | |
| | | | | | | | |
| | |
NET INCREASE IN NET ASSETS RESULTING FROM OPERATIONS | | | | | | $ | 95,608,395 | |
| | | | | | | | |
| | |
(a) Net of foreign capital gain tax and capital gain tax refund, if applicable of | | | | | | $ | (126,880 | ) |
(b) Net of increase in deferred foreign capital gain tax of | | | | | | $ | (667,267 | ) |
See notes to financial statements.
| | |
MASTER PORTFOLIO FINANCIAL STATEMENTS | | 43 |
Statements of Changes in Net Assets
| | | | | | | | |
| | | Total International ex U.S. Index
Master Portfolio | |
| |
| | | Year Ended December 31, | |
| | | | |
| | |
| | | 2021 | | | 2020 | |
| |
| | |
INCREASE (DECREASE) IN NET ASSETS | | | | | | | | |
| | |
OPERATIONS | | | | | | | | |
Net investment income | | $ | 32,970,110 | | | $ | 23,221,506 | |
Net realized loss | | | (8,213,653 | ) | | | (26,575,264 | ) |
Net change in unrealized appreciation (depreciation) | | | 70,851,938 | | | | 137,122,346 | |
| | | | | | | | |
Net increase in net assets resulting from operations | | | 95,608,395 | | | | 133,768,588 | |
| | | | | | | | |
| | |
CAPITAL TRANSACTIONS | | | | | | | | |
Proceeds from contributions | | | 900,216,526 | | | | 507,738,832 | |
Value of withdrawals | | | (798,980,542 | ) | | | (530,057,182 | ) |
| | | | | | | | |
Net increase (decrease) in net assets derived from capital transactions | | | 101,235,984 | | | | (22,318,350 | ) |
| | | | | | | | |
| | |
NET ASSETS | | | | | | | | |
Total increase in net assets | | | 196,844,379 | | | | 111,450,238 | |
Beginning of year | | | 1,206,357,755 | | | | 1,094,907,517 | |
| | | | | | | | |
End of year | | $ | 1,403,202,134 | | | $ | 1,206,357,755 | |
| | | | | | | | |
See notes to financial statements.
| | |
| 44 | | 2 0 2 1 BLACK ROCK ANNUAL REPORT TO SHAREHOLDERS |
Financial Highlights
| | | | | | | | | | | | | | | | | | | | |
| | | Total International ex U.S. Index Master Portfolio | |
| |
| | | Year Ended December 31, | |
| | | | |
| | | | | |
| | | 2021 | | | 2020 | | | 2019 | | | 2018 | | | 2017 | |
| |
| | | | | |
Total Return | | | | | | | | | | | | | | | | | | | | |
Total return | | | 7.70 | % | | | 10.82 | % | | | 21.29 | % | | | (13.87 | )% | | | 27.67 | % |
| | | | | | | | | | | | | | | | | | | | |
| | | | | |
Ratios to Average Net Assets(a) | | | | | | | | | | | | | | | | | | | | |
Total expenses | | | 0.07 | % | | | 0.09 | % | | | 0.08 | % | | | 0.08 | % | | | 0.07 | % |
| | | | | | | | | | | | | | | | | | | | |
| | | | | |
Total expenses after fees waived and/or reimbursed | | | 0.07 | % | | | 0.09 | % | | | 0.08 | % | | | 0.08 | % | | | 0.07 | % |
| | | | | | | | | | | | | | | | | | | | |
| | | | | |
Net investment income | | | 2.44 | % | | | 2.30 | % | | | 3.17 | % | | | 2.87 | % | | | 2.85 | % |
| | | | | | | | | | | | | | | | | | | | |
| | | | | |
Supplemental Data | | | | | | | | | | | | | | | | | | | | |
Net assets, end of year (000) | | $ | 1,403,202 | | | $ | 1,206,358 | | | $ | 1,094,908 | | | $ | 759,697 | | | $ | 1,048,849 | |
| | | | | | | | | | | | | | | | | | | | |
| | | | | |
Portfolio turnover rate | | | 13 | % | | | 23 | % | | | 5 | % | | | 40 | % | | | 57 | % |
| | | | | | | | | | | | | | | | | | | | |
| (a) | Excludes fees and expenses incurred indirectly as a result of investments in underlying funds. |
See notes to financial statements.
| | |
MASTER PORTFOLIO FINANCIAL HIGHLIGHTS | | 45 |
Notes to Financial Statements
Master Investment Portfolio (“MIP”) is registered under the Investment Company Act of 1940, as amended (the “1940 Act”), as an open-end management investment company. MIP is organized as a Delaware statutory trust. Total International ex U.S. Index Master Portfolio (the “Master Portfolio”) is a series of MIP. The Master Portfolio is classified as diversified.
The Master Portfolio, together with certain other registered investment companies advised by BlackRock Fund Advisors (“BFA” or the “Manager”) or its affiliates, is included in a complex of open-end equity, multi-asset, index and money market funds referred to as the BlackRock Multi-Asset Complex.
| 2. | SIGNIFICANT ACCOUNTING POLICIES |
The financial statements are prepared in conformity with accounting principles generally accepted in the United States of America (“U.S. GAAP”), which may require management to make estimates and assumptions that affect the reported amounts of assets and liabilities in the financial statements, disclosure of contingent assets and liabilities at the date of the financial statements and the reported amounts of increases and decreases in net assets from operations during the reporting period. Actual results could differ from those estimates. The Master Portfolio is considered an investment company under U.S. GAAP and follows the accounting and reporting guidance applicable to investment companies. Below is a summary of significant accounting policies:
Investment Transactions and Income Recognition: For financial reporting purposes, investment transactions are recorded on the dates the transactions are executed. Realized gains and losses on investment transactions are determined using the specific identification method. Dividend income and capital gain distributions, if any, are recorded on the ex-dividend dates. Non-cash dividends, if any, are recorded on the ex-dividend dates at fair value. Dividends from foreign securities where the ex-dividend dates may have passed are subsequently recorded when the Master Portfolio is informed of the ex-dividend dates. Under the applicable foreign tax laws, a withholding tax at various rates may be imposed on capital gains, dividends and interest. Upon notification from issuers, a portion of the dividend income received from a real estate investment trust may be redesignated as a reduction of cost of the related investment and/or realized gain.
Foreign Currency Translation: The Master Portfolio’s books and records are maintained in U.S. dollars. Securities and other assets and liabilities denominated in foreign currencies are translated into U.S. dollars using exchange rates determined as of the close of trading on the New York Stock Exchange (“NYSE”). Purchases and sales of investments are recorded at the rates of exchange prevailing on the respective dates of such transactions. Generally, when the U.S. dollar rises in value against a foreign currency, the investments denominated in that currency will lose value; the opposite effect occurs if the U.S. dollar falls in relative value.
The Master Portfolio does not isolate the effect of fluctuations in foreign exchange rates from the effect of fluctuations in the market prices of investments for financial reporting purposes. Accordingly, the effects of changes in exchange rates on investments are not segregated in the Statement of Operations from the effects of changes in market prices of those investments, but are included as a component of net realized and unrealized gain (loss) from investments. The Master Portfolio reports realized currency gains (losses) on foreign currency related transactions as components of net realized gain (loss) for financial reporting purposes, whereas such components are generally treated as ordinary income for U.S. federal income tax purposes.
Foreign Taxes: The Master Portfolio may be subject to foreign taxes (a portion of which may be reclaimable) on income, stock dividends, capital gains on investments, or certain foreign currency transactions. All foreign taxes are recorded in accordance with the applicable foreign tax regulations and rates that exist in the foreign jurisdictions in which the Master Portfolio invests. These foreign taxes, if any, are paid by the Master Portfolio and are reflected in its Statement of Operations as follows: foreign taxes withheld at source are presented as a reduction of income, foreign taxes on securities lending income are presented as a reduction of securities lending income, foreign taxes on stock dividends are presented as “Foreign taxes withheld”, and foreign taxes on capital gains from sales of investments and foreign taxes on foreign currency transactions are included in their respective net realized gain (loss) categories. Foreign taxes payable or deferred as of December 31, 2021, if any, are disclosed in the Statement of Assets and Liabilities.
The Master Portfolio files withholding tax reclaims in certain jurisdictions to recover a portion of amounts previously withheld. The Master Portfolio may record a reclaim receivable based on collectability, which includes factors such as the jurisdiction’s applicable laws, payment history and market convention. The Statement of Operations includes tax reclaims recorded as well as professional and other fees, if any, associated with recovery of foreign withholding taxes.
Segregation and Collateralization: In cases where the Master Portfolio enters into certain investments (e.g., futures contracts) that would be treated as “senior securities” for 1940 Act purposes, the Master Portfolio may segregate or designate on its books and records cash or liquid assets having a market value at least equal to the amount of its future obligations under such investments. Doing so allows the investment to be excluded from treatment as a “senior security.” Furthermore, if required by an exchange or counterparty agreement, the Master Portfolio may be required to deliver/deposit cash and/or securities to/with an exchange, or broker-dealer or custodian as collateral for certain investments or obligations.
Indemnifications: In the normal course of business, the Master Portfolio enters into contracts that contain a variety of representations that provide general indemnification. The Master Portfolio’s maximum exposure under these arrangements is unknown because it involves future potential claims against the Master Portfolio, which cannot be predicted with any certainty.
Other: Expenses directly related to the Master Portfolio are charged to the Master Portfolio. Other operating expenses shared by several funds, including other funds managed by the Manager, are prorated among those funds on the basis of relative net assets or other appropriate methods.
| | |
| 46 | | 2 0 2 1 BLACK ROCK ANNUAL REPORT TO SHAREHOLDERS |
Notes to Financial Statements (continued)
| 3. | INVESTMENT VALUATION AND FAIR VALUE MEASUREMENTS |
Investment Valuation Policies: The Master Portfolio’s investments are valued at fair value (also referred to as “market value” within the financial statements) each day that the Master Portfolio is open for business and, for financial reporting purposes, as of the report date. U.S. GAAP defines fair value as the price a master portfolio would receive to sell an asset or pay to transfer a liability in an orderly transaction between market participants at the measurement date. The Master Portfolio determines the fair values of its financial instruments using various independent dealers or pricing services under policies approved by the Board of Trustees of the MIP (the “Board”). If a security’s market price is not readily available or does not otherwise accurately represent the fair value of the security, the security will be valued in accordance with a policy approved by the Board as reflecting fair value. The BlackRock Global Valuation Methodologies Committee (the “Global Valuation Committee”) is the committee formed by management to develop global pricing policies and procedures and to oversee the pricing function for all financial instruments.
Fair Value Inputs and Methodologies: The following methods and inputs are used to establish the fair value of the Master Portfolio’s assets and liabilities:
| | • | | Equity investments traded on a recognized securities exchange are valued at that day’s official closing price, as applicable, on the exchange where the stock is primarily traded. Equity investments traded on a recognized exchange for which there were no sales on that day may be valued at the last available bid (long positions) or ask (short positions) price. |
| | • | | Investments in open-end U.S. mutual funds (including money market funds) are valued at that day’s published net asset value (“NAV”). |
| | • | | Futures contracts are valued based on that day’s last reported settlement or trade price on the exchange where the contract is traded. |
Generally, trading in foreign instruments is substantially completed each day at various times prior to the close of trading on the NYSE. Each business day, the Master Portfolio uses current market factors supplied by independent pricing services to value certain foreign instruments (“Systematic Fair Value Price”). The Systematic Fair Value Price is designed to value such foreign securities at fair value as of the close of trading on the NYSE, which follows the close of the local markets.
If events (e.g., market volatility, company announcement or a natural disaster) occur that are expected to materially affect the value of such investment, or in the event that application of these methods of valuation results in a price for an investment that is deemed not to be representative of the market value of such investment, or if a price is not available, the investment will be valued by the Global Valuation Committee, or its delegate, in accordance with a policy approved by the Board as reflecting fair value (“Fair Valued Investments”). The fair valuation approaches that may be used by the Global Valuation Committee include market approach, income approach and cost approach. Valuation techniques such as discounted cash flow, use of market comparables and matrix pricing are types of valuation approaches and are typically used in determining fair value. When determining the price for Fair Valued Investments, the Global Valuation Committee, or its delegate, seeks to determine the price that the Master Portfolio might reasonably expect to receive or pay from the current sale or purchase of that asset or liability in an arm’s-length transaction. Fair value determinations shall be based upon all available factors that the Global Valuation Committee, or its delegate, deems relevant and consistent with the principles of fair value measurement. The pricing of all Fair Valued Investments is subsequently reported to the Board or a committee thereof on a quarterly basis.
For investments in equity or debt issued by privately held companies or funds (“Private Company” or collectively, the “Private Companies”) and other Fair Valued Investments, the fair valuation approaches that are used by the Global Valuation Committee and third-party pricing services utilize one or a combination of, but not limited to, the following inputs.
| | |
| | | Standard Inputs Generally Considered By Third-Party Pricing Services |
Market approach | | (i) recent market transactions, including subsequent rounds of financing, in the underlying investment or comparable issuers; (ii) recapitalizations and other transactions across the capital structure; and (iii) market multiples of comparable issuers. |
Income approach | | (i) future cash flows discounted to present and adjusted as appropriate for liquidity, credit, and/or market risks; (ii) quoted prices for similar investments or assets in active markets; and (iii) other risk factors, such as interest rates, yield curves, volatilities, prepayment speeds, loss severities, credit risks, recovery rates, liquidation amounts and/or default rates. |
Cost approach | | (i) audited or unaudited financial statements, investor communications and financial or operational metrics issued by the Private Company; (ii) changes in the valuation of relevant indices or publicly traded companies comparable to the Private Company; (iii) relevant news and other public sources; and (iv) known secondary market transactions in the Private Company’s interests and merger or acquisition activity in companies comparable to the Private Company. |
Investments in series of preferred stock issued by Private Companies are typically valued utilizing market approach in determining the enterprise value of the company. Such investments often contain rights and preferences that differ from other series of preferred and common stock of the same issuer. Enterprise valuation techniques such as an option pricing model (“OPM”), a probability weighted expected return model (“PWERM”), current value method or a hybrid of those techniques are used as deemed appropriate under the circumstances. The use of these valuation techniques involve a determination of the exit scenarios of the investment in order to appropriately allocate the enterprise value of the company among the various parts of its capital structure.
The Private Companies are not subject to the public company disclosure, timing, and reporting standards applicable to other investments held by the Master Portfolio. Typically, the most recently available information by a Private Company is as of a date that is earlier than the date the Master Portfolio is calculating its NAV. This factor may result in a difference between the value of the investment and the price the Master Portfolio could receive upon the sale of the investment.
Fair Value Hierarchy: Various inputs are used in determining the fair value of financial instruments. These inputs to valuation techniques are categorized into a fair value hierarchy consisting of three broad levels for financial reporting purposes as follows:
| | |
MASTER PORTFOLIO NOTES TO FINANCIAL STATEMENTS | | 47 |
Notes to Financial Statements (continued)
| | • | | Level 1 – Unadjusted price quotations in active markets/exchanges for identical assets or liabilities that the Master Portfolio has the ability to access; |
| | • | | Level 2 – Other observable inputs (including, but not limited to, quoted prices for similar assets or liabilities in markets that are active, quoted prices for identical or similar assets or liabilities in markets that are not active, inputs other than quoted prices that are observable for the assets or liabilities (such as interest rates, yield curves, volatilities, prepayment speeds, loss severities, credit risks and default rates) or other market-corroborated inputs); and |
| | • | | Level 3 – Unobservable inputs based on the best information available in the circumstances, to the extent observable inputs are not available (including the Global Valuation Committee’s assumptions used in determining the fair value of financial instruments). |
The hierarchy gives the highest priority to unadjusted quoted prices in active markets for identical assets or liabilities (Level 1 measurements) and the lowest priority to unobservable inputs (Level 3 measurements). Accordingly, the degree of judgment exercised in determining fair value is greatest for instruments categorized in Level 3. The inputs used to measure fair value may fall into different levels of the fair value hierarchy. In such cases, for disclosure purposes, the fair value hierarchy classification is determined based on the lowest level input that is significant to the fair value measurement in its entirety. Investments classified within Level 3 have significant unobservable inputs used by the Global Valuation Committee in determining the price for Fair Valued Investments. Level 3 investments include equity or debt issued by Private Companies that may not have a secondary market and/or may have a limited number of investors. The categorization of a value determined for financial instruments is based on the pricing transparency of the financial instruments and is not necessarily an indication of the risks associated with investing in those securities.
| 4. | SECURITIES AND OTHER INVESTMENTS |
Preferred Stocks: Preferred stock has a preference over common stock in liquidation (and generally in receiving dividends as well), but is subordinated to the liabilities of the issuer in all respects. As a general rule, the market value of preferred stock with a fixed dividend rate and no conversion element varies inversely with interest rates and perceived credit risk, while the market price of convertible preferred stock generally also reflects some element of conversion value. Because preferred stock is junior to debt securities and other obligations of the issuer, deterioration in the credit quality of the issuer will cause greater changes in the value of a preferred stock than in a more senior debt security with similar stated yield characteristics. Unlike interest payments on debt securities, preferred stock dividends are payable only if declared by the issuer’s board of directors. Preferred stock also may be subject to optional or mandatory redemption provisions.
Securities Lending: The Master Portfolio may lend its securities to approved borrowers, such as brokers, dealers and other financial institutions. The borrower pledges and maintains with the Master Portfolio collateral consisting of cash, an irrevocable letter of credit issued by a bank, or securities issued or guaranteed by the U.S. Government. The initial collateral received by the Master Portfolio is required to have a value of at least 102% of the current value of the loaned securities for securities traded on U.S. exchanges and a value of at least 105% for all other securities. The collateral is maintained thereafter at a value equal to at least 100% of the current market value of the securities on loan. The market value of the loaned securities is determined at the close of each business day of the Master Portfolio and any additional required collateral is delivered to the Master Portfolio, or excess collateral returned by the Master Portfolio, on the next business day. During the term of the loan, the Master Portfolio is entitled to all distributions made on or in respect of the loaned securities, but does not receive interest income on securities received as collateral. Loans of securities are terminable at any time and the borrower, after notice, is required to return borrowed securities within the standard time period for settlement of securities transactions.
As of period end, any securities on loan were collateralized by cash and/or U.S. Government obligations. Cash collateral invested by the securities lending agent, BlackRock Institutional Trust Company, N.A. (“BTC”), if any, is disclosed in the Schedule of Investments. Any non-cash collateral received cannot be sold, re-invested or pledged by the Master Portfolio, except in the event of borrower default. The securities on loan, if any, are disclosed in the Master Portfolio’s Schedule of Investments. The market value of any securities on loan and the value of any related collateral are shown separately in the Statement of Assets and Liabilities as a component of investments at value – unaffiliated and collateral on securities loaned at value, respectively.
Securities lending transactions are entered into by the Master Portfolio under Master Securities Lending Agreements (each, an “MSLA”), which provide the right, in the event of default (including bankruptcy or insolvency), for the non-defaulting party to liquidate the collateral and calculate a net exposure to the defaulting party or request additional collateral. In the event that a borrower defaults, the Master Portfolio, as lender, would offset the market value of the collateral received against the market value of the securities loaned. When the value of the collateral is greater than that of the market value of the securities loaned, the lender is left with a net amount payable to the defaulting party. However, bankruptcy or insolvency laws of a particular jurisdiction may impose restrictions on or prohibitions against such a right of offset in the event of an MSLA counterparty’s bankruptcy or insolvency. Under the MSLA, absent an event of default, the borrower can resell or re-pledge the loaned securities, and the Master Portfolio can reinvest cash collateral received in connection with loaned securities. Upon an event of default, the parties’ obligations to return the securities or collateral to the other party are extinguished, and the parties can resell or re-pledge the loaned securities or the collateral received in connection with the loaned securities in order to satisfy the defaulting party’s net payment obligation for all transactions under the MSLA. The defaulting party remains liable for any deficiency.
As of period end, the following table is a summary of the Master Portfolio’s securities on loan by counterparty which are subject to offset under an MSLA:
| | | | | | | | | | | | | | | | | | | | |
| |
Counterparty | |
| Securities
Loaned at Value |
| |
| Cash Collateral
Received |
(a) | |
| Non-Cash Collateral
Received at Fair Value |
| |
| Net
Amount |
(b) | | | | |
| |
Barclays Capital, Inc. | | $ | 6,884,304 | | | $ | (6,884,304 | ) | | $ | — | | | $ | — | | | | | |
BNP Paribas SA | | | 4,769,458 | | | | (4,766,263 | ) | | | — | | | | 3,195 | | | | | |
Citigroup Global Markets, Inc. | | | 3,053,691 | | | | (3,053,691 | ) | | | — | | | | — | | | | | |
Credit Suisse Securities (USA) LLC | | | 2,300,289 | | | | (2,300,289 | ) | | | — | | | | — | | | | | |
Deutsche Bank Securities, Inc. | | | 472,230 | | | | (472,230 | ) | | | — | | | | — | | | | | |
Goldman Sachs & Co. LLC | | | 1,260,854 | | | | (1,260,854 | ) | | | — | | | | — | | | | | |
HSBC Bank PLC | | | 121,839 | | | | (121,839 | ) | | | — | | | | — | | | | | |
Jefferies LLC | | | 5,380 | | | | (5,380 | ) | | | — | | | | — | | | | | |
JPMorgan Securities LLC | | | 984,048 | | | | (984,048 | ) | | | — | | | | — | | | | | |
| | |
| 48 | | 2 0 2 1 BLACK ROCK ANNUAL REPORT TO SHAREHOLDERS |
Notes to Financial Statements (continued)
| | | | | | | | | | | | | | | | |
Counterparty | |
| Securities
Loaned at Value |
| |
| Cash Collateral
Received |
(a) | |
| Non-Cash Collateral
Received at Fair Value |
| |
| Net
Amount |
(b) |
Morgan Stanley | | $ | 3,639,155 | | | $ | (3,639,155 | ) | | $ | — | | | $ | — | |
National Financial Services LLC | | | 485,384 | | | | (485,384 | ) | | | — | | | | — | |
Nomura Securities International, Inc. | | | 8,045,152 | | | | (8,045,152 | ) | | | — | | | | — | |
Scotia Capital (USA), Inc. | | | 4,651,989 | | | | (4,651,989 | ) | | | — | | | | — | |
SG Americas Securities LLC | | | 65,107 | | | | (65,107 | ) | | | — | | | | — | |
State Street Bank & Trust Co. | | | 257,706 | | | | (257,706 | ) | | | — | | | | — | |
UBS AG | | | 59,145 | | | | (59,145 | ) | | | — | | | | — | |
Wells Fargo Bank N.A. | | | 586,867 | | | | (586,867 | ) | | | — | | | | — | |
Wells Fargo Securities LLC | | | 233,178 | | | | (233,178 | ) | | | — | | | | — | |
| | | | | | | | | | | | | | | | |
| | $ | 37,875,776 | | | $ | (37,872,581 | ) | | $ | — | | | $ | 3,195 | |
| | | | | | | | | | | | | | | | |
| | (a) | Collateral received in excess of the market value of securities on loan is not presented in this table. The total cash collateral received by the Master Portfolio is disclosed in the Master Portfolio’s Statement of Assets and Liabilities. | |
| | (b) | The market value of the loaned securities is determined as of December 31, 2021. Additional collateral is delivered to the Master Portfolio on the next business day in accordance with the MSLA. The net amount would be subject to the borrower default indemnity in the event of default by the counterparty. | |
The risks of securities lending include the risk that the borrower may not provide additional collateral when required or may not return the securities when due. To mitigate these risks, the Master Portfolio benefits from a borrower default indemnity provided by BlackRock, Inc. (“BlackRock”). BlackRock’s indemnity allows for full replacement of the securities loaned to the extent the collateral received does not cover the value on the securities loaned in the event of borrower default. The Master Portfolio could incur a loss if the value of an investment purchased with cash collateral falls below the market value of loaned securities or if the value of an investment purchased with cash collateral falls below the value of the original cash collateral received. Such losses are borne entirely by the Master Portfolio.
| 5. | DERIVATIVE FINANCIAL INSTRUMENTS |
The Master Portfolio engages in various portfolio investment strategies using derivative contracts both to increase the returns of the Master Portfolio and/or to manage its exposure to certain risks such as credit risk, equity risk, interest rate risk, foreign currency exchange rate risk, commodity price risk or other risks (e.g., inflation risk). Derivative financial instruments categorized by risk exposure are included in the Schedule of Investments. These contracts may be transacted on an exchange or over-the-counter (“OTC”).
Futures Contracts: Futures contracts are purchased or sold to gain exposure to, or manage exposure to, changes in interest rates (interest rate risk) and changes in the value of equity securities (equity risk) or foreign currencies (foreign currency exchange rate risk).
Futures contracts are exchange-traded agreements between the Master Portfolio and a counterparty to buy or sell a specific quantity of an underlying instrument at a specified price and on a specified date. Depending on the terms of a contract, it is settled either through physical delivery of the underlying instrument on the settlement date or by payment of a cash amount on the settlement date. Upon entering into a futures contract, the Master Portfolio is required to deposit initial margin with the broker in the form of cash or securities in an amount that varies depending on a contract’s size and risk profile. The initial margin deposit must then be maintained at an established level over the life of the contract. Amounts pledged, which are considered restricted, are included in cash pledged for futures contracts in the Statement of Assets and Liabilities.
Securities deposited as initial margin are designated in the Schedule of Investments and cash deposited, if any, are shown as cash pledged for futures contracts in the Statement of Assets and Liabilities. Pursuant to the contract, the Master Portfolio agrees to receive from or pay to the broker an amount of cash equal to the daily fluctuation in market value of the contract (“variation margin”). Variation margin is recorded as unrealized appreciation (depreciation) and, if any, shown as variation margin receivable (or payable) on futures contracts in the Statement of Assets and Liabilities. When the contract is closed, a realized gain or loss is recorded in the Statement of Operations equal to the difference between the notional amount of the contract at the time it was opened and the notional amount at the time it was closed. The use of futures contracts involves the risk of an imperfect correlation in the movements in the price of futures contracts and interest rates, foreign currency exchange rates or underlying assets.
| 6. | INVESTMENT ADVISORY AGREEMENT AND OTHER TRANSACTIONS WITH AFFILIATES |
Investment Advisory: MIP, on behalf of the Master Portfolio, entered into an Investment Advisory Agreement with the Manager, the Master Portfolio’s investment adviser and an indirect, wholly-owned subsidiary of BlackRock, Inc. (“BlackRock”), to provide investment advisory services. The Manager is responsible for the management of the Master Portfolio’s portfolio and provides the personnel, facilities, equipment and certain other services necessary to the operations of the Master Portfolio.
For such services, the Master Portfolio pays the Manager a monthly fee at an annual rate equal to 0.03% of the average daily value of the Master Portfolio’s net assets.
| | |
MASTER PORTFOLIO NOTES TO FINANCIAL STATEMENTS | | 49 |
Notes to Financial Statements (continued)
BAL is not entitled to compensation for providing administrative services to the Master Portfolio, for so long as BAL (or an affiliate) is entitled to compensation for providing administrative services to corresponding feeder funds that invest substantially all of their assets in the Master Portfolio, or BAL (or an affiliate) receives investment advisory fees from the Master Portfolio.
Expense Limitations, Waivers and Reimbursements: With respect to each Master Portfolio, the Manager contractually agreed to waive its investment advisory fees by the amount of investment advisory fees the Master Portfolio pays to the Manager indirectly through its investment in affiliated money market funds (the “affiliated money market fund waiver”) through June 30, 2023. The contractual agreement may be terminated upon 90 days’ notice by a majority of the trustees who are not “interested persons” of the Trust, as defined in the 1940 Act (“Independent Trustees”), or by a vote of a majority of the outstanding voting securities of the Master Portfolio. The amount of waivers and/or reimbursements of fees and expenses made pursuant to the expense limitation described below will be reduced by the amount of the affiliated money market fund waiver. This amounts are included in fees waived and/or reimbursed by the Manager in the Statement of Operations. For the year ended December 31, 2021, the amount waived and/or reimbursed was $7,612.
The Manager has contractually agreed to waive its investment advisory fee with respect to any portion of the Master Portfolio’s assets invested in affiliated equity and fixed-income mutual funds and affiliated exchange-traded funds that have a contractual management fee through June 30, 2023. The contractual agreement may be terminated upon 90 days’ notice by a majority of the Trustees who are not “interested persons” of the Fund, as defined in the 1940 Act (“independent Trustees”) or by a vote of a majority of the outstanding voting securities of the Master Portfolio. This amount is included in fees waived and/or reimbursed by the Manager in the Statement of Operations. For the year ended December 31, 2021, the Manager waived $21,522 in investment advisory fees pursuant to this arrangement.
Securities Lending: The SEC has issued an exemptive order which permits BTC, an affiliate of the Manager, to serve as securities lending agent for the Master Portfolio, subject to applicable conditions. As securities lending agent, BTC bears all operational costs directly related to securities lending, including any custodial costs. The Master Portfolio is responsible for fees in connection with the investment of cash collateral received for securities on loan (the “collateral investment fees”). The cash collateral is invested in a money market fund, BlackRock Cash Funds: Institutional or BlackRock Cash Funds: Treasury, managed by the Manager or its affiliates. However, BTC has agreed to reduce the amount of securities lending income it receives in order to effectively limit the collateral investment fees the Master Portfolio bears to an annual rate of 0.04%. The SL Agency Shares of such money market fund will not be subject to a sales load, distribution fee or service fee. The money market fund in which the cash collateral has been invested may, under certain circumstances, impose a liquidity fee of up to 2% of the value redeemed or temporarily restrict redemptions for up to 10 business days during a 90 day period, in the event that the money market fund’s weekly liquid assets fall below certain thresholds.
Securities lending income is equal to the total of income earned from the reinvestment of cash collateral, net of fees and other payments to and from borrowers of securities, and less the collateral investment fees. The Master Portfolio retains a portion of securities lending income and remits a remaining portion to BTC as compensation for its services as securities lending agent.
Pursuant to the current securities lending agreement, the Master Portfolio retains 82% of securities lending income (which excludes collateral investment fees), and this amount retained can never be less than 70% of the total of securities lending income plus the collateral investment fees.
In addition, commencing the business day following the date that the aggregate securities lending income earned across the BlackRock Multi-Asset Complex in a calendar year exceeds a specified threshold, the Master Portfolio, pursuant to the securities lending agreement, will retain for the remainder of that calendar year securities lending income in an amount equal to 85% of securities lending income (which excludes collateral investment fees), and this amount retained can never be less than 70% of the total of securities lending income plus the collateral investment fees.
The share of securities lending income earned by the Master Portfolio is shown as securities lending income — affiliated — net in the Statement of Operations. For the year ended December 31, 2021, the Master Portfolio paid BTC $50,156 for securities lending agent services.
Interfund Lending: In accordance with an exemptive order (the “Order”) from the SEC, the Master Portfolio may participate in a joint lending and borrowing facility for temporary purposes (the “Interfund Lending Program”), subject to compliance with the terms and conditions of the Order, and to the extent permitted by the Master Portfolio’s investment policies and restrictions. The Master Portfolio is currently permitted to borrow and lend under the Interfund Lending Program.
A lending BlackRock fund may lend in aggregate up to 15% of its net assets but may not lend more than 5% of its net assets to any one borrowing fund through the Interfund Lending Program. A borrowing BlackRock fund may not borrow through the Interfund Lending Program or from any other source more than 33 1/3% of its total assets (or any lower threshold provided for by the fund’s investment restrictions). If a borrowing BlackRock fund’s total outstanding borrowings exceed 10% of its total assets, each of its outstanding interfund loans will be subject to collateralization of at least 102% of the outstanding principal value of the loan. All interfund loans are for temporary or emergency purposes and the interest rate to be charged will be the average of the highest current overnight repurchase agreement rate available to a lending fund and the bank loan rate, as calculated according to a formula established by the Board.
During the year ended December 31, 2021, the Master Portfolio did not participate in the Interfund Lending Program.
Trustees and Officers: Certain trustees and/or officers of MIP are directors and/or officers of BlackRock or its affiliates.
Other Transactions: The Master Portfolio may purchase securities from, or sell securities to, an affiliated fund provided the affiliation is due solely to having a common investment adviser, common officers, or common trustees. For the year ended December 31, 2021, the purchase and sale transactions and any net realized gains (losses) with affiliated funds in compliance with Rule 17a-7 under the 1940 Act were as follows:
| | | | | | | | | | | | |
| |
| Master Portfolio Name | | Purchases | | | Sales | | | Net Realized
Gain (Loss) | |
| |
Total International ex U.S. Index Master Portfolio | | $ | 31,825,705 | | | $ | 5,526,803 | | | $ | (564,945 | ) |
| |
| | |
| 50 | | 2 0 2 1 BLACK ROCK ANNUAL REPORT TO SHAREHOLDERS |
Notes to Financial Statements (continued)
For the year ended December 31, 2021, purchases and sales of investments, excluding short-term investments, were $298,750,051 and $171,280,981, respectively.
The Master Portfolio is classified as a partnership for U.S. federal income tax purposes. As such, each investor in the Master Portfolio is treated as the owner of its proportionate share of net assets, income, expenses and realized and unrealized gains and losses of the Master Portfolio. Therefore, no U.S. federal income tax provision is required. It is intended that the Master Portfolio’s assets will be managed so an investor in the Master Portfolio can satisfy the requirements of Subchapter M of the Internal Revenue Code of 1986, as amended.
The Master Portfolio files U.S. federal and various state and local tax returns. No income tax returns are currently under examination. The statute of limitations on the Master Portfolio’s U.S. federal tax returns generally remains open for a period of three fiscal years after they are filed. The statutes of limitations on the Master Portfolio’s state and local tax returns may remain open for an additional year depending upon the jurisdiction.
Management has analyzed tax laws and regulations and their application to the Master Portfolio as of December 31, 2021, inclusive of the open tax return years, and does not believe that there are any uncertain tax positions that require recognition of a tax liability in the Master Portfolio’s financial statements.
As of December 31, 2021, gross unrealized appreciation and depreciation based on cost of investments (including short positions and derivatives, if any) for U.S. federal income tax purposes were as follows:
| | | | | | | | | | | | | | | | |
| |
| Master Portfolio Name | | Tax Cost | | | Gross Unrealized
Appreciation | | | Gross Unrealized
Depreciation | | | Net Unrealized
Appreciation
(Depreciation) | |
| |
Total International ex U.S. Index Master Portfolio | | $ | 1,048,757,725 | | | $ | 485,445,212 | | | $ | (92,193,144 | ) | | $ | 393,252,068 | |
| | | | | | | | | | | | | | | | |
MIP, on behalf of the Master Portfolio, along with certain other funds managed by the Manager and its affiliates (“Participating Funds”), is a party to a 364-day, $2.25 billion credit agreement with a group of lenders. Under this agreement, the Master Portfolio may borrow to fund shareholder redemptions. Excluding commitments designated for certain individual funds, the Participating Funds, including the Master Portfolio, can borrow up to an aggregate commitment amount of $1.75 billion at any time outstanding, subject to asset coverage and other limitations as specified in the agreement. The credit agreement has the following terms: a fee of 0.10% per annum on unused commitment amounts and interest at a rate equal to the higher of (a) one-month London Interbank Offered Rate (“LIBOR”) (but, in any event, not less than 0.00%) on the date the loan is made plus 0.80% per annum or (b) the Fed Funds rate (but, in any event, not less than 0.00%) in effect from time to time plus 0.80% per annum on amounts borrowed. The agreement expires in unless extended or renewed. These fees were allocated among such funds based upon portions of the aggregate commitment available to them and relative net assets of Participating Funds. During the year ended December 31, 2021, the Master Portfolio did not borrow under the credit agreement.
In the normal course of business, the Master Portfolio invests in securities or other instruments and may enter into certain transactions, and such activities subject the Master Portfolio to various risks, including among others, fluctuations in the market (market risk) or failure of an issuer to meet all of its obligations. The value of securities or other instruments may also be affected by various factors, including, without limitation: (i) the general economy; (ii) the overall market as well as local, regional or global political and/or social instability; (iii) regulation, taxation or international tax treaties between various countries; or (iv) currency, interest rate and price fluctuations. Local, regional or global events such as war, acts of terrorism, the spread of infectious illness or other public health issues, recessions, or other events could have a significant impact on the Master Portfolio and its investments. The Master Portfolio’s prospectus provides details of the risks to which the Master Portfolio is subject.
The Manager uses a “passive” or index approach to try to achieve the Master Portfolio’s investment objective following the securities included in its underlying index during upturns as well as downturns. The Manager does not take steps to reduce market exposure or to lessen the effects of a declining market. Divergence from the underlying index and the composition of the portfolio is monitored by the Manager.
The Master Portfolio may be exposed to additional risks when reinvesting cash collateral in money market funds that do not seek to maintain a stable NAV per share of $1.00, which may be subject to redemption gates or liquidity fees under certain circumstances.
Market Risk: An outbreak of respiratory disease caused by a novel coronavirus has developed into a global pandemic and has resulted in closing borders, quarantines, disruptions to supply chains and customer activity, as well as general concern and uncertainty. The impact of this pandemic, and other global health crises that may arise in the future, could affect the economies of many nations, individual companies and the market in general in ways that cannot necessarily be foreseen at the present time. This pandemic may result in substantial market volatility and may adversely impact the prices and liquidity of a fund’s investments. The duration of this pandemic and its effects cannot be determined with certainty.
Valuation Risk: The market values of equities, such as common stocks and preferred securities or equity related investments, such as futures and options, may decline due to general market conditions which are not specifically related to a particular company. They may also decline due to factors which affect a particular industry or industries. The Master Portfolio may invest in illiquid investments. An illiquid investment is any investment that the Master Portfolio reasonably expects cannot be sold or disposed of in
| | |
MASTER PORTFOLIO NOTES TO FINANCIAL STATEMENTS | | 51 |
Notes to Financial Statements (continued)
current market conditions in seven calendar days or less without the sale or disposition significantly changing the market value of the investment. The Master Portfolio may experience difficulty in selling illiquid investments in a timely manner at the price that it believes the investments are worth. Prices may fluctuate widely over short or extended periods in response to company, market or economic news. Markets also tend to move in cycles, with periods of rising and falling prices. This volatility may cause the Master Portfolio’s NAV to experience significant increases or decreases over short periods of time. If there is a general decline in the securities and other markets, the NAV of the Master Portfolio may lose value, regardless of the individual results of the securities and other instruments in which the Master Portfolio invests.
The price the Master Portfolio could receive upon the sale of any particular portfolio investment may differ from the Master Portfolio’s valuation of the investment, particularly for securities that trade in thin or volatile markets or that are valued using a fair valuation technique or a price provided by an independent pricing service. Changes to significant unobservable inputs and assumptions (i.e., publicly traded company multiples, growth rate, time to exit) due to the lack of observable inputs may significantly impact the resulting fair value and therefore the Master Portfolio’s results of operations. As a result, the price received upon the sale of an investment may be less than the value ascribed by the Master Portfolio, and the Master Portfolio could realize a greater than expected loss or lesser than expected gain upon the sale of the investment. The Master Portfolio’s ability to value its investments may also be impacted by technological issues and/or errors by pricing services or other third-party service providers.
Counterparty Credit Risk: The Master Portfolio may be exposed to counterparty credit risk, or the risk that an entity may fail to or be unable to perform on its commitments related to unsettled or open transactions, including making timely interest and/or principal payments or otherwise honoring its obligations. The Master Portfolio manages counterparty credit risk by entering into transactions only with counterparties that the Manager believes have the financial resources to honor their obligations and by monitoring the financial stability of those counterparties. Financial assets, which potentially expose the Master Portfolio to market, issuer and counterparty credit risks, consist principally of financial instruments and receivables due from counterparties. The extent of the Master Portfolio’s exposure to market, issuer and counterparty credit risks with respect to these financial assets is approximately their value recorded in the Statement of Assets and Liabilities, less any collateral held by the Master Portfolio.
A derivative contract may suffer a mark-to-market loss if the value of the contract decreases due to an unfavorable change in the market rates or values of the underlying instrument. Losses can also occur if the counterparty does not perform under the contract.
With exchange-traded futures, there is less counterparty credit risk to the Master Portfolio since the exchange or clearinghouse, as counterparty to such instruments, guarantees against a possible default. The clearinghouse stands between the buyer and the seller of the contract; therefore, credit risk is limited to failure of the clearinghouse. While offset rights may exist under applicable law, the Master Portfolio does not have a contractual right of offset against a clearing broker or clearinghouse in the event of a default (including the bankruptcy or insolvency). Additionally, credit risk exists in exchange-traded futures with respect to initial and variation margin that is held in a clearing broker’s customer accounts. While clearing brokers are required to segregate customer margin from their own assets, in the event that a clearing broker becomes insolvent or goes into bankruptcy and at that time there is a shortfall in the aggregate amount of margin held by the clearing broker for all its clients, typically the shortfall would be allocated on a pro rata basis across all the clearing broker’s customers, potentially resulting in losses to the Master Portfolio.
Concentration Risk: A diversified portfolio, where this is appropriate and consistent with a fund’s objectives, minimizes the risk that a price change of a particular investment will have a material impact on the NAV of a fund. The investment concentrations within the Master Portfolio’s portfolio are disclosed in its Schedule of Investments.
The Master Portfolio invests a substantial amount of its assets in issuers located in a single country or a limited number of countries. When a Master Portfolio concentrates its investments in this manner, it assumes the risk that economic, regulatory, political and social conditions in those countries may have a significant impact on their investment performance and could affect the income from, or the value or liquidity of, the Master Portfolio’s portfolio. Unanticipated or sudden political or social developments may cause uncertainty in the markets and as a result adversely affect the Master Portfolio’s investments. Foreign issuers may not be subject to the same uniform accounting, auditing and financial reporting standards and practices as used in the United States. Foreign securities markets may also be more volatile and less liquid than U.S. securities and may be less subject to governmental supervision not typically associated with investing in U.S. securities. Investment percentages in specific countries are presented in the Schedule of Investments.
The Master Portfolio invests a significant portion of its assets in securities of issuers located in Europe or with significant exposure to European issuers or countries. The European financial markets have recently experienced volatility and adverse trends due to concerns about economic downturns in, or rising government debt levels of, several European countries. These events may spread to other countries in Europe and may affect the value and liquidity of certain of the Master Portfolio’s investments.
Responses to the financial problems by European governments, central banks and others, including austerity measures and reforms, may not work, may result in social unrest and may limit future growth and economic recovery or have other unintended consequences. Further defaults or restructurings by governments and others of their debt could have additional adverse effects on economies, financial markets and asset valuations around the world. In addition, the United Kingdom has withdrawn from the European Union, and one or more other countries may withdraw from the European Union and/or abandon the Euro, the common currency of the European Union. The impact of these actions, especially if they occur in a disorderly fashion, is not clear but could be significant and far reaching.
The Master Portfolio invests a significant portion of its assets in securities of issuers located in Asia or with significant exposure to Asian issuers or countries. The Asian financial markets have recently experienced volatility and adverse trends due to concerns in several Asian countries regarding monetary policy, government intervention in the markets, rising government debt levels or economic downturns. These events may spread to other countries in Asia and may affect the value and liquidity of certain of the Master Portfolio’s investments.
LIBOR Transition Risk: The United Kingdom’s Financial Conduct Authority announced a phase out of the LIBOR. Although many LIBOR rates will cease to be published or no longer will be representative of the underlying market they seek to measure after December 31, 2021, a selection of widely used USD LIBOR rates will continue to be published through June 2023 in order to assist with the transition. The Master Portfolio may be exposed to financial instruments tied to LIBOR to determine payment obligations, financing terms, hedging strategies or investment value. The transition process away from LIBOR might lead to increased volatility and illiquidity in markets for, and reduce the effectiveness of new hedges placed against instruments whose terms currently include LIBOR. The ultimate effect of the LIBOR transition process on the Master Portfolio is uncertain.
| | |
| 52 | | 2 0 2 1 BLACK ROCK ANNUAL REPORT TO SHAREHOLDERS |
Notes to Financial Statements (continued)
Management has evaluated the impact of all subsequent events on the Master Portfolio through the date the financial statements were issued and has determined that there were no subsequent events requiring adjustment or additional disclosure in the financial statements.
| | |
MASTER PORTFOLIO NOTES TO FINANCIAL STATEMENTS | | 53 |
Report of Independent Registered Public Accounting Firm
To the Board of Trustees of Master Investment Portfolio and Investors of Total International ex U.S. Index Master Portfolio
Opinion on the Financial Statements
We have audited the accompanying statement of assets and liabilities, including the schedule of investments, of Total International ex U.S. Index Master Portfolio (one of the series constituting Master Investment Portfolio, referred to hereafter as the “Master Portfolio”) as of December 31, 2021, the related statement of operations for the year ended December 31, 2021, the statements of changes in net assets for each of the two years in the period ended December 31, 2021, including the related notes, and the financial highlights for each of the five years in the period ended December 31, 2021 (collectively referred to as the “financial statements”). In our opinion, the financial statements present fairly, in all material respects, the financial position of the Master Portfolio as of December 31, 2021, the results of its operations for the year then ended, the changes in its net assets for each of the two years in the period ended December 31, 2021 and the financial highlights for each of the five years in the period ended December 31, 2021 in conformity with accounting principles generally accepted in the United States of America.
Basis for Opinion
These financial statements are the responsibility of the Master Portfolio’s management. Our responsibility is to express an opinion on the Master Portfolio’s financial statements based on our audits. We are a public accounting firm registered with the Public Company Accounting Oversight Board (United States) (PCAOB) and are required to be independent with respect to the Master Portfolio in accordance with the U.S. federal securities laws and the applicable rules and regulations of the Securities and Exchange Commission and the PCAOB.
We conducted our audits of these financial statements in accordance with the standards of the PCAOB. Those standards require that we plan and perform the audit to obtain reasonable assurance about whether the financial statements are free of material misstatement, whether due to error or fraud.
Our audits included performing procedures to assess the risks of material misstatement of the financial statements, whether due to error or fraud, and performing procedures that respond to those risks. Such procedures included examining, on a test basis, evidence regarding the amounts and disclosures in the financial statements. Our audits also included evaluating the accounting principles used and significant estimates made by management, as well as evaluating the overall presentation of the financial statements. Our procedures included confirmation of securities owned as of December 31, 2021 by correspondence with the custodian, transfer agent and brokers; when replies were not received from brokers, we performed other auditing procedures. We believe that our audits provide a reasonable basis for our opinion.
/s/PricewaterhouseCoopers LLP
Philadelphia, Pennsylvania
February 24, 2022
We have served as the auditor of one or more BlackRock investment companies since 2000.
| | |
| 54 | | 2 0 2 1 BLACK ROCK ANNUAL REPORT TO SHAREHOLDERS |
Statement Regarding Liquidity Risk Management Program
In compliance with Rule 22e-4 under the Investment Company Act of 1940, as amended (the “Liquidity Rule”), BlackRock Funds III and Master Investment Portfolio (the “Trusts”) have adopted and implemented a liquidity risk management program (the “Program”) for iShares MSCI Total International Index Fund and Total International ex U.S. Index Master Portfolio (the “Funds”), each a series of the respective Trust, which is reasonably designed to assess and manage each Fund’s liquidity risk.
The Board of Trustees (the “Board”) of the Trusts, on behalf of the Funds, met on November 9-10, 2021 (the “Meeting”) to review the Program. The Board previously appointed BlackRock Advisors, LLC or BlackRock Fund Advisors (“BlackRock”), each an investment adviser to certain BlackRock funds, as the program administrator for each Fund’s Program, as applicable. BlackRock also previously delegated oversight of the Program to the 40 Act Liquidity Risk Management Committee (the “Committee”). At the Meeting, the Committee, on behalf of BlackRock, provided the Board with a report that addressed the operation of the Program and assessed its adequacy and effectiveness of implementation, including the management of each Fund’s Highly Liquid Investment Minimum (“HLIM”) where applicable, and any material changes to the Program (the “Report”). The Report covered the period from October 1, 2020 through September 30, 2021 (the “Program Reporting Period”).
The Report described the Program’s liquidity classification methodology for categorizing each Fund’s investments (including derivative transactions) into one of four liquidity buckets. It also referenced the methodology used by BlackRock to establish each Fund’s HLIM and noted that the Committee reviews and ratifies the HLIM assigned to each Fund no less frequently than annually. The Report also discussed notable events affecting liquidity over the Program Reporting Period, including the imposition of capital controls in certain countries.
The Report noted that the Program complied with the key factors for consideration under the Liquidity Rule for assessing, managing and periodically reviewing each Fund’s liquidity risk, as follows:
| a) | | The Fund’s investment strategy and liquidity of portfolio investments during both normal and reasonably foreseeable stressed conditions. During the Program Reporting Period, the Committee reviewed whether each Fund’s strategy is appropriate for an open-end fund structure with a focus on funds with more significant and consistent holdings of less liquid and illiquid assets. The Committee also factored a fund’s concentration in an issuer into the liquidity classification methodology by taking issuer position sizes into account. Where a fund participated in borrowings for investment purposes (such as tender option bonds or reverse repurchase agreements), such borrowings were factored into the Program’s calculation of a fund’s liquidity bucketing. Derivative exposure was also considered in such calculation. |
| b) | | Short-term and long-term cash flow projections during both normal and reasonably foreseeable stressed conditions. During the Program Reporting Period, the Committee reviewed historical redemption activity and used this information as a component to establish each Fund’s reasonably anticipated trading size (“RATS”). Each Fund has adopted an in-kind redemption policy which may be utilized to meet larger redemption requests. The Committee may also take into consideration a fund’s shareholder ownership concentration (which, depending on product type and distribution channel, may or may not be available), a fund’s distribution channels, and the degree of certainty associated with a fund’s short-term and long-term cash flow projections. |
| c) | | Holdings of cash and cash equivalents, as well as borrowing arrangements. The Committee considered the terms of the credit facility committed to each Fund, the financial health of the institution providing the facility and the fact that the credit facility is shared among multiple funds (including that a portion of the aggregate commitment amount is specifically designated for BlackRock Floating Rate Income Portfolio, a series of BlackRock Funds V). The Committee also considered other types of borrowing available to the Funds, such as the ability to use reverse repurchase agreements and interfund lending, as applicable. |
There were no material changes to the Program during the Program Reporting Period other than the enhancement of certain model components in the Program’s methodology. The Report provided to the Board stated that the Committee concluded that based on the operation of the functions, as described in the Report, the Program is operating as intended and is effective in implementing the requirements of the Liquidity Rule.
| | |
STATEMENT REGARDING LIQUIDITY RISK MANAGEMENT PROGRAM | | 55 |
Trustee and Officer Information
| | | | | | | | |
| | | | | Independent Trustees(a) | | | | |
| | | | | |
Name
Year of Birth(b) | | Position(s) Held
(Length of Service)(c) | | Principal Occupation(s) During Past Five Years | | Number of BlackRock-Advised
Registered Investment Companies
(“RICs”) Consisting of
Investment Portfolios
(“Portfolios”) Overseen | | Public Company
and Other Investment Company Directorships Held During Past Five Years |
| | | | |
Mark Stalnecker
1951 | | Chair of the Board
(Since 2019) and Trustee (Since 2015) | | Chief Investment Officer, University of Delaware from 1999 to 2013; Trustee and Chair of the Finance and Investment Committees, Winterthur Museum and Country Estate from 2005 to 2016; Member of the Investment Committee, Delaware Public Employees’ Retirement System since 2002; Member of the Investment Committee, Christiana Care Health System from 2009 to 2017; Member of the Investment Committee, Delaware Community Foundation from 2013 to 2014; Director and Chair of the Audit Committee, SEI Private Trust Co. from 2001 to 2014. | | 30 RICs consisting of 159 Portfolios | | None |
| | | | |
Bruce R. Bond
1946 | | Trustee (Since 2019) | | Board Member, Amsphere Limited (software) since 2018; Trustee and Member of the Governance Committee, State Street Research Mutual Funds from 1997 to 2005; Board Member of Governance, Audit and Finance Committee, Avaya Inc. (computer equipment) from 2003 to 2007. | | 30 RICs consisting of 159 Portfolios | | None |
| | | | |
Susan J. Carter
1956 | | Trustee (Since 2016) | | Director, Pacific Pension Institute from 2014 to 2018; Advisory Board Member, Center for Private Equity and Entrepreneurship at Tuck School of Business since 1997; Senior Advisor, Commonfund Capital, Inc. (“CCI”) (investment adviser) in 2015; Chief Executive Officer, CCI from 2013 to 2014; President & Chief Executive Officer, CCI from 1997 to 2013; Advisory Board Member, Girls Who Invest from 2015 to 2018 and Board Member thereof since 2018; Advisory Board Member, Bridges Fund Management since 2016; Trustee, Financial Accounting Foundation since 2017; Practitioner Advisory Board Member, Private Capital Research Institute (“PCRI”) since 2017; Lecturer in the Practice of Management, Yale School of Management since 2019; Advisor to Finance Committee, Altman Foundation since 2020. | | 30 RICs consisting of 159 Portfolios | | None |
| | | | |
Collette Chilton
1958 | | Trustee (Since 2015) | | Chief Investment Officer, Williams College since 2006; Chief Investment Officer, Lucent Asset Management Corporation from 1998 to 2006; Director, Boys and Girls Club of Boston since 2017; Director, B1 Capital since 2018; Director, David and Lucile Packard Foundation since 2020. | | 30 RICs consisting of 159 Portfolios | | None |
| | | | |
Neil A. Cotty
1954 | | Trustee (Since 2016) | | Bank of America Corporation from 1996 to 2015, serving in various senior finance leadership roles, including Chief Accounting Officer from 2009 to 2015, Chief Financial Officer of Global Banking, Markets and Wealth Management from 2008 to 2009, Chief Accounting Officer from 2004 to 2008, Chief Financial Officer of Consumer Bank from 2003 to 2004, Chief Financial Officer of Global Corporate Investment Bank from 1999 to 2002. | | 30 RICs consisting of 159 Portfolios | | None |
| | | | |
Lena G. Goldberg
1949 | | Trustee (Since 2019) | | Director, Charles Stark Draper Laboratory, Inc. since 2013; Senior Lecturer, Harvard Business School, from 2008 to 2021; FMR LLC/Fidelity Investments (financial services) from 1996 to 2008, serving in various senior roles including Executive Vice President - Strategic Corporate Initiatives and Executive Vice President and General Counsel; Partner, Sullivan & Worcester LLP from 1985 to 1996 and Associate thereof from 1979 to 1985. | | 30 RICs consisting of 159 Portfolios | | None |
| | |
| 56 | | 2 0 2 1 BLACK ROCK ANNUAL REPORT TO SHAREHOLDERS |
Trustee and Officer Information (continued)
| | | | | | | | |
| Independent Trustees(a) (continued) |
| | | | | |
Name
Year of Birth(b) | | Position(s) Held
(Length of Service)(c) | | Principal Occupation(s) During Past Five Years | | Number of BlackRock-Advised
Registered Investment Companies
(“RICs”) Consisting of
Investment Portfolios
(“Portfolios”) Overseen | | Public Company
and Other
Investment
Company
Directorships Held
During Past Five Years |
| | | | |
Henry R. Keizer
1956 | | Trustee
(Since 2019) | | Director, Park Indemnity Ltd. (captive insurer) since 2010; Director, MUFG Americas Holdings Corporation and MUFG Union Bank, N.A. (financial and bank holding company) from 2014 to 2016; Director, American Institute of Certified Public Accountants from 2009 to 2011; Director, KPMG LLP (audit, tax and advisory services) from 2004 to 2005 and 2010 to 2012; Director, KPMG International in 2012, Deputy Chairman and Chief Operating Officer thereof from 2010 to 2012 and U.S. Vice Chairman of Audit thereof from 2005 to 2010; Global Head of Audit, KPMGI (consortium of KPMG firms) from 2006 to 2010; Director, YMCA of Greater New York from 2006 to 2010. | | 30 RICs consisting of 159 Portfolios | | Hertz Global Holdings (car rental); Sealed Air Corp. (packaging); GrafTech International Ltd. (materials manufacturing); Montpelier Re Holdings, Ltd. (publicly held property and casualty reinsurance) from 2013 to 2015; WABCO (commercial vehicle safety systems) from 2015 to 2020. |
| | | | |
Cynthia A. Montgomery
1952 | | Trustee
(Since 2009) | | Professor, Harvard Business School since 1989. | | 30 RICs consisting of 159 Portfolios | | Newell Rubbermaid, Inc. (manufacturing) from 1995 to 2016. |
| | | | |
Donald C. Opatrny
1952 | | Trustee
(Since 2019) | | Trustee, Vice Chair, Member of the Executive Committee and Chair of the Investment Committee, Cornell University from 2004 to 2019; President, Trustee and Member of the Investment Committee, The Aldrich Contemporary Art Museum from 2007 to 2014; Member of the Board and Investment Committee, University School from 2007 to 2018; Member of the Investment Committee, Mellon Foundation from 2009 to 2015; Trustee, Artstor (a Mellon Foundation affiliate) from 2010 to 2015; President and Trustee, the Center for the Arts, Jackson Hole from 2011 to 2018; Director, Athena Capital Advisors LLC (investment management firm) since 2013; Trustee and Chair of the Investment Committee, Community Foundation of Jackson Hole since 2014; Member of Affordable Housing Supply Board of Jackson, Wyoming since 2017; Member, Investment Funds Committee, State of Wyoming since 2017; Trustee, Phoenix Art Museum since 2018; Trustee, Arizona Community Foundation and Member of Investment Committee since 2020. | | 30 RICs consisting of 159 Portfolios | | None |
| | | | |
Joseph P. Platt
1947 | | Trustee
(Since 2009) | | General Partner, Thorn Partners, LP (private investments) since 1998; Director, WQED Multi-Media (public broadcasting not-for-profit) since 2001; Chair, Basic Health International (non-profit) since 2015. | | 30 RICs consisting of 159 Portfolios | | Greenlight Capital Re, Ltd. (reinsurance company); Consol Energy Inc. |
| | |
TRUSTEE AND OFFICER INFORMATION | | 57 |
Trustee and Officer Information (continued)
| | | | | | | | |
| Independent Trustees(a) (continued) |
| | | | | |
Name
Year of Birth(b) | | Position(s) Held
(Length of Service)(c) | | Principal Occupation(s) During Past Five Years | | Number of BlackRock-Advised
Registered Investment Companies
(“RICs”) Consisting of
Investment Portfolios
(“Portfolios”) Overseen | | Public Company
and Other
Investment
Company
Directorships Held
During Past Five Years |
| | | | |
Kenneth L. Urish
1951 | | Trustee
(Since 2009) | | Managing Partner, Urish Popeck & Co., LLC (certified public accountants and consultants) since 1976; Past- Chairman of the Professional Ethics Committee of the Pennsylvania Institute of Certified Public Accountants and Committee Member thereof since 2007; Member of External Advisory Board, The Pennsylvania State University Accounting Department since founding in 2001; Principal, UP Strategic Wealth Investment Advisors, LLC since 2013; Trustee, The Holy Family Institute from 2001 to 2010; President and Trustee, Pittsburgh Catholic Publishing Associates from 2003 to 2008; Director, Inter-Tel from 2006 to 2007; Member, Advisory Board, ESG Competent Boards since 2020. | | 30 RICs consisting of 159 Portfolios | | None |
| | | | |
Claire A. Walton
1957 | | Trustee
(Since 2016) | | Chief Operating Officer and Chief Financial Officer of Liberty Square Asset Management, LP from 1998 to 2015; General Partner of Neon Liberty Capital Management, LLC since 2003; Director, Boston Hedge Fund Group from 2009 to 2018; Director, Woodstock Ski Runners since 2013; Director, Massachusetts Council on Economic Education from 2013 to 2015. | | 30 RICs consisting of 159 Portfolios | | None |
| | | | |
| | | | | Interested Trustees(a)(d) | | | | |
| | | | | |
Name
Year of Birth(b) | | Position(s) Held
(Length of Service)(c) | | Principal Occupation(s) During Past Five Years | | Number of BlackRock-Advised
Registered Investment Companies
(“RICs”) Consisting of
Investment Portfolios
(“Portfolios”) Overseen | | Public Company
and Other
Investment
Company
Directorships
Held During Past Five Years |
| | | | |
Robert Fairbairn
1965 | | Trustee
(Since 2018) | | Vice Chairman of BlackRock, Inc. since 2019; Member of BlackRock’s Global Executive and Global Operating Committees; Co-Chair of BlackRock’s Human Capital Committee; Senior Managing Director of BlackRock, Inc. from 2010 to 2019; oversaw BlackRock’s Strategic Partner Program and Strategic Product Management Group from 2012 to 2019; Member of the Board of Managers of BlackRock Investments, LLC from 2011 to 2018; Global Head of BlackRock’s Retail and iShares® businesses from 2012 to 2016. | | 103 RICs consisting of 261 Portfolios | | None |
John M. Perlowski(e)
1964 | | Trustee
(Since 2015)
President and Chief Executive Officer
(Since 2010) | | Managing Director of BlackRock, Inc. since 2009; Head of BlackRock Global Accounting and Product Services since 2009; Advisory Director of Family Resource Network (charitable foundation) since 2009. | | 105 RICs consisting of 263 Portfolios | | None |
| (a) | The address of each Trustee is c/o BlackRock, Inc., 55 East 52nd Street, New York, New York 10055. |
| (b) | Independent Trustees serve until their resignation, retirement, removal or death, or until December 31 of the year in which they turn 75. The Board may determine to extend the terms of Independent Trustees on a case-by-case basis, as appropriate. |
| (c) | In connection with the acquisition of Barclays Global Investors by BlackRock, Inc. in December 2009, certain Independent Trustees were elected to the Board. Furthermore, effective January 1, 2019, three BlackRock Fund Complexes were realigned and consolidated into two BlackRock Fund Complexes. As a result, although the chart shows the year that each Independent Trustee joined the Board, certain Independent Trustees first became members of the boards of other BlackRock-advised Funds or legacy BlackRock funds as follows: Bruce R. Bond, 2005; Cynthia A. Montgomery, 1994; Joseph P. Platt, 1999; Kenneth L. Urish, 1999; Lena G. Goldberg, 2016; Henry R. Keizer, 2016; Donald C. Opatrny, 2015. |
| (d) | Mr. Fairbairn and Mr. Perlowski are both “interested persons,” as defined in the 1940 Act, of the Trust/MIP based on their positions with BlackRock, Inc. and its affiliates. Mr. Fairbairn and Mr. Perlowski are also board members of the BlackRock Fixed-Income Complex. |
| (e) | Mr. Perlowski is also a trustee of the BlackRock Credit Strategies Fund and BlackRock Private Investments Fund. |
| | |
| 58 | | 2 0 2 1 BLACK ROCK ANNUAL REPORT TO SHAREHOLDERS |
Trustee and Officer Information (continued)
| | | | |
| Officers Who Are Not Trustees(a) |
| | | |
Name
Year of Birth(b) | | Position(s) Held
(Length of Service) | | Principal Occupation(s) During Past Five Years |
| | |
Thomas Callahan
1968 | | Vice President
(Since 2016) | | Managing Director of BlackRock, Inc. since 2013; Member of the Board of Managers of BlackRock Investments, LLC (principal underwriter) since 2019 and Managing Director thereof since 2017; Head of BlackRock’s Global Cash Management Business since 2016; Co-Head of the Global Cash Management Business from 2014 to 2016; Deputy Head of the Global Cash Management Business from 2013 to 2014; Member of the Cash Management Group Executive Committee since 2013; Chief Executive Officer of NYSE Liffe U.S. from 2008 to 2013. |
| | |
Jennifer McGovern
1977 | | Vice President
(Since 2014) | | Managing Director of BlackRock, Inc. since 2016; Director of BlackRock, Inc. from 2011 to 2015; Head of Americas Product Development and Governance for BlackRock’s Global Product Group since 2019; Head of Product Structure and Oversight for BlackRock’s U.S. Wealth Advisory Group from 2013 to 2019. |
| | |
Trent Walker
1974 | | Chief Financial Officer (Since 2021) | | Managing Director of BlackRock, Inc. since September 2019; Executive Vice President of PIMCO from 2016 to 2019; Senior Vice President of PIMCO from 2008 to 2015; Treasurer from 2013 to 2019 and Assistant Treasurer from 2007 to 2017 of PIMCO Funds, PIMCO Variable Insurance Trust, PIMCO ETF Trust, PIMCO Equity Series, PIMCO Equity Series VIT, PIMCO Managed Accounts Trust, 2 PIMCO-sponsored interval funds and 21 PIMCO-sponsored closed-end funds. |
| | |
Jay M. Fife
1970 | | Treasurer
(Since 2009) | | Managing Director of BlackRock, Inc. since 2007. |
| | |
Charles Park
1967 | | Chief Compliance Officer (Since 2014) | | Anti-Money Laundering Compliance Officer for certain BlackRock-advised Funds from 2014 to 2015; Chief Compliance Officer of BlackRock Advisors, LLC and the BlackRock-advised Funds in the BlackRock Multi-Asset Complex and the BlackRock Fixed-Income Complex since 2014; Principal of and Chief Compliance Officer for iShares® Delaware Trust Sponsor LLC since 2012 and BlackRock Fund Advisors (“BFA”) since 2006; Chief Compliance Officer for the BFA-advised iShares® exchange traded funds since 2006; Chief Compliance Officer for BlackRock Asset Management International Inc. since 2012. |
| | |
Lisa Belle
1968 | | Anti-Money Laundering Compliance Officer
(Since 2019) | | Managing Director of BlackRock, Inc. since 2019; Global Financial Crime Head for Asset and Wealth Management of JP Morgan from 2013 to 2019; Managing Director of RBS Securities from 2012 to 2013; Head of Financial Crimes for Barclays Wealth Americas from 2010 to 2012. |
| | |
Janey Ahn
1975 | | Secretary
(Since 2019) | | Managing Director of BlackRock, Inc. since 2018; Director of BlackRock, Inc. from 2009 to 2017. |
| (a) | The address of each Officer is c/o BlackRock, Inc., 55 East 52nd Street, New York, New York 10055. |
| (b) | Officers of the Trust/MIP serve at the pleasure of the Board. |
Further information about the Trust’s/MIP’s Trustees and Officers is available in the Trust’s/MIP’s Statement of Additional Information, which can be obtained without charge by calling (800) 441-7762.
Effective December 31, 2021, Bruce R. Bond retired as a Trustee of the Trust/MIP.
| | |
TRUSTEE AND OFFICER INFORMATION | | 59 |
Additional Information
Regulation Regarding Derivatives
On October 28, 2020, the Securities and Exchange Commission (the “SEC”) adopted regulations governing the use of derivatives by registered investment companies (“Rule 18f-4”). The Fund/Master Portfolio will be required to implement and comply with Rule 18f-4 by August 19, 2022. Once implemented, Rule 18f-4 will impose limits on the amount of derivatives a fund can enter into, eliminate the asset segregation framework currently used by funds to comply with Section 18 of the 1940 Act, treat derivatives as senior securities and require funds whose use of derivatives is more than a limited specified exposure amount to establish and maintain a comprehensive derivatives risk management program and appoint a derivatives risk manager.
General Information
Quarterly performance, semi-annual and annual reports, current net asset value and other information regarding the Fund/Master Portfolio may be found on BlackRock’s website, which can be accessed at blackrock.com. Any reference to BlackRock’s website in this report is intended to allow investors public access to information regarding the Fund/Master Portfolio and does not, and is not intended to, incorporate BlackRock’s website in this report.
Householding
The Fund will mail only one copy of shareholder documents, including prospectuses, annual and semi-annual reports, Rule 30e-3 notices and proxy statements, to shareholders with multiple accounts at the same address. This practice is commonly called “householding” and is intended to reduce expenses and eliminate duplicate mailings of shareholder documents. Mailings of your shareholder documents may be householded indefinitely unless you instruct us otherwise. If you do not want the mailing of these documents to be combined with those for other members of your household, please call the Fund at (800) 441-7762.
Availability of Quarterly Schedule of Investments
The Fund/Master Portfolio file their complete schedules of portfolio holdings with the SEC for the first and third quarters of each fiscal year as an exhibit to their reports on Form N-PORT. The Fund’s/Master Portfolio’s Forms N-PORT are available on the SEC’s website at sec.gov. Additionally, the Fund/Master Portfolio makes their portfolio holdings for the first and third quarters of each fiscal year available at blackrock.com/fundreports.
Availability of Proxy Voting Policies, Procedures and Voting Records
A description of the policies and procedures that the Fund/Master Portfolio use to determine how to vote proxies relating to portfolio securities and information about how the Fund/Master Portfolio voted proxies relating to securities held in the Fund’s/Master Portfolio’s portfolios during the most recent 12-month period ended June 30 is available without charge, upon request (1) by calling (800) 441-7762; (2) on the BlackRock website at blackrock.com; and (3) on the SEC’s website at sec.gov.
BlackRock’s Mutual Fund Family
BlackRock offers a diverse lineup of open-end mutual funds crossing all investment styles and managed by experts in equity, fixed-income and tax-exempt investing. Visit blackrock.com for more information.
Shareholder Privileges
Account Information
Call us at (800) 441-7762 from 8:00 AM to 6:00 PM ET on any business day to get information about your account balances, recent transactions and share prices. You can also visit blackrock.com for more information.
Automatic Investment Plans
Investor class shareholders who want to invest regularly can arrange to have $50 or more automatically deducted from their checking or savings account and invested in any of the BlackRock funds.
Systematic Withdrawal Plans
Investor class shareholders can establish a systematic withdrawal plan and receive periodic payments of $50 or more from their BlackRock funds, as long as their account balance is at least $10,000.
Retirement Plans
Shareholders may make investments in conjunction with Traditional, Rollover, Roth, Coverdell, Simple IRAs, SEP IRAs and 403(b) Plans.
| | |
| 60 | | 2 0 2 1 BLACK ROCK ANNUAL REPORT TO SHAREHOLDERS |
Additional Information (continued)
BlackRock Privacy Principles
BlackRock is committed to maintaining the privacy of its current and former fund investors and individual clients (collectively, “Clients”) and to safeguarding their non-public personal information. The following information is provided to help you understand what personal information BlackRock collects, how we protect that information and why in certain cases we share such information with select parties.
If you are located in a jurisdiction where specific laws, rules or regulations require BlackRock to provide you with additional or different privacy-related rights beyond what is set forth below, then BlackRock will comply with those specific laws, rules or regulations.
BlackRock obtains or verifies personal non-public information from and about you from different sources, including the following: (i) information we receive from you or, if applicable, your financial intermediary, on applications, forms or other documents; (ii) information about your transactions with us, our affiliates, or others; (iii) information we receive from a consumer reporting agency; and (iv) from visits to our websites.
BlackRock does not sell or disclose to non-affiliated third parties any non-public personal information about its Clients, except as permitted by law or as is necessary to respond to regulatory requests or to service Client accounts. These non-affiliated third parties are required to protect the confidentiality and security of this information and to use it only for its intended purpose.
We may share information with our affiliates to service your account or to provide you with information about other BlackRock products or services that may be of interest to you. In addition, BlackRock restricts access to non-public personal information about its Clients to those BlackRock employees with a legitimate business need for the information. BlackRock maintains physical, electronic and procedural safeguards that are designed to protect the non-public personal information of its Clients, including procedures relating to the proper storage and disposal of such information.
Fund and/or MIP Service Providers
Investment Adviser
BlackRock Fund Advisors
San Francisco, CA 94105
Administrator
BlackRock Advisors, LLC
Wilmington, DE 19809
Accounting Agent and Custodian
State Street Bank and Trust Company
Boston, MA 02111
Transfer Agent
BNY Mellon Investment Servicing (US) Inc.
Wilmington, DE 19809
Distributor
BlackRock Investments, LLC
New York, NY 10022
Independent Registered Public Accounting Firm
PricewaterhouseCoopers LLP
Philadelphia, PA 19103
Legal Counsel
Sidley Austin LLP
New York, NY 10019
Address of the Trust/MIP
400 Howard Street
San Francisco, CA 94105
| | |
ADDITIONAL INFORMATION | | 61 |
Glossary of Terms Used in this Report
| | |
| Portfolio Abbreviation |
| |
| ADR | | American Depositary Receipt |
| |
| CD | | Certificate of Deposit |
| |
| CPO | | Certificates of Participation (Ordinary) |
| |
| GDR | | Global Depositary Receipt |
| |
| JSC | | Joint Stock Company |
| |
| MSCI | | Morgan Stanley Capital International |
| |
| NVDR | | Non-Voting Depositary Receipt |
| |
| PCL | | Public Company Limited |
| |
| PJSC | | Public Joint Stock Company |
| |
| REIT | | Real Estate Investment Trust |
| |
| SCA | | Societe en Commandite par Actions |
| |
| SRF | | State Revolving Fund |
| | |
| 62 | | 2 0 2 1 BLACK ROCK ANNUAL REPORT TO SHAREHOLDERS |
Want to know more?
blackrock.com | 800-441-7762
This report is intended for current holders. It is not authorized for use as an offer of sale or a solicitation of an offer to buy shares of the Fund unless preceded or accompanied by the Fund’s current prospectus. Past performance results shown in this report should not be considered a representation of future performance. Investment returns and principal value of shares will fluctuate so that shares, when redeemed, may be worth more or less than their original cost. Statements and other information herein are as dated and are subject to change.
TIEXUS-12/21-AR
| | |

| | DECEMBER 31, 2021 |
BlackRock Funds III
| · | | iShares Russell 1000 Large-Cap Index Fund |
|
Not FDIC Insured • May Lose Value • No Bank Guarantee |
The Markets in Review
Dear Shareholder,
The 12-month reporting period as of December 31, 2021 saw a continuation of the resurgent growth that followed the initial coronavirus (or “COVID-19”) pandemic reopening, albeit at a slower pace. The global economy weathered the emergence of several variant strains and the resulting peaks and troughs in infections amid optimism that increasing vaccinations and economic adaptation could help contain the pandemic’s disruptions. Continued growth meant that the U.S. economy regained and then surpassed its pre-pandemic output. However, a rapid rebound in consumer spending pushed up against supply constraints and led to elevated inflation.
Equity prices rose with the broader economy, as the implementation of mass vaccination campaigns and passage of an additional fiscal stimulus package and infrastructure bill further boosted stocks. In the United States, both large- and small-capitalization stocks posted a strong advance, and many equity indices neared or surpassed all-time highs late in the reporting period. International equities from developed markets also gained, although emerging market stocks declined, pressured by a strengthening U.S. dollar.
The 10-year U.S. Treasury yield (which is inversely related to bond prices) rose during the reporting period as the economy expanded rapidly and inflation reached its highest annualized reading in decades. In the corporate bond market, support from the U.S. Federal Reserve (the “Fed”) assuaged credit concerns and led to solid returns for high-yield corporate bonds, outpacing investment-grade corporate bonds, which declined.
The Fed maintained accommodative monetary policy during the reporting period by maintaining near-zero interest rates and by asserting that inflation could exceed its 2% target for a sustained period without triggering a rate increase. However, the Fed’s tone shifted late in the year, as it reduced its bond-buying program and used its market guidance to raise the prospect of higher rates in 2022.
Looking ahead, we believe that the global expansion will continue to broaden as Europe and other developed market economies gain momentum, although the Delta and Omicron variants of the coronavirus remain a threat, particularly in emerging markets. While we expect inflation to abate somewhat as supply bottlenecks are resolved, we anticipate that inflation will remain higher than the pre-COVID norm. The Fed is poised to raise interest rates next year in response, but the Fed’s policy shift means that tightening is likely to be less aggressive than what we’ve seen in previous cycles.
In this environment, we favor an overweight to equities, as we believe low interest rates and continued economic growth will support further gains, albeit likely more modest than what we saw in 2021. Sectors that are better poised to manage the transition to a lower-carbon world, such as technology and health care, are particularly attractive in the long term. U.S. and other developed-market equities have room for further growth, while we believe Chinese equities stand to gain from a more accommodative monetary and fiscal environment as the Chinese economy slows. We are underweight long-term credit, but inflation-protected U.S. Treasuries, Asian fixed income, and emerging market local-currency bonds offer potential opportunities. We believe that international diversification and a focus on sustainability can help provide portfolio resilience, and the disruption created by the coronavirus appears to be accelerating the shift toward sustainable investments.
In this environment, our view is that investors need to think globally, extend their scope across a broad array of asset classes, and be nimble as market conditions change. We encourage you to talk with your financial advisor and visit blackrock.com for further insight about investing in today’s markets.
Sincerely,

Rob Kapito
President, BlackRock Advisors, LLC

Rob Kapito
President, BlackRock Advisors, LLC
| | | | |
| Total Returns as of December 31, 2021 |
| | | 6-Month | | 12-Month |
| | |
U.S. large cap equities
(S&P 500® Index) | | 11.67% | | 28.71% |
| | |
U.S. small cap equities
(Russell 2000® Index) | | (2.31) | | 14.82 |
International equities (MSCI Europe, Australasia, Far East Index) | | 2.24 | | 11.26 |
Emerging market equities
(MSCI Emerging Markets Index) | | (9.30) | | (2.54) |
3-month Treasury bills
(ICE BofA 3-Month U.S. Treasury Bill Index) | | 0.02 | | 0.05 |
U.S. Treasury securities
(ICE BofA 10-Year U.S. Treasury Index) | | 0.44 | | (3.68) |
U.S. investment grade bonds
(Bloomberg U.S. Aggregate Bond Index) | | 0.06 | | (1.54) |
Tax-exempt municipal bonds
(S&P Municipal Bond Index) | | 0.52 | | 1.77 |
U.S. high yield bonds
(Bloomberg U.S. Corporate High Yield 2%
Issuer Capped Index) | | 1.59 | | 5.26 |
|
| Past performance is not an indication of future results. Index performance is shown for illustrative purposes only. You cannot invest directly in an index. |
| | |
| 2 | | T H I S P A G E I S N O T P A R T O F Y O U R F U N D R E P O R T |
Table of Contents

| | |
| Fund Summary as of December 31, 2021 | | iShares Russell 1000 Large-Cap Index Fund |
Investment Objective
iShares Russell 1000 Large-Cap Index Fund’s (the “Fund”) investment objective is to match the performance of the Russell 1000® Index as closely as possible before the deduction of Fund expenses.
Portfolio Management Commentary
How did the Fund perform?
For the 12-month period ended December 31, 2021, the Fund’s Institutional Shares returned 26.27%, Investor A Shares returned 25.99%, and Class K Shares returned 26.37%. The benchmark Russell 1000® Index returned 26.45% for the same period.
Returns for the Fund’s respective share classes differ from the benchmark index based on individual share-class expenses. The Fund invests all of its assets in Large Cap Index Master Portfolio (the “Master Portfolio”), a series of Master Investment Portfolio.
Describe the market environment.
In the first quarter of 2021, following the strong end to 2020, favorable conditions continued with signs of a sooner-than-expected economic activity restart. Monetary conditions remained supportive, as the Fed signaled a continuing environment of low interest rates. With both the Senate and Congress passing a new $1.9 trillion stimulus package, and the United States starting to lead in the vaccine rollout, optimism continued to rise for strong economic growth in the first quarter. Despite the heightened volatility at the beginning of the quarter related to retail trading activity, the positive news about the stimulus package and the potential infrastructure bill soothed the market and supported a positive return over the first quarter.
The U.S. equity market rallied in the second quarter of 2021 as the vaccination campaign continued to accelerate, and as more signs started to emerge for a sooner-than-expected economic activity restart. The U.S. Consumer Price Index increased by more than 4% (one-year as of April 2021), which raised questions on whether this surge was sparked by temporary factors at play. However, the inflation concerns and the Fed’s cautious optimism about the recovery muted the market rally in May. In June, the U.S. equity market extended its rally, supported by the prospect of more fiscal stimulus, as President Biden reached a bipartisan $1 trillion agreement for infrastructure spending.
In the third quarter of 2021, U.S. equities continued climbing in August on the back of strong economic data and quarterly earnings reports. The positive return in markets came despite the increase in COVID-19 Delta variant cases in the United States. The Fed announcement in August was in line with expectations, as Fed Chair Jerome Powell suggested that tapering may start before year end during his Jackson Hole speech.
The positive sentiment of July and August was offset in September amid concerns regarding potential contagion from the unfolding debt crisis at Chinese property developer, Evergrande. Concerns that higher inflation and supply chain issues would last longer than expected also weighed down on the market. Lastly, the continuing disagreement in Washington D.C. regarding the debt ceiling and the infrastructure bill dampened U.S. equity performance. However, Congress passed a bill, toward the end of the third quarter, extending government funding until December 3, 2021.
Following a strong earnings season in the fourth quarter of 2021 that boosted the positive sentiment early in the quarter, the emergence of the new COVID-19 Omicron variant and the concerns about higher inflation rates weighed down on U.S. market performance in November. However, preliminary data showed that the coronavirus vaccine was effective against the Omicron variant, and the Fed shared more clarity on next year’s policy path, leading to strong positive returns to end the fourth quarter. The falling unemployment rate and the $550 billion bipartisan infrastructure bill signed by President Biden supported market performance over the fourth quarter.
The Fed’s stance on monetary policy was at the forefront of market discussions over the fourth quarter of 2021. Fed Chair Jerome Powell conceded that inflation had been far stickier than initially anticipated. These inflation pressures have been exacerbated as consumer demand continued to increase with supply chain bottlenecks and labor shortages. The Fed brought forward the dates of tapering to Spring 2022.
In the fourth quarter of 2021, from a Global Industry Classification Standard sector perspective within the benchmark, real estate (+13.80%), information technology (+13.77%) and materials (+12.76%) were among the best performers. While communication services (-0.92%), financials (+3.28%), and industrials (+6.08%) were among the worst performers.
Describe recent portfolio activity.
During the period, as changes were made to the composition of the Russell 1000 Index® Index, the Master Portfolio purchased and sold securities to maintain its objective of replicating the risks and return of the benchmark index.
Describe portfolio positioning at period end.
The Master Portfolio remains positioned to match the risk characteristics of its benchmark index, irrespective of the market’s future direction.
The views expressed reflect the opinions of BlackRock as of the date of this report and are subject to change based on changes in market, economic or other conditions. These views are not intended to be a forecast of future events and are no guarantee of future results.
| | |
| 4 | | 2 0 2 1 BLACK ROCK ANNUAL REPORT TO SHAREHOLDERS |
| | |
| Fund Summary as of December 31, 2021 (continued) | | iShares Russell 1000 Large-Cap Index Fund |
TOTAL RETURN BASED ON A $10,000 INVESTMENT
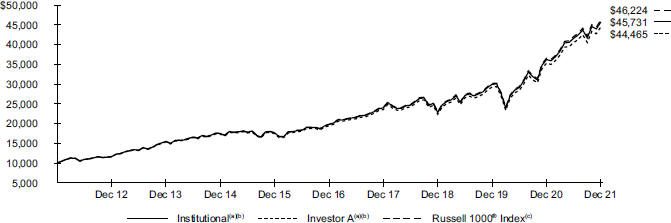
| (a) | Assuming transaction costs and other operating expenses, including administration fees, if any. | |
| (b) | The Fund invests all of its assets in the Master Portfolio. The Master Portfolio will be substantially invested in equity securities in the Russell 1000® Index and will invest, under normal circumstances, at least 80% of its net assets in securities or other financial instruments that are components of or have economic characteristics similar to the securities included in the Russell 1000® Index. | |
| (c) | An index that measures the performance of the large-cap segment of the U.S. equity universe. It is a subset of the Russell 3000® Index and includes approximately 1,000 of the largest securities based on a combination of their market capitalization and current index membership. The index represents approximately 93% of the U.S. market. | |
Performance
| | | | | | | | | | | | |
| | | Average Annual Total Returns(a) | |
| | | | 1 Year | | | | 5 Years | | | | 10 Years | |
Institutional | | | 26.27 | % | | | 18.26 | % | | | 16.42 | % |
Investor A | | | 25.99 | | | | 17.96 | | | | 16.09 | |
Class K | | | 26.37 | | | | 18.33 | | | | 16.43 | |
| | | |
Russell 1000® Index | | | 26.45 | | | | 18.43 | | | | 16.54 | |
| | (a) | See “About Fund Performance” for a detailed description of share classes, including any related fees. | |
Past performance is not an indication of future results.
Performance results may include adjustments made for financial reporting purposes in accordance with U.S. generally accepted accounting principles.
Expense Example
| | | | | | | | | | | | | | | | | | | | | | | | | | | | | | | | |
| | | Actual | | | | | | Hypothetical(a) | | | | |
| | | | | | | | |
| | |
| Beginning
Account Value
(07/01/21) |
| |
| Ending
Account Value
(12/31/21) |
| |
| Expenses
Paid During
the Period |
(b) | | | | | |
| Beginning
Account Value
(07/01/21) |
| |
| Ending
Account Value
(12/31/21) |
| |
| Expenses
Paid During
the Period |
(b) | |
| Annualized
Expense
Ratio |
|
Institutional | | $ | 1,000.00 | | | | $ 1,099.30 | | | $ | 0.63 | | | | | | | $ | 1,000.00 | | | $ | 1,024.60 | | | $ | 0.61 | | | | 0.12 | % |
Investor A | | | 1,000.00 | | | | 1,098.10 | | | | 2.01 | | | | | | | | 1,000.00 | | | | 1,023.29 | | | | 1.94 | | | | 0.38 | |
Class K | | | 1,000.00 | | | | 1,099.60 | | | | 0.37 | | | | | | | | 1,000.00 | | | | 1,024.85 | | | | 0.36 | | | | 0.07 | |
| | (a) | Hypothetical 5% annual return before expenses is calculated by prorating the number of days in the most recent fiscal half year divided by 365. | |
| | (b) | For each class of the Fund, expenses are equal to the annualized expense ratio for the class, multiplied by the average account value over the period, multiplied by 184/365 (to reflect the one-half year period shown). Because the Fund invests all of its assets in the Master Portfolio, the expense example reflects the net expenses of both the Fund and the Master Portfolio in which it invests. | |
See “Disclosure of Expenses” for further information on how expenses were calculated.
| | |
| About Fund Performance | | iShares Russell 1000 Large-Cap Index Fund |
Institutional and Class K Shares are not subject to any sales charge. These shares bear no ongoing distribution or service fees and are available only to certain eligible investors.
Investor A Shares are not subject to any sales charge and bear no ongoing distribution fee. These shares are subject to an ongoing service fee of 0.25% per year. These shares are generally available through financial intermediaries.
Past performance is not an indication of future results. Financial markets have experienced extreme volatility and trading in many instruments has been disrupted. These circumstances may continue for an extended period of time and may continue to affect adversely the value and liquidity of the Fund’s investments. As a result, current performance may be lower or higher than the performance data quoted. Refer to blackrock.com to obtain performance data current to the most recent month-end. Performance results do not reflect the deduction of taxes that a shareholder would pay on Fund distributions or the redemption of Fund shares. Figures shown in the performance table(s) assume reinvestment of all distributions, if any, at net asset value (“NAV”) on the ex-dividend date or payable date, as applicable. Investment return and principal value of shares will fluctuate so that shares, when redeemed, may be worth more or less than their original cost. Distributions paid to each class of shares will vary because of the different levels of service, distribution and transfer agency fees applicable to each class, which are deducted from the income available to be paid to shareholders.
BlackRock Advisors, LLC (the “Administrator”), the Fund’s administrator, has contractually and/or voluntarily agreed to waive and/or reimburse a portion of the Fund’s expenses. Without such waiver(s) and/or reimbursement(s), the Fund’s performance would have been lower. With respect to the Fund’s voluntary waiver(s), if any, the Administrator is under no obligation to waive and/or reimburse or to continue waiving and/or reimbursing its fees and such voluntary waiver(s) may be reduced or discontinued at any time. With respect to the Fund’s contractual waiver(s), if any, the Administrator is under no obligation to continue waiving and/or reimbursing its fees after the applicable termination date of such agreement. See the Notes to Financial Statements for additional information on waivers and/or reimbursements.
Disclosure of Expenses
Shareholders of the Fund may incur the following charges: (a) transactional expenses; and (b) operating expenses, including administration fees, service and distribution fees, including 12b-1 fees, acquired fund fees and expenses, and other fund expenses. The expense example shown (which is based on a hypothetical investment of $1,000 invested at the beginning of the period (or from the commencement of operations if less than 6 months) and held through the end of the period) is intended to assist shareholders both in calculating expenses based on an investment in the Fund and in comparing these expenses with similar costs of investing in other mutual funds.
The expense example provides information about actual account values and actual expenses. Annualized expense ratios reflect contractual and voluntary fee waivers, if any. In order to estimate the expenses a shareholder paid during the period covered by this report, shareholders can divide their account value by $1,000 and then multiply the result by the number corresponding to their share class under the heading entitled “Expenses Paid During the Period.”
The expense example also provides information about hypothetical account values and hypothetical expenses based on the Fund’s actual expense ratio and an assumed rate of return of 5% per year before expenses. In order to assist shareholders in comparing the ongoing expenses of investing in the Fund and other funds, compare the 5% hypothetical example with the 5% hypothetical examples that appear in shareholder reports of other funds.
The expenses shown in the expense example are intended to highlight shareholders’ ongoing costs only and do not reflect transactional expenses, such as sales charges, if any. Therefore, the hypothetical example is useful in comparing ongoing expenses only and will not help shareholders determine the relative total expenses of owning different funds. If these transactional expenses were included, shareholder expenses would have been higher.
Derivative Financial Instruments
The Large Cap Index Master Portfolio (the “Master Portfolio”) may invest in various derivative financial instruments. These instruments are used to obtain exposure to a security, commodity, index, market, and/or other assets without owning or taking physical custody of securities, commodities and/or other referenced assets or to manage market, equity, credit, interest rate, foreign currency exchange rate, commodity and/or other risks. Derivative financial instruments may give rise to a form of economic
leverage and involve risks, including the imperfect correlation between the value of a derivative financial instrument and the underlying asset, possible default of the counterparty to the transaction or illiquidity of the instrument. The Master Portfolio’s successful use of a derivative financial instrument depends on the investment adviser’s ability to predict pertinent market movements accurately, which cannot be assured. The use of these instruments may result in losses greater than if they had not been used, may limit the amount of appreciation the Master Portfolio can realize on an investment and/or may result in lower distributions paid to shareholders. The Master Portfolio’s investments in these instruments, if any, are discussed in detail in the Master Portfolio Notes to Financial Statements.
| | |
| 6 | | 2 0 2 1 BLACK ROCK ANNUAL REPORT TO SHAREHOLDERS |
Statement of Assets and Liabilities
December 31, 2021
| | | | |
| | | iShares
Russell 1000
Large-Cap
Index Fund | |
| |
ASSETS | | | | |
Investments, at value — Master Portfolio | | $ | 809,363,774 | |
Receivables: | | | | |
Capital shares sold | | | 1,361,652 | |
Withdrawals from the Master Portfolio | | | 8,302,465 | |
Prepaid expenses | | | 19,546 | |
| | | | |
| |
Total assets | | | 819,047,437 | |
| | | | |
| |
LIABILITIES | | | | |
Payables: | | | | |
Accounting services fees | | | 2,076 | |
Administration fees | | | 6,713 | |
Capital shares redeemed | | | 9,664,463 | |
Officer’s fees | | | 254 | |
Other accrued expenses | | | 10,718 | |
Professional fees | | | 32,439 | |
Service fees | | | 11,370 | |
Transfer agent fees | | | 116,419 | |
| | | | |
| |
Total liabilities | | | 9,844,452 | |
| | | | |
| |
NET ASSETS | | $ | 809,202,985 | |
| | | | |
| |
NET ASSETS CONSIST OF | | | | |
Paid-in capital | | $ | 402,761,093 | |
Accumulated earnings | | | 406,441,892 | |
| | | | |
| |
NET ASSETS | | $ | 809,202,985 | |
| | | | |
| | |
FUND FINANCIAL STATEMENTS | | 7 |
Statement of Assets and Liabilities (continued)
December 31, 2021
| | | | |
| | | iShares
Russell 1000
Large-Cap
Index Fund | |
| |
NET ASSET VALUE | | | | |
Institutional | | | | |
| |
Net assets | | $ | 172,195,723 | |
| | | | |
| |
Shares outstanding | | | 5,548,573 | |
| | | | |
| |
Net asset value | | $ | 31.03 | |
| | | | |
| |
Shares authorized | | | Unlimited | |
| | | | |
| |
Par value | | | N/A | |
| | | | |
| |
Investor A | | | | |
| |
Net assets | | $ | 61,446,470 | |
| | | | |
| |
Shares outstanding | | | 1,991,946 | |
| | | | |
| |
Net asset value | | $ | 30.85 | |
| | | | |
| |
Shares authorized | | | Unlimited | |
| | | | |
| |
Par value | | | N/A | |
| | | | |
| |
Class K | | | | |
| |
Net assets | | $ | 575,560,792 | |
| | | | |
| |
Shares outstanding | | | 18,624,501 | |
| | | | |
| |
Net asset value | | $ | 30.90 | |
| | | | |
| |
Shares authorized | | | Unlimited | |
| | | | |
| |
Par value | | | N/A | |
| | | | |
See notes to financial statements.
| | |
| 8 | | 2 0 2 1 BLACK ROCK ANNUAL REPORT TO SHAREHOLDERS |
Statement of Operations
Year Ended December 31, 2021
| | | | |
| | | iShares
Russell 1000
Large-Cap
Index Fund | |
| |
| |
INVESTMENT INCOME | | | | |
Net investment income allocated from the Master Portfolio: | | | | |
Dividends — unaffiliated | | $ | 9,431,251 | |
Dividends — affiliated | | | 122,121 | |
Securities lending income — affiliated — net | | | 74,628 | |
Foreign taxes withheld | | | (1,298 | ) |
Expenses | | | (240,135 | ) |
Fees waived | | | 5,360 | |
| | | | |
| |
Total investment income | | | 9,391,927 | |
| | | | |
| |
FUND EXPENSES | | | | |
Transfer agent — class specific | | | 275,586 | |
Service — class specific | | | 139,490 | |
Registration | | | 71,202 | |
Administration | | | 71,009 | |
Professional | | | 67,668 | |
Accounting services | | | 4,972 | |
Officer | | | 288 | |
Miscellaneous | | | 16,747 | |
| | | | |
| |
Total expenses | | | 646,962 | |
Less: | | | | |
Fees waived and/or reimbursed by the Administrator | | | (1,285 | ) |
Transfer agent fees waived and/or reimbursed — class specific | | | (147,658 | ) |
| | | | |
| |
Total expenses after fees waived and/or reimbursed | | | 498,019 | |
| | | | |
| |
Net investment income | | | 8,893,908 | |
| | | | |
| |
REALIZED AND UNREALIZED GAIN (LOSS) ALLOCATED FROM THE MASTER PORTFOLIO | | | | |
Net realized gain from: | | | | |
Investments — unaffiliated | | | 4,475,982 | |
Investments — affiliated | | | 821,665 | |
Futures contracts | | | 1,070,532 | |
| | | | |
| |
| | | 6,368,179 | |
| | | | |
| |
Net change in unrealized appreciation (depreciation) on: | | | | |
Investments — unaffiliated | | | 146,810,876 | |
Investments — affiliated | | | 897,528 | |
Futures contracts | | | 20,509 | |
| | | | |
| |
| | | 147,728,913 | |
| | | | |
| |
Net realized and unrealized gain | | | 154,097,092 | |
| | | | |
| |
NET INCREASE IN NET ASSETS RESULTING FROM OPERATIONS | | $ | 162,991,000 | |
| | | | |
See notes to financial statements.
| | |
FUND FINANCIAL STATEMENTS | | 9 |
Statements of Changes in Net Assets
| | | | | | | | |
| | | iShares Russell 1000 Large-Cap Index Fund | |
| | | | |
| |
| | | Year Ended December 31, | |
| | | | |
| | |
| | | 2021 | | | 2020 | |
| |
| | |
INCREASE (DECREASE) IN NET ASSETS | | | | | | | | |
| | |
OPERATIONS | | | | | | | | |
Net investment income | | $ | 8,893,908 | | | $ | 8,728,166 | |
Net realized gain (loss) | | | 6,368,179 | | | | (2,612,897 | ) |
Net change in unrealized appreciation (depreciation) | | | 147,728,913 | | | | 121,879,004 | |
| | | | | | | | |
| | |
Net increase in net assets resulting from operations | | | 162,991,000 | | | | 127,994,273 | |
| | | | | | | | |
| | |
DISTRIBUTIONS TO SHAREHOLDERS(a) | | | | | | | | |
Institutional | | | (3,082,663 | ) | | | (1,928,228 | ) |
Investor A | | | (930,718 | ) | | | (1,105,082 | ) |
Class K | | | (10,979,369 | ) | | | (6,317,909 | ) |
| | | | | | | | |
| | |
Decrease in net assets resulting from distributions to shareholders | | | (14,992,750 | ) | | | (9,351,219 | ) |
| | | | | | | | |
| | |
CAPITAL SHARE TRANSACTIONS | | | | | | | | |
Net increase (decrease) in net assets derived from capital share transactions | | | (280,334 | ) | | | 86,583,042 | |
| | | | | | | | |
| | |
NET ASSETS | | | | | | | | |
Total increase in net assets | | | 147,717,916 | | | | 205,226,096 | |
Beginning of year | | | 661,485,069 | | | | 456,258,973 | |
| | | | | | | | |
| | |
End of year | | $ | 809,202,985 | | | $ | 661,485,069 | |
| | | | | | | | |
(a) Distributions for annual periods determined in accordance with U.S. federal income tax regulations.
See notes to financial statements.
| | |
| 10 | | 2 0 2 1 BLACK ROCK ANNUAL REPORT TO SHAREHOLDERS |
Financial Highlights
(For a share outstanding throughout each period)
| | | | | | | | | | | | | | | | | | | | | | |
| | | iShares Russell 1000 Large-Cap Index Fund | |
| |
| | | Institutional | |
| |
| | | Year Ended December 31, | |
| | | | | | |
| | | | | 2021 | | | 2020 | | | 2019 | | | 2018 | | | 2017 | |
| | | | | | |
Net asset value, beginning of year | | | | $ | 25.08 | | | $ | 21.14 | | | $ | 16.58 | | | $ | 17.82 | | | $ | 15.07 | |
| | | | | | | | | | | | | | | | | | | | | | |
Net investment income(a) | | | | | 0.35 | | | | 0.35 | | | | 0.35 | | | | 0.34 | | | | 0.30 | |
Net realized and unrealized gain (loss) | | | | | 6.19 | | | | 3.96 | | | | 4.79 | | | | (1.19 | ) | | | 2.91 | |
| | | | | | | | | | | | | | | | | | | | | | |
| | | | | | |
Net increase (decrease) from investment operations | | | | | 6.54 | | | | 4.31 | | | | 5.14 | | | | (0.85 | ) | | | 3.21 | |
| | | | | | | | | | | | | | | | | | | | | | |
| | | | | | |
Distributions(b) | | | | | | | | | | | | | | | | | | | | | | |
From net investment income | | | | | (0.37 | ) | | | (0.34 | ) | | | (0.39 | ) | | | (0.33 | ) | | | (0.35 | ) |
From net realized gain | | | | | (0.22 | ) | | | (0.03 | ) | | | (0.19 | ) | | | (0.06 | ) | | | (0.11 | ) |
Return of capital | | | | | — | | | | — | | | | — | | | | — | | | | (0.00 | )(c) |
| | | | | | | | | | | | | | | | | | | | | | |
| | | | | | |
Total distributions | | | | | (0.59 | ) | | | (0.37 | ) | | | (0.58 | ) | | | (0.39 | ) | | | (0.46 | ) |
| | | | | | | | | | | | | | | | | | | | | | |
| | | | | | |
Net asset value, end of year | | | | $ | 31.03 | | | $ | 25.08 | | | $ | 21.14 | | | $ | 16.58 | | | $ | 17.82 | |
| | | | | | | | | | | | | | | | | | | | | | |
| | | | | | |
Total Return(d) | | | | | | | | | | | | | | | | | | | | | | |
Based on net asset value | | | | | 26.27 | % | | | 20.79 | % | | | 31.28 | % | | | (4.88 | )% | | | 21.46 | % |
| | | | | | | | | | | | | | | | | | | | | | |
| | | | | | |
Ratios to Average Net Assets(e)(f)(g) | | | | | | | | | | | | | | | | | | | | | | |
Total expenses | | | | | 0.12 | % | | | 0.13 | % | | | 0.15 | %(h) | | | 0.17 | %(i) | | | 0.17 | %(i) |
| | | | | | | | | | | | | | | | | | | | | | |
| | | | | | |
Total expenses after fees waived and/or reimbursed | | | | | 0.12 | % | | | 0.13 | % | | | 0.13 | % | | | 0.13 | % | | | 0.13 | % |
| | | | | | | | | | | | | | | | | | | | | | |
| | | | | | |
Net investment income | | | | | 1.24 | % | | | 1.66 | % | | | 1.81 | % | | | 1.89 | % | | | 1.82 | % |
| | | | | | | | | | | | | | | | | | | | | | |
| | | | | | |
Supplemental Data | | | | | | | | | | | | | | | | | | | | | | |
Net assets, end of year (000) | | | | $ | 172,196 | | | $ | 125,604 | | | $ | 82,729 | | | $ | 102,279 | | | $ | 45,733 | |
| | | | | | | | | | | | | | | | | | | | | | |
| | | | | | |
Portfolio turnover rate of the Master Portfolio | | | | | 17 | % | | | 14 | % | | | 10 | % | | | 12 | % | | | 12 | % |
| | | | | | | | | | | | | | | | | | | | | | |
| (a) | Based on average shares outstanding. |
| (b) | Distributions for annual periods determined in accordance with U.S. federal income tax regulations. |
| (c) | Amount is greater than $(0.005) per share. |
| (d) | Where applicable, assumes the reinvestment of distributions. |
| (e) | Includes the Fund’s share of the Master Portfolio’s allocated net expenses and/or net investment income. |
| (f) | Includes the Fund’s share of the Master Portfolio’s allocated fees waived of less than 0.01%. |
| (g) | Excludes fees and expenses incurred indirectly as a result of investments in underlying funds. |
| (h) | Includes recoupment of past waived and/or reimbursed fees. Excluding the recoupment of past waived and/or reimbursed fees for the year ended December, 31, 2019, the expense ratio would have been 0.14%. |
| (i) | Includes recoupment of past waived and/or reimbursed fees with no financial impact to the expense ratio. |
See notes to financial statements.
| | |
FUND FINANCIAL HIGHLIGHTS | | 11 |
Financial Highlights (continued)
(For a share outstanding throughout each period)
| | | | | | | | | | | | | | | | | | | | |
| | | iShares Russell 1000 Large-Cap Index Fund (continued) | |
| |
| | | Investor A | |
| |
| | | Year Ended December 31, | |
| | | | | |
| | | 2021 | | | 2020 | | | 2019 | | | 2018 | | | 2017 | |
| | | | | |
Net asset value, beginning of year | | $ | 24.92 | | | $ | 21.01 | | | $ | 16.48 | | | $ | 17.72 | | | $ | 14.99 | |
| | | | | | | | | | | | | | | | | | | | |
Net investment income(a) | | | 0.28 | | | | 0.30 | | | | 0.30 | | | | 0.29 | | | | 0.26 | |
Net realized and unrealized gain (loss) | | | 6.16 | | | | 3.92 | | | | 4.76 | | | | (1.18 | ) | | | 2.89 | |
| | | | | | | | | | | | | | | | | | | | |
| | | | | |
Net increase (decrease) from investment operations | | | 6.44 | | | | 4.22 | | | | 5.06 | | | | (0.89 | ) | | | 3.15 | |
| | | | | | | | | | | | | | | | | | | | |
| | | | | |
Distributions(b) | | | | | | | | | | | | | | | | | | | | |
From net investment income | | | (0.29 | ) | | | (0.28 | ) | | | (0.34 | ) | | | (0.29 | ) | | | (0.31 | ) |
From net realized gain | | | (0.22 | ) | | | (0.03 | ) | | | (0.19 | ) | | | (0.06 | ) | | | (0.11 | ) |
Return of capital | | | — | | | | — | | | | — | | | | — | | | | 0.00 | (c) |
| | | | | | | | | | | | | | | | | | | | |
| | | | | |
Total distributions | | | (0.51 | ) | | | (0.31 | ) | | | (0.53 | ) | | | (0.35 | ) | | | (0.42 | ) |
| | | | | | | | | | | | | | | | | | | | |
| | | | | |
Net asset value, end of year | | $ | 30.85 | | | $ | 24.92 | | | $ | 21.01 | | | $ | 16.48 | | | $ | 17.72 | |
| | | | | | | | | | | | | | | | | | | | |
| | | | | |
Total Return(d) | | | | | | | | | | | | | | | | | | | | |
Based on net asset value | | | 25.99 | % | | | 20.45 | % | | | 30.98 | % | | | (5.15 | )% | | | 21.16 | % |
| | | | | | | | | | | | | | | | | | | | |
| | | | | |
Ratios to Average Net Assets(e)(f)(g) | | | | | | | | | | | | | | | | | | | | |
Total expenses | | | 0.63 | % | | | 0.68 | % | | | 0.76 | % | | | 0.87 | % | | | 0.68 | %(h) |
| | | | | | | | | | | | | | | | | | | | |
| | | | | |
Total expenses after fees waived and/or reimbursed | | | 0.37 | % | | | 0.38 | % | | | 0.38 | % | | | 0.38 | % | | | 0.38 | % |
| | | | | | | | | | | | | | | | | | | | |
| | | | | |
Net investment income | | | 0.98 | % | | | 1.42 | % | | | 1.57 | % | | | 1.60 | % | | | 1.56 | % |
| | | | | | | | | | | | | | | | | | | | |
| | | | | |
Supplemental Data | | | | | | | | | | | | | | | | | | | | |
Net assets, end of year (000) | | $ | 61,446 | | | $ | 84,724 | | | $ | 86,038 | | | $ | 57,500 | | | $ | 66,675 | |
| | | | | | | | | | | | | | | | | | | | |
| | | | | |
Portfolio turnover rate of the Master Portfolio | | | 17 | % | | | 14 | % | | | 10 | % | | | 12 | % | | | 12 | % |
| | | | | | | | | | | | | | | | | | | | |
| (a) | Based on average shares outstanding. |
| (b) | Distributions for annual periods determined in accordance with U.S. federal income tax regulations. |
| (c) | Amount is greater than $(0.005) per share. |
| (d) | Where applicable, assumes the reinvestment of distributions. |
| (e) | Includes the Fund’s share of the Master Portfolio’s allocated net expenses and/or net investment income. |
| (f) | Includes the Fund’s share of the Master Portfolio’s allocated fees waived of less than 0.01%. |
| (g) | Excludes fees and expenses incurred indirectly as a result of investments in underlying funds. |
| (h) | Includes recoupment of past waived and/or reimbursed fees. Excluding the recoupment of past waived and/or reimbursed fees for the year ended December, 31, 2017, the expense ratio would have been 0.67%. |
See notes to financial statements.
| | |
| 12 | | 2 0 2 1 BLACK ROCK ANNUAL REPORT TO SHAREHOLDERS |
Financial Highlights (continued)
(For a share outstanding throughout each period)
| | | | | | | | | | | | | | | | | | | | |
| | | iShares Russell 1000 Large-Cap Index Fund (continued) | |
| |
| | | Class K | |
| |
| | | Year Ended December 31, | |
| | | | | |
| | | 2021 | | | 2020 | | | 2019 | | | 2018 | | | 2017 | |
| | | | | |
Net asset value, beginning of year | | $ | 24.97 | | | $ | 21.05 | | | $ | 16.52 | | | $ | 17.76 | | | $ | 15.01 | |
| | | | | | | | | | | | | | | | | | | | |
Net investment income(a) | | | 0.36 | | | | 0.36 | | | | 0.36 | | | | 0.35 | | | | 0.31 | |
Net realized and unrealized gain (loss) | | | 6.17 | | | | 3.94 | | | | 4.76 | | | | (1.19 | ) | | | 2.91 | |
| | | | | | | | | | | | | | | | | | | | |
| | | | | |
Net increase (decrease) from investment operations | | | 6.53 | | | | 4.30 | | | | 5.12 | | | | (0.84 | ) | | | 3.22 | |
| | | | | | | | | | | | | | | | | | | | |
| | | | | |
Distributions(b) | | | | | | | | | | | | | | | | | | | | |
From net investment income | | | (0.38 | ) | | | (0.35 | ) | | | (0.40 | ) | | | (0.34 | ) | | | (0.36 | ) |
From net realized gain | | | (0.22 | ) | | | (0.03 | ) | | | (0.19 | ) | | | (0.06 | ) | | | (0.11 | ) |
Return of capital | | | — | | | | — | | | | — | | | | — | | | | (0.00 | )(c) |
| | | | | | | | | | | | | | | | | | | | |
| | | | | |
Total distributions | | | (0.60 | ) | | | (0.38 | ) | | | (0.59 | ) | | | (0.40 | ) | | | (0.47 | ) |
| | | | | | | | | | | | | | | | | | | | |
| | | | | |
Net asset value, end of year | | $ | 30.90 | | | $ | 24.97 | | | $ | 21.05 | | | $ | 16.52 | | | $ | 17.76 | |
| | | | | | | | | | | | | | | | | | | | |
| | | | | |
Total Return(d) | | | | | | | | | | | | | | | | | | | | |
Based on net asset value | | | 26.37 | % | | | 20.84 | % | | | 31.28 | % | | | (4.85 | )% | | | 21.60 | % |
| | | | | | | | | | | | | | | | | | | | |
| | | | | |
Ratios to Average Net Assets(e)(f)(g) | | | | | | | | | | | | | | | | | | | | |
Total expenses | | | 0.07 | % | | | 0.08 | % | | | 0.10 | % | | | 0.13 | % | | | 0.10 | %(h) |
| | | | | | | | | | | | | | | | | | | | |
| | | | | |
Total expenses after fees waived and/or reimbursed | | | 0.07 | % | | | 0.07 | % | | | 0.08 | % | | | 0.08 | % | | | 0.08 | % |
| | | | | | | | | | | | | | | | | | | | |
| | | | | |
Net investment income | | | 1.29 | % | | | 1.71 | % | | | 1.87 | % | | | 1.92 | % | | | 1.87 | % |
| | | | | | | | | | | | | | | | | | | | |
| | | | | |
Supplemental Data | | | | | | | | | | | | | | | | | | | | |
Net assets, end of year (000) | | $ | 575,561 | | | $ | 451,157 | | | $ | 287,492 | | | $ | 154,097 | | | $ | 99,149 | |
| | | | | | | | | | | | | | | | | | | | |
| | | | | |
Portfolio turnover rate of the Master Portfolio | | | 17 | % | | | 14 | % | | | 10 | % | | | 12 | % | | | 12 | % |
| | | | | | | | | | | | | | | | | | | | |
| (a) | Based on average shares outstanding. |
| (b) | Distributions for annual periods determined in accordance with U.S. federal income tax regulations. |
| (c) | Amount is greater than $(0.005) per share. |
| (d) | Where applicable, assumes the reinvestment of distributions. |
| (e) | Includes the Fund’s share of the Master Portfolio’s allocated net expenses and/or net investment income. |
| (f) | Includes the Fund’s share of the Master Portfolio’s allocated fees waived of less than 0.01%. |
| (g) | Excludes fees and expenses incurred indirectly as a result of investments in underlying funds. |
| (h) | Includes recoupment of past waived and/or reimbursed fees with no financial impact to the expense ratio. |
See notes to financial statements.
| | |
FUND FINANCIAL HIGHLIGHTS | | 13 |
Notes to Financial Statements
BlackRock Funds III (the “Trust”) is registered under the Investment Company Act of 1940, as amended (the “1940 Act”), as an open-end management investment company. The Trust is organized as a Delaware statutory trust. iShares Russell 1000 Large-Cap Index Fund (the “Fund”) is a series of the Trust. The Fund is classified as diversified.
The Fund seeks to achieve its investment objective by investing all of its assets in Large Cap Index Master Portfolio (the “Master Portfolio”), a series of Master Investment Portfolio (“MIP”) and an affiliate of the Trust, which has the same investment objective and strategies as the Fund. The value of the Fund’s investment in the Master Portfolio reflects the Fund’s proportionate interest in the net assets of the Master Portfolio. The performance of the Fund is directly affected by the performance of the Master Portfolio. At December 31, 2021, the percentage of the Master Portfolio owned by the Fund was 3.3%. The financial statements of the Master Portfolio, including the Schedule of Investments, are included elsewhere in this report and should be read in conjunction with the Fund’s financial statements.
The Fund offers multiple classes of shares. All classes of shares have identical voting, dividend, liquidation and other rights and are subject to the same terms and conditions, except that certain classes bear expenses related to the shareholder servicing and distribution of such shares. Institutional and Class K Shares are sold only to certain eligible investors. Investor A Shares bear certain expenses related to shareholder servicing of such shares. Investor A Shares are generally available through financial intermediaries. Each class has exclusive voting rights with respect to matters relating to its shareholder servicing and distribution expenditures.
| | | | | | |
| | | | |
| Share Class | | Initial Sales Charge | | CDSC | | Conversion Privilege |
| | | |
Institutional Shares, Investor A and Class K | | No | | No | | None |
The Board of Trustees of the Trust and Board of Trustees of MIP are referred to throughout this report as the “Board” and the members are referred to as “Trustees”.
The Fund, together with certain other registered investment companies advised by BlackRock Fund Advisors (“BFA” or the “Manager”) or its affiliates, is included in a complex of open-end equity, multi-asset, index and money market funds referred to as the BlackRock Multi-Asset Complex.
| 2. | SIGNIFICANT ACCOUNTING POLICIES |
The financial statements are prepared in conformity with accounting principles generally accepted in the United States of America (“U.S. GAAP”), which may require management to make estimates and assumptions that affect the reported amounts of assets and liabilities in the financial statements, disclosure of contingent assets and liabilities at the date of the financial statements and the reported amounts of increases and decreases in net assets from operations during the reporting period. Actual results could differ from those estimates. The Fund is considered an investment company under U.S. GAAP and follows the accounting and reporting guidance applicable to investment companies. Below is a summary of significant accounting policies:
Investment Transactions and Income Recognition: For financial reporting purposes, contributions to and withdrawals from the Master Portfolio are accounted for on a trade date basis. The Fund records its proportionate share of the Master Portfolio’s income, expenses and realized and unrealized gains and losses on a daily basis. Realized and unrealized gains and losses are adjusted utilizing partnership tax allocation rules. In addition, the Fund accrues its own expenses. Income, expenses and realized and unrealized gains and losses are allocated daily to each class based on its relative net assets.
Distributions: Distributions paid by the Fund are recorded on the ex-dividend dates. The character and timing of distributions are determined in accordance with U.S. federal income tax regulations, which may differ from U.S. GAAP.
Indemnifications: In the normal course of business, the Fund enters into contracts that contain a variety of representations that provide general indemnification. The Fund’s maximum exposure under these arrangements is unknown because it involves future potential claims against the Fund, which cannot be predicted with any certainty.
Other: Expenses directly related to the Fund or its classes are charged to the Fund or the applicable class. Expenses directly related to the Fund and other shared expenses prorated to the Fund are allocated daily to each class based on its relative net assets or other appropriate methods. Other operating expenses shared by several funds, including other funds managed by BlackRock Advisors, LLC (“BAL” or the “Administrator”), are prorated among those funds on the basis of relative net assets or other appropriate methods.
| 3. | INVESTMENT VALUATION AND FAIR VALUE MEASUREMENTS |
Investment Valuation Policies: The Fund’s policy is to value its financial instruments at fair value. The Fund records its investment in the Master Portfolio at fair value based on the Fund’s proportionate interest in the net assets of the Master Portfolio. Valuation of securities held by the Master Portfolio is discussed in Note 3 of the Master Portfolio’s Notes to Financial Statements, which are included elsewhere in this report.
| 4. | ADMINISTRATION AGREEMENT AND OTHER TRANSACTIONS WITH AFFILIATES |
Administration: The Trust, on behalf of the Fund, entered into an Administration Agreement with the Administrator, an indirect, wholly-owned subsidiary of BlackRock, Inc. (“BlackRock”), to provide administrative services (other than investment advice and related portfolio activities). For such services, the Fund pays the Administrator a monthly fee at an annual rate of 0.01% of the average daily net assets of the Fund. The Fund does not pay an investment advisory fee or investment management fee.
Service Fees: The Trust, on behalf of the Fund, entered into a Distribution Agreement and a Distribution and Service Plan with BlackRock Investments, LLC (“BRIL”), an affiliate of the Administrator. Pursuant to the Distribution and Service Plan and in accordance with Rule 12b-1 under the 1940 Act, the Fund pays BRIL ongoing service fees. The fees are accrued daily and paid monthly at an annual rate of 0.25% based upon the average daily net assets of the Investor A Shares.
| | |
| 14 | | 2 0 2 1 BLACK ROCK ANNUAL REPORT TO SHAREHOLDERS |
Notes to Financial Statements (continued)
BRIL and broker-dealers, pursuant to sub-agreements with BRIL, provide shareholder servicing to the Fund. The ongoing service fee compensates BRIL and each broker-dealer for providing shareholder servicing related services to shareholders.
For the year ended December 31, 2021, the class specific service fees borne directly by Investor A Shares were $139,490.
Transfer Agent: Pursuant to written agreements, certain financial intermediaries, some of which may be affiliates, provide the Fund with sub-accounting, recordkeeping, sub-transfer agency and other administrative services with respect to servicing of underlying investor accounts. For these services, these entities receive an asset-based fee or an annual fee per shareholder account, which will vary depending on share class and/or net assets. For the year ended December 31, 2021, the Fund did not pay any amounts to affiliates in return for these services.
The Administrator maintains a call center that is responsible for providing certain shareholder services to the Fund. Shareholder services include responding to inquiries and processing purchases and sales based upon instructions from shareholders. For the year ended December 31, 2021, the Fund reimbursed the Administrator the following amounts for costs incurred in running the call center, which are included in transfer agent — class specific in the Statement of Operations:
| | | | | | | | | | | | | | | | |
| |
| | | | |
| | | Institutional | | | Investor A | | | Class K | | | Total | |
| |
| | | | |
Reimbursed amounts | | $ | 670 | | | $ | 27,123 | | | $ | 2,133 | | | $ | 29,926 | |
| |
For the year ended December 31, 2021, the following table shows the class specific transfer agent fees borne directly by each share class of the Fund:
| | | | | | | | | | | | | | | | |
| |
| | | | |
| | | Institutional | | | Investor A | | | Class K | | | Total | |
| |
| | | | |
Transfer agent fees — class specific | | $ | 78,980 | | | $ | 177,758 | | | $ | 18,848 | | | $ | 275,586 | |
| |
Expense Limitations, Waivers and Reimbursements: The Administrator and the Manager contractually agreed to waive and/or reimburse fees or expenses in order to limit expenses, excluding interest expense, dividend expense, tax expense, acquired fund fees and expenses, and certain other fund expenses, which constitute extraordinary expenses not incurred in the ordinary course of the Fund’s business (“expense limitation”). The expense limitations as a percentage of average daily net assets are as follows:
| | | | |
| | |
| Share Class | | Expense Limitation | |
| |
Institutional | | | 0.13 | % |
Investor A | | | 0.38 | |
Class K | | | 0.08 | |
The Administrator and the Manager have agreed not to reduce or discontinue these contractual expense limitations through June 30, 2023, unless approved by the Board, including a majority of the trustees who are not “interested persons” of the Trust, as defined in the 1940 Act (“Independent Trustees”), or by a vote of a majority of the outstanding voting securities of the Fund. For the year ended December 31, 2021, the Administrator waived and/or reimbursed investment advisory fees of $1,285 which is included in fees waived and/or reimbursed by the Administrator in the Statement of Operations.
In addition, these amounts waived and/or reimbursed by the Manager are included in transfer agent fees waived and/or reimbursed – class specific in the Statement of Operations. For the year ended December 31, 2021, class specific expense waivers and/or reimbursements are as follows:
| | | | | | | | | | | | | | | | |
| |
| | | Institutional | | | Investor A | | | Class K | | | Total | |
| |
| | | | |
Transfer agent fees waived and/or reimbursed — class specific | | $ | 636 | | | $ | 144,561 | | | $ | 2,461 | | | $ | 147,658 | |
| |
Interfund Lending: In accordance with an exemptive order (the “Order”) from the U.S. Securities and Exchange Commission (“SEC”), the Fund may participate in a joint lending and borrowing facility for temporary purposes (the “Interfund Lending Program”), subject to compliance with the terms and conditions of the Order, and to the extent permitted by the Fund’s investment policies and restrictions. The Fund is currently permitted to borrow and lend under the Interfund Lending Program.
A lending BlackRock fund may lend in aggregate up to 15% of its net assets but may not lend more than 5% of its net assets to any one borrowing fund through the Interfund Lending Program. A borrowing BlackRock fund may not borrow through the Interfund Lending Program or from any other source more than 33 1/3% of its total assets (or any lower threshold provided for by the fund’s investment restrictions). If a borrowing BlackRock fund’s total outstanding borrowings exceed 10% of its total assets, each of its outstanding interfund loans will be subject to collateralization of at least 102% of the outstanding principal value of the loan. All interfund loans are for temporary or emergency purposes and the interest rate to be charged will be the average of the highest current overnight repurchase agreement rate available to a lending fund and the bank loan rate, as calculated according to a formula established by the Board.
During the year ended December 31, 2021, the Fund did not participate in the Interfund Lending Program.
Trustees and Officers: Certain trustees and/or officers of the Fund are directors and/or officers of BlackRock or its affiliates. The Fund reimburses the Administrator for a portion of the compensation paid to the Fund’s Chief Compliance Officer, which is included in Trustees and Officer in the Master Portfolio’s Statement of Operations.
It is the Fund’s policy to comply with the requirements of the Internal Revenue Code of 1986, as amended, applicable to regulated investment companies, and to distribute substantially all of its taxable income to its shareholders. Therefore, no U.S. federal income tax provision is required.
The Fund files U.S. federal and various state and local tax returns. No income tax returns are currently under examination. The statute of limitations on the Fund’s U.S. federal tax returns generally remains open for a period of three fiscal years after they are filed. The statutes of limitations on the Fund’s state and local tax returns may remain open for an additional year depending upon the jurisdiction.
| | |
FUND NOTES TO FINANCIAL STATEMENTS | | 15 |
Notes to Financial Statements (continued)
Management has analyzed tax laws and regulations and their application to the Fund as of December 31, 2021, inclusive of the open tax return years, and does not believe that there are any uncertain tax positions that require recognition of a tax liability in the Fund’s financial statements.
The tax character of distributions paid was as follows:
| | | | | | | | |
| |
| | |
| | | Year Ended | | | Year Ended | |
| Fund Name | | 12/31/21 | | | 12/31/20 | |
| |
| | |
iShares Russell 1000 Large-Cap Index Fund | | | | | | | | |
Ordinary income | | $ | 11,981,544 | | | $ | 9,049,894 | |
Long-term capital gains | | | 3,011,206 | | | | 301,325 | |
| | | | | | | | |
| | |
| | $ | 14,992,750 | | | $ | 9,351,219 | |
| | | | | | | | |
As of December 31, 2021, the tax components of accumulated earnings (loss) were as follows:
| | | | | | | | | | | | | | | | |
| |
| Fund Name | | Undistributed
Ordinary Income | | | Undistributed
Long-Term
Capital Gains | | | Net Unrealized
Gains (Losses)(a) | | | Total | |
| |
iShares Russell 1000 Large-Cap Index Fund | | $ | 816,860 | | | $ | 1,860,818 | | | $ | 403,764,214 | | | $ | 406,441,892 | |
| |
| | (a) | The difference between book-basis and tax-basis net unrealized gains was attributable primarily to the timing and recognition of partnership income. | |
| 6. | CAPITAL SHARE TRANSACTIONS |
Transactions in capital shares for each class were as follows:
| | | | | | | | | | | | | | | | | | | | |
| | | | |
| | | Year Ended
12/31/21 | | | | | | Year Ended
12/31/20 | |
| | | | | |
| Fund Name / Share Class | | Shares | | | Amounts | | | | | | Shares | | | Amounts | |
| | | | | |
iShares Russell 1000 Large-Cap Index Fund | | | | | | | | | | | | | | | | | | | | |
Institutional | | | | | | | | | | | | | | | | | | | | |
Shares sold | | | 3,958,236 | | | $ | 109,578,992 | | | | | | | | 3,869,357 | | | $ | 74,662,340 | |
Shares issued in reinvestment of distributions | | | 105,787 | | | | 3,081,916 | | | | | | | | 95,067 | | | | 1,927,824 | |
Shares redeemed | | | (3,524,510 | ) | | | (96,669,122 | ) | | | | | | | (2,869,461 | ) | | | (59,689,187 | ) |
| | | | | | | | | | | | | | | | | | | | |
| | | | | |
| | | 539,513 | | | $ | 15,991,786 | | | | | | | | 1,094,963 | | | $ | 16,900,977 | |
| | | | | | | | | | | | | | | | | | | | |
Investor A | | | | | | | | | | | | | | | | | | | | |
Shares sold | | | 839,505 | | | $ | 23,731,241 | | | | | | | | 1,480,384 | | | $ | 30,360,644 | |
Shares issued in reinvestment of distributions | | | 31,988 | | | | 930,091 | | | | | | | | 54,629 | | | | 1,104,369 | |
Shares redeemed | | | (2,279,451 | ) | | | (60,190,536 | ) | | | | | | | (2,230,668 | ) | | | (47,846,287 | ) |
| | | | | | | | | | | | | | | | | | | | |
| | | | | |
| | | (1,407,958 | ) | | $ | (35,529,204 | ) | | | | | | | (695,655 | ) | | $ | (16,381,274 | ) |
| | | | | | | | | | | | | | | | | | | | |
Class K | | | | | | | | | | | | | | | | | | | | |
Shares sold | | | 6,696,905 | | | $ | 186,038,207 | | | | | | | | 9,057,409 | | | $ | 182,227,116 | |
Shares issued in reinvestment of distributions | | | 347,267 | | | | 10,056,414 | | | | | | | | 276,250 | | | | 5,651,370 | |
Shares redeemed | | | (6,485,963 | ) | | | (176,837,537 | ) | | | | | | | (4,923,567 | ) | | | (101,815,147 | ) |
| | | | | | | | | | | | | | | | | | | | |
| | | | | |
| | | 558,209 | | | $ | 19,257,084 | | | | | | | | 4,410,092 | | | $ | 86,063,339 | |
| | | | | | | | | | | | | | | | | | | | |
| | | | | |
| | | (310,236 | ) | | $ | (280,334 | ) | | | | | | | 4,809,400 | | | $ | 86,583,042 | |
| | | | | | | | | | | | | | | | | | | | |
Management has evaluated the impact of all subsequent events on the Fund through the date the financial statements were issued and has determined that there were no subsequent events requiring adjustment or additional disclosure in the financial statements.
| | |
| 16 | | 2 0 2 1 BLACK ROCK ANNUAL REPORT TO SHAREHOLDERS |
Report of Independent Registered Public Accounting Firm
To the Board of Trustees of BlackRock Funds III and Shareholders of iShares Russell 1000 Large-Cap Index Fund
Opinion on the Financial Statements
We have audited the accompanying statement of assets and liabilities of iShares Russell 1000 Large-Cap Index Fund (one of the series constituting BlackRock Funds III, referred to hereafter as the “Fund”) as of December 31, 2021, the related statement of operations for the year ended December 31, 2021, the statements of changes in net assets for each of the two years in the period ended December 31, 2021, including the related notes, and the financial highlights for each of the five years in the period ended December 31, 2021 (collectively referred to as the “financial statements”). In our opinion, the financial statements present fairly, in all material respects, the financial position of the Fund as of December 31, 2021, the results of its operations for the year then ended, the changes in its net assets for each of the two years in the period ended December 31, 2021 and the financial highlights for each of the five years in the period ended December 31, 2021 in conformity with accounting principles generally accepted in the United States of America.
Basis for Opinion
These financial statements are the responsibility of the Fund’s management. Our responsibility is to express an opinion on the Fund’s financial statements based on our audits. We are a public accounting firm registered with the Public Company Accounting Oversight Board (United States) (PCAOB) and are required to be independent with respect to the Fund in accordance with the U.S. federal securities laws and the applicable rules and regulations of the Securities and Exchange Commission and the PCAOB.
We conducted our audits of these financial statements in accordance with the standards of the PCAOB. Those standards require that we plan and perform the audit to obtain reasonable assurance about whether the financial statements are free of material misstatement, whether due to error or fraud.
Our audits included performing procedures to assess the risks of material misstatement of the financial statements, whether due to error or fraud, and performing procedures that respond to those risks. Such procedures included examining, on a test basis, evidence regarding the amounts and disclosures in the financial statements. Our audits also included evaluating the accounting principles used and significant estimates made by management, as well as evaluating the overall presentation of the financial statements. Our procedures included confirmation of securities owned as of December 31, 2021 by correspondence with the administrator of the Master Portfolio. We believe that our audits provide a reasonable basis for our opinion.
/s/PricewaterhouseCoopers LLP
Philadelphia, Pennsylvania
February 24, 2022
We have served as the auditor of one or more BlackRock investment companies since 2000.
| | |
FUND REPORT OF INDEPENDENT REGISTERED PUBLIC ACCOUNTING FIRM | | 17 |
| | |
| Important Tax Information (unaudited) | | |
The following amount, or maximum amount allowable by law, is hereby designated as qualified dividend income for individuals for the fiscal year ended December 31, 2021:
| | |
| | |
| Fund Name | | Qualified Dividend
Income |
| |
iShares Russell 1000 Large-Cap Index Fund | | $ 8,432,174 |
The following amount, or maximum amount allowable by law, is hereby designated as qualified business income for individuals for the fiscal year ended December 31, 2021:
| | |
| | |
| Fund Name | | Qualified Business
Income |
| |
iShares Russell 1000 Large-Cap Index Fund | | $ 325,055 |
The Fund hereby designates the following amount, or maximum amount allowable by law, as capital gain dividends, subject to a long-term capital gains tax rate of not greater than 20%, for the fiscal year ended December 31, 2021:
| | |
| | |
| Fund Name | | 20% Rate Long-Term
Capital Gain Dividends |
| |
iShares Russell 1000 Large-Cap Index Fund | | $ 3,011,206 |
The following percentage, or maximum percentage allowable by law, of ordinary income distributions paid during the fiscal year ended December 31, 2021 qualified for the dividends-received deduction for corporate shareholders:
| | |
| | |
| Fund Name | | Dividends-Received
Deduction |
| |
iShares Russell 1000 Large-Cap Index Fund | | 68.05% |
The Fund hereby designates the following amount, or maximum amount allowable by law, as qualified short-term capital gains eligible for exemption from U.S. withholding tax for nonresident aliens and foreign corporations for the fiscal year ended December 31, 2021:
| | |
| | |
| Fund Name | | Qualified
Short-Term
Capital Gains |
| |
iShares Russell 1000 Large-Cap Index Fund | | $ 2,745,682 |
| | |
| 18 | | 2 0 2 1 BLACK ROCK ANNUAL REPORT TO SHAREHOLDERS |
| | |
| Master Portfolio Information as of December 31, 2021 | | Large Cap Index Master Portfolio |
TEN LARGEST HOLDINGS
| | | | |
| | |
| Security | | Percent of
Net Assets | |
| |
Apple, Inc. | | | 6 | % |
| |
Microsoft Corp. | | | 6 | |
| |
Amazon.com, Inc. | | | 3 | |
| |
Alphabet, Inc., Class A | | | 2 | |
| |
Tesla, Inc. | | | 2 | |
| |
Alphabet, Inc., Class C | | | 2 | |
| |
Meta Platforms, Inc., Class A | | | 2 | |
| |
NVIDIA Corp. | | | 1 | |
| |
Berkshire Hathaway, Inc., Class B | | | 1 | |
| |
UnitedHealth Group, Inc. | | | 1 | |
SECTOR ALLOCATION
| | | | |
| | |
| Sector(a) | | Percent of
Net Assets | |
| |
Information Technology | | | 29 | % |
| |
Health Care | | | 13 | |
| |
Consumer Discretionary | | | 12 | |
| |
Financials | | | 12 | |
| |
Communication Services | | | 10 | |
| |
Industrials | | | 8 | |
| |
Consumer Staples | | | 6 | |
| |
Real Estate | | | 3 | |
| |
Energy | | | 3 | |
| |
Utilities | | | 2 | |
| |
Materials | | | 2 | |
| |
Short-Term Securities | | | 7 | |
| |
Liabilities in Excess of Other Assets | | | (7 | ) |
| (a) | For Large Cap Index Master Portfolio (the “Master Portfolio”) compliance purposes, the Master Portfolio’s sector classifications refer to one or more of the sector subclassifications used by one or more widely recognized market indexes or ratings group indexes, and/or as defined by the investment adviser. These definitions may not apply for purposes of this report, which may combine such sector sub-classifications for reporting ease. |
| | |
MASTER PORTFOLIO INFORMATION | | 19 |
| | |
Schedule of Investments December 31, 2021 | | Large Cap Index Master Portfolio (Percentages shown are based on Net Assets) |
| | | | | | | | |
| Security | | Shares | | | Value | |
|
Common Stocks | |
| | |
| Aerospace & Defense — 1.3% | | | | | | |
Axon Enterprise, Inc.(a) | | | 34,636 | | | $ | 5,437,852 | |
Boeing Co.(a) | | | 286,333 | | | | 57,644,560 | |
BWX Technologies, Inc.(b) | | | 48,614 | | | | 2,327,638 | |
Curtiss-Wright Corp. | | | 19,499 | | | | 2,703,926 | |
General Dynamics Corp. | | | 132,800 | | | | 27,684,816 | |
HEICO Corp.(b) | | | 24,152 | | | | 3,483,201 | |
HEICO Corp., Class A | | | 41,513 | | | | 5,335,251 | |
Hexcel Corp.(a)(b) | | | 42,866 | | | | 2,220,459 | |
Howmet Aerospace, Inc. | | | 213,426 | | | | 6,793,350 | |
Huntington Ingalls Industries, Inc. | | | 20,726 | | | | 3,870,373 | |
L3Harris Technologies, Inc. | | | 104,838 | | | | 22,355,655 | |
Lockheed Martin Corp. | | | 133,526 | | | | 47,456,476 | |
Mercury Systems, Inc.(a) | | | 27,892 | | | | 1,535,734 | |
Northrop Grumman Corp.(b) | | | 79,692 | | | | 30,846,382 | |
Raytheon Technologies Corp. | | | 802,641 | | | | 69,075,284 | |
Spirit AeroSystems Holdings, Inc., Class A(b) | | | 56,095 | | | | 2,417,134 | |
Textron, Inc. | | | 119,057 | | | | 9,191,200 | |
TransDigm Group, Inc.(a) | | | 27,607 | | | | 17,565,782 | |
Virgin Galactic Holdings Inc.(a) | | | 96,064 | | | | 1,285,336 | |
| | | | | | | | |
| | |
| | | | | | | 319,230,409 | |
|
| Air Freight & Logistics — 0.6% | |
C.H. Robinson Worldwide, Inc.(b) | | | 69,844 | | | | 7,517,310 | |
Expeditors International of Washington, Inc. | | | 90,446 | | | | 12,145,993 | |
FedEx Corp.(b) | | | 131,651 | | | | 34,050,215 | |
GXO Logistics, Inc.(a) | | | 52,538 | | | | 4,772,027 | |
United Parcel Service, Inc., Class B | | | 387,939 | | | | 83,150,845 | |
| | | | | | | | |
| | |
| | | | | | | 141,636,390 | |
|
| Airlines(a) — 0.2% | |
Alaska Air Group, Inc. | | | 65,191 | | | | 3,396,451 | |
American Airlines Group, Inc.(b) | | | 334,267 | | | | 6,003,435 | |
Copa Holdings SA, Class A(b) | | | 16,783 | | | | 1,387,283 | |
Delta Air Lines, Inc. | | | 349,233 | | | | 13,648,026 | |
JetBlue Airways Corp. | | | 176,940 | | | | 2,519,626 | |
Southwest Airlines Co.(b) | | | 320,359 | | | | 13,724,179 | |
United Airlines Holdings, Inc. | | | 168,847 | | | | 7,392,122 | |
| | | | | | | | |
| | |
| | | | | | | 48,071,122 | |
|
| Auto Components — 0.2% | |
Aptiv PLC(a) | | | 144,796 | | | | 23,884,100 | |
BorgWarner, Inc.(b) | | | 130,378 | | | | 5,876,137 | |
Gentex Corp.(b) | | | 133,676 | | | | 4,658,609 | |
Lear Corp.(b) | | | 32,138 | | | | 5,879,647 | |
QuantumScape Corp.(a)(b) | | | 110,459 | | | | 2,451,085 | |
| | | | | | | | |
| | |
| | | | | | | 42,749,578 | |
|
| Automobiles — 2.3% | |
Ford Motor Co. | | | 2,085,598 | | | | 43,317,870 | |
General Motors Co.(a) | | | 741,102 | | | | 43,450,810 | |
Harley-Davidson, Inc.(b) | | | 82,663 | | | | 3,115,569 | |
Rivian Automotive, Inc., Class A(a) | | | 76,951 | | | | 7,979,049 | |
Tesla, Inc.(a) | | | 433,660 | | | | 458,283,215 | |
Thor Industries, Inc. | | | 28,362 | | | | 2,943,125 | |
| | | | | | | | |
| | |
| | | | | | | 559,089,638 | |
|
| Banks — 3.8% | |
Bank of America Corp. | | | 3,861,755 | | | | 171,809,480 | |
Bank of Hawaii Corp. | | | 21,836 | | | | 1,828,983 | |
Bank OZK(b) | | | 63,567 | | | | 2,957,773 | |
BOK Financial Corp.(b) | | | 15,956 | | | | 1,683,198 | |
Citigroup, Inc. | | | 1,063,732 | | | | 64,238,776 | |
Citizens Financial Group, Inc.(b) | | | 228,641 | | | | 10,803,287 | |
| | | | | | | | |
| Security | | Shares | | | Value | |
|
| Banks (continued) | |
Comerica, Inc. | | | 70,718 | | | $ | 6,152,466 | |
Commerce Bancshares, Inc.(b) | | | 59,525 | | | | 4,091,749 | |
Cullen/Frost Bankers, Inc. | | | 30,027 | | | | 3,785,504 | |
East West Bancorp, Inc. | | | 74,493 | | | | 5,861,109 | |
Fifth Third Bancorp(b) | | | 369,678 | | | | 16,099,477 | |
First Citizens BancShares, Inc., Class A(b) | | | 3,379 | | | | 2,804,029 | |
First Hawaiian, Inc.(b) | | | 68,030 | | | | 1,859,260 | |
First Horizon Corp. | | | 292,672 | | | | 4,779,334 | |
First Republic Bank(b) | | | 95,874 | | | | 19,798,940 | |
FNB Corp.(b) | | | 164,449 | | | | 1,994,766 | |
Huntington Bancshares, Inc.(b) | | | 769,193 | | | | 11,860,956 | |
JPMorgan Chase & Co. | | | 1,574,421 | | | | 249,309,565 | |
KeyCorp.(b) | | | 497,064 | | | | 11,497,090 | |
M&T Bank Corp.(b) | | | 68,699 | | | | 10,550,792 | |
PacWest Bancorp | | | 60,351 | | | | 2,726,055 | |
People’s United Financial, Inc. | | | 240,331 | | | | 4,282,698 | |
Pinnacle Financial Partners, Inc. | | | 41,046 | | | | 3,919,893 | |
PNC Financial Services Group, Inc. | | | 226,323 | | | | 45,382,288 | |
Popular, Inc. | | | 44,841 | | | | 3,678,756 | |
Prosperity Bancshares, Inc. | | | 49,377 | | | | 3,569,957 | |
Regions Financial Corp. | | | 525,132 | | | | 11,447,878 | |
Signature Bank(b) | | | 31,853 | | | | 10,303,490 | |
Sterling Bancorp | | | 103,668 | | | | 2,673,598 | |
SVB Financial Group(a) | | | 30,375 | | | | 20,601,540 | |
Synovus Financial Corp. | | | 73,621 | | | | 3,524,237 | |
Truist Financial Corp.(b) | | | 715,787 | | | | 41,909,329 | |
U.S. Bancorp | | | 723,581 | | | | 40,643,545 | |
Umpqua Holdings Corp. | | | 112,107 | | | | 2,156,939 | |
Webster Financial Corp.(b) | | | 44,724 | | | | 2,497,388 | |
Wells Fargo & Co. | | | 2,144,731 | | | | 102,904,193 | |
Western Alliance Bancorp | | | 54,585 | | | | 5,876,075 | |
Wintrust Financial Corp. | | | 30,232 | | | | 2,745,670 | |
Zions Bancorp NA(b) | | | 85,292 | | | | 5,387,043 | |
| | | | | | | | |
| | |
| | | | | | | 919,997,106 | |
|
| Beverages — 1.3% | |
Boston Beer Co., Inc., Class A(a) | | | 5,171 | | | | 2,611,872 | |
Brown-Forman Corp., Class A | | | 22,750 | | | | 1,542,223 | |
Brown-Forman Corp., Class B | | | 98,806 | | | | 7,199,005 | |
Coca-Cola Co. | | | 2,081,829 | | | | 123,265,095 | |
Constellation Brands, Inc., Class A | | | 83,632 | | | | 20,989,123 | |
Keurig Dr Pepper, Inc. | | | 374,773 | | | | 13,814,133 | |
Molson Coors Beverage Co., Class B(b) | | | 99,776 | | | | 4,624,618 | |
Monster Beverage Corp.(a) | | | 199,527 | | | | 19,162,573 | |
PepsiCo, Inc. | | | 740,830 | | | | 128,689,579 | |
| | | | | | | | |
| | |
| | | | | | | 321,898,221 | |
|
| Biotechnology — 1.9% | |
AbbVie, Inc. | | | 947,320 | | | | 128,267,128 | |
Alnylam Pharmaceuticals, Inc.(a) | | | 62,834 | | | | 10,655,390 | |
Amgen, Inc. | | | 304,111 | | | | 68,415,852 | |
Biogen, Inc.(a) | | | 78,369 | | | | 18,802,290 | |
BioMarin Pharmaceutical, Inc.(a) | | | 98,051 | | | | 8,662,806 | |
CureVac NV(a)(b) | | | 28,509 | | | | 978,144 | |
Exact Sciences Corp.(a) | | | 91,640 | | | | 7,132,341 | |
Exelixis, Inc.(a) | | | 177,209 | | | | 3,239,380 | |
Gilead Sciences, Inc.(b) | | | 670,240 | | | | 48,666,126 | |
Horizon Therapeutics PLC(a) | | | 117,175 | | | | 12,626,778 | |
Incyte Corp.(a) | | | 100,510 | | | | 7,377,434 | |
Ionis Pharmaceuticals, Inc.(a)(b) | | | 74,032 | | | | 2,252,794 | |
Iovance Biotherapeutics, Inc.(a)(b) | | | 81,538 | | | | 1,556,560 | |
Mirati Therapeutics, Inc.(a)(b) | | | 21,074 | | | | 3,091,345 | |
Moderna, Inc.(a) | | | 182,378 | | | | 46,320,364 | |
| | |
| 20 | | 2 0 2 1 BLACK ROCK ANNUAL REPORT TO SHAREHOLDERS |
| | |
Schedule of Investments (continued) December 31, 2021 | | Large Cap Index Master Portfolio (Percentages shown are based on Net Assets) |
| | | | | | | | |
| Security | | Shares | | | Value | |
|
| Biotechnology (continued) | |
Natera, Inc.(a) | | | 45,793 | | | $ | 4,276,608 | |
Neurocrine Biosciences, Inc.(a) | | | 48,786 | | | | 4,155,104 | |
Novavax, Inc.(a)(b) | | | 39,637 | | | | 5,670,866 | |
Regeneron Pharmaceuticals, Inc.(a) | | | 53,849 | | | | 34,006,720 | |
Sage Therapeutics, Inc.(a) | | | 27,664 | | | | 1,176,827 | |
Sarepta Therapeutics, Inc.(a) | | | 46,299 | | | | 4,169,225 | |
Seagen, Inc.(a) | | | 71,654 | | | | 11,077,708 | |
Ultragenyx Pharmaceutical, Inc.(a) | | | 34,585 | | | | 2,908,253 | |
United Therapeutics Corp.(a) | | | 23,857 | | | | 5,155,021 | |
Vertex Pharmaceuticals, Inc.(a) | | | 136,410 | | | | 29,955,636 | |
| | | | | | | | |
| | |
| | | | | | | 470,596,700 | |
|
| Building Products — 0.6% | |
A O Smith Corp.(b) | | | 71,073 | | | | 6,101,617 | |
Advanced Drainage Systems, Inc.(b) | | | 34,230 | | | | 4,659,730 | |
Allegion plc(b) | | | 48,010 | | | | 6,358,444 | |
Armstrong World Industries, Inc.(b) | | | 24,198 | | | | 2,809,872 | |
AZEK Co., Inc.(a) | | | 62,229 | | | | 2,877,469 | |
Builders FirstSource, Inc.(a)(b) | | | 101,451 | | | | 8,695,365 | |
Carlisle Cos., Inc. | | | 28,395 | | | | 7,045,367 | |
Carrier Global Corp.(b) | | | 468,415 | | | | 25,406,830 | |
Fortune Brands Home & Security, Inc. | | | 72,566 | | | | 7,757,306 | |
Johnson Controls International PLC(b) | | | 384,887 | | | | 31,295,162 | |
Lennox International, Inc.(b) | | | 18,490 | | | | 5,997,416 | |
Masco Corp. | | | 133,924 | | | | 9,404,143 | |
Owens Corning(b) | | | 54,064 | | | | 4,892,792 | |
Trane Technologies PLC(b) | | | 128,309 | | | | 25,922,267 | |
Trex Co., Inc.(a) | | | 63,150 | | | | 8,527,145 | |
| | | | | | | | |
| | |
| | | | | | | 157,750,925 | |
|
| Capital Markets — 3.2% | |
Affiliated Managers Group, Inc. | | | 23,012 | | | | 3,785,704 | |
Ameriprise Financial, Inc. | | | 59,326 | | | | 17,896,281 | |
Apollo Global Management, Inc.(b) | | | 127,439 | | | | 9,230,407 | |
Ares Management Corp., Class A | | | 73,796 | | | | 5,997,401 | |
Bank of New York Mellon Corp.(b) | | | 408,424 | | | | 23,721,266 | |
BlackRock, Inc.(c) | | | 76,537 | | | | 70,074,216 | |
Blackstone, Inc. | | | 367,040 | | | | 47,491,306 | |
Carlyle Group, Inc. | | | 87,105 | | | | 4,782,065 | |
Cboe Global Markets, Inc. | | | 57,761 | | | | 7,532,034 | |
Charles Schwab Corp. | | | 805,162 | | | | 67,714,124 | |
CME Group, Inc. | | | 193,242 | | | | 44,148,067 | |
Evercore, Inc., Class A(b) | | | 19,369 | | | | 2,631,279 | |
FactSet Research Systems, Inc.(b) | | | 19,929 | | | | 9,685,693 | |
Franklin Resources, Inc.(b) | | | 161,878 | | | | 5,421,294 | |
Goldman Sachs Group, Inc. | | | 175,696 | | | | 67,212,505 | |
Interactive Brokers Group, Inc., Class A | | | 41,604 | | | | 3,304,190 | |
Intercontinental Exchange, Inc. | | | 299,727 | | | | 40,993,662 | |
Invesco Ltd. | | | 179,011 | | | | 4,120,833 | |
Janus Henderson Group PLC | | | 93,426 | | | | 3,918,286 | |
Jefferies Financial Group, Inc.(b) | | | 115,156 | | | | 4,468,053 | |
KKR & Co., Inc. | | | 296,447 | | | | 22,085,301 | |
Lazard Ltd., Class A | | | 51,262 | | | | 2,236,561 | |
LPL Financial Holdings, Inc. | | | 43,724 | | | | 6,999,775 | |
MarketAxess Holdings, Inc. | | | 19,979 | | | | 8,216,763 | |
Moody’s Corp.(b) | | | 87,461 | | | | 34,160,517 | |
Morgan Stanley | | | 717,925 | | | | 70,471,518 | |
Morningstar, Inc. | | | 12,947 | | | | 4,427,745 | |
MSCI, Inc. | | | 42,951 | | | | 26,315,648 | |
Nasdaq, Inc.(b) | | | 62,474 | | | | 13,120,165 | |
Northern Trust Corp. | | | 110,217 | | | | 13,183,055 | |
Raymond James Financial, Inc. | | | 98,977 | | | | 9,937,291 | |
S&P Global, Inc.(b) | | | 128,759 | | | | 60,765,235 | |
| | | | | | | | |
| Security | | Shares | | | Value | |
|
| Capital Markets (continued) | |
SEI Investments Co. | | | 60,461 | | | $ | 3,684,493 | |
State Street Corp.(b) | | | 196,262 | | | | 18,252,366 | |
Stifel Financial Corp.(b) | | | 54,749 | | | | 3,855,425 | |
T. Rowe Price Group, Inc.(b) | | | 120,934 | | | | 23,780,462 | |
Tradeweb Markets, Inc., Class A(b) | | | 56,323 | | | | 5,640,185 | |
Virtu Financial, Inc., Class A | | | 39,330 | | | | 1,133,884 | |
| | | | | | | | |
| | |
| | | | | | | 772,395,055 | |
|
| Chemicals — 1.3% | |
Air Products & Chemicals, Inc. | | | 118,773 | | | | 36,137,873 | |
Albemarle Corp.(b) | | | 61,867 | | | | 14,462,649 | |
Ashland Global Holdings, Inc. | | | 29,334 | | | | 3,158,098 | |
Axalta Coating Systems Ltd.(a) | | | 115,763 | | | | 3,834,071 | |
Celanese Corp. | | | 59,084 | | | | 9,929,657 | |
CF Industries Holdings, Inc.(b) | | | 114,453 | | | | 8,100,983 | |
Chemours Co. | | | 88,178 | | | | 2,959,254 | |
Corteva, Inc. | | | 393,260 | | | | 18,593,333 | |
Diversey Holdings Ltd.(a) | | | 27,521 | | | | 366,304 | |
Dow, Inc. | | | 402,869 | | | | 22,850,730 | |
DuPont de Nemours, Inc. | | | 279,936 | | | | 22,613,230 | |
Eastman Chemical Co. | | | 72,756 | | | | 8,796,928 | |
Ecolab, Inc. | | | 133,865 | | | | 31,403,390 | |
Element Solutions, Inc. | | | 130,715 | | | | 3,173,760 | |
FMC Corp. | | | 69,470 | | | | 7,634,058 | |
Huntsman Corp. | | | 117,672 | | | | 4,104,399 | |
International Flavors & Fragrances, Inc.(b) | | | 136,106 | | | | 20,504,369 | |
LyondellBasell Industries NV, Class A | | | 142,759 | | | | 13,166,663 | |
Mosaic Co. | | | 202,819 | | | | 7,968,758 | |
NewMarket Corp. | | | 3,312 | | | | 1,135,089 | |
Olin Corp. | | | 76,084 | | | | 4,376,352 | |
PPG Industries, Inc.(b) | | | 126,600 | | | | 21,830,904 | |
RPM International, Inc.(b) | | | 68,115 | | | | 6,879,615 | |
Scotts Miracle-Gro Co.(b) | | | 21,069 | | | | 3,392,109 | |
Sherwin-Williams Co.(b) | | | 128,890 | | | | 45,389,902 | |
Valvoline, Inc. | | | 97,038 | | | | 3,618,547 | |
Westlake Chemical Corp. | | | 18,106 | | | | 1,758,636 | |
| | | | | | | | |
| | |
| | | | | | | 328,139,661 | |
|
| Commercial Services & Supplies — 0.4% | |
ADT, Inc. | | | 65,817 | | | | 553,520 | |
Cintas Corp.(b) | | | 46,268 | | | | 20,504,590 | |
Clean Harbors, Inc.(a) | | | 27,862 | | | | 2,779,792 | |
Copart, Inc.(a) | | | 110,963 | | | | 16,824,210 | |
Driven Brands Holdings, Inc.(a) | | | 22,717 | | | | 763,745 | |
IAA, Inc.(a) | | | 70,453 | | | | 3,566,331 | |
MSA Safety, Inc.(b) | | | 20,127 | | | | 3,038,372 | |
Republic Services, Inc. | | | 114,542 | | | | 15,972,882 | |
Rollins, Inc. | | | 127,532 | | | | 4,362,870 | |
Stericycle, Inc.(a) | | | 51,667 | | | | 3,081,420 | |
Waste Management, Inc. | | | 226,845 | | | | 37,860,430 | |
| | | | | | | | |
| | |
| | | | | | | 109,308,162 | |
|
| Communications Equipment — 0.9% | |
Arista Networks, Inc.(a) | | | 130,636 | | | | 18,778,925 | |
Ciena Corp.(a) | | | 86,107 | | | | 6,627,656 | |
Cisco Systems, Inc.(b) | | | 2,265,957 | | | | 143,593,695 | |
CommScope Holding Co., Inc.(a) | | | 96,259 | | | | 1,062,699 | |
F5 Networks, Inc.(a) | | | 31,955 | | | | 7,819,708 | |
Juniper Networks, Inc. | | | 179,952 | | | | 6,426,086 | |
Lumentum Holdings, Inc.(a) | | | 37,811 | | | | 3,999,269 | |
Motorola Solutions, Inc. | | | 89,305 | | | | 24,264,169 | |
| | |
MASTER PORTFOLIO SCHEDULE OF INVESTMENTS | | 21 |
| | |
Schedule of Investments (continued) December 31, 2021 | | Large Cap Index Master Portfolio (Percentages shown are based on Net Assets) |
| | | | | | | | |
| Security | | Shares | | | Value | |
|
| Communications Equipment (continued) | |
Ubiquiti, Inc. | | | 4,358 | | | $ | 1,336,599 | |
ViaSat, Inc.(a)(b) | | | 37,134 | | | | 1,653,948 | |
| | | | | | | | |
| | |
| | | | | | | 215,562,754 | |
|
| Construction & Engineering — 0.1% | |
AECOM(a) | | | 75,665 | | | | 5,852,688 | |
MasTec, Inc.(a) | | | 30,124 | | | | 2,779,843 | |
Quanta Services, Inc.(b) | | | 73,811 | | | | 8,463,169 | |
Valmont Industries, Inc.(b) | | | 10,544 | | | | 2,641,272 | |
| | | | | | | | |
| | |
| | | | | | | 19,736,972 | |
|
| Construction Materials — 0.1% | |
Eagle Materials, Inc.(b) | | | 22,928 | | | | 3,816,595 | |
Martin Marietta Materials, Inc.(b) | | | 33,294 | | | | 14,666,673 | |
Vulcan Materials Co. | | | 70,541 | | | | 14,642,901 | |
| | | | | | | | |
| | |
| | | | | | | 33,126,169 | |
|
| Consumer Finance — 0.6% | |
Ally Financial, Inc. | | | 185,429 | | | | 8,828,275 | |
American Express Co. | | | 336,499 | | | | 55,051,236 | |
Capital One Financial Corp. | | | 224,887 | | | | 32,628,855 | |
Credit Acceptance Corp.(a)(b) | | | 4,685 | | | | 3,221,781 | |
Discover Financial Services | | | 156,896 | | | | 18,130,902 | |
OneMain Holdings, Inc. | | | 57,378 | | | | 2,871,195 | |
Santander Consumer USA Holdings, Inc.(b) | | | 29,725 | | | | 1,249,044 | |
SLM Corp. | | | 170,533 | | | | 3,354,384 | |
Synchrony Financial | | | 291,871 | | | | 13,539,896 | |
Upstart Holdings Inc(a)(b) | | | 24,213 | | | | 3,663,427 | |
| | | | | | | | |
| | |
| | | | | | | 142,538,995 | |
|
| Containers & Packaging — 0.4% | |
Amcor PLC | | | 845,608 | | | | 10,155,752 | |
AptarGroup, Inc.(b) | | | 34,443 | | | | 4,218,579 | |
Ardagh Group SA(a) | | | 6,425 | | | | 145,044 | |
Avery Dennison Corp.(b) | | | 44,650 | | | | 9,669,851 | |
Ball Corp.(b) | | | 170,987 | | | | 16,460,918 | |
Berry Global Group, Inc.(a) | | | 70,752 | | | | 5,220,083 | |
Crown Holdings, Inc. | | | 68,268 | | | | 7,551,806 | |
Graphic Packaging Holding Co. | | | 155,466 | | | | 3,031,587 | |
International Paper Co. | | | 210,993 | | | | 9,912,451 | |
Packaging Corp. of America(b) | | | 48,960 | | | | 6,665,904 | |
Sealed Air Corp. | | | 82,180 | | | | 5,544,685 | |
Silgan Holdings, Inc.(b) | | | 48,245 | | | | 2,066,816 | |
Sonoco Products Co. | | | 53,723 | | | | 3,110,024 | |
Westrock Co. | | | 146,328 | | | | 6,491,110 | |
| | | | | | | | |
| | |
| | | | | | | 90,244,610 | |
|
| Distributors — 0.1% | |
Genuine Parts Co. | | | 74,424 | | | | 10,434,245 | |
LKQ Corp.(b) | | | 141,999 | | | | 8,524,200 | |
Pool Corp. | | | 20,903 | | | | 11,831,098 | |
| | | | | | | | |
| | |
| | | | | | | 30,789,543 | |
|
| Diversified Consumer Services — 0.1% | |
Bright Horizons Family Solutions, Inc.(a) | | | 34,384 | | | | 4,328,258 | |
Chegg, Inc.(a)(b) | | | 75,210 | | | | 2,308,947 | |
frontdoor, Inc.(a)(b) | | | 51,747 | | | | 1,896,528 | |
Grand Canyon Education, Inc.(a) | | | 19,988 | | | | 1,713,172 | |
H&R Block, Inc. | | | 90,572 | | | | 2,133,876 | |
Mister Car Wash, Inc.(a) | | | 24,625 | | | | 448,421 | |
Service Corp. International(b) | | | 86,566 | | | | 6,145,320 | |
Terminix Global Holdings, Inc.(a) | | | 61,335 | | | | 2,774,182 | |
| | | | | | | | |
| | |
| | | | | | | 21,748,704 | |
| | | | | | | | |
| Security | | Shares | | | Value | |
|
| Diversified Financial Services — 1.2% | |
Berkshire Hathaway, Inc., Class B(a) | | | 983,520 | | | $ | 294,072,480 | |
Equitable Holdings, Inc. | | | 202,853 | | | | 6,651,550 | |
Voya Financial, Inc. | | | 59,002 | | | | 3,912,422 | |
| | | | | | | | |
| | |
| | | | | | | 304,636,452 | |
|
| Diversified Telecommunication Services — 0.9% | |
AT&T, Inc. | | | 3,830,117 | | | | 94,220,878 | |
Lumen Technologies, Inc.(b) | | | 546,186 | | | | 6,854,635 | |
Verizon Communications, Inc. | | | 2,221,969 | | | | 115,453,509 | |
| | | | | | | | |
| | |
| | | | | | | 216,529,022 | |
|
| Electric Utilities — 1.5% | |
Alliant Energy Corp.(b) | | | 133,241 | | | | 8,190,324 | |
American Electric Power Co., Inc. | | | 266,777 | | | | 23,735,150 | |
Avangrid, Inc.(b) | | | 29,257 | | | | 1,459,339 | |
Duke Energy Corp. | | | 414,792 | | | | 43,511,681 | |
Edison International(b) | | | 198,194 | | | | 13,526,741 | |
Entergy Corp. | | | 107,454 | | | | 12,104,693 | |
Evergy, Inc. | | | 122,408 | | | | 8,398,413 | |
Eversource Energy(b) | | | 184,295 | | | | 16,767,159 | |
Exelon Corp. | | | 523,063 | | | | 30,212,119 | |
FirstEnergy Corp.(b) | | | 292,060 | | | | 12,146,775 | |
Hawaiian Electric Industries, Inc. | | | 52,075 | | | | 2,161,113 | |
IDACORP, Inc. | | | 26,848 | | | | 3,042,147 | |
NextEra Energy, Inc.(b) | | | 1,051,465 | | | | 98,164,772 | |
NRG Energy, Inc.(b) | | | 135,175 | | | | 5,823,339 | |
OGE Energy Corp.(b) | | | 108,037 | | | | 4,146,460 | |
PG&E Corp.(a) | | | 810,753 | | | | 9,842,541 | |
Pinnacle West Capital Corp. | | | 58,710 | | | | 4,144,339 | |
PPL Corp.(b) | | | 397,449 | | | | 11,947,317 | |
Southern Co. | | | 570,216 | | | | 39,105,413 | |
Xcel Energy, Inc. | | | 288,223 | | | | 19,512,697 | |
| | | | | | | | |
| | |
| | | | | | | 367,942,532 | |
|
| Electrical Equipment — 0.7% | |
Acuity Brands, Inc.(b) | | | 19,019 | | | | 4,026,703 | |
AMETEK, Inc. | | | 124,668 | | | | 18,331,183 | |
ChargePoint Holdings, Inc.(a)(b) | | | 120,742 | | | | 2,300,135 | |
Eaton Corp. PLC | | | 214,051 | | | | 36,992,294 | |
Emerson Electric Co. | | | 319,069 | | | | 29,663,845 | |
Generac Holdings, Inc.(a) | | | 33,419 | | | | 11,760,814 | |
Hubbell, Inc.(b) | | | 28,978 | | | | 6,035,248 | |
nVent Electric PLC(b) | | | 83,814 | | | | 3,184,932 | |
Plug Power, Inc.(a)(b) | | | 273,403 | | | | 7,718,167 | |
Regal Rexnord Corp. | | | 35,330 | | | | 6,012,459 | |
Rockwell Automation, Inc.(b) | | | 62,781 | | | | 21,901,152 | |
Sensata Technologies Holding PLC(a) | | | 86,180 | | | | 5,316,444 | |
Shoals Technologies Group, Inc., Class A(a)(b) | | | 63,807 | | | | 1,550,510 | |
Sunrun, Inc.(a)(b) | | | 106,993 | | | | 3,669,860 | |
Vertiv Holdings Co. | | | 170,562 | | | | 4,258,933 | |
| | | | | | | | |
| | |
| | | | | | | 162,722,679 | |
|
| Electronic Equipment, Instruments & Components — 0.6% | |
Amphenol Corp., Class A(b) | | | 313,448 | | | | 27,414,162 | |
Arrow Electronics, Inc.(a) | | | 36,242 | | | | 4,866,213 | |
Avnet, Inc. | | | 51,693 | | | | 2,131,302 | |
CDW Corp. | | | 73,793 | | | | 15,111,331 | |
Cognex Corp. | | | 90,425 | | | | 7,031,448 | |
Coherent, Inc.(a) | | | 13,003 | | | | 3,465,820 | |
Corning, Inc. | | | 413,298 | | | | 15,387,084 | |
IPG Photonics Corp.(a) | | | 19,152 | | | | 3,296,825 | |
Jabil, Inc. | | | 73,341 | | | | 5,159,539 | |
Keysight Technologies, Inc.(a) | | | 98,818 | | | | 20,406,905 | |
Littelfuse, Inc.(b) | | | 13,666 | | | | 4,300,417 | |
| | |
| 22 | | 2 0 2 1 BLACK ROCK ANNUAL REPORT TO SHAREHOLDERS |
| | |
Schedule of Investments (continued) December 31, 2021 | | Large Cap Index Master Portfolio (Percentages shown are based on Net Assets) |
| | | | | | | | |
| Security | | Shares | | | Value | |
|
| Electronic Equipment, Instruments & Components (continued) | |
National Instruments Corp. | | | 67,460 | | | $ | 2,945,978 | |
SYNNEX Corp. | | | 20,971 | | | | 2,398,244 | |
Teledyne Technologies, Inc.(a) | | | 24,195 | | | | 10,570,554 | |
Trimble, Inc.(a) | | | 133,626 | | | | 11,650,851 | |
Vontier Corp. | | | 83,910 | | | | 2,578,554 | |
Zebra Technologies Corp., Class A(a) | | | 28,293 | | | | 16,839,994 | |
| | | | | | | | |
| | |
| | | | | | | 155,555,221 | |
|
| Energy Equipment & Services — 0.2% | |
Baker Hughes Co.(b) | | | 395,695 | | | | 9,520,422 | |
Halliburton Co.(b) | | | 476,161 | | | | 10,889,802 | |
NOV, Inc.(b) | | | 197,756 | | | | 2,679,594 | |
Schlumberger NV | | | 753,953 | | | | 22,580,892 | |
| | | | | | | | |
| | |
| | | | | | | 45,670,710 | |
|
| Entertainment — 1.7% | |
Activision Blizzard, Inc.(b) | | | 412,818 | | | | 27,464,782 | |
Electronic Arts, Inc.(b) | | | 153,209 | | | | 20,208,267 | |
Liberty Media Corp.-Liberty Formula One, Class A(a) | | | 14,208 | | | | 843,103 | |
Liberty Media Corp.-Liberty Formula One, Class C(a) | | | 104,313 | | | | 6,596,754 | |
Live Nation Entertainment, Inc.(a) | | | 72,061 | | | | 8,624,981 | |
Madison Square Garden Sports Corp.(a) | | | 9,792 | | | | 1,701,164 | |
Netflix, Inc.(a) | | | 231,580 | | | | 139,513,055 | |
Playtika Holding Corp.(a) | | | 56,255 | | | | 972,649 | |
Roku, Inc.(a)(b) | | | 63,421 | | | | 14,472,672 | |
Skillz, Inc.(a)(b) | | | 158,038 | | | | 1,175,803 | |
Spotify Technology SA(a) | | | 73,607 | | | | 17,226,246 | |
Take-Two Interactive Software, Inc.(a) | | | 61,881 | | | | 10,997,491 | |
Walt Disney Co.(a) | | | 973,568 | | | | 150,795,948 | |
World Wrestling Entertainment, Inc., Class A(b) | | | 24,370 | | | | 1,202,416 | |
Zynga, Inc., Class A(a) | | | 536,080 | | | | 3,430,912 | |
| | | | | | | | |
| | |
| | | | | | | 405,226,243 | |
|
| Equity Real Estate Investment Trusts (REITs) — 3.1% | |
Alexandria Real Estate Equities, Inc.(b) | | | 82,951 | | | | 18,494,755 | |
American Campus Communities, Inc.(b) | | | 74,192 | | | | 4,250,460 | |
American Homes 4 Rent, Class A(b) | | | 152,895 | | | | 6,667,751 | |
American Tower Corp. | | | 241,666 | | | | 70,687,305 | |
Americold Realty Trust(b) | | | 141,502 | | | | 4,639,851 | |
Apartment Income REIT Corp. | | | 87,495 | | | | 4,783,352 | |
AvalonBay Communities, Inc. | | | 75,520 | | | | 19,075,597 | |
Boston Properties, Inc.(b) | | | 83,457 | | | | 9,612,577 | |
Brixmor Property Group, Inc.(b) | | | 157,959 | | | | 4,013,738 | |
Camden Property Trust | | | 52,487 | | | | 9,378,377 | |
Cousins Properties, Inc.(b) | | | 82,141 | | | | 3,308,639 | |
Crown Castle International Corp.(b) | | | 229,916 | | | | 47,992,666 | |
CubeSmart | | | 113,530 | | | | 6,460,992 | |
CyrusOne, Inc. | | | 66,585 | | | | 5,974,006 | |
Digital Realty Trust, Inc.(b) | | | 149,957 | | | | 26,522,895 | |
Douglas Emmett, Inc. | | | 87,900 | | | | 2,944,650 | |
Duke Realty Corp. | | | 204,132 | | | | 13,399,225 | |
EPR Properties(b) | | | 40,258 | | | | 1,911,852 | |
Equinix, Inc.(b) | | | 48,036 | | | | 40,630,770 | |
Equity LifeStyle Properties, Inc.(b) | | | 92,126 | | | | 8,075,765 | |
Equity Residential | | | 195,986 | | | | 17,736,733 | |
Essex Property Trust, Inc. | | | 34,194 | | | | 12,044,153 | |
Extra Space Storage, Inc. | | | 70,977 | | | | 16,092,615 | |
Federal Realty Investment Trust(b) | | | 40,201 | | | | 5,480,200 | |
First Industrial Realty Trust, Inc. | | | 66,305 | | | | 4,389,391 | |
Gaming and Leisure Properties, Inc. | | | 120,357 | | | | 5,856,572 | |
Healthcare Trust of America, Inc., Class A | | | 116,856 | | | | 3,901,822 | |
| | | | | | | | |
| Security | | Shares | | | Value | |
|
| Equity Real Estate Investment Trusts (REITs) (continued) | |
Healthpeak Properties, Inc. | | | 292,133 | | | $ | 10,543,080 | |
Highwoods Properties, Inc.(b) | | | 56,254 | | | | 2,508,366 | |
Host Hotels & Resorts, Inc.(a)(b) | | | 372,489 | | | | 6,477,584 | |
Hudson Pacific Properties, Inc. | | | 82,180 | | | | 2,030,668 | |
Invitation Homes, Inc.(b) | | | 310,355 | | | | 14,071,496 | |
Iron Mountain, Inc.(b) | | | 152,817 | | | | 7,996,914 | |
JBG SMITH Properties(b) | | | 63,076 | | | | 1,810,912 | |
Kilroy Realty Corp.(b) | | | 64,778 | | | | 4,305,146 | |
Kimco Realty Corp.(b) | | | 306,638 | | | | 7,558,627 | |
Lamar Advertising Co., Class A | | | 45,610 | | | | 5,532,493 | |
Life Storage, Inc.(b) | | | 41,256 | | | | 6,319,594 | |
Medical Properties Trust, Inc.(b) | | | 319,967 | | | | 7,560,820 | |
Mid-America Apartment Communities, Inc.(b) | | | 62,548 | | | | 14,351,013 | |
National Retail Properties, Inc.(b) | | | 91,392 | | | | 4,393,213 | |
Omega Healthcare Investors, Inc.(b) | | | 131,791 | | | | 3,899,696 | |
Orion Office REIT, Inc.(a) | | | 29,717 | | | | 554,816 | |
Park Hotels & Resorts, Inc.(a) | | | 126,278 | | | | 2,384,129 | |
Prologis, Inc.(b) | | | 394,488 | | | | 66,416,000 | |
Public Storage | | | 81,221 | | | | 30,422,138 | |
Rayonier, Inc.(b) | | | 75,646 | | | | 3,053,073 | |
Realty Income Corp.(b) | | | 296,700 | | | | 21,240,753 | |
Regency Centers Corp.(b) | | | 90,465 | | | | 6,816,538 | |
Rexford Industrial Realty, Inc.(b) | | | 76,092 | | | | 6,171,822 | |
SBA Communications Corp. | | | 58,315 | | | | 22,685,701 | |
Simon Property Group, Inc. | | | 175,527 | | | | 28,043,949 | |
SL Green Realty Corp.(b) | | | 37,210 | | | | 2,667,957 | |
Spirit Realty Capital, Inc.(b) | | | 67,076 | | | | 3,232,392 | |
STORE Capital Corp.(b) | | | 136,886 | | | | 4,708,878 | |
Sun Communities, Inc.(b) | | | 61,518 | | | | 12,916,934 | |
UDR, Inc.(b) | | | 157,660 | | | | 9,458,023 | |
Ventas, Inc. | | | 212,812 | | | | 10,878,949 | |
VICI Properties, Inc.(b) | | | 315,289 | | | | 9,493,352 | |
Vornado Realty Trust(b) | | | 90,241 | | | | 3,777,488 | |
Welltower, Inc.(b) | | | 227,142 | | | | 19,481,969 | |
Weyerhaeuser Co. | | | 404,913 | | | | 16,674,317 | |
WP Carey, Inc.(b) | | | 99,359 | | | | 8,152,406 | |
| | | | | | | | |
| | |
| | | | | | | 762,917,915 | |
|
| Food & Staples Retailing — 1.3% | |
Albertsons Cos., Inc., Class A | | | 88,796 | | | | 2,680,751 | |
Casey’s General Stores, Inc.(b) | | | 19,362 | | | | 3,821,091 | |
Costco Wholesale Corp.(b) | | | 237,048 | | | | 134,572,150 | |
Grocery Outlet Holding Corp.(a)(b) | | | 49,659 | | | | 1,404,357 | |
Kroger Co.(b) | | | 395,990 | | | | 17,922,507 | |
Sysco Corp. | | | 275,976 | | | | 21,677,915 | |
US Foods Holding Corp.(a) | | | 125,465 | | | | 4,369,946 | |
Walgreens Boots Alliance, Inc. | | | 388,803 | | | | 20,279,964 | |
Walmart, Inc. | | | 769,179 | | | | 111,292,509 | |
| | | | | | | | |
| | |
| | | | | | | 318,021,190 | |
|
| Food Products — 0.9% | |
Archer-Daniels-Midland Co. | | | 296,654 | | | | 20,050,844 | |
Beyond Meat, Inc.(a)(b) | | | 29,925 | | | | 1,949,913 | |
Bunge Ltd.(b) | | | 72,946 | | | | 6,810,239 | |
Campbell Soup Co.(b) | | | 103,873 | | | | 4,514,321 | |
Conagra Brands, Inc. | | | 245,145 | | | | 8,371,702 | |
Darling Ingredients, Inc.(a)(b) | | | 86,723 | | | | 6,009,037 | |
Flowers Foods, Inc.(b) | | | 102,672 | | | | 2,820,400 | |
Freshpet, Inc.(a) | | | 21,901 | | | | 2,086,508 | |
General Mills, Inc. | | | 325,533 | | | | 21,934,413 | |
Hain Celestial Group, Inc.(a) | | | 48,979 | | | | 2,086,995 | |
Hershey Co. | | | 78,282 | | | | 15,145,219 | |
Hormel Foods Corp.(b) | | | 150,350 | | | | 7,338,583 | |
| | |
MASTER PORTFOLIO SCHEDULE OF INVESTMENTS | | 23 |
| | |
Schedule of Investments (continued) December 31, 2021 | | Large Cap Index Master Portfolio (Percentages shown are based on Net Assets) |
| | | | | | | | |
| Security | | Shares | | | Value | |
|
| Food Products (continued) | |
Ingredion, Inc. | | | 35,350 | | | $ | 3,416,224 | |
J.M. Smucker Co.(b) | | | 55,507 | | | | 7,538,961 | |
Kellogg Co. | | | 138,340 | | | | 8,911,863 | |
Kraft Heinz Co.(b) | | | 362,349 | | | | 13,008,329 | |
Lamb Weston Holdings, Inc.(b) | | | 78,479 | | | | 4,973,999 | |
McCormick & Co., Inc. | | | 132,108 | | | | 12,762,954 | |
Mondelez International, Inc., Class A | | | 744,414 | | | | 49,362,092 | |
Pilgrim’s Pride Corp.(a) | | | 28,135 | | | | 793,407 | |
Post Holdings, Inc.(a) | | | 32,268 | | | | 3,637,572 | |
Seaboard Corp. | | | 134 | | | | 527,291 | |
Tyson Foods, Inc., Class A(b) | | | 153,946 | | | | 13,417,933 | |
| | | | | | | | |
| | |
| | | | | | 217,468,799 | |
| | |
| Gas Utilities(b) — 0.1% | | | | | | |
Atmos Energy Corp. | | | 70,724 | | | | 7,409,753 | |
National Fuel Gas Co. | | | 46,971 | | | | 3,003,326 | |
UGI Corp. | | | 111,222 | | | | 5,106,202 | |
| | | | | | | | |
| | |
| | | | | | 15,519,281 | |
|
| Health Care Equipment & Supplies — 2.8% | |
Abbott Laboratories | | | 931,339 | | | | 131,076,651 | |
ABIOMED, Inc.(a) | | | 23,590 | | | | 8,472,820 | |
Align Technology, Inc.(a) | | | 41,936 | | | | 27,559,500 | |
Baxter International, Inc. | | | 269,076 | | | | 23,097,484 | |
Becton Dickinson and Co. | | | 153,846 | | | | 38,689,192 | |
Boston Scientific Corp.(a) | | | 760,702 | | | | 32,314,621 | |
Cooper Cos., Inc. | | | 26,309 | | | | 11,021,892 | |
DENTSPLY SIRONA, Inc. | | | 114,468 | | | | 6,386,170 | |
DexCom, Inc.(a) | | | 51,799 | | | | 27,813,473 | |
Edwards Lifesciences Corp.(a) | | | 329,362 | | | | 42,668,847 | |
Envista Holdings Corp.(a)(b) | | | 82,015 | | | | 3,695,596 | |
Figs, Inc., Class A(a)(b) | | | 27,109 | | | | 747,124 | |
Globus Medical, Inc., Class A(a) | | | 40,460 | | | | 2,921,212 | |
Hologic, Inc.(a) | | | 134,043 | | | | 10,262,332 | |
ICU Medical, Inc.(a) | | | 10,540 | | | | 2,501,564 | |
IDEXX Laboratories, Inc.(a) | | | 45,482 | | | | 29,948,078 | |
Insulet Corp.(a) | | | 35,901 | | | | 9,552,179 | |
Integra LifeSciences Holdings Corp.(a)(b) | | | 39,587 | | | | 2,651,933 | |
Intuitive Surgical, Inc.(a) | | | 189,680 | | | | 68,152,024 | |
Masimo Corp.(a) | | | 26,861 | | | | 7,864,364 | |
Medtronic PLC | | | 719,246 | | | | 74,405,999 | |
Novocure Ltd.(a)(b) | | | 54,962 | | | | 4,126,547 | |
Penumbra, Inc.(a)(b) | | | 18,517 | | | | 5,320,304 | |
Quidel Corp.(a)(b) | | | 19,204 | | | | 2,592,348 | |
ResMed, Inc. | | | 77,501 | | | | 20,187,460 | |
STERIS PLC(b) | | | 45,825 | | | | 11,154,263 | |
Stryker Corp.(b) | | | 187,949 | | | | 50,261,322 | |
Tandem Diabetes Care, Inc.(a) | | | 34,301 | | | | 5,162,986 | |
Teleflex, Inc. | | | 24,918 | | | | 8,185,065 | |
Zimmer Biomet Holdings, Inc. | | | 112,900 | | | | 14,342,816 | |
| | | | | | | | |
| | |
| | | | | | 683,136,166 | |
|
| Health Care Providers & Services — 2.6% | |
Acadia Healthcare Co., Inc.(a) | | | 47,503 | | | | 2,883,432 | |
Agilon Health, Inc.(a)(b) | | | 90,037 | | | | 2,430,999 | |
Amedisys, Inc.(a) | | | 17,764 | | | | 2,875,636 | |
AmerisourceBergen Corp.(b) | | | 79,702 | | | | 10,591,599 | |
Anthem, Inc.(b) | | | 131,010 | | | | 60,728,375 | |
Cardinal Health, Inc. | | | 154,369 | | | | 7,948,460 | |
Centene Corp.(a) | | | 309,260 | | | | 25,483,024 | |
Chemed Corp.(b) | | | 8,047 | | | | 4,257,185 | |
Cigna Corp. | | | 173,683 | | | | 39,882,827 | |
CVS Health Corp. | | | 704,969 | | | | 72,724,602 | |
DaVita, Inc.(a)(b) | | | 36,393 | | | | 4,140,068 | |
| | | | | | | | |
| Security | | Shares | | | Value | |
|
| Health Care Providers & Services (continued) | |
Encompass Health Corp. | | | 51,380 | | | $ | 3,353,059 | |
Guardant Health, Inc.(a) | | | 48,196 | | | | 4,820,564 | |
HCA Healthcare, Inc. | | | 130,316 | | | | 33,480,787 | |
Henry Schein, Inc.(a) | | | 76,135 | | | | 5,902,747 | |
Humana, Inc.(b) | | | 69,176 | | | | 32,087,979 | |
Laboratory Corp. of America Holdings(a) | | | 52,527 | | | | 16,504,509 | |
McKesson Corp. | | | 82,550 | | | | 20,519,453 | |
Molina Healthcare, Inc.(a) | | | 30,081 | | | | 9,568,164 | |
Oak Street Health, Inc.(a)(b) | | | 56,426 | | | | 1,869,958 | |
Premier, Inc., Class A(b) | | | 67,703 | | | | 2,787,332 | |
Quest Diagnostics, Inc.(b) | | | 65,484 | | | | 11,329,387 | |
Signify Health, Inc., Class A(a)(b) | | | 33,844 | | | | 481,262 | |
UnitedHealth Group, Inc. | | | 504,434 | | | | 253,296,489 | |
Universal Health Services, Inc., Class B(b) | | | 39,117 | | | | 5,071,910 | |
| | | | | | | | |
| | |
| | | | | | 635,019,807 | |
| | |
| Health Care Technology — 0.2% | | | | | | |
Cerner Corp. | | | 156,602 | | | | 14,543,628 | |
Certara, Inc.(a)(b) | | | 44,527 | | | | 1,265,457 | |
Change Healthcare, Inc.(a) | | | 142,878 | | | | 3,054,732 | |
Teladoc Health, Inc.(a)(b) | | | 82,107 | | | | 7,539,065 | |
Veeva Systems, Inc., Class A(a) | | | 73,553 | | | | 18,791,320 | |
| | | | | | | | |
| | |
| | | | | | 45,194,202 | |
|
| Hotels, Restaurants & Leisure — 2.0% | |
Aramark | | | 119,824 | | | | 4,415,514 | |
Booking Holdings, Inc.(a) | | | 22,098 | | | | 53,018,185 | |
Boyd Gaming Corp.(a)(b) | | | 44,050 | | | | 2,888,359 | |
Caesars Entertainment, Inc.(a)(b) | | | 111,316 | | | | 10,411,385 | |
Carnival Corp.(a)(b) | | | 457,270 | | | | 9,200,272 | |
Chipotle Mexican Grill, Inc.(a) | | | 14,978 | | | | 26,185,289 | |
Choice Hotels International, Inc. | | | 18,605 | | | | 2,902,194 | |
Churchill Downs, Inc.(b) | | | 19,784 | | | | 4,765,966 | |
Darden Restaurants, Inc.(b) | | | 69,276 | | | | 10,435,737 | |
Domino’s Pizza, Inc. | | | 19,720 | | | | 11,128,588 | |
DraftKings, Inc., Class A(a)(b) | | | 163,006 | | | | 4,477,775 | |
Expedia Group, Inc.(a) | | | 79,167 | | | | 14,307,060 | |
Hilton Worldwide Holdings, Inc.(a) | | | 146,195 | | | | 22,804,958 | |
Hyatt Hotels Corp., Class A(a) | | | 22,950 | | | | 2,200,905 | |
Las Vegas Sands Corp.(a) | | | 178,202 | | | | 6,707,523 | |
Marriott International, Inc., Class A(a) | | | 147,336 | | | | 24,345,801 | |
Marriott Vacations Worldwide Corp. | | | 22,345 | | | | 3,775,858 | |
McDonald’s Corp. | | | 400,446 | | | | 107,347,559 | |
MGM Resorts International | | | 208,288 | | | | 9,347,965 | |
Norwegian Cruise Line Holdings Ltd.(a) | | | 199,787 | | | | 4,143,582 | |
Penn National Gaming, Inc.(a) | | | 90,034 | | | | 4,668,263 | |
Planet Fitness, Inc., Class A(a) | | | 42,598 | | | | 3,858,527 | |
Royal Caribbean Cruises Ltd.(a)(b) | | | 117,649 | | | | 9,047,208 | |
Six Flags Entertainment Corp.(a) | | | 45,434 | | | | 1,934,580 | |
Starbucks Corp. | | | 631,140 | | | | 73,824,446 | |
Travel + Leisure Co. | | | 45,887 | | | | 2,536,175 | |
Vail Resorts, Inc. | | | 21,598 | | | | 7,081,984 | |
Wendy’s Co. | | | 95,181 | | | | 2,270,067 | |
Wyndham Hotels & Resorts, Inc. | | | 46,877 | | | | 4,202,523 | |
Wynn Resorts Ltd.(a)(b) | | | 56,909 | | | | 4,839,541 | |
Yum China Holdings, Inc.(b) | | | 225,354 | | | | 11,231,643 | |
Yum! Brands, Inc. | | | 156,884 | | | | 21,784,912 | |
| | | | | | | | |
| | |
| | | | | | 482,090,344 | |
|
| Household Durables — 0.4% | |
D.R. Horton, Inc. | | | 173,452 | | | | 18,810,869 | |
Garmin Ltd. | | | 83,164 | | | | 11,324,442 | |
Leggett & Platt, Inc.(b) | | | 74,594 | | | | 3,070,289 | |
Lennar Corp., B Shares | | | 10,779 | | | | 1,030,688 | |
| | |
| 24 | | 2 0 2 1 BLACK ROCK ANNUAL REPORT TO SHAREHOLDERS |
| | |
Schedule of Investments (continued) December 31, 2021 | | Large Cap Index Master Portfolio (Percentages shown are based on Net Assets) |
| | | | | | | | |
| Security | | Shares | | | Value | |
|
| Household Durables (continued) | |
Lennar Corp., Class A | | | 145,063 | | | $ | 16,850,518 | |
Mohawk Industries, Inc.(a) | | | 28,446 | | | | 5,182,292 | |
Newell Brands, Inc. | | | 209,219 | | | | 4,569,343 | |
NVR, Inc.(a) | | | 1,680 | | | | 9,926,902 | |
PulteGroup, Inc. | | | 139,170 | | | | 7,954,957 | |
Tempur Sealy International, Inc.(b) | | | 91,835 | | | | 4,319,000 | |
Toll Brothers, Inc.(b) | | | 61,053 | | | | 4,419,627 | |
TopBuild Corp.(a) | | | 17,705 | | | | 4,884,987 | |
Whirlpool Corp.(b) | | | 31,237 | | | | 7,330,074 | |
| | | | | | | | |
| | |
| | | | | | 99,673,988 | |
|
| Household Products — 1.2% | |
Church & Dwight Co., Inc.(b) | | | 133,373 | | | | 13,670,732 | |
Clorox Co. | | | 66,802 | | | | 11,647,597 | |
Colgate-Palmolive Co.(b) | | | 448,328 | | | | 38,260,312 | |
Kimberly-Clark Corp.(b) | | | 181,669 | | | | 25,964,133 | |
Procter & Gamble Co. | | | 1,290,439 | | | | 211,090,012 | |
Reynolds Consumer Products Inc. | | | 25,495 | | | | 800,543 | |
Spectrum Brands Holdings, Inc.(b) | | | 24,767 | | | | 2,519,299 | |
| | | | | | | | |
| | |
| | | | | | 303,952,628 | |
|
| Independent Power and Renewable Electricity Producers — 0.1% | |
AES Corp.(b) | | | 354,602 | | | | 8,616,829 | |
Brookfield Renewable Corp., Class A(b) | | | 68,537 | | | | 2,524,218 | |
Vistra Corp. | | | 254,672 | | | | 5,798,881 | |
| | | | | | | | |
| | |
| | | | | | 16,939,928 | |
|
| Industrial Conglomerates — 0.9% | |
3M Co.(b) | | | 309,119 | | | | 54,908,808 | |
General Electric Co. | | | 583,660 | | | | 55,138,360 | |
Honeywell International, Inc. | | | 372,309 | | | | 77,630,150 | |
Roper Technologies, Inc. | | | 56,033 | | | | 27,560,391 | |
| | | | | | | | |
| | |
| | | | | | 215,237,709 | |
|
| Insurance — 2.0% | |
Aflac, Inc. | | | 350,176 | | | | 20,446,777 | |
Alleghany Corp.(a) | | | 7,238 | | | | 4,832,016 | |
Allstate Corp.(b) | | | 153,229 | | | | 18,027,392 | |
American Financial Group, Inc.(b) | | | 35,874 | | | | 4,926,218 | |
American International Group, Inc.(b) | | | 448,492 | | | | 25,501,255 | |
Aon PLC, Class A | | | 116,373 | | | | 34,977,069 | |
Arch Capital Group Ltd.(a) | | | 201,065 | | | | 8,937,339 | |
Arthur J. Gallagher & Co. | | | 108,656 | | | | 18,435,664 | |
Assurant, Inc.(b) | | | 31,492 | | | | 4,908,343 | |
Assured Guaranty Ltd.(b) | | | 39,415 | | | | 1,978,633 | |
Athene Holding Ltd., Class A(a) | | | 59,309 | | | | 4,942,219 | |
Axis Capital Holdings Ltd.(b) | | | 44,804 | | | | 2,440,474 | |
Brighthouse Financial, Inc.(a) | | | 47,261 | | | | 2,448,120 | |
Brown & Brown, Inc.(b) | | | 125,378 | | | | 8,811,566 | |
Chubb Ltd. | | | 229,079 | | | | 44,283,261 | |
Cincinnati Financial Corp.(b) | | | 79,806 | | | | 9,092,298 | |
CNA Financial Corp.(b) | | | 18,457 | | | | 813,585 | |
Erie Indemnity Co., Class A(b) | | | 13,588 | | | | 2,617,864 | |
Everest Re Group Ltd. | | | 20,711 | | | | 5,673,157 | |
Fidelity National Financial, Inc.(b) | | | 149,944 | | | | 7,824,078 | |
First American Financial Corp. | | | 58,488 | | | | 4,575,516 | |
Globe Life, Inc. | | | 55,614 | | | | 5,212,144 | |
Hanover Insurance Group, Inc.(b) | | | 17,519 | | | | 2,296,040 | |
Hartford Financial Services Group, Inc. | | | 182,076 | | | | 12,570,527 | |
Kemper Corp.(b) | | | 33,376 | | | | 1,962,175 | |
Lemonade, Inc.(a)(b) | | | 18,475 | | | | 777,982 | |
Lincoln National Corp.(b) | | | 97,535 | | | | 6,657,739 | |
Loews Corp. | | | 117,613 | | | | 6,793,327 | |
Markel Corp.(a) | | | 7,370 | | | | 9,094,580 | |
| | | | | | | | |
| Security | | Shares | | | Value | |
|
| Insurance (continued) | |
Marsh & McLennan Cos., Inc. | | | 271,074 | | | $ | 47,118,083 | |
Mercury General Corp.(b) | | | 13,156 | | | | 698,057 | |
MetLife, Inc. | | | 381,596 | | | | 23,845,934 | |
Old Republic International Corp.(b) | | | 148,984 | | | | 3,662,027 | |
Primerica, Inc.(b) | | | 21,114 | | | | 3,236,143 | |
Principal Financial Group, Inc.(b) | | | 137,756 | | | | 9,963,891 | |
Progressive Corp.(b) | | | 314,545 | | | | 32,288,044 | |
Prudential Financial, Inc. | | | 202,710 | | | | 21,941,330 | |
Reinsurance Group of America, Inc. | | | 34,980 | | | | 3,829,960 | |
RenaissanceRe Holdings Ltd.(b) | | | 23,436 | | | | 3,968,418 | |
Travelers Cos., Inc. | | | 131,714 | | | | 20,604,021 | |
Unum Group | | | 104,440 | | | | 2,566,091 | |
W.R. Berkley Corp. | | | 72,694 | | | | 5,989,259 | |
White Mountains Insurance Group Ltd. | | | 1,716 | | | | 1,739,852 | |
Willis Towers Watson PLC | | | 66,472 | | | | 15,786,435 | |
| | | | | | | | |
| | |
| | | | | | 479,094,903 | |
|
| Interactive Media & Services(a) — 5.7% | |
Alphabet, Inc., Class A | | | 161,284 | | | | 467,246,199 | |
Alphabet, Inc., Class C | | | 150,468 | | | | 435,392,700 | |
IAC/InterActiveCorp(b) | | | 40,964 | | | | 5,354,405 | |
Match Group, Inc.(b) | | | 148,341 | | | | 19,618,097 | |
Meta Platforms, Inc., Class A | | | 1,267,364 | | | | 426,277,881 | |
Pinterest, Inc., Class A | | | 301,844 | | | | 10,972,029 | |
TripAdvisor, Inc.(b) | | | 55,991 | | | | 1,526,315 | |
Twitter, Inc. | | | 416,486 | | | | 18,000,525 | |
Vimeo, Inc.(b) | | | 79,879 | | | | 1,434,627 | |
| | | | | | | | |
| | |
| | | | | | 1,385,822,778 | |
|
| Internet & Direct Marketing Retail — 3.4% | |
Amazon.com, Inc.(a) | | | 232,735 | | | | 776,017,620 | |
DoorDash, Inc., Class A(a) | | | 77,099 | | | | 11,480,041 | |
eBay, Inc.(b) | | | 337,918 | | | | 22,471,547 | |
Etsy, Inc.(a)(b) | | | 68,207 | | | | 14,933,240 | |
Qurate Retail, Inc., Series A(b) | | | 197,866 | | | | 1,503,782 | |
Wayfair, Inc., Class A(a)(b) | | | 40,445 | | | | 7,683,337 | |
| | | | | | | | |
| | |
| | | | | | 834,089,567 | |
| | |
| IT Services — 4.8% | | | | | | |
Accenture PLC, Class A | | | 340,993 | | | | 141,358,648 | |
Akamai Technologies, Inc.(a)(b) | | | 87,667 | | | | 10,260,546 | |
Alliance Data Systems Corp. | | | 24,590 | | | | 1,636,956 | |
Amdocs Ltd. | | | 70,407 | | | | 5,269,260 | |
Automatic Data Processing, Inc.(b) | | | 227,323 | | | | 56,053,305 | |
Block, Inc., Class A(a) | | | 213,429 | | | | 34,470,918 | |
Broadridge Financial Solutions, Inc.(b) | | | 60,946 | | | | 11,142,148 | |
Cloudflare, Inc., Class A(a) | | | 139,151 | | | | 18,298,356 | |
Cognizant Technology Solutions Corp., Class A(b) | | | 282,994 | | | | 25,107,228 | |
Concentrix Corp. | | | 23,884 | | | | 4,266,160 | |
DXC Technology Co.(a)(b) | | | 132,485 | | | | 4,264,692 | |
EPAM Systems, Inc.(a) | | | 29,252 | | | | 19,553,499 | |
Euronet Worldwide, Inc.(a) | | | 27,020 | | | | 3,219,973 | |
Fastly, Inc., Class A(a)(b) | | | 56,737 | | | | 2,011,327 | |
Fidelity National Information Services, Inc. | | | 326,160 | | | | 35,600,364 | |
Fiserv, Inc.(a)(b) | | | 322,420 | | | | 33,463,972 | |
FleetCor Technologies, Inc.(a) | | | 42,053 | | | | 9,413,143 | |
Gartner, Inc.(a)(b) | | | 43,575 | | | | 14,567,994 | |
Genpact Ltd. | | | 99,807 | | | | 5,297,756 | |
Global Payments, Inc. | | | 153,003 | | | | 20,682,946 | |
Globant SA(a)(b) | | | 22,030 | | | | 6,919,403 | |
GoDaddy, Inc., Class A(a)(b) | | | 92,298 | | | | 7,832,408 | |
International Business Machines Corp. | | | 478,196 | | | | 63,915,677 | |
Jack Henry & Associates, Inc. | | | 39,632 | | | | 6,618,148 | |
Kyndryl Holdings, Inc.(a) | | | 96,905 | | | | 1,753,980 | |
| | |
MASTER PORTFOLIO SCHEDULE OF INVESTMENTS | | 25 |
| | |
Schedule of Investments (continued) December 31, 2021 | | Large Cap Index Master Portfolio (Percentages shown are based on Net Assets) |
| | | | | | | | |
| Security | | Shares | | | Value | |
|
| IT Services (continued) | |
Mastercard, Inc., Class A(b) | | | 469,180 | | | $ | 168,585,758 | |
MongoDB, Inc.(a)(b) | | | 33,326 | | | | 17,641,118 | |
Okta, Inc.(a)(b) | | | 66,604 | | | | 14,930,619 | |
Paychex, Inc. | | | 173,491 | | | | 23,681,521 | |
PayPal Holdings, Inc.(a) | | | 630,070 | | | | 118,818,601 | |
Paysafe Ltd.(a) | | | 223,543 | | | | 874,053 | |
Sabre Corp.(a)(b) | | | 176,574 | | | | 1,516,771 | |
Shift4 Payments, Inc., Class A(a)(b) | | | 23,042 | | | | 1,334,823 | |
Snowflake, Inc., Class A(a) | | | 105,377 | | | | 35,696,459 | |
SolarWinds Corp.(b) | | | 14,202 | | | | 201,526 | |
StoneCo Ltd., Class A(a) | | | 118,694 | | | | 2,001,181 | |
Switch, Inc., Class A(b) | | | 66,216 | | | | 1,896,426 | |
Twilio, Inc., Class A(a) | | | 89,279 | | | | 23,510,732 | |
VeriSign, Inc.(a) | | | 52,399 | | | | 13,299,914 | |
Visa, Inc., Class A(b) | | | 907,643 | | | | 196,695,315 | |
Western Union Co.(b) | | | 207,896 | | | | 3,708,865 | |
WEX, Inc.(a) | | | 25,267 | | | | 3,547,234 | |
Wix.com Ltd.(a) | | | 28,614 | | | | 4,515,003 | |
| | | | | | | | |
| | |
| | | | | | 1,175,434,726 | |
|
| Leisure Products — 0.1% | |
Brunswick Corp. | | | 43,513 | | | | 4,383,065 | |
Hasbro, Inc.(b) | | | 68,126 | | | | 6,933,864 | |
Hayward Holdings, Inc.(a)(b) | | | 20,586 | | | | 539,971 | |
Mattel, Inc.(a) | | | 190,027 | | | | 4,096,982 | |
Peloton Interactive, Inc., Class A(a)(b) | | | 144,175 | | | | 5,155,698 | |
Polaris, Inc.(b) | | | 30,110 | | | | 3,309,390 | |
YETI Holdings, Inc.(a)(b) | | | 45,912 | | | | 3,802,891 | |
| | | | | | | | |
| | |
| | | | | | 28,221,861 | |
|
| Life Sciences Tools & Services — 2.0% | |
10X Genomics, Inc., Class A(a)(b) | | | 44,882 | | | | 6,685,623 | |
Adaptive Biotechnologies Corp.(a)(b) | | | 58,400 | | | | 1,638,704 | |
Agilent Technologies, Inc. | | | 163,125 | | | | 26,042,906 | |
Avantor, Inc.(a) | | | 311,215 | | | | 13,114,600 | |
Bio-Rad Laboratories, Inc., Class A(a) | | | 11,316 | | | | 8,550,030 | |
Bio-Techne Corp. | | | 20,671 | | | | 10,693,935 | |
Bruker Corp. | | | 53,452 | | | | 4,485,157 | |
Charles River Laboratories International, Inc.(a) | | | 26,239 | | | | 9,886,330 | |
Danaher Corp. | | | 339,971 | | | | 111,853,859 | |
Illumina, Inc.(a) | | | 78,190 | | | | 29,746,604 | |
IQVIA Holdings, Inc.(a) | | | 102,147 | | | | 28,819,755 | |
Maravai LifeSciences Holdings, Inc., Class A(a) | | | 54,538 | | | | 2,285,142 | |
Mettler-Toledo International, Inc.(a) | | | 12,051 | | | | 20,453,078 | |
PerkinElmer, Inc.(b) | | | 68,054 | | | | 13,682,937 | |
QIAGEN NV(a) | | | 119,088 | | | | 6,618,911 | |
Repligen Corp.(a) | | | 29,209 | | | | 7,735,711 | |
Sotera Health Co.(a)(b) | | | 62,387 | | | | 1,469,214 | |
Syneos Health, Inc.(a)(b) | | | 53,612 | | | | 5,504,880 | |
Thermo Fisher Scientific, Inc. | | | 210,665 | | | | 140,564,115 | |
Waters Corp.(a) | | | 32,828 | | | | 12,231,713 | |
West Pharmaceutical Services, Inc. | | | 39,560 | | | | 18,554,036 | |
| | | | | | | | |
| | |
| | | | | | 480,617,240 | |
|
| Machinery — 1.6% | |
AGCO Corp. | | | 34,546 | | | | 4,008,027 | |
Allison Transmission Holdings, Inc. | | | 60,337 | | | | 2,193,250 | |
Caterpillar, Inc. | | | 290,135 | | | | 59,982,510 | |
Colfax Corp.(a)(b) | | | 67,510 | | | | 3,103,435 | |
Crane Co. | | | 25,215 | | | | 2,565,122 | |
Cummins, Inc. | | | 77,087 | | | | 16,815,758 | |
Deere & Co. | | | 149,524 | | | | 51,270,284 | |
Donaldson Co., Inc. | | | 68,092 | | | | 4,035,132 | |
Dover Corp. | | | 78,163 | | | | 14,194,401 | |
| | | | | | | | |
| Security | | Shares | | | Value | |
|
| Machinery (continued) | |
Flowserve Corp.(b) | | | 69,309 | | | $ | 2,120,855 | |
Fortive Corp. | | | 175,493 | | | | 13,388,361 | |
Gates Industrial Corp. PLC(a) | | | 40,279 | | | | 640,839 | |
Graco, Inc. | | | 88,554 | | | | 7,139,223 | |
IDEX Corp. | | | 40,432 | | | | 9,554,890 | |
Illinois Tool Works, Inc.(b) | | | 169,559 | | | | 41,847,161 | |
Ingersoll Rand, Inc. | | | 217,795 | | | | 13,474,977 | |
ITT, Inc.(b) | | | 46,740 | | | | 4,776,361 | |
Lincoln Electric Holdings, Inc.(b) | | | 30,018 | | | | 4,186,610 | |
Middleby Corp.(a)(b) | | | 29,684 | | | | 5,840,624 | |
Nordson Corp.(b) | | | 30,281 | | | | 7,729,831 | |
Oshkosh Corp.(b) | | | 35,129 | | | | 3,959,390 | |
Otis Worldwide Corp. | | | 230,516 | | | | 20,071,028 | |
PACCAR, Inc.(b) | | | 183,564 | | | | 16,201,359 | |
Parker-Hannifin Corp. | | | 69,282 | | | | 22,039,990 | |
Pentair PLC | | | 87,735 | | | | 6,407,287 | |
Snap-on, Inc.(b) | | | 28,941 | | | | 6,233,313 | |
Stanley Black & Decker, Inc. | | | 86,586 | | | | 16,331,851 | |
Timken Co.(b) | | | 32,511 | | | | 2,252,687 | |
Toro Co. | | | 56,462 | | | | 5,641,118 | |
Westinghouse Air Brake Technologies Corp.(b) | | | 97,678 | | | | 8,997,121 | |
Woodward, Inc.(b) | | | 30,355 | | | | 3,322,658 | |
Xylem, Inc. | | | 95,064 | | | | 11,400,075 | |
| | | | | | | | |
| | |
| | | | | | 391,725,528 | |
|
| Marine — 0.0% | |
Kirby Corp.(a) | | | 29,762 | | | | 1,768,458 | |
| | | | | | | | |
| | |
| Media — 1.1% | | | | | | |
Altice USA, Inc., Class A(a) | | | 121,027 | | | | 1,958,217 | |
Cable One, Inc.(b) | | | 2,783 | | | | 4,907,681 | |
Charter Communications, Inc., Class A(a)(b) | | | 66,754 | | | | 43,521,605 | |
Comcast Corp., Class A | | | 2,445,426 | | | | 123,078,291 | |
Discovery, Inc., Class A(a)(b) | | | 84,801 | | | | 1,996,216 | |
Discovery, Inc., Class C(a)(b) | | | 167,784 | | | | 3,842,254 | |
DISH Network Corp., Class A(a) | | | 131,813 | | | | 4,276,014 | |
Fox Corp., Class A(b) | | | 176,069 | | | | 6,496,946 | |
Fox Corp., Class B | | | 84,233 | | | | 2,886,665 | |
Interpublic Group of Cos., Inc.(b) | | | 216,585 | | | | 8,111,108 | |
Liberty Broadband Corp., Class A(a)(b) | | | 13,216 | | | | 2,126,454 | |
Liberty Broadband Corp., Class C(a) | | | 74,749 | | | | 12,042,064 | |
Liberty Media Corp. - Liberty SiriusXM, Class A(a)(b) | | | 42,844 | | | | 2,178,617 | |
Liberty Media Corp. - Liberty SiriusXM, Class C(a) | | | 87,042 | | | | 4,426,086 | |
Loyalty Ventures, Inc.(a) | | | 9,836 | | | | 295,769 | |
New York Times Co., Class A | | | 93,485 | | | | 4,515,325 | |
News Corp., Class A(b) | | | 208,116 | | | | 4,643,068 | |
News Corp., Class B | | | 71,927 | | | | 1,618,358 | |
Nexstar Media Group, Inc., Class A(b) | | | 19,677 | | | | 2,970,833 | |
Omnicom Group, Inc.(b) | | | 113,670 | | | | 8,328,601 | |
Sirius XM Holdings, Inc.(b) | | | 483,705 | | | | 3,071,527 | |
ViacomCBS, Inc., Class A(b) | | | 1,463 | | | | 48,820 | |
ViacomCBS, Inc., Class B(b) | | | 307,178 | | | | 9,270,632 | |
| | | | | | | | |
| | |
| | | | | | 256,611,151 | |
|
| Metals & Mining — 0.5% | |
Alcoa Corp. | | | 100,224 | | | | 5,971,346 | |
Cleveland-Cliffs, Inc.(a)(b) | | | 244,506 | | | | 5,322,896 | |
Freeport-McMoRan, Inc.(b) | | | 788,475 | | | | 32,903,062 | |
Newmont Corp. | | | 430,527 | | | | 26,701,284 | |
Nucor Corp. | | | 153,146 | | | | 17,481,616 | |
Reliance Steel & Aluminum Co.(b) | | | 34,439 | | | | 5,586,695 | |
Royal Gold, Inc.(b) | | | 34,461 | | | | 3,625,642 | |
| | |
| 26 | | 2 0 2 1 BLACK ROCK ANNUAL REPORT TO SHAREHOLDERS |
| | |
Schedule of Investments (continued) December 31, 2021 | | Large Cap Index Master Portfolio (Percentages shown are based on Net Assets) |
| | | | | | | | |
| Security | | Shares | | | Value | |
|
| Metals & Mining (continued) | |
Southern Copper Corp.(b) | | | 46,669 | | | $ | 2,879,944 | |
Steel Dynamics, Inc. | | | 103,117 | | | | 6,400,472 | |
United States Steel Corp.(b) | | | 143,487 | | | | 3,416,425 | |
| | | | | | | | |
| | |
| | | | | | 110,289,382 | |
|
| Mortgage Real Estate Investment Trusts (REITs) — 0.1% | |
AGNC Investment Corp.(b) | | | 293,657 | | | | 4,416,601 | |
Annaly Capital Management, Inc.(b) | | | 750,782 | | | | 5,871,115 | |
New Residential Investment Corp. | | | 216,193 | | | | 2,315,427 | |
Starwood Property Trust, Inc.(b) | | | 143,973 | | | | 3,498,544 | |
| | | | | | | | |
| | |
| | | | | | 16,101,687 | |
|
| Multiline Retail — 0.5% | |
Dollar General Corp. | | | 125,061 | | | | 29,493,136 | |
Dollar Tree, Inc.(a) | | | 119,275 | | | | 16,760,523 | |
Kohl’s Corp.(b) | | | 82,020 | | | | 4,050,968 | |
Nordstrom, Inc.(a)(b) | | | 59,838 | | | | 1,353,535 | |
Ollie’s Bargain Outlet Holdings, Inc.(a)(b) | | | 35,011 | | | | 1,792,213 | |
Target Corp.(b) | | | 261,318 | | | | 60,479,438 | |
| | | | | | | | |
| | |
| | | | | | 113,929,813 | |
|
| Multi-Utilities — 0.7% | |
Ameren Corp. | | | 136,647 | | | | 12,162,949 | |
CenterPoint Energy, Inc. | | | 311,957 | | | | 8,706,720 | |
CMS Energy Corp. | | | 152,534 | | | | 9,922,337 | |
Consolidated Edison, Inc.(b) | | | 190,447 | | | | 16,248,938 | |
Dominion Energy, Inc. | | | 432,387 | | | | 33,968,323 | |
DTE Energy Co. | | | 104,654 | | | | 12,510,339 | |
MDU Resources Group, Inc. | | | 103,705 | | | | 3,198,262 | |
NiSource, Inc. | | | 217,211 | | | | 5,997,196 | |
Public Service Enterprise Group, Inc. | | | 270,928 | | | | 18,079,025 | |
Sempra Energy | | | 172,308 | | | | 22,792,902 | |
WEC Energy Group, Inc. | | | 169,509 | | | | 16,454,239 | |
| | | | | | | | |
| | |
| | | | | | 160,041,230 | |
|
| Oil, Gas & Consumable Fuels — 2.3% | |
Antero Midstream Corp.(b) | | | 194,309 | | | | 1,880,911 | |
APA Corp. | | | 185,883 | | | | 4,998,394 | |
Cheniere Energy, Inc. | | | 127,768 | | | | 12,958,231 | |
Chevron Corp. | | | 1,037,331 | | | | 121,730,793 | |
ConocoPhillips | | | 706,022 | | | | 50,960,668 | |
Continental Resources, Inc.(b) | | | 33,740 | | | | 1,510,202 | |
Coterra Energy, Inc.(b) | | | 438,266 | | | | 8,327,054 | |
Devon Energy Corp.(b) | | | 362,688 | | | | 15,976,406 | |
Diamondback Energy, Inc. | | | 98,604 | | | | 10,634,441 | |
DTE Midstream LLC(a) | | | 52,327 | | | | 2,510,649 | |
EOG Resources, Inc.(b) | | | 312,571 | | | | 27,765,682 | |
EQT Corp.(a)(b) | | | 156,488 | | | | 3,413,003 | |
Exxon Mobil Corp. | | | 2,270,752 | | | | 138,947,315 | |
Hess Corp. | | | 147,001 | | | | 10,882,484 | |
HollyFrontier Corp. | | | 84,830 | | | | 2,780,727 | |
Kinder Morgan, Inc. | | | 1,042,266 | | | | 16,530,339 | |
Marathon Oil Corp. | | | 426,004 | | | | 6,994,986 | |
Marathon Petroleum Corp. | | | 331,905 | | | | 21,238,601 | |
New Fortress Energy, Inc.(b) | | | 14,214 | | | | 343,126 | |
Occidental Petroleum Corp. | | | 446,218 | | | | 12,935,860 | |
ONEOK, Inc. | | | 240,219 | | | | 14,115,268 | |
Phillips 66 | | | 237,294 | | | | 17,194,323 | |
Pioneer Natural Resources Co.(b) | | | 115,909 | | | | 21,081,529 | |
Targa Resources Corp. | | | 118,984 | | | | 6,215,724 | |
Texas Pacific Land Corp.(b) | | | 3,158 | | | | 3,943,932 | |
| | | | | | | | |
| Security | | Shares | | | Value | |
|
| Oil, Gas & Consumable Fuels (continued) | |
Valero Energy Corp.(b) | | | 216,461 | | | $ | 16,258,386 | |
Williams Cos., Inc.(b) | | | 659,517 | | | | 17,173,823 | |
| | | | | | | | |
| | |
| | | | | | 569,302,857 | |
|
| Paper & Forest Products — 0.0% | |
Louisiana-Pacific Corp. | | | 46,962 | | | | 3,679,473 | |
Sylvamo Corp.(a) | | | 19,181 | | | | 534,958 | |
| | | | | | | | |
| | |
| | | | | | 4,214,431 | |
|
| Personal Products — 0.2% | |
Coty, Inc., Class A(a) | | | 160,728 | | | | 1,687,644 | |
Estee Lauder Cos., Inc., Class A(b) | | | 123,173 | | | | 45,598,645 | |
Herbalife Nutrition Ltd.(a) | | | 57,625 | | | | 2,358,591 | |
Olaplex Holdings, Inc.(a)(b) | | | 43,544 | | | | 1,268,437 | |
| | | | | | | | |
| | |
| | | | | | 50,913,317 | |
|
| Pharmaceuticals — 3.4% | |
Bristol-Myers Squibb Co. | | | 1,196,658 | | | | 74,611,626 | |
Catalent, Inc.(a) | | | 87,077 | | | | 11,148,468 | |
Elanco Animal Health, Inc.(a) | | | 246,833 | | | | 7,005,121 | |
Eli Lilly & Co. | | | 454,501 | | | | 125,542,266 | |
Jazz Pharmaceuticals PLC(a)(b) | | | 31,786 | | | | 4,049,536 | |
Johnson & Johnson | | | 1,412,789 | | | | 241,685,814 | |
Merck & Co., Inc. | | | 1,358,412 | | | | 104,108,696 | |
Nektar Therapeutics(a)(b) | | | 90,298 | | | | 1,219,926 | |
Organon & Co. | | | 135,789 | | | | 4,134,775 | |
Perrigo Co. PLC | | | 71,340 | | | | 2,775,126 | |
Pfizer, Inc. | | | 2,993,375 | | | | 176,758,794 | |
Royalty Pharma PLC, Class A | | | 175,855 | | | | 7,007,822 | |
Viatris, Inc. | | | 646,422 | | | | 8,746,090 | |
Zoetis, Inc.(b) | | | 253,996 | | | | 61,982,644 | |
| | | | | | | | |
| | |
| | | | | | 830,776,704 | |
|
| Professional Services — 0.6% | |
Booz Allen Hamilton Holding Corp. | | | 70,687 | | | | 5,993,551 | |
CACI International, Inc., Class A(a) | | | 12,404 | | | | 3,339,281 | |
Clarivate PLC(a)(b) | | | 240,413 | | | | 5,654,514 | |
CoStar Group, Inc.(a) | | | 208,362 | | | | 16,466,849 | |
Dun & Bradstreet Holdings, Inc.(a)(b) | | | 81,354 | | | | 1,666,944 | |
Equifax, Inc. | | | 65,256 | | | | 19,106,304 | |
FTI Consulting, Inc.(a)(b) | | | 18,977 | | | | 2,911,451 | |
IHS Markit Ltd. | | | 200,701 | | | | 26,677,177 | |
Jacobs Engineering Group, Inc. | | | 69,418 | | | | 9,665,068 | |
Legalzoom.com, Inc.(a)(b) | | | 13,278 | | | | 213,378 | |
Leidos Holdings, Inc. | | | 74,672 | | | | 6,638,341 | |
ManpowerGroup, Inc. | | | 29,146 | | | | 2,836,780 | |
Nielsen Holdings PLC | | | 190,661 | | | | 3,910,457 | |
Robert Half International, Inc.(b) | | | 58,497 | | | | 6,523,585 | |
Science Applications International Corp.(b) | | | 30,168 | | | | 2,521,743 | |
TransUnion | | | 101,002 | | | | 11,976,817 | |
Verisk Analytics, Inc. | | | 85,496 | | | | 19,555,500 | |
| | | | | | | | |
| | |
| | | | | | 145,657,740 | |
|
| Real Estate Management & Development(a) — 0.2% | |
CBRE Group, Inc., Class A | | | 179,851 | | | | 19,515,632 | |
Howard Hughes Corp.(b) | | | 21,016 | | | | 2,139,008 | |
Jones Lang LaSalle, Inc. | | | 27,606 | | | | 7,435,400 | |
Opendoor Technologies Inc.(b) | | | 248,898 | | | | 3,636,400 | |
Zillow Group, Inc., Class A(b) | | | 33,710 | | | | 2,097,436 | |
Zillow Group, Inc., Class C(b) | | | 92,963 | | | | 5,935,688 | |
| | | | | | | | |
| | |
| | | | | | 40,759,564 | |
|
| Road & Rail — 1.1% | |
AMERCO | | | 4,991 | | | | 3,624,614 | |
| | |
MASTER PORTFOLIO SCHEDULE OF INVESTMENTS | | 27 |
| | |
Schedule of Investments (continued) December 31, 2021 | | Large Cap Index Master Portfolio (Percentages shown are based on Net Assets) |
| | | | | | | | |
| Security | | Shares | | | Value | |
|
| Road & Rail (continued) | |
CSX Corp. | | | 1,180,950 | | | $ | 44,403,720 | |
JB Hunt Transport Services, Inc. | | | 44,764 | | | | 9,149,762 | |
Knight-Swift Transportation Holdings, Inc. | | | 86,287 | | | | 5,258,330 | |
Landstar System, Inc. | | | 20,169 | | | | 3,610,654 | |
Lyft, Inc., Class A(a)(b) | | | 158,981 | | | | 6,793,258 | |
Norfolk Southern Corp. | | | 130,173 | | | | 38,753,804 | |
Old Dominion Freight Line, Inc.(b) | | | 55,042 | | | | 19,725,952 | |
Ryder System, Inc.(b) | | | 26,131 | | | | 2,153,978 | |
Schneider National, Inc., Class B(b) | | | 30,004 | | | | 807,408 | |
TuSimple Holdings, Inc., Class A(a)(b) | | | 71,506 | | | | 2,563,490 | |
Uber Technologies, Inc.(a) | | | 869,813 | | | | 36,471,259 | |
Union Pacific Corp.(b) | | | 344,703 | | | | 86,841,027 | |
XPO Logistics, Inc.(a) | | | 52,538 | | | | 4,068,017 | |
| | | | | | | | |
| | |
| | | | | | 264,225,273 | |
|
| Semiconductors & Semiconductor Equipment — 5.9% | |
Advanced Micro Devices, Inc.(a) | | | 648,925 | | | | 93,380,308 | |
Allegro MicroSystems, Inc.(a) | | | 21,554 | | | | 779,824 | |
Analog Devices, Inc.(b) | | | 286,504 | | | | 50,358,808 | |
Applied Materials, Inc.(b) | | | 482,966 | | | | 75,999,530 | |
Azenta Inc(b) | | | 39,284 | | | | 4,050,573 | |
Broadcom, Inc.(b) | | | 214,049 | | | | 142,430,345 | |
Cirrus Logic, Inc.(a)(b) | | | 31,220 | | | | 2,872,864 | |
Enphase Energy, Inc.(a)(b) | | | 70,835 | | | | 12,958,555 | |
Entegris, Inc.(b) | | | 71,327 | | | | 9,884,496 | |
First Solar, Inc.(a) | | | 56,884 | | | | 4,958,009 | |
Globalfoundries, Inc.(a) | | | 28,257 | | | | 1,835,857 | |
Intel Corp.(b) | | | 2,167,318 | | | | 111,616,877 | |
KLA Corp. | | | 81,283 | | | | 34,960,631 | |
Lam Research Corp. | | | 75,396 | | | | 54,221,033 | |
Marvell Technology, Inc. | | | 441,225 | | | | 38,602,775 | |
Microchip Technology, Inc. | | | 289,159 | | | | 25,174,183 | |
Micron Technology, Inc. | | | 598,883 | | | | 55,785,952 | |
MKS Instruments, Inc. | | | 30,243 | | | | 5,267,423 | |
Monolithic Power Systems, Inc.(b) | | | 24,128 | | | | 11,903,066 | |
NVIDIA Corp. | | | 1,282,825 | | | | 377,291,661 | |
NXP Semiconductors NV(b) | | | 142,475 | | | | 32,452,956 | |
ON Semiconductor Corp.(a)(b) | | | 224,707 | | | | 15,262,099 | |
Qorvo, Inc.(a) | | | 59,477 | | | | 9,301,608 | |
Qualcomm, Inc. | | | 604,860 | | | | 110,610,748 | |
Skyworks Solutions, Inc. | | | 88,597 | | | | 13,744,939 | |
Teradyne, Inc.(b) | | | 88,536 | | | | 14,478,292 | |
Texas Instruments, Inc.(b) | | | 495,258 | | | | 93,341,275 | |
Universal Display Corp.(b) | | | 23,204 | | | | 3,829,356 | |
Wolfspeed, Inc.(a)(b) | | | 63,460 | | | | 7,092,924 | |
Xilinx, Inc. | | | 132,031 | | | | 27,994,533 | |
| | | | | | | | |
| | |
| | | | | | 1,442,441,500 | |
|
| Software — 10.2% | |
Adobe, Inc.(a) | | | 256,008 | | | | 145,171,897 | |
Alteryx, Inc., Class A(a)(b) | | | 31,822 | | | | 1,925,231 | |
Anaplan, Inc.(a)(b) | | | 80,201 | | | | 3,677,216 | |
ANSYS, Inc.(a) | | | 47,014 | | | | 18,858,256 | |
Aspen Technology, Inc.(a) | | | 35,457 | | | | 5,396,555 | |
Atlassian Corp. PLC, Class A(a) | | | 73,302 | | | | 27,949,320 | |
Autodesk, Inc.(a) | | | 118,034 | | | | 33,189,980 | |
Avalara, Inc.(a) | | | 45,792 | | | | 5,912,205 | |
Bentley Systems, Inc., Class B(b) | | | 72,359 | | | | 3,497,110 | |
Bill.Com Holdings, Inc.(a) | | | 49,547 | | | | 12,344,635 | |
Black Knight, Inc.(a) | | | 79,975 | | | | 6,629,128 | |
C3.AI, Inc., Class A(a) | | | 18,741 | | | | 585,656 | |
Cadence Design Systems, Inc.(a) | | | 147,833 | | | | 27,548,680 | |
CDK Global, Inc.(b) | | | 60,737 | | | | 2,535,162 | |
| | | | | | | | |
| Security | | Shares | | | Value | |
|
| Software (continued) | |
Ceridian HCM Holding, Inc.(a)(b) | | | 69,321 | | | $ | 7,241,272 | |
Citrix Systems, Inc. | | | 67,374 | | | | 6,372,907 | |
Coupa Software, Inc.(a) | | | 39,935 | | | | 6,311,727 | |
Crowdstrike Holdings, Inc., Class A(a) | | | 106,069 | | | | 21,717,628 | |
Datadog, Inc., Class A(a) | | | 137,274 | | | | 24,449,872 | |
Datto Holding Corp.(a)(b) | | | 16,238 | | | | 427,871 | |
DocuSign, Inc.(a) | | | 102,501 | | | | 15,611,927 | |
Dolby Laboratories, Inc., Class A | | | 35,426 | | | | 3,373,264 | |
DoubleVerify Holdings, Inc.(a)(b) | | | 10,690 | | | | 355,763 | |
Dropbox, Inc., Class A(a) | | | 163,598 | | | | 4,014,695 | |
Duck Creek Technologies, Inc.(a) | | | 40,103 | | | | 1,207,501 | |
Dynatrace, Inc.(a) | | | 108,691 | | | | 6,559,502 | |
Elastic NV(a) | | | 36,898 | | | | 4,541,775 | |
Everbridge, Inc.(a)(b) | | | 20,541 | | | | 1,383,026 | |
Fair Isaac Corp.(a)(b) | | | 14,730 | | | | 6,387,959 | |
Five9, Inc.(a) | | | 35,842 | | | | 4,921,823 | |
Fortinet, Inc.(a) | | | 72,131 | | | | 25,923,881 | |
Guidewire Software, Inc.(a) | | | 46,785 | | | | 5,311,501 | |
HubSpot, Inc.(a)(b) | | | 23,965 | | | | 15,796,530 | |
Intuit, Inc. | | | 142,333 | | | | 91,551,432 | |
Jamf Holding Corp.(a)(b) | | | 34,439 | | | | 1,309,026 | |
Mandiant, Inc.(a) | | | 131,159 | | | | 2,300,529 | |
Manhattan Associates, Inc.(a) | | | 33,911 | | | | 5,272,821 | |
McAfee Corp., Class A(b) | | | 27,526 | | | | 709,896 | |
Microsoft Corp. | | | 4,041,092 | | | | 1,359,100,061 | |
N-Able, Inc.(a)(b) | | | 14,202 | | | | 157,642 | |
nCino, Inc.(a)(b) | | | 32,187 | | | | 1,765,779 | |
NCR Corp.(a) | | | 72,634 | | | | 2,919,887 | |
New Relic, Inc.(a) | | | 25,880 | | | | 2,845,765 | |
NortonLifeLock, Inc.(b) | | | 296,659 | | | | 7,707,201 | |
Nuance Communications, Inc.(a) | | | 157,081 | | | | 8,689,721 | |
Nutanix, Inc., Class A(a) | | | 100,784 | | | | 3,210,978 | |
Oracle Corp. | | | 884,889 | | | | 77,171,170 | |
Palantir Technologies, Inc., Class A(a)(b) | | | 874,044 | | | | 15,916,341 | |
Palo Alto Networks, Inc.(a)(b) | | | 51,013 | | | | 28,401,998 | |
Paycom Software, Inc.(a) | | | 27,235 | | | | 11,307,700 | |
Paycor HCM, Inc.(a)(b) | | | 15,501 | | | | 446,584 | |
Paylocity Holding Corp.(a) | | | 20,139 | | | | 4,756,026 | |
Pegasystems, Inc.(b) | | | 21,225 | | | | 2,373,380 | |
Procore Technologies, Inc.(a) | | | 32,087 | | | | 2,565,997 | |
PTC, Inc.(a)(b) | | | 58,717 | | | | 7,113,565 | |
RingCentral, Inc., Class A(a) | | | 43,382 | | | | 8,127,618 | |
salesforce.com, Inc.(a) | | | 501,441 | | | | 127,431,201 | |
ServiceNow, Inc.(a) | | | 105,518 | | | | 68,492,789 | |
Smartsheet, Inc., Class A(a) | | | 64,552 | | | | 4,999,552 | |
Splunk, Inc.(a)(b) | | | 84,994 | | | | 9,835,506 | |
SS&C Technologies Holdings, Inc. | | | 118,726 | | | | 9,733,157 | |
Synopsys, Inc.(a) | | | 81,146 | | | | 29,902,301 | |
Teradata Corp.(a) | | | 57,517 | | | | 2,442,747 | |
Trade Desk, Inc., Class A(a) | | | 229,751 | | | | 21,054,382 | |
Tyler Technologies, Inc.(a) | | | 21,887 | | | | 11,774,112 | |
Unity Software, Inc.(a) | | | 79,489 | | | | 11,366,132 | |
VMware, Inc., Class A(b) | | | 120,209 | | | | 13,929,819 | |
Workday, Inc., Class A(a)(b) | | | 101,180 | | | | 27,640,352 | |
Zendesk, Inc.(a) | | | 61,974 | | | | 6,463,268 | |
Zoom Video Communications, Inc., Class A(a) | | | 114,690 | | | | 21,092,638 | |
Zscaler, Inc.(a)(b) | | | 41,509 | | | | 13,338,087 | |
| | | | | | | | |
| | |
| | | | | | 2,482,348,615 | |
| | |
| Specialty Retail — 2.4% | | | | | | |
Advance Auto Parts, Inc. | | | 33,721 | | | | 8,088,994 | |
AutoNation, Inc.(a) | | | 22,079 | | | | 2,579,931 | |
AutoZone, Inc.(a) | | | 11,220 | | | | 23,521,496 | |
| | |
| 28 | | 2 0 2 1 BLACK ROCK ANNUAL REPORT TO SHAREHOLDERS |
| | |
Schedule of Investments (continued) December 31, 2021 | | Large Cap Index Master Portfolio (Percentages shown are based on Net Assets) |
| | | | | | | | |
| Security | | Shares | | | Value | |
|
| Specialty Retail (continued) | |
Bath & Body Works, Inc. | | | 129,074 | | | $ | 9,008,074 | |
Best Buy Co., Inc.(b) | | | 133,849 | | | | 13,599,058 | |
Burlington Stores, Inc.(a) | | | 36,161 | | | | 10,541,293 | |
CarMax, Inc.(a)(b) | | | 87,253 | | | | 11,362,958 | |
Carvana Co.(a)(b) | | | 41,394 | | | | 9,594,715 | |
Dick’s Sporting Goods, Inc.(b) | | | 32,622 | | | | 3,751,204 | |
Five Below, Inc.(a) | | | 30,030 | | | | 6,212,907 | |
Floor & Decor Holdings, Inc., Class A(a) | | | 54,620 | | | | 7,101,146 | |
Foot Locker, Inc.(b) | | | 48,169 | | | | 2,101,614 | |
GameStop Corp., Class A(a)(b) | | | 34,483 | | | | 5,116,932 | |
Gap, Inc.(b) | | | 103,373 | | | | 1,824,533 | |
Home Depot, Inc. | | | 570,198 | | | | 236,637,872 | |
Leslie’s, Inc.(a)(b) | | | 61,205 | | | | 1,448,110 | |
Lithia Motors, Inc. | | | 15,527 | | | | 4,610,743 | |
Lowe’s Cos., Inc. | | | 371,529 | | | | 96,032,816 | |
O’Reilly Automotive, Inc.(a) | | | 35,690 | | | | 25,205,349 | |
Penske Automotive Group, Inc.(b) | | | 14,808 | | | | 1,587,714 | |
Petco Health & Wellness Co., Inc.(a)(b) | | | 29,465 | | | | 583,112 | |
RH(a)(b) | | | 9,209 | | | | 4,935,471 | |
Ross Stores, Inc. | | | 187,228 | | | | 21,396,416 | |
TJX Cos., Inc.(b) | | | 643,734 | | | | 48,872,285 | |
Tractor Supply Co. | | | 61,997 | | | | 14,792,484 | |
Ulta Beauty, Inc.(a) | | | 28,378 | | | | 11,701,385 | |
Victoria’s Secret & Co.(a) | | | 42,731 | | | | 2,373,280 | |
Vroom, Inc.(a)(b) | | | 57,305 | | | | 618,321 | |
Williams-Sonoma, Inc.(b) | | | 40,106 | | | | 6,783,128 | |
| | | | | | | | |
| | |
| | | | | | 591,983,341 | |
|
| Technology Hardware, Storage & Peripherals — 6.3% | |
Apple, Inc. | | | 8,276,773 | | | | 1,469,706,582 | |
Dell Technologies, Inc., Class C(a) | | | 147,904 | | | | 8,307,768 | |
Hewlett Packard Enterprise Co. | | | 686,785 | | | | 10,830,599 | |
HP, Inc. | | | 622,399 | | | | 23,445,770 | |
NetApp, Inc.(b) | | | 118,745 | | | | 10,923,352 | |
Pure Storage, Inc., Class A(a) | | | 139,352 | | | | 4,535,908 | |
Western Digital Corp.(a) | | | 164,826 | | | | 10,748,303 | |
Xerox Holdings Corp.(b) | | | 77,484 | | | | 1,754,238 | |
| | | | | | | | |
| | |
| | | | | | 1,540,252,520 | |
|
| Textiles, Apparel & Luxury Goods — 0.8% | |
Capri Holdings Ltd.(a) | | | 76,780 | | | | 4,983,790 | |
Carter’s, Inc.(b) | | | 22,980 | | | | 2,326,036 | |
Columbia Sportswear Co. | | | 21,427 | | | | 2,087,847 | |
Deckers Outdoor Corp.(a) | | | 14,966 | | | | 5,482,195 | |
Hanesbrands, Inc.(b) | | | 186,783 | | | | 3,123,012 | |
Lululemon Athletica, Inc.(a)(b) | | | 61,180 | | | | 23,948,911 | |
NIKE, Inc., Class B | | | 664,312 | | | | 110,720,881 | |
PVH Corp. | | | 37,356 | | | | 3,984,017 | |
Ralph Lauren Corp. | | | 25,251 | | | | 3,001,334 | |
Skechers USA, Inc., Class A(a) | | | 74,526 | | | | 3,234,428 | |
Tapestry, Inc.(b) | | | 154,787 | | | | 6,284,352 | |
Under Armour, Inc., Class A(a) | | | 103,529 | | | | 2,193,779 | |
Under Armour, Inc., Class C(a) | | | 98,963 | | | | 1,785,293 | |
VF Corp.(b) | | | 173,477 | | | | 12,701,986 | |
| | | | | | | | |
| | |
| | | | | | 185,857,861 | |
| | |
| Thrifts & Mortgage Finance — 0.0% | | | | | | |
MGIC Investment Corp. | | | 181,135 | | | | 2,611,967 | |
New York Community Bancorp, Inc.(b) | | | 247,647 | | | | 3,023,770 | |
Rocket Cos., Inc., Class A(b) | | | 66,116 | | | | 925,624 | |
TFS Financial Corp.(b) | | | 20,191 | | | | 360,813 | |
UWM Holdings Corp.(b) | | | 64,344 | | | | 380,916 | |
| | | | | | | | |
| | |
| | | | | | 7,303,090 | |
| | | | | | | | |
| Security | | Shares | | | Value | |
|
| Tobacco — 0.5% | |
Altria Group, Inc. | | | 988,034 | | | $ | 46,822,931 | |
Philip Morris International, Inc. | | | 834,415 | | | | 79,269,425 | |
| | | | | | | | |
| | |
| | | | | | 126,092,356 | |
|
| Trading Companies & Distributors — 0.3% | |
Air Lease Corp.(b) | | | 63,100 | | | | 2,790,913 | |
Core & Main, Inc., Class A(a)(b) | | | 18,777 | | | | 569,694 | |
Fastenal Co. | | | 309,958 | | | | 19,855,910 | |
MSC Industrial Direct Co., Inc., Class A(b) | | | 21,953 | | | | 1,845,369 | |
SiteOne Landscape Supply, Inc.(a)(b) | | | 23,653 | | | | 5,730,649 | |
United Rentals, Inc.(a) | | | 38,439 | | | | 12,772,895 | |
Univar Solutions, Inc.(a)(b) | | | 83,149 | | | | 2,357,274 | |
W.W. Grainger, Inc. | | | 24,944 | | | | 12,926,979 | |
Watsco, Inc. | | | 17,346 | | | | 5,427,216 | |
| | | | | | | | |
| | |
| | | | | | 64,276,899 | |
|
| Water Utilities — 0.1% | |
American Water Works Co., Inc.(b) | | | 97,079 | | | | 18,334,340 | |
Essential Utilities, Inc. | | | 116,575 | | | | 6,258,913 | |
| | | | | | | | |
| | |
| | | | | | 24,593,253 | |
|
| Wireless Telecommunication Services — 0.1% | |
T-Mobile US, Inc.(a) | | | 317,586 | | | | 36,833,624 | |
| | | | | | | | |
| |
Total Common Stocks — 98.7%
(Cost: $12,295,333,329) | | | | 24,039,646,799 | |
| | | | | | | | |
|
Investment Companies | |
|
| Equity Funds — 0.9% | |
iShares Russell 1000 ETF(b)(c) | | | 869,486 | | | | 229,918,183 | |
| | | | | | | | |
| |
Total Investment Companies — 0.9%
(Cost: $197,380,396) | | | | 229,918,183 | |
| | | | | | | | |
| |
Total Long-Term Investments — 99.6%
(Cost: $12,492,713,725) | | | | 24,269,564,982 | |
| | | | | | | | |
|
Short-Term Securities | |
|
| Money Market Funds — 7.4% | |
BlackRock Cash Funds: Institutional,
SL Agency Shares, 0.10%(c)(d)(e) | | | 1,584,282,615 | | | | 1,584,757,900 | |
BlackRock Cash Funds: Treasury,
SL Agency Shares, 0.01%(c)(d) | | | 227,588,973 | | | | 227,588,973 | |
| | | | | | | | |
| |
Total Short-Term Securities — 7.4%
(Cost: $1,812,146,041) | | | | 1,812,346,873 | |
| | | | | | | | |
| |
Total Investments — 107.0%
(Cost: $14,304,859,766) | | | | 26,081,911,855 | |
| |
Liabilities in Excess of Other Assets — (7.0)% | | | | (1,716,486,903 | ) |
| | | | | | | | |
| |
Net Assets — 100.0% | | | $ | 24,365,424,952 | |
| | | | | | | | |
| (a) | Non-income producing security. |
| (b) | All or a portion of this security is on loan. |
| (c) | Affiliate of the Master Portfolio. |
| (d) | Annualized 7-day yield as of period end. |
| (e) | All or a portion of this security was purchased with the cash collateral from loaned securities. |
| | |
MASTER PORTFOLIO SCHEDULE OF INVESTMENTS | | 29 |
| | |
Schedule of Investments (continued) December 31, 2021 | | Large Cap Index Master Portfolio |
For Master Portfolio compliance purposes, the Master Portfolio’s industry classifications refer to one or more of the industry sub-classifications used by one or more widely recognized market indexes or rating group indexes, and/or as defined by the investment adviser. These definitions may not apply for purposes of this report, which may combine such industry sub-classifications for reporting ease.
Affiliates
Investments in issuers considered to be affiliate(s) of the Master Portfolio during the year ended December 31, 2021 for purposes of Section 2(a)(3) of the Investment Company Act of 1940, as amended, were as follows:
| | | | | | | | | | | | | | | | | | | | | | | | | | | | | | | | | | | | | | | | | | |
| | | | | | | |
| | | Affiliated Issuer | | Value at
12/31/20 | | | Purchases
at Cost | | | Proceeds
from Sales | | | Net Realized Gain (Loss) | | | Change in
Unrealized
Appreciation
(Depreciation) | | | Value at 12/31/21 | | | Shares Held at
12/31/21 | | | Income | | | Capital Gain
Distributions
from
Underlying
Funds | | | | |
| | | | | | | |
| | BlackRock Cash Funds: Institutional, SL Agency Shares | | $ | 1,048,530,631 | | | $ | 536,563,366 | (a) | | $ | — | | | $ | 32,084 | | | $ | (368,181 | ) | | $ | 1,584,757,900 | | | | 1,584,282,615 | | | $ | 2,453,198 | (b) | | $ | — | | | | | |
| | BlackRock Cash Funds: Treasury, SL Agency Shares | | | 201,900,891 | | | | 25,688,082 | (a) | | | — | | | | — | | | | — | | | | 227,588,973 | | | | 227,588,973 | | | | 19,637 | | | | — | | | | | |
| | BlackRock, Inc. | | | 57,024,749 | | | | 4,171,328 | | | | (6,486,465 | ) | | | 813,504 | | | | 14,551,100 | | | | 70,074,216 | | | | 76,537 | | | | 1,293,995 | | | | — | | | | | |
| | iShares Russell 1000 ETF | | | 132,927,058 | | | | 1,491,840,771 | | | | (1,432,868,790 | ) | | | 23,890,145 | | | | 14,128,999 | | | | 229,918,183 | | | | 869,486 | | | | 2,247,655 | | | | — | | | | | |
| | | | | | | | | | | | | | | | | | | | | | | | | | | | | | | | | | | | | | | | | | |
| | | | | | | | | | | |
| | | | | | | | | | | | | | | | $ | 24,735,733 | | | $ | 28,311,918 | | | $ | 2,112,339,272 | | | | | | | $ | 6,014,485 | | | $ | — | | | | | |
| | | | | | | | | | | | | | | | | | | | | | | | | | | | | | | | | | | | | | | | | | |
| | (a) | Represents net amount purchased (sold). | |
| | (b) | All or a portion represents securities lending income earned from the reinvestment of cash collateral from loaned securities, net of fees and collateral investment expenses, and other payments to and from borrowers of securities. | |
Derivative Financial Instruments Outstanding as of Period End
Futures Contracts
| | | | | | | | | | | | | | | | |
| |
| Description | | Number of
Contracts | | | Expiration
Date | | | Notional
Amount (000) | | | Value/
Unrealized
Appreciation
(Depreciation) | |
| |
Long Contracts | | | | | | | | | | | | | | | | |
S&P 500 E-Mini Index | | | 679 | | | | 03/18/22 | | | $ | 161,551 | | | $ | 2,233,648 | |
S&P Mid 400 E-Mini Index | | | 51 | | | | 03/18/22 | | | | 14,472 | | | | 344,239 | |
| | | | | | | | | | | | | | | | |
| | | | |
| | | | | | | | | | | | | | $ | 2,577,887 | |
| | | | | | | | | | | | | | | | |
Derivative Financial Instruments Categorized by Risk Exposure
As of period end, the fair values of derivative financial instruments located in the Statement of Assets and Liabilities were as follows:
| | | | | | | | | | | | | | | | | | | | | | | | | | | | |
| |
| | | Commodity
Contracts | | | Credit
Contracts | | | Equity
Contracts | | | Foreign
Currency
Exchange
Contracts | | | Interest
Rate
Contracts | | | Other
Contracts | | | Total | |
| |
Assets — Derivative Financial Instruments | | | | | | | | | | | | | | | | | | | | | | | | | | | | |
Futures contracts | | | | | | | | | | | | | | | | | | | | | | | | | | | | |
Unrealized appreciation on futures contracts(a) | | $ | — | | | $ | — | | | $ | 2,577,887 | | | $ | — | | | $ | — | | | $ | — | | | $ | 2,577,887 | |
| | | | | | | | | | | | | | | | | | | | | | | | | | | | |
| | (a) | Net cumulative unrealized appreciation (depreciation) on futures contracts and centrally cleared swaps, if any, are reported in the Master Portfolio Schedule of Investments. In the Statement of Assets and Liabilities, only current day’s variation margin is reported in receivables or payables and the net cumulative unrealized appreciation (depreciation) is included in net unrealized appreciation (depreciation). | |
| | |
| 30 | | 2 0 2 1 BLACK ROCK ANNUAL REPORT TO SHAREHOLDERS |
| | |
Schedule of Investments (continued) December 31, 2021 | | Large Cap Index Master Portfolio |
For the period ended December 31, 2021, the effect of derivative financial instruments in the Statement of Operations was as follows:
| | | | | | | | | | | | | | | | | | | | | | | | | | | | |
| |
| | | Commodity
Contracts | | | Credit
Contracts | | | Equity
Contracts | | | Foreign
Currency
Exchange
Contracts | | | Interest
Rate
Contracts | | | Other
Contracts | | | Total | |
| |
Net Realized Gain (Loss) from: | | | | | | | | | | | | | | | | | | | | | | | | | | | | |
Futures contracts | | $ | — | | | $ | — | | | $ | 33,675,490 | | | $ | — | | | $ | — | | | $ | — | | | $ | 33,675,490 | |
| | | | | | | | | | | | | | | | | | | | | | | | | | | | |
Net Change in Unrealized Appreciation (Depreciation) on: | | | | | | | | | | | | | | | | | | | | | | | | | | | | |
Futures contracts | | $ | — | | | $ | — | | | $ | 893,427 | | | $ | — | | | $ | — | | | $ | — | | | $ | 893,427 | |
| | | | | | | | | | | | | | | | | | | | | | | | | | | | |
Average Quarterly Balances of Outstanding Derivative Financial Instruments
| | | | |
Futures contracts: | | | | |
Average notional value of contracts — long | | $ | 168,921,800 | |
For more information about the Master Portfolio’s investment risks regarding derivative financial instruments, refer to the Notes to Financial Statements.
Fair Value Hierarchy as of Period End
Various inputs are used in determining the fair value of financial instruments. For a description of the input levels and information about the Master Portfolio’s policy regarding valuation of financial instruments, refer to the Notes to Financial Statements.
The following table summarizes the Master Portfolio’s financial instruments categorized in the fair value hierarchy. The breakdown of the Master Portfolio’s financial instruments into major categories is disclosed in the Schedule of Investments above.
| | | | | | | | | | | | | | | | |
| |
| | | Level 1 | | | Level 2 | | | Level 3 | | | Total | |
| |
Assets | | | | | | | | | | | | | | | | |
Investments | | | | | | | | | | | | | | | | |
Long-Term Investments | | | | | | | | | | | | | | | | |
Common Stocks | | | | | | | | | | | | | | | | |
Aerospace & Defense | | $ | 319,230,409 | | | $ | — | | | $ | — | | | $ | 319,230,409 | |
Air Freight & Logistics | | | 141,636,390 | | | | — | | | | — | | | | 141,636,390 | |
Airlines | | | 48,071,122 | | | | — | | | | — | | | | 48,071,122 | |
Auto Components | | | 42,749,578 | | | | — | | | | — | | | | 42,749,578 | |
Automobiles | | | 559,089,638 | | | | — | | | | — | | | | 559,089,638 | |
Banks | | | 919,997,106 | | | | — | | | | — | | | | 919,997,106 | |
Beverages | | | 321,898,221 | | | | — | | | | — | | | | 321,898,221 | |
Biotechnology | | | 470,596,700 | | | | — | | | | — | | | | 470,596,700 | |
Building Products | | | 157,750,925 | | | | — | | | | — | | | | 157,750,925 | |
Capital Markets | | | 772,395,055 | | | | — | | | | — | | | | 772,395,055 | |
Chemicals | | | 328,139,661 | | | | — | | | | — | | | | 328,139,661 | |
Commercial Services & Supplies | | | 109,308,162 | | | | — | | | | — | | | | 109,308,162 | |
Communications Equipment | | | 215,562,754 | | | | — | | | | — | | | | 215,562,754 | |
Construction & Engineering | | | 19,736,972 | | | | — | | | | — | | | | 19,736,972 | |
Construction Materials | | | 33,126,169 | | | | — | | | | — | | | | 33,126,169 | |
Consumer Finance | | | 142,538,995 | | | | — | | | | — | | | | 142,538,995 | |
Containers & Packaging | | | 90,099,566 | | | | 145,044 | | | | — | | | | 90,244,610 | |
Distributors | | | 30,789,543 | | | | — | | | | — | | | | 30,789,543 | |
Diversified Consumer Services | | | 21,748,704 | | | | — | | | | — | | | | 21,748,704 | |
Diversified Financial Services | | | 304,636,452 | | | | — | | | | — | | | | 304,636,452 | |
Diversified Telecommunication Services | | | 216,529,022 | | | | — | | | | — | | | | 216,529,022 | |
Electric Utilities | | | 367,942,532 | | | | — | | | | — | | | | 367,942,532 | |
Electrical Equipment | | | 162,722,679 | | | | — | | | | — | | | | 162,722,679 | |
Electronic Equipment, Instruments & Components | | | 155,555,221 | | | | — | | | | — | | | | 155,555,221 | |
Energy Equipment & Services | | | 45,670,710 | | | | — | | | | — | | | | 45,670,710 | |
Entertainment | | | 405,226,243 | | | | — | | | | — | | | | 405,226,243 | |
Equity Real Estate Investment Trusts (REITs) | | | 762,917,915 | | | | — | | | | — | | | | 762,917,915 | |
Food & Staples Retailing | | | 318,021,190 | | | | — | | | | — | | | | 318,021,190 | |
Food Products | | | 217,468,799 | | | | — | | | | — | | | | 217,468,799 | |
Gas Utilities | | | 15,519,281 | | | | — | | | | — | | | | 15,519,281 | |
Health Care Equipment & Supplies | | | 683,136,166 | | | | — | | | | — | | | | 683,136,166 | |
Health Care Providers & Services | | | 635,019,807 | | | | — | | | | — | | | | 635,019,807 | |
Health Care Technology | | | 45,194,202 | | | | — | | | | — | | | | 45,194,202 | |
Hotels, Restaurants & Leisure | | | 482,090,344 | | | | — | | | | — | | | | 482,090,344 | |
| | |
MASTER PORTFOLIO SCHEDULE OF INVESTMENTS | | 31 |
| | |
Schedule of Investments (continued) December 31, 2021 | | Large Cap Index Master Portfolio |
Fair Value Hierarchy as of Period End (continued)
| | | | | | | | | | | | | | | | |
| |
| | | Level 1 | | | Level 2 | | | Level 3 | | | Total | |
| |
Common Stocks (continued) | | | | | | | | | | | | | | | | |
Household Durables | | $ | 99,673,988 | | | $ | — | | | $ | — | | | $ | 99,673,988 | |
Household Products | | | 303,952,628 | | | | — | | | | — | | | | 303,952,628 | |
Independent Power and Renewable Electricity Producers | | | 16,939,928 | | | | — | | | | — | | | | 16,939,928 | |
Industrial Conglomerates | | | 215,237,709 | | | | — | | | | — | | | | 215,237,709 | |
Insurance | | | 479,094,903 | | | | — | | | | — | | | | 479,094,903 | |
Interactive Media & Services | | | 1,385,822,778 | | | | — | | | | — | | | | 1,385,822,778 | |
Internet & Direct Marketing Retail | | | 834,089,567 | | | | — | | | | — | | | | 834,089,567 | |
IT Services | | | 1,175,434,726 | | | | — | | | | — | | | | 1,175,434,726 | |
Leisure Products | | | 28,221,861 | | | | — | | | | — | | | | 28,221,861 | |
Life Sciences Tools & Services | | | 480,617,240 | | | | — | | | | — | | | | 480,617,240 | |
Machinery | | | 391,725,528 | | | | — | | | | — | | | | 391,725,528 | |
Marine | | | 1,768,458 | | | | — | | | | — | | | | 1,768,458 | |
Media | | | 256,611,151 | | | | — | | | | — | | | | 256,611,151 | |
Metals & Mining | | | 110,289,382 | | | | — | | | | — | | | | 110,289,382 | |
Mortgage Real Estate Investment Trusts (REITs) | | | 16,101,687 | | | | — | | | | — | | | | 16,101,687 | |
Multiline Retail | | | 113,929,813 | | | | — | | | | — | | | | 113,929,813 | |
Multi-Utilities | | | 160,041,230 | | | | — | | | | — | | | | 160,041,230 | |
Oil, Gas & Consumable Fuels | | | 569,302,857 | | | | — | | | | — | | | | 569,302,857 | |
Paper & Forest Products | | | 4,214,431 | | | | — | | | | — | | | | 4,214,431 | |
Personal Products | | | 50,913,317 | | | | — | | | | — | | | | 50,913,317 | |
Pharmaceuticals | | | 830,776,704 | | | | — | | | | — | | | | 830,776,704 | |
Professional Services | | | 145,657,740 | | | | — | | | | — | | | | 145,657,740 | |
Real Estate Management & Development | | | 40,759,564 | | | | — | | | | — | | | | 40,759,564 | |
Road & Rail | | | 264,225,273 | | | | — | | | | — | | | | 264,225,273 | |
Semiconductors & Semiconductor Equipment | | | 1,442,441,500 | | | | — | | | | — | | | | 1,442,441,500 | |
Software | | | 2,482,348,615 | | | | — | | | | — | | | | 2,482,348,615 | |
Specialty Retail | | | 591,983,341 | | | | — | | | | — | | | | 591,983,341 | |
Technology Hardware, Storage & Peripherals | | | 1,540,252,520 | | | | — | | | | — | | | | 1,540,252,520 | |
Textiles, Apparel & Luxury Goods | | | 185,857,861 | | | | — | | | | — | | | | 185,857,861 | |
Thrifts & Mortgage Finance | | | 7,303,090 | | | | — | | | | — | | | | 7,303,090 | |
Tobacco | | | 126,092,356 | | | | — | | | | — | | | | 126,092,356 | |
Trading Companies & Distributors | | | 64,276,899 | | | | — | | | | — | | | | 64,276,899 | |
Water Utilities | | | 24,593,253 | | | | — | | | | — | | | | 24,593,253 | |
Wireless Telecommunication Services | | | 36,833,624 | | | | — | | | | — | | | | 36,833,624 | |
Investment Companies | | | 229,918,183 | | | | — | | | | — | | | | 229,918,183 | |
Short-Term Securities | | | | | | | | | | | | | | | | |
Money Market Funds | | | 1,812,346,873 | | | | — | | | | — | | | | 1,812,346,873 | |
| | | | | | | | | | | | | | | | |
| | $ | 26,081,766,811 | | | $ | 145,044 | | | $ | — | | | $ | 26,081,911,855 | |
| | | | | | | | | | | | | | | | |
Derivative Financial Instruments(a) | | | | | | | | | | | | | | | | |
Assets | | | | | | | | | | | | | | | | |
Equity Contracts | | $ | 2,577,887 | | | $ | — | | | $ | — | | | $ | 2,577,887 | |
| | | | | | | | | | | | | | | | |
| | (a) | Derivative financial instruments are futures contracts. Futures contracts are valued at the unrealized appreciation (depreciation) on the instrument. | |
| | |
| 32 | | 2 0 2 1 BLACK ROCK ANNUAL REPORT TO SHAREHOLDERS |
Statement of Assets and Liabilities
December 31, 2021
| | | | |
| | | Large Cap Index
Master Portfolio | |
| |
| |
ASSETS | | | | |
Investments, at value — unaffiliated(a)(b) | | $ | 23,969,572,583 | |
Investments, at value — affiliated(c) | | | 2,112,339,272 | |
Cash | | | 47,105 | |
Cash pledged for futures contracts | | | 11,418,100 | |
Receivables: | | | | |
Investments sold | | | 158,649,942 | |
Securities lending income — affiliated | | | 220,085 | |
Dividends — unaffiliated | | | 15,030,339 | |
Dividends — affiliated | | | 839 | |
Variation margin on futures contracts | | | 9,259 | |
Prepaid expenses | | | 94,265 | |
| | | | |
| |
Total assets | | | 26,267,381,789 | |
| | | | |
| |
LIABILITIES | | | | |
Collateral on securities loaned | | | 1,586,485,243 | |
Payables: | | | | |
Investments purchased | | | 11,145,033 | |
Accounting services fees | | | 183,554 | |
Withdrawals to investors | | | 302,757,815 | |
Investment advisory fees | | | 600,219 | |
Trustees’ and Officer’s fees | | | 66,895 | |
Other accrued expenses | | | 23,945 | |
Professional fees | | | 72,246 | |
Variation margin on futures contracts | | | 621,887 | |
| | | | |
| |
Total liabilities | | | 1,901,956,837 | |
| | | | |
| |
NET ASSETS | | $ | 24,365,424,952 | |
| | | | |
| |
NET ASSETS CONSIST OF | | | | |
Investors’ capital | | $ | 12,585,794,976 | |
Net unrealized appreciation (depreciation) | | | 11,779,629,976 | |
| | | | |
| |
NET ASSETS | | $ | 24,365,424,952 | |
| | | | |
| |
(a) Investments, at cost — unaffiliated | | $ | 12,263,666,469 | |
(b) Securities loaned, at value | | $ | 1,549,211,599 | |
(c) Investments, at cost — affiliated | | $ | 2,041,193,297 | |
See notes to financial statements.
| | |
MASTER PORTFOLIO FINANCIAL STATEMENTS | | 33 |
Statement of Operations
Year Ended December 31, 2021
| | | | |
| | | Large Cap Index
Master Portfolio | |
| |
| |
INVESTMENT INCOME | | | | |
Dividends — unaffiliated | | $ | 295,367,417 | |
Dividends — affiliated | | | 3,676,377 | |
Securities lending income — affiliated — net | | | 2,338,108 | |
Foreign taxes withheld | | | (39,869 | ) |
| | | | |
| |
Total investment income | | | 301,342,033 | |
| | | | |
| |
EXPENSES | | | | |
Investment advisory | | | 6,683,405 | |
Custodian | | | 352,728 | |
Trustees and Officer | | | 246,864 | |
Professional | | | 90,577 | |
Miscellaneous | | | 155,947 | |
| | | | |
| |
Total expenses | | | 7,529,521 | |
Less: | | | | |
Fees waived and/or reimbursed by the Manager | | | (168,513 | ) |
| | | | |
| |
Total expenses after fees waived and/or reimbursed | | | 7,361,008 | |
| | | | |
| |
Net investment income | | | 293,981,025 | |
| | | | |
| |
REALIZED AND UNREALIZED GAIN (LOSS) | | | | |
Net realized gain from: | | | | |
Investments — unaffiliated | | | 105,802,020 | |
Investments — affiliated | | | 24,735,733 | |
Futures contracts | | | 33,675,490 | |
| | | | |
| |
| | | 164,213,243 | |
| | | | |
Net change in unrealized appreciation (depreciation) on: | | | | |
Investments — unaffiliated | | | 4,672,508,630 | |
Investments — affiliated | | | 28,311,918 | |
Futures contracts | | | 893,427 | |
| | | | |
| |
| | | 4,701,713,975 | |
| | | | |
| |
Net realized and unrealized gain | | | 4,865,927,218 | |
| | | | |
| |
NET INCREASE IN NET ASSETS RESULTING FROM OPERATIONS | | $ | 5,159,908,243 | |
| | | | |
See notes to financial statements.
| | |
| 34 | | 2 0 2 1 BLACK ROCK ANNUAL REPORT TO SHAREHOLDERS |
Statements of Changes in Net Assets
| | | | | | | | |
| | | Large Cap Index Master Portfolio | |
| | | | |
| |
| | | Year Ended December 31, | |
| | | | |
| | |
| | | 2021 | | | 2020 | |
| |
| | |
INCREASE (DECREASE) IN NET ASSETS | | | | | | | | |
| | |
OPERATIONS | | | | | | | | |
Net investment income | | $ | 293,981,025 | | | $ | 282,019,299 | |
Net realized gain (loss) | | | 164,213,243 | | | | (178,775,993 | ) |
Net change in unrealized appreciation (depreciation) | | | 4,701,713,975 | | | | 3,322,308,344 | |
| | | | | | | | |
| | |
Net increase in net assets resulting from operations | | | 5,159,908,243 | | | | 3,425,551,650 | |
| | | | | | | | |
| | |
CAPITAL TRANSACTIONS | | | | | | | | |
Proceeds from contributions | | | 3,037,786,941 | | | | 3,317,046,361 | |
Value of withdrawals | | | (3,164,855,949 | ) | | | (2,551,746,165 | ) |
| | | | | | | | |
| | |
Net increase (decrease) in net assets derived from capital transactions | | | (127,069,008 | ) | | | 765,300,196 | |
| | | | | | | | |
| | |
NET ASSETS | | | | | | | | |
Total increase in net assets | | | 5,032,839,235 | | | | 4,190,851,846 | |
Beginning of year | | | 19,332,585,717 | | | | 15,141,733,871 | |
| | | | | | | | |
| | |
End of year | | $ | 24,365,424,952 | | | $ | 19,332,585,717 | |
| | | | | | | | |
See notes to financial statements.
| | |
MASTER PORTFOLIO FINANCIAL STATEMENTS | | 35 |
Financial Highlights
| | | | | | | | | | | | | | | | | | | | |
| | | Large Cap Index Master Portfolio | |
| |
| | | Year Ended December 31, | |
| | | | |
| | | | | |
| | | 2021 | | | 2020 | | | 2019 | | | 2018 | | | 2017 | |
| |
| | | | | |
Total Return | | | | | | | | | | | | | | | | | | | | |
Total return | | | 26.42 | % | | | 20.89 | % | | | 31.33 | % | | | (4.81 | )% | | | 21.65 | % |
| | | | | | | | | | | | | | | | | | | | |
| | | | | |
Ratios to Average Net Assets(a) | | | | | | | | | | | | | | | | | | | | |
Total expenses | | | 0.03 | % | | | 0.04 | % | | | 0.03 | % | | | 0.04 | % | | | 0.04 | % |
| | | | | | | | | | | | | | | | | | | | |
| | | | | |
Total expenses after fees waived and/or reimbursed | | | 0.03 | % | | | 0.03 | % | | | 0.03 | % | | | 0.03 | % | | | 0.04 | % |
| | | | | | | | | | | | | | | | | | | | |
| | | | | |
Net investment income | | | 1.32 | % | | | 1.76 | % | | | 1.92 | % | | | 1.97 | % | | | 1.92 | % |
| | | | | | | | | | | | | | | | | | | | |
| | | | | |
Supplemental Data | | | | | | | | | | | | | | | | | | | | |
Net assets, end of year (000) | | $ | 24,365,425 | | | $ | 19,332,586 | | | $ | 15,141,734 | | | $ | 10,279,955 | | | $ | 6,697,020 | |
| | | | | | | | | | | | | | | | | | | | |
| | | | | |
Portfolio turnover rate. | | | 17 | % | | | 14 | % | | | 10 | % | | | 12 | % | | | 12 | % |
| | | | | | | | | | | | | | | | | | | | |
| (a) | Excludes fees and expenses incurred indirectly as a result of investments in underlying funds. |
See notes to financial statements.
| | |
| 36 | | 2 0 2 1 BLACK ROCK ANNUAL REPORT TO SHAREHOLDERS |
Notes to Financial Statements
Master Investment Portfolio (“MIP”) is registered under the Investment Company Act of 1940, as amended (the “1940 Act”), as an open-end management investment company. MIP is organized as a Delaware statutory trust. Large Cap Index Master Portfolio (the “Master Portfolio”) is a series of MIP. The Master Portfolio is classified as diversified.
The Master Portfolio, together with certain other registered investment companies advised by BlackRock Fund Advisors (“BFA” or the “Manager”) or its affiliates, is included in a complex of open-end equity, multi-asset, index and money market funds referred to as the BlackRock Multi-Asset Complex.
| 2. | SIGNIFICANT ACCOUNTING POLICIES |
The financial statements are prepared in conformity with accounting principles generally accepted in the United States of America (“U.S. GAAP”), which may require management to make estimates and assumptions that affect the reported amounts of assets and liabilities in the financial statements, disclosure of contingent assets and liabilities at the date of the financial statements and the reported amounts of increases and decreases in net assets from operations during the reporting period. Actual results could differ from those estimates. The Master Portfolio is considered an investment company under U.S. GAAP and follows the accounting and reporting guidance applicable to investment companies. Below is a summary of significant accounting policies:
Investment Transactions and Income Recognition: For financial reporting purposes, investment transactions are recorded on the dates the transactions are executed. Realized gains and losses on investment transactions are determined using the specific identification method. Dividend income and capital gain distributions, if any, are recorded on the ex-dividend dates. Non-cash dividends, if any, are recorded on the ex-dividend dates at fair value. Dividends from foreign securities where the ex-dividend dates may have passed are subsequently recorded when the Master Portfolio is informed of the ex-dividend dates. Under the applicable foreign tax laws, a withholding tax at various rates may be imposed on capital gains, dividends and interest. Upon notification from issuers, a portion of the dividend income received from a real estate investment trust may be redesignated as a reduction of cost of the related investment and/or realized gain.
Foreign Taxes: The Master Portfolio may be subject to foreign taxes (a portion of which may be reclaimable) on income, stock dividends, capital gains on investments, or certain foreign currency transactions. All foreign taxes are recorded in accordance with the applicable foreign tax regulations and rates that exist in the foreign jurisdictions in which the Master Portfolio invests. These foreign taxes, if any, are paid by the Master Portfolio and are reflected in its Statement of Operations as follows: foreign taxes withheld at source are presented as a reduction of income, foreign taxes on securities lending income are presented as a reduction of securities lending income, foreign taxes on stock dividends are presented as “Foreign taxes withheld”, and foreign taxes on capital gains from sales of investments and foreign taxes on foreign currency transactions are included in their respective net realized gain (loss) categories. Foreign taxes payable or deferred as of December 31, 2021, if any, are disclosed in the Statement of Assets and Liabilities.
The Master Portfolio files withholding tax reclaims in certain jurisdictions to recover a portion of amounts previously withheld. The Master Portfolio may record a reclaim receivable based on collectability, which includes factors such as the jurisdiction’s applicable laws, payment history and market convention. The Statement of Operations includes tax reclaims recorded as well as professional and other fees, if any, associated with recovery of foreign withholding taxes.
Segregation and Collateralization: In cases where the Master Portfolio enters into certain investments (e.g., futures contracts) that would be treated as “senior securities” for 1940 Act purposes, the Master Portfolio may segregate or designate on its books and records cash or liquid assets having a market value at least equal to the amount of its future obligations under such investments. Doing so allows the investments to be excluded from treatment as a “senior security.” Furthermore, if required by an exchange or counterparty agreement, the Master Portfolio may be required to deliver/deposit cash and/or securities to/with an exchange, or broker-dealer or custodian as collateral for certain investments or obligations.
Indemnifications: In the normal course of business, the Master Portfolio enters into contracts that contain a variety of representations that provide general indemnification. The Master Portfolio’s maximum exposure under these arrangements is unknown because it involves future potential claims against the Master Portfolio, which cannot be predicted with any certainty.
Other: Expenses directly related to the Master Portfolio are charged to the Master Portfolio. Other operating expenses shared by several funds, including other funds managed by the Manager, are prorated among those funds on the basis of relative net assets or other appropriate methods.
| 3. | INVESTMENT VALUATION AND FAIR VALUE MEASUREMENTS |
Investment Valuation Policies: The Master Portfolio’s investments are valued at fair value (also referred to as “market value” within the financial statements) each day that the Master Portfolio is open for business and, for financial reporting purposes, as of the report date. U.S. GAAP defines fair value as the price a fund would receive to sell an asset or pay to transfer a liability in an orderly transaction between market participants at the measurement date. The Master Portfolio determines the fair values of its financial instruments using various independent dealers or pricing services under policies approved by the Board of Trustees of the MIP (the “Board”). If a security’s market price is not readily available or does not otherwise accurately represent the fair value of the security, the security will be valued in accordance with a policy approved by the Board as reflecting fair value. The BlackRock Global Valuation Methodologies Committee (the “Global Valuation Committee”) is the committee formed by management to develop global pricing policies and procedures and to oversee the pricing function for all financial instruments.
| | |
MASTER PORTFOLIO NOTES TO FINANCIAL STATEMENTS | | 37 |
Notes to Financial Statements (continued)
Fair Value Inputs and Methodologies: The following methods and inputs are used to establish the fair value of the Master Portfolio’s assets and liabilities:
| | • | | Equity investments traded on a recognized securities exchange are valued at that day’s official closing price, as applicable, on the exchange where the stock is primarily traded. Equity investments traded on a recognized exchange for which there were no sales on that day may be valued at the last available bid (long positions) or ask (short positions) price. |
| | • | | Investments in open-end U.S. mutual funds (including money market funds) are valued at that day’s published net asset value (“NAV”). |
| | • | | Futures contracts are valued based on that day’s last reported settlement or trade price on the exchange where the contract is traded. |
Generally, trading in foreign instruments is substantially completed each day at various times prior to the close of trading on the New York Stock Exchange (“NYSE”). Each business day, the Master Portfolio uses current market factors supplied by independent pricing services to value certain foreign instruments (“Systematic Fair Value Price”). The Systematic Fair Value Price is designed to value such foreign securities at fair value as of the close of trading on the NYSE, which follows the close of the local markets.
If events (e.g., market volatility, company announcement or a natural disaster) occur that are expected to materially affect the value of such investment, or in the event that application of these methods of valuation results in a price for an investment that is deemed not to be representative of the market value of such investment, or if a price is not available, the investment will be valued by the Global Valuation Committee, or its delegate, in accordance with a policy approved by the Board as reflecting fair value (“Fair Valued Investments”). The fair valuation approaches that may be used by the Global Valuation Committee include market approach, income approach and cost approach. Valuation techniques such as discounted cash flow, use of market comparables and matrix pricing are types of valuation approaches and are typically used in determining fair value. When determining the price for Fair Valued Investments, the Global Valuation Committee, or its delegate, seeks to determine the price that the Master Portfolio might reasonably expect to receive or pay from the current sale or purchase of that asset or liability in an arm’s-length transaction. Fair value determinations shall be based upon all available factors that the Global Valuation Committee, or its delegate, deems relevant and consistent with the principles of fair value measurement. The pricing of all Fair Valued Investments is subsequently reported to the Board or a committee thereof on a quarterly basis.
Fair Value Hierarchy: Various inputs are used in determining the fair value of financial instruments. These inputs to valuation techniques are categorized into a fair value hierarchy consisting of three broad levels for financial reporting purposes as follows:
| | • | | Level 1 – Unadjusted price quotations in active markets/exchanges for identical assets or liabilities that the Master Portfolio has the ability to access; |
| | • | | Level 2 – Other observable inputs (including, but not limited to, quoted prices for similar assets or liabilities in markets that are active, quoted prices for identical or similar assets or liabilities in markets that are not active, inputs other than quoted prices that are observable for the assets or liabilities (such as interest rates, yield curves, volatilities, prepayment speeds, loss severities, credit risks and default rates) or other market-corroborated inputs); and |
| | • | | Level 3 – Unobservable inputs based on the best information available in the circumstances, to the extent observable inputs are not available (including the Global Valuation Committee’s assumptions used in determining the fair value of financial instruments). |
The hierarchy gives the highest priority to unadjusted quoted prices in active markets for identical assets or liabilities (Level 1 measurements) and the lowest priority to unobservable inputs (Level 3 measurements). Accordingly, the degree of judgment exercised in determining fair value is greatest for instruments categorized in Level 3. The inputs used to measure fair value may fall into different levels of the fair value hierarchy. In such cases, for disclosure purposes, the fair value hierarchy classification is determined based on the lowest level input that is significant to the fair value measurement in its entirety. Investments classified within Level 3 have significant unobservable inputs used by the Global Valuation Committee in determining the price for Fair Valued Investments. Level 3 investments include equity or debt issued by privately held companies or funds that may not have a secondary market and/or may have a limited number of investors. The categorization of a value determined for financial instruments is based on the pricing transparency of the financial instruments and is not necessarily an indication of the risks associated with investing in those securities.
| 4. | SECURITIES AND OTHER INVESTMENTS |
Securities Lending: The Master Portfolio may lend its securities to approved borrowers, such as brokers, dealers and other financial institutions. The borrower pledges and maintains with the Master Portfolio collateral consisting of cash, an irrevocable letter of credit issued by a bank, or securities issued or guaranteed by the U.S. Government. The initial collateral received by the Master Portfolio is required to have a value of at least 102% of the current value of the loaned securities for securities traded on U.S. exchanges and a value of at least 105% for all other securities. The collateral is maintained thereafter at a value equal to at least 100% of the current market value of the securities on loan. The market value of the loaned securities is determined at the close of each business day of the Master Portfolio and any additional required collateral is delivered to the Master Portfolio, or excess collateral returned by the Master Portfolio, on the next business day. During the term of the loan, the Master Portfolio is entitled to all distributions made on or in respect of the loaned securities, but does not receive interest income on securities received as collateral. Loans of securities are terminable at any time and the borrower, after notice, is required to return borrowed securities within the standard time period for settlement of securities transactions.
As of period end, any securities on loan were collateralized by cash and/or U.S. Government obligations. Cash collateral invested by the securities lending agent, BlackRock Institutional Trust Company, N.A. (“BTC”), if any, is disclosed in the Schedule of Investments. Any non-cash collateral received cannot be sold, re-invested or pledged by the Master Portfolio, except in the event of borrower default. The securities on loan, if any, are disclosed in the Master Portfolio’s Schedule of Investments. The market value of any securities on loan and the value of any related collateral are shown separately in the Statement of Assets and Liabilities as a component of investments at value –unaffiliated and collateral on securities loaned at value, respectively.
Securities lending transactions are entered into by the Master Portfolio under Master Securities Lending Agreements (each, an “MSLA”), which provide the right, in the event of default (including bankruptcy or insolvency), for the non-defaulting party to liquidate the collateral and calculate a net exposure to the defaulting party or request additional collateral. In the event that a borrower defaults, the Master Portfolio, as lender, would offset the market value of the collateral received against the market value of the securities
| | |
| 38 | | 2 0 2 1 BLACK ROCK ANNUAL REPORT TO SHAREHOLDERS |
Notes to Financial Statements (continued)
loaned. When the value of the collateral is greater than that of the market value of the securities loaned, the lender is left with a net amount payable to the defaulting party. However, bankruptcy or insolvency laws of a particular jurisdiction may impose restrictions on or prohibitions against such a right of offset in the event of an MSLA counterparty’s bankruptcy or insolvency. Under the MSLA, absent an event of default, the borrower can resell or re-pledge the loaned securities, and the Master Portfolio can reinvest cash collateral received in connection with loaned securities. Upon an event of default, the parties’ obligations to return the securities or collateral to the other party are extinguished, and the parties can resell or re-pledge the loaned securities or the collateral received in connection with the loaned securities in order to satisfy the defaulting party’s net payment obligation for all transactions under the MSLA. The defaulting party remains liable for any deficiency.
As of period end, the following table is a summary of the Master Portfolio’s securities on loan by counterparty which are subject to offset under an MSLA:
| | | | | | | | | | | | | | | | |
| |
Counterparty | |
| Securities
Loaned at Value |
| |
| Cash Collateral
Received |
(a) | |
| Non-Cash Collateral
Received at Fair Value |
(a) | |
| Net
Amount |
|
| |
Barclays Bank PLC | | $ | 117,603,882 | | | $ | (117,603,882 | ) | | | $ — | | | $ | — | |
Barclays Capital, Inc. | | | 23,193,785 | | | | (23,193,785 | ) | | | — | | | | — | |
BNP Paribas SA | | | 718,335,411 | | | | (718,335,411 | ) | | | — | | | | — | |
BofA Securities, Inc. | | | 24,384,339 | | | | (24,384,339 | ) | | | — | | | | — | |
Citadel Clearing LLC | | | 2,781,521 | | | | (2,781,521 | ) | | | — | | | | — | |
Credit Suisse Securities (USA) LLC | | | 12,531,595 | | | | (12,531,595 | ) | | | — | | | | — | |
Deutsche Bank Securities, Inc. | | | 885,161 | | | | (885,161 | ) | | | — | | | | — | |
Goldman Sachs & Co. LLC | | | 138,046,758 | | | | (138,046,758 | ) | | | — | | | | — | |
HSBC Bank PLC | | | 21,097,711 | | | | (21,097,711 | ) | | | — | | | | — | |
Jefferies LLC | | | 4,679,702 | | | | (4,679,702 | ) | | | — | | | | — | |
JPMorgan Securities LLC | | | 188,774,217 | | | | (188,774,217 | ) | | | — | | | | — | |
Morgan Stanley | | | 83,143,665 | | | | (83,143,665 | ) | | | — | | | | — | |
Natixis S.A. | | | 28,096 | | | | (28,096 | ) | | | — | | | | — | |
Nomura Securities International, Inc. | | | 580,322 | | | | (580,322 | ) | | | — | | | | — | |
Pershing LLC | | | 10,014 | | | | (10,014 | ) | | | — | | | | — | |
Scotia Capital (USA), Inc. | | | 27,960,032 | | | | (27,960,032 | ) | | | — | | | | — | |
SG Americas Securities LLC | | | 43,149,589 | | | | (43,149,589 | ) | | | — | | | | — | |
State Street Bank & Trust Co. | | | 23,293,515 | | | | (23,293,515 | ) | | | — | | | | — | |
Toronto Dominion Bank | | | 2,030,045 | | | | (2,030,045 | ) | | | — | | | | — | |
UBS AG | | | 58,457,047 | | | | (58,457,047 | ) | | | — | | | | — | |
UBS Securities LLC | | | 46,509,417 | | | | (46,509,417 | ) | | | — | | | | — | |
Virtu Americas LLC | | | 4,650,600 | | | | (4,650,600 | ) | | | — | | | | — | |
Wells Fargo Bank N.A. | | | 4,250,371 | | | | (4,250,371 | ) | | | — | | | | — | |
Wells Fargo Securities LLC | | | 2,834,804 | | | | (2,834,804 | ) | | | — | | | | — | |
| | | | | | | | | | | | | | | | |
| | $ | 1,549,211,599 | | | $ | (1,549,211,599 | ) | | | $ — | | | $ | — | |
| | | | | | | | | | | | | | | | |
| | (a) | Collateral received in excess of the market value of securities on loan is not presented in this table. The total cash collateral received by the Master Portfolio is disclosed in the Master Portfolio’s Statement of Assets and Liabilities. | |
The risks of securities lending include the risk that the borrower may not provide additional collateral when required or may not return the securities when due. To mitigate these risks, the Master Portfolio benefits from a borrower default indemnity provided by BlackRock, Inc. (“BlackRock”). BlackRock’s indemnity allows for full replacement of the securities loaned to the extent the collateral received does not cover the value on the securities loaned in the event of borrower default. The Master Portfolio could incur a loss if the value of an investment purchased with cash collateral falls below the market value of loaned securities or if the value of an investment purchased with cash collateral falls below the value of the original cash collateral received. Such losses are borne entirely by the Master Portfolio.
| 5. | DERIVATIVE FINANCIAL INSTRUMENTS |
The Master Portfolio engages in various portfolio investment strategies using derivative contracts both to increase the returns of the Master Portfolio and/or to manage its exposure to certain risks such as credit risk, equity risk, interest rate risk, foreign currency exchange rate risk, commodity price risk or other risks (e.g., inflation risk). Derivative financial instruments categorized by risk exposure are included in the Schedule of Investments. These contracts may be transacted on an exchange or over-the-counter (“OTC”).
Futures Contracts: Futures contracts are purchased or sold to gain exposure to, or manage exposure to, changes in interest rates (interest rate risk) and changes in the value of equity securities (equity risk) or foreign currencies (foreign currency exchange rate risk).
Futures contracts are exchange-traded agreements between the Master Portfolio and a counterparty to buy or sell a specific quantity of an underlying instrument at a specified price and on a specified date. Depending on the terms of a contract, it is settled either through physical delivery of the underlying instrument on the settlement date or by payment of a cash amount on the settlement date. Upon entering into a futures contract, the Master Portfolio is required to deposit initial margin with the broker in the form of cash or securities in an amount that varies depending on a contract’s size and risk profile. The initial margin deposit must then be maintained at an established level over the life of the contract. Amounts pledged, which are considered restricted, are included in cash pledged for futures contracts in the Statement of Assets and Liabilities.
Securities deposited as initial margin are designated in the Schedule of Investments and cash deposited, if any, are shown as cash pledged for futures contracts in the Statement of Assets and Liabilities. Pursuant to the contract, the Master Portfolio agrees to receive from or pay to the broker an amount of cash equal to the daily fluctuation in market value of the contract (“variation margin”). Variation margin is recorded as unrealized appreciation (depreciation) and, if any, shown as variation margin receivable (or payable) on futures contracts in the Statement of Assets and Liabilities. When the contract is closed, a realized gain or loss is recorded in the Statement of Operations equal
| | |
MASTER PORTFOLIO NOTES TO FINANCIAL STATEMENTS | | 39 |
Notes to Financial Statements (continued)
to the difference between the notional amount of the contract at the time it was opened and the notional amount at the time it was closed. The use of futures contracts involves the risk of an imperfect correlation in the movements in the price of futures contracts and interest rates, foreign currency exchange rates or underlying assets.
| 6. | INVESTMENT ADVISORY AGREEMENT AND OTHER TRANSACTIONS WITH AFFILIATES |
Investment Advisory: MIP, on behalf of the Master Portfolio, entered into an Investment Advisory Agreement with the Manager, the Master Portfolio’s investment adviser and an indirect, wholly-owned subsidiary of BlackRock, to provide investment advisory services. The Manager is responsible for the management of the Master Portfolio’s portfolio and provides the personnel, facilities, equipment and certain other services necessary to the operations of the Master Portfolio.
For such services, the Master Portfolio pays the Manager a monthly fee at an annual rate equal to 0.03% of the average daily value of the Master Portfolio’s net assets.
BlackRock Advisors, LLC (“BAL”) is not entitled to compensation for providing administrative services to the Master Portfolio, for so long as BAL (or an affiliate) is entitled to compensation for providing administrative services to corresponding feeder funds that invest substantially all of their assets in the Master Portfolio, or BAL (or an affiliate) receives investment advisory fees from the Master Portfolio.
Expense Limitations, Waivers and Reimbursements: The Manager contractually agreed to waive its investment advisory fees by the amount of investment advisory fees the Master Portfolio pays to the Manager indirectly through its investment in affiliated money market funds (the “affiliated money market fund waiver”) through June 30, 2023. The contractual agreement may be terminated upon 90 days’ notice by a majority of the trustees who are not “interested persons” of MIP, as defined in the 1940 Act (“Independent Trustees”), or by a vote of a majority of the outstanding voting securities of the Master Portfolio. This amount is included in fees waived and/or reimbursed by the Manager in the Statement of Operations. For the year ended December 31, 2021, the Manager waived $112,061 in investment advisory fees pursuant to this arrangement.
The Manager has contractually agreed to waive its investment advisory fee with respect to any portion of the Master Portfolio’s assets invested in affiliated equity and fixed-income mutual funds and affiliated exchange-traded funds that have a contractual management fee through June 30, 2023. The contractual agreement may be terminated upon 90 days’ notice by a majority of the Independent Trustees, or by a vote of a majority of the outstanding voting securities of the Master Portfolio. This amount is included in fees waived and/or reimbursed by the Manager in the Statement of Operations. For the year ended December 31, 2021, the Manager waived $56,452 in investment advisory fees pursuant to this arrangement.
Securities Lending: The U.S. Securities and Exchange Commission (“SEC”) has issued an exemptive order which permits BTC, an affiliate of the Manager, to serve as securities lending agent for the Master Portfolio, subject to applicable conditions. As securities lending agent, BTC bears all operational costs directly related to securities lending, including any custodial costs. The Master Portfolio is responsible for fees in connection with the investment of cash collateral received for securities on loan (the “collateral investment fees”). The cash collateral is invested in a money market fund, BlackRock Cash Funds: Institutional or BlackRock Cash Funds: Treasury, managed by the Manager or its affiliates. However, BTC has agreed to reduce the amount of securities lending income it receives in order to effectively limit the collateral investment fees the Master Portfolio bears to an annual rate of 0.04%. The SL Agency Shares of such money market fund will not be subject to a sales load, distribution fee or service fee. The money market fund in which the cash collateral has been invested may, under certain circumstances, impose a liquidity fee of up to 2% of the value redeemed or temporarily restrict redemptions for up to 10 business days during a 90 day period, in the event that the money market fund’s weekly liquid assets fall below certain thresholds.
Securities lending income is equal to the total of income earned from the reinvestment of cash collateral, net of fees and other payments to and from borrowers of securities, and less the collateral investment fees. The Master Portfolio retains a portion of securities lending income and remits a remaining portion to BTC as compensation for its services as securities lending agent.
Pursuant to the current securities lending agreement, the Master Portfolio retains 77% of securities lending income (which excludes collateral investment fees), and this amount retained can never be less than 70% of the total of securities lending income plus the collateral investment fees.
In addition, commencing the business day following the date that the aggregate securities lending income earned across the BlackRock Multi-Asset Complex in a calendar year exceeds a specified threshold, the Master Portfolio, pursuant to the securities lending agreement, will retain for the remainder of that calendar year securities lending income in an amount equal to 81% of securities lending income (which excludes collateral investment fees), and this amount retained can never be less than 70% of the total of securities lending income plus the collateral investment fees.
The share of securities lending income earned by the Master Portfolio is shown as securities lending income — affiliated — net in the Statement of Operations. For the year ended December 31, 2021, the Master Portfolio paid BTC $972,452 for securities lending agent services.
Interfund Lending: In accordance with an exemptive order (the “Order”) from the SEC, the Master Portfolio may participate in a joint lending and borrowing facility for temporary purposes (the “Interfund Lending Program”), subject to compliance with the terms and conditions of the Order, and to the extent permitted by the Master Portfolio’s investment policies and restrictions. The Master Portfolio is currently permitted to borrow and lend under the Interfund Lending Program.
A lending BlackRock fund may lend in aggregate up to 15% of its net assets but may not lend more than 5% of its net assets to any one borrowing fund through the Interfund Lending Program. A borrowing BlackRock fund may not borrow through the Interfund Lending Program or from any other source more than 33 1/3% of its total assets (or any lower threshold provided for by the fund’s investment restrictions). If a borrowing BlackRock fund’s total outstanding borrowings exceed 10% of its total assets, each of its outstanding interfund loans will be subject to collateralization of at least 102% of the outstanding principal value of the loan. All interfund loans are for temporary or emergency purposes and the interest rate to be charged will be the average of the highest current overnight repurchase agreement rate available to a lending fund and the bank loan rate, as calculated according to a formula established by the Board.
| | |
| 40 | | 2 0 2 1 BLACK ROCK ANNUAL REPORT TO SHAREHOLDERS |
Notes to Financial Statements (continued)
During the year ended December 31, 2021, the Master Portfolio did not participate in the Interfund Lending Program.
Trustees and Officers: Certain trustees and/or officers of the Master Portfolio are directors and/or officers of BlackRock or its affiliates.
Other Transactions: The Master Portfolio may purchase securities from, or sell securities to, an affiliated fund provided the affiliation is due solely to having a common investment adviser, common officers, or common trustees. For the year ended December 31, 2021, the purchase and sale transactions and any net realized gains (losses) with affiliated funds in compliance with Rule 17a-7 under the 1940 Act were as follows:
| | | | | | | | | | | | |
| |
| Master Portfolio Name | | Purchases | | | Sales | | | Net Realized
Gain (Loss) | |
| |
Large Cap Index Master Portfolio. | | $ | 466,924,573 | | | $ | 672,575,697 | | | $ | (5,396,939 | ) |
| |
For the year ended December 31, 2021, purchases and sales of investments, excluding short-term investments, were $3,809,261,558 and $3,605,709,042, respectively.
The Master Portfolio is classified as a partnership for U.S. federal income tax purposes. As such, each investor in the Master Portfolio is treated as the owner of its proportionate share of net assets, income, expenses and realized and unrealized gains and losses of the Master Portfolio. Therefore, no U.S. federal income tax provision is required. It is intended that the Master Portfolio’s assets will be managed so an investor in the Master Portfolio can satisfy the requirements of Subchapter M of the Internal Revenue Code of 1986, as amended.
The Master Portfolio files U.S. federal and various state and local tax returns. No income tax returns are currently under examination. The statute of limitations on the Master Portfolio’s U.S. federal tax returns generally remains open for a period of three fiscal years after they are filed. The statutes of limitations on the Master Portfolio’s state and local tax returns may remain open for an additional year depending upon the jurisdiction.
Management has analyzed tax laws and regulations and their application to the Master Portfolio as of December 31, 2021, inclusive of the open tax return years, and does not believe that there are any uncertain tax positions that require recognition of a tax liability in the Master Portfolio’s financial statements.
As of December 31, 2021, gross unrealized appreciation and depreciation based on cost of investments (including short positions and derivatives, if any) for U.S. federal income tax purposes were as follows:
| | | | | | | | | | | | | | | | |
| |
| Master Portfolio Name | | Tax Cost | | | Gross Unrealized
Appreciation | | | Gross Unrealized
Depreciation | | | Net Unrealized
Appreciation
(Depreciation) | |
| |
Large Cap Index Master Portfolio | | $ | 14,706,336,512 | | | $ | 12,101,875,803 | | | $ | (726,300,460 | ) | | $ | 11,375,575,343 | |
| | | | | | | | | | | | | | | | |
MIP, on behalf of the Master Portfolio, along with certain other funds managed by the Manager and its affiliates (“Participating Funds”), is a party to a 364-day, $2.25 billion credit agreement with a group of lenders. Under this agreement, the Master Portfolio may borrow to fund shareholder redemptions. Excluding commitments designated for certain individual funds, the Participating Funds, including the Master Portfolio, can borrow up to an aggregate commitment amount of $1.75 billion at any time outstanding, subject to asset coverage and other limitations as specified in the agreement. The credit agreement has the following terms: a fee of 0.10% per annum on unused commitment amounts and interest at a rate equal to the higher of (a) one-month London Interbank Offered Rate (“LIBOR”) (but, in any event, not less than 0.00%) on the date the loan is made plus 0.80% per annum or (b) the Fed Funds rate (but, in any event, not less than 0.00%) in effect from time to time plus 0.80% per annum on amounts borrowed. The agreement expires in April 2022 unless extended or renewed. These fees were allocated among such funds based upon portions of the aggregate commitment available to them and relative net assets of Participating Funds. During the year ended December 31, 2021, the Master Portfolio did not borrow under the credit agreement.
In the normal course of business, the Master Portfolio invests in securities or other instruments and may enter into certain transactions, and such activities subject the Master Portfolio to various risks, including among others, fluctuations in the market (market risk) or failure of an issuer to meet all of its obligations. The value of securities or other instruments may also be affected by various factors, including, without limitation: (i) the general economy; (ii) the overall market as well as local, regional or global political and/or social instability; (iii) regulation, taxation or international tax treaties between various countries; or (iv) currency, interest rate and price fluctuations. Local, regional or global events such as war, acts of terrorism, the spread of infectious illness or other public health issues, recessions, or other events could have a significant impact on the Master Portfolio and its investments. The Master Portfolio’s prospectus provides details of the risks to which the Master Portfolio is subject.
BFA uses a “passive” or index approach to try to achieve the Master Portfolio’s investment objective following the securities included in its underlying index during upturns as well as downturns. BFA does not take steps to reduce market exposure or to lessen the effects of a declining market. Divergence from the underlying index and the composition of the portfolio is monitored by BFA.
| | |
MASTER PORTFOLIO NOTES TO FINANCIAL STATEMENTS | | 41 |
Notes to Financial Statements (continued)
The Master Portfolio may be exposed to additional risks when reinvesting cash collateral in money market funds that do not seek to maintain a stable NAV per share of $1.00, which may be subject to redemption gates or liquidity fees under certain circumstances.
Market Risk: An outbreak of respiratory disease caused by a novel coronavirus has developed into a global pandemic and has resulted in closing borders, quarantines, disruptions to supply chains and customer activity, as well as general concern and uncertainty. The impact of this pandemic, and other global health crises that may arise in the future, could affect the economies of many nations, individual companies and the market in general in ways that cannot necessarily be foreseen at the present time. This pandemic may result in substantial market volatility and may adversely impact the prices and liquidity of a fund’s investments. The duration of this pandemic and its effects cannot be determined with certainty.
Valuation Risk: The market values of equities, such as common stocks and preferred securities or equity related investments, such as futures and options, may decline due to general market conditions which are not specifically related to a particular company. They may also decline due to factors which affect a particular industry or industries. The Master Portfolio may invest in illiquid investments. An illiquid investment is any investment that the Master Portfolio reasonably expects cannot be sold or disposed of in current market conditions in seven calendar days or less without the sale or disposition significantly changing the market value of the investment. The Master Portfolio may experience difficulty in selling illiquid investments in a timely manner at the price that it believes the investments are worth. Prices may fluctuate widely over short or extended periods in response to company, market or economic news. Markets also tend to move in cycles, with periods of rising and falling prices. This volatility may cause the Master Portfolio’s NAV to experience significant increases or decreases over short periods of time. If there is a general decline in the securities and other markets, the NAV of the Master Portfolio may lose value, regardless of the individual results of the securities and other instruments in which the Master Portfolio invests.
Counterparty Credit Risk: The Master Portfolio may be exposed to counterparty credit risk, or the risk that an entity may fail to or be unable to perform on its commitments related to unsettled or open transactions, including making timely interest and/or principal payments or otherwise honoring its obligations. The Master Portfolio manages counterparty credit risk by entering into transactions only with counterparties that the Manager believes have the financial resources to honor their obligations and by monitoring the financial stability of those counterparties. Financial assets, which potentially expose the Master Portfolio to market, issuer and counterparty credit risks, consist principally of financial instruments and receivables due from counterparties. The extent of the Master Portfolio’s exposure to market, issuer and counterparty credit risks with respect to these financial assets is approximately their value recorded in the Statement of Assets and Liabilities, less any collateral held by the Master Portfolio.
A derivative contract may suffer a mark-to-market loss if the value of the contract decreases due to an unfavorable change in the market rates or values of the underlying instrument. Losses can also occur if the counterparty does not perform under the contract.
With exchange-traded futures, there is less counterparty credit risk to the Master Portfolio since the exchange or clearinghouse, as counterparty to such instruments, guarantees against a possible default. The clearinghouse stands between the buyer and the seller of the contract; therefore, credit risk is limited to failure of the clearinghouse. While offset rights may exist under applicable law, the Master Portfolio does not have a contractual right of offset against a clearing broker or clearinghouse in the event of a default (including the bankruptcy or insolvency). Additionally, credit risk exists in exchange-traded futures with respect to initial and variation margin that is held in a clearing broker’s customer accounts. While clearing brokers are required to segregate customer margin from their own assets, in the event that a clearing broker becomes insolvent or goes into bankruptcy and at that time there is a shortfall in the aggregate amount of margin held by the clearing broker for all its clients, typically the shortfall would be allocated on a pro rata basis across all the clearing broker’s customers, potentially resulting in losses to the Master Portfolio.
Concentration Risk: A diversified portfolio, where this is appropriate and consistent with a fund’s objectives, minimizes the risk that a price change of a particular investment will have a material impact on the NAV of a fund. The investment concentrations within the Master Portfolio’s portfolio are disclosed in its Schedule of Investments.
The Master Portfolio invests a significant portion of its assets in securities within a single or limited number of market sectors. When a Master Portfolio concentrates its investments in this manner, it assumes the risk that economic, regulatory, political and social conditions affecting such sectors may have a significant impact on the Master Portfolio and could affect the income from, or the value or liquidity of, the Master Portfolio’s portfolio. Investment percentages in specific sectors are presented in the Schedule of Investments.
LIBOR Transition Risk: The United Kingdom’s Financial Conduct Authority announced a phase out of the LIBOR. Although many LIBOR rates will cease to be published or no longer will be representative of the underlying market they seek to measure after December 31, 2021, a selection of widely used USD LIBOR rates will continue to be published through June 2023 in order to assist with the transition. The Master Portfolio may be exposed to financial instruments tied to LIBOR to determine payment obligations, financing terms, hedging strategies or investment value. The transition process away from LIBOR might lead to increased volatility and illiquidity in markets for, and reduce the effectiveness of new hedges placed against instruments whose terms currently include LIBOR. The ultimate effect of the LIBOR transition process on the Master Portfolio is uncertain.
Management has evaluated the impact of all subsequent events on the Master Portfolio through the date the financial statements were issued and has determined that there were no subsequent events requiring adjustment or additional disclosure in the financial statements.
| | |
| 42 | | 2 0 2 1 BLACK ROCK ANNUAL REPORT TO SHAREHOLDERS |
Report of Independent Registered Public Accounting Firm
To the Board of Trustees of Master Investment Portfolio and Investors of Large Cap Index Master Portfolio
Opinion on the Financial Statements
We have audited the accompanying statement of assets and liabilities, including the schedule of investments, of Large Cap Index Master Portfolio (one of the series constituting Master Investment Portfolio, referred to hereafter as the “Master Portfolio”) as of December 31, 2021, the related statement of operations for the year ended December 31, 2021, the statements of changes in net assets for each of the two years in the period ended December 31, 2021, including the related notes, and the financial highlights for each of the five years in the period ended December 31, 2021 (collectively referred to as the “financial statements”). In our opinion, the financial statements present fairly, in all material respects, the financial position of the Master Portfolio as of December 31, 2021, the results of its operations for the year then ended, the changes in its net assets for each of the two years in the period ended December 31, 2021 and the financial highlights for each of the five years in the period ended December 31, 2021 in conformity with accounting principles generally accepted in the United States of America.
Basis for Opinion
These financial statements are the responsibility of the Master Portfolio’s management. Our responsibility is to express an opinion on the Master Portfolio’s financial statements based on our audits. We are a public accounting firm registered with the Public Company Accounting Oversight Board (United States) (PCAOB) and are required to be independent with respect to the Master Portfolio in accordance with the U.S. federal securities laws and the applicable rules and regulations of the Securities and Exchange Commission and the PCAOB.
We conducted our audits of these financial statements in accordance with the standards of the PCAOB. Those standards require that we plan and perform the audit to obtain reasonable assurance about whether the financial statements are free of material misstatement, whether due to error or fraud.
Our audits included performing procedures to assess the risks of material misstatement of the financial statements, whether due to error or fraud, and performing procedures that respond to those risks. Such procedures included examining, on a test basis, evidence regarding the amounts and disclosures in the financial statements. Our audits also included evaluating the accounting principles used and significant estimates made by management, as well as evaluating the overall presentation of the financial statements. Our procedures included confirmation of securities owned as of December 31, 2021 by correspondence with the custodian, transfer agent and brokers. We believe that our audits provide a reasonable basis for our opinion.
/s/PricewaterhouseCoopers LLP
Philadelphia, Pennsylvania
February 24, 2022
We have served as the auditor of one or more BlackRock investment companies since 2000.
| | |
MASTER PORTFOLIO REPORT OF INDEPENDENT REGISTERED PUBLIC ACCOUNTING FIRM | | 43 |
Statement Regarding Liquidity Risk Management Program
In compliance with Rule 22e-4 under the Investment Company Act of 1940, as amended (the “Liquidity Rule”), BlackRock Funds III and Master Investment Portfolio (the “Trusts”) have adopted and implemented a liquidity risk management program (the “Program”) for iShares Russell 1000 Large-Cap Index Fund and Large Cap Index Master Portfolio (the “Funds”), each a series of the respective Trust, which is reasonably designed to assess and manage each Fund’s liquidity risk.
The Board of Trustees (the “Board”) of the Trusts, on behalf of the Funds, met on November 9-10, 2021 (the “Meeting”) to review the Program. The Board previously appointed BlackRock Advisors, LLC or BlackRock Fund Advisors (“BlackRock”), each an investment adviser to certain BlackRock funds, as the program administrator for each Fund’s Program, as applicable. BlackRock also previously delegated oversight of the Program to the 40 Act Liquidity Risk Management Committee (the “Committee”). At the Meeting, the Committee, on behalf of BlackRock, provided the Board with a report that addressed the operation of the Program and assessed its adequacy and effectiveness of implementation, including the management of each Fund’s Highly Liquid Investment Minimum (“HLIM”) where applicable, and any material changes to the Program (the “Report”). The Report covered the period from October 1, 2020 through September 30, 2021 (the “Program Reporting Period”).
The Report described the Program’s liquidity classification methodology for categorizing each Fund’s investments (including derivative transactions) into one of four liquidity buckets. It also referenced the methodology used by BlackRock to establish each Fund’s HLIM and noted that the Committee reviews and ratifies the HLIM assigned to each Fund no less frequently than annually. The Report also discussed notable events affecting liquidity over the Program Reporting Period, including the imposition of capital controls in certain countries.
The Report noted that the Program complied with the key factors for consideration under the Liquidity Rule for assessing, managing and periodically reviewing each Fund’s liquidity risk, as follows:
| a) | | The Fund’s investment strategy and liquidity of portfolio investments during both normal and reasonably foreseeable stressed conditions. During the Program Reporting Period, the Committee reviewed whether each Fund’s strategy is appropriate for an open-end fund structure with a focus on funds with more significant and consistent holdings of less liquid and illiquid assets. The Committee also factored a fund’s concentration in an issuer into the liquidity classification methodology by taking issuer position sizes into account. Where a fund participated in borrowings for investment purposes (such as tender option bonds or reverse repurchase agreements), such borrowings were factored into the Program’s calculation of a fund’s liquidity bucketing. Derivative exposure was also considered in such calculation. |
| b) | | Short-term and long-term cash flow projections during both normal and reasonably foreseeable stressed conditions. During the Program Reporting Period, the Committee reviewed historical redemption activity and used this information as a component to establish each Fund’s reasonably anticipated trading size (“RATS”). Each Fund has adopted an in-kind redemption policy which may be utilized to meet larger redemption requests. The Committee may also take into consideration a fund’s shareholder ownership concentration (which, depending on product type and distribution channel, may or may not be available), a fund’s distribution channels, and the degree of certainty associated with a fund’s short-term and long-term cash flow projections. |
| c) | | Holdings of cash and cash equivalents, as well as borrowing arrangements. The Committee considered the terms of the credit facility committed to each Fund, the financial health of the institution providing the facility and the fact that the credit facility is shared among multiple funds (including that a portion of the aggregate commitment amount is specifically designated for BlackRock Floating Rate Income Portfolio, a series of BlackRock Funds V). The Committee also considered other types of borrowing available to the Funds, such as the ability to use reverse repurchase agreements and interfund lending, as applicable. |
There were no material changes to the Program during the Program Reporting Period other than the enhancement of certain model components in the Program’s methodology. The Report provided to the Board stated that the Committee concluded that based on the operation of the functions, as described in the Report, the Program is operating as intended and is effective in implementing the requirements of the Liquidity Rule.
| | |
| 44 | | 2 0 2 1 BLACK ROCK ANNUAL REPORT TO SHAREHOLDERS |
Trustee and Officer Information
| | | | | | | | |
| Independent Trustees(a) |
| | | | | |
Name
Year of Birth(b) | | Position(s) Held
(Length of Service)(c) | | Principal Occupation(s) During Past Five Years | | Number of BlackRock-Advised
Registered Investment Companies
(“RICs”) Consisting of
Investment Portfolios
(“Portfolios”) Overseen | | Public Company
and Other
Investment
Company
Directorships Held
During
Past Five Years |
| | | | |
Mark Stalnecker
1951 | | Chair of the Board
(Since 2019) and Trustee
(Since 2015) | | Chief Investment Officer, University of Delaware from 1999 to 2013; Trustee and Chair of the Finance and Investment Committees, Winterthur Museum and Country Estate from 2005 to 2016; Member of the Investment Committee, Delaware Public Employees’ Retirement System since 2002; Member of the Investment Committee, Christiana Care Health System from 2009 to 2017; Member of the Investment Committee, Delaware Community Foundation from 2013 to 2014; Director and Chair of the Audit Committee, SEI Private Trust Co. from 2001 to 2014. | | 30 RICs consisting of 159 Portfolios | | None |
| | | | |
Bruce R. Bond
1946 | | Trustee
(Since 2019) | | Board Member, Amsphere Limited (software) since 2018; Trustee and Member of the Governance Committee, State Street Research Mutual Funds from 1997 to 2005; Board Member of Governance, Audit and Finance Committee, Avaya Inc. (computer equipment) from 2003 to 2007. | | 30 RICs consisting of 159 Portfolios | | None |
| | | | |
Susan J. Carter
1956 | | Trustee
(Since 2016) | | Director, Pacific Pension Institute from 2014 to 2018; Advisory Board Member, Center for Private Equity and Entrepreneurship at Tuck School of Business since 1997; Senior Advisor, Commonfund Capital, Inc. (“CCI”) (investment adviser) in 2015; Chief Executive Officer, CCI from 2013 to 2014; President & Chief Executive Officer, CCI from 1997 to 2013; Advisory Board Member, Girls Who Invest from 2015 to 2018 and Board Member thereof since 2018; Advisory Board Member, Bridges Fund Management since 2016; Trustee, Financial Accounting Foundation since 2017; Practitioner Advisory Board Member, Private Capital Research Institute (“PCRI”) since 2017; Lecturer in the Practice of Management, Yale School of Management since 2019; Advisor to Finance Committee, Altman Foundation since 2020. | | 30 RICs consisting of 159 Portfolios | | None |
| | | | |
Collette Chilton
1958 | | Trustee
(Since 2015) | | Chief Investment Officer, Williams College since 2006; Chief Investment Officer, Lucent Asset Management Corporation from 1998 to 2006; Director, Boys and Girls Club of Boston since 2017; Director, B1 Capital since 2018; Director, David and Lucile Packard Foundation since 2020. | | 30 RICs consisting of 159 Portfolios | | None |
| | | | |
Neil A. Cotty
1954 | | Trustee
(Since 2016) | | Bank of America Corporation from 1996 to 2015, serving in various senior finance leadership roles, including Chief Accounting Officer from 2009 to 2015, Chief Financial Officer of Global Banking, Markets and Wealth Management from 2008 to 2009, Chief Accounting Officer from 2004 to 2008, Chief Financial Officer of Consumer Bank from 2003 to 2004, Chief Financial Officer of Global Corporate Investment Bank from 1999 to 2002. | | 30 RICs consisting of 159 Portfolios | | None |
| | | | |
Lena G. Goldberg
1949 | | Trustee
(Since 2019) | | Director, Charles Stark Draper Laboratory, Inc. since 2013; Senior Lecturer, Harvard Business School, from 2008 to 2021; FMR LLC/Fidelity Investments (financial services) from 1996 to 2008, serving in various senior roles including Executive Vice President - Strategic Corporate Initiatives and Executive Vice President and General Counsel; Partner, Sullivan & Worcester LLP from 1985 to 1996 and Associate thereof from 1979 to 1985. | | 30 RICs consisting of 159 Portfolios | | None |
| | |
TRUSTEE AND OFFICER INFORMATION | | 45 |
Trustee and Officer Information (continued)
| | | | | | | | |
| Independent Trustees(a) (continued) |
| | | | | |
Name
Year of Birth(b) | | Position(s) Held
(Length of Service)(c) | | Principal Occupation(s) During Past Five Years | | Number of BlackRock-Advised
Registered Investment Companies
(“RICs”) Consisting of
Investment Portfolios
(“Portfolios”) Overseen | | Public Company
and Other
Investment
Company
Directorships Held
During
Past Five Years |
| | | | |
Henry R. Keizer
1956 | | Trustee
(Since 2019) | | Director, Park Indemnity Ltd. (captive insurer) since 2010; Director, MUFG Americas Holdings Corporation and MUFG Union Bank, N.A. (financial and bank holding company) from 2014 to 2016; Director, American Institute of Certified Public Accountants from 2009 to 2011; Director, KPMG LLP (audit, tax and advisory services) from 2004 to 2005 and 2010 to 2012; Director, KPMG International in 2012, Deputy Chairman and Chief Operating Officer thereof from 2010 to 2012 and U.S. Vice Chairman of Audit thereof from 2005 to 2010; Global Head of Audit, KPMGI (consortium of KPMG firms) from 2006 to 2010; Director, YMCA of Greater New York from 2006 to 2010. | | 30 RICs consisting of 159 Portfolios | | Hertz Global Holdings (car rental); Sealed Air Corp. (packaging); GrafTech International Ltd. (materials manufacturing); Montpelier Re Holdings, Ltd. (publicly held property and casualty reinsurance) from 2013 to 2015; WABCO (commercial vehicle safety systems) from 2015 to 2020. |
| | | | |
Cynthia A. Montgomery
1952 | | Trustee
(Since 2009) | | Professor, Harvard Business School since 1989. | | 30 RICs consisting of 159 Portfolios | | Newell Rubbermaid, Inc. (manufacturing) from 1995 to 2016. |
| | | | |
Donald C. Opatrny
1952 | | Trustee
(Since 2019) | | Trustee, Vice Chair, Member of the Executive Committee and Chair of the Investment Committee, Cornell University from 2004 to 2019; President, Trustee and Member of the Investment Committee, The Aldrich Contemporary Art Museum from 2007 to 2014; Member of the Board and Investment Committee, University School from 2007 to 2018; Member of the Investment Committee, Mellon Foundation from 2009 to 2015; Trustee, Artstor (a Mellon Foundation affiliate) from 2010 to 2015; President and Trustee, the Center for the Arts, Jackson Hole from 2011 to 2018; Director, Athena Capital Advisors LLC (investment management firm) since 2013; Trustee and Chair of the Investment Committee, Community Foundation of Jackson Hole since 2014; Member of Affordable Housing Supply Board of Jackson, Wyoming since 2017; Member, Investment Funds Committee, State of Wyoming since 2017; Trustee, Phoenix Art Museum since 2018; Trustee, Arizona Community Foundation and Member of Investment Committee since 2020. | | 30 RICs consisting of 159 Portfolios | | None |
| | | | |
Joseph P. Platt
1947 | | Trustee
(Since 2009) | | General Partner, Thorn Partners, LP (private investments) since 1998; Director, WQED Multi-Media (public broadcasting not-for-profit) since 2001; Chair, Basic Health International (non-profit) since 2015. | | 30 RICs consisting of 159 Portfolios | | Greenlight Capital Re, Ltd. (reinsurance company); Consol Energy Inc. |
| | |
| 46 | | 2 0 2 1 BLACK ROCK ANNUAL REPORT TO SHAREHOLDERS |
Trustee and Officer Information (continued)
| | | | | | | | |
| Independent Trustees(a) (continued) |
| | | | | |
Name
Year of Birth(b) | | Position(s) Held
(Length of Service)(c) | | Principal Occupation(s) During Past Five Years | | Number of BlackRock-Advised
Registered Investment Companies
(“RICs”) Consisting of
Investment Portfolios
(“Portfolios”) Overseen | | Public Company
and Other
Investment
Company
Directorships Held
During
Past Five Years |
| | | | |
Kenneth L. Urish
1951 | | Trustee
(Since 2009) | | Managing Partner, Urish Popeck & Co., LLC (certified public accountants and consultants) since 1976; Past- Chairman of the Professional Ethics Committee of the Pennsylvania Institute of Certified Public Accountants and Committee Member thereof since 2007; Member of External Advisory Board, The Pennsylvania State University Accounting Department since founding in 2001; Principal, UP Strategic Wealth Investment Advisors, LLC since 2013; Trustee, The Holy Family Institute from 2001 to 2010; President and Trustee, Pittsburgh Catholic Publishing Associates from 2003 to 2008; Director, Inter- Tel from 2006 to 2007; Member, Advisory Board, ESG Competent Boards since 2020. | | 30 RICs consisting of 159 Portfolios | | None |
| | | | |
Claire A. Walton
1957 | | Trustee
(Since 2016) | | Chief Operating Officer and Chief Financial Officer of Liberty Square Asset Management, LP from 1998 to 2015; General Partner of Neon Liberty Capital Management, LLC since 2003; Director, Boston Hedge Fund Group from 2009 to 2018; Director, Woodstock Ski Runners since 2013; Director, Massachusetts Council on Economic Education from 2013 to 2015. | | 30 RICs consisting of 159 Portfolios | | None |
|
| Interested Trustees(a)(d) |
| | | | | |
Name
Year of Birth(b) | | Position(s) Held
(Length of Service)(c) | | Principal Occupation(s) During Past Five Years | | Number of BlackRock-Advised
Registered Investment Companies
(“RICs”) Consisting of
Investment Portfolios
(“Portfolios”) Overseen | | Public Company
and Other
Investment
Company
Directorships
Held During
Past Five Years |
| | | | |
Robert Fairbairn
1965 | | Trustee
(Since 2018) | | Vice Chairman of BlackRock, Inc. since 2019; Member of BlackRock’s Global Executive and Global Operating Committees; Co-Chair of BlackRock’s Human Capital Committee; Senior Managing Director of BlackRock, Inc. from 2010 to 2019; oversaw BlackRock’s Strategic Partner Program and Strategic Product Management Group from 2012 to 2019; Member of the Board of Managers of BlackRock Investments, LLC from 2011 to 2018; Global Head of BlackRock’s Retail and iShares® businesses from 2012 to 2016. | | 103 RICs consisting of 261 Portfolios | | None |
| | | | |
John M. Perlowski(e)
1964 | | Trustee
(Since 2015)
President and Chief Executive Officer
(Since 2010) | | Managing Director of BlackRock, Inc. since 2009; Head of BlackRock Global Accounting and Product Services since 2009; Advisory Director of Family Resource Network (charitable foundation) since 2009. | | 105 RICs consisting of 263 Portfolios | | None |
| (a) | The address of each Trustee is c/o BlackRock, Inc., 55 East 52nd Street, New York, New York 10055. |
| (b) | Independent Trustees serve until their resignation, retirement, removal or death, or until December 31 of the year in which they turn 75. The Board may determine to extend the terms of Independent Trustees on a case-by-case basis, as appropriate. |
| (c) | In connection with the acquisition of Barclays Global Investors by BlackRock, Inc. in December 2009, certain Independent Trustees were elected to the Board. Furthermore, effective January 1, 2019, three BlackRock Fund Complexes were realigned and consolidated into two BlackRock Fund Complexes. As a result, although the chart shows the year that each Independent Trustee joined the Board, certain Independent Trustees first became members of the boards of other BlackRock-advised Funds or legacy BlackRock funds as follows: Bruce R. Bond, 2005; Cynthia A. Montgomery, 1994; Joseph P. Platt, 1999; Kenneth L. Urish, 1999; Lena G. Goldberg, 2016; Henry R. Keizer, 2016; Donald C. Opatrny, 2015. |
| (d) | Mr. Fairbairn and Mr. Perlowski are both “interested persons,” as defined in the 1940 Act, of the Trust/MIP based on their positions with BlackRock, Inc. and its affiliates. Mr. Fairbairn and Mr. Perlowski are also board members of the BlackRock Fixed-Income Complex. |
| (e) | Mr. Perlowski is also a trustee of the BlackRock Credit Strategies Fund and BlackRock Private Investments Fund. |
| | |
TRUSTEE AND OFFICER INFORMATION | | 47 |
Trustee and Officer Information (continued)
| | | | |
| Officers Who Are Not Trustees(a) |
| | | |
Name
Year of Birth(b) | | Position(s) Held
(Length of Service) | | Principal Occupation(s) During Past Five Years |
| | |
Thomas Callahan
1968 | | Vice President
(Since 2016) | | Managing Director of BlackRock, Inc. since 2013; Member of the Board of Managers of BlackRock Investments, LLC (principal underwriter) since 2019 and Managing Director thereof since 2017; Head of BlackRock’s Global Cash Management Business since 2016; Co-Head of the Global Cash Management Business from 2014 to 2016; Deputy Head of the Global Cash Management Business from 2013 to 2014; Member of the Cash Management Group Executive Committee since 2013; Chief Executive Officer of NYSE Liffe U.S. from 2008 to 2013. |
| | |
Jennifer McGovern
1977 | | Vice President
(Since 2014) | | Managing Director of BlackRock, Inc. since 2016; Director of BlackRock, Inc. from 2011 to 2015; Head of Americas Product Development and Governance for BlackRock’s Global Product Group since 2019; Head of Product Structure and Oversight for BlackRock’s U.S. Wealth Advisory Group from 2013 to 2019. |
| | |
Trent Walker
1974 | | Chief Financial Officer
(Since 2021) | | Managing Director of BlackRock, Inc. since September 2019; Executive Vice President of PIMCO from 2016 to 2019; Senior Vice President of PIMCO from 2008 to 2015; Treasurer from 2013 to 2019 and Assistant Treasurer from 2007 to 2017 of PIMCO Funds, PIMCO Variable Insurance Trust, PIMCO ETF Trust, PIMCO Equity Series, PIMCO Equity Series VIT, PIMCO Managed Accounts Trust, 2 PIMCO-sponsored interval funds and 21 PIMCO-sponsored closed-end funds. |
| | |
Jay M. Fife
1970 | | Treasurer
(Since 2009) | | Managing Director of BlackRock, Inc. since 2007. |
| | |
Charles Park
1967 | | Chief Compliance Officer
(Since 2014) | | Anti-Money Laundering Compliance Officer for certain BlackRock-advised Funds from 2014 to 2015; Chief Compliance Officer of BlackRock Advisors, LLC and the BlackRock-advised Funds in the BlackRock Multi-Asset Complex and the BlackRock Fixed-Income Complex since 2014; Principal of and Chief Compliance Officer for iShares® Delaware Trust Sponsor LLC since 2012 and BlackRock Fund Advisors (“BFA”) since 2006; Chief Compliance Officer for the BFA-advised iShares® exchange traded funds since 2006; Chief Compliance Officer for BlackRock Asset Management International Inc. since 2012. |
| | |
Lisa Belle
1968 | | Anti-Money Laundering Compliance Officer
(Since 2019) | | Managing Director of BlackRock, Inc. since 2019; Global Financial Crime Head for Asset and Wealth Management of JP Morgan from 2013 to 2019; Managing Director of RBS Securities from 2012 to 2013; Head of Financial Crimes for Barclays Wealth Americas from 2010 to 2012. |
| | |
Janey Ahn
1975 | | Secretary
(Since 2019) | | Managing Director of BlackRock, Inc. since 2018; Director of BlackRock, Inc. from 2009 to 2017. |
(a) The address of each Officer is c/o BlackRock, Inc., 55 East 52nd Street, New York, New York 10055.
(b) Officers of the Trust/MIP serve at the pleasure of the Board.
Further information about the Trust’s/MIP’s Trustees and Officers is available in the Trust’s/MIP’s Statement of Additional Information, which can be obtained without charge by calling (800) 441-7762.
Effective December 31, 2021, Bruce R. Bond retired as a Trustee of the Trust/MIP.
| | |
| 48 | | 2 0 2 1 BLACK ROCK ANNUAL REPORT TO SHAREHOLDERS |
Additional Information
Regulation Regarding Derivatives
On October 28, 2020, the Securities and Exchange Commission (the “SEC”) adopted regulations governing the use of derivatives by registered investment companies (“Rule 18f-4”). The Fund/Master Portfolio will be required to implement and comply with Rule 18f-4 by August 19, 2022. Once implemented, Rule 18f-4 will impose limits on the amount of derivatives a fund can enter into, eliminate the asset segregation framework currently used by funds to comply with Section 18 of the 1940 Act, treat derivatives as senior securities and require funds whose use of derivatives is more than a limited specified exposure amount to establish and maintain a comprehensive derivatives risk management program and appoint a derivatives risk manager.
General Information
Quarterly performance, semi-annual and annual reports, current net asset value and other information regarding the Fund/Master Portfolio may be found on BlackRock’s website, which can be accessed at blackrock.com. Any reference to BlackRock’s website in this report is intended to allow investors public access to information regarding the Fund/Master Portfolio and does not, and is not intended to, incorporate BlackRock’s website in this report.
Householding
The Fund will mail only one copy of shareholder documents, including prospectuses, annual and semi-annual reports, Rule 30e-3 notices and proxy statements, to shareholders with multiple accounts at the same address. This practice is commonly called “householding” and is intended to reduce expenses and eliminate duplicate mailings of shareholder documents. Mailings of your shareholder documents may be householded indefinitely unless you instruct us otherwise. If you do not want the mailing of these documents to be combined with those for other members of your household, please call the Fund at (800) 441-7762.
Availability of Quarterly Schedule of Investments
The Fund/Master Portfolio file their complete schedules of portfolio holdings with the SEC for the first and third quarters of each fiscal year as an exhibit to their reports on Form N-PORT. The Fund’s/Master Portfolio’s Forms N-PORT are available on the SEC’s website at sec.gov. Additionally, the Fund/Master Portfolio makes their portfolio holdings for the first and third quarters of each fiscal year available at blackrock.com/fundreports.
Availability of Proxy Voting Policies, Procedures and Voting Records
A description of the policies and procedures that the Fund/Master Portfolio use to determine how to vote proxies relating to portfolio securities and information about how the Fund/Master Portfolio voted proxies relating to securities held in the Fund’s/Master Portfolio’s portfolios during the most recent 12-month period ended June 30 is available without charge, upon request (1) by calling (800) 441-7762; (2) on the BlackRock website at blackrock.com; and (3) on the SEC’s website at sec.gov.
BlackRock’s Mutual Fund Family
BlackRock offers a diverse lineup of open-end mutual funds crossing all investment styles and managed by experts in equity, fixed-income and tax-exempt investing. Visit blackrock.com for more information.
Shareholder Privileges
Account Information
Call us at (800) 441-7762 from 8:00 AM to 6:00 PM ET on any business day to get information about your account balances, recent transactions and share prices. You can also visit blackrock.com for more information.
Automatic Investment Plans
Investor class shareholders who want to invest regularly can arrange to have $50 or more automatically deducted from their checking or savings account and invested in any of the BlackRock funds.
Systematic Withdrawal Plans
Investor class shareholders can establish a systematic withdrawal plan and receive periodic payments of $50 or more from their BlackRock funds, as long as their account balance is at least $10,000.
Retirement Plans
Shareholders may make investments in conjunction with Traditional, Rollover, Roth, Coverdell, Simple IRAs, SEP IRAs and 403(b) Plans.
| | |
ADDITIONAL INFORMATION | | 49 |
Additional Information (continued)
BlackRock Privacy Principles
BlackRock is committed to maintaining the privacy of its current and former fund investors and individual clients (collectively, “Clients”) and to safeguarding their non-public personal information. The following information is provided to help you understand what personal information BlackRock collects, how we protect that information and why in certain cases we share such information with select parties.
If you are located in a jurisdiction where specific laws, rules or regulations require BlackRock to provide you with additional or different privacy-related rights beyond what is set forth below, then BlackRock will comply with those specific laws, rules or regulations.
BlackRock obtains or verifies personal non-public information from and about you from different sources, including the following: (i) information we receive from you or, if applicable, your financial intermediary, on applications, forms or other documents; (ii) information about your transactions with us, our affiliates, or others; (iii) information we receive from a consumer reporting agency; and (iv) from visits to our websites.
BlackRock does not sell or disclose to non-affiliated third parties any non-public personal information about its Clients, except as permitted by law or as is necessary to respond to regulatory requests or to service Client accounts. These non-affiliated third parties are required to protect the confidentiality and security of this information and to use it only for its intended purpose.
We may share information with our affiliates to service your account or to provide you with information about other BlackRock products or services that may be of interest to you. In addition, BlackRock restricts access to non-public personal information about its Clients to those BlackRock employees with a legitimate business need for the information. BlackRock maintains physical, electronic and procedural safeguards that are designed to protect the non-public personal information of its Clients, including procedures relating to the proper storage and disposal of such information.
Fund and/or MIP Service Providers
Investment Adviser
BlackRock Fund Advisors
San Francisco, CA 94105
Administrator
BlackRock Advisors, LLC
Wilmington, DE 19809
Accounting Agent and Custodian
State Street Bank and Trust Company
Boston, MA 02111
Transfer Agent
BNY Mellon Investment Servicing (US) Inc.
Wilmington, DE 19809
Distributor
BlackRock Investments, LLC
New York, NY 10022
Independent Registered Public Accounting Firm
PricewaterhouseCoopers LLP
Philadelphia, PA 19103
Legal Counsel
Sidley Austin LLP
New York, NY 10019
Address of the Trust/MIP
400 Howard Street
San Francisco, CA 94105
| | |
| 50 | | 2 0 2 1 BLACK ROCK ANNUAL REPORT TO SHAREHOLDERS |
Glossary of Terms Used in this Report
Portfolio Abbreviation
| | |
| |
| ETF | | Exchange-Traded Fund |
| |
| MSCI | | Morgan Stanley Capital International |
| |
| REIT | | Real Estate Investment Trust |
| |
| S&P | | Standard & Poor’s |
| | |
GLOSSARY OF TERMS USED IN THIS REPORT | | 51 |
Want to know more?
blackrock.com | 800-441-7762
This report is intended for current holders. It is not authorized for use as an offer of sale or a solicitation of an offer to buy shares of the Fund unless preceded or accompanied by the Fund’s current prospectus. Past performance results shown in this report should not be considered a representation of future performance. Investment returns and principal value of shares will fluctuate so that shares, when redeemed, may be worth more or less than their original cost. Statements and other information herein are as dated and are subject to change.
LCI-12/21-AR
| | |

| | DECEMBER 31, 2021 |
BlackRock Funds III
· iShares S&P 500 Index Fund
|
Not FDIC Insured • May Lose Value • No Bank Guarantee |
The Markets in Review
Dear Shareholder,
The 12-month reporting period as of December 31, 2021 saw a continuation of the resurgent growth that followed the initial coronavirus (or “COVID-19”) pandemic reopening, albeit at a slower pace. The global economy weathered the emergence of several variant strains and the resulting peaks and troughs in infections amid optimism that increasing vaccinations and economic adaptation could help contain the pandemic’s disruptions. Continued growth meant that the U.S. economy regained and then surpassed its pre-pandemic output. However, a rapid rebound in consumer spending pushed up against supply constraints and led to elevated inflation.
Equity prices rose with the broader economy, as the implementation of mass vaccination campaigns and passage of an additional fiscal stimulus package and infrastructure bill further boosted stocks. In the United States, both large- and small-capitalization stocks posted a strong advance, and many equity indices neared or surpassed all-time highs late in the reporting period. International equities from developed markets also gained, although emerging market stocks declined, pressured by a strengthening U.S. dollar.
The 10-year U.S. Treasury yield (which is inversely related to bond prices) rose during the reporting period as the economy expanded rapidly and inflation reached its highest annualized reading in decades. In the corporate bond market, support from the U.S. Federal Reserve (the “Fed”) assuaged credit concerns and led to solid returns for high-yield corporate bonds, outpacing investment-grade corporate bonds, which declined.
The Fed maintained accommodative monetary policy during the reporting period by maintaining near-zero interest rates and by asserting that inflation could exceed its 2% target for a sustained period without triggering a rate increase. However, the Fed’s tone shifted late in the year, as it reduced its bond-buying program and used its market guidance to raise the prospect of higher rates in 2022.
Looking ahead, we believe that the global expansion will continue to broaden as Europe and other developed market economies gain momentum, although the Delta and Omicron variants of the coronavirus remain a threat, particularly in emerging markets. While we expect inflation to abate somewhat as supply bottlenecks are resolved, we anticipate that inflation will remain higher than the pre-COVID norm. The Fed is poised to raise interest rates next year in response, but the Fed’s policy shift means that tightening is likely to be less aggressive than what we’ve seen in previous cycles.
In this environment, we favor an overweight to equities, as we believe low interest rates and continued economic growth will support further gains, albeit likely more modest than what we saw in 2021. Sectors that are better poised to manage the transition to a lower-carbon world, such as technology and health care, are particularly attractive in the long term. U.S. and other developed-market equities have room for further growth, while we believe Chinese equities stand to gain from a more accommodative monetary and fiscal environment as the Chinese economy slows. We are underweight long-term credit, but inflation-protected U.S. Treasuries, Asian fixed income, and emerging market local-currency bonds offer potential opportunities. We believe that international diversification and a focus on sustainability can help provide portfolio resilience, and the disruption created by the coronavirus appears to be accelerating the shift toward sustainable investments.
In this environment, our view is that investors need to think globally, extend their scope across a broad array of asset classes, and be nimble as market conditions change. We encourage you to talk with your financial advisor and visit blackrock.com for further insight about investing in today’s markets.
Sincerely,

Rob Kapito
President, BlackRock Advisors, LLC

Rob Kapito
President, BlackRock Advisors, LLC
| | | | |
| Total Returns as of December 31, 2021 |
| | | |
| | | 6-Month | | 12-Month |
| | |
U.S. large cap equities
(S&P 500® Index) | | 11.67% | | 28.71% |
| | |
U.S. small cap equities
(Russell 2000® Index) | | (2.31) | | 14.82 |
| | |
International equities
(MSCI Europe, Australasia, Far East Index) | | 2.24 | | 11.26 |
| | |
Emerging market equities
(MSCI Emerging Markets Index) | | (9.30) | | (2.54) |
| | |
3-month Treasury bills
(ICE BofA 3-Month U.S. Treasury Bill Index) | | 0.02 | | 0.05 |
| | |
U.S. Treasury securities
(ICE BofA 10-Year U.S. Treasury Index) | | 0.44 | | (3.68) |
| | |
U.S. investment grade bonds
(Bloomberg U.S. Aggregate Bond Index) | | 0.06 | | (1.54) |
| | |
Tax-exempt municipal bonds
(S&P Municipal Bond Index) | | 0.52 | | 1.77 |
| | |
U.S. high yield bonds
(Bloomberg U.S. Corporate High Yield 2% Issuer Capped Index) | | 1.59 | | 5.26 |
|
| Past performance is not an indication of future results. Index performance is shown for illustrative purposes only. You cannot invest directly in an index. |
| | |
| 2 | | THIS PAGE IS NOT PART OF YOUR FUND REPORT |
Table of Contents

| | |
| Fund Summary as of December 31, 2021 | | iShares S&P 500 Index Fund |
Investment Objective
iShares S&P 500 Index Fund’s (the “Fund”) investment objective is to seek to provide investment results that correspond to the total return performance of publicly-traded common stocks in the aggregate, as represented by the Standard & Poor’s 500® Index (“S&P 500® Index”).
Portfolio Management Commentary
How did the Fund perform?
For the 12-month period ended December 31, 2021, the Fund’s Institutional Shares returned 28.56%, Service Shares returned 28.40%, Investor A Shares returned 28.23%, Class G Shares returned 28.67%, Class K Shares returned 28.65%, and Investor P Shares returned 28.23%. The benchmark S&P 500® Index returned 28.71% for the same period.
Returns for the Fund’s respective share classes differ from the benchmark index based on individual share-class expenses. The Fund invests all of its assets in S&P 500® Index Master Portfolio (the “Master Portfolio”), a series of Master Investment Portfolio.
Describe the market environment.
In the first quarter of 2021, following the strong end to 2020, favorable conditions continued with signs of a sooner-than-expected economic activity restart. Monetary conditions remained supportive, as the Fed signaled a continuing environment of low interest rates. With both the Senate and Congress passing a new $1.9 trillion stimulus package, and the United States starting to lead in the vaccine rollout, optimism continued to rise for strong economic growth in the first quarter. Despite the heightened volatility at the beginning of the quarter related to retail trading activity, the positive news about the stimulus package and the potential infrastructure bill soothed the market and supported a positive return over the first quarter.
The U.S. equity market rallied in the second quarter of 2021 as the vaccination campaign continued to accelerate, and as more signs started to emerge for a sooner-than-expected economic activity restart. The U.S. Consumer Price Index increased by more than 4% (one-year as of April 2021), which raised questions on whether this surge was sparked by temporary factors at play. However, the inflation concerns and the Fed’s cautious optimism about the recovery muted the market rally in May. In June, the U.S. equity market extended its rally, supported by the prospect of more fiscal stimulus, as President Biden reached a bipartisan $1 trillion agreement for infrastructure spending.
In the third quarter of 2021, U.S. equities continued climbing in August on the back of strong economic data and quarterly earnings reports. The positive return in markets came despite the increase in COVID-19 Delta variant cases in the United States. The Fed’s announcement in August was in line with expectations, as Fed Chair Jerome Powell suggested that tapering may start before year end during his Jackson Hole speech.
The positive sentiment of July and August was offset in September amid concerns regarding potential contagion from the unfolding debt crisis at Chinese property developer, Evergrande. Concerns that higher inflation and supply chain issues would last longer than expected also weighed down on the market. Lastly, the continuing disagreement in Washington D.C. regarding the debt ceiling and the infrastructure bill dampened U.S. equity performance. However, Congress passed a bill toward the end of the third quarter, extending government funding until December 3, 2021.
Following a strong earnings season in the fourth quarter of 2021 that boosted the positive sentiment early in the quarter, the emergence of the new COVID-19 Omicron variant and the concerns about higher inflation rates weighed down on U.S. market performance in November. However, preliminary data showed that the coronavirus vaccine was effective against the Omicron variant, and the Fed shared more clarity on next year’s policy path, leading to strong positive returns to end the fourth quarter. The falling unemployment rate and the $550 billion bipartisan infrastructure bill signed by President Biden supported market performance over the fourth quarter.
The Fed’s stance on monetary policy was at the forefront of market discussions over the fourth quarter of 2021. Fed Chair Jerome Powell conceded that inflation had been far stickier than initially anticipated. These inflation pressures were exacerbated as consumer demand continued to increase with supply chain bottlenecks and labor shortages. The Fed brought forward the dates of tapering to Spring 2022.
In the fourth quarter of 2021, from a Global Industry Classification Standard sector perspective, real estate (+17.54%), information technology (+16.69%), and materials (+15.20%) were among the best performers. While communication services (-0.01%), financials (+4.57%), and energy (+7.97%) were among the worst performers.
Describe recent portfolio activity.
During the period, as changes were made to the composition of the S&P 500® Index, the Master Portfolio purchased and sold securities to maintain its objective of replicating the risks and return of the benchmark index.
Describe portfolio positioning at period end.
The Master Portfolio remains positioned to match the risk characteristics of its benchmark index, irrespective of the market’s future direction.
The views expressed reflect the opinions of BlackRock as of the date of this report and are subject to change based on changes in market, economic, or other conditions. These views are not intended to be a forecast of future events and are no guarantee of future results.
| | |
| 4 | | 2 0 2 1 BLACK ROCK ANNUAL REPORT TO SHAREHOLDERS |
| | |
| Fund Summary as of December 31, 2021 (continued) | | iShares S&P 500 Index Fund |
TOTAL RETURN BASED ON A $10,000 INVESTMENT
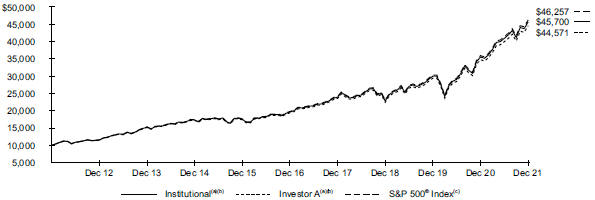
| | (a) | Assuming transaction costs and other operating expenses, including investment advisory fees. | |
| | (b) | The Fund invests all of its assets in the Master Portfolio. Under normal circumstances, the Master Portfolio invests at least 90% of the value of its assets, plus the amount of any borrowing for investment purposes, in securities comprising the S&P 500® Index. | |
| | (c) | An unmanaged index that covers 500 leading companies and captures approximately 80% coverage of available market capitalization. | |
Performance
| | | | | | | | | | | | | | | | | | | | | | | | |
| | | Average Annual Total Returns(a) | |
| | | | |
| | | |
| | | 1 Year | | | 5 Years | | | 10 Years | |
| | | | | | | | | | | | |
| | | | | | |
| | | Without Sales Charge | | | With Sales Charge | | | Without Sales Charge | | | With Sales Charge | | | Without
Sales
Charge | | | With Sales Charge | |
| | | | | | |
Institutional | | | 28.56 | % | | | N/A | | | | 18.37 | % | | | N/A | | | | 16.41 | % | | | N/A | |
Service | | | 28.40 | | | | N/A | | | | 18.23 | | | | N/A | | | | 16.27 | | | | N/A | |
Investor A | | | 28.23 | | | | N/A | | | | 18.07 | | | | N/A | | | | 16.12 | | | | N/A | |
Investor P | | | 28.23 | | | | 21.51 | % | | | 18.08 | | | | 16.80 | % | | | 16.12 | | | | 15.50 | % |
Class G | | | 28.67 | | | | N/A | | | | 18.46 | | | | N/A | | | | 16.50 | | | | N/A | |
Class K | | | 28.65 | | | | N/A | | | | 18.45 | | | | N/A | | | | 16.49 | | | | N/A | |
| | | | | | |
S&P 500® Index | | | 28.71 | | | | N/A | | | | 18.47 | | | | N/A | | | | 16.55 | | | | N/A | |
| | (a) | Assuming maximum sales charges, if any. Average annual total returns with and without sales charges reflect reductions for distribution and service fees. See “About Fund Performance” for a detailed description of share classes, including any related sales charges and fees, and how performance was calculated for certain share classes. | |
N/A — Not applicable as the share class and index do not have a sales charge.
Past performance is not an indication of future results.
Performance results may include adjustments made for financial reporting purposes in accordance with U.S. generally accepted accounting principles.
Expense Example
| | | | | | | | | | | | | | | | | | | | | | | | | | | | | | | | |
| | | Actual | | | Hypothetical(a) | | | | | | | |
| | | | | | | | | | | | | | | | |
| | |
| Beginning
Account Value (07/01/21) |
| |
| Ending
Account Value (12/31/21) |
| |
| Expenses
Paid During the Period |
(b) | |
| Beginning
Account Value (07/01/21) |
| |
| Ending
Account Value
(12/31/21) |
| |
| Expenses
Paid During
the Period |
(b) | | | | | |
| Annualized
Expense Ratio |
|
| | | | | | | | |
Institutional | | | $ 1,000.00 | | | | $ 1,116.20 | | | | $ 0.53 | | | | $ 1,000.00 | | | | $ 1,024.70 | | | | $ 0.51 | | | | | | | | 0.10 | % |
Service | | | 1,000.00 | | | | 1,115.40 | | | | 1.17 | | | | 1,000.00 | | | | 1,024.10 | | | | 1.12 | | | | | | | | 0.22 | |
Investor A | | | 1,000.00 | | | | 1,114.80 | | | | 1.87 | | | | 1,000.00 | | | | 1,023.44 | | | | 1.79 | | | | | | | | 0.35 | |
Investor P | | | 1,000.00 | | | | 1,114.70 | | | | 1.87 | | | | 1,000.00 | | | | 1,023.44 | | | | 1.79 | | | | | | | | 0.35 | |
Class G | | | 1,000.00 | | | | 1,116.60 | | | | 0.05 | | | | 1,000.00 | | | | 1,025.16 | | | | 0.05 | | | | | | | | 0.01 | |
| Class K | | | 1,000.00 | | | | 1,116.60 | | | | 0.16 | | | | 1,000.00 | | | | 1,025.05 | | | | 0.15 | | | | | | | | 0.03 | |
| | (a) | Hypothetical 5% annual return before expenses is calculated by prorating the number of days in the most recent fiscal half year divided by 365. | |
| | (b) | For each class of the Fund, expenses are equal to the annualized expense ratio for the class, multiplied by the average account value over the period, multiplied by 184/365 (to reflect the one-half year period shown). Because the Fund invests all of its assets in the Master Portfolio, the expense example reflects the net expenses of both the Fund and the Master Portfolio in which it invests. | |
See “Disclosure of Expenses” for further information on how expenses were calculated.
| | |
About Fund Performance | | iShares S&P 500 Index Fund |
Institutional and Class K Shares are not subject to any sales charge. These shares bear no ongoing distribution or service fees and are available only to certain eligible investors. Prior to April 11, 2013, Class K Shares were an undesignated share class of the Fund. Institutional Shares performance shown prior to the Institutional Shares inception date of April 10, 2013 is that of Class K Shares (which have no distribution or service fees) and was restated to reflect Institutional Shares fees.
Service Shares are not subject to any sales charge. These shares are subject to a service fee of 0.15% per year (but no distribution fee) and are only available to certain eligible investors. Service Shares performance shown prior to the Service Shares inception date of April 19, 2013 is that of Class K Shares (which have no distribution or service fees) and was restated to reflect Service Shares fees.
Investor A Shares are not subject to any sales charge and bear no ongoing distribution fee. These shares are subject to an ongoing service fee of 0.25% per year. These shares are generally available through financial intermediaries. Investor A Shares performance shown prior to the Investor A Shares inception date of April 10, 2013 is that of Class K Shares (which have no distribution or service fees) and was restated to reflect Investor A Shares fees.
Investor P Shares are subject to a maximum initial sales charge (front-end load) of 5.25% and a service fee of 0.25% per year (but no distribution fee). Certain redemption of these shares may be subject to a CDSC where no initial sales charge was paid at the time of purchase. These shares are only available to investors purchasing shares through registered representatives of an insurance company’s broker-dealer that has entered into an agreement with the Fund’s distributor to offer such shares. Investor P Shares performance shown prior to the Investor P Shares inception date of August 6, 2018 is that of Class K Shares (which have no distribution or service fees) and was restated to reflect Investor P Shares fees.
Class G Shares are not subject to any sales charge. These shares bear no ongoing distribution or service fees and are available only to investors on eligible platforms. Class G Shares performance shown prior to the Class G Shares inception date of July 1, 2019 is that of Class K Shares (which have no distribution or service fees).
Past performance is not an indication of future results. Financial markets have experienced extreme volatility and trading in many instruments has been disrupted. These circumstances may continue for an extended period of time and may continue to affect adversely the value and liquidity of the Fund’s investments. As a result, current performance may be lower or higher than the performance data quoted. Refer to blackrock.com to obtain performance data current to the most recent month-end. Performance results do not reflect the deduction of taxes that a shareholder would pay on Fund distributions or the redemption of Fund shares. Figures shown in the performance table(s) assume reinvestment of all distributions, if any, at net asset value (“NAV”) on the ex-dividend date or payable date, as applicable. Investment return and principal value of shares will fluctuate so that shares, when redeemed, may be worth more or less than their original cost. Distributions paid to each class of shares will vary because of the different levels of service, distribution and transfer agency fees applicable to each class, which are deducted from the income available to be paid to shareholders.
BlackRock Advisors, LLC (the “Administrator”), the Fund’s administrator, has contractually and/or voluntarily agreed to waive and/or reimburse a portion of the Fund’s expenses. Without such waiver(s) and/or reimbursement(s), the Fund’s performance would have been lower. With respect to the Fund’s voluntary waiver(s), if any, the Administrator is under no obligation to waive and/or reimburse or to continue waiving and/or reimbursing its fees and such voluntary waiver(s) may be reduced or discontinued at any time. With respect to the Fund’s contractual waiver(s), if any, the Administrator is under no obligation to continue waiving and/or reimbursing its fees after the applicable termination date of such agreement. See the Notes to Financial Statements for additional information on waivers and/or reimbursements.
Disclosure of Expenses
Shareholders of the Fund may incur the following charges: (a) transactional expenses, such as sales charges; and (b) operating expenses, including administration fees, service and distribution fees, including 12b-1 fees, acquired fund fees and expenses, and other fund expenses. The expense example shown (which is based on a hypothetical investment of $1,000 invested at the beginning of the period (or from the commencement of operations if less than 6 months) and held through the end of the period) is intended to assist shareholders both in calculating expenses based on an investment in the Fund and in comparing these expenses with similar costs of investing in other mutual funds.
The expense example provides information about actual account values and actual expenses. Annualized expense ratios reflect contractual and voluntary fee waivers, if any. In order to estimate the expenses a shareholder paid during the period covered by this report, shareholders can divide their account value by $1,000 and then multiply the result by the number corresponding to their share class under the heading entitled “Expenses Paid During the Period.”
The expense example also provides information about hypothetical account values and hypothetical expenses based on the Fund’s actual expense ratio and an assumed rate of return of 5% per year before expenses. In order to assist shareholders in comparing the ongoing expenses of investing in the Fund and other funds, compare the 5% hypothetical example with the 5% hypothetical examples that appear in shareholder reports of other funds.
The expenses shown in the expense example are intended to highlight shareholders’ ongoing costs only and do not reflect transactional expenses, such as sales charges, if any. Therefore, the hypothetical example is useful in comparing ongoing expenses only and will not help shareholders determine the relative total expenses of owning different funds. If these transactional expenses were included, shareholder expenses would have been higher.
| | |
| 6 | | 2 0 2 1 BLACK ROCK ANNUAL REPORT TO SHAREHOLDERS |
| | |
Derivative Financial Instruments | | iShares S&P 500 Index Fund |
The S&P 500 Index Master Portfolio (the “Master Portfolio”) may invest in various derivative financial instruments. These instruments are used to obtain exposure to a security, commodity, index, market, and/or other assets without owning or taking physical custody of securities, commodities and/or other referenced assets or to manage market, equity, credit, interest rate, foreign currency exchange rate, commodity and/or other risks. Derivative financial instruments may give rise to a form of economic leverage and involve risks, including the imperfect correlation between the value of a derivative financial instrument and the underlying asset, possible default of the counterparty to the transaction or illiquidity of the instrument. The Master Portfolio’s successful use of a derivative financial instrument depends on the investment adviser’s ability to predict pertinent market movements accurately, which cannot be assured. The use of these instruments may result in losses greater than if they had not been used, may limit the amount of appreciation the Master Portfolio can realize on an investment and/or may result in lower distributions paid to shareholders. The Master Portfolio’s investments in these instruments, if any, are discussed in detail in the Master Portfolio Notes to Financial Statements.
| | |
DERIVATIVE FINANCIAL INSTRUMENTS | | 7 |
Statement of Assets and Liabilities
December 31, 2021
| | | | |
| | | iShares S&P 500 Index Fund | |
| |
| |
ASSETS | | | | |
Investments, at value — Master Portfolio | | $ | 33,870,113,832 | |
Receivables: | | | | |
Capital shares sold | | | 36,732,922 | |
Withdrawals from the Master Portfolio | | | 66,837,601 | |
| | | | |
| |
Total assets | | | 33,973,684,355 | |
| | | | |
| |
LIABILITIES | | | | |
Payables: | | | | |
Administration fees | | | 1,007,089 | |
Capital shares redeemed | | | 103,570,524 | |
Professional fees | | | 14,055 | |
Service and distribution fees | | | 1,005,729 | |
| | | | |
| |
Total liabilities | | | 105,597,397 | |
| | | | |
| |
NET ASSETS | | $ | 33,868,086,958 | |
| | | | |
| |
NET ASSETS CONSIST OF | | | | |
Paid-in capital | | $ | 14,422,032,388 | |
Accumulated earnings | | | 19,446,054,570 | |
| | | | |
| |
NET ASSETS | | $ | 33,868,086,958 | |
| | | | |
| | |
| 8 | | 2 0 2 1 BLACK ROCK ANNUAL REPORT TO SHAREHOLDERS |
Statement of Assets and Liabilities (continued)
December 31, 2021
| | | | |
| | | iShares S&P 500 Index Fund | |
| |
| |
NET ASSET VALUE | | | | |
| |
Institutional | | | | |
| |
Net assets | | $ | 5,536,376,033 | |
| | | | |
| |
Shares outstanding | | | 9,880,083 | |
| | | | |
| |
Net asset value | | $ | 560.36 | |
| | | | |
| |
Shares authorized | | | Unlimited | |
| | | | |
| |
Par value | | | No par value | |
| | | | |
| |
Service | | | | |
| |
Net assets | | $ | 523,049,812 | |
| | | | |
| |
Shares outstanding | | | 933,525 | |
| | | | |
| |
Net asset value | | $ | 560.30 | |
| | | | |
| |
Shares authorized | | | Unlimited | |
| | | | |
| |
Par value | | | No par value | |
| | | | |
| |
Investor A | | | | |
| |
Net assets | | $ | 2,806,389,522 | |
| | | | |
| |
Shares outstanding | | | 5,008,641 | |
| | | | |
| |
Net asset value | | $ | 560.31 | |
| | | | |
| |
Shares authorized | | | Unlimited | |
| | | | |
| |
Par value | | | No par value | |
| | | | |
| |
Investor P | | | | |
| |
Net assets | | $ | 1,667,178,042 | |
| | | | |
| |
Shares outstanding | | | 2,978,274 | |
| | | | |
| |
Net asset value | | $ | 559.78 | |
| | | | |
| |
Shares authorized | | | Unlimited | |
| | | | |
| |
Par value | | | No par value | |
| | | | |
| |
Class G | | | | |
| |
Net assets | | $ | 10,447,836,814 | |
| | | | |
| |
Shares outstanding | | | 18,641,089 | |
| | | | |
| |
Net asset value | | $ | 560.47 | |
| | | | |
| |
Shares authorized | | | Unlimited | |
| | | | |
| |
Par value | | | No par value | |
| | | | |
| |
Class K | | | | |
| |
Net assets | | $ | 12,887,256,735 | |
| | | | |
| |
Shares outstanding | | | 22,992,948 | |
| | | | |
| |
Net asset value | | $ | 560.49 | |
| | | | |
| |
Shares authorized | | | Unlimited | |
| | | | |
| |
Par value | | | No par value | |
| | | | |
See notes to financial statements.
| | |
FUND FINANCIAL STATEMENTS | | 9 |
Statement of Operations
Year Ended December 31, 2021
| | | | |
| | | iShares S&P 500 Index Fund | |
| |
| |
INVESTMENT INCOME | | | | |
Net investment income allocated from the Master Portfolio: | | | | |
Dividends — unaffiliated | | $ | 421,447,362 | |
Dividends — affiliated | | | 4,559,409 | |
Securities lending income — affiliated — net | | | 365,879 | |
Foreign taxes withheld | | | (2,118,262 | ) |
Expenses | | | (3,441,774 | ) |
Fees waived | | | 568,189 | |
| | | | |
| |
Total investment income | | | 421,380,803 | |
| | | | |
| |
FUND EXPENSES | | | | |
Service — class specific | | | 11,521,398 | |
Administration — class specific | | | 10,913,095 | |
Professional | | | 14,267 | |
Miscellaneous | | | 5,827 | |
| | | | |
| |
Total expenses | | | 22,454,587 | |
Less: | | | | |
Fees waived and/or reimbursed by the Administrator | | | (14,267 | ) |
| | | | |
| |
Total expenses after fees waived and/or reimbursed | | | 22,440,320 | |
| | | | |
| |
Net investment income | | | 398,940,483 | |
| | | | |
| |
REALIZED AND UNREALIZED GAIN (LOSS) ALLOCATED FROM THE MASTER PORTFOLIO | | | | |
Net realized gain from: | | | | |
Investments — unaffiliated | | | 194,600,640 | |
Investments — affiliated | | | 30,172,746 | |
Futures contracts | | | 52,797,494 | |
| | | | |
| |
| | | 277,570,880 | |
| | | | |
Net change in unrealized appreciation (depreciation) on: | | | | |
Investments — unaffiliated | | | 6,833,282,139 | |
Investments — affiliated | | | 46,486,231 | |
Futures contracts | | | 5,197,645 | |
| | | | |
| |
| | | 6,884,966,015 | |
| | | | |
| |
Net realized and unrealized gain | | | 7,162,536,895 | |
| | | | |
| |
NET INCREASE IN NET ASSETS RESULTING FROM OPERATIONS | | $ | 7,561,477,378 | |
| | | | |
See notes to financial statements.
| | |
| 10 | | 2 0 2 1 BLACK ROCK ANNUAL REPORT TO SHAREHOLDERS |
Statements of Changes in Net Assets
| | | | | | | | | | | | |
| | | iShares S&P 500 Index Fund | |
| | | | |
| |
| | | Year Ended December 31, | |
| | | | |
| | | |
| | | 2021 | | | | | | 2020 | |
| |
| | | |
INCREASE (DECREASE) IN NET ASSETS | | | | | | | | | | | | |
| | | |
OPERATIONS | | | | | | | | | | | | |
Net investment income | | $ | 398,940,483 | | | | | | | $ | 395,878,062 | |
Net realized gain (loss) | | | 277,570,880 | | | | | | | | (27,962,320 | ) |
Net change in unrealized appreciation (depreciation) | | | 6,884,966,015 | | | | | | | | 3,845,897,135 | |
| | | | | | | | | | | | |
| | | |
Net increase in net assets resulting from operations | | | 7,561,477,378 | | | | | | | | 4,213,812,877 | |
| | | | | | | | | | | | |
| | | |
DISTRIBUTIONS TO SHAREHOLDERS(a) | | | | | | | | | | | | |
Institutional | | | (92,321,474 | ) | | | | | | | (67,939,601 | ) |
Service | | | (9,859,969 | ) | | | | | | | (7,162,650 | ) |
Investor A | | | (44,239,611 | ) | | | | | | | (39,328,960 | ) |
Investor P | | | (25,621,646 | ) | | | | | | | (19,660,719 | ) |
Class G | | | (187,155,415 | ) | | | | | | | (119,641,388 | ) |
Class K | | | (235,557,043 | ) | | | | | | | (171,640,338 | ) |
| | | | | | | | | | | | |
| | | |
Decrease in net assets resulting from distributions to shareholders | | | (594,755,158 | ) | | | | | | | (425,373,656 | ) |
| | | | | | | | | | | | |
| | | |
CAPITAL SHARE TRANSACTIONS | | | | | | | | | | | | |
Net increase in net assets derived from capital share transactions | | | 468,263,812 | | | | | | | | 142,708,268 | |
| | | | | | | | | | | | |
| | | |
NET ASSETS | | | | | | | | | | | | |
Total increase in net assets | | | 7,434,986,032 | | | | | | | | 3,931,147,489 | |
Beginning of year | | | 26,433,100,926 | | | | | | | | 22,501,953,437 | |
| | | | | | | | | | | | |
| | | |
End of year | | $ | 33,868,086,958 | | | | | | | $ | 26,433,100,926 | |
| | | | | | | | | | | | |
| (a) | Distributions for annual periods determined in accordance with U.S. federal income tax regulations. |
See notes to financial statements.
| | |
FUND FINANCIAL STATEMENTS | | 11 |
Financial Highlights
(For a share outstanding throughout each period)
| | | | | | | | | | | | | | | | | | | | |
| | | iShares S&P 500 Index Fund | |
| |
| | | Institutional | |
| |
| | | Year Ended December 31, | |
| | | | | |
| | | 2021 | | | 2020 | | | 2019 | | | 2018 | | | 2017 | |
| | | | | | |
Net asset value, beginning of year | | $ | 444.18 | | | $ | 382.63 | | | $ | 297.40 | | | $ | 318.31 | | | $ | 267.04 | |
| | | | | | | | | | | | | | | | | | | | |
| | | | | |
Net investment income(a) | | | 6.59 | | | | 6.59 | | | | 6.46 | | | | 6.03 | | | | 5.42 | |
Net realized and unrealized gain (loss) | | | 119.44 | | | | 62.05 | | | | 86.13 | | | | (19.72 | ) | | | 52.02 | |
| | | | | | | | | | | | | | | | | | | | |
| | | | | |
Net increase (decrease) from investment operations | | | 126.03 | | | | 68.64 | | | | 92.59 | | | | (13.69 | ) | | | 57.44 | |
| | | | | | | | | | | | | | | | | | | | |
| | | | | |
Distributions(b) | | | | | | | | | | | | | | | | | | | | |
From net investment income | | | (6.65 | ) | | | (6.60 | ) | | | (7.36 | ) | | | (5.82 | ) | | | (5.32 | ) |
From net realized gain | | | (3.20 | ) | | | (0.49 | ) | | | — | | | | (1.40 | ) | | | (0.85 | ) |
| | | | | | | | | | | | | | | | | | | | |
| | | | | |
Total distributions | | | (9.85 | ) | | | (7.09 | ) | | | (7.36 | ) | | | (7.22 | ) | | | (6.17 | ) |
| | | | | | | | | | | | | | | | | | | | |
| | | | | |
Net asset value, end of year | | $ | 560.36 | | | $ | 444.18 | | | $ | 382.63 | | | $ | 297.40 | | | $ | 318.31 | |
| | | | | | | | | | | | | | | | | | | | |
| | | | | |
Total Return(c) | | | | | | | | | | | | | | | | | | | | |
Based on net asset value | | | 28.56 | % | | | 18.34 | % | | | 31.35 | % | | | (4.45 | )% | | | 21.68 | % |
| | | | | | | | | | | | | | | | | | | | |
| | | | | |
Ratios to Average Net Assets(d)(e)(f) | | | | | | | | | | | | | | | | | | | | |
Total expenses | | | 0.10 | % | | | 0.10 | % | | | 0.10 | % | | | 0.11 | % | | | 0.11 | % |
| | | | | | | | | | | | | | | | | | | | |
| | | | | |
Total expenses after fees waived and/or reimbursed | | | 0.10 | % | | | 0.10 | % | | | 0.10 | % | | | 0.11 | % | | | 0.11 | % |
| | | | | | | | | | | | | | | | | | | | |
| | | | | |
Net investment income | | | 1.30 | % | | | 1.73 | % | | | 1.87 | % | | | 1.84 | % | | | 1.86 | % |
| | | | | | | | | | | | | | | | | | | | |
| | | | | |
Supplemental Data | | | | | | | | | | | | | | | | | | | | |
Net assets, end of year (000) | | $ | 5,536,376 | | | $ | 4,143,093 | | | $ | 3,950,956 | | | $ | 3,660,724 | | | $ | 3,596,342 | |
| | | | | | | | | | | | | | | | | | | | |
| | | | | |
Portfolio turnover rate of the Master Portfolio | | | 6 | % | | | 5 | % | | | 3 | % | | | 12 | % | | | 11 | % |
| | | | | | | | | | | | | | | | | | | | |
| (a) | Based on average shares outstanding. |
| (b) | Distributions for annual periods determined in accordance with U.S. federal income tax regulations. |
| (c) | Where applicable, assumes the reinvestment of distributions. |
| (d) | Includes the Fund’s share of the Master Portfolio’s allocated net expenses and/or net investment income. |
| (e) | Includes the Fund’s share of the Master Portfolio’s allocated fees waived of less than 0.01%. |
| (f) | Excludes fees and expenses incurred indirectly as a result of investments in underlying funds. |
See notes to financial statements.
| | |
| 12 | | 2 0 2 1 BLACK ROCK ANNUAL REPORT TO SHAREHOLDERS |
Financial Highlights (continued)
(For a share outstanding throughout each period)
| | | | | | | | | | | | | | | | | | | | |
| | | iShares S&P 500 Index Fund (continued) | |
| |
| | | Service | |
| |
| | | Year Ended December 31, | |
| | | | | |
| | | 2021 | | | 2020 | | | 2019 | | | 2018 | | | 2017 | |
| | | | | | |
Net asset value, beginning of year | | $ | 444.13 | | | $ | 382.60 | | | $ | 297.38 | | | $ | 318.29 | | | $ | 267.02 | |
| | | | | | | | | | | | | | | | | | | | |
| | | | | |
Net investment income(a) | | | 5.98 | | | | 6.10 | | | | 6.06 | | | | 5.64 | | | | 5.08 | |
Net realized and unrealized gain (loss) | | | 119.41 | | | | 62.12 | | | | 86.10 | | | | (19.73 | ) | | | 52.00 | |
| | | | | | | | | | | | | | | | | | | | |
| | | | | |
Net increase (decrease) from investment operations | | | 125.39 | | | | 68.22 | | | | 92.16 | | | | (14.09 | ) | | | 57.08 | |
| | | | | | | | | | | | | | | | | | | | |
| | | | | |
Distributions(b) | | | | | | | | | | | | | | | | | | | | |
From net investment income | | | (6.02 | ) | | | (6.20 | ) | | | (6.94 | ) | | | (5.42 | ) | | | (4.96 | ) |
From net realized gain | | | (3.20 | ) | | | (0.49 | ) | | | — | | | | (1.40 | ) | | | (0.85 | ) |
| | | | | | | | | | | | | | | | | | | | |
| | | | | |
Total distributions | | | (9.22 | ) | | | (6.69 | ) | | | (6.94 | ) | | | (6.82 | ) | | | (5.81 | ) |
| | | | | | | | | | | | | | | | | | | | |
| | | | | |
Net asset value, end of year | | $ | 560.30 | | | $ | 444.13 | | | $ | 382.60 | | | $ | 297.38 | | | $ | 318.29 | |
| | | | | | | | | | | | | | | | | | | | |
| | | | | |
Total Return(c) | | | | | | | | | | | | | | | | | | | | |
Based on net asset value | | | 28.40 | % | | | 18.21 | % | | | 31.20 | % | | | (4.57 | )% | | | 21.54 | % |
| | | | | | | | | | | | | | | | | | | | |
| | | | | |
Ratios to Average Net Assets(d)(e)(f) | | | | | | | | | | | | | | | | | | | | |
Total expenses | | | 0.22 | % | | | 0.22 | % | | | 0.22 | % | | | 0.23 | % | | | 0.23 | % |
| | | | | | | | | | | | | | | | | | | | |
| | | | | |
Total expenses after fees waived and/or reimbursed | | | 0.22 | % | | | 0.22 | % | | | 0.22 | % | | | 0.23 | % | | | 0.23 | % |
| | | | | | | | | | | | | | | | | | | | |
| | | | | |
Net investment income | | | 1.19 | % | | | 1.58 | % | | | 1.75 | % | | | 1.72 | % | | | 1.74 | % |
| | | | | | | | | | | | | | | | | | | | |
| | | | | |
Supplemental Data | | | | | | | | | | | | | | | | | | | | |
Net assets, end of year (000) | | $ | 523,050 | | | $ | 584,228 | | | $ | 334,402 | | | $ | 318,651 | | | $ | 319,504 | |
| | | | | | | | | | | | | | | | | | | | |
| | | | | |
Portfolio turnover rate of the Master Portfolio | | | 6 | % | | | 5 | % | | | 3 | % | | | 12 | % | | | 11 | % |
| | | | | | | | | | | | | | | | | | | | |
| (a) | Based on average shares outstanding. |
| (b) | Distributions for annual periods determined in accordance with U.S. federal income tax regulations. |
| (c) | Where applicable, assumes the reinvestment of distributions. |
| (d) | Includes the Fund’s share of the Master Portfolio’s allocated net expenses and/or net investment income. |
| (e) | Includes the Fund’s share of the Master Portfolio’s allocated fees waived of less than 0.01%. |
| (f) | Excludes fees and expenses incurred indirectly as a result of investments in underlying funds. |
See notes to financial statements.
| | |
FUND FINANCIAL HIGHLIGHTS | | 13 |
Financial Highlights (continued)
(For a share outstanding throughout each period)
| | | | | | | | | | | | | | | | | | | | |
| | | iShares S&P 500 Index Fund (continued) | |
| |
| | | Investor A | |
| |
| | | Year Ended December 31, | |
| | | | | |
| | | 2021 | | | 2020 | | | 2019 | | | 2018 | | | 2017 | |
| | | | | | |
Net asset value, beginning of year | | $ | 444.11 | | | $ | 382.52 | | | $ | 297.33 | | | $ | 318.23 | | | $ | 266.99 | |
| | | | | | | | | | | | | | | | | | | | |
| | | | | |
Net investment income(a) | | | 5.32 | | | | 5.66 | | | | 5.61 | | | | 5.22 | | | | 4.71 | |
Net realized and unrealized gain (loss) | | | 119.41 | | | | 62.03 | | | | 86.07 | | | | (19.72 | ) | | | 51.97 | |
| | | | | | | | | | | | | | | | | | | | |
| | | | | |
Net increase (decrease) from investment operations | | | 124.73 | | | | 67.69 | | | | 91.68 | | | | (14.50 | ) | | | 56.68 | |
| | | | | | | | | | | | | | | | | | | | |
| | | | | |
Distributions(b) | | | | | | | | | | | | | | | | | | | | |
From net investment income | | | (5.33 | ) | | | (5.61 | ) | | | (6.49 | ) | | | (5.00 | ) | | | (4.59 | ) |
From net realized gain | | | (3.20 | ) | | | (0.49 | ) | | | — | | | | (1.40 | ) | | | (0.85 | ) |
| | | | | | | | | | | | | | | | | | | | |
| | | | | |
Total distributions | | | (8.53 | ) | | | (6.10 | ) | | | (6.49 | ) | | | (6.40 | ) | | | (5.44 | ) |
| | | | | | | | | | | | | | | | | | | | |
| | | | | |
Net asset value, end of year | | $ | 560.31 | | | $ | 444.11 | | | $ | 382.52 | | | $ | 297.33 | | | $ | 318.23 | |
| | | | | | | | | | | | | | | | | | | | |
| | | | | |
Total Return(c) | | | | | | | | | | | | | | | | | | | | |
Based on net asset value | | | 28.23 | % | | | 18.04 | % | | | 31.02 | % | | | (4.68 | )% | | | 21.38 | % |
| | | | | | | | | | | | | | | | | | | | |
| | | | | |
Ratios to Average Net Assets(d)(e)(f) | | | | | | | | | | | | | | | | | | | | |
Total expenses | | | 0.35 | % | | | 0.35 | % | | | 0.35 | % | | | 0.36 | % | | | 0.36 | % |
| | | | | | | | | | | | | | | | | | | | |
| | | | | |
Total expenses after fees waived and/or reimbursed | | | 0.35 | % | | | 0.35 | % | | | 0.35 | % | | | 0.36 | % | | | 0.36 | % |
| | | | | | | | | | | | | | | | | | | | |
| | | | | |
Net investment income | | | 1.06 | % | | | 1.49 | % | | | 1.62 | % | | | 1.60 | % | | | 1.61 | % |
| | | | | | | | | | | | | | | | | | | | |
| | | | | |
Supplemental Data | | | | | | | | | | | | | | | | | | | | |
Net assets, end of year (000) | | $ | 2,806,390 | | | $ | 2,579,349 | | | $ | 2,667,724 | | | $ | 2,160,098 | | | $ | 2,271,969 | |
| | | | | | | | | | | | | | | | | | | | |
| | | | | |
Portfolio turnover rate of the Master Portfolio | | | 6 | % | | | 5 | % | | | 3 | % | | | 12 | % | | | 11 | % |
| | | | | | | | | | | | | | | | | | | | |
| (a) | Based on average shares outstanding. |
| (b) | Distributions for annual periods determined in accordance with U.S. federal income tax regulations. |
| (c) | Where applicable, assumes the reinvestment of distributions. |
| (d) | Includes the Fund’s share of the Master Portfolio’s allocated net expenses and/or net investment income. |
| (e) | Includes the Fund’s share of the Master Portfolio’s allocated fees waived of less than 0.01%. |
| (f) | Excludes fees and expenses incurred indirectly as a result of investments in underlying funds. |
See notes to financial statements.
| | |
| 14 | | 2 0 2 1 BLACK ROCK ANNUAL REPORT TO SHAREHOLDERS |
Financial Highlights (continued)
(For a share outstanding throughout each period)
| | | | | | | | | | | | | | | | | | | | |
| | | iShares S&P 500 Index Fund (continued) | |
| |
| | | Investor P | |
| | | |
| | | Year Ended December 31, | | | | | | |
| Period from
08/06/18to 12/31/18 |
(a) |
| | | 2021 | | | 2020 | | | 2019 | | | | |
| | | | | | |
Net asset value, beginning of period | | $ | 443.73 | | | $ | 382.22 | | | $ | 297.10 | | | | | | | $ | 339.48 | |
| | | | | | | | | | | | | | | | | | | | |
| | | | | |
Net investment income(b) | | | 5.32 | | | | 5.64 | | | | 5.61 | | | | | | | | 2.20 | |
Net realized and unrealized gain (loss) | | | 119.30 | | | | 62.00 | | | | 86.00 | | | | | | | | (40.58 | ) |
| | | | | | | | | | | | | | | | | | | | |
| | | | | |
Net increase (decrease) from investment operations | | | 124.62 | | | | 67.64 | | | | 91.61 | | | | | | | | (38.38 | ) |
| | | | | | | | | | | | | | | | | | | | |
| | | | | |
Distributions(c) | | | | | | | | | | | | | | | | | | | | |
From net investment income | | | (5.37 | ) | | | (5.64 | ) | | | (6.49 | ) | | | | | | | (2.89 | ) |
From net realized gain | | | (3.20 | ) | | | (0.49 | ) | | | — | | | | | | | | (1.11 | ) |
| | | | | | | | | | | | | | | | | | | | |
| | | | | |
Total distributions | | | (8.57 | ) | | | (6.13 | ) | | | (6.49 | ) | | | | | | | (4.00 | ) |
| | | | | | | | | | | | | | | | | | | | |
| | | | | |
Net asset value, end of period | | $ | 559.78 | | | $ | 443.73 | | | $ | 382.22 | | | | | | | $ | 297.10 | |
| | | | | | | | | | | | | | | | | | | | |
| | | | | |
Total Return(d) | | | | | | | | | | | | | | | | | | | | |
Based on net asset value | | | 28.23 | % | | | 18.05 | % | | | 31.02 | % | | | | | | | (11.38 | )%(e) |
| | | | | | | | | | | | | | | | | | | | |
| | | | | |
Ratios to Average Net Assets(f)(g)(h) | | | | | | | | | | | | | | | | | | | | |
Total expenses | | | 0.35 | % | | | 0.35 | % | | | 0.35 | % | | | | | | | 0.35 | %(i) |
| | | | | | | | | | | | | | | | | | | | |
| | | | | |
Total expenses after fees waived and/or reimbursed | | | 0.35 | % | | | 0.35 | % | | | 0.35 | % | | | | | | | 0.35 | %(i) |
| | | | | | | | | | | | | | | | | | | | |
| | | | | |
Net investment income | | | 1.05 | % | | | 1.48 | % | | | 1.62 | % | | | | | | | 1.68 | %(i) |
| | | | | | | | | | | | | | | | | | | | |
| | | | | |
Supplemental Data | | | | | | | | | | | | | | | | | | | | |
Net assets, end of period (000) | | $ | 1,667,178 | | | $ | 1,387,865 | | | $ | 1,278,339 | | | | | | | $ | 1,064,145 | |
| | | | | | | | | | | | | | | | | | | | |
| | | | | |
Portfolio turnover rate of the Master Portfolio | | | 6 | % | | | 5 | % | | | 3 | % | | | | | | | 12 | % |
| | | | | | | | | | | | | | | | | | | | |
| (a) | Commencement of operations. |
| (b) | Based on average shares outstanding. |
| (c) | Distributions for annual periods determined in accordance with U.S. federal income tax regulations. |
| (d) | Where applicable, excludes the effects of any sales charges and assumes the reinvestment of distributions. |
| (e) | Aggregate total return. |
| (f) | Includes the Fund’s share of the Master Portfolio’s allocated net expenses and/or net investment income. |
| (g) | Includes the Fund’s share of the Master Portfolio’s allocated fees waived of less than 0.01%. |
| (h) | Excludes fees and expenses incurred indirectly as a result of investments in underlying funds. |
See notes to financial statements.
| | |
FUND FINANCIAL HIGHLIGHTS | | 15 |
Financial Highlights (continued)
(For a share outstanding throughout each period)
| | | | | | | | | | | | | | | | |
| | | iShares S&P 500 Index Fund (continued) | |
| |
| | | Class G | |
| | | | | | | | | | | | Period from | |
| | | Year Ended December 31, | | | | | | | | 07/01/19 | (a) |
| | | | |
| | | 2021 | | | 2020 | | | | | | to 12/31/19 | |
| | | | |
Net asset value, beginning of period | | $ | 444.26 | | | $ | 382.71 | | | | | | | $ | 351.81 | |
| | | | | | | | | | | | | | | | |
| | | | |
Net investment income(b) | | | 7.04 | | | | 6.93 | | | | | | | | 3.41 | |
Net realized and unrealized gain | | | 119.45 | | | | 62.05 | | | | | | | | 31.80 | |
| | | | | | | | | | | | | | | | |
| | | | |
Net increase from investment operations | | | 126.49 | | | | 68.98 | | | | | | | | 35.21 | |
| | | | | | | | | | | | | | | | |
| | | | |
Distributions(c) | | | | | | | | | | | | | | | | |
From net investment income | | | (7.08 | ) | | | (6.94 | ) | | | | | | | (4.31 | ) |
From net realized gain | | | (3.20 | ) | | | (0.49 | ) | | | | | | | — | |
| | | | | | | | | | | | | | | | |
| | | | |
Total distributions | | | (10.28 | ) | | | (7.43 | ) | | | | | | | (4.31 | ) |
| | | | | | | | | | | | | | | | |
| | | | |
Net asset value, end of period | | $ | 560.47 | | | $ | 444.26 | | | | | | | $ | 382.71 | |
| | | | | | | | | | | | | | | | |
| | | | |
Total Return(d) | | | | | | | | | | | | | | | | |
Based on net asset value | | | 28.67 | % | | | 18.45 | % | | | | | | | 10.07 | %(e) |
| | | | | | | | | | | | | | | | |
| | | | |
Ratios to Average Net Assets(f)(g)(h) | | | | | | | | | | | | | | | | |
Total expenses | | | 0.01 | % | | | 0.01 | % | | | | | | | 0.01 | %(i) |
| | | | | | | | | | | | | | | | |
| | | | |
Total expenses after fees waived and/or reimbursed | | | 0.01 | % | | | 0.01 | % | | | | | | | 0.01 | %(i) |
| | | | | | | | | | | | | | | | |
| | | | |
Net investment income | | | 1.39 | % | | | 1.82 | % | | | | | | | 1.89 | %(i) |
| | | | | | | | | | | | | | | | |
| | | | |
Supplemental Data | | | | | | | | | | | | | | | | |
Net assets, end of period (000) | | $ | 10,447,837 | | | $ | 7,378,823 | | | | | | | $ | 5,796,331 | |
| | | | | | | | | | | | | | | | |
| | | | |
Portfolio turnover rate of the Master Portfolio | | | 6 | % | | | 5 | % | | | | | | | 3 | % |
| | | | | | | | | | | | | | | | |
| (a) | Commencement of operations. |
| (b) | Based on average shares outstanding. |
| (c) | Distributions for annual periods determined in accordance with U.S. federal income tax regulations. |
| (d) | Where applicable, assumes the reinvestment of distributions. |
| (e) | Aggregate total return. |
| (f) | Includes the Fund’s share of the Master Portfolio’s allocated net expenses and/or net investment income. |
| (g) | Includes the Fund’s share of the Master Portfolio’s allocated fees waived of less than 0.01%. |
| (h) | Excludes fees and expenses incurred indirectly as a result of investments in underlying funds. |
See notes to financial statements.
| | |
| 16 | | 2 0 2 1 BLACK ROCK ANNUAL REPORT TO SHAREHOLDERS |
Financial Highlights (continued)
(For a share outstanding throughout each period)
| | | | | | | | | | | | | | | | | | | | |
| | | iShares S&P 500 Index Fund (continued) | |
| |
| | | Class K | |
| |
| | | Year Ended December 31, | |
| | | | | |
| | | 2021 | | | 2020 | | | 2019 | | | 2018 | | | 2017 | |
| | | | | | |
Net asset value, beginning of year | | $ | 444.27 | | | $ | 382.72 | | | $ | 297.46 | | | $ | 318.37 | | | $ | 267.08 | |
| | | | | | | | | | | | | | | | | | | | |
| | | | | |
Net investment income(a) | | | 6.94 | | | | 6.86 | | | | 6.74 | | | | 6.29 | | | | 5.69 | |
Net realized and unrealized gain (loss) | | | 119.47 | | | | 62.05 | | | | 86.12 | | | | (19.76 | ) | | | 51.97 | |
| | | | | | | | | | | | | | | | | | | | |
| | | | | |
Net increase (decrease) from investment operations | | | 126.41 | | | | 68.91 | | | | 92.86 | | | | (13.47 | ) | | | 57.66 | |
| | | | | | | | | | | | | | | | | | | | |
| | | | | |
Distributions(b) | | | | | | | | | | | | | | | | | | | | |
From net investment income | | | (6.99 | ) | | | (6.87 | ) | | | (7.60 | ) | | | (6.04 | ) | | | (5.52 | ) |
From net realized gain | | | (3.20 | ) | | | (0.49 | ) | | | — | | | | (1.40 | ) | | | (0.85 | ) |
| | | | | | | | | | | | | | | | | | | | |
| | | | | |
Total distributions | | | (10.19 | ) | | | (7.36 | ) | | | (7.60 | ) | | | (7.44 | ) | | | (6.37 | ) |
| | | | | | | | | | | | | | | | | | | | |
| | | | | |
Net asset value, end of year | | $ | 560.49 | | | $ | 444.27 | | | $ | 382.72 | | | $ | 297.46 | | | $ | 318.37 | |
| | | | | | | | | | | | | | | | | | | | |
| | | | | |
Total Return(c) | | | | | | | | | | | | | | | | | | | | |
Based on net asset value | | | 28.65 | % | | | 18.42 | % | | | 31.44 | % | | | (4.38 | )% | | | 21.77 | % |
| | | | | | | | | | | | | | | | | | | | |
| | | | | |
Ratios to Average Net Assets(d)(e)(f) | | | | | | | | | | | | | | | | | | | | |
Total expenses | | | 0.03 | % | | | 0.03 | % | | | 0.03 | % | | | 0.04 | % | | | 0.04 | % |
| | | | | | | | | | | | | | | | | | | | |
| | | | | |
Total expenses after fees waived and/or reimbursed | | | 0.03 | % | | | 0.03 | % | | | 0.03 | % | | | 0.04 | % | | | 0.04 | % |
| | | | | | | | | | | | | | | | | | | | |
| | | | | |
Net investment income | | | 1.37 | % | | | 1.80 | % | | | 1.96 | % | | | 1.92 | % | | | 1.93 | % |
| | | | | | | | | | | | | | | | | | | | |
| | | | | |
Supplemental Data | | | | | | | | | | | | | | | | | | | | |
Net assets, end of year (000) | | $ | 12,887,257 | | | $ | 10,359,743 | | | $ | 8,471,585 | | | $ | 9,375,051 | | | $ | 6,618,222 | |
| | | | | | | | | | | | | | | | | | | | |
| | | | | |
Portfolio turnover rate of the Master Portfolio | | | 6 | % | | | 5 | % | | | 3 | % | | | 12 | % | | | 11 | % |
| | | | | | | | | | | | | | | | | | | | |
| (a) | Based on average shares outstanding. |
| (b) | Distributions for annual periods determined in accordance with U.S. federal income tax regulations. |
| (c) | Where applicable, assumes the reinvestment of distributions. |
| (d) | Includes the Fund’s share of the Master Portfolio’s allocated net expenses and/or net investment income. |
| (e) | Includes the Fund’s share of the Master Portfolio’s allocated fees waived of less than 0.01%. |
| (f) | Excludes fees and expenses incurred indirectly as a result of investments in underlying funds. |
See notes to financial statements.
| | |
FUND FINANCIAL HIGHLIGHTS | | 17 |
Notes to Financial Statements
BlackRock Funds III (the “Trust”) is registered under the Investment Company Act of 1940, as amended (the “1940 Act”), as an open-end management investment company. The Trust is organized as a Delaware statutory trust. iShares S&P 500 Index Fund (the “Fund”) is a series of the Trust. The Fund is classified as diversified.
The Fund seeks to achieve its investment objective by investing all of its assets in S&P 500 Index Master Portfolio (the “Master Portfolio”), a series of Master Investment Portfolio (“MIP”) and an affiliate of the Trust, which has the same investment objective and strategies as the Fund. The value of the Fund’s investment in the Master Portfolio reflects the Fund’s proportionate interest in the net assets of the Master Portfolio. The performance of the Fund is directly affected by the performance of the Master Portfolio. At December 31, 2021, the percentage of the Master Portfolio owned by the Fund was 98.2%. The financial statements of the Master Portfolio, including the Schedule of Investments, are included elsewhere in this report and should be read in conjunction with the Fund’s financial statements.
The Fund offers multiple classes of shares. All classes of shares have identical voting, dividend, liquidation and other rights and are subject to the same terms and conditions, except that certain classes bear expenses related to the shareholder servicing and distribution of such shares. Institutional, Service and Class K Shares are sold only to certain eligible investors. Service, Investor A, and Investor P Shares bear certain expenses related to shareholder servicing of such shares. Investor A Shares are generally available through financial intermediaries. Investor P Shares are only available through registered representatives of an insurance company’s broker-dealer that has entered into an agreement with the Fund’s distributor to offer such shares. Class G Shares are available only to investors on eligible platforms. Each class has exclusive voting rights with respect to matters relating to its shareholder servicing and distribution expenditures.
| | | | | | | | |
| | | | |
| Share Class | | Initial Sales Charge | | CDSC | | | Conversion Privilege |
| | | |
Institutional, Service, Investor A, Class K and Class G Shares | | No | | | No | | | None |
Investor P Shares | | Yes | | | No | (a) | | None |
| | (a) | Investor P Shares may be subject to a contingent deferred sales charge (“CDSC”) for certain redemptions where no initial sales charge was paid at the time of purchase. | |
The Board of Trustees of the Trust and Board of Trustees of MIP are referred to throughout this report as the “Board” and the members are referred to as “Trustees”.
The Fund, together with certain other registered investment companies advised by BlackRock Fund Advisors (“BFA” or the “Manager”) or its affiliates, is included in a complex of open-end equity, multi-asset, index and money market funds referred to as the BlackRock Multi-Asset Complex.
| 2. | SIGNIFICANT ACCOUNTING POLICIES |
The financial statements are prepared in conformity with accounting principles generally accepted in the United States of America (“U.S. GAAP”), which may require management to make estimates and assumptions that affect the reported amounts of assets and liabilities in the financial statements, disclosure of contingent assets and liabilities at the date of the financial statements and the reported amounts of increases and decreases in net assets from operations during the reporting period. Actual results could differ from those estimates. The Fund is considered an investment company under U.S. GAAP and follows the accounting and reporting guidance applicable to investment companies. Below is a summary of significant accounting policies:
Investment Transactions and Income Recognition: For financial reporting purposes, contributions to and withdrawals from the Master Portfolio are accounted for on a trade date basis. The Fund records its proportionate share of the Master Portfolio’s income, expenses and realized and unrealized gains and losses on a daily basis. Realized and unrealized gains and losses are adjusted utilizing partnership tax allocation rules. In addition, the Fund accrues its own expenses. Income, expenses and realized and unrealized gains and losses are allocated daily to each class based on its relative net assets.
Distributions: Distributions paid by the Fund are recorded on the ex-dividend dates. The character and timing of distributions are determined in accordance with U.S. federal income tax regulations, which may differ from U.S. GAAP.
Indemnifications: In the normal course of business, the Fund enters into contracts that contain a variety of representations that provide general indemnification. The Fund’s maximum exposure under these arrangements is unknown because it involves future potential claims against the Fund, which cannot be predicted with any certainty.
Other: Expenses directly related to the Fund or its classes are charged to the Fund or the applicable class. Expenses directly related to the Fund and other shared expenses prorated to the Fund are allocated daily to each class based on its relative net assets or other appropriate methods. Other operating expenses shared by several funds, including other funds managed by BlackRock Advisors, LLC (“BAL” or the “Administrator”), are prorated among those funds on the basis of relative net assets or other appropriate methods.
| 3. | INVESTMENT VALUATION AND FAIR VALUE MEASUREMENTS |
Investment Valuation Policies: The Fund’s policy is to value its financial instruments at fair value. The Fund records its investment in the Master Portfolio at fair value based on the Fund’s proportionate interest in the net assets of the Master Portfolio. Valuation of securities held by the Master Portfolio is discussed in Note 3 of the Master Portfolio’s Notes to Financial Statements, which are included elsewhere in this report.
| 4. | ADMINISTRATION AGREEMENT AND OTHER TRANSACTIONS WITH AFFILIATES |
Administration: The Trust, on behalf of the Fund, entered into an Administration Agreement with BAL, an indirect, wholly-owned subsidiary of BlackRock, Inc. (“BlackRock”), to provide general administrative services (other than investment advice and related portfolio activities). BAL has agreed to bear all of the Fund’s ordinary operating expenses, excluding, generally, investment advisory fees, distribution fees, brokerage and other expenses related to the execution of portfolio transactions, extraordinary expenses and
| | |
| 18 | | 2 0 2 1 BLACK ROCK ANNUAL REPORT TO SHAREHOLDERS |
Notes to Financial Statements (continued)
certain other expenses which are borne by the Fund. BAL is entitled to receive for these administrative services an annual fee based on the average daily net assets of the Fund as follows:
| | | | | | | | | | | | | | | | | | | | | | | | |
| |
| | | | | | |
| | | Institutional | | | Service | | | Investor A | | | Investor P | | | Class G | | | Class K | |
| |
| | | | | | |
Administration fees - class specific | | | 0.09 | % | | | 0.06 | % | | | 0.09 | % | | | 0.09 | % | | | 0.0025 | % | | | 0.02% | |
| |
From time to time, BAL may waive such fees in whole or in part. Any such waiver will reduce the expenses of the Fund and, accordingly, have a favorable impact on its performance. BAL may delegate certain of its administration duties to sub-administrators.
The fees and expenses of the Trust’s trustees who are not “interested persons” of the Trust, as defined in the 1940 Act (“Independent Trustees”), counsel to the Independent Trustees and the Fund’s independent registered public accounting firm (together, the “independent expenses”) are paid directly by the Fund. BAL has contractually agreed to reimburse the Fund or provide an offsetting credit against the administration fees paid by the Fund in an amount equal to these independent expenses through June 30, 2023. For the year ended December 31, 2021, the amount waived was $14,267 which is included in fees waived and/or reimbursed by the Administrator in the Statement of Operations.
For the year ended December 31, 2021, the following table shows the class specific administration fees borne directly by each share class of the Fund:
| | | | | | | | | | | | | | | | | | | | | | | | | | | | |
| |
| | | | | | | |
| | | Institutional | | | Service | | | Investor A | | | Investor P | | | Class G | | | Class K | | | Total | |
| |
| | | | | | | |
Administration fees | | $ | 4,157,871 | | | $ | 344,610 | | | | $ 2,462,889 | | | | $ 1,374,665 | | | | $ 225,442 | | | $ | 2,347,618 | | | $ | 10,913,095 | |
| |
Service Fees: The Trust, on behalf of the Fund, entered into a Distribution Agreement and a Distribution and Service Plan with BlackRock Investments, LLC (“BRIL”), an affiliate of the Administrator. Pursuant to the Distribution and Service Plan and in accordance with Rule 12b-1 under the 1940 Act, the Fund pays BRIL ongoing service fees. The fees are accrued daily and paid monthly at annual rates based upon the average daily net assets of the relevant share class of the Fund as follows:
| | | | |
| |
| |
| Share Class | | Service Fees | |
| |
| |
Service | | | 0.15% | |
Investor A | | | 0.25 | |
Investor P | | | 0.25 | |
| |
BRIL and broker-dealers, pursuant to sub-agreements with BRIL, provide shareholder servicing to the Fund. The ongoing service fee compensates BRIL and each broker-dealer for providing shareholder servicing related services to shareholders.
For the year ended December 31, 2021, the following table shows the class specific service fees borne directly by each share class of the Fund:
| | | | | | | | | | | | | | | | | | | | | | | | | | | | |
| |
| | | | | | | |
| | | Service | | | | | | Investor A | | | | | | Investor P | | | | | | Total | |
| |
| | | | | | | |
Service fees — class specific | | $ | 861,525 | | | | | | | $ | 6,841,358 | | | | | | | $ | 3,818,515 | | | | | | | $ | 11,521,398 | |
| |
Other Fees: For the year ended December 31, 2021, affiliates earned underwriting discounts, direct commissions and dealer concessions on sales of the Fund’s Investor P Shares for a total of $110,839.
For the year ended December 31, 2021, affiliates received CDSCs as follows:
| | | | | | | | |
| |
| | |
| | | Investor A | | | Total | |
| |
| | |
CDSC | | $ | 351 | | | $ | 351 | |
| |
Interfund Lending: In accordance with an exemptive order (the “Order”) from the U.S. Securities and Exchange Commission (“SEC”), the Fund may participate in a joint lending and borrowing facility for temporary purposes (the “Interfund Lending Program”), subject to compliance with the terms and conditions of the Order, and to the extent permitted by the Fund’s investment policies and restrictions. The Fund is currently permitted to borrow and lend under the Interfund Lending Program.
A lending BlackRock fund may lend in aggregate up to 15% of its net assets but may not lend more than 5% of its net assets to any one borrowing fund through the Interfund Lending Program. A borrowing BlackRock fund may not borrow through the Interfund Lending Program or from any other source more than 33 1/3% of its total assets (or any lower threshold provided for by the fund’s investment restrictions). If a borrowing BlackRock fund’s total outstanding borrowings exceed 10% of its total assets, each of its outstanding interfund loans will be subject to collateralization of at least 102% of the outstanding principal value of the loan. All interfund loans are for temporary or emergency purposes and the interest rate to be charged will be the average of the highest current overnight repurchase agreement rate available to a lending fund and the bank loan rate, as calculated according to a formula established by the Board.
During the year ended December 31, 2021, the Fund did not participate in the Interfund Lending Program.
Trustees and Officers: Certain trustees and/or officers of the Trust are directors and/or officers of BlackRock or its affiliates.
It is the Fund’s policy to comply with the requirements of the Internal Revenue Code of 1986, as amended, applicable to regulated investment companies, and to distribute substantially all of its taxable income to its shareholders. Therefore, no U.S. federal income tax provision is required.
| | |
FUND NOTES TO FINANCIAL STATEMENTS | | 19 |
Notes to Financial Statements (continued)
The Fund files U.S. federal and various state and local tax returns. No income tax returns are currently under examination. The statute of limitations on the Fund’s U.S. federal tax returns generally remains open for a period of three fiscal years after they are filed. The statutes of limitations on the Fund’s state and local tax returns may remain open for an additional year depending upon the jurisdiction.
Management has analyzed tax laws and regulations and their application to the Fund as of December 31, 2021, inclusive of the open tax return years, and does not believe that there are any uncertain tax positions that require recognition of a tax liability in the Fund’s financial statements.
The tax character of distributions paid was as follows:
| | | | | | | | | | | | |
| | | | |
| Fund Name | | Year Ended 12/31/21 | | | | | | Year Ended 12/31/20 | |
| | | |
iShares S&P 500 Index Fund | | | | | | | | | | | | |
Ordinary income | | $ | 465,174,493 | | | | | | | $ | 400,693,756 | |
Long-term capital gains | | | 129,580,665 | | | | | | | | 24,679,900 | |
| | | | | | | | | | | | |
| | | |
| | $ | 594,755,158 | | | | | | | $ | 425,373,656 | |
| | | | | | | | | | | | |
As of December 31, 2021, the tax components of accumulated earnings (loss) were as follows:
| | | | | | | | | | | | | | | | |
| |
| | | | |
| Fund Name | | Undistributed Ordinary Income | | | Undistributed Long-Term Capital Gains | | | Net Unrealized Gains (Losses)(a) | | | Total | |
| |
| | | | |
iShares S&P 500 Index Fund | | $ | 8,997,028 | | | $ | 67,644,618 | | | $ | 19,369,412,924 | | | $ | 19,446,054,570 | |
| |
| | (a) | The difference between book-basis and tax-basis net unrealized gains was attributable primarily to the timing and recognition of partnership income. | |
As of the year ended December 31, 2021, the Fund utilized the following amount of its capital loss carry forward:
| | | | |
| |
| |
| Fund Name | | Amounts | |
| |
| |
iShares S&P 500 Index Fund | | $ | 23,858,276 | |
| |
| 6. | CAPITAL SHARE TRANSACTIONS |
Transactions in capital shares for each class were as follows:
| | | | | | | | | | | | | | | | | | | | | | | | | | | | |
| |
| | | |
| | | Year Ended
12/31/21 | | | | | | Year Ended
12/31/20 | |
| | | | | | | | | | | | | | | | | | | | | | |
| | | | | | | |
Fund Name / Share Class | | | Shares | | | | | | | | Amounts | | | | | | | | Shares | | | | | | | | Amounts | |
| |
| | | | | | | |
iShares S&P 500 Index Fund | | | | | | | | | | | | | | | | | | | | | | | | | | | | |
Institutional | | | | | | | | | | | | | | | | | | | | | | | | | | | | |
Shares sold | | | 3,428,456 | | | | | | | $ | 1,752,240,643 | | | | | | | | 3,679,496 | | | | | | | $ | 1,374,045,597 | |
Shares issued in reinvestment of distributions | | | 172,207 | | | | | | | | 89,763,610 | | | | | | | | 179,841 | | | | | | | | 65,779,653 | |
Shares redeemed | | | (3,048,036 | ) | | | | | | | (1,514,143,662 | ) | | | | | | | (4,857,713 | ) | | | | | | | (1,808,867,351 | ) |
| | | | | | | | | | | | | | | | | | | | | | | | | | | | |
| | | | | | | |
| | | 552,627 | | | | | | | $ | 327,860,591 | | | | | | | | (998,376 | ) | | | | | | $ | (369,042,101 | ) |
| | | | | | | | | | | | | | | | | | | | | | | | | | | | |
| | | | | | | |
Service | | | | | | | | | | | | | | | | | | | | | | | | | | | | |
Shares sold | | | 307,882 | | | | | | | $ | 153,383,975 | | | | | | | | 738,300 | | | | | | | $ | 300,927,299 | |
Shares issued in reinvestment of distributions | | | 18,900 | | | | | | | | 9,763,495 | | | | | | | | 18,821 | | | | | | | | 7,091,729 | |
Shares redeemed | | | (708,694 | ) | | | | | | | (362,768,495 | ) | | | | | | | (315,706 | ) | | | | | | | (122,420,332 | ) |
| | | | | | | | | | | | | | | | | | | | | | | | | | | | |
| | | | | | | |
| | | (381,912 | ) | | | | | | $ | (199,621,025 | ) | | | | | | | 441,415 | | | | | | | $ | 185,598,696 | |
| | | | | | | | | | | | | | | | | | | | | | | | | | | | |
| | | | | | | |
Investor A | | | | | | | | | | | | | | | | | | | | | | | | | | | | |
Shares sold and automatic conversion of shares | | | 1,157,134 | | | | | | | $ | 578,808,382 | | | | | | | | 2,442,035 | | | | | | | $ | 916,471,286 | |
Shares issued in reinvestment of distributions | | | 81,073 | | | | | | | | 42,206,643 | | | | | | | | 104,073 | | | | | | | | 37,871,112 | |
Shares redeemed | | | (2,037,420 | ) | | | | | | | (1,027,376,732 | ) | | | | | | | (3,712,334 | ) | | | | | | | (1,436,511,775 | ) |
| | | | | | | | | | | | | | | | | | | | | | | | | | | | |
| | | | | | | |
| | | (799,213 | ) | | | | | | $ | (406,361,707 | ) | | | | | | | (1,166,226 | ) | | | | | | $ | (482,169,377 | ) |
| | | | | | | | | | | | | | | | | | | | | | | | | | | | |
| | | | | | | |
Investor C1(a) | | | | | | | | | | | | | | | | | | | | | | | | | | | | |
Shares sold | | | — | | | | | | | $ | — | | | | | | | | — | | | | | | | $ | — | |
Shares issued in reinvestment of distributions | | | — | | | | | | | | — | | | | | | | | — | | | | | | | | — | |
Shares redeemed and automatic conversion of shares | | | — | | | | | | | | — | | | | | | | | (6,810 | ) | | | | | | | (2,616,935 | ) |
| | | | | | | | | | | | | | | | | | | | | | | | | | | | |
| | | | | | | |
| | | — | | | | | | | $ | — | | | | | | | | (6,810 | ) | | | | | | $ | (2,616,935 | ) |
| | | | | | | | | | | | | | | | | | | | | | | | | | | | |
| | | | | | | |
Investor P | | | | | | | | | | | | | | | | | | | | | | | | | | | | |
Shares sold | | | 191,871 | | | | | | | $ | 96,505,627 | | | | | | | | 245,118 | | | | | | | $ | 90,608,518 | |
Shares issued in reinvestment of distributions | | | 49,144 | | | | | | | | 25,616,598 | | | | | | | | 53,787 | | | | | | | | 19,657,110 | |
Shares redeemed | | | (390,454 | ) | | | | | | | (195,039,448 | ) | | | | | | | (515,707 | ) | | | | | | | (192,140,214 | ) |
| | | | | | | | | | | | | | | | | | | | | | | | | | | | |
| | | | | | | |
| | | (149,439 | ) | | | | | | $ | (72,917,223 | ) | | | | | | | (216,802 | ) | | | | | | $ | (81,874,586 | ) |
| | | | | | | | | | | | | | | | | | | | | | | | | | | | |
| | |
| 20 | | 2 0 2 1 BLACK ROCK ANNUAL REPORT TO SHAREHOLDERS |
Notes to Financial Statements (continued)
| | | | | | | | | | | | | | | | |
| |
| | |
| | | Year Ended 12/31/21 | | | Year Ended 12/31/20 | |
| | | | | | | | |
| | | | |
| Fund Name / Share Class (continued) | | Shares | | | Amounts | | | Shares | | | Amounts | |
| |
| | | | |
iShares S&P 500 Index Fund (continued) | | | | | | | | | | | | | | | | |
Class G | | | | | | | | | | | | | | | | |
Shares sold | | | 4,376,624 | | | $ | 2,184,933,039 | | | | 4,554,687 | | | $ | 1,711,983,156 | |
Shares issued in reinvestment of distributions | | | 359,371 | | | | 187,153,946 | | | | 325,731 | | | | 119,640,328 | |
Shares redeemed | | | (2,704,051 | ) | | | (1,378,489,143 | ) | | | (3,416,870 | ) | | | (1,310,049,547 | ) |
| | | | | | | | | | | | | | | | |
| | | | |
| | | 2,031,944 | | | $ | 993,597,842 | | | | 1,463,548 | | | $ | 521,573,937 | |
| | | | | | | | | | | | | | | | |
Class K | | | | | | | | | | | | | | | | |
Shares sold | | | 5,757,122 | | | $ | 2,877,370,135 | | | | 9,201,699 | | | $ | 3,392,445,782 | |
Shares issued in reinvestment of distributions | | | 418,815 | | | | 217,893,849 | | | | 426,140 | | | | 156,776,764 | |
Shares redeemed | | | (6,501,345 | ) | | | (3,269,558,650 | ) | | | (8,444,927 | ) | | | (3,177,983,912 | ) |
| | | | | | | | | | | | | | | | |
| | | | |
| | | (325,408 | ) | | $ | (174,294,666 | ) | | | 1,182,912 | | | $ | 371,238,634 | |
| | | | | | | | | | | | | | | | |
| | | | |
| | | 928,599 | | | $ | 468,263,812 | | | | 699,661 | | | $ | 142,708,268 | |
| | | | | | | | | | | | | | | | |
| | (a) | On February 24, 2020, the Fund’s issued and outstanding Investor C1 Shares converted into Investor A Shares. | |
As of December 31, 2021, shares owned by BlackRock Financial Management, Inc., an affiliate of the Fund, were as follows:
| | | | | | | | | | | | |
| |
Fund Name | | | Investor P | | | | Class G | | | | Total | |
| |
| | | |
iShares S&P 500 Index Fund | | | 589 | | | | 143 | | | | 732 | |
| |
Management has evaluated the impact of all subsequent events on the Fund through the date the financial statements were issued and has determined that there were no subsequent events requiring adjustment or additional disclosure in the financial statements.
| | |
FUND NOTES TO FINANCIAL STATEMENTS | | 21 |
Report of Independent Registered Public Accounting Firm
To the Board of Trustees of BlackRock Funds III and Shareholders of iShares S&P 500 Index Fund
Opinion on the Financial Statements
We have audited the accompanying statement of assets and liabilities of iShares S&P 500 Index Fund (one of the series constituting BlackRock Funds III, referred to hereafter as the “Fund”) as of December 31, 2021, the related statement of operations for the year ended December 31, 2021, the statements of changes in net assets for each of the two years in the period ended December 31, 2021, including the related notes, and the financial highlights for each of the periods indicated therein (collectively referred to as the “financial statements”). In our opinion, the financial statements present fairly, in all material respects, the financial position of the Fund as of December 31, 2021, the results of its operations for the year then ended, the changes in its net assets for each of the two years in the period ended December 31, 2021 and the financial highlights for each of the periods indicated therein in conformity with accounting principles generally accepted in the United States of America.
Basis for Opinion
These financial statements are the responsibility of the Fund’s management. Our responsibility is to express an opinion on the Fund’s financial statements based on our audits. We are a public accounting firm registered with the Public Company Accounting Oversight Board (United States) (PCAOB) and are required to be independent with respect to the Fund in accordance with the U.S. federal securities laws and the applicable rules and regulations of the Securities and Exchange Commission and the PCAOB.
We conducted our audits of these financial statements in accordance with the standards of the PCAOB. Those standards require that we plan and perform the audit to obtain reasonable assurance about whether the financial statements are free of material misstatement, whether due to error or fraud.
Our audits included performing procedures to assess the risks of material misstatement of the financial statements, whether due to error or fraud, and performing procedures that respond to those risks. Such procedures included examining, on a test basis, evidence regarding the amounts and disclosures in the financial statements. Our audits also included evaluating the accounting principles used and significant estimates made by management, as well as evaluating the overall presentation of the financial statements. Our procedures included confirmation of securities owned as of December 31, 2021 by correspondence with the administrator of the Master Portfolio. We believe that our audits provide a reasonable basis for our opinion.
/s/PricewaterhouseCoopers LLP
Philadelphia, Pennsylvania
February 15, 2022
We have served as the auditor of one or more BlackRock investment companies since 2000.
| | |
| 22 | | 2 0 2 1 BLACK ROCK ANNUAL REPORT TO SHAREHOLDERS |
| | |
| Important Tax Information (unaudited) | | |
The following amounts, or maximum amounts allowable by law, are hereby designated as qualified dividend income for individuals for the fiscal year ended December 31, 2021:
| | |
|
| |
Fund Name | | Qualified Dividend Income |
|
| |
iShares S&P 500 Index Fund | | $ 411,955,391 |
|
The following amount, or maximum amount allowable by law, is hereby designated as qualified business income for individuals for the fiscal year ended December 31, 2021:
| | | | |
| |
| |
| Fund Name | | Qualified Business Income | |
| |
| |
iShares S&P 500 Index Fund | | $ | 13,624,112 | |
| |
The Fund hereby designates the following amount, or maximum amount allowable by law, as capital gain dividends, subject to a long-term capital gains tax rate of not greater than 20%, for the fiscal year ended December 31, 2021:
| | | | |
| |
| |
| Fund Name | | 20% Rate Long-Term Capital Gain Dividends | |
| |
| |
iShares S&P 500 Index Fund | | $ | 129,580,665 | |
| |
The following percentage, or maximum percentage allowable by law, of ordinary income distributions paid during the fiscal year ended December 31, 2021 qualified for the dividends-received deduction for corporate shareholders:
| | | | |
| |
| |
| Fund Name | | Dividends-Received Deduction | |
| |
| |
iShares S&P 500 Index Fund | | | 87.49% | |
| |
The Fund hereby designates the following amount, or maximum amount allowable by law, as qualified short-term capital gain eligible for exemption from U.S. withholding tax for nonresident aliens and foreign corporations for the fiscal year ended December 31, 2021:
| | | | |
| |
| |
| Fund Name | | Qualified Short-Term Capital Gains | |
| |
| |
iShares S&P 500 Index Fund | | $ | 62,820,698 | |
| |
| | |
IMPORTANT TAX INFORMATION | | 23 |
| | |
| Master Portfolio Information as of December 31, 2021 | | S&P 500 Index Master Portfolio |
TEN LARGEST HOLDINGS
| | | | |
| |
| |
| Security | | Percent of Net Assets | |
| |
| |
Apple, Inc. | | | 7% | |
Microsoft Corp. | | | 6 | |
Amazon.com, Inc. | | | 4 | |
Alphabet, Inc., Class A | | | 2 | |
Tesla, Inc. | | | 2 | |
Alphabet, Inc., Class C | | | 2 | |
Meta Platforms, Inc., Class A | | | 2 | |
NVIDIA Corp. | | | 2 | |
Berkshire Hathaway, Inc., Class B | | | 1 | |
iShares Core S&P 500 ETF | | | 1 | |
SECTOR ALLOCATION
| | | | |
| | |
| Sector(a) | | Percent of Net Assets | |
| |
Information Technology | | | 29% | |
Health Care | | | 13 | |
Consumer Discretionary | | | 12 | |
Financials | | | 10 | |
Communication Services | | | 10 | |
Industrials | | | 8 | |
Consumer Staples | | | 6 | |
Real Estate | | | 3 | |
Energy | | | 3 | |
Materials | | | 3 | |
Utilities | | | 2 | |
Investment Companies | | | 1 | |
Short-Term Securities | | | 1 | |
Liabilities in Excess of Other Assets | | | (1) | |
| (a) | | For S&P 500 Index Master Portfolio (the “Master Portfolio”) compliance purposes, the Master Portfolio’s sector classifications refer to one or more of the sector subclassifications used by one or more widely recognized market indexes or ratings group indexes, and/or as defined by the investment adviser. These definitions may not apply for purposes of this report, which may combine such sector sub-classifications for reporting ease. |
| | |
| 24 | | 2 0 2 1 BLACK ROCK ANNUAL REPORT TO SHAREHOLDERS |
| | |
Schedule of Investments December 31, 2021 | | S&P 500 Index Master Portfolio (Percentages shown are based on Net Assets) |
| | | | | | | | |
| Security | | Shares | | | Value | |
| |
| | |
Common Stocks | | | | | | | | |
| |
| Aerospace & Defense — 1.3% | | | | |
Boeing Co.(a) | | | 464,518 | | | $ | 93,516,763 | |
General Dynamics Corp. | | | 194,872 | | | | 40,624,966 | |
Howmet Aerospace, Inc. | | | 329,069 | | | | 10,474,266 | |
Huntington Ingalls Industries, Inc. | | | 34,143 | | | | 6,375,864 | |
L3Harris Technologies, Inc. | | | 164,996 | | | | 35,183,747 | |
Lockheed Martin Corp. | | �� | 205,897 | | | | 73,177,853 | |
Northrop Grumman Corp. | | | 125,140 | | | | 48,437,940 | |
Raytheon Technologies Corp. | | | 1,258,568 | | | | 108,312,362 | |
Textron, Inc. | | | 185,345 | | | | 14,308,634 | |
TransDigm Group, Inc.(a) | | | 44,018 | | | | 28,007,773 | |
| | | | | | | | |
| | |
| | | | | | | 458,420,168 | |
| |
| Air Freight & Logistics — 0.6% | | | | |
C.H. Robinson Worldwide, Inc. | | | 109,300 | | | | 11,763,959 | |
Expeditors International of Washington, Inc. | | | 140,904 | | | | 18,921,998 | |
FedEx Corp. | | | 205,504 | | | | 53,151,555 | |
United Parcel Service, Inc., Class B | | | 612,295 | | | | 131,239,310 | |
| | | | | | | | |
| | |
| | | | | | 215,076,822 | |
| | |
| Airlines(a) — 0.2% | | | | | | |
Alaska Air Group, Inc. | | | 104,278 | | | | 5,432,884 | |
American Airlines Group, Inc. | | | 546,838 | | | | 9,821,210 | |
Delta Air Lines, Inc. | | | 535,595 | | | | 20,931,052 | |
Southwest Airlines Co. | | | 495,402 | | | | 21,223,022 | |
United Airlines Holdings, Inc.(b) | | | 274,606 | | | | 12,022,251 | |
| | | | | | | | |
| | |
| | | | | | 69,430,419 | |
| |
| Auto Components — 0.1% | | | | |
Aptiv PLC(a) | | | 227,531 | | | | 37,531,239 | |
BorgWarner, Inc. | | | 203,548 | | | | 9,173,908 | |
| | | | | | | | |
| | |
| | | | | | 46,705,147 | |
| |
| Automobiles — 2.5% | | | | |
Ford Motor Co. | | | 3,300,651 | | | | 68,554,521 | |
General Motors Co.(a) | | | 1,220,506 | | | | 71,558,267 | |
Tesla, Inc.(a) | | | 683,995 | | | | 722,832,236 | |
| | | | | | | | |
| | |
| | | | | | 862,945,024 | |
| |
| Banks — 3.9% | | | | |
Bank of America Corp. | | | 6,055,810 | | | | 269,422,987 | |
Citigroup, Inc. | | | 1,668,474 | | | | 100,759,145 | |
Citizens Financial Group, Inc. | | | 358,562 | | | | 16,942,054 | |
Comerica, Inc. | | | 110,277 | | | | 9,594,099 | |
Fifth Third Bancorp | | | 574,938 | | | | 25,038,550 | |
First Republic Bank | | | 149,355 | | | | 30,843,301 | |
Huntington Bancshares, Inc. | | | 1,215,338 | | | | 18,740,512 | |
JPMorgan Chase & Co. | | | 2,484,941 | | | | 393,490,407 | |
KeyCorp. | | | 782,882 | | | | 18,108,061 | |
M&T Bank Corp. | | | 109,183 | | | | 16,768,325 | |
People’s United Financial, Inc. | | | 362,910 | | | | 6,467,056 | |
PNC Financial Services Group, Inc. | | | 355,378 | | | | 71,260,397 | |
Regions Financial Corp. | | | 801,570 | | | | 17,474,226 | |
Signature Bank | | | 50,982 | | | | 16,491,147 | |
SVB Financial Group(a)(b) | | | 49,321 | | | | 33,451,475 | |
Truist Financial Corp. | | | 1,122,446 | | | | 65,719,213 | |
U.S. Bancorp | | | 1,134,600 | | | | 63,730,482 | |
Wells Fargo & Co. | | | 3,352,672 | | | | 160,861,203 | |
Zions Bancorp NA | | | 131,562 | | | | 8,309,456 | |
| | | | | | | | |
| | |
| | | | | | 1,343,472,096 | |
| |
| Beverages — 1.4% | | | | |
Brown-Forman Corp., Class B | | | 152,675 | | | | 11,123,901 | |
Coca-Cola Co. | | | 3,266,742 | | | | 193,423,794 | |
| | | | | | | | |
| Security | | Shares | | | Value | |
| |
| |
| Beverages (continued) | | | | |
Constellation Brands, Inc., Class A | | | 138,122 | | | $ | 34,664,478 | |
Molson Coors Beverage Co., Class B | | | 161,725 | | | | 7,495,954 | |
Monster Beverage Corp.(a) | | | 315,899 | | | | 30,338,940 | |
PepsiCo, Inc. | | | 1,163,102 | | | | 202,042,448 | |
| | | | | | | | |
| | |
| | | | | | | 479,089,515 | |
| |
| Biotechnology — 1.8% | | | | |
AbbVie, Inc. | | | 1,486,863 | | | | 201,321,250 | |
Amgen, Inc. | | | 473,623 | | | | 106,550,966 | |
Biogen, Inc.(a) | | | 123,515 | | | | 29,633,719 | |
Gilead Sciences, Inc. | | | 1,055,808 | | | | 76,662,219 | |
Incyte Corp.(a) | | | 157,004 | | | | 11,524,094 | |
Moderna, Inc.(a) | | | 296,603 | | | | 75,331,230 | |
Regeneron Pharmaceuticals, Inc.(a) | | | 88,895 | | | | 56,138,970 | |
Vertex Pharmaceuticals, Inc.(a) | | | 213,788 | | | | 46,947,845 | |
| | | | | | | | |
| | |
| | | | | | | 604,110,293 | |
| |
| Building Products — 0.5% | | | | |
A O Smith Corp. | | | 112,155 | | | | 9,628,507 | |
Allegion plc | | | 76,360 | | | | 10,113,118 | |
Carrier Global Corp. | | | 729,501 | | | | 39,568,134 | |
Fortune Brands Home & Security, Inc. | | | 112,945 | | | | 12,073,821 | |
Johnson Controls International PLC | | | 595,912 | | | | 48,453,605 | |
Masco Corp. | | | 205,241 | | | | 14,412,023 | |
Trane Technologies PLC | | | 199,668 | | | | 40,338,926 | |
| | | | | | | | |
| | |
| | | | | | | 174,588,134 | |
| |
| Capital Markets — 2.9% | | | | |
Ameriprise Financial, Inc. | | | 94,083 | | | | 28,381,078 | |
Bank of New York Mellon Corp. | | | 638,842 | | | | 37,103,943 | |
BlackRock, Inc.(c) | | | 120,278 | | | | 110,121,726 | |
Cboe Global Markets, Inc. | | | 90,101 | | | | 11,749,170 | |
Charles Schwab Corp. | | | 1,262,626 | | | | 106,186,847 | |
CME Group, Inc. | | | 302,297 | | | | 69,062,773 | |
FactSet Research Systems, Inc. | | | 31,651 | | | | 15,382,703 | |
Franklin Resources, Inc. | | | 229,824 | | | | 7,696,806 | |
Goldman Sachs Group, Inc. | | | 285,435 | | | | 109,193,159 | |
Intercontinental Exchange, Inc. | | | 473,755 | | | | 64,795,471 | |
Invesco Ltd. | | | 287,050 | | | | 6,607,891 | |
MarketAxess Holdings, Inc. | | | 31,620 | | | | 13,004,357 | |
Moody’s Corp. | | | 135,528 | | | | 52,934,526 | |
Morgan Stanley | | | 1,207,068 | | | | 118,485,795 | |
MSCI, Inc. | | | 69,386 | | | | 42,512,108 | |
Nasdaq, Inc. | | | 97,481 | | | | 20,471,985 | |
Northern Trust Corp. | | | 176,469 | | | | 21,107,457 | |
Raymond James Financial, Inc. | | | 153,484 | | | | 15,409,794 | |
S&P Global, Inc. | | | 202,797 | | | | 95,705,988 | |
State Street Corp. | | | 307,440 | | | | 28,591,920 | |
T. Rowe Price Group, Inc. | | | 188,982 | | | | 37,161,420 | |
| | | | | | | | |
| | |
| | | | | | | 1,011,666,917 | |
| |
| Chemicals — 1.8% | | | | |
Air Products & Chemicals, Inc. | | | 186,309 | | | | 56,686,376 | |
Albemarle Corp. | | | 99,057 | | | | 23,156,555 | |
Celanese Corp. | | | 91,544 | | | | 15,384,885 | |
CF Industries Holdings, Inc. | | | 183,713 | | | | 13,003,206 | |
Corteva, Inc. | | | 612,904 | | | | 28,978,101 | |
Dow, Inc. | | | 621,906 | | | | 35,274,508 | |
DuPont de Nemours, Inc. | | | 435,649 | | | | 35,191,726 | |
Eastman Chemical Co. | | | 113,044 | | | | 13,668,150 | |
Ecolab, Inc. | | | 209,419 | | | | 49,127,603 | |
FMC Corp. | | | 107,378 | | | | 11,799,769 | |
International Flavors & Fragrances, Inc. | | | 214,018 | | | | 32,241,812 | |
Linde plc(a) | | | 430,983 | | | | 149,305,441 | |
| | |
MASTER PORTFOLIO SCHEDULE OF INVESTMENTS | | 25 |
| | |
Schedule of Investments (continued) December 31, 2021 | | S&P 500 Index Master Portfolio (Percentages shown are based on Net Assets) |
| | | | | | | | |
| Security | | Shares | | | Value | |
| |
|
Chemicals (continued) | |
LyondellBasell Industries NV, Class A | | | 221,059 | | | $ | 20,388,272 | |
Mosaic Co. | | | 311,460 | | | | 12,237,263 | |
PPG Industries, Inc. | | | 199,394 | | | | 34,383,501 | |
Sherwin-Williams Co. | | | 202,693 | | | | 71,380,367 | |
| | | | | | | | |
| | |
| | | | | | | 602,207,535 | |
|
| Commercial Services & Supplies — 0.4% | |
Cintas Corp. | | | 74,088 | | | | 32,833,579 | |
Copart, Inc.(a)(b) | | | 179,430 | | | | 27,205,177 | |
Republic Services, Inc. | | | 175,976 | | | | 24,539,853 | |
Rollins, Inc. | | | 182,239 | | | | 6,234,396 | |
Waste Management, Inc. | | | 323,602 | | | | 54,009,174 | |
| | | | | | | | |
| | |
| | | | | | | 144,822,179 | |
|
| Communications Equipment — 0.9% | |
Arista Networks, Inc.(a) | | | 188,618 | | | | 27,113,838 | |
Cisco Systems, Inc. | | | 3,547,654 | | | | 224,814,834 | |
F5 Networks, Inc.(a) | | | 50,186 | | | | 12,281,016 | |
Juniper Networks, Inc. | | | 278,138 | | | | 9,932,308 | |
Motorola Solutions, Inc. | | | 142,665 | | | | 38,762,080 | |
| | | | | | | | |
| | |
| | | | | | | 312,904,076 | |
|
| Construction & Engineering — 0.0% | |
Quanta Services, Inc. | | | 118,529 | | | | 13,590,535 | |
| | | | | | | | |
|
| Construction Materials — 0.1% | |
Martin Marietta Materials, Inc. | | | 52,614 | | | | 23,177,520 | |
Vulcan Materials Co. | | | 110,809 | | | | 23,001,732 | |
| | | | | | | | |
| | |
| | | | | | | 46,179,252 | |
|
| Consumer Finance — 0.6% | |
American Express Co. | | | 527,542 | | | | 86,305,871 | |
Capital One Financial Corp. | | | 357,885 | | | | 51,925,535 | |
Discover Financial Services | | | 246,433 | | | | 28,477,797 | |
Synchrony Financial | | | 460,164 | | | | 21,347,008 | |
| | | | | | | | |
| | |
| | | | | | | 188,056,211 | |
|
| Containers & Packaging — 0.3% | |
Amcor PLC | | | 1,280,178 | | | | 15,374,938 | |
Avery Dennison Corp. | | | 70,445 | | | | 15,256,274 | |
Ball Corp. | | | 271,334 | | | | 26,121,324 | |
International Paper Co. | | | 325,206 | | | | 15,278,178 | |
Packaging Corp. of America | | | 79,157 | | | | 10,777,226 | |
Sealed Air Corp. | | | 127,950 | | | | 8,632,786 | |
Westrock Co. | | | 221,545 | | | | 9,827,736 | |
| | | | | | | | |
| | |
| | | | | | | 101,268,462 | |
|
| Distributors — 0.1% | |
Genuine Parts Co. | | | 119,603 | | | | 16,768,340 | |
LKQ Corp. | | | 225,493 | | | | 13,536,345 | |
Pool Corp. | | | 33,768 | | | | 19,112,688 | |
| | | | | | | | |
| | |
| | | | | | | 49,417,373 | |
|
| Diversified Financial Services — 1.3% | |
Berkshire Hathaway, Inc., Class B(a) | | | 1,539,915 | | | | 460,434,585 | |
| | | | | | | | |
|
| Diversified Telecommunication Services — 1.0% | |
AT&T, Inc. | | | 6,010,684 | | | | 147,862,827 | |
Lumen Technologies, Inc. | | | 774,849 | | | | 9,724,355 | |
Verizon Communications, Inc. | | | 3,485,243 | | | | 181,093,226 | |
| | | | | | | | |
| | |
| | | | | | | 338,680,408 | |
|
| Electric Utilities — 1.6% | |
Alliant Energy Corp. | | | 212,278 | | | | 13,048,729 | |
American Electric Power Co., Inc. | | | 420,474 | | | | 37,409,572 | |
Duke Energy Corp. | | | 647,553 | | | | 67,928,310 | |
Edison International | | | 319,423 | | | | 21,800,620 | |
| | | | | | | | |
| Security | | Shares | | | Value | |
| |
| | |
Electric Utilities (continued) | | | | | | | | |
Entergy Corp. | | | 170,291 | | | $ | 19,183,281 | |
Evergy, Inc. | | | 194,569 | | | | 13,349,379 | |
Eversource Energy | | | 287,721 | | | | 26,176,856 | |
Exelon Corp. | | | 824,237 | | | | 47,607,929 | |
FirstEnergy Corp. | | | 461,583 | | | | 19,197,237 | |
NextEra Energy, Inc. | | | 1,651,208 | | | | 154,156,779 | |
NRG Energy, Inc. | | | 201,183 | | | | 8,666,964 | |
Pinnacle West Capital Corp. | | | 93,097 | | | | 6,571,717 | |
PPL Corp. | | | 631,241 | | | | 18,975,104 | |
Southern Co. | | | 891,189 | | | | 61,117,742 | |
Xcel Energy, Inc. | | | 452,156 | | | | 30,610,961 | |
| | | | | | | | |
| | |
| | | | | | | 545,801,180 | |
| | |
| Electrical Equipment — 0.5% | | | | | | |
AMETEK, Inc. | | | 194,395 | | | | 28,583,841 | |
Eaton Corp. PLC | | | 335,470 | | | | 57,975,925 | |
Emerson Electric Co. | | | 504,847 | | | | 46,935,626 | |
Generac Holdings, Inc.(a) | | | 52,714 | | | | 18,551,111 | |
Rockwell Automation, Inc. | | | 97,930 | | | | 34,162,880 | |
| | | | | | | | |
| | |
| | | | | | | 186,209,383 | |
|
| Electronic Equipment, Instruments & Components — 0.7% | |
Amphenol Corp., Class A | | | 504,094 | | | | 44,088,061 | |
CDW Corp. | | | 114,123 | | | | 23,370,108 | |
Corning, Inc. | | | 649,904 | | | | 24,195,926 | |
IPG Photonics Corp.(a)(b) | | | 29,995 | | | | 5,163,339 | |
Keysight Technologies, Inc.(a) | | | 154,868 | | | | 31,981,791 | |
TE Connectivity Ltd. | | | 274,381 | | | | 44,268,630 | |
Teledyne Technologies, Inc.(a) | | | 39,097 | | | | 17,081,088 | |
Trimble, Inc.(a) | | | 210,161 | | | | 18,323,938 | |
Zebra Technologies Corp., Class A(a) | | | 45,233 | | | | 26,922,682 | |
| | | | | | | | |
| | |
| | | | | | | 235,395,563 | |
|
| Energy Equipment & Services — 0.2% | |
Baker Hughes Co. | | | 734,957 | | | | 17,683,065 | |
Halliburton Co. | | | 750,650 | | | | 17,167,366 | |
Schlumberger NV | | | 1,176,733 | | | | 35,243,153 | |
| | | | | | | | |
| | |
| | | | | | | 70,093,584 | |
|
| Entertainment — 1.6% | |
Activision Blizzard, Inc. | | | 654,118 | | | | 43,518,471 | |
Electronic Arts, Inc. | | | 237,420 | | | | 31,315,698 | |
Live Nation Entertainment, Inc.(a)(b) | | | 110,771 | | | | 13,258,181 | |
Netflix, Inc.(a) | | | 372,103 | | | | 224,169,731 | |
Take-Two Interactive Software, Inc.(a) | | | 98,152 | | | | 17,443,574 | |
Walt Disney Co.(a) | | | 1,529,552 | | | | 236,912,309 | |
| | | | | | | | |
| | |
| | | | | | | 566,617,964 | |
|
| Equity Real Estate Investment Trusts (REITs) — 2.6% | |
Alexandria Real Estate Equities, Inc. | | | 118,575 | | | | 26,437,482 | |
American Tower Corp. | | | 382,778 | | | | 111,962,565 | |
AvalonBay Communities, Inc. | | | 117,068 | | | | 29,570,206 | |
Boston Properties, Inc. | | | 119,633 | | | | 13,779,329 | |
Crown Castle International Corp. | | | 363,832 | | | | 75,946,292 | |
Digital Realty Trust, Inc. | | | 236,975 | | | | 41,913,768 | |
Duke Realty Corp. | | | 320,238 | | | | 21,020,422 | |
Equinix, Inc. | | | 75,411 | | | | 63,785,640 | |
Equity Residential | | | 288,204 | | | | 26,082,462 | |
Essex Property Trust, Inc. | | | 55,122 | | | | 19,415,622 | |
Extra Space Storage, Inc. | | | 111,693 | | | | 25,324,154 | |
Federal Realty Investment Trust | | | 58,771 | | | | 8,011,663 | |
Healthpeak Properties, Inc. | | | 457,368 | | | | 16,506,411 | |
Host Hotels & Resorts, Inc.(a) | | | 586,178 | | | | 10,193,635 | |
Iron Mountain, Inc. | | | 244,276 | | | | 12,782,963 | |
Kimco Realty Corp. | | | 505,766 | | | | 12,467,132 | |
| | |
| 26 | | 2 0 2 1 BLACK ROCK ANNUAL REPORT TO SHAREHOLDERS |
| | |
Schedule of Investments (continued) December 31, 2021 | | S&P 500 Index Master Portfolio (Percentages shown are based on Net Assets) |
| | | | | | | | |
| Security | | Shares | | | Value | |
| |
|
Equity Real Estate Investment Trusts (REITs) (continued) | |
Mid-America Apartment Communities, Inc. | | | 97,160 | | | $ | 22,292,390 | |
Prologis, Inc. | | | 622,765 | | | | 104,848,715 | |
Public Storage | | | 128,153 | | | | 48,000,988 | |
Realty Income Corp. | | | 475,725 | | | | 34,057,153 | |
Regency Centers Corp. | | | 131,429 | | | | 9,903,175 | |
SBA Communications Corp. | | | 91,469 | | | | 35,583,270 | |
Simon Property Group, Inc. | | | 276,411 | | | | 44,162,186 | |
UDR, Inc. | | | 244,381 | | | | 14,660,416 | |
Ventas, Inc. | | | 335,648 | | | | 17,158,326 | |
Vornado Realty Trust | | | 135,460 | | | | 5,670,356 | |
Welltower, Inc. | | | 366,001 | | | | 31,391,906 | |
Weyerhaeuser Co. | | | 627,144 | | | | 25,825,790 | |
| | | | | | | | |
| | |
| | | | | | | 908,754,417 | |
| |
| Food & Staples Retailing — 1.4% | | | | |
Costco Wholesale Corp. | | | 371,509 | | | | 210,905,659 | |
Kroger Co. | | | 571,684 | | | | 25,874,418 | |
Sysco Corp. | | | 430,072 | | | | 33,782,155 | |
Walgreens Boots Alliance, Inc. | | | 602,306 | | | | 31,416,281 | |
Walmart, Inc. | | | 1,195,804 | | | | 173,020,881 | |
| | | | | | | | |
| | |
| | | | | | | 474,999,394 | |
| |
| Food Products — 0.9% | | | | |
Archer-Daniels-Midland Co. | | | 468,990 | | | | 31,699,034 | |
Campbell Soup Co. | | | 172,290 | | | | 7,487,723 | |
Conagra Brands, Inc. | | | 401,277 | | | | 13,703,610 | |
General Mills, Inc. | | | 509,297 | | | | 34,316,432 | |
Hershey Co. | | | 122,861 | | | | 23,769,918 | |
Hormel Foods Corp. | | | 239,218 | | | | 11,676,231 | |
J.M. Smucker Co. | | | 91,126 | | | | 12,376,733 | |
Kellogg Co. | | | 213,833 | | | | 13,775,122 | |
Kraft Heinz Co. | | | 596,958 | | | | 21,430,792 | |
Lamb Weston Holdings, Inc. | | | 124,846 | | | | 7,912,739 | |
McCormick & Co., Inc. | | | 207,835 | | | | 20,078,939 | |
Mondelez International, Inc., Class A | | | 1,172,965 | | | | 77,779,309 | |
Tyson Foods, Inc., Class A | | | 248,636 | | | | 21,671,114 | |
| | | | | | | | |
| | |
| | | | | | | 297,677,696 | |
| |
| Gas Utilities — 0.0% | | | | |
Atmos Energy Corp. | | | 110,895 | | | | 11,618,469 | |
| | | | | | | | |
| |
| Health Care Equipment & Supplies — 2.9% | | | | |
Abbott Laboratories | | | 1,486,867 | | | | 209,261,662 | |
ABIOMED, Inc.(a) | | | 37,886 | | | | 13,607,515 | |
Align Technology, Inc.(a) | | | 61,778 | | | | 40,599,266 | |
Baxter International, Inc. | | | 423,317 | | | | 36,337,531 | |
Becton Dickinson and Co. | | | 241,449 | | | | 60,719,595 | |
Boston Scientific Corp.(a) | | | 1,196,169 | | | | 50,813,259 | |
Cooper Cos., Inc. | | | 41,795 | | | | 17,509,597 | |
DENTSPLY SIRONA, Inc. | | | 185,620 | | | | 10,355,740 | |
DexCom, Inc.(a) | | | 81,364 | | | | 43,688,400 | |
Edwards Lifesciences Corp.(a)(b) | | | 523,314 | | | | 67,795,329 | |
Hologic, Inc.(a)(b) | | | 213,145 | | | | 16,318,381 | |
IDEXX Laboratories, Inc.(a) | | | 71,792 | | | | 47,272,160 | |
Intuitive Surgical, Inc.(a) | | | 300,161 | | | | 107,847,847 | |
Medtronic PLC | | | 1,132,602 | | | | 117,167,677 | |
ResMed, Inc. | | | 122,238 | | | | 31,840,554 | |
STERIS PLC | | | 82,863 | | | | 20,169,683 | |
Stryker Corp. | | | 282,162 | | | | 75,455,762 | |
Teleflex, Inc. | | | 39,660 | | | | 13,027,517 | |
Zimmer Biomet Holdings, Inc. | | | 174,977 | | | | 22,229,078 | |
| | | | | | | | |
| | |
| | | | | | | 1,002,016,553 | |
| | | | | | | | |
| Security | | Shares | | | Value | |
| |
| |
Health Care Providers & Services — 2.7% | | | | | |
AmerisourceBergen Corp. | | | 124,418 | | | $ | 16,533,908 | |
Anthem, Inc. | | | 204,088 | | | | 94,602,951 | |
Cardinal Health, Inc. | | | 236,942 | | | | 12,200,144 | |
Centene Corp.(a)(b) | | | 490,310 | | | | 40,401,544 | |
Cigna Corp. | | | 278,682 | | | | 63,993,748 | |
CVS Health Corp. | | | 1,108,330 | | | | 114,335,323 | |
DaVita, Inc.(a)(b) | | | 54,837 | | | | 6,238,257 | |
HCA Healthcare, Inc. | | | 201,374 | | | | 51,737,008 | |
Henry Schein, Inc.(a)(b) | | | 118,442 | | | | 9,182,808 | |
Humana, Inc. | | | 108,608 | | | | 50,378,907 | |
Laboratory Corp. of America Holdings(a)(b) | | | 80,470 | | | | 25,284,479 | |
McKesson Corp. | | | 128,383 | | | | 31,912,162 | |
Quest Diagnostics, Inc. | | | 102,721 | | | | 17,771,760 | |
UnitedHealth Group, Inc. | | | 791,957 | | | | 397,673,288 | |
Universal Health Services, Inc., Class B | | | 61,483 | | | | 7,971,886 | |
| | | | | | | | |
| | |
| | | | | | | 940,218,173 | |
| |
| Health Care Technology — 0.1% | | | | |
Cerner Corp. | | | 247,398 | | | | 22,975,852 | |
| | | | | | | | |
| |
| Hotels, Restaurants & Leisure — 1.9% | | | | |
Booking Holdings, Inc.(a) | | | 34,560 | | | | 82,917,389 | |
Caesars Entertainment, Inc.(a) | | | 177,113 | | | | 16,565,379 | |
Carnival Corp.(a) | | | 677,484 | | | | 13,630,978 | |
Chipotle Mexican Grill, Inc.(a)(b) | | | 23,694 | | | | 41,423,035 | |
Darden Restaurants, Inc. | | | 109,918 | | | | 16,558,047 | |
Domino’s Pizza, Inc. | | | 30,984 | | | | 17,485,201 | |
Expedia Group, Inc.(a) | | | 122,768 | | | | 22,186,633 | |
Hilton Worldwide Holdings, Inc.(a) | | | 234,479 | | | | 36,576,379 | |
Las Vegas Sands Corp.(a) | | | 289,081 | | | | 10,881,009 | |
Marriott International, Inc., Class A(a) | | | 229,982 | | | | 38,002,226 | |
McDonald’s Corp. | | | 628,153 | | | | 168,388,975 | |
MGM Resorts International | | | 327,290 | | | | 14,688,775 | |
Norwegian Cruise Line Holdings Ltd.(a)(b) | | | 315,188 | | | | 6,536,999 | |
Penn National Gaming, Inc.(a) | | | 139,685 | | | | 7,242,667 | |
Royal Caribbean Cruises Ltd.(a) | | | 184,059 | | | | 14,154,137 | |
Starbucks Corp. | | | 991,931 | | | | 116,026,169 | |
Wynn Resorts Ltd.(a) | | | 89,689 | | | | 7,627,153 | |
Yum! Brands, Inc. | | | 246,481 | | | | 34,226,352 | |
| | | | | | | | |
| | |
| | | | | | | 665,117,503 | |
| |
| Household Durables — 0.4% | | | | |
D.R. Horton, Inc. | | | 274,922 | | | | 29,815,291 | |
Garmin Ltd. | | | 127,190 | | | | 17,319,462 | |
Lennar Corp., Class A | | | 227,913 | | | | 26,474,374 | |
Mohawk Industries, Inc.(a) | | | 46,132 | | | | 8,404,328 | |
Newell Brands, Inc. | | | 322,363 | | | | 7,040,408 | |
NVR, Inc.(a) | | | 2,753 | | | | 16,267,119 | |
PulteGroup, Inc. | | | 212,892 | | | | 12,168,907 | |
Whirlpool Corp. | | | 50,983 | | | | 11,963,671 | |
| | | | | | | | |
| | |
| | | | | | | 129,453,560 | |
| |
| Household Products — 1.4% | | | | |
Church & Dwight Co., Inc. | | | 206,456 | | | | 21,161,740 | |
Clorox Co. | | | 104,297 | | | | 18,185,225 | |
Colgate-Palmolive Co. | | | 707,660 | | | | 60,391,704 | |
Kimberly-Clark Corp. | | | 284,060 | | | | 40,597,855 | |
Procter & Gamble Co. | | | 2,034,818 | | | | 332,855,529 | |
| | | | | | | | |
| | |
| | | | | | | 473,192,053 | |
|
| Independent Power and Renewable Electricity Producers — 0.0% | |
AES Corp. | | | 558,229 | | | | 13,564,965 | |
| | | | | | | | |
| | |
| Industrial Conglomerates — 1.0% | | | | | | |
3M Co. | | | 484,543 | | | | 86,069,373 | |
| | |
MASTER PORTFOLIO SCHEDULE OF INVESTMENTS | | 27 |
| | |
Schedule of Investments (continued) December 31, 2021 | | S&P 500 Index Master Portfolio (Percentages shown are based on Net Assets) |
| | | | | | | | |
| Security | | Shares | | | Value | |
| |
| |
Industrial Conglomerates (continued) | | | | | |
General Electric Co. | | | 923,768 | | | $ | 87,268,363 | |
Honeywell International, Inc. | | | 578,841 | | | | 120,694,137 | |
Roper Technologies, Inc. | | | 88,594 | | | | 43,575,845 | |
| | | | | | | | |
| | |
| | | | | | | 337,607,718 | |
| |
| Insurance — 1.8% | | | | |
Aflac, Inc. | | | 511,747 | | | | 29,880,906 | |
Allstate Corp. | | | 241,052 | | | | 28,359,768 | |
American International Group, Inc. | | | 698,158 | | | | 39,697,264 | |
Aon PLC, Class A | | | 185,267 | | | | 55,683,849 | |
Arthur J. Gallagher & Co. | | | 174,290 | | | | 29,571,784 | |
Assurant, Inc. | | | 47,910 | | | | 7,467,253 | |
Brown & Brown, Inc. | | | 196,507 | | | | 13,810,512 | |
Chubb Ltd. | | | 362,189 | | | | 70,014,756 | |
Cincinnati Financial Corp. | | | 126,390 | | | | 14,399,613 | |
Everest Re Group Ltd. | | | 33,258 | | | | 9,110,031 | |
Globe Life, Inc. | | | 77,552 | | | | 7,268,173 | |
Hartford Financial Services Group, Inc. | | | 286,186 | | | | 19,758,281 | |
Lincoln National Corp. | | | 142,833 | | | | 9,749,781 | |
Loews Corp. | | | 170,875 | | | | 9,869,740 | |
Marsh & McLennan Cos., Inc. | | | 424,542 | | | | 73,793,890 | |
MetLife, Inc. | | | 601,197 | | | | 37,568,801 | |
Principal Financial Group, Inc. | | | 207,282 | | | | 14,992,707 | |
Progressive Corp. | | | 492,601 | | | | 50,565,493 | |
Prudential Financial, Inc. | | | 317,842 | | | | 34,403,218 | |
Travelers Cos., Inc. | | | 206,857 | | | | 32,358,640 | |
W.R. Berkley Corp. | | | 118,923 | | | | 9,798,066 | |
Willis Towers Watson PLC | | | 104,775 | | | | 24,883,015 | |
| | | | | | | | |
| | |
| | | | | | | 623,005,541 | |
| |
| Interactive Media & Services(a) — 6.2% | | | | |
Alphabet, Inc., Class A | | | 252,937 | | | | 732,768,606 | |
Alphabet, Inc., Class C | | | 235,110 | | | | 680,311,945 | |
Match Group, Inc.(b) | | | 238,033 | | | | 31,479,864 | |
Meta Platforms, Inc., Class A | | | 1,989,689 | | | | 669,231,895 | |
Twitter, Inc. | | | 671,889 | | | | 29,039,043 | |
| | | | | | | | |
| | |
| | | | | | | 2,142,831,353 | |
| |
| Internet & Direct Marketing Retail — 3.7% | | | | |
Amazon.com, Inc.(a) | | | 366,735 | | | | 1,222,819,180 | |
eBay, Inc. | | | 526,377 | | | | 35,004,070 | |
Etsy, Inc.(a)(b) | | | 106,350 | | | | 23,284,269 | |
| | | | | | | | |
| | |
| | | | | | | 1,281,107,519 | |
| |
| IT Services — 4.4% | | | | |
Accenture PLC, Class A | | | 531,116 | | | | 220,174,138 | |
Akamai Technologies, Inc.(a) | | | 137,627 | | | | 16,107,864 | |
Automatic Data Processing, Inc. | | | 354,321 | | | | 87,368,472 | |
Broadridge Financial Solutions, Inc. | | | 96,708 | | | | 17,680,157 | |
Cognizant Technology Solutions Corp., Class A | | | 441,014 | | | | 39,126,762 | |
DXC Technology Co.(a) | | | 212,880 | | | | 6,852,607 | |
EPAM Systems, Inc.(a) | | | 47,634 | | | | 31,840,947 | |
Fidelity National Information Services, Inc. | | | 512,026 | | | | 55,887,638 | |
Fiserv, Inc.(a) | | | 501,389 | | | | 52,039,164 | |
FleetCor Technologies, Inc.(a) | | | 68,276 | | | | 15,282,900 | |
Gartner, Inc.(a) | | | 69,151 | | | | 23,118,562 | |
Global Payments, Inc. | | | 243,974 | | | | 32,980,405 | |
International Business Machines Corp. | | | 752,197 | | | | 100,538,651 | |
Jack Henry & Associates, Inc. | | | 63,214 | | | | 10,556,106 | |
Mastercard, Inc., Class A | | | 729,431 | | | | 262,099,147 | |
Paychex, Inc. | | | 269,402 | | | | 36,773,373 | |
PayPal Holdings, Inc.(a) | | | 988,924 | | | | 186,491,288 | |
| | | | | | | | |
| Security | | Shares | | | Value | |
| |
| |
IT Services (continued) | | | | | |
VeriSign, Inc.(a) | | | 81,258 | | | $ | 20,624,906 | |
Visa, Inc., Class A | | | 1,410,108 | | | | 305,584,505 | |
| | | | | | | | |
| | |
| | | | | | | 1,521,127,592 | |
| |
| Leisure Products — 0.0% | | | | |
Hasbro, Inc. | | | 109,344 | | | | 11,129,032 | |
| | | | | | | | |
| |
| Life Sciences Tools & Services — 2.0% | | | | |
Agilent Technologies, Inc. | | | 255,445 | | | | 40,781,794 | |
Bio-Rad Laboratories, Inc., Class A(a) | | | 18,020 | | | | 13,615,371 | |
Bio-Techne Corp. | | | 32,720 | | | | 16,927,365 | |
Charles River Laboratories International,
Inc.(a) | | | 42,647 | | | | 16,068,537 | |
Danaher Corp. | | | 534,411 | | | | 175,826,563 | |
Illumina, Inc.(a) | | | 131,425 | | | | 49,999,327 | |
IQVIA Holdings, Inc.(a) | | | 161,346 | | | | 45,522,161 | |
Mettler-Toledo International, Inc.(a) | | | 19,328 | | | | 32,803,675 | |
PerkinElmer, Inc. | | | 106,115 | | | | 21,335,482 | |
Thermo Fisher Scientific, Inc. | | | 330,864 | | | | 220,765,695 | |
Waters Corp.(a)(b) | | | 51,322 | | | | 19,122,577 | |
West Pharmaceutical Services, Inc. | | | 61,820 | | | | 28,994,198 | |
| | | | | | | | |
| | |
| | | | | | | 681,762,745 | |
| |
| Machinery — 1.5% | | | | |
Caterpillar, Inc. | | | 454,852 | | | | 94,036,103 | |
Cummins, Inc. | | | 120,269 | | | | 26,235,480 | |
Deere & Co. | | | 237,251 | | | | 81,350,995 | |
Dover Corp. | | | 122,144 | | | | 22,181,350 | |
Fortive Corp. | | | 301,310 | | | | 22,986,940 | |
IDEX Corp. | | | 64,439 | | | | 15,228,225 | |
Illinois Tool Works, Inc. | | | 240,174 | | | | 59,274,943 | |
Ingersoll Rand, Inc.(b) | | | 340,640 | | | | 21,075,397 | |
Otis Worldwide Corp. | | | 358,805 | | | | 31,241,151 | |
PACCAR, Inc. | | | 291,061 | | | | 25,689,044 | |
Parker-Hannifin Corp. | | | 108,526 | | | | 34,524,291 | |
Pentair PLC | | | 138,010 | | | | 10,078,870 | |
Snap-on, Inc. | | | 45,895 | | | | 9,884,865 | |
Stanley Black & Decker, Inc. | | | 135,562 | | | | 25,569,704 | |
Westinghouse Air Brake Technologies Corp. | | | 158,926 | | | | 14,638,674 | |
Xylem, Inc. | | | 152,793 | | | | 18,322,937 | |
| | | | | | | | |
| | |
| | | | | | | 512,318,969 | |
| |
| Media — 1.0% | | | | |
Charter Communications, Inc., Class A(a)(b) | | | 104,022 | | | | 67,819,223 | |
Comcast Corp., Class A | | | 3,833,846 | | | | 192,957,469 | |
Discovery, Inc., Class A(a)(b) | | | 143,129 | | | | 3,369,257 | |
Discovery, Inc., Class C(a)(b) | | | 254,964 | | | | 5,838,676 | |
DISH Network Corp., Class A(a)(b) | | | 205,755 | | | | 6,674,692 | |
Fox Corp., Class A | | | 269,365 | | | | 9,939,568 | |
Fox Corp., Class B | | | 124,115 | | | | 4,253,421 | |
Interpublic Group of Cos., Inc. | | | 330,733 | | | | 12,385,951 | |
News Corp., Class A | | | 321,091 | | | | 7,163,540 | |
News Corp., Class B | | | 114,231 | | | | 2,570,198 | |
Omnicom Group, Inc. | | | 180,687 | | | | 13,238,936 | |
ViacomCBS, Inc., Class B | | | 506,664 | | | | 15,291,120 | |
| | | | | | | | |
| | |
| | | | | | | 341,502,051 | |
| |
| Metals & Mining — 0.4% | | | | |
Freeport-McMoRan, Inc. | | | 1,233,728 | | | | 51,483,470 | |
Newmont Corp. | | | 674,444 | | | | 41,829,017 | |
Nucor Corp. | | | 240,315 | | | | 27,431,957 | |
| | | | | | | | |
| | |
| | | | | | | 120,744,444 | |
| |
| Multiline Retail — 0.5% | | | | |
Dollar General Corp. | | | 196,179 | | | | 46,264,894 | |
| | |
| 28 | | 2 0 2 1 BLACK ROCK ANNUAL REPORT TO SHAREHOLDERS |
| | |
Schedule of Investments (continued) December 31, 2021 | | S&P 500 Index Master Portfolio (Percentages shown are based on Net Assets) |
| | | | | | | | |
| Security | | Shares | | | Value | |
| |
| |
Multiline Retail (continued) | | | | | |
Dollar Tree, Inc.(a) | | | 189,118 | | | $ | 26,574,861 | |
Target Corp. | | | 410,368 | | | | 94,975,570 | |
| | | | | | | | |
| | |
| | | | | | | 167,815,325 | |
| |
| Multi-Utilities — 0.7% | | | | |
Ameren Corp. | | | 216,876 | | | | 19,304,133 | |
CenterPoint Energy, Inc. | | | 528,783 | | | | 14,758,334 | |
CMS Energy Corp. | | | 245,651 | | | | 15,979,598 | |
Consolidated Edison, Inc. | | | 297,450 | | | | 25,378,434 | |
Dominion Energy, Inc. | | | 678,958 | | | | 53,338,940 | |
DTE Energy Co. | | | 161,717 | | | | 19,331,650 | |
NiSource, Inc. | | | 332,857 | | | | 9,190,182 | |
Public Service Enterprise Group, Inc. | | | 424,062 | | | | 28,297,657 | |
Sempra Energy | | | 268,515 | | | | 35,519,164 | |
WEC Energy Group, Inc. | | | 264,960 | | | | 25,719,667 | |
| | | | | | | | |
| | |
| | | | | | | 246,817,759 | |
| |
| Oil, Gas & Consumable Fuels — 2.4% | | | | |
APA Corp. | | | 304,246 | | | | 8,181,175 | |
Chevron Corp. | | | 1,620,898 | | | | 190,212,380 | |
ConocoPhillips | | | 1,109,039 | | | | 80,050,435 | |
Coterra Energy, Inc. | | | 691,384 | | | | 13,136,296 | |
Devon Energy Corp. | | | 529,331 | | | | 23,317,031 | |
Diamondback Energy, Inc. | | | 143,084 | | | | 15,431,609 | |
EOG Resources, Inc. | | | 492,292 | | | | 43,730,298 | |
Exxon Mobil Corp. | | | 3,558,569 | | | | 217,748,837 | |
Hess Corp. | | | 230,842 | | | | 17,089,233 | |
Kinder Morgan, Inc. | | | 1,636,136 | | | | 25,949,117 | |
Marathon Oil Corp. | | | 660,608 | | | | 10,847,183 | |
Marathon Petroleum Corp. | | | 517,618 | | | | 33,122,376 | |
Occidental Petroleum Corp. | | | 745,767 | | | | 21,619,785 | |
ONEOK, Inc. | | | 374,012 | | | | 21,976,945 | |
Phillips 66 | | | 367,836 | | | | 26,653,397 | |
Pioneer Natural Resources Co. | | | 190,911 | | | | 34,722,893 | |
Valero Energy Corp. | | | 346,896 | | | | 26,055,359 | |
Williams Cos., Inc. | | | 1,030,913 | | | | 26,844,975 | |
| | | | | | | | |
| | |
| | | | | | | 836,689,324 | |
| |
| Personal Products — 0.2% | | | | |
Estee Lauder Cos., Inc., Class A | | | 195,217 | | | | 72,269,333 | |
| | | | | | | | |
| |
| Pharmaceuticals — 3.6% | | | | |
Bristol-Myers Squibb Co. | | | 1,868,196 | | | | 116,482,020 | |
Catalent, Inc.(a) | | | 144,561 | | | | 18,508,145 | |
Eli Lilly & Co. | | | 667,612 | | | | 184,407,787 | |
Johnson & Johnson | | | 2,213,624 | | | | 378,684,658 | |
Merck & Co., Inc. | | | 2,123,945 | | | | 162,779,145 | |
Organon & Co. | | | 212,173 | | | | 6,460,668 | |
Pfizer, Inc. | | | 4,719,589 | | | | 278,691,730 | |
Viatris, Inc. | | | 1,010,311 | | | | 13,669,508 | |
Zoetis, Inc. | | | 397,829 | | | | 97,082,211 | |
| | | | | | | | |
| | |
| | | | | | | 1,256,765,872 | |
| |
| Professional Services — 0.4% | | | | |
Equifax, Inc. | | | 102,033 | | | | 29,874,242 | |
IHS Markit Ltd. | | | 335,125 | | | | 44,544,815 | |
Jacobs Engineering Group, Inc. | | | 109,619 | | | | 15,262,253 | |
Leidos Holdings, Inc. | | | 118,004 | | | | 10,490,556 | |
Nielsen Holdings PLC | | | 301,814 | | | | 6,190,205 | |
Robert Half International, Inc. | | | 95,263 | | | | 10,623,730 | |
Verisk Analytics, Inc. | | | 136,594 | | | | 31,243,146 | |
| | | | | | | | |
| | |
| | | | | | | 148,228,947 | |
| | | | | | | | |
| Security | | Shares | | | Value | |
| |
| |
Real Estate Management & Development ��� 0.1% | | | | | |
CBRE Group, Inc., Class A(a)(b) | | | 281,234 | | | $ | 30,516,701 | |
| | | | | | | | |
| |
| Road & Rail — 0.9% | | | | |
CSX Corp. | | | 1,864,995 | | | | 70,123,812 | |
JB Hunt Transport Services, Inc. | | | 69,564 | | | | 14,218,882 | |
Norfolk Southern Corp. | | | 204,617 | | | | 60,916,527 | |
Old Dominion Freight Line, Inc. | | | 78,333 | | | | 28,072,980 | |
Union Pacific Corp. | | | 540,563 | | | | 136,184,037 | |
| | | | | | | | |
| | |
| | | | | | | 309,516,238 | |
|
| Semiconductors & Semiconductor Equipment — 6.3% | |
Advanced Micro Devices, Inc.(a)(b) | | | 1,015,421 | | | | 146,119,082 | |
Analog Devices, Inc. | | | 451,883 | | | | 79,427,475 | |
Applied Materials, Inc. | | | 759,229 | | | | 119,472,275 | |
Broadcom, Inc. | | | 346,108 | | | | 230,303,724 | |
Enphase Energy, Inc.(a) | | | 113,469 | | | | 20,758,019 | |
Intel Corp. | | | 3,419,744 | | | | 176,116,816 | |
KLA Corp. | | | 127,492 | | | | 54,835,584 | |
Lam Research Corp. | | | 118,391 | | | | 85,140,888 | |
Microchip Technology, Inc. | | | 466,564 | | | | 40,619,062 | |
Micron Technology, Inc. | | | 940,083 | | | | 87,568,732 | |
Monolithic Power Systems, Inc. | | | 36,500 | | | | 18,006,545 | |
NVIDIA Corp. | | | 2,102,130 | | | | 618,257,454 | |
NXP Semiconductors NV | | | 222,907 | | | | 50,773,757 | |
Qorvo, Inc.(a) | | | 92,517 | | | | 14,468,734 | |
Qualcomm, Inc. | | | 941,754 | | | | 172,218,554 | |
Skyworks Solutions, Inc. | | | 138,467 | | | | 21,481,770 | |
SolarEdge Technologies, Inc.(a) | | | 44,162 | | | | 12,390,532 | |
Teradyne, Inc.(b) | | | 137,062 | | | | 22,413,749 | |
Texas Instruments, Inc. | | | 777,452 | | | | 146,526,378 | |
Xilinx, Inc. | | | 208,430 | | | | 44,193,413 | |
| | | | | | | | |
| | |
| | | | | | | 2,161,092,543 | |
| |
| Software — 9.4% | | | | |
Adobe, Inc.(a) | | | 399,986 | | | | 226,816,061 | |
ANSYS, Inc.(a) | | | 73,962 | | | | 29,667,637 | |
Autodesk, Inc.(a)(b) | | | 185,214 | | | | 52,080,325 | |
Cadence Design Systems, Inc.(a) | | | 233,035 | | | | 43,426,072 | |
Ceridian HCM Holding, Inc.(a)(b) | | | 113,394 | | | | 11,845,137 | |
Citrix Systems, Inc. | | | 103,740 | | | | 9,812,767 | |
Fortinet, Inc.(a) | | | 114,050 | | | | 40,989,570 | |
Intuit, Inc. | | | 238,373 | | | | 153,326,281 | |
Microsoft Corp. | | | 6,313,099 | | | | 2,123,221,456 | |
NortonLifeLock, Inc. | | | 492,908 | | | | 12,805,750 | |
Oracle Corp. | | | 1,356,189 | | | | 118,273,243 | |
Paycom Software, Inc.(a)(b) | | | 40,313 | | | | 16,737,554 | |
PTC, Inc.(a) | | | 88,186 | | | | 10,683,734 | |
salesforce.com, Inc.(a) | | | 823,194 | | | | 209,198,291 | |
ServiceNow, Inc.(a) | | | 167,330 | | | | 108,615,576 | |
Synopsys, Inc.(a) | | | 128,358 | | | | 47,299,923 | |
Tyler Technologies, Inc.(a) | | | 34,150 | | | | 18,370,993 | |
| | | | | | | | |
| | |
| | | | | | | 3,233,170,370 | |
| |
| Specialty Retail — 2.4% | | | | |
Advance Auto Parts, Inc. | | | 52,975 | | | | 12,707,643 | |
AutoZone, Inc.(a) | | | 17,631 | | | | 36,961,452 | |
Bath & Body Works, Inc. | | | 222,582 | | | | 15,533,998 | |
Best Buy Co., Inc. | | | 187,470 | | | | 19,046,952 | |
CarMax, Inc.(a)(b) | | | 136,909 | | | | 17,829,659 | |
Gap, Inc. | | | 171,031 | | | | 3,018,697 | |
Home Depot, Inc. | | | 887,401 | | | | 368,280,289 | |
Lowe’s Cos., Inc. | | | 582,234 | | | | 150,495,845 | |
O’Reilly Automotive, Inc.(a) | | | 56,655 | | | | 40,011,461 | |
| | |
MASTER PORTFOLIO SCHEDULE OF INVESTMENTS | | 29 |
| | |
Schedule of Investments (continued) December 31, 2021 | | S&P 500 Index Master Portfolio (Percentages shown are based on Net Assets) |
| | | | | | | | |
| Security | | Shares | | | Value | |
| |
| |
Specialty Retail (continued) | | | | | |
Ross Stores, Inc. | | | 300,147 | | | $ | 34,300,799 | |
TJX Cos., Inc. | | | 1,010,722 | | | | 76,734,014 | |
Tractor Supply Co. | | | 95,612 | | | | 22,813,023 | |
Ulta Beauty, Inc.(a)(b) | | | 45,673 | | | | 18,832,805 | |
| | | | | | | | |
| | |
| | | | | | | 816,566,637 | |
|
| Technology Hardware, Storage & Peripherals — 7.1% | |
Apple, Inc. | | | 13,105,581 | | | | 2,327,158,018 | |
Hewlett Packard Enterprise Co. | | | 1,101,086 | | | | 17,364,126 | |
HP, Inc. | | | 969,098 | | | | 36,505,922 | |
NetApp, Inc. | | | 187,617 | | | | 17,258,888 | |
Seagate Technology Holdings PLC | | | 172,228 | | | | 19,458,320 | |
Western Digital Corp.(a) | | | 260,073 | | | | 16,959,360 | |
| | | | | | | | |
| | |
| | | | | | | 2,434,704,634 | |
| |
| Textiles, Apparel & Luxury Goods — 0.7% | | | | |
NIKE, Inc., Class B | | | 1,073,299 | | | | 178,886,744 | |
PVH Corp. | | | 60,241 | | | | 6,424,703 | |
Ralph Lauren Corp. | | | 39,948 | | | | 4,748,219 | |
Tapestry, Inc. | | | 237,843 | | | | 9,656,426 | |
Under Armour, Inc., Class A(a) | | | 150,302 | | | | 3,184,899 | |
Under Armour, Inc., Class C(a)(b) | | | 169,421 | | | | 3,056,355 | |
VF Corp. | | | 274,125 | | | | 20,071,433 | |
| | | | | | | | |
| | |
| | | | | | | 226,028,779 | |
| |
| Tobacco — 0.6% | | | | |
Altria Group, Inc. | | | 1,544,636 | | | | 73,200,300 | |
Philip Morris International, Inc. | | | 1,308,437 | | | | 124,301,515 | |
| | | | | | | | |
| | |
| | | | | | | 197,501,815 | |
| |
| Trading Companies & Distributors — 0.2% | | | | |
Fastenal Co. | | | 481,642 | | | | 30,853,987 | |
United Rentals, Inc.(a) | | | 61,424 | | | | 20,410,581 | |
W.W. Grainger, Inc. | | | 36,543 | | | | 18,938,044 | |
| | | | | | | | |
| | |
| | | | | | | 70,202,612 | |
| |
| Water Utilities — 0.1% | | | | |
American Water Works Co., Inc. | | | 153,076 | | | | 28,909,933 | |
| | | | | | | | |
| | | | | | | | |
| Security | | Shares | | | Value | |
| |
| |
Wireless Telecommunication Services — 0.2% | | | | | |
T-Mobile US, Inc.(a) | | | 493,333 | | | $ | 57,216,761 | |
| | | | | | | | |
| |
Total Common Stocks — 98.4%
(Cost: $13,266,446,878) | | | | 33,933,922,007 | |
| | | | | | | | |
| |
| Investment Companies | | | | |
| |
| Equity Funds — 1.3% | | | | |
iShares Core S&P 500 ETF(c) | | | 908,230 | | | | 433,216,628 | |
| | | | | | | | |
| |
Total Investment Companies — 1.3%
(Cost: $406,997,076) | | | | 433,216,628 | |
| | | | | | | | |
| |
Total Long-Term Investments — 99.7%
(Cost: $13,673,443,954) | | | | 34,367,138,635 | |
| | | | | | | | |
| |
| Short-Term Securities | | | | |
| | |
| Money Market Funds — 0.9% | | | | | | |
BlackRock Cash Funds: Institutional, SL Agency Shares, 0.10%(c)(d)(e) | | | 129,501,196 | | | | 129,540,046 | |
BlackRock Cash Funds: Treasury, SL Agency Shares, 0.01%(c)(d) | | | 190,825,864 | | | | 190,825,864 | |
| | | | | | | | |
| |
Total Short-Term Securities — 0.9%
(Cost: $320,350,320) | | | | 320,365,910 | |
| | | | | | | | |
| |
Total Investments — 100.6%
(Cost: $13,993,794,274) | | | | 34,687,504,545 | |
| |
Liabilities in Excess of Other Assets — (0.6)% | | | | (198,218,973 | ) |
| | | | | | | | |
| |
Net Assets — 100.0% | | | $ | 34,489,285,572 | |
| | | | | | | | |
| (a) | Non-income producing security. |
| (b) | All or a portion of this security is on loan. |
| (c) | Affiliate of the Master Portfolio. |
| (d) | Annualized 7-day yield as of period end. |
| (e) | All or a portion of this security was purchased with the cash collateral from loaned securities. |
For Master Portfolio compliance purposes, the Master Portfolio’s industry classifications refer to one or more of the industry sub-classifications used by one or more widely recognized market indexes or rating group indexes, and/or as defined by the investment adviser. These definitions may not apply for purposes of this report, which may combine such industry sub-classifications for reporting ease.
Affiliates
Investments in issuers considered to be affiliate(s) of the Master Portfolio during the year ended December 31, 2021 for purposes of Section 2(a)(3) of the Investment Company Act of 1940, as amended, were as follows:
| | | | | | | | | | | | | | | | | | | | | | | | | | | | | | | | | | | | | | | | | | |
| | | | | | | |
| | | | | | | | | | | |
| | | Affiliated Issuer | | Value at 12/31/20 | | | Purchases at Cost | | | Proceeds from Sales | | | Net Realized Gain (Loss) | | | Change in Unrealized Appreciation (Depreciation) | | | Value at 12/31/21 | | | Shares Held at 12/31/21 | | | Income | | | Capital Gain Distributions from Underlying Funds | | | | |
| | | | | | | |
| | | | | | | | | | | |
| | BlackRock Cash Funds: Institutional, SL Agency Shares | | $ | 161,818,190 | | | $ | — | | | $ | (32,256,275 | )(a) | | $ | 110,352 | | | $ | (132,221 | ) | | $ | 129,540,046 | | | | 129,501,196 | | | $ | 378,891 | (b) | | $ | — | | | | | |
| | BlackRock Cash Funds: Treasury, SL Agency Shares | | | 82,440,013 | | | | 108,385,851 | (a) | | | — | | | | — | | | | — | | | �� | 190,825,864 | | | | 190,825,864 | | | | 23,048 | | | | — | | | | | |
| | BlackRock, Inc. | | | 87,650,514 | | | | 1,662,103 | | | | (2,429,331 | ) | | | 532,851 | | | | 22,705,589 | | | | 110,121,726 | | | | 120,278 | | | | 1,975,379 | | | | — | | | | | |
| | iShares Core S&P 500 ETF | | | 4,286,954 | | | | 996,376,819 | | | | (622,290,936 | ) | | | 30,081,124 | | | | 24,762,667 | | | | 433,216,628 | | | | 908,230 | | | | 2,638,849 | | | | — | | | | | |
| | | | | | | | | | | | | | | | | | | | | | | | | | | | | | | | | | | | | | | | | | |
| | | | | | | | | | | |
| | | | | | | | | | | | | | | | $ | 30,724,327 | | | $ | 47,336,035 | | | $ | 863,704,264 | | | | | | | $ | 5,016,167 | | | $ | — | | | | | |
| | | | | | | | | | | | | | | | | | | | | | | | | | | | | | | | | | | | | | | | | | |
| | (a) | Represents net amount purchased (sold). | |
| | (b) | All or a portion represents securities lending income earned from the reinvestment of cash collateral from loaned securities, net of fees and collateral investment expenses, and other payments to and from borrowers of securities. | |
| | |
| 30 | | 2 0 2 1 BLACK ROCK ANNUAL REPORT TO SHAREHOLDERS |
| | |
Schedule of Investments (continued) December 31, 2021 | | S&P 500 Index Master Portfolio |
Derivative Financial Instruments Outstanding as of Period End
Futures Contracts
| | | | | | | | | | | | | | | | |
| | | | | |
| Description | | Number of Contracts | | | Expiration Date | | | Notional Amount (000) | | | Value/ Unrealized Appreciation (Depreciation) | |
| | | | |
Long Contracts | | | | | | | | | | | | | | | | |
| | | | |
S&P 500 E-Mini Index | | | 784 | | | | 03/18/22 | | | $ | 186,533 | | | $ | 6,917,190 | |
| | | | | | | | | | | | | | | | |
Derivative Financial Instruments Categorized by Risk Exposure
As of period end, the fair values of derivative financial instruments located in the Statement of Assets and Liabilities were as follows:
| | | | | | | | | | | | | | | | | | | | | | | | | | | | |
| | | | | | | | |
| | | Commodity Contracts | | | Credit Contracts | | | Equity Contracts | | | Foreign Currency Exchange Contracts | | | Interest Rate Contracts | | | Other Contracts | | | Total | |
| | | | | | | |
Assets — Derivative Financial Instruments | | | | | | | | | | | | | | | | | | | | | | | | | | | | |
Futures contracts | | | | | | | | | | | | | | | | | | | | | | | | | | | | |
Unrealized appreciation on futures contracts(a) | | $ | — | | | $ | — | | | $ | 6,917,190 | | | $ | — | | | $ | — | | | $ | — | | | $ | 6,917,190 | |
| | | | | | | | | | | | | | | | | | | | | | | | | | | | |
| | (a) | Net cumulative unrealized appreciation (depreciation) on futures contracts and centrally cleared swaps, if any, are reported in the Master Portfolio Schedule of Investments. In the Statement of Assets and Liabilities, only current day’s variation margin is reported in receivables or payables and the net cumulative unrealized appreciation (depreciation) is included in net unrealized appreciation (depreciation). | |
For the period ended December 31, 2021, the effect of derivative financial instruments in the Statement of Operations was as follows:
| | | | | | | | | | | | | | | | | | | | | | | | | | | | |
| | | | | | | | |
| | | Commodity Contracts | | | Credit Contracts | | | Equity Contracts | | | Foreign Currency Exchange Contracts | | | Interest Rate Contracts | | | Other Contracts | | | Total | |
| | | | | | | |
Net Realized Gain (Loss) from: | | | | | | | | | | | | | | | | | | | | | | | | | | | | |
Futures contracts | | $ | — | | | $ | — | | | $ | 53,863,481 | | | $ | — | | | $ | — | | | $ | — | | | $ | 53,863,481 | |
| | | | | | | | | | | | | | | | | | | | | | | | | | | | |
| | | | | | | |
Net Change in Unrealized Appreciation (Depreciation) on: | | | | | | | | | | | | | | | | | | | | | | | | | | | | |
Futures contracts | | $ | — | | | $ | — | | | $ | 5,296,692 | | | $ | — | | | $ | — | | | $ | — | | | $ | 5,296,692 | |
| | | | | | | | | | | | | | | | | | | | | | | | | | | | |
Average Quarterly Balances of Outstanding Derivative Financial Instruments
| | | | |
| | |
Futures contracts: | | | | |
Average notional value of contracts — long | | $ | 224,304,286 | |
For more information about the Master Portfolio’s investment risks regarding derivative financial instruments, refer to the Notes to Financial Statements.
Fair Value Hierarchy as of Period End
Various inputs are used in determining the fair value of financial instruments. For a description of the input levels and information about the Master Portfolio’s policy regarding valuation of financial instruments, refer to the Notes to Financial Statements.
The following table summarizes the Master Portfolio’s financial instruments categorized in the fair value hierarchy. The breakdown of the Master Portfolio’s financial instruments into major categories is disclosed in the Schedule of Investments above.
| | | | | | | | | | | | | | | | |
| | | | | |
| | | Level 1 | | | Level 2 | | | Level 3 | | | Total | |
| | | | |
Assets | | | | | | | | | | | | | | | | |
Investments | | | | | | | | | | | | | | | | |
Long-Term Investments | | | | | | | | | | | | | | | | |
Common Stocks | | $ | 33,933,922,007 | | | $ | — | | | $ | — | | | $ | 33,933,922,007 | |
Investment Companies | | | 433,216,628 | | | | — | | | | — | | | | 433,216,628 | |
Short-Term Securities | | | | | | | | | | | | | | | | |
Money Market Funds | | | 320,365,910 | | | | — | | | | — | | | | 320,365,910 | |
| | | | | | | | | | | | | | | | |
| | | | |
| | $ | 34,687,504,545 | | | $ | — | | | $ | — | | | $ | 34,687,504,545 | |
| | | | | | | | | | | | | | | | |
| | |
MASTER PORTFOLIO SCHEDULE OF INVESTMENTS | | 31 |
| | |
Schedule of Investments (continued) December 31, 2021 | | S&P 500 Index Master Portfolio |
Fair Value Hierarchy as of Period End (continued)
| | | | | | | | | | | | | | | | |
| | | | | |
| | | Level 1 | | | Level 2 | | | Level 3 | | | Total | |
| | | | |
Derivative Financial Instruments(a) | | | | | | | | | | | | | | | | |
Assets | | | | | | | | | | | | | | | | |
Equity Contracts | | $ | 6,917,190 | | | $ | — | | | $ | — | | | $ | 6,917,190 | |
| | | | | | | | | | | | | | | | |
| | (a) | Derivative financial instruments are futures contracts. Futures contracts are valued at the unrealized appreciation (depreciation) on the instrument. | |
See notes to financial statements.
| | |
| 32 | | 2 0 2 1 BLACK ROCK ANNUAL REPORT TO SHAREHOLDERS |
Statement of Assets and Liabilities
December 31, 2021
| | | | |
| | | S&P 500 Index Master Portfolio | |
| |
| |
ASSETS | | | | |
Investments, at value — unaffiliated(a)(b) | | $ | 33,823,800,281 | |
Investments, at value — affiliated(c) | | | 863,704,264 | |
Cash | | | 87,846 | |
Cash pledged for futures contracts | | | 10,105,800 | |
Receivables: | | | | |
Securities lending income — affiliated | | | 10,757 | |
Dividends — unaffiliated | | | 20,170,487 | |
Dividends — affiliated | | | 698 | |
Prepaid expenses | | | 41,137 | |
| | | | |
| |
Total assets | | | 34,717,921,270 | |
| | | | |
| |
LIABILITIES | | | | |
Collateral on securities loaned | | | 129,405,466 | |
Payables: | | | | |
Investments purchased | | | 23,924,376 | |
Withdrawals to investors | | | 74,250,025 | |
Investment advisory fees | | | 276,022 | |
Trustees’ fees | | | 103,860 | |
Professional fees | | | 103,593 | |
Variation margin on futures contracts | | | 572,356 | |
| | | | |
| |
Total liabilities | | | 228,635,698 | |
| | | | |
| |
NET ASSETS | | $ | 34,489,285,572 | |
| | | | |
| |
NET ASSETS CONSIST OF | | | | |
Investors’ capital | | $ | 13,788,658,111 | |
Net unrealized appreciation (depreciation) | | | 20,700,627,461 | |
| | | | |
| |
NET ASSETS | | $ | 34,489,285,572 | |
| | | | |
| |
(a) Investments, at cost — unaffiliated | | $ | 13,225,259,124 | |
(b) Securities loaned, at value | | $ | 125,970,318 | |
(c) Investments, at cost — affiliated | | $ | 768,535,150 | |
See notes to financial statements.
| | |
MASTER PORTFOLIO FINANCIAL STATEMENTS | | 33 |
Statement of Operations
Year Ended December 31, 2021
| | | | |
| | | S&P 500 Index Master Portfolio | |
| |
| |
INVESTMENT INCOME
| | | | |
Dividends — unaffiliated | | $ | 429,964,111 | |
Dividends — affiliated | | | 4,642,759 | |
Securities lending income — affiliated — net | | | 373,408 | |
Foreign taxes withheld | | | (2,160,807 | ) |
| | | | |
| |
Total investment income | | | 432,819,471 | |
| | | | |
| |
EXPENSES | | | | |
Investment advisory | | | 3,082,741 | |
Trustees | | | 357,059 | |
Professional | | | 71,377 | |
| | | | |
| |
Total expenses | | | 3,511,177 | |
Less: | | | | |
Fees waived and/or reimbursed by the Manager | | | (579,645 | ) |
| | | | |
| |
Total expenses after fees waived and/or reimbursed | | | 2,931,532 | |
| | | | |
| |
Net investment income | | | 429,887,939 | |
| | | | |
| |
REALIZED AND UNREALIZED GAIN (LOSS) | | | | |
Net realized gain from: | | | | |
Investments — unaffiliated | | | 213,228,863 | |
Investments — affiliated | | | 30,724,327 | |
Futures contracts | | | 53,863,481 | |
| | | | |
| |
| | | 297,816,671 | |
| | | | |
Net change in unrealized appreciation (depreciation) on: | | | | |
Investments — unaffiliated | | | 6,955,669,347 | |
Investments — affiliated | | | 47,336,035 | |
Futures contracts | | | 5,296,692 | |
| | | | |
| |
| | | 7,008,302,074 | |
| | | | |
| |
Net realized and unrealized gain | | | 7,306,118,745 | |
| | | | |
| |
NET INCREASE IN NET ASSETS RESULTING FROM OPERATIONS | | $ | 7,736,006,684 | |
| | | | |
See notes to financial statements.
| | |
| 34 | | 2 0 2 1 BLACK ROCK ANNUAL REPORT TO SHAREHOLDERS |
Statements of Changes in Net Assets
| | | | | | | | |
| | | S&P 500 Index Master Portfolio | |
| |
| | | Year Ended December 31, | |
| | |
| | | 2021 | | | 2020 | |
| |
| | |
INCREASE (DECREASE) IN NET ASSETS | | | | | | | | |
| | |
OPERATIONS | | | | | | | | |
Net investment income | | $ | 429,887,939 | | | $ | 425,673,598 | |
Net realized gain (loss) | | | 297,816,671 | | | | (14,465,672 | ) |
Net change in unrealized appreciation (depreciation) | | | 7,008,302,074 | | | | 3,910,413,153 | |
| | | | | | | | |
| | |
Net increase in net assets resulting from operations | | | 7,736,006,684 | | | | 4,321,621,079 | |
| | | | | | | | |
| | |
CAPITAL TRANSACTIONS | | | | | | | | |
Proceeds from contributions | | | 7,697,627,774 | | | | 7,849,994,984 | |
Value of withdrawals | | | (7,937,321,540 | ) | | | (8,386,601,754 | ) |
| | | | | | | | |
| | |
Net decrease in net assets derived from capital transactions | | | (239,693,766 | ) | | | (536,606,770 | ) |
| | | | | | | | |
| | |
NET ASSETS | | | | | | | | |
Total increase in net assets | | | 7,496,312,918 | | | | 3,785,014,309 | |
Beginning of year | | | 26,992,972,654 | | | | 23,207,958,345 | |
| | | | | | | | |
| | |
End of year | | $ | 34,489,285,572 | | | $ | 26,992,972,654 | |
| | | | | | | | |
See notes to financial statements.
| | |
MASTER PORTFOLIO FINANCIAL STATEMENTS | | 35 |
Financial Highlights
| | | | | | | | | | | | | | | | | | | | |
| | | S&P 500 Index Master Portfolio | |
| |
| | | Year Ended December 31, | |
| | | | | |
| | | 2021 | | | 2020 | | | 2019 | | | 2018 | | | 2017 | |
| | | | | |
Total Return | | | | | | | | | | | | | | | | | | | | |
Total return | | | 28.65 | % | | | 18.42 | % | | | 31.44 | % | | | (4.38 | )% | | | 21.77 | % |
| | | | | | | | | | | | | | | | | | | | |
| | | | | |
Ratios to Average Net Assets(a) | | | | | | | | | | | | | | | | | | | | |
Total expenses | | | 0.01 | % | | | 0.01 | % | | | 0.03 | % | | | 0.04 | % | | | 0.04 | % |
| | | | | | | | | | | | | | | | | | | | |
| | | | | |
Total expenses after fees waived and/or reimbursed | | | 0.01 | % | | | 0.01 | % | | | 0.02 | % | | | 0.04 | % | | | 0.04 | % |
| | | | | | | | | | | | | | | | | | | | |
| | | | | |
Net investment income | | | 1.39 | % | | | 1.82 | % | | | 1.95 | % | | | 1.92 | % | | | 1.93 | % |
| | | | | | | | | | | | | | | | | | | | |
| | | | | |
Supplemental Data | | | | | | | | | | | | | | | | | | | | |
Net assets, end of year (000) | | $ | 34,489,286 | | | $ | 26,992,973 | | | $ | 23,207,958 | | | $ | 17,256,929 | | | $ | 13,775,074 | |
| | | | | | | | | | | | | | | | | | | | |
| | | | | |
Portfolio turnover rate | | | 6 | % | | | 5 | % | | | 3 | % | | | 12 | % | | | 11 | % |
| | | | | | | | | | | | | | | | | | | | |
| (a) | Excludes fees and expenses incurred indirectly as a result of investments in underlying funds. |
See notes to financial statements.
| | |
| 36 | | 2 0 2 1 BLACK ROCK ANNUAL REPORT TO SHAREHOLDERS |
Notes to Financial Statements
Master Investment Portfolio (“MIP”) is registered under the Investment Company Act of 1940, as amended (the “1940 Act”), as an open-end management investment company. MIP is organized as a Delaware statutory trust. S&P 500 Index Master Portfolio (the “Master Portfolio”) is a series of MIP. The Master Portfolio is classified as diversified.
The Master Portfolio, together with certain other registered investment companies advised by BlackRock Fund Advisors (“BFA” or the “Manager”) or its affiliates, is included in a complex of open-end equity, multi-asset, index and money market funds referred to as the BlackRock Multi-Asset Complex.
| 2. | SIGNIFICANT ACCOUNTING POLICIES |
The financial statements are prepared in conformity with accounting principles generally accepted in the United States of America (“U.S. GAAP”), which may require management to make estimates and assumptions that affect the reported amounts of assets and liabilities in the financial statements, disclosure of contingent assets and liabilities at the date of the financial statements and the reported amounts of increases and decreases in net assets from operations during the reporting period. Actual results could differ from those estimates. The Master Portfolio is considered an investment company under U.S. GAAP and follows the accounting and reporting guidance applicable to investment companies. Below is a summary of significant accounting policies:
Investment Transactions and Income Recognition: For financial reporting purposes, investment transactions are recorded on the dates the transactions are executed. Realized gains and losses on investment transactions are determined using the specific identification method. Dividend income and capital gain distributions, if any, are recorded on the ex-dividend dates. Non-cash dividends, if any, are recorded on the ex-dividend dates at fair value. Dividends from foreign securities where the ex-dividend dates may have passed are subsequently recorded when the Master Portfolio is informed of the ex-dividend dates. Under the applicable foreign tax laws, a withholding tax at various rates may be imposed on capital gains, dividends and interest. Upon notification from issuers, a portion of the dividend income received from a real estate investment trust may be redesignated as a reduction of cost of the related investment and/or realized gain.
Foreign Taxes: The Master Portfolio may be subject to foreign taxes (a portion of which may be reclaimable) on income, stock dividends, capital gains on investments, or certain foreign currency transactions. All foreign taxes are recorded in accordance with the applicable foreign tax regulations and rates that exist in the foreign jurisdictions in which the Master Portfolio invests. These foreign taxes, if any, are paid by the Master Portfolio and are reflected in its Statement of Operations as follows: foreign taxes withheld at source are presented as a reduction of income, foreign taxes on securities lending income are presented as a reduction of securities lending income, foreign taxes on stock dividends are presented as “Foreign taxes withheld”, and foreign taxes on capital gains from sales of investments and foreign taxes on foreign currency transactions are included in their respective net realized gain (loss) categories. Foreign taxes payable or deferred as of December 31, 2021, if any, are disclosed in the Statement of Assets and Liabilities.
The Master Portfolio files withholding tax reclaims in certain jurisdictions to recover a portion of amounts previously withheld. The Master Portfolio may record a reclaim receivable based on collectability, which includes factors such as the jurisdiction’s applicable laws, payment history and market convention. The Statement of Operations includes tax reclaims recorded as well as professional and other fees, if any, associated with recovery of foreign withholding taxes.
Segregation and Collateralization: In cases where the Master Portfolio enters into certain investments (e.g., futures contracts) that would be treated as “senior securities” for 1940 Act purposes, the Master Portfolio may segregate or designate on its books and records cash or liquid assets having a market value at least equal to the amount of its future obligations under such investments. Doing so allows the investments to be excluded from treatment as a “senior security.” Furthermore, if required by an exchange or counterparty agreement, the Master Portfolio may be required to deliver/deposit cash and/or securities to/with an exchange, or broker-dealer or custodian as collateral for certain investments or obligations.
Indemnifications: In the normal course of business, the Master Portfolio enters into contracts that contain a variety of representations that provide general indemnification. The Master Portfolio’s maximum exposure under these arrangements is unknown because it involves future potential claims against the Master Portfolio, which cannot be predicted with any certainty.
Other: Expenses directly related to the Master Portfolio are charged to the Master Portfolio. Other operating expenses shared by several funds, including other funds managed by the Manager, are prorated among those funds on the basis of relative net assets or other appropriate methods.
| 3. | INVESTMENT VALUATION AND FAIR VALUE MEASUREMENTS |
Investment Valuation Policies: The Master Portfolio’s investments are valued at fair value (also referred to as “market value” within the financial statements) each day that the Master Portfolio is open for business and, for financial reporting purposes, as of the report date. U.S. GAAP defines fair value as the price a fund would receive to sell an asset or pay to transfer a liability in an orderly transaction between market participants at the measurement date. The Master Portfolio determines the fair values of its financial instruments using various independent dealers or pricing services under policies approved by the Board of Trustees of the MIP (the “Board”). If a security’s market price is not readily available or does not otherwise accurately represent the fair value of the security, the security will be valued in accordance with a policy approved by the Board as reflecting fair value. The BlackRock Global Valuation Methodologies Committee (the “Global Valuation Committee”) is the committee formed by management to develop global pricing policies and procedures and to oversee the pricing function for all financial instruments.
| | |
MASTER PORTFOLIO NOTES TO FINANCIAL STATEMENTS | | 37 |
Notes to Financial Statements (continued)
Fair Value Inputs and Methodologies: The following methods and inputs are used to establish the fair value of the Master Portfolio’s assets and liabilities:
| | • | | Equity investments traded on a recognized securities exchange are valued at that day’s official closing price, as applicable, on the exchange where the stock is primarily traded. Equity investments traded on a recognized exchange for which there were no sales on that day may be valued at the last available bid (long positions) or ask (short positions) price. |
| | • | | Investments in open-end U.S. mutual funds (including money market funds) are valued at that day’s published NAV. |
| | • | | Futures contracts are valued based on that day’s last reported settlement or trade price on the exchange where the contract is traded. |
Generally, trading in foreign instruments is substantially completed each day at various times prior to the close of trading on the New York Stock Exchange (“NYSE”). Each business day, the Master Portfolio uses current market factors supplied by independent pricing services to value certain foreign instruments (“Systematic Fair Value Price”). The Systematic Fair Value Price is designed to value such foreign securities at fair value as of the close of trading on the NYSE, which follows the close of the local markets.
If events (e.g., market volatility, company announcement or a natural disaster) occur that are expected to materially affect the value of such investment, or in the event that application of these methods of valuation results in a price for an investment that is deemed not to be representative of the market value of such investment, or if a price is not available, the investment will be valued by the Global Valuation Committee, or its delegate, in accordance with a policy approved by the Board as reflecting fair value (“Fair Valued Investments”). The fair valuation approaches that may be used by the Global Valuation Committee include market approach, income approach and cost approach. Valuation techniques such as discounted cash flow, use of market comparables and matrix pricing are types of valuation approaches and are typically used in determining fair value. When determining the price for Fair Valued Investments, the Global Valuation Committee, or its delegate, seeks to determine the price that the Master Portfolio might reasonably expect to receive or pay from the current sale or purchase of that asset or liability in an arm’s-length transaction. Fair value determinations shall be based upon all available factors that the Global Valuation Committee, or its delegate, deems relevant and consistent with the principles of fair value measurement. The pricing of all Fair Valued Investments is subsequently reported to the Board or a committee thereof on a quarterly basis.
Fair Value Hierarchy: Various inputs are used in determining the fair value of financial instruments. These inputs to valuation techniques are categorized into a fair value hierarchy consisting of three broad levels for financial reporting purposes as follows:
| | • | | Level 1 – Unadjusted price quotations in active markets/exchanges for identical assets or liabilities that the Master Portfolio has the ability to access; |
| | • | | Level 2 – Other observable inputs (including, but not limited to, quoted prices for similar assets or liabilities in markets that are active, quoted prices for identical or similar assets or liabilities in markets that are not active, inputs other than quoted prices that are observable for the assets or liabilities (such as interest rates, yield curves, volatilities, prepayment speeds, loss severities, credit risks and default rates) or other market-corroborated inputs); and |
| | • | | Level 3 – Unobservable inputs based on the best information available in the circumstances, to the extent observable inputs are not available (including the Global Valuation Committee’s assumptions used in determining the fair value of financial instruments). |
The hierarchy gives the highest priority to unadjusted quoted prices in active markets for identical assets or liabilities (Level 1 measurements) and the lowest priority to unobservable inputs (Level 3 measurements). Accordingly, the degree of judgment exercised in determining fair value is greatest for instruments categorized in Level 3. The inputs used to measure fair value may fall into different levels of the fair value hierarchy. In such cases, for disclosure purposes, the fair value hierarchy classification is determined based on the lowest level input that is significant to the fair value measurement in its entirety. Investments classified within Level 3 have significant unobservable inputs used by the Global Valuation Committee in determining the price for Fair Valued Investments. Level 3 investments include equity or debt issued by privately held companies or funds that may not have a secondary market and/or may have a limited number of investors. The categorization of a value determined for financial instruments is based on the pricing transparency of the financial instruments and is not necessarily an indication of the risks associated with investing in those securities.
| 4. | SECURITIES AND OTHER INVESTMENTS |
Securities Lending: The Master Portfolio may lend its securities to approved borrowers, such as brokers, dealers and other financial institutions. The borrower pledges and maintains with the Master Portfolio collateral consisting of cash, an irrevocable letter of credit issued by a bank, or securities issued or guaranteed by the U.S. Government. The initial collateral received by the Master Portfolio is required to have a value of at least 102% of the current value of the loaned securities for securities traded on U.S. exchanges and a value of at least 105% for all other securities. The collateral is maintained thereafter at a value equal to at least 100% of the current market value of the securities on loan. The market value of the loaned securities is determined at the close of each business day of the Master Portfolio and any additional required collateral is delivered to the Master Portfolio, or excess collateral returned by the Master Portfolio, on the next business day. During the term of the loan, the Master Portfolio is entitled to all distributions made on or in respect of the loaned securities, but does not receive interest income on securities received as collateral. Loans of securities are terminable at any time and the borrower, after notice, is required to return borrowed securities within the standard time period for settlement of securities transactions.
As of period end, any securities on loan were collateralized by cash and/or U.S. Government obligations. Cash collateral invested by the securities lending agent, BlackRock Institutional Trust Company, N.A. (“BTC”), if any, is disclosed in the Schedule of Investments. Any non-cash collateral received cannot be sold, re-invested or pledged by the Master Portfolio, except in the event of borrower default. The securities on loan, if any, are disclosed in the Master Portfolio’s Schedule of Investments. The market value of any securities on loan and the value of any related collateral are shown separately in the Statement of Assets and Liabilities as a component of investments at value –unaffiliated and collateral on securities loaned at value, respectively.
Securities lending transactions are entered into by the Master Portfolio under Master Securities Lending Agreements (each, an “MSLA”), which provide the right, in the event of default (including bankruptcy or insolvency), for the non-defaulting party to liquidate the collateral and calculate a net exposure to the defaulting party or request additional collateral. In the event that a borrower defaults, the Master Portfolio, as lender, would offset the market value of the collateral received against the market value of the securities
| | |
| 38 | | 2 0 2 1 BLACK ROCK ANNUAL REPORT TO SHAREHOLDERS |
Notes to Financial Statements (continued)
loaned. When the value of the collateral is greater than that of the market value of the securities loaned, the lender is left with a net amount payable to the defaulting party. However, bankruptcy or insolvency laws of a particular jurisdiction may impose restrictions on or prohibitions against such a right of offset in the event of an MSLA counterparty’s bankruptcy or insolvency. Under the MSLA, absent an event of default, the borrower can resell or re-pledge the loaned securities, and the Master Portfolio can reinvest cash collateral received in connection with loaned securities. Upon an event of default, the parties’ obligations to return the securities or collateral to the other party are extinguished, and the parties can resell or re-pledge the loaned securities or the collateral received in connection with the loaned securities in order to satisfy the defaulting party’s net payment obligation for all transactions under the MSLA. The defaulting party remains liable for any deficiency.
As of period end, the following table is a summary of the Master Portfolio’s securities on loan by counterparty which are subject to offset under an MSLA:
| | | | | | | | | | | | | | | | | | |
| |
| | | Securities | | | Cash Collateral | | | | Non-Cash Collateral | | | | Net | |
Counterparty | | | Loaned at Value | | | | | | Received | (a) | | | Received at Fair Value | (a) | | | Amount | |
| |
| | | | | |
Barclays Bank PLC | | $ | 55,474,325 | | | | | $ | (55,474,325 | ) | | $ | — | | | $ | — | |
Barclays Capital, Inc. | | | 10,206,763 | | | | | | (10,206,763 | ) | | | — | | | | — | |
BNP Paribas SA | | | 4,974,260 | | | | | | (4,974,260 | ) | | | — | | | | — | |
Citigroup Global Markets, Inc. | | | 14,367,448 | | | | | | (14,367,448 | ) | | | — | | | | — | |
Credit Suisse Securities (USA) LLC | | | 11,415,667 | | | | | | (11,415,667 | ) | | | — | | | | — | |
Goldman Sachs & Co. LLC | | | 7,366,484 | | | | | | (7,366,484 | ) | | | — | | | | — | |
JPMorgan Securities LLC | | | 6,747,433 | | | | | | (6,747,433 | ) | | | — | | | | — | |
Morgan Stanley | | | 3,747,001 | | | | | | (3,747,001 | ) | | | — | | | | — | |
SG Americas Securities LLC | | | 10,579,254 | | | | | | (10,579,254 | ) | | | — | | | | — | |
State Street Bank & Trust Co. | | | 66,410 | | | | | | (66,410 | ) | | | — | | | | — | |
UBS AG | | | 627,059 | | | | | | (627,059 | ) | | | — | | | | — | |
UBS Securities LLC | | | 221,000 | | | | | | (221,000 | ) | | | — | | | | — | |
Virtu Americas LLC | | | 81,765 | | | | | | (81,765 | ) | | | — | | | | — | |
Wells Fargo Securities LLC | | | 95,449 | | | | | | (95,449 | ) | | | — | | | | — | |
| | | | | | | | | | | | | | | | | | |
| | | | | |
| | $ | 125,970,318 | | | | | $ | (125,970,318 | ) | | $ | — | | | $ | — | |
| | | | | | | | | | | | | | | | | | |
| | (a) | Collateral received in excess of the market value of securities on loan is not presented in this table. The total cash collateral received by the Master Portfolio is disclosed in the Master Portfolio’s Statement of Assets and Liabilities. | |
The risks of securities lending include the risk that the borrower may not provide additional collateral when required or may not return the securities when due. To mitigate these risks, the Master Portfolio benefits from a borrower default indemnity provided by BlackRock, Inc. (“BlackRock”). BlackRock’s indemnity allows for full replacement of the securities loaned to the extent the collateral received does not cover the value on the securities loaned in the event of borrower default. The Master Portfolio could incur a loss if the value of an investment purchased with cash collateral falls below the market value of loaned securities or if the value of an investment purchased with cash collateral falls below the value of the original cash collateral received. Such losses are borne entirely by the Master Portfolio.
| 5. | DERIVATIVE FINANCIAL INSTRUMENTS |
The Master Portfolio engages in various portfolio investment strategies using derivative contracts both to increase the returns of the Master Portfolio and/or to manage its exposure to certain risks such as credit risk, equity risk, interest rate risk, foreign currency exchange rate risk, commodity price risk or other risks (e.g., inflation risk). Derivative financial instruments categorized by risk exposure are included in the Schedule of Investments. These contracts may be transacted on an exchange or over-the-counter (“OTC”).
Futures Contracts: Futures contracts are purchased or sold to gain exposure to, or manage exposure to, changes in interest rates (interest rate risk) and changes in the value of equity securities (equity risk) or foreign currencies (foreign currency exchange rate risk).
Futures contracts are exchange-traded agreements between the Master Portfolio and a counterparty to buy or sell a specific quantity of an underlying instrument at a specified price and on a specified date. Depending on the terms of a contract, it is settled either through physical delivery of the underlying instrument on the settlement date or by payment of a cash amount on the settlement date. Upon entering into a futures contract, the Master Portfolio is required to deposit initial margin with the broker in the form of cash or securities in an amount that varies depending on a contract’s size and risk profile. The initial margin deposit must then be maintained at an established level over the life of the contract. Amounts pledged, which are considered restricted, are included in cash pledged for futures contracts in the Statement of Assets and Liabilities.
Securities deposited as initial margin are designated in the Schedule of Investments and cash deposited, if any, are shown as cash pledged for futures contracts in the Statement of Assets and Liabilities. Pursuant to the contract, the Master Portfolio agrees to receive from or pay to the broker an amount of cash equal to the daily fluctuation in market value of the contract (“variation margin”). Variation margin is recorded as unrealized appreciation (depreciation) and, if any, shown as variation margin receivable (or payable) on futures contracts in the Statement of Assets and Liabilities. When the contract is closed, a realized gain or loss is recorded in the Statement of Operations equal to the difference between the notional amount of the contract at the time it was opened and the notional amount at the time it was closed. The use of futures contracts involves the risk of an imperfect correlation in the movements in the price of futures contracts and interest rates, foreign currency exchange rates or underlying assets.
| 6. | INVESTMENT ADVISORY AGREEMENT AND OTHER TRANSACTIONS WITH AFFILIATES |
Investment Advisory: MIP, on behalf of the Master Portfolio, entered into an Investment Advisory Agreement with the Manager, the Master Portfolio’s investment adviser and an indirect, wholly-owned subsidiary of BlackRock, to provide investment advisory services. The Manager is responsible for the management of the Master Portfolio’s portfolio and provides the personnel, facilities, equipment and certain other services necessary to the operations of the Master Portfolio.
| | |
MASTER PORTFOLIO NOTES TO FINANCIAL STATEMENTS | | 39 |
Notes to Financial Statements (continued)
For such services, the Master Portfolio pays the Manager a monthly fee at an annual rate equal to 0.01% of the average daily value of the Master Portfolio’s net assets.
Administration: MIP, on behalf of the Master Portfolio entered into an Administration Agreement with BlackRock Advisors, LLC (“BAL”), which has agreed to provide general administrative services (other than investment advice and related portfolio activities). BAL has agreed to bear all of the Master Portfolio’s ordinary operating expenses, excluding, generally, investment advisory fees, distribution fees, brokerage and other expenses related to the execution of portfolio transactions, extraordinary expenses and certain other expenses which are borne by the Master Portfolio.
BAL is not entitled to compensation for providing administrative services to the Master Portfolio, for so long as BAL (or an affiliate) is entitled to compensation for providing administrative services to corresponding feeder funds that invest substantially all of their assets in the Master Portfolio, or BAL (or an affiliate) receives investment advisory fees from the Master Portfolio.
The fees and expenses of the Master Portfolio’s Independent Trustees, counsel to the Independent Trustees and the Master Portfolio’s independent registered public accounting firm (together, the “independent expenses”) are paid directly by the Master Portfolio. BFA has contractually agreed to reimburse the Master Portfolio or provide an offsetting credit against the investment advisory fees paid by the Master Portfolio in an amount equal to these independent expenses through June 30, 2023. If the Master Portfolio does not pay administration fees, BAL agrees to cap the expenses of the Master Portfolio at the rate at which it pays an investment advisory fee to BFA. The amount waived is included in fees waived and/or reimbursed by the Manager in the Statement of Operations. For the year ended December 31, 2021, the amount waived was $428,436.
Expense Waivers and Reimbursements: The Manager contractually agreed to waive its investment advisory fees by the amount of investment advisory fees the Master Portfolio pays to the Manager indirectly through its investment in affiliated money market funds (the “affiliated money market fund waiver”) through June 30, 2023. The contractual agreement may be terminated upon 90 days’ notice by a majority of the trustees who are not “interested persons” of MIP, as defined in the 1940 Act (“Independent Trustees”), or by a vote of a majority of the outstanding voting securities of the Master Portfolio. This amount is included in fees waived and/or reimbursed by the Manager in the Statement of Operations. For the year ended December 31, 2021, the amounts waived were $133,018.
The Manager has contractually agreed to waive its investment advisory fee with respect to any portion of the Master Portfolio’s assets invested in affiliated equity and fixed-income mutual funds and affiliated exchange-traded funds that have a contractual management fee through June 30, 2023. The contractual agreement may be terminated upon 90 days’ notice by a majority of the Independent Trustees, or by a vote of a majority of the outstanding voting securities of the Master Portfolio. This amount is included in fees waived and/or reimbursed by the Manager in the Statement of Operations. For the year ended December 31, 2021, the Manager waived $18,191 in investment advisory fees pursuant to this arrangement.
Securities Lending: The U.S. Securities and Exchange Commission (“SEC”) has issued an exemptive order which permits BTC, an affiliate of the Manager, to serve as securities lending agent for the Master Portfolio, subject to applicable conditions. As securities lending agent, BTC bears all operational costs directly related to securities lending, including any custodial costs. The Master Portfolio is responsible for fees in connection with the investment of cash collateral received for securities on loan (the “collateral investment fees”). The cash collateral is invested in a money market fund, BlackRock Cash Funds: Institutional or BlackRock Cash Funds: Treasury, managed by the Manager or its affiliates. However, BTC has agreed to reduce the amount of securities lending income it receives in order to effectively limit the collateral investment fees the Master Portfolio bears to an annual rate of 0.04%. The SL Agency Shares of such money market fund will not be subject to a sales load, distribution fee or service fee. The money market fund in which the cash collateral has been invested may, under certain circumstances, impose a liquidity fee of up to 2% of the value redeemed or temporarily restrict redemptions for up to 10 business days during a 90 day period, in the event that the money market fund’s weekly liquid assets fall below certain thresholds.
Securities lending income is equal to the total of income earned from the reinvestment of cash collateral, net of fees and other payments to and from borrowers of securities, and less the collateral investment fees. The Master Portfolio retains a portion of securities lending income and remits a remaining portion to BTC as compensation for its services as securities lending agent.
Pursuant to the current securities lending agreement, the Master Portfolio retains 77% of securities lending income (which excludes collateral investment fees), and this amount retained can never be less than 70% of the total of securities lending income plus the collateral investment fees.
In addition, commencing the business day following the date that the aggregate securities lending income earned across the BlackRock Multi-Asset Complex in a calendar year exceeds a specified threshold, the Master Portfolio, pursuant to the securities lending agreement, will retain for the remainder of that calendar year securities lending income in an amount equal to 81% of securities lending income (which excludes collateral investment fees), and this amount retained can never be less than 70% of the total of securities lending income plus the collateral investment fees.
Prior to January 1, 2021, the Master Portfolio retained 75% of securities lending income (which excluded collateral investment fees) and the amount retained could never be less than 70% of the total of securities lending income plus the collateral investment fees. In addition, commencing the business day following the date that the aggregate securities lending income earned across the BlackRock Multi-Asset Complex in a calendar year exceeded a specified threshold, the Fund would retain for the remainder of that calendar year 80% of securities lending income (which excluded collateral investment fees), and the amount retained could never be less than 70% of the total of securities lending income plus the collateral investment fees.
The share of securities lending income earned by the Master Portfolio is shown as securities lending income — affiliated — net in the Statement of Operations. For the year ended December 31, 2021, the Master Portfolio paid BTC $135,880 for securities lending agent services.
Interfund Lending: In accordance with an exemptive order (the “Order”) from the SEC, the Master Portfolio may participate in a joint lending and borrowing facility for temporary purposes (the “Interfund Lending Program”), subject to compliance with the terms and conditions of the Order, and to the extent permitted by the Master Portfolio’s investment policies and restrictions. The Master Portfolio is currently permitted to borrow and lend under the Interfund Lending Program.
| | |
| 40 | | 2 0 2 1 BLACK ROCK ANNUAL REPORT TO SHAREHOLDERS |
Notes to Financial Statements (continued)
A lending BlackRock fund may lend in aggregate up to 15% of its net assets but may not lend more than 5% of its net assets to any one borrowing fund through the Interfund Lending Program. A borrowing BlackRock fund may not borrow through the Interfund Lending Program or from any other source more than 33 1/3% of its total assets (or any lower threshold provided for by the fund’s investment restrictions). If a borrowing BlackRock fund’s total outstanding borrowings exceed 10% of its total assets, each of its outstanding interfund loans will be subject to collateralization of at least 102% of the outstanding principal value of the loan. All interfund loans are for temporary or emergency purposes and the interest rate to be charged will be the average of the highest current overnight repurchase agreement rate available to a lending fund and the bank loan rate, as calculated according to a formula established by the Board.
During the year ended December 31, 2021, the Master Portfolio did not participate in the Interfund Lending Program.
Trustees and Officers: Certain trustees and/or officers of the Master Portfolio are directors and/or officers of BlackRock or its affiliates.
Other Transactions: The Master Portfolio may purchase securities from, or sell securities to, an affiliated fund provided the affiliation is due solely to having a common investment adviser, common officers, or common trustees. For the year ended December 31, 2021, the purchase and sale transactions and any net realized gains (losses) with affiliated funds in compliance with Rule 17a-7 under the 1940 Act were as follows:
| | | | | | | | | | | | |
| |
| | | |
| Master Portfolio Name | | Purchases | | | Sales | | | Net Realized
Gain (Loss) | |
| |
| | | |
S&P 500 Index Master Portfolio | | $ | 496,940,717 | | | $ | 181,144,688 | | | $ | 7,982,180 | |
| |
For the year ended December 31, 2021, purchases and sales of investments, excluding short-term investments, were $1,972,674,265 and $1,800,914,115, respectively.
The Master Portfolio is classified as a partnership for U.S. federal income tax purposes. As such, each investor in the Master Portfolio is treated as the owner of its proportionate share of net assets, income, expenses and realized and unrealized gains and losses of the Master Portfolio. Therefore, no U.S. federal income tax provision is required. It is intended that the Master Portfolio’s assets will be managed so an investor in the Master Portfolio can satisfy the requirements of Subchapter M of the Internal Revenue Code of 1986, as amended.
The Master Portfolio files U.S. federal and various state and local tax returns. No income tax returns are currently under examination. The statute of limitations on the Master Portfolio’s U.S. federal tax returns generally remains open for a period of three fiscal years after they are filed. The statutes of limitations on the Master Portfolio’s state and local tax returns may remain open for an additional year depending upon the jurisdiction.
Management has analyzed tax laws and regulations and their application to the Master Portfolio as of December 31, 2021, inclusive of the open tax return years, and does not believe that there are any uncertain tax positions that require recognition of a tax liability in the Master Portfolio’s financial statements.
As of December 31, 2021, gross unrealized appreciation and depreciation based on cost of investments (including short positions and derivatives, if any) for U.S. federal income tax purposes were as follows:
| | | | | | | | | | | | | | | | | | | | | | | | | | | | |
| |
| | | | | | | |
| Master Portfolio Name | | Tax Cost | | | | | | Gross Unrealized Appreciation | | | | | | Gross Unrealized Depreciation | | | | | | Net Unrealized Appreciation (Depreciation) | |
| |
| | | | | | | |
S&P 500 Index Master Portfolio | | $ | 13,797,616,494 | | | | | | | $ | 21,341,364,282 | | | | | | | $ | (451,476,231 | ) | | | | | | $ | 20,889,888,051 | |
| | | | | | | | | | | | | | | | | | | | | | | | | | | | |
The MIP, on behalf of the Master Portfolio, along with certain other funds managed by the Manager and its affiliates (“Participating Funds”), is a party to a 364-day, $2.25 billion credit agreement with a group of lenders. Under this agreement, the Master Portfolio may borrow to fund shareholder redemptions. Excluding commitments designated for certain individual funds, the Participating Funds, including the Master Portfolio, can borrow up to an aggregate commitment amount of $1.75 billion at any time outstanding, subject to asset coverage and other limitations as specified in the agreement. The credit agreement has the following terms: a fee of 0.10% per annum on unused commitment amounts and interest at a rate equal to the higher of (a) one-month London Interbank Offered Rate (“LIBOR”) (but, in any event, not less than 0.00%) on the date the loan is made plus 0.80% per annum or (b) the Fed Funds rate (but, in any event, not less than 0.00%) in effect from time to time plus 0.80% per annum on amounts borrowed. The agreement expires in April 2022 unless extended or renewed. These fees were allocated among such funds based upon portions of the aggregate commitment available to them and relative net assets of Participating Funds. During the year ended December 31, 2021, the Master Portfolio did not borrow under the credit agreement.
In the normal course of business, the Master Portfolio invests in securities or other instruments and may enter into certain transactions, and such activities subject the Master Portfolio to various risks, including among others, fluctuations in the market (market risk) or failure of an issuer to meet all of its obligations. The value of securities or other instruments may also be affected by various factors, including, without limitation: (i) the general economy; (ii) the overall market as well as local, regional or global political and/or social instability; (iii) regulation, taxation or international tax treaties between various countries; or (iv) currency, interest rate and price fluctuations. Local, regional or
| | |
MASTER PORTFOLIO NOTES TO FINANCIAL STATEMENTS | | 41 |
Notes to Financial Statements (continued)
global events such as war, acts of terrorism, the spread of infectious illness or other public health issues, recessions, or other events could have a significant impact on the Master Portfolio and its investments. The Master Portfolio’s prospectus provides details of the risks to which the Master Portfolio is subject.
The Master Portfolio may be exposed to additional risks when reinvesting cash collateral in money market funds that do not seek to maintain a stable NAV per share of $1.00, which may be subject to redemption gates or liquidity fees under certain circumstances.
Market Risk: An outbreak of respiratory disease caused by a novel coronavirus has developed into a global pandemic and has resulted in closing borders, quarantines, disruptions to supply chains and customer activity, as well as general concern and uncertainty. The impact of this pandemic, and other global health crises that may arise in the future, could affect the economies of many nations, individual companies and the market in general in ways that cannot necessarily be foreseen at the present time. This pandemic may result in substantial market volatility and may adversely impact the prices and liquidity of a fund’s investments. The duration of this pandemic and its effects cannot be determined with certainty.
Valuation Risk: The market values of equities, such as common stocks and preferred securities or equity related investments, such as futures and options, may decline due to general market conditions which are not specifically related to a particular company. They may also decline due to factors which affect a particular industry or industries. The Master Portfolio may invest in illiquid investments. An illiquid investment is any investment that the Master Portfolio reasonably expects cannot be sold or disposed of in current market conditions in seven calendar days or less without the sale or disposition significantly changing the market value of the investment. The Master Portfolio may experience difficulty in selling illiquid investments in a timely manner at the price that it believes the investments are worth. Prices may fluctuate widely over short or extended periods in response to company, market or economic news. Markets also tend to move in cycles, with periods of rising and falling prices. This volatility may cause the Master Portfolio’s NAV to experience significant increases or decreases over short periods of time. If there is a general decline in the securities and other markets, the NAV of the Master Portfolio may lose value, regardless of the individual results of the securities and other instruments in which the Master Portfolio invests.
Counterparty Credit Risk: The Master Portfolio may be exposed to counterparty credit risk, or the risk that an entity may fail to or be unable to perform on its commitments related to unsettled or open transactions, including making timely interest and/or principal payments or otherwise honoring its obligations. The Master Portfolio manages counterparty credit risk by entering into transactions only with counterparties that the Manager believes have the financial resources to honor their obligations and by monitoring the financial stability of those counterparties. Financial assets, which potentially expose the Master Portfolio to market, issuer and counterparty credit risks, consist principally of financial instruments and receivables due from counterparties. The extent of the Master Portfolio’s exposure to market, issuer and counterparty credit risks with respect to these financial assets is approximately their value recorded in the Statement of Assets and Liabilities, less any collateral held by the Master Portfolio.
A derivative contract may suffer a mark-to-market loss if the value of the contract decreases due to an unfavorable change in the market rates or values of the underlying instrument. Losses can also occur if the counterparty does not perform under the contract.
With exchange-traded futures, there is less counterparty credit risk to the Master Portfolio since the exchange or clearinghouse, as counterparty to such instruments, guarantees against a possible default. The clearinghouse stands between the buyer and the seller of the contract; therefore, credit risk is limited to failure of the clearinghouse. While offset rights may exist under applicable law, the Master Portfolio does not have a contractual right of offset against a clearing broker or clearinghouse in the event of a default (including the bankruptcy or insolvency). Additionally, credit risk exists in exchange-traded futures with respect to initial and variation margin that is held in a clearing broker’s customer accounts. While clearing brokers are required to segregate customer margin from their own assets, in the event that a clearing broker becomes insolvent or goes into bankruptcy and at that time there is a shortfall in the aggregate amount of margin held by the clearing broker for all its clients, typically the shortfall would be allocated on a pro rata basis across all the clearing broker’s customers, potentially resulting in losses to the Master Portfolio.
Concentration Risk: A diversified portfolio, where this is appropriate and consistent with a fund’s objectives, minimizes the risk that a price change of a particular investment will have a material impact on the NAV of a fund. The investment concentrations within the Master Portfolio’s portfolio are disclosed in its Schedule of Investments.
The Master Portfolio invests a significant portion of its assets in securities within a single or limited number of market sectors. When a Master Portfolio concentrates its investments in this manner, it assumes the risk that economic, regulatory, political and social conditions affecting such sectors may have a significant impact on the Master Portfolio and could affect the income from, or the value or liquidity of, the Master Portfolio’s portfolio. Investment percentages in specific sectors are presented in the Schedule of Investments.
LIBOR Transition Risk: The United Kingdom’s Financial Conduct Authority announced a phase out of the LIBOR. Although many LIBOR rates will cease to be published or no longer will be representative of the underlying market they seek to measure after December 31, 2021, a selection of widely used USD LIBOR rates will continue to be published through June 2023 in order to assist with the transition. The Master Portfolio may be exposed to financial instruments tied to LIBOR to determine payment obligations, financing terms, hedging strategies or investment value. The transition process away from LIBOR might lead to increased volatility and illiquidity in markets for, and reduce the effectiveness of new hedges placed against instruments whose terms currently include LIBOR. The ultimate effect of the LIBOR transition process on the Master Portfolio is uncertain.
Management has evaluated the impact of all subsequent events on the Master Portfolio through the date the financial statements were issued and has determined that there were no subsequent events requiring adjustment or additional disclosure in the financial statements.
| | |
| 42 | | 2 0 2 1 BLACK ROCK ANNUAL REPORT TO SHAREHOLDERS |
Report of Independent Registered Public Accounting Firm
To the Board of Trustees of Master Investment Portfolio and Investors of S&P 500 Index Master Portfolio
Opinion on the Financial Statements
We have audited the accompanying statement of assets and liabilities, including the schedule of investments, of S&P 500 Index Master Portfolio (one of the series constituting Master Investment Portfolio, referred to hereafter as the “Master Portfolio”) as of December 31, 2021, the related statement of operations for the year ended December 31, 2021, the statements of changes in net assets for each of the two years in the period ended December 31, 2021, including the related notes, and the financial highlights for each of the five years in the period ended December 31, 2021 (collectively referred to as the “financial statements”). In our opinion, the financial statements present fairly, in all material respects, the financial position of the Master Portfolio as of December 31, 2021, the results of its operations for the year then ended, the changes in its net assets for each of the two years in the period ended December 31, 2021 and the financial highlights for each of the five years in the period ended December 31, 2021 in conformity with accounting principles generally accepted in the United States of America.
Basis for Opinion
These financial statements are the responsibility of the Master Portfolio’s management. Our responsibility is to express an opinion on the Master Portfolio’s financial statements based on our audits. We are a public accounting firm registered with the Public Company Accounting Oversight Board (United States) (PCAOB) and are required to be independent with respect to the Master Portfolio in accordance with the U.S. federal securities laws and the applicable rules and regulations of the Securities and Exchange Commission and the PCAOB.
We conducted our audits of these financial statements in accordance with the standards of the PCAOB. Those standards require that we plan and perform the audit to obtain reasonable assurance about whether the financial statements are free of material misstatement, whether due to error or fraud.
Our audits included performing procedures to assess the risks of material misstatement of the financial statements, whether due to error or fraud, and performing procedures that respond to those risks. Such procedures included examining, on a test basis, evidence regarding the amounts and disclosures in the financial statements. Our audits also included evaluating the accounting principles used and significant estimates made by management, as well as evaluating the overall presentation of the financial statements. Our procedures included confirmation of securities owned as of December 31, 2021 by correspondence with the custodian, transfer agent and brokers; when replies were not received from brokers, we performed other auditing procedures. We believe that our audits provide a reasonable basis for our opinion.
/s/PricewaterhouseCoopers LLP
Philadelphia, Pennsylvania
February 15, 2022
We have served as the auditor of one or more BlackRock investment companies since 2000.
| | |
MASTER PORTFOLIO REPORT OF INDEPENDENT REGISTERED PUBLIC ACCOUNTING F IRM | | 43 |
Statement Regarding Liquidity Risk Management Program
In compliance with Rule 22e-4 under the Investment Company Act of 1940, as amended (the “Liquidity Rule”), BlackRock Funds III and Master Investment Portfolio (the “Trusts”) have adopted and implemented a liquidity risk management program (the “Program”) for iShares S&P 500 Index Fund and S&P 500 Index Master Portfolio (the “Funds”), each a series of the respective Trust, which is reasonably designed to assess and manage each Fund’s liquidity risk.
The Board of Trustees (the “Board”) of the Trusts, on behalf of the Funds, met on November 9-10, 2021 (the “Meeting”) to review the Program. The Board previously appointed BlackRock Advisors, LLC or BlackRock Fund Advisors (“BlackRock”), each an investment adviser to certain BlackRock funds, as the program administrator for each Fund’s Program, as applicable. BlackRock also previously delegated oversight of the Program to the 40 Act Liquidity Risk Management Committee (the “Committee”). At the Meeting, the Committee, on behalf of BlackRock, provided the Board with a report that addressed the operation of the Program and assessed its adequacy and effectiveness of implementation, including the management of each Fund’s Highly Liquid Investment Minimum (“HLIM”) where applicable, and any material changes to the Program (the “Report”). The Report covered the period from October 1, 2020 through September 30, 2021 (the “Program Reporting Period”).
The Report described the Program’s liquidity classification methodology for categorizing each Fund’s investments (including derivative transactions) into one of four liquidity buckets. It also referenced the methodology used by BlackRock to establish each Fund’s HLIM and noted that the Committee reviews and ratifies the HLIM assigned to each Fund no less frequently than annually. The Report also discussed notable events affecting liquidity over the Program Reporting Period, including the imposition of capital controls in certain countries.
The Report noted that the Program complied with the key factors for consideration under the Liquidity Rule for assessing, managing and periodically reviewing each Fund’s liquidity risk, as follows:
| | a) | The Fund’s investment strategy and liquidity of portfolio investments during both normal and reasonably foreseeable stressed conditions. During the Program Reporting Period, the Committee reviewed whether each Fund’s strategy is appropriate for an open-end fund structure with a focus on funds with more significant and consistent holdings of less liquid and illiquid assets. The Committee also factored a fund’s concentration in an issuer into the liquidity classification methodology by taking issuer position sizes into account. Where a fund participated in borrowings for investment purposes (such as tender option bonds or reverse repurchase agreements), such borrowings were factored into the Program’s calculation of a fund’s liquidity bucketing. Derivative exposure was also considered in such calculation. | |
| | b) | Short-term and long-term cash flow projections during both normal and reasonably foreseeable stressed conditions. During the Program Reporting Period, the Committee reviewed historical redemption activity and used this information as a component to establish each Fund’s reasonably anticipated trading size (“RATS”). Each Fund has adopted an in-kind redemption policy which may be utilized to meet larger redemption requests. The Committee may also take into consideration a fund’s shareholder ownership concentration (which, depending on product type and distribution channel, may or may not be available), a fund’s distribution channels, and the degree of certainty associated with a fund’s short-term and long-term cash flow projections. | |
| | c) | Holdings of cash and cash equivalents, as well as borrowing arrangements. The Committee considered the terms of the credit facility committed to each Fund, the financial health of the institution providing the facility and the fact that the credit facility is shared among multiple funds (including that a portion of the aggregate commitment amount is specifically designated for BlackRock Floating Rate Income Portfolio, a series of BlackRock Funds V). The Committee also considered other types of borrowing available to the Funds, such as the ability to use reverse repurchase agreements and interfund lending, as applicable. | |
There were no material changes to the Program during the Program Reporting Period other than the enhancement of certain model components in the Program’s methodology. The Report provided to the Board stated that the Committee concluded that based on the operation of the functions, as described in the Report, the Program is operating as intended and is effective in implementing the requirements of the Liquidity Rule.
| | |
| 44 | | 2 0 2 1 BLACK ROCK ANNUAL REPORT TO SHAREHOLDERS |
Trustee and Officer Information
| | | | | | | | |
| Independent Trustees(a) | | |
| | | | | |
Name Year of Birth(b) | | Position(s) Held (Length of Service)(c) | | Principal Occupation(s) During Past Five Years | | Number of BlackRock-Advised Registered Investment Companies (“RICs”) Consisting of Investment Portfolios (“Portfolios”) Overseen | | Public Company
and Other Investment Company Directorships Held During Past Five Years |
| | | | |
Mark Stalnecker 1951 | | Chair of the Board (Since 2019) and Trustee (Since 2015) | | Chief Investment Officer, University of Delaware from 1999 to 2013; Trustee and Chair of the Finance and Investment Committees, Winterthur Museum and Country Estate from 2005 to 2016; Member of the Investment Committee, Delaware Public Employees’ Retirement System since 2002; Member of the Investment Committee, Christiana Care Health System from 2009 to 2017; Member of the Investment Committee, Delaware Community Foundation from 2013 to 2014; Director and Chair of the Audit Committee, SEI Private Trust Co. from 2001 to 2014. | | 30 RICs consisting of 159 Portfolios | | None |
| | | | |
Bruce R. Bond 1946 | | Trustee (Since 2019) | | Board Member, Amsphere Limited (software) since 2018; Trustee and Member of the Governance Committee, State Street Research Mutual Funds from 1997 to 2005; Board Member of Governance, Audit and Finance Committee, Avaya Inc. (computer equipment) from 2003 to 2007. | | 30 RICs consisting of 159 Portfolios | | None |
| | | | |
Susan J. Carter 1956 | | Trustee (Since 2016) | | Director, Pacific Pension Institute from 2014 to 2018; Advisory Board Member, Center for Private Equity and Entrepreneurship at Tuck School of Business since 1997; Senior Advisor, Commonfund Capital, Inc. (“CCI”) (investment adviser) in 2015; Chief Executive Officer, CCI from 2013 to 2014; President & Chief Executive Officer, CCI from 1997 to 2013; Advisory Board Member, Girls Who Invest from 2015 to 2018 and Board Member thereof since 2018; Advisory Board Member, Bridges Fund Management since 2016; Trustee, Financial Accounting Foundation since 2017; Practitioner Advisory Board Member, Private Capital Research Institute (“PCRI”) since 2017; Lecturer in the Practice of Management, Yale School of Management since 2019; Advisor to Finance Committee, Altman Foundation since 2020. | | 30 RICs consisting of 159 Portfolios | | None |
| | | | |
Collette Chilton 1958 | | Trustee (Since 2015) | | Chief Investment Officer, Williams College since 2006; Chief Investment Officer, Lucent Asset Management Corporation from 1998 to 2006; Director, Boys and Girls Club of Boston since 2017; Director, B1 Capital since 2018; Director, David and Lucile Packard Foundation since 2020. | | 30 RICs consisting of 159 Portfolios | | None |
| | | | |
Neil A. Cotty 1954 | | Trustee (Since 2016) | | Bank of America Corporation from 1996 to 2015, serving in various senior finance leadership roles, including Chief Accounting Officer from 2009 to 2015, Chief Financial Officer of Global Banking, Markets and Wealth Management from 2008 to 2009, Chief Accounting Officer from 2004 to 2008, Chief Financial Officer of Consumer Bank from 2003 to 2004, Chief Financial Officer of Global Corporate Investment Bank from 1999 to 2002. | | 30 RICs consisting of 159 Portfolios | | None |
| | | | |
Lena G. Goldberg 1949 | | Trustee (Since 2019) | | Director, Charles Stark Draper Laboratory, Inc. since 2013; Senior Lecturer, Harvard Business School, from 2008 to 2021; FMR LLC/Fidelity Investments (financial services) from 1996 to 2008, serving in various senior roles including Executive Vice President - Strategic Corporate Initiatives and Executive Vice President and General Counsel; Partner, Sullivan & Worcester LLP from 1985 to 1996 and Associate thereof from 1979 to 1985. | | 30 RICs consisting of 159 Portfolios | | None |
| | |
TRUSTEE AND OFFICER INFORMATION | | 45 |
Trustee and Officer Information (continued)
| | | | | | | | |
| Independent Trustees(a) (continued) |
| | | | | |
Name Year of Birth(b) | | Position(s) Held (Length of Service)(c) | | Principal Occupation(s) During Past Five Years | | Number of BlackRock-Advised Registered Investment Companies (“RICs”) Consisting of Investment Portfolios (“Portfolios”) Overseen | | Public Company and Other Investment Company Directorships Held During Past Five Years |
| | | | |
Henry R. Keizer 1956 | | Trustee (Since 2019) | | Director, Park Indemnity Ltd. (captive insurer) since 2010; Director, MUFG Americas Holdings Corporation and MUFG Union Bank, N.A. (financial and bank holding company) from 2014 to 2016; Director, American Institute of Certified Public Accountants from 2009 to 2011; Director, KPMG LLP (audit, tax and advisory services) from 2004 to 2005 and 2010 to 2012; Director, KPMG International in 2012, Deputy Chairman and Chief Operating Officer thereof from 2010 to 2012 and U.S. Vice Chairman of Audit thereof from 2005 to 2010; Global Head of Audit, KPMGI (consortium of KPMG firms) from 2006 to 2010; Director, YMCA of Greater New York from 2006 to 2010. | | 30 RICs consisting of 159 Portfolios | | Hertz Global Holdings (car rental); Sealed Air Corp. (packaging); GrafTech International Ltd. (materials manufacturing); Montpelier Re Holdings, Ltd. (publicly held property and casualty reinsurance) from 2013 to 2015; WABCO (commercial vehicle safety systems) from 2015 to 2020. |
| | | | |
Cynthia A. Montgomery 1952 | | Trustee (Since 2009) | | Professor, Harvard Business School since 1989. | | 30 RICs consisting of 159 Portfolios | | Newell Rubbermaid, Inc. (manufacturing) from 1995 to 2016. |
| | | | |
Donald C. Opatrny 1952 | | Trustee (Since 2019) | | Trustee, Vice Chair, Member of the Executive Committee and Chair of the Investment Committee, Cornell University from 2004 to 2019; President, Trustee and Member of the Investment Committee, The Aldrich Contemporary Art Museum from 2007 to 2014; Member of the Board and Investment Committee, University School from 2007 to 2018; Member of the Investment Committee, Mellon Foundation from 2009 to 2015; Trustee, Artstor (a Mellon Foundation affiliate) from 2010 to 2015; President and Trustee, the Center for the Arts, Jackson Hole from 2011 to 2018; Director, Athena Capital Advisors LLC (investment management firm) since 2013; Trustee and Chair of the Investment Committee, Community Foundation of Jackson Hole since 2014; Member of Affordable Housing Supply Board of Jackson, Wyoming since 2017; Member, Investment Funds Committee, State of Wyoming since 2017; Trustee, Phoenix Art Museum since 2018; Trustee, Arizona Community Foundation and Member of Investment Committee since 2020. | | 30 RICs consisting of 159 Portfolios | | None |
| | | | |
Joseph P. Platt 1947 | | Trustee (Since 2009) | | General Partner, Thorn Partners, LP (private investments) since 1998; Director, WQED Multi-Media (public broadcasting not-for-profit) since 2001; Chair, Basic Health International (non-profit) since 2015. | | 30 RICs consisting of 159 Portfolios | | Greenlight Capital Re, Ltd. (reinsurance company); Consol Energy Inc. |
| | |
| 46 | | 2 0 2 1 BLACK ROCK ANNUAL REPORT TO SHAREHOLDERS |
Trustee and Officer Information (continued)
| | | | | | | | |
| Independent Trustees(a) (continued) |
| | | | | |
Name Year of Birth(b) | | Position(s) Held (Length of Service)(c) | | Principal Occupation(s) During Past Five Years | | Number of BlackRock-Advised Registered Investment Companies (“RICs”) Consisting of Investment Portfolios (“Portfolios”) Overseen | | Public Company and Other Investment Company Directorships Held During Past Five Years |
| | | | |
Kenneth L. Urish 1951 | | Trustee (Since 2009) | | Managing Partner, Urish Popeck & Co., LLC (certified public accountants and consultants) since 1976; Past- Chairman of the Professional Ethics Committee of the Pennsylvania Institute of Certified Public Accountants and Committee Member thereof since 2007; Member of External Advisory Board, The Pennsylvania State University Accounting Department since founding in 2001; Principal, UP Strategic Wealth Investment Advisors, LLC since 2013; Trustee, The Holy Family Institute from 2001 to 2010; President and Trustee, Pittsburgh Catholic Publishing Associates from 2003 to 2008; Director, Inter- Tel from 2006 to 2007; Member, Advisory Board, ESG Competent Boards since 2020. | | 30 RICs consisting of 159 Portfolios | | None |
| | | | |
Claire A. Walton 1957 | | Trustee (Since 2016) | | Chief Operating Officer and Chief Financial Officer of Liberty Square Asset Management, LP from 1998 to 2015; General Partner of Neon Liberty Capital Management, LLC since 2003; Director, Boston Hedge Fund Group from 2009 to 2018; Director, Woodstock Ski Runners since 2013; Director, Massachusetts Council on Economic Education from 2013 to 2015. | | 30 RICs consisting of 159 Portfolios | | None |
| | |
TRUSTEE AND OFFICER INFORMATION | | 47 |
Trustee and Officer Information (continued)
| | | | | | | | |
| Interested Trustees(a)(d) |
| | | | | |
Name Year of Birth(b) | | Position(s) Held (Length of Service)(c) | | Principal Occupation(s) During Past Five Years | | Number of BlackRock-Advised Registered Investment Companies (“RICs”) Consisting of Investment Portfolios (“Portfolios”) Overseen | | Public Company and Other Investment Company Directorships Held During Past Five Years |
| | | | |
Robert Fairbairn 1965 | | Trustee (Since 2018) | | Vice Chairman of BlackRock, Inc. since 2019; Member of BlackRock’s Global Executive and Global Operating Committees; Co-Chair of BlackRock’s Human Capital Committee; Senior Managing Director of BlackRock, Inc. from 2010 to 2019; oversaw BlackRock’s Strategic Partner Program and Strategic Product Management Group from 2012 to 2019; Member of the Board of Managers of BlackRock Investments, LLC from 2011 to 2018; Global Head of BlackRock’s Retail and iShares® businesses from 2012 to 2016. | | 103 RICs consisting of 261 Portfolios | | None |
| | | | |
John M. Perlowski(e) 1964 | | Trustee (Since 2015) President and Chief Executive Officer (Since 2010) | | Managing Director of BlackRock, Inc. since 2009; Head of BlackRock Global Accounting and Product Services since 2009; Advisory Director of Family Resource Network (charitable foundation) since 2009. | | 105 RICs consisting of 263 Portfolios | | None |
(a) The address of each Trustee is c/o BlackRock, Inc., 55 East 52nd Street, New York, New York 10055. (b) Independent Trustees serve until their resignation, retirement, removal or death, or until December 31 of the year in which they turn 75. The Board may determine to extend the terms of Independent Trustees on a case-by-case basis, as appropriate. (c) In connection with the acquisition of Barclays Global Investors by BlackRock, Inc. in December 2009, certain Independent Trustees were elected to the Board. Furthermore, effective January 1, 2019, three BlackRock Fund Complexes were realigned and consolidated into two BlackRock Fund Complexes. As a result, although the chart shows the year that each Independent Trustee joined the Board, certain Independent Trustees first became members of the boards of other BlackRock-advised Funds or legacy BlackRock funds as follows: Bruce R. Bond, 2005; Cynthia A. Montgomery, 1994; Joseph P. Platt, 1999; Kenneth L. Urish, 1999; Lena G. Goldberg, 2016; Henry R. Keizer, 2016; Donald C. Opatrny, 2015. (d) Mr. Fairbairn and Mr. Perlowski are both “interested persons,” as defined in the 1940 Act, of the Trust/MIP based on their positions with BlackRock, Inc. and its affiliates. Mr. Fairbairn and Mr. Perlowski are also board members of the BlackRock Fixed-Income Complex. (e) Mr. Perlowski is also a trustee of the BlackRock Credit Strategies Fund and BlackRock Private Investments Fund. |
| | | | |
|
| Officers Who Are Not Trustees(a) |
| | | |
Name Year of Birth(b) | | Position(s) Held (Length of Service) | | Principal Occupation(s) During Past Five Years |
| | |
Thomas Callahan 1968 | | Vice President (Since 2016) | | Managing Director of BlackRock, Inc. since 2013; Member of the Board of Managers of BlackRock Investments, LLC (principal underwriter) since 2019 and Managing Director thereof since 2017; Head of BlackRock’s Global Cash Management Business since 2016; Co-Head of the Global Cash Management Business from 2014 to 2016; Deputy Head of the Global Cash Management Business from 2013 to 2014; Member of the Cash Management Group Executive Committee since 2013; Chief Executive Officer of NYSE Liffe U.S. from 2008 to 2013. |
| | |
Jennifer McGovern 1977 | | Vice President (Since 2014) | | Managing Director of BlackRock, Inc. since 2016; Director of BlackRock, Inc. from 2011 to 2015; Head of Americas Product Development and Governance for BlackRock’s Global Product Group since 2019; Head of Product Structure and Oversight for BlackRock’s U.S. Wealth Advisory Group from 2013 to 2019. |
| | |
Trent Walker 1974 | | Chief Financial Officer (Since 2021) | | Managing Director of BlackRock, Inc. since September 2019; Executive Vice President of PIMCO from 2016 to 2019; Senior Vice President of PIMCO from 2008 to 2015; Treasurer from 2013 to 2019 and Assistant Treasurer from 2007 to 2017 of PIMCO Funds, PIMCO Variable Insurance Trust, PIMCO ETF Trust, PIMCO Equity Series, PIMCO Equity Series VIT, PIMCO Managed Accounts Trust, 2 PIMCO-sponsored interval funds and 21 PIMCO-sponsored closed-end funds. |
| | |
Jay M. Fife 1970 | | Treasurer
(Since 2009) | | Managing Director of BlackRock, Inc. since 2007. |
| | |
Charles Park 1967 | | Chief Compliance Officer (Since 2014) | | Anti-Money Laundering Compliance Officer for certain BlackRock-advised Funds from 2014 to 2015; Chief Compliance Officer of BlackRock Advisors, LLC and the BlackRock-advised Funds in the BlackRock Multi-Asset Complex and the BlackRock Fixed-Income Complex since 2014; Principal of and Chief Compliance Officer for iShares® Delaware Trust Sponsor LLC since 2012 and BlackRock Fund Advisors (“BFA”) since 2006; Chief Compliance Officer for the BFA-advised iShares® exchange traded funds since 2006; Chief Compliance Officer for BlackRock Asset Management International Inc. since 2012. |
| | |
| 48 | | 2 0 2 1 BLACK ROCK ANNUAL REPORT TO SHAREHOLDERS |
Trustee and Officer Information (continued)
| | | | |
| Officers Who Are Not Trustees(a) (continued) |
| | | |
Name Year of Birth(b) | | Position(s) Held (Length of Service) | | Principal Occupation(s) During Past Five Years |
| | |
Lisa Belle 1968 | | Anti-Money Laundering Compliance Officer (Since 2019) | | Managing Director of BlackRock, Inc. since 2019; Global Financial Crime Head for Asset and Wealth Management of JP Morgan from 2013 to 2019; Managing Director of RBS Securities from 2012 to 2013; Head of Financial Crimes for Barclays Wealth Americas from 2010 to 2012. |
| | |
Janey Ahn 1975 | | Secretary (Since 2019) | | Managing Director of BlackRock, Inc. since 2018; Director of BlackRock, Inc. from 2009 to 2017. |
| (a) | The address of each Officer is c/o BlackRock, Inc., 55 East 52nd Street, New York, New York 10055. |
| (b) | Officers of the Trust/MIP serve at the pleasure of the Board. |
Further information about Trust’s/MIP’s Trustees and Officers is available in the Trust’s/MIP’s Statement of Additional Information, which can be obtained without charge by calling (800) 441-7762.
Effective December 31, 2021, Bruce R. Bond retired as a Trustee of the Trust/MIP.
| | |
TRUSTEE AND OFFICER INFORMATION | | 49 |
Additional Information
Regulation Regarding Derivatives
On October 28, 2020, the Securities and Exchange Commission (the “SEC”) adopted regulations governing the use of derivatives by registered investment companies (“Rule 18f-4”). The Fund/Master Portfolio will be required to implement and comply with Rule 18f-4 by August 19, 2022. Once implemented, Rule 18f-4 will impose limits on the amount of derivatives a fund can enter into, eliminate the asset segregation framework currently used by funds to comply with Section 18 of the 1940 Act, treat derivatives as senior securities and require funds whose use of derivatives is more than a limited specified exposure amount to establish and maintain a comprehensive derivatives risk management program and appoint a derivatives risk manager.
General Information
Quarterly performance, semi-annual and annual reports, current net asset value and other information regarding the Fund/Master Portfolio may be found on BlackRock’s website, which can be accessed at blackrock.com. Any reference to BlackRock’s website in this report is intended to allow investors public access to information regarding the Fund/Master Portfolio and does not, and is not intended to, incorporate BlackRock’s website in this report.
Householding
The Fund will mail only one copy of shareholder documents, including prospectuses, annual and semi-annual reports, Rule 30e-3 notices and proxy statements, to shareholders with multiple accounts at the same address. This practice is commonly called “householding” and is intended to reduce expenses and eliminate duplicate mailings of shareholder documents. Mailings of your shareholder documents may be householded indefinitely unless you instruct us otherwise. If you do not want the mailing of these documents to be combined with those for other members of your household, please call the Fund at (800) 441-7762.
Availability of Quarterly Schedule of Investments
The Fund/Master Portfolio file their complete schedules of portfolio holdings with the SEC for the first and third quarters of each fiscal year as an exhibit to their reports on Form N-PORT. The Fund’s/Master Portfolio’s Forms N-PORT are available on the SEC’s website at sec.gov. Additionally, the Fund/Master Portfolio makes their portfolio holdings for the first and third quarters of each fiscal year available at blackrock.com/fundreports.
Availability of Proxy Voting Policies, Procedures and Voting Records
A description of the policies and procedures that the Fund/Master Portfolio use to determine how to vote proxies relating to portfolio securities and information about how the Fund/Master Portfolio voted proxies relating to securities held in the Fund’s/Master Portfolio’s portfolios during the most recent 12-month period ended June 30 is available without charge, upon request (1) by calling (800) 441-7762; (2) on the BlackRock website at blackrock.com; and (3) on the SEC’s website at sec.gov.
BlackRock’s Mutual Fund Family
BlackRock offers a diverse lineup of open-end mutual funds crossing all investment styles and managed by experts in equity, fixed-income and tax-exempt investing. Visit blackrock.com for more information.
Shareholder Privileges
Account Information
Call us at (800) 441-7762 from 8:00 AM to 6:00 PM ET on any business day to get information about your account balances, recent transactions and share prices. You can also visit blackrock.com for more information.
Automatic Investment Plans
Investor class shareholders who want to invest regularly can arrange to have $50 or more automatically deducted from their checking or savings account and invested in any of the BlackRock funds.
Systematic Withdrawal Plans
Investor class shareholders can establish a systematic withdrawal plan and receive periodic payments of $50 or more from their BlackRock funds, as long as their account balance is at least $10,000.
Retirement Plans
Shareholders may make investments in conjunction with Traditional, Rollover, Roth, Coverdell, Simple IRAs, SEP IRAs and 403(b) Plans.
| | |
| 50 | | 2 0 2 1 BLACK ROCK ANNUAL REPORT TO SHAREHOLDERS |
Additional Information (continued)
BlackRock Privacy Principles
BlackRock is committed to maintaining the privacy of its current and former fund investors and individual clients (collectively, “Clients”) and to safeguarding their non-public personal information. The following information is provided to help you understand what personal information BlackRock collects, how we protect that information and why in certain cases we share such information with select parties.
If you are located in a jurisdiction where specific laws, rules or regulations require BlackRock to provide you with additional or different privacy-related rights beyond what is set forth below, then BlackRock will comply with those specific laws, rules or regulations.
BlackRock obtains or verifies personal non-public information from and about you from different sources, including the following: (i) information we receive from you or, if applicable, your financial intermediary, on applications, forms or other documents; (ii) information about your transactions with us, our affiliates, or others; (iii) information we receive from a consumer reporting agency; and (iv) from visits to our websites.
BlackRock does not sell or disclose to non-affiliated third parties any non-public personal information about its Clients, except as permitted by law or as is necessary to respond to regulatory requests or to service Client accounts. These non-affiliated third parties are required to protect the confidentiality and security of this information and to use it only for its intended purpose.
We may share information with our affiliates to service your account or to provide you with information about other BlackRock products or services that may be of interest to you. In addition, BlackRock restricts access to non-public personal information about its Clients to those BlackRock employees with a legitimate business need for the information. BlackRock maintains physical, electronic and procedural safeguards that are designed to protect the non-public personal information of its Clients, including procedures relating to the proper storage and disposal of such information.
Fund and/or MIP Service Providers
| | |
Investment Adviser | | Distributor |
BlackRock Fund Advisors | | BlackRock Investments, LLC |
San Francisco, CA 94105 | | New York, NY 10022 |
| |
Administrator | | Independent Registered Public Accounting Firm |
BlackRock Advisors, LLC | | PricewaterhouseCoopers LLP |
Wilmington, DE 19809 | | Philadelphia, PA 19103 |
| |
Accounting Agent and Custodian | | Legal Counsel |
State Street Bank and Trust Company | | Sidley Austin LLP |
Boston, MA 02111 | | New York, NY 10019 |
| |
Transfer Agent | | Address of the Trust/MIP |
BNY Mellon Investment Servicing (US) Inc. | | 400 Howard Street |
Wilmington, DE 19809 | | San Francisco, CA 94105 |
| | |
ADDITIONAL INFORMATION | | 51 |
Glossary of Terms Used in this Report
Portfolio Abbreviation
| | |
| |
| ETF | | Exchange-Traded Fund |
| |
| MSCI | | Morgan Stanley Capital International |
| |
| S&P | | Standard & Poor’s |
| | |
| 52 | | 2 0 2 1 BLACK ROCK ANNUAL REPORT TO SHAREHOLDERS |
Want to know more?
blackrock.com | 800-441-7762
This report is intended for current holders. It is not authorized for use as an offer of sale or a solicitation of an offer to buy shares of the Fund unless preceded or accompanied by the Fund’s current prospectus. Past performance results shown in this report should not be considered a representation of future performance. Investment returns and principal value of shares will fluctuate so that shares, when redeemed, may be worth more or less than their original cost. Statements and other information herein are as dated and are subject to change.
SPSF-12/21-AR
| | |

| | DECEMBER 31, 2021 |
BlackRock Funds III
· iShares U.S. Aggregate Bond Index Fund
| | | | |
| | |
| | | Not FDIC Insured • May Lose Value • No Bank Guarantee | | |
| | |
| | | | |
The Markets in Review
Dear Shareholder,
The 12-month reporting period as of December 31, 2021 saw a continuation of the resurgent growth that followed the initial coronavirus (or “COVID-19”) pandemic reopening, albeit at a slower pace. The global economy weathered the emergence of several variant strains and the resulting peaks and troughs in infections amid optimism that increasing vaccinations and economic adaptation could help contain the pandemic’s disruptions. Continued growth meant that the U.S. economy regained and then surpassed its pre-pandemic output. However, a rapid rebound in consumer spending pushed up against supply constraints and led to elevated inflation.
Equity prices rose with the broader economy, as the implementation of mass vaccination campaigns and passage of an additional fiscal stimulus package and infrastructure bill further boosted stocks. In the United States, both large- and small-capitalization stocks posted a strong advance, and many equity indices neared or surpassed all-time highs late in the reporting period. International equities from developed markets also gained, although emerging market stocks declined, pressured by a strengthening U.S. dollar.
The 10-year U.S. Treasury yield (which is inversely related to bond prices) rose during the reporting period as the economy expanded rapidly and inflation reached its highest annualized reading in decades. In the corporate bond market, support from the U.S. Federal Reserve (the “Fed”) assuaged credit concerns and led to solid returns for high-yield corporate bonds, outpacing investment-grade corporate bonds, which declined.
The Fed maintained accommodative monetary policy during the reporting period by maintaining near-zero interest rates and by asserting that inflation could exceed its 2% target for a sustained period without triggering a rate increase. However, the Fed’s tone shifted late in the year, as it reduced its bond-buying program and used its market guidance to raise the prospect of higher rates in 2022.
Looking ahead, we believe that the global expansion will continue to broaden as Europe and other developed market economies gain momentum, although the Delta and Omicron variants of the coronavirus remain a threat, particularly in emerging markets. While we expect inflation to abate somewhat as supply bottlenecks are resolved, we anticipate that inflation will remain higher than the pre-COVID norm. The Fed is poised to raise interest rates next year in response, but the Fed’s policy shift means that tightening is likely to be less aggressive than what we’ve seen in previous cycles.
In this environment, we favor an overweight to equities, as we believe low interest rates and continued economic growth will support further gains, albeit likely more modest than what we saw in 2021. Sectors that are better poised to manage the transition to a lower-carbon world, such as technology and health care, are particularly attractive in the long term. U.S. and other developed-market equities have room for further growth, while we believe Chinese equities stand to gain from a more accommodative monetary and fiscal environment as the Chinese economy slows. We are underweight long-term credit, but inflation-protected U.S. Treasuries, Asian fixed income, and emerging market local-currency bonds offer potential opportunities. We believe that international diversification and a focus on sustainability can help provide portfolio resilience, and the disruption created by the coronavirus appears to be accelerating the shift toward sustainable investments.
In this environment, our view is that investors need to think globally, extend their scope across a broad array of asset classes, and be nimble as market conditions change. We encourage you to talk with your financial advisor and visit blackrock.com for further insight about investing in today’s markets.
Sincerely,

Rob Kapito
President, BlackRock Advisors, LLC

Rob Kapito
President, BlackRock Advisors, LLC
| | | | |
| Total Returns as of December 31, 2021 |
| | | |
| | | 6-Month | | 12-Month |
| | |
U.S. large cap equities
(S&P 500® Index) | | 11.67% | | 28.71% |
| | |
U.S. small cap equities
(Russell 2000® Index) | | (2.31) | | 14.82 |
| | |
International equities
(MSCI Europe, Australasia, Far East Index) | | 2.24 | | 11.26 |
| | |
Emerging market equities
(MSCI Emerging Markets Index) | | (9.30) | | (2.54) |
| | |
3-month Treasury bills
(ICE BofA 3-Month U.S. Treasury Bill Index) | | 0.02 | | 0.05 |
| | |
U.S. Treasury securities
(ICE BofA 10-Year U.S. Treasury Index) | | 0.44 | | (3.68) |
| | |
U.S. investment grade bonds
(Bloomberg U.S. Aggregate Bond Index) | | 0.06 | | (1.54) |
| | |
Tax-exempt municipal bonds
(S&P Municipal Bond Index) | | 0.52 | | 1.77 |
| | |
U.S. high yield bonds
(Bloomberg U.S. Corporate High Yield 2% Issuer Capped Index) | | 1.59 | | 5.26 |
|
| Past performance is not an indication of future results. Index performance is shown for illustrative purposes only. You cannot invest directly in an index. |
| | |
| 2 | | T H I S P A G E I S N O T P A R T O F Y O U R F U N D R E P O R T |
Table of Contents

| | |
| Fund Summary as of December 31, 2021 | | iShares U.S. Aggregate Bond Index Fund |
Investment Objective
iShares U.S. Aggregate Bond Index Fund’s (the “Fund”) investment objective is to seek to provide investment results that correspond to the total return performance of fixed-income securities in the aggregate, as represented by the Bloomberg U.S. Aggregate Bond Index (the “Index”).
Portfolio Management Commentary
How did the Fund perform?
For the 12-month period ended December 31, 2021, the Fund’s Institutional Shares returned (1.85)%, Investor A Shares returned (2.09)%, Class K Shares returned (1.80)% and Investor P Shares returned (2.09)%. For the same period, the benchmark Index returned (1.54)%.
Returns for the Fund’s respective share classes differ from the Index based on individual share class expenses. The Fund invests all of its assets in U.S. Total Bond Index Master Portfolio (the “Master Portfolio”), a series of Master Investment Portfolio.
On December 31, 2021, Bloomberg priced the Fund’s benchmark index at 1 pm EST while BlackRock funds priced at 4 pm EST. This event caused some pricing noise and underperformance across both the index and active books, including the iShares U.S. Aggregate Bond Index Fund, when looking at the official returns. This effect was offset on January 3, 2022 as the benchmark reverted to 4 pm EST pricing.
Describe the market environment.
At year end, the 10-year U.S. Treasury yield rose by 59 basis points (0.59%) to 1.52%. The global markets in 2021 began the process of recovery from the COVID-19 pandemic and geopolitical uncertainty. The year started with a positive tone for risk assets as vaccines were rolled out and signs of recovery emerged. The reopening of the economy, continued government stimulus and a dovish Fed contributed to a risk-on environment in the first half of the year. The Fed maintained its exceptionally accommodative stance through most of 2021 as the economy continued to recover with minor setbacks due to the Delta variant and, more recently, the Omicron variant. The U.S. unemployment rate trended downward throughout the year, beginning at 6.4% in January and ending the year at 3.9%.
As the economy showed continued signs of recovery and inflation remained elevated, the Fed began tapering its asset purchases in November. The final Federal Open Market Committee (“FOMC”) meeting of the year, held in December 2021, announced a doubling in the pace of tapering. At the new pace, the Fed will wrap up its asset purchases in the middle of March 2022, and the expectation is that fed funds rate hikes will follow shortly thereafter. This was reflected in the December Summary of Economic Projections and “dot plot,” which showed that FOMC participants anticipate that three increases in the Fed’s benchmark overnight lending rate will be appropriate in 2022.
During the period, the Master Portfolio at times held cash at elevated levels, which was committed for pending transactions. The cash position did not have any material impact on Fund performance.
Describe recent portfolio activity.
During the period, the Master Portfolio maintained its objective of seeking to provide investment results that correspond to the total return performance of the fixed-income securities in aggregate, as represented by the Index. Other factors considered in security selection included transaction costs and maturity structure.
Describe portfolio positioning at period end.
The Master Portfolio remains positioned to attempt to match the risk characteristics of the Index, irrespective of the market’s future direction.
The views expressed reflect the opinions of BlackRock as of the date of this report and are subject to change based on changes in market, economic or other conditions. These views are not intended to be a forecast of future events and are no guarantee of future results.
| | |
| 4 | | 2 0 2 1 BLACK ROCK ANNUAL REPORT TO SHAREHOLDERS |
| | |
| Fund Summary as of December 31, 2021 (continued) | | iShares U.S. Aggregate Bond Index Fund |
TOTAL RETURN BASED ON A $10,000 INVESTMENT
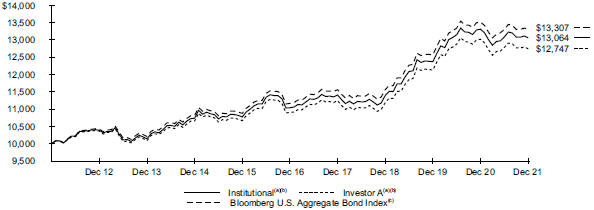
| | (a) | Assuming transaction costs and other operating expenses, including administration fees, if any. | |
| | (b) | The Fund invests all of its assets in the Master Portfolio. The Master Portfolio invests primarily in investment-grade U.S. Government securities and corporate bonds, as well as investment-grade mortgage-backed, asset-backed and commercial mortgage-backed securities. | |
| | (c) | Bloomberg U.S. Aggregate Bond Index (formerly Bloomberg Barclays U.S. Aggregate Bond Index), a broad-based flagship benchmark that measures the investment grade, U.S. dollar-denominated, fixed-rate taxable bond market. | |
Performance
| | | | | | | | | | | | | | | | | | | | | | | | | | | | | | | | | | | | | | | | |
| | | | | | | | | Average Annual Total Returns(a) | |
| | | | | | | | | | | | |
| | | | | | | |
| | | | | | | | | 1 Year | | | | | | 5 Years | | | | | | 10 Years | |
| | | | | | | | | | | | | | | | | | | | | | | | | | | | |
| | | | | | | | | | |
| | | Standardized
30-Day Yields | | | Unsubsidized
30-Day Yields | | | Without
Sales
Charge | | | With
Sales
Charge | | | | | | Without
Sales
Charge | | | With
Sales
Charge | | | | | | Without
Sales
Charge | | | With
Sales
Charge | |
| | | | | | | | | | |
Institutional | | | 1.48 | % | | | 1.48 | % | | | (1.85 | )% | | | N/A | | | | | | | | 3.42 | % | | | N/A | | | | | | | | 2.71 | % | | | N/A | |
Investor A | | | 1.23 | | | | 1.23 | | | | (2.09 | ) | | | N/A | | | | | | | | 3.16 | | | | N/A | | | | | | | | 2.46 | | | | N/A | |
Investor P | | | 1.19 | | | | 1.18 | | | | (2.09 | ) | | | (6.01 | )% | | | | | | | 3.17 | | | | 2.33 | % | | | | | | | 2.45 | | | | 2.04 | % |
Class K | | | 1.53 | | | | 1.53 | | | | (1.80 | ) | | | N/A | | | | | | | | 3.49 | | | | N/A | | | | | | | | 2.77 | | | | N/A | |
| | | | | | | | | | |
Bloomberg U.S. Aggregate Bond Index | | | — | | | | — | | | | (1.54 | ) | | | N/A | | | | | | | | 3.57 | | | | N/A | | | | | | | | 2.90 | | | | N/A | |
| | (a) | Assuming maximum sales charges, if any. Average annual total returns with and without sales charges reflect reductions for distribution and service fees. See “About Fund Performance” for a detailed description of share classes, including any related sales charges and fees, and how performance was calculated for certain share classes. | |
N/A — Not applicable as the share class and index do not have a sales charge.
Past performance is not an indication of future results.
Performance results may include adjustments made for financial reporting purposes in accordance with U.S. generally accepted accounting principles.
Expense Example
| | | | | | | | | | | | | | | | | | | | | | | | | | | | | | | | |
| | | Actual | | | | | | Hypothetical(a) | | | | |
| | | | | | | | | | | | | | | | |
| | | | | | | | |
| | |
| Beginning
Account Value
(07/01/21) |
| |
| Ending
Account Value
(12/31/21) |
| |
| Expenses
Paid During
the Period |
(b) | | | | | |
| Beginning
Account Value
(07/01/21) |
| |
| Ending
Account Value
(12/31/21) |
| |
| Expenses
Paid During
the Period |
(b) | |
| Annualized
Expense
Ratio |
|
| | | | | | | | |
Institutional | | | $ 1,000.00 | | | | $ 998.50 | | | | $ 0.45 | | | | | | | | $ 1,000.00 | | | | $ 1,024.75 | | | | $ 0.46 | | | | 0.09 | % |
Investor A | | | 1,000.00 | | | | 997.20 | | | | 1.71 | | | | | | | | 1,000.00 | | | | 1,023.49 | | | | 1.73 | | | | 0.34 | |
Investor P | | | 1,000.00 | | | | 998.10 | | | | 1.71 | | | | | | | | 1,000.00 | | | | 1,023.49 | | | | 1.73 | | | | 0.34 | |
Class K | | | 1,000.00 | | | | 999.60 | | | | 0.20 | | | | | | | | 1,000.00 | | | | 1,025.00 | | | | 0.20 | | | | 0.04 | |
| | (a) | Hypothetical 5% annual return before expenses is calculated by prorating the number of days in the most recent fiscal half year divided by 365. | |
| | (b) | For each class of the Fund, expenses are equal to the annualized expense ratio for the class, multiplied by the average account value over the period, multiplied by 184/365 (to reflect the one-half year period shown). Because the Fund invests all of its assets in the Master Portfolio, the expense example reflects the net expenses of both the Fund and the Master Portfolio in which it invests. | |
See “Disclosure of Expenses” for further information on how expenses were calculated.
| | |
| About Fund Performance | | iShares U.S. Aggregate Bond Index Fund |
Institutional and Class K Shares are not subject to any sales charge. These shares bear no ongoing distribution or service fees and are available only to certain eligible investors.
Investor A Shares are not subject to any sales charge and bear no ongoing distribution fee. These shares are subject to an ongoing service fee of 0.25% per year. These shares are generally available through financial intermediaries.
Investor P Shares are subject to a maximum initial sales charge (front-end load) of 4.00% and a service fee of 0.25% per year (but no distribution fee). Certain redemption of these shares may be subject to a CDSC where no initial sales charge was paid at the time of purchase. These shares are only available to investors purchasing shares through registered representatives of an insurance company’s broker-dealer that has entered into an agreement with the Fund’s distributor to offer such shares. Investor P Shares performance shown prior to the Investor P Shares inception date of August 6, 2018 is that of Class K Shares (which have no distribution or service fess) and was restated or reflect Investor P Shares fees.
Past performance is not an indication of future results. Financial markets have experienced extreme volatility and trading in many instruments has been disrupted. These circumstances may continue for an extended period of time and may continue to affect adversely the value and liquidity of the Fund’s investments. As a result, current performance may be lower or higher than the performance data quoted. Refer to blackrock.com to obtain performance data current to the most recent month-end. Performance results do not reflect the deduction of taxes that a shareholder would pay on Fund distributions or the redemption of Fund shares. Figures shown in the performance table(s) assume reinvestment of all distributions, if any, at net asset value (“NAV”) on the ex-dividend date or payable date, as applicable. Investment return and principal value of shares will fluctuate so that shares, when redeemed, may be worth more or less than their original cost. Distributions paid to each class of shares will vary because of the different levels of service, distribution and transfer agency fees applicable to each class, which are deducted from the income available to be paid to shareholders.
BlackRock Advisors, LLC (the “Administrator”), the Fund’s administrator, has contractually and/or voluntarily agreed to waive and/or reimburse a portion of the Fund’s expenses. Without such waiver(s) and/or reimbursement(s), the Fund’s performance would have been lower. With respect to the Fund’s voluntary waiver(s), if any, the Administrator is under no obligation to waive and/or reimburse or to continue waiving and/or reimbursing its fees and such voluntary waiver(s) may be reduced or discontinued at any time. With respect to the Fund’s contractual waiver(s), if any, the Administrator is under no obligation to continue waiving and/or reimbursing its fees after the applicable termination date of such agreement. See the Notes to Financial Statements for additional information on waivers and/or reimbursements.
The standardized 30-day yield includes the effects of any waivers and/or reimbursements. The unsubsidized 30-day yield excludes the effects of any waivers and/or reimbursements.
Disclosure of Expenses
Shareholders of the Fund may incur the following charges: (a) transactional expenses, such as sales charges; and (b) operating expenses, including administration fees, service and distribution fees, including 12b-1 fees, acquired fund fees and expenses, and other fund expenses. The expense example shown (which is based on a hypothetical investment of $1,000 invested at the beginning of the period (or from the commencement of operations if less than 6 months) and held through the end of the period) is intended to assist shareholders both in calculating expenses based on an investment in the Fund and in comparing these expenses with similar costs of investing in other mutual funds.
The expense example provides information about actual account values and actual expenses. Annualized expense ratios reflect contractual and voluntary fee waivers, if any. In order to estimate the expenses a shareholder paid during the period covered by this report, shareholders can divide their account value by $1,000 and then multiply the result by the number corresponding to their share class under the heading entitled “Expenses Paid During the Period.”
The expense example also provides information about hypothetical account values and hypothetical expenses based on the Fund’s actual expense ratio and an assumed rate of return of 5% per year before expenses. In order to assist shareholders in comparing the ongoing expenses of investing in the Fund and other funds, compare the 5% hypothetical example with the 5% hypothetical examples that appear in shareholder reports of other funds.
The expenses shown in the expense example are intended to highlight shareholders’ ongoing costs only and do not reflect transactional expenses, such as sales charges, if any. Therefore, the hypothetical example is useful in comparing ongoing expenses only and will not help shareholders determine the relative total expenses of owning different funds. If these transactional expenses were included, shareholder expenses would have been higher.
| | |
| 6 | | 2 0 2 1 BLACK ROCK ANNUAL REPORT TO SHAREHOLDERS |
Statement of Assets and Liabilities
December 31, 2021
| | | | |
| | | iShares U.S. Aggregate Bond Index Fund | |
| |
| |
ASSETS | | | | |
Investments, at value — Master Portfolio | | $ | 2,586,150,284 | |
Receivables: | | | | |
Capital shares sold | | | 5,745,415 | |
Withdrawals from the Master Portfolio | | | 6,825,670 | |
| | | | |
| |
Total assets | | | 2,598,721,369 | |
| | | | |
| |
LIABILITIES | | | | |
Payables: | | | | |
Administration fees | | | 45,388 | |
Capital shares redeemed | | | 12,571,085 | |
Professional fees | | | 12,864 | |
Service fees | | | 32,039 | |
| | | | |
| |
Total liabilities | | | 12,661,376 | |
| | | | |
| |
NET ASSETS | | $ | 2,586,059,993 | |
| | | | |
| |
NET ASSETS CONSIST OF | | | | |
Paid-in capital | | $ | 2,535,833,510 | |
Accumulated earnings | | | 50,226,483 | |
| | | | |
| |
NET ASSETS | | $ | 2,586,059,993 | |
| | | | |
| | |
FUND FINANCIAL STATEMENTS | | 7 |
Statement of Assets and Liabilities (continued)
December 31, 2021
| | | | |
| | | iShares U.S. Aggregate Bond Index Fund | |
| |
| |
NET ASSET VALUE | | | | |
| |
| Institutional | | | |
Net assets | | $ | 419,039,764 | |
| | | | |
| |
Shares outstanding | | | 39,981,571 | |
| | | | |
| |
Net asset value | | $ | 10.48 | |
| | | | |
| |
Shares authorized | | | Unlimited | |
| | | | |
| |
Par value | | | No par value | |
| | | | |
| |
| Investor A | | | |
Net assets | | $ | 144,418,360 | |
| | | | |
| |
Shares outstanding | | | 13,779,909 | |
| | | | |
| |
Net asset value | | $ | 10.48 | |
| | | | |
| |
Shares authorized | | | Unlimited | |
| | | | |
| |
Par value | | | No par value | |
| | | | |
| |
| Investor P | | | |
Net assets | | $ | 8,461,201 | |
| | | | |
| |
Shares outstanding | | | 807,523 | |
| | | | |
| |
Net asset value | | $ | 10.48 | |
| | | | |
| |
Shares authorized | | | Unlimited | |
| | | | |
| |
Par value | | | No par value | |
| | | | |
| |
| Class K | | | |
Net assets | | $ | 2,014,140,668 | |
| | | | |
| |
Shares outstanding | | | 192,041,359 | |
| | | | |
| |
Net asset value | | $ | 10.49 | |
| | | | |
| |
Shares authorized | | | Unlimited | |
| | | | |
| |
Par value | | | No par value | |
| | | | |
See notes to financial statements.
| | |
| 8 | | 2 0 2 1 BLACK ROCK ANNUAL REPORT TO SHAREHOLDERS |
Statement of Operations
Year Ended December 31, 2021
| | | | |
| | | iShares U.S. Aggregate Bond Index Fund | |
| |
| |
INVESTMENT INCOME | | | | |
Net investment income allocated from the Master Portfolio: | | | | |
Dividends — affiliated | | $ | 353,028 | |
Interest - unaffliated | | | 48,378,109 | |
Securities lending income — affiliated — net | | | 829,442 | |
Expenses | | | (1,115,659 | ) |
Fees waived | | | 200,246 | |
| | | | |
| |
Total investment income | | | 48,645,166 | |
| | | | |
| |
FUND EXPENSES | | | | |
Administration — class specific | | | 551,749 | |
Service — class specific | | | 405,538 | |
Professional | | | 13,062 | |
Miscellaneous | | | 4,132 | |
| | | | |
| |
Total expenses | | | 974,481 | |
Less: | | | | |
Fees waived and/or reimbursed by the Administrator | | | (13,062 | ) |
| | | | |
| |
Total expenses after fees waived and/or reimbursed | | | 961,419 | |
| | | | |
| |
Net investment income | | | 47,683,747 | |
| | | | |
| |
REALIZED AND UNREALIZED GAIN (LOSS) ALLOCATED FROM THE MASTER PORTFOLIO | | | | |
Net realized gain (loss) from: | | | | |
Investments — unaffiliated | | | 2,769,599 | |
Investments — affiliated | | | (202,985 | ) |
| | | | |
| |
| | | 2,566,614 | |
| | | | |
Net change in unrealized appreciation (depreciation) on: | | | | |
Investments — unaffiliated | | | (99,413,308 | ) |
Investments — affiliated | | | (100,600 | ) |
| | | | |
| |
| | | (99,513,908 | ) |
| | | | |
| |
Net realized and unrealized loss | | | (96,947,294 | ) |
| | | | |
| |
NET DECREASE IN NET ASSETS RESULTING FROM OPERATIONS | | $ | (49,263,547 | ) |
| | | | |
See notes to financial statements.
| | |
FUND FINANCIAL STATEMENTS | | 9 |
Statements of Changes in Net Assets
| | | | | | | | |
| | | iShares U.S. Aggregate | |
| |
| | | Bond Index Fund | |
| | | | |
| |
| | | Year Ended December 31, | |
| | | | |
| | |
| | | 2021 | | | 2020 | |
| |
| | |
INCREASE (DECREASE) IN NET ASSETS | | | | | | | | |
| | |
OPERATIONS | | | | | | | | |
Net investment income | | $ | 47,683,747 | | | $ | 53,256,102 | |
Net realized gain | | | 2,566,614 | | | | 16,101,177 | |
Net change in unrealized appreciation (depreciation) | | | (99,513,908 | ) | | | 90,696,413 | |
| | | | | | | | |
| | |
Net increase (decrease) in net assets resulting from operations | | | (49,263,547 | ) | | | 160,053,692 | |
| | | | | | | | |
| | |
DISTRIBUTIONS TO SHAREHOLDERS(a) | | | | | | | | |
From net investment income and net realized gain | | | | | | | | |
Institutional | | | (7,992,323 | ) | | | (6,908,555 | ) |
Investor A | | | (2,639,249 | ) | | | (3,454,789 | ) |
Investor P | | | (136,576 | ) | | | (126,962 | ) |
Class K | | | (42,745,480 | ) | | | (52,552,693 | ) |
Return of capital | | | | | | | | |
Institutional | | | (14,602 | ) | | | — | |
Investor A | | | (5,601 | ) | | | — | |
Investor P | | | (286 | ) | | | — | |
Class K | | | (77,300 | ) | | | — | |
| | | | | | | | |
| | |
Decrease in net assets resulting from distributions to shareholders | | | (53,611,417 | ) | | | (63,042,999 | ) |
| | | | | | | | |
| | |
CAPITAL SHARE TRANSACTIONS | | | | | | | | |
Net increase (decrease) in net assets derived from capital share transactions | | | (16,506,421 | ) | | | 565,686,648 | |
| | | | | | | | |
| | |
NET ASSETS | | | | | | | | |
Total increase (decrease) in net assets | | | (119,381,385 | ) | | | 662,697,341 | |
Beginning of year | | | 2,705,441,378 | | | | 2,042,744,037 | |
| | | | | | | | |
| | |
End of year | | $ | 2,586,059,993 | | | $ | 2,705,441,378 | |
| | | | | | | | |
| (a) | Distributions for annual periods determined in accordance with U.S. federal income tax regulations. |
See notes to financial statements.
| | |
| 10 | | 2 0 2 1 BLACK ROCK ANNUAL REPORT TO SHAREHOLDERS |
Financial Highlights
(For a share outstanding throughout each period)
| | | | | | | | | | | | | | | | | | | | | | |
| | | | | iShares U.S. Aggregate Bond Index Fund | |
| | |
| | | | | Institutional | |
| | |
| | | | | Year Ended December 31, | |
| | | | | | |
| | | | | 2021 | | | 2020 | | | 2019 | | | 2018 | | | 2017 | |
| | | | | |
Net asset value, beginning of year | | $ | 10.89 | | | $ | 10.39 | | | $ | 9.85 | | | $ | 10.13 | | | $ | 10.02 | |
| | | | | | | | | | | | | | | | | | | | | | |
| | | | | |
Net investment income(a) | | | 0.19 | | | | 0.24 | | | | 0.29 | | | | 0.26 | | | | 0.22 | |
Net realized and unrealized gain (loss) | | | (0.39 | ) | | | 0.54 | | | | 0.54 | | | | (0.28 | ) | | | 0.11 | |
| | | | | | | | | | | | | | | | | | | | | | |
| | | | | |
Net increase (decrease) from investment operations | | | (0.20 | ) | | | 0.78 | | | | 0.83 | | | | (0.02 | ) | | | 0.33 | |
| | | | | | | | | | | | | | | | | | | | | | |
| | | | | |
Distributions(b) | | | | | | | | | | | | | | | | | | | | |
From net investment income | | | (0.21 | ) | | | (0.26 | ) | | | (0.29 | ) | | | (0.26 | ) | | | (0.22 | ) |
From net realized gain | | | (0.00 | )(c) | | | (0.02 | ) | | | — | | | | — | | | | — | |
Return of capital | | | (0.00 | )(c) | | | — | | | | — | | | | (0.00 | )(c) | | | — | |
| | | | | | | | | | | | | | | | | | | | | | |
| | | | | |
Total distributions | | | (0.21 | ) | | | (0.28 | ) | | | (0.29 | ) | | | (0.26 | ) | | | (0.22 | ) |
| | | | | | | | | | | | | | | | | | | | | | |
| | | | | |
Net asset value, end of year | | $ | 10.48 | | | $ | 10.89 | | | $ | 10.39 | | | $ | 9.85 | | | $ | 10.13 | |
| | | | | | | | | | | | | | | | | | | | | | |
| | | | | |
Total Return(d) | | | | | | | | | | | | | | | | | | | | |
Based on net asset value | | | (1.85 | )% | | | 7.59 | % | | | 8.56 | %(e) | | | (0.13 | )% | | | 3.34 | % |
| | | | | | | | | | | | | | | | | | | | | | |
| | | | | |
Ratios to Average Net Assets(f)(g) | | | | | | | | | | | | | | | | | | | | |
Total expenses | | | 0.09 | % | | | 0.09 | % | | | 0.10 | % | | | 0.09 | % | | | 0.09 | % |
| | | | | | | | | | | | | | | | | | | | | | |
| | | | | |
Total expenses after fees waived and/or reimbursed | | | 0.09 | % | | | 0.09 | % | | | 0.10 | % | | | 0.09 | % | | | 0.09 | % |
| | | | | | | | | | | | | | | | | | | | | | |
| | | | | |
Net investment income | | | 1.75 | % | | | 2.18 | % | | | 2.85 | % | | | 2.67 | % | | | 2.15 | % |
| | | | | | | | | | | | | | | | | | | | | | |
| | | | | |
Supplemental Data | | | | | | | | | | | | | | | | | | | | |
Net assets, end of year (000) | | $ | 419,040 | | | $ | 371,074 | | | $ | 187,854 | | | $ | 150,714 | | | $ | 98,927 | |
| | | | | | | | | | | | | | | | | | | | | | |
| | | | | |
Portfolio turnover rate of the Master Portfolio(h) | | | 175 | % | | | 186 | % | | | 158 | % | | | 274 | % | | | 345 | % |
| | | | | | | | | | | | | | | | | | | | | | |
|
(a) Based on average shares outstanding. (b) Distributions for annual periods determined in accordance with U.S. federal income tax regulations. (c) Amount is greater than $(0.005) per share. (d) Where applicable, assumes the reinvestment of distributions. (e) Includes payment from an affiliate, which had no impact on the Fund’s total return. (f) Includes the Fund’s share of the Master Portfolio’s allocated net expenses and/or net investment income. (g) Excludes fees and expenses incurred indirectly as a result of investments in underlying funds. (h) Includes mortgage dollar roll transactions (“MDRs”). Additional information regarding portfolio turnover rate is as follows: | |
| | |
| | | | | Year Ended December 31, | |
| | | | | | |
| | | | | 2021 | | | 2020 | | | 2019 | | | 2018 | | | 2017 | |
| | | | | | |
| | Portfolio turnover rate (excluding MDRs) | | | 89 | % | | | 101 | % | | | 97 | % | | | 162 | % | | | 193 | % |
| | | | | | | | | | | | | | | | | | | | | | |
See notes to financial statements.
| | |
FUND FINANCIAL HIGHLIGHTS | | 11 |
Financial Highlights (continued)
(For a share outstanding throughout each period)
| | | | | | | | | | | | | | | | | | | | | | | | |
| | | | | | | iShares U.S. Aggregate Bond Index Fund (continued) | |
| | | |
| | | | | | | Investor A | |
| | | |
| | | | | | | Year Ended December 31, | |
| | | | | | | |
| | | | | | | 2021 | | | 2020 | | | 2019 | | | 2018 | | | 2017 | |
| | | | | | |
Net asset value, beginning of year | | | | $ | 10.89 | | | $ | 10.39 | | | $ | 9.84 | | | $ | 10.13 | | | $ | 10.01 | |
| | | | | | | | | | | | | | | | | | | | | | | | |
| | | | | | |
Net investment income(a) | | | | | 0.16 | | | | 0.21 | | | | 0.26 | | | | 0.24 | | | | 0.19 | |
Net realized and unrealized gain (loss) | | | | | (0.39 | ) | | | 0.54 | | | | 0.56 | | | | (0.29 | ) | | | 0.13 | |
| | | | | | | | | | | | | | | | | | | | | | | | |
| | | | | | |
Net increase (decrease) from investment operations | | | | | (0.23 | ) | | | 0.75 | | | | 0.82 | | | | (0.05 | ) | | | 0.32 | |
| | | | | | | | | | | | | | | | | | | | | | | | |
| | | | | | |
Distributions(b) | | | | | | | | | | | | | | | | | | | | | | |
From net investment income | | | | | (0.18 | ) | | | (0.23 | ) | | | (0.27 | ) | | | (0.24 | ) | | | (0.20 | ) |
From net realized gain | | | | | (0.00 | )(c) | | | (0.02 | ) | | | — | | | | — | | | | — | |
Return of capital | | | | | (0.00 | )(c) | | | — | | | | — | | | | (0.00 | )(c) | | | — | |
| | | | | | | | | | | | | | | | | | | | | | | | |
| | | | | | |
Total distributions | | | | | (0.18 | ) | | | (0.25 | ) | | | (0.27 | ) | | | (0.24 | ) | | | (0.20 | ) |
| | | | | | | | | | | | | | | | | | | | | | | | |
| | | | | | |
Net asset value, end of year | | | | $ | 10.48 | | | $ | 10.89 | | | $ | 10.39 | | | $ | 9.84 | | | $ | 10.13 | |
| | | | | | | | | | | | | | | | | | | | | | | | |
| | | | | | |
Total Return(d) | | | | | | | | | | | | | | | | | | | | | | |
Based on net asset value | | | | | (2.09 | )% | | | 7.33 | % | | | 8.39 | %(e) | | | (0.48 | )% | | | 3.19 | % |
| | | | | | | | | | | | | | | | | | | | | | | | |
| | | | | | |
Ratios to Average Net Assets(f)(g) | | | | | | | | | | | | | | | | | | | | | | |
Total expenses | | | | | 0.34 | % | | | 0.34 | % | | | 0.35 | % | | | 0.34 | % | | | 0.34 | % |
| | | | | | | | | | | | | | | | | | | | | | | | |
| | | | | | |
Total expenses after fees waived and/or reimbursed | | | | | 0.34 | % | | | 0.34 | % | | | 0.35 | % | | | 0.34 | % | | | 0.34 | % |
| | | | | | | | | | | | | | | | | | | | | | | | |
| | | | | | |
Net investment income | | | | | 1.46 | % | | | 1.98 | % | | | 2.61 | % | | | 2.39 | % | | | 1.91 | % |
| | | | | | | | | | | | | | | | | | | | | | | | |
| | | | | | |
Supplemental Data | | | | | | | | | | | | | | | | | | | | | | |
Net assets, end of year (000) | | | | $ | 144,418 | | | $ | 161,624 | | | $ | 121,421 | | | $ | 126,483 | | | $ | 121,690 | |
| | | | | | | | | | | | | | | | | | | | | | | | |
| | | | | | |
Portfolio turnover rate of the Master Portfolio(h) | | | | | 175 | % | | | 186 | % | | | 158 | % | | | 274 | % | | | 345 | % |
| | | | | | | | | | | | | | | | | | | | | | | | |
(a) Based on average shares outstanding. (b) Distributions for annual periods determined in accordance with U.S. federal income tax regulations. (c) Amount is greater than $(0.005) per share. (d) Where applicable, assumes the reinvestment of distributions. (e) Includes payment from an affiliate, which had no impact on the Fund’s total return. (f) Includes the Fund’s share of the Master Portfolio’s allocated net expenses and/or net investment income. (g) Excludes fees and expenses incurred indirectly as a result of investments in underlying funds. (h) Includes mortgage dollar roll transactions (“MDRs”). Additional information regarding portfolio turnover rate is as follows: | |
| | | |
| | | | | | | Year Ended December 31, | |
| | | | | | | |
| | | | | | | 2021 | | | 2020 | | | 2019 | | | 2018 | | | 2017 | |
| | | | | | | |
| | Portfolio turnover rate (excluding MDRs) | | | | | 89 | % | | | 101 | % | | | 97 | % | | | 162 | % | | | 193 | % |
| | | | | | | | | | | | | | | | | | | | | | | | |
See notes to financial statements.
| | |
| 12 | | 2 0 2 1 BLACK ROCK ANNUAL REPORT TO SHAREHOLDERS |
Financial Highlights (continued)
(For a share outstanding throughout each period)
| | | | | | | | | | | | | | | | | | | | | | | | | | | | | | | | |
| | | | | iShares U.S. Aggregate Bond Index Fund (continued) | | | |
| | | |
| | | | | Investor P | | | |
| | | | | | | | | | | | | | | | | | | | Period from | | | |
| | | | | Year Ended December 31, | | | | | | | | 08/06/18 | (a) | | |
| | | | | 2021 | | | | | | 2020 | | | | | | 2019 | | | to 12/31/18 | | | |
| | | | | | | | |
Net asset value, beginning of period | | $ | 10.89 | | | | | | | $ | 10.39 | | | | | | | $ | 9.85 | | | | | | | $ | 9.83 | | | |
| | | | | | | | | | | | | | | | | | | | | | | | | | | | | | | | |
| | | | | | | | |
Net investment income(b) | | | 0.16 | | | | | | | | 0.21 | | | | | | | | 0.27 | | | | | | | | 0.10 | | | |
Net realized and unrealized gain (loss) | | | (0.39 | ) | | | | | | | 0.55 | | | | | | | | 0.54 | | | | | | | | 0.03 | | | |
| | | | | | | | | | | | | | | | | | | | | | | | | | | | | | | | |
| | | | | | | | |
Net increase (decrease) from investment operations | | | (0.23 | ) | | | | | | | 0.76 | | | | | | | | 0.81 | | | | | | | | 0.13 | | | |
| | | | | | | | | | | | | | | | | | | | | | | | | | | | | | | | |
| | | | | | | | |
Distributions(c) | | | | | | | | | | | | | | | | | | | | | | | | | | | | | | |
From net investment income | | | (0.18 | ) | | | | | | | (0.24 | ) | | | | | | | (0.27 | ) | | | | | | | (0.11 | ) | | |
From net realized gain | | | (0.00 | )(d) | | | | | | | (0.02 | ) | | | | | | | — | | | | | | | | — | | | |
Return of capital | | | (0.00 | )(d) | | | | | | | — | | | | | | | | — | | | | | | | | (0.00 | )(d) | | |
| | | | | | | | | | | | | | | | | | | | | | | | | | | | | | | | |
| | | | | | | | |
Total distributions | | | (0.18 | ) | | | | | | | (0.26 | ) | | | | | | | (0.27 | ) | | | | | | | (0.11 | ) | | |
| | | | | | | | | | | | | | | | | | | | | | | | | | | | | | | | |
| | | | | | | | |
Net asset value, end of period | | $ | 10.48 | | | | | | | $ | 10.89 | | | | | | | $ | 10.39 | | | | | | | $ | 9.85 | | | |
| | | | | | | | | | | | | | | | | | | | | | | | | | | | | | |
| | | | | | | | |
Total Return(e) | | | | | | | | | | | | | | | | | | | | | | | | | | | | | | |
Based on net asset value | | | (2.09 | )% | | | | | | | 7.34 | % | | | | | | | 8.32 | %(f) | | | | | | | 1.30 | %(g) | | |
| | | | | | | | | | | | | | | | | | | | | | | | | | | | | | | | |
| | | | | | | | |
Ratios to Average Net Assets(h)(i) | | | | | | | | | | | | | | | | | | | | | | | | | | | | | | |
Total expenses | | | 0.34 | % | | | | | | | 0.34 | % | | | | | | | 0.35 | % | | | | | | | 0.34 | %(j) | | |
| | | | | | | | | | | | | | | | | | | | | | | | | | | | | | | | |
| | | | | | | | |
Total expenses after fees waived and/or reimbursed | | | 0.34 | % | | | | | | | 0.34 | % | | | | | | | 0.35 | % | | | | | | | 0.34 | %(j) | | |
| | | | | | | | | | | | | | | | | | | | | | | | | | | | | | | | |
| | | | | | | | |
Net investment income | | | 1.50 | % | | | | | | | 1.95 | % | | | | | | | 2.54 | % | | | | | | | 2.61 | %(j) | | |
| | | | | | | | | | | | | | | | | | | | | | | | | | | | | | | | |
| | | | | | | | |
Supplemental Data | | | | | | | | | | | | | | | | | | | | | | | | | | | | | | |
Net assets, end of period (000) | | $ | 8,461 | | | | | | | $ | 7,045 | | | | | | | $ | 2,714 | | | | | | | $ | 277 | | | |
| | | | | | | | | | | | | | | | | | | | | | | | | | | | | | | | |
| | | | | | | | |
Portfolio turnover rate of the Master Portfolio(k) | | | 175 | % | | | | | | | 186 | % | | | | | | | 158 | % | | | | | | | 274 | % | | |
| | | | | | | | | | | | | | | | | | | | | | | | | | | | | | | | |
(a) Commencement of operations. (b) Based on average shares outstanding. (c) Distributions for annual periods determined in accordance with U.S. federal income tax regulations. (d) Amount is greater than $(0.005) per share. (e) Where applicable, excludes the effects of any sales charges and assumes the reinvestment of distributions. (f) Includes payment from an affiliate, which had no impact on the Fund’s total return. (g) Aggregate total return. (h) Includes the Fund’s share of the Master Portfolio’s allocated net expenses and/or net investment income. (i) Excludes fees and expenses incurred indirectly as a result of investments in underlying funds. (j) Annualized. (k) Includes mortgage dollar roll transactions (“MDRs”). Additional information regarding portfolio turnover rate is as follows: |
| | | | | | | | |
| | | | | | | | | | | | | | | | | | | | Period from | | | |
| | | | | Year Ended December 31, | | | | | | | | 08/06/18 | (a) | | |
| | | | | | | | |
| | | | | 2021 | | | | | | 2020 | | | | | | 2019 | | | to 12/31/18 | | | |
| | | | | | | | | |
| | Portfolio turnover rate (excluding MDRs) | | | 89 | % | | | | | | | 101 | % | | | | | | | 97 | % | | | | | | | 162 | % | | |
| | | | | | | | | | | | | | | | | | | | | | | | | | | | | | | | |
See notes to financial statements.
| | |
FUND FINANCIAL HIGHLIGHTS | | 13 |
Financial Highlights (continued)
(For a share outstanding throughout each period)
| | | | | | | | | | | | | | | | | | | | | | | | |
| | | | | | | iShares U.S. Aggregate Bond Index Fund (continued) | |
| | | |
| | | | | | | Class K | |
| | | |
| | | | | | | Year Ended December 31, | |
| | | | | | | |
| | | | | | | 2021 | | | 2020 | | | 2019 | | | 2018 | | | 2017 | |
| | | | | | |
Net asset value, beginning of year | | | | $ | 10.90 | | | $ | 10.40 | | | $ | 9.85 | | | $ | 10.13 | | | $ | 10.02 | |
| | | | | | | | | | | | | | | | | | | | | | | | |
| | | | | | |
Net investment income(a) | | | | | 0.19 | | | | 0.25 | | | | 0.29 | | | | 0.27 | | | | 0.22 | |
Net realized and unrealized gain (loss) | | | | | (0.39 | ) | | | 0.54 | | | | 0.56 | | | | (0.28 | ) | | | 0.12 | |
| | | | | | | | | | | | | | | | | | | | | | | | |
| | | | | | |
Net increase (decrease) from investment operations | | | | | (0.20 | ) | | | 0.79 | | | | 0.85 | | | | (0.01 | ) | | | 0.34 | |
| | | | | | | | | | | | | | | | | | | | | | | | |
| | | | | | |
Distributions(b) | | | | | | | | | | | | | | | | | | | | | | |
From net investment income | | | | | (0.21 | ) | | | (0.27 | ) | | | (0.30 | ) | | | (0.27 | ) | | | (0.23 | ) |
From net realized gain | | | | | (0.00 | )(c) | | | (0.02 | ) | | | — | | | | — | | | | — | |
Return of capital | | | | | (0.00 | )(c) | | | — | | | | — | | | | (0.00 | )(c) | | | — | |
| | | | | | | | | | | | | | | | | | | | | | | | |
| | | | | | |
Total distributions | | | | | (0.21 | ) | | | (0.29 | ) | | | (0.30 | ) | | | (0.27 | ) | | | (0.23 | ) |
| | | | | | | | | | | | | | | | | | | | | | | | |
| | | | | | |
Net asset value, end of year | | | | $ | 10.49 | | | $ | 10.90 | | | $ | 10.40 | | | $ | 9.85 | | | $ | 10.13 | |
| | | | | | | | | | | | | | | | | | | | | | | | |
| | | | | | |
Total Return(d) | | | | | | | | | | | | | | | | | | | | | | |
Based on net asset value | | | | | (1.80 | )% | | | 7.64 | % | | | 8.71 | %(e) | | | (0.08 | )% | | | 3.39 | % |
| | | | | | | | | | | | | | | | | | | | | | | | |
| | | | | | |
Ratios to Average Net Assets(f)(g) | | | | | | | | | | | | | | | | | | | | | | |
Total expenses | | | | | 0.04 | % | | | 0.04 | % | | | 0.05 | % | | | 0.04 | % | | | 0.04 | % |
| | | | | | | | | | | | | | | | | | | | | | | | |
| | | | | | |
Total expenses after fees waived and/or reimbursed | | | | | 0.04 | % | | | 0.04 | % | | | 0.05 | % | | | 0.04 | % | | | 0.04 | % |
| | | | | | | | | | | | | | | | | | | | | | | | |
| | | | | | |
Net investment income | | | | | 1.80 | % | | | 2.29 | % | | | 2.89 | % | | | 2.71 | % | | | 2.21 | % |
| | | | | | | | | | | | | | | | | | | | | | | | |
| | | | | | |
Supplemental Data | | | | | | | | | | | | | | | | | | | | | | |
Net assets, end of year (000) | | | | $ | 2,014,141 | | | $ | 2,165,698 | | | $ | 1,730,754 | | | $ | 1,027,621 | | | $ | 756,239 | |
| | | | | | | | | | | | | | | | | | | | | | | | |
| | | | | | |
Portfolio turnover rate of the Master Portfolio(h) | | | | | 175 | % | | | 186 | % | | | 158 | % | | | 274 | % | | | 345 | % |
| | | | | | | | | | | | | | | | | | | | | | | | |
(a) Based on average shares outstanding. (b) Distributions for annual periods determined in accordance with U.S. federal income tax regulations. (c) Amount is greater than $(0.005) per share. (d) Where applicable, assumes the reinvestment of distributions. (e) Includes payment from an affiliate, which had no impact on the Fund’s total return. (f) Includes the Fund’s share of the Master Portfolio’s allocated net expenses and/or net investment income. (g) Excludes fees and expenses incurred indirectly as a result of investments in underlying funds. (h) Includes mortgage dollar roll transactions (“MDRs”). Additional information regarding portfolio turnover rate is as follows: | |
| | | |
| | | | | | | Year Ended December 31, | |
| | | | | | | |
| | | | | | | 2021 | | | 2020 | | | 2019 | | | 2018 | | | 2017 | |
| | | | | | | |
| | Portfolio turnover rate (excluding MDRs) | | | | | 89 | % | | | 101 | % | | | 97 | % | | | 162 | % | | | 193 | % |
| | | | | | | | | | | | | | | | | | | | | | | | |
See notes to financial statements.
| | |
| 14 | | 2 0 2 1 BLACK ROCK ANNUAL REPORT TO SHAREHOLDERS |
Notes to Financial Statements
BlackRock Funds III (the “Trust”) is registered under the Investment Company Act of 1940, as amended (the “1940 Act”), as an open-end management investment company. The Trust is organized as a Delaware statutory trust. iShares U.S. Aggregate Bond Index Fund (the “Fund”) is a series of the Trust. The Fund is classified as diversified.
The Fund seeks to achieve its investment objective by investing all of its assets in U.S. Total Bond Index Master Portfolio (the “Master Portfolio”), a series of Master Investment Portfolio (“MIP”) and an affiliate of the Trust, which has the same investment objective and strategies as the Fund. The value of the Fund’s investment in the Master Portfolio reflects the Fund’s proportionate interest in the net assets of the Master Portfolio. The performance of the Fund is directly affected by the performance of the Master Portfolio. At December 31, 2021, the percentage of the Master Portfolio owned by the Fund was 14.8%. The financial statements of the Master Portfolio, including the Schedule of Investments, are included elsewhere in this report and should be read in conjunction with the Fund’s financial statements.
The Fund offers multiple classes of shares. All classes of shares have identical voting, dividend, liquidation and other rights and are subject to the same terms and conditions, except that certain classes bear expenses related to the shareholder servicing and distribution of such shares. Institutional and Class K Shares are sold only to certain eligible investors. Investor A and Investor P Shares bear certain expenses related to shareholder servicing of such shares. Investor A Shares are generally available through financial intermediaries. Investor P Shares are only available through registered representatives of an insurance company’s broker-dealer that has entered into an agreement with the Fund’s distributor to offer such shares. Each class has exclusive voting rights with respect to matters relating to its shareholder servicing and distribution expenditures.
| | | | | | |
|
| | | |
| Share Class | | Initial Sales Charge | | CDSC | | Conversion Privilege |
|
| | | |
Institutional, Investor A and Class K Shares | | No | | No | | None |
Investor P Shares | | Yes | | No(a) | | None |
|
| | (a) | Investor P Shares may be subject to a contingent deferred sales charge (“CDSC”) for certain redemptions where no initial sales charge was paid at the time of purchase. | |
The Board of Trustees of the Trust and Board of Directors of MIP are referred to throughout this report as the “Board” and the members are referred to as “Trustees”.
The Fund, together with certain other registered investment companies advised by BlackRock Fund Advisors (“BFA” or the “Manager”) or its affiliates, is included in a complex of open-end equity, multi-asset, index and money market funds referred to as the BlackRock Multi-Asset Complex.
| 2. | SIGNIFICANT ACCOUNTING POLICIES |
The financial statements are prepared in conformity with accounting principles generally accepted in the United States of America (“U.S. GAAP”), which may require management to make estimates and assumptions that affect the reported amounts of assets and liabilities in the financial statements, disclosure of contingent assets and liabilities at the date of the financial statements and the reported amounts of increases and decreases in net assets from operations during the reporting period. Actual results could differ from those estimates. The Fund is considered an investment company under U.S. GAAP and follows the accounting and reporting guidance applicable to investment companies. Below is a summary of significant accounting policies:
Investment Transactions and Income Recognition: For financial reporting purposes, contributions to and withdrawals from the Master Portfolio are accounted for on a trade date basis. The Fund records its proportionate share of the Master Portfolio’s income, expenses and realized and unrealized gains and losses on a daily basis. Realized and unrealized gains and losses are adjusted utilizing partnership tax allocation rules. In addition, the Fund accrues its own expenses. Income, expenses and realized and unrealized gains and losses are allocated daily to each class based on its relative net assets.
Distributions: Distributions from net investment income are declared daily and paid monthly. Distributions of capital gains are recorded on the ex-dividend dates and made at least annually. The portion of distributions, if any, that exceeds a fund’s current and accumulated earnings and profits, as measured on a tax basis, constitute a non-taxable return of capital. The character and timing of distributions are determined in accordance with U.S. federal income tax regulations, which may differ from U.S. GAAP.
Indemnifications: In the normal course of business, the Fund enters into contracts that contain a variety of representations that provide general indemnification. The Fund’s maximum exposure under these arrangements is unknown because it involves future potential claims against the Fund, which cannot be predicted with any certainty.
Other: Expenses directly related to the Fund or its classes are charged to the Fund or the applicable class. Expenses directly related to the Fund and other shared expenses prorated to the Fund are allocated daily to each class based on its relative net assets or other appropriate methods. Other operating expenses shared by several funds, including other funds managed by the Administrator, are prorated among those funds on the basis of relative net assets or other appropriate methods.
| 3. | INVESTMENT VALUATION AND FAIR VALUE MEASUREMENTS |
Investment Valuation Policies: The Fund’s policy is to value its financial instruments at fair value. The Fund records its investment in the Master Portfolio at fair value based on the Fund’s proportionate interest in the net assets of the Master Portfolio. Valuation of securities held by the Master Portfolio is discussed in Note 3 of the Master Portfolio’s Notes to Financial Statements, which are included elsewhere in this report.
| 4. | ADMINISTRATION AGREEMENT AND OTHER TRANSACTIONS WITH AFFILIATES |
Administration: The Trust, on behalf of the Fund, entered into an Administration Agreement with BlackRock Advisors, LLC (“BAL”), which has agreed to provide general administrative services (other than investment advice and related portfolio activities). BAL has agreed to bear all of the Fund’s ordinary operating expenses, excluding,
| | |
FUND NOTES TO FINANCIAL STATEMENTS | | 15 |
Notes to Financial Statements (continued)
generally, investment advisory fees, distribution fees, brokerage and other expenses related to the execution of portfolio transactions, extraordinary expenses and certain other expenses which are borne by the Fund. BAL is entitled to receive for these administrative services an annual fee based on the average daily net assets of the Fund as follows:
| | | | | | | | | | | | | | | | |
| | | | | |
| | | Institutional | | | Investor A | | | Investor P | | | Class K | |
| | | | |
Administration fees - class specific | | | 0.06 | % | | | 0.06 | % | | | 0.06 | % | | | 0.01 | % |
For the year ended December 31, 2021, the following table shows the class specific administration fees borne directly by each share class of the Fund:
| | | | | | | | | | | | | | | | | | | | |
| | | | | | |
| | | Institutional | | | Investor A | | | Investor P | | | Class K | | | Total | |
| | | | | |
Administration fees | | $ | 241,420 | | | $ | 92,600 | | | $ | 4,730 | | | $ | 212,999 | | | $ | 551,749 | |
From time to time, BAL may waive such fees in whole or in part. Any such waiver will reduce the expenses of the Fund and, accordingly, have a favorable impact on its performance. BAL may delegate certain of its administration duties to sub-administrators. For the year ended December 31, 2021, BAL did not waive any amount.
Service and Distribution Fees: The Trust, on behalf of the Fund, entered into a Distribution Agreement and a Distribution and Service Plan with BlackRock Investments, LLC (“BRIL”), an affiliate of the Administrator. Pursuant to the Distribution and Service Plan and in accordance with Rule 12b-1 under the 1940 Act, the Fund pays BRIL ongoing service fees. The fees are accrued daily and paid monthly at annual rates based upon the average daily net assets of the relevant share class of the Fund as follows:
| | | | |
| | |
| Share Class | | Service Fees | |
| |
Investor A | | | 0.25 | % |
Investor P | | | 0.25 | |
BRIL and broker-dealers, pursuant to sub-agreements with BRIL, provide shareholder servicing and distribution services to the Fund. The ongoing service and/or distribution fee compensates BRIL and each broker-dealer for providing shareholder servicing and/or distribution related services to shareholders.
For the year ended December 31, 2021, the following table shows the class specific service fees borne directly by each share class of the Fund:
| | | | | | | | | | | | |
| |
| | | |
| Fund Name | | Investor A | | | Investor P | | | Total | |
| |
| | | |
iShares U.S. Aggregate Bond Index Fund | | $ | 385,832 | | | $ | 19,706 | | | $ | 405,538 | |
| |
Other Fees: For the year ended December 31, 2021, affiliates earned underwriting discounts, direct commissions and dealer concessions on sales of the Fund’s Investor P Shares for a total of $4,468.
Expense Limitations, Waivers and Reimbursements: The fees and expenses of the Trust’s trustees who are not “interested persons” of the Trust, as defined in the 1940 Act (“Independent Trustees”), counsel to the Independent Trustees and the Trust’s independent registered public accounting firm (together, the “independent expenses”) are paid directly by the Fund. Each of BAL and BFA, as applicable, has contractually agreed to reimburse the Fund or provide an offsetting credit against the administration fees paid by the Fund in an amount equal to these independent expenses through June 30, 2023. For the year ended December 31, 2021, the amount waived was $13,062.
Interfund Lending: In accordance with an exemptive order (the “Order”) from the U.S. Securities and Exchange Commission (“SEC”), the Fund may participate in a joint lending and borrowing facility for temporary purposes (the “Interfund Lending Program”), subject to compliance with the terms and conditions of the Order, and to the extent permitted by the Fund’s investment policies and restrictions. The Fund is currently permitted to borrow and lend under the Interfund Lending Program.
A lending BlackRock fund may lend in aggregate up to 15% of its net assets but may not lend more than 5% of its net assets to any one borrowing fund through the Interfund Lending Program. A borrowing BlackRock fund may not borrow through the Interfund Lending Program or from any other source more than 33 1/3% of its total assets (or any lower threshold provided for by the fund’s investment restrictions). If a borrowing BlackRock fund’s total outstanding borrowings exceed 10% of its total assets, each of its outstanding interfund loans will be subject to collateralization of at least 102% of the outstanding principal value of the loan. All interfund loans are for temporary or emergency purposes and the interest rate to be charged will be the average of the highest current overnight repurchase agreement rate available to a lending fund and the bank loan rate, as calculated according to a formula established by the Board.
During the year ended December 31, 2021, the Fund did not participate in the Interfund Lending Program.
Trustees and Officers: Certain trustees and/or officers of Trust are directors and/or officers of BlackRock or its affiliates.
It is the Fund’s policy to comply with the requirements of the Internal Revenue Code of 1986, as amended, applicable to regulated investment companies, and to distribute substantially all of its taxable income to its shareholders. Therefore, no U.S. federal income tax provision is required.
The Fund files U.S. federal and various state and local tax returns. No income tax returns are currently under examination. The statute of limitations on the Fund’s U.S. federal tax returns generally remains open for a period of three fiscal years after they are filed. The statutes of limitations on the Fund’s state and local tax returns may remain open for an additional year depending upon the jurisdiction.
Management has analyzed tax laws and regulations and their application to the Fund as of December 31, 2021, inclusive of the open tax return years, and does not believe that there are any uncertain tax positions that require recognition of a tax liability in the Fund’s financial statements.
| | |
| 16 | | 2 0 2 1 BLACK ROCK ANNUAL REPORT TO SHAREHOLDERS |
Notes to Financial Statements (continued)
The tax character of distributions paid was as follows:
| | | | | | | | |
| |
| | |
| Fund Name | | Year Ended
12/31/21 | | | Year Ended
12/31/20 | |
| |
| | |
iShares U.S. Aggregate Bond Index Fund | | | | | | | | |
Ordinary income | | $ | 53,484,827 | | | $ | 57,599,347 | |
Long-term capital gains | | | 28,801 | | | | 5,443,652 | |
Return of capital | | | 97,789 | | | | — | |
| | | | | | | | |
| | |
| | $ | 53,611,417 | | | $ | 63,042,999 | |
| | | | | | | | |
As of December 31, 2021, the tax components of accumulated earnings (loss) were as follows:
| | | | |
| |
| |
| | | Amounts | |
| |
| |
Non-expiring capital loss carryforwards(a) | | $ | (3,398,951 | ) |
Net unrealized gains(b) | | | 53,625,434 | |
| | | | |
| |
| | | 50,226,483 | |
| |
| | (a) | Amounts available to offset future realized capital gains. | |
| | (b) | The difference between book-basis and tax-basis net unrealized gains was attributable primarily to the timing and recognition of partnership income. | |
| 6. | CAPITAL SHARE TRANSACTIONS |
Transactions in capital shares for each class were as follows:
| | | | | | | | | | | | | | | | |
| |
| | |
| | | Year Ended 12/31/21 | | | Year Ended 12/31/20 | |
| | | | | | | | |
| | | | |
| Fund Name / Share Class | | Shares | | | Amounts | | | Shares | | | Amounts | |
| |
| | | | |
iShares U.S. Aggregate Bond Index Fund | | | | | | | | | | | | | | | | |
Institutional | | | | | | | | | | | | | | | | |
Shares sold | | | 18,015,453 | | | $ | 190,881,809 | | | | 29,586,240 | | | $ | 321,480,272 | |
Shares issued in reinvestment of distributions | | | 757,112 | | | | 8,006,609 | | | | 636,685 | | | | 6,907,923 | |
Shares redeemed | | | (12,871,825 | ) | | | (136,378,482 | ) | | | (14,219,029 | ) | | | (152,783,494 | ) |
| | | | | | | | | | | | | | | | |
| | | | |
| | | 5,900,740 | | | $ | 62,509,936 | | | | 16,003,896 | | | $ | 175,604,701 | |
| | | | | | | | | | | | | | | | |
Investor A | | | | | | | | | | | | | | | | |
Shares sold | | | 6,012,661 | | | $ | 63,679,017 | | | | 9,018,823 | | | $ | 97,280,126 | |
Shares issued in reinvestment of distributions | | | 250,003 | | | | 2,644,033 | | | | 318,345 | | | | 3,448,413 | |
Shares redeemed | | | (7,328,064 | ) | | | (77,850,649 | ) | | | (6,177,196 | ) | | | (66,506,742 | ) |
| | | | | | | | | | | | | | | | |
| | | | |
| | | (1,065,400 | ) | | $ | (11,527,599 | ) | | | 3,159,972 | | | $ | 34,221,797 | |
| | | | | | | | | | | | | | | | |
Investor P | | | | | | | | | | | | | | | | |
Shares sold | | | 407,308 | | | $ | 4,312,350 | | | | 723,493 | | | $ | 7,812,713 | |
Shares issued in reinvestment of distributions | | | 12,593 | | | | 133,146 | | | | 11,221 | | | | 121,713 | |
Shares redeemed | | | (259,620 | ) | | | (2,748,562 | ) | | | (348,725 | ) | | | (3,775,009 | ) |
| | | | | | | | | | | | | | | | |
| | | | |
| | | 160,281 | | | $ | 1,696,934 | | | | 385,989 | | | $ | 4,159,417 | |
| | | | | | | | | | | | | | | | |
Class K | | | | | | | | | | | | | | | | |
Shares sold | | | 84,630,081 | | | $ | 897,544,385 | | | | 102,397,157 | | | $ | 1,106,754,143 | |
Shares issued in reinvestment of distributions | | | 3,821,704 | | | | 40,454,247 | | | | 4,617,118 | | | | 50,053,706 | |
Shares redeemed | | | (95,183,822 | ) | | | (1,007,184,324 | ) | | | (74,690,360 | ) | | | (805,107,116 | ) |
| | | | | | | | | | | | | | | | |
| | | | |
| | | (6,732,037 | ) | | $ | (69,185,692 | ) | | | 32,323,915 | | | $ | 351,700,733 | |
| | | | | | | | | | | | | | | | |
| | | | |
| | | (1,736,416 | ) | | $ | (16,506,421 | ) | | | 51,873,772 | | | $ | 565,686,648 | |
| | | | | | | | | | | | | | | | |
As of December 31, 2021, BlackRock Financial Management, Inc., an affiliate of the Fund, owned 20,346 Investor P Shares of the Fund.
Management has evaluated the impact of all subsequent events on the Fund through the date the financial statements were issued and has determined that there were no subsequent events requiring adjustment or additional disclosure in the financial statements.
| | |
FUND NOTES TO FINANCIAL STATEMENTS | | 17 |
Report of Independent Registered Public Accounting Firm
To the Board of Trustees of BlackRock Funds III and Shareholders of iShares U.S. Aggregate Bond Index Fund
Opinion on the Financial Statements
We have audited the accompanying statement of assets and liabilities of iShares U.S. Aggregate Bond Index Fund (one of the series constituting BlackRock Funds III, referred to hereafter as the “Fund”) as of December 31, 2021, the related statement of operations for the year ended December 31, 2021, the statements of changes in net assets for each of the two years in the period ended December 31, 2021, including the related notes, and the financial highlights for each of the periods indicated therein (collectively referred to as the “financial statements”). In our opinion, the financial statements present fairly, in all material respects, the financial position of the Fund as of December 31, 2021, the results of its operations for the year then ended, the changes in its net assets for each of the two years in the period ended December 31, 2021 and the financial highlights for each of the periods indicated therein in conformity with accounting principles generally accepted in the United States of America.
Basis for Opinion
These financial statements are the responsibility of the Fund’s management. Our responsibility is to express an opinion on the Fund’s financial statements based on our audits. We are a public accounting firm registered with the Public Company Accounting Oversight Board (United States) (PCAOB) and are required to be independent with respect to the Fund in accordance with the U.S. federal securities laws and the applicable rules and regulations of the Securities and Exchange Commission and the PCAOB.
We conducted our audits of these financial statements in accordance with the standards of the PCAOB. Those standards require that we plan and perform the audit to obtain reasonable assurance about whether the financial statements are free of material misstatement, whether due to error or fraud.
Our audits included performing procedures to assess the risks of material misstatement of the financial statements, whether due to error or fraud, and performing procedures that respond to those risks. Such procedures included examining, on a test basis, evidence regarding the amounts and disclosures in the financial statements. Our audits also included evaluating the accounting principles used and significant estimates made by management, as well as evaluating the overall presentation of the financial statements. Our procedures included confirmation of securities owned as of December 31, 2021 by correspondence with the administrator of the Master Portfolio. We believe that our audits provide a reasonable basis for our opinion.
/s/PricewaterhouseCoopers LLP
Philadelphia, Pennsylvania
February 24, 2022
We have served as the auditor of one or more BlackRock investment companies since 2000.
| | |
| 18 | | 2 0 2 1 BLACK ROCK ANNUAL REPORT TO SHAREHOLDERS |
Important Tax Information (unaudited)
The Fund hereby designates the following amount, or maximum amount allowable by law, as capital gain dividends, subject to a long-term capital gains tax rate of not greater than 20%, for the fiscal year ended December 31, 2021:
| | | | |
| |
| |
| Fund Name | | 20% Rate Long-Term
Capital Gain Dividends | |
| |
| |
iShares U.S. Aggregate Bond Index Fund | | $ | 28,801 | |
| |
The Fund hereby designates the following amount, or maximum amount allowable by law, of distributions from direct federal obligation interest for the fiscal year ended December 31, 2021:
| | | | |
| |
| |
| Fund Name | | Federal Obligation
Interest | |
| |
| |
iShares U.S. Aggregate Bond Index Fund | | $ | 4,316,112 | |
| |
The law varies in each state as to whether and what percent of ordinary income dividends attributable to federal obligations is exempt from state income tax. Shareholders are advised to check with their tax advisers to determine if any portion of the dividends received is exempt from state income tax.
The Fund hereby designate the following amounts, or maximum amounts allowable by law, as interest income eligible to be treated as a Section 163(j) interest dividend for the fiscal year ended December 31, 2021:
| | | | |
| |
| |
| Fund Name | | Interest Dividend | |
| |
| |
iShares U.S. Aggregate Bond Index Fund | | $ | 51,399,169 | |
| |
The Fund hereby designates the following amount, or maximum amount allowable by law, as interest-related dividends eligible for exemption from U.S. withholding tax for nonresident aliens and foreign corporations for the fiscal year ended December 31, 2021:
| | | | |
| |
| |
| Fund Name | | Interest
Related
Dividends | |
| |
| |
iShares U.S. Aggregate Bond Index Fund | | $ | 46,867,743 | |
| |
| | |
IMPORTANT TAX INFORMATION | | 19 |
| | |
| Master Portfolio Information as of December 31, 2021 | | U.S. Total Bond Index Master Portfolio |
PORTFOLIO ALLOCATION
| | | | |
| | |
| Asset Type(a) | | Percent of
Total Investments | |
| |
U.S. Treasury Obligations | | | 40 | % |
U.S. Government Sponsored Agency Securities | | | 30 | |
Corporate Bonds | | | 25 | |
Foreign Agency Obligations | | | 3 | |
Non-Agency Mortgage-Backed Securities | | | 1 | |
Municipal Bonds | | | 1 | |
Other* | | | — | (b) |
CREDIT QUALITY ALLOCATION
| | | | |
| | |
| Credit Rating(a)(c) | | Percent of
Total Investments | |
| |
AAA/Aaa(d) | | | 74 | % |
AA/Aa | | | 3 | |
A | | | 11 | |
BBB/Baa | | | 12 | |
N/R | | | — | (b) |
| (a) | Excludes short-term securities. |
| (b) | Rounds to less than 1% of total investments. |
| (c) | For financial reporting purposes, credit quality ratings shown above reflect the highest rating assigned by either S&P Global Ratings or Moody’s Investors Service, Inc. if ratings differ. These rating agencies are independent, nationally recognized statistical rating organizations and are widely used. Investment grade ratings are credit ratings of BBB/Baa or higher. Below investment grade ratings are credit ratings of BB/Ba or lower. Investments designated N/R are not rated by either rating agency. Unrated investments do not necessarily indicate low credit quality. Credit quality ratings are subject to change. |
| (d) | The investment adviser evaluates the credit quality of not-rated investments based upon certain factors including, but not limited to, credit ratings for similar investments and financial analysis of sectors, individual investments and/or issuer. Using this approach, the investment adviser has deemed U.S. Government Sponsored Agency Securities and U.S. Treasury Obligations as AAA/Aaa. |
| * | Includes one or more investment categories that individually represents less than 1% of the Master Portfolio’s total investments. Please refer to the Schedule of Investments for details. |
| | |
| 20 | | 2 0 2 1 BLACK ROCK ANNUAL REPORT TO SHAREHOLDERS |
| | |
Schedule of Investments December 31, 2021 | | U.S. Total Bond Index Master Portfolio (Percentages shown are based on Net Assets) |
| | | | | | | | |
| Security | | Par
(000) | | | Value | |
| | |
Asset-Backed Securities | | | | | | | | |
Americredit Automobile Receivables Trust | | | | | | | | |
0.37%, 08/18/25 | | $ | 1,520 | | | $ | 1,514,968 | |
Series 2018-1, Class D, 3.82%, 03/18/24 | | | 4,000 | | | | 4,092,475 | |
BA Credit Card Trust, 0.44%, 09/15/26 | | | 5,020 | | | | 4,946,855 | |
Carmax Auto Owner Trust | | | | | | | | |
Series 2021-1, Class A3, 0.34%, 12/15/25 | | | 2,250 | | | | 2,230,157 | |
Series 2021-1, Class A4, 0.53%, 10/15/26 | | | 1,030 | | | | 1,011,477 | |
GM Financial Consumer Automobile Receivables Trust | | | | | | | | |
Series 2020-2, Class A3, 1.49%, 12/16/24 | | | 23 | | | | 22,805 | |
Series 2020-2, Class A4, 1.74%, 08/18/25 | | | 2,365 | | | | 2,395,600 | |
Series 2020-3, Class A3, 0.45%, 04/16/25 | | | 1,110 | | | | 1,107,896 | |
Honda Auto Receivables Owner Trust, Series 2020-2, Class A4, 1.09%, 10/15/26 | | | 5,000 | | | | 5,010,864 | |
Nissan Auto Lease Trust, Series 2020-A, Class A4, 1.88%, 04/15/25 | | | 930 | | | | 936,307 | |
Nissan Auto Receivables Owner Trust, Series 2019-B, Class A4, 2.54%, 12/15/25 | | | 6,000 | | | | 6,127,262 | |
Santander Drive Auto Receivables Trust, Series 2020-1, Class C, 4.11%, 12/15/25 | | | 51 | | | | 52,487 | |
Synchrony Credit Card Master Note Trust, Series 2018-2, Class A, 3.47%, 05/15/26 | | | 3,415 | | | | 3,538,004 | |
Toyota Auto Receivables Owner Trust | | | | | | | | |
Series 2021-B, Class A3, 0.26%, 11/17/25 | | | 3,750 | | | | 3,713,751 | |
Series 2021-B, Class A4, 0.53%, 10/15/26 | | | 2,500 | | | | 2,448,528 | |
Verizon Master Trust, 0.50%, 05/20/27 | | | 2,870 | | | | 2,832,754 | |
| | | | | | | | |
| | |
Total Asset-Backed Securities — 0.3%
(Cost: $42,019,020) | | | | | | | 41,982,190 | |
| | | | | | | | |
| | |
Corporate Bonds | | | | | | | | |
| | |
Advertising Agencies — 0.0% | | | | | | | | |
Interpublic Group of Cos., Inc. | | | | | | | | |
4.20%, 04/15/24(a) | | | 125 | | | | 133,387 | |
4.75%, 03/30/30 | | | 1,000 | | | | 1,161,218 | |
2.40%, 03/01/31(a) | | | 1,010 | | | | 1,007,272 | |
3.38%, 03/01/41 | | | 1,400 | | | | 1,441,411 | |
Omnicom Group, Inc. | | | | | | | | |
2.45%, 04/30/30 | | | 700 | | | | 699,230 | |
2.60%, 08/01/31(a) | | | 385 | | | | 390,131 | |
Omnicom Group, Inc./Omnicom Capital, Inc. | | | | | | | | |
3.65%, 11/01/24 | | | 70 | | | | 74,194 | |
3.60%, 04/15/26(a) | | | 500 | | | | 536,059 | |
| | | | | | | | |
| | |
| | | | | | | 5,442,902 | |
| | |
| Aerospace & Defense — 0.7% | | | | | | |
3M Co. | | | | | | | | |
1.75%, 02/14/23 | | | 1,500 | | | | 1,516,618 | |
2.00%, 02/14/25(a) | | | 1,000 | | | | 1,022,981 | |
3.00%, 08/07/25 | | | 250 | | | | 264,646 | |
2.88%, 10/15/27(a) | | | 750 | | | | 798,197 | |
2.38%, 08/26/29 | | | 985 | | | | 1,010,417 | |
3.13%, 09/19/46 | | | 250 | | | | 263,015 | |
3.63%, 10/15/47 | | | 600 | | | | 682,101 | |
4.00%, 09/14/48(a) | | | 1,000 | | | | 1,201,403 | |
3.25%, 08/26/49(a) | | | 430 | | | | 468,281 | |
3.70%, 04/15/50(a) | | | 500 | | | | 586,047 | |
Boeing Co. | | | | | | | | |
1.17%, 02/04/23 | | | 1,505 | | | | 1,505,154 | |
2.80%, 03/01/23 | | | 2,000 | | | | 2,035,450 | |
4.51%, 05/01/23 | | | 2,000 | | | | 2,088,929 | |
| | | | | | | | |
| Security | | Par
(000) | | | Value | |
| | |
Aerospace & Defense (continued) | | | | | | | | |
Boeing Co. (continued) | | | | | | | | |
1.88%, 06/15/23(a) | | $ | 500 | | | $ | 504,026 | |
1.43%, 02/04/24 | | | 2,500 | | | | 2,496,182 | |
4.88%, 05/01/25 | | | 2,000 | | | | 2,188,141 | |
2.75%, 02/01/26 | | | 1,000 | | | | 1,028,579 | |
2.20%, 02/04/26 | | | 2,500 | | | | 2,499,404 | |
3.10%, 05/01/26 | | | 1,000 | | | | 1,041,972 | |
2.70%, 02/01/27 | | | 230 | | | | 233,862 | |
2.80%, 03/01/27 | | | 1,000 | | | | 1,020,387 | |
5.04%, 05/01/27 | | | 2,000 | | | | 2,251,989 | |
3.20%, 03/01/29(a) | | | 1,000 | | | | 1,029,183 | |
2.95%, 02/01/30(a) | | | 570 | | | | 580,730 | |
5.15%, 05/01/30(a) | | | 3,000 | | | | 3,495,303 | |
3.63%, 02/01/31(a) | | | 2,000 | | | | 2,132,770 | |
6.13%, 02/15/33(a) | | | 100 | | | | 126,389 | |
3.25%, 02/01/35(a) | | | 1,600 | | | | 1,612,232 | |
5.71%, 05/01/40 | | | 2,000 | | | | 2,568,815 | |
3.38%, 06/15/46(a) | | | 250 | | | | 239,568 | |
3.85%, 11/01/48 | | | 1,000 | | | | 1,037,887 | |
3.90%, 05/01/49 | | | 750 | | | | 786,323 | |
3.75%, 02/01/50(a) | | | 540 | | | | 561,242 | |
5.81%, 05/01/50 | | | 3,300 | | | | 4,468,615 | |
3.95%, 08/01/59 | | | 500 | | | | 519,354 | |
5.93%, 05/01/60 | | | 2,500 | | | | 3,469,210 | |
Carlisle Cos., Inc., 2.75%, 03/01/30 | | | 1,100 | | | | 1,120,927 | |
Eaton Corp. | | | | | | | | |
3.10%, 09/15/27 | | | 690 | | | | 734,075 | |
4.00%, 11/02/32 | | | 2,200 | | | | 2,527,837 | |
4.15%, 11/02/42 | | | 250 | | | | 292,240 | |
General Dynamics Corp. | | | | | | | | |
3.38%, 05/15/23 | | | 2,000 | | | | 2,066,557 | |
3.25%, 04/01/25 | | | 500 | | | | 528,490 | |
3.50%, 05/15/25 | | | 1,000 | | | | 1,066,068 | |
1.15%, 06/01/26 | | | 440 | | | | 435,928 | |
2.13%, 08/15/26(a) | | | 500 | | | | 514,473 | |
3.75%, 05/15/28 | | | 500 | | | | 552,349 | |
2.25%, 06/01/31 | | | 340 | | | | 345,767 | |
4.25%, 04/01/40 | | | 1,000 | | | | 1,221,069 | |
2.85%, 06/01/41 | | | 480 | | | | 493,728 | |
4.25%, 04/01/50 | | | 500 | | | | 637,614 | |
General Electric Co., Series A, 6.75%, 03/15/32 | | | 1,290 | | | | 1,759,243 | |
Illinois Tool Works, Inc. | | | | | | | | |
2.65%, 11/15/26 | | | 3,000 | | | | 3,145,974 | |
4.88%, 09/15/41(a) | | | 50 | | | | 65,970 | |
3.90%, 09/01/42 | | | 75 | | | | 87,119 | |
L3Harris Technologies, Inc. | | | | | | | | |
3.85%, 06/15/23(a) | | | 1,500 | | | | 1,558,004 | |
3.83%, 04/27/25 | | | 500 | | | | 533,054 | |
4.40%, 06/15/28 | | | 1,250 | | | | 1,403,018 | |
2.90%, 12/15/29 | | | 700 | | | | 721,744 | |
1.80%, 01/15/31 | | | 920 | | | | 878,072 | |
4.85%, 04/27/35 | | | 1,065 | | | | 1,298,473 | |
Lockheed Martin Corp. | | | | | | | | |
3.55%, 01/15/26 | | | 2,250 | | | | 2,435,617 | |
3.60%, 03/01/35 | | | 65 | | | | 72,653 | |
4.07%, 12/15/42 | | | 1,100 | | | | 1,294,806 | |
3.80%, 03/01/45 | | | 1,500 | | | | 1,714,664 | |
4.70%, 05/15/46 | | | 750 | | | | 979,626 | |
2.80%, 06/15/50 | | | 500 | | | | 498,351 | |
4.09%, 09/15/52 | | | 500 | | | | 617,758 | |
| | |
MASTER PORTFOLIO SCHEDULE OF INVESTMENTS | | 21 |
| | |
Schedule of Investments (continued) December 31, 2021 | | U.S. Total Bond Index Master Portfolio (Percentages shown are based on Net Assets) |
| | | | | | | | |
| Security | | Par
(000) | | | Value | |
| | |
Aerospace & Defense (continued) | | | | | | | | |
Northrop Grumman Corp. | | | | | | | | |
3.25%, 08/01/23 | | $ | 500 | | | $ | 517,168 | |
2.93%, 01/15/25 | | | 1,000 | | | | 1,041,694 | |
3.25%, 01/15/28 | | | 2,000 | | | | 2,140,436 | |
4.40%, 05/01/30(a) | | | 1,000 | | | | 1,153,794 | |
4.75%, 06/01/43 | | | 875 | | | | 1,100,625 | |
4.03%, 10/15/47(a) | | | 1,500 | | | | 1,768,823 | |
5.25%, 05/01/50(a) | | | 1,000 | | | | 1,400,638 | |
Parker-Hannifin Corp. | | | | | | | | |
3.25%, 06/14/29 | | | 2,000 | | | | 2,119,556 | |
4.20%, 11/21/34 | | | 250 | | | | 284,775 | |
4.10%, 03/01/47 | | | 500 | | | | 580,800 | |
4.00%, 06/14/49 | | | 500 | | | | 584,407 | |
Raytheon Technologies Corp. | | | | | | | | |
3.70%, 12/15/23 | | | 3,000 | | | | 3,143,494 | |
3.95%, 08/16/25 | | | 1,000 | | | | 1,084,321 | |
3.50%, 03/15/27 | | | 1,000 | | | | 1,071,144 | |
3.13%, 05/04/27 | | | 1,000 | | | | 1,061,721 | |
4.13%, 11/16/28 | | | 3,000 | | | | 3,355,628 | |
2.25%, 07/01/30 | | | 2,615 | | | | 2,607,568 | |
1.90%, 09/01/31 | | | 1,000 | | | | 964,859 | |
2.38%, 03/15/32 | | | 1,755 | | | | 1,753,094 | |
4.45%, 11/16/38 | | | 500 | | | | 602,599 | |
4.88%, 10/15/40 | | | 250 | | | | 315,659 | |
4.70%, 12/15/41 | | | 100 | | | | 123,176 | |
4.50%, 06/01/42 | | | 2,200 | | | | 2,719,683 | |
4.15%, 05/15/45 | | | 500 | | | | 582,697 | |
3.75%, 11/01/46 | | | 750 | | | | 835,513 | |
4.35%, 04/15/47 | | | 1,000 | | | | 1,215,075 | |
4.05%, 05/04/47 | | | 500 | | | | 578,589 | |
4.63%, 11/16/48 | | | 1,250 | | | | 1,601,275 | |
3.13%, 07/01/50 | | | 1,330 | | | | 1,358,287 | |
2.82%, 09/01/51 | | | 500 | | | | 482,762 | |
3.03%, 03/15/52 | | | 1,810 | | | | 1,818,702 | |
Teledyne Technologies, Inc., 2.75%, 04/01/31 | | | 1,000 | | | | 1,014,083 | |
Textron, Inc. | | | | | | | | |
3.00%, 06/01/30 | | | 1,000 | | | | 1,031,942 | |
2.45%, 03/15/31(a) | | | 1,300 | | | | 1,277,500 | |
Trane Technologies Global Holding Co. Ltd., 4.30%, 02/21/48 | | | 500 | | | | 609,275 | |
Trane Technologies Luxembourg Finance SA | | | | | | | | |
3.55%, 11/01/24 | | | 500 | | | | 528,488 | |
4.65%, 11/01/44 | | | 30 | | | | 37,042 | |
4.50%, 03/21/49 | | | 500 | | | | 618,598 | |
| | | | | | | | |
| | |
| | | | | | | 126,022,160 | |
| | |
Air Freight & Logistics — 0.0% | | | | | | | | |
JB Hunt Transport Services, Inc., 3.88%, 03/01/26 | | | 1,000 | | | | 1,087,047 | |
| | | | | | | | |
| | |
Airlines — 0.1% | | | | | | | | |
American Airlines Pass-Through Trust | | | | | | | | |
2.88%, 01/11/36 | | | 1,000 | | | | 990,480 | |
Series 2016-2, Class AA, 3.20%, 12/15/29 | | | 382 | | | | 384,200 | |
Series 2019-1, Class AA, 3.15%, 08/15/33(a) | | | 919 | | | | 927,652 | |
Continental Airlines Pass-Through Trust | | | | | | | | |
Series 2012-1, Class A, 4.15%, 10/11/25 | | | 29 | | | | 30,148 | |
Series 2012-2, Class A, 4.00%, 04/29/26 | | | 301 | | | | 311,571 | |
JetBlue Pass Through Trust, Series AA, Class AA, 2.75%, 11/15/33(a) | | | 860 | | | | 865,645 | |
Southwest Airlines Co. 4.75%, 05/04/23 | | | 1,255 | | | | 1,314,290 | |
| | | | | | | | |
| Security | | Par
(000) | | | Value | |
| | |
Airlines (continued) | | | | | | | | |
Southwest Airlines Co. (continued) | | | | | | | | |
5.25%, 05/04/25(a) | | $ | 1,560 | | | $ | 1,732,666 | |
5.13%, 06/15/27 | | | 1,240 | | | | 1,417,596 | |
2.63%, 02/10/30 | | | 2,000 | | | | 1,997,039 | |
United Airlines Pass-Through Trust | | | | | | | | |
Series 2020-1, Class A, 5.88%, 10/15/27(a) | | | 1,621 | | | | 1,776,063 | |
Series A, Class A, 4.30%, 02/15/27 | | | 131 | | | | 136,509 | |
Series AA, Class AA, 3.10%, 01/07/30 | | | 394 | | | | 405,835 | |
Series AA, Class AA, 2.70%, 11/01/33 | | | 1,263 | | | | 1,252,005 | |
| | | | | | | | |
| | |
| | | | | | | 13,541,699 | |
| | |
| Auto Components — 0.0% | | | | | | |
Aptiv PLC | | | | | | | | |
4.40%, 10/01/46 | | | 500 | | | | 577,219 | |
3.10%, 12/01/51 | | | 2,000 | | | | 1,905,065 | |
BorgWarner, Inc. | | | | | | | | |
3.38%, 03/15/25 | | | 70 | | | | 73,743 | |
2.65%, 07/01/27(a) | | | 905 | | | | 934,976 | |
Lear Corp. | | | | | | | | |
4.25%, 05/15/29 | | | 1,000 | | | | 1,101,494 | |
2.60%, 01/15/32 | | | 400 | | | | 393,932 | |
5.25%, 05/15/49(a) | | | 500 | | | | 631,259 | |
3.55%, 01/15/52 | | | 210 | | | | 207,763 | |
Magna International, Inc., 2.45%, 06/15/30 | | | 115 | | | | 116,684 | |
| | | | | | | | |
| | |
| | | | | | | 5,942,135 | |
| | |
| Automobiles — 0.4% | | | | | | |
American Honda Finance Corp. | | | | | | | | |
2.05%, 01/10/23 | | | 895 | | | | 908,206 | |
1.95%, 05/10/23 | | | 685 | | | | 695,814 | |
0.88%, 07/07/23 | | | 2,000 | | | | 2,000,674 | |
3.63%, 10/10/23(a) | | | 2,000 | | | | 2,096,630 | |
2.40%, 06/27/24 | | | 1,000 | | | | 1,029,990 | |
0.75%, 08/09/24 | | | 100 | | | | 98,872 | |
2.15%, 09/10/24 | | | 1,000 | | | | 1,024,654 | |
1.30%, 09/09/26(a) | | | 400 | | | | 395,087 | |
2.35%, 01/08/27 | | | 500 | | | | 514,014 | |
2.00%, 03/24/28 | | | 540 | | | | 545,332 | |
AutoNation, Inc. | | | | | | | | |
1.95%, 08/01/28 | | | 210 | | | | 205,340 | |
4.75%, 06/01/30 | | | 1,000 | | | | 1,142,292 | |
2.40%, 08/01/31 | | | 440 | | | | 424,386 | |
Cummins, Inc. | | | | | | | | |
3.65%, 10/01/23 | | | 250 | | | | 260,284 | |
0.75%, 09/01/25 | | | 500 | | | | 490,280 | |
2.60%, 09/01/50 | | | 500 | | | | 460,637 | |
Daimler Finance North America LLC, 8.50%, 01/18/31 | | | 600 | | | | 892,182 | |
General Motors Co. | | | | | | | | |
4.88%, 10/02/23 | | | 600 | | | | 637,375 | |
5.40%, 10/02/23 | | | 180 | | | | 192,665 | |
4.00%, 04/01/25 | | | 2,000 | | | | 2,139,106 | |
6.13%, 10/01/25 | | | 1,335 | | | | 1,533,553 | |
4.20%, 10/01/27(a) | | | 1,000 | | | | 1,094,329 | |
6.80%, 10/01/27 | | | 600 | | | | 736,458 | |
5.00%, 04/01/35 | | | 750 | | | | 885,128 | |
6.60%, 04/01/36 | | | 250 | | | | 338,137 | |
5.15%, 04/01/38 | | | 500 | | | | 602,621 | |
6.25%, 10/02/43 | | | 250 | | | | 342,110 | |
5.20%, 04/01/45(a) | | | 1,000 | | | | 1,237,253 | |
6.75%, 04/01/46 | | | 775 | | | | 1,107,388 | |
5.40%, 04/01/48 | | | 500 | | | | 637,885 | |
| | |
| 22 | | 2 0 2 1 BLACK ROCK ANNUAL REPORT TO SHAREHOLDERS |
| | |
Schedule of Investments (continued) December 31, 2021 | | U.S. Total Bond Index Master Portfolio (Percentages shown are based on Net Assets) |
| | | | | | | | |
| Security | | Par
(000) | | | Value | |
| | |
Automobiles (continued) | | | | | | | | |
General Motors Co. (continued) | | | | | | | | |
5.95%, 04/01/49 | | $ | 1,000 | | | $ | 1,368,779 | |
General Motors Financial Co., Inc. | | | | | | | | |
3.25%, 01/05/23 | | | 3,000 | | | | 3,064,898 | |
5.10%, 01/17/24 | | | 1,000 | | | | 1,072,241 | |
1.05%, 03/08/24 | | | 400 | | | | 397,887 | |
3.95%, 04/13/24 | | | 1,000 | | | | 1,052,232 | |
1.20%, 10/15/24 | | | 605 | | | | 600,551 | |
4.00%, 01/15/25 | | | 250 | | | | 265,578 | |
2.90%, 02/26/25(a) | | | 660 | | | | 682,369 | |
2.75%, 06/20/25(a) | | | 980 | | | | 1,011,239 | |
4.30%, 07/13/25 | | | 1,000 | | | | 1,077,945 | |
5.25%, 03/01/26 | | | 405 | | | | 454,164 | |
1.50%, 06/10/26 | | | 1,000 | | | | 983,910 | |
4.35%, 01/17/27 | | | 500 | | | | 550,801 | |
2.70%, 08/20/27(a) | | | 1,000 | | | | 1,017,166 | |
2.40%, 04/10/28 | | | 505 | | | | 507,082 | |
2.40%, 10/15/28 | | | 970 | | | | 967,297 | |
5.65%, 01/17/29 | | | 250 | | | | 296,467 | |
3.60%, 06/21/30 | | | 2,060 | | | | 2,196,949 | |
2.70%, 06/10/31 | | | 710 | | | | 707,468 | |
PACCAR Financial Corp. | | | | | | | | |
0.50%, 08/09/24(a) | | | 405 | | | | 397,951 | |
1.10%, 05/11/26 | | | 640 | | | | 629,965 | |
Stellantis NV, 5.25%, 04/15/23 | | | 4,000 | | | | 4,195,400 | |
Toyota Motor Corp. | | | | | | | | |
0.68%, 03/25/24(a) | | | 500 | | | | 497,007 | |
2.36%, 07/02/24 | | | 500 | | | | 515,213 | |
1.34%, 03/25/26 | | | 500 | | | | 497,720 | |
2.76%, 07/02/29 | | | 185 | | | | 194,459 | |
2.36%, 03/25/31(a) | | | 500 | | | | 515,185 | |
Toyota Motor Credit Corp. | | | | | | | | |
2.63%, 01/10/23 | | | 2,000 | | | | 2,040,585 | |
0.50%, 08/14/23 | | | 4,000 | | | | 3,985,252 | |
0.50%, 06/18/24 | | | 1,000 | | | | 985,216 | |
0.63%, 09/13/24(a) | | | 900 | | | | 887,659 | |
2.00%, 10/07/24 | | | 3,000 | | | | 3,070,151 | |
1.13%, 06/18/26 | | | 2,400 | | | | 2,363,611 | |
1.90%, 04/06/28(a) | | | 1,100 | | | | 1,102,260 | |
3.65%, 01/08/29 | | | 1,000 | | | | 1,112,035 | |
2.15%, 02/13/30 | | | 500 | | | | 501,041 | |
3.38%, 04/01/30(a) | | | 1,000 | | | | 1,095,860 | |
1.90%, 09/12/31 | | | 700 | | | | 685,510 | |
| | | | | | | | |
| | |
| | | | | | | 68,215,785 | |
| | |
| Banks — 1.4% | | | | | | |
Banco Bilbao Vizcaya Argentaria SA | | | | | | | | |
0.88%, 09/18/23 | | | 1,400 | | | | 1,394,368 | |
1.13%, 09/18/25 | | | 1,200 | | | | 1,175,336 | |
Bank of Montreal | | | | | | | | |
2.50%, 06/28/24 | | | 1,000 | | | | 1,031,241 | |
0.63%, 07/09/24 | | | 1,000 | | | | 986,367 | |
1.25%, 09/15/26(a) | | | 2,000 | | | | 1,957,231 | |
(5 year USD Swap + 1.43%), 3.80%, 12/15/32(b) | | | 500 | | | | 536,298 | |
Series E, 3.30%, 02/05/24 | | | 4,000 | | | | 4,185,211 | |
BBVA USA, 2.50%, 08/27/24 | | | 1,000 | | | | 1,032,517 | |
BPCE SA, 4.00%, 04/15/24(a) | | | 250 | | | | 266,112 | |
Canadian Imperial Bank of Commerce | | | | | | | | |
3.50%, 09/13/23 | | | 2,000 | | | | 2,090,734 | |
0.50%, 12/14/23 | | | 800 | | | | 790,125 | |
| | | | | | | | |
| Security | | Par
(000) | | | Value | |
| | |
Banks (continued) | | | | | | | | |
Canadian Imperial Bank of Commerce (continued) | | | | | | | | |
1.00%, 10/18/24 | | $ | 1,000 | | | $ | 991,152 | |
0.95%, 10/23/25 | | | 720 | | | | 704,876 | |
1.25%, 06/22/26 | | | 2,000 | | | | 1,949,267 | |
Citibank NA, 3.65%, 01/23/24 | | | 2,500 | | | | 2,629,691 | |
Citizens Financial Group, Inc. | | | | | | | | |
2.85%, 07/27/26 | | | 1,500 | | | | 1,562,546 | |
2.50%, 02/06/30 | | | 340 | | | | 340,922 | |
Comerica, Inc. | | | | | | | | |
3.70%, 07/31/23 | | | 250 | | | | 260,158 | |
4.00%, 02/01/29 | | | 1,000 | | | | 1,117,507 | |
Cooperatieve Rabobank UA | | | | | | | | |
2.75%, 01/10/23 | | | 2,000 | | | | 2,042,060 | |
3.38%, 05/21/25 | | | 500 | | | | 533,076 | |
4.38%, 08/04/25 | | | 500 | | | | 541,646 | |
3.75%, 07/21/26 | | | 2,500 | | | | 2,692,316 | |
5.25%, 05/24/41 | | | 1,025 | | | | 1,437,157 | |
5.25%, 08/04/45 | | | 1,250 | | | | 1,643,806 | |
Credit Suisse AG, 1.25%, 08/07/26 | | | 935 | | | | 911,469 | |
Credit Suisse AG, New York | | | | | | | | |
1.00%, 05/05/23 | | | 1,690 | | | | 1,694,425 | |
3.63%, 09/09/24 | | | 750 | | | | 795,264 | |
2.95%, 04/09/25 | | | 1,000 | | | | 1,046,734 | |
Discover Bank | | | | | | | | |
3.35%, 02/06/23 | | | 500 | | | | 511,960 | |
4.20%, 08/08/23 | | | 2,000 | | | | 2,100,325 | |
2.45%, 09/12/24 | | | 600 | | | | 614,141 | |
2.70%, 02/06/30 | | | 535 | | | | 541,769 | |
(5 year USD Swap + 1.73%), 4.68%, 08/09/28(b) | | | 1,000 | | | | 1,045,126 | |
Fifth Third Bancorp | | | | | | | | |
1.63%, 05/05/23 | | | 2,000 | | | | 2,019,398 | |
4.30%, 01/16/24 | | | 250 | | | | 264,358 | |
3.65%, 01/25/24 | | | 1,000 | | | | 1,047,606 | |
2.55%, 05/05/27 | | | 2,000 | | | | 2,062,919 | |
8.25%, 03/01/38 | | | 425 | | | | 696,990 | |
(SOFR + 0.69%), 1.71%, 11/01/27(b) | | | 1,000 | | | | 987,695 | |
Fifth Third Bank | | | | | | | | |
1.80%, 01/30/23 | | | 250 | | | | 252,535 | |
3.95%, 07/28/25 | | | 500 | | | | 543,823 | |
3.85%, 03/15/26 | | | 500 | | | | 539,268 | |
2.25%, 02/01/27(a) | | | 590 | | | | 603,484 | |
First Republic Bank, 4.63%, 02/13/47 | | | 500 | | | | 619,337 | |
HSBC Bank USA NA, 7.00%, 01/15/39 | | | 1,000 | | | | 1,552,593 | |
Huntington Bancshares, Inc. | | | | | | | | |
2.63%, 08/06/24 | | | 775 | | | | 798,051 | |
4.00%, 05/15/25 | | | 1,000 | | | | 1,075,546 | |
2.55%, 02/04/30(a) | | | 800 | | | | 812,138 | |
(5 year CMT + 1.17%), 2.49%, 08/15/36(b)(c) | | | 1,405 | | | | 1,346,173 | |
Huntington Ingalls Industries, Inc., 2.04%, 08/16/28(c) | | | 400 | | | | 391,583 | |
ING Groep NV | | | | | | | | |
4.10%, 10/02/23 | | | 1,000 | | | | 1,052,605 | |
3.95%, 03/29/27 | | | 250 | | | | 273,252 | |
4.55%, 10/02/28 | | | 1,000 | | | | 1,146,852 | |
4.05%, 04/09/29 | | | 1,000 | | | | 1,116,693 | |
(SOFR + 1.01%), 1.73%, 04/01/27(a)(b) | | | 350 | | | | 347,648 | |
(SOFR + 1.32%), 2.73%, 04/01/32(b) | | | 535 | | | | 546,200 | |
KeyBank NA | | | | | | | | |
3.38%, 03/07/23 | | | 1,250 | | | | 1,288,342 | |
| | |
MASTER PORTFOLIO SCHEDULE OF INVESTMENTS | | 23 |
| | |
Schedule of Investments (continued) December 31, 2021 | | U.S. Total Bond Index Master Portfolio (Percentages shown are based on Net Assets) |
| | | | | | | | |
| Security | | Par
(000) | | | Value | |
| | |
Banks (continued) | | | | | | | | |
KeyBank NA (continued) | | | | | | | | |
3.90%, 04/13/29(a) | | $ | 1,000 | | | $ | 1,104,808 | |
(SOFR + 0.34%), 0.42%, 01/03/24(b) | | | 470 | | | | 468,264 | |
KeyCorp. | | | | | | | | |
2.25%, 04/06/27 | | | 250 | | | | 254,093 | |
2.55%, 10/01/29 | | | 500 | | | | 511,924 | |
M&T Bank Corp., 3.55%, 07/26/23 | | | 2,000 | | | | 2,076,094 | |
National Australia Bank Ltd.(a) | | | | | | | | |
2.88%, 04/12/23 | | | 2,000 | | | | 2,051,670 | |
2.50%, 07/12/26 | | | 1,250 | | | | 1,305,309 | |
National Bank of Canada | | | | | | | | |
2.10%, 02/01/23 | | | 1,000 | | | | 1,013,475 | |
0.75%, 08/06/24 | | | 685 | | | | 675,682 | |
PNC Bank NA | | | | | | | | |
2.95%, 01/30/23 | | | 250 | | | | 255,528 | |
2.95%, 02/23/25 | | | 250 | | | | 261,975 | |
3.88%, 04/10/25 | | | 250 | | | | 268,417 | |
3.10%, 10/25/27(a) | | | 500 | | | | 534,912 | |
4.05%, 07/26/28 | | | 500 | | | | 560,705 | |
PNC Financial Services Group, Inc. | | | | | | | | |
3.50%, 01/23/24 | | | 2,000 | | | | 2,094,172 | |
3.90%, 04/29/24 | | | 2,000 | | | | 2,118,993 | |
2.20%, 11/01/24 | | | 300 | | | | 308,021 | |
1.15%, 08/13/26(a) | | | 1,000 | | | | 985,856 | |
3.45%, 04/23/29 | | | 2,000 | | | | 2,177,688 | |
2.55%, 01/22/30 | | | 1,000 | | | | 1,028,034 | |
(SOFR + 0.98%), 2.31%, 04/23/32(b) | | | 1,000 | | | | 1,007,972 | |
Regions Financial Corp. | | | | | | | | |
2.25%, 05/18/25 | | | 2,000 | | | | 2,039,141 | |
1.80%, 08/12/28 | | | 2,000 | | | | 1,956,449 | |
Royal Bank of Canada | | | | | | | | |
1.95%, 01/17/23 | | | 675 | | | | 684,058 | |
1.60%, 04/17/23 | | | 2,000 | | | | 2,022,442 | |
3.70%, 10/05/23(a) | | | 2,000 | | | | 2,097,844 | |
2.55%, 07/16/24(a) | | | 1,000 | | | | 1,033,150 | |
0.65%, 07/29/24 | | | 2,000 | | | | 1,971,694 | |
0.75%, 10/07/24(a) | | | 2,200 | | | | 2,177,695 | |
2.25%, 11/01/24 | | | 1,500 | | | | 1,539,698 | |
0.88%, 01/20/26 | | | 2,000 | | | | 1,945,950 | |
4.65%, 01/27/26 | | | 700 | | | | 776,279 | |
1.20%, 04/27/26 | | | 4,000 | | | | 3,929,076 | |
1.15%, 07/14/26 | | | 1,000 | | | | 978,138 | |
1.40%, 11/02/26 | | | 2,200 | | | | 2,170,651 | |
2.30%, 11/03/31 | | | 2,000 | | | | 2,009,315 | |
Santander Holdings USA, Inc. | | | | | | | | |
3.40%, 01/18/23 | | | 2,000 | | | | 2,044,061 | |
3.24%, 10/05/26 | | | 2,000 | | | | 2,087,515 | |
Santander UK Group Holdings PLC(b) | | | | | | | | |
(1 year CMT + 1.25%), 1.53%, 08/21/26 | | | 1,000 | | | | 983,652 | |
(3 mo. LIBOR US + 1.08%), 3.37%, 01/05/24 | | | 3,000 | | | | 3,064,997 | |
(3 mo. LIBOR US + 1.40%), 3.82%, 11/03/28 | | | 500 | | | | 536,654 | |
(SOFR + 0.99%), 1.67%, 06/14/27 | | | 1,800 | | | | 1,762,321 | |
SVB Financial Group | | | | | | | | |
1.80%, 10/28/26 | | | 900 | | | | 896,885 | |
1.80%, 02/02/31 | | | 450 | | | | 426,329 | |
Toronto-Dominion Bank | | | | | | | | |
0.75%, 06/12/23 | | | 2,000 | | | | 2,000,090 | |
3.50%, 07/19/23 | | | 500 | | | | 521,022 | |
0.45%, 09/11/23 | | | 3,000 | | | | 2,981,560 | |
0.55%, 03/04/24(a) | | | 1,500 | | | | 1,483,697 | |
2.65%, 06/12/24 | | | 500 | | | | 518,632 | |
| | | | | | | | |
| Security | | Par
(000) | | | Value | |
| | |
Banks (continued) | | | | | | | | |
Toronto-Dominion Bank (continued) | | | | | | | | |
0.70%, 09/10/24(a) | | $ | 1,100 | | | $ | 1,085,692 | |
1.25%, 12/13/24 | | | 1,000 | | | | 1,001,205 | |
0.75%, 01/06/26(a) | | | 1,800 | | | | 1,744,297 | |
1.20%, 06/03/26 | | | 1,800 | | | | 1,768,674 | |
1.25%, 09/10/26 | | | 1,100 | | | | 1,080,703 | |
2.00%, 09/10/31 | | | 1,100 | | | | 1,084,262 | |
(5 year USD Swap + 2.21%), 3.63%, 09/15/31(a)(b) | | | 500 | | | | 537,117 | |
Truist Bank | | | | | | | | |
1.25%, 03/09/23 | | | 3,000 | | | | 3,018,090 | |
2.75%, 05/01/23 | | | 500 | | | | 512,709 | |
2.15%, 12/06/24 | | | 1,000 | | | | 1,030,243 | |
3.80%, 10/30/26 | | | 250 | | | | 272,444 | |
2.25%, 03/11/30(a) | | | 1,000 | | | | 997,394 | |
(3 mo. LIBOR US + 0.74%), 3.69%, 08/02/24(b) | | | 365 | | | | 380,646 | |
(5 year CMT + 1.15%), 2.64%, 09/17/29(b) | | | 1,000 | | | | 1,028,212 | |
Truist Financial Corp. | | | | | | | | |
3.75%, 12/06/23 | | | 2,000 | | | | 2,102,132 | |
2.50%, 08/01/24 | | | 2,000 | | | | 2,064,374 | |
2.85%, 10/26/24(a) | | | 500 | | | | 522,461 | |
1.13%, 08/03/27(a) | | | 900 | | | | 870,796 | |
1.95%, 06/05/30(a) | | | 2,000 | | | | 1,974,878 | |
(SOFR + 0.86%), 1.89%, 06/07/29(b) | | | 1,000 | | | | 984,697 | |
US Bancorp, (5 year CMT + 0.95%),
2.49%, 11/03/36(b) | | | 700 | | | | 697,308 | |
US Bancorp. | | | | | | | | |
2.40%, 07/30/24 | | | 1,000 | | | | 1,033,174 | |
3.90%, 04/26/28 | | | 2,000 | | | | 2,239,245 | |
1.38%, 07/22/30 | | | 2,000 | | | | 1,881,845 | |
Series V, 2.38%, 07/22/26(a) | | | 500 | | | | 519,185 | |
US Bank NA/Cincinnati OH | | | | | | | | |
3.40%, 07/24/23 | | | 3,000 | | | | 3,119,300 | |
2.80%, 01/27/25(a) | | | 500 | | | | 522,254 | |
Wells Fargo & Co. | | | | | | | | |
4.13%, 08/15/23 | | | 1,750 | | | | 1,835,196 | |
4.48%, 01/16/24(a) | | | 250 | | | | 265,492 | |
3.75%, 01/24/24(a) | | | 2,000 | | | | 2,099,916 | |
3.30%, 09/09/24 | | | 750 | | | | 788,763 | |
3.00%, 02/19/25 | | | 350 | | | | 365,401 | |
3.55%, 09/29/25 | | | 1,000 | | | | 1,065,576 | |
3.00%, 04/22/26 | | | 1,750 | | | | 1,838,220 | |
4.10%, 06/03/26 | | | 2,020 | | | | 2,201,705 | |
3.00%, 10/23/26 | | | 1,750 | | | | 1,838,536 | |
4.30%, 07/22/27 | | | 1,500 | | | | 1,671,197 | |
4.15%, 01/24/29 | | | 1,000 | | | | 1,119,407 | |
5.38%, 11/02/43 | | | 900 | | | | 1,189,521 | |
5.61%, 01/15/44 | | | 656 | | | | 887,670 | |
4.65%, 11/04/44 | | | 3,345 | | | | 4,049,622 | |
3.90%, 05/01/45 | | | 1,150 | | | | 1,315,600 | |
4.90%, 11/17/45 | | | 1,500 | | | | 1,886,314 | |
4.40%, 06/14/46 | | | 2,600 | | | | 3,081,391 | |
4.75%, 12/07/46 | | | 1,600 | | | | 1,996,884 | |
(3 mo. LIBOR US + 0.75%), 2.16%, 02/11/26(b) | | | 1,500 | | | | 1,522,385 | |
(3 mo. LIBOR US + 1.17%), 3.20%, 06/17/27(b) | | | 1,335 | | | | 1,407,367 | |
(3 mo. LIBOR US + 1.31%), 3.58%, 05/22/28(b) | | | 1,500 | | | | 1,612,535 | |
(SOFR + 0.51%), 0.81%, 05/19/25(b) | | | 675 | | | | 667,381 | |
| | |
| 24 | | 2 0 2 1 BLACK ROCK ANNUAL REPORT TO SHAREHOLDERS |
| | |
Schedule of Investments (continued) December 31, 2021 | | U.S. Total Bond Index Master Portfolio (Percentages shown are based on Net Assets) |
| | | | | | | | |
| Security | | Par
(000) | | | Value | |
| | |
Banks (continued) | | | | | | | | |
Wells Fargo & Co. (continued) | | | | | | | | |
(SOFR + 1.09%), 2.41%, 10/30/25(b) | | $ | 1,000 | | | $ | 1,024,970 | |
(SOFR + 1.26%), 2.57%, 02/11/31(b) | | | 1,500 | | | | 1,531,292 | |
(SOFR + 1.43%), 2.88%, 10/30/30(b) | | | 2,000 | | | | 2,079,177 | |
(SOFR + 1.60%), 1.65%, 06/02/24(b) | | | 3,000 | | | | 3,025,385 | |
(SOFR + 2.00%), 2.19%, 04/30/26(b) | | | 3,000 | | | | 3,052,988 | |
(SOFR + 2.10%), 2.39%, 06/02/28(b) | | | 900 | | | | 914,696 | |
(SOFR + 2.53%), 3.07%, 04/30/41(b) | | | 2,000 | | | | 2,051,050 | |
(SOFR + 4.03%), 4.48%, 04/04/31(b) | | | 2,000 | | | | 2,323,435 | |
(SOFR + 4.50%), 5.01%, 04/04/51(b) | | | 4,000 | | | | 5,462,136 | |
Series M, 3.45%, 02/13/23 | | | 3,450 | | | | 3,549,579 | |
Wells Fargo Bank NA, 6.60%, 01/15/38 | | | 500 | | | | 725,960 | |
Westpac Banking Corp. | | | | | | | | |
2.75%, 01/11/23 | | | 3,000 | | | | 3,063,870 | |
2.00%, 01/13/23 | | | 1,180 | | | | 1,197,645 | |
1.02%, 11/18/24 | | | 505 | | | | 503,649 | |
2.35%, 02/19/25 | | | 500 | | | | 516,245 | |
2.85%, 05/13/26 | | | 500 | | | | 526,584 | |
1.15%, 06/03/26 | | | 1,000 | | | | 981,848 | |
3.40%, 01/25/28 | | | 500 | | | | 543,194 | |
1.95%, 11/20/28 | | | 1,000 | | | | 995,998 | |
2.65%, 01/16/30 | | | 795 | | | | 826,275 | |
2.15%, 06/03/31 | | | 1,400 | | | | 1,403,775 | |
4.42%, 07/24/39 | | | 1,000 | | | | 1,169,136 | |
2.96%, 11/16/40(a) | | | 2,000 | | | | 1,961,580 | |
3.13%, 11/18/41 | | | 335 | | | | 332,017 | |
(5 year CMT + 1.35%), 2.89%, 02/04/30(b) | | | 1,250 | | | | 1,276,806 | |
(5 year CMT + 1.53%), 3.02%, 11/18/36(b) | | | 455 | | | | 449,588 | |
(5 year CMT + 1.75%), 2.67%, 11/15/35(b) | | | 500 | | | | 487,074 | |
(5 year USD ICE Swap + 2.24%), 4.32%, 11/23/31(a)(b) | | | 750 | | | | 811,095 | |
Zions Bancorp NA, 3.25%, 10/29/29 | | | 1,000 | | | | 1,033,836 | |
| | | | | | | | |
| | |
| | | | | | | 244,840,908 | |
| | |
| Beverages — 0.6% | | | | | | |
Anheuser-Busch Cos. LLC/Anheuser-Busch InBev Worldwide, Inc. | | | | | | | | |
3.65%, 02/01/26 | | | 2,250 | | | | 2,415,722 | |
4.70%, 02/01/36 | | | 3,500 | | | | 4,223,835 | |
4.90%, 02/01/46 | | | 6,370 | | | | 8,051,265 | |
Anheuser-Busch InBev Finance, Inc. | | | | | | | | |
3.65%, 02/01/26 | | | 500 | | | | 536,827 | |
4.00%, 01/17/43(a) | | | 500 | | | | 556,289 | |
4.63%, 02/01/44 | | | 650 | | | | 779,143 | |
4.90%, 02/01/46 | | | 500 | | | | 627,693 | |
Anheuser-Busch InBev Worldwide, Inc. | | | | | | | | |
4.00%, 04/13/28 | | | 1,000 | | | | 1,112,300 | |
4.75%, 01/23/29(a) | | | 3,500 | | | | 4,073,775 | |
3.50%, 06/01/30 | | | 1,000 | | | | 1,096,051 | |
4.38%, 04/15/38 | | | 1,000 | | | | 1,171,056 | |
8.20%, 01/15/39 | | | 1,150 | | | | 1,867,310 | |
5.45%, 01/23/39 | | | 1,000 | | | | 1,308,756 | |
4.35%, 06/01/40 | | | 1,000 | | | | 1,175,318 | |
4.95%, 01/15/42 | | | 500 | | | | 627,154 | |
3.75%, 07/15/42 | | | 300 | | | | 327,003 | |
4.60%, 04/15/48(a) | | | 2,000 | | | | 2,445,679 | |
4.44%, 10/06/48 | | | 632 | | | | 755,380 | |
5.55%, 01/23/49 | | | 3,000 | | | | 4,150,374 | |
4.50%, 06/01/50(a) | | | 2,200 | | | | 2,712,200 | |
4.75%, 04/15/58 | | | 1,500 | | | | 1,854,548 | |
5.80%, 01/23/59 | | | 1,000 | | | | 1,445,847 | |
| | | | | | | | |
| Security | | Par
(000) | | | Value | |
| | |
Beverages (continued) | | | | | | | | |
Anheuser-Busch InBev Worldwide, Inc. (continued) | | | | | | | | |
4.60%, 06/01/60 | | $ | 500 | | | $ | 618,837 | |
Coca-Cola Co. | | | | | | | | |
1.75%, 09/06/24 | | | 3,000 | | | | 3,056,903 | |
2.90%, 05/25/27 | | | 250 | | | | 266,135 | |
1.50%, 03/05/28 | | | 1,000 | | | | 983,484 | |
2.13%, 09/06/29 | | | 1,000 | | | | 1,016,543 | |
3.45%, 03/25/30 | | | 500 | | | | 553,543 | |
2.00%, 03/05/31 | | | 920 | | | | 916,923 | |
2.25%, 01/05/32 | | | 1,700 | | | | 1,727,730 | |
2.88%, 05/05/41 | | | 500 | | | | 520,437 | |
2.60%, 06/01/50 | | | 1,000 | | | | 976,387 | |
3.00%, 03/05/51 | | | 810 | | | | 857,230 | |
2.50%, 03/15/51(a) | | | 3,000 | | | | 2,878,699 | |
2.75%, 06/01/60(a) | | | 600 | | | | 594,274 | |
Coca-Cola Femsa SAB de CV, 2.75%, 01/22/30 | | | 1,000 | | | | 1,021,125 | |
Constellation Brands, Inc. | | | | | | | | |
4.75%, 12/01/25(a) | | | 1,000 | | | | 1,114,453 | |
3.70%, 12/06/26 | | | 750 | | | | 810,158 | |
3.50%, 05/09/27 | | | 1,000 | | | | 1,074,586 | |
3.15%, 08/01/29 | | | 1,000 | | | | 1,054,708 | |
2.88%, 05/01/30 | | | 1,000 | | | | 1,026,248 | |
2.25%, 08/01/31 | | | 2,410 | | | | 2,355,452 | |
4.10%, 02/15/48 | | | 500 | | | | 566,836 | |
3.75%, 05/01/50(a) | | | 500 | | | | 546,122 | |
Diageo Capital PLC | | | | | | | | |
2.63%, 04/29/23 | | | 250 | | | | 255,371 | |
3.50%, 09/18/23 | | | 2,000 | | | | 2,082,443 | |
1.38%, 09/29/25 | | | 500 | | | | 497,232 | |
3.88%, 05/18/28(a) | | | 1,000 | | | | 1,116,550 | |
2.38%, 10/24/29 | | | 830 | | | | 847,633 | |
2.00%, 04/29/30 | | | 1,000 | | | | 989,436 | |
2.13%, 04/29/32 | | | 1,000 | | | | 991,858 | |
3.88%, 04/29/43(a) | | | 1,125 | | | | 1,321,964 | |
Diageo Investment Corp., 4.25%, 05/11/42 | | | 250 | | | | 307,026 | |
Fomento Economico Mexicano SAB de CV | | | | | | | | |
4.38%, 05/10/43 | | | 500 | | | | 590,156 | |
3.50%, 01/16/50 | | | 1,500 | | | | 1,562,813 | |
Keurig Dr. Pepper, Inc. | | | | | | | | |
4.06%, 05/25/23 | | | 1,759 | | | | 1,833,909 | |
0.75%, 03/15/24 | | | 405 | | | | 402,177 | |
4.42%, 05/25/25 | | | 250 | | | | 271,992 | |
4.60%, 05/25/28 | | | 750 | | | | 852,954 | |
3.20%, 05/01/30 | | | 500 | | | | 528,591 | |
2.25%, 03/15/31 | | | 500 | | | | 492,703 | |
4.99%, 05/25/38 | | | 250 | | | | 309,297 | |
4.42%, 12/15/46 | | | 500 | | | | 592,150 | |
5.09%, 05/25/48 | | | 750 | | | | 978,580 | |
3.80%, 05/01/50 | | | 500 | | | | 553,636 | |
3.35%, 03/15/51 | | | 500 | | | | 519,909 | |
Molson Coors Beverage Co. | | | | | | | | |
3.00%, 07/15/26 | | | 2,345 | | | | 2,454,620 | |
5.00%, 05/01/42 | | | 1,750 | | | | 2,114,117 | |
4.20%, 07/15/46(a) | | | 500 | | | | 554,227 | |
PepsiCo, Inc. | | | | | | | | |
2.75%, 03/01/23 | | | 300 | | | | 307,377 | |
0.75%, 05/01/23 | | | 295 | | | | 295,377 | |
0.40%, 10/07/23 | | | 215 | | | | 213,829 | |
3.60%, 03/01/24 | | | 250 | | | | 263,433 | |
2.25%, 03/19/25 | | | 2,400 | | | | 2,479,920 | |
| | |
MASTER PORTFOLIO SCHEDULE OF INVESTMENTS | | 25 |
| | |
Schedule of Investments (continued) December 31, 2021 | | U.S. Total Bond Index Master Portfolio (Percentages shown are based on Net Assets) |
| | | | | | | | |
| Security | | Par
(000) | | | Value | |
| | |
Beverages (continued) | | | | | | | | |
PepsiCo, Inc. (continued) | | | | | | | | |
2.75%, 04/30/25(a) | | $ | 1,000 | | | $ | 1,046,378 | |
3.50%, 07/17/25 | | | 250 | | | | 268,350 | |
2.85%, 02/24/26 | | | 500 | | | | 526,737 | |
2.38%, 10/06/26 | | | 1,000 | | | | 1,044,421 | |
3.00%, 10/15/27 | | | 500 | | | | 535,959 | |
2.63%, 07/29/29 | | | 1,000 | | | | 1,052,122 | |
2.75%, 03/19/30 | | | 1,400 | | | | 1,477,841 | |
1.63%, 05/01/30 | | | 600 | | | | 581,856 | |
1.40%, 02/25/31 | | | 1,200 | | | | 1,144,374 | |
1.95%, 10/21/31(a) | | | 985 | | | | 984,518 | |
2.63%, 10/21/41 | | | 500 | | | | 505,880 | |
3.45%, 10/06/46 | | | 1,688 | | | | 1,901,484 | |
3.38%, 07/29/49 | | | 300 | | | | 335,779 | |
2.88%, 10/15/49(a) | | | 500 | | | | 524,256 | |
3.63%, 03/19/50 | | | 700 | | | | 826,872 | |
2.75%, 10/21/51 | | | 500 | | | | 512,410 | |
| | | | | | | | |
| | |
| | | | | | | 107,700,855 | |
| | |
| Biotechnology — 0.3% | | | | | | |
Amgen, Inc. | | | | | | | | |
2.25%, 08/19/23 | | | 250 | | | | 255,374 | |
3.63%, 05/22/24 | | | 250 | | | | 263,298 | |
3.13%, 05/01/25(a) | | | 750 | | | | 790,588 | |
2.60%, 08/19/26 | | | 715 | | | | 745,356 | |
3.20%, 11/02/27 | | | 2,000 | | | | 2,155,284 | |
2.00%, 01/15/32 | | | 1,400 | | | | 1,355,638 | |
3.15%, 02/21/40 | | | 1,000 | | | | 1,025,514 | |
2.80%, 08/15/41 | | | 1,100 | | | | 1,058,318 | |
4.95%, 10/01/41 | | | 2,000 | | | | 2,498,541 | |
5.15%, 11/15/41 | | | 500 | | | | 635,928 | |
4.40%, 05/01/45 | | | 1,925 | | | | 2,297,036 | |
4.56%, 06/15/48 | | | 500 | | | | 619,800 | |
3.38%, 02/21/50 | | | 1,000 | | | | 1,040,131 | |
4.66%, 06/15/51 | | | 1,904 | | | | 2,435,683 | |
3.00%, 01/15/52 | | | 1,400 | | | | 1,358,413 | |
2.77%, 09/01/53 | | | 1,064 | | | | 994,108 | |
Baxalta, Inc. | | | | | | | | |
4.00%, 06/23/25 | | | 1,398 | | | | 1,507,385 | |
5.25%, 06/23/45 | | | 105 | | | | 139,444 | |
Biogen, Inc. | | | | | | | | |
4.05%, 09/15/25 | | | 595 | | | | 646,242 | |
2.25%, 05/01/30 | | | 795 | | | | 782,749 | |
3.15%, 05/01/50 | | | 1,130 | | | | 1,086,115 | |
3.25%, 02/15/51(a)(c) | | | 1,290 | | | | 1,265,800 | |
Gilead Sciences, Inc. | | | | | | | | |
2.50%, 09/01/23 | | | 500 | | | | 511,882 | |
0.75%, 09/29/23 | | | 319 | | | | 317,656 | |
3.70%, 04/01/24 | | | 1,750 | | | | 1,839,569 | |
3.50%, 02/01/25 | | | 1,170 | | | | 1,236,850 | |
3.65%, 03/01/26 | | | 1,325 | | | | 1,427,495 | |
2.95%, 03/01/27 | | | 500 | | | | 526,671 | |
1.20%, 10/01/27(a) | | | 355 | | | | 343,119 | |
1.65%, 10/01/30(a) | | | 1,060 | | | | 1,015,938 | |
4.60%, 09/01/35(a) | | | 1,350 | | | | 1,633,464 | |
2.60%, 10/01/40 | | | 580 | | | | 558,750 | |
5.65%, 12/01/41 | | | 50 | | | | 68,832 | |
4.80%, 04/01/44 | | | 1,100 | | | | 1,388,473 | |
4.50%, 02/01/45 | | | 1,150 | | | | 1,401,947 | |
4.75%, 03/01/46 | | | 1,500 | | | | 1,900,683 | |
4.15%, 03/01/47 | | | 1,150 | | | | 1,353,970 | |
| | | | | | | | |
| Security | | Par
(000) | | | Value | |
| | |
Biotechnology (continued) | | | | | | | | |
Gilead Sciences, Inc. (continued) | | | | | | | | |
2.80%, 10/01/50 | | $ | 1,550 | | | $ | 1,502,639 | |
Illumina, Inc., 2.55%, 03/23/31 | | | 900 | | | | 899,743 | |
Regeneron Pharmaceuticals, Inc. | | | | | | | | |
1.75%, 09/15/30 | | | 810 | | | | 765,978 | |
2.80%, 09/15/50 | | | 835 | | | | 782,454 | |
Royalty Pharma PLC | | | | | | | | |
1.20%, 09/02/25 | | | 1,000 | | | | 978,903 | |
1.75%, 09/02/27 | | | 1,500 | | | | 1,473,713 | |
2.20%, 09/02/30 | | | 2,000 | | | | 1,935,879 | |
2.15%, 09/02/31 | | | 345 | | | | 325,907 | |
3.30%, 09/02/40(a) | | | 1,000 | | | | 997,118 | |
3.35%, 09/02/51 | | | 500 | | | | 478,268 | |
| | | | | | | | |
| | |
| | | | | | | 50,622,646 | |
| | |
| Building Materials — 0.1% | | | | | | |
Carrier Global Corp. | | | | | | | | |
2.24%, 02/15/25 | | | 1,390 | | | | 1,423,333 | |
2.49%, 02/15/27 | | | 983 | | | | 1,009,861 | |
2.72%, 02/15/30 | | | 500 | | | | 510,620 | |
3.38%, 04/05/40 | | | 1,000 | | | | 1,044,817 | |
3.58%, 04/05/50 | | | 1,500 | | | | 1,594,841 | |
Eagle Materials, Inc., 2.50%, 07/01/31 | | | 380 | | | | 375,002 | |
Fortune Brands Home & Security, Inc. | | | | | | | | |
4.00%, 06/15/25 | | | 1,000 | | | | 1,072,086 | |
3.25%, 09/15/29(a) | | | 500 | | | | 528,510 | |
Johnson Controls International PLC | | | | | | | | |
3.63%, 07/02/24(d) | | | 75 | | | | 78,968 | |
4.63%, 07/02/44 | | | 750 | | | | 901,840 | |
5.13%, 09/14/45 | | | 24 | | | | 31,665 | |
4.50%, 02/15/47 | | | 250 | | | | 302,950 | |
4.95%, 07/02/64(d) | | | 179 | | | | 231,212 | |
Johnson Controls International PLC/Tyco Fire & Security Finance SCA (a) | | | | | | | | |
1.75%, 09/15/30 | | | 395 | | | | 378,031 | |
2.00%, 09/16/31 | | | 700 | | | | 677,850 | |
Martin Marietta Materials, Inc. | | | | | | | | |
3.45%, 06/01/27 | | | 250 | | | | 266,507 | |
2.40%, 07/15/31 | | | 165 | | | | 164,246 | |
4.25%, 12/15/47(a) | | | 250 | | | | 292,754 | |
3.20%, 07/15/51 | | | 300 | | | | 303,479 | |
Series CB, 2.50%, 03/15/30 | | | 1,000 | | | | 1,008,847 | |
Masco Corp. | | | | | | | | |
1.50%, 02/15/28 | | | 365 | | | | 353,289 | |
2.00%, 10/01/30 | | | 2,000 | | | | 1,919,976 | |
2.00%, 02/15/31 | | | 500 | | | | 479,164 | |
3.13%, 02/15/51 | | | 295 | | | | 293,079 | |
Owens Corning | | | | | | | | |
4.20%, 12/01/24 | | | 250 | | | | 267,351 | |
3.88%, 06/01/30 | | | 300 | | | | 327,184 | |
4.40%, 01/30/48 | | | 1,000 | | | | 1,171,044 | |
Vulcan Materials Co. | | | | | | | | |
3.90%, 04/01/27 | | | 1,000 | | | | 1,093,938 | |
4.50%, 06/15/47 | | | 500 | | | | 613,849 | |
| | | | | | | | |
| | |
| | | | | | | 18,716,293 | |
| | |
| Building Products — 0.2% | | | | | | |
Allegion PLC, 3.50%, 10/01/29 | | | 500 | | | | 531,397 | |
Home Depot, Inc. | | | | | | | | |
3.35%, 09/15/25 | | | 1,500 | | | | 1,601,315 | |
2.13%, 09/15/26 | | | 500 | | | | 515,677 | |
2.50%, 04/15/27 | | | 800 | | | | 834,283 | |
| | |
| 26 | | 2 0 2 1 BLACK ROCK ANNUAL REPORT TO SHAREHOLDERS |
| | |
Schedule of Investments (continued) December 31, 2021 | | U.S. Total Bond Index Master Portfolio (Percentages shown are based on Net Assets) |
| | | | | | | | |
| Security | | Par
(000) | | | Value | |
| | |
Building Products (continued) | | | | | | | | |
Home Depot, Inc. (continued) | | | | | | | | |
2.80%, 09/14/27 | | $ | 500 | | | $ | 530,236 | |
0.90%, 03/15/28(a) | | | 675 | | | | 644,037 | |
1.50%, 09/15/28(a) | | | 500 | | | | 493,399 | |
3.90%, 12/06/28 | | | 440 | | | | 495,469 | |
2.95%, 06/15/29 | | | 590 | | | | 628,543 | |
2.70%, 04/15/30 | | | 300 | | | | 314,773 | |
1.38%, 03/15/31 | | | 1,600 | | | | 1,508,263 | |
1.88%, 09/15/31(a) | | | 500 | | | | 491,920 | |
5.88%, 12/16/36 | | | 100 | | | | 141,641 | |
3.30%, 04/15/40 | | | 1,100 | | | | 1,192,594 | |
5.40%, 09/15/40 | | | 500 | | | | 683,720 | |
5.95%, 04/01/41 | | | 500 | | | | 717,408 | |
4.20%, 04/01/43 | | | 750 | | | | 905,018 | |
4.40%, 03/15/45 | | | 1,250 | | | | 1,559,920 | |
4.25%, 04/01/46 | | | 1,000 | | | | 1,244,541 | |
3.90%, 06/15/47 | | | 1,000 | | | | 1,168,269 | |
4.50%, 12/06/48 | | | 1,000 | | | | 1,292,899 | |
3.13%, 12/15/49 | | | 1,600 | | | | 1,686,206 | |
3.35%, 04/15/50 | | | 1,565 | | | | 1,706,732 | |
2.38%, 03/15/51 | | | 900 | | | | 826,766 | |
2.75%, 09/15/51 | | | 500 | | | | 496,509 | |
3.50%, 09/15/56 | | | 640 | | | | 721,853 | |
Lowe’s Cos., Inc. | | | | | | | | |
4.00%, 04/15/25(a) | | | 1,000 | | | | 1,081,416 | |
3.38%, 09/15/25 | | | 500 | | | | 532,131 | |
2.50%, 04/15/26 | | | 955 | | | | 994,082 | |
1.30%, 04/15/28 | | | 845 | | | | 809,793 | |
1.70%, 09/15/28 | | | 555 | | | | 543,823 | |
3.65%, 04/05/29 | | | 500 | | | | 548,142 | |
4.50%, 04/15/30(a) | | | 1,000 | | | | 1,160,802 | |
1.70%, 10/15/30 | | | 450 | | | | 427,539 | |
2.63%, 04/01/31 | | | 1,000 | | | | 1,023,106 | |
5.00%, 04/15/40 | | | 1,000 | | | | 1,255,633 | |
2.80%, 09/15/41 | | | 285 | | | | 278,070 | |
4.38%, 09/15/45 | | | 1,000 | | | | 1,195,931 | |
3.70%, 04/15/46 | | | 750 | | | | 822,098 | |
4.05%, 05/03/47 | | | 1,000 | | | | 1,150,436 | |
3.00%, 10/15/50 | | | 1,230 | | | | 1,213,024 | |
3.50%, 04/01/51(a) | | | 1,000 | | | | 1,078,895 | |
| | | | | | | | |
| | |
| | | | | | | 37,048,309 | |
| | |
| Capital Markets — 0.8% | | | | | | |
Ameriprise Financial, Inc. | | | | | | | | |
4.00%, 10/15/23 | | | 150 | | | | 158,160 | |
3.70%, 10/15/24 | | | 1,000 | | | | 1,067,433 | |
2.88%, 09/15/26(a) | | | 500 | | | | 526,348 | |
Ares Capital Corp. | | | | | | | | |
4.20%, 06/10/24 | | | 500 | | | | 527,602 | |
3.25%, 07/15/25 | | | 875 | | | | 903,680 | |
3.88%, 01/15/26 | | | 1,000 | | | | 1,053,894 | |
2.88%, 06/15/28 | | | 1,030 | | | | 1,025,429 | |
3.20%, 11/15/31 | | | 500 | | | | 491,591 | |
Bain Capital Specialty Finance, Inc.,
2.55%, 10/13/26 | | | 200 | | | | 194,381 | |
Bank of New York Mellon Corp. | | | | | | | | |
1.85%, 01/27/23(a) | | | 245 | | | | 248,377 | |
3.50%, 04/28/23 | | | 2,000 | | | | 2,071,036 | |
3.45%, 08/11/23 | | | 500 | | | | 520,955 | |
2.20%, 08/16/23 | | | 1,000 | | | | 1,021,663 | |
0.50%, 04/26/24 | | | 200 | | | | 197,527 | |
| | | | | | | | |
| Security | | Par
(000) | | | Value | |
| | |
Capital Markets (continued) | | | | | | | | |
Bank of New York Mellon Corp. (continued) | | | | | | | | |
2.10%, 10/24/24 | | $ | 250 | | | $ | 256,408 | |
0.85%, 10/25/24 | | | 1,000 | | | | 991,551 | |
1.60%, 04/24/25 | | | 2,000 | | | | 2,018,366 | |
2.80%, 05/04/26 | | | 70 | | | | 73,341 | |
1.05%, 10/15/26(a) | | | 1,000 | | | | 974,688 | |
3.25%, 05/16/27 | | | 750 | | | | 808,074 | |
3.85%, 04/28/28(a) | | | 2,000 | | | | 2,243,870 | |
1.65%, 07/14/28 | | | 300 | | | | 297,034 | |
1.90%, 01/25/29 | | | 1,000 | | | | 993,183 | |
3.30%, 08/23/29 | | | 1,000 | | | | 1,077,916 | |
1.80%, 07/28/31 | | | 1,000 | | | | 978,265 | |
(3 mo. LIBOR US + 1.07%), 3.44%, 02/07/28(b) | | | 2,000 | | | | 2,145,802 | |
Series G, 3.00%, 02/24/25 | | | 105 | | | | 110,159 | |
Blackstone Secured Lending Fund, 2.85%, 09/30/28(c) | | | 400 | | | | 389,953 | |
Brookfield Asset Management, Inc., 4.00%, 01/15/25 | | | 2,250 | | | | 2,404,773 | |
Brookfield Finance I UK PLC, 2.34%, 01/30/32 | | | 485 | | | | 473,093 | |
Brookfield Finance, Inc.
4.00%, 04/01/24 | | | 150 | | | | 158,102 | |
4.25%, 06/02/26(a) | | | 1,000 | | | | 1,100,204 | |
3.90%, 01/25/28 | | | 1,000 | | | | 1,096,994 | |
4.35%, 04/15/30 | | | 2,000 | | | | 2,254,502 | |
2.72%, 04/15/31 | | | 1,800 | | | | 1,815,908 | |
4.70%, 09/20/47 | | | 500 | | | | 614,003 | |
3.50%, 03/30/51 | | | 310 | | | | 324,860 | |
Charles Schwab Corp. | | | | | | | | |
0.75%, 03/18/24 | | | 1,000 | | | | 995,534 | |
3.00%, 03/10/25 | | | 80 | | | | 84,092 | |
3.63%, 04/01/25 | | | 1,000 | | | | 1,065,449 | |
3.85%, 05/21/25 | | | 1,000 | | | | 1,077,512 | |
0.90%, 03/11/26 | | | 1,690 | | | | 1,648,117 | |
1.15%, 05/13/26(a) | | | 2,000 | | | | 1,973,046 | |
3.20%, 01/25/28 | | | 1,000 | | | | 1,074,966 | |
2.00%, 03/20/28 | | | 800 | | | | 810,590 | |
3.25%, 05/22/29(a) | | | 200 | | | | 214,841 | |
2.75%, 10/01/29 | | | 1,000 | | | | 1,045,079 | |
4.63%, 03/22/30 | | | 1,000 | | | | 1,183,315 | |
1.65%, 03/11/31(a) | | | 2,000 | | | | 1,920,665 | |
2.30%, 05/13/31(a) | | | 1,000 | | | | 1,009,981 | |
1.95%, 12/01/31 | | | 800 | | | | 785,623 | |
CI Financial Corp. | | | | | | | | |
3.20%, 12/17/30 | | | 600 | | | | 615,606 | |
4.10%, 06/15/51(a) | | | 245 | | | | 265,525 | |
E*TRADE Financial Corp., 4.50%, 06/20/28 | | | 1,000 | | | | 1,125,094 | |
Franklin Resources, Inc., 2.95%, 08/12/51 | | | 300 | | | | 288,836 | |
FS KKR Capital Corp. 4.63%, 07/15/24 | | | 500 | | | | 526,257 | |
1.65%, 10/12/24 | | | 500 | | | | 490,521 | |
4.13%, 02/01/25 | | | 100 | | | | 104,570 | |
3.40%, 01/15/26 | | | 1,000 | | | | 1,015,490 | |
2.63%, 01/15/27 | | | 400 | | | | 394,749 | |
3.13%, 10/12/28 | | | 500 | | | | 497,459 | |
GLP Capital LP/GLP Financing II, Inc., 3.25%, 01/15/32 | | | 120 | | | | 120,647 | |
Golub Capital BDC, Inc. | | | | | | | | |
2.50%, 08/24/26 | | | 200 | | | | 196,555 | |
2.05%, 02/15/27 | | | 900 | | | | 863,801 | |
| | |
MASTER PORTFOLIO SCHEDULE OF INVESTMENTS | | 27 |
| | |
Schedule of Investments (continued) December 31, 2021 | | U.S. Total Bond Index Master Portfolio (Percentages shown are based on Net Assets) |
| | | | | | | | |
| Security | | Par
(000) | | | Value | |
| | |
Capital Markets (continued) | | | | | | | | |
Invesco Finance PLC | | | | | | | | |
4.00%, 01/30/24 | | $ | 250 | | | $ | 263,955 | |
5.38%, 11/30/43 | | | 500 | | | | 656,742 | |
Jefferies Group LLC, 2.75%, 10/15/32(a) | | | 2,000 | | | | 1,978,035 | |
Jefferies Group LLC/Jefferies Group Capital Finance, Inc. | | | | | | | | |
4.85%, 01/15/27 | | | 1,000 | | | | 1,134,307 | |
4.15%, 01/23/30 | | | 1,000 | | | | 1,108,601 | |
2.63%, 10/15/31 | | | 400 | | | | 393,427 | |
Kreditanstalt fuer Wiederaufbau | | | | | | | | |
2.13%, 01/17/23 | | | 5,200 | | | | 5,287,770 | |
1.63%, 02/15/23 | | | 4,000 | | | | 4,048,823 | |
0.25%, 10/19/23(a) | | | 7,000 | | | | 6,939,209 | |
2.63%, 02/28/24 | | | 1,000 | | | | 1,038,840 | |
0.25%, 03/08/24 | | | 3,000 | | | | 2,961,979 | |
1.38%, 08/05/24 | | | 3,000 | | | | 3,033,068 | |
2.50%, 11/20/24 | | | 2,000 | | | | 2,083,517 | |
2.00%, 05/02/25 | | | 2,000 | | | | 2,056,565 | |
0.38%, 07/18/25 | | | 4,000 | | | | 3,893,202 | |
0.63%, 01/22/26 | | | 2,000 | | | | 1,951,256 | |
2.88%, 04/03/28(a) | | | 5,000 | | | | 5,419,973 | |
1.75%, 09/14/29 | | | 1,500 | | | | 1,523,972 | |
0.75%, 09/30/30 | | | 3,000 | | | | 2,799,694 | |
Landwirtschaftliche Rentenbank | | | | | | | | |
2.00%, 01/13/25 | | | 1,000 | | | | 1,027,477 | |
2.38%, 06/10/25 | | | 2,000 | | | | 2,082,955 | |
0.88%, 09/03/30 | | | 2,000 | | | | 1,882,379 | |
Lazard Group LLC, 4.38%, 03/11/29 | | | 1,000 | | | | 1,127,754 | |
Legg Mason, Inc., 5.63%, 01/15/44 | | | 625 | | | | 856,962 | |
Main Street Capital Corp., 3.00%, 07/14/26 | | | 200 | | | | 200,575 | |
Nomura Holdings, Inc. | | | | | | | | |
2.65%, 01/16/25 | | | 900 | | | | 925,539 | |
1.65%, 07/14/26 | | | 200 | | | | 196,334 | |
2.17%, 07/14/28 | | | 400 | | | | 392,430 | |
3.10%, 01/16/30(a) | | | 900 | | | | 927,716 | |
2.68%, 07/16/30 | | | 2,000 | | | | 1,990,838 | |
2.61%, 07/14/31 | | | 200 | | | | 197,364 | |
Northern Trust Corp. | | | | | | | | |
3.65%, 08/03/28 | | | 250 | | | | 278,235 | |
3.15%, 05/03/29 | | | 500 | | | | 538,226 | |
Oesterreichische Kontrollbank AG | | | | | | | | |
2.88%, 03/13/23 | | | 2,000 | | | | 2,053,360 | |
1.50%, 02/12/25 | | | 1,000 | | | | 1,011,506 | |
Owl Rock Capital Corp. | | | | | | | | |
4.00%, 03/30/25 | | | 345 | | | | 358,859 | |
3.75%, 07/22/25 | | | 265 | | | | 274,507 | |
3.40%, 07/15/26 | | | 1,000 | | | | 1,016,064 | |
2.63%, 01/15/27 | | | 300 | | | | 293,424 | |
2.88%, 06/11/28 | | | 1,055 | | | | 1,035,566 | |
Owl Rock Capital Corp. III, 3.13%, 04/13/27(c) | | | 200 | | | | 195,550 | |
Prospect Capital Corp. | | | | | | | | |
3.36%, 11/15/26 | | | 475 | | | | 474,214 | |
3.44%, 10/15/28 | | | 300 | | | | 288,682 | |
Raymond James Financial, Inc., 4.95%, 07/15/46. | | | 500 | | | | 636,353 | |
Sixth Street Specialty Lending, Inc., 3.88%, 11/01/24 | | | 500 | | | | 522,744 | |
State Street Corp. | | | | | | | | |
3.10%, 05/15/23 | | | 250 | | | | 257,778 | |
3.30%, 12/16/24 | | | 405 | | | | 431,119 | |
2.65%, 05/19/26 | | | 1,000 | | | | 1,054,049 | |
| | | | | | | | |
| Security | | Par
(000) | | | Value | |
| | |
Capital Markets (continued) | | | | | | | | |
State Street Corp. (continued) | | | | | | | | |
2.40%, 01/24/30(a) | | $ | 300 | | | $ | 309,322 | |
(SOFR + 0.56%), 1.68%, 11/18/27(b) | | | 900 | | | | 901,270 | |
(SOFR + 0.94%), 2.35%, 11/01/25(b) | | | 1,450 | | | | 1,494,431 | |
(SOFR + 1.49%), 3.03%, 11/01/34(b) | | | 200 | | | | 208,261 | |
(SOFR + 2.60%), 2.90%, 03/30/26(b) | | | 1,000 | | | | 1,045,564 | |
(SOFR + 2.65%), 3.15%, 03/30/31(b) | | | 1,000 | | | | 1,082,440 | |
| | | | | | | | |
| | |
| | | | | | | 131,145,827 | |
| | |
| Chemicals — 0.4% | | | | | | |
Air Products and Chemicals, Inc. | | | | | | | | |
1.50%, 10/15/25 | | | 585 | | | | 586,857 | |
1.85%, 05/15/27(a) | | | 415 | | | | 420,921 | |
2.05%, 05/15/30 | | | 430 | | | | 432,522 | |
2.70%, 05/15/40 | | | 495 | | | | 499,165 | |
2.80%, 05/15/50 | | | 645 | | | | 660,837 | |
Albemarle Corp., 4.15%, 12/01/24 | | | 250 | | | | 267,737 | |
Cabot Corp., 4.00%, 07/01/29 | | | 1,500 | | | | 1,636,384 | |
Celanese US Holdings LLC, 1.40%, 08/05/26 | | | 200 | | | | 195,140 | |
CF Industries, Inc. | | | | | | | | |
5.15%, 03/15/34 | | | 500 | | | | 603,995 | |
4.95%, 06/01/43 | | | 500 | | | | 603,571 | |
5.38%, 03/15/44 | | | 500 | | | | 630,550 | |
Dow Chemical Co. | | | | | | | | |
4.80%, 11/30/28 | | | 300 | | | | 349,928 | |
4.25%, 10/01/34 | | | 1,361 | | | | 1,570,933 | |
9.40%, 05/15/39 | | | 198 | | | | 354,741 | |
5.25%, 11/15/41 | | | 100 | | | | 127,849 | |
4.38%, 11/15/42 | | | 250 | | | | 295,252 | |
5.55%, 11/30/48 | | | 1,000 | | | | 1,403,019 | |
4.80%, 05/15/49 | | | 1,000 | | | | 1,272,120 | |
3.60%, 11/15/50(a) | | | 1,000 | | | | 1,082,881 | |
DuPont de Nemours, Inc. | | | | | | | | |
4.21%, 11/15/23 | | | 2,000 | | | | 2,114,942 | |
4.73%, 11/15/28(a) | | | 1,500 | | | | 1,737,358 | |
5.32%, 11/15/38 | | | 750 | | | | 966,398 | |
5.42%, 11/15/48(a) | | | 1,500 | | | | 2,098,989 | |
Eastman Chemical Co. | | | | | | | | |
3.80%, 03/15/25 | | | 1,050 | | | | 1,121,288 | |
4.50%, 12/01/28 | | | 1,000 | | | | 1,136,688 | |
4.80%, 09/01/42 | | | 250 | | | | 299,527 | |
4.65%, 10/15/44 | | | 1,000 | | | | 1,195,915 | |
Ecolab, Inc. | | | | | | | | |
3.25%, 12/01/27(a) | | | 1,000 | | | | 1,085,185 | |
4.80%, 03/24/30 | | | 500 | | | | 600,528 | |
1.30%, 01/30/31(a) | | | 800 | | | | 749,818 | |
2.13%, 02/01/32 | | | 1,000 | | | | 991,688 | |
2.13%, 08/15/50(a) | | | 800 | | | | 705,133 | |
2.70%, 12/15/51 | | | 715 | | | | 701,897 | |
2.75%, 08/18/55 | | | 445 | | | | 436,719 | |
EI du Pont de Nemours and Co. | | | | | | | | |
1.70%, 07/15/25 | | | 800 | | | | 805,732 | |
2.30%, 07/15/30 | | | 800 | | | | 802,978 | |
Emerson Electric Co. | | | | | | | | |
2.63%, 02/15/23 | | | 350 | | | | 355,659 | |
2.00%, 12/21/28 | | | 500 | | | | 499,941 | |
2.20%, 12/21/31 | | | 300 | | | | 298,608 | |
2.75%, 10/15/50 | | | 1,000 | | | | 972,488 | |
2.80%, 12/21/51 | | | 165 | | | | 161,619 | |
FMC Corp. | | | | | | | | |
3.20%, 10/01/26 | | | 155 | | | | 163,843 | |
| | |
| 28 | | 2 0 2 1 BLACK ROCK ANNUAL REPORT TO SHAREHOLDERS |
| | |
Schedule of Investments (continued) December 31, 2021 | | U.S. Total Bond Index Master Portfolio (Percentages shown are based on Net Assets) |
| | | | | | | | |
| Security | | Par
(000) | | | Value | |
| | |
Chemicals (continued) | | | | | | | | |
FMC Corp. (continued) | | | | | | | | |
3.45%, 10/01/29 | | $ | 115 | | | $ | 122,448 | |
4.50%, 10/01/49(a) | | | 165 | | | | 197,926 | |
Huntsman International LLC, 2.95%, 06/15/31(a) | | | 185 | | | | 187,596 | |
International Flavors & Fragrances, Inc. | | | | | | | | |
4.45%, 09/26/28(a) | | | 500 | | | | 566,030 | |
4.38%, 06/01/47 | | | 500 | | | | 580,661 | |
5.00%, 09/26/48 | | | 500 | | | | 642,680 | |
Linde, Inc. | | | | | | | | |
2.70%, 02/21/23(a) | | | 1,000 | | | | 1,017,320 | |
2.65%, 02/05/25 | | | 165 | | | | 171,321 | |
3.20%, 01/30/26(a) | | | 250 | | | | 266,086 | |
1.10%, 08/10/30 | | | 900 | | | | 840,715 | |
2.00%, 08/10/50 | | | 705 | | | | 615,629 | |
LYB International Finance BV | | | | | | | | |
4.00%, 07/15/23 | | | 255 | | | | 266,405 | |
5.25%, 07/15/43 | | | 75 | | | | 96,542 | |
4.88%, 03/15/44(a) | | | 350 | | | | 432,323 | |
LYB International Finance III LLC | | | | | | | | |
1.25%, 10/01/25(a) | | | 210 | | | | 206,445 | |
3.38%, 05/01/30(a) | | | 500 | | | | 527,269 | |
2.25%, 10/01/30 | | | 675 | | | | 671,350 | |
3.38%, 10/01/40 | | | 535 | | | | 557,200 | |
4.20%, 10/15/49(a) | | | 830 | | | | 958,638 | |
4.20%, 05/01/50 | | | 500 | | | | 577,892 | |
3.63%, 04/01/51(a) | | | 730 | | | | 772,522 | |
3.80%, 10/01/60 | | | 545 | | | | 575,259 | |
LyondellBasell Industries NV, 4.63%, 02/26/55(a) | | | 900 | | | | 1,097,262 | |
Mosaic Co. | | | | | | | | |
4.25%, 11/15/23 | | | 1,000 | | | | 1,051,810 | |
4.05%, 11/15/27(a) | | | 1,000 | | | | 1,103,439 | |
5.45%, 11/15/33 | | | 250 | | | | 310,021 | |
Nutrien Ltd. | | | | | | | | |
1.90%, 05/13/23 | | | 3,000 | | | | 3,038,323 | |
3.00%, 04/01/25(a) | | | 250 | | | | 260,236 | |
4.00%, 12/15/26 | | | 250 | | | | 273,334 | |
2.95%, 05/13/30 | | | 1,000 | | | | 1,052,323 | |
4.90%, 06/01/43(a) | | | 500 | | | | 638,713 | |
5.00%, 04/01/49 | | | 750 | | | | 1,004,217 | |
3.95%, 05/13/50(a) | | | 1,000 | | | | 1,157,539 | |
PPG Industries, Inc. | | | | | | | | |
2.40%, 08/15/24 | | | 1,000 | | | | 1,030,897 | |
1.20%, 03/15/26 | | | 420 | | | | 410,812 | |
2.80%, 08/15/29 | | | 1,000 | | | | 1,041,048 | |
Rohm & Haas Co., 7.85%, 07/15/29 | | | 125 | | | | 169,886 | |
RPM International, Inc., 5.25%, 06/01/45 | | | 250 | | | | 320,659 | |
Sherwin-Williams Co. | | | | | | | | |
3.95%, 01/15/26 | | | 500 | | | | 544,094 | |
3.45%, 06/01/27 | | | 250 | | | | 270,469 | |
2.95%, 08/15/29 | | | 620 | | | | 652,239 | |
2.20%, 03/15/32 | | | 1,100 | | | | 1,087,151 | |
4.50%, 06/01/47 | | | 1,000 | | | | 1,246,206 | |
3.80%, 08/15/49 | | | 880 | | | | 989,969 | |
2.90%, 03/15/52 | | | 415 | | | | 405,259 | |
Westlake Chemical Corp. | | | | | | | | |
3.60%, 08/15/26 | | | 500 | | | | 536,207 | |
3.38%, 06/15/30 | | | 300 | | | | 317,944 | |
2.88%, 08/15/41(a) | | | 900 | | | | 875,580 | |
| | | | | | | | |
| Security | | Par
(000) | | | Value | |
| | |
Chemicals (continued) | | | | | | | | |
Westlake Chemical Corp. (continued) | | | | | | | | |
5.00%, 08/15/46 | | $ | 750 | | | $ | 948,288 | |
3.13%, 08/15/51 | | | 630 | | | | 606,746 | |
3.38%, 08/15/61 | | | 500 | | | | 476,955 | |
| | | | | | | | |
| | |
| | | | | | | 66,765,226 | |
| | |
| Commercial Services & Supplies — 0.0% | | | | | | |
GATX Corp. | | | | | | | | |
3.25%, 09/15/26 | | | 750 | | | | 784,536 | |
3.85%, 03/30/27 | | | 500 | | | | 539,437 | |
4.70%, 04/01/29(a) | | | 1,000 | | | | 1,148,367 | |
1.90%, 06/01/31 | | | 2,000 | | | | 1,899,355 | |
3.10%, 06/01/51 | | | 490 | | | | 475,967 | |
George Washington University | | | | | | | | |
4.87%, 09/15/45 | | | 100 | | | | 135,159 | |
Series 2014, 4.30%, 09/15/44(a) | | | 250 | | | | 317,197 | |
Massachusetts Institute of Technology, 5.60%, 07/01/2111 | | | 500 | | | | 873,568 | |
Rockefeller Foundation, Series 2020, 2.49%, 10/01/50 | | | 1,193 | | | | 1,173,204 | |
| | | | | | | | |
| | |
| | | | | | | 7,346,790 | |
| | |
| Communications Equipment — 0.1% | | | | | | |
Cisco Systems, Inc. | | | | | | | | |
2.60%, 02/28/23 | | | 500 | | | | 511,277 | |
2.20%, 09/20/23 | | | 1,000 | | | | 1,024,761 | |
3.63%, 03/04/24 | | | 1,000 | | | | 1,060,881 | |
2.95%, 02/28/26 | | | 1,500 | | | | 1,594,096 | |
2.50%, 09/20/26(a) | | | 1,000 | | | | 1,049,077 | |
5.90%, 02/15/39 | | | 500 | | | | 717,856 | |
5.50%, 01/15/40 | | | 850 | | | | 1,183,532 | |
Juniper Networks, Inc. | | | | | | | | |
3.75%, 08/15/29(a) | | | 500 | | | | 540,713 | |
5.95%, 03/15/41 | | | 500 | | | | 661,543 | |
Motorola Solutions, Inc. | | | | | | | | |
4.60%, 02/23/28(a) | | | 500 | | | | 564,514 | |
4.60%, 05/23/29 | | | 965 | | | | 1,102,520 | |
2.30%, 11/15/30 | | | 840 | | | | 811,515 | |
2.75%, 05/24/31 | | | 590 | | | | 591,062 | |
| | | | | | | | |
| | |
| | | | | | | 11,413,347 | |
| | |
| Construction Materials — 0.0% | | | | | | |
Carlisle Cos., Inc., 2.20%, 03/01/32 | | | 300 | | | | 288,916 | |
WW Grainger, Inc., 4.60%, 06/15/45 | | | 1,250 | | | | 1,599,478 | |
| | | | | | | | |
| | |
| | | | | | | 1,888,394 | |
| | |
| Consumer Discretionary — 0.0% | | | | | | |
California Endowment, 2.50%, 04/01/51 | | | 84 | | | | 82,414 | |
Cintas Corp. No. 2, 3.70%, 04/01/27 | | | 500 | | | | 546,997 | |
GXO Logistics, Inc.(c) | | | | | | | | |
1.65%, 07/15/26 | | | 1,000 | | | | 975,740 | |
2.65%, 07/15/31 | | | 500 | | | | 493,830 | |
Harley-Davidson, Inc., 4.63%, 07/28/45 | | | 600 | | | | 637,688 | |
Quanta Services, Inc. | | | | | | | | |
2.35%, 01/15/32 | | | 230 | | | | 223,312 | |
3.05%, 10/01/41 | | | 270 | | | | 261,035 | |
RELX Capital, Inc., 3.50%, 03/16/23 | | | 300 | | | | 308,808 | |
| | | | | | | | |
| | |
| | | | | | | 3,529,824 | |
| | |
MASTER PORTFOLIO SCHEDULE OF INVESTMENTS | | 29 |
| | |
Schedule of Investments (continued) December 31, 2021 | | U.S. Total Bond Index Master Portfolio (Percentages shown are based on Net Assets) |
| | | | | | | | |
| Security | | Par
(000) | | | Value | |
| | |
Consumer Finance — 0.5% | | | | | | | | |
American Express Co. | | | | | | | | |
3.40%, 02/27/23 | | $ | 2,000 | | | $ | 2,057,737 | |
3.70%, 08/03/23 | | | 2,000 | | | | 2,085,289 | |
0.75%, 11/03/23 | | | 500 | | | | 498,467 | |
3.40%, 02/22/24 | | | 3,000 | | | | 3,146,177 | |
2.50%, 07/30/24 | | | 655 | | | | 676,720 | |
3.00%, 10/30/24 | | | 1,000 | | | | 1,048,007 | |
3.63%, 12/05/24(a) | | | 300 | | | | 320,550 | |
3.13%, 05/20/26 | | | 3,000 | | | | 3,174,543 | |
1.65%, 11/04/26 | | | 1,000 | | | | 1,002,809 | |
3.30%, 05/03/27(c) | | | 500 | | | | 536,063 | |
4.05%, 12/03/42 | | | 67 | | | | 79,530 | |
Andrew W Mellon Foundation, Series 2020, 0.95%, 08/01/27 | | | 112 | | | | 108,647 | |
Automatic Data Processing, Inc. | | | | | | | | |
1.70%, 05/15/28 | | | 580 | | | | 577,908 | |
1.25%, 09/01/30 | | | 2,000 | | | | 1,882,252 | |
Block Financial LLC | | | | | | | | |
2.50%, 07/15/28 | | | 510 | | | | 510,564 | |
3.88%, 08/15/30 | | | 1,000 | | | | 1,069,915 | |
Capital One Bank USA NA, 3.38%, 02/15/23 | | | 350 | | | | 359,687 | |
Capital One Financial Corp. | | | | | | | | |
3.20%, 01/30/23 | | | 4,000 | | | | 4,097,021 | |
3.50%, 06/15/23 | | | 110 | | | | 113,986 | |
3.90%, 01/29/24 | | | 1,000 | | | | 1,052,328 | |
3.75%, 04/24/24 | | | 250 | | | | 263,489 | |
3.30%, 10/30/24 | | | 1,000 | | | | 1,052,461 | |
3.20%, 02/05/25 | | | 250 | | | | 261,956 | |
4.25%, 04/30/25 | | | 2,000 | | | | 2,161,037 | |
4.20%, 10/29/25 | | | 340 | | | | 370,349 | |
3.75%, 07/28/26 | | | 230 | | | | 246,627 | |
3.75%, 03/09/27 | | | 500 | | | | 541,301 | |
3.65%, 05/11/27 | | | 2,000 | | | | 2,154,491 | |
3.80%, 01/31/28 | | | 1,000 | | | | 1,088,670 | |
(SOFR + 0.86%), 1.88%, 11/02/27(b) | | | 1,000 | | | | 994,888 | |
(SOFR + 1.27%), 2.62%, 11/02/32(b) | | | 500 | | | | 498,631 | |
(SOFR + 1.34%), 2.36%, 07/29/32(b) | | | 1,000 | | | | 946,706 | |
Discover Financial Services | | | | | | | | |
3.95%, 11/06/24 | | | 350 | | | | 372,236 | |
3.75%, 03/04/25 | | | 75 | | | | 79,345 | |
Equifax, Inc. | | | | | | | | |
2.60%, 12/01/24 | | | 1,000 | | | | 1,033,692 | |
2.35%, 09/15/31 | | | 1,000 | | | | 986,445 | |
Global Payments, Inc. | | | | | | | | |
4.00%, 06/01/23 | | | 1,000 | | | | 1,038,767 | |
4.80%, 04/01/26 | | | 500 | | | | 555,081 | |
2.15%, 01/15/27 | | | 490 | | | | 491,949 | |
3.20%, 08/15/29(a) | | | 250 | | | | 260,390 | |
2.90%, 05/15/30 | | | 1,815 | | | | 1,847,946 | |
2.90%, 11/15/31 | | | 390 | | | | 395,571 | |
4.15%, 08/15/49(a) | | | 355 | | | | 404,937 | |
Mastercard, Inc. | | | | | | | | |
3.38%, 04/01/24(a) | | | 250 | | | | 263,057 | |
2.00%, 03/03/25(a) | | | 1,200 | | | | 1,230,276 | |
3.30%, 03/26/27 | | | 235 | | | | 253,948 | |
3.50%, 02/26/28 | | | 1,000 | | | | 1,097,087 | |
2.95%, 06/01/29 | | | 1,500 | | | | 1,606,899 | |
3.35%, 03/26/30 | | | 830 | | | | 913,041 | |
1.90%, 03/15/31 | | | 515 | | | | 517,810 | |
2.00%, 11/18/31 | | | 2,200 | | | | 2,193,272 | |
| | | | | | | | |
| Security | | Par
(000) | | | Value | |
| | |
Consumer Finance (continued) | | | | | | | | |
Mastercard, Inc. (continued) | | | | | | | | |
3.65%, 06/01/49(a) | | $ | 500 | | | $ | 578,640 | |
3.85%, 03/26/50 | | | 1,050 | | | | 1,261,902 | |
2.95%, 03/15/51 | | | 550 | | | | 569,059 | |
Moody’s Corp. | | | | | | | | |
4.88%, 02/15/24(a) | | | 500 | | | | 534,199 | |
3.25%, 01/15/28 | | | 750 | | | | 804,020 | |
4.25%, 02/01/29 | | | 1,000 | | | | 1,128,304 | |
2.00%, 08/19/31 | | | 295 | | | | 286,856 | |
2.75%, 08/19/41 | | | 360 | | | | 351,301 | |
3.25%, 05/20/50 | | | 135 | | | | 140,978 | |
2.55%, 08/18/60 | | | 1,000 | | | | 877,060 | |
3.10%, 11/29/61 | | | 465 | | | | 460,979 | |
PayPal Holdings, Inc. | | | | | | | | |
1.35%, 06/01/23 | | | 395 | | | | 398,207 | |
2.40%, 10/01/24 | | | 1,170 | | | | 1,210,907 | |
1.65%, 06/01/25 | | | 440 | | | | 445,377 | |
2.65%, 10/01/26 | | | 1,000 | | | | 1,049,746 | |
2.85%, 10/01/29 | | | 1,335 | | | | 1,404,997 | |
2.30%, 06/01/30 | | | 465 | | | | 472,279 | |
3.25%, 06/01/50(a) | | | 585 | | | | 626,590 | |
S&P Global, Inc. | | | | | | | | |
2.50%, 12/01/29 | | | 320 | | | | 330,475 | |
1.25%, 08/15/30 | | | 430 | | | | 401,197 | |
3.25%, 12/01/49 | | | 225 | | | | 243,888 | |
2.30%, 08/15/60 | | | 850 | | | | 734,887 | |
Synchrony Financial | | | | | | | | |
4.50%, 07/23/25 | | | 190 | | | | 205,286 | |
3.95%, 12/01/27 | | | 1,000 | | | | 1,073,819 | |
5.15%, 03/19/29 | | | 500 | | | | 574,603 | |
2.88%, 10/28/31 | | | 890 | | | | 888,141 | |
Visa, Inc. | | | | | | | | |
3.15%, 12/14/25 | | | 1,945 | | | | 2,075,308 | |
1.90%, 04/15/27(a) | | | 2,000 | | | | 2,028,625 | |
2.75%, 09/15/27(a) | | | 1,150 | | | | 1,212,276 | |
2.05%, 04/15/30 | | | 1,000 | | | | 1,012,904 | |
1.10%, 02/15/31 | | | 1,400 | | | | 1,306,994 | |
4.15%, 12/14/35 | | | 500 | | | | 598,363 | |
2.70%, 04/15/40 | | | 1,000 | | | | 1,021,833 | |
4.30%, 12/14/45 | | | 1,750 | | | | 2,202,138 | |
3.65%, 09/15/47 | | | 195 | | | | 226,929 | |
2.00%, 08/15/50 | | | 1,100 | | | | 963,356 | |
Western Union Co. | | | | | | | | |
1.35%, 03/15/26(a) | | | 900 | | | | 881,960 | |
2.75%, 03/15/31 | | | 900 | | | | 885,694 | |
6.20%, 11/17/36 | | | 525 | | | | 647,900 | |
| | | | | | | | |
| | |
| | | | | | | 82,638,532 | |
| | |
| Containers & Packaging — 0.1% | | | | | | |
Amcor Flexibles North America, Inc. | | | | | | | | |
2.63%, 06/19/30 | | | 275 | | | | 275,980 | |
2.69%, 05/25/31 | | | 285 | | | | 288,856 | |
Avery Dennison Corp., 2.25%, 02/15/32 | | | 500 | | | | 485,578 | |
Berry Global, Inc. | | | | | | | | |
1.57%, 01/15/26 | | | 1,000 | | | | 978,520 | |
1.65%, 01/15/27 | | | 500 | | | | 488,447 | |
Fibria Overseas Finance Ltd., 5.50%, 01/17/27(a) | | | 1,000 | | | | 1,118,937 | |
Georgia-Pacific LLC, 8.88%, 05/15/31 | | | 525 | | | | 811,368 | |
International Paper Co. | | | | | | | | |
7.30%, 11/15/39 | | | 1,750 | | | | 2,681,353 | |
4.80%, 06/15/44 | | | 218 | | | | 275,537 | |
| | |
| 30 | | 2 0 2 1 BLACK ROCK ANNUAL REPORT TO SHAREHOLDERS |
| | |
Schedule of Investments (continued) December 31, 2021 | | U.S. Total Bond Index Master Portfolio (Percentages shown are based on Net Assets) |
| | | | | | | | |
| Security | | Par
(000) | | | Value | |
|
Containers & Packaging (continued) | |
International Paper Co. (continued) | |
4.40%, 08/15/47 | | $ | 250 | | | $ | 307,134 | |
4.35%, 08/15/48(a) | | | 575 | | | | 704,300 | |
Packaging Corp. of America | | | | | | | | |
3.00%, 12/15/29 | | | 200 | | | | 209,118 | |
4.05%, 12/15/49 | | | 650 | | | | 758,546 | |
3.05%, 10/01/51 | | | 185 | | | | 184,095 | |
Sonoco Products Co., 3.13%, 05/01/30(a) | | | 1,300 | | | | 1,359,341 | |
Suzano Austria GmbH | | | | | | | | |
6.00%, 01/15/29 | | | 1,000 | | | | 1,156,125 | |
3.75%, 01/15/31(a) | | | 2,000 | | | | 2,029,750 | |
WestRock MWV LLC, 8.20%, 01/15/30(a) | | | 100 | | | | 138,641 | |
WRKCo, Inc. | | | | | | | | |
4.65%, 03/15/26 | | | 1,170 | | | | 1,304,551 | |
3.38%, 09/15/27 | | | 500 | | | | 531,897 | |
4.00%, 03/15/28 | | | 1,000 | | | | 1,105,165 | |
4.90%, 03/15/29(a) | | | 1,000 | | | | 1,163,299 | |
| | | | | | | | |
| | |
| | | | | | | 18,356,538 | |
| | |
| Diversified Financial Services — 4.2% | | | | | | |
AerCap Ireland Capital DAC/AerCap Global Aviation Trust | | | | | | | | |
3.30%, 01/23/23 | | | 500 | | | | 510,518 | |
1.15%, 10/29/23 | | | 1,000 | | | | 995,670 | |
4.88%, 01/16/24 | | | 1,000 | | | | 1,063,457 | |
2.88%, 08/14/24(a) | | | 3,000 | | | | 3,085,694 | |
1.65%, 10/29/24 | | | 4,175 | | | | 4,167,427 | |
6.50%, 07/15/25 | | | 1,000 | | | | 1,142,740 | |
1.75%, 01/30/26 | | | 1,000 | | | | 980,812 | |
2.45%, 10/29/26 | | | 1,945 | | | | 1,960,949 | |
3.65%, 07/21/27(a) | | | 1,000 | | | | 1,053,821 | |
3.88%, 01/23/28(a) | | | 500 | | | | 530,175 | |
3.00%, 10/29/28 | | | 1,500 | | | | 1,521,204 | |
3.30%, 01/30/32 | | | 3,435 | | | | 3,499,481 | |
3.40%, 10/29/33 | | | 495 | | | | 503,966 | |
3.85%, 10/29/41 | | | 150 | | | | 156,246 | |
Air Lease Corp. | | | | | | | | |
2.25%, 01/15/23 | | | 1,095 | | | | 1,108,556 | |
3.00%, 09/15/23 | | | 500 | | | | 513,141 | |
4.25%, 02/01/24 | | | 500 | | | | 526,781 | |
4.25%, 09/15/24 | | | 250 | | | | 265,878 | |
2.30%, 02/01/25(a) | | | 375 | | | | 380,152 | |
3.25%, 03/01/25 | | | 2,000 | | | | 2,075,276 | |
3.38%, 07/01/25 | | | 1,000 | | | | 1,043,420 | |
2.88%, 01/15/26 | | | 1,000 | | | | 1,031,440 | |
1.88%, 08/15/26 | | | 155 | | | | 152,434 | |
3.63%, 12/01/27(a) | | | 200 | | | | 210,555 | |
2.10%, 09/01/28 | | | 500 | | | | 482,209 | |
3.25%, 10/01/29 | | | 500 | | | | 510,737 | |
3.00%, 02/01/30 | | | 400 | | | | 399,239 | |
3.13%, 12/01/30(a) | | | 2,000 | | | | 2,040,745 | |
Aircastle Ltd. | | | | | | | | |
5.00%, 04/01/23 | | | 100 | | | | 104,382 | |
4.13%, 05/01/24 | | | 1,000 | | | | 1,044,100 | |
4.25%, 06/15/26 | | | 500 | | | | 535,570 | |
Ally Financial, Inc. | | | | | | | | |
3.05%, 06/05/23 | | | 2,000 | | | | 2,050,526 | |
1.45%, 10/02/23 | | | 2,335 | | | | 2,345,715 | |
3.88%, 05/21/24 | | | 1,500 | | | | 1,580,749 | |
5.13%, 09/30/24 | | | 2,300 | | | | 2,513,019 | |
4.63%, 03/30/25(a) | | | 1,500 | | | | 1,629,467 | |
| | | | | | | | |
| Security | | Par
(000) | | | Value | |
|
Diversified Financial Services (continued) | |
Ally Financial, Inc. (continued) | |
5.80%, 05/01/25(a) | | $ | 1,500 | | | $ | 1,692,702 | |
2.20%, 11/02/28 | | | 1,190 | | | | 1,182,058 | |
8.00%, 11/01/31 | | | 700 | | | | 990,898 | |
Banco Santander SA | | | | | | | | |
3.13%, 02/23/23 | | | 1,000 | | | | 1,023,527 | |
2.71%, 06/27/24 | | | 1,000 | | | | 1,035,378 | |
2.75%, 05/28/25 | | | 1,400 | | | | 1,447,026 | |
5.18%, 11/19/25 | | | 200 | | | | 222,626 | |
1.85%, 03/25/26 | | | 400 | | | | 398,165 | |
4.25%, 04/11/27 | | | 2,000 | | | | 2,198,841 | |
3.80%, 02/23/28 | | | 600 | | | | 650,393 | |
4.38%, 04/12/28 | | | 1,000 | | | | 1,115,101 | |
3.31%, 06/27/29 | | | 600 | | | | 634,144 | |
3.49%, 05/28/30 | | | 800 | | | | 844,515 | |
2.75%, 12/03/30 | | | 400 | | | | 391,425 | |
2.96%, 03/25/31 | | | 600 | | | | 612,174 | |
(1 year CMT + 0.90%), 1.72%, 09/14/27(b) | | | 800 | | | | 785,442 | |
(1 year CMT + 1.60%), 3.23%, 11/22/32(b) | | | 1,200 | | | | 1,201,128 | |
Bank of America Corp. | | | | | | | | |
3.30%, 01/11/23 | | | 3,000 | | | | 3,082,112 | |
4.10%, 07/24/23(a) | | | 4,000 | | | | 4,204,679 | |
4.13%, 01/22/24(a) | | | 2,000 | | | | 2,124,906 | |
4.00%, 04/01/24 | | | 500 | | | | 531,524 | |
4.20%, 08/26/24 | | | 1,750 | | | | 1,875,753 | |
4.00%, 01/22/25 | | | 750 | | | | 800,991 | |
3.88%, 08/01/25 | | | 2,250 | | | | 2,438,796 | |
4.45%, 03/03/26 | | | 1,340 | | | | 1,475,283 | |
3.50%, 04/19/26(a) | | | 645 | | | | 694,786 | |
4.25%, 10/22/26 | | | 1,290 | | | | 1,423,389 | |
3.25%, 10/21/27 | | | 1,375 | | | | 1,463,553 | |
6.11%, 01/29/37 | | | 350 | | | | 470,811 | |
7.75%, 05/14/38(a) | | | 200 | | | | 313,371 | |
5.88%, 02/07/42 | | | 1,100 | | | | 1,561,897 | |
5.00%, 01/21/44 | | | 1,250 | | | | 1,641,460 | |
4.88%, 04/01/44 | | | 1,000 | | | | 1,301,167 | |
(3 mo. LIBOR US + 0.64%), 2.02%, 02/13/26 | | | 1,400 | | | | 1,418,018 | |
(3 mo. LIBOR US + 0.78%), 3.55%, 03/05/24(b) | | | 2,000 | | | | 2,059,444 | |
(3 mo. LIBOR US + 0.81%), 3.37%, 01/23/26(b) | | | 2,000 | | | | 2,103,991 | |
(3 mo. LIBOR US + 0.87%), 2.46%, 10/22/25(b) | | | 385 | | | | 395,419 | |
(3 mo. LIBOR US + 0.94%), 3.86%, 07/23/24(b) | | | 1,500 | | | | 1,562,787 | |
(3 mo. LIBOR US + 0.97%), 3.46%, 03/15/25(b) | | | 1,000 | | | | 1,045,811 | |
(3 mo. LIBOR US + 0.99%), 2.50%, 02/13/31(b) | | | 3,500 | | | | 3,508,920 | |
(3 mo. LIBOR US + 1.04%), 3.42%, 12/20/28(b) | | | 5,544 | | | | 5,919,133 | |
(3 mo. LIBOR US + 1.06%), 3.56%, 04/23/27(b) | | | 1,000 | | | | 1,069,352 | |
(3 mo. LIBOR US + 1.07%), 3.97%, 03/05/29 | | | 1,000 | | | | 1,094,227 | |
(3 mo. LIBOR US + 1.09%), 3.09%, 10/01/25(b) | | | 1,000 | | | | 1,040,488 | |
(3 mo. LIBOR US + 1.18%), 3.19%, 07/23/30(b) | | | 4,965 | | | | 5,236,033 | |
(3 mo. LIBOR US + 1.19%), 2.88%, 10/22/30(b) | | | 1,000 | | | | 1,032,548 | |
| | |
MASTER PORTFOLIO SCHEDULE OF INVESTMENTS | | 31 |
| | |
Schedule of Investments (continued) December 31, 2021 | | U.S. Total Bond Index Master Portfolio (Percentages shown are based on Net Assets) |
| | | | | | | | |
| Security | | Par
(000) | | | Value | |
|
Diversified Financial Services (continued) | |
Bank of America Corp. (continued) | |
(3 mo. LIBOR US + 1.19%), 3.95%, 01/23/49(b) | | $ | 600 | | | $ | 700,428 | |
(3 mo. LIBOR US + 1.21%), 3.97%, 02/07/30(b) | | | 2,650 | | | | 2,919,066 | |
(3 mo. LIBOR US + 1.31%), 4.27%, 07/23/29(b) | | | 1,450 | | | | 1,616,665 | |
(3 mo. LIBOR US + 1.32%), 4.08%, 04/23/40(b) | | | 1,000 | | | | 1,148,840 | |
(3 mo. LIBOR US + 1.37%), 3.59%, 07/21/28(b) | | | 500 | | | | 538,140 | |
(3 mo. LIBOR US + 1.51%), 3.71%, 04/24/28(b) | | | 1,000 | | | | 1,085,232 | |
(3 mo. LIBOR US + 1.52%), 4.33%, 03/15/50(b) | | | 2,000 | | | | 2,474,219 | |
(3 mo. LIBOR US + 1.58%), 3.82%, 01/20/28(b) | | | 2,000 | | | | 2,165,752 | |
(3 mo. LIBOR US + 1.81%), 4.24%, 04/24/38(b) | | | 1,500 | | | | 1,760,006 | |
(3 mo. LIBOR US + 1.99%), 4.44%, 01/20/48 | | | 1,150 | | | | 1,429,021 | |
(3 mo. LIBOR US + 3.15%), 4.08%, 03/20/51(b) | | | 3,900 | | | | 4,691,024 | |
(5 year CMT + 1.20%), 2.48%, 09/21/36(b) | | | 2,000 | | | | 1,937,340 | |
(SOFR + 0.41%), 0.52%, 06/14/24(b) | | | 900 | | | | 894,027 | |
(SOFR + 0.65%), 1.53%, 12/06/25(b) | | | 1,000 | | | | 1,001,630 | |
(SOFR + 0.69%), 0.98%, 04/22/25(b) | | | 1,000 | | | | 991,983 | |
(SOFR + 0.74%), 0.81%, 10/24/24 | | | 1,600 | | | | 1,589,333 | |
(SOFR + 0.91%), 1.66%, 03/11/27(b) | | | 1,700 | | | | 1,688,063 | |
(SOFR + 0.96%), 1.73%, 07/22/27(b) | | | 4,300 | | | | 4,268,685 | |
(SOFR + 1.01%), 1.20%, 10/24/26(b) | | | 1,100 | | | | 1,078,046 | |
(SOFR + 1.06%), 2.09%, 06/14/29(b) | | | 2,000 | | | | 1,985,942 | |
(SOFR + 1.15%), 1.32%, 06/19/26(b) | | | 1,700 | | | | 1,681,945 | |
(SOFR + 1.21%), 2.57%, 10/20/32(b) | | | 2,205 | | | | 2,215,593 | |
(SOFR + 1.22%), 2.65%, 03/11/32(b) | | | 1,700 | | | | 1,721,842 | |
(SOFR + 1.22%), 2.30%, 07/21/32(b) | | | 400 | | | | 393,283 | |
(SOFR + 1.32%), 2.69%, 04/22/32(b) | | | 3,145 | | | | 3,191,629 | |
(SOFR + 1.37%), 1.92%, 10/24/31(b) | | | 1,700 | | | | 1,627,677 | |
(SOFR + 1.53%), 1.90%, 07/23/31(b) | | | 2,000 | | | | 1,914,151 | |
(SOFR + 1.56%), 2.97%, 07/21/52(b) | | | 200 | | | | 200,595 | |
(SOFR + 1.58%), 3.31%, 04/22/42(b) | | | 3,000 | | | | 3,153,060 | |
(SOFR + 1.65%), 3.48%, 03/13/52(b) | | | 715 | | | | 788,971 | |
(SOFR + 1.88%), 2.83%, 10/24/51(a)(b) | | | 815 | | | | 800,163 | |
(SOFR + 1.93%), 2.68%, 06/19/41(b) | | | 3,000 | | | | 2,887,706 | |
(SOFR + 2.15%), 2.59%, 04/29/31(b) | | | 2,700 | | | | 2,727,472 | |
Series L, 3.95%, 04/21/25 | | | 2,155 | | | | 2,303,482 | |
Series L, 4.18%, 11/25/27 | | | 1,000 | | | | 1,094,143 | |
Bank of Nova Scotia | | | | | | | | |
2.38%, 01/18/23 | | | 475 | | | | 483,151 | |
3.40%, 02/11/24 | | | 1,000 | | | | 1,049,213 | |
0.65%, 07/31/24 | | | 1,565 | | | | 1,545,362 | |
2.20%, 02/03/25(a) | | | 2,000 | | | | 2,046,009 | |
4.50%, 12/16/25 | | | 250 | | | | 274,612 | |
1.35%, 06/24/26 | | | 2,000 | | | | 1,976,251 | |
2.70%, 08/03/26(a) | | | 500 | | | | 521,214 | |
1.30%, 09/15/26(a) | | | 1,400 | | | | 1,372,088 | |
2.15%, 08/01/31 | | | 1,000 | | | | 992,162 | |
Barclays PLC | | | | | | | | |
3.68%, 01/10/23 | | | 1,500 | | | | 1,500,697 | |
3.65%, 03/16/25 | | | 450 | | | | 475,292 | |
4.38%, 01/12/26 | | | 2,000 | | | | 2,186,395 | |
5.20%, 05/12/26 | | | 1,000 | | | | 1,115,870 | |
| | | | | | | | |
| Security | | Par
(000) | | | Value | |
|
Diversified Financial Services (continued) | |
Barclays PLC (continued) | |
4.34%, 01/10/28 | | $ | 750 | | | $ | 818,831 | |
4.84%, 05/09/28(a) | | | 1,000 | | | | 1,101,578 | |
5.25%, 08/17/45(a) | | | 250 | | | | 330,992 | |
4.95%, 01/10/47 | | | 1,000 | | | | 1,294,779 | |
(1 year CMT + 1.05%), 2.28%, 11/24/27(b) | | | 1,000 | | | | 1,001,783 | |
(1 year CMT + 1.20%), 2.67%, 03/10/32(b) | | | 2,000 | | | | 1,983,537 | |
(1 year CMT + 1.30%), 3.33%, 11/24/42(b) | | | 1,000 | | | | 1,017,620 | |
(1 year CMT + 1.90%), 2.65%, 06/24/31(b) | | | 2,000 | | | | 1,991,432 | |
(3 mo. LIBOR US + 1.36%), 4.34%, 05/16/24(b) | | | 2,000 | | | | 2,081,951 | |
(3 mo. LIBOR US + 1.61%), 3.93%, 05/07/25(a)(b) | | | 4,000 | | | | 4,206,616 | |
(3 mo. LIBOR US + 1.90%), 4.97%, 05/16/29(b) | | | 2,250 | | | | 2,566,395 | |
(3 mo. LIBOR US + 3.05%), 5.09%, 06/20/30(b) | | | 1,000 | | | | 1,134,332 | |
(5 year CMT + 2.90%), 3.56%, 09/23/35(b) | | | 1,000 | | | | 1,024,134 | |
(SOFR + 2.71%), 2.85%, 05/07/26(b) | | | 500 | | | | 515,678 | |
Blackstone Private Credit Fund(c) | | | | | | | | |
2.63%, 12/15/26 | | | 300 | | | | 292,487 | |
3.25%, 03/15/27 | | | 1,200 | | | | 1,212,395 | |
BNP Paribas SA | | | | | | | | |
3.25%, 03/03/23 | | | 250 | | | | 257,413 | |
4.25%, 10/15/24(a) | | | 500 | | | | 539,228 | |
Cboe Global Markets, Inc., 1.63%, 12/15/30 | | | 1,700 | | | | 1,614,738 | |
Citigroup, Inc. | | | | | | | | |
3.50%, 05/15/23 | | | 3,500 | | | | 3,618,140 | |
3.88%, 10/25/23 | | | 3,000 | | | | 3,161,784 | |
3.88%, 03/26/25(a) | | | 500 | | | | 533,605 | |
3.30%, 04/27/25 | | | 155 | | | | 164,621 | |
4.40%, 06/10/25 | | | 500 | | | | 544,514 | |
5.50%, 09/13/25 | | | 1,000 | | | | 1,130,924 | |
3.70%, 01/12/26 | | | 1,000 | | | | 1,081,275 | |
4.60%, 03/09/26 | | | 750 | | | | 827,139 | |
3.40%, 05/01/26(a) | | | 500 | | | | 536,130 | |
3.20%, 10/21/26 | | | 2,500 | | | | 2,649,221 | |
4.30%, 11/20/26 | | | 150 | | | | 165,971 | |
4.45%, 09/29/27 | | | 3,000 | | | | 3,345,060 | |
4.13%, 07/25/28 | | | 750 | | | | 823,055 | |
6.63%, 06/15/32 | | | 100 | | | | 132,660 | |
6.13%, 08/25/36(a) | | | 184 | | | | 250,601 | |
8.13%, 07/15/39 | | | 575 | | | | 972,159 | |
5.88%, 01/30/42 | | | 2,500 | | | | 3,533,203 | |
6.68%, 09/13/43 | | | 250 | | | | 375,867 | |
5.30%, 05/06/44 | | | 500 | | | | 652,416 | |
4.65%, 07/30/45 | | | 750 | | | | 945,705 | |
4.75%, 05/18/46 | | | 1,500 | | | | 1,844,468 | |
4.65%, 07/23/48 | | | 1,500 | | | | 1,926,064 | |
(3 mo. LIBOR US + 0.90%), 3.35%, 04/24/25(b) | | | 4,000 | | | | 4,176,595 | |
(3 mo. LIBOR US + 1.15%), 3.52%, 10/27/28(b) | | | 2,000 | | | | 2,145,363 | |
(3 mo. LIBOR US + 1.34%), 3.98%, 03/20/30(b) | | | 2,500 | | | | 2,759,724 | |
(3 mo. LIBOR US + 1.39%), 3.67%, 07/24/28(b) | | | 1,000 | | | | 1,078,542 | |
(3 mo. LIBOR US + 1.56%), 3.89%, 01/10/28(b) | | | 1,000 | | | | 1,084,169 | |
(3 mo. LIBOR US + 1.84%), 4.28%, 04/24/48(b) | | | 1,000 | | | | 1,226,949 | |
| | |
| 32 | | 2 0 2 1 BLACK ROCK ANNUAL REPORT TO SHAREHOLDERS |
| | |
Schedule of Investments (continued) December 31, 2021 | | U.S. Total Bond Index Master Portfolio (Percentages shown are based on Net Assets) |
| | | | | | | | |
| Security | | Par
(000) | | | Value | |
|
| Diversified Financial Services (continued) | |
Citigroup, Inc. (continued) | |
(SOFR + 0.53%), 1.28%, 11/03/25(b) | | $ | 445 | | | $ | 443,803 | |
(SOFR + 0.67%), 0.98%, 05/01/25(b) | | | 690 | | | | 684,559 | |
(SOFR + 0.77%), 1.12%, 01/28/27(b) | | | 2,200 | | | | 2,142,768 | |
(SOFR + 0.77%), 1.46%, 06/09/27(b) | | | 3,205 | | | | 3,150,326 | |
(SOFR + 1.15%), 2.67%, 01/29/31(a)(b) | | | 1,000 | | | | 1,015,136 | |
(SOFR + 1.17%), 2.56%, 05/01/32(b) | | | 1,205 | | | | 1,211,249 | |
(SOFR + 1.18%), 2.52%, 11/03/32(b) | | | 340 | | | | 339,597 | |
(SOFR + 1.38%), 2.90%, 11/03/42(b) | | | 495 | | | | 490,114 | |
(SOFR + 1.42%), 2.98%, 11/05/30(b) | | | 1,000 | | | | 1,038,455 | |
(SOFR + 1.67%), 1.68%, 05/15/24(b) | | | 1,000 | | | | 1,011,089 | |
(SOFR + 2.11%), 2.57%, 06/03/31(a)(b) | | | 1,500 | | | | 1,512,973 | |
(SOFR + 2.84%), 3.11%, 04/08/26(b) | | | 1,400 | | | | 1,467,658 | |
(SOFR + 3.91%), 4.41%, 03/31/31(b) | | | 2,400 | | | | 2,740,943 | |
(SOFR + 4.55%), 5.32%, 03/26/41(b) | | | 2,400 | | | | 3,172,010 | |
Clorox Co. | |
3.50%, 12/15/24(a) | | | 250 | | | | 266,276 | |
3.10%, 10/01/27 | | | 500 | | | | 530,629 | |
CME Group, Inc. | |
3.00%, 03/15/25(a) | | | 1,250 | | | | 1,312,186 | |
3.75%, 06/15/28 | | | 1,000 | | | | 1,112,262 | |
5.30%, 09/15/43 | | | 100 | | | | 138,987 | |
Credit Suisse Group AG | |
3.80%, 06/09/23 | | | 1,000 | | | | 1,036,049 | |
3.75%, 03/26/25 | | | 2,500 | | | | 2,652,761 | |
4.55%, 04/17/26 | | | 2,250 | | | | 2,478,917 | |
4.88%, 05/15/45(a) | | | 1,500 | | | | 1,899,173 | |
Deutsche Bank AG | |
3.95%, 02/27/23 | | | 2,000 | | | | 2,062,277 | |
0.96%, 11/08/23 | | | 475 | | | | 474,154 | |
0.90%, 05/28/24 | | | 330 | | | | 327,118 | |
3.70%, 05/30/24 | | | 215 | | | | 225,753 | |
4.10%, 01/13/26 | | | 350 | | | | 375,422 | |
1.69%, 03/19/26(a) | | | 570 | | | | 567,192 | |
(SOFR + 1.22%), 2.31%, 11/16/27(b) | | | 1,020 | | | | 1,019,546 | |
(SOFR + 1.72%), 3.04%, 05/28/32(b) | | | 475 | | | | 478,628 | |
(SOFR + 1.87%), 2.13%, 11/24/26(b) | | | 1,405 | | | | 1,402,694 | |
(SOFR + 2.16%), 2.22%, 09/18/24(b) | | | 1,435 | | | | 1,453,458 | |
(SOFR + 2.58%), 3.96%, 11/26/25(b) | | | 800 | | | | 844,759 | |
(SOFR + 3.04%), 3.55%, 09/18/31(b) | | | 855 | | | | 899,855 | |
GE Capital Funding LLC, 4.55%, 05/15/32 | | | 1,000 | | | | 1,182,846 | |
GE Capital International Funding Co., 4.42%, 11/15/35 | | | 3,071 | | | | 3,664,809 | |
Goldman Sachs Group, Inc. | |
3.63%, 01/22/23 | | | 150 | | | | 154,477 | |
3.63%, 02/20/24 | | | 1,000 | | | | 1,049,057 | |
4.00%, 03/03/24 | | | 3,425 | | | | 3,631,424 | |
3.85%, 07/08/24 | | | 500 | | | | 529,032 | |
3.50%, 01/23/25 | | | 3,750 | | | | 3,953,400 | |
3.50%, 04/01/25 | | | 1,915 | | | | 2,024,986 | |
3.75%, 05/22/25 | | | 2,250 | | | | 2,401,219 | |
4.25%, 10/21/25 | | | 1,050 | | | | 1,145,082 | |
3.75%, 02/25/26(a) | | | 380 | | | | 409,225 | |
3.50%, 11/16/26 | | | 2,000 | | | | 2,131,398 | |
5.95%, 01/15/27(a) | | | 250 | | | | 294,693 | |
3.85%, 01/26/27 | | | 2,000 | | | | 2,149,544 | |
2.60%, 02/07/30(a) | | | 2,000 | | | | 2,033,492 | |
3.80%, 03/15/30 | | | 2,600 | | | | 2,862,122 | |
6.75%, 10/01/37 | | | 1,650 | | | | 2,339,533 | |
6.25%, 02/01/41 | | | 1,000 | | | | 1,453,744 | |
4.80%, 07/08/44 | | | 1,250 | | | | 1,596,445 | |
| | | | | | | | |
| Security | | Par
(000) | | | Value | |
|
| Diversified Financial Services (continued) | |
Goldman Sachs Group, Inc. (continued) | |
5.15%, 05/22/45 | | $ | 1,500 | | | $ | 1,950,701 | |
4.75%, 10/21/45 | | | 1,750 | | | | 2,252,393 | |
(3 mo. LIBOR US + 1.16%), 3.81%, 04/23/29(b) | | | 2,000 | | | | 2,175,506 | |
(3 mo. LIBOR US + 1.20%), 3.27%, 09/29/25(b) | | | 1,000 | | | | 1,049,243 | |
(3 mo. LIBOR US + 1.30%), 4.22%, 05/01/29(b) | | | 3,000 | | | | 3,332,481 | |
(3 mo. LIBOR US + 1.37%), 4.02%, 10/31/38(b) | | | 2,000 | | | | 2,287,458 | |
(3 mo. LIBOR US + 1.43%), 4.41%, 04/23/39(b) | | | 2,400 | | | | 2,866,916 | |
(3 mo. LIBOR US + 1.51%), 3.69%, 06/05/28(b) | | | 2,500 | | | | 2,692,111 | |
(SOFR + 0.49%), 0.93%, 10/21/24(b) | | | 1,000 | | | | 995,698 | |
(SOFR + 0.51%), 0.66%, 09/10/24(b) | | | 2,000 | | | | 1,983,217 | |
(SOFR + 0.57%), 0.67%, 03/08/24(b) | | | 1,500 | | | | 1,493,223 | |
(SOFR + 0.80%), 1.43%, 03/09/27(b) | | | 2,500 | | | | 2,449,061 | |
(SOFR + 0.82%), 1.54%, 09/10/27(b) | | | 2,000 | | | | 1,959,477 | |
(SOFR + 0.91%), 1.95%, 10/21/27(b) | | | 1,650 | | | | 1,642,741 | |
(SOFR + 1.09%), 1.99%, 01/27/32(b) | | | 1,460 | | | | 1,399,814 | |
(SOFR + 1.25%), 2.38%, 07/21/32(b) | | | 2,800 | | | | 2,756,869 | |
(SOFR + 1.26%), 2.65%, 10/21/32(b) | | | 1,605 | | | | 1,615,042 | |
(SOFR + 1.28%), 2.62%, 04/22/32(b) | | | 3,355 | | | | 3,379,094 | |
(SOFR + 1.47%), 2.91%, 07/21/42(b) | | | 2,000 | | | | 1,988,407 | |
(SOFR + 1.51%), 3.21%, 04/22/42(b) | | | 1,000 | | | | 1,037,087 | |
Series VAR, (SOFR + 0.79%), 1.09%, 12/09/26(b) | | | 3,000 | | | | 2,923,374 | |
HSBC Holdings PLC | | | | | | | | |
3.60%, 05/25/23 | | | 3,750 | | | | 3,888,748 | |
4.25%, 03/14/24 | | | 500 | | | | 527,961 | |
4.25%, 08/18/25(a) | | | 500 | | | | 537,608 | |
4.30%, 03/08/26 | | | 1,000 | | | | 1,095,780 | |
3.90%, 05/25/26 | | | 3,000 | | | | 3,235,385 | |
4.38%, 11/23/26 | | | 2,000 | | | | 2,194,243 | |
4.95%, 03/31/30 | | | 1,353 | | | | 1,587,611 | |
6.50%, 05/02/36 | | | 200 | | | | 271,725 | |
6.50%, 09/15/37 | | | 750 | | | | 1,037,661 | |
6.80%, 06/01/38 | | | 250 | | | | 353,844 | |
6.10%, 01/14/42(a) | | | 1,000 | | | | 1,429,771 | |
5.25%, 03/14/44(a) | | | 1,250 | | | | 1,630,516 | |
(3 mo. LIBOR US + 0.99%), 3.95%, 05/18/24(b) | | | 3,380 | | | | 3,505,253 | |
(3 mo. LIBOR US + 1.21%), 3.80%, 03/11/25(b) | | | 1,000 | | | | 1,049,372 | |
(3 mo. LIBOR US + 1.35%), 4.29%, 09/12/26(a)(b) | | | 3,000 | | | | 3,238,820 | |
(3 mo. LIBOR US + 1.53%), 4.58%, 06/19/29(b) | | | 3,000 | | | | 3,360,736 | |
(3 mo. LIBOR US + 1.55%), 4.04%, 03/13/28(b) | | | 3,000 | | | | 3,242,827 | |
(3 mo. LIBOR US + 1.61%), 3.97%, 05/22/30(b) | | | 3,000 | | | | 3,254,244 | |
(SOFR + 0.58%), 1.16%, 11/22/24(b) | | | 1,110 | | | | 1,106,706 | |
(SOFR + 0.71%), 0.98%, 05/24/25(b) | | | 560 | | | | 553,229 | |
(SOFR + 1.10%), 2.25%, 11/22/27(b) | | | 1,250 | | | | 1,252,604 | |
(SOFR + 1.19%), 2.80%, 05/24/32(b) | | | 2,730 | | | | 2,738,469 | |
(SOFR + 1.29%), 2.21%, 08/17/29(b) | | | 745 | | | | 730,563 | |
(SOFR + 1.40%), 2.63%, 11/07/25(b) | | | 1,000 | | | | 1,025,686 | |
(SOFR + 1.41%), 2.87%, 11/22/32(b) | | | 2,000 | | | | 2,016,595 | |
| | |
MASTER PORTFOLIO SCHEDULE OF INVESTMENTS | | 33 |
| | |
Schedule of Investments (continued) December 31, 2021 | | U.S. Total Bond Index Master Portfolio (Percentages shown are based on Net Assets) |
| | | | | | | | |
| Security | | Par
(000) | | | Value | |
|
| Diversified Financial Services (continued) | |
HSBC Holdings PLC (continued) | |
(SOFR + 1.54%), 1.65%, 04/18/26(b) | | $ | 1,740 | | | $ | 1,725,577 | |
(SOFR + 1.73%), 2.01%, 09/22/28(b) | | | 1,000 | | | | 978,895 | |
(SOFR + 1.95%), 2.36%, 08/18/31(b) | | | 2,000 | | | | 1,953,988 | |
(SOFR + 2.39%), 2.85%, 06/04/31(b) | | | 2,000 | | | | 2,023,099 | |
Intercontinental Exchange, Inc. | | | | | | | | |
4.00%, 10/15/23 | | | 2,000 | | | | 2,104,048 | |
3.75%, 12/01/25 | | | 1,115 | | | | 1,204,986 | |
3.75%, 09/21/28 | | | 1,135 | | | | 1,253,232 | |
2.10%, 06/15/30 | | | 770 | | | | 763,010 | |
1.85%, 09/15/32 | | | 165 | | | | 157,936 | |
2.65%, 09/15/40 | | | 1,000 | | | | 965,682 | |
4.25%, 09/21/48 | | | 500 | | | | 611,134 | |
3.00%, 06/15/50 | | | 435 | | | | 439,868 | |
3.00%, 09/15/60 | | | 1,550 | | | | 1,524,761 | |
John Deere Capital Corp. | | | | | | | | |
2.80%, 03/06/23 | | | 500 | | | | 512,328 | |
3.45%, 06/07/23(a) | | | 2,000 | | | | 2,072,888 | |
3.45%, 01/10/24(a) | | | 1,000 | | | | 1,050,517 | |
0.45%, 01/17/24 | | | 250 | | | | 247,577 | |
0.45%, 06/07/24 | | | 405 | | | | 399,950 | |
0.63%, 09/10/24(a) | | | 160 | | | | 158,201 | |
2.05%, 01/09/25 | | | 1,000 | | | | 1,027,492 | |
0.70%, 01/15/26 | | | 900 | | | | 872,743 | |
1.05%, 06/17/26(a) | | | 2,000 | | | | 1,965,600 | |
2.25%, 09/14/26 | | | 500 | | | | 515,475 | |
3.05%, 01/06/28 | | | 300 | | | | 320,716 | |
1.50%, 03/06/28(a) | | | 250 | | | | 246,441 | |
2.80%, 07/18/29 | | | 630 | | | | 664,464 | |
2.45%, 01/09/30(a) | | | 300 | | | | 308,993 | |
1.45%, 01/15/31 | | | 900 | | | | 856,691 | |
2.00%, 06/17/31 | | | 2,000 | | | | 1,999,008 | |
JPMorgan Chase & Co. | | | | | | | | |
2.97%, 01/15/23 | | | 2,000 | | | | 2,001,378 | |
3.20%, 01/25/23 | | | 3,150 | | | | 3,235,427 | |
3.38%, 05/01/23 | | | 3,500 | | | | 3,608,319 | |
2.70%, 05/18/23 | | | 2,500 | | | | 2,556,726 | |
3.88%, 02/01/24(a) | | | 2,000 | | | | 2,117,252 | |
3.63%, 05/13/24(a) | | | 1,000 | | | | 1,057,707 | |
3.88%, 09/10/24 | | | 1,300 | | | | 1,378,871 | |
3.13%, 01/23/25(a) | | | 1,250 | | | | 1,312,534 | |
3.90%, 07/15/25 | | | 2,250 | | | | 2,435,118 | |
3.30%, 04/01/26(a) | | | 500 | | | | 533,236 | |
3.20%, 06/15/26 | | | 1,000 | | | | 1,060,420 | |
2.95%, 10/01/26 | | | 3,000 | | | | 3,166,930 | |
7.63%, 10/15/26(a) | | | 500 | | | | 628,811 | |
4.13%, 12/15/26 | | | 250 | | | | 275,743 | |
4.25%, 10/01/27 | | | 500 | | | | 560,877 | |
3.63%, 12/01/27 | | | 1,000 | | | | 1,077,521 | |
6.40%, 05/15/38 | | | 1,100 | | | | 1,600,435 | |
5.50%, 10/15/40 | | | 125 | | | | 170,037 | |
5.60%, 07/15/41(a) | | | 550 | | | | 761,591 | |
5.40%, 01/06/42 | | | 400 | | | | 543,936 | |
5.63%, 08/16/43 | | | 500 | | | | 698,901 | |
4.85%, 02/01/44 | | | 100 | | | | 130,637 | |
4.95%, 06/01/45 | | | 1,250 | | | | 1,626,649 | |
(3 mo. LIBOR US + 0.73%), 3.56%, 04/23/24(b) | | | 1,500 | | | | 1,550,081 | |
(3 mo. LIBOR US + 0.89%), 3.80%, 07/23/24(b) | | | 2,500 | | | | 2,605,439 | |
| | | | | | | | |
| Security | | Par
(000) | | | Value | |
|
| Diversified Financial Services (continued) | |
JPMorgan Chase & Co. (continued) | |
(3 mo. LIBOR US + 0.95%), 3.51%, 01/23/29(b) | | $ | 1,000 | | | $ | 1,071,241 | |
(3 mo. LIBOR US + 1.00%), 4.02%, 12/05/24(b) | | | 2,000 | | | | 2,108,735 | |
(3 mo. LIBOR US + 1.12%), 4.01%, 04/23/29(b) | | | 4,000 | | | | 4,415,020 | |
(3 mo. LIBOR US + 1.16%), 3.22%, 03/01/25(a)(b) | | | 2,000 | | | | 2,079,129 | |
(3 mo. LIBOR US + 1.16%), 3.70%, 05/06/30(b) | | | 1,000 | | | | 1,092,852 | |
(3 mo. LIBOR US + 1.22%), 3.90%, 01/23/49(b) | | | 1,750 | | | | 2,027,359 | |
(3 mo. LIBOR US + 1.26%), 4.20%, 07/23/29(b) | | | 1,175 | | | | 1,314,392 | |
(3 mo. LIBOR US + 1.33%), 4.45%, 12/05/29(a)(b) | | | 2,500 | | | | 2,837,236 | |
(3 mo. LIBOR US + 1.34%), 3.78%, 02/01/28(b) | | | 2,000 | | | | 2,165,066 | |
(3 mo. LIBOR US + 1.36%), 3.88%, 07/24/38(b) | | | 1,000 | | | | 1,135,001 | |
(3 mo. LIBOR US + 1.38%), 3.54%, 05/01/28(a)(b) | | | 1,750 | | | | 1,900,559 | |
(3 mo. LIBOR US + 1.38%), 3.96%, 11/15/48(b) | | | 2,500 | | | | 2,932,079 | |
(3 mo. LIBOR US + 1.46%), 4.03%, 07/24/48(b) | | | 1,500 | | | | 1,770,652 | |
(3 mo. LIBOR US + 1.58%), 4.26%, 02/22/48(a)(b) | | | 1,000 | | | | 1,222,470 | |
(SOFR + 0.49%), 0.77%, 08/09/25(b) | | | 1,000 | | | | 984,153 | |
(SOFR + 0.54%), 0.82%, 06/01/25(b) | | | 1,305 | | | | 1,289,763 | |
(SOFR + 0.58%), 0.97%, 06/23/25(b) | | | 1,000 | | | | 990,266 | |
(SOFR + 0.61%), 1.56%, 12/10/25(b) | | | 1,000 | | | | 1,001,067 | |
(SOFR + 0.77%), 1.47%, 09/22/27(b) | | | 1,000 | | | | 980,227 | |
(SOFR + 0.89%), 1.58%, 04/22/27(b) | | | 300 | | | | 296,464 | |
(SOFR + 1.02%), 2.07%, 06/01/29(a)(b) | | | 1,400 | | | | 1,388,318 | |
(SOFR + 1.07%), 1.95%, 02/04/32(b) | | | 2,000 | | | | 1,926,326 | |
(SOFR + 1.11%), 1.76%, 11/19/31(a)(b) | | | 1,000 | | | | 947,795 | |
(SOFR + 1.16%), 2.30%, 10/15/25(b) | | | 500 | | | | 511,354 | |
(SOFR + 1.18%), 2.55%, 11/08/32(b) | | | 3,610 | | | | 3,630,295 | |
(SOFR + 1.25%), 2.58%, 04/22/32(b) | | | 1,465 | | | | 1,483,824 | |
(SOFR + 1.46%), 1.51%, 06/01/24(b) | | | 2,000 | | | | 2,015,183 | |
(SOFR + 1.46%), 3.16%, 04/22/42(b) | | | 2,300 | | | | 2,400,925 | |
(SOFR + 1.51%), 2.74%, 10/15/30(a)(b) | | | 3,000 | | | | 3,082,450 | |
(SOFR + 1.51%), 2.53%, 11/19/41(b) | | | 1,500 | | | | 1,426,347 | |
(SOFR + 1.58%), 3.33%, 04/22/52(b) | | | 2,700 | | | | 2,889,056 | |
(SOFR + 1.59%), 2.01%, 03/13/26(b) | | | 1,300 | | | | 1,315,331 | |
(SOFR + 1.85%), 2.08%, 04/22/26(b) | | | 3,100 | | | | 3,146,403 | |
(SOFR + 2.04%), 2.52%, 04/22/31(b) | | | 1,600 | | | | 1,617,172 | |
(SOFR + 2.44%), 3.11%, 04/22/51(b) | | | 2,700 | | | | 2,789,559 | |
(SOFR + 2.46%), 3.11%, 04/22/41(b) | | | 1,100 | | | | 1,139,214 | |
(SOFR + 2.52%), 2.96%, 05/13/31(b) | | | 2,000 | | | | 2,070,747 | |
(SOFR + 3.79%), 4.49%, 03/24/31(b) | | | 2,000 | | | | 2,314,417 | |
Kimberly-Clark Corp. | | | | | | | | |
2.65%, 03/01/25 | | | 85 | | | | 88,938 | |
2.75%, 02/15/26(a) | | | 500 | | | | 528,600 | |
2.00%, 11/02/31 | | | 300 | | | | 298,437 | |
5.30%, 03/01/41 | | | 250 | | | | 336,933 | |
3.20%, 07/30/46(a) | | | 210 | | | | 229,286 | |
3.90%, 05/04/47(a) | | | 750 | | | | 898,551 | |
| | |
| 34 | | 2 0 2 1 BLACK ROCK ANNUAL REPORT TO SHAREHOLDERS |
| | |
Schedule of Investments (continued) December 31, 2021 | | U.S. Total Bond Index Master Portfolio (Percentages shown are based on Net Assets) |
| | | | | | | | |
| Security | | Par
(000) | | | Value | |
|
| Diversified Financial Services (continued) | |
Kimberly-Clark Corp. (continued) | |
2.88%, 02/07/50(a) | | $ | 800 | | | $ | 820,080 | |
Lloyds Banking Group PLC | | | | | | | | |
4.05%, 08/16/23(a) | | | 500 | | | | 523,851 | |
3.90%, 03/12/24 | | | 500 | | | | 528,155 | |
4.50%, 11/04/24 | | | 2,000 | | | | 2,154,666 | |
4.45%, 05/08/25 | | | 500 | | | | 543,119 | |
4.58%, 12/10/25 | | | 250 | | | | 272,709 | |
4.65%, 03/24/26 | | | 750 | | | | 825,644 | |
4.38%, 03/22/28 | | | 1,000 | | | | 1,121,841 | |
4.55%, 08/16/28 | | | 2,000 | | | | 2,274,668 | |
5.30%, 12/01/45 | | | 850 | | | | 1,123,175 | |
4.34%, 01/09/48 | | | 1,300 | | | | 1,515,268 | |
(1 year CMT + 1.00%), 2.44%, 02/05/26(b) | | | 340 | | | | 346,624 | |
(1 year CMT + 3.50%), 3.87%, 07/09/25(b) | | | 1,000 | | | | 1,056,378 | |
(3 mo. LIBOR US + 1.21%), 3.57%, 11/07/28(a)(b) | | | 500 | | | | 534,004 | |
Mitsubishi UFJ Financial Group, Inc. | | | | | | | | |
3.46%, 03/02/23 | | | 3,000 | | | | 3,088,741 | |
3.76%, 07/26/23 | | | 1,500 | | | | 1,564,308 | |
2.53%, 09/13/23 | | | 1,000 | | | | 1,025,905 | |
2.80%, 07/18/24 | | | 1,000 | | | | 1,036,479 | |
2.19%, 02/25/25 | | | 500 | | | | 509,899 | |
3.85%, 03/01/26 | | | 500 | | | | 540,972 | |
2.76%, 09/13/26 | | | 250 | | | | 259,972 | |
3.29%, 07/25/27(a) | | | 1,000 | | | | 1,067,954 | |
3.96%, 03/02/28 | | | 1,000 | | | | 1,108,926 | |
3.74%, 03/07/29 | | | 2,000 | | | | 2,184,863 | |
2.56%, 02/25/30 | | | 2,000 | | | | 2,016,918 | |
2.05%, 07/17/30 | | | 2,000 | | | | 1,942,497 | |
4.29%, 07/26/38(a) | | | 250 | | | | 299,745 | |
3.75%, 07/18/39 | | | 1,010 | | | | 1,144,980 | |
(1 year CMT + 0.45%), 0.96%, 10/11/25(b) | | | 410 | | | | 404,297 | |
(1 year CMT + 0.55%), 0.95%, 07/19/25(a)(b) | | | 2,500 | | | | 2,469,331 | |
(1 year CMT + 0.67%), 1.64%, 10/13/27(b) | | | 500 | | | | 493,467 | |
(1 year CMT + 0.68%), 0.85%, 09/15/24(b) | | | 2,000 | | | | 1,990,096 | |
(1 year CMT + 0.75%), 1.54%, 07/20/27(b) | | | 500 | | | | 491,097 | |
(1 year CMT + 0.95%), 2.31%, 07/20/32(b) | | | 500 | | | | 492,994 | |
(1 year CMT + 0.97%), 2.49%, 10/13/32(b) | | | 215 | | | | 215,266 | |
Mizuho Financial Group, Inc. | | | | | | | | |
3.55%, 03/05/23 | | | 2,000 | | | | 2,062,364 | |
3.17%, 09/11/27 | | | 1,000 | | | | 1,053,506 | |
2.56%, 09/13/31 | | | 2,000 | | | | 1,949,289 | |
(1 year CMT + 0.67%), 1.23%, 05/22/27(b) | | | 2,000 | | | | 1,939,066 | |
(1 year CMT + 0.75%), 1.55%, 07/09/27(b) | | | 500 | | | | 491,897 | |
(1 year CMT + 0.90%), 2.26%, 07/09/32(a)(b) | | | 500 | | | | 488,577 | |
(3 mo. LIBOR US + 1.00%), 3.92%, 09/11/24(b) | | | 2,000 | | | | 2,089,402 | |
(3 mo. LIBOR US + 1.13%), 3.15%, 07/16/30(a)(b) | | | 1,000 | | | | 1,048,540 | |
(SOFR + 0.87%), 0.85%, 09/08/24(b) | | | 2,000 | | | | 1,989,608 | |
(SOFR + 1.25%), 1.24%, 07/10/24(b) | | | 800 | | | | 801,937 | |
(SOFR + 1.36%), 2.56%, 09/13/25(b) | | | 905 | | | | 929,088 | |
(SOFR + 1.57%), 2.87%, 09/13/30(b) | | | 500 | | | | 515,906 | |
(SOFR + 1.77%), 2.20%, 07/10/31(a)(b) | | | 1,000 | | | | 977,684 | |
Morgan Stanley | | | | | | | | |
3.13%, 01/23/23 | | | 3,500 | | | | 3,588,628 | |
3.75%, 02/25/23 | | | 500 | | | | 517,144 | |
4.10%, 05/22/23 | | | 250 | | | | 260,382 | |
3.70%, 10/23/24 | | | 1,500 | | | | 1,597,425 | |
| | | | | | | | |
| Security | | Par
(000) | | | Value | |
|
| Diversified Financial Services (continued) | |
Morgan Stanley (continued) | |
4.00%, 07/23/25 | | $ | 2,005 | | | $ | 2,172,899 | |
5.00%, 11/24/25 | | | 1,250 | | | | 1,399,297 | |
3.88%, 01/27/26 | | | 1,750 | | | | 1,892,329 | |
3.13%, 07/27/26 | | | 500 | | | | 529,661 | |
4.35%, 09/08/26 | | | 1,500 | | | | 1,658,007 | |
3.63%, 01/20/27 | | | 2,000 | | | | 2,168,317 | |
3.95%, 04/23/27 | | | 250 | | | | 275,220 | |
7.25%, 04/01/32 | | | 50 | | | | 71,246 | |
6.38%, 07/24/42 | | | 1,050 | | | | 1,590,705 | |
4.30%, 01/27/45 | | | 1,000 | | | | 1,229,623 | |
4.38%, 01/22/47 | | | 1,500 | | | | 1,884,212 | |
(3 mo. LIBOR US + 0.85%), 3.74%, 04/24/24(b) | | | 4,000 | | | | 4,138,166 | |
(3 mo. LIBOR US + 1.14%), 3.77%, 01/24/29(b) | | | 3,000 | | | | 3,264,527 | |
(3 mo. LIBOR US + 1.34%), 3.59%, 07/22/28(a)(b) | | | 2,250 | | | | 2,425,707 | |
(3 mo. LIBOR US + 1.43%), 4.46%, 04/22/39(b) | | | 3,000 | | | | 3,598,855 | |
(3 mo. LIBOR US + 1.46%), 3.97%, 07/22/38(b) | | | 1,000 | | | | 1,139,668 | |
(3 mo. LIBOR US + 1.63%), 4.43%, 01/23/30(b) | | | 750 | | | | 854,668 | |
(SOFR + 0.46%), 0.53%, 01/25/24(b) | | | 2,500 | | | | 2,491,407 | |
(SOFR + 0.51%), 0.79%, 01/22/25(b) | | | 500 | | | | 494,934 | |
(SOFR + 0.53%), 0.79%, 05/30/25(b) | | | 2,305 | | | | 2,274,876 | |
(SOFR + 0.56%), 1.16%, 10/21/25(b) | | | 3,000 | | | | 2,976,304 | |
(SOFR + 0.62%), 0.73%, 04/05/24(b) | | | 4,000 | | | | 3,987,595 | |
(SOFR + 0.72%), 0.99%, 12/10/26(b) | | | 1,800 | | | | 1,745,884 | |
(SOFR + 0.86%), 1.51%, 07/20/27(b) | | | 1,910 | | | | 1,879,897 | |
(SOFR + 0.88%), 1.59%, 05/04/27(b) | | | 125 | | | | 123,768 | |
(SOFR + 1.02%), 1.93%, 04/28/32(b) | | | 3,100 | | | | 2,962,100 | |
(SOFR + 1.03%), 1.79%, 02/13/32(b) | | | 1,980 | | | | 1,874,159 | |
(SOFR + 1.14%), 2.70%, 01/22/31(b) | | | 4,000 | | | | 4,092,338 | |
(SOFR + 1.15%), 2.72%, 07/22/25(b) | | | 605 | | | | 623,450 | |
(SOFR + 1.18%), 2.24%, 07/21/32(b) | | | 500 | | | | 489,037 | |
(SOFR + 1.20%), 2.51%, 10/20/32(b) | | | 1,645 | | | | 1,643,251 | |
(SOFR + 1.36%), 2.48%, 09/16/36(b) | | | 2,690 | | | | 2,590,335 | |
(SOFR + 1.43%), 2.80%, 01/25/52(b) | | | 1,285 | | | | 1,260,842 | |
(SOFR + 1.49%), 3.22%, 04/22/42(b) | | | 35 | | | | 36,668 | |
(SOFR + 1.99%), 2.19%, 04/28/26(a)(b) | | | 3,430 | | | | 3,497,286 | |
(SOFR + 3.12%), 3.62%, 04/01/31(b) | | | 4,020 | | | | 4,380,566 | |
(SOFR + 4.84%), 5.60%, 03/24/51(a)(b) | | | 1,000 | | | | 1,493,731 | |
Series F, 3.88%, 04/29/24(a) | | | 250 | | | | 265,023 | |
Nasdaq, Inc. | | | | | | | | |
4.25%, 06/01/24 | | | 250 | | | | 265,560 | |
3.85%, 06/30/26 | | | 600 | | | | 654,189 | |
1.65%, 01/15/31 | | | 1,500 | | | | 1,396,312 | |
3.25%, 04/28/50 | | | 1,000 | | | | 1,016,741 | |
Natwest Group PLC | | | | | | | | |
3.88%, 09/12/23 | | | 1,000 | | | | 1,042,746 | |
6.00%, 12/19/23 | | | 1,000 | | | | 1,086,644 | |
4.80%, 04/05/26 | | | 1,000 | | | | 1,112,264 | |
(1 year CMT + 0.90%), 1.64%, 06/14/27(b) | | | 695 | | | | 685,469 | |
(1 year CMT + 2.15%), 2.36%, 05/22/24(b) | | | 385 | | | | 391,146 | |
(1 year CMT + 2.55%), 3.07%, 05/22/28(b) | | | 580 | | | | 603,252 | |
(3 mo. LIBOR US + 1.55%), 4.52%, 06/25/24(a)(b) | | | 2,000 | | | | 2,092,253 | |
| | |
MASTER PORTFOLIO SCHEDULE OF INVESTMENTS | | 35 |
| | |
Schedule of Investments (continued) December 31, 2021 | | U.S. Total Bond Index Master Portfolio (Percentages shown are based on Net Assets) |
| | | | | | | | |
| Security | | Par
(000) | | | Value | |
|
Diversified Financial Services (continued) | |
Natwest Group PLC (continued) | |
(3 mo. LIBOR US + 1.75%), 4.89%, 05/18/29(b) | | $ | 1,000 | | | $ | 1,143,732 | |
(3 mo. LIBOR US + 1.76%), 4.27%, 03/22/25(b) | | | 1,000 | | | | 1,058,248 | |
(3 mo. LIBOR US + 1.87%), 4.45%, 05/08/30(b) | | | 1,000 | | | | 1,123,169 | |
(3 mo. LIBOR US + 1.91%), 5.08%, 01/27/30(b) | | | 1,000 | | | | 1,159,788 | |
(5 year CMT + 2.10%), 3.75%, 11/01/29(b) | | | 2,290 | | | | 2,387,791 | |
(5 year CMT + 2.35%), 3.03%, 11/28/35(b) | | | 300 | | | | 296,007 | |
ORIX Corp., 2.25%, 03/09/31(a) | | | 500 | | | | 498,184 | |
Rexford Industrial Realty LP | | | | | | | | |
2.13%, 12/01/30 | | | 400 | | | | 379,949 | |
2.15%, 09/01/31(a) | | | 445 | | | | 420,169 | |
Sumitomo Mitsui Financial Group, Inc. | | | | | | | | |
3.10%, 01/17/23(a) | | | 4,000 | | | | 4,094,872 | |
3.75%, 07/19/23 | | | 500 | | | | 520,870 | |
3.94%, 10/16/23 | | | 1,000 | | | | 1,050,949 | |
2.45%, 09/27/24 | | | 2,000 | | | | 2,056,879 | |
2.35%, 01/15/25 | | | 2,000 | | | | 2,049,309 | |
1.47%, 07/08/25(a) | | | 2,000 | | | | 1,989,526 | |
3.78%, 03/09/26 | | | 500 | | | | 539,283 | |
2.63%, 07/14/26 | | | 1,000 | | | | 1,035,287 | |
1.40%, 09/17/26 | | | 1,500 | | | | 1,464,086 | |
3.01%, 10/19/26 | | | 250 | | | | 261,811 | |
3.36%, 07/12/27(a) | | | 1,000 | | | | 1,070,855 | |
3.35%, 10/18/27 | | | 500 | | | | 534,139 | |
3.54%, 01/17/28 | | | 2,000 | | | | 2,157,926 | |
1.90%, 09/17/28 | | | 1,500 | | | | 1,470,493 | |
3.04%, 07/16/29 | | | 920 | | | | 958,867 | |
3.20%, 09/17/29 | | | 500 | | | | 520,390 | |
2.72%, 09/27/29 | | | 1,000 | | | | 1,022,728 | |
2.13%, 07/08/30 | | | 2,000 | | | | 1,943,081 | |
1.71%, 01/12/31 | | | 900 | | | | 847,556 | |
2.22%, 09/17/31 | | | 565 | | | | 554,178 | |
2.93%, 09/17/41(a) | | | 200 | | | | 197,545 | |
| | | | | | | | |
| | |
| | | | | | | 738,618,131 | |
|
| Diversified Telecommunication Services — 0.8% | |
AT&T, Inc. | | | | | | | | |
4.05%, 12/15/23 | | | 2,500 | | | | 2,645,074 | |
0.90%, 03/25/24 | | | 2,000 | | | | 1,990,965 | |
4.45%, 04/01/24 | | | 2,500 | | | | 2,668,444 | |
3.95%, 01/15/25 | | | 500 | | | | 534,294 | |
3.40%, 05/15/25 | | | 1,000 | | | | 1,056,421 | |
4.13%, 02/17/26 | | | 1,000 | | | | 1,090,746 | |
1.70%, 03/25/26 | | | 700 | | | | 696,384 | |
1.65%, 02/01/28 | | | 1,100 | | | | 1,076,709 | |
4.35%, 03/01/29 | | | 2,000 | | | | 2,246,552 | |
4.30%, 02/15/30 | | | 3,000 | | | | 3,376,470 | |
2.75%, 06/01/31(a) | | | 2,000 | | | | 2,040,507 | |
2.25%, 02/01/32 | | | 1,400 | | | | 1,352,850 | |
2.55%, 12/01/33 | | | 5,518 | | | | 5,396,836 | |
4.50%, 05/15/35(a) | | | 1,310 | | | | 1,513,309 | |
4.90%, 08/15/37 | | | 750 | | | | 906,262 | |
4.85%, 03/01/39 | | | 2,000 | | | | 2,390,550 | |
5.35%, 09/01/40 | | | 1 | | | | 1,267 | |
3.50%, 06/01/41 | | | 1,000 | | | | 1,027,744 | |
4.90%, 06/15/42 | | | 350 | | | | 421,642 | |
3.10%, 02/01/43 | | | 1,600 | | | | 1,555,425 | |
4.65%, 06/01/44 | | | 250 | | | | 292,798 | |
| | | | | | | | |
| Security | | Par
(000) | | | Value | |
|
Diversified Telecommunication Services (continued) | |
AT&T, Inc. (continued) | |
4.75%, 05/15/46 | | $ | 1,000 | | | $ | 1,207,635 | |
4.50%, 03/09/48 | | | 1,000 | | | | 1,165,855 | |
3.65%, 06/01/51 | | | 1,000 | | | | 1,035,645 | |
3.30%, 02/01/52 | | | 800 | | | | 783,431 | |
3.50%, 09/15/53 | | | 4,624 | | | | 4,665,131 | |
3.55%, 09/15/55 | | | 9,407 | | | | 9,441,136 | |
3.80%, 12/01/57(a) | | | 4,577 | | | | 4,764,940 | |
3.65%, 09/15/59 | | | 7,181 | | | | 7,252,013 | |
3.85%, 06/01/60 | | | 1,000 | | | | 1,044,563 | |
3.50%, 02/01/61(a) | | | 600 | | | | 589,984 | |
British Telecommunications PLC | | | | | | | | |
5.13%, 12/04/28(a) | | | 1,000 | | | | 1,132,459 | |
9.63%, 12/15/30 | | | 900 | | | | 1,317,934 | |
Deutsche Telekom International Finance BV, 8.75%, 06/15/30 | | | 1,650 | | | | 2,398,214 | |
Telefonica Emisiones SA | | | | | | | | |
4.10%, 03/08/27(a) | | | 1,000 | | | | 1,100,698 | |
7.05%, 06/20/36 | | | 75 | | | | 107,000 | |
4.67%, 03/06/38 | | | 1,000 | | | | 1,150,424 | |
5.21%, 03/08/47 | | | 1,750 | | | | 2,172,657 | |
4.90%, 03/06/48(a) | | | 1,500 | | | | 1,804,209 | |
5.52%, 03/01/49(a) | | | 500 | | | | 650,894 | |
Telefonica Europe BV, 8.25%, 09/15/30 | | | 300 | | | | 423,669 | |
Verizon Communications, Inc. | | | | | | | | |
0.75%, 03/22/24 | | | 335 | | | | 333,627 | |
3.50%, 11/01/24 | | | 250 | | | | 266,014 | |
3.38%, 02/15/25 | | | 1,496 | | | | 1,592,224 | |
0.85%, 11/20/25 | | | 1,450 | | | | 1,414,622 | |
1.45%, 03/20/26 | | | 705 | | | | 701,425 | |
2.63%, 08/15/26 | | | 900 | | | | 937,669 | |
4.13%, 03/16/27 | | | 2,750 | | | | 3,056,706 | |
2.10%, 03/22/28 | | | 810 | | | | 811,543 | |
4.33%, 09/21/28 | | | 2,164 | | | | 2,458,207 | |
3.88%, 02/08/29 | | | 2,000 | | | | 2,216,347 | |
4.02%, 12/03/29 | | | 3,000 | | | | 3,363,304 | |
3.15%, 03/22/30 | | | 1,000 | | | | 1,057,951 | |
1.68%, 10/30/30 | | | 2,000 | | | | 1,900,262 | |
1.75%, 01/20/31 | | | 3,000 | | | | 2,839,364 | |
2.55%, 03/21/31 | | | 3,420 | | | | 3,450,483 | |
2.36%, 03/15/32(c) | | | 5,851 | | | | 5,765,096 | |
4.50%, 08/10/33 | | | 1,750 | | | | 2,057,390 | |
4.40%, 11/01/34 | | | 1,500 | | | | 1,747,185 | |
4.27%, 01/15/36 | | | 1,250 | | | | 1,466,231 | |
4.81%, 03/15/39 | | | 596 | | | | 747,252 | |
2.65%, 11/20/40 | | | 2,000 | | | | 1,900,434 | |
3.40%, 03/22/41 | | | 2,515 | | | | 2,633,063 | |
2.85%, 09/03/41 | | | 650 | | | | 641,245 | |
4.75%, 11/01/41 | | | 3,000 | | | | 3,706,147 | |
3.85%, 11/01/42 | | | 250 | | | | 279,260 | |
4.86%, 08/21/46 | | | 2,000 | | | | 2,574,061 | |
4.00%, 03/22/50 | | | 1,000 | | | | 1,148,232 | |
2.88%, 11/20/50 | | | 2,500 | | | | 2,372,217 | |
3.55%, 03/22/51 | | | 665 | | | | 716,114 | |
2.99%, 10/30/56 | | | 4,978 | | | | 4,712,137 | |
3.00%, 11/20/60 | | | 2,400 | | | | 2,267,884 | |
3.70%, 03/22/61 | | | 2,365 | | | | 2,564,173 | |
| | | | | | | | |
| | |
| | | | | | | 142,187,609 | |
|
| Education — 0.1% | |
American University, Series 2019, 3.67%, 04/01/49 | | | 171 | | | | 197,585 | |
| | |
| 36 | | 2 0 2 1 BLACK ROCK ANNUAL REPORT TO SHAREHOLDERS |
| | |
Schedule of Investments (continued) December 31, 2021 | | U.S. Total Bond Index Master Portfolio (Percentages shown are based on Net Assets) |
| | | | | | | | |
| Security | | Par
(000) | | | Value | |
|
| Education (continued) | |
Brown University in Providence in the State of Rhode Island and Providence Plant, Series A, 2.92%, 09/01/50(a) | | $ | 300 | | | $ | 324,786 | |
California Institute of Technology, 3.65%, 09/01/2119 | | | 1,000 | | | | 1,163,453 | |
Duke University | | | | | | | | |
Series 2020, 2.68%, 10/01/44 | | | 300 | | | | 301,610 | |
Series 2020, 2.83%, 10/01/55 | | | 253 | | | | 261,855 | |
Emory University, Series 2020, 2.97%, 09/01/50(a) | | | 350 | | | | 367,734 | |
Ford Foundation (The) | | | | | | | | |
Series 2020, 2.42%, 06/01/50(a) | | | 60 | | | | 56,688 | |
Series 2020, 2.82%, 06/01/70 | | | 125 | | | | 128,863 | |
George Washington University, Series 2018, 4.13%, 09/15/48 | | | 164 | | | | 198,553 | |
Georgetown University | | | | | | | | |
Series 20A, 2.94%, 04/01/50(a) | | | 104 | | | | 104,545 | |
Series A, 5.22%, 01/01/2118 | | | 62 | | | | 88,371 | |
Series B, 4.32%, 04/01/49 | | | 40 | | | | 48,990 | |
Leland Stanford Junior University | | | | | | | | |
3.65%, 05/01/48 | | | 750 | | | | 907,977 | |
2.41%, 06/01/50 | | | 300 | | | | 291,034 | |
Massachusetts Institute of Technology | | | | | | | | |
4.68%, 07/01/2114 | | | 300 | | | | 445,803 | |
Series F, 2.99%, 07/01/50 | | | 289 | | | | 315,722 | |
Series G, 2.29%, 07/01/51 | | | 157 | | | | 149,534 | |
Northeastern University, Series 2020, 2.89%, 10/01/50(a) | | | 51 | | | | 50,752 | |
Northwestern University | | | | | | | | |
3.87%, 12/01/48 | | | 100 | | | | 121,856 | |
Series 2017, 3.66%, 12/01/57 | | | 58 | | | | 72,433 | |
Series 2020, 2.64%, 12/01/50 | | | 85 | | | | 86,647 | |
President and Fellows of Harvard College | | | | | | | | |
3.15%, 07/15/46 | | | 175 | | | | 199,244 | |
2.52%, 10/15/50 | | | 204 | | | | 204,533 | |
3.30%, 07/15/56 | | | 700 | | | | 799,216 | |
Trustees of Boston College, 3.13%, 07/01/52 | | | 500 | | | | 537,124 | |
Trustees of Boston University, Series CC, 4.06%, 10/01/48 | | | 35 | | | | 42,450 | |
Trustees of Princeton University(a) | | | | | | | | |
5.70%, 03/01/39 | | | 500 | | | | 721,146 | |
Series 2020, 2.52%, 07/01/50 | | | 420 | | | | 419,603 | |
Trustees of the University of Pennsylvania | | | | | | | | |
3.61%, 02/15/2119 | | | 160 | | | | 184,196 | |
Series 2020, 2.40%, 10/01/50(a) | | | 146 | | | | 139,216 | |
University of Chicago (The), Series C, 2.55%, 04/01/50 | | | 137 | | | | 133,667 | |
University of Notre Dame du Lac, Series 2017, 3.39%, 02/15/48 | | | 110 | | | | 127,304 | |
University of Southern California | | | | | | | | |
3.03%, 10/01/39 | | | 200 | | | | 212,174 | |
2.81%, 10/01/50(a) | | | 134 | | | | 135,862 | |
2.95%, 10/01/51 | | | 500 | | | | 518,094 | |
Series A, 3.23%, 10/01/2120 | | | 130 | | | | 132,197 | |
William Marsh Rice University, 3.77%, 05/15/55(a) | | | 300 | | | | 382,847 | |
| | | | | | | | |
| Security | | Par
(000) | | | Value | |
| | |
Education (continued) | | | | | | | | |
Yale University | | | | | | | | |
Series 2020, 1.48%, 04/15/30(a) | | $ | 152 | | | $ | 148,348 | |
Series 2020, 2.40%, 04/15/50 | | | 175 | | | | 172,107 | |
| | | | | | | | |
| | |
| | | | | | | 10,894,119 | |
| | |
| Electric Utilities — 1.8% | | | | | | |
AEP Texas, Inc. | | | | | | | | |
3.95%, 06/01/28. | | | 500 | | | | 547,503 | |
3.45%, 05/15/51 | | | 1,000 | | | | 1,007,271 | |
Series H, 3.45%, 01/15/50 | | | 250 | | | | 254,292 | |
AEP Transmission Co. LLC | | | | | | | | |
3.10%, 12/01/26 | | | 500 | | | | 527,475 | |
3.80%, 06/15/49 | | | 1,000 | | | | 1,128,756 | |
3.15%, 09/15/49 | | | 135 | | | | 137,437 | |
2.75%, 08/15/51 | | | 400 | | | | 380,519 | |
Series M, 3.65%, 04/01/50 | | | 500 | | | | 551,950 | |
AES Corp. | | | | | | | | |
1.38%, 01/15/26 | | | 1,000 | | | | 970,456 | |
2.45%, 01/15/31 | | | 500 | | | | 487,153 | |
Alabama Power Co. | | | | | | | | |
3.75%, 03/01/45 | | | 250 | | | | 276,631 | |
4.30%, 01/02/46 | | | 250 | | | | 299,294 | |
3.45%, 10/01/49 | | | 185 | | | | 196,018 | |
3.13%, 07/15/51(a) | | | 600 | | | | 611,800 | |
3.00%, 03/15/52 | | | 500 | | | | 498,732 | |
Series 20-A, 1.45%, 09/15/30(a) | | | 1,000 | | | | 934,577 | |
Series B, 3.70%, 12/01/47 | | | 2,500 | | | | 2,761,202 | |
Ameren Corp. | | | | | | | | |
2.50%, 09/15/24 | | | 635 | | | | 652,006 | |
1.95%, 03/15/27 | | | 770 | | | | 772,217 | |
3.50%, 01/15/31(a) | | | 1,000 | | | | 1,078,678 | |
Ameren Illinois Co. | | | | | | | | |
4.15%, 03/15/46 | | | 500 | | | | 595,015 | |
3.25%, 03/15/50 | | | 150 | | | | 159,447 | |
2.90%, 06/15/51 | | | 600 | | | | 608,259 | |
American Electric Power Co., Inc. | | | | | | | | |
2.30%, 03/01/30 | | | 300 | | | | 292,476 | |
3.25%, 03/01/50(a) | | | 1,000 | | | | 981,839 | |
Series J, 4.30%, 12/01/28 | | | 500 | | | | 557,082 | |
Series N, 1.00%, 11/01/25 | | | 500 | | | | 488,920 | |
Appalachian Power Co., 4.40%, 05/15/44 | | | 250 | | | | 289,343 | |
Arizona Public Service Co. | | | | | | | | |
3.15%, 05/15/25 | | | 250 | | | | 260,097 | |
2.60%, 08/15/29 | | | 500 | | | | 507,499 | |
2.20%, 12/15/31(a) | | | 1,000 | | | | 970,446 | |
5.05%, 09/01/41 | | | 250 | | | | 306,286 | |
4.20%, 08/15/48 | | | 250 | | | | 286,497 | |
3.50%, 12/01/49 | | | 1,100 | | | | 1,143,201 | |
Baltimore Gas & Electric Co. | | | | | | | | |
2.40%, 08/15/26(a) | | | 1,000 | | | | 1,025,540 | |
6.35%, 10/01/36 | | | 250 | | | | 352,592 | |
3.50%, 08/15/46 | | | 700 | | | | 755,651 | |
3.20%, 09/15/49 | | | 225 | | | | 234,950 | |
2.90%, 06/15/50(a) | | | 450 | | | | 447,095 | |
Baltimore Gas and Electric Co., 2.25%, 06/15/31 | | | 320 | | | | 320,251 | |
Berkshire Hathaway Energy Co. | | | | | | | | |
3.75%, 11/15/23 | | | 500 | | | | 522,367 | |
3.50%, 02/01/25(a) | | | 110 | | | | 116,425 | |
4.05%, 04/15/25(a) | | | 2,000 | | | | 2,163,838 | |
3.25%, 04/15/28(a) | | | 500 | | | | 535,170 | |
| | |
MASTER PORTFOLIO SCHEDULE OF INVESTMENTS | | 37 |
| | |
Schedule of Investments (continued) December 31, 2021 | | U.S. Total Bond Index Master Portfolio (Percentages shown are based on Net Assets) |
| | | | | | | | |
| Security | | Par
(000) | | | Value | |
|
| Electric Utilities (continued) | |
Berkshire Hathaway Energy Co. (continued) | |
3.70%, 07/15/30 | | $ | 500 | | | $ | 552,187 | |
1.65%, 05/15/31(a) | | | 845 | | | | 802,661 | |
6.13%, 04/01/36 | | | 250 | | | | 340,264 | |
5.15%, 11/15/43 | | | 250 | | | | 322,142 | |
4.50%, 02/01/45 | | | 400 | | | | 484,363 | |
3.80%, 07/15/48 | | | 500 | | | | 559,414 | |
4.45%, 01/15/49 | | | 2,000 | | | | 2,470,166 | |
4.25%, 10/15/50 | | | 1,000 | | | | 1,221,585 | |
2.85%, 05/15/51 | | | 900 | | | | 866,170 | |
59562VAP2, 5.95%, 05/15/37 | | | 1,000 | | | | 1,345,320 | |
Black Hills Corp. | | | | | | | | |
3.95%, 01/15/26(a) | | | 200 | | | | 214,351 | |
3.05%, 10/15/29 | | | 415 | | | | 430,957 | |
2.50%, 06/15/30 | | | 55 | | | | 54,364 | |
4.35%, 05/01/33 | | | 400 | | | | 454,825 | |
3.88%, 10/15/49(a) | | | 350 | | | | 382,816 | |
CenterPoint Energy Houston Electric LLC | | | | | | | | |
3.55%, 08/01/42 | | | 100 | | | | 111,202 | |
3.95%, 03/01/48 | | | 250 | | | | 297,954 | |
3.35%, 04/01/51 | | | 500 | | | | 549,544 | |
Series AD, 2.90%, 07/01/50 | | | 290 | | | | 292,171 | |
CenterPoint Energy, Inc. | | | | | | | | |
2.50%, 09/01/24 | | | 425 | | | | 436,757 | |
1.45%, 06/01/26 | | | 240 | | | | 235,448 | |
4.25%, 11/01/28 | | | 2,000 | | | | 2,222,070 | |
2.95%, 03/01/30 | | | 1,000 | | | | 1,031,597 | |
2.65%, 06/01/31(a) | | | 810 | | | | 820,978 | |
3.70%, 09/01/49 | | | 250 | | | | 270,022 | |
Cleco Corporate Holdings LLC | | | | | | | | |
3.74%, 05/01/26 | | | 500 | | | | 533,157 | |
3.38%, 09/15/29 | | | 500 | | | | 508,517 | |
CMS Energy Corp., 3.45%, 08/15/27(a) | | | 1,000 | | | | 1,072,431 | |
Commonwealth Edison Co. | | | | | | | | |
2.55%, 06/15/26 | | | 250 | | | | 261,299 | |
3.70%, 08/15/28 | | | 500 | | | | 548,532 | |
5.90%, 03/15/36 | | | 50 | | | | 68,532 | |
3.70%, 03/01/45 | | | 250 | | | | 278,849 | |
3.65%, 06/15/46 | | | 750 | | | | 830,440 | |
4.00%, 03/01/48 | | | 2,000 | | | | 2,336,055 | |
4.00%, 03/01/49 | | | 1,000 | | | | 1,186,565 | |
3.00%, 03/01/50 | | | 500 | | | | 507,255 | |
3.13%, 03/15/51 | | | 400 | | | | 414,682 | |
2.75%, 09/01/51(a) | | | 500 | | | | 483,376 | |
Series 127, 3.20%, 11/15/49 | | | 610 | | | | 639,954 | |
Connecticut Light & Power Co. | | | | | | | | |
2.50%, 01/15/23 | | | 150 | | | | 152,096 | |
Series A, 3.20%, 03/15/27 | | | 500 | | | | 531,720 | |
Series A, 2.05%, 07/01/31 | | | 800 | | | | 787,738 | |
Consolidated Edison Co. of New York, Inc. | | | | | | | | |
3.80%, 05/15/28(a) | | | 500 | | | | 546,408 | |
2.40%, 06/15/31 | | | 1,000 | | | | 1,005,974 | |
3.95%, 03/01/43 | | | 150 | | | | 162,909 | |
4.45%, 03/15/44 | | | 250 | | | | 292,923 | |
4.50%, 12/01/45 | | | 250 | | | | 295,125 | |
3.85%, 06/15/46 | | | 1,000 | | | | 1,085,119 | |
4.50%, 05/15/58 | | | 1,000 | | | | 1,223,096 | |
3.70%, 11/15/59 | | | 200 | | | | 213,450 | |
3.60%, 06/15/61 | | | 750 | | | | 791,557 | |
Series 12-A, 4.20%, 03/15/42 | | | 400 | | | | 451,008 | |
| | | | | | | | |
| Security | | Par
(000) | | | Value | |
|
| Electric Utilities (continued) | |
Consolidated Edison Co. of New York, Inc. (continued) | | | | | | | | |
Series 20B, 3.95%, 04/01/50(a) | | $ | 1,000 | | | $ | 1,142,397 | |
Series A, 4.13%, 05/15/49 | | | 500 | | | | 572,344 | |
Series C, 4.30%, 12/01/56 | | | 500 | | | | 594,129 | |
Series C, 4.00%, 11/15/57 | | | 750 | | | | 846,940 | |
Series C, 3.00%, 12/01/60(a) | | | 1,000 | | | | 932,142 | |
Series D, 4.00%, 12/01/28(a) | | | 500 | | | | 559,951 | |
Series E, 4.65%, 12/01/48(a) | | | 500 | | | | 618,514 | |
Consumers Energy Co. | | | | | | | | |
4.35%, 04/15/49 | | | 1,000 | | | | 1,253,146 | |
3.10%, 08/15/50 | | | 215 | | | | 223,864 | |
3.50%, 08/01/51 | | | 1,000 | | | | 1,120,006 | |
2.65%, 08/15/52(a) | | | 125 | | | | 121,588 | |
2.50%, 05/01/60 | | | 1,055 | | | | 930,045 | |
Dominion Energy South Carolina, Inc. | | | | | | | | |
2.30%, 12/01/31 | | | 200 | | | | 201,646 | |
5.45%, 02/01/41(a) | | | 1,000 | | | | 1,348,551 | |
4.60%, 06/15/43 | | | 250 | | | | 311,522 | |
5.10%, 06/01/65(a) | | | 500 | | | | 714,849 | |
Dominion Energy, Inc. | | | | | | | | |
3.07%, 08/15/24(d) | | | 500 | | | | 517,549 | |
3.90%, 10/01/25(a) | | | 2,000 | | | | 2,157,039 | |
2.25%, 08/15/31 | | | 110 | | | | 107,427 | |
7.00%, 06/15/38 | | | 250 | | | | 362,199 | |
4.70%, 12/01/44 | | | 1,000 | | | | 1,232,995 | |
Series A, 1.45%, 04/15/26 | | | 200 | | | | 197,685 | |
Series A, 4.60%, 03/15/49 | | | 500 | | | | 623,821 | |
Series C, 3.38%, 04/01/30(a) | | | 1,500 | | | | 1,591,819 | |
Series C, 3.30%, 04/15/41 | | | 300 | | | | 311,603 | |
Series C, 4.90%, 08/01/41 | | | 50 | | | | 61,496 | |
DTE Electric Co. | | | | | | | | |
3.65%, 03/15/24 | | | 1,000 | | | | 1,047,004 | |
3.70%, 03/15/45 | | | 645 | | | | 713,576 | |
3.70%, 06/01/46(a) | | | 250 | | | | 281,609 | |
3.75%, 08/15/47 | | | 200 | | | | 227,096 | |
2.95%, 03/01/50(a) | | | 1,000 | | | | 1,007,518 | |
Series A, 1.90%, 04/01/28 | | | 500 | | | | 495,032 | |
Series A, 4.00%, 04/01/43 | | | 150 | | | | 173,972 | |
Series A, 4.05%, 05/15/48 | | | 250 | | | | 297,357 | |
Series B, 3.25%, 04/01/51(a) | | | 400 | | | | 430,095 | |
DTE Energy Co. | | | | | | | | |
2.95%, 03/01/30 | | | 1,000 | | | | 1,025,455 | |
Series C, 2.53%, 10/01/24 | | | 1,000 | �� | | | 1,029,234 | |
Series C, 3.40%, 06/15/29 | | | 701 | | | | 739,795 | |
Series F, 1.05%, 06/01/25 | | | 895 | | | | 876,888 | |
Duke Energy Carolinas LLC | | | | | | | | |
3.05%, 03/15/23(a) | | | 200 | | | | 204,894 | |
6.00%, 12/01/28(a) | | | 500 | | | | 617,612 | |
2.45%, 08/15/29 | | | 500 | | | | 508,697 | |
2.45%, 02/01/30 | | | 400 | | | | 404,838 | |
2.55%, 04/15/31(a) | | | 300 | | | | 307,945 | |
6.10%, 06/01/37 | | | 500 | | | | 677,863 | |
6.05%, 04/15/38 | | | 100 | | | | 138,592 | |
5.30%, 02/15/40 | | | 250 | | | | 329,081 | |
4.25%, 12/15/41 | | | 1,000 | | | | 1,178,187 | |
4.00%, 09/30/42 | | | 500 | | | | 573,920 | |
3.70%, 12/01/47 | | | 500 | | | | 555,988 | |
3.95%, 03/15/48 | | | 1,000 | | | | 1,151,929 | |
3.20%, 08/15/49 | | | 930 | | | | 962,525 | |
| | |
| 38 | | 2 0 2 1 BLACK ROCK ANNUAL REPORT TO SHAREHOLDERS |
| | |
Schedule of Investments (continued) December 31, 2021 | | U.S. Total Bond Index Master Portfolio (Percentages shown are based on Net Assets) |
| | | | | | | | |
| Security | | Par
(000) | | | Value | |
|
| Electric Utilities (continued) | |
Duke Energy Carolinas LLC (continued) | |
3.45%, 04/15/51 | | $ | 300 | | | $ | 328,076 | |
Duke Energy Corp. | | | | | | | | |
3.95%, 10/15/23 | | | 250 | | | | 260,984 | |
3.75%, 04/15/24 | | | 500 | | | | 525,065 | |
0.90%, 09/15/25 | | | 1,415 | | | | 1,375,018 | |
2.65%, 09/01/26 | | | 500 | | | | 517,652 | |
3.15%, 08/15/27 | | | 500 | | | | 525,912 | |
2.45%, 06/01/30 | | | 1,695 | | | | 1,682,810 | |
2.55%, 06/15/31 | | | 1,000 | | | | 1,001,182 | |
3.30%, 06/15/41 | | | 700 | | | | 710,456 | |
4.80%, 12/15/45 | | | 250 | | | | 306,908 | |
3.75%, 09/01/46(a) | | | 1,500 | | | | 1,600,344 | |
3.95%, 08/15/47 | | | 500 | | | | 551,968 | |
4.20%, 06/15/49 | | | 500 | | | | 571,753 | |
3.50%, 06/15/51 | | | 1,000 | | | | 1,032,554 | |
(5 year CMT + 2.32%), 3.25%, 01/15/82(b) | | | 625 | | | | 609,187 | |
Duke Energy Florida LLC | | | | | | | | |
2.50%, 12/01/29(a) | | | 345 | | | | 354,522 | |
1.75%, 06/15/30 | | | 470 | | | | 451,024 | |
2.40%, 12/15/31 | | | 820 | | | | 830,076 | |
3.40%, 10/01/46 | | | 250 | | | | 263,739 | |
3.00%, 12/15/51 | | | 365 | | | | 367,837 | |
Duke Energy Indiana LLC | | | | | | | | |
3.75%, 05/15/46(a) | | | 500 | | | | 557,095 | |
2.75%, 04/01/50 | | | 1,000 | | | | 972,599 | |
Series UUU, 4.20%, 03/15/42 | | | 400 | | | | 457,091 | |
Series WWW, 4.90%, 07/15/43 | | | 250 | | | | 312,977 | |
Series YYY, 3.25%, 10/01/49 | | | 500 | | | | 517,316 | |
Duke Energy Ohio, Inc.(a) | | | | | | | | |
2.13%, 06/01/30 | | | 610 | | | | 600,105 | |
3.70%, 06/15/46 | | | 250 | | | | 275,623 | |
Duke Energy Progress LLC | | | | | | | | |
3.38%, 09/01/23 | | | 250 | | | | 259,529 | |
3.70%, 09/01/28 | | | 365 | | | | 399,856 | |
3.45%, 03/15/29 | | | 500 | | | | 539,556 | |
2.00%, 08/15/31 | | | 100 | | | | 97,684 | |
4.10%, 05/15/42 | | | 150 | | | | 175,134 | |
4.10%, 03/15/43 | | | 250 | | | | 288,833 | |
4.38%, 03/30/44 | | | 100 | | | | 120,015 | |
4.15%, 12/01/44 | | | 500 | | | | 587,322 | |
4.20%, 08/15/45 | | | 250 | | | | 297,145 | |
3.70%, 10/15/46 | | | 500 | | | | 557,105 | |
3.60%, 09/15/47 | | | 1,000 | | | | 1,101,862 | |
2.50%, 08/15/50(a) | | | 500 | | | | 461,841 | |
2.90%, 08/15/51(a) | | | 100 | | | | 99,133 | |
Edison International | | | | | | | | |
3.55%, 11/15/24 | | | 175 | | | | 183,038 | |
5.75%, 06/15/27 | | | 2,050 | | | | 2,337,320 | |
4.13%, 03/15/28 | | | 1,000 | | | | 1,055,440 | |
Emera US Finance LP | | | | | | | | |
0.83%, 06/15/24 | | | 505 | | | | 495,594 | |
3.55%, 06/15/26 | | | 1,075 | | | | 1,143,372 | |
2.64%, 06/15/31(a) | | | 900 | | | | 883,954 | |
4.75%, 06/15/46 | | | 350 | | | | 412,315 | |
Entergy Arkansas LLC | | | | | | | | |
3.50%, 04/01/26 | | | 65 | | | | 69,531 | |
2.65%, 06/15/51(a) | | | 300 | | | | 278,783 | |
3.35%, 06/15/52 | | | 500 | | | | 525,022 | |
Entergy Corp. | | | | | | | | |
0.90%, 09/15/25 | | | 665 | | | | 644,074 | |
| | | | | | | | |
| Security | | Par
(000) | | | Value | |
|
| Electric Utilities (continued) | |
Entergy Corp. (continued) | |
2.95%, 09/01/26(a) | | $ | 1,000 | | | $ | 1,042,774 | |
1.90%, 06/15/28 | | | 400 | | | | 391,933 | |
2.80%, 06/15/30 | | | 310 | | | | 315,475 | |
2.40%, 06/15/31 | | | 600 | | | | 590,933 | |
3.75%, 06/15/50(a) | | | 135 | | | | 145,316 | |
Entergy Louisiana LLC | | | | | | | | |
4.05%, 09/01/23 | | | 250 | | | | 259,990 | |
5.40%, 11/01/24 | | | 3,000 | | | | 3,324,330 | |
1.60%, 12/15/30 | | | 325 | | | | 306,045 | |
4.00%, 03/15/33 | | | 250 | | | | 284,067 | |
4.20%, 09/01/48 | | | 250 | | | | 297,352 | |
4.20%, 04/01/50 | | | 1,000 | | | | 1,188,710 | |
2.90%, 03/15/51 | | | 1,500 | | | | 1,469,229 | |
Entergy Mississippi LLC | | | | | | | | |
2.85%, 06/01/28 | | | 500 | | | | 521,499 | |
3.85%, 06/01/49 | | | 500 | | | | 573,230 | |
Entergy Texas, Inc., 3.55%, 09/30/49 | | | 200 | | | | 210,957 | |
Evergy Kansas Central, Inc. | | | | | | | | |
2.55%, 07/01/26 | | | 350 | | | | 362,795 | |
4.25%, 12/01/45 | | | 1,000 | | | | 1,203,171 | |
3.25%, 09/01/49 | | | 500 | | | | 518,447 | |
3.45%, 04/15/50 | | | 500 | | | | 535,913 | |
Evergy Metro, Inc., 3.65%, 08/15/25 | | | 150 | | | | 159,706 | |
Evergy, Inc. | | | | | | | | |
2.45%, 09/15/24 | | | 500 | | | | 512,794 | |
2.90%, 09/15/29(a) | | | 500 | | | | 511,783 | |
Eversource Energy | | | | | | | | |
1.40%, 08/15/26 | | | 500 | | | | 489,983 | |
2.55%, 03/15/31 | | | 500 | | | | 501,375 | |
3.45%, 01/15/50(a) | | | 400 | | | | 420,921 | |
Series H, 3.15%, 01/15/25 | | | 125 | | | | 130,212 | |
Series M, 3.30%, 01/15/28 | | | 2,000 | | | | 2,130,868 | |
Series Q, 0.80%, 08/15/25 | | | 800 | | | | 778,483 | |
Series R, 1.65%, 08/15/30 | | | 800 | | | | 747,972 | |
Exelon Corp. | | | | | | | | |
3.95%, 06/15/25 | | | 750 | | | | 801,264 | |
3.40%, 04/15/26 | | | 750 | | | | 798,918 | |
4.05%, 04/15/30 | | | 1,000 | | | | 1,111,062 | |
5.10%, 06/15/45 | | | 250 | | | | 321,581 | |
4.45%, 04/15/46 | | | 1,250 | | | | 1,493,053 | |
4.70%, 04/15/50 | | | 500 | | | | 627,669 | |
Exelon Generation Co. LLC | | | | | | | | |
6.25%, 10/01/39 | | | 150 | | | | 187,327 | |
5.75%, 10/01/41(a) | | | 500 | | | | 594,342 | |
5.60%, 06/15/42(a) | | | 1,050 | | | | 1,240,854 | |
Florida Power & Light Co. | | | | | | | | |
2.75%, 06/01/23 | | | 250 | | | | 254,379 | |
2.85%, 04/01/25 | | | 120 | | | | 125,307 | |
3.13%, 12/01/25 | | | 500 | | | | 528,652 | |
5.95%, 02/01/38 | | | 50 | | | | 69,610 | |
5.69%, 03/01/40 | | | 500 | | | | 702,754 | |
5.25%, 02/01/41 | | | 500 | | | | 670,157 | |
4.13%, 02/01/42 | | | 500 | | | | 595,030 | |
4.05%, 10/01/44 | | | 750 | | | | 888,532 | |
3.70%, 12/01/47 | | | 1,000 | | | | 1,144,834 | |
3.95%, 03/01/48 | | | 500 | | | | 592,947 | |
4.13%, 06/01/48 | | | 500 | | | | 614,003 | |
3.15%, 10/01/49 | | | 885 | | | | 939,554 | |
2.88%, 12/04/51 | | | 1,500 | | | | 1,521,225 | |
341081FU6, 3.99%, 03/01/49 | | | 500 | | | | 609,677 | |
| | |
MASTER PORTFOLIO SCHEDULE OF INVESTMENTS | | 39 |
| | |
Schedule of Investments (continued) December 31, 2021 | | U.S. Total Bond Index Master Portfolio (Percentages shown are based on Net Assets) |
| | | | | | | | |
| Security | | Par
(000) | | | Value | |
|
Electric Utilities (continued) | |
Fortis, Inc./Canada, 3.06%, 10/04/26(a) | | $ | 1,000 | | | $ | 1,040,959 | |
Georgia Power Co. | | | | | | | | |
4.30%, 03/15/42 | | | 700 | | | | 796,942 | |
Series A, 2.20%, 09/15/24 | | | 1,000 | | | | 1,023,018 | |
Series B, 2.65%, 09/15/29 | | | 1,000 | | | | 1,019,250 | |
Series B, 3.70%, 01/30/50 | | | 1,000 | | | | 1,063,172 | |
Indiana Michigan Power Co. | | | | | | | | |
6.05%, 03/15/37 | | | 175 | | | | 238,321 | |
4.25%, 08/15/48 | | | 250 | | | | 296,563 | |
3.25%, 05/01/51 | | | 500 | | | | 513,252 | |
Series K, 4.55%, 03/15/46 | | | 150 | | | | 183,058 | |
Interstate Power & Light Co. | | | | | | | | |
3.25%, 12/01/24(a) | | | 250 | | | | 262,439 | |
4.10%, 09/26/28 | | | 300 | | | | 332,745 | |
3.70%, 09/15/46 | | | 500 | | | | 558,032 | |
3.50%, 09/30/49 | | | 105 | | | | 112,525 | |
3.10%, 11/30/51 | | | 430 | | | | 427,166 | |
IPALCO Enterprises, Inc., 4.25%, 05/01/30 | | | 1,000 | | | | 1,097,462 | |
ITC Holdings Corp., 3.25%, 06/30/26(a) | | | 1,000 | | | | 1,054,075 | |
Kentucky Utilities Co. | | | | | | | | |
4.38%, 10/01/45 | | | 1,000 | | | | 1,178,516 | |
3.30%, 06/01/50 | | | 300 | | | | 314,510 | |
Louisville Gas & Electric Co., 4.25%, 04/01/49 | | | 1,000 | | | | 1,218,575 | |
MidAmerican Energy Co. | | | | | | | | |
3.65%, 04/15/29(a) | | | 500 | | | | 550,976 | |
4.80%, 09/15/43 | | | 250 | | | | 318,757 | |
4.40%, 10/15/44 | | | 1,000 | | | | 1,222,976 | |
3.65%, 08/01/48 | | | 500 | | | | 561,982 | |
4.25%, 07/15/49 | | | 1,500 | | | | 1,850,852 | |
3.15%, 04/15/50 | | | 250 | | | | 261,666 | |
2.70%, 08/01/52(a) | | | 300 | | | | 291,215 | |
Mississippi Power Co. | | | | | | | | |
Series 12-A, 4.25%, 03/15/42 | | | 500 | | | | 572,877 | |
Series B, 3.10%, 07/30/51 | | | 500 | | | | 493,112 | |
National Rural Utilities Cooperative Finance Corp. | | | | | | | | |
3.40%, 11/15/23(a) | | | 1,700 | | | | 1,769,021 | |
1.00%, 10/18/24 | | | 750 | | | | 743,517 | |
2.85%, 01/27/25 | | | 250 | | | | 260,713 | |
3.40%, 02/07/28 | | | 2,000 | | | | 2,156,895 | |
2.40%, 03/15/30 | | | 830 | | | | 836,899 | |
4.30%, 03/15/49 | | | 500 | | | | 624,505 | |
Nevada Power Co. | | | | | | | | |
5.45%, 05/15/41 | | | 50 | | | | 65,147 | |
Series DD, 2.40%, 05/01/30 | | | 400 | | | | 401,946 | |
Series EE, 3.13%, 08/01/50(a) | | | 400 | | | | 403,723 | |
NextEra Energy Capital Holdings, Inc. | | | | | | | | |
0.65%, 03/01/23 | | | 3,000 | | | | 2,993,929 | |
1.88%, 01/15/27 | | | 890 | | | | 895,278 | |
3.55%, 05/01/27 | | | 1,000 | | | | 1,083,297 | |
1.90%, 06/15/28 | | | 685 | | | | 677,779 | |
2.75%, 11/01/29 | | | 245 | | | | 251,679 | |
2.25%, 06/01/30 | | | 2,300 | | | | 2,286,167 | |
2.44%, 01/15/32 | | | 485 | | | | 486,083 | |
3.00%, 01/15/52 | | | 550 | | | | 549,025 | |
Northern States Power Co. | | | | | | | | |
2.60%, 05/15/23(a) | | | 500 | | | | 507,403 | |
2.25%, 04/01/31 | | | 155 | | | | 156,250 | |
3.40%, 08/15/42 | | | 200 | | | | 215,773 | |
4.00%, 08/15/45 | | | 85 | | | | 100,020 | |
3.60%, 09/15/47 | | | 150 | | | | 168,625 | |
2.90%, 03/01/50 | | | 445 | | | | 449,260 | |
| | | | | | | | |
| Security | | Par
(000) | | | Value | |
|
Electric Utilities (continued) | |
Northern States Power Co. (continued) | |
2.60%, 06/01/51 | | $ | 805 | | | $ | 767,944 | |
3.20%, 04/01/52 | | | 225 | | | | 238,386 | |
Oglethorpe Power Corp. | | | | | | | | |
5.05%, 10/01/48 | | | 500 | | | | 630,891 | |
3.75%, 08/01/50 | | | 250 | | | | 267,388 | |
Ohio Power Co. | | | | | | | | |
4.15%, 04/01/48 | | | 1,000 | | | | 1,172,864 | |
2.90%, 10/01/51 | | | 435 | | | | 419,478 | |
Series Q, 1.63%, 01/15/31(a) | | | 435 | | | | 409,011 | |
Oklahoma Gas and Electric Co., 3.25%, 04/01/30 | | | 1,000 | | | | 1,066,736 | |
Oncor Electric Delivery Co. LLC | | | | | | | | |
0.55%, 10/01/25 | | | 580 | | | | 558,312 | |
3.70%, 11/15/28 | | | 355 | | | | 390,705 | |
2.75%, 05/15/30(c) | | | 1,000 | | | | 1,040,009 | |
5.25%, 09/30/40 | | | 250 | | | | 331,460 | |
5.30%, 06/01/42 | | | 75 | | | | 100,165 | |
3.75%, 04/01/45 | | | 250 | | | | 284,381 | |
3.80%, 09/30/47 | | | 1,000 | | | | 1,157,966 | |
4.10%, 11/15/48 | | | 500 | | | | 602,670 | |
3.80%, 06/01/49 | | | 1,000 | | | | 1,156,147 | |
3.10%, 09/15/49 | | | 245 | | | | 255,652 | |
2.70%, 11/15/51(c) | | | 365 | | | | 351,008 | |
Pacific Gas and Electric Co. | | | | | | | | |
4.25%, 08/01/23 | | | 1,000 | | | | 1,035,136 | |
3.15%, 01/01/26(a) | | | 2,000 | | | | 2,044,264 | |
2.10%, 08/01/27(a) | | | 585 | | | | 564,784 | |
3.30%, 12/01/27 | | | 1,000 | | | | 1,016,409 | |
3.00%, 06/15/28(a) | | | 625 | | | | 629,537 | |
3.75%, 07/01/28 | | | 1,000 | | | | 1,039,825 | |
4.55%, 07/01/30 | | | 2,000 | | | | 2,162,394 | |
2.50%, 02/01/31 | | | 1,500 | | | | 1,428,841 | |
3.25%, 06/01/31 | | | 1,900 | | | | 1,906,276 | |
4.50%, 07/01/40(a) | | | 2,000 | | | | 2,082,804 | |
3.30%, 08/01/40 | | | 895 | | | | 829,677 | |
4.20%, 06/01/41 | | | 440 | | | | 442,806 | |
4.75%, 02/15/44 | | | 500 | | | | 518,507 | |
4.30%, 03/15/45 | | | 100 | | | | 101,101 | |
4.00%, 12/01/46 | | | 500 | | | | 485,221 | |
3.95%, 12/01/47 | | | 1,000 | | | | 963,178 | |
4.95%, 07/01/50 | | | 2,000 | | | | 2,178,113 | |
3.50%, 08/01/50 | | | 900 | | | | 833,726 | |
PacifiCorp. | | | | | | | | |
2.95%, 06/01/23(a) | | | 300 | | | | 307,098 | |
5.25%, 06/15/35(a) | | | 250 | | | | 314,342 | |
4.10%, 02/01/42 | | | 250 | | | | 285,807 | |
4.13%, 01/15/49 | | | 1,000 | | | | 1,152,046 | |
4.15%, 02/15/50 | | | 500 | | | | 591,511 | |
2.90%, 06/15/52(a) | | | 100 | | | | 98,131 | |
PECO Energy Co. | | | | | | | | |
3.90%, 03/01/48 | | | 1,000 | | | | 1,167,321 | |
3.00%, 09/15/49 | | | 195 | | | | 196,836 | |
3.05%, 03/15/51 | | | 120 | | | | 122,388 | |
2.85%, 09/15/51 | | | 325 | | | | 321,830 | |
Potomac Electric Power Co. | | | | | | | | |
3.60%, 03/15/24(a) | | | 250 | | | | 261,493 | |
4.15%, 03/15/43 | | | 250 | | | | 291,097 | |
PPL Electric Utilities Corp. | | | | | | | | |
4.75%, 07/15/43 | | | 250 | | | | 316,219 | |
3.00%, 10/01/49 | | | 170 | | | | 173,946 | |
| | |
| 40 | | 2 0 2 1 BLACK ROCK ANNUAL REPORT TO SHAREHOLDERS |
| | |
Schedule of Investments (continued) December 31, 2021 | | U.S. Total Bond Index Master Portfolio (Percentages shown are based on Net Assets) |
| | | | | | | | |
| Security | | Par (000) | | | Value | |
| | |
Electric Utilities (continued) | | | | | | | | |
Progress Energy, Inc. | | | | | | | | |
7.75%, 03/01/31 | | $ | 50 | | | $ | 69,662 | |
7.00%, 10/30/31 | | | 1,000 | | | | 1,352,679 | |
Public Service Co. of Colorado | | | | | | | | |
3.70%, 06/15/28 | | | 1,000 | | | | 1,096,969 | |
3.60%, 09/15/42 | | | 250 | | | | 276,411 | |
4.30%, 03/15/44 | | | 75 | | | | 89,516 | |
3.80%, 06/15/47 | | | 1,000 | | | | 1,126,714 | |
4.05%, 09/15/49 | | | 1,000 | | | | 1,185,462 | |
Series 35, 1.90%, 01/15/31 | | | 800 | | | | 777,051 | |
Series 36, 2.70%, 01/15/51 | | | 800 | | | | 767,550 | |
Public Service Co. of New Hampshire, 3.60%, 07/01/49 | | | 1,000 | | | | 1,120,165 | |
Public Service Co. of Oklahoma(a) | | | | | | | | |
2.20%, 08/15/31 | | | 500 | | | | 491,033 | |
3.15%, 08/15/51 | | | 200 | | | | 201,528 | |
Public Service Electric & Gas Co. | | | | | | | | |
2.38%, 05/15/23 | | | 250 | | | | 254,379 | |
3.20%, 05/15/29 | | | 500 | | | | 537,180 | |
2.45%, 01/15/30 | | | 400 | | | | 406,862 | |
1.90%, 08/15/31 | | | 820 | | | | 797,885 | |
3.95%, 05/01/42(a) | | | 50 | | | | 57,476 | |
3.65%, 09/01/42(a) | | | 50 | | | | 55,368 | |
3.80%, 03/01/46 | | | 1,250 | | | | 1,435,412 | |
3.85%, 05/01/49 | | | 500 | | | | 583,781 | |
3.15%, 01/01/50 | | | 400 | | | | 418,119 | |
3.00%, 03/01/51(a) | | | 1,000 | | | | 1,027,872 | |
Series K, 4.05%, 05/01/45 | | | 150 | | | | 173,862 | |
Public Service Enterprise Group, Inc. | | | | | | | | |
0.84%, 11/08/23 | | | 1,700 | | | | 1,693,344 | |
2.88%, 06/15/24 | | | 1,000 | | | | 1,035,399 | |
0.80%, 08/15/25(a) | | | 2,000 | | | | 1,947,107 | |
Puget Energy, Inc. | | | | | | | | |
3.65%, 05/15/25(a) | | | 250 | | | | 264,181 | |
2.38%, 06/15/28 | | | 400 | | | | 393,711 | |
4.10%, 06/15/30 | | | 500 | | | | 540,473 | |
Puget Sound Energy, Inc. | | | | | | | | |
5.80%, 03/15/40(a) | | | 500 | | | | 685,020 | |
4.22%, 06/15/48 | | | 500 | | | | 591,116 | |
3.25%, 09/15/49 | | | 750 | | | | 790,949 | |
San Diego Gas & Electric Co. | | | | | | | | |
4.15%, 05/15/48 | | | 1,000 | | | | 1,189,431 | |
2.95%, 08/15/51 | | | 300 | | | | 301,909 | |
Series NNN, 3.60%, 09/01/23 | | | 250 | | | | 258,248 | |
Series VVV, 1.70%, 10/01/30 | | | 500 | | | | 478,443 | |
Sempra Energy | | | | | | | | |
3.40%, 02/01/28 | | | 2,000 | | | | 2,129,032 | |
3.80%, 02/01/38 | | | 1,000 | | | | 1,097,224 | |
4.00%, 02/01/48 | | | 1,000 | | | | 1,112,427 | |
(5 year CMT + 2.87%), 4.13%, 04/01/52(b) | | | 500 | | | | 506,343 | |
Sierra Pacific Power Co., 2.60%, 05/01/26 | | | 1,250 | | | | 1,299,697 | |
Southern California Edison Co. | | | | | | | | |
2.85%, 08/01/29 | | | 2,350 | | | | 2,428,625 | |
2.25%, 06/01/30 | | | 1,000 | | | | 986,834 | |
6.00%, 01/15/34(a) | | | 500 | | | | 647,797 | |
5.50%, 03/15/40 | | | 50 | | | | 62,718 | |
4.50%, 09/01/40 | | | 1,000 | | | | 1,128,295 | |
4.65%, 10/01/43 | | | 350 | | | | 408,766 | |
4.00%, 04/01/47 | | | 1,000 | | | | 1,102,614 | |
3.65%, 02/01/50 | | | 400 | | | | 423,255 | |
Series 08-A, 5.95%, 02/01/38 | | | 500 | | | | 646,252 | |
| | | | | | | | |
| Security | | Par (000) | | | Value | |
| | |
Electric Utilities (continued) | | | | | | | | |
Southern California Edison Co. (continued) | | | | | | | | |
Series B, 4.88%, 03/01/49(a) | | $ | 500 | | | $ | 610,386 | |
Series C, 3.60%, 02/01/45 | | | 250 | | | | 255,516 | |
Series C, 4.13%, 03/01/48 | | | 1,000 | | | | 1,121,741 | |
Series D, 3.40%, 06/01/23 | | | 1,000 | | | | 1,032,515 | |
Series E, 3.70%, 08/01/25 | | | 2,000 | | | | 2,135,411 | |
Series G, 2.50%, 06/01/31(a) | | | 965 | | | | 968,656 | |
Series H, 3.65%, 06/01/51(a) | | | 305 | | | | 330,452 | |
Southern Co. | | | | | | | | |
2.95%, 07/01/23 | | | 2,000 | | | | 2,048,191 | |
3.25%, 07/01/26 | | | 500 | | | | 528,941 | |
4.40%, 07/01/46 | | | 750 | | | | 878,596 | |
Series B, (5 year CMT + 3.73%), 4.00%, 01/15/51(b) | | | 1,000 | | | | 1,022,500 | |
Southern Power Co. | | | | | | | | |
5.25%, 07/15/43 | | | 500 | | | | 625,280 | |
Series F, 4.95%, 12/15/46 | | | 1,000 | | | | 1,215,223 | |
Southwestern Electric Power Co. | | | | | | | | |
3.25%, 11/01/51 | | | 400 | | | | 396,666 | |
Series L, 3.85%, 02/01/48 | | | 500 | | | | 537,964 | |
Series M, 4.10%, 09/15/28 | | | 1,000 | | | | 1,107,623 | |
Southwestern Public Service Co. | | | | | | | | |
3.70%, 08/15/47 | | | 500 | | | | 561,119 | |
3.75%, 06/15/49(a) | | | 1,000 | | | | 1,138,192 | |
Series 8, 3.15%, 05/01/50 | | | 400 | | | | 417,133 | |
Tampa Electric Co. | | | | | | | | |
4.10%, 06/15/42 | | | 250 | | | | 288,105 | |
4.30%, 06/15/48 | | | 400 | | | | 488,857 | |
4.45%, 06/15/49 | | | 250 | | | | 314,164 | |
3.63%, 06/15/50(a) | | | 80 | | | | 88,866 | |
Toledo Edison Co., 6.15%, 05/15/37 | | | 100 | | | | 136,985 | |
Tucson Electric Power Co. | | | | | | | | |
1.50%, 08/01/30 | | | 865 | | | | 807,967 | |
4.85%, 12/01/48 | | | 250 | | | | 322,159 | |
3.25%, 05/01/51(a) | | | 200 | | | | 205,084 | |
Union Electric Co. | | | | | | | | |
2.95%, 06/15/27 | | | 1,000 | | | | 1,051,865 | |
2.15%, 03/15/32(a) | | | 1,000 | | | | 981,440 | |
4.00%, 04/01/48 | | | 1,000 | | | | 1,182,270 | |
3.25%, 10/01/49(a) | | | 500 | | | | 531,427 | |
Virginia Electric & Power Co. | | | | | | | | |
4.00%, 01/15/43 | | | 250 | | | | 287,272 | |
4.45%, 02/15/44 | | | 650 | | | | 793,440 | |
4.60%, 12/01/48 | | | 455 | | | | 580,442 | |
3.30%, 12/01/49 | | | 280 | | | | 297,488 | |
2.45%, 12/15/50 | | | 715 | | | | 658,685 | |
Series A, 3.15%, 01/15/26 | | | 555 | | | | 586,720 | |
Series A, 3.50%, 03/15/27 | | | 750 | | | | 807,946 | |
Series A, 3.80%, 04/01/28 | | | 500 | | | | 547,229 | |
Series A, 2.88%, 07/15/29 | | | 115 | | | | 120,608 | |
Series A, 6.00%, 05/15/37 | | | 250 | | | | 341,785 | |
Series B, 6.00%, 01/15/36 | | | 1,000 | | | | 1,371,047 | |
Series B, 3.80%, 09/15/47 | | | 500 | | | | 564,892 | |
Series C, 4.00%, 11/15/46 | | | 300 | | | | 347,540 | |
Series D, 4.65%, 08/15/43 | | | 500 | | | | 626,335 | |
Virginia Electric and Power Co. | | | | | | | | |
2.30%, 11/15/31 | | | 500 | | | | 503,803 | |
2.95%, 11/15/51 | | | 500 | | | | 501,817 | |
WEC Energy Group, Inc. | | | | | | | | |
0.55%, 09/15/23 | | | 2,000 | | | | 1,984,050 | |
3.55%, 06/15/25(a) | | | 203 | | | | 214,942 | |
| | |
MASTER PORTFOLIO SCHEDULE OF INVESTMENTS | | 41 |
| | |
Schedule of Investments (continued) December 31, 2021 | | U.S. Total Bond Index Master Portfolio (Percentages shown are based on Net Assets) |
| | | | | | | | |
| Security | | Par (000) | | | Value | |
|
| Electric Utilities (continued) | |
Wisconsin Electric Power Co. | | | | | | | | |
1.70%, 06/15/28 | | $ | 245 | | | $ | 239,986 | |
4.30%, 10/15/48 | | | 750 | | | | 920,383 | |
Wisconsin Power & Light Co., 3.00%, 07/01/29(a) | | | 1,000 | | | | 1,049,715 | |
Wisconsin Power and Light Co., 1.95%, 09/16/31(a) | | | 260 | | | | 252,933 | |
Wisconsin Public Service Corp. | | | | | | | | |
3.30%, 09/01/49 | | | 625 | | | | 664,977 | |
2.85%, 12/01/51 | | | 235 | | | | 230,807 | |
Xcel Energy, Inc. | | | | | | | | |
3.30%, 06/01/25 | | | 292 | | | | 306,563 | |
3.35%, 12/01/26(a) | | | 500 | | | | 530,931 | |
1.75%, 03/15/27 | | | 500 | | | | 495,495 | |
4.00%, 06/15/28 | | | 1,000 | | | | 1,101,912 | |
2.60%, 12/01/29 | | | 200 | | | | 204,433 | |
2.35%, 11/15/31 | | | 400 | | | | 397,860 | |
4.80%, 09/15/41 | | | 250 | | | | 303,296 | |
3.50%, 12/01/49 | | | 200 | | | | 212,653 | |
| | | | | | | | |
| | |
| | | | | | | 317,349,831 | |
|
| Electrical Equipment — 0.0% | |
Rockwell Automation, Inc., 4.20%, 03/01/49(a) | | | 1,000 | | | | 1,252,717 | |
Trane Technologies Global Holding Co. Ltd., 4.25%, 06/15/23 | | | 1,000 | | | | 1,045,358 | |
Tyco Electronics Group SA, 3.45%, 08/01/24(a) | | | 75 | | | | 78,629 | |
Vontier Corp., 1.80%, 04/01/26(c) | | | 600 | | | | 590,460 | |
| | | | | | | | |
| | |
| | | | | | | 2,967,164 | |
|
| Electronic Equipment, Instruments & Components — 0.1% | |
Amphenol Corp. | | | | | | | | |
2.80%, 02/15/30 | | | 1,000 | | | | 1,030,431 | |
2.20%, 09/15/31 | | | 325 | | | | 317,629 | |
Arrow Electronics, Inc. | | | | | | | | |
4.00%, 04/01/25 | | | 500 | | | | 533,150 | |
2.95%, 02/15/32 | | | 400 | | | | 403,936 | |
Avnet, Inc., 3.00%, 05/15/31 | | | 500 | | | | 493,589 | |
CDW LLC/CDW Finance Corp. | | | | | | | | |
5.50%, 12/01/24 | | | 750 | | | | 821,842 | |
2.67%, 12/01/26 | | | 800 | | | | 819,684 | |
4.25%, 04/01/28(a) | | | 400 | | | | 413,000 | |
3.28%, 12/01/28 | | | 800 | | | | 819,708 | |
3.25%, 02/15/29 | | | 450 | | | | 454,018 | |
3.57%, 12/01/31 | | | 800 | | | | 832,308 | |
Corning, Inc. | | | | | | | | |
4.75%, 03/15/42 | | | 50 | | | | 62,975 | |
5.35%, 11/15/48(a) | | | 750 | | | | 1,034,250 | |
3.90%, 11/15/49(a) | | | 250 | | | | 280,024 | |
4.38%, 11/15/57(a) | | | 750 | | | | 891,619 | |
5.85%, 11/15/68 | | | 600 | | | | 884,197 | |
5.45%, 11/15/79 | | | 250 | | | | 330,038 | |
Keysight Technologies, Inc., 3.00%, 10/30/29 | | | 800 | | | | 830,050 | |
Rockwell Automation, Inc. | | | | | | | | |
0.35%, 08/15/23 | | | 35 | | | | 34,769 | |
1.75%, 08/15/31 | | | 245 | | | | 238,048 | |
2.80%, 08/15/61 | | | 170 | | | | 166,320 | |
TD SYNNEX Corp.(c) | | | | | | | | |
1.75%, 08/09/26 | | | 1,000 | | | | 974,543 | |
| | | | | | | | |
| Security | | Par (000) | | | Value | |
|
| Electronic Equipment, Instruments & Components (continued) | |
TD SYNNEX Corp.(c) (continued) | | | | | | | | |
2.38%, 08/09/28 | | $ | 1,000 | | | $ | 970,697 | |
2.65%, 08/09/31 | | | 1,000 | | | | 961,339 | |
| | | | | | | | |
| | |
| | | | | | | 14,598,164 | |
|
| Energy Equipment & Services — 0.1% | |
Baker Hughes a GE Co. LLC/Baker Hughes Co- Obligor, Inc. | | | | | | | | |
2.77%, 12/15/22 | | | 500 | | | | 509,931 | |
3.34%, 12/15/27 | | | 450 | | | | 479,645 | |
3.14%, 11/07/29 | | | 325 | | | | 342,188 | |
4.08%, 12/15/47 | | | 1,500 | | | | 1,704,582 | |
Baker Hughes Holdings LLC, 5.13%, 09/15/40(a) | | | 100 | | | | 124,820 | |
Baker Hughes Holdings LLC / Baker Hughes Co-Obligor, Inc. | | | | | | | | |
1.23%, 12/15/23(a) | | | 900 | | | | 904,095 | |
2.06%, 12/15/26 | | | 685 | | | | 691,147 | |
Halliburton Co. | | | | | | | | |
3.80%, 11/15/25 | | | 2,415 | | | | 2,596,172 | |
2.92%, 03/01/30(a) | | | 1,000 | | | | 1,028,726 | |
4.85%, 11/15/35 | | | 1,000 | | | | 1,175,269 | |
4.50%, 11/15/41 | | | 50 | | | | 55,347 | |
4.75%, 08/01/43 | | | 1,250 | | | | 1,435,974 | |
5.00%, 11/15/45(a) | | | 2,175 | | | | 2,598,519 | |
NOV, Inc. | | | | | | | | |
3.60%, 12/01/29(a) | | | 1,000 | | | | 1,032,926 | |
3.95%, 12/01/42 | | | 150 | | | | 146,965 | |
| | | | | | | | |
| | |
| | | | | | | 14,826,306 | |
|
| Environmental, Maintenance & Security Service — 0.1% | |
Republic Services, Inc. | | | | | | | | |
4.75%, 05/15/23 | | | 211 | | | | 219,952 | |
2.50%, 08/15/24 | | | 205 | | | | 210,958 | |
3.20%, 03/15/25 | | | 250 | | | | 262,231 | |
2.90%, 07/01/26 | | | 85 | | | | 88,848 | |
3.95%, 05/15/28 | | | 1,750 | | | | 1,938,139 | |
1.45%, 02/15/31 | | | 880 | | | | 818,308 | |
1.75%, 02/15/32 | | | 1,000 | | | | 942,202 | |
2.38%, 03/15/33 | | | 1,500 | | | | 1,492,929 | |
3.05%, 03/01/50 | | | 1,000 | | | | 1,027,668 | |
Waste Connections, Inc. | | | | | | | | |
2.20%, 01/15/32 | | | 1,000 | | | | 979,352 | |
2.95%, 01/15/52 | | | 670 | | | | 659,492 | |
Waste Management, Inc. | | | | | | | | |
2.40%, 05/15/23 | | | 500 | | | | 509,350 | |
0.75%, 11/15/25 | | | 1,000 | | | | 973,256 | |
3.15%, 11/15/27 | | | 1,000 | | | | 1,067,802 | |
2.00%, 06/01/29(a) | | | 245 | | | | 244,747 | |
1.50%, 03/15/31 | | | 1,000 | | | | 941,555 | |
2.95%, 06/01/41 | | | 570 | | | | 594,429 | |
4.15%, 07/15/49(a) | | | 500 | | | | 631,470 | |
3.05%, 04/01/50 | | | 1,000 | | | | 986,526 | |
| | | | | | | | |
| | |
| | | | | | | 14,589,214 | |
|
| Equity Real Estate Investment Trusts (REITs) — 0.9% | |
Alexandria Real Estate Equities, Inc. | | | | | | | | |
4.30%, 01/15/26 | | | 750 | | | | 821,321 | |
3.95%, 01/15/27 | | | 500 | | | | 546,468 | |
3.38%, 08/15/31 | | | 820 | | | | 882,765 | |
| | |
| 42 | | 2 0 2 1 BLACK ROCK ANNUAL REPORT TO SHAREHOLDERS |
| | |
Schedule of Investments (continued) December 31, 2021 | | U.S. Total Bond Index Master Portfolio (Percentages shown are based on Net Assets) |
| | | | | | | | |
| Security | | Par (000) | | | Value | |
|
| Equity Real Estate Investment Trusts (REITs) (continued) | |
Alexandria Real Estate Equities, Inc. (continued) | | | | | | | | |
2.00%, 05/18/32 | | $ | 290 | | | $ | 276,952 | |
1.88%, 02/01/33 | | | 585 | | | | 549,695 | |
4.85%, 04/15/49 | | | 250 | | | | 323,082 | |
4.00%, 02/01/50 | | | 1,000 | | | | 1,165,190 | |
3.00%, 05/18/51 | | | 1,075 | | | | 1,061,724 | |
American Campus Communities Operating Partnership LP | | | | | | | | |
3.30%, 07/15/26 | | | 1,000 | | | | 1,053,521 | |
2.25%, 01/15/29 | | | 500 | | | | 494,530 | |
2.85%, 02/01/30 | | | 500 | | | | 510,108 | |
3.88%, 01/30/31 | | | 195 | | | | 215,953 | |
American Homes 4 Rent, 2.38%, 07/15/31 | | | 35 | | | | 34,301 | |
American Homes 4 Rent LP, 3.38%, 07/15/51 | | | 25 | | | | 25,097 | |
American Tower Corp. | | | | | | | | |
3.50%, 01/31/23 | | | 150 | | | | 154,029 | |
3.00%, 06/15/23 | | | 1,000 | | | | 1,028,187 | |
0.60%, 01/15/24 | | | 605 | | | | 598,524 | |
5.00%, 02/15/24 | | | 3,000 | | | | 3,227,959 | |
3.38%, 05/15/24 | | | 2,000 | | | | 2,088,336 | |
2.95%, 01/15/25 | | | 500 | | | | 519,233 | |
2.40%, 03/15/25 | | | 585 | | | | 600,686 | |
4.40%, 02/15/26 | | | 30 | | | | 32,739 | |
1.60%, 04/15/26 | | | 510 | | | | 504,782 | |
1.45%, 09/15/26 | | | 255 | | | | 249,512 | |
3.38%, 10/15/26 | | | 500 | | | | 531,261 | |
2.75%, 01/15/27 | | | 435 | | | | 448,345 | |
1.50%, 01/31/28 | | | 1,500 | | | | 1,435,063 | |
3.95%, 03/15/29 | | | 500 | | | | 545,162 | |
3.80%, 08/15/29 | | | 500 | | | | 543,953 | |
2.90%, 01/15/30 | | | 540 | | | | 553,412 | |
2.10%, 06/15/30(a) | | | 2,000 | | | | 1,925,677 | |
1.88%, 10/15/30(a) | | | 965 | | | | 911,890 | |
2.70%, 04/15/31(a) | | | 600 | | | | 601,825 | |
2.30%, 09/15/31 | | | 715 | | | | 694,427 | |
3.70%, 10/15/49 | | | 425 | | | | 452,941 | |
3.10%, 06/15/50 | | | 110 | | | | 106,975 | |
2.95%, 01/15/51 | | | 570 | | | | 539,912 | |
AvalonBay Communities, Inc. | | | | | | | | |
3.45%, 06/01/25 | | | 100 | | | | 106,131 | |
3.20%, 01/15/28 | | | 2,000 | | | | 2,137,781 | |
1.90%, 12/01/28 | | | 600 | | | | 592,403 | |
3.30%, 06/01/29 | | | 255 | | | | 275,253 | |
2.45%, 01/15/31 | | | 835 | | | | 855,819 | |
2.05%, 01/15/32(a) | | | 755 | | | | 746,410 | |
3.90%, 10/15/46 | | | 250 | | | | 295,145 | |
Boston Properties LP | | | | | | | | |
3.13%, 09/01/23 | | | 250 | | | | 257,160 | |
3.20%, 01/15/25 | | | 1,000 | | | | 1,047,008 | |
3.65%, 02/01/26 | | | 190 | | | | 203,545 | |
4.50%, 12/01/28 | | | 1,000 | | | | 1,126,980 | |
2.90%, 03/15/30 | | | 480 | | | | 488,794 | |
3.25%, 01/30/31 | | | 1,000 | | | | 1,047,699 | |
2.55%, 04/01/32 | | | 745 | | | | 739,429 | |
2.45%, 10/01/33 | | | 1,000 | | | | 968,380 | |
Brandywine Operating Partnership LP, 4.55%, 10/01/29(a) | | | 500 | | | | 557,381 | |
Brixmor Operating Partnership LP | | | | | | | | |
3.65%, 06/15/24 | | | 750 | | | | 785,771 | |
4.13%, 06/15/26 | | | 250 | | | | 270,791 | |
4.13%, 05/15/29 | | | 1,250 | | | | 1,384,788 | |
| | | | | | | | |
| Security | | Par (000) | | | Value | |
|
| Equity Real Estate Investment Trusts (REITs) (continued) | |
Brixmor Operating Partnership LP (continued) | | | | | | | | |
2.50%, 08/16/31 | | $ | 900 | | | $ | 880,728 | |
Broadstone Net Lease LLC, 2.60%, 09/15/31 | | | 570 | | | | 553,164 | |
Camden Property Trust, 2.80%, 05/15/30 | | | 1,500 | | | | 1,559,925 | |
Corporate Office Properties LP | | | | | | | | |
2.00%, 01/15/29 | | | 200 | | | | 192,286 | |
2.75%, 04/15/31 | | | 1,000 | | | | 994,270 | |
2.90%, 12/01/33 | | | 500 | | | | 488,346 | |
Crown Castle International Corp. | | | | | | | | |
3.15%, 07/15/23 | | | 1,000 | | | | 1,030,116 | |
3.70%, 06/15/26 | | | 280 | | | | 300,076 | |
1.05%, 07/15/26 | | | 2,000 | | | | 1,931,427 | |
4.00%, 03/01/27 | | | 1,000 | | | | 1,086,826 | |
3.80%, 02/15/28(a) | | | 2,000 | | | | 2,176,187 | |
2.25%, 01/15/31 | | | 1,000 | | | | 974,250 | |
2.10%, 04/01/31 | | | 1,740 | | | | 1,665,084 | |
2.90%, 04/01/41 | | | 2,000 | | | | 1,945,053 | |
4.00%, 11/15/49 | | | 585 | | | | 643,375 | |
3.25%, 01/15/51 | | | 1,000 | | | | 982,624 | |
CubeSmart LP | | | | | | | | |
2.25%, 12/15/28 | | | 1,395 | | | | 1,395,185 | |
3.00%, 02/15/30 | | | 1,500 | | | | 1,563,244 | |
2.00%, 02/15/31 | | | 500 | | | | 481,618 | |
2.50%, 02/15/32 | | | 1,545 | | | | 1,538,158 | |
CyrusOne LP/CyrusOne Finance Corp. | | | | | | | | |
2.90%, 11/15/24 | | | 1,000 | | | | 1,032,210 | |
2.15%, 11/01/30(a) | | | 275 | | | | 272,132 | |
Digital Realty Trust LP | | | | | | | | |
4.75%, 10/01/25 | | | 500 | | | | 553,512 | |
3.70%, 08/15/27(a) | | | 1,000 | | | | 1,083,666 | |
3.60%, 07/01/29(a) | | | 750 | | | | 811,772 | |
Duke Realty LP | | | | | | | | |
3.25%, 06/30/26(a) | | | 500 | | | | 530,711 | |
2.88%, 11/15/29 | | | 540 | | | | 561,055 | |
1.75%, 07/01/30 | | | 325 | | | | 308,773 | |
1.75%, 02/01/31 | | | 255 | | | | 241,282 | |
2.25%, 01/15/32 | | | 1,400 | | | | 1,372,985 | |
3.05%, 03/01/50 | | | 500 | | | | 490,465 | |
Equinix, Inc. | | | | | | | | |
2.63%, 11/18/24 | | | 835 | | | | 860,358 | |
1.25%, 07/15/25 | | | 475 | | | | 466,515 | |
1.00%, 09/15/25 | | | 1,000 | | | | 969,999 | |
1.45%, 05/15/26 | | | 395 | | | | 387,161 | |
2.90%, 11/18/26(a) | | | 135 | | | | 139,855 | |
1.55%, 03/15/28 | | | 835 | | | | 803,146 | |
2.00%, 05/15/28 | | | 375 | | | | 368,055 | |
3.20%, 11/18/29 | | | 455 | | | | 478,245 | |
2.15%, 07/15/30 | | | 500 | | | | 486,046 | |
2.50%, 05/15/31 | | | 885 | | | | 884,386 | |
3.00%, 07/15/50 | | | 135 | | | | 129,142 | |
2.95%, 09/15/51(a) | | | 400 | | | | 377,520 | |
3.40%, 02/15/52 | | | 800 | | | | 815,620 | |
ERP Operating LP | | | | | | | | |
3.00%, 04/15/23 | | | 500 | | | | 511,354 | |
3.25%, 08/01/27 | | | 500 | | | | 533,183 | |
3.50%, 03/01/28 | | | 1,000 | | | | 1,085,911 | |
3.00%, 07/01/29 | | | 735 | | | | 778,159 | |
2.50%, 02/15/30 | | | 405 | | | | 415,473 | |
1.85%, 08/01/31(a) | | | 305 | | | | 296,063 | |
4.50%, 07/01/44 | | | 150 | | | | 188,324 | |
4.50%, 06/01/45 | | | 500 | | | | 628,135 | |
| | |
MASTER PORTFOLIO SCHEDULE OF INVESTMENTS | | 43 |
| | |
Schedule of Investments (continued) December 31, 2021 | | U.S. Total Bond Index Master Portfolio (Percentages shown are based on Net Assets) |
| | | | | | | | |
| Security | | Par (000) | | | Value | |
|
| Equity Real Estate Investment Trusts (REITs) (continued) | |
Essex Portfolio LP | | | | | | | | |
3.88%, 05/01/24(a) | | $ | 100 | | | $ | 105,245 | |
4.00%, 03/01/29 | | | 1,000 | | | | 1,106,196 | |
3.00%, 01/15/30 | | | 200 | | | | 209,603 | |
1.65%, 01/15/31(a) | | | 90 | | | | 83,825 | |
2.55%, 06/15/31 | | | 170 | | | | 170,524 | |
2.65%, 03/15/32 | | | 95 | | | | 95,301 | |
2.65%, 09/01/50 | | | 400 | | | | 359,677 | |
Extra Space Storage LP | | | | | | | | |
2.55%, 06/01/31 | | | 500 | | | | 492,017 | |
2.35%, 03/15/32 | | | 275 | | | | 267,324 | |
Federal Realty Investment Trust | | | | | | | | |
3.25%, 07/15/27(a) | | | 500 | | | | 530,326 | |
3.50%, 06/01/30 | | | 800 | | | | 852,642 | |
GLP Capital LP/GLP Financing II, Inc. | | | | | | | | |
3.35%, 09/01/24 | | | 215 | | | | 222,626 | |
4.00%, 01/15/30 | | | 980 | | | | 1,036,885 | |
Healthcare Trust of America Holdings LP, 3.10%, 02/15/30 | | | 1,000 | | | | 1,032,221 | |
Healthpeak Properties, Inc. | | | | | | | | |
3.40%, 02/01/25 | | | 31 | | | | 32,524 | |
4.00%, 06/01/25 | | | 250 | | | | 268,991 | |
1.35%, 02/01/27 | | | 175 | | | | 170,297 | |
2.13%, 12/01/28 | | | 425 | | | | 425,587 | |
3.50%, 07/15/29 | | | 1,500 | | | | 1,626,508 | |
3.00%, 01/15/30 | | | 530 | | | | 556,363 | |
2.88%, 01/15/31 | | | 90 | | | | 93,593 | |
Highwoods Realty LP | | | | | | | | |
4.13%, 03/15/28 | | | 250 | | | | 275,465 | |
3.05%, 02/15/30 | | | 500 | | | | 513,677 | |
Host Hotels & Resorts LP | | | | | | | | |
2.90%, 12/15/31 | | | 400 | | | | 385,904 | |
Series E, 4.00%, 06/15/25 | | | 190 | | | | 201,439 | |
Series H, 3.38%, 12/15/29 | | | 1,000 | | | | 1,019,224 | |
Hudson Pacific Properties LP, 4.65%, 04/01/29 | | | 1,000 | | | | 1,129,290 | |
Invitation Homes Operating Partnership LP | | | | | | | | |
2.30%, 11/15/28 | | | 310 | | | | 306,623 | |
2.00%, 08/15/31 | | | 200 | | | | 188,339 | |
2.70%, 01/15/34 | | | 500 | | | | 490,365 | |
Kilroy Realty LP | | | | | | | | |
3.05%, 02/15/30 | | | 1,000 | | | | 1,030,464 | |
2.50%, 11/15/32 | | | 375 | | | | 362,684 | |
2.65%, 11/15/33 | | | 400 | | | | 388,795 | |
Kimco Realty Corp. | | | | | | | | |
3.30%, 02/01/25 | | | 350 | | | | 367,861 | |
2.80%, 10/01/26 | | | 500 | | | | 519,688 | |
2.25%, 12/01/31 | | | 250 | | | | 243,598 | |
4.45%, 09/01/47 | | | 350 | | | | 416,614 | |
3.70%, 10/01/49(a) | | | 500 | | | | 531,647 | |
Life Storage LP | | | | | | | | |
4.00%, 06/15/29 | | | 1,000 | | | | 1,108,457 | |
2.20%, 10/15/30(a) | | | 130 | | | | 127,684 | |
2.40%, 10/15/31 | | | 430 | | | | 422,654 | |
Mid-America Apartments LP | | | | | | | | |
4.30%, 10/15/23 | | | 200 | | | | 209,282 | |
1.10%, 09/15/26 | | | 265 | | | | 256,144 | |
3.60%, 06/01/27 | | | 500 | | | | 539,755 | |
3.95%, 03/15/29 | | | 500 | | | | 558,184 | |
2.75%, 03/15/30(a) | | | 250 | | | | 258,893 | |
1.70%, 02/15/31 | | | 195 | | | | 186,213 | |
2.88%, 09/15/51 | | | 125 | | | | 123,063 | |
| | | | | | | | |
| Security | | Par (000) | | | Value | |
|
| Equity Real Estate Investment Trusts (REITs) (continued) | |
National Retail Properties, Inc. | | | | | | | | |
4.30%, 10/15/28(a) | | $ | 1,000 | | | $ | 1,124,273 | |
3.10%, 04/15/50 | | | 1,000 | | | | 966,250 | |
3.00%, 04/15/52 | | | 110 | | | | 103,960 | |
Omega Healthcare Investors, Inc. | | | | | | | | |
4.38%, 08/01/23(a) | | | 1,206 | | | | 1,258,415 | |
4.50%, 04/01/27 | | | 250 | | | | 273,411 | |
4.75%, 01/15/28 | | | 500 | | | | 551,649 | |
3.63%, 10/01/29 | | | 600 | | | | 622,751 | |
3.25%, 04/15/33 | | | 400 | | | | 389,871 | |
Phillips Edison Grocery Co., 2.63%, 11/15/31 | | | 900 | | | | 875,118 | |
Physicians Realty LP, 2.63%, 11/01/31 | | | 500 | | | | 499,508 | |
Piedmont Operating Partnership LP, 3.15%, 08/15/30(a) | | | 500 | | | | 512,065 | |
Public Storage | | | | | | | | |
1.50%, 11/09/26(a) | | | 795 | | | | 793,037 | |
1.85%, 05/01/28 | | | 1,205 | | | | 1,202,508 | |
1.95%, 11/09/28 | | | 775 | | | | 772,282 | |
2.30%, 05/01/31 | | | 1,050 | | | | 1,059,416 | |
2.25%, 11/09/31 | | | 495 | | | | 497,491 | |
Rayonier LP, 2.75%, 05/17/31 | | | 715 | | | | 713,343 | |
Realty Income Corp. | | | | | | | | |
0.75%, 03/15/26 | | | 575 | | | | 551,982 | |
4.13%, 10/15/26 | | | 1,000 | | | | 1,103,572 | |
3.00%, 01/15/27 | | | 1,000 | | | | 1,054,936 | |
3.95%, 08/15/27 | | | 500 | | | | 554,379 | |
3.40%, 01/15/28 | | | 500 | | | | 539,224 | |
3.25%, 06/15/29(a) | | | 975 | | | | 1,052,676 | |
3.10%, 12/15/29 | | | 500 | | | | 530,870 | |
3.25%, 01/15/31 | | | 670 | | | | 720,426 | |
2.85%, 12/15/32 | | | 1,000 | | | | 1,037,697 | |
1.80%, 03/15/33 | | | 285 | | | | 267,002 | |
Regency Centers LP | | | | | | | | |
2.95%, 09/15/29 | | | 1,000 | | | | 1,037,605 | |
3.70%, 06/15/30(a) | | | 500 | | | | 547,207 | |
4.40%, 02/01/47(a) | | | 500 | | | | 587,647 | |
Sabra Health Care LP | | | | | | | | |
3.90%, 10/15/29(a) | | | 1,000 | | | | 1,047,019 | |
3.20%, 12/01/31 | | | 500 | | | | 488,620 | |
Safehold Operating Partnership LP, 2.80%, 06/15/31 | | | 1,000 | | | | 986,600 | |
Simon Property Group LP | | | | | | | | |
2.00%, 09/13/24 | | | 1,040 | | | | 1,058,497 | |
3.38%, 10/01/24 | | | 500 | | | | 525,929 | |
3.30%, 01/15/26(a) | | | 1,500 | | | | 1,587,226 | |
1.38%, 01/15/27 | | | 700 | | | | 683,638 | |
3.38%, 06/15/27(a) | | | 750 | | | | 804,441 | |
2.45%, 09/13/29 | | | 500 | | | | 503,405 | |
2.65%, 07/15/30(a) | | | 1,000 | | | | 1,018,720 | |
2.25%, 01/15/32 | | | 700 | | | | 681,089 | |
4.75%, 03/15/42(a) | | | 100 | | | | 123,170 | |
4.25%, 10/01/44 | | | 250 | | | | 291,947 | |
4.25%, 11/30/46 | | | 500 | | | | 591,841 | |
3.25%, 09/13/49(a) | | | 655 | | | | 670,606 | |
3.80%, 07/15/50(a) | | | 1,000 | | | | 1,121,359 | |
SITE Centers Corp., 4.25%, 02/01/26(a) | | | 250 | | | | 267,064 | |
Spirit Realty LP | | | | | | | | |
3.20%, 01/15/27 | | | 1,000 | | | | 1,045,284 | |
4.00%, 07/15/29(a) | | | 425 | | | | 466,859 | |
3.40%, 01/15/30 | | | 500 | | | | 525,837 | |
STORE Capital Corp., 2.70%, 12/01/31 | | | 500 | | | | 488,932 | |
| | |
| 44 | | 2 0 2 1 BLACK ROCK ANNUAL REPORT TO SHAREHOLDERS |
| | |
Schedule of Investments (continued) December 31, 2021 | | U.S. Total Bond Index Master Portfolio (Percentages shown are based on Net Assets) |
| | | | | | | | |
| Security | | Par (000) | | | Value | |
|
| Equity Real Estate Investment Trusts (REITs) (continued) | |
Sun Communities Operating LP | | | | | | | | |
2.30%, 11/01/28 | | $ | 310 | | | $ | 309,606 | |
2.70%, 07/15/31 | | | 735 | | | | 729,019 | |
Tanger Properties LP, 3.88%, 07/15/27(a) | | | 1,000 | | | | 1,072,092 | |
UDR, Inc. | | | | | | | | |
4.40%, 01/26/29 | | | 1,000 | | | | 1,126,493 | |
3.20%, 01/15/30 | | | 500 | | | | 525,294 | |
3.00%, 08/15/31 | | | 500 | | | | 520,712 | |
1.90%, 03/15/33 | | | 250 | | | | 230,470 | |
Ventas Realty LP | | | | | | | | |
3.50%, 04/15/24 | | | 1,000 | | | | 1,045,603 | |
2.65%, 01/15/25 | | | 650 | | | | 669,610 | |
4.13%, 01/15/26 | | | 1,250 | | | | 1,360,139 | |
3.25%, 10/15/26 | | | 500 | | | | 529,469 | |
4.00%, 03/01/28 | | | 1,500 | | | | 1,659,745 | |
3.00%, 01/15/30(a) | | | 1,000 | | | | 1,032,052 | |
4.75%, 11/15/30(a) | | | 1,000 | | | | 1,164,674 | |
2.50%, 09/01/31 | | | 700 | | | | 692,990 | |
Welltower, Inc. | | | | | | | | |
3.63%, 03/15/24 | | | 500 | | | | 525,850 | |
4.00%, 06/01/25 | | | 1,250 | | | | 1,346,237 | |
4.25%, 04/01/26 | | | 350 | | | | 383,411 | |
2.05%, 01/15/29(a) | | | 620 | | | | 610,189 | |
4.13%, 03/15/29 | | | 1,000 | | | | 1,118,255 | |
3.10%, 01/15/30 | | | 1,000 | | | | 1,047,615 | |
2.75%, 01/15/31 | | | 2,000 | | | | 2,037,275 | |
2.80%, 06/01/31 | | | 945 | | | | 963,141 | |
2.75%, 01/15/32 | | | 1,000 | | | | 1,008,781 | |
Weyerhaeuser Co. | | | | | | | | |
4.00%, 11/15/29 | | | 1,000 | | | | 1,117,364 | |
4.00%, 04/15/30 | | | 1,000 | | | | 1,115,197 | |
7.38%, 03/15/32(a) | | | 350 | | | | 492,397 | |
WP Carey, Inc., 2.45%, 02/01/32 | | | 690 | | | | 672,871 | |
| | | | | | | | |
| | |
| | | | | | | 165,170,846 | |
|
| Food & Staples Retailing — 0.5% | |
Campbell Soup Co. | | | | | | | | |
3.65%, 03/15/23 | | | 1,000 | | | | 1,030,852 | |
3.30%, 03/19/25(a) | | | 500 | | | | 526,815 | |
4.80%, 03/15/48(a) | | | 750 | | | | 934,426 | |
3.13%, 04/24/50 | | | 1,000 | | | | 984,272 | |
Conagra Brands, Inc. | | | | | | | | |
3.20%, 01/25/23 | | | 471 | | | | 479,932 | |
4.30%, 05/01/24 | | | 1,000 | | | | 1,064,089 | |
4.60%, 11/01/25 | | | 1,000 | | | | 1,099,475 | |
1.38%, 11/01/27 | | | 1,000 | | | | 955,021 | |
5.30%, 11/01/38 | | | 1,000 | | | | 1,263,586 | |
5.40%, 11/01/48(a) | | | 500 | | | | 673,366 | |
Costco Wholesale Corp. | | | | | | | | |
3.00%, 05/18/27 | | | 1,500 | | | | 1,611,864 | |
1.60%, 04/20/30 | | | 1,500 | | | | 1,453,138 | |
1.75%, 04/20/32 | | | 500 | | | | 485,781 | |
Dollar General Corp. | | | | | | | | |
3.25%, 04/15/23 | | | 2,000 | | | | 2,048,327 | |
4.13%, 04/03/50 | | | 1,000 | | | | 1,154,232 | |
Dollar Tree, Inc. | | | | | | | | |
4.20%, 05/15/28(a) | | | 1,000 | | | | 1,114,509 | |
2.65%, 12/01/31 | | | 500 | | | | 501,091 | |
3.38%, 12/01/51 | | | 400 | | | | 402,677 | |
General Mills, Inc. | | | | | | | | |
3.65%, 02/15/24 | | | 500 | | | | 523,928 | |
| | | | | | | | |
| Security | | Par (000) | | | Value | |
|
| Food & Staples Retailing (continued) | |
General Mills, Inc. (continued) | | | | | | | | |
3.20%, 02/10/27 | | $ | 250 | | | $ | 265,615 | |
4.20%, 04/17/28 | | | 1,000 | | | | 1,116,721 | |
2.88%, 04/15/30(a) | | | 1,000 | | | | 1,043,620 | |
2.25%, 10/14/31(a) | | | 700 | | | | 691,653 | |
3.00%, 02/01/51(a) | | | 1,051 | | | | 1,053,859 | |
Ingredion, Inc., 3.90%, 06/01/50(a) | | | 500 | | | | 565,267 | |
Kellogg Co. | | | | | | | | |
2.65%, 12/01/23 | | | 1,000 | | | | 1,030,525 | |
3.25%, 04/01/26 | | | 65 | | | | 68,828 | |
4.30%, 05/15/28 | | | 1,000 | | | | 1,131,756 | |
2.10%, 06/01/30(a) | | | 2,000 | | | | 1,958,890 | |
4.50%, 04/01/46 | | | 350 | | | | 434,252 | |
Koninklijke Ahold Delhaize NV, 5.70%, 10/01/40(a) | | | 73 | | | | 99,058 | |
Kroger Co. | | | | | | | | |
3.50%, 02/01/26 | | | 495 | | | | 529,663 | |
2.65%, 10/15/26 | | | 1,000 | | | | 1,039,075 | |
3.70%, 08/01/27 | | | 500 | | | | 545,739 | |
4.50%, 01/15/29(a) | | | 1,000 | | | | 1,151,715 | |
2.20%, 05/01/30(a) | | | 1,500 | | | | 1,494,070 | |
1.70%, 01/15/31(a) | | | 1,065 | | | | 1,011,181 | |
5.15%, 08/01/43(a) | | | 125 | | | | 163,376 | |
3.88%, 10/15/46 | | | 500 | | | | 556,345 | |
4.45%, 02/01/47(a) | | | 1,000 | | | | 1,213,144 | |
4.65%, 01/15/48(a) | | | 500 | | | | 619,702 | |
5.40%, 01/15/49(a) | | | 500 | | | | 698,195 | |
3.95%, 01/15/50(a) | | | 300 | | | | 344,949 | |
McCormick & Co., Inc. | | | | | | | | |
0.90%, 02/15/26 | | | 375 | | | | 362,420 | |
2.50%, 04/15/30 | | | 2,000 | | | | 2,021,657 | |
1.85%, 02/15/31 | | | 135 | | | | 128,760 | |
Sysco Corp. | | | | | | | | |
3.75%, 10/01/25(a) | | | 100 | | | | 107,160 | |
3.30%, 07/15/26 | | | 630 | | | | 670,952 | |
3.25%, 07/15/27 | | | 1,000 | | | | 1,063,379 | |
5.95%, 04/01/30 | | | 1,000 | | | | 1,248,199 | |
2.45%, 12/14/31 | | | 500 | | | | 500,621 | |
4.85%, 10/01/45 | | | 150 | | | | 183,857 | |
4.50%, 04/01/46 | | | 250 | | | | 290,875 | |
4.45%, 03/15/48 | | | 500 | | | | 588,332 | |
6.60%, 04/01/50 | | | 1,543 | | | | 2,397,013 | |
3.15%, 12/14/51 | | | 200 | | | | 196,856 | |
Target Corp. | | | | | | | | |
3.50%, 07/01/24 | | | 1,000 | | | | 1,060,281 | |
2.25%, 04/15/25 | | | 1,420 | | | | 1,463,371 | |
2.50%, 04/15/26(a) | | | 250 | | | | 261,662 | |
3.38%, 04/15/29 | | | 1,000 | | | | 1,095,285 | |
2.35%, 02/15/30 | | | 980 | | | | 1,007,096 | |
2.65%, 09/15/30 | | | 1,160 | | | | 1,215,882 | |
7.00%, 01/15/38 | | | 1,000 | | | | 1,579,507 | |
3.63%, 04/15/46(a) | | | 850 | | | | 998,527 | |
3.90%, 11/15/47 | | | 500 | | | | 619,345 | |
Walgreens Boots Alliance, Inc. | | | | | | | | |
0.95%, 11/17/23 | | | 1,000 | | | | 999,473 | |
3.45%, 06/01/26 | | | 459 | | | | 488,375 | |
3.20%, 04/15/30(a) | | | 2,000 | | | | 2,117,487 | |
4.10%, 04/15/50 | | | 1,000 | | | | 1,120,904 | |
Walmart, Inc. | | | | | | | | |
3.40%, 06/26/23 | | | 2,000 | | | | 2,080,410 | |
3.30%, 04/22/24 | | | 1,750 | | | | 1,834,398 | |
| | |
MASTER PORTFOLIO SCHEDULE OF INVESTMENTS | | 45 |
| | |
Schedule of Investments (continued) December 31, 2021 | | U.S. Total Bond Index Master Portfolio (Percentages shown are based on Net Assets) |
| | | | | | | | |
| Security | | Par
(000) | | | Value | |
|
| Food & Staples Retailing (continued) | |
Walmart, Inc. (continued) | | | | | | | | |
1.05%, 09/17/26 | | $ | 240 | | | $ | 237,304 | |
1.50%, 09/22/28(a) | | | 3,500 | | | | 3,478,328 | |
2.38%, 09/24/29 | | | 33 | | | | 34,427 | |
1.80%, 09/22/31 | | | 5,500 | | | | 5,444,851 | |
2.50%, 09/22/41 | | | 3,200 | | | | 3,226,316 | |
4.05%, 06/29/48 | | | 475 | | | | 603,676 | |
2.65%, 09/22/51 | | | 1,160 | | | | 1,186,037 | |
| | | | | | | | |
| | |
| | | | | | | 79,047,602 | |
| | |
| Food Products — 0.1% | | | | | | |
Archer-Daniels-Midland Co. | | | | | | | | |
2.50%, 08/11/26 | | | 1,750 | | | | 1,819,846 | |
4.54%, 03/26/42 | | | 37 | | | | 47,293 | |
4.02%, 04/16/43 | | | 125 | | | | 150,420 | |
3.75%, 09/15/47 | | | 1,000 | | | | 1,179,343 | |
4.50%, 03/15/49(a) | | | 1,000 | | | | 1,314,545 | |
Bunge Ltd. Finance Corp.(a) | | | | | | | | |
3.75%, 09/25/27 | | | 1,000 | | | | 1,084,840 | |
2.75%, 05/14/31 | | | 700 | | | | 710,418 | |
Flowers Foods, Inc., 2.40%, 03/15/31(a) | | | 60 | | | | 59,092 | |
Hershey Co. | | | | | | | | |
2.05%, 11/15/24 | | | 500 | | | | 513,715 | |
2.45%, 11/15/29(a) | | | 500 | | | | 518,318 | |
3.13%, 11/15/49 | | | 500 | | | | 534,180 | |
2.65%, 06/01/50(a) | | | 1,000 | | | | 1,004,100 | |
Hormel Foods Corp. | | | | | | | | |
1.70%, 06/03/28 | | | 1,300 | | | | 1,294,945 | |
3.05%, 06/03/51 | | | 1,300 | | | | 1,380,652 | |
J M Smucker Co., 2.13%, 03/15/32(a) | | | 1,000 | | | | 967,132 | |
JM Smucker Co. | | | | | | | | |
3.50%, 03/15/25 | | | 1,250 | | | | 1,332,017 | |
4.25%, 03/15/35 | | | 250 | | | | 291,981 | |
4.38%, 03/15/45(a) | | | 500 | | | | 603,156 | |
3.55%, 03/15/50 | | | 1,000 | | | | 1,082,299 | |
Mondelez International, Inc. | | | | | | | | |
1.50%, 05/04/25 | | | 350 | | | | 350,324 | |
2.75%, 04/13/30 | | | 2,000 | | | | 2,061,005 | |
1.50%, 02/04/31 | | | 580 | | | | 543,910 | |
1.88%, 10/15/32(a) | | | 500 | | | | 476,713 | |
2.63%, 09/04/50 | | | 715 | | | | 667,846 | |
Tyson Foods, Inc. | | | | | | | | |
3.95%, 08/15/24 | | | 2,000 | | | | 2,126,021 | |
3.55%, 06/02/27 | | | 1,000 | | | | 1,076,414 | |
4.88%, 08/15/34 | | | 70 | | | | 85,530 | |
5.15%, 08/15/44 | | | 250 | | | | 323,582 | |
4.55%, 06/02/47 | | | 250 | | | | 309,807 | |
5.10%, 09/28/48 | | | 1,500 | | | | 2,017,407 | |
| | | | | | | | |
| | |
| | | | | | | 25,926,851 | |
|
| Health Care Equipment & Supplies — 0.3% | |
Abbott Laboratories | | | | | | | | |
3.88%, 09/15/25 | | | 45 | | | | 48,867 | |
3.75%, 11/30/26 | | | 1,417 | | | | 1,565,831 | |
1.15%, 01/30/28 | | | 530 | | | | 515,127 | |
1.40%, 06/30/30(a) | | | 445 | | | | 429,371 | |
4.75%, 11/30/36 | | | 2,250 | | | | 2,871,274 | |
5.30%, 05/27/40 | | | 500 | | | | 690,409 | |
4.75%, 04/15/43 | | | 250 | | | | 325,177 | |
4.90%, 11/30/46 | | | 2,000 | | | | 2,734,402 | |
| | | | | | | | |
| Security | | Par
(000) | | | Value | |
| | |
| Health Care Equipment & Supplies (continued) | | | | | | |
Baxter International, Inc. | | | | | | | | |
2.60%, 08/15/26 | | $ | 730 | | | $ | 756,489 | |
1.92%, 02/01/27(c) | | | 2,715 | | | | 2,724,953 | |
2.27%, 12/01/28(c) | | | 1,805 | | | | 1,818,074 | |
3.95%, 04/01/30 | | | 500 | | | | 556,684 | |
3.50%, 08/15/46 | | | 500 | | | | 544,126 | |
3.13%, 12/01/51(c) | | | 450 | | | | 462,974 | |
Becton Dickinson and Co. | | | | | | | | |
3.36%, 06/06/24 | | | 454 | | | | 475,314 | |
3.73%, 12/15/24 | | | 342 | | | | 363,523 | |
3.70%, 06/06/27 | | | 1,630 | | | | 1,776,330 | |
2.82%, 05/20/30 | | | 470 | | | | 486,482 | |
1.96%, 02/11/31 | | | 1,075 | | | | 1,033,386 | |
4.69%, 12/15/44 | | | 696 | | | | 876,323 | |
4.67%, 06/06/47 | | | 500 | | | | 630,416 | |
3.79%, 05/20/50(a) | | | 455 | | | | 510,543 | |
Boston Scientific Corp. | | | | | | | | |
3.45%, 03/01/24 | | | 2,000 | | | | 2,091,427 | |
3.85%, 05/15/25 | | | 382 | | | | 410,534 | |
4.00%, 03/01/29 | | | 250 | | | | 277,619 | |
2.65%, 06/01/30(a) | | | 1,000 | | | | 1,019,410 | |
4.55%, 03/01/39 | | | 1,000 | | | | 1,196,108 | |
4.70%, 03/01/49 | | | 800 | | | | 1,013,259 | |
Danaher Corp. | | | | | | | | |
3.35%, 09/15/25 | | | 300 | | | | 319,452 | |
4.38%, 09/15/45 | | | 300 | | | | 368,751 | |
2.60%, 10/01/50(a) | | | 500 | | | | 476,601 | |
2.80%, 12/10/51 | | | 800 | | | | 788,884 | |
DH Europe Finance II Sarl | | | | | | | | |
2.20%, 11/15/24 | | | 1,000 | | | | 1,021,872 | |
2.60%, 11/15/29 | | | 445 | | | | 459,770 | |
3.25%, 11/15/39(a) | | | 400 | | | | 427,002 | |
3.40%, 11/15/49 | | | 675 | | | | 723,308 | |
Koninklijke Philips NV, 5.00%, 03/15/42 | | | 250 | | | | 317,383 | |
Medtronic Global Holdings SCA, 3.35%, 04/01/27 | | | 250 | | | | 269,582 | |
Medtronic, Inc. | | | | | | | | |
3.50%, 03/15/25 | | | 1,809 | | | | 1,925,999 | |
4.38%, 03/15/35 | | | 350 | | | | 430,549 | |
4.63%, 03/15/45(a) | | | 1,750 | | | | 2,291,874 | |
MidMichigan Health, Series 2020, 3.41%, 06/01/50 | | | 47 | | | | 50,045 | |
PerkinElmer, Inc. | | | | | | | | |
1.90%, 09/15/28 | | | 520 | | | | 507,659 | |
3.30%, 09/15/29 | | | 1,000 | | | | 1,058,395 | |
2.25%, 09/15/31 | | | 275 | | | | 267,397 | |
Smith & Nephew PLC, 2.03%, 10/14/30 | | | 1,400 | | | | 1,351,905 | |
STERIS Irish FinCo. UnLtd Co. | | | | | | | | |
2.70%, 03/15/31(a) | | | 700 | | | | 706,009 | |
3.75%, 03/15/51 | | | 400 | | | | 437,712 | |
Stryker Corp. | | | | | | | | |
3.38%, 05/15/24 | | | 2,000 | | | | 2,098,838 | |
3.38%, 11/01/25 | | | 580 | | | | 618,243 | |
3.50%, 03/15/26 | | | 500 | | | | 535,835 | |
4.63%, 03/15/46 | | | 1,250 | | | | 1,600,689 | |
2.90%, 06/15/50(a) | | | 500 | | | | 502,237 | |
Thermo Fisher Scientific, Inc. | | | | | | | | |
3.65%, 12/15/25 | | | 500 | | | | 536,789 | |
1.75%, 10/15/28 | | | 380 | | | | 377,517 | |
2.60%, 10/01/29 | | | 970 | | | | 1,008,150 | |
| | |
| 46 | | 2 0 2 1 BLACK ROCK ANNUAL REPORT TO SHAREHOLDERS |
| | |
Schedule of Investments (continued) December 31, 2021 | | U.S. Total Bond Index Master Portfolio (Percentages shown are based on Net Assets) |
| | | | | | | | |
| Security | | Par (000) | | | Value | |
|
| Health Care Equipment & Supplies (continued) | |
Thermo Fisher Scientific, Inc. (continued) | | | | | | | | |
2.00%, 10/15/31 | | $ | 250 | | | $ | 246,320 | |
2.80%, 10/15/41(a) | | | 1,420 | | | | 1,436,477 | |
4.10%, 08/15/47(a) | | | 500 | | | | 616,738 | |
Zimmer Biomet Holdings, Inc. | | | | | | | | |
2.60%, 11/24/31 | | | 1,100 | | | | 1,105,781 | |
4.45%, 08/15/45(a) | | | 500 | | | | 593,000 | |
| | | | | | | | |
| | |
| | | | | | | 53,681,195 | |
|
| Health Care Providers & Services — 0.7% | |
AdventHealth Obligated Group, 2.80%, 11/15/51 | | | 139 | | | | 135,497 | |
Adventist Health System/West, 3.63%, 03/01/49 | | | 197 | | | | 217,583 | |
Advocate Health & Hospitals Corp. | | | | | | | | |
3.83%, 08/15/28 | | | 74 | | | | 82,646 | |
4.27%, 08/15/48 | | | 107 | | | | 132,350 | |
3.39%, 10/15/49(a) | | | 460 | | | | 512,161 | |
Series 2020, 3.01%, 06/15/50(a) | | | 265 | | | | 273,131 | |
Aetna, Inc. | | | | | | | | |
2.80%, 06/15/23 | | | 1,500 | | | | 1,536,915 | |
3.50%, 11/15/24 | | | 320 | | | | 337,514 | |
6.75%, 12/15/37 | | | 300 | | | | 433,756 | |
4.50%, 05/15/42 | | | 250 | | | | 295,427 | |
4.75%, 03/15/44 | | | 1,025 | | | | 1,252,044 | |
3.88%, 08/15/47 | | | 1,050 | | | | 1,167,998 | |
AHS Hospital Corp., Series 2021, 2.78%, 07/01/51 | | | 470 | | | | 465,896 | |
Allina Health System | | | | | | | | |
Series 2019, 3.89%, 04/15/49 | | | 220 | | | | 257,683 | |
Series 2021, 2.90%, 11/15/51 | | | 70 | | | | 70,421 | |
AmerisourceBergen Corp. | | | | | | | | |
3.45%, 12/15/27 | | | 750 | | | | 806,067 | |
2.80%, 05/15/30 | | | 400 | | | | 413,021 | |
2.70%, 03/15/31 | | | 500 | | | | 505,172 | |
4.25%, 03/01/45 | | | 250 | | | | 284,802 | |
4.30%, 12/15/47 | | | 500 | | | | 589,109 | |
Anthem, Inc. | | | | | | | | |
3.30%, 01/15/23 | | | 100 | | | | 102,601 | |
3.50%, 08/15/24 | | | 250 | | | | 263,992 | |
2.38%, 01/15/25 | | | 160 | | | | 164,986 | |
1.50%, 03/15/26 | | | 990 | | | | 988,845 | |
3.65%, 12/01/27 | | | 1,000 | | | | 1,097,059 | |
2.25%, 05/15/30 | | | 785 | | | | 782,197 | |
2.55%, 03/15/31(a) | | | 700 | | | | 714,668 | |
4.63%, 05/15/42 | | | 50 | | | | 62,134 | |
4.65%, 01/15/43 | | | 2,000 | | | | 2,499,047 | |
5.10%, 01/15/44 | | | 900 | | | | 1,188,149 | |
4.65%, 08/15/44 | | | 350 | | | | 438,713 | |
4.38%, 12/01/47 | | | 1,000 | | | | 1,218,255 | |
4.55%, 03/01/48 | | | 750 | | | | 935,384 | |
3.13%, 05/15/50 | | | 845 | | | | 865,807 | |
3.60%, 03/15/51 | | | 990 | | | | 1,098,855 | |
Ascension Health | | | | | | | | |
3.95%, 11/15/46(a) | | | 1,500 | | | | 1,833,998 | |
Series B, 2.53%, 11/15/29(a) | | | 150 | | | | 155,680 | |
Series B, 3.11%, 11/15/39 | | | 52 | | | | 55,250 | |
Banner Health | | | | | | | | |
2.91%, 01/01/42 | | | 216 | | | | 220,191 | |
2.91%, 01/01/51(a) | | | 309 | | | | 312,187 | |
Series 2020, 3.18%, 01/01/50 | | | 181 | | | | 191,183 | |
| | | | | | | | |
| Security | | Par (000) | | | Value | |
|
| Health Care Providers & Services (continued) | |
Baptist Healthcare System Obligated Group, Series 20B, 3.54%, 08/15/50 | | $ | 65 | | | $ | 70,864 | |
BayCare Health System, Inc., Series 2020, 3.83%, 11/15/50 | | | 285 | | | | 337,724 | |
Baylor Scott & White Holdings | | | | | | | | |
1.78%, 11/15/30 | | | 120 | | | | 115,810 | |
2.84%, 11/15/50(a) | | | 1,183 | | | | 1,183,517 | |
Beth Israel Lahey Health, Inc., 3.08%, 07/01/51 | | | 86 | | | | 84,782 | |
Bon Secours Mercy Health, Inc.(a) | | | | | | | | |
3.46%, 06/01/30 | | | 200 | | | | 217,366 | |
Series 20-2, 3.21%, 06/01/50 | | | 170 | | | | 179,092 | |
Cardinal Health, Inc. | | | | | | | | |
3.50%, 11/15/24 | | | 250 | | | | 263,829 | |
3.75%, 09/15/25 | | | 500 | | | | 535,912 | |
3.41%, 06/15/27(a) | | | 1,000 | | | | 1,072,485 | |
4.60%, 03/15/43 | | | 50 | | | | 57,548 | |
4.90%, 09/15/45 | | | 750 | | | | 901,249 | |
4.37%, 06/15/47 | | | 500 | | | | 563,460 | |
Cedars-Sinai Health System, 2.29%, 08/15/31 | | | 200 | | | | 199,563 | |
Children’s Health System of Texas, 2.51%, 08/15/50(a) | | | 71 | | | | 67,012 | |
Children’s Hospital Corp., Series 2017, 4.12%, 01/01/47(a) | | | 200 | | | | 246,920 | |
Children’s Hospital of Philadelphia,
Series 2020, 2.70%, 07/01/50 | | | 144 | | | | 140,093 | |
CHRISTUS Health, Series C, 4.34%, 07/01/28 | | | 155 | | | | 175,391 | |
CommonSpirit Health | | | | | | | | |
2.76%, 10/01/24 | | | 2,245 | | | | 2,315,356 | |
1.55%, 10/01/25 | | | 184 | | | | 182,257 | |
3.35%, 10/01/29 | | | 1,132 | | | | 1,203,747 | |
2.78%, 10/01/30 | | | 308 | | | | 315,245 | |
3.82%, 10/01/49(a) | | | 1,251 | | | | 1,414,040 | |
4.19%, 10/01/49 | | | 400 | | | | 465,408 | |
3.91%, 10/01/50 | | | 597 | | | | 664,184 | |
Community Health Network, Inc., Series 20-A, 3.10%, 05/01/50 | | | 1,000 | | | | 998,036 | |
Cottage Health Obligated Group, Series 2020, 3.30%, 11/01/49 | | | 46 | | | | 49,421 | |
Dartmouth-Hitchcock Health, Series B, 4.18%, 08/01/48 | | | 100 | | | | 118,478 | |
Dignity Health, 5.27%, 11/01/64 | | | 100 | | | | 139,401 | |
Duke University Health System, Inc., Series 2017, 3.92%, 06/01/47 | | | 173 | | | | 205,514 | |
Hackensack Meridian Health, Inc. | | | | | | | | |
Series 2020, 2.68%, 09/01/41 | | | 195 | | | | 190,159 | |
Series 2020, 2.88%, 09/01/50 | | | 793 | | | | 794,640 | |
Hartford HealthCare Corp., 3.45%, 07/01/54(a) | | | 175 | | | | 186,212 | |
HCA, Inc. | | | | | | | | |
4.75%, 05/01/23 | | | 3,000 | | | | 3,142,112 | |
5.25%, 04/15/25 | | | 1,000 | | | | 1,106,204 | |
5.25%, 06/15/26 | | | 1,000 | | | | 1,124,574 | |
4.13%, 06/15/29(a) | | | 750 | | | | 825,282 | |
2.38%, 07/15/31(a) | | | 1,000 | | | | 984,456 | |
5.13%, 06/15/39 | | | 1,000 | | | | 1,231,529 | |
5.50%, 06/15/47 | | | 1,000 | | | | 1,308,541 | |
5.25%, 06/15/49 | | | 1,250 | | | | 1,605,400 | |
3.50%, 07/15/51 | | | 1,360 | | | | 1,386,481 | |
Humana, Inc. | | | | | | | | |
3.85%, 10/01/24 | | | 500 | | | | 530,765 | |
1.35%, 02/03/27 | | | 765 | | | | 743,869 | |
| | |
MASTER PORTFOLIO SCHEDULE OF INVESTMENTS | | 47 |
| | |
Schedule of Investments (continued) December 31, 2021 | | U.S. Total Bond Index Master Portfolio (Percentages shown are based on Net Assets) |
| | | | | | | | |
| Security | | Par (000) | | | Value | |
|
| Health Care Providers & Services (continued) | |
Humana, Inc. (continued) | | | | | | | | |
3.13%, 08/15/29 | | $ | 500 | | | $ | 523,862 | |
2.15%, 02/03/32 | | | 465 | | | | 449,624 | |
4.63%, 12/01/42 | | | 1,000 | | | | 1,231,061 | |
4.95%, 10/01/44 | | | 250 | | | | 321,534 | |
4.80%, 03/15/47 | | | 200 | | | | 253,369 | |
Indiana University Health, Inc. Obligated Group, Series 2021, 2.85%, 11/01/51 | | | 500 | | | | 502,654 | |
Integris Baptist Medical Center, Inc., Series A, 3.88%, 08/15/50 | | | 188 | | | | 214,667 | |
Johns Hopkins Health System Corp., 3.84%, 05/15/46 | | | 175 | | | | 207,642 | |
Kaiser Foundation Hospitals | | | | | | | | |
3.15%, 05/01/27 | | | 500 | | | | 532,199 | |
2.81%, 06/01/41 | | | 574 | | | | 577,100 | |
4.15%, 05/01/47 | | | 1,110 | | | | 1,368,340 | |
3.00%, 06/01/51 | | | 671 | | | | 690,511 | |
Series 2019, 3.27%, 11/01/49 | | | 325 | | | | 347,711 | |
Mass General Brigham, Inc. | | | | | | | | |
3.34%, 07/01/60 | | | 600 | | | | 652,947 | |
Series 2017, 3.77%, 07/01/48 | | | 85 | | | | 98,235 | |
Series 2020, 3.19%, 07/01/49 | | | 500 | | | | 529,683 | |
Mayo Clinic | | | | | | | | |
Series 2016, 4.13%, 11/15/52(a) | | | 300 | | | | 376,682 | |
Series 2021, 3.20%, 11/15/61 | | | 367 | | | | 394,421 | |
McKesson Corp. | | | | | | | | |
2.85%, 03/15/23 | | | 150 | | | | 152,649 | |
3.80%, 03/15/24 | | | 1,500 | | | | 1,574,582 | |
1.30%, 08/15/26 | | | 900 | | | | 878,509 | |
3.95%, 02/16/28 | | | 1,000 | | | | 1,097,950 | |
MedStar Health, Inc., Series 20A, 3.63%, 08/15/49 | | | 99 | | | | 108,113 | |
Memorial Health Services, 3.45%, 11/01/49 | | | 175 | | | | 192,714 | |
Memorial Sloan-Kettering Cancer Center | | | | | | | | |
5.00%, 07/01/42 | | | 200 | | | | 264,893 | |
4.13%, 07/01/52 | | | 200 | | | | 251,748 | |
Series 2020, 2.96%, 01/01/50 | | | 1,214 | | | | 1,240,034 | |
Mercy Health, Series 2018, 4.30%, 07/01/28 | | | 64 | | | | 71,986 | |
Methodist Hospital, Series 20A, 2.71%, 12/01/50(a) | | | 219 | | | | 211,736 | |
Montefiore Obligated Group, 4.29%, 09/01/50 | | | 364 | | | | 356,508 | |
Mount Sinai Hospitals Group, Inc. | | | | | | | | |
Series 2017, 3.98%, 07/01/48 | | | 66 | | | | 76,225 | |
Series 2019, 3.74%, 07/01/49 | | | 300 | | | | 326,054 | |
Series 2020, 3.39%, 07/01/50 | | | 186 | | | | 193,864 | |
MultiCare Health System, 2.80%, 08/15/50 | | | 47 | | | | 45,547 | |
New York and Presbyterian Hospital | | | | | | | | |
2.26%, 08/01/40 | | | 500 | | | | 467,662 | |
4.02%, 08/01/45 | | | 150 | | | | 183,381 | |
2.61%, 08/01/60 | | | 500 | | | | 475,839 | |
Series 2019, 3.95%, 08/01/2119 | | | 207 | | | | 251,038 | |
Northwell Healthcare, Inc. | | | | | | | | |
3.98%, 11/01/46 | | | 200 | | | | 227,126 | |
4.26%, 11/01/47 | | | 70 | | | | 82,640 | |
3.81%, 11/01/49 | | | 162 | | | | 179,633 | |
Novant Health, Inc. | | | | | | | | |
2.64%, 11/01/36 | | | 138 | | | | 139,064 | |
3.17%, 11/01/51 | | | 434 | | | | 455,367 | |
3.32%, 11/01/61 | | | 217 | | | | 232,657 | |
Ochsner LSU Health System of North Louisiana, 2.51%, 05/15/31(a) | | | 200 | | | | 195,607 | |
| | | | | | | | |
| Security | | Par (000) | | | Value | |
|
| Health Care Providers & Services (continued) | |
OhioHealth Corp., 2.83%, 11/15/41 | | $ | 331 | | | $ | 337,811 | |
Orlando Health Obligated Group(a) | | | | | | | | |
4.09%, 10/01/48 | | | 29 | | | | 34,274 | |
3.33%, 10/01/50 | | | 192 | | | | 201,009 | |
PeaceHealth Obligated Group | | | | | | | | |
Series 2018, 4.79%, 11/15/48 | | | 79 | | | | 104,929 | |
Series 2020, 1.38%, 11/15/25 | | | 24 | | | | 23,841 | |
Series 2020, 3.22%, 11/15/50 | | | 139 | | | | 145,477 | |
Piedmont Healthcare, Inc. | | | | | | | | |
2.72%, 01/01/42 | | | 164 | | | | 160,117 | |
2.86%, 01/01/52 | | | 66 | | | | 64,379 | |
Providence St Joseph Health Obligated Group, 2.70%, 10/01/51 | | | 905 | | | | 874,691 | |
Providence St. Joseph Health Obligated Group | | | | | | | | |
Series 19A, 2.53%, 10/01/29 | | | 325 | | | | 335,277 | |
Series A, 3.93%, 10/01/48(a) | | | 77 | | | | 90,491 | |
Rady Children’s Hospital-San Diego, 3.15%, 08/15/51 | | | 120 | | | | 128,429 | |
RWJ Barnabas Health, Inc., 3.95%, 07/01/46(a) | | | 230 | | | | 269,156 | |
Seattle Children’s Hospital, Series 2021, 2.72%, 10/01/50 | | | 175 | | | | 171,592 | |
Sentara Healthcare, 2.93%, 11/01/51 | | | 134 | | | | 135,759 | |
Sharp HealthCare, Series 20B, 2.68%, 08/01/50 | | | 91 | | | | 86,015 | |
Spectrum Health System Obligated Group, Series 19A, 3.49%, 07/15/49 | | | 85 | | | | 93,887 | |
Stanford Health Care | | | | | | | | |
3.03%, 08/15/51 | | | 700 | | | | 727,700 | |
Series 2018, 3.80%, 11/15/48 | | | 64 | | | | 76,063 | |
Summa Health, 3.51%, 11/15/51(a) | | | 200 | | | | 210,839 | |
Sutter Health | | | | | | | | |
Series 2018, 3.70%, 08/15/28 | | | 86 | | | | 94,863 | |
Series 2018, 4.09%, 08/15/48 | | | 107 | | | | 125,747 | |
Series 20A, 2.29%, 08/15/30 | | | 260 | | | | 259,622 | |
Series 20A, 3.36%, 08/15/50 | | | 335 | | | | 351,028 | |
Series 20-A, 1.32%, 08/15/25 | | | 134 | | | | 132,784 | |
Series 20-A, 3.16%, 08/15/40(a) | | | 177 | | | | 182,061 | |
Texas Health Resources, 2.33%, 11/15/50 | | | 165 | | | | 149,037 | |
Toledo Hospital | | | | | | | | |
6.02%, 11/15/48 | | | 125 | | | | 152,021 | |
Series B, 5.33%, 11/15/28 | | | 125 | | | | 140,079 | |
Trinity Health Corp. | | | | | | | | |
Series 2019, 3.43%, 12/01/48(a) | | | 137 | | | | 150,268 | |
Series 2021, 2.63%, 12/01/40 | | | 112 | | | | 109,785 | |
UnitedHealth Group, Inc. | | | | | | | | |
2.88%, 03/15/23 | | | 250 | | | | 256,372 | |
3.50%, 06/15/23 | | | 2,000 | | | | 2,080,051 | |
2.38%, 08/15/24 | | | 2,425 | | | | 2,510,807 | |
3.75%, 07/15/25 | | | 1,000 | | | | 1,084,263 | |
1.25%, 01/15/26 | | | 210 | | | | 209,201 | |
3.10%, 03/15/26 | | | 500 | | | | 534,445 | |
1.15%, 05/15/26(a) | | | 995 | | | | 984,237 | |
3.45%, 01/15/27 | | | 500 | | | | 544,091 | |
3.38%, 04/15/27(a) | | | 1,000 | | | | 1,083,466 | |
3.85%, 06/15/28 | | | 1,000 | | | | 1,114,518 | |
2.88%, 08/15/29 | | | 1,890 | | | | 1,999,325 | |
2.00%, 05/15/30(a) | | | 315 | | | | 312,721 | |
2.30%, 05/15/31 | | | 1,145 | | | | 1,164,943 | |
4.63%, 07/15/35 | | | 555 | | | | 693,497 | |
6.88%, 02/15/38 | | | 100 | | | | 153,315 | |
3.50%, 08/15/39 | | | 645 | | | | 715,171 | |
2.75%, 05/15/40 | | | 300 | | | | 304,554 | |
| | |
| 48 | | 2 0 2 1 BLACK ROCK ANNUAL REPORT TO SHAREHOLDERS |
| | |
Schedule of Investments (continued) December 31, 2021 | | U.S. Total Bond Index Master Portfolio (Percentages shown are based on Net Assets) |
| | | | | | | | |
| Security | | Par (000) | | | Value | |
|
| Health Care Providers & Services (continued) | |
UnitedHealth Group, Inc. (continued) | | | | | | | | |
5.95%, 02/15/41 | | $ | 100 | | | $ | 143,515 | |
3.05%, 05/15/41 | | | 1,255 | | | | 1,313,507 | |
4.63%, 11/15/41 | | | 600 | | | | 753,591 | |
3.95%, 10/15/42 | | | 150 | | | | 174,833 | |
4.25%, 03/15/43(a) | | | 500 | | | | 606,003 | |
4.75%, 07/15/45 | | | 1,500 | | | | 1,963,609 | |
4.20%, 01/15/47 | | | 750 | | | | 910,375 | |
4.25%, 04/15/47 | | | 1,000 | | | | 1,223,872 | |
3.75%, 10/15/47 | | | 500 | | | | 573,923 | |
4.25%, 06/15/48 | | | 1,400 | | | | 1,734,191 | |
4.45%, 12/15/48 | | | 1,000 | | | | 1,276,150 | |
3.70%, 08/15/49 | | | 1,500 | | | | 1,726,054 | |
2.90%, 05/15/50 | | | 1,290 | | | | 1,314,054 | |
3.25%, 05/15/51 | | | 495 | | | | 535,506 | |
3.88%, 08/15/59 | | | 1,000 | | | | 1,196,737 | |
3.13%, 05/15/60 | | | 600 | | | | 619,504 | |
Universal Health Services, Inc.(c) | | | | | | | | |
1.65%, 09/01/26 | | | 900 | | | | 883,359 | |
2.65%, 10/15/30 | | | 50 | | | | 49,595 | |
2.65%, 01/15/32(a) | | | 900 | | | | 884,386 | |
West Virginia United Health System Obligated Group, Series 2020, 3.13%, 06/01/50 | | | 60 | | | | 59,012 | |
Willis-Knighton Medical Center, Series 2018, 4.81%, 09/01/48(a) | | | 108 | | | | 138,658 | |
Yale-New Haven Health Services Corp., Series 2020, 2.50%, 07/01/50 | | | 121 | | | | 111,846 | |
| | | | | | | | |
| | |
| | | | | | | 113,863,958 | |
|
| Health Care Technology — 0.0% | |
Catholic Health Services of Long Island Obligated Group, Series 2020, 3.37%, 07/01/50 | | | 225 | | | | 231,019 | |
Laboratory Corp. of America Holdings | | | | | | | | |
4.00%, 11/01/23 | | | 100 | | | | 104,838 | |
3.25%, 09/01/24 | | | 1,000 | | | | 1,046,918 | |
2.30%, 12/01/24 | | | 1,000 | | | | 1,024,459 | |
3.60%, 02/01/25 | | | 75 | | | | 79,170 | |
1.55%, 06/01/26 | | | 515 | | | | 509,089 | |
3.60%, 09/01/27 | | | 500 | | | | 540,042 | |
2.70%, 06/01/31 | | | 1,095 | | | | 1,111,614 | |
4.70%, 02/01/45 | | | 450 | | | | 547,655 | |
Quest Diagnostics, Inc. | | | | | | | | |
4.25%, 04/01/24(a) | | | 250 | | | | 264,121 | |
3.50%, 03/30/25 | | | 370 | | | | 390,502 | |
4.20%, 06/30/29 | | | 250 | | | | 282,256 | |
2.95%, 06/30/30(a) | | | 425 | | | | 441,626 | |
2.80%, 06/30/31 | | | 400 | | | | 412,983 | |
4.70%, 03/30/45(a) | | | 250 | | | | 309,597 | |
| | | | | | | | |
| | |
| | | | | | | 7,295,889 | |
| | |
| Hotels, Restaurants & Leisure — 0.2% | | | | | | |
Choice Hotels International, Inc., 3.70%, 12/01/29 | | | 200 | | | | 212,534 | |
Darden Restaurants, Inc., 4.55%, 02/15/48 | | | 500 | | | | 578,092 | |
GLP Capital LP/GLP Financing II, Inc., 5.25%, 06/01/25 | | | 400 | | | | 438,101 | |
Hyatt Hotels Corp. | | | | | | | | |
3.38%, 07/15/23 | | | 190 | | | | 194,354 | |
4.38%, 09/15/28 | | | 305 | | | | 329,789 | |
5.75%, 04/23/30 | | | 500 | | | | 596,428 | |
| | | | | | | | |
| Security | | Par (000) | | | Value | |
|
| Hotels, Restaurants & Leisure (continued) | |
Las Vegas Sands Corp. | | | | | | | | |
3.20%, 08/08/24 | | $ | 2,745 | | | $ | 2,794,663 | |
3.50%, 08/18/26 | | | 270 | | | | 273,291 | |
3.90%, 08/08/29(a) | | | 185 | | | | 186,290 | |
Marriott International, Inc. | | | | | | | | |
4.00%, 04/15/28 | | | 1,000 | | | | 1,079,109 | |
Series EE, 5.75%, 05/01/25 | | | 608 | | | | 684,390 | |
Series FF, 4.63%, 06/15/30(a) | | | 1,000 | | | | 1,124,945 | |
Series GG, 3.50%, 10/15/32 | | | 1,000 | | | | 1,047,254 | |
Series R, 3.13%, 06/15/26 | | | 1,000 | | | | 1,038,526 | |
McDonald’s Corp. | | | | | | | | |
3.35%, 04/01/23 | | | 250 | | | | 257,357 | |
3.25%, 06/10/24(a) | | | 400 | | | | 420,260 | |
3.38%, 05/26/25 | | | 500 | | | | 531,391 | |
3.30%, 07/01/25 | | | 115 | | | | 121,908 | |
3.70%, 01/30/26 | | | 1,000 | | | | 1,075,878 | |
3.50%, 03/01/27(a) | | | 1,000 | | | | 1,080,113 | |
3.50%, 07/01/27 | | | 1,400 | | | | 1,518,234 | |
3.80%, 04/01/28 | | | 1,000 | | | | 1,098,677 | |
3.60%, 07/01/30 | | | 1,525 | | | | 1,685,214 | |
4.70%, 12/09/35 | | | 315 | | | | 383,506 | |
6.30%, 03/01/38 | | | 1,000 | | | | 1,421,030 | |
3.70%, 02/15/42 | | | 100 | | | | 110,378 | |
4.60%, 05/26/45 | | | 1,000 | | | | 1,242,110 | |
4.88%, 12/09/45 | | | 1,000 | | | | 1,284,757 | |
4.45%, 03/01/47 | | | 500 | | | | 609,849 | |
4.45%, 09/01/48 | | | 500 | | | | 615,638 | |
3.63%, 09/01/49 | | | 875 | | | | 967,509 | |
4.20%, 04/01/50 | | | 1,390 | | | | 1,682,328 | |
Sands China Ltd. | | | | | | | | |
5.13%, 08/08/25 | | | 1,500 | | | | 1,565,130 | |
5.40%, 08/08/28(a) | | | 1,750 | | | | 1,865,518 | |
Starbucks Corp. | | | | | | | | |
3.10%, 03/01/23 | | | 2,000 | | | | 2,047,627 | |
3.85%, 10/01/23(a) | | | 250 | | | | 261,037 | |
3.80%, 08/15/25 | | | 1,000 | | | | 1,078,847 | |
4.00%, 11/15/28(a) | | | 500 | | | | 557,968 | |
3.55%, 08/15/29 | | | 1,250 | | | | 1,365,242 | |
2.25%, 03/12/30 | | | 1,000 | | | | 992,965 | |
2.55%, 11/15/30(a) | | | 800 | | | | 815,880 | |
3.75%, 12/01/47 | | | 1,000 | | | | 1,099,929 | |
3.35%, 03/12/50 | | | 1,000 | | | | 1,045,633 | |
3.50%, 11/15/50 | | | 800 | | | | 861,442 | |
| | | | | | | | |
| | |
| | | | | | | 40,241,121 | |
| | |
| Household Durables — 0.1% | | | | | | |
D.R. Horton, Inc. | | | | | | | | |
2.50%, 10/15/24 | | | 425 | | | | 437,304 | |
1.40%, 10/15/27 | | | 1,000 | | | | 967,021 | |
DR Horton, Inc., 1.30%, 10/15/26 | | | 1,015 | | | | 991,111 | |
Leggett & Platt, Inc. | | | | | | | | |
3.80%, 11/15/24 | | | 200 | | | | 209,896 | |
4.40%, 03/15/29 | | | 1,000 | | | | 1,119,277 | |
3.50%, 11/15/51 | | | 605 | | | | 607,084 | |
Lennar Corp. | | | | | | | | |
4.75%, 05/30/25 | | | 2,000 | | | | 2,188,110 | |
4.75%, 11/29/27(a) | | | 2,000 | | | | 2,263,361 | |
MDC Holdings, Inc. | | | | | | | | |
2.50%, 01/15/31 | | | 200 | | | | 193,446 | |
6.00%, 01/15/43 | | | 400 | | | | 506,014 | |
| | |
MASTER PORTFOLIO SCHEDULE OF INVESTMENTS | | 49 |
| | |
Schedule of Investments (continued) December 31, 2021 | | U.S. Total Bond Index Master Portfolio (Percentages shown are based on Net Assets) |
| | | | | | | | |
| Security | | Par (000) | | | Value | |
|
| Household Durables (continued) | |
Mohawk Industries, Inc. | | | | | | | | |
3.85%, 02/01/23(a) | | $ | 125 | | | $ | 127,889 | |
3.63%, 05/15/30. | | | 300 | | | | 321,524 | |
PulteGroup, Inc., 7.88%, 06/15/32(a) | | | 1,000 | | | | 1,420,964 | |
Whirlpool Corp. | | | | | | | | |
2.40%, 05/15/31(a) | | | 245 | | | | 245,322 | |
5.15%, 03/01/43 | | | 200 | | | | 247,907 | |
4.50%, 06/01/46 | | | 250 | | | | 297,475 | |
4.60%, 05/15/50(a) | | | 600 | | | | 742,028 | |
| | | | | | | | |
| | |
| | | | | | | 12,885,733 | |
| | |
| Household Products — 0.0% | | | | | | |
Church & Dwight Co., Inc., 2.30%, 12/15/31 | | | 1,000 | | | | 1,008,546 | |
| | | | | | | | |
| | |
| Insurance — 0.8% | | | | | | |
Aflac, Inc. | | | | | | | | |
3.63%, 11/15/24 | | | 250 | | | | 267,095 | |
1.13%, 03/15/26 | | | 1,000 | | | | 981,716 | |
2.88%, 10/15/26(a) | | | 750 | | | | 788,973 | |
4.75%, 01/15/49 | | | 500 | | | | 662,374 | |
Alleghany Corp. | | | | | | | | |
3.63%, 05/15/30 | | | 700 | | | | 758,882 | |
3.25%, 08/15/51(a) | | | 1,000 | | | | 985,184 | |
Allstate Corp. | | | | | | | | |
3.15%, 06/15/23 | | | 250 | | | | 258,453 | |
3.28%, 12/15/26 | | | 750 | | | | 805,510 | |
1.45%, 12/15/30 | | | 2,000 | | | | 1,890,705 | |
4.50%, 06/15/43 | | | 150 | | | | 182,349 | |
4.20%, 12/15/46 | | | 1,000 | | | | 1,200,317 | |
3.85%, 08/10/49 | | | 1,000 | | | | 1,166,820 | |
Series B, (3 mo. LIBOR US + 2.94%), 5.75%, 08/15/53(b) | | | 1,250 | | | | 1,300,000 | |
American Financial Group, Inc., 4.50%, 06/15/47 | | | 750 | | | | 889,592 | |
American International Group, Inc. | | | | | | | | |
4.13%, 02/15/24 | | | 250 | | | | 265,449 | |
2.50%, 06/30/25 | | | 1,000 | | | | 1,031,096 | |
3.75%, 07/10/25 | | | 750 | | | | 802,515 | |
3.90%, 04/01/26 | | | 2,500 | | | | 2,709,514 | |
4.25%, 03/15/29 | | | 1,000 | | | | 1,142,651 | |
3.40%, 06/30/30 | | | 1,500 | | | | 1,622,045 | |
3.88%, 01/15/35 | | | 500 | | | | 552,801 | |
4.70%, 07/10/35 | | | 500 | | | | 596,336 | |
4.50%, 07/16/44 | | | 750 | | | | 923,662 | |
4.80%, 07/10/45 | | | 750 | | | | 960,998 | |
4.75%, 04/01/48 | | | 1,000 | | | | 1,273,690 | |
4.38%, 06/30/50 | | | 1,000 | | | | 1,246,515 | |
4.38%, 01/15/55 | | | 900 | | | | 1,103,704 | |
Aon Corp. | | | | | | | | |
4.50%, 12/15/28 | | | 1,000 | | | | 1,138,075 | |
3.75%, 05/02/29 | | | 1,000 | | | | 1,096,209 | |
2.80%, 05/15/30 | | | 1,800 | | | | 1,855,040 | |
Aon Corp./Aon Global Holdings PLC | | | | | | | | |
2.05%, 08/23/31 | | | 500 | | | | 486,080 | |
2.60%, 12/02/31 | | | 345 | | | | 351,000 | |
2.90%, 08/23/51 | | | 400 | | | | 385,036 | |
Aon PLC | | | | | | | | |
3.50%, 06/14/24 | | | 1,000 | | | | 1,050,944 | |
3.88%, 12/15/25 | | | 600 | | | | 648,133 | |
4.60%, 06/14/44 | | | 250 | | | | 306,820 | |
4.75%, 05/15/45 | | | 500 | | | | 622,117 | |
Arch Capital Finance LLC, 4.01%, 12/15/26 | | | 1,000 | | | | 1,097,215 | |
| | | | | | | | |
| Security | | Par (000) | | | Value | |
|
| Insurance (continued) | |
Arch Capital Group Ltd., 3.64%, 06/30/50 | | $ | 1,000 | | | $ | 1,069,786 | |
Arch Capital Group US, Inc., 5.14%, 11/01/43 | | | 125 | | | | 162,982 | |
Arthur J Gallagher & Co. | | | | | | | | |
2.40%, 11/09/31 | | | 500 | | | | 491,845 | |
3.50%, 05/20/51 | | | 500 | | | | 527,994 | |
3.05%, 03/09/52 | | | 500 | | | | 483,558 | |
Assurant, Inc., 2.65%, 01/15/32(a) | | | 2,000 | | | | 1,961,394 | |
Assured Guaranty US Holdings, Inc., 5.00%, 07/01/24(a) | | | 110 | | | | 119,067 | |
Athene Holding Ltd. | | | | | | | | |
6.15%, 04/03/30 | | | 1,000 | | | | 1,237,219 | |
3.95%, 05/25/51 | | | 260 | | | | 280,488 | |
AXA SA, 8.60%, 12/15/30 | | | 550 | | | | 793,468 | |
Berkshire Hathaway Finance Corp. | | | | | | | | |
1.85%, 03/12/30 | | | 500 | | | | 495,285 | |
1.45%, 10/15/30 | | | 900 | | | | 861,925 | |
4.40%, 05/15/42 | | | 100 | | | | 121,875 | |
4.30%, 05/15/43 | | | 250 | | | | 299,117 | |
4.20%, 08/15/48 | | | 2,000 | | | | 2,426,999 | |
4.25%, 01/15/49 | | | 1,000 | | | | 1,227,887 | |
2.85%, 10/15/50 | | | 1,000 | | | | 985,298 | |
2.50%, 01/15/51 | | | 760 | | | | 705,534 | |
Berkshire Hathaway, Inc. | | | | | | | | |
3.00%, 02/11/23(a) | | | 1,000 | | | | 1,025,455 | |
2.75%, 03/15/23 | | | 1,500 | | | | 1,531,556 | |
3.13%, 03/15/26 | | | 1,400 | | | | 1,495,047 | |
4.50%, 02/11/43 | | | 1,100 | | | | 1,357,417 | |
Brighthouse Financial, Inc. | | | | | | | | |
5.63%, 05/15/30 | | | 1,000 | | | | 1,193,245 | |
4.70%, 06/22/47 | | | 388 | | | | 425,812 | |
Brown & Brown, Inc., 2.38%, 03/15/31 | | | 1,000 | | | | 974,013 | |
Chubb Corp. | | | | | | | | |
6.00%, 05/11/37 | | | 50 | | | | 70,980 | |
Series 1, 6.50%, 05/15/38 | | | 100 | | | | 149,024 | |
Chubb INA Holdings, Inc. | | | | | | | | |
3.35%, 05/15/24(a) | | | 500 | | | | 527,052 | |
3.15%, 03/15/25 | | | 1,000 | | | | 1,055,292 | |
3.35%, 05/03/26 | | | 795 | | | | 852,340 | |
4.15%, 03/13/43 | | | 150 | | | | 179,676 | |
2.85%, 12/15/51 | | | 500 | | | | 501,539 | |
3.05%, 12/15/61 | | | 345 | | | | 351,971 | |
CNA Financial Corp. | | | | | | | | |
4.50%, 03/01/26 | | | 350 | | | | 386,204 | |
3.90%, 05/01/29 | | | 500 | | | | 553,387 | |
Enstar Group Ltd., 3.10%, 09/01/31 | | | 715 | | | | 700,853 | |
Equitable Holdings, Inc. | | | | | | | | |
4.35%, 04/20/28 | | | 1,000 | | | | 1,121,014 | |
5.00%, 04/20/48 | | | 1,000 | | | | 1,248,966 | |
Everest Reinsurance Holdings, Inc. | | | | | | | | |
3.50%, 10/15/50 | | | 500 | | | | 524,498 | |
3.13%, 10/15/52 | | | 900 | | | | 876,069 | |
Fairfax Financial Holdings Ltd., 4.63%, 04/29/30 | | | 1,000 | | | | 1,119,987 | |
Fidelity National Financial, Inc. | | | | | | | | |
3.40%, 06/15/30 | | | 500 | | | | 527,847 | |
3.20%, 09/17/51(a) | | | 330 | | | | 315,341 | |
First American Financial Corp.(a) | | | | | | | | |
4.60%, 11/15/24 | | | 200 | | | | 216,398 | |
2.40%, 08/15/31 | | | 220 | | | | 215,236 | |
Globe Life, Inc., 2.15%, 08/15/30 | | | 1,000 | | | | 986,512 | |
| | |
| 50 | | 2 0 2 1 BLACK ROCK ANNUAL REPORT TO SHAREHOLDERS |
| | |
Schedule of Investments (continued) December 31, 2021 | | U.S. Total Bond Index Master Portfolio (Percentages shown are based on Net Assets) |
| | | | | | | | |
| Security | | Par (000) | | | Value | |
| | |
Insurance (continued) | | | | | | | | |
Hanover Insurance Group, Inc. | | | | | | | | |
4.50%, 04/15/26 | | $ | 600 | | | $ | 657,710 | |
2.50%, 09/01/30 | | | 500 | | | | 497,154 | |
Hartford Financial Services Group, Inc. | | | | | | | | |
2.80%, 08/19/29(a) | | | 500 | | | | 518,498 | |
6.10%, 10/01/41 | | | 100 | | | | 139,938 | |
3.60%, 08/19/49(a) | | | 1,335 | | | | 1,461,217 | |
2.90%, 09/15/51 | | | 1,035 | | | | 1,019,782 | |
Lincoln National Corp. | | | | | | | | |
4.00%, 09/01/23 | | | 200 | | | | 209,659 | |
3.35%, 03/09/25 | | | 65 | | | | 68,974 | |
3.80%, 03/01/28(a) | | | 1,500 | | | | 1,645,653 | |
6.30%, 10/09/37 | | | 250 | | | | 349,724 | |
4.35%, 03/01/48 | | | 200 | | | | 239,976 | |
4.38%, 06/15/50(a) | | | 500 | | | | 606,038 | |
Loews Corp. | | | | | | | | |
2.63%, 05/15/23 | | | 250 | | | | 255,150 | |
3.75%, 04/01/26 | | | 500 | | | | 540,454 | |
3.20%, 05/15/30 | | | 655 | | | | 696,235 | |
Manulife Financial Corp. | | | | | | | | |
4.15%, 03/04/26 | | | 500 | | | | 547,284 | |
2.48%, 05/19/27 | | | 1,000 | | | | 1,023,532 | |
5.38%, 03/04/46 | | | 1,000 | | | | 1,399,800 | |
(5 year USD ICE Swap + 1.65%), 4.06%, 02/24/32(b) | | | 500 | | | | 537,934 | |
Markel Corp. | | | | | | | | |
3.35%, 09/17/29 | | | 475 | | | | 513,074 | |
4.30%, 11/01/47(a) | | | 750 | | | | 868,622 | |
4.15%, 09/17/50 | | | 500 | | | | 572,058 | |
3.45%, 05/07/52 | | | 300 | | | | 309,265 | |
Marsh & McLennan Cos., Inc. | | | | | | | | |
3.30%, 03/14/23 | | | 500 | | | | 513,121 | |
3.88%, 03/15/24 | | | 500 | | | | 528,814 | |
3.50%, 06/03/24 | | | 1,000 | | | | 1,054,321 | |
3.50%, 03/10/25 | | | 500 | | | | 529,208 | |
3.75%, 03/14/26 | | | 1,000 | | | | 1,085,007 | |
4.38%, 03/15/29 | | | 1,000 | | | | 1,139,896 | |
2.25%, 11/15/30(a) | | | 345 | | | | 344,276 | |
2.38%, 12/15/31 | | | 65 | | | | 65,617 | |
4.35%, 01/30/47 | | | 250 | | | | 308,273 | |
4.20%, 03/01/48 | | | 500 | | | | 606,866 | |
4.90%, 03/15/49 | | | 1,000 | | | | 1,344,093 | |
2.90%, 12/15/51 | | | 145 | | | | 144,707 | |
MetLife, Inc. | | | | | | | | |
3.00%, 03/01/25 | | | 1,650 | | | | 1,734,753 | |
6.38%, 06/15/34 | | | 500 | | | | 694,906 | |
5.88%, 02/06/41 | | | 2,000 | | | | 2,830,373 | |
4.13%, 08/13/42 | | | 300 | | | | 355,361 | |
4.88%, 11/13/43 | | | 1,250 | | | | 1,621,113 | |
4.05%, 03/01/45 | | | 250 | | | | 297,130 | |
4.60%, 05/13/46 | | | 1,500 | | | | 1,917,647 | |
Old Republic International Corp. | | | | | | | | |
4.88%, 10/01/24(a) | | | 250 | | | | 272,256 | |
3.85%, 06/11/51 | | | 200 | | | | 215,077 | |
Primerica, Inc., 2.80%, 11/19/31 | | | 210 | | | | 212,263 | |
Principal Financial Group, Inc. | | | | | | | | |
3.40%, 05/15/25 | | | 250 | | | | 264,019 | |
3.10%, 11/15/26 | | | 1,000 | | | | 1,050,980 | |
3.70%, 05/15/29 | | | 1,135 | | | | 1,252,628 | |
2.13%, 06/15/30 | | | 1,000 | | | | 988,639 | |
| | | | | | | | |
| Security | | Par (000) | | | Value | |
| | |
Insurance (continued) | | | | | | | | |
Principal Financial Group, Inc. (continued) | | | | | | | | |
4.63%, 09/15/42 | | $ | 50 | | | $ | 62,189 | |
4.30%, 11/15/46 | | | 250 | | | | 307,303 | |
Progressive Corp. | | | | | | | | |
2.45%, 01/15/27 | | | 500 | | | | 517,913 | |
4.00%, 03/01/29 | | | 300 | | | | 338,727 | |
4.35%, 04/25/44 | | | 100 | | | | 122,391 | |
3.70%, 01/26/45 | | | 200 | | | | 223,572 | |
4.13%, 04/15/47 | | | 500 | | | | 605,489 | |
4.20%, 03/15/48 | | | 500 | | | | 617,748 | |
3.95%, 03/26/50 | | | 500 | | | | 604,399 | |
Prudential Financial, Inc. | | | | | | | | |
1.50%, 03/10/26(a) | | | 1,000 | | | | 1,000,472 | |
3.88%, 03/27/28 | | | 697 | | | | 772,852 | |
3.00%, 03/10/40(a) | | | 1,000 | | | | 1,024,780 | |
4.60%, 05/15/44(a) | | | 250 | | | | 310,067 | |
3.91%, 12/07/47(a) | | | 500 | | | | 580,543 | |
3.94%, 12/07/49 | | | 908 | | | | 1,059,162 | |
4.35%, 02/25/50(a) | | | 1,000 | | | | 1,247,377 | |
3.70%, 03/13/51 | | | 1,250 | | | | 1,422,360 | |
(3 mo. LIBOR US + 2.67%), 5.70%, 09/15/48(a)(b) | | | 1,000 | | | | 1,120,277 | |
(3 mo. LIBOR US + 3.04%), 5.20%, 03/15/44(a)(b) | | | 350 | | | | 364,481 | |
(5 year CMT + 3.04%), 3.70%, 10/01/50(b) | | | 1,000 | | | | 1,011,588 | |
Prudential PLC, 3.13%, 04/14/30 | | | 1,000 | | | | 1,067,362 | |
Reinsurance Group of America, Inc., 3.90%, 05/15/29 | | | 475 | | | | 519,398 | |
Travelers Cos., Inc. | | | | | | | | |
6.75%, 06/20/36 | | | 250 | | | | 368,138 | |
6.25%, 06/15/37 | | | 500 | | | | 716,504 | |
4.60%, 08/01/43 | | | 850 | | | | 1,085,382 | |
4.30%, 08/25/45 | | | 250 | | | | 308,433 | |
4.00%, 05/30/47 | | | 500 | | | | 597,252 | |
4.05%, 03/07/48(a) | | | 1,150 | | | | 1,391,695 | |
4.10%, 03/04/49 | | | 250 | | | | 302,409 | |
Travelers Property Casualty Corp., 6.38%, 03/15/33 | | | 100 | | | | 139,057 | |
Trinity Acquisition PLC, 4.40%, 03/15/26 | | | 500 | | | | 546,979 | |
Unum Group | | | | | | | | |
4.00%, 06/15/29 | | | 1,000 | | | | 1,103,753 | |
5.75%, 08/15/42(a) | | | 250 | | | | 305,214 | |
4.50%, 12/15/49(a) | | | 250 | | | | 265,907 | |
Voya Financial, Inc. | | | | | | | | |
3.65%, 06/15/26 | | | 350 | | | | 376,757 | |
5.70%, 07/15/43 | | | 500 | | | | 680,400 | |
W R Berkley Corp. | | | | | | | | |
3.55%, 03/30/52(a) | | | 500 | | | | 546,532 | |
3.15%, 09/30/61 | | | 500 | | | | 474,521 | |
Willis North America, Inc. | | | | | | | | |
4.50%, 09/15/28 | | | 1,500 | | | | 1,676,674 | |
3.88%, 09/15/49 | | | 580 | | | | 629,356 | |
WR Berkley Corp., 4.00%, 05/12/50 | | | 500 | | | | 572,070 | |
XLIT Ltd., 5.50%, 03/31/45 | | | 250 | | | | 342,157 | |
| | | | | | | | |
| | |
| | | | | | | 133,518,782 | |
| | |
| Interactive Media & Services — 0.1% | | | | | | |
Alphabet, Inc. | | | | | | | | |
3.38%, 02/25/24(a) | | | 500 | | | | 526,808 | |
0.45%, 08/15/25 | | | 175 | | | | 170,978 | |
2.00%, 08/15/26(a) | | | 2,500 | | | | 2,576,144 | |
| | |
MASTER PORTFOLIO SCHEDULE OF INVESTMENTS | | 51 |
| | |
Schedule of Investments (continued) December 31, 2021 | | U.S. Total Bond Index Master Portfolio (Percentages shown are based on Net Assets) |
| | | | | | | | |
| Security | | Par (000) | | | Value | |
| | |
Interactive Media & Services (continued) | | | | | | | | |
Alphabet, Inc. (continued) | | | | | | | | |
0.80%, 08/15/27(a) | | $ | 540 | | | $ | 522,864 | |
1.10%, 08/15/30(a) | | | 650 | | | | 614,417 | |
1.90%, 08/15/40 | | | 600 | | | | 546,361 | |
2.05%, 08/15/50 | | | 800 | | | | 713,947 | |
2.25%, 08/15/60 | | | 1,500 | | | | 1,336,672 | |
Baidu, Inc. | | | | | | | | |
3.08%, 04/07/25(a) | | | 2,000 | | | | 2,069,940 | |
4.13%, 06/30/25 | | | 1,000 | | | | 1,076,070 | |
4.88%, 11/14/28(a) | | | 500 | | | | 570,225 | |
eBay, Inc. | | | | | | | | |
2.75%, 01/30/23 | | | 3,000 | | | | 3,066,253 | |
1.90%, 03/11/25 | | | 1,000 | | | | 1,011,220 | |
1.40%, 05/10/26 | | | 395 | | | | 388,932 | |
3.60%, 06/05/27 | | | 1,000 | | | | 1,087,295 | |
2.70%, 03/11/30 | | | 1,000 | | | | 1,022,130 | |
2.60%, 05/10/31(a) | | | 2,355 | | | | 2,378,018 | |
3.65%, 05/10/51 | | | 500 | | | | 543,731 | |
JD.com, Inc., 3.38%, 01/14/30(a) | | | 1,000 | | | | 1,043,500 | |
| | | | | | | | |
| | |
| | | | | | | 21,265,505 | |
| | |
| Internet & Direct Marketing Retail — 0.3% | | | | | | |
Alibaba Group Holding Ltd. | | | | | | | | |
3.60%, 11/28/24(a) | | | 1,500 | | | | 1,578,390 | |
3.40%, 12/06/27(a) | | | 1,000 | | | | 1,057,400 | |
4.50%, 11/28/34(a) | | | 250 | | | | 285,133 | |
4.00%, 12/06/37 | | | 1,000 | | | | 1,078,750 | |
4.20%, 12/06/47(a) | | | 1,300 | | | | 1,432,681 | |
3.15%, 02/09/51(a) | | | 2,000 | | | | 1,857,500 | |
4.40%, 12/06/57(a) | | | 1,000 | | | | 1,135,812 | |
Amazon.com, Inc. | | | | | | | | |
2.40%, 02/22/23 | | | 1,500 | | | | 1,527,834 | |
0.40%, 06/03/23 | | | 2,000 | | | | 1,992,539 | |
0.45%, 05/12/24(a) | | | 1,735 | | | | 1,717,824 | |
2.80%, 08/22/24 | | | 1,500 | | | | 1,570,072 | |
1.00%, 05/12/26(a) | | | 1,700 | | | | 1,683,485 | |
1.20%, 06/03/27 | | | 2,000 | | | | 1,972,851 | |
3.15%, 08/22/27 | | | 2,750 | | | | 2,970,058 | |
1.65%, 05/12/28 | | | 1,700 | | | | 1,702,803 | |
1.50%, 06/03/30 | | | 3,000 | | | | 2,907,208 | |
2.10%, 05/12/31 | | | 2,000 | | | | 2,027,218 | |
4.80%, 12/05/34 | | | 600 | | | | 766,274 | |
3.88%, 08/22/37 | | | 1,000 | | | | 1,175,334 | |
2.88%, 05/12/41 | | | 1,400 | | | | 1,453,828 | |
4.95%, 12/05/44 | | | 500 | | | | 682,444 | |
4.05%, 08/22/47 | | | 2,500 | | | | 3,031,115 | |
2.50%, 06/03/50 | | | 2,000 | | | | 1,904,274 | |
3.10%, 05/12/51 | | | 2,000 | | | | 2,135,245 | |
4.25%, 08/22/57 | | | 2,000 | | | | 2,560,806 | |
2.70%, 06/03/60 | | | 2,000 | | | | 1,927,210 | |
3.25%, 05/12/61 | | | 700 | | | | 753,512 | |
| | | | | | | | |
| | |
| | | | | | | 44,887,600 | |
| | |
| Internet Software & Services — 0.1% | | | | | | |
Booking Holdings, Inc. | | | | | | | | |
2.75%, 03/15/23 | | | 500 | | | | 510,730 | |
3.60%, 06/01/26 | | | 1,500 | | | | 1,617,385 | |
4.63%, 04/13/30 | | | 1,000 | | | | 1,168,718 | |
Expedia Group, Inc. | | | | | | | | |
4.50%, 08/15/24(a) | | | 250 | | | | 267,147 | |
5.00%, 02/15/26 | | | 500 | | | | 556,087 | |
3.80%, 02/15/28 | | | 750 | | | | 801,862 | |
| | | | | | | | |
| Security | | Par (000) | | | Value | |
| | |
Internet Software & Services (continued) | | | | | | | | |
Expedia Group, Inc. (continued) | | | | | | | | |
3.25%, 02/15/30 | | $ | 825 | | | $ | 841,913 | |
2.95%, 03/15/31 | | | 480 | | | | 479,318 | |
VeriSign, Inc. | | | | | | | | |
5.25%, 04/01/25 | | | 1,000 | | | | 1,102,500 | |
4.75%, 07/15/27 | | | 1,000 | | | | 1,038,750 | |
2.70%, 06/15/31 | | | 1,020 | | | | 1,025,100 | |
| | | | | | | | |
| | |
| | | | | | | 9,409,510 | |
| | |
| IT Services — 0.2% | | | | | | |
Broadridge Financial Solutions, Inc. | | | | | | | | |
3.40%, 06/27/26 | | | 270 | | | | 287,130 | |
2.90%, 12/01/29 | | | 500 | | | | 516,909 | |
2.60%, 05/01/31 | | | 460 | | | | 461,720 | |
CGI, Inc.(c) | | | | | | | | |
1.45%, 09/14/26 | | | 500 | | | | 488,928 | |
2.30%, 09/14/31 | | | 500 | | | | 481,503 | |
Citrix Systems, Inc., 4.50%, 12/01/27 | | | 1,000 | | | | 1,085,524 | |
DXC Technology Co. | | | | | | | | |
1.80%, 09/15/26 | | | 600 | | | | 592,887 | |
2.38%, 09/15/28 | | | 400 | | | | 391,014 | |
Fidelity National Information Services, Inc. | | | | | | | | |
0.38%, 03/01/23(a) | | | 1,355 | | | | 1,348,284 | |
0.60%, 03/01/24 | | | 510 | | | | 502,042 | |
1.15%, 03/01/26 | | | 595 | | | | 579,574 | |
1.65%, 03/01/28 | | | 680 | | | | 658,378 | |
2.25%, 03/01/31(a) | | | 1,730 | | | | 1,691,831 | |
3.10%, 03/01/41 | | | 505 | | | | 509,896 | |
Fiserv, Inc. | | | | | | | | |
2.75%, 07/01/24 | | | 2,120 | | | | 2,192,764 | |
2.25%, 06/01/27 | | | 1,800 | | | | 1,831,307 | |
4.20%, 10/01/28(a) | | | 1,000 | | | | 1,121,025 | |
3.50%, 07/01/29 | | | 1,645 | | | | 1,769,100 | |
2.65%, 06/01/30(a) | | | 955 | | | | 969,034 | |
4.40%, 07/01/49 | | | 880 | | | | 1,048,385 | |
Genpact Luxembourg Sarl, 3.38%, 12/01/24 | | | 1,000 | | | | 1,050,905 | |
International Business Machines Corp. | | | | | | | | |
3.63%, 02/12/24 | | | 775 | | | | 816,914 | |
3.00%, 05/15/24 | | | 2,000 | | | | 2,089,208 | |
3.45%, 02/19/26(a) | | | 250 | | | | 267,874 | |
3.30%, 05/15/26 | | | 1,500 | | | | 1,603,598 | |
3.30%, 01/27/27(a) | | | 1,000 | | | | 1,072,311 | |
1.70%, 05/15/27 | | | 1,170 | | | | 1,165,966 | |
3.50%, 05/15/29 | | | 4,000 | | | | 4,340,963 | |
1.95%, 05/15/30(a) | | | 1,700 | | | | 1,661,913 | |
5.88%, 11/29/32 | | | 250 | | | | 328,906 | |
2.85%, 05/15/40 | | | 1,000 | | | | 981,584 | |
4.00%, 06/20/42 | | | 850 | | | | 977,675 | |
4.70%, 02/19/46(a) | | | 1,250 | | | | 1,600,777 | |
4.25%, 05/15/49 | | | 1,925 | | | | 2,334,755 | |
2.95%, 05/15/50 | | | 1,280 | | | | 1,250,029 | |
Kyndryl Holdings, Inc., 4.10%, 10/15/41(c) | | | 1,000 | | | | 968,091 | |
Leidos, Inc., 2.30%, 02/15/31 | | | 750 | | | | 722,085 | |
Verisk Analytics, Inc. | | | | | | | | |
4.00%, 06/15/25 | | | 250 | | | | 268,607 | |
4.13%, 03/15/29 | | | 500 | | | | 557,480 | |
3.63%, 05/15/50 | | | 330 | | | | 358,841 | |
| | | | | | | | |
| | |
| | | | | | | 42,945,717 | |
| | |
| Leisure Products — 0.0% | | | | | | |
Hasbro, Inc. | | | | | | | | |
3.00%, 11/19/24 | | | 500 | | | | 520,333 | |
| | |
| 52 | | 2 0 2 1 BLACK ROCK ANNUAL REPORT TO SHAREHOLDERS |
| | |
Schedule of Investments (continued) December 31, 2021 | | U.S. Total Bond Index Master Portfolio (Percentages shown are based on Net Assets) |
| | | | | | | | |
| Security | | Par (000) | | | Value | |
| | |
Leisure Products (continued) | | | | | | | | |
Hasbro, Inc. (continued) | | | | | | | | |
3.55%, 11/19/26 | | $ | 300 | | | $ | 321,641 | |
3.50%, 09/15/27 | | | 250 | | | | 269,516 | |
3.90%, 11/19/29 | | | 300 | | | | 330,761 | |
6.35%, 03/15/40(a) | | | 500 | | | | 689,859 | |
5.10%, 05/15/44 | | | 60 | | | | 74,679 | |
| | | | | | | | |
| | |
| | | | | | | 2,206,789 | |
| | |
| Life Sciences Tools & Services — 0.0% | | | | | | |
Agilent Technologies, Inc. | | | | | | | | |
3.88%, 07/15/23 | | | 200 | | | | 207,296 | |
2.75%, 09/15/29 | | | 645 | | | | 665,850 | |
2.30%, 03/12/31 | | | 690 | | | | 683,259 | |
| | | | | | | | |
| | |
| | | | | | | 1,556,405 | |
| | |
| Machinery — 0.2% | | | | | | |
Brunswick Corp., 2.40%, 08/18/31 | | | 260 | | | | 249,300 | |
Caterpillar Financial Services Corp. | | | | | | | | |
2.63%, 03/01/23 | | | 2,000 | | | | 2,043,418 | |
3.45%, 05/15/23 | | | 400 | | | | 413,789 | |
3.65%, 12/07/23 | | | 1,000 | | | | 1,052,626 | |
2.85%, 05/17/24(a) | | | 2,000 | | | | 2,087,853 | |
3.30%, 06/09/24 | | | 250 | | | | 262,625 | |
2.15%, 11/08/24(a) | | | 2,200 | | | | 2,263,697 | |
0.80%, 11/13/25(a) | | | 1,000 | | | | 980,729 | |
1.15%, 09/14/26(a) | | | 900 | | | | 886,510 | |
Caterpillar, Inc. | | | | | | | | |
3.40%, 05/15/24 | | | 500 | | | | 524,786 | |
2.60%, 09/19/29 | | | 70 | | | | 73,204 | |
2.60%, 04/09/30(a) | | | 500 | | | | 521,025 | |
1.90%, 03/12/31(a) | | | 910 | | | | 907,061 | |
5.20%, 05/27/41 | | | 600 | | | | 825,432 | |
3.80%, 08/15/42 | | | 1,450 | | | | 1,691,792 | |
3.25%, 09/19/49 | | | 1,000 | | | | 1,095,995 | |
3.25%, 04/09/50 | | | 1,000 | | | | 1,104,816 | |
4.75%, 05/15/64 | | | 200 | | | | 287,213 | |
CNH Industrial Capital LLC | | | | | | | | |
1.88%, 01/15/26(a) | | | 1,000 | | | | 1,000,426 | |
1.45%, 07/15/26 | | | 220 | | | | 215,284 | |
CNH Industrial NV, 4.50%, 08/15/23 | | | 3,000 | | | | 3,151,333 | |
Crane Co., 4.45%, 12/15/23 | | | 125 | | | | 131,736 | |
Deere & Co. | | | | | | | | |
2.75%, 04/15/25(a) | | | 1,000 | | | | 1,044,627 | |
3.10%, 04/15/30 | | | 500 | | | | 538,868 | |
3.90%, 06/09/42 | | | 550 | | | | 653,011 | |
2.88%, 09/07/49 | | | 385 | | | | 397,608 | |
3.75%, 04/15/50 | | | 1,000 | | | | 1,181,118 | |
Dover Corp. | | | | | | | | |
3.15%, 11/15/25 | | | 250 | | | | 264,077 | |
2.95%, 11/04/29(a) | | | 170 | | | | 179,322 | |
Flowserve Corp., 2.80%, 01/15/32 | | | 200 | | | | 194,602 | |
Fortive Corp., 3.15%, 06/15/26(a) | | | 500 | | | | 529,660 | |
IDEX Corp., 2.63%, 06/15/31 | | | 190 | | | | 191,645 | |
John Deere Capital Corp., 1.30%, 10/13/26 | | | 515 | | | | 509,798 | |
Kennametal, Inc., 2.80%, 03/01/31 | | | 155 | | | | 154,115 | |
nVent Finance Sarl, 2.75%, 11/15/31 | | | 185 | | | | 184,225 | |
Otis Worldwide Corp. | | | | | | | | |
2.06%, 04/05/25 | | | 515 | | | | 523,562 | |
2.57%, 02/15/30 | | | 1,000 | | | | 1,014,375 | |
3.11%, 02/15/40 | | | 1,000 | | | | 1,025,746 | |
3.36%, 02/15/50(a) | | | 195 | | | | 205,497 | |
| | | | | | | | |
| Security | | Par (000) | | | Value | |
| | |
Machinery (continued) | | | | | | | | |
Snap-On Inc., 3.10%, 05/01/50 | | $ | 1,000 | | | $ | 1,054,243 | |
Stanley Black & Decker, Inc. | | | | | | | | |
4.25%, 11/15/28 | | | 1,000 | | | | 1,135,988 | |
2.30%, 03/15/30 | | | 1,000 | | | | 1,013,703 | |
4.85%, 11/15/48(a) | | | 250 | | | | 332,670 | |
2.75%, 11/15/50 | | | 300 | | | | 288,741 | |
(5 year CMT + 2.66%), 4.00%, 03/15/60(b) | | | 600 | | | | 616,416 | |
Valmont Industries, Inc., 5.00%, 10/01/44 | | | 1,000 | | | | 1,233,833 | |
Westinghouse Air Brake Technologies Corp. | | | | | | | | |
4.40%, 03/15/24 | | | 500 | | | | 528,850 | |
3.20%, 06/15/25 | | | 500 | | | | 520,370 | |
4.95%, 09/15/28 | | | 500 | | | | 568,355 | |
Xylem, Inc., 4.38%, 11/01/46 | | | 500 | | | | 594,800 | |
| | | | | | | | |
| | |
| | | | | | | 38,450,475 | |
| | |
| Media — 0.9% | | | | | | |
Bell Canada | | | | | | | | |
2.15%, 02/15/32. | | | 500 | | | | 487,636 | |
4.46%, 04/01/48 | | | 310 | | | | 383,529 | |
4.30%, 07/29/49(a) | | | 265 | | | | 321,797 | |
3.65%, 03/17/51 | | | 380 | | | | 417,200 | |
3.20%, 02/15/52(a) | | | 245 | | | | 249,877 | |
Charter Communications Operating LLC/Charter Communications Operating Capital | | | | | | | | |
4.50%, 02/01/24 | | | 2,000 | | | | 2,126,962 | |
4.91%, 07/23/25 | | | 1,930 | | | | 2,125,139 | |
3.75%, 02/15/28 | | | 500 | | | | 535,642 | |
2.25%, 01/15/29 | | | 485 | | | | 473,213 | |
5.05%, 03/30/29 | | | 1,000 | | | | 1,144,804 | |
2.80%, 04/01/31 | | | 2,000 | | | | 1,978,985 | |
2.30%, 02/01/32 | | | 1,800 | | | | 1,708,618 | |
6.38%, 10/23/35 | | | 250 | | | | 322,936 | |
5.38%, 04/01/38 | | | 1,000 | | | | 1,193,327 | |
3.50%, 06/01/41 | | | 1,000 | | | | 974,984 | |
3.50%, 03/01/42 | | | 500 | | | | 484,944 | |
6.48%, 10/23/45 | | | 1,500 | | | | 2,048,381 | |
5.38%, 05/01/47 | | | 1,500 | | | | 1,790,409 | |
5.75%, 04/01/48 | | | 1,000 | | | | 1,247,058 | |
5.13%, 07/01/49 | | | 1,000 | | | | 1,159,970 | |
4.80%, 03/01/50 | | | 1,900 | | | | 2,127,305 | |
3.70%, 04/01/51 | | | 1,600 | | | | 1,546,859 | |
3.90%, 06/01/52 | | | 1,600 | | | | 1,604,426 | |
6.83%, 10/23/55 | | | 250 | | | | 357,532 | |
3.85%, 04/01/61 | | | 1,470 | | | | 1,386,224 | |
4.40%, 12/01/61 | | | 1,400 | | | | 1,448,310 | |
3.95%, 06/30/62(a) | | | 1,500 | | | | 1,445,069 | |
Comcast Corp. | | | | | | | | |
3.70%, 04/15/24(a) | | | 1,000 | | | | 1,062,414 | |
3.38%, 08/15/25 | | | 2,500 | | | | 2,672,027 | |
3.95%, 10/15/25(a) | | | 1,250 | | | | 1,364,663 | |
3.15%, 03/01/26 | | | 1,750 | | | | 1,865,875 | |
2.35%, 01/15/27 | | | 850 | | | | 880,336 | |
3.30%, 02/01/27 | | | 1,000 | | | | 1,074,304 | |
3.30%, 04/01/27 | | | 2,000 | | | | 2,149,647 | |
3.15%, 02/15/28 | | | 1,250 | | | | 1,341,718 | |
3.55%, 05/01/28(a) | | | 1,000 | | | | 1,096,394 | |
4.15%, 10/15/28 | | | 2,220 | | | | 2,520,213 | |
2.65%, 02/01/30 | | | 945 | | | | 980,055 | |
3.40%, 04/01/30 | | | 2,730 | | | | 2,979,437 | |
4.25%, 10/15/30 | | | 1,000 | | | | 1,154,071 | |
1.95%, 01/15/31 | | | 845 | | | | 827,922 | |
| | |
MASTER PORTFOLIO SCHEDULE OF INVESTMENTS | | 53 |
| | |
Schedule of Investments (continued) December 31, 2021 | | U.S. Total Bond Index Master Portfolio (Percentages shown are based on Net Assets) |
| | | | | | | | |
| Security | | Par (000) | | | Value | |
| | |
Media (continued) | | | | | | | | |
Comcast Corp. (continued) | | | | | | | | |
1.50%, 02/15/31 | | $ | 1,645 | | | $ | 1,552,659 | |
4.25%, 01/15/33 | | | 650 | | | | 760,661 | |
4.20%, 08/15/34 | | | 2,235 | | | | 2,628,542 | |
4.40%, 08/15/35 | | | 250 | | | | 299,580 | |
3.20%, 07/15/36 | | | 500 | | | | 533,237 | |
3.90%, 03/01/38 | | | 500 | | | | 565,849 | |
4.60%, 10/15/38 | | | 750 | | | | 910,034 | |
3.25%, 11/01/39 | | | 1,000 | | | | 1,055,041 | |
3.75%, 04/01/40 | | | 1,000 | | | | 1,119,526 | |
4.65%, 07/15/42 | | | 575 | | | | 703,630 | |
4.75%, 03/01/44 | | | 375 | | | | 468,205 | |
4.60%, 08/15/45 | | | 1,250 | | | | 1,554,603 | |
3.40%, 07/15/46 | | | 500 | | | | 529,580 | |
4.00%, 08/15/47 | | | 500 | | | | 575,095 | |
3.97%, 11/01/47 | | | 1,500 | | | | 1,727,022 | |
4.00%, 03/01/48 | | | 500 | | | | 575,938 | |
4.70%, 10/15/48 | | | 1,250 | | | | 1,591,681 | |
4.00%, 11/01/49 | | | 1,255 | | | | 1,454,222 | |
3.45%, 02/01/50 | | | 1,800 | | | | 1,922,080 | |
2.80%, 01/15/51 | | | 860 | | | | 828,526 | |
2.89%, 11/01/51(c) | | | 964 | | | | 933,138 | |
2.45%, 08/15/52 | | | 1,700 | | | | 1,522,160 | |
4.05%, 11/01/52 | | | 361 | | | | 421,625 | |
2.94%, 11/01/56(c) | | | 3,858 | | | | 3,674,874 | |
4.95%, 10/15/58(a) | | | 1,000 | | | | 1,381,464 | |
2.65%, 08/15/62 | | | 800 | | | | 709,961 | |
2.99%, 11/01/63(c) | | | 3,530 | | | | 3,350,061 | |
Discovery Communications LLC | | | | | | | | |
2.95%, 03/20/23 | | | 525 | | | | 536,947 | |
3.90%, 11/15/24 | | | 250 | | | | 265,063 | |
3.45%, 03/15/25 | | | 1,000 | | | | 1,048,611 | |
4.90%, 03/11/26 | | | 330 | | | | 367,784 | |
3.95%, 03/20/28 | | | 620 | | | | 673,811 | |
5.00%, 09/20/37 | | | 250 | | | | 298,292 | |
5.20%, 09/20/47 | | | 1,445 | | | | 1,791,176 | |
5.30%, 05/15/49 | | | 500 | | | | 626,018 | |
4.65%, 05/15/50(a) | | | 1,000 | | | | 1,173,105 | |
4.00%, 09/15/55 | | | 1,538 | | | | 1,624,851 | |
Fox Corp. | | | | | | | | |
4.03%, 01/25/24 | | | 1,000 | | | | 1,056,091 | |
4.71%, 01/25/29 | | | 1,000 | | | | 1,141,398 | |
5.48%, 01/25/39 | | | 1,000 | | | | 1,289,662 | |
5.58%, 01/25/49(a) | | | 1,500 | | | | 2,047,344 | |
Grupo Televisa SAB | | | | | | | | |
4.63%, 01/30/26(a) | | | 2,000 | | | | 2,164,750 | |
6.63%, 01/15/40 | | | 250 | | | | 338,875 | |
5.00%, 05/13/45 | | | 200 | | | | 235,600 | |
6.13%, 01/31/46 | | | 1,050 | | | | 1,418,353 | |
5.25%, 05/24/49(a) | | | 500 | | | | 624,625 | |
NBCUniversal Media LLC | | | | | | | | |
5.95%, 04/01/41 | | | 625 | | | | 894,555 | |
4.45%, 01/15/43 | | | 202 | | | | 244,781 | |
TCI Communications, Inc., 7.88%, 02/15/26 | | | 250 | | | | 311,034 | |
TELUS Corp. | | | | | | | | |
4.60%, 11/16/48(a) | | | 200 | | | | 254,473 | |
4.30%, 06/15/49 | | | 500 | | | | 605,550 | |
Thomson Reuters Corp. | | | | | | | | |
4.30%, 11/23/23 | | | 250 | | | | 262,697 | |
3.35%, 05/15/26 | | | 140 | | | | 148,572 | |
| | | | | | | | |
| Security | | Par (000) | | | Value | |
| | |
Media (continued) | | | | | | | | |
Thomson Reuters Corp. (continued) | | | | | | | | |
5.65%, 11/23/43 | | $ | 1,000 | | | $ | 1,375,052 | |
Time Warner Cable LLC | | | | | | | | |
6.55%, 05/01/37 | | | 650 | | | | 850,376 | |
6.75%, 06/15/39 | | | 2,050 | | | | 2,793,002 | |
5.88%, 11/15/40 | | | 250 | | | | 311,978 | |
5.50%, 09/01/41 | | | 1,750 | | | | 2,121,719 | |
4.50%, 09/15/42 | | | 1,225 | | | | 1,335,510 | |
Time Warner Entertainment Co. LP, 88731EAJ9, 8.38%, 07/15/33(a) | | | 500 | | | | 728,008 | |
TWDC Enterprises 18 Corp. | | | | | | | | |
3.15%, 09/17/25 | | | 165 | | | | 175,225 | |
3.00%, 02/13/26(a) | | | 200 | | | | 211,575 | |
1.85%, 07/30/26(a) | | | 1,000 | | | | 1,008,429 | |
2.95%, 06/15/27(a) | | | 750 | | | | 799,288 | |
4.13%, 06/01/44 | | | 500 | | | | 597,159 | |
3.00%, 07/30/46 | | | 75 | | | | 76,975 | |
Series E, 4.13%, 12/01/41 | | | 250 | | | | 296,746 | |
ViacomCBS, Inc. | | | | | | | | |
3.70%, 08/15/24 | | | 1,000 | | | | 1,058,705 | |
3.50%, 01/15/25 | | | 500 | | | | 527,350 | |
4.00%, 01/15/26 | | | 1,500 | | | | 1,619,512 | |
3.38%, 02/15/28(a) | | | 500 | | | | 532,170 | |
3.70%, 06/01/28 | | | 500 | | | | 542,288 | |
4.95%, 01/15/31 | | | 1,000 | | | | 1,191,260 | |
4.20%, 05/19/32 | | | 1,000 | | | | 1,127,966 | |
6.88%, 04/30/36 | | | 250 | | | | 357,816 | |
4.85%, 07/01/42 | | | 325 | | | | 386,948 | |
4.38%, 03/15/43 | | | 1,070 | | | | 1,217,319 | |
5.85%, 09/01/43 | | | 1,100 | | | | 1,481,710 | |
5.25%, 04/01/44 | | | 250 | | | | 312,977 | |
4.90%, 08/15/44 | | | 1,000 | | | | 1,216,753 | |
4.95%, 05/19/50(a) | | | 1,000 | | | | 1,274,747 | |
Walt Disney Co. | | | | | | | | |
1.75%, 08/30/24 | | | 2,500 | | | | 2,539,611 | |
3.70%, 09/15/24 | | | 500 | | | | 531,321 | |
3.35%, 03/24/25 | | | 1,300 | | | | 1,382,711 | |
3.70%, 10/15/25 | | | 830 | | | | 895,433 | |
1.75%, 01/13/26 | | | 600 | | | | 606,247 | |
3.38%, 11/15/26 | | | 1,500 | | | | 1,613,583 | |
2.20%, 01/13/28 | | | 1,000 | | | | 1,018,571 | |
2.00%, 09/01/29 | | | 500 | | | | 497,357 | |
3.80%, 03/22/30(a) | | | 1,000 | | | | 1,121,680 | |
2.65%, 01/13/31(a) | | | 2,600 | | | | 2,704,586 | |
6.20%, 12/15/34 | | | 350 | | | | 488,763 | |
6.40%, 12/15/35(a) | | | 764 | | | | 1,093,326 | |
6.65%, 11/15/37 | | | 250 | | | | 370,564 | |
4.63%, 03/23/40 | | | 1,000 | | | | 1,242,997 | |
3.50%, 05/13/40 | | | 1,600 | | | | 1,752,310 | |
4.75%, 09/15/44 | | | 500 | | | | 639,987 | |
4.95%, 10/15/45 | | | 15 | | | | 19,744 | |
4.75%, 11/15/46 | | | 1,500 | | | | 1,965,395 | |
2.75%, 09/01/49 | | | 1,000 | | | | 967,546 | |
4.70%, 03/23/50 | | | 1,300 | | | | 1,715,070 | |
3.60%, 01/13/51 | | | 2,200 | | | | 2,487,907 | |
3.80%, 05/13/60 | | | 1,000 | | | | 1,158,463 | |
WPP Finance 2010, 3.75%, 09/19/24 | | | 250 | | | | 264,285 | |
| | | | | | | | |
| | |
| | | | | | | 160,459,244 | |
| | |
| 54 | | 2 0 2 1 BLACK ROCK ANNUAL REPORT TO SHAREHOLDERS |
| | |
Schedule of Investments (continued) December 31, 2021 | | U.S. Total Bond Index Master Portfolio (Percentages shown are based on Net Assets) |
| | | | | | | | |
| Security | | Par (000) | | | Value | |
| | |
Metals & Mining — 0.2% | | | | | | | | |
AngloGold Ashanti Holdings PLC,
3.75%, 10/01/30 | | $ | 1,000 | | | $ | 1,003,800 | |
ArcelorMittal SA | | | | | | | | |
4.55%, 03/11/26 | | | 250 | | | | 273,649 | |
4.25%, 07/16/29(a) | | | 300 | | | | 328,479 | |
7.00%, 10/15/39 | | | 450 | | | | 619,956 | |
6.75%, 03/01/41 | | | 300 | | | | 405,030 | |
Barrick Gold Corp., 5.25%, 04/01/42 | | | 950 | | | | 1,231,971 | |
Barrick North America Finance LLC | | | | | | | | |
5.70%, 05/30/41 | | | 250 | | | | 339,760 | |
5.75%, 05/01/43 | | | 500 | | | | 679,311 | |
Barrick PD Australia Finance Pty Ltd., 5.95%, 10/15/39 | | | 500 | | | | 680,287 | |
BHP Billiton Finance USA Ltd. | | | | | | | | |
4.13%, 02/24/42(a) | | | 250 | | | | 295,898 | |
5.00%, 09/30/43 | | | 1,850 | | | | 2,446,496 | |
Newmont Corp. | | | | | | | | |
2.80%, 10/01/29 | | | 1,080 | | | | 1,110,448 | |
2.25%, 10/01/30 | | | 500 | | | | 492,960 | |
2.60%, 07/15/32 | | | 1,145 | | | | 1,147,450 | |
5.88%, 04/01/35 | | | 250 | | | | 324,793 | |
4.88%, 03/15/42(a) | | | 1,300 | | | | 1,628,206 | |
Nucor Corp. | | | | | | | | |
3.95%, 05/01/28 | | | 1,000 | | | | 1,102,714 | |
2.70%, 06/01/30(a) | | | 1,000 | | | | 1,030,772 | |
2.98%, 12/15/55 | | | 750 | | | | 736,279 | |
Precision Castparts Corp. | | | | | | | | |
2.50%, 01/15/23 | | | 150 | | | | 152,212 | |
4.38%, 06/15/45 | | | 500 | | | | 617,798 | |
Reliance Steel & Aluminum Co., 4.50%, 04/15/23 | | | 25 | | | | 25,878 | |
Rio Tinto Finance USA Ltd. | | | | | | | | |
7.13%, 07/15/28 | | | 1,000 | | | | 1,303,655 | |
5.20%, 11/02/40 | | | 350 | | | | 465,643 | |
2.75%, 11/02/51 | | | 1,255 | | | | 1,244,153 | |
Rio Tinto Finance USA PLC | | | | | | | | |
4.75%, 03/22/42 | | | 350 | | | | 448,391 | |
4.13%, 08/21/42 | | | 500 | | | | 597,814 | |
Southern Copper Corp. | | | | | | | | |
3.88%, 04/23/25 | | | 750 | | | | 801,000 | |
6.75%, 04/16/40 | | | 1,350 | | | | 1,891,519 | |
5.88%, 04/23/45(a) | | | 1,615 | | | | 2,206,292 | |
Steel Dynamics, Inc. | | | | | | | | |
2.80%, 12/15/24 | | | 30 | | | | 31,169 | |
2.40%, 06/15/25 | | | 45 | | | | 46,039 | |
5.00%, 12/15/26 | | | 1,100 | | | | 1,130,752 | |
1.65%, 10/15/27(a) | | | 500 | | | | 488,997 | |
3.45%, 04/15/30 | | | 90 | | | | 96,162 | |
3.25%, 01/15/31 | | | 285 | | | | 300,499 | |
3.25%, 10/15/50 | | | 600 | | | | 604,699 | |
Teck Resources Ltd. | | | | | | | | |
6.13%, 10/01/35 | | | 200 | | | | 259,279 | |
6.25%, 07/15/41 | | | 200 | | | | 265,258 | |
5.40%, 02/01/43(a) | | | 2,000 | | | | 2,438,766 | |
Timken Co., 4.50%, 12/15/28 | | | 500 | | | | 557,268 | |
Vale Overseas Ltd. | | | | | | | | |
6.25%, 08/10/26 | | | 2,000 | | | | 2,310,375 | |
3.75%, 07/08/30 | | | 1,000 | | | | 1,033,312 | |
| | | | | | | | |
| Security | | Par (000) | | | Value | |
| | |
Metals & Mining (continued) | | | | | | | | |
Vale Overseas Ltd. (continued) | | | | | | | | |
6.88%, 11/10/39(a) | | $ | 1,250 | | | $ | 1,676,797 | |
Vale SA, 5.63%, 09/11/42 | | | 1,000 | | | | 1,191,750 | |
| | | | | | | | |
| | |
| | | | | | | 38,063,736 | |
| | |
| Multiline Retail — 0.0% | | | | | | |
Kohl’s Corp., 5.55%, 07/17/45 | | | 100 | | | | 116,598 | |
O’Reilly Automotive, Inc. | | | | | | | | |
4.35%, 06/01/28 | | | 1,000 | | | | 1,127,974 | |
3.90%, 06/01/29 | | | 1,000 | | | | 1,103,772 | |
1.75%, 03/15/31(a) | | | 440 | | | | 416,291 | |
TJX Cos., Inc. | | | | | | | | |
2.25%, 09/15/26 | | | 1,500 | | | | 1,548,564 | |
4.50%, 04/15/50(a) | | | 500 | | | | 674,473 | |
Tractor Supply Co., 1.75%, 11/01/30 | | | 270 | | | | 252,795 | |
| | | | | | | | |
| | |
| | | | | | | 5,240,467 | |
| | |
| Multi-Utilities — 0.1% | | | | | | |
Atmos Energy Corp. | | | | | | | | |
2.63%, 09/15/29 | | | 210 | | | | 215,902 | |
1.50%, 01/15/31 | | | 1,000 | | | | 938,285 | |
4.15%, 01/15/43 | | | 100 | | | | 115,626 | |
4.30%, 10/01/48 | | | 500 | | | | 610,176 | |
4.13%, 03/15/49 | | | 500 | | | | 594,390 | |
3.38%, 09/15/49 | | | 630 | | | | 668,710 | |
CenterPoint Energy Resources Corp. | | | | | | | | |
1.75%, 10/01/30 | | | 200 | | | | 189,426 | |
5.85%, 01/15/41 | | | 250 | | | | 338,023 | |
Eastern Energy Gas Holdings LLC | | | | | | | | |
3.60%, 12/15/24 | | | 167 | | | | 177,113 | |
Series A, 2.50%, 11/15/24 | | | 495 | | | | 509,694 | |
National Fuel Gas Co.(a) | | | | | | | | |
3.75%, 03/01/23 | | | 300 | | | | 306,610 | |
2.95%, 03/01/31 | | | 500 | | | | 502,458 | |
NiSource, Inc. | | | | | | | | |
0.95%, 08/15/25 | | | 870 | | | | 846,828 | |
3.49%, 05/15/27 | | | 1,000 | | | | 1,073,438 | |
2.95%, 09/01/29 | | | 1,000 | | | | 1,036,315 | |
1.70%, 02/15/31(a) | | | 445 | | | | 415,455 | |
5.95%, 06/15/41 | | | 1,050 | | | | 1,437,742 | |
5.25%, 02/15/43 | | | 75 | | | | 95,932 | |
4.80%, 02/15/44 | | | 250 | | | | 306,277 | |
5.65%, 02/01/45 | | | 250 | | | | 337,593 | |
4.38%, 05/15/47 | | | 500 | | | | 588,729 | |
3.95%, 03/30/48(a) | | | 500 | | | | 561,579 | |
ONE Gas, Inc., 4.66%, 02/01/44 | | | 250 | | | | 306,896 | |
Piedmont Natural Gas Co., Inc. | | | | | | | | |
2.50%, 03/15/31(a) | | | 500 | | | | 499,832 | |
3.35%, 06/01/50 | | | 400 | | | | 410,097 | |
Southern California Gas Co. | | | | | | | | |
Series TT, 2.60%, 06/15/26(a) | | | 1,250 | | | | 1,297,845 | |
Series UU, 4.13%, 06/01/48 | | | 250 | | | | 298,341 | |
Series VV, 4.30%, 01/15/49 | | | 1,000 | | | | 1,240,628 | |
Series XX, 2.55%, 02/01/30 | | | 1,000 | | | | 1,025,375 | |
Southern Co. Gas Capital Corp. | | | | | | | | |
2.45%, 10/01/23 | | | 1,000 | | | | 1,020,802 | |
3.95%, 10/01/46 | | | 750 | | | | 823,085 | |
3.15%, 09/30/51 | | | 900 | | | | 888,654 | |
Series 20-A, 1.75%, 01/15/31(a) | | | 500 | | | | 468,233 | |
| | |
MASTER PORTFOLIO SCHEDULE OF INVESTMENTS | | 55 |
| | |
Schedule of Investments (continued) December 31, 2021 | | U.S. Total Bond Index Master Portfolio (Percentages shown are based on Net Assets) |
| | | | | | | | |
| Security | | Par (000) | | | Value | |
| | |
Multi-Utilities (continued) | | | | | | | | |
Southwest Gas Corp. | | | | | | | | |
2.20%, 06/15/30(a) | | $ | 1,000 | | | $ | 969,570 | |
3.18%, 08/15/51 | | | 900 | | | | 862,452 | |
Washington Gas Light Co., 3.65%, 09/15/49 | | | 500 | | | | 558,857 | |
| | | | | | | | |
| | |
| | | | | | | 22,536,968 | |
|
| Offshore Drilling & Other Services — 0.1% | |
Applied Materials, Inc. | | | | | | | | |
3.90%, 10/01/25 | | | 160 | | | | 174,315 | |
3.30%, 04/01/27(a) | | | 1,000 | | | | 1,079,727 | |
1.75%, 06/01/30 | | | 285 | | | | 278,899 | |
5.85%, 06/15/41(a) | | | 300 | | | | 438,670 | |
4.35%, 04/01/47 | | | 750 | | | | 952,272 | |
2.75%, 06/01/50(a) | | | 500 | | | | 500,715 | |
KLA Corp. | | | | | | | | |
4.65%, 11/01/24 | | | 305 | | | | 330,662 | |
4.10%, 03/15/29 | | | 500 | | | | 564,391 | |
3.30%, 03/01/50(a) | | | 1,070 | | | | 1,143,255 | |
Lam Research Corp. | | | | | | | | |
3.80%, 03/15/25 | | | 230 | | | | 247,336 | |
1.90%, 06/15/30 | | | 820 | | | | 806,380 | |
4.88%, 03/15/49 | | | 1,000 | | | | 1,357,391 | |
2.88%, 06/15/50 | | | 305 | | | | 303,901 | |
3.13%, 06/15/60 | | | 610 | | | | 621,535 | |
| | | | | | | | |
| | |
| | | | | | | 8,799,449 | |
| | |
| Oil, Gas & Consumable Fuels — 2.0% | | | | | | |
Eastern Gas Transmission and Storage, Inc.(c) | | | | | | | | |
3.00%, 11/15/29 | | | 1,000 | | | | 1,031,917 | |
3.90%, 11/15/49 | | | 300 | | | | 332,108 | |
Boardwalk Pipelines LP | | | | | | | | |
3.38%, 02/01/23 | | | 200 | | | | 203,591 | |
4.80%, 05/03/29 | | | 500 | | | | 559,962 | |
BP Capital Markets America, Inc. | | | | | | | | |
2.75%, 05/10/23 | | | 350 | | | | 358,694 | |
3.79%, 02/06/24 | | | 1,000 | | | | 1,052,680 | |
3.19%, 04/06/25 | | | 2,000 | | | | 2,109,313 | |
3.80%, 09/21/25(a) | | | 1,000 | | | | 1,079,204 | |
3.41%, 02/11/26(a) | | | 2,000 | | | | 2,133,291 | |
3.12%, 05/04/26(a) | | | 350 | | | | 370,156 | |
3.02%, 01/16/27 | | | 500 | | | | 527,792 | |
3.54%, 04/06/27 | | | 1,000 | | | | 1,079,987 | |
3.94%, 09/21/28 | | | 500 | | | | 553,304 | |
4.23%, 11/06/28 | | | 1,000 | | | | 1,128,735 | |
3.63%, 04/06/30(a) | | | 1,000 | | | | 1,103,330 | |
1.75%, 08/10/30 | | | 515 | | | | 495,224 | |
3.06%, 06/17/41 | | | 200 | | | | 202,402 | |
3.00%, 02/24/50 | | | 1,000 | | | | 984,418 | |
2.77%, 11/10/50 | | | 1,700 | | | | 1,601,393 | |
2.94%, 06/04/51 | | | 1,950 | | | | 1,871,736 | |
3.00%, 03/17/52 | | | 500 | | | | 489,283 | |
3.38%, 02/08/61 | | | 2,000 | | | | 2,054,697 | |
BP Capital Markets PLC | | | | | | | | |
3.99%, 09/26/23 | | | 250 | | | | 262,924 | |
3.28%, 09/19/27 | | | 500 | | | | 537,141 | |
3.72%, 11/28/28 | | | 1,000 | | | | 1,097,447 | |
Canadian Natural Resources Ltd. | | | | | | | | |
2.95%, 01/15/23 | | | 1,000 | | | | 1,019,042 | |
3.80%, 04/15/24(a) | | | 1,250 | | | | 1,311,026 | |
3.90%, 02/01/25(a) | | | 250 | | | | 265,552 | |
3.85%, 06/01/27 | | | 250 | | | | 267,837 | |
| | | | | | | | |
| Security | | Par (000) | | | Value | |
| | |
Oil, Gas & Consumable Fuels (continued) | | | | | | | | |
Canadian Natural Resources Ltd. (continued) | | | | | | | | |
2.95%, 07/15/30 | | $ | 500 | | | $ | 506,193 | |
6.25%, 03/15/38(a) | | | 300 | | | | 394,714 | |
4.95%, 06/01/47(a) | | | 1,500 | | | | 1,840,613 | |
Cenovus Energy, Inc. | | | | | | | | |
5.38%, 07/15/25 | | | 1,732 | | | | 1,911,304 | |
4.25%, 04/15/27(a) | | | 2,000 | | | | 2,179,981 | |
2.65%, 01/15/32 | | | 210 | | | | 205,458 | |
5.25%, 06/15/37 | | | 1,393 | | | | 1,645,893 | |
6.80%, 09/15/37(a) | | | 500 | | | | 669,994 | |
5.40%, 06/15/47(a) | | | 500 | | | | 622,466 | |
3.75%, 02/15/52(a) | | | 125 | | | | 125,304 | |
Cheniere Corpus Christi Holdings LLC | | | | | | | | |
7.00%, 06/30/24 | | | 1,000 | | | | 1,106,224 | |
5.13%, 06/30/27 | | | 1,500 | | | | 1,692,476 | |
3.70%, 11/15/29 | | | 500 | | | | 535,578 | |
2.74%, 12/31/39(a)(c) | | | 500 | | | | 487,798 | |
Chevron Corp. | | | | | | | | |
1.14%, 05/11/23 | | | 235 | | | | 236,321 | |
3.19%, 06/24/23 | | | 500 | | | | 514,809 | |
1.55%, 05/11/25 | | | 3,200 | | | | 3,227,127 | |
3.33%, 11/17/25 | | | 500 | | | | 533,621 | |
2.95%, 05/16/26 | | | 1,250 | | | | 1,323,379 | |
2.00%, 05/11/27(a) | | | 520 | | | | 527,783 | |
2.24%, 05/11/30(a) | | | 950 | | | | 960,884 | |
3.08%, 05/11/50(a) | | | 130 | | | | 138,003 | |
Chevron USA, Inc. | | | | | | | | |
0.69%, 08/12/25 | | | 760 | | | | 743,509 | |
1.02%, 08/12/27 | | | 655 | | | | 630,762 | |
3.85%, 01/15/28 | | | 1,500 | | | | 1,660,706 | |
4.20%, 10/15/49 | | | 500 | | | | 597,244 | |
2.34%, 08/12/50 | | | 1,100 | | | | 1,014,801 | |
CNOOC Finance Ltd. | | | | | | | | |
Series 2013, 3.00%, 05/09/23 | | | 1,300 | | | | 1,330,306 | |
Series 2013, 4.25%, 05/09/43 | | | 500 | | | | 540,719 | |
Series 2013, 3.30%, 09/30/49 | | | 500 | | | | 463,750 | |
CNOOC Finance ULC | | | | | | | | |
Series 2014, 4.25%, 04/30/24 | | | 1,750 | | | | 1,855,875 | |
Series 2014, 4.88%, 04/30/44 | | | 500 | | | | 589,313 | |
CNOOC Finance USA LLC | | | | | | | | |
Series 2015, 3.50%, 05/05/25 | | | 500 | | | | 526,344 | |
Series 2015, 4.38%, 05/02/28 | | | 2,000 | | | | 2,232,250 | |
CNOOC Petroleum North America ULC | | | | | | | | |
7.88%, 03/15/32 | | | 900 | | | | 1,260,169 | |
6.40%, 05/15/37 | | | 400 | | | | 524,825 | |
Columbia Pipeline Group, Inc., 4.50%, 06/01/25 | | | 250 | | | | 269,487 | |
ConocoPhillips | | | | | | | | |
3.75%, 10/01/27(c) | | | 1,000 | | | | 1,096,193 | |
2.40%, 02/15/31(c) | | | 200 | | | | 200,636 | |
6.50%, 02/01/39 | | | 1,400 | | | | 2,033,696 | |
4.88%, 10/01/47(c) | | | 500 | | | | 658,442 | |
4.85%, 08/15/48(c) | | | 1,000 | | | | 1,308,676 | |
ConocoPhillips Co. | | | | | | | | |
4.95%, 03/15/26(a) | | | 1,000 | | | | 1,128,158 | |
6.95%, 04/15/29 | | | 850 | | | | 1,118,279 | |
4.30%, 11/15/44 | | | 1,000 | | | | 1,198,322 | |
5.95%, 03/15/46 | | | 750 | | | | 1,111,101 | |
Continental Resources, Inc. | | | | | | | | |
4.50%, 04/15/23 | | | 500 | | | | 515,235 | |
3.80%, 06/01/24 | | | 700 | | | | 730,426 | |
| | |
| 56 | | 2 0 2 1 BLACK ROCK ANNUAL REPORT TO SHAREHOLDERS |
| | |
Schedule of Investments (continued) December 31, 2021 | | U.S. Total Bond Index Master Portfolio (Percentages shown are based on Net Assets) |
| | | | | | | | |
| Security | | Par
(000) | | | Value | |
|
Oil, Gas & Consumable Fuels (continued) | |
Continental Resources, Inc. (continued) | | | | | | | | |
4.38%, 01/15/28 | | $ | 700 | | | $ | 756,735 | |
4.90%, 06/01/44 | | | 500 | | | | 554,125 | |
Coterra Energy, Inc., 4.38%, 03/15/29(c) | | | 1,000 | | | | 1,117,382 | |
Devon Energy Corp. | | | | | | | | |
5.85%, 12/15/25(a) | | | 250 | | | | 285,845 | |
5.88%, 06/15/28 | | | 650 | | | | 704,003 | |
4.50%, 01/15/30 | | | 650 | | | | 697,837 | |
5.60%, 07/15/41(a) | | | 500 | | | | 627,161 | |
4.75%, 05/15/42(a) | | | 1,350 | | | | 1,563,072 | |
5.00%, 06/15/45 | | | 500 | | | | 604,361 | |
Diamondback Energy, Inc. | | | | | | | | |
2.88%, 12/01/24 | | | 1,000 | | | | 1,037,414 | |
4.75%, 05/31/25(a) | | | 115 | | | | 125,975 | |
3.50%, 12/01/29 | | | 1,000 | | | | 1,060,407 | |
3.13%, 03/24/31 | | | 185 | | | | 190,670 | |
4.40%, 03/24/51 | | | 1,080 | | | | 1,237,907 | |
Enable Midstream Partners LP | | | | | | | | |
4.95%, 05/15/28 | | | 1,000 | | | | 1,109,105 | |
5.00%, 05/15/44(a) | | | 500 | | | | 537,207 | |
Enbridge Energy Partners LP | | | | | | | | |
5.88%, 10/15/25 | | | 1,500 | | | | 1,706,982 | |
7.38%, 10/15/45 | | | 800 | | | | 1,247,546 | |
Enbridge, Inc. | | | | | | | | |
4.00%, 10/01/23 | | | 1,000 | | | | 1,044,053 | |
0.55%, 10/04/23 | | | 280 | | | | 277,822 | |
3.50%, 06/10/24 | | | 65 | | | | 67,838 | |
2.50%, 01/15/25 | | | 250 | | | | 256,907 | |
1.60%, 10/04/26 | | | 460 | | | | 453,402 | |
4.25%, 12/01/26 | | | 1,000 | | | | 1,099,073 | |
3.70%, 07/15/27 | | | 1,000 | | | | 1,078,173 | |
3.13%, 11/15/29(a) | | | 750 | | | | 785,400 | |
2.50%, 08/01/33 | | | 1,000 | | | | 981,440 | |
4.50%, 06/10/44(a) | | | 250 | | | | 291,924 | |
4.00%, 11/15/49(a) | | | 550 | | | | 616,524 | |
3.40%, 08/01/51 | | | 320 | | | | 324,364 | |
Encana Corp., 6.50%, 02/01/38 | | | 325 | | | | 421,656 | |
Energy Transfer LP | | | | | | | | |
3.45%, 01/15/23 | | | 1,000 | | | | 1,018,155 | |
3.60%, 02/01/23 | | | 150 | | | | 152,910 | |
4.25%, 03/15/23(a) | | | 1,000 | | | | 1,027,592 | |
5.88%, 01/15/24 | | | 1,000 | | | | 1,076,272 | |
4.90%, 02/01/24 | | | 250 | | | | 264,464 | |
4.25%, 04/01/24 | | | 400 | | | | 419,934 | |
4.05%, 03/15/25 | | | 1,000 | | | | 1,059,503 | |
2.90%, 05/15/25 | | | 120 | | | | 123,964 | |
4.75%, 01/15/26 | | | 1,000 | | | | 1,093,859 | |
4.20%, 04/15/27 | | | 1,000 | | | | 1,085,064 | |
4.00%, 10/01/27 | | | 1,750 | | | | 1,879,005 | |
5.25%, 04/15/29 | | | 1,500 | | | | 1,718,100 | |
3.75%, 05/15/30(a) | | | 400 | | | | 423,862 | |
4.90%, 03/15/35 | | | 250 | | | | 282,248 | |
6.50%, 02/01/42 | | | 500 | | | | 644,166 | |
4.95%, 01/15/43 | | | 250 | | | | 267,177 | |
5.15%, 02/01/43 | | | 500 | | | | 551,360 | |
5.95%, 10/01/43 | | | 150 | | | | 180,281 | |
5.30%, 04/01/44 | | | 100 | | | | 114,508 | |
5.15%, 03/15/45 | | | 1,000 | | | | 1,130,073 | |
5.35%, 05/15/45(a) | | | 250 | | | | 287,110 | |
6.13%, 12/15/45(a) | | | 1,250 | | | | 1,554,844 | |
5.30%, 04/15/47(a) | | | 750 | | | | 869,074 | |
| | | | | | | | |
| Security | | Par
(000) | | | Value | |
|
Oil, Gas & Consumable Fuels (continued) | |
Energy Transfer LP (continued) | | | | | | | | |
5.40%, 10/01/47 | | $ | 1,000 | | | $ | 1,173,463 | |
6.00%, 06/15/48 | | | 1,000 | | | | 1,242,328 | |
6.25%, 04/15/49 | | | 1,500 | | | | 1,959,392 | |
5.00%, 05/15/50 | | | 1,070 | | | | 1,231,247 | |
Energy Transfer Partners LP/Regency Energy Finance Corp., 4.50%, 11/01/23 | | | 1,000 | | | | 1,047,505 | |
Enterprise Products Operating LLC | | | | | | | | |
3.90%, 02/15/24 | | | 125 | | | | 131,247 | |
3.75%, 02/15/25 | | | 1,790 | | | | 1,902,002 | |
3.70%, 02/15/26 | | | 1,960 | | | | 2,102,329 | |
3.95%, 02/15/27 | | | 2,000 | | | | 2,180,282 | |
4.15%, 10/16/28 | | | 1,000 | | | | 1,122,569 | |
3.13%, 07/31/29(a) | | | 1,155 | | | | 1,226,496 | |
2.80%, 01/31/30 | | | 860 | | | | 896,673 | |
5.95%, 02/01/41 | | | 150 | | | | 199,103 | |
4.45%, 02/15/43 | | | 825 | | | | 941,180 | |
4.85%, 03/15/44 | | | 700 | | | | 842,500 | |
5.10%, 02/15/45 | | | 250 | | | | 308,276 | |
4.90%, 05/15/46 | | | 1,100 | | | | 1,330,081 | |
4.25%, 02/15/48 | | | 1,000 | | | | 1,131,862 | |
4.80%, 02/01/49 | | | 1,000 | | | | 1,217,009 | |
4.20%, 01/31/50(a) | | | 1,120 | | | | 1,255,511 | |
3.70%, 01/31/51 | | | 800 | | | | 839,306 | |
3.20%, 02/15/52 | | | 1,700 | | | | 1,666,807 | |
3.30%, 02/15/53 | | | 1,185 | | | | 1,178,589 | |
3.95%, 01/31/60 | | | 545 | | | | 588,383 | |
(3 mo. LIBOR US + 2.57%), 5.38%, 02/15/78(b) | | | 1,000 | | | | 1,003,368 | |
Series E, (3 mo. LIBOR US + 3.03%), 5.25%, 08/16/77(b) | | | 750 | | | | 765,690 | |
EOG Resources, Inc. | | | | | | | | |
3.15%, 04/01/25 | | | 80 | | | | 83,956 | |
4.38%, 04/15/30(a) | | | 1,000 | | | | 1,155,571 | |
5.10%, 01/15/36 | | | 250 | | | | 303,579 | |
4.95%, 04/15/50 | | | 500 | | | | 679,242 | |
Equinor ASA | | | | | | | | |
2.65%, 01/15/24 | | | 1,500 | | | | 1,546,436 | |
3.70%, 03/01/24 | | | 250 | | | | 263,660 | |
3.25%, 11/10/24 | | | 500 | | | | 526,604 | |
2.88%, 04/06/25(a) | | | 2,000 | | | | 2,087,229 | |
3.13%, 04/06/30 | | | 1,000 | | | | 1,074,319 | |
2.38%, 05/22/30 | | | 1,000 | | | | 1,015,908 | |
3.63%, 04/06/40 | | | 1,000 | | | | 1,110,976 | |
5.10%, 08/17/40 | | | 1,100 | | | | 1,441,774 | |
4.25%, 11/23/41 | | | 300 | | | | 360,502 | |
3.25%, 11/18/49 | | | 750 | | | | 794,372 | |
3.70%, 04/06/50 | | | 1,000 | | | | 1,144,679 | |
Exxon Mobil Corp. | | | | | | | | |
2.73%, 03/01/23 | | | 1,000 | | | | 1,019,662 | |
1.57%, 04/15/23 | | | 1,000 | | | | 1,011,271 | |
3.18%, 03/15/24 | | | 250 | | | | 261,233 | |
2.02%, 08/16/24 | | | 500 | | | | 512,296 | |
2.71%, 03/06/25 | | | 1,250 | | | | 1,299,779 | |
2.99%, 03/19/25 | | | 2,000 | | | | 2,101,838 | |
3.04%, 03/01/26 | | | 620 | | | | 655,900 | |
2.28%, 08/16/26(a) | | | 500 | | | | 516,003 | |
3.29%, 03/19/27 | | | 800 | | | | 861,336 | |
2.44%, 08/16/29(a) | | | 500 | | | | 512,827 | |
3.48%, 03/19/30 | | | 1,100 | | | | 1,204,453 | |
2.61%, 10/15/30 | | | 800 | | | | 829,123 | |
| | |
MASTER PORTFOLIO SCHEDULE OF INVESTMENTS | | 57 |
| | |
Schedule of Investments (continued) December 31, 2021 | | U.S. Total Bond Index Master Portfolio (Percentages shown are based on Net Assets) |
| | | | | | | | |
| Security | | Par (000) | | | Value | |
|
Oil, Gas & Consumable Fuels (continued) | |
Exxon Mobil Corp. (continued) | | | | | | | | |
3.00%, 08/16/39 | | $ | 500 | | | $ | 505,892 | |
4.23%, 03/19/40 | | | 1,200 | | | | 1,416,608 | |
4.11%, 03/01/46 | | | 1,000 | | | | 1,166,903 | |
3.10%, 08/16/49 | | | 1,500 | | | | 1,519,187 | |
4.33%, 03/19/50 | | | 1,651 | | | | 2,027,183 | |
3.45%, 04/15/51(a) | | | 3,549 | | | | 3,844,518 | |
Hess Corp. | | | | | | | | |
4.30%, 04/01/27(a) | | | 1,500 | | | | 1,633,578 | |
5.60%, 02/15/41 | | | 550 | | | | 679,009 | |
5.80%, 04/01/47 | | | 1,000 | | | | 1,277,547 | |
HollyFrontier Corp., 5.88%, 04/01/26(a) | | | 500 | | | | 560,745 | |
Kinder Morgan Energy Partners LP | | | | | | | | |
3.45%, 02/15/23 | | | 500 | | | | 510,589 | |
4.15%, 02/01/24 | | | 1,000 | | | | 1,051,915 | |
4.30%, 05/01/24 | | | 500 | | | | 530,427 | |
4.25%, 09/01/24 | | | 155 | | | | 165,207 | |
5.80%, 03/15/35 | | | 1,000 | | | | 1,254,312 | |
6.50%, 02/01/37 | | | 100 | | | | 132,085 | |
6.95%, 01/15/38 | | | 1,250 | | | | 1,729,491 | |
6.38%, 03/01/41 | | | 500 | | | | 662,584 | |
5.00%, 08/15/42 | | | 75 | | | | 86,981 | |
5.00%, 03/01/43 | | | 250 | | | | 291,158 | |
5.50%, 03/01/44 | | | 750 | | | | 919,411 | |
5.40%, 09/01/44 | | | 250 | | | | 304,038 | |
Kinder Morgan, Inc. | | | | | | | | |
3.15%, 01/15/23 | | | 1,500 | | | | 1,531,667 | |
4.30%, 06/01/25(a) | | | 410 | | | | 443,063 | |
1.75%, 11/15/26 | | | 2,190 | | | | 2,181,431 | |
4.30%, 03/01/28 | | | 1,500 | | | | 1,666,800 | |
2.00%, 02/15/31(a) | | | 900 | | | | 856,440 | |
7.75%, 01/15/32 | | | 1,000 | | | | 1,404,693 | |
5.30%, 12/01/34 | | | 250 | | | | 300,849 | |
5.55%, 06/01/45 | | | 1,250 | | | | 1,580,403 | |
5.05%, 02/15/46 | | | 750 | | | | 898,913 | |
5.20%, 03/01/48 | | | 1,250 | | | | 1,543,931 | |
3.25%, 08/01/50 | | | 900 | | | | 861,247 | |
3.60%, 02/15/51 | | | 400 | | | | 402,268 | |
Magellan Midstream Partners LP | | | | | | | | |
3.20%, 03/15/25 | | | 500 | | | | 517,335 | |
3.25%, 06/01/30 | | | 300 | | | | 315,075 | |
4.25%, 09/15/46(a) | | | 250 | | | | 277,759 | |
4.85%, 02/01/49 | | | 750 | | | | 897,375 | |
3.95%, 03/01/50 | | | 315 | | | | 333,665 | |
Marathon Oil Corp. | | | | | | | | |
4.40%, 07/15/27 | | | 1,000 | | | | 1,095,379 | |
6.80%, 03/15/32 | | | 1,000 | | | | 1,288,063 | |
6.60%, 10/01/37 | | | 250 | | | | 326,645 | |
5.20%, 06/01/45(a) | | | 250 | | | | 299,178 | |
Marathon Petroleum Corp. | | | | | | | | |
3.63%, 09/15/24 | | | 115 | | | | 120,906 | |
4.70%, 05/01/25 | | | 1,000 | | | | 1,090,922 | |
3.80%, 04/01/28 | | | 1,000 | | | | 1,071,715 | |
4.75%, 09/15/44 | | | 250 | | | | 294,202 | |
4.50%, 04/01/48 | | | 1,000 | | | | 1,140,015 | |
MPLX LP | | | | | | | | |
3.38%, 03/15/23 | | | 2,000 | | | | 2,050,841 | |
4.50%, 07/15/23 | | | 250 | | | | 260,259 | |
4.88%, 12/01/24 | | | 250 | | | | 271,349 | |
4.88%, 06/01/25 | | | 250 | | | | 273,565 | |
1.75%, 03/01/26 | | �� | 725 | | | | 717,706 | |
| | | | | | | | |
| Security | | Par (000) | | | Value | |
|
Oil, Gas & Consumable Fuels (continued) | |
MPLX LP (continued) | | | | | | | | |
4.13%, 03/01/27 | | $ | 1,000 | | | $ | 1,094,077 | |
4.25%, 12/01/27 | | | 2,000 | | | | 2,215,218 | |
4.00%, 03/15/28 | | | 1,000 | | | | 1,083,660 | |
2.65%, 08/15/30 | | | 880 | | | | 875,980 | |
4.50%, 04/15/38 | | | 750 | | | | 839,889 | |
5.20%, 03/01/47 | | | 1,000 | | | | 1,224,263 | |
5.20%, 12/01/47 | | | 500 | | | | 607,127 | |
4.70%, 04/15/48 | | | 1,750 | | | | 2,019,025 | |
5.50%, 02/15/49 | | | 700 | | | | 893,899 | |
Newfield Exploration Co., 5.63%, 07/01/24 | | | 650 | | | | 715,508 | |
ONEOK Partners LP | | | | | | | | |
4.90%, 03/15/25 | | | 250 | | | | 272,264 | |
6.13%, 02/01/41 | | | 300 | | | | 377,962 | |
ONEOK, Inc. | | | | | | | | |
7.50%, 09/01/23 | | | 2,000 | | | | 2,174,331 | |
2.75%, 09/01/24 | | | 430 | | | | 441,871 | |
5.85%, 01/15/26 | | | 1,000 | | | | 1,146,728 | |
4.55%, 07/15/28 | | | 500 | | | | 552,000 | |
4.35%, 03/15/29 | | | 1,000 | | | | 1,089,872 | |
3.40%, 09/01/29 | | | 1,000 | | | | 1,035,864 | |
3.10%, 03/15/30 | | | 1,000 | | | | 1,018,509 | |
6.35%, 01/15/31(a) | | | 1,000 | | | | 1,255,351 | |
4.95%, 07/13/47 | | | 1,000 | | | | 1,155,388 | |
4.45%, 09/01/49(a) | | | 1,000 | | | | 1,104,910 | |
4.50%, 03/15/50 | | | 500 | | | | 553,764 | |
Ovintiv Exploration, Inc., 5.38%, 01/01/26 | | | 1,450 | | | | 1,607,350 | |
Ovintiv, Inc. | | | | | | | | |
8.13%, 09/15/30 | | | 200 | | | | 265,950 | |
7.20%, 11/01/31 | | | 225 | | | | 293,218 | |
7.38%, 11/01/31(a) | | | 1,325 | | | | 1,727,153 | |
6.50%, 08/15/34 | | | 500 | | | | 643,334 | |
6.63%, 08/15/37 | | | 300 | | | | 392,729 | |
Phillips 66 | | | | | | | | |
3.85%, 04/09/25(a) | | | 1,000 | | | | 1,066,264 | |
2.15%, 12/15/30(a) | | | 1,000 | | | | 962,369 | |
4.65%, 11/15/34 | | | 1,355 | | | | 1,587,639 | |
5.88%, 05/01/42 | | | 100 | | | | 137,745 | |
4.88%, 11/15/44(a) | | | 1,250 | | | | 1,575,935 | |
3.30%, 03/15/52 | | | 385 | | | | 384,575 | |
Phillips 66 Partners LP | | | | | | | | |
2.45%, 12/15/24(a) | | | 255 | | | | 259,262 | |
3.55%, 10/01/26(a) | | | 500 | | | | 531,957 | |
3.15%, 12/15/29 | | | 370 | | | | 383,584 | |
4.90%, 10/01/46(a) | | | 500 | | | | 608,726 | |
Pioneer Natural Resources Co. | | | | | | | | |
0.55%, 05/15/23 | | | 2,000 | | | | 1,992,358 | |
1.90%, 08/15/30 | | | 1,200 | | | | 1,139,690 | |
Plains All American Pipeline LP/PAA Finance Corp. | | | | | | | | |
2.85%, 01/31/23 | | | 250 | | | | 253,431 | |
3.60%, 11/01/24 | | | 750 | | | | 783,959 | |
4.50%, 12/15/26 | | | 500 | | | | 548,894 | |
3.55%, 12/15/29 | | | 1,000 | | | | 1,035,926 | |
3.80%, 09/15/30 | | | 1,000 | | | | 1,044,243 | |
5.15%, 06/01/42(a) | | | 50 | | | | 54,934 | |
4.70%, 06/15/44 | | | 750 | | | | 797,554 | |
4.90%, 02/15/45 | | | 1,000 | | | | 1,085,240 | |
Sabine Pass Liquefaction LLC | | | | | | | | |
5.63%, 04/15/23 | | | 500 | | | | 522,950 | |
5.75%, 05/15/24(a) | | | 1,000 | | | | 1,087,547 | |
| | |
| 58 | | 2 0 2 1 BLACK ROCK ANNUAL REPORT TO SHAREHOLDERS |
| | |
Schedule of Investments (continued) December 31, 2021 | | U.S. Total Bond Index Master Portfolio (Percentages shown are based on Net Assets) |
| | | | | | | | |
| Security | | Par (000) | | | Value | |
| | |
Oil, Gas & Consumable Fuels (continued) | | | | | | | | |
Sabine Pass Liquefaction LLC (continued) | | | | | | | | |
5.63%, 03/01/25 | | $ | 1,000 | | | $ | 1,110,224 | |
5.88%, 06/30/26 | | | 1,000 | | | | 1,147,305 | |
5.00%, 03/15/27 | | | 1,000 | | | | 1,123,176 | |
4.20%, 03/15/28 | | | 1,000 | | | | 1,095,371 | |
4.50%, 05/15/30(a) | | | 2,000 | | | | 2,256,046 | |
Shell International Finance BV | | | | | | | | |
2.00%, 11/07/24 | | | 1,000 | | | | 1,024,872 | |
3.25%, 05/11/25 | | | 1,250 | | | | 1,330,314 | |
2.88%, 05/10/26 | | | 1,500 | | | | 1,591,055 | |
2.50%, 09/12/26 | | | 1,000 | | | | 1,046,220 | |
3.88%, 11/13/28(a) | | | 1,000 | | | | 1,117,507 | |
2.38%, 11/07/29 | | | 1,000 | | | | 1,021,378 | |
4.13%, 05/11/35 | | | 750 | | | | 875,219 | |
6.38%, 12/15/38 | | | 300 | | | | 436,862 | |
5.50%, 03/25/40 | | | 300 | | | | 406,481 | |
2.88%, 11/26/41 | | | 500 | | | | 500,424 | |
4.55%, 08/12/43 | | | 700 | | | | 872,879 | |
4.38%, 05/11/45 | | | 2,500 | | | | 3,037,392 | |
4.00%, 05/10/46 | | | 1,250 | | | | 1,453,596 | |
3.75%, 09/12/46(a) | | | 900 | | | | 1,010,578 | |
3.13%, 11/07/49 | | | 940 | | | | 967,250 | |
3.25%, 04/06/50(a) | | | 3,000 | | | | 3,191,802 | |
3.00%, 11/26/51 | | | 1,000 | | | | 1,016,060 | |
Spectra Energy Partners LP | | | | | | | | |
4.75%, 03/15/24 | | | 250 | | | | 266,320 | |
3.50%, 03/15/25 | | | 250 | | | | 262,824 | |
3.38%, 10/15/26 | | | 1,000 | | | | 1,060,172 | |
4.50%, 03/15/45 | | | 500 | | | | 577,972 | |
Suncor Energy, Inc. | | | | | | | | |
2.80%, 05/15/23 | | | 1,200 | | | | 1,227,637 | |
6.50%, 06/15/38 | | | 500 | | | | 683,682 | |
6.85%, 06/01/39 | | | 250 | | | | 359,781 | |
4.00%, 11/15/47 | | | 1,500 | | | | 1,667,100 | |
3.75%, 03/04/51 | | | 1,000 | | | | 1,073,273 | |
TC PipeLines LP | | | | | | | | |
4.38%, 03/13/25 | | | 250 | | | | 268,266 | |
3.90%, 05/25/27 | | | 105 | | | | 115,062 | |
Total Capital Canada Ltd., 2.75%, 07/15/23 | | | 1,150 | | | | 1,181,553 | |
Total Capital International SA | | | | | | | | |
2.70%, 01/25/23 | | | 500 | | | | 510,235 | |
3.75%, 04/10/24 | | | 1,000 | | | | 1,061,234 | |
3.46%, 02/19/29(a) | | | 3,000 | | | | 3,249,892 | |
3.46%, 07/12/49 | | | 500 | | | | 540,147 | |
3.13%, 05/29/50 | | | 1,000 | | | | 1,025,027 | |
3.39%, 06/29/60 | | | 1,000 | | | | 1,060,520 | |
TransCanada PipeLines Ltd. | | | | | | | | |
3.75%, 10/16/23 | | | 500 | | | | 520,354 | |
1.00%, 10/12/24 | | | 190 | | | | 188,325 | |
4.88%, 01/15/26 | | | 850 | | | | 946,508 | |
4.25%, 05/15/28 | | | 750 | | | | 836,352 | |
4.10%, 04/15/30 | | | 1,500 | | | | 1,673,223 | |
2.50%, 10/12/31 | | | 500 | | | | 497,280 | |
4.63%, 03/01/34 | | | 1,250 | | | | 1,467,475 | |
5.60%, 03/31/34 | | | 500 | | | | 625,648 | |
6.20%, 10/15/37 | | | 200 | | | | 271,962 | |
4.75%, 05/15/38 | | | 1,250 | | | | 1,489,425 | |
7.25%, 08/15/38 | | | 250 | | | | 374,279 | |
7.63%, 01/15/39 | | | 250 | | | | 389,031 | |
5.00%, 10/16/43 | | | 650 | | | | 808,772 | |
| | | | | | | | |
| Security | | Par (000) | | | Value | |
|
Oil, Gas & Consumable Fuels (continued) | |
TransCanada PipeLines Ltd. (continued) | | | | | | | | |
4.88%, 05/15/48 | | $ | 750 | | | $ | 953,092 | |
5.10%, 03/15/49(a) | | | 750 | | | | 988,391 | |
Transcontinental Gas Pipe Line Co. LLC | | | | | | | | |
7.85%, 02/01/26 | | | 250 | | | | 305,158 | |
4.00%, 03/15/28 | | | 750 | | | | 819,510 | |
4.45%, 08/01/42 | | | 250 | | | | 292,342 | |
3.95%, 05/15/50 | | | 500 | | | | 560,089 | |
Valero Energy Corp. | | | | | | | | |
2.85%, 04/15/25 | | | 2,000 | | | | 2,071,730 | |
3.40%, 09/15/26 | | | 750 | | | | 801,138 | |
2.15%, 09/15/27(a) | | | 2,000 | | | | 1,992,350 | |
4.35%, 06/01/28 | | | 2,000 | | | | 2,205,291 | |
4.00%, 04/01/29(a) | | | 1,000 | | | | 1,088,173 | |
2.80%, 12/01/31 | | | 1,000 | | | | 996,880 | |
6.63%, 06/15/37(a) | | | 300 | | | | 404,148 | |
4.90%, 03/15/45(a) | | | 500 | | | | 590,403 | |
3.65%, 12/01/51 | | | 1,000 | | | | 993,584 | |
Valero Energy Partners LP, 4.50%, 03/15/28 | | | 500 | | | | 551,300 | |
Williams Cos., Inc. | | | | | | | | |
3.70%, 01/15/23 | | | 3,000 | | | | 3,066,157 | |
4.30%, 03/04/24 | | | 250 | | | | 263,806 | |
4.55%, 06/24/24 | | | 2,000 | | | | 2,140,205 | |
3.90%, 01/15/25 | | | 250 | | | | 265,665 | |
4.00%, 09/15/25 | | | 250 | | | | 270,079 | |
3.75%, 06/15/27 | | | 750 | | | | 809,683 | |
3.50%, 11/15/30 | | | 1,000 | | | | 1,062,908 | |
2.60%, 03/15/31 | | | 1,000 | | | | 993,210 | |
6.30%, 04/15/40 | | | 250 | | | | 338,526 | |
5.40%, 03/04/44 | | | 1,000 | | | | 1,241,369 | |
5.75%, 06/24/44 | | | 1,000 | | | | 1,297,931 | |
4.90%, 01/15/45 | | | 500 | | | | 597,764 | |
5.10%, 09/15/45(a) | | | 900 | | | | 1,106,073 | |
4.85%, 03/01/48(a) | | | 500 | | | | 607,514 | |
| | | | | | | | |
| | |
| | | | | | | 345,443,708 | |
| | |
| Personal Products — 0.1% | | | | | | |
Colgate-Palmolive Co. | | | | | | | | |
3.25%, 03/15/24 | | | 250 | | | | 262,109 | |
3.70%, 08/01/47 | | | 750 | | | | 905,753 | |
Estee Lauder Cos., Inc. | | | | | | | | |
2.00%, 12/01/24 | | | 325 | | | | 333,834 | |
3.15%, 03/15/27 | | | 1,000 | | | | 1,071,557 | |
2.38%, 12/01/29 | | | 130 | | | | 132,588 | |
2.60%, 04/15/30 | | | 500 | | | | 518,220 | |
1.95%, 03/15/31 | | | 1,500 | | | | 1,477,592 | |
4.15%, 03/15/47 | | | 500 | | | | 623,955 | |
3.13%, 12/01/49(a) | | | 685 | | | | 749,233 | |
Procter & Gamble Co. | | | | | | | | |
3.10%, 08/15/23 | | | 500 | | | | 519,780 | |
0.55%, 10/29/25 | | | 1,265 | | | | 1,234,116 | |
1.00%, 04/23/26 | | | 565 | | | | 558,544 | |
2.85%, 08/11/27(a) | | | 500 | | | | 534,920 | |
3.00%, 03/25/30 | | | 1,000 | | | | 1,086,884 | |
1.20%, 10/29/30 | | | 1,600 | | | | 1,513,178 | |
1.95%, 04/23/31 | | | 1,000 | | | | 1,008,264 | |
3.55%, 03/25/40 | | | 250 | | | | 289,169 | |
3.60%, 03/25/50 | | | 1,000 | | | | 1,243,552 | |
Unilever Capital Corp. | | | | | | | | |
3.13%, 03/22/23 | | | 2,000 | | | | 2,054,948 | |
0.38%, 09/14/23 | | | 2,000 | | | | 1,987,331 | |
| | |
MASTER PORTFOLIO SCHEDULE OF INVESTMENTS | | 59 |
| | |
Schedule of Investments (continued) December 31, 2021 | | U.S. Total Bond Index Master Portfolio (Percentages shown are based on Net Assets) |
| | | | | | | | |
| Security | | Par (000) | | | Value | |
| | |
Personal Products (continued) | | | | | | | | |
Unilever Capital Corp. (continued) | | | | | | | | |
3.10%, 07/30/25 | | $ | 250 | | | $ | 265,123 | |
2.00%, 07/28/26 | | | 750 | | | | 766,835 | |
2.90%, 05/05/27(a) | | | 750 | | | | 795,016 | |
2.13%, 09/06/29(a) | | | 1,000 | | | | 1,007,947 | |
1.38%, 09/14/30 | | | 805 | | | | 763,274 | |
1.75%, 08/12/31(a) | | | 1,000 | | | | 970,941 | |
2.63%, 08/12/51 | | | 1,000 | | | | 988,690 | |
| | | | | | | | |
| | |
| | | | | | | 23,663,353 | |
| | |
| Pharmaceuticals — 1.4% | | | | | | |
AbbVie, Inc. | | | | | | | | |
2.85%, 05/14/23 | | | 1,500 | | | | 1,533,205 | |
3.75%, 11/14/23(a) | | | 3,000 | | | | 3,140,856 | |
2.60%, 11/21/24 | | | 1,850 | | | | 1,919,621 | |
3.80%, 03/15/25 | | | 1,750 | | | | 1,862,834 | |
3.60%, 05/14/25 | | | 1,500 | | | | 1,595,135 | |
3.20%, 05/14/26 | | | 1,435 | | | | 1,521,283 | |
2.95%, 11/21/26 | | | 2,000 | | | | 2,107,735 | |
3.20%, 11/21/29 | | | 2,850 | | | | 3,047,199 | |
4.55%, 03/15/35 | | | 630 | | | | 757,505 | |
4.50%, 05/14/35 | | | 1,450 | | | | 1,734,522 | |
4.30%, 05/14/36 | | | 200 | | | | 235,764 | |
4.05%, 11/21/39 | | | 2,395 | | | | 2,747,855 | |
4.40%, 11/06/42 | | | 1,400 | | | | 1,670,490 | |
4.85%, 06/15/44 | | | 1,250 | | | | 1,566,468 | |
4.75%, 03/15/45 | | | 668 | | | | 833,182 | |
4.70%, 05/14/45(a) | | | 2,500 | | | | 3,101,574 | |
4.45%, 05/14/46 | | | 1,250 | | | | 1,511,663 | |
4.88%, 11/14/48 | | | 1,000 | | | | 1,292,194 | |
4.25%, 11/21/49 | | | 4,195 | | | | 5,043,113 | |
Astrazeneca Finance LLC | | | | | | | | |
1.20%, 05/28/26 | | | 1,000 | | | | 987,263 | |
1.75%, 05/28/28 | | | 870 | | | | 864,939 | |
2.25%, 05/28/31 | | | 230 | | | | 231,609 | |
AstraZeneca PLC | | | | | | | | |
3.50%, 08/17/23 | | | 500 | | | | 521,780 | |
3.38%, 11/16/25(a) | | | 2,700 | | | | 2,897,722 | |
0.70%, 04/08/26 | | | 1,100 | | | | 1,063,984 | |
3.13%, 06/12/27 | | | 500 | | | | 535,874 | |
4.00%, 01/17/29 | | | 1,500 | | | | 1,693,990 | |
1.38%, 08/06/30 | | | 1,100 | | | | 1,038,467 | |
6.45%, 09/15/37 | | | 600 | | | | 882,062 | |
4.38%, 11/16/45 | | | 950 | | | | 1,216,560 | |
4.38%, 08/17/48(a) | | | 900 | | | | 1,161,482 | |
2.13%, 08/06/50 | | | 1,385 | | | | 1,228,587 | |
3.00%, 05/28/51(a) | | | 1,350 | | | | 1,414,880 | |
Bristol-Myers Squibb Co. | | | | | | | | |
2.75%, 02/15/23 | | | 2,000 | | | | 2,045,341 | |
3.25%, 02/20/23(a) | | | 1,000 | | | | 1,026,347 | |
0.54%, 11/13/23 | | | 3,000 | | | | 2,986,699 | |
3.88%, 08/15/25 | | | 236 | | | | 255,394 | |
3.20%, 06/15/26(a) | | | 4,000 | | | | 4,301,323 | |
3.45%, 11/15/27 | | | 1,000 | | | | 1,091,305 | |
3.90%, 02/20/28 | | | 1,000 | | | | 1,114,575 | |
3.40%, 07/26/29 | | | 2,800 | | | | 3,066,011 | |
1.45%, 11/13/30(a) | | | 750 | | | | 714,495 | |
4.13%, 06/15/39 | | | 500 | | | | 591,427 | |
4.50%, 03/01/44 | | | 250 | | | | 311,583 | |
5.00%, 08/15/45 | | | 1,328 | | | | 1,764,127 | |
4.35%, 11/15/47 | | | 800 | | | | 985,400 | |
| | | | | | | | |
| Security | | Par (000) | | | Value | |
| | |
Pharmaceuticals (continued) | | | | | | | | |
Bristol-Myers Squibb Co. (continued) | | | | | | | | |
4.55%, 02/20/48 | | $ | 1,000 | | | $ | 1,277,096 | |
4.25%, 10/26/49 | | | 4,100 | | | | 5,066,638 | |
2.55%, 11/13/50 | | | 1,000 | | | | 945,970 | |
Cigna Corp. | | | | | | | | |
3.00%, 07/15/23 | | | 1,000 | | | | 1,028,631 | |
3.75%, 07/15/23 | | | 722 | | | | 750,815 | |
0.61%, 03/15/24 | | | 200 | | | | 198,333 | |
3.50%, 06/15/24 | | | 750 | | | | 786,361 | |
3.25%, 04/15/25 | | | 300 | | | | 315,102 | |
4.13%, 11/15/25 | | | 1,000 | | | | 1,093,617 | |
4.50%, 02/25/26 | | | 250 | | | | 276,141 | |
1.25%, 03/15/26(a) | | | 500 | | | | 492,781 | |
3.40%, 03/01/27 | | | 750 | | | | 805,483 | |
3.05%, 10/15/27(a) | | | 1,000 | | | | 1,061,531 | |
4.38%, 10/15/28 | | | 2,000 | | | | 2,273,001 | |
2.40%, 03/15/30 | | | 1,000 | | | | 1,008,821 | |
2.38%, 03/15/31(a) | | | 215 | | | | 216,105 | |
4.80%, 08/15/38 | | | 1,000 | | | | 1,230,001 | |
3.20%, 03/15/40 | | | 1,000 | | | | 1,035,927 | |
4.80%, 07/15/46 | | | 1,250 | | | | 1,577,593 | |
3.88%, 10/15/47 | | | 750 | | | | 837,388 | |
4.90%, 12/15/48 | | | 1,500 | | | | 1,938,188 | |
3.40%, 03/15/50 | | | 1,000 | | | | 1,037,946 | |
3.40%, 03/15/51 | | | 1,250 | | | | 1,307,027 | |
CVS Health Corp. | | | | | | | | |
2.63%, 08/15/24(a) | | | 1,225 | | | | 1,268,377 | |
4.10%, 03/25/25 | | | 181 | | | | 195,088 | |
3.88%, 07/20/25 | | | 943 | | | | 1,013,431 | |
2.88%, 06/01/26(a) | | | 1,750 | | | | 1,827,664 | |
3.63%, 04/01/27 | | | 175 | | | | 189,893 | |
1.30%, 08/21/27(a) | | | 1,500 | | | | 1,454,133 | |
4.30%, 03/25/28 | | | 1,670 | | | | 1,874,053 | |
3.25%, 08/15/29 | | | 2,000 | | | | 2,132,390 | |
3.75%, 04/01/30 | | | 1,745 | | | | 1,913,135 | |
1.75%, 08/21/30 | | | 2,065 | | | | 1,967,841 | |
1.88%, 02/28/31 | | | 1,235 | | | | 1,184,868 | |
2.13%, 09/15/31(a) | | | 450 | | | | 440,670 | |
4.88%, 07/20/35 | | | 1,000 | | | | 1,222,650 | |
4.78%, 03/25/38 | | | 2,500 | | | | 3,043,122 | |
4.13%, 04/01/40 | | | 800 | | | | 918,473 | |
2.70%, 08/21/40 | | | 705 | | | | 679,029 | |
5.13%, 07/20/45 | | | 2,750 | | | | 3,574,626 | |
5.05%, 03/25/48 | | | 4,750 | | | | 6,210,330 | |
4.25%, 04/01/50(a) | | | 1,285 | | | | 1,553,071 | |
Eli Lilly & Co. | | | | | | | | |
2.75%, 06/01/25 | | | 45 | | | | 46,924 | |
3.10%, 05/15/27 | | | 750 | | | | 799,964 | |
3.38%, 03/15/29(a) | | | 1,000 | | | | 1,102,300 | |
3.70%, 03/01/45 | | | 1,000 | | | | 1,154,500 | |
2.25%, 05/15/50(a) | | | 1,500 | | | | 1,371,928 | |
2.50%, 09/15/60(a) | | | 1,000 | | | | 940,129 | |
GlaxoSmithKline Capital PLC, 3.38%, 06/01/29(a) | | | 1,000 | | | | 1,090,440 | |
GlaxoSmithKline Capital, Inc. | | | | | | | | |
2.80%, 03/18/23 | | | 1,500 | | | | 1,536,332 | |
3.38%, 05/15/23 | | | 1,000 | | | | 1,035,537 | |
3.63%, 05/15/25 | | | 1,000 | | | | 1,076,919 | |
3.88%, 05/15/28 | | | 1,000 | | | | 1,119,221 | |
5.38%, 04/15/34(a) | | | 250 | | | | 330,717 | |
6.38%, 05/15/38 | | | 1,100 | | | | 1,609,584 | |
| | |
| 60 | | 2 0 2 1 BLACK ROCK ANNUAL REPORT TO SHAREHOLDERS |
| | |
Schedule of Investments (continued) December 31, 2021 | | U.S. Total Bond Index Master Portfolio (Percentages shown are based on Net Assets) |
| | | | | | | | |
| Security | | Par
(000) | | | Value | |
|
Pharmaceuticals (continued) | |
GlaxoSmithKline Capital, Inc. (continued) | |
4.20%, 03/18/43 | | $ | 600 | | | $ | 729,364 | |
Johnson & Johnson | | | | | | | | |
2.05%, 03/01/23 | | | 750 | | | | 760,832 | |
0.55%, 09/01/25 | | | 3,000 | | | | 2,936,695 | |
2.45%, 03/01/26 | | | 2,370 | | | | 2,472,866 | |
2.90%, 01/15/28 | | | 1,000 | | | | 1,066,249 | |
4.38%, 12/05/33 | | | 250 | | | | 308,524 | |
3.55%, 03/01/36 | | | 750 | | | | 857,920 | |
3.63%, 03/03/37(a) | | | 500 | | | | 573,998 | |
2.10%, 09/01/40(a) | | | 1,500 | | | | 1,419,352 | |
4.50%, 09/01/40 | | | 100 | | | | 126,490 | |
4.50%, 12/05/43 | | | 750 | | | | 953,353 | |
3.70%, 03/01/46 | | | 500 | | | | 587,369 | |
3.75%, 03/03/47 | | | 1,750 | | | | 2,057,742 | |
3.50%, 01/15/48 | | | 1,250 | | | | 1,432,864 | |
2.45%, 09/01/60(a) | | | 2,000 | | | | 1,888,449 | |
Mead Johnson Nutrition Co., 4.60%, 06/01/44 | | | 250 | | | | 322,005 | |
Merck & Co., Inc. | | | | | | | | |
2.75%, 02/10/25 | | | 3,570 | | | | 3,739,004 | |
1.70%, 06/10/27 | | | 935 | | | | 940,598 | |
1.90%, 12/10/28 | | | 960 | | | | 964,519 | |
1.45%, 06/24/30 | | | 2,000 | | | | 1,914,844 | |
2.15%, 12/10/31 | | | 850 | | | | 852,371 | |
3.90%, 03/07/39 | | | 500 | | | | 586,865 | |
2.35%, 06/24/40 | | | 2,000 | | | | 1,904,978 | |
4.15%, 05/18/43 | | | 750 | | | | 911,416 | |
3.70%, 02/10/45 | | | 1,900 | | | | 2,186,622 | |
4.00%, 03/07/49(a) | | | 1,000 | | | | 1,212,254 | |
2.45%, 06/24/50(a) | | | 1,000 | | | | 942,076 | |
2.75%, 12/10/51 | | | 515 | | | | 509,590 | |
2.90%, 12/10/61 | | | 720 | | | | 716,258 | |
Mylan, Inc. | | | | | | | | |
4.20%, 11/29/23 | | | 250 | | | | 261,976 | |
4.55%, 04/15/28 | | | 800 | | | | 895,462 | |
5.40%, 11/29/43 | | | 250 | | | | 308,201 | |
5.20%, 04/15/48 | | | 550 | | | | 680,870 | |
Novartis Capital Corp. | | | | | | | | |
3.40%, 05/06/24 | | | 1,400 | | | | 1,477,005 | |
1.75%, 02/14/25 | | | 500 | | | | 506,962 | |
3.00%, 11/20/25 | | | 1,100 | | | | 1,165,683 | |
2.00%, 02/14/27 | | | 500 | | | | 508,003 | |
3.10%, 05/17/27 | | | 2,500 | | | | 2,665,941 | |
2.20%, 08/14/30 | | | 1,000 | | | | 1,014,799 | |
4.40%, 05/06/44(a) | | | 1,250 | | | | 1,598,035 | |
4.00%, 11/20/45 | | | 250 | | | | 303,265 | |
2.75%, 08/14/50 | | | 1,250 | | | | 1,262,443 | |
Pfizer, Inc. | | | | | | | | |
3.20%, 09/15/23 | | | 2,000 | | | | 2,077,843 | |
3.40%, 05/15/24 | | | 1,000 | | | | 1,059,162 | |
0.80%, 05/28/25 | | | 1,550 | | | | 1,531,461 | |
2.75%, 06/03/26(a) | | | 115 | | | | 121,784 | |
3.00%, 12/15/26 | | | 750 | | | | 806,187 | |
3.60%, 09/15/28(a) | | | 2,000 | | | | 2,225,018 | |
3.45%, 03/15/29 | | | 800 | | | | 880,375 | |
2.63%, 04/01/30 | | | 1,000 | | | | 1,053,563 | |
1.70%, 05/28/30(a) | | | 825 | | | | 808,125 | |
1.75%, 08/18/31(a) | | | 1,000 | | | | 976,475 | |
4.00%, 12/15/36 | | | 500 | | | | 594,399 | |
4.10%, 09/15/38 | | | 1,000 | | | | 1,190,572 | |
| | | | | | | | |
| Security | | Par
(000) | | | Value | |
|
| Pharmaceuticals (continued) | |
Pfizer, Inc. (continued) | |
3.90%, 03/15/39 | | $ | 500 | | | $ | 588,276 | |
7.20%, 03/15/39 | | | 2,250 | | | | 3,630,840 | |
2.55%, 05/28/40 | | | 245 | | | | 244,434 | |
4.30%, 06/15/43 | | | 500 | | | | 612,498 | |
4.40%, 05/15/44 | | | 500 | | | | 621,492 | |
4.13%, 12/15/46 | | | 1,500 | | | | 1,853,837 | |
4.20%, 09/15/48 | | | 500 | | | | 627,184 | |
4.00%, 03/15/49 | | | 1,000 | | | | 1,217,715 | |
2.70%, 05/28/50(a) | | | 675 | | | | 679,065 | |
Sanofi, 3.63%, 06/19/28(a) | | | 2,000 | | | | 2,246,499 | |
Shire Acquisitions Investments Ireland DAC | | | | | | | | |
2.88%, 09/23/23(a) | | | 1,500 | | | | 1,542,718 | |
3.20%, 09/23/26 | | | 1,900 | | | | 2,015,264 | |
Takeda Pharmaceutical Co. Ltd. | | | | | | | | |
4.40%, 11/26/23 | | | 1,000 | | | | 1,058,095 | |
5.00%, 11/26/28(a) | | | 1,000 | | | | 1,174,765 | |
2.05%, 03/31/30 | | | 1,055 | | | | 1,033,111 | |
3.03%, 07/09/40 | | | 1,030 | | | | 1,048,107 | |
3.18%, 07/09/50 | | | 1,115 | | | | 1,123,921 | |
3.38%, 07/09/60(a) | | | 1,000 | | | | 1,035,358 | |
Utah Acquisition Sub, Inc. | | | | | | | | |
3.95%, 06/15/26 | | | 250 | | | | 269,547 | |
5.25%, 06/15/46(a) | | | 500 | | | | 612,552 | |
Viatris, Inc. | | | | | | | | |
1.65%, 06/22/25 | | | 1,000 | | | | 996,210 | |
2.30%, 06/22/27 | | | 1,000 | | | | 1,005,829 | |
2.70%, 06/22/30 | | | 2,000 | | | | 2,007,096 | |
3.85%, 06/22/40 | | | 1,000 | | | | 1,059,077 | |
4.00%, 06/22/50 | | | 1,500 | | | | 1,597,628 | |
Wyeth LLC | | | | | | | | |
6.50%, 02/01/34 | | | 500 | | | | 713,512 | |
5.95%, 04/01/37 | | | 250 | | | | 352,079 | |
Zoetis, Inc. | | | | | | | | |
3.25%, 02/01/23 | | | 1,000 | | | | 1,019,013 | |
3.90%, 08/20/28 | | | 1,000 | | | | 1,109,546 | |
2.00%, 05/15/30 | | | 400 | | | | 394,302 | |
4.70%, 02/01/43 | | | 400 | | | | 509,817 | |
3.95%, 09/12/47 | | | 500 | | | | 587,047 | |
4.45%, 08/20/48 | | | 250 | | | | 319,354 | |
3.00%, 05/15/50 | | | 400 | | | | 415,857 | |
| | | | | | | | |
| | |
| | | | | | | 242,823,980 | |
|
| Producer Durables: Miscellaneous — 0.3% | |
| | |
Oracle Corp. | | | | | | | | |
2.63%, 02/15/23 | | | 2,000 | | | | 2,035,600 | |
2.40%, 09/15/23 | | | 4,000 | | | | 4,079,157 | |
3.40%, 07/08/24 | | | 2,000 | | | | 2,090,895 | |
2.95%, 11/15/24 | | | 3,500 | | | | 3,640,034 | |
2.50%, 04/01/25 | | | 700 | | | | 716,402 | |
2.95%, 05/15/25 | | | 500 | | | | 519,175 | |
1.65%, 03/25/26 | | | 895 | | | | 888,080 | |
2.65%, 07/15/26 | | | 745 | | | | 765,629 | |
2.80%, 04/01/27(a) | | | 1,500 | | | | 1,546,477 | |
3.25%, 11/15/27 | | | 750 | | | | 789,696 | |
2.30%, 03/25/28 | | | 1,385 | | | | 1,380,707 | |
2.95%, 04/01/30 | | | 3,300 | | | | 3,337,508 | |
3.25%, 05/15/30 | | | 950 | | | | 984,836 | |
2.88%, 03/25/31 | | | 1,560 | | | | 1,569,937 | |
4.30%, 07/08/34 | | | 250 | | | | 276,891 | |
3.90%, 05/15/35 | | | 500 | | | | 535,521 | |
| | |
MASTER PORTFOLIO SCHEDULE OF INVESTMENTS | | 61 |
| | |
Schedule of Investments (continued) December 31, 2021 | | U.S. Total Bond Index Master Portfolio (Percentages shown are based on Net Assets) |
| | | | | | | | |
| Security | | Par
(000) | | | Value | |
| | |
Producer Durables: Miscellaneous (continued) | | | | | | | | |
Oracle Corp. (continued) | |
3.85%, 07/15/36 | | $ | 750 | | | $ | 792,255 | |
3.80%, 11/15/37 | | | 750 | | | | 783,059 | |
6.13%, 07/08/39 | | | 500 | | | | 662,718 | |
3.60%, 04/01/40 | | | 1,850 | | | | 1,855,281 | |
3.65%, 03/25/41 | | | 1,670 | | | | 1,688,593 | |
4.50%, 07/08/44 | | | 500 | | | | 564,545 | |
4.13%, 05/15/45 | | | 2,250 | | | | 2,373,611 | |
4.00%, 07/15/46 | | | 2,250 | | | | 2,335,325 | |
4.38%, 05/15/55 | | | 1,250 | | | | 1,368,236 | |
3.85%, 04/01/60 | | | 2,100 | | | | 2,073,647 | |
4.10%, 03/25/61 | | | 615 | | | | 640,964 | |
salesforce.com, Inc. | | | | | | | | |
3.25%, 04/11/23 | | | 2,500 | | | | 2,578,665 | |
1.50%, 07/15/28(a) | | | 60 | | | | 59,266 | |
2.70%, 07/15/41 | | | 2,085 | | | | 2,082,335 | |
2.90%, 07/15/51 | | | 1,385 | | | | 1,409,527 | |
3.05%, 07/15/61 | | | 50 | | | | 51,424 | |
Salesforce.com., Inc., 1.95%, 07/15/31 | | | 320 | | | | 317,005 | |
| | | | | | | | |
| | |
| | | | | | | 46,793,001 | |
|
| Real Estate — 0.0% | |
Prologis LP | | | | | | | | |
2.13%, 04/15/27 | | | 30 | | | | 30,491 | |
2.25%, 04/15/30 | | | 1,240 | | | | 1,246,302 | |
1.25%, 10/15/30 | | | 365 | | | | 339,438 | |
4.38%, 09/15/48 | | | 600 | | | | 753,454 | |
3.00%, 04/15/50(a) | | | 95 | | | | 97,852 | |
2.13%, 10/15/50 | | | 715 | | | | 612,605 | |
| | | | | | | | |
| | |
| | | | | | | 3,080,142 | |
|
| Real Estate Management & Development — 0.0% | |
CBRE Services, Inc. | | | | | | | | |
4.88%, 03/01/26 | | | 250 | | | | 279,411 | |
2.50%, 04/01/31 | | | 1,800 | | | | 1,810,365 | |
Essential Properties LP, 2.95%, 07/15/31(a) | | | 1,000 | | | | 985,060 | |
| | | | | | | | |
| | |
| | | | | | | 3,074,836 | |
|
| Road & Rail — 0.4% | |
Burlington Northern Santa Fe LLC | | | | | | | | |
3.75%, 04/01/24 | | | 50 | | | | 52,595 | |
3.65%, 09/01/25 | | | 750 | | | | 806,902 | |
7.00%, 12/15/25 | | | 250 | | | | 302,541 | |
3.25%, 06/15/27(a) | | | 1,750 | | | | 1,883,212 | |
5.40%, 06/01/41 | | | 50 | | | | 67,497 | |
4.40%, 03/15/42 | | | 150 | | | | 182,534 | |
4.38%, 09/01/42 | | | 250 | | | | 303,789 | |
4.45%, 03/15/43(a) | | | 200 | | | | 245,826 | |
5.15%, 09/01/43 | | | 250 | | | | 334,810 | |
4.90%, 04/01/44 | | | 500 | | | | 653,203 | |
4.55%, 09/01/44 | | | 250 | | | | 315,290 | |
4.15%, 04/01/45 | | | 500 | | | | 600,953 | |
4.70%, 09/01/45 | | | 500 | | | | 640,257 | |
3.90%, 08/01/46 | | | 2,000 | | | | 2,320,533 | |
4.13%, 06/15/47 | | | 250 | | | | 301,349 | |
4.05%, 06/15/48 | | | 1,000 | | | | 1,202,571 | |
4.15%, 12/15/48 | | | 500 | | | | 615,089 | |
3.55%, 02/15/50 | | | 1,125 | | | | 1,260,070 | |
3.05%, 02/15/51(a) | | | 1,000 | | | | 1,034,732 | |
3.30%, 09/15/51 | | | 1,000 | | | | 1,085,615 | |
2.88%, 06/15/52 | | | 205 | | | | 205,039 | |
| | | | | | | | |
| Security | | Par
(000) | | | Value | |
|
Road & Rail (continued) | |
Canadian National Railway Co. | |
2.95%, 11/21/24 | | $ | 305 | | | $ | 318,020 | |
2.75%, 03/01/26 | | | 560 | | | | 585,088 | |
3.65%, 02/03/48 | | | 1,500 | | | | 1,711,333 | |
2.45%, 05/01/50 | | | 455 | | | | 423,327 | |
Canadian Pacific Railway Co. | | | | | | | | |
4.45%, 03/15/23(a) | | | 500 | | | | 516,596 | |
2.90%, 02/01/25 | | | 1,000 | | | | 1,040,056 | |
1.75%, 12/02/26 | | | 285 | | | | 286,028 | |
2.05%, 03/05/30 | | | 1,000 | | | | 985,604 | |
7.13%, 10/15/31(a) | | | 250 | | | | 347,246 | |
2.45%, 12/02/31(a) | | | 685 | | | | 698,412 | |
4.80%, 09/15/35 | | | 250 | | | | 309,157 | |
3.00%, 12/02/41 | | | 415 | | | | 424,366 | |
5.75%, 01/15/42 | | | 25 | | | | 34,012 | |
4.80%, 08/01/45 | | | 1,110 | | | | 1,420,635 | |
3.10%, 12/02/51 | | | 595 | | | | 611,851 | |
6.13%, 09/15/2115 | | | 700 | | | | 1,041,764 | |
CSX Corp. | | | | | | | | |
3.35%, 11/01/25(a) | | | 250 | | | | 266,733 | |
3.25%, 06/01/27 | | | 2,000 | | | | 2,144,605 | |
3.80%, 03/01/28 | | | 2,500 | | | | 2,747,253 | |
2.40%, 02/15/30(a) | | | 500 | | | | 507,744 | |
4.75%, 05/30/42 | | | 100 | | | | 125,131 | |
4.30%, 03/01/48 | | | 750 | | | | 915,469 | |
4.50%, 03/15/49 | | | 1,000 | | | | 1,241,131 | |
3.35%, 09/15/49 | | | 215 | | | | 227,104 | |
3.80%, 04/15/50 | | | 550 | | | | 625,931 | |
3.95%, 05/01/50(a) | | | 450 | | | | 528,381 | |
2.50%, 05/15/51(a) | | | 1,000 | | | | 923,900 | |
4.50%, 08/01/54 | | | 250 | | | | 314,527 | |
4.25%, 11/01/66 | | | 750 | | | | 916,496 | |
4.65%, 03/01/68 | | | 500 | | | | 648,448 | |
Kansas City Southern | | | | | | | | |
2.88%, 11/15/29 | | | 120 | | | | 124,268 | |
4.70%, 05/01/48 | | | 500 | | | | 622,078 | |
3.50%, 05/01/50 | | | 1,000 | | | | 1,063,140 | |
4.20%, 11/15/69(a) | | | 105 | | | | 123,553 | |
Norfolk Southern Corp. | | | | | | | | |
3.85%, 01/15/24(a) | | | 1,000 | | | | 1,047,580 | |
3.15%, 06/01/27 | | | 880 | | | | 932,783 | |
2.55%, 11/01/29(a) | | | 165 | | | | 168,871 | |
3.95%, 10/01/42 | | | 100 | | | | 114,203 | |
4.45%, 06/15/45 | | | 250 | | | | 306,611 | |
3.94%, 11/01/47 | | | 225 | | | | 260,390 | |
4.15%, 02/28/48 | | | 250 | | | | 297,851 | |
3.40%, 11/01/49 | | | 335 | | | | 359,168 | |
3.05%, 05/15/50 | | | 605 | | | | 616,249 | |
2.90%, 08/25/51 | | | 100 | | | | 98,346 | |
4.05%, 08/15/52 | | | 1,000 | | | | 1,201,853 | |
3.16%, 05/15/55 | | | 1,000 | | | | 1,012,946 | |
4.10%, 05/15/2121(a) | | | 1,000 | | | | 1,130,557 | |
Union Pacific Corp. | | | | | | | | |
3.65%, 02/15/24(a) | | | 1,000 | | | | 1,045,039 | |
3.25%, 08/15/25 | | | 250 | | | | 265,315 | |
2.75%, 03/01/26 | | | 1,000 | | | | 1,047,616 | |
2.15%, 02/05/27(a) | | | 160 | | | | 164,047 | |
3.95%, 09/10/28 | | | 1,000 | | | | 1,120,916 | |
3.70%, 03/01/29(a) | | | 1,000 | | | | 1,105,585 | |
2.40%, 02/05/30 | | | 865 | | | | 881,498 | |
2.38%, 05/20/31(a) | | | 1,290 | | | | 1,314,902 | |
| | |
| 62 | | 2 0 2 1 BLACK ROCK ANNUAL REPORT TO SHAREHOLDERS |
| | |
Schedule of Investments (continued) December 31, 2021 | | U.S. Total Bond Index Master Portfolio (Percentages shown are based on Net Assets) |
| | | | | | | | |
| Security | | Par
(000) | | | Value | |
|
Road & Rail (continued) | |
Union Pacific Corp. (continued) | |
3.38%, 02/01/35 | | $ | 500 | | | $ | 546,302 | |
3.60%, 09/15/37(a) | | | 1,250 | | | | 1,386,069 | |
3.20%, 05/20/41 | | | 300 | | | | 319,381 | |
4.05%, 11/15/45 | | | 250 | | | | 294,415 | |
4.05%, 03/01/46 | | | 140 | | | | 165,489 | |
4.50%, 09/10/48(a) | | | 500 | | | | 630,202 | |
3.25%, 02/05/50 | | | 1,100 | | | | 1,178,949 | |
3.80%, 10/01/51 | | | 250 | | | | 290,845 | |
2.95%, 03/10/52 | | | 345 | | | | 349,075 | |
3.95%, 08/15/59 | | | 780 | | | | 922,434 | |
3.84%, 03/20/60(a) | | | 1,450 | | | | 1,707,154 | |
3.55%, 05/20/61 | | | 180 | | | | 198,714 | |
3.80%, 04/06/71 | | | 2,000 | | | | 2,315,610 | |
| | | | | | | | |
| | |
| | | | | | | 64,030,759 | |
|
| Semiconductors & Semiconductor Equipment — 0.6% | |
Altera Corp., 4.10%, 11/15/23(a) | | | 250 | | | | 264,220 | |
Analog Devices, Inc. | | | | | | | | |
3.50%, 12/05/26 | | | 750 | | | | 817,942 | |
1.70%, 10/01/28 | | | 30 | | | | 29,907 | |
2.10%, 10/01/31 | | | 75 | | | | 75,155 | |
2.80%, 10/01/41 | | | 2,050 | | | | 2,073,449 | |
2.95%, 10/01/51 | | | 65 | | | | 66,750 | |
Broadcom Corp./Broadcom Cayman Finance Ltd. | | | | | | | | |
3.88%, 01/15/27 | | | 4,750 | | | | 5,150,385 | |
3.50%, 01/15/28 | | | 500 | | | | 534,114 | |
Broadcom, Inc. | | | | | | | | |
3.15%, 11/15/25 | | | 356 | | | | 372,713 | |
3.46%, 09/15/26 | | | 2,000 | | | | 2,129,148 | |
1.95%, 02/15/28(c) | | | 265 | | | | 261,989 | |
4.11%, 09/15/28 | | | 1,000 | | | | 1,096,300 | |
4.75%, 04/15/29 | | | 1,000 | | | | 1,138,301 | |
5.00%, 04/15/30 | | | 1,000 | | | | 1,164,224 | |
4.15%, 11/15/30 | | | 1,700 | | | | 1,885,395 | |
2.45%, 02/15/31(c) | | | 2,550 | | | | 2,500,308 | |
4.30%, 11/15/32 | | | 1,200 | | | | 1,348,531 | |
2.60%, 02/15/33(c) | | | 600 | | | | 584,938 | |
3.42%, 04/15/33(c) | | | 1,174 | | | | 1,230,707 | |
3.47%, 04/15/34(c) | | | 3,250 | | | | 3,401,676 | |
3.14%, 11/15/35(c) | | | 1,500 | | | | 1,508,937 | |
3.50%, 02/15/41(c) | | | 2,045 | | | | 2,098,208 | |
3.75%, 02/15/51(c) | | | 1,310 | | | | 1,369,609 | |
Flex Ltd. | | | | | | | | |
4.88%, 06/15/29 | | | 500 | | | | 567,200 | |
4.88%, 05/12/30 | | | 1,995 | | | | 2,276,096 | |
Honeywell International, Inc. | | | | | | | | |
2.30%, 08/15/24 | | | 1,000 | | | | 1,033,237 | |
1.35%, 06/01/25 | | | 1,355 | | | | 1,360,469 | |
1.10%, 03/01/27 | | | 1,000 | | | | 971,299 | |
2.70%, 08/15/29 | | | 1,500 | | | | 1,570,844 | |
1.95%, 06/01/30(a) | | | 1,000 | | | | 994,210 | |
1.75%, 09/01/31 | | | 1,000 | | | | 973,736 | |
3.81%, 11/21/47 | | | 500 | | | | 597,077 | |
2.80%, 06/01/50(a) | | | 435 | | | | 452,171 | |
Intel Corp. | | | | | | | | |
2.88%, 05/11/24(a) | | | 1,000 | | | | 1,041,096 | |
3.40%, 03/25/25 | | | 2,400 | | | | 2,551,083 | |
3.70%, 07/29/25 | | | 1,000 | | | | 1,079,037 | |
3.75%, 03/25/27 | | | 800 | | | | 879,714 | |
1.60%, 08/12/28 | | | 360 | | | | 355,635 | |
| | | | | | | | |
| Security | | Par
(000) | | | Value | |
|
Semiconductors & Semiconductor Equipment (continued) | |
Intel Corp. (continued) | |
2.45%, 11/15/29 | | $ | 1,000 | | | $ | 1,034,448 | |
2.00%, 08/12/31(a) | | | 500 | | | | 496,689 | |
2.80%, 08/12/41 | | | 120 | | | | 119,705 | |
4.10%, 05/19/46 | | | 2,500 | | | | 2,969,319 | |
4.10%, 05/11/47 | | | 250 | | | | 299,997 | |
3.73%, 12/08/47 | | | 1,399 | | | | 1,593,462 | |
4.75%, 03/25/50(a) | | | 2,600 | | | | 3,462,375 | |
3.05%, 08/12/51 | | | 2,065 | | | | 2,112,269 | |
3.10%, 02/15/60 | | | 500 | | | | 499,625 | |
4.95%, 03/25/60 | | | 1,000 | | | | 1,401,958 | |
3.20%, 08/12/61(a) | | | 120 | | | | 122,887 | |
Jabil, Inc. | | | | | | | | |
1.70%, 04/15/26 | | | 840 | | | | 837,704 | |
3.00%, 01/15/31 | | | 1,350 | | | | 1,386,756 | |
Marvell Technology, Inc. | | | | | | | | |
1.65%, 04/15/26 | | | 890 | | | | 879,480 | |
2.45%, 04/15/28 | | | 1,000 | | | | 1,014,214 | |
2.95%, 04/15/31 | | | 475 | | | | 483,996 | |
Microchip Technology, Inc. | | | | | | | | |
4.33%, 06/01/23 | | | 2,000 | | | | 2,084,691 | |
4.25%, 09/01/25 | | | 1,000 | | | | 1,038,575 | |
Micron Technology, Inc. | | | | | | | | |
4.98%, 02/06/26 | | | 250 | | | | 277,575 | |
5.33%, 02/06/29 | | | 250 | | | | 296,113 | |
4.66%, 02/15/30 | | | 750 | | | | 864,360 | |
2.70%, 04/15/32 | | | 1,000 | | | | 1,001,130 | |
3.37%, 11/01/41 | | | 500 | | | | 513,435 | |
3.48%, 11/01/51 | | | 500 | | | | 511,865 | |
NVIDIA Corp. | | | | | | | | |
3.20%, 09/16/26(a) | | | 1,000 | | | | 1,073,988 | |
1.55%, 06/15/28 | | | 725 | | | | 719,213 | |
2.85%, 04/01/30 | | | 660 | | | | 701,014 | |
2.00%, 06/15/31 | | | 700 | | | | 696,330 | |
3.50%, 04/01/40 | | | 710 | | | | 797,903 | |
3.50%, 04/01/50 | | | 2,405 | | | | 2,741,633 | |
3.70%, 04/01/60 | | | 145 | | | | 173,285 | |
NXP BV/NXP Funding LLC/NXP USA, Inc.(c) | | | | | | | | |
2.70%, 05/01/25(a) | | | 85 | | | | 87,752 | |
3.88%, 06/18/26 | | | 320 | | | | 344,860 | |
4.30%, 06/18/29 | | | 1,000 | | | | 1,119,250 | |
3.40%, 05/01/30 | | | 1,165 | | | | 1,240,579 | |
2.50%, 05/11/31 | | | 860 | | | | 859,983 | |
2.65%, 02/15/32 | | | 375 | | | | 375,539 | |
3.25%, 05/11/41 | | | 1,435 | | | | 1,467,557 | |
3.13%, 02/15/42 | | | 500 | | | | 499,455 | |
3.25%, 11/30/51 | | | 300 | | | | 298,463 | |
Qorvo, Inc., 4.38%, 10/15/29 | | | 550 | | | | 583,688 | |
QUALCOMM, Inc. | | | | | | | | |
3.25%, 05/20/27 | | | 500 | | | | 539,520 | |
1.30%, 05/20/28 | | | 2,250 | | | | 2,164,868 | |
2.15%, 05/20/30(a) | | | 605 | | | | 610,208 | |
1.65%, 05/20/32(a) | | | 828 | | | | 782,983 | |
4.65%, 05/20/35 | | | 250 | | | | 310,838 | |
4.80%, 05/20/45 | | | 750 | | | | 993,685 | |
4.30%, 05/20/47 | | | 1,500 | | | | 1,878,279 | |
3.25%, 05/20/50(a) | | | 800 | | | | 878,691 | |
Skyworks Solutions, Inc. | | | | | | | | |
1.80%, 06/01/26 | | | 165 | | | | 163,298 | |
3.00%, 06/01/31 | | | 190 | | | | 191,509 | |
| | |
MASTER PORTFOLIO SCHEDULE OF INVESTMENTS | | 63 |
| | |
Schedule of Investments (continued) December 31, 2021 | | U.S. Total Bond Index Master Portfolio (Percentages shown are based on Net Assets) |
| | | | | | | | |
| Security | | Par
(000) | | | Value | |
| | |
Semiconductors & Semiconductor Equipment (continued) | | | | | | | | |
Texas Instruments, Inc. | | | | | | | | |
1.13%, 09/15/26 | | $ | 85 | | | $ | 84,179 | |
2.25%, 09/04/29 | | | 680 | | | | 694,153 | |
1.90%, 09/15/31 | | | 565 | | | | 557,323 | |
3.88%, 03/15/39 | | | 1,000 | | | | 1,181,684 | |
4.15%, 05/15/48 | | | 1,000 | | | | 1,247,502 | |
2.70%, 09/15/51 | | | 720 | | | | 720,014 | |
TSMC Arizona Corp., 2.50%, 10/25/31 | | | 2,000 | | | | 2,025,600 | |
Xilinx, Inc., 2.38%, 06/01/30 | | | 1,400 | | | | 1,417,826 | |
| | | | | | | | |
| | |
| | | | | | | 103,331,090 | |
|
| Software — 0.4% | |
Activision Blizzard, Inc. | | | | | | | | |
3.40%, 06/15/27 | | | 1,000 | | | | 1,074,308 | |
1.35%, 09/15/30 | | | 130 | | | | 119,909 | |
2.50%, 09/15/50 | | | 800 | | | | 700,629 | |
Autodesk, Inc. | | | | | | | | |
3.50%, 06/15/27 | | | 2,000 | | | | 2,149,093 | |
2.85%, 01/15/30 | | | 100 | | | | 103,212 | |
2.40%, 12/15/31 | | | 770 | | | | 767,753 | |
Electronic Arts, Inc. | | | | | | | | |
1.85%, 02/15/31 | | | 285 | | | | 273,158 | |
2.95%, 02/15/51 | | | 390 | | | | 367,477 | |
Intuit, Inc. | | | | | | | | |
0.65%, 07/15/23 | | | 655 | | | | 652,951 | |
0.95%, 07/15/25 | | | 755 | | | | 744,138 | |
1.35%, 07/15/27 | | | 825 | | | | 806,819 | |
1.65%, 07/15/30 | | | 985 | | | | 949,966 | |
Microsoft Corp. | | | | | | | | |
2.00%, 08/08/23(a) | | | 2,000 | | | | 2,037,928 | |
3.63%, 12/15/23 | | | 1,000 | | | | 1,052,490 | |
2.88%, 02/06/24 | | | 865 | | | | 900,308 | |
3.13%, 11/03/25 | | | 4,500 | | | | 4,800,304 | |
2.40%, 08/08/26 | | | 2,235 | | | | 2,338,873 | |
3.30%, 02/06/27 | | | 4,500 | | | | 4,903,759 | |
3.50%, 02/12/35 | | | 1,165 | | | | 1,330,486 | |
3.45%, 08/08/36 | | | 596 | | | | 686,025 | |
2.53%, 06/01/50 | | | 4,714 | | | | 4,597,036 | |
2.92%, 03/17/52 | | | 4,190 | | | | 4,448,601 | |
4.50%, 02/06/57(a) | | | 2,000 | | | | 2,775,650 | |
2.68%, 06/01/60 | | | 3,737 | | | | 3,724,646 | |
3.04%, 03/17/62 | | | 1,707 | | | | 1,826,060 | |
Oracle Corp. | | | | | | | | |
5.38%, 07/15/40 | | | 400 | | | | 488,444 | |
4.00%, 11/15/47 | | | 1,500 | | | | 1,557,366 | |
3.60%, 04/01/50 | | | 4,600 | | | | 4,504,039 | |
3.95%, 03/25/51 | | | 2,630 | | | | 2,730,222 | |
Roper Technologies, Inc. | | | | | | | | |
3.65%, 09/15/23 | | | 250 | | | | 260,241 | |
2.35%, 09/15/24(a) | | | 240 | | | | 246,064 | |
1.00%, 09/15/25 | | | 620 | | | | 605,750 | |
3.80%, 12/15/26 | | | 250 | | | | 273,862 | |
1.40%, 09/15/27 | | | 370 | | | | 359,021 | |
2.95%, 09/15/29 | | | 435 | | | | 449,917 | |
2.00%, 06/30/30 | | | 380 | | | | 365,324 | |
1.75%, 02/15/31 | | | 490 | | | | 460,111 | |
ServiceNow, Inc., 1.40%, 09/01/30 | | | 810 | | | | 753,952 | |
VMware, Inc. | | | | | | | | |
0.60%, 08/15/23 | | | 3,000 | | | | 2,978,959 | |
| | | | | | | | |
| Security | | Par
(000) | | | Value | |
|
| Software (continued) | |
VMware, Inc. (continued) | | | | | | | | |
1.40%, 08/15/26 | | $ | 2,000 | | | $ | 1,965,563 | |
4.70%, 05/15/30 | | | 1,000 | | | | 1,163,858 | |
| | | | | | | | |
| | |
| | | | | | | 63,294,272 | |
| | |
| Specialty Retail — 0.0% | | | | | | |
AutoZone, Inc. | | | | | | | | |
3.13%, 07/15/23 | | | 1,250 | | | | 1,285,081 | |
3.25%, 04/15/25 | | | 165 | | | | 173,257 | |
3.75%, 04/18/29 | | | 1,000 | | | | 1,091,363 | |
Best Buy Co., Inc., 1.95%, 10/01/30 | | | 1,250 | | | | 1,199,228 | |
Ross Stores, Inc. | | | | | | | | |
4.60%, 04/15/25 | | | 500 | | | | 547,772 | |
1.88%, 04/15/31 | | | 1,000 | | | | 958,674 | |
| | | | | | | | |
| | |
| | | | | | | 5,255,375 | |
|
| Technology Hardware, Storage & Peripherals — 0.5% | |
Adobe, Inc. | | | | | | | | |
1.70%, 02/01/23 | | | 160 | | | | 161,765 | |
1.90%, 02/01/25 | | | 160 | | | | 163,822 | |
3.25%, 02/01/25 | | | 70 | | | | 74,024 | |
2.15%, 02/01/27 | | | 1,275 | | | | 1,311,529 | |
2.30%, 02/01/30 | | | 1,200 | | | | 1,226,495 | |
Apple, Inc. | | | | | | | | |
2.40%, 01/13/23 | | | 1,000 | | | | 1,019,108 | |
2.85%, 02/23/23(a) | | | 250 | | | | 255,216 | |
2.40%, 05/03/23 | | | 4,000 | | | | 4,095,384 | |
0.75%, 05/11/23 | | | 3,350 | | | | 3,359,127 | |
3.45%, 05/06/24 | | | 1,000 | | | | 1,057,612 | |
2.85%, 05/11/24 | | | 2,000 | | | | 2,083,061 | |
1.80%, 09/11/24 | | | 1,635 | | | | 1,670,756 | |
2.75%, 01/13/25 | | | 1,000 | | | | 1,044,702 | |
2.50%, 02/09/25 | | | 140 | | | | 145,686 | |
1.13%, 05/11/25 | | | 650 | | | | 647,958 | |
3.20%, 05/13/25 | | | 750 | | | | 798,021 | |
0.55%, 08/20/25 | | | 2,800 | | | | 2,723,633 | |
0.70%, 02/08/26 | | | 500 | | | | 489,789 | |
3.25%, 02/23/26 | | | 1,910 | | | | 2,041,702 | |
2.45%, 08/04/26 | | | 1,410 | | | | 1,472,463 | |
3.35%, 02/09/27 | | | 2,000 | | | | 2,170,347 | |
3.20%, 05/11/27 | | | 1,500 | | | | 1,617,676 | |
2.90%, 09/12/27 | | | 1,000 | | | | 1,065,863 | |
3.00%, 11/13/27 | | | 1,000 | | | | 1,074,473 | |
1.40%, 08/05/28 | | | 200 | | | | 195,850 | |
2.20%, 09/11/29 | | | 1,235 | | | | 1,264,062 | |
1.65%, 05/11/30 | | | 1,400 | | | | 1,362,460 | |
1.25%, 08/20/30 | | | 2,800 | | | | 2,639,240 | |
1.65%, 02/08/31 | | | 2,500 | | | | 2,440,768 | |
1.70%, 08/05/31 | | | 200 | | | | 195,171 | |
4.50%, 02/23/36(a) | | | 250 | | | | 313,655 | |
3.85%, 05/04/43 | | | 1,750 | | | | 2,060,760 | |
4.45%, 05/06/44 | | | 250 | | | | 319,049 | |
3.45%, 02/09/45 | | | 1,350 | | | | 1,506,445 | |
4.38%, 05/13/45 | | | 500 | | | | 630,496 | |
4.65%, 02/23/46 | | | 1,980 | | | | 2,597,141 | |
3.85%, 08/04/46 | | | 750 | | | | 888,724 | |
4.25%, 02/09/47 | | | 250 | | | | 312,211 | |
3.75%, 11/13/47 | | | 1,250 | | | | 1,467,049 | |
2.95%, 09/11/49 | | | 1,250 | | | | 1,287,691 | |
2.65%, 05/11/50 | | | 1,200 | | | | 1,179,759 | |
2.40%, 08/20/50 | | | 2,800 | | | | 2,628,739 | |
2.65%, 02/08/51 | | | 2,250 | | | | 2,212,215 | |
| | |
| 64 | | 2 0 2 1 BLACK ROCK ANNUAL REPORT TO SHAREHOLDERS |
| | |
Schedule of Investments (continued) December 31, 2021 | | U.S. Total Bond Index Master Portfolio (Percentages shown are based on Net Assets) |
| | | | | | | | |
| Security | | Par
(000) | | | Value | |
| | |
Technology Hardware, Storage & Peripherals (continued) | | | | | | | | |
Apple, Inc. (continued) | | | | | | | | |
2.70%, 08/05/51 | | $ | 2,190 | | | $ | 2,166,377 | |
2.55%, 08/20/60 | | | 1,600 | | | | 1,502,568 | |
2.80%, 02/08/61 | | | 2,500 | | | | 2,482,326 | |
2.85%, 08/05/61 | | | 200 | | | | 200,394 | |
Dell International LLC / EMC Corp.(c) | | | | | | | | |
3.38%, 12/15/41 | | | 1,000 | | | | 988,641 | |
3.45%, 12/15/51 | | | 500 | | | | 480,052 | |
Dell International LLC/EMC Corp. | | | | | | | | |
5.45%, 06/15/23 | | | 3,000 | | | | 3,164,679 | |
4.00%, 07/15/24 | | | 1,000 | | | | 1,061,099 | |
5.85%, 07/15/25 | | | 600 | | | | 680,068 | |
6.02%, 06/15/26 | | | 3,090 | | | | 3,571,581 | |
4.90%, 10/01/26 | | | 1,000 | | | | 1,126,323 | |
5.30%, 10/01/29 | | | 1,250 | | | | 1,465,242 | |
6.20%, 07/15/30 | | | 1,500 | | | | 1,892,804 | |
8.10%, 07/15/36 | | | 270 | | | | 410,832 | |
8.35%, 07/15/46 | | | 334 | | | | 555,278 | |
Dell, Inc. | | | | | | | | |
7.10%, 04/15/28 | | | 400 | | | | 501,133 | |
6.50%, 04/15/38(a) | | | 400 | | | | 515,956 | |
Fortinet, Inc. | | | | | | | | |
1.00%, 03/15/26 | | | 760 | | | | 736,163 | |
2.20%, 03/15/31(a) | | | 885 | | | | 866,111 | |
Hewlett Packard Enterprise Co. | | | | | | | | |
2.25%, 04/01/23 | | | 1,000 | | | | 1,015,191 | |
1.45%, 04/01/24 | | | 1,000 | | | | 1,006,402 | |
4.90%, 10/15/25 | | | 1,250 | | | | 1,386,690 | |
6.20%, 10/15/35 | | | 500 | | | | 654,470 | |
6.35%, 10/15/45 | | | 750 | | | | 1,004,526 | |
HP, Inc. | | | | | | | | |
2.20%, 06/17/25 | | | 500 | | | | 510,332 | |
1.45%, 06/17/26(c) | | | 755 | | | | 740,049 | |
3.40%, 06/17/30 | | | 500 | | | | 529,077 | |
2.65%, 06/17/31(c) | | | 1,000 | | | | 985,854 | |
6.00%, 09/15/41(a) | | | 650 | | | | 863,826 | |
NetApp, Inc., 1.88%, 06/22/25 | | | 675 | | | | 679,998 | |
Western Digital Corp. | | | | | | | | |
2.85%, 02/01/29 | | | 100 | | | | 100,963 | |
3.10%, 02/01/32 | | | 225 | | | | 226,643 | |
| | | | | | | | |
| | |
| | | | | | | 91,343,345 | |
|
| Textiles, Apparel & Luxury Goods — 0.0% | |
NIKE, Inc. | | | | | | | | |
2.75%, 03/27/27(a) | | | 2,000 | | | | 2,118,805 | |
2.85%, 03/27/30 | | | 1,000 | | | | 1,063,015 | |
3.25%, 03/27/40 | | | 1,000 | | | | 1,087,836 | |
3.88%, 11/01/45 | | | 500 | | | | 599,923 | |
3.38%, 11/01/46 | | | 1,500 | | | | 1,669,536 | |
VF Corp., 2.95%, 04/23/30 | | | 500 | | | | 518,625 | |
| | | | | | | | |
| | |
| | | | | | | 7,057,740 | |
|
| Tobacco — 0.3% | |
Altria Group, Inc. | | | | | | | | |
4.00%, 01/31/24 | | | 1,000 | | | | 1,055,898 | |
2.35%, 05/06/25 | | | 240 | | | | 245,634 | |
2.63%, 09/16/26 | | | 2,000 | | | | 2,065,215 | |
4.80%, 02/14/29(a) | | | 552 | | | | 622,623 | |
3.40%, 05/06/30 | | | 435 | | | | 450,066 | |
2.45%, 02/04/32 | | | 1,215 | | | | 1,153,541 | |
5.80%, 02/14/39 | | | 1,000 | | | | 1,201,982 | |
| | | | | | | | |
| Security | | Par
(000) | | | Value | |
|
| Tobacco (continued) | |
Altria Group, Inc. (continued) | | | | | | | | |
3.40%, 02/04/41 | | $ | 1,000 | | | $ | 922,436 | |
4.50%, 05/02/43 | | | 400 | | | | 414,563 | |
5.38%, 01/31/44 | | | 1,320 | | | | 1,523,597 | |
3.88%, 09/16/46 | | | 1,250 | | | | 1,209,061 | |
5.95%, 02/14/49 | | | 1,500 | | | | 1,871,896 | |
4.45%, 05/06/50 | | | 655 | | | | 675,680 | |
3.70%, 02/04/51 | | | 1,400 | | | | 1,304,968 | |
4.00%, 02/04/61(a) | | | 700 | | | | 668,903 | |
BAT Capital Corp. | | | | | | | | |
3.22%, 08/15/24 | | | 1,250 | | | | 1,299,180 | |
2.79%, 09/06/24 | | | 2,000 | | | | 2,060,490 | |
3.22%, 09/06/26 | | | 1,000 | | | | 1,040,640 | |
4.70%, 04/02/27 | | | 500 | | | | 550,024 | |
3.56%, 08/15/27 | | | 2,500 | | | | 2,622,002 | |
2.26%, 03/25/28 | | | 600 | | | | 584,661 | |
3.46%, 09/06/29 | | | 500 | | | | 518,122 | |
4.91%, 04/02/30 | | | 600 | | | | 673,482 | |
2.73%, 03/25/31(a) | | | 2,800 | | | | 2,717,180 | |
4.39%, 08/15/37 | | | 2,250 | | | | 2,370,708 | |
3.73%, 09/25/40 | | | 200 | | | | 192,108 | |
4.54%, 08/15/47 | | | 1,350 | | | | 1,411,860 | |
4.76%, 09/06/49(a) | | | 750 | | | | 805,314 | |
5.28%, 04/02/50 | | | 250 | | | | 282,801 | |
3.98%, 09/25/50(a) | | | 600 | | | | 576,746 | |
BAT International Finance PLC, 1.67%, 03/25/26 | | | 250 | | | | 245,412 | |
Philip Morris International, Inc. | | | | | | | | |
2.63%, 03/06/23 | | | 250 | | | | 255,714 | |
2.13%, 05/10/23 | | | 1,000 | | | | 1,014,951 | |
3.25%, 11/10/24 | | | 1,000 | | | | 1,057,860 | |
3.38%, 08/11/25 | | | 750 | | | | 795,550 | |
2.75%, 02/25/26 | | | 415 | | | | 431,366 | |
3.13%, 08/17/27(a) | | | 1,000 | | | | 1,067,225 | |
2.10%, 05/01/30 | | | 2,000 | | | | 1,957,061 | |
1.75%, 11/01/30 | | | 2,000 | | | | 1,902,736 | |
6.38%, 05/16/38 | | | 1,750 | | | | 2,455,620 | |
4.38%, 11/15/41 | | | 1,000 | | | | 1,135,190 | |
4.50%, 03/20/42 | | | 50 | | | | 57,822 | |
3.88%, 08/21/42 | | | 350 | | | | 376,437 | |
4.13%, 03/04/43 | | | 450 | | | | 497,537 | |
4.88%, 11/15/43 | | | 250 | | | | 304,265 | |
4.25%, 11/10/44(a) | | | 365 | | | | 416,713 | |
Reynolds American, Inc. | | | | | | | | |
4.45%, 06/12/25 | | | 1,000 | | | | 1,079,995 | |
5.70%, 08/15/35 | | | 325 | | | | 385,102 | |
6.15%, 09/15/43 | | | 150 | | | | 183,687 | |
5.85%, 08/15/45 | | | 1,750 | | | | 2,126,323 | |
| | | | | | | | |
| | |
| | | | | | | 50,837,947 | |
|
| Transportation Infrastructure — 0.2% | |
FedEx Corp. | | | | | | | | |
3.25%, 04/01/26(a) | | | 545 | | | | 581,275 | |
3.10%, 08/05/29 | | | 1,000 | | | | 1,056,545 | |
4.25%, 05/15/30 | | | 2,000 | | | | 2,274,218 | |
2.40%, 05/15/31(a) | | | 625 | | | | 626,251 | |
3.90%, 02/01/35 | | | 190 | | | | 212,008 | |
3.25%, 05/15/41 | | | 855 | | | | 873,416 | |
3.88%, 08/01/42 | | | 50 | | | | 54,890 | |
4.75%, 11/15/45 | | | 660 | | | | 804,228 | |
4.55%, 04/01/46 | | | 750 | | | | 898,750 | |
4.40%, 01/15/47 | | | 500 | | | | 588,836 | |
| | |
MASTER PORTFOLIO SCHEDULE OF INVESTMENTS | | 65 |
| | |
Schedule of Investments (continued) December 31, 2021 | | U.S. Total Bond Index Master Portfolio (Percentages shown are based on Net Assets) |
| | | | | | | | |
| Security | | Par
(000) | | | Value | |
|
Transportation Infrastructure (continued) | |
FedEx Corp. (continued) | | | | | | | | |
4.05%, 02/15/48 | | $ | 1,000 | | | $ | 1,122,663 | |
4.95%, 10/17/48 | | | 1,000 | | | | 1,277,323 | |
5.25%, 05/15/50 | | | 1,000 | | | | 1,337,798 | |
Ryder System, Inc. | | | | | | | | |
3.40%, 03/01/23 | | | 500 | | | | 512,968 | |
3.88%, 12/01/23 | | | 2,000 | | | | 2,100,353 | |
2.50%, 09/01/24 | | | 285 | | | | 293,175 | |
1.75%, 09/01/26 | | | 490 | | | | 486,454 | |
2.90%, 12/01/26 | | | 1,160 | | | | 1,207,912 | |
United Parcel Service, Inc. | | | | | | | | |
2.50%, 04/01/23 | | | 2,000 | | | | 2,039,761 | |
3.90%, 04/01/25(a) | | | 1,000 | | | | 1,079,130 | |
2.40%, 11/15/26(a) | | | 2,000 | | | | 2,072,095 | |
3.05%, 11/15/27(a) | | | 500 | | | | 533,802 | |
6.20%, 01/15/38 | | | 100 | | | | 144,304 | |
5.20%, 04/01/40 | | | 1,000 | | | | 1,347,296 | |
3.63%, 10/01/42(a) | | | 250 | | | | 288,026 | |
3.40%, 11/15/46 | | | 220 | | | | 247,257 | |
3.75%, 11/15/47 | | | 500 | | | | 594,522 | |
4.25%, 03/15/49 | | | 1,000 | | | | 1,279,694 | |
3.40%, 09/01/49 | | | 300 | | | | 338,031 | |
5.30%, 04/01/50 | | | 1,000 | | | | 1,477,227 | |
| | | | | | | | |
| | |
| | | | | | | 27,750,208 | |
| | |
| Utilities — 0.1% | | | | | | |
American Water Capital Corp. | | | | | | | | |
3.40%, 03/01/25 | | | 750 | | | | 792,642 | |
2.95%, 09/01/27(a) | | | 500 | | | | 527,385 | |
3.75%, 09/01/28 | | | 1,500 | | | | 1,645,077 | |
3.45%, 06/01/29 | | | 500 | | | | 538,663 | |
2.30%, 06/01/31(a) | | | 900 | | | | 899,958 | |
4.30%, 09/01/45 | | | 250 | | | | 298,729 | |
3.75%, 09/01/47 | | | 500 | | | | 557,587 | |
4.15%, 06/01/49 | | | 500 | | | | 590,147 | |
3.45%, 05/01/50 | | | 1,000 | | | | 1,063,743 | |
3.25%, 06/01/51 | | | 900 | | | | 934,800 | |
Essential Utilities, Inc. | | | | | | | | |
2.40%, 05/01/31 | | | 1,000 | | | | 994,126 | |
3.35%, 04/15/50 | | | 1,000 | | | | 1,035,003 | |
| | | | | | | | |
| | |
| | | | | | | 9,877,860 | |
|
| Wireless Telecommunication Services — 0.3% | |
America Movil SAB de CV | | | | | | | | |
3.63%, 04/22/29(a) | | | 1,400 | | | | 1,511,387 | |
2.88%, 05/07/30 | | | 1,500 | | | | 1,550,906 | |
6.13%, 03/30/40 | | | 250 | | | | 345,750 | |
4.38%, 07/16/42 | | | 850 | | | | 1,002,628 | |
4.38%, 04/22/49(a) | | | 1,000 | | | | 1,215,187 | |
EPR Properties | | | | | | | | |
4.50%, 04/01/25 | | | 200 | | | | 212,949 | |
4.75%, 12/15/26 | | | 300 | | | | 320,599 | |
4.50%, 06/01/27 | | | 300 | | | | 316,747 | |
4.95%, 04/15/28(a) | | | 300 | | | | 323,711 | |
3.75%, 08/15/29(a) | | | 300 | | | | 302,778 | |
GLP Capital LP/GLP Financing II, Inc., 5.30%, 01/15/29 | | | 1,000 | | | | 1,135,200 | |
Orange SA | | | | | | | | |
9.00%, 03/01/31 | | | 250 | | | | 383,071 | |
5.38%, 01/13/42 | | | 1,825 | | | | 2,401,957 | |
| | | | | | | | |
| Security | | Par
(000) | | | Value | |
|
| Wireless Telecommunication Services (continued) | |
Rogers Communications, Inc. | | | | | | | | |
3.00%, 03/15/23 | | $ | 650 | | | $ | 662,210 | |
4.10%, 10/01/23 | | | 2,000 | | | | 2,087,108 | |
3.63%, 12/15/25 | | | 1,565 | | | | 1,663,869 | |
2.90%, 11/15/26(a) | | | 1,000 | | | | 1,043,984 | |
5.00%, 03/15/44(a) | | | 250 | | | | 308,439 | |
4.30%, 02/15/48 | | | 750 | | | | 857,024 | |
4.35%, 05/01/49 | | | 1,250 | | | | 1,448,530 | |
3.70%, 11/15/49 | | | 400 | | | | 419,843 | |
T-Mobile USA, Inc. | | | | | | | | |
3.50%, 04/15/25 | | | 1,045 | | | | 1,107,150 | |
1.50%, 02/15/26 | | | 1,000 | | | | 987,805 | |
3.75%, 04/15/27 | | | 3,500 | | | | 3,790,151 | |
2.05%, 02/15/28 | | | 500 | | | | 496,304 | |
3.88%, 04/15/30 | | | 6,000 | | | | 6,562,521 | |
2.55%, 02/15/31 | | | 700 | | | | 696,482 | |
2.25%, 11/15/31(a) | | | 345 | | | | 334,757 | |
2.70%, 03/15/32(c) | | | 755 | | | | 759,652 | |
4.38%, 04/15/40 | | | 1,250 | | | | 1,428,981 | |
3.00%, 02/15/41 | | | 2,000 | | | | 1,952,612 | |
4.50%, 04/15/50 | | | 1,720 | | | | 2,013,094 | |
3.30%, 02/15/51 | | | 1,750 | | | | 1,709,128 | |
3.40%, 10/15/52(c) | | | 1,000 | | | | 995,386 | |
3.60%, 11/15/60 | | | 500 | | | | 495,262 | |
3.60%, 11/15/60(c) | | | 500 | | | | 495,262 | |
Vodafone Group PLC | | | | | | | | |
4.13%, 05/30/25 | | | 1,500 | | | | 1,620,675 | |
4.38%, 05/30/28 | | | 1,350 | | | | 1,519,001 | |
7.88%, 02/15/30 | | | 100 | | | | 138,920 | |
6.15%, 02/27/37 | | | 500 | | | | 677,802 | |
5.00%, 05/30/38 | | | 500 | | | | 621,533 | |
4.38%, 02/19/43 | | | 950 | | | | 1,113,787 | |
5.25%, 05/30/48 | | | 2,500 | | | | 3,256,238 | |
4.88%, 06/19/49 | | | 500 | | | | 630,535 | |
4.25%, 09/17/50(a) | | | 1,190 | | | | 1,373,454 | |
5.13%, 06/19/59 | | | 600 | | | | 787,970 | |
Vornado Realty LP, 3.50%, 01/15/25(a) | | | 250 | | | | 261,951 | |
WP Carey, Inc., 3.85%, 07/15/29 | | | 475 | | | | 522,982 | |
| | | | | | | | |
| | |
| | | | | | | 55,863,272 | |
| | | | | | | | |
| | |
Total Corporate Bonds — 25.3%
(Cost: $4,258,693,846) | | | | | | | 4,430,279,031 | |
| | | | | | | | |
| | |
Foreign Agency Obligations | | | | | | | | |
| | |
Canada — 0.3% | | | | | | | | |
Canada Government International Bond, 1.63%, 01/22/25 | | | 2,000 | | | | 2,032,511 | |
Export Development Canada, 2.50%, 01/24/23 | | | 2,000 | | | | 2,041,764 | |
Province of Alberta Canada | | | | | | | | |
1.88%, 11/13/24 | | | 1,000 | | | | 1,022,485 | |
1.00%, 05/20/25(a) | | | 3,000 | | | | 2,973,109 | |
3.30%, 03/15/28 | | | 2,000 | | | | 2,190,880 | |
1.30%, 07/22/30 | | | 2,000 | | | | 1,905,187 | |
Province of British Columbia Canada | | | | | | | | |
2.25%, 06/02/26 | | | 1,000 | | | | 1,039,542 | |
0.90%, 07/20/26 | | | 2,000 | | | | 1,957,166 | |
Province of New Brunswick Canada, 3.63%, 02/24/28 | | | 1,000 | | | | 1,119,011 | |
Province of Ontario Canada 1.75%, 01/24/23 | | | 5,000 | | | | 5,060,547 | |
| | |
| 66 | | 2 0 2 1 BLACK ROCK ANNUAL REPORT TO SHAREHOLDERS |
| | |
Schedule of Investments (continued) December 31, 2021 | | U.S. Total Bond Index Master Portfolio (Percentages shown are based on Net Assets) |
| | | | | | | | |
| Security | | Par
(000) | | | Value | |
| | |
Canada (continued) | | | | | | | | |
Province of Ontario Canada (continued) | |
0.63%, 01/21/26 | | $ | 1,000 | | | $ | 971,855 | |
2.50%, 04/27/26(a) | | | 3,000 | | | | 3,137,516 | |
1.05%, 05/21/27(a) | | | 1,000 | | | | 975,377 | |
2.00%, 10/02/29 | | | 1,000 | | | | 1,015,287 | |
1.13%, 10/07/30 | | | 2,000 | | | | 1,890,290 | |
1.60%, 02/25/31 | | | 2,000 | | | | 1,956,056 | |
Province of Quebec Canada | | | | | | | | |
2.63%, 02/13/23 | | | 250 | | | | 255,766 | |
0.60%, 07/23/25(a) | | | 2,000 | | | | 1,954,382 | |
2.50%, 04/20/26(a) | | | 2,750 | | | | 2,880,924 | |
2.75%, 04/12/27 | | | 2,000 | | | | 2,122,486 | |
1.35%, 05/28/30 | | | 2,000 | | | | 1,935,143 | |
Series QO, 2.88%, 10/16/24 | | | 500 | | | | 524,597 | |
Series QW, 2.50%, 04/09/24(a) | | | 2,000 | | | | 2,071,094 | |
Series QX, 1.50%, 02/11/25 | | | 2,000 | | | | 2,025,480 | |
| | | | | | | | |
| | |
| | | | | | | 45,058,455 | |
| | |
| Chile — 0.1% | | | | | | |
Chile Government International Bond | | | | | | | | |
3.24%, 02/06/28 | | | 1,500 | | | | 1,577,156 | |
2.45%, 01/31/31(a) | | | 2,500 | | | | 2,484,062 | |
2.55%, 01/27/32 | | | 1,000 | | | | 994,875 | |
2.55%, 07/27/33 | | | 2,000 | | | | 1,944,375 | |
3.10%, 05/07/41 | | | 700 | | | | 684,381 | |
3.63%, 10/30/42 | | | 350 | | | | 369,753 | |
3.86%, 06/21/47 | | | 750 | | | | 830,063 | |
3.50%, 01/25/50 | | | 1,000 | | | | 1,037,375 | |
3.10%, 01/22/61 | | | 1,500 | | | | 1,389,656 | |
3.25%, 09/21/71 | | | 1,000 | | | | 921,188 | |
| | | | | | | | |
| | |
| | | | | | | 12,232,884 | |
| | |
| Germany — 0.0% | | | | | | |
FMS Wertmanagement, 2.75%, 03/06/23 | | | 500 | | | | 512,502 | |
Landwirtschaftliche Rentenbank, 1.75%, 07/27/26 | | | 1,000 | | | | 1,017,306 | |
| | | | | | | | |
| | |
| | | | | | | 1,529,808 | |
| | |
| Hungary — 0.0% | | | | | | |
Hungary Government International Bond | | | | | | | | |
5.38%, 02/21/23 | | | 2,500 | | | | 2,622,702 | |
5.75%, 11/22/23(a) | | | 500 | | | | 541,880 | |
5.38%, 03/25/24 | | | 1,500 | | | | 1,627,438 | |
7.63%, 03/29/41 | | | 750 | | | | 1,227,187 | |
| | | | | | | | |
| | |
| | | | | | | 6,019,207 | |
| | |
| Indonesia — 0.1% | | | | | | |
Indonesia Government International Bond | | | | | | | | |
3.50%, 01/11/28 | | | 2,000 | | | | 2,153,500 | |
4.10%, 04/24/28(a) | | | 1,000 | | | | 1,115,187 | |
4.75%, 02/11/29(a) | | | 1,000 | | | | 1,163,750 | |
2.85%, 02/14/30(a) | | | 2,000 | | | | 2,081,625 | |
3.85%, 10/15/30(a) | | | 2,000 | | | | 2,243,500 | |
4.35%, 01/11/48 | | | 1,400 | | | | 1,597,750 | |
3.70%, 10/30/49 | | | 500 | | | | 528,750 | |
3.50%, 02/14/50 | | | 1,000 | | | | 1,032,063 | |
4.20%, 10/15/50 | | | 1,000 | | | | 1,138,750 | |
3.05%, 03/12/51(a) | | | 1,000 | | | | 988,750 | |
| | | | | | | | |
| Security | | Par
(000) | | | Value | |
| | |
Indonesia (continued) | | | | | | | | |
Indonesia Government International Bond (continued) | | | | | |
3.20%, 09/23/61 | | $ | 1,000 | | | $ | 958,750 | |
4.45%, 04/15/70 | | | 600 | | | | 711,750 | |
| | | | | | | | |
| | |
| | | | | | | 15,714,125 | |
| | |
| Israel — 0.1% | | | | | | |
Israel Government International Bond | | | | | | | | |
3.15%, 06/30/23 | | | 3,000 | | | | 3,105,562 | |
2.88%, 03/16/26(a) | | | 750 | | | | 794,203 | |
3.25%, 01/17/28(a) | | | 1,500 | | | | 1,626,844 | |
2.75%, 07/03/30 | | | 2,400 | | | | 2,549,250 | |
4.50%, 01/30/43 | | | 1,200 | | | | 1,531,725 | |
4.13%, 01/17/48 | | | 1,000 | | | | 1,225,812 | |
3.88%, 07/03/50(a) | | | 1,000 | | | | 1,166,438 | |
4.50%, 04/03/2120 | | | 600 | | | | 763,500 | |
State of Israel | | | | | | | | |
2.50%, 01/15/30(a) | | | 2,000 | | | | 2,081,875 | |
3.38%, 01/15/50 | | | 1,000 | | | | 1,080,500 | |
| | | | | | | | |
| | |
| | | | | | | 15,925,709 | |
| | |
| Italy — 0.1% | | | | | | |
Republic of Italy Government International Bond | | | | | | | | |
6.88%, 09/27/23 | | | 100 | | | | 109,753 | |
2.38%, 10/17/24 | | | 3,500 | | | | 3,585,423 | |
1.25%, 02/17/26 | | | 3,000 | | | | 2,921,299 | |
2.88%, 10/17/29 | | | 2,500 | | | | 2,553,568 | |
5.38%, 06/15/33 | | | 750 | | | | 922,945 | |
4.00%, 10/17/49 | | | 1,500 | | | | 1,645,346 | |
3.88%, 05/06/51 | | | 1,000 | | | | 1,068,024 | |
| | | | | | | | |
| | |
| | | | | | | 12,806,358 | |
| | |
| Japan — 0.2% | | | | | | |
Japan Bank for International Cooperation | | | | | | | | |
1.75%, 01/23/23 | | | 2,000 | | | | 2,023,081 | |
3.25%, 07/20/23 | | | 1,100 | | | | 1,142,459 | |
0.38%, 09/15/23 | | | 5,000 | | | | 4,960,207 | |
3.38%, 10/31/23 | | | 500 | | | | 523,131 | |
0.63%, 07/15/25 | | | 2,000 | | | | 1,954,697 | |
2.88%, 06/01/27 | | | 1,000 | | | | 1,064,223 | |
2.75%, 11/16/27 | | | 500 | | | | 529,919 | |
3.25%, 07/20/28 | | | 2,000 | | | | 2,202,200 | |
2.00%, 10/17/29(a) | | | 1,000 | | | | 1,020,541 | |
1.25%, 01/21/31 | | | 2,000 | | | | 1,915,747 | |
1.88%, 04/15/31 | | | 3,000 | | | | 3,030,143 | |
Series DTC, 3.38%, 07/31/23 | | | 500 | | | | 520,582 | |
Series DTC, 2.50%, 05/23/24 | | | 500 | | | | 517,715 | |
Series DTC, 2.50%, 05/28/25 | | | 3,000 | | | | 3,123,825 | |
Series DTC, 2.38%, 04/20/26 | | | 750 | | | | 778,923 | |
Series DTC, 2.25%, 11/04/26 | | | 500 | | | | 516,593 | |
| | | | | | | | |
| | |
| | | | | | | 25,823,986 | |
| | |
| Mexico — 0.2% | | | | | | |
Mexico Government International Bond | | | | | | | | |
4.00%, 10/02/23 | | | 210 | | | | 221,458 | |
3.60%, 01/30/25 | | | 2,000 | | | | 2,122,875 | |
4.13%, 01/21/26 | | | 3,000 | | | | 3,294,562 | |
4.15%, 03/28/27 | | | 1,000 | | | | 1,105,500 | |
3.75%, 01/11/28 | | | 1,000 | | | | 1,075,500 | |
4.50%, 04/22/29 | | | 1,500 | | | | 1,673,719 | |
| | |
MASTER PORTFOLIO SCHEDULE OF INVESTMENTS | | 67 |
| | |
Schedule of Investments (continued) December 31, 2021 | | U.S. Total Bond Index Master Portfolio (Percentages shown are based on Net Assets) |
| | | | | | | | |
| Security | | Par
(000) | | | Value | |
| | |
Mexico (continued) | | | | | | | | |
Mexico Government International Bond (continued) | | | | | | | | |
3.25%, 04/16/30(a) | | $ | 3,000 | | | $ | 3,081,188 | |
2.66%, 05/24/31(a) | | | 2,000 | | | | 1,949,125 | |
4.75%, 04/27/32 | | | 3,000 | | | | 3,390,562 | |
6.75%, 09/27/34 | | | 150 | | | | 199,575 | |
6.05%, 01/11/40 | | | 2,300 | | | | 2,857,463 | |
4.28%, 08/14/41 | | | 3,000 | | | | 3,111,187 | |
4.75%, 03/08/44 | | | 2,200 | | | | 2,394,288 | |
5.55%, 01/21/45(a) | | | 1,525 | | | | 1,826,473 | |
4.60%, 01/23/46 | | | 1,500 | | | | 1,604,344 | |
4.35%, 01/15/47 | | | 1,750 | | | | 1,812,125 | |
4.60%, 02/10/48(a) | | | 2,000 | | | | 2,129,750 | |
4.50%, 01/31/50 | | | 1,950 | | | | 2,069,803 | |
5.00%, 04/27/51(a) | | | 2,000 | | | | 2,277,250 | |
3.77%, 05/24/61 | | | 2,000 | | | | 1,843,500 | |
5.75%, 10/12/2110 | | | 500 | | | | 574,781 | |
| | | | | | | | |
| | |
| | | | | | | 40,615,028 | |
| | |
| Panama — 0.1% | | | | | | |
Panama Government International Bond | | | | | | | | |
3.75%, 03/16/25 | | | 3,500 | | | | 3,703,000 | |
3.88%, 03/17/28 | | | 2,500 | | | | 2,703,594 | |
3.16%, 01/23/30 | | | 1,000 | | | | 1,036,125 | |
2.25%, 09/29/32 | | | 2,000 | | | | 1,904,125 | |
6.70%, 01/26/36 | | | 350 | | | | 468,847 | |
4.50%, 05/15/47 | | | 750 | | | | 826,781 | |
4.50%, 04/16/50(a) | | | 1,250 | | | | 1,376,016 | |
4.30%, 04/29/53 | | | 1,000 | | | | 1,073,937 | |
4.50%, 04/01/56 | | | 2,400 | | | | 2,645,700 | |
3.87%, 07/23/60(a) | | | 2,500 | | | | 2,494,219 | |
| | | | | | | | |
| | |
| | | | | | | 18,232,344 | |
| | |
| Peru — 0.1% | | | | | | |
Peruvian Government International Bond | | | | | | | | |
7.35%, 07/21/25 | | | 1,400 | | | | 1,664,950 | |
2.39%, 01/23/26 | | | 2,000 | | | | 2,024,750 | |
4.13%, 08/25/27 | | | 1,000 | | | | 1,096,438 | |
2.84%, 06/20/30(a) | | | 1,800 | | | | 1,827,337 | |
2.78%, 01/23/31 | | | 2,000 | | | | 1,986,000 | |
1.86%, 12/01/32 | | | 1,750 | | | | 1,597,203 | |
8.75%, 11/21/33 | | | 441 | | | | 685,562 | |
3.00%, 01/15/34 | | | 775 | | | | 771,125 | |
6.55%, 03/14/37 | | | 250 | | | | 339,891 | |
3.30%, 03/11/41 | | | 2,000 | | | | 1,996,875 | |
5.63%, 11/18/50(a) | | | 1,400 | | | | 1,966,387 | |
3.55%, 03/10/51 | | | 1,600 | | | | 1,664,300 | |
2.78%, 12/01/60(a) | | | 1,250 | | | | 1,097,891 | |
3.23%, 07/28/2121 | | | 500 | | | | 430,094 | |
| | | | | | | | |
| | |
| | | | | | | 19,148,803 | |
| | |
| Philippines — 0.1% | | | | | | |
Philippine Government International Bond | | | | | | | | |
4.20%, 01/21/24 | | | 2,500 | | | | 2,656,250 | |
3.00%, 02/01/28 | | | 1,000 | | | | 1,071,530 | |
3.75%, 01/14/29 | | | 3,000 | | | | 3,378,375 | |
2.46%, 05/05/30 | | | 2,000 | | | | 2,061,875 | |
7.75%, 01/14/31 | | | 1,500 | | | | 2,182,782 | |
1.65%, 06/10/31 | | | 1,000 | | | | 967,500 | |
6.38%, 10/23/34 | | | 250 | | | | 347,000 | |
5.00%, 01/13/37 | | | 1,000 | | | | 1,237,375 | |
3.95%, 01/20/40 | | | 250 | | | | 278,406 | |
3.70%, 03/01/41 | | | 1,100 | | | | 1,196,456 | |
| | | | | | | | |
| Security | | Par
(000) | | | Value | |
| | |
Philippines (continued) | | | | | | | | |
Philippine Government International Bond (continued) | | | | | | | | |
3.70%, 02/02/42 | | $ | 2,000 | | | $ | 2,179,750 | |
2.95%, 05/05/45 | | | 1,000 | | | | 985,500 | |
2.65%, 12/10/45 | | | 2,000 | | | | 1,890,375 | |
3.20%, 07/06/46 | | | 2,000 | | | | 2,035,000 | |
| | | | | | | | |
| | |
| | | | | | | 22,468,174 | |
| | |
| Poland — 0.0% | | | | | | |
Republic of Poland Government International Bond | | | | | | | | |
3.00%, 03/17/23 | | | 200 | | | | 205,297 | |
4.00%, 01/22/24 | | | 2,250 | | | | 2,381,454 | |
3.25%, 04/06/26 | | | 1,250 | | | | 1,336,428 | |
| | | | | | | | |
| | |
| | | | | | | 3,923,179 | |
| | |
| South Korea — 0.1% | | | | | | |
Export-Import Bank of Korea | | | | | | | | |
2.38%, 06/25/24 | | | 1,000 | | | | 1,031,700 | |
2.88%, 01/21/25(a) | | | 1,000 | | | | 1,046,125 | |
1.88%, 02/12/25 | | | 1,000 | | | | 1,017,600 | |
3.25%, 11/10/25 | | | 500 | | | | 534,625 | |
2.63%, 05/26/26 | | | 1,000 | | | | 1,047,687 | |
3.25%, 08/12/26 | | | 500 | | | | 539,312 | |
2.50%, 06/29/41 | | | 1,000 | | | | 1,009,300 | |
Korea Development Bank | | | | | | | | |
3.38%, 03/12/23 | | | 4,000 | | | | 4,119,080 | |
2.75%, 03/19/23(a) | | | 1,000 | | | | 1,023,000 | |
0.50%, 10/27/23(a) | | | 2,000 | | | | 1,987,020 | |
Korea International Bond(a) | | | | | | | | |
4.13%, 06/10/44 | | | 250 | | | | 324,878 | |
3.88%, 09/20/48 | | | 1,750 | | | | 2,255,094 | |
| | | | | | | | |
| | |
| | | | | | | 15,935,421 | |
| | |
| Supranational — 1.3% | | | | | | |
African Development Bank | | | | | | | | |
3.00%, 09/20/23 | | | 5,000 | | | | 5,192,216 | |
0.88%, 03/23/26 | | | 2,000 | | | | 1,967,158 | |
Asian Development Bank | | | | | | | | |
2.75%, 03/17/23(a) | | | 3,750 | | | | 3,848,262 | |
0.25%, 07/14/23 | | | 4,000 | | | | 3,975,008 | |
0.25%, 10/06/23 | | | 1,000 | | | | 991,589 | |
2.63%, 01/30/24(a) | | | 3,000 | | | | 3,113,842 | |
0.38%, 06/11/24 | | | 3,000 | | | | 2,963,340 | |
1.50%, 10/18/24(a) | | | 3,000 | | | | 3,041,192 | |
0.63%, 04/29/25(a) | | | 5,000 | | | | 4,922,616 | |
0.50%, 02/04/26 | | | 2,000 | | | | 1,943,014 | |
1.00%, 04/14/26 | | | 2,000 | | | | 1,976,710 | |
2.00%, 04/24/26 | | | 1,000 | | | | 1,030,350 | |
2.63%, 01/12/27(a) | | | 1,000 | | | | 1,060,329 | |
2.50%, 11/02/27(a) | | | 2,000 | | | | 2,119,532 | |
2.75%, 01/19/28 | | | 750 | | | | 806,171 | |
5.82%, 06/16/28 | | | 3,000 | | | | 3,814,202 | |
1.75%, 09/19/29(a) | | | 2,000 | | | | 2,028,586 | |
1.88%, 01/24/30 | | | 3,000 | | | | 3,074,262 | |
Asian Infrastructure Investment Bank | | | | | | | | |
2.25%, 05/16/24 | | | 10,000 | | | | 10,314,456 | |
0.50%, 10/30/24(a) | | | 3,795 | | | | 3,745,058 | |
Council Of Europe Development Bank, 0.25%, 10/20/23 | | | 3,000 | | | | 2,971,035 | |
European Bank for Reconstruction & Development | | | | | | | | |
2.75%, 03/07/23 | | | 2,000 | | | | 2,050,620 | |
| | |
| 68 | | 2 0 2 1 BLACK ROCK ANNUAL REPORT TO SHAREHOLDERS |
| | |
Schedule of Investments (continued) December 31, 2021 | | U.S. Total Bond Index Master Portfolio (Percentages shown are based on Net Assets) |
| | | | | | | | |
| Security | | Par
(000) | | | Value | |
| | |
Supranational (continued) | | | | | | | | |
European Bank for Reconstruction & Development (continued) | | | | | | | | |
0.25%, 07/10/23 | �� | $ | 4,000 | | | $ | 3,974,505 | |
1.50%, 02/13/25 | | | 1,000 | | | | 1,012,507 | |
0.50%, 05/19/25 | | | 2,000 | | | | 1,955,866 | |
European Investment Bank | | | | | | | | |
2.50%, 03/15/23 | | | 2,000 | | | | 2,046,427 | |
1.38%, 05/15/23 | | | 1,000 | | | | 1,010,297 | |
2.88%, 08/15/23 | | | 1,500 | | | | 1,552,493 | |
0.25%, 09/15/23 | | | 3,000 | | | | 2,975,778 | |
3.13%, 12/14/23 | | | 4,000 | | | | 4,181,125 | |
3.25%, 01/29/24 | | | 3,000 | | | | 3,149,208 | |
2.63%, 03/15/24 | | | 2,000 | | | | 2,078,577 | |
1.88%, 02/10/25 | | | 5,000 | | | | 5,129,131 | |
1.63%, 03/14/25 | | | 4,000 | | | | 4,062,085 | |
0.63%, 07/25/25 | | | 2,000 | | | | 1,961,908 | |
0.38%, 12/15/25(a) | | | 5,000 | | | | 4,832,923 | |
2.13%, 04/13/26 | | | 1,000 | | | | 1,035,956 | |
0.75%, 10/26/26(a) | | | 1,445 | | | | 1,406,082 | |
2.38%, 05/24/27 | | | 3,500 | | | | 3,672,105 | |
1.63%, 10/09/29 | | | 750 | | | | 752,580 | |
0.88%, 05/17/30 | | | 5,000 | | | | 4,744,205 | |
Inter-American Development Bank | | | | | | | | |
0.50%, 05/24/23 | | | 3,000 | | | | 2,996,768 | |
0.25%, 11/15/23 | | | 3,000 | | | | 2,973,041 | |
2.63%, 01/16/24 | | | 5,000 | | | | 5,186,400 | |
3.00%, 02/21/24(a) | | | 5,000 | | | | 5,234,088 | |
2.13%, 01/15/25(a) | | | 1,000 | | | | 1,032,482 | |
1.75%, 03/14/25 | | | 3,000 | | | | 3,060,646 | |
0.88%, 04/03/25 | | | 3,000 | | | | 2,977,532 | |
0.63%, 07/15/25 | | | 5,000 | | | | 4,905,438 | |
0.88%, 04/20/26 | | | 3,000 | | | | 2,952,255 | |
2.00%, 06/02/26(a) | | | 500 | | | | 515,511 | |
2.38%, 07/07/27(a) | | | 1,000 | | | | 1,049,292 | |
1.13%, 07/20/28 | | | 3,000 | | | | 2,931,982 | |
2.25%, 06/18/29 | | | 4,500 | | | | 4,728,568 | |
3.20%, 08/07/42(a) | | | 750 | | | | 869,895 | |
4.38%, 01/24/44 | | | 300 | | | | 414,422 | |
International Bank for Reconstruction & Development | | | | | | | | |
7.63%, 01/19/23(a) | | | 1,000 | | | | 1,074,017 | |
1.75%, 04/19/23 | | | 1,000 | | | | 1,014,935 | |
0.13%, 04/20/23 | | | 4,000 | | | | 3,975,028 | |
3.00%, 09/27/23 | | | 4,000 | | | | 4,156,694 | |
2.50%, 03/19/24(a) | | | 3,000 | | | | 3,108,712 | |
1.63%, 01/15/25(a) | | | 3,000 | | | | 3,051,169 | |
0.75%, 03/11/25 | | | 5,000 | | | | 4,946,971 | |
0.63%, 04/22/25 | | | 5,000 | | | | 4,916,220 | |
0.38%, 07/28/25(a) | | | 3,000 | | | | 2,916,733 | |
0.50%, 10/28/25 | | | 2,000 | | | | 1,948,168 | |
1.38%, 04/20/28 | | | 1,000 | | | | 997,132 | |
1.13%, 09/13/28 | | | 5,000 | | | | 4,879,296 | |
1.25%, 02/10/31 | | | 5,000 | | | | 4,858,786 | |
4.75%, 02/15/35(a) | | | 500 | | | | 667,023 | |
Series GDIF, 1.88%, 06/19/23 | | | 5,000 | | | | 5,090,362 | |
Series GDIF, 1.50%, 08/28/24(a) | | | 4,000 | | | | 4,057,423 | |
Series GDIF, 2.50%, 11/25/24 | | | 3,000 | | | | 3,127,399 | |
Series GDIF, 2.50%, 07/29/25 | | | 1,000 | | | | 1,047,133 | |
Series GDIF, 1.88%, 10/27/26(a) | | | 750 | | | | 768,680 | |
Series GDIF, 2.50%, 11/22/27 | | | 2,000 | | | | 2,112,577 | |
| | | | | | | | |
| Security | | Par
(000) | | | Value | |
| | |
Supranational (continued) | | | | | | | | |
International Bank for Reconstruction & Development (continued) | | | | | | | | |
Series GDIF, 1.75%, 10/23/29(a) | | $ | 3,000 | | | $ | 3,042,819 | |
International Finance Corp. | | | | | | | | |
2.88%, 07/31/23 | | | 750 | | | | 775,474 | |
0.38%, 07/16/25 | | | 2,000 | | | | 1,946,000 | |
0.75%, 10/08/26 | | | 2,000 | | | | 1,947,171 | |
0.75%, 08/27/30(a) | | | 2,000 | | | | 1,872,801 | |
Nordic Investment Bank, 0.38%, 05/19/23 | | | 3,000 | | | | 2,989,124 | |
| | | | | | | | |
| | |
| | | | | | | 231,599,473 | |
| | |
| Sweden — 0.0% | | | | | | |
Svensk Exportkredit AB | | | | | | | | |
2.88%, 03/14/23. | | | 1,000 | | | | 1,026,633 | |
0.75%, 04/06/23 | | | 2,000 | | | | 2,003,102 | |
1.75%, 12/12/23 | | | 1,000 | | | | 1,016,404 | |
0.63%, 05/14/25 | | | 2,000 | | | | 1,961,043 | |
0.50%, 08/26/25 | | | 2,000 | | | | 1,949,422 | |
| | | | | | | | |
| | |
| | | | | | | 7,956,604 | |
| | |
| Uruguay — 0.1% | | | | | | |
Uruguay Government International Bond | | | | | | | | |
4.50%, 08/14/24(a) | | | 1,250 | | | | 1,324,844 | |
4.38%, 10/27/27 | | | 1,000 | | | | 1,119,875 | |
4.38%, 01/23/31 | | | 2,500 | | | | 2,877,813 | |
5.10%, 06/18/50 | | | 2,250 | | | | 2,979,562 | |
4.98%, 04/20/55 | | | 2,200 | | | | 2,881,037 | |
| | | | | | | | |
| | |
| | | | | | | 11,183,131 | |
| | | | | | | | |
| |
Total Foreign Agency Obligations — 2.9%
(Cost: $500,473,543) | | | | 506,172,689 | |
| | | | | | | | |
| | |
Municipal Bonds | | | | | | | | |
| | |
Alabama — 0.0% | | | | | | | | |
Alabama Federal Aid Highway Finance Authority Refunding RB, 2.65%, 09/01/37 | | | 30 | | | | 30,292 | |
| | | | | | | | |
| | |
Arizona — 0.0% | | | | | | | | |
Salt River Project Agricultural Improvement & Power District, RB, BAB, 4.84%, 01/01/41 | | | 220 | | | | 288,382 | |
| | | | | | | | |
| | |
California — 0.2% | | | | | | | | |
Bay Area Toll Authority Refunding RB, 3.13%, 04/01/55 | | | 95 | | | | 95,185 | |
Bay Area Toll Authority, RB, BAB | | | | | | | | |
Series F-2, 6.26%, 04/01/49 | | | 750 | | | | 1,214,050 | |
Series S-1, 6.92%, 04/01/40 | | | 620 | | | | 929,976 | |
Series S-1, 7.04%, 04/01/50(a) | | | 100 | | | | 175,048 | |
Series S-3, 6.91%, 10/01/50 | | | 660 | | | | 1,166,496 | |
Bay Area Toll Authority, Refunding RB, 2.57%, 04/01/31 | | | 345 | | | | 358,984 | |
California State University, RB, Series E, 2.90%, 11/01/51 | | | 200 | | | | 200,512 | |
California State University, Refunding RB | | | | | | | | |
Series B, 2.98%, 11/01/51 | | | 1,015 | | | | 1,032,565 | |
Series B, 2.72%, 11/01/52 | | | 105 | | | | 105,801 | |
City of San Francisco California Public Utilities Commission Water Revenue, RB, BAB, 6.95%, 11/01/50 | | | 100 | | | | 166,322 | |
City of San Francisco California Public Utilities Commission Water Revenue, Refunding RB | | | | | | | | |
Series A, 3.30%, 11/01/39 | | | 115 | | | | 119,037 | |
| | |
MASTER PORTFOLIO SCHEDULE OF INVESTMENTS | | 69 |
| | |
Schedule of Investments (continued) December 31, 2021 | | U.S. Total Bond Index Master Portfolio (Percentages shown are based on Net Assets) |
| | | | | | | | |
| Security | | Par
(000) | | | Value | |
| | |
California (continued) | | | | | | | | |
City of San Francisco California Public Utilities Commission Water Revenue, Refunding RB (continued) | | | | | | | | |
Series E, 2.83%, 11/01/41 | | $ | 490 | | | $ | 482,767 | |
East Bay Municipal Utility District Water System Revenue, RB, BAB, 5.87%, 06/01/40 | | | 100 | | | | 142,872 | |
Foothill-Eastern Transportation Corridor Agency, Refunding RB | | | | | | | | |
Series A, 4.09%, 01/15/49 | | | 275 | | | | 293,111 | |
Series A, (AGM), 3.92%, 01/15/53 | | | 175 | | | | 185,998 | |
Golden State Tobacco Securitization Corp. | | | | | | | | |
(SAP), 2.75%, 06/01/34 | | | 60 | | | | 59,773 | |
(SAP), 3.00%, 06/01/46 | | | 165 | | | | 168,537 | |
Golden State Tobacco Securitization Corp. Refunding RB | | | | | | | | |
3.71%, 06/01/41 | | | 290 | | | | 289,649 | |
3.85%, 06/01/50 | | | 85 | | | | 86,682 | |
4.21%, 06/01/50 | | | 290 | | | | 290,397 | |
Golden State Tobacco Securitization Corp., Refunding RB, (SAP), 3.29%, 06/01/42 | | | 70 | | | | 71,357 | |
Los Angeles Community College District, GO, BAB, 6.75%, 08/01/49 | | | 540 | | | | 932,631 | |
Los Angeles Community College District, Refunding GO, 2.11%, 08/01/32 | | | 665 | | | | 663,653 | |
Los Angeles County Metropolitan Transportation Authority, RB, BAB, 5.74%, 06/01/39 | | | 100 | | | | 134,495 | |
Los Angeles County Public Works Financing Authority, Refunding RB, BAB, 7.62%, 08/01/40 | | | 100 | | | | 160,380 | |
Los Angeles Department of Water & Power Power System Revenue, RB, BAB | | | | | | | | |
5.72%, 07/01/39 | | | 200 | | | | 275,949 | |
6.57%, 07/01/45 | | | 675 | | | | 1,097,495 | |
6.60%, 07/01/50 | | | 90 | | | | 154,706 | |
Los Angeles Unified School District, GO, BAB | | | | | | | | |
5.76%, 07/01/29 | | | 300 | | | | 361,684 | |
5.75%, 07/01/34 | | | 850 | | | | 1,106,604 | |
Series RY, 6.76%, 07/01/34 | | | 950 | | | | 1,322,398 | |
Regents of the University of California Medical Center Pooled Revenue, RB | | | | | | | | |
Series N, 3.26%, 05/15/60(a) | | | 365 | | | | 398,307 | |
Series N, 3.71%, 05/15/2120 | | | 500 | | | | 553,723 | |
Regents of the University of California Medical Center Pooled Revenue, RB, BAB, Series H, 6.55%, 05/15/48 | | | 120 | | | | 186,456 | |
Regents of the University of California Medical Center Pooled Revenue, Refunding RB, BAB, Series F, 6.58%, 05/15/49(a) | | | 600 | | | | 914,075 | |
Sales Tax Securitization Corp. Refunding RB, 3.24%, 01/01/42 | | | 260 | | | | 260,917 | |
San Diego County Regional Transportation Commission, RB, BAB, 5.91%, 04/01/48 | | | 260 | | | | 396,557 | |
San Diego County Regional Transportation Commission, Refunding RB, Series A, 3.25%, 04/01/48 | | | 175 | | | | 178,164 | |
San Diego County Water Authority, RB, BAB, Series B, 6.14%, 05/01/49 | | | 315 | | | | 473,241 | |
San Joaquin Hills Transportation Corridor Agency Refunding RB, (AGM), 3.49%, 01/15/50 | | | 300 | | | | 304,223 | |
| | | | | | | | |
| Security | | Par
(000) | | | Value | |
| | |
California (continued) | | | | | | | | |
Santa Clara Valley Transportation Authority, RB, BAB, 5.88%, 04/01/32 | | $ | 600 | | | $ | 720,076 | |
State of California Department of Water Resources Power Supply Revenue, Refunding RB, Series P, 2.00%, 05/01/22(e) | | | 250 | | | | 251,399 | |
State of California, GO, Series A, 2.37%, 04/01/22 | | | 500 | | | | 502,716 | |
State of California, GO, BAB | | | | | | | | |
7.50%, 04/01/34 | | | 645 | | | | 994,633 | |
7.55%, 04/01/39 | | | 2,375 | | | | 3,963,200 | |
7.30%, 10/01/39 | | | 600 | | | | 946,304 | |
7.35%, 11/01/39 | | | 1,550 | | | | 2,456,404 | |
7.60%, 11/01/40(a) | | | 1,850 | | | | 3,179,367 | |
State of California, Refunding GO | | | | | | | | |
3.38%, 04/01/25 | | | 100 | | | | 107,278 | |
3.50%, 04/01/28 | | | 355 | | | | 393,118 | |
2.50%, 10/01/29 | | | 1,250 | | | | 1,310,180 | |
4.50%, 04/01/33 | | | 200 | | | | 230,430 | |
4.60%, 04/01/38 | | | 165 | | | | 189,528 | |
University of California, RB | | | | | | | | |
Series AD, 4.86%, 05/15/2112(a) | | | 300 | | | | 435,989 | |
Series AQ, 4.77%, 05/15/2115 | | | 405 | | | | 577,577 | |
Series BD, 3.35%, 07/01/29 | | | 570 | | | | 625,916 | |
Series BG, 0.88%, 05/15/25 | | | 240 | | | | 237,546 | |
Series BG, 1.61%, 05/15/30 | | | 1,000 | | | | 969,132 | |
University of California, RB, BAB | | | | | | | | |
5.77%, 05/15/43 | | | 190 | | | | 261,109 | |
5.95%, 05/15/45(a) | | | 500 | | | | 703,876 | |
University of California, Refunding RB | | | | | | | | |
Series AJ, 4.60%, 05/15/31 | | | 150 | | | | 172,732 | |
Series AX, 3.06%, 07/01/25 | | | 100 | | | | 106,303 | |
| | | | | | | | |
| | |
| | | | | | | 36,845,590 | |
| | |
| Colorado — 0.0% | | | | | | |
Regional Transportation District Sales Tax Revenue, RB, BAB, Series B, 5.84%, 11/01/50 | | | 100 | | | | 158,138 | |
| | | | | | | | |
| | |
Connecticut — 0.0% | | | | | | | | |
State of Connecticut, GO, Series A, 5.85%, 03/15/32(a) | | | 600 | | | | 779,483 | |
State of Connecticut, GO, BAB, Series D, 5.09%, 10/01/30 | | | 150 | | | | 173,304 | |
| | | | | | | | |
| | |
| | | | | | | 952,787 | |
| | |
| District of Columbia — 0.0% | | | | | | |
District of Columbia Water & Sewer Authority, RB, Series A, Senior Lien, 4.81%, 10/01/2114(a) | | | 200 | | | | 296,556 | |
District of Columbia Water & Sewer Authority, Refunding RB, Series D, Subordinate Lien, 3.21%, 10/01/48 | | | 160 | | | | 166,105 | |
District of Columbia, RB, BAB, Series E, 5.59%, 12/01/34 | | | 200 | | | | 254,981 | |
Metropolitan Washington Airports Authority Dulles Toll Road Revenue, RB, BAB, 7.46%, 10/01/46 | | | 100 | | | | 176,390 | |
| | | | | | | | |
| | |
| | | | | | | 894,032 | |
| | |
| Florida — 0.0% | | | | | | |
County of Miami-Dade Florida Aviation Revenue, Refunding RB, Series C, 4.28%, 10/01/41 | | | 665 | | | | 731,430 | |
County of Miami-Dade Florida Transit System, Refunding RB, Series B, 2.60%, 07/01/42 | | | 150 | | | | 149,401 | |
| | |
| 70 | | 2 0 2 1 BLACK ROCK ANNUAL REPORT TO SHAREHOLDERS |
| | |
Schedule of Investments (continued) December 31, 2021 | | U.S. Total Bond Index Master Portfolio (Percentages shown are based on Net Assets) |
| | | | | | | | |
| Security | | Par
(000) | | | Value | |
| | |
Florida (continued) | | | | | | | | |
County of Miami-Dade Florida Water & Sewer System Revenue, Refunding RB, Series C, 3.49%, 10/01/42 | | $ | 70 | | | $ | 73,530 | |
State Board of Administration Finance Corp., RB | | | | | | | | |
Series A, 1.26%, 07/01/25 | | | 735 | | | | 730,696 | |
Series A, 1.71%, 07/01/27 | | | 450 | | | | 447,887 | |
Series A, 2.15%, 07/01/30 | | | 960 | | | | 959,777 | |
| | | | | | | | |
| | |
| | | | | | | 3,092,721 | |
| | |
| Georgia — 0.0% | | | | | | |
City of Atlanta Georgia Water & Wastewater Revenue, Refunding RB, 2.26%, 11/01/35 | | | 230 | | | | 229,428 | |
Municipal Electric Authority of Georgia, Refunding RB, BAB | | | | | | | | |
6.64%, 04/01/57 | | | 633 | | | | 971,616 | |
6.66%, 04/01/57 | | | 705 | | | | 1,096,110 | |
| | | | | | | | |
| | |
| | | | | | | 2,297,154 | |
| | |
| Idaho — 0.0% | | | | | | |
Idaho Energy Res. Authority RB, 2.86%, 09/01/46 | | | 110 | | | | 112,367 | |
| | | | | | | | |
| | |
Illinois — 0.1% | | | | | | | | |
Chicago O’Hare International Airport, ARB | | | | | | | | |
Series C, Senior Lien, 4.47%, 01/01/49 | | | 165 | | | | 216,706 | |
Series C, Senior Lien, 4.57%, 01/01/54 | | | 165 | | | | 229,261 | |
Chicago O’Hare International Airport, Refunding ARB, BAB, Series B, 6.40%, 01/01/40 | | | 250 | | | | 373,869 | |
Chicago Transit Authority Sales & Transfer Tax Receipts Revenue, RB, Series A, 6.90%, 12/01/40(a) | | | 530 | | | | 746,463 | |
Chicago Transit Authority Sales Tax Receipts Fund, RB, BAB, Series B, 6.20%, 12/01/40 | | | 435 | | | | 601,859 | |
Illinois State Toll Highway Authority, RB, BAB, Series A, 6.18%, 01/01/34 | | | 250 | | | | 342,005 | |
Metropolitan Water Reclamation District of Greater Chicago, GO, BAB, 5.72%, 12/01/38 | | | 340 | | | | 466,230 | |
State of Illinois, GO, 5.10%, 06/01/33 | | | 5,300 | | | | 6,094,915 | |
State of Illinois, GO, BAB, 7.35%, 07/01/35 | | | 425 | | | | 532,168 | |
| | | | | | | | |
| | |
| | | | | | | 9,603,476 | |
| | |
| Indiana — 0.0% | | | | | | |
Indiana Finance Authority Refunding RB, 3.05%, 01/01/51 | | | 130 | | | | 133,700 | |
| | | | | | | | |
| | |
Kansas — 0.0% | | | | | | | | |
Kansas Development Finance Authority RB, Series K, (BAM), 2.77%, 05/01/51 | | | 145 | | | | 143,945 | |
| | | | | | | | |
| | |
| Massachusetts — 0.0% | | | | | | |
Commonwealth of Massachusetts, GO, Series H, 2.90%, 09/01/49 | | | 105 | | | | 109,575 | |
Commonwealth of Massachusetts, GO, BAB, 5.46%, 12/01/39 | | | 1,000 | | | | 1,360,215 | |
Commonwealth of Massachusetts, Refunding GO, Series D, 2.81%, 09/01/43 | | | 1,000 | | | | 1,023,488 | |
Massachusetts School Building Authority, RB, BAB, 5.72%, 08/15/39 | | | 585 | | | | 810,622 | |
Massachusetts School Building Authority, Refunding RB
Series B, 1.75%, 08/15/30 | | | 200 | | | | 198,639 | |
| | | | | | | | |
| Security | | Par
(000) | | | Value | |
| | |
Massachusetts (continued) | | | | | | | | |
Massachusetts School Building Authority,
Refunding RB (continued) | | | | | | | | |
Sub-Series B, 3.40%, 10/15/40 | | $ | 125 | | | $ | 130,753 | |
Massachusetts Water Res. Authority Refunding RB, 2.82%, 08/01/41 | | | 175 | | | | 177,597 | |
| | | | | | | | |
| | |
| | | | | | | 3,810,889 | |
| | |
| Michigan — 0.0% | | | | | | |
Great Lakes Water Authority Sewage Disposal System Revenue, Refunding RB, Series A, 3.06%, 07/01/39 | | | 30 | | | | 31,533 | |
Michigan Finance Authority, Refunding RB | | | | | | | | |
3.08%, 12/01/34 | | | 150 | | | | 159,087 | |
3.38%, 12/01/40 | | | 125 | | | | 136,761 | |
Michigan State Building Authority, Refunding RB, 2nd Series, 2.71%, 10/15/40 | | | 250 | | | | 242,153 | |
Michigan Strategic Fund, RB, 3.23%, 09/01/47 | | | 85 | | | | 86,838 | |
University of Michigan, RB, Series B, 2.44%, 04/01/40 | | | 575 | | | | 579,493 | |
| | | | | | | | |
| | |
| | | | | | | 1,235,865 | |
| | |
| Missouri — 0.0% | | | | | | |
Health & Educational Facilities Authority of the State of Missouri, RB, Series A, 3.65%, 08/15/57 | | | 440 | | | | 546,841 | |
Health & Educational Facilities Authority of the State of Missouri, Refunding RB, Class A, 3.23%, 05/15/50. | | | 250 | | | | 279,904 | |
| | | | | | | | |
| | |
| | | | | | | 826,745 | |
| | |
| Nebraska — 0.0% | | | | | | |
University of Nebraska Facilities Corp., Refunding RB, Series A, 3.04%, 10/01/49 | | | 200 | | | | 217,822 | |
| | | | | | | | |
| | |
Nevada — 0.0% | | | | | | | | |
County of Clark Department of Aviation, ARB, BAB, Series C, 6.82%, 07/01/45 | | | 450 | | | | 711,953 | |
| | | | | | | | |
| | |
New Jersey — 0.1% | | | | | | | | |
New Jersey Economic Development Authority, RB, Series A, (NPFGC), 7.43%, 02/15/29 | | | 1,450 | | | | 1,826,552 | |
New Jersey Transportation Trust Fund Authority, RB, BAB | | | | | | | | |
Series B, 6.56%, 12/15/40 | | | 100 | | | | 145,629 | |
Series C, 5.75%, 12/15/28 | | | 350 | | | | 406,611 | |
New Jersey Transportation Trust Fund Authority, Refunding RB | | | | | | | | |
4.08%, 06/15/39 | | | 200 | | | | 221,782 | |
4.13%, 06/15/42 | | | 1,055 | | | | 1,177,764 | |
New Jersey Turnpike Authority, RB, BAB | | | | | | | | |
Series A, 7.10%, 01/01/41 | | | 750 | | | | 1,184,510 | |
Series F, 7.41%, 01/01/40 | | | 900 | | | | 1,464,535 | |
Rutgers The State University of New Jersey, RB, Series P, 3.92%, 05/01/2119(a) | | | 210 | | | | 249,782 | |
Rutgers The State University of New Jersey, Refunding RB, Series R, 3.27%, 05/01/43 | | | 425 | | | | 453,635 | |
| | | | | | | | |
| | |
| | | | | | | 7,130,800 | |
| | |
| New York — 0.1% | | | | | | |
City of New York, GO, BAB | | | | | | | | |
5.52%, 10/01/37(a) | | | 500 | | | | 661,713 | |
| | |
MASTER PORTFOLIO SCHEDULE OF INVESTMENTS | | 71 |
| | |
Schedule of Investments (continued) December 31, 2021 | | U.S. Total Bond Index Master Portfolio (Percentages shown are based on Net Assets) |
| | | | | | | | |
| Security | | Par (000) | | | Value | |
| | |
| New York (continued) | | | | | | |
City of New York, GO, BAB (continued) | | | | | | | | |
Series A-2, 5.21%, 10/01/31 | | $ | 225 | | | $ | 270,501 | |
Series F-1, 6.27%, 12/01/37(a) | | | 300 | | | | 421,876 | |
Metropolitan Transportation Authority, RB, BAB | | | | | | | | |
6.67%, 11/15/39 | | | 515 | | | | 730,897 | |
7.34%, 11/15/39 | | | 500 | | | | 808,590 | |
6.81%, 11/15/40 | | | 400 | | | | 572,367 | |
Metropolitan Transportation Authority, Refunding RB, Series C-2, 5.18%, 11/15/49(a) | | | 200 | | | | 272,738 | |
New York City Transitional Finance Authority Future Tax Secured Revenue, RB, BAB | | | | | | | | |
5.77%, 08/01/36 | | | 100 | | | | 124,701 | |
5.57%, 11/01/38 | | | 645 | | | | 838,953 | |
New York City Water & Sewer System, RB, BAB, 5.95%, 06/15/42 | | | 115 | | | | 174,908 | |
New York City Water & Sewer System, Refunding RB, 5.88%, 06/15/44(a) | | | 100 | | | | 154,567 | |
New York City Water & Sewer System, Refunding RB, BAB | | | | | | | | |
5.72%, 06/15/42(a) | | | 300 | | | | 447,420 | |
6.01%, 06/15/42 | | | 600 | | | | 904,441 | |
5.44%, 06/15/43 | | | 200 | | | | 292,445 | |
New York State Dormitory Authority, RB, BAB, Series D, 5.60%, 03/15/40 | | | 750 | | | | 999,251 | |
New York State Dormitory Authority, Refunding RB | | | | | | | | |
Series B, 3.14%, 07/01/43 | | | 50 | | | | 51,697 | |
Series F, 3.11%, 02/15/39 | | | 350 | | | | 370,572 | |
New York State Thruway Authority, Refunding RB | | | | | | | | |
Series M, 2.90%, 01/01/35(a) | | | 500 | | | | 522,272 | |
Series M, 3.50%, 01/01/42 | | | 160 | | | | 165,764 | |
New York State Urban Development Corp., RB, Series B, 3.90%, 03/15/33 | | | 500 | | | | 551,061 | |
New York State Urban Development Corp., RB, BAB, 5.77%, 03/15/39 | | | 200 | | | | 241,422 | |
Port Authority of New York & New Jersey, ARB | | | | | | | | |
3.18%, 07/15/60 | | | 340 | | | | 340,315 | |
215th Series, 3.29%, 08/01/69(a) | | | 200 | | | | 211,653 | |
Consolidated, 192nd Series, 4.81%, 10/15/65(a) | | | 205 | | | | 281,345 | |
Port Authority of New York & New Jersey, RB | | | | | | | | |
159th Series, 6.04%, 12/01/29 | | | 200 | | | | 253,982 | |
181st Series, 4.96%, 08/01/46 | | | 180 | | | | 240,243 | |
182nd Series, 5.31%, 08/01/46 | | | 100 | | | | 108,541 | |
Consolidated, 165th Series, 5.65%, 11/01/40 | | | 1,245 | | | | 1,701,439 | |
Consolidated, 168th Series, 4.93%, 10/01/51 | | | 1,250 | | | | 1,746,615 | |
Series AAA, 1.09%, 07/01/23 | | | 950 | | | | 954,063 | |
Port Authority of New York & New Jersey, Refunding RB, 174th Series, 4.46%, 10/01/62 | | | 1,450 | | | | 1,927,191 | |
| | | | | | | | |
| | |
| | | | | | | 17,343,543 | |
| | |
| North Carolina — 0.0% | | | | | | |
Charlotte-Mecklenburg Hospital Authority, RB, 3.20%, 01/15/51 | | | 135 | | | | 146,244 | |
| | | | | | | | |
| | |
| Ohio — 0.0% | | | | | | |
American Municipal Power, Inc., RB, Series B, 7.83%, 02/15/41 | | | 650 | | | | 1,063,757 | |
American Municipal Power, Inc., RB, BAB, Series B, 8.08%, 02/15/50 | | | 500 | | | | 931,679 | |
| | | | | | | | |
| Security | | Par (000) | | | Value | |
| | |
| Ohio (continued) | | | | | | |
JobsOhio Beverage System, Refunding RB | | | | | | | | |
Series A, 2.83%, 01/01/38 | | $ | 500 | | | $ | 504,454 | |
Series B, 3.99%, 01/01/29 | | | 100 | | | | 109,554 | |
Series B, 4.53%, 01/01/35 | | | 350 | | | | 420,648 | |
Ohio State University, RB, Series A, 3.80%, 12/01/46 | | | 200 | | | | 240,973 | |
Ohio State University, RB, BAB, Series C, 4.91%, 06/01/40(a) | | | 805 | | | | 1,070,934 | |
Ohio Turnpike & Infrastructure Commission, Refunding RB, Series A, 3.22%, 02/15/48 | | | 250 | | | | 254,648 | |
Ohio Water Development Authority Water Pollution Control Loan Fund, RB, Series B-2, 4.88%, 12/01/34 | | | 100 | | | | 116,592 | |
| | | | | | | | |
| | |
| | | | | | | 4,713,239 | |
| | |
| Oregon — 0.0% | | | | | | |
Oregon School Boards Association, GO, Series B, (NPFGC), 5.55%, 06/30/28 | | | 375 | | | | 437,883 | |
Oregon State University, RB, (BAM), 3.42%, 03/01/60 | | | 175 | | | | 180,849 | |
State of Oregon Department of Transportation, RB, BAB, Series A, 5.83%, 11/15/34 | | | 125 | | | | 167,864 | |
State of Oregon, GO | | | | | | | | |
5.76%, 06/01/23 | | | 38 | | | | 39,606 | |
5.89%, 06/01/27 | | | 750 | | | | 879,103 | |
| | | | | | | | |
| | |
| | | | | | | 1,705,305 | |
| | |
| Pennsylvania — 0.0% | | | | | | |
City of Philadelphia PA Water & Wastewater Revenue Refunding RB, Series B, 2.93%, 07/01/45 | | | 185 | | | | 188,279 | |
Commonwealth Financing Authority, RB,
Series A, 2.99%, 06/01/42 | | | 1,265 | | | | 1,296,520 | |
Pennsylvania State University, Refunding RB | | | | | | | | |
Series D, 2.79%, 09/01/43 | | | 500 | | | | 506,103 | |
Series D, 2.84%, 09/01/50 | | | 160 | | | | 160,182 | |
University of Pittsburgh-of the Commonwealth System of Higher Education, RB, 3.56%, 09/15/2119 | | | 175 | | | | 200,867 | |
| | | | | | | | |
| | |
| | | | | | | 2,351,951 | |
| | |
| South Carolina — 0.0% | | | | | | |
South Carolina Public Service Authority, RB, BAB, Series C, 6.45%, 01/01/50 | | | 100 | | | | 158,215 | |
| | | | | | | | |
| | |
| Tennessee — 0.0% | | | | | | |
Metropolitan Government Nashville & Davidson County Health & Educational Facilities Board, RB, Series B, 4.05%, 07/01/26 | | | 350 | | | | 382,121 | |
| | | | | | | | |
| | |
| Texas — 0.1% | | | | | | |
City of San Antonio Texas Electric & Gas Systems Revenue, RB, 4.43%, 02/01/42 | | | 170 | | | | 205,747 | |
City of San Antonio Texas Electric & Gas Systems Revenue, RB, BAB | | | | | | | | |
5.72%, 02/01/41. | | | 200 | | | | 275,081 | |
5.81%, 02/01/41(a) | | | 250 | | | | 364,641 | |
City of San Antonio Texas Electric & Gas Systems Revenue, Refunding RB, 2.91%, 02/01/48 | | | 300 | | | | 301,216 | |
Dallas Area Rapid Transit Refunding RB, 2.61%, 12/01/48 | | | 260 | | | | 255,594 | |
Dallas Area Rapid Transit, RB, BAB, 5.02%, 12/01/48(a) | | | 560 | | | | 784,209 | |
| | |
| 72 | | 2 0 2 1 BLACK ROCK ANNUAL REPORT TO SHAREHOLDERS |
| | |
Schedule of Investments (continued) December 31, 2021 | | U.S. Total Bond Index Master Portfolio (Percentages shown are based on Net Assets) |
| | | | | | | | |
| Security | | Par (000) | | | Value | |
| | |
| Texas (continued) | | | | | | |
Dallas Fort Worth International Airport, Refunding RB
2.84%, 11/01/46 | | $ | 65 | | | $ | 65,096 | |
Series A, 2.99%, 11/01/38 | | | 200 | | | | 208,626 | |
Series A, 3.14%, 11/01/45 | | | 265 | | | | 280,118 | |
Series C, 2.92%, 11/01/50 | | | 380 | | | | 387,385 | |
Grand Parkway Transportation Corp., Refunding RB, Subordinate, 3.24%, 10/01/52 | | | 1,090 | | | | 1,104,327 | |
North Texas Tollway Authority, RB, BAB, Series B, 6.72%, 01/01/49 | | | 550 | | | | 924,144 | |
North Texas Tollway Authority, Refunding RB, 3.01%, 01/01/43 | | | 35 | | | | 35,658 | |
Permanent University Fund - University of Texas System, Refunding RB, Series A, 3.38%, 07/01/47 | | | 1,040 | | | | 1,191,822 | |
State of Texas, GO, BAB, 5.52%, 04/01/39 | | | 1,155 | | | | 1,631,152 | |
Texas Private Activity Bond Surface Transportation Corp., RB, Series B, 3.92%, 12/31/49 | | | 425 | | | | 475,129 | |
Texas Transportation Commission State Highway Fund, RB, Series B, 5.18%, 04/01/30 | | | 600 | | | | 720,493 | |
Texas Transportation Commission State Highway Fund, Refunding RB, 4.00%, 10/01/33 | | | 500 | | | | 600,179 | |
Texas Transportation Commission, Refunding GO, 2.47%, 10/01/44 | | | 985 | | | | 959,187 | |
| | | | | | | | |
| | |
| | | | | | | 10,769,804 | |
| | |
| Utah — 0.0% | | | | | | |
State of Utah, GO, BAB, Series B, 3.54%, 07/01/25 | | | 300 | | | | 312,674 | |
| | | | | | | | |
| | |
| Virginia — 0.0% | | | | | | |
University of Virginia, RB, Series C, 4.18%, 09/01/2117 | | | 60 | | | | 82,375 | |
University of Virginia, Refunding RB | | | | | | | | |
2.26%, 09/01/50 | | | 620 | | | | 575,001 | |
2.58%, 11/01/51 | | | 300 | | | | 303,979 | |
Series A, 3.23%, 09/01/2119(a) | | | 120 | | | | 128,145 | |
| | | | | | | | |
| | |
| | | | | | | 1,089,500 | |
| | |
| Washington — 0.0% | | | | | | |
State of Washington, GO, BAB, Series B, 5.14%, 08/01/40 | | | 200 | | | | 272,294 | |
| | | | | | | | |
| | |
| Wisconsin — 0.0% | | | | | | |
State of Wisconsin, RB, Series A, (AGM), 5.70%, 05/01/26 | | | 75 | | | | 84,518 | |
State of Wisconsin, Refunding RB | | | | | | | | |
Series A, 3.95%, 05/01/36(a) | | | 600 | | | | 658,164 | |
Series C, 3.15%, 05/01/27 | | | 320 | | | | 344,303 | |
| | | | | | | | |
| | |
| | | | | | | 1,086,985 | |
| | | | | | | | |
| | |
Total Municipal Bonds — 0.6%
(Cost: $100,120,089) | | | | | | | 108,818,533 | |
| | | | | | | | |
|
Non-Agency Mortgage-Backed Securities | |
|
| Commercial Mortgage-Backed Securities — 1.0% | |
Bank | | | | | | | | |
Series 2019-BN18, Class A4, 3.58%, 05/15/62 | | | 2,000 | | | | 2,190,967 | |
Series 2020-BN27, Class A5, 2.14%, 04/15/63 | | | 5,440 | | | | 5,432,682 | |
| | | | | | | | |
| Security | | Par (000) | | | Value | |
|
| Commercial Mortgage-Backed Securities (continued) | |
Barclays Commercial Mortgage Trust,
Series 2017-C1, Class A4, 3.67%, 02/15/50 | | $ | 2,300 | | | $ | 2,489,031 | |
BBCMS Mortgage Trust, Series 2020-C7,
Class A5, 2.04%, 04/15/53 | | | 6,670 | | | | 6,583,960 | |
BBCMS Trust, Series 2021-C10, Class A5, 2.49%, 07/15/54 | | | 9,290 | | | | 9,474,950 | |
Benchmark Mortgage Trust | | | | | | | | |
Series 2018-B5, Class A4, 4.21%, 07/15/51 | | | 3,000 | | | | 3,381,404 | |
Series 2019-B11, Class A4, 3.28%, 05/15/52 | | | 4,000 | | | | 4,278,150 | |
Series 2019-B13, Class A4, 2.95%, 08/15/57 | | | 8,544 | | | | 8,998,797 | |
Series 2019-B9, Class A5, 4.02%, 03/15/52 | | | 3,000 | | | | 3,367,682 | |
Series 2020-B19, Class B, 2.35%, 09/15/53 | | | 1,130 | | | | 1,105,954 | |
Series 2020-B21, Class A4, 1.70%, 12/17/53 | | | 3,600 | | | | 3,444,065 | |
Series 2020-B21, Class A5, 1.98%, 12/17/53 | | | 2,400 | | | | 2,353,770 | |
Series 2021-B29, Class A5, 2.39%, 09/15/54 | | | 3,330 | | | | 3,370,974 | |
Citigroup Commercial Mortgage Trust | | | | | | | | |
Series 2013-GC17, Class A4, 4.13%, 11/10/46 | | | 750 | | | | 785,231 | |
Series 2014-GC25, Class A4, 3.64%, 10/10/47 | | | 500 | | | | 525,675 | |
Series 2014-GC25, Class AS, 4.02%, 10/10/47 | | | 1,500 | | | | 1,578,035 | |
Series 2016-GC37, Class A4, 3.31%, 04/10/49 | | | 3,500 | | | | 3,692,727 | |
Series 2016-P5, Class A4, 2.94%, 10/10/49 | | | 1,000 | | | | 1,043,479 | |
Series 2017-P7, Class A4, 3.71%, 04/14/50 | | | 2,250 | | | | 2,431,604 | |
Commercial Mortgage Trust | | | | | | | | |
Series 2013-CR12, Class A4, 4.05%, 10/10/46 | | | 1,300 | | | | 1,358,594 | |
Series 2013-CR9, Class A4, 4.25%, 07/10/45(b) | | | 2,700 | | | | 2,801,589 | |
Series 2014-UBS2, Class A5, 3.96%, 03/10/47 | | | 500 | | | | 524,303 | |
Series 2015-PC1, Class A5, 3.90%, 07/10/50 | | | 1,500 | | | | 1,598,588 | |
Series 2016-CR28, Class A4, 3.76%, 02/10/49 | | | 750 | | | | 803,156 | |
Commission Mortgage Trust, Series 2014-CR20, Class A3, 3.33%, 11/10/47 | | | 4,525 | | | | 4,657,265 | |
CSAIL Commercial Mortgage Securities Trust | | | | | | | | |
Series 2015-C3, Class A4, 3.72%, 08/15/48 | | | 1,000 | | | | 1,063,147 | |
Series 2016-C7, Class A5, 3.50%, 11/15/49 | | | 4,800 | | | | 5,133,684 | |
Series 2018-CX11, Class A5, 4.03%, 04/15/51(b) | | | 4,000 | | | | 4,399,914 | |
DBJPM Mortgage Trust, Series 2016-C3, Class A5, 2.89%, 08/10/49 | | | 7,500 | | | | 7,806,081 | |
GS Mortgage Securities Corp. II, Series 2018- GS10, Class A5, 4.16%, 07/10/51(b) | | | 3,000 | | | | 3,376,696 | |
GS Mortgage Securities Trust | | | | | | | | |
Series 2012-GCJ9, Class A3, 2.77%, 11/10/45 | | | 243 | | | | 245,807 | |
Series 2014-GC24, Class A5, 3.93%, 09/10/47 | | | 7,000 | | | | 7,397,701 | |
Series 2015-GC30, Class A4, 3.38%, 05/10/50 | | | 600 | | | | 632,425 | |
Series 2015-GS1, Class A3, 3.73%, 11/10/48 | | | 2,300 | | | | 2,460,641 | |
JPMBB Commercial Mortgage Securities Trust | | | | | | | | |
Series 2014-C18, Class A5, 4.08%, 02/15/47 | | | 250 | | | | 261,946 | |
Series 2014-C22, Class A4, 3.80%, 09/15/47 | | | 300 | | | | 316,133 | |
Series 2015-C31, Class A3, 3.80%, 08/15/48 | | | 2,241 | | | | 2,378,862 | |
JPMDB Commercial Mortgage Securities Trust, Series 2017-C7, Class A5, 3.41%, 10/15/50 | | | 6,000 | | | | 6,440,566 | |
| | |
MASTER PORTFOLIO SCHEDULE OF INVESTMENTS | | 73 |
| | |
Schedule of Investments (continued) December 31, 2021 | | U.S. Total Bond Index Master Portfolio (Percentages shown are based on Net Assets) |
| | | | | | | | |
| Security | | Par (000) | | | Value | |
|
| Commercial Mortgage-Backed Securities (continued) | |
JPMorgan Chase Commercial Mortgage Securities Trust | | | | | | | | |
Series 2014-C20, Class A5, 3.80%, 07/15/47 | | $ | 1,400 | | | $ | 1,464,316 | |
Series 2017-JP7, Class A5, 3.45%, 09/15/50 | | | 3,500 | | | | 3,756,661 | |
Morgan Stanley Bank of America Merrill Lynch Trust | | | | | | | | |
Series 2013-C10, Class A5, 4.07%, 07/15/46(b) | | | 3,750 | | | | 3,892,980 | |
Series 2013-C10, Class AS, 4.07%, 07/15/46(b) | | | 2,500 | | | | 2,573,468 | |
Series 2013-C11, Class A4, 4.15%, 08/15/46(b) | | | 11,765 | | | | 12,131,110 | |
Series 2014-C16, Class A4, 3.60%, 06/15/47 | | | 4,248 | | | | 4,384,180 | |
Series 2015-C24, Class A4, 3.73%, 05/15/48 | | | 750 | | | | 799,739 | |
Series 2016-C28, Class A4, 3.54%, 01/15/49 | | | 6,772 | | | | 7,193,927 | |
Morgan Stanley Capital I Trust | | | | | | | | |
Series 2015-UBS8, Class A4, 3.81%, 12/15/48 | | | 1,181 | | | | 1,264,223 | |
Series 2018-H3, Class A4, 3.91%, 07/15/51 | | | 3,000 | | | | 3,285,846 | |
Series 2019-H6, Class A4, 3.42%, 06/15/52 | | | 590 | | | | 638,371 | |
Series 2019-L3, Class AS, 3.49%, 11/15/52 | | | 760 | | | | 816,656 | |
Wells Fargo Commercial Mortgage Trust 2.09%, 07/15/53 | | | 2,830 | | | | 2,800,991 | |
Series 2013-LC12, Class A4, 4.22%, 07/15/46(b) | | | 200 | | | | 207,094 | |
Series 2014-LC18, Class ASB, 3.24%, 12/15/47 | | | 1,475 | | | | 1,517,979 | |
Series 2015-C27, Class A5, 3.45%, 02/15/48 | | | 1,500 | | | | 1,579,261 | |
Series 2015-SG1, Class A4, 3.79%, 09/15/48 | | | 4,934 | | | | 5,193,427 | |
Series 2019-C49, Class A5, 4.02%, 03/15/52 | | | 3,850 | | | | 4,312,757 | |
Series 2020-C56, Class A5, 2.45%, 06/15/53 | | | 3,110 | | | | 3,166,424 | |
| | | | | | | | |
| |
Total Non-Agency Mortgage-Backed
Securities — 1.0%
(Cost: $179,521,606) | | | | 181,165,645 | |
| | | | | | | | |
| | |
Preferred Securities | | | | | | | | |
| | |
| Capital Trusts — 0.0% | | | | | | |
| | |
| Diversified Financial Services — 0.0% | | | | | | |
Goldman Sachs Capital I, 6.35%, 02/15/34 | | | 250 | | | | 345,017 | |
| | | | | | | | |
| | |
| Electric Utilities — 0.0% | | | | | | |
American Electric Power Co., Inc., 3.88%, 02/15/62(b) | | | 400 | | | | 406,074 | |
| | | | | | | | |
| | |
| Insurance — 0.0% | | | | | | |
MetLife, Inc., 6.40%, 12/15/66 | | | 600 | | | | 738,129 | |
Prudential Financial, Inc.(b) | | | | | | | | |
5.38%, 05/15/45 | | | 500 | | | | 533,622 | |
5.63%, 06/15/43 | | | 100 | | | | 104,051 | |
| | | | | | | | |
| | |
| | | | | | | 1,375,802 | |
| | | | | | | | |
| | |
Total Capital Trusts — 0.0% | | | | | | | 2,126,893 | |
| | | | | | | | |
| | |
Total Preferred Securities — 0.0%
(Cost: $1,940,600) | | | | | | | 2,126,893 | |
| | | | | | | | |
|
U.S. Government Sponsored Agency Securities | |
| | |
| Agency Obligations — 1.1% | | | | | | |
Fannie Mae | | | | | | | | |
2.63%, 01/11/22 - 09/06/24(a) | | | 8,715 | | | | 8,993,120 | |
1.88%, 04/05/22 | | | 5,000 | | | | 5,020,200 | |
| | | | | | | | |
| Security | | Par (000) | | | Value | |
| | |
| Agency Obligations (continued) | | | | | | |
Fannie Mae (continued) | | | | | | | | |
2.38%, 01/19/23 | | $ | 490 | | | $ | 500,034 | |
0.25%, 07/10/23 | | | 10,000 | | | | 9,945,511 | |
0.50%, 06/17/25 | | | 20,000 | | | | 19,601,015 | |
6.25%, 05/15/29 | | | 5,350 | | | | 7,105,631 | |
7.13%, 01/15/30 | | | 10,000 | | | | 14,151,116 | |
7.25%, 05/15/30 | | | 20,550 | | | | 29,571,713 | |
0.88%, 08/05/30 | | | 7,010 | | | | 6,605,799 | |
6.63%, 11/15/30 | | | 149 | | | | 210,420 | |
Fannie Mae Mortgage-Backed Securities, 2.00%, 12/01/51 | | | 17,489 | | | | 17,487,391 | |
Federal Home Loan Bank | | | | | | | | |
3.00%, 12/09/22 | | | 4,910 | | | | 5,030,078 | |
2.75%, 12/13/24 | | | 5,000 | | | | 5,257,577 | |
3.13%, 06/13/25 | | | 9,570 | | | | 10,225,512 | |
5.50%, 07/15/36 | | | 2,100 | | | | 3,045,225 | |
Federal Home Loan Mortgage Corp. | | | | | | | | |
2.38%, 01/13/22 | | | 12,715 | | | | 12,723,274 | |
0.13%, 07/25/22 | | | 925 | | | | 924,499 | |
0.25%, 08/24/23 - 12/04/23 | | | 11,035 | | | | 10,945,030 | |
0.38%, 07/21/25 | | | 325 | | | | 316,736 | |
6.75%, 03/15/31 | | | 2,800 | | | | 4,022,713 | |
6.25%, 07/15/32 | | | 3,300 | | | | 4,740,712 | |
Freddie Mac Mortgage-Backed Securities, 2.00%, 01/01/37 | | | 7,394 | | | | 7,593,826 | |
Peruvian Government International Bond, 3.60%, 01/15/72 | | | 300 | | | | 291,281 | |
Tennessee Valley Authority | | | | | | | | |
1.50%, 09/15/31 | | | 200 | | | | 197,025 | |
5.88%, 04/01/36 | | | 2,100 | | | | 3,061,937 | |
3.50%, 12/15/42 | | | 140 | | | | 165,990 | |
| | | | | | | | |
| | |
| | | | | | | 187,733,365 | |
| | |
| Mortgage-Backed Securities — 28.2% | | | | | | |
Fannie Mae | | | | | | | | |
1.61%, 04/25/31(b) | | | 4,260 | | | | 4,187,379 | |
1.71%, 07/25/31(b) | | | 3,000 | | | | 2,964,268 | |
Series 2012-M9, Class A2, 2.48%, 04/25/22 | | | 209 | | | | 209,372 | |
Series 2014-M13, Class A2, 3.02%, 08/25/24(b) | | | 341 | | | | 355,039 | |
Series 2016-M5, Class A2, 2.47%, 04/25/26 | | | 6,110 | | | | 6,304,666 | |
Series 2016-M6, Class A2, 2.49%, 05/25/26 | | | 7,000 | | | | 7,281,092 | |
Series 2017-M15, Class A2, 2.96%, 09/25/27(b) | | | 4,000 | | | | 4,294,459 | |
Series 2018-M12, Class A2, 3.64%, 08/25/30(b) | | | 3,000 | | | | 3,413,298 | |
Series 2018-M3, Class A2, 3.09%, 02/25/30(b) | | | 10,000 | | | | 10,924,281 | |
Series 2019-M22, Class A2, 2.52%, 08/25/29 | | | 5,000 | | | | 5,264,270 | |
Series 2020-M46, Class A2, 1.32%, 05/25/30 | | | 5,481 | | | | 5,329,356 | |
Fannie Mae Mortgage-Backed Securities | | | | | | | | |
1.50%, 10/01/36 - 11/01/50 | | | 9,093 | | | | 8,941,947 | |
2.00%, 11/01/36 - 12/01/51 | | | 83,711 | | | | 83,932,091 | |
4.00%, 07/01/49 | | | 4,354 | | | | 4,625,840 | |
2.50%, 08/01/51 - 01/01/52 | | | 70,160 | | | | 71,723,814 | |
Fannie Mae or Freddie Mac, 1.50%, 01/14/52(f) | | | 133,125 | | | | 128,554,671 | |
Federal Home Loan Bank, 2.00%, 10/01/51 | | | 10,818 | | | | 10,825,610 | |
Federal Home Loan Mortgage Corp., 4.00%, 01/01/48 | | | 2,057 | | | | 2,205,403 | |
Freddie Mac | | | | | | | | |
2.07%, 01/25/31 | | | 10,930 | | | | 11,174,495 | |
Series K026, Class A2, 2.51%, 11/25/22 | | | 200 | | | | 202,725 | |
| | |
| 74 | | 2 0 2 1 BLACK ROCK ANNUAL REPORT TO SHAREHOLDERS |
| | |
Schedule of Investments (continued) December 31, 2021 | | U.S. Total Bond Index Master Portfolio (Percentages shown are based on Net Assets) |
| | | | | | | | |
| Security | | Par (000) | | | Value | |
| | |
| Mortgage-Backed Securities (continued) | | | | | | |
Freddie Mac (continued) | | | | | | | | |
Series K031, Class A2, 3.30%, 04/25/23(b) | | $ | 100 | | | $ | 102,944 | |
Series K033, Class A2, 3.06%, 07/25/23(b) | | | 100 | | | | 102,984 | |
Series K034, Class A2, 3.53%, 07/25/23(b) | | | 3,900 | | | | 4,041,705 | |
Series K035, Class A2, 3.46%, 08/25/23(b) | | | 2,000 | | | | 2,073,494 | |
Series K036, Class A2, 3.53%, 10/25/23(b) | | | 1,200 | | | | 1,249,466 | |
Series K037, Class A2, 3.49%, 01/25/24 | | | 2,700 | | | | 2,820,543 | |
Series K041, Class A2, 3.17%, 10/25/24 | | | 7,500 | | | | 7,883,303 | |
Series K045, Class A1, 2.49%, 11/25/24 | | | 2,416 | | | | 2,436,758 | |
Series K052, Class A2, 3.15%, 11/25/25 | | | 750 | | | | 797,203 | |
Series K063, Class A2, 3.43%, 01/25/27(b) | | | 5,000 | | | | 5,444,907 | |
Series K066, Class A2, 3.12%, 06/25/27 | | | 3,500 | | | | 3,775,630 | |
Series K067, Class A1, 2.90%, 03/25/27 | | | 3,442 | | | | 3,603,022 | |
Series K076, Class A2, 3.90%, 04/25/28 | | | 2,000 | | | | 2,266,102 | |
Series K081, Class A2, 3.90%, 08/25/28(b) | | | 10,000 | | | | 11,372,360 | |
Series K088, Class A2, 3.69%, 01/25/29 | | | 500 | | | | 564,835 | |
Series K100, Class A2, 2.67%, 09/25/29 | | | 10,000 | | | | 10,655,689 | |
Series K101, Class A2, 2.52%, 10/25/29 | | | 5,650 | | | | 5,965,750 | |
Series K110, Class A2, 1.48%, 04/25/30 | | | 2,640 | | | | 2,583,573 | |
Series K111, Class A2, 1.35%, 05/25/30 | | | 1,000 | | | | 968,320 | |
Series K727, Class A2, 2.95%, 07/25/24 | | | 5,000 | | | | 5,195,848 | |
Series K730, Class A2, 3.59%, 01/25/25(b) | | | 9,000 | | | | 9,526,561 | |
Series K734, Class A2, 3.21%, 02/25/26 | | | 5,700 | | | | 6,082,842 | |
Freddie Mac Mortgage-Backed Securities | | | | | | | | |
2.00%, 10/01/36 - 12/01/51 | | | 110,156 | | | | 110,190,618 | |
2.50%, 10/01/51 - 01/01/52 | | | 2,533 | | | | 2,588,493 | |
3.00%, 11/01/51 | | | 6,278 | | | | 6,525,036 | |
Ginnie Mae | | | | | | | | |
2.50%, 02/20/51 - 05/20/51 | | | 94,644 | | | | 97,041,288 | |
2.00%, 01/21/52(f) | | | 176,508 | | | | 178,101,562 | |
Ginnie Mae Mortgage-Backed Securities | | | | | | | | |
7.50%, 12/15/23 | | | 15 | | | | 15,047 | |
5.50%, 12/15/32 - 04/20/48 | | | 270 | | | | 304,185 | |
6.00%, 03/15/35 - 10/20/38 | | | 89 | | | | 102,590 | |
6.50%, 09/15/36 | | | 60 | | | | 65,526 | |
4.50%, 07/15/39 - 01/21/52(f) | | | 36,056 | | | | 38,384,114 | |
5.00%, 11/15/39 - 01/21/52(f) | | | 18,373 | | | | 19,726,394 | |
4.00%, 03/15/41 - 01/21/52(f) | | | 73,601 | | | | 78,085,619 | |
3.50%, 09/20/42 - 01/21/52(f) | | | 150,888 | | | | 159,473,664 | |
3.00%, 01/20/43 - 08/20/51(f) | | | 168,329 | | | | 174,925,582 | |
2.50%, 05/20/45 - 01/21/52(f) | | | 162,255 | | | | 166,312,324 | |
1.50%, 01/21/52(f) | | | 6,100 | | | | 5,940,143 | |
Government National Mortgage Association Mortgage-Backed Securities | | | | | | | | |
4.00%, 10/20/48 | | | 2,120 | | | | 2,242,147 | |
3.00%, 10/15/49 - 11/20/51 | | | 23,581 | | | | 24,454,811 | |
2.00%, 07/20/50 - 12/20/51 | | | 84,489 | | | | 85,343,671 | |
2.50%, 12/20/51 | | | 9,375 | | | | 9,612,510 | |
Uniform Mortgage-Backed Securities | | | | | | | | |
4.50%, 05/01/24 - 01/14/52(f) | | | 101,900 | | | | 109,809,247 | |
8.00%, 12/01/24 | | | 21 | | | | 20,894 | |
4.00%, 10/01/25 - 02/01/57(f) | | | 237,099 | | | | 254,881,196 | |
3.50%, 02/01/26 - 11/01/51(f) | | | 352,115 | | | | 374,256,942 | |
3.00%, 01/01/27 - 01/13/52(f) | | | 506,034 | | | | 529,896,497 | |
2.50%, 07/01/28 - 09/01/51(f) | | | 748,382 | | | | 767,809,268 | |
7.00%, 02/01/32 | | | 11 | | | | 10,735 | |
6.50%, 07/01/32 | | | 56 | | | | 63,432 | |
5.00%, 04/01/33 - 01/14/52(f) | | | 22,768 | | | | 25,022,497 | |
6.00%, 03/01/34 - 02/01/49 | | | 2,021 | | | | 2,361,458 | |
5.50%, 06/01/35 - 01/14/52(f) | | | 26,061 | | | | 28,665,146 | |
| | | | | | | | |
| Security | | Par (000) | | | Value | |
|
| Mortgage-Backed Securities (continued) | |
Uniform Mortgage-Backed Securities (continued) | | | | | | | | |
2.00%, 12/01/35 - 10/01/51(f)(g) | | $ | 1,057,719 | | | $ | 1,062,797,555 | |
1.50%, 01/19/37(f) | | | 160,025 | | | | 160,453,230 | |
(12 mo. LIBOR US + 1.50%), 1.75%, 06/01/43(b) | | | 4 | | | | 4,263 | |
(12 mo. LIBOR US + 1.53%), 1.78%, 05/01/43(b) | | | 67 | | | | 69,223 | |
(12 mo. LIBOR US + 1.54%), 1.79%, 06/01/43(b) | | | 92 | | | | 95,926 | |
(12 mo. LIBOR US + 1.70%), 1.95%, 08/01/42(b) | | | 18 | | | | 18,836 | |
(12 mo. LIBOR US + 1.73%), 2.00%, 08/01/41(b) | | | 5 | | | | 5,530 | |
(12 mo. LIBOR US + 1.75%), 2.00%, 08/01/41(b) | | | 6 | | | | 6,124 | |
(12 mo. LIBOR US + 1.83%), 2.11%, 09/01/40(b) | | | 10 | | | | 10,187 | |
(12 mo. LIBOR US + 1.83%), 2.08%, 11/01/40(b) | | | 5 | | | | 4,839 | |
| | | | | | | | |
| | |
| | | | | | | 4,937,926,264 | |
| | | | | | | | |
| |
Total U.S. Government Sponsored Agency
Securities — 29.3%
(Cost: $5,103,927,185) | | | | 5,125,659,629 | |
| | | | | | | | |
| | |
U.S. Treasury Obligations | | | | | | | | |
U.S. Treasury Bonds | | | | | | | | |
2.38%, 03/15/22 - 05/15/51(a) | | | 73,710 | | | | 80,328,385 | |
0.13%, 02/15/24(a) | | | 100,000 | | | | 98,695,312 | |
0.38%, 12/31/25(a) | | | 50,000 | | | | 48,464,844 | |
0.50%, 02/28/26(a) | | | 60,000 | | | | 58,296,094 | |
0.63%, 12/31/27 | | | 35,000 | | | | 33,489,258 | |
1.13%, 02/29/28 - 08/15/40(a) | | | 161,000 | | | | 148,595,078 | |
5.38%, 02/15/31 | | | 6,000 | | | | 8,029,453 | |
4.50%, 02/15/36 - 08/15/39(a) | | | 19,601 | | | | 27,331,691 | |
4.75%, 02/15/37 - 02/15/41 | | | 67,450 | | | | 96,043,024 | |
5.00%, 05/15/37 | | | 17,000 | | | | 24,744,961 | |
4.38%, 02/15/38 - 05/15/41 | | | 20,810 | | | | 29,037,260 | |
3.50%, 02/15/39 | | | 6,700 | | | | 8,405,359 | |
4.25%, 05/15/39 - 11/15/40 | | | 19,303 | | | | 26,556,462 | |
4.63%, 02/15/40 | | | 16,230 | | | | 23,310,971 | |
3.88%, 08/15/40 | | | 3,860 | | | | 5,087,510 | |
1.38%, 11/15/40 - 08/15/50(a) | | | 36,000 | | | | 32,242,187 | |
1.88%, 02/15/41 - 11/15/51 | | | 194,000 | | | | 192,121,016 | |
2.25%, 05/15/41 - 08/15/49(a) | | | 79,000 | | | | 83,765,508 | |
1.75%, 08/15/41(a) | | | 20,000 | | | | 19,390,625 | |
3.75%, 08/15/41 - 11/15/43(a) | | | 58,250 | | | | 76,876,670 | |
2.00%, 11/15/41 - 08/15/51 | | | 112,000 | | | | 113,725,039 | |
3.13%, 11/15/41 - 05/15/48(a) | | | 82,550 | | | | 100,913,327 | |
3.00%, 05/15/42 - 08/15/48(a) | | | 105,580 | | | | 127,085,817 | |
2.75%, 08/15/42 - 11/15/47(a) | | | 97,000 | | | | 111,789,589 | |
2.88%, 05/15/43 - 05/15/49(a) | | | 70,550 | | | | 83,172,230 | |
3.63%, 08/15/43 - 02/15/44 | | | 18,500 | | | | 24,043,945 | |
3.38%, 05/15/44 - 11/15/48(a) | | | 17,300 | | | | 22,259,449 | |
2.50%, 02/15/45 - 05/15/46 | | | 73,950 | | | | 81,557,694 | |
1.25%, 05/15/50 | | | 24,000 | | | | 20,380,313 | |
1.63%, 11/15/50(a) | | | 78,000 | | | | 72,671,016 | |
U.S. Treasury Notes | | | | | | | | |
1.50%, 01/31/22 - 02/15/30(a) | | | 274,475 | | | | 277,701,871 | |
1.88%, 02/28/22 - 08/31/24(a) | | | 112,958 | | | | 114,032,137 | |
1.75%, 03/31/22 - 12/31/24(a) | | | 181,158 | | | | 184,019,633 | |
2.25%, 04/15/22 - 11/15/27(a) | | | 285,085 | | | | 295,903,706 | |
| | |
MASTER PORTFOLIO SCHEDULE OF INVESTMENTS | | 75 |
| | |
Schedule of Investments (continued) December 31, 2021 | | U.S. Total Bond Index Master Portfolio (Percentages shown are based on Net Assets) |
| | | | | | | | |
| Security | | Par (000) | | | Value | |
|
U.S. Treasury Obligations (continued) | |
U.S. Treasury Notes (continued) | | | | | | | | |
2.13%, 06/30/22 - 05/15/25(a) | | $ | 148,250 | | | $ | 152,450,539 | |
2.00%, 07/31/22 - 11/15/26(a) | | | 239,484 | | | | 246,324,563 | |
1.38%, 10/15/22 - 11/15/31(a) | | | 308,000 | | | | 308,381,642 | |
7.63%, 11/15/22 - 02/15/25 | | | 3,775 | | | | 4,065,630 | |
0.25%, 04/15/23 - 09/30/25(a) | | | 368,000 | | | | 361,036,952 | |
1.63%, 04/30/23 - 05/15/31(a) | | | 330,350 | | | | 335,541,801 | |
2.75%, 04/30/23 - 02/15/28(a) | | | 338,600 | | | | 352,155,072 | |
2.63%, 06/30/23 - 02/15/29(a) | | | 83,884 | | | | 88,620,301 | |
1.25%, 07/31/23 - 08/15/31(a) | | | 368,000 | | | | 364,304,140 | |
2.50%, 08/15/23 - 05/15/24(a) | | | 103,300 | | | | 106,970,398 | |
6.25%, 08/15/23 | | | 2,050 | | | | 2,236,422 | |
2.88%, 09/30/23 - 08/15/28(a) | | | 166,600 | | | | 178,144,016 | |
0.13%, 12/15/23(a) | | | 105,000 | | | | 103,794,140 | |
0.38%, 04/15/24 - 09/30/27(a) | | | 438,000 | | | | 426,412,423 | |
2.38%, 08/15/24 - 05/15/29(a) | | | 50,500 | | | | 53,325,644 | |
0.63%, 10/15/24 - 08/15/30(a) | | | 271,500 | | | | 260,633,203 | |
0.75%, 11/15/24 - 08/31/26(a) | | | 280,000 | | | | 275,140,819 | |
7.50%, 11/15/24 | | | 5,000 | | | | 5,936,133 | |
1.00%, 12/15/24 - 07/31/28 | | | 80,000 | | | | 78,985,938 | |
6.88%, 08/15/25 | | | 8,000 | | | | 9,643,125 | |
3.00%, 09/30/25 - 10/31/25(a) | | | 53,000 | | | | 56,637,070 | |
6.00%, 02/15/26 | | | 7,659 | | | | 9,149,512 | |
0.88%, 06/30/26 - 11/15/30(a) | | | 76,000 | | | | 73,385,508 | |
6.75%, 08/15/26(a) | | | 7,500 | | | | 9,347,461 | |
1.13%, 10/31/26 - 02/15/31(a) | | | 187,000 | | | | 183,361,914 | |
6.63%, 02/15/27 | | | 3,500 | | | | 4,425,859 | |
0.50%, 04/30/27 - 08/31/27(a) | | | 98,000 | | | | 93,744,765 | |
3.13%, 11/15/28(a) | | | 30,000 | | | | 33,345,703 | |
5.25%, 11/15/28 - 02/15/29 | | | 14,000 | | | | 17,559,063 | |
6.13%, 08/15/29 | | | 7,500 | | | | 10,061,426 | |
| | | | | | | | |
| |
Total U.S. Treasury Obligations — 39.8%
(Cost: $6,848,257,488) | | | | 6,955,188,616 | |
| | | | | | | | |
| |
Total Long-Term Investments — 99.2%
(Cost: $17,034,953,377) | | | | 17,351,393,226 | |
| | | | | | | | |
| | |
| | | Shares | | | | |
| | |
Short-Term Securities | | | | | | | | |
| |
| Money Market Funds — 27.9% | | | | |
BlackRock Cash Funds: Institutional, SL Agency Shares, 0.10%(h)(i)(j) | | | 4,888,620,524 | | | | 4,890,087,111 | |
BlackRock Cash Funds: Treasury, SL Agency Shares, 0.01%(h)(i) | | | 100,000 | | | | 100,000 | |
| | | | | | | | |
| | |
| | | | | | | 4,890,187,111 | |
| | | | | | | | |
| | | | | | | | |
| Security | | Par (000) | | | Value | |
| |
| | |
| U.S. Treasury Obligations — 0.3% | | | | | | |
U.S. Treasury Notes | | | | | | | | |
1.75%, 02/28/22 | | $ | 1,500 | | | $ | 1,503,932 | |
2.13%, 12/31/22 | | | 45,000 | | | | 45,747,061 | |
| | | | | | | | |
| | |
| | | | | | | 47,250,993 | |
| | | | | | | | |
| |
Total Short-Term Securities — 28.2%
(Cost: $4,934,488,655) | | | | 4,937,438,104 | |
| | | | | | | | |
| |
Total Investments Before TBA Sale
Commitments — 127.4%
(Cost: $21,969,442,032) | | | | 22,288,831,330 | |
| | |
TBA Sale Commitments(f) | | | | | | | | |
| | |
| Mortgage-Backed Securities — (0.3)% | | | | | | |
Uniform Mortgage-Backed Securities | | | | | | | | |
1.50%, 01/19/37 | | | (4,099 | ) | | | (4,109,969 | ) |
2.00%, 01/16/36 - 07/25/51 | | | (29,781 | ) | | | (30,021,213 | ) |
2.50%, 07/25/51 | | | (5,125 | ) | | | (5,228,726 | ) |
3.00%, 01/19/37 | | | (600 | ) | | | (627,356 | ) |
3.50%, 01/19/37 | | | (225 | ) | | | (236,824 | ) |
4.00%, 01/14/52 | | | (12,925 | ) | | | (13,747,925 | ) |
| | | | | | | | |
| |
Total TBA Sale Commitments — (0.3)%
(Proceeds: $(54,009,332)) | | | | (53,972,013 | ) |
| | | | | | | | |
| |
Total Investments, Net of TBA Sale
Commitments — 127.1%
(Cost: $21,915,432,700) | | | | 22,234,859,317 | |
| |
Liabilities in Excess of Other Assets — (27.1)% | | | | (4,745,357,245 | ) |
| | | | | | | | |
| | |
Net Assets — 100.0% | | | | | | $ | 17,489,502,072 | |
| | | | | | | | |
| (a) | All or a portion of this security is on loan. |
| (b) | Variable rate security. Interest rate resets periodically. The rate shown is the effective interest rate as of period end. Security description also includes the reference rate and spread if published and available. |
| (c) | Security exempt from registration pursuant to Rule 144A under the Securities Act of 1933, as amended. These securities may be resold in transactions exempt from registration to qualified institutional investors. |
| (d) | Step coupon security. Coupon rate will either increase (step-up bond) or decrease (step- down bond) at regular intervals until maturity. Interest rate shown reflects the rate currently in effect. |
| (e) | Security is collateralized by municipal bonds or U.S. Treasury obligations. |
| (f) | Represents or includes a TBA transaction. |
| (g) | All or a portion of the security has been pledged as collateral in connection with outstanding TBA commitments. |
| (h) | Affiliate of the Master Portfolio. |
| (i) | Annualized 7-day yield as of period end. |
| (j) | All or a portion of this security was purchased with the cash collateral from loaned securities. |
For Master Portfolio compliance purposes, the Master Portfolio’s industry classifications refer to one or more of the industry sub-classifications used by one or more widely recognized market indexes or rating group indexes, and/or as defined by the investment adviser. These definitions may not apply for purposes of this report, which may combine such industry sub-classifications for reporting ease.
| | |
| 76 | | 2 0 2 1 BLACK ROCK ANNUAL REPORT TO SHAREHOLDERS |
| | |
Schedule of Investments (continued) December 31, 2021 | | U.S. Total Bond Index Master Portfolio |
Affiliates
Investments in issuers considered to be affiliate(s) of the Master Portfolio during the year ended December 31, 2021 for purposes of Section 2(a)(3) of the Investment Company Act of 1940, as amended, were as follows:
| | | | | | | | | | | | | | | | | | | | | | | | | | | | | | | | | | | | | | | | | | |
| | | | | | | | | | | |
| | | Affiliated Issuer | | Value at 12/31/20 | | | Purchases at Cost | | | Proceeds from Sales | | | Net Realized Gain (Loss) | | | Change in Unrealized Appreciation (Depreciation) | | | Value at 12/31/21 | | | Shares Held at 12/31/21 | | | Income | | | Capital Gain Distributions from Underlying Funds | | | | |
| | BlackRock Cash Funds: Institutional, SL Agency Shares | | $ | 5,188,245,250 | | | $ | — | | | $ | (296,105,068 | )(a) | | $ | (1,372,735 | ) | | $ | (680,336 | ) | | $ | 4,890,087,111 | | | | 4,888,620,524 | | | $ | 7,092,279 | (b) | | $ | — | | | | | |
| | BlackRock Cash Funds: Treasury, SL Agency Shares | | | 100,000 | | | | — | | | | — | | | | — | | | | — | | | | 100,000 | | | | 100,000 | | | | 11 | | | | — | | | | | |
| | | | | | | | | | | | | | | | | | | | | | | | | | | | | | | | | | | | | | | | | | |
| | | | | | | | | | | |
| | | | | | | | | | | | | | | | $ | (1,372,735 | ) | | $ | (680,336 | ) | | $ | 4,890,187,111 | | | | | | | $ | 7,092,290 | | | $ | — | | | | | |
| | | | | | | | | | | | | | | | | | | | | | | | | | | | | | | | | | | | | | | | | | |
| | (a) | Represents net amount purchased (sold). | |
| | (b) | All or a portion represents securities lending income earned from the reinvestment of cash collateral from loaned securities, net of fees and collateral investment expenses, and other payments to and from borrowers of securities. | |
Fair Value Hierarchy as of Period End
Various inputs are used in determining the fair value of financial instruments. For a description of the input levels and information about the Master Portfolio’s policy regarding valuation of financial instruments, refer to the Notes to Financial Statements.
The following table summarizes the Master Portfolio’s financial instruments categorized in the fair value hierarchy. The breakdown of the Master Portfolio’s financial instruments into major categories is disclosed in the Schedule of Investments above.
| | | | | | | | | | | | | | | | |
| |
| | | | |
| | | Level 1 | | | Level 2 | | | Level 3 | | | Total | |
| |
Assets | | | | | | | | | | | | | | | | |
Investments | | | | | | | | | | | | | | | | |
Long-Term Investments | | | | | | | | | | | | | | | | |
Asset-Backed Securities | | $ | — | | | $ | 41,982,190 | | | $ | — | | | $ | 41,982,190 | |
Corporate Bonds | | | — | | | | 4,430,279,031 | | | | — | | | | 4,430,279,031 | |
Foreign Agency Obligations | | | — | | | | 506,172,689 | | | | — | | | | 506,172,689 | |
Municipal Bonds | | | — | | | | 108,818,533 | | | | — | | | | 108,818,533 | |
Non-Agency Mortgage-Backed Securities | | | — | | | | 181,165,645 | | | | — | | | | 181,165,645 | |
Preferred Securities | | | | | | | | | | | | | | | | |
Capital Trusts | | | — | | | | 2,126,893 | | | | — | | | | 2,126,893 | |
U.S. Government Sponsored Agency Securities | | | — | | | | 5,125,659,629 | | | | — | | | | 5,125,659,629 | |
U.S. Treasury Obligations | | | — | | | | 6,955,188,616 | | | | — | | | | 6,955,188,616 | |
Short-Term Securities | | | | | | | | | | | | | | | | |
Money Market Funds | | | 4,890,187,111 | | | | — | | | | — | | | | 4,890,187,111 | |
U.S. Treasury Obligations | | | — | | | | 47,250,993 | | | | — | | | | 47,250,993 | |
Liabilities | | | | | | | | | | | | | | | | |
Investments | | | | | | | | | | | | | | | | |
TBA Sale Commitments | | | — | | | | (53,972,013 | ) | | | — | | | | (53,972,013 | ) |
| | | | | | | | | | | | | | | | |
| | | | |
| | $ | 4,890,187,111 | | | $ | 17,344,672,206 | | | $ | — | | | $ | 22,234,859,317 | |
| | | | | | | | | | | | | | | | |
See notes to financial statements.
| | |
MASTER PORTFOLIO SCHEDULE OF INVESTMENTS | | 77 |
Statement of Assets and Liabilities
December 31, 2021
| | | | |
| | | U.S. Total Bond Index Master Portfolio | |
| |
| |
ASSETS | | | | |
Investments, at value — unaffiliated(a)(b) | | $ | 17,398,644,219 | |
Investments, at value — affiliated(c) | | | 4,890,187,111 | |
Cash | | | 87,487,413 | |
Receivables: | | | | |
Investments sold | | | 27,689,937 | |
Securities lending income — affiliated | | | 359,014 | |
TBA sale commitments | | | 54,009,332 | |
Contributions from investors | | | 296,564,375 | |
Dividends — unaffiliated | | | 609,099 | |
Dividends — affiliated | | | 6,864 | |
Interest — unaffiliated | | | 79,081,638 | |
Principal paydowns | | | 121 | |
| | | | |
| |
Total assets | | | 22,834,639,123 | |
| | | | |
| |
LIABILITIES | | | | |
Cash received as collateral for TBA commitments | | | 55,000 | |
Collateral on securities loaned | | | 3,474,544,571 | |
TBA sale commitments, at value(d) | | | 53,972,013 | |
Payables: | | | | |
Investments purchased | | | 1,815,956,571 | |
Investment advisory fees | | | 487,721 | |
Trustees’ fees | | | 52,484 | |
Professional fees | | | 68,691 | |
| | | | |
| |
Total liabilities | | | 5,345,137,051 | |
| | | | |
| |
NET ASSETS | | $ | 17,489,502,072 | |
| | | | |
| |
NET ASSETS CONSIST OF | | | | |
Investors’ capital | | $ | 17,171,718,237 | |
Net unrealized appreciation (depreciation) | | | 317,783,835 | |
| | | | |
| |
NET ASSETS | | $ | 17,489,502,072 | |
| | | | |
| |
(a) Investments, at cost — unaffiliated | | $ | 17,081,186,186 | |
(b) Securities loaned, at value | | $ | 3,391,897,728 | |
(c) Investments, at cost — affiliated | | $ | 4,888,255,846 | |
(d) Proceeds from TBA sale commitments | | $ | 54,009,332 | |
See notes to financial statements.
| | |
| 78 | | 2 0 2 1 BLACK ROCK ANNUAL REPORT TO SHAREHOLDERS |
Statement of Operations
Year Ended December 31, 2021
| | | | |
| | | U.S. Total Bond Index Master Portfolio | |
| |
| |
INVESTMENT INCOME | | | | |
Dividends — affiliated | | $ | 2,146,165 | |
Interest — unaffiliated | | | 290,414,971 | |
Securities lending income — affiliated — net | | | 4,946,125 | |
| | | | |
| |
Total investment income | | | 297,507,261 | |
| | | | |
| |
EXPENSES | | | | |
Investment advisory | | | 6,463,849 | |
Trustees | | | 193,804 | |
Professional | | | 39,622 | |
| | | | |
Total expenses | | | 6,697,275 | |
Less: | | | | |
Fees waived and/or reimbursed by the Manager | | | (1,198,844 | ) |
| | | | |
| |
Total expenses after fees waived and/or reimbursed | | | 5,498,431 | |
| | | | |
| |
Net investment income | | | 292,008,830 | |
| | | | |
| |
REALIZED AND UNREALIZED GAIN (LOSS) | | | | |
Net realized gain (loss) from: | | | | |
Investments — unaffiliated | | | 14,967,948 | |
Investments — affiliated | | | (1,372,735 | ) |
| | | | |
| |
| | | 13,595,213 | |
| | | | |
Net change in unrealized appreciation (depreciation) on: | | | | |
Investments — unaffiliated | | | (558,367,917 | ) |
Investments — affiliated | | | (680,336 | ) |
| | | | |
| |
| | | (559,048,253 | ) |
| | | | |
| |
Net realized and unrealized loss | | | (545,453,040 | ) |
| | | | |
| |
NET DECREASE IN NET ASSETS RESULTING FROM OPERATIONS | | $ | (253,444,210 | ) |
| | | | |
See notes to financial statements.
Statements of Changes in Net Assets
| | | | | | | | |
| | | U.S. Total Bond Index Master Portfolio | |
| | | | |
| |
| | | Year Ended December 31, | |
| | | | |
| | |
| | | 2021 | | | 2020 | |
| |
| | |
INCREASE (DECREASE) IN NET ASSETS | | | | | | | | |
| | |
OPERATIONS | | | | | | | | |
Net investment income | | $ | 292,008,830 | | | $ | 287,708,873 | |
Net realized gain | | | 13,595,213 | | | | 102,047,666 | |
Net change in unrealized appreciation (depreciation) | | | (559,048,253 | ) | | | 472,324,698 | |
| | | | | | | | |
| | |
Net increase (decrease) in net assets resulting from operations | | | (253,444,210 | ) | | | 862,081,237 | |
| | | | | | | | |
| | |
CAPITAL TRANSACTIONS | | | | | | | | |
Proceeds from contributions | | | 4,684,584,990 | | | | 5,253,167,273 | |
Value of withdrawals | | | (1,730,769,802 | ) | | | (2,508,761,968 | ) |
| | | | | | | | |
| | |
Net increase in net assets derived from capital transactions | | | 2,953,815,188 | | | | 2,744,405,305 | |
| | | | | | | | |
| | |
NET ASSETS | | | | | | | | |
Total increase in net assets | | | 2,700,370,978 | | | | 3,606,486,542 | |
Beginning of year | | | 14,789,131,094 | | | | 11,182,644,552 | |
| | | | | | | | |
| | |
End of year | | $ | 17,489,502,072 | | | $ | 14,789,131,094 | |
| | | | | | | | |
See notes to financial statements.
| | |
| 80 | | 2 0 2 1 BLACK ROCK ANNUAL REPORT TO SHAREHOLDERS |
Financial Highlights
| | | | | | | | | | | | | | | | | | | | | | |
| | | | | U.S. Total Bond Index Master Portfolio | |
| | |
| | | | | Year Ended December 31, | |
| | | | | | |
| | | | | 2021 | | | 2020 | | | 2019 | | | 2018 | | | 2017 | |
| | | | | |
Total Return | | | | | | | | | | | | | | | | | | | | |
Total return | | | (1.79 | )% | | | 7.65 | % | | | 8.72 | %(a) | | | (0.07 | )% | | | 3.40 | % |
| | | | | | | | | | | | | | | | | | | | | | |
| | | | | |
Ratios to Average Net Assets(b) | | | | | | | | | | | | | | | | | | | | |
Total expenses | | | 0.04 | % | | | 0.04 | % | | | 0.04 | % | | | 0.04 | % | | | 0.04 | % |
| | | | | | | | | | | | | | | | | | | | | | |
| | | | | |
Total expenses after fees waived and/or reimbursed | | | 0.03 | % | | | 0.03 | % | | | 0.04 | % | | | 0.03 | % | | | 0.03 | % |
| | | | | | | | | | | | | | | | | | | | | | |
| | | | | |
Net investment income | | | 1.81 | % | | | 2.31 | % | | | 2.90 | % | | | 2.74 | % | | | 2.22 | % |
| | | | | | | | | | | | | | | | | | | | | | |
| | | | | |
Supplemental Data | | | | | | | | | | | | | | | | | | | | |
Net assets, end of year (000) | | $ | 17,489,502 | | | $ | 14,789,131 | | | $ | 11,182,645 | | | $ | 8,327,639 | | | $ | 5,047,766 | |
| | | | | | | | | | | | | | | | | | | | | | |
| | | | | |
Portfolio turnover rate(c)(d) | | | 175 | % | | | 186 | % | | | 158 | % | | | 274 | % | | | 345 | % |
| | | | | | | | | | | | | | | | | | | | | | |
|
(a) Includes payment from an affiliate, which had no impact on the Fund’s total return. (b) Excludes fees and expenses incurred indirectly as a result of investments in underlying funds. (c) Portfolio turnover rates include TBA transactions, if any. (d) Includes mortgage dollar roll transactions (“MDRs”). Additional information regarding portfolio turnover rate is as follows: | |
| | |
| | | | | Year Ended December 31, | |
| | | | | | |
| | | | | 2021 | | | 2020 | | | 2019 | | | 2018 | | | 2017 | |
| | | | | | |
| | Portfolio turnover rate (excluding MDRs) | | | 89 | % | | | 101 | % | | | 97 | % | | | 162 | % | | | 193 | % |
| | | | | | | | | | | | | | | | | | | | | | |
See notes to financial statements.
| | |
MASTER PORTFOLIO FINANCIAL HIGHLIGHTS | | 81 |
Notes to Financial Statements
Master Investment Portfolio (“MIP”) is registered under the Investment Company Act of 1940, as amended (the “1940 Act”), as an open-end management investment company. MIP is organized as a Delaware statutory trust. U.S. Total Bond Index Master Portfolio (the “Master Portfolio”) is a series of MIP. The Master Portfolio is classified as diversified.
The Master Portfolio, together with certain other registered investment companies advised by BlackRock Fund Advisors (“BFA” or the “Manager”) or its affiliates, is included in a complex of open-end equity, multi-asset, index and money market funds referred to as the BlackRock Multi-Asset Complex.
| 2. | SIGNIFICANT ACCOUNTING POLICIES |
The financial statements are prepared in conformity with accounting principles generally accepted in the United States of America (“U.S. GAAP”), which may require management to make estimates and assumptions that affect the reported amounts of assets and liabilities in the financial statements, disclosure of contingent assets and liabilities at the date of the financial statements and the reported amounts of increases and decreases in net assets from operations during the reporting period. Actual results could differ from those estimates. The Master Portfolio is considered an investment company under U.S. GAAP and follows the accounting and reporting guidance applicable to investment companies. Below is a summary of significant accounting policies:
Investment Transactions and Income Recognition: For financial reporting purposes, investment transactions are recorded on the dates the transactions are executed. Realized gains and losses on investment transactions are determined using the specific identification method. Dividend income and capital gain distributions, if any, are recorded on the ex-dividend dates. Non-cash dividends, if any, are recorded on the ex-dividend dates at fair value. Interest income, including amortization and accretion of premiums and discounts on debt securities, is recognized daily on an accrual basis.
Segregation and Collateralization: In cases where the Master Portfolio enters into certain investments (e.g., dollar rolls and TBA sale commitments) that would be treated as “senior securities” for 1940 Act purposes, the Master Portfolio may segregate or designate on its books and records cash or liquid assets having a market value at least equal to the amount of its future obligations under such investments. Doing so allows the investment to be excluded from treatment as a “senior security.” Furthermore, if required by an exchange or counterparty agreement, the Master Portfolio may be required to deliver/deposit cash and/or securities to/with an exchange, or broker-dealer or custodian as collateral for certain investments or obligations.
Indemnifications: In the normal course of business, the Master Portfolio enters into contracts that contain a variety of representations that provide general indemnification. The Master Portfolio’s maximum exposure under these arrangements is unknown because it involves future potential claims against the Master Portfolio, which cannot be predicted with any certainty.
Other: Expenses directly related to the Master Portfolio are charged to the Master Portfolio. Other operating expenses shared by several funds, including other funds managed by the Manager, are prorated among those funds on the basis of relative net assets or other appropriate methods.
| 3. | INVESTMENT VALUATION AND FAIR VALUE MEASUREMENTS |
Investment Valuation Policies: The Master Portfolio’s investments are valued at fair value (also referred to as “market value” within the financial statements) each day that the Master Portfolio is open for business and, for financial reporting purposes, as of the report date. U.S. GAAP defines fair value as the price a fund would receive to sell an asset or pay to transfer a liability in an orderly transaction between market participants at the measurement date. The Master Portfolio determines the fair values of its financial instruments using various independent dealers or pricing services under policies approved by the Board of Trustees of the MIP (the “Board”). If a security’s market price is not readily available or does not otherwise accurately represent the fair value of the security, the security will be valued in accordance with a policy approved by the Board as reflecting fair value. The BlackRock Global Valuation Methodologies Committee (the “Global Valuation Committee”) is the committee formed by management to develop global pricing policies and procedures and to oversee the pricing function for all financial instruments.
Fair Value Inputs and Methodologies: The following methods and inputs are used to establish the fair value of the Master Portfolio’s assets and liabilities:
| | • | | Fixed-income investments for which market quotations are readily available are generally valued using the last available bid price or current market quotations provided by independent dealers or third-party pricing services. Floating rate loan interests are valued at the mean of the bid prices from one or more independent brokers or dealers as obtained from a third-party pricing service. Pricing services generally value fixed-income securities assuming orderly transactions of an institutional round lot size, but a fund may hold or transact in such securities in smaller, odd lot sizes. Odd lots may trade at lower prices than institutional round lots. The pricing services may use matrix pricing or valuation models that utilize certain inputs and assumptions to derive values, including transaction data (e.g., recent representative bids and offers), market data, credit quality information, perceived market movements, news, and other relevant information. Certain fixed-income securities, including asset- backed and mortgage related securities may be valued based on valuation models that consider the estimated cash flows of each tranche of the entity, establish a benchmark yield and develop an estimated tranche specific spread to the benchmark yield based on the unique attributes of the tranche. The amortized cost method of valuation may be used with respect to debt obligations with sixty days or less remaining to maturity unless the Manager determines such method does not represent fair value. |
| | • | | Investments in open-end U.S. mutual funds (including money market funds) are valued at that day’s published net asset value (“NAV”). |
If events (e.g., market volatility, company announcement or a natural disaster) occur that are expected to materially affect the value of such investment, or in the event that application of these methods of valuation results in a price for an investment that is deemed not to be representative of the market value of such investment, or if a price is not available, the investment will be valued by the Global Valuation Committee, or its delegate, in accordance with a policy approved by the Board as reflecting fair value (“Fair Valued Investments”). The fair valuation approaches that may be used by the Global Valuation Committee include market approach, income approach and cost approach.
| | |
| 82 | | 2 0 2 1 BLACK ROCK ANNUAL REPORT TO SHAREHOLDERS |
Notes to Financial Statements (continued)
Valuation techniques such as discounted cash flow, use of market comparables and matrix pricing are types of valuation approaches and are typically used in determining fair value. When determining the price for Fair Valued Investments, the Global Valuation Committee, or its delegate, seeks to determine the price that the Master Portfolio might reasonably expect to receive or pay from the current sale or purchase of that asset or liability in an arm’s-length transaction. Fair value determinations shall be based upon all available factors that the Global Valuation Committee, or its delegate, deems relevant and consistent with the principles of fair value measurement. The pricing of all Fair Valued Investments is subsequently reported to the Board or a committee thereof on a quarterly basis.
Fair Value Hierarchy: Various inputs are used in determining the fair value of financial instruments. These inputs to valuation techniques are categorized into a fair value hierarchy consisting of three broad levels for financial reporting purposes as follows:
| | • | | Level 1 – Unadjusted price quotations in active markets/exchanges for identical assets or liabilities that the Master Portfolio has the ability to access; |
| | • | | Level 2 – Other observable inputs (including, but not limited to, quoted prices for similar assets or liabilities in markets that are active, quoted prices for identical or similar assets or liabilities in markets that are not active, inputs other than quoted prices that are observable for the assets or liabilities (such as interest rates, yield curves, volatilities, prepayment speeds, loss severities, credit risks and default rates) or other market–corroborated inputs); and |
| | • | | Level 3 – Unobservable inputs based on the best information available in the circumstances, to the extent observable inputs are not available (including the Global Valuation Committee’s assumptions used in determining the fair value of financial instruments). |
The hierarchy gives the highest priority to unadjusted quoted prices in active markets for identical assets or liabilities (Level 1 measurements) and the lowest priority to unobservable inputs (Level 3 measurements). Accordingly, the degree of judgment exercised in determining fair value is greatest for instruments categorized in Level 3. The inputs used to measure fair value may fall into different levels of the fair value hierarchy. In such cases, for disclosure purposes, the fair value hierarchy classification is determined based on the lowest level input that is significant to the fair value measurement in its entirety. Investments classified within Level 3 have significant unobservable inputs used by the Global Valuation Committee in determining the price for Fair Valued Investments. Level 3 investments include equity or debt issued by privately held companies or funds that may not have a secondary market and/or may have a limited number of investors. The categorization of a value determined for financial instruments is based on the pricing transparency of the financial instruments and is not necessarily an indication of the risks associated with investing in those securities.
| 4. | SECURITIES AND OTHER INVESTMENTS |
Asset-Backed and Mortgage-Backed Securities: Asset-backed securities are generally issued as pass-through certificates or as debt instruments. Asset-backed securities issued as pass-through certificates represent undivided fractional ownership interests in an underlying pool of assets. Asset-backed securities issued as debt instruments, which are also known as collateralized obligations, are typically issued as the debt of a special purpose entity organized solely for the purpose of owning such assets and issuing such debt. Asset-backed securities are often backed by a pool of assets representing the obligations of a number of different parties. The yield characteristics of certain asset-backed securities may differ from traditional debt securities. One such major difference is that all or a principal part of the obligations may be prepaid at any time because the underlying assets (i.e., loans) may be prepaid at any time. As a result, a decrease in interest rates in the market may result in increases in the level of prepayments as borrowers, particularly mortgagors, refinance and repay their loans. An increased prepayment rate with respect to an asset-backed security will have the effect of shortening the maturity of the security. In addition, a fund may subsequently have to reinvest the proceeds at lower interest rates. If a fund has purchased such an asset-backed security at a premium, a faster than anticipated prepayment rate could result in a loss of principal to the extent of the premium paid.
For mortgage pass-through securities (the “Mortgage Assets”) there are a number of important differences among the agencies and instrumentalities of the U.S. Government that issue mortgage-related securities and among the securities that they issue. For example, mortgage-related securities guaranteed by Ginnie Mae are guaranteed as to the timely payment of principal and interest by Ginnie Mae and such guarantee is backed by the full faith and credit of the United States. However, mortgage-related securities issued by Freddie Mac and Fannie Mae, including Freddie Mac and Fannie Mae guaranteed mortgage pass-through certificates, which are solely the obligations of Freddie Mac and Fannie Mae, are not backed by or entitled to the full faith and credit of the United States, but are supported by the right of the issuer to borrow from the U.S. Treasury.
Non-agency mortgage-backed securities are securities issued by non-governmental issuers and have no direct or indirect government guarantees of payment and are subject to various risks. Non-agency mortgage loans are obligations of the borrowers thereunder only and are not typically insured or guaranteed by any other person or entity. The ability of a borrower to repay a loan is dependent upon the income or assets of the borrower. A number of factors, including a general economic downturn, acts of God, terrorism, social unrest and civil disturbances, may impair a borrower’s ability to repay its loans.
Multiple Class Pass-Through Securities: Multiple class pass-through securities, including collateralized mortgage obligations (“CMOs”) and commercial mortgage-backed securities, may be issued by Ginnie Mae, U.S. Government agencies or instrumentalities or by trusts formed by private originators of, or investors in, mortgage loans. In general, CMOs are debt obligations of a legal entity that are collateralized by a pool of residential or commercial mortgage loans or mortgage pass-through securities (the “Mortgage Assets”). The payments on these are used to make payments on the CMOs or multiple pass-through securities. Multiple class pass-through securities represent direct ownership interests in the Mortgage Assets. Classes of CMOs include interest only (“IOs”), principal only (“POs”), planned amortization classes and targeted amortization classes. IOs and POs are stripped mortgage-backed securities representing interests in a pool of mortgages, the cash flow from which has been separated into interest and principal components. IOs receive the interest portion of the cash flow while POs receive the principal portion. IOs and POs can be extremely volatile in response to changes in interest rates. As interest rates rise and fall, the value of IOs tends to move in the same direction as interest rates. POs perform best when prepayments on the underlying mortgages rise since this increases the rate at which the principal is returned and the yield to maturity on the PO. When payments on mortgages underlying a PO are slower than anticipated, the life of the PO is lengthened and the yield to maturity is reduced. If the underlying Mortgage Assets experience greater than anticipated prepayments of principal, a fund’s initial investment in the IOs may not fully recoup.
Capital Securities and Trust Preferred Securities: Capital securities, including trust preferred securities, are typically issued by corporations, generally in the form of interest-bearing notes with preferred securities characteristics. In the case of trust preferred securities, an affiliated business trust of a corporation issues these securities, generally in the form of beneficial interests in subordinated debentures or similarly structured securities. The securities can be structured with either a fixed or adjustable
| | |
MASTER PORTFOLIO NOTES TO FINANCIAL STATEMENTS | | 83 |
Notes to Financial Statements (continued)
coupon that can have either a perpetual or stated maturity date. For trust preferred securities, the issuing bank or corporation pays interest to the trust, which is then distributed to holders of these securities as a dividend. Dividends can be deferred without creating an event of default or acceleration, although maturity cannot take place unless all cumulative payment obligations have been met. The deferral of payments does not affect the purchase or sale of these securities in the open market. These securities generally are rated below that of the issuing company’s senior debt securities and are freely callable at the issuer’s option.
TBA Commitments: TBA commitments are forward agreements for the purchase or sale of securities, including mortgage-backed securities for a fixed price, with payment and delivery on an agreed upon future settlement date. The specific securities to be delivered are not identified at the trade date. However, delivered securities must meet specified terms, including issuer, rate and mortgage terms. When entering into TBA commitments, a fund may take possession of or deliver the underlying mortgage-backed securities but can extend the settlement or roll the transaction. TBA commitments involve a risk of loss if the value of the security to be purchased or sold declines or increases, respectively, prior to settlement date, if there are expenses or delays in connection with the TBA transactions, or if the counterparty fails to complete the transaction.
In order to better define contractual rights and to secure rights that will help a fund mitigate its counterparty risk, TBA commitments may be entered into by a fund under Master Securities Forward Transaction Agreements (each, an “MSFTA”). An MSFTA typically contains, among other things, collateral posting terms and netting provisions in the event of default and/or termination event. The collateral requirements are typically calculated by netting the mark-to-market amount for each transaction under such agreement and comparing that amount to the value of the collateral currently pledged by a fund and the counterparty. Cash collateral that has been pledged to cover the obligations of a fund and cash collateral received from the counterparty, if any, is reported separately in the Statement of Assets and Liabilities as cash pledged as collateral for TBA commitments or cash received as collateral for TBA commitments, respectively. Non-cash collateral pledged by a fund, if any, is noted in the Schedule of Investments. Typically, a fund is permitted to sell, re-pledge or use the collateral it receives; however, the counterparty is not permitted to do so. To the extent amounts due to a fund are not fully collateralized, contractually or otherwise, a fund bears the risk of loss from counterparty non-performance.
Mortgage Dollar Roll Transactions: The Master Portfolio may sell TBA mortgage-backed securities and simultaneously contract to repurchase substantially similar (i.e., same type, coupon and maturity) securities on a specific future date at an agreed upon price. During the period between the sale and repurchase, a fund is not entitled to receive interest and principal payments on the securities sold. Mortgage dollar roll transactions are treated as purchases and sales and a fund realizes gains and losses on these transactions. Mortgage dollar rolls involve the risk that the market value of the securities that a fund is required to purchase may decline below the agreed upon repurchase price of those securities.
Securities Lending: The Master Portfolio may lend its securities to approved borrowers, such as brokers, dealers and other financial institutions. The borrower pledges and maintains with the Master Portfolio collateral consisting of cash, an irrevocable letter of credit issued by a bank, or securities issued or guaranteed by the U.S. Government. The initial collateral received by the Master Portfolio is required to have a value of at least 102% of the current value of the loaned securities for securities traded on U.S. exchanges and a value of at least 105% for all other securities. The collateral is maintained thereafter at a value equal to at least 100% of the current market value of the securities on loan. The market value of the loaned securities is determined at the close of each business day of the Master Portfolio and any additional required collateral is delivered to the Master Portfolio, or excess collateral returned by the Master Portfolio, on the next business day. During the term of the loan, the Master Portfolio is entitled to all distributions made on or in respect of the loaned securities, but does not receive interest income on securities received as collateral. Loans of securities are terminable at any time and the borrower, after notice, is required to return borrowed securities within the standard time period for settlement of securities transactions.
As of period end, any securities on loan were collateralized by cash and/or U.S. Government obligations. Cash collateral invested by the securities lending agent, BlackRock Institutional Trust Company, N.A. (“BTC”), if any, is disclosed in the Schedule of Investments. Any non-cash collateral received cannot be sold, re-invested or pledged by the Master Portfolio, except in the event of borrower default. The securities on loan, if any, are disclosed in the Master Portfolio’s Schedule of Investments. The market value of any securities on loan and the value of any related collateral are shown separately in the Statement of Assets and Liabilities as a component of investments at value –unaffiliated and collateral on securities loaned at value, respectively.
Securities lending transactions are entered into by the Master Portfolio under Master Securities Lending Agreements (each, an “MSLA”), which provide the right, in the event of default (including bankruptcy or insolvency), for the non-defaulting party to liquidate the collateral and calculate a net exposure to the defaulting party or request additional collateral. In the event that a borrower defaults, the Master Portfolio, as lender, would offset the market value of the collateral received against the market value of the securities loaned. When the value of the collateral is greater than that of the market value of the securities loaned, the lender is left with a net amount payable to the defaulting party. However, bankruptcy or insolvency laws of a particular jurisdiction may impose restrictions on or prohibitions against such a right of offset in the event of an MSLA counterparty’s bankruptcy or insolvency. Under the MSLA, absent an event of default, the borrower can resell or re-pledge the loaned securities, and the Master Portfolio can reinvest cash collateral received in connection with loaned securities. Upon an event of default, the parties’ obligations to return the securities or collateral to the other party are extinguished, and the parties can resell or re-pledge the loaned securities or the collateral received in connection with the loaned securities in order to satisfy the defaulting party’s net payment obligation for all transactions under the MSLA. The defaulting party remains liable for any deficiency.
As of period end, the following table is a summary of the Master Portfolio’s securities on loan by counterparty which are subject to offset under an MSLA:
| | | | | | | | | | | | | | | | | | | | | | |
| | | | | | | |
| Counterparty | | | |
| Securities
Loaned at Value |
| | | | | |
| Cash Collateral
Received |
(a) | |
| Non-Cash Collateral
Received at Fair Value |
| |
| Net
Amount |
|
| | | | | | |
Barclays Bank PLC | | | | | $ 22,064,523 | | | | | | | | $ (22,064,523 | ) | | | $ — | | | | $ — | |
Barclays Capital, Inc. | | | | | 100,257,006 | | | | | | | | (100,257,006 | ) | | | — | | | | — | |
BMO Capital Markets Corp. | | | | | 3,770,355 | | | | | | | | (3,770,355 | ) | | | — | | | | — | |
BNP Paribas SA | | | | | 38,884,611 | | | | | | | | (38,884,611 | ) | | | — | | | | — | |
BofA Securities, Inc. | | | | | 388,647,245 | | | | | | | | (388,647,245 | ) | | | — | | | | — | |
Citadel Clearing LLC | | | | | 3,296,720 | | | | | | | | (3,296,720 | ) | | | — | | | | — | |
Citigroup Global Markets, Inc. | | | | | 656,216,635 | | | | | | | | (656,216,635 | ) | | | — | | | | — | |
Credit Agricole Corporate & Investment Bank SA | | | | | 154,592,031 | | | | | | | | (154,592,031 | ) | | | — | | | | — | |
Credit Suisse Securities (USA) LLC | | | | | 6,164,301 | | | | | | | | (6,164,301 | ) | | | — | | | | — | |
| | |
| 84 | | 2 0 2 1 BLACK ROCK ANNUAL REPORT TO SHAREHOLDERS |
Notes to Financial Statements (continued)
| | | | | | | | | | | | | | | | | | | | | | | | | | | | | | |
| | | | | | | |
| | Securities | | | | Cash Collateral | | | | | | | | Non-Cash Collateral | | | | | | | | Net | |
| Counterparty | | Loaned at Value | | | | | | | | Received | (a) | | | Received at Fair Value | | | | Amount | |
| | | | | | | | |
Deutsche Bank Securities, Inc. | | | | $ | 84,078,620 | | | | | | | $ | (84,078,620 | ) | | | | | | $ | — | | | | | | | $ | — | |
Goldman Sachs & Co. LLC | | | | | 109,222,014 | | | | | | | | (109,222,014 | ) | | | | | | | — | | | | | | | | — | |
HSBC Securities (USA), Inc. | | | | | 31,741,221 | | | | | | | | (31,741,221 | ) | | | | | | | — | | | | | | | | — | |
Jefferies LLC | | | | | 942,829 | | | | | | | | (942,829 | ) | | | | | | | — | | | | | | | | — | |
JPMorgan Securities LLC | | | | | 1,060,261,528 | | | | | | | | (1,060,261,528 | ) | | | | | | | — | | | | | | | | — | |
Morgan Stanley | | | | | 492,536,338 | | | | | | | | (492,536,338 | ) | | | | | | | — | | | | | | | | — | |
Nomura Securities International, Inc. | | | | | 6,345,942 | | | | | | | | (6,345,942 | ) | | | | | | | — | | | | | | | | — | |
Pershing LLC | | | | | 946,493 | | | | | | | | (946,493 | ) | | | | | | | — | | | | | | | | — | |
RBC Capital Markets LLC | | | | | 175,640,595 | | | | | | | | (175,640,595 | ) | | | | | | | — | | | | | | | | — | |
Scotia Capital (USA), Inc. | | | | | 7,807,197 | | | | | | | | (7,807,197 | ) | | | | | | | — | | | | | | | | — | |
State Street Bank & Trust Co. | | | | | 2,916,654 | | | | | | | | (2,916,654 | ) | | | | | | | — | | | | | | | | — | |
TD Securities (USA) LLC | | | | | 25,191,406 | | | | | | | | (25,191,406 | ) | | | | | | | — | | | | | | | | — | |
Toronto Dominion Bank | | | | | 9,196,579 | | | | | | | | (9,196,579 | ) | | | | | | | — | | | | | | | | — | |
Wells Fargo Securities LLC | | | | | 11,176,885 | | | | | | | | (11,176,885 | ) | | | | | | | — | | | | | | | | — | |
| | | | | | | | | | | | | | | | | | | | | | | | | | | | | | |
| | | | | | | | |
| | | | $ | 3,391,897,728 | | | | | | | $ | (3,391,897,728 | ) | | | | | | $ | — | | | | | | | $ | — | |
| | | | | | | | | | | | | | | | | | | | | | | | | | | | | | |
| | (a) | Collateral received in excess of the market value of securities on loan is not presented in this table. The total cash collateral received by the Master Portfolio is disclosed in the Master Portfolio’s Statement of Assets and Liabilities. | |
The risks of securities lending include the risk that the borrower may not provide additional collateral when required or may not return the securities when due. To mitigate these risks, the Master Portfolio benefits from a borrower default indemnity provided by BlackRock, Inc. (“BlackRock”). BlackRock’s indemnity allows for full replacement of the securities loaned to the extent the collateral received does not cover the value on the securities loaned in the event of borrower default. The Master Portfolio could incur a loss if the value of an investment purchased with cash collateral falls below the market value of loaned securities or if the value of an investment purchased with cash collateral falls below the value of the original cash collateral received. Such losses are borne entirely by the Master Portfolio.
| 5. | INVESTMENT ADVISORY AGREEMENT AND OTHER TRANSACTIONS WITH AFFILIATES |
Investment Advisory: MIP, on behalf of the Master Portfolio, entered into an Investment Advisory Agreement with the Manager, the Master Portfolio’s investment adviser and an indirect, wholly-owned subsidiary of BlackRock, to provide investment advisory and administrative services. The Manager is responsible for the management of the Master Portfolio’s portfolio and provides the personnel, facilities, equipment and certain other services necessary to the operations of the Master Portfolio.
For such services, the Master Portfolio pays the Manager a monthly fee at an annual rate equal to 0.04% of the average daily value of the Master Portfolio’s net assets.
Administration: MIP, on behalf of the Master Portfolio entered into an Administration Agreement with BlackRock Advisors, LLC (“BAL”), which has agreed to provide general administrative services (other than investment advice and related portfolio activities). BAL has agreed to bear all of the Master Portfolio’s ordinary operating expenses, excluding, generally, investment advisory fees, distribution fees, brokerage and other expenses related to the execution of portfolio transactions, extraordinary expenses and certain other expenses which are borne by the Master Portfolio. BAL is entitled to receive for these administrative services an annual fee based on the average daily net assets of the Master Portfolio.
BAL is not entitled to compensation for providing administrative services to the Master Portfolio, for so long as BAL (or an affiliate) is entitled to compensation for providing administrative services to corresponding feeder funds that invest substantially all of their assets in the Master Portfolio, or BAL (or an affiliate) receives investment advisory fees from the Master Portfolio.
Expense Waivers and Reimbursements: The fees and expenses of MIP’s trustees who are not “interested persons” of MIP, as defined in the 1940 Act (“Independent Trustees”), counsel to the Independent Trustees and the Master Portfolio’s independent registered public accounting firm (together, the “independent expenses”) are paid directly by the Master Portfolio. BAL and BFA have contractually agreed to reimburse the Master Portfolio or provide an offsetting credit against the administration fees paid by the Master Portfolio in an amount equal to these independent expenses through June 30, 2023. The amount waived is included in fees waived and/or reimbursed by the Manager in the Statement of Operations. For the year ended December 31, 2021, the amount waived was $233,426.
The Manager contractually agreed to waive its investment advisory fees by the amount of investment advisory fees the Master Portfolio pays to the Manager indirectly through its investment in affiliated money market funds (the “affiliated money market fund waiver”) through June 30, 2023. The contractual agreement may be terminated upon 90 days’ notice by a majority of the Independent Trustees, or by a vote of a majority of the outstanding voting securities of the Master Portfolio. This amount is included in fees waived and/or reimbursed by the Manager in the Statement of Operations. For the year ended December 31, 2021, the amounts waived were $965,418.
| | |
MASTER PORTFOLIO NOTES TO FINANCIAL STATEMENTS | | 85 |
Notes to Financial Statements (continued)
The Manager has contractually agreed to waive its investment advisory fee with respect to any portion of the Master Portfolio’s assets invested in affiliated equity and fixed-income mutual funds and affiliated exchange-traded funds that have a contractual management fee through June 30, 2023. The agreement can be renewed for annual periods thereafter, and may be terminated on 90 days’ notice, each subject to approval by a majority of the Master Portfolio’s Independent Trustees. For the year ended December 31, 2021, there were no fees waived by the Manager pursuant to this arrangement.
Securities Lending: The U.S. Securities and Exchange Commission (“SEC”) has issued an exemptive order which permits BTC, an affiliate of the Manager, to serve as securities lending agent for the Master Portfolio, subject to applicable conditions. As securities lending agent, BTC bears all operational costs directly related to securities lending, including any custodial costs. The Master Portfolio is responsible for fees in connection with the investment of cash collateral received for securities on loan (the “collateral investment fees”). The cash collateral is invested in a money market fund, BlackRock Cash Funds: Institutional or BlackRock Cash Funds: Treasury, managed by the Manager or its affiliates. However, BTC has agreed to reduce the amount of securities lending income it receives in order to effectively limit the collateral investment fees the Master Portfolio bears to an annual rate of 0.04%. The SL Agency Shares of such money market fund will not be subject to a sales load, distribution fee or service fee. The money market fund in which the cash collateral has been invested may, under certain circumstances, impose a liquidity fee of up to 2% of the value redeemed or temporarily restrict redemptions for up to 10 business days during a 90 day period, in the event that the money market fund’s weekly liquid assets fall below certain thresholds.
Securities lending income is equal to the total of income earned from the reinvestment of cash collateral, net of fees and other payments to and from borrowers of securities, and less the collateral investment fees. The Master Portfolio retains a portion of securities lending income and remits a remaining portion to BTC as compensation for its services as securities lending agent.
Pursuant to the current securities lending agreement, the Master Portfolio retains 82% of securities lending income (which excludes collateral investment fees), and this amount retained can never be less than 70% of the total of securities lending income plus the collateral investment fees.
In addition, commencing the business day following the date that the aggregate securities lending income earned across the BlackRock Multi-Asset Complex in a calendar year exceeds a specified threshold, the Master Portfolio, pursuant to the securities lending agreement, will retain for the remainder of that calendar year securities lending income in an amount equal to 85% of securities lending income (which excludes collateral investment fees), and this amount retained can never be less than 70% of the total of securities lending income plus the collateral investment fees.
The share of securities lending income earned by the Master Portfolio is shown as securities lending income — affiliated — net in the Statement of Operations. For the year ended December 31, 2021, the Master Portfolio paid BTC $2,138,436 for securities lending agent services.
Interfund Lending: In accordance with an exemptive order (the “Order”) from the SEC, the Master Portfolio may participate in a joint lending and borrowing facility for temporary purposes (the “Interfund Lending Program”), subject to compliance with the terms and conditions of the Order, and to the extent permitted by the Master Portfolio’s investment policies and restrictions. The Master Portfolio is currently permitted to borrow and lend under the Interfund Lending Program.
A lending BlackRock fund may lend in aggregate up to 15% of its net assets but may not lend more than 5% of its net assets to any one borrowing fund through the Interfund Lending Program. A borrowing BlackRock fund may not borrow through the Interfund Lending Program or from any other source more than 33 1/3% of its total assets (or any lower threshold provided for by the fund’s investment restrictions). If a borrowing BlackRock fund’s total outstanding borrowings exceed 10% of its total assets, each of its outstanding interfund loans will be subject to collateralization of at least 102% of the outstanding principal value of the loan. All interfund loans are for temporary or emergency purposes and the interest rate to be charged will be the average of the highest current overnight repurchase agreement rate available to a lending fund and the bank loan rate, as calculated according to a formula established by the Board.
During the year ended December 31, 2021, the Master Portfolio did not participate in the Interfund Lending Program.
Trustees and Officers: Certain trustees and/or officers of MIP are directors and/or officers of BlackRock or its affiliates.
Other Transactions: The Master Portfolio may purchase securities from, or sell securities to, an affiliated fund provided the affiliation is due solely to having a common investment adviser, common officers, or common trustees. For the year ended December 31, 2021, the purchase and sale transactions and any net realized gains (losses) with affiliated funds in compliance with Rule 17a-7 under the 1940 Act were as follows:
| | | | | | | | | | | | |
| |
| | | |
| Master Portfolio Name | | Purchases | | | Sales | | | Net Realized
Gain (Loss) | |
| |
| | | |
U.S. Total Bond Index Master Portfolio | | $ | 33,267,958 | | | $ | 9,335,831 | | | $ | 113,031 | |
| |
For the year ended December 31, 2021, purchases and sales of investments, including paydowns/payups and mortgage dollar rolls, excluding short-term investments, were as follows:
| | | | | | | | | | | | | | | | |
| |
| | |
| | | U.S. Government Securities | | | Other Securities | |
| | | | |
| | | | |
| Master Portfolio Name | | Purchases | | | Sales | | | Purchases | | | Sales | |
| |
| | | | |
U.S. Total Bond Index Master Portfolio | | | $ 2,377,802,433 | | | | $ 693,274,605 | | | | $ 29,328,426,620 | | | | $ 27,658,425,821 | |
| |
For the year ended December 31, 2021, purchases and sales related to mortgage dollar rolls were $13,998,406,296 and $14,008,999,933, respectively.
| | |
| 86 | | 2 0 2 1 BLACK ROCK ANNUAL REPORT TO SHAREHOLDERS |
Notes to Financial Statements (continued)
The Master Portfolio is classified as a partnership for U.S. federal income tax purposes. As such, each investor in the Master Portfolio is treated as the owner of its proportionate share of net assets, income, expenses and realized and unrealized gains and losses of the Master Portfolio. Therefore, no U.S. federal income tax provision is required. It is intended that the Master Portfolio’s assets will be managed so an investor in the Master Portfolio can satisfy the requirements of Subchapter M of the Internal Revenue Code of 1986, as amended.
The Master Portfolio files U.S. federal and various state and local tax returns. No income tax returns are currently under examination. The statute of limitations on the Master Portfolio’s U.S. federal tax returns generally remains open for a period of three fiscal years after they are filed. The statutes of limitations on the Master Portfolio’s state and local tax returns may remain open for an additional year depending upon the jurisdiction.
Management has analyzed tax laws and regulations and their application to the Master Portfolio as of December 31, 2021, inclusive of the open tax return years, and does not believe that there are any uncertain tax positions that require recognition of a tax liability in the Master Portfolio’s financial statements.
As of December 31, 2021, gross unrealized appreciation and depreciation based on cost of investments (including short positions and derivatives, if any) for U.S. federal income tax purposes were as follows:
| | | | | | | | | | | | | | | | |
| |
| | | | |
| Master Portfolio Name | | Tax Cost | | | Gross Unrealized Appreciation | | | Gross Unrealized
Depreciation | | | Net Unrealized Appreciation (Depreciation) | |
| |
| | | | |
U.S. Total Bond Index Master Portfolio | | $ | 21,974,625,003 | | | $ | 490,717,049 | | | $ | (176,473,403 | ) | | $ | 314,243,646 | |
| | | | | | | | | | | | | | | | |
MIP, on behalf of the Master Portfolio, along with certain other funds managed by the Manager and its affiliates (“Participating Funds”), is a party to a 364-day, $2.25 billion credit agreement with a group of lenders. Under this agreement, the Master Portfolio may borrow to fund shareholder redemptions. Excluding commitments designated for certain individual funds, the Participating Funds, including the Master Portfolio, can borrow up to an aggregate commitment amount of $1.75 billion at any time outstanding, subject to asset coverage and other limitations as specified in the agreement. The credit agreement has the following terms: a fee of 0.10% per annum on unused commitment amounts and interest at a rate equal to the higher of (a) one-month London Interbank Offered Rate (“LIBOR”) (but, in any event, not less than 0.00%) on the date the loan is made plus 0.80% per annum or (b) the Fed Funds rate (but, in any event, not less than 0.00%) in effect from time to time plus 0.80% per annum on amounts borrowed. The agreement expires in April 2022 unless extended or renewed. These fees were allocated among such funds based upon portions of the aggregate commitment available to them and relative net assets of Participating Funds. During the year ended December 31, 2021, the Master Portfolio did not borrow under the credit agreement.
In the normal course of business, the Master Portfolio invests in securities or other instruments and may enter into certain transactions, and such activities subject the Master Portfolio to various risks, including among others, fluctuations in the market (market risk) or failure of an issuer to meet all of its obligations. The value of securities or other instruments may also be affected by various factors, including, without limitation: (i) the general economy; (ii) the overall market as well as local, regional or global political and/or social instability; (iii) regulation, taxation or international tax treaties between various countries; or (iv) currency, interest rate and price fluctuations. Local, regional or global events such as war, acts of terrorism, the spread of infectious illness or other public health issues, recessions, or other events could have a significant impact on the Master Portfolio and its investments. The Master Portfolio’s prospectus provides details of the risks to which the Master Portfolio is subject.
BFA uses a “passive” or index approach to try to achieve the Master Portfolio’s investment objective following the securities included in its underlying index during upturns as well as downturns. BFA does not take steps to reduce market exposure or to lessen the effects of a declining market. Divergence from the underlying index and the composition of the portfolio is monitored by BFA.
The Master Portfolio may be exposed to additional risks when reinvesting cash collateral in money market funds that do not seek to maintain a stable NAV per share of $1.00, which may be subject to redemption gates or liquidity fees under certain circumstances.
Market Risk: The Master Portfolio may be exposed to prepayment risk, which is the risk that borrowers may exercise their option to prepay principal earlier than scheduled during periods of declining interest rates, which would force the Master Portfolio to reinvest in lower yielding securities. The Master Portfolio may also be exposed to reinvestment risk, which is the risk that income from the Master Portfolio’s portfolio will decline if the Master Portfolio invests the proceeds from matured, traded or called fixed-income securities at market interest rates that are below the Master Portfolio portfolio’s current earnings rate.
Municipal securities are subject to the risk that litigation, legislation or other political events, local business or economic conditions, credit rating downgrades, or the bankruptcy of the issuer could have a significant effect on an issuer’s ability to make payments of principal and/or interest or otherwise affect the value of such securities. Municipal securities can be significantly affected by political or economic changes, including changes made in the law after issuance of the securities, as well as uncertainties in the municipal market related to, taxation, legislative changes or the rights of municipal security holders, including in connection with an issuer insolvency. Municipal securities backed by current or anticipated revenues from a specific project or specific assets can be negatively affected by the discontinuance of the tax benefits supporting the project or assets or the inability to collect revenues for the project or from the assets. Municipal securities may be less liquid than taxable bonds, and there may be less publicly available information on the financial condition of municipal security issuers than for issuers of other securities.
| | |
MASTER PORTFOLIO NOTES TO FINANCIAL STATEMENTS | | 87 |
Notes to Financial Statements (continued)
An outbreak of respiratory disease caused by a novel coronavirus has developed into a global pandemic and has resulted in closing borders, quarantines, disruptions to supply chains and customer activity, as well as general concern and uncertainty. The impact of this pandemic, and other global health crises that may arise in the future, could affect the economies of many nations, individual companies and the market in general in ways that cannot necessarily be foreseen at the present time. This pandemic may result in substantial market volatility and may adversely impact the prices and liquidity of a fund’s investments. The duration of this pandemic and its effects cannot be determined with certainty.
Counterparty Credit Risk: The Master Portfolio may be exposed to counterparty credit risk, or the risk that an entity may fail to or be unable to perform on its commitments related to unsettled or open transactions, including making timely interest and/or principal payments or otherwise honoring its obligations. The Master Portfolio manages counterparty credit risk by entering into transactions only with counterparties that the Manager believes have the financial resources to honor their obligations and by monitoring the financial stability of those counterparties. Financial assets, which potentially expose the Master Portfolio to market, issuer and counterparty credit risks, consist principally of financial instruments and receivables due from counterparties. The extent of the Master Portfolio’s exposure to market, issuer and counterparty credit risks with respect to these financial assets is approximately their value recorded in the Statement of Assets and Liabilities, less any collateral held by the Master Portfolio.
Concentration Risk: A diversified portfolio, where this is appropriate and consistent with a fund’s objectives, minimizes the risk that a price change of a particular investment will have a material impact on the NAV of a fund. The investment concentrations within the Master Portfolio’s portfolio are disclosed in its Schedule of Investments.
The Master Portfolio invests a significant portion of its assets in fixed-income securities and/or uses derivatives tied to the fixed-income markets. Changes in market interest rates or economic conditions may affect the value and/or liquidity of such investments. Interest rate risk is the risk that prices of bonds and other fixed-income securities will increase as interest rates fall and decrease as interest rates rise. The Master Portfolio may be subject to a greater risk of rising interest rates due to the current period of historically low rates.
The Master Portfolio invests a significant portion of its assets in securities backed by commercial or residential mortgage loans or in issuers that hold mortgage and other asset-backed securities. When a Master Portfolio concentrates its investments in this manner, it assumes a greater risk of prepayment or payment extension by securities issuers. Changes in economic conditions, including delinquencies and/or defaults on assets underlying these securities, can affect the value, income and/or liquidity of such positions. Investment percentages in these securities are presented in the Schedule of Investments.
LIBOR Transition Risk: The United Kingdom’s Financial Conduct Authority announced a phase out of the LIBOR. Although many LIBOR rates will cease to be published or no longer will be representative of the underlying market they seek to measure after December 31, 2021, a selection of widely used USD LIBOR rates will continue to be published through June 2023 in order to assist with the transition. The Master Portfolio may be exposed to financial instruments tied to LIBOR to determine payment obligations, financing terms, hedging strategies or investment value. The transition process away from LIBOR might lead to increased volatility and illiquidity in markets for, and reduce the effectiveness of new hedges placed against instruments whose terms currently include LIBOR. The ultimate effect of the LIBOR transition process on the Master Portfolio is uncertain.
Management has evaluated the impact of all subsequent events on the Master Portfolio through the date the financial statements were issued and has determined that there were no subsequent events requiring adjustment or additional disclosure in the financial statements.
| | |
| 88 | | 2 0 2 1 BLACK ROCK ANNUAL REPORT TO SHAREHOLDERS |
Report of Independent Registered Public Accounting Firm
To the Board of Trustees of Master Investment Portfolio and Investors of U.S. Total Bond Index Master Portfolio
Opinion on the Financial Statements
We have audited the accompanying statement of assets and liabilities, including the schedule of investments, of U.S. Total Bond Index Master Portfolio (one of the series constituting Master Investment Portfolio, referred to hereafter as the “Master Portfolio”) as of December 31, 2021, the related statement of operations for the year ended December 31, 2021, the statements of changes in net assets for each of the two years in the period ended December 31, 2021, including the related notes, and the financial highlights for each of the five years in the period ended December 31, 2021 (collectively referred to as the “financial statements”). In our opinion, the financial statements present fairly, in all material respects, the financial position of the Master Portfolio as of December 31, 2021, the results of its operations for the year then ended, the changes in its net assets for each of the two years in the period ended December 31, 2021 and the financial highlights for each of the five years in the period ended December 31, 2021 in conformity with accounting principles generally accepted in the United States of America.
Basis for Opinion
These financial statements are the responsibility of the Master Portfolio’s management. Our responsibility is to express an opinion on the Master Portfolio’s financial statements based on our audits. We are a public accounting firm registered with the Public Company Accounting Oversight Board (United States) (PCAOB) and are required to be independent with respect to the Master Portfolio in accordance with the U.S. federal securities laws and the applicable rules and regulations of the Securities and Exchange Commission and the PCAOB.
We conducted our audits of these financial statements in accordance with the standards of the PCAOB. Those standards require that we plan and perform the audit to obtain reasonable assurance about whether the financial statements are free of material misstatement, whether due to error or fraud.
Our audits included performing procedures to assess the risks of material misstatement of the financial statements, whether due to error or fraud, and performing procedures that respond to those risks. Such procedures included examining, on a test basis, evidence regarding the amounts and disclosures in the financial statements. Our audits also included evaluating the accounting principles used and significant estimates made by management, as well as evaluating the overall presentation of the financial statements. Our procedures included confirmation of securities owned as of December 31, 2021 by correspondence with the custodian, transfer agent and brokers; when replies were not received from brokers, we performed other auditing procedures. We believe that our audits provide a reasonable basis for our opinion.
/s/PricewaterhouseCoopers LLP
Philadelphia, Pennsylvania
February 24, 2022
We have served as the auditor of one or more BlackRock investment companies since 2000.
| | |
MASTER PORTFOLIO REPORT OF INDEPENDENT REGISTERED PUBLIC ACCOUNTING FIRM | | 89 |
| | |
| Statement Regarding Liquidity Risk Management Program | | |
In compliance with Rule 22e-4 under the Investment Company Act of 1940, as amended (the “Liquidity Rule”), BlackRock Funds III and Master Investment Portfolio (the “Trusts”) have adopted and implemented a liquidity risk management program (the “Program”) for iShares U.S. Aggregate Bond Index Fund and U.S. Total Bond Index Master Portfolio (the “Funds”), each a series of the respective Trust, which is reasonably designed to assess and manage each Fund’s liquidity risk.
The Board of Trustees (the “Board”) of the Trusts, on behalf of the Funds, met on November 9-10, 2021 (the “Meeting”) to review the Program. The Board previously appointed BlackRock Advisors, LLC or BlackRock Fund Advisors (“BlackRock”), each an investment adviser to certain BlackRock funds, as the program administrator for each Fund’s Program, as applicable. BlackRock also previously delegated oversight of the Program to the 40 Act Liquidity Risk Management Committee (the “Committee”). At the Meeting, the Committee, on behalf of BlackRock, provided the Board with a report that addressed the operation of the Program and assessed its adequacy and effectiveness of implementation, including the management of each Fund’s Highly Liquid Investment Minimum (“HLIM”) where applicable, and any material changes to the Program (the “Report”). The Report covered the period from October 1, 2020 through September 30, 2021 (the “Program Reporting Period”).
The Report described the Program’s liquidity classification methodology for categorizing each Fund’s investments (including derivative transactions) into one of four liquidity buckets. It also referenced the methodology used by BlackRock to establish each Fund’s HLIM and noted that the Committee reviews and ratifies the HLIM assigned to each Fund no less frequently than annually. The Report also discussed notable events affecting liquidity over the Program Reporting Period, including the imposition of capital controls in certain countries.
The Report noted that the Program complied with the key factors for consideration under the Liquidity Rule for assessing, managing and periodically reviewing each Fund’s liquidity risk, as follows:
| a) | | The Fund’s investment strategy and liquidity of portfolio investments during both normal and reasonably foreseeable stressed conditions. During the Program Reporting Period, the Committee reviewed whether each Fund’s strategy is appropriate for an open-end fund structure with a focus on funds with more significant and consistent holdings of less liquid and illiquid assets. The Committee also factored a fund’s concentration in an issuer into the liquidity classification methodology by taking issuer position sizes into account. Where a fund participated in borrowings for investment purposes (such as tender option bonds or reverse repurchase agreements), such borrowings were factored into the Program’s calculation of a fund’s liquidity bucketing. Derivative exposure was also considered in such calculation. |
| b) | | Short-term and long-term cash flow projections during both normal and reasonably foreseeable stressed conditions. During the Program Reporting Period, the Committee reviewed historical redemption activity and used this information as a component to establish each Fund’s reasonably anticipated trading size (“RATS”). Each Fund has adopted an in-kind redemption policy which may be utilized to meet larger redemption requests. The Committee may also take into consideration a fund’s shareholder ownership concentration (which, depending on product type and distribution channel, may or may not be available), a fund’s distribution channels, and the degree of certainty associated with a fund’s short-term and long-term cash flow projections. |
| c) | | Holdings of cash and cash equivalents, as well as borrowing arrangements. The Committee considered the terms of the credit facility committed to each Fund, the financial health of the institution providing the facility and the fact that the credit facility is shared among multiple funds (including that a portion of the aggregate commitment amount is specifically designated for BlackRock Floating Rate Income Portfolio, a series of BlackRock Funds V). The Committee also considered other types of borrowing available to the Funds, such as the ability to use reverse repurchase agreements and interfund lending, as applicable. |
There were no material changes to the Program during the Program Reporting Period other than the enhancement of certain model components in the Program’s methodology. The Report provided to the Board stated that the Committee concluded that based on the operation of the functions, as described in the Report, the Program is operating as intended and is effective in implementing the requirements of the Liquidity Rule.
| | |
| 90 | | 2 0 2 1 BLACK ROCK ANNUAL REPORT TO SHAREHOLDERS |
Trustee and Officer Information
| | | | | | | | |
| Independent Trustees(a) |
| | | | | |
Name Year of Birth(b) | | Position(s) Held (Length of Service)(c) | | Principal Occupation(s) During Past Five Years | | Number of BlackRock-Advised Registered Investment Companies (“RICs”) Consisting of Investment Portfolios (“Portfolios”) Overseen | | Public Company
and Other
Investment
Company
Directorships Held During Past Five Years |
| | | | |
Mark Stalnecker 1951 | | Chair of the Board (Since 2019) and Trustee
(Since 2015) | | Chief Investment Officer, University of Delaware from 1999 to 2013; Trustee and Chair of the Finance and Investment Committees, Winterthur Museum and Country Estate from 2005 to 2016; Member of the Investment Committee, Delaware Public Employees’ Retirement System since 2002; Member of the Investment Committee, Christiana Care Health System from 2009 to 2017; Member of the Investment Committee, Delaware Community Foundation from 2013 to 2014; Director and Chair of the Audit Committee, SEI Private Trust Co. from 2001 to 2014. | | 30 RICs consisting of 159 Portfolios | | None |
| | | | |
Bruce R. Bond 1946 | | Trustee
(Since 2019) | | Board Member, Amsphere Limited (software) since 2018; Trustee and Member of the Governance Committee, State Street Research Mutual Funds from 1997 to 2005; Board Member of Governance, Audit and Finance Committee, Avaya Inc. (computer equipment) from 2003 to 2007. | | 30 RICs consisting of 159 Portfolios | | None |
| | | | |
Susan J. Carter 1956 | | Trustee
(Since 2016) | | Director, Pacific Pension Institute from 2014 to 2018; Advisory Board Member, Center for Private Equity and Entrepreneurship at Tuck School of Business since 1997; Senior Advisor, Commonfund Capital, Inc. (“CCI”) (investment adviser) in 2015; Chief Executive Officer, CCI from 2013 to 2014; President & Chief Executive Officer, CCI from 1997 to 2013; Advisory Board Member, Girls Who Invest from 2015 to 2018 and Board Member thereof since 2018; Advisory Board Member, Bridges Fund Management since 2016; Trustee, Financial Accounting Foundation since 2017; Practitioner Advisory Board Member, Private Capital Research Institute (“PCRI”) since 2017; Lecturer in the Practice of Management, Yale School of Management since 2019; Advisor to Finance Committee, Altman Foundation since 2020. | | 30 RICs consisting of 159 Portfolios | | None |
| | | | |
Collette Chilton 1958 | | Trustee
(Since 2015) | | Chief Investment Officer, Williams College since 2006; Chief Investment Officer, Lucent Asset Management Corporation from 1998 to 2006; Director, Boys and Girls Club of Boston since 2017; Director, B1 Capital since 2018; Director, David and Lucile Packard Foundation since 2020. | | 30 RICs consisting of 159 Portfolios | | None |
| | | | |
Neil A. Cotty 1954 | | Trustee
(Since 2016) | | Bank of America Corporation from 1996 to 2015, serving in various senior finance leadership roles, including Chief Accounting Officer from 2009 to 2015, Chief Financial Officer of Global Banking, Markets and Wealth Management from 2008 to 2009, Chief Accounting Officer from 2004 to 2008, Chief Financial Officer of Consumer Bank from 2003 to 2004, Chief Financial Officer of Global Corporate Investment Bank from 1999 to 2002. | | 30 RICs consisting of 159 Portfolios | | None |
| | | | |
Lena G. Goldberg 1949 | | Trustee
(Since 2019) | | Director, Charles Stark Draper Laboratory, Inc. since 2013; Senior Lecturer, Harvard Business School, from 2008 to 2021; FMR LLC/Fidelity Investments (financial services) from 1996 to 2008, serving in various senior roles including Executive Vice President - Strategic Corporate Initiatives and Executive Vice President and General Counsel; Partner, Sullivan & Worcester LLP from 1985 to 1996 and Associate thereof from 1979 to 1985. | | 30 RICs consisting of 159 Portfolios | | None |
| | |
TRUSTEE AND OFFICER INFORMATION | | 91 |
Trustee and Officer Information (continued)
| | | | | | | | |
| Independent Trustees(a) (continued) |
| | | | | |
Name Year of Birth(b) | | Position(s) Held (Length of Service)(c) | | Principal Occupation(s) During Past Five Years | | Number of BlackRock-Advised Registered Investment Companies (“RICs”) Consisting of Investment Portfolios (“Portfolios”) Overseen | | Public Company
and Other
Investment
Company
Directorships Held
During Past Five Years |
| | | | |
Henry R. Keizer 1956 | | Trustee
(Since 2019) | | Director, Park Indemnity Ltd. (captive insurer) since 2010; Director, MUFG Americas Holdings Corporation and MUFG Union Bank, N.A. (financial and bank holding company) from 2014 to 2016; Director, American Institute of Certified Public Accountants from 2009 to 2011; Director, KPMG LLP (audit, tax and advisory services) from 2004 to 2005 and 2010 to 2012; Director, KPMG International in 2012, Deputy Chairman and Chief Operating Officer thereof from 2010 to 2012 and U.S. Vice Chairman of Audit thereof from 2005 to 2010; Global Head of Audit, KPMGI (consortium of KPMG firms) from 2006 to 2010; Director, YMCA of Greater New York from 2006 to 2010. | | 30 RICs consisting of 159 Portfolios | | Hertz Global Holdings (car rental); Sealed Air Corp. (packaging); GrafTech International Ltd. (materials manufacturing); Montpelier Re Holdings, Ltd. (publicly held property and casualty reinsurance) from 2013 to 2015; WABCO (commercial vehicle safety systems) from 2015 to 2020. |
| | | | |
Cynthia A. Montgomery 1952 | | Trustee
(Since 2009) | | Professor, Harvard Business School since 1989. | | 30 RICs consisting of 159 Portfolios | | Newell Rubbermaid, Inc. (manufacturing) from 1995 to 2016. |
| | | | |
Donald C. Opatrny 1952 | | Trustee
(Since 2019) | | Trustee, Vice Chair, Member of the Executive Committee and Chair of the Investment Committee, Cornell University from 2004 to 2019; President, Trustee and Member of the Investment Committee, The Aldrich Contemporary Art Museum from 2007 to 2014; Member of the Board and Investment Committee, University School from 2007 to 2018; Member of the Investment Committee, Mellon Foundation from 2009 to 2015; Trustee, Artstor (a Mellon Foundation affiliate) from 2010 to 2015; President and Trustee, the Center for the Arts, Jackson Hole from 2011 to 2018; Director, Athena Capital Advisors LLC (investment management firm) since 2013; Trustee and Chair of the Investment Committee, Community Foundation of Jackson Hole since 2014; Member of Affordable Housing Supply Board of Jackson, Wyoming since 2017; Member, Investment Funds Committee, State of Wyoming since 2017; Trustee, Phoenix Art Museum since 2018; Trustee, Arizona Community Foundation and Member of Investment Committee since 2020. | | 30 RICs consisting of 159 Portfolios | | None |
| | | | |
Joseph P. Platt 1947 | | Trustee
(Since 2009) | | General Partner, Thorn Partners, LP (private investments) since 1998; Director, WQED Multi-Media (public broadcasting not-for-profit) since 2001; Chair, Basic Health International (non-profit) since 2015. | | 30 RICs consisting of 159 Portfolios | | Greenlight Capital Re, Ltd. (reinsurance company); Consol Energy Inc. |
| | |
| 92 | | 2 0 2 1 BLACK ROCK ANNUAL REPORT TO SHAREHOLDERS |
Trustee and Officer Information (continued)
| | | | | | | | |
| Independent Trustees(a) (continued) |
| | | | | |
Name Year of Birth(b) | | Position(s) Held (Length of Service)(c) | | Principal Occupation(s) During Past Five Years | | Number of BlackRock-Advised Registered Investment Companies (“RICs”) Consisting of Investment Portfolios (“Portfolios”) Overseen | | Public Company
and Other
Investment
Company
Directorships Held During Past Five Years |
| | | | |
Kenneth L. Urish 1951 | | Trustee
(Since 2009) | | Managing Partner, Urish Popeck & Co., LLC (certified public accountants and consultants) since 1976; Past- Chairman of the Professional Ethics Committee of the Pennsylvania Institute of Certified Public Accountants and Committee Member thereof since 2007; Member of External Advisory Board, The Pennsylvania State University Accounting Department since founding in 2001; Principal, UP Strategic Wealth Investment Advisors, LLC since 2013; Trustee, The Holy Family Institute from 2001 to 2010; President and Trustee, Pittsburgh Catholic Publishing Associates from 2003 to 2008; Director, Inter- Tel from 2006 to 2007; Member, Advisory Board, ESG Competent Boards since 2020. | | 30 RICs consisting of 159 Portfolios | | None |
| | | | |
Claire A. Walton 1957 | | Trustee
(Since 2016) | | Chief Operating Officer and Chief Financial Officer of Liberty Square Asset Management, LP from 1998 to 2015; General Partner of Neon Liberty Capital Management, LLC since 2003; Director, Boston Hedge Fund Group from 2009 to 2018; Director, Woodstock Ski Runners since 2013; Director, Massachusetts Council on Economic Education from 2013 to 2015. | | 30 RICs consisting of 159 Portfolios | | None |
|
| Interested Trustees(a)(d) |
| | | | | |
Name Year of Birth(b) | | Position(s) Held (Length of Service)(c) | | Principal Occupation(s) During Past Five Years | | Number of BlackRock-Advised Registered Investment Companies (“RICs”) Consisting of Investment Portfolios (“Portfolios”) Overseen | | Public Company
and Other
Investment
Company
Directorships Held During Past Five Years |
| | | | |
Robert Fairbairn 1965 | | Trustee
(Since 2018) | | Vice Chairman of BlackRock, Inc. since 2019; Member of BlackRock’s Global Executive and Global Operating Committees; Co-Chair of BlackRock’s Human Capital Committee; Senior Managing Director of BlackRock, Inc. from 2010 to 2019; oversaw BlackRock’s Strategic Partner Program and Strategic Product Management Group from 2012 to 2019; Member of the Board of Managers of BlackRock Investments, LLC from 2011 to 2018; Global Head of BlackRock’s Retail and iShares® businesses from 2012 to 2016. | | 103 RICs consisting of 261 Portfolios | | None |
| | | | |
John M. Perlowski(e) 1964 | | Trustee
(Since 2015) President and Chief Executive Officer
(Since 2010) | | Managing Director of BlackRock, Inc. since 2009; Head of BlackRock Global Accounting and Product Services since 2009; Advisory Director of Family Resource Network (charitable foundation) since 2009. | | 105 RICs consisting of 263 Portfolios | | None |
(a) The address of each Trustee is c/o BlackRock, Inc., 55 East 52nd Street, New York, New York 10055. (b) Independent Trustees serve until their resignation, retirement, removal or death, or until December 31 of the year in which they turn 75. The Board may determine to extend the terms of Independent Trustees on a case-by-case basis, as appropriate. (c) In connection with the acquisition of Barclays Global Investors by BlackRock, Inc. in December 2009, certain Independent Trustees were elected to the Board. Furthermore, effective January 1, 2019, three BlackRock Fund Complexes were realigned and consolidated into two BlackRock Fund Complexes. As a result, although the chart shows the year that each Independent Trustee joined the Board, certain Independent Trustees first became members of the boards of other BlackRock-advised Funds or legacy BlackRock funds as follows: Bruce R. Bond, 2005; Cynthia A. Montgomery, 1994; Joseph P. Platt, 1999; Kenneth L. Urish, 1999; Lena G. Goldberg, 2016; Henry R. Keizer, 2016; Donald C. Opatrny, 2015. (d) Mr. Fairbairn and Mr. Perlowski are both “interested persons,” as defined in the 1940 Act, of the Trust/MIP based on their positions with BlackRock, Inc. and its affiliates. Mr. Fairbairn and Mr. Perlowski are also board members of the BlackRock Fixed-Income Complex. (e) Mr. Perlowski is also a trustee of the BlackRock Credit Strategies Fund and BlackRock Private Investments Fund. |
| | |
TRUSTEE AND OFFICER INFORMATION | | 93 |
Trustee and Officer Information (continued)
| | | | |
| Officers Who Are Not Trustees(a) |
| | | |
Name Year of Birth(b) | | Position(s) Held (Length of Service) | | Principal Occupation(s) During Past Five Years |
| | |
Thomas Callahan 1968 | | Vice President
(Since 2016) | | Managing Director of BlackRock, Inc. since 2013; Member of the Board of Managers of BlackRock Investments, LLC (principal underwriter) since 2019 and Managing Director thereof since 2017; Head of BlackRock’s Global Cash Management Business since 2016; Co-Head of the Global Cash Management Business from 2014 to 2016; Deputy Head of the Global Cash Management Business from 2013 to 2014; Member of the Cash Management Group Executive Committee since 2013; Chief Executive Officer of NYSE Liffe U.S. from 2008 to 2013. |
| | |
Jennifer McGovern 1977 | | Vice President
(Since 2014) | | Managing Director of BlackRock, Inc. since 2016; Director of BlackRock, Inc. from 2011 to 2015; Head of Americas Product Development and Governance for BlackRock’s Global Product Group since 2019; Head of Product Structure and Oversight for BlackRock’s U.S. Wealth Advisory Group from 2013 to 2019. |
| | |
Trent Walker 1974 | | Chief Financial Officer
(Since 2021) | | Managing Director of BlackRock, Inc. since September 2019; Executive Vice President of PIMCO from 2016 to 2019; Senior Vice President of PIMCO from 2008 to 2015; Treasurer from 2013 to 2019 and Assistant Treasurer from 2007 to 2017 of PIMCO Funds, PIMCO Variable Insurance Trust, PIMCO ETF Trust, PIMCO Equity Series, PIMCO Equity Series VIT, PIMCO Managed Accounts Trust, 2 PIMCO-sponsored interval funds and 21 PIMCO-sponsored closed-end funds. |
| | |
Jay M. Fife 1970 | | Treasurer
(Since 2009) | | Managing Director of BlackRock, Inc. since 2007. |
| | |
Charles Park 1967 | | Chief Compliance Officer
(Since 2014) | | Anti-Money Laundering Compliance Officer for certain BlackRock-advised Funds from 2014 to 2015; Chief Compliance Officer of BlackRock Advisors, LLC and the BlackRock-advised Funds in the BlackRock Multi-Asset Complex and the BlackRock Fixed-Income Complex since 2014; Principal of and Chief Compliance Officer for iShares® Delaware Trust Sponsor LLC since 2012 and BlackRock Fund Advisors (“BFA”) since 2006; Chief Compliance Officer for the BFA-advised iShares® exchange traded funds since 2006; Chief Compliance Officer for BlackRock Asset Management International Inc. since 2012. |
| | |
Lisa Belle 1968 | | Anti-Money Laundering Compliance Officer
(Since 2019) | | Managing Director of BlackRock, Inc. since 2019; Global Financial Crime Head for Asset and Wealth Management of JP Morgan from 2013 to 2019; Managing Director of RBS Securities from 2012 to 2013; Head of Financial Crimes for Barclays Wealth Americas from 2010 to 2012. |
| | |
Janey Ahn 1975 | | Secretary
(Since 2019) | | Managing Director of BlackRock, Inc. since 2018; Director of BlackRock, Inc. from 2009 to 2017. |
(a) The address of each Officer is c/o BlackRock, Inc., 55 East 52nd Street, New York, New York 10055. (b) Officers of the Trust/MIP serve at the pleasure of the Board. |
Further information about the Trust’s/MIP’s Trustees and Officers is available in the Trust’s/MIP’s Statement of Additional Information, which can be obtained without charge by calling (800) 441-7762.
|
|
| |
Effective December 31, 2021, Bruce R. Bond retired as a Trustee of the Trust/MIP. |
| | |
| 94 | | 2 0 2 1 BLACK ROCK ANNUAL REPORT TO SHAREHOLDERS |
Additional Information
Regulation Regarding Derivatives
On October 28, 2020, the Securities and Exchange Commission (the “SEC”) adopted regulations governing the use of derivatives by registered investment companies (“Rule 18f-4”). The Fund/Master Portfolio will be required to implement and comply with Rule 18f-4 by August 19, 2022. Once implemented, Rule 18f-4 will impose limits on the amount of derivatives a fund can enter into, eliminate the asset segregation framework currently used by funds to comply with Section 18 of the 1940 Act, treat derivatives as senior securities and require funds whose use of derivatives is more than a limited specified exposure amount to establish and maintain a comprehensive derivatives risk management program and appoint a derivatives risk manager.
General Information
Quarterly performance, semi-annual and annual reports, current net asset value and other information regarding the Fund/Master Portfolio may be found on BlackRock’s website, which can be accessed at blackrock.com. Any reference to BlackRock’s website in this report is intended to allow investors public access to information regarding the Fund/Master Portfolio and does not, and is not intended to, incorporate BlackRock’s website in this report.
Householding
The Fund will mail only one copy of shareholder documents, including prospectuses, annual and semi-annual reports, Rule 30e-3 notices and proxy statements, to shareholders with multiple accounts at the same address. This practice is commonly called “householding” and is intended to reduce expenses and eliminate duplicate mailings of shareholder documents. Mailings of your shareholder documents may be householded indefinitely unless you instruct us otherwise. If you do not want the mailing of these documents to be combined with those for other members of your household, please call the Fund at (800) 441-7762.
Availability of Quarterly Schedule of Investments
The Fund/Master Portfolio file their complete schedules of portfolio holdings with the SEC for the first and third quarters of each fiscal year as an exhibit to their reports on Form N-PORT. The Fund’s/Master Portfolio’s Forms N-PORT are available on the SEC’s website at sec.gov. Additionally, the Fund/Master Portfolio makes their portfolio holdings for the first and third quarters of each fiscal year available at blackrock.com/fundreports.
Availability of Proxy Voting Policies, Procedures and Voting Records
A description of the policies and procedures that the Fund/Master Portfolio use to determine how to vote proxies relating to portfolio securities and information about how the Fund/Master Portfolio voted proxies relating to securities held in the Fund’s/Master Portfolio’s portfolios during the most recent 12-month period ended June 30 is available without charge, upon request (1) by calling (800) 441-7762; (2) on the BlackRock website at blackrock.com; and (3) on the SEC’s website at sec.gov.
BlackRock’s Mutual Fund Family
BlackRock offers a diverse lineup of open-end mutual funds crossing all investment styles and managed by experts in equity, fixed-income and tax-exempt investing. Visit blackrock.com for more information.
Shareholder Privileges
Account Information
Call us at (800) 441-7762 from 8:00 AM to 6:00 PM ET on any business day to get information about your account balances, recent transactions and share prices. You can also visit blackrock.com for more information.
Automatic Investment Plans
Investor class shareholders who want to invest regularly can arrange to have $50 or more automatically deducted from their checking or savings account and invested in any of the BlackRock funds.
Systematic Withdrawal Plans
Investor class shareholders can establish a systematic withdrawal plan and receive periodic payments of $50 or more from their BlackRock funds, as long as their account balance is at least $10,000.
Retirement Plans
Shareholders may make investments in conjunction with Traditional, Rollover, Roth, Coverdell, Simple IRAs, SEP IRAs and 403(b) Plans.
| | |
ADDITIONAL INFORMATION | | 95 |
Additional Information (continued)
BlackRock Privacy Principles
BlackRock is committed to maintaining the privacy of its current and former fund investors and individual clients (collectively, “Clients”) and to safeguarding their non-public personal information. The following information is provided to help you understand what personal information BlackRock collects, how we protect that information and why in certain cases we share such information with select parties.
If you are located in a jurisdiction where specific laws, rules or regulations require BlackRock to provide you with additional or different privacy-related rights beyond what is set forth below, then BlackRock will comply with those specific laws, rules or regulations.
BlackRock obtains or verifies personal non-public information from and about you from different sources, including the following: (i) information we receive from you or, if applicable, your financial intermediary, on applications, forms or other documents; (ii) information about your transactions with us, our affiliates, or others; (iii) information we receive from a consumer reporting agency; and (iv) from visits to our websites.
BlackRock does not sell or disclose to non-affiliated third parties any non-public personal information about its Clients, except as permitted by law or as is necessary to respond to regulatory requests or to service Client accounts. These non-affiliated third parties are required to protect the confidentiality and security of this information and to use it only for its intended purpose.
We may share information with our affiliates to service your account or to provide you with information about other BlackRock products or services that may be of interest to you. In addition, BlackRock restricts access to non-public personal information about its Clients to those BlackRock employees with a legitimate business need for the information. BlackRock maintains physical, electronic and procedural safeguards that are designed to protect the non-public personal information of its Clients, including procedures relating to the proper storage and disposal of such information.
Fund and/or MIP Service Providers
|
Investment Adviser |
BlackRock Fund Advisors |
San Francisco, CA 94105 |
|
Administrator |
BlackRock Advisors, LLC |
Wilmington, DE 19809 |
|
Accounting Agent and Custodian |
State Street Bank and Trust Company |
Boston, MA 02111 |
|
Transfer Agent |
BNY Mellon Investment Servicing (US) Inc. |
Wilmington, DE 19809 |
|
Distributor |
BlackRock Investments, LLC |
New York, NY 10022 |
|
Independent Registered Public Accounting Firm |
PricewaterhouseCoopers LLP |
Philadelphia, PA 19103 |
|
Legal Counsel |
Sidley Austin LLP |
New York, NY 10019 |
|
Address of the Trust/MIP |
400 Howard Street |
San Francisco, CA 94105 |
|
| | |
| 96 | | 2 0 2 1 BLACK ROCK ANNUAL REPORT TO SHAREHOLDERS |
Glossary of Terms Used in this Report
| | |
| Portfolio Abbreviation |
| |
| AGM | | Assured Guaranty Municipal Corp. |
| |
| ARB | | Airport Revenue Bonds |
| |
| BAB | | Build America Bond |
| |
| BAM | | Build America Mutual Assurance Co. |
| |
| CMT | | Constant Maturity Treasury |
| |
| DAC | | Designated Activity Company |
| |
| GO | | General Obligation Bonds |
| |
| LIBOR | | London Interbank Offered Rate |
| |
| LP | | Limited Partnership |
| |
| NPFGC | | National Public Finance Guarantee Corp. |
| |
| PIPE | | Private Investment in Public Equity |
| |
| RB | | Revenue Bond |
| |
| SAB | | Special Assessment Bonds |
| |
| SAN | | State Aid Notes |
| |
| SAP | | Subject to Appropriations |
| |
| SCA | | Societe en Commandite par Actions |
| |
| SOFR | | Secured Overnight Financing Rate |
| |
| ST | | Special Tax |
| |
| TBA | | To-Be-Announced |
| | |
GLOSSARY OF TERMS USED IN THIS REPORT | | 97 |
Want to know more?
blackrock.com | 800-441-7762
This report is intended for current holders. It is not authorized for use as an offer of sale or a solicitation of an offer to buy shares of the Fund unless preceded or accompanied by the Fund’s current prospectus. Past performance results shown in this report should not be considered a representation of future performance. Investment returns and principal value of shares will fluctuate so that shares, when redeemed, may be worth more or less than their original cost. Statements and other information herein are as dated and are subject to change.
USTB-12/21-AR
| | |
| Master Portfolio Information as of December 31, 2021 | | Diversified Equity Master Portfolio |
| | | | |
| TEN LARGEST HOLDINGS | |
| | |
| Security | | Percent of Net Assets | |
| |
Apple, Inc. | | | 2 | % |
Microsoft Corp. | | | 2 | |
Taiwan Semiconductor Manufacturing Co. Ltd. | | | 1 | |
Amazon.com, Inc. | | | 1 | |
Samsung Electronics Co. Ltd. | | | 1 | |
Tencent Holdings Ltd. | | | 1 | |
Alphabet, Inc., Class A | | | 1 | |
Tesla, Inc. | | | 1 | |
Alphabet, Inc., Class C | | | 1 | |
Alibaba Group Holding Ltd. | | | 1 | |
| | | | |
| SECTOR ALLOCATION | |
| | |
| Sector(a) | | Percent of Net Assets | |
| |
Information Technology | | | 20 | % |
Financials | | | 13 | |
Consumer Discretionary | | | 11 | |
Health Care | | | 10 | |
Industrials | | | 8 | |
Communication Services | | | 6 | |
Materials | | | 4 | |
Consumer Staples | | | 4 | |
Energy | | | 4 | |
Real Estate | | | 3 | |
Utilities | | | 3 | |
Short-Term Securities | | | 17 | |
Liabilities in Excess of Other Assets | | | (3 | ) |
| (a) | For Diversified Equity Master Portfolio (the “Master Portfolio”) compliance purposes, the Master Portfolio’s sector classifications refer to one or more of the sector subclassifications used by one or more widely recognized market indexes or ratings group indexes, and/or as defined by the investment adviser. These definitions may not apply for purposes of this report, which may combine such sector sub-classifications for reporting ease. |
Derivative Financial Instruments
The Master Portfolio may invest in various derivative financial instruments. These instruments are used to obtain exposure to a security, commodity, index, market, and/or other assets without owning or taking physical custody of securities, commodities and/or other referenced assets or to manage market, equity, credit, interest rate, foreign currency exchange rate, commodity and/or other risks. Derivative financial instruments may give rise to a form of economic leverage and involve risks, including the imperfect correlation between the value of a derivative financial instrument and the underlying asset, possible default of the counterparty to the transaction or illiquidity of the instrument. The Master Portfolio’s successful use of a derivative financial instrument depends on the investment adviser’s ability to predict pertinent market movements accurately, which cannot be assured. The use of these instruments may result in losses greater than if they had not been used, may limit the amount of appreciation the Master Portfolio can realize on an investment and/or may result in lower distributions paid to shareholders. The Master Portfolio’s investments in these instruments, if any, are discussed in detail in the Notes to Financial Statements.
| | | | |
| PORTFOLIO INFORMATION / DERIVATIVE FINANCIAL INSTRUMENTS | | | 1 | |
| | |
Schedule of Investments December 31, 2021 | | Diversified Equity Master Portfolio (Percentages shown are based on Net Assets) |
| | | | | | | | |
| Security | | Shares | | | Value | |
| | |
Common Stocks | | | | | | | | |
| | |
Aerospace & Defense — 0.4% | | | | | | | | |
AAR Corp.(a) | | | 2,817 | | | $ | 109,947 | |
Aerojet Rocketdyne Holdings, Inc. | | | 6,496 | | | | 303,753 | |
Astronics Corp.(a) | | | 9,346 | | | | 112,152 | |
Axon Enterprise, Inc.(a) | | | 1,816 | | | | 285,112 | |
Curtiss-Wright Corp. | | | 132 | | | | 18,304 | |
Embraer SA(a) | | | 22,364 | | | | 99,887 | |
Embraer SA, ADR(a)(b) | | | 15,081 | | | | 267,688 | |
Hexcel Corp.(a) | | | 272 | | | | 14,090 | |
Lockheed Martin Corp. | | | 3,710 | | | | 1,318,571 | |
Maxar Technologies, Inc. | | | 3,152 | | | | 93,079 | |
Mercury Systems, Inc.(a) | | | 1,932 | | | | 106,376 | |
Moog, Inc., Class A | | | 1,786 | | | | 144,612 | |
MTU Aero Engines AG | | | 141 | | | | 28,629 | |
Northrop Grumman Corp. | | | 531 | | | | 205,534 | |
PAE, Inc.(a) | | | 4,751 | | | | 47,177 | |
Singapore Technologies Engineering Ltd. | | | 31,500 | | | | 87,908 | |
Spirit AeroSystems Holdings, Inc., Class A | | | 340 | | | | 14,651 | |
Vectrus, Inc.(a) | | | 3,740 | | | | 171,180 | |
Virgin Galactic Holdings Inc.(a) | | | 581 | | | | 7,774 | |
| | | | | | | | |
| | |
| | | | | | | 3,436,424 | |
| | |
| Air Freight & Logistics — 0.6% | | | | | | |
C.H. Robinson Worldwide, Inc.(b) | | | 14,203 | | | | 1,528,669 | |
Deutsche Post AG, Registered Shares | | | 3,095 | | | | 199,073 | |
DSV A/S | | | 774 | | | | 180,364 | |
Expeditors International of Washington, Inc. | | | 4,682 | | | | 628,746 | |
FedEx Corp. | | | 64 | | | | 16,553 | |
GXO Logistics, Inc.(a) | | | 315 | | | | 28,611 | |
Hub Group, Inc., Class A(a) | | | 13,202 | | | | 1,112,136 | |
InPost SA(a) | | | 2,249 | | | | 27,136 | |
JD Logistics, Inc.(a)(b)(c) | | | 24,600 | | | | 83,562 | |
Radiant Logistics, Inc.(a) | | | 6,856 | | | | 49,980 | |
SF Holding Co. Ltd., Class A | | | 13,500 | | | | 146,496 | |
SG Holdings Co. Ltd. | | | 1,300 | | | | 30,483 | |
United Parcel Service, Inc., Class B(b) | | | 7,056 | | | | 1,512,383 | |
Yamato Holdings Co. Ltd. | | | 2,300 | | | | 54,031 | |
ZTO Express Cayman, Inc., ADR | | | 11,699 | | | | 330,146 | |
| | | | | | | | |
| | |
| | | | | | | 5,928,369 | |
| | |
| Airlines(a) — 0.1% | | | | | | |
Alaska Air Group, Inc. | | | 3,422 | | | | 178,286 | |
American Airlines Group, Inc. | | | 2,075 | | | | 37,267 | |
China Airlines Ltd. | | | 249,000 | | | | 247,475 | |
Copa Holdings SA, Class A(b) | | | 142 | | | | 11,738 | |
Eva Airways Corp. | | | 215,000 | | | | 216,793 | |
JetBlue Airways Corp. | | | 1,029 | | | | 14,653 | |
Spirit Airlines, Inc. | | | 20,866 | | | | 455,922 | |
United Airlines Holdings, Inc. | | | 1,051 | | | | 46,013 | |
| | | | | | | | |
| | |
| | | | | | | 1,208,147 | |
| | |
| Auto Components — 0.6% | | | | | | |
Aptiv PLC(a) | | | 986 | | | | 162,641 | |
Bharat Forge Ltd. | | | 17,602 | | | | 164,516 | |
BorgWarner, Inc. | | | 31,129 | | | | 1,402,984 | |
Bridgestone Corp. | | | 1,900 | | | | 81,572 | |
Continental AG, Class A(a) | | | 477 | | | | 50,116 | |
Cooper-Standard Holdings, Inc.(a) | | | 2,064 | | | | 46,254 | |
Denso Corp. | | | 1,900 | | | | 157,455 | |
Dorman Products, Inc.(a) | | | 349 | | | | 39,441 | |
Faurecia SE | | | 327 | | | | 15,557 | |
Fox Factory Holding Corp.(a) | | | 2,832 | | | | 481,723 | |
Gentex Corp. | | | 777 | | | | 27,078 | |
| | | | | | | | |
| Security | | Shares | | | Value | |
| | |
Auto Components (continued) | | | | | | | | |
Goodyear Tire & Rubber Co.(a) | | | 30,380 | | | $ | 647,702 | |
Hankook Tire & Technology Co. Ltd. | | | 2,580 | | | | 86,191 | |
Holley, Inc.(a) | | | 1,982 | | | | 25,746 | |
Hu Lane Associate, Inc. | | | 12,000 | | | | 60,567 | |
Hyundai Mobis Co. Ltd. | | | 2,739 | | | | 585,480 | |
Koito Manufacturing Co. Ltd. | | | 200 | | | | 10,593 | |
LCI Industries | | | 4,011 | | | | 625,195 | |
Lear Corp. | | | 220 | | | | 40,249 | |
Mando Corp.(a) | | | 1,553 | | | | 82,636 | |
Modine Manufacturing Co.(a) | | | 1,761 | | | | 17,769 | |
Patrick Industries, Inc. | | | 4,229 | | | | 341,238 | |
QuantumScape Corp.(a)(b) | | | 669 | | | | 14,845 | |
Tenneco, Inc., Class A(a) | | | 10,731 | | | | 121,260 | |
XPEL Inc.(a) | | | 2,580 | | | | 176,162 | |
| | | | | | | | |
| | |
| | | | | | | 5,464,970 | |
| | |
| Automobiles — 1.6% | | | | | | |
BAIC Motor Corp. Ltd., Class H(c) | | | 556,500 | | | | 239,049 | |
Bayerische Motoren Werke AG | | | 1,187 | | | | 118,750 | |
BYD Co. Ltd., Class A | | | 23,300 | | | | 981,264 | |
BYD Co. Ltd., Class H | | | 21,500 | | | | 727,224 | |
Canoo, Inc.(a) | | | 5,628 | | | | 43,448 | |
Daimler AG, Registered Shares | | | 2,531 | | | | 193,379 | |
Dongfeng Motor Group Co. Ltd., Class H | | | 110,000 | | | | 91,443 | |
Ferrari NV | | | 296 | | | | 76,192 | |
Fisker, Inc.(a)(b) | | | 13,680 | | | | 215,186 | |
Ford Motor Co. | | | 12,982 | | | | 269,636 | |
Ford Otomotiv Sanayi A/S | | | 5,541 | | | | 99,729 | |
Geely Automobile Holdings Ltd. | | | 80,000 | | | | 218,545 | |
General Motors Co.(a) | | | 4,646 | | | | 272,395 | |
Great Wall Motor Co. Ltd., Class H | | | 95,000 | | | | 326,365 | |
Harley-Davidson, Inc.(b) | | | 498 | | | | 18,770 | |
Honda Motor Co. Ltd. | | | 7,900 | | | | 224,761 | |
Hyundai Motor Co. | | | 1,674 | | | | 293,836 | |
Isuzu Motors Ltd. | | | 1,100 | | | | 13,691 | |
Kia Corp. | | | 3,145 | | | | 217,046 | |
Li Auto, Inc., ADR(a) | | | 14,182 | | | | 455,242 | |
Lucid Group, Inc.(a) | | | 1,292 | | | | 49,161 | |
Mazda Motor Corp.(a) | | | 2,400 | | | | 18,415 | |
NIO, Inc., ADR(a) | | | 34,892 | | | | 1,105,379 | |
Nissan Motor Co. Ltd.(a) | | | 12,100 | | | | 58,280 | |
Rivian Automotive, Inc., Class A(a)(b) | | | 3,431 | | | | 355,760 | |
Stellantis NV | | | 4,706 | | | | 88,843 | |
Subaru Corp. | | | 9,300 | | | | 166,171 | |
Suzuki Motor Corp. | | | 700 | | | | 26,994 | |
Tata Motors Ltd.(a) | | | 24,469 | | | | 157,733 | |
Tesla, Inc.(a) | | | 6,418 | | | | 6,782,414 | |
Thor Industries, Inc. | | | 173 | | | | 17,952 | |
Toyota Motor Corp. | | | 32,700 | | | | 604,380 | |
TVS Motor Co. Ltd. | | | 10,836 | | | | 91,067 | |
Volkswagen AG | | | 198 | | | | 57,882 | |
Winnebago Industries, Inc.(b) | | | 3,440 | | | | 257,725 | |
XPeng, Inc., ADR(a)(b) | | | 9,678 | | | | 487,094 | |
Yamaha Motor Co. Ltd. | | | 1,000 | | | | 24,019 | |
| | | | | | | | |
| | |
| | | | | | | 15,445,220 | |
| | |
| Banks — 6.2% | | | | | | |
ABN AMRO Bank NV(c) | | | 2,124 | | | | 31,222 | |
Abu Dhabi Commercial Bank PJSC | | | 66,002 | | | | 153,130 | |
Agricultural Bank of China Ltd., Class H | | | 493,000 | | | | 169,610 | |
Akbank TAS | | | 12,617 | | | | 6,814 | |
Al Rajhi Bank | | | 64,670 | | | | 2,438,851 | |
Ameris Bancorp | | | 4,600 | | | | 228,528 | |
Australia & New Zealand Banking Group Ltd. | | | 10,546 | | | | 211,250 | |
| | |
| 2 | | 2 0 2 1 BLACK ROCK ANNUAL REPORT TO SHAREHOLDERS |
| | |
Schedule of Investments (continued) December 31, 2021 | | Diversified Equity Master Portfolio (Percentages shown are based on Net Assets) |
| | | | | | | | |
| Security | | Shares | | | Value | |
| | |
Banks (continued) | | | | | | | | |
Axis Bank Ltd.(a) | | | 76,326 | | | $ | 693,594 | |
BancFirst Corp. | | | 911 | | | | 64,280 | |
Banco Bilbao Vizcaya Argentaria SA | | | 17,295 | | | | 102,576 | |
Banco Bradesco SA, ADR(b) | | | 127,429 | | | | 435,807 | |
Banco do Brasil SA | | | 73,903 | | | | 381,960 | |
Banco Santander Brasil SA | | | 8,200 | | | | 44,107 | |
Banco Santander Brasil SA, ADR | | | 22,649 | | | | 121,625 | |
Banco Santander Chile, ADR(b) | | | 11,420 | | | | 186,032 | |
Banco Santander SA | | | 46,850 | | | | 155,592 | |
Bancolombia SA, ADR(b) | | | 5,034 | | | | 159,024 | |
Bangkok Bank PCL, NVDR | | | 94,500 | | | | 342,508 | |
Bank AlBilad(a) | | | 21,891 | | | | 269,805 | |
Bank Central Asia Tbk PT | | | 930,100 | | | | 476,351 | |
Bank Hapoalim BM | | | 2,469 | | | | 25,411 | |
Bank Leumi Le-Israel BM | | | 4,111 | | | | 44,095 | |
Bank Mandiri Persero Tbk PT | | | 955,200 | | | | 471,658 | |
Bank Negara Indonesia Persero Tbk PT | | | 157,000 | | | | 74,215 | |
Bank of America Corp. | | | 46,575 | | | | 2,072,122 | |
Bank of China Ltd., Class H | | | 1,617,000 | | | | 581,742 | |
Bank of Communications Co. Ltd., Class A | | | 349,700 | | | | 253,667 | |
Bank of Communications Co. Ltd., Class H | | | 517,000 | | | | 312,533 | |
Bank of Hangzhou Co. Ltd., Class A | | | 54,400 | | | | 109,722 | |
Bank of Hawaii Corp. | | | 4,443 | | | | 372,146 | |
Bank of Nanjing Co. Ltd., Class A | | | 141,600 | | | | 199,518 | |
Bank of Ningbo Co. Ltd., Class A | | | 27,830 | | | | 167,549 | |
Bank OZK | | | 399 | | | | 18,565 | |
Bank Rakyat Indonesia Persero Tbk PT | | | 3,352,100 | | | | 965,157 | |
BankFinancial Corp. | | | 17,281 | | | | 184,388 | |
Barclays PLC | | | 46,208 | | | | 117,704 | |
Baycom Corp.(a) | | | 3,586 | | | | 67,273 | |
BNP Paribas SA | | | 3,235 | | | | 223,671 | |
BOC Hong Kong Holdings Ltd. | | | 11,500 | | | | 37,714 | |
BOK Financial Corp. | | | 99 | | | | 10,444 | |
Byline Bancorp, Inc. | | | 671 | | | | 18,352 | |
Cadence Bank(b) | | | 9,303 | | | | 277,136 | |
CaixaBank SA | | | 11,014 | | | | 30,086 | |
Capital City Bank Group, Inc. | | | 21,219 | | | | 560,182 | |
Capitec Bank Holdings Ltd. | | | 5,643 | | | | 722,346 | |
Capstar Financial Holdings, Inc. | | | 7,291 | | | | 153,330 | |
Carter Bankshares, Inc.(a) | | | 5,803 | | | | 89,308 | |
Cathay General Bancorp | | | 2,927 | | | | 125,832 | |
Central Pacific Financial Corp. | | | 17,812 | | | | 501,764 | |
China CITIC Bank Corp. Ltd., Class H | | | 243,000 | | | | 105,406 | |
China Construction Bank Corp., Class H | | | 1,685,000 | | | | 1,167,614 | |
China Merchants Bank Co. Ltd., Class A | | | 35,500 | | | | 272,060 | |
China Merchants Bank Co. Ltd., Class H | | | 126,000 | | | | 980,227 | |
China Minsheng Banking Corp. Ltd., Class H(b) | | | 137,500 | | | | 52,576 | |
CIMB Group Holdings Bhd | | | 372,400 | | | | 487,126 | |
CIT Group, Inc. | | | 6,853 | | | | 351,833 | |
Citigroup, Inc. | | | 23,211 | | | | 1,401,712 | |
Citizens Financial Group, Inc. | | | 473 | | | | 22,349 | |
City Union Bank Ltd. | | | 65,779 | | | | 118,918 | |
Civista Bancshares, Inc. | | | 3,300 | | | | 80,520 | |
Colony Bankcorp, Inc. | | | 812 | | | | 13,861 | |
Comerica, Inc. | | | 435 | | | | 37,845 | |
Commerce Bancshares, Inc. | | | 363 | | | | 24,953 | |
Commerzbank AG(a) | | | 2,820 | | | | 21,335 | |
Commonwealth Bank of Australia | | | 5,495 | | | | 403,944 | |
Community Trust Bancorp, Inc. | | | 3,271 | | | | 142,648 | |
Concordia Financial Group Ltd. | | | 2,800 | | | | 10,168 | |
ConnectOne Bancorp, Inc. | | | 1,334 | | | | 43,635 | |
Credicorp Ltd. | | | 1,953 | | | | 238,403 | |
Credit Agricole SA | | | 4,229 | | | | 60,294 | |
| | | | | | | | |
| Security | | Shares | | | Value | |
| | |
Banks (continued) | | | | | | | | |
CTBC Financial Holding Co. Ltd. | | | 1,263,000 | | | $ | 1,183,178 | |
Cullen/Frost Bankers, Inc. | | | 186 | | | | 23,449 | |
Customers Bancorp, Inc.(a)(b) | | | 2,034 | | | | 132,963 | |
Danske Bank A/S | | | 1,949 | | | | 33,648 | |
DBS Group Holdings Ltd. | | | 6,900 | | | | 167,111 | |
DNB Bank ASA | | | 4,072 | | | | 93,142 | |
Dubai Islamic Bank PJSC | | | 65,042 | | | | 95,062 | |
E.Sun Financial Holding Co. Ltd. | | | 638,122 | | | | 646,773 | |
East West Bancorp, Inc. | | | 459 | | | | 36,114 | |
Emirates NBD Bank PJSC | | | 68,395 | | | | 252,110 | |
Enterprise Bancorp, Inc. | | | 1,250 | | | | 56,150 | |
Erste Group Bank AG | | | 523 | | | | 24,518 | |
Fifth Third Bancorp | | | 892 | | | | 38,847 | |
First Abu Dhabi Bank PJSC | | | 100,870 | | | | 517,388 | |
First Bank/Hamilton | | | 5,631 | | | | 81,706 | |
First Busey Corp. | | | 1,610 | | | | 43,663 | |
First Business Financial Services, Inc. | | | 1,667 | | | | 48,626 | |
First Citizens BancShares, Inc., Class A | | | 19 | | | | 15,767 | |
First Commonwealth Financial Corp. | | | 6,808 | | | | 109,541 | |
First Financial Bankshares, Inc. | | | 11,223 | | | | 570,577 | |
First Financial Northwest, Inc. | | | 19,415 | | | | 313,941 | |
First Hawaiian, Inc. | | | 423 | | | | 11,561 | |
First Horizon Corp. | | | 1,779 | | | | 29,051 | |
First Interstate Bancsystem, Inc., Class A(b) | | | 19,176 | | | | 779,888 | |
First Northwest Bancorp | | | 2,493 | | | | 50,433 | |
First Republic Bank | | | 10,117 | | | | 2,089,262 | |
First Savings Financial Group, Inc. | | | 1,623 | | | | 42,847 | |
First Western Financial, Inc.(a) | | | 1,252 | | | | 38,011 | |
FNB Corp. | | | 1,035 | | | | 12,555 | |
Fulton Financial Corp. | | | 38,047 | | | | 646,799 | |
Glacier Bancorp, Inc.(b) | | | 15,664 | | | | 888,149 | |
Grupo Financiero Banorte SAB de CV, Class O | | | 57,146 | | | | 371,252 | |
Hancock Whitney Corp. | | | 8,150 | | | | 407,663 | |
Hang Seng Bank Ltd. | | | 2,900 | | | | 53,104 | |
Hanmi Financial Corp. | | | 2,110 | | | | 49,965 | |
HBT Financial, Inc.(b) | | | 11,075 | | | | 207,435 | |
HDFC Bank Ltd. | | | 26,709 | | | | 528,764 | |
HDFC Bank Ltd., ADR | | | 4,911 | | | | 319,559 | |
Heartland Financial USA, Inc. | | | 19,480 | | | | 985,883 | |
HomeTrust Bancshares, Inc. | | | 1,436 | | | | 44,487 | |
Howard Bancorp, Inc.(a) | | | 904 | | | | 19,698 | |
HSBC Holdings PLC | | | 62,323 | | | | 376,385 | |
Huntington Bancshares, Inc.(b) | | | 13,895 | | | | 214,261 | |
ICICI Bank Ltd. | | | 142,340 | | | | 1,414,995 | |
ICICI Bank Ltd., ADR | | | 13,372 | | | | 264,632 | |
Independent Bank Corp. | | | 15,813 | | | | 377,456 | |
IndusInd Bank Ltd. | | | 10,169 | | | | 121,015 | |
Industrial & Commercial Bank of China Ltd., Class H | | | 1,582,000 | | | | 892,379 | |
Industrial Bank Co. Ltd., Class A | | | 100,876 | | | | 302,057 | |
ING Groep NV | | | 12,384 | | | | 172,175 | |
Intesa Sanpaolo SpA | | | 35,198 | | | | 90,914 | |
Investar Holding Corp. | | | 3,275 | | | | 60,293 | |
Investors Bancorp, Inc. | | | 15,625 | | | | 236,719 | |
Israel Discount Bank Ltd., Class A | | | 3,294 | | | | 22,117 | |
Itau Unibanco Holding SA, ADR(b) | | | 125,681 | | | | 471,304 | |
Japan Post Bank Co. Ltd. | | | 5,400 | | | | 49,500 | |
JPMorgan Chase & Co. | | | 14,073 | | | | 2,228,460 | |
KB Financial Group, Inc. | | | 11,679 | | | | 540,087 | |
KBC Group NV | | | 798 | | | | 68,565 | |
KeyCorp. | | | 862 | | | | 19,938 | |
Kiatnakin Phatra Bank PCL, NVDR | | | 24,400 | | | | 43,551 | |
Kotak Mahindra Bank Ltd. | | | 32,307 | | | | 777,656 | |
Lakeland Bancorp, Inc.(b) | | | 12,343 | | | | 234,394 | |
| | | | |
MASTER PORTFOLIO SCHEDULE OF INVESTMENTS | | | 3 | |
| | |
Schedule of Investments (continued) December 31, 2021 | | Diversified Equity Master Portfolio (Percentages shown are based on Net Assets) |
| | | | | | | | |
| Security | | Shares | | | Value | |
| | |
Banks (continued) | | | | | | | | |
Level One Bancorp, Inc. | | | 782 | | | $ | 30,842 | |
M&T Bank Corp. | | | 153 | | | | 23,498 | |
Malayan Banking Bhd | | | 376,800 | | | | 750,537 | |
Mercantile Bank Corp. | | | 2,368 | | | | 82,951 | |
Meridian Corp. | | | 2,598 | | | | 95,528 | |
Mid Penn Bancorp, Inc. | | | 6,043 | | | | 191,805 | |
Midland States Bancorp, Inc. | | | 21,580 | | | | 534,968 | |
Mitsubishi UFJ Financial Group, Inc. | | | 41,300 | | | | 224,766 | |
Mizrahi Tefahot Bank Ltd. | | | 2,605 | | | | 100,320 | |
Mizuho Financial Group, Inc. | | | 8,820 | | | | 112,025 | |
Moneta Money Bank A/S(a)(c) | | | 64,700 | | | | 277,611 | |
National Australia Bank Ltd. | | | 12,044 | | | | 252,889 | |
National Bank of Kuwait SAKP | | | 170,250 | | | | 561,326 | |
Natwest Group PLC | | | 21,109 | | | | 64,642 | |
Nedbank Group Ltd. | | | 27,184 | | | | 298,572 | |
Nordea Bank Abp | | | 12,241 | | | | 149,322 | |
Northrim BanCorp, Inc. | | | 5,914 | | | | 257,022 | |
OceanFirst Financial Corp. | | | 18,581 | | | | 412,498 | |
Old Second Bancorp, Inc. | | | 1,472 | | | | 18,532 | |
OTP Bank Nyrt(a) | | | 9,400 | | | | 479,318 | |
Oversea-Chinese Banking Corp. Ltd. | | | 8,700 | | | | 73,635 | |
PacWest Bancorp | | | 377 | | | | 17,029 | |
Peapack Gladstone Financial Corp. | | | 5,503 | | | | 194,806 | |
People’s United Financial, Inc. | | | 1,382 | | | | 24,627 | |
Pinnacle Financial Partners, Inc. | | | 4,919 | | | | 469,764 | |
Popular, Inc. | | | 257 | | | | 21,084 | |
Postal Savings Bank of China Co. Ltd., Class A | | | 148,500 | | | | 119,174 | |
Prosperity Bancshares, Inc. | | | 290 | | | | 20,967 | |
Public Bank Bhd | | | 775,600 | | | | 774,099 | |
QCR Holdings, Inc. | | | 1,263 | | | | 70,728 | |
Regions Financial Corp. | | | 30,189 | | | | 658,120 | |
Republic First Bancorp, Inc.(a) | | | 115,487 | | | | 429,612 | |
Resona Holdings, Inc. | | | 6,700 | | | | 26,037 | |
RHB Bank Bhd | | | 194,800 | | | | 250,907 | |
Riyad Bank | | | 28,783 | | | | 207,761 | |
Salisbury Bancorp, Inc. | | | 1,845 | | | | 97,564 | |
Sandy Spring Bancorp, Inc. | | | 5,915 | | | | 284,393 | |
Saudi National Bank | | | 25,750 | | | | 441,695 | |
Sberbank of Russia PJSC, ADR | | | 35,262 | | | | 565,779 | |
ServisFirst Bancshares, Inc. | | | 2,596 | | | | 220,504 | |
Shinhan Financial Group Co. Ltd. | | | 19,295 | | | | 596,197 | |
Shinhan Financial Group Co. Ltd., ADR | | | 3,845 | | | | 118,849 | |
Sierra Bancorp | | | 11,161 | | | | 303,021 | |
Signature Bank | | | 404 | | | | 130,682 | |
Silvergate Capital Corp., Class A(a) | | | 1,069 | | | | 158,426 | |
Skandinaviska Enskilda Banken AB, Class A | | | 7,562 | | | | 104,987 | |
SmartFinancial, Inc. | | | 6,654 | | | | 182,053 | |
Societe Generale SA | | | 2,495 | | | | 85,750 | |
South Plains Financial, Inc. | | | 4,416 | | | | 122,809 | |
South State Corp. | | | 10,205 | | | | 817,523 | |
Standard Bank Group Ltd. | | | 65,151 | | | | 572,376 | |
Standard Chartered PLC | | | 7,538 | | | | 45,837 | |
Sterling Bancorp | | | 621 | | | | 16,016 | |
Sumitomo Mitsui Financial Group, Inc. | | | 4,600 | | | | 157,077 | |
Sumitomo Mitsui Trust Holdings, Inc. | | | 1,400 | | | | 46,814 | |
SVB Financial Group(a) | | | 51 | | | | 34,590 | |
Svenska Handelsbanken AB, A Shares | | | 6,141 | | | | 66,372 | |
Swedbank AB, A Shares | | | 3,972 | | | | 79,821 | |
Synovus Financial Corp. | | | 472 | | | | 22,595 | |
TowneBank | | | 1,553 | | | | 49,059 | |
Trico Bancshares | | | 4,617 | | | | 198,346 | |
TriState Capital Holdings, Inc.(a) | | | 2,003 | | | | 60,611 | |
| | | | | | | | |
| Security | | Shares | | | Value | |
| | |
Banks (continued) | | | | | | | | |
Truist Financial Corp. | | | 4,272 | | | $ | 250,126 | |
U.S. Bancorp | | | 4,042 | | | | 227,039 | |
UMB Financial Corp. | | | 3,928 | | | | 416,800 | |
Umpqua Holdings Corp. | | | 715 | | | | 13,757 | |
UniCredit SpA | | | 5,146 | | | | 79,101 | |
United Community Banks, Inc. | | | 6,180 | | | | 222,109 | |
United Overseas Bank Ltd. | | | 3,000 | | | | 59,915 | |
Univest Financial Corp. | | | 3,000 | | | | 89,760 | |
Washington Trust Bancorp, Inc. | | | 1,672 | | | | 94,251 | |
Webster Financial Corp. | | | 292 | | | | 16,305 | |
Wells Fargo & Co. | | | 10,130 | | | | 486,037 | |
WesBanco, Inc. | | | 16,991 | | | | 594,515 | |
Western Alliance Bancorp | | | 4,556 | | | | 490,453 | |
Westpac Banking Corp. | | | 13,356 | | | | 207,198 | |
Wintrust Financial Corp. | | | 184 | | | | 16,711 | |
Zions Bancorp NA | | | 519 | | | | 32,780 | |
| | | | | | | | |
| | |
| | | | | | | 59,691,141 | |
| | |
| Beverages — 0.9% | | | | | | |
Ambev SA | | | 265,964 | | | | 744,227 | |
Ambev SA, ADR | | | 39,124 | | | | 109,547 | |
Anheuser-Busch InBev SA/NV | | | 2,058 | | | | 124,077 | |
Arca Continental SAB de CV | | | 78,187 | | | | 498,399 | |
Asahi Group Holdings Ltd. | | | 700 | | | | 27,250 | |
Boston Beer Co., Inc., Class A(a) | | | 30 | | | | 15,153 | |
Brown-Forman Corp., Class A | | | 148 | | | | 10,033 | |
Carlsberg A/S, Class B | | | 145 | | | | 25,034 | |
Celsius Holdings, Inc.(a) | | | 808 | | | | 60,253 | |
Coca-Cola Co. | | | 6,698 | | | | 396,589 | |
Coca-Cola European Partners PLC | | | 6,549 | | | | 366,286 | |
Coca-Cola Femsa SAB de CV | | | 41,882 | | | | 228,479 | |
Coca-Cola Femsa SAB de CV, ADR | | | 7,043 | | | | 385,886 | |
Coca-Cola HBC AG | | | 2,270 | | | | 78,599 | |
Diageo PLC | | | 7,189 | | | | 393,066 | |
Duckhorn Portfolio, Inc.(a) | | | 936 | | | | 21,846 | |
Fomento Economico Mexicano SAB de CV | | | 91,065 | | | | 708,577 | |
Fomento Economico Mexicano SAB de CV, ADR | | | 3,615 | | | | 280,922 | |
Heineken Holding NV | | | 727 | | | | 67,033 | |
Heineken NV | | | 1,502 | | | | 169,035 | |
Jiangsu Yanghe Brewery Joint-Stock Co. Ltd., Class A | | | 9,600 | | | | 249,109 | |
JiuGui Liquor Co. Ltd. | | | 5,100 | | | | 170,468 | |
Keurig Dr Pepper, Inc. | | | 20,194 | | | | 744,351 | |
Kweichow Moutai Co. Ltd., Class A | | | 1,300 | | | | 418,807 | |
MGP Ingredients, Inc. | | | 574 | | | | 48,784 | |
Molson Coors Beverage Co., Class B | | | 15,654 | | | | 725,563 | |
Nongfu Spring Co. Ltd., Class H(c) | | | 58,400 | | | | 385,747 | |
PepsiCo, Inc. | | | 3,705 | | | | 643,596 | |
Pernod Ricard SA | | | 700 | | | | 168,404 | |
Primo Water Corp. | | | 10,719 | | | | 188,976 | |
Shanxi Xinghuacun Fen Wine Factory Co. Ltd., Class A | | | 7,459 | | | | 370,253 | |
Sichuan Swellfun Co. Ltd. | | | 5,900 | | | | 111,607 | |
Treasury Wine Estates Ltd. | | | 3,241 | | | | 29,222 | |
Varun Beverages Ltd. | | | 5,571 | | | | 66,488 | |
Vintage Wine Estates, Inc.(a) | | | 1,877 | | | | 22,186 | |
| | | | | | | | |
| | |
| | | | | | | 9,053,852 | |
| | |
| Biotechnology — 2.5% | | | | | | |
2seventy bio, Inc.(a) | | | 996 | | | | 25,527 | |
3SBio, Inc.(a)(c) | | | 471,000 | | | | 392,515 | |
4D Molecular Therapeutics, Inc.(a) | | | 1,572 | | | | 34,490 | |
89bio, Inc.(a) | | | 1,320 | | | | 17,252 | |
AbbVie, Inc. | | | 13,822 | | | | 1,871,499 | |
Abeona Therapeutics, Inc.(a)(b) | | | 12,073 | | | | 4,069 | |
| | |
| 4 | | 2 0 2 1 BLACK ROCK ANNUAL REPORT TO SHAREHOLDERS |
| | |
Schedule of Investments (continued) December 31, 2021 | | Diversified Equity Master Portfolio (Percentages shown are based on Net Assets) |
| | | | | | | | |
| Security | | Shares | | | Value | |
| | |
Biotechnology (continued) | | | | | | | | |
ACADIA Pharmaceuticals, Inc.(a)(b) | | | 7,763 | | | $ | 181,188 | |
ADMA Biologics, Inc.(a)(b) | | | 46,699 | | | | 65,846 | |
Affimed NV(a) | | | 11,343 | | | | 62,613 | |
Agenus, Inc.(a) | | | 27,624 | | | | 88,949 | |
Akebia Therapeutics, Inc.(a) | | | 17,028 | | | | 38,483 | |
Akero Therapeutics, Inc.(a) | | | 1,434 | | | | 30,329 | |
Akouos, Inc.(a) | | | 1,837 | | | | 15,615 | |
Alder Biopharmaceuticals, Inc.(d) | | | 3,943 | | | | 3,470 | |
Alector, Inc.(a) | | | 6,919 | | | | 142,877 | |
Aligos Therapeutics, Inc.(a) | | | 3,453 | | | | 40,987 | |
Alkermes PLC(a) | | | 15,255 | | | | 354,831 | |
Allogene Therapeutics, Inc.(a) | | | 11,574 | | | | 172,684 | |
Allovir, Inc.(a) | | | 1,921 | | | | 24,858 | |
Alnylam Pharmaceuticals, Inc.(a) | | | 525 | | | | 89,030 | |
ALX Oncology Holdings, Inc.(a) | | | 850 | | | | 18,267 | |
Amgen, Inc. | | | 8,768 | | | | 1,972,537 | |
Amicus Therapeutics, Inc.(a) | | | 17,212 | | | | 198,799 | |
Anavex Life Sciences Corp.(a)(b) | | | 2,179 | | | | 37,784 | |
Apellis Pharmaceuticals, Inc.(a) | | | 5,189 | | | | 245,336 | |
Applied Molecular Transport, Inc.(a) | | | 3,993 | | | | 55,822 | |
Applied Therapeutics, Inc.(a) | | | 1,218 | | | | 10,901 | |
Aprea Therapeutics, Inc.(a) | | | 5,798 | | | | 16,640 | |
Aptinyx, Inc.(a)(b) | | | 12,794 | | | | 34,160 | |
AquaBounty Technologies, Inc.(a) | | | 3 | | | | 6 | |
Arcturus Therapeutics Holdings, Inc.(a) | | | 704 | | | | 26,055 | |
Arcus Biosciences, Inc.(a)(b) | | | 2,616 | | | | 105,870 | |
Arcutis Biotherapeutics, Inc.(a) | | | 3,039 | | | | 63,029 | |
Arena Pharmaceuticals, Inc.(a) | | | 4,222 | | | | 392,393 | |
Argenx SE(a) | | | 123 | | | | 43,740 | |
Arrowhead Pharmaceuticals, Inc.(a) | | | 2,935 | | | | 194,590 | |
Assembly Biosciences, Inc.(a) | | | 24,276 | | | | 56,563 | |
Astria Therapeutics, Inc.(a) | | | 2,019 | | | | 10,882 | |
Atara Biotherapeutics, Inc.(a) | | | 11,930 | | | | 188,017 | |
Athenex, Inc.(a) | | | 8,143 | | | | 11,074 | |
Athersys, Inc.(a)(b) | | | 36,649 | | | | 33,079 | |
Atossa Therapeutics, Inc.(a) | | | 11,978 | | | | 19,165 | |
Atreca, Inc., Class A(a) | | | 11,605 | | | | 35,163 | |
Avidity Biosciences, Inc.(a) | | | 6,499 | | | | 154,481 | |
Avrobio, Inc.(a) | | | 3,970 | | | | 15,285 | |
Beam Therapeutics, Inc.(a)(b) | | | 2,895 | | | | 230,703 | |
BeiGene Ltd., ADR(a) | | | 924 | | | | 250,339 | |
Beyondspring, Inc.(a) | | | 6,288 | | | | 28,485 | |
BioCryst Pharmaceuticals, Inc.(a) | | | 14,503 | | | | 200,867 | |
Biogen, Inc.(a) | | | 1,673 | | | | 401,386 | |
Biohaven Pharmaceutical Holding Co. Ltd.(a) | | | 1,891 | | | | 260,599 | |
BioMarin Pharmaceutical, Inc.(a) | | | 866 | | | | 76,511 | |
Bioxcel Therapeutics, Inc.(a) | | | 880 | | | | 17,890 | |
Black Diamond Therapeutics, Inc.(a) | | | 8,489 | | | | 45,246 | |
Blueprint Medicines Corp.(a) | | | 2,349 | | | | 251,601 | |
Bolt Biotherapeutics, Inc.(a) | | | 1,792 | | | | 8,781 | |
Bridgebio Pharma, Inc.(a) | | | 14,730 | | | | 245,696 | |
C4 Therapeutics, Inc.(a) | | | 5,819 | | | | 187,372 | |
Cabaletta Bio, Inc.(a) | | | 4,042 | | | | 15,319 | |
Caribou Biosciences, Inc.(a) | | | 4,033 | | | | 60,858 | |
Catalyst Biosciences, Inc.(a) | | | 6,436 | | | | 5,883 | |
Celltrion, Inc.(a) | | | 2,299 | | | | 382,711 | |
Celularity, Inc.(a)(b) | | | 2,154 | | | | 11,028 | |
Centogene NV(a) | | | 910 | | | | 4,668 | |
Cidara Therapeutics, Inc.(a) | | | 14,886 | | | | 18,905 | |
Clovis Oncology, Inc.(a)(b) | | | 15,342 | | | | 41,577 | |
Coherus Biosciences, Inc.(a) | | | 9,769 | | | | 155,913 | |
Corbus Pharmaceuticals Holdings, Inc.(a) | | | 12,901 | | | | 7,943 | |
Cortexyme, Inc.(a)(b) | | | 608 | | | | 7,673 | |
| | | | | | | | |
| Security | | Shares | | | Value | |
| | |
Biotechnology (continued) | | | | | | | | |
Corvus Pharmaceuticals, Inc.(a) | | | 5,735 | | | $ | 13,821 | |
Crinetics Pharmaceuticals, Inc.(a) | | | 4,021 | | | | 114,237 | |
CSL Ltd. | | | 1,463 | | | | 309,425 | |
Cue Biopharma, Inc.(a) | | | 3,329 | | | | 37,651 | |
Cullinan Oncology, Inc.(a)(b) | | | 1,282 | | | | 19,781 | |
CureVac NV(a) | | | 173 | | | | 5,936 | |
Cytokinetics, Inc.(a) | | | 1,843 | | | | 84,004 | |
Deciphera Pharmaceuticals, Inc.(a) | | | 9,838 | | | | 96,117 | |
Denali Therapeutics, Inc.(a) | | | 8,910 | | | | 397,386 | |
Dynavax Technologies Corp.(a) | | | 5,945 | | | | 83,646 | |
Dyne Therapeutics, Inc.(a) | | | 3,265 | | | | 38,821 | |
Editas Medicine, Inc.(a) | | | 4,271 | | | | 113,395 | |
Emergent BioSolutions, Inc.(a) | | | 2,050 | | | | 89,114 | |
Enanta Pharmaceuticals, Inc.(a) | | | 2,449 | | | | 183,136 | |
Erasca, Inc.(a)(b) | | | 2,545 | | | | 39,651 | |
Exact Sciences Corp.(a) | | | 812 | | | | 63,198 | |
Exagen, Inc.(a)(b) | | | 3,265 | | | | 37,972 | |
Exelixis, Inc.(a) | | | 1,993 | | | | 36,432 | |
Exicure, Inc.(a) | | | 5,365 | | | | 1,084 | |
Fate Therapeutics, Inc.(a) | | | 7,308 | | | | 427,591 | |
Fennec Pharmaceuticals, Inc.(a) | | | 1,750 | | | | 7,700 | |
FibroGen, Inc.(a) | | | 1,679 | | | | 23,674 | |
Foghorn Therapeutics, Inc.(a) | | | 2,487 | | | | 56,878 | |
Forma Therapeutics Holdings, Inc.(a) | | | 2,471 | | | | 35,138 | |
Forte Biosciences, Inc.(a) | | | 1,659 | | | | 3,550 | |
Frequency Therapeutics, Inc.(a) | | | 4,657 | | | | 23,890 | |
G1 Therapeutics, Inc.(a)(b) | | | 5,130 | | | | 52,377 | |
Galera Therapeutics, Inc.(a)(b) | | | 4,076 | | | | 18,709 | |
Genmab A/S(a) | | | 154 | | | | 61,470 | |
Gilead Sciences, Inc. | | | 5,016 | | | | 364,212 | |
Global Blood Therapeutics, Inc.(a) | | | 3,835 | | | | 112,250 | |
GlycoMimetics, Inc.(a) | | | 5,325 | | | | 7,668 | |
Grifols SA | | | 444 | | | | 8,544 | |
Gritstone bio, Inc.(a) | | | 11,781 | | | | 151,504 | |
Halozyme Therapeutics, Inc.(a)(b) | | | 18,303 | | | | 735,964 | |
Heron Therapeutics, Inc.(a)(b) | | | 17,833 | | | | 162,815 | |
Homology Medicines, Inc.(a)(b) | | | 6,560 | | | | 23,878 | |
Horizon Therapeutics PLC(a) | | | 1,476 | | | | 159,054 | |
Hugel, Inc.(a) | | | 880 | | | | 113,538 | |
Imeik Technology Development Co. Ltd. | | | 800 | | | | 67,462 | |
ImmunityBio, Inc.(a)(b) | | | 1,861 | | | | 11,315 | |
ImmunoGen, Inc.(a) | | | 3,634 | | | | 26,964 | |
Incyte Corp.(a) | | | 846 | | | | 62,096 | |
Infinity Pharmaceuticals, Inc.(a) | | | 6,021 | | | | 13,547 | |
Innovent Biologics, Inc.(a)(c) | | | 27,500 | | | | 170,290 | |
Inovio Pharmaceuticals, Inc.(a)(b) | | | 18,125 | | | | 90,444 | |
Inozyme Pharma, Inc.(a) | | | 892 | | | | 6,083 | |
Insmed, Inc.(a) | | | 8,502 | | | | 231,594 | |
Intellia Therapeutics, Inc.(a) | | | 3,889 | | | | 459,835 | |
Intercept Pharmaceuticals, Inc.(a) | | | 1,472 | | | | 23,979 | |
Invitae Corp.(a) | | | 19,299 | | | | 294,696 | |
Ionis Pharmaceuticals, Inc.(a) | | | 456 | | | | 13,876 | |
Iovance Biotherapeutics, Inc.(a) | | | 479 | | | | 9,144 | |
Ironwood Pharmaceuticals, Inc.(a) | | | 28,582 | | | | 333,266 | |
iTeos Therapeutics, Inc.(a) | | | 1,216 | | | | 56,617 | |
Jounce Therapeutics, Inc.(a) | | | 3,154 | | | | 26,336 | |
Karyopharm Therapeutics, Inc.(a) | | | 39,299 | | | | 252,693 | |
Kiniksa Pharmaceuticals Ltd., Class A(a) | | | 18,893 | | | | 222,371 | |
Kinnate Biopharma, Inc.(a) | | | 3,570 | | | | 63,260 | |
Kodiak Sciences, Inc.(a) | | | 1,795 | | | | 152,180 | |
Kronos Bio, Inc.(a) | | | 996 | | | | 13,536 | |
Krystal Biotech, Inc.(a) | | | 1,919 | | | | 134,234 | |
Kura Oncology, Inc.(a) | | | 5,419 | | | | 75,866 | |
| | | | |
MASTER PORTFOLIO SCHEDULE OF INVESTMENTS | | | 5 | |
| | |
Schedule of Investments (continued) December 31, 2021 | | Diversified Equity Master Portfolio (Percentages shown are based on Net Assets) |
| | | | | | | | |
| Security | | Shares | | | Value | |
| | |
Biotechnology (continued) | | | | | | | | |
Kymera Therapeutics, Inc.(a) | | | 1,645 | | | $ | 104,441 | |
Ligand Pharmaceuticals, Inc.(a) | | | 610 | | | | 94,221 | |
LogicBio Therapeutics, Inc.(a) | | | 2,154 | | | | 4,976 | |
Lyell Immunopharma, Inc.(a) | | | 4,668 | | | | 36,130 | |
MacroGenics, Inc.(a) | | | 2,973 | | | | 47,717 | |
MannKind Corp.(a) | | | 21,372 | | | | 93,396 | |
Mirati Therapeutics, Inc.(a) | | | 135 | | | | 19,803 | |
Mirum Pharmaceuticals, Inc.(a) | | | 3,369 | | | | 53,736 | |
Moderna, Inc.(a) | | | 1,977 | | | | 502,118 | |
Molecular Templates, Inc.(a) | | | 1,349 | | | | 5,288 | |
Mustang Bio, Inc.(a) | | | 5,399 | | | | 8,962 | |
Myriad Genetics, Inc.(a) | | | 8,867 | | | | 244,729 | |
Natera, Inc.(a) | | | 1,292 | | | | 120,660 | |
Neurocrine Biosciences, Inc.(a) | | | 343 | | | | 29,213 | |
NextCure, Inc.(a) | | | 6,872 | | | | 41,232 | |
Nkarta, Inc.(a) | | | 1,579 | | | | 24,238 | |
Novavax, Inc.(a) | | | 380 | | | | 54,367 | |
Nymox Pharmaceutical Corp.(a)(b) | | | 5,685 | | | | 7,391 | |
Ocugen, Inc.(a)(b) | | | 14,115 | | | | 64,223 | |
Olema Pharmaceuticals, Inc.(a) | | | 3,835 | | | | 35,896 | |
Oncorus, Inc.(a)(b) | | | 2,121 | | | | 11,178 | |
Oncternal Therapeutics, Inc.(a) | | | 4,499 | | | | 10,213 | |
OPKO Health, Inc.(a)(b) | | | 44,763 | | | | 215,310 | |
Oyster Point Pharma, Inc.(a) | | | 3,332 | | | | 60,842 | |
Passage Bio, Inc.(a) | | | 8,451 | | | | 53,664 | |
Pieris Pharmaceuticals, Inc.(a) | | | 6,677 | | | | 25,239 | |
PMV Pharmaceuticals, Inc.(a) | | | 3,522 | | | | 81,358 | |
Poseida Therapeutics, Inc.(a) | | | 5,208 | | | | 35,466 | |
Precigen, Inc.(a) | | | 4,316 | | | | 16,012 | |
Precision BioSciences, Inc.(a) | | | 9,626 | | | | 71,232 | |
Prelude Therapeutics, Inc.(a) | | | 1,281 | | | | 15,948 | |
Prevail Therapeutics, Inc. | | | 1,105 | | | | 553 | |
Prothena Corp. PLC(a) | | | 1,050 | | | | 51,870 | |
PTC Therapeutics, Inc.(a) | | | 8,990 | | | | 358,072 | |
Puma Biotechnology, Inc.(a) | | | 7,912 | | | | 24,052 | |
Recursion Pharmaceuticals, Inc., Class A(a) | | | 8,722 | | | | 149,408 | |
Regeneron Pharmaceuticals, Inc.(a) | | | 583 | | | | 368,176 | |
REGENXBIO, Inc.(a) | | | 2,829 | | | | 92,508 | |
Relay Therapeutics, Inc.(a) | | | 7,811 | | | | 239,876 | |
Revolution Medicines, Inc.(a) | | | 3,410 | | | | 85,830 | |
Rhythm Pharmaceuticals, Inc.(a) | | | 1,968 | | | | 19,641 | |
Rigel Pharmaceuticals, Inc.(a)(b) | | | 21,910 | | | | 58,062 | |
Rocket Pharmaceuticals, Inc.(a) | | | 1,254 | | | | 27,375 | |
Sage Therapeutics, Inc.(a) | | | 167 | | | | 7,104 | |
Sana Biotechnology, Inc.(a)(b) | | | 3,249 | | | | 50,295 | |
Sangamo Therapeutics, Inc.(a)(b) | | | 25,053 | | | | 187,898 | |
Sarepta Therapeutics, Inc.(a) | | | 267 | | | | 24,043 | |
Seagen, Inc.(a) | | | 677 | | | | 104,664 | |
Seres Therapeutics, Inc.(a) | | | 4,888 | | | | 40,717 | |
Shanghai Junshi Biosciences Co. Ltd.(a) | | | 13,469 | | | | 141,904 | |
Shanghai Junshi Biosciences Co. Ltd., Class H(a)(c) | | | 18,600 | | | | 138,351 | |
Shattuck Labs, Inc.(a) | | | 2,210 | | | | 18,807 | |
Sigilon Therapeutics, Inc.(a) | | | 2,256 | | | | 6,227 | |
Solid Biosciences, Inc.(a) | | | 34,854 | | | | 60,995 | |
Sorrento Therapeutics, Inc.(a)(b) | | | 30,784 | | | | 143,146 | |
Spectrum Pharmaceuticals, Inc.(a) | | | 19,129 | | | | 24,294 | |
SpringWorks Therapeutics, Inc.(a) | | | 1,381 | | | | 85,594 | |
SQZ Biotechnologies Co.(a) | | | 1,471 | | | | 13,136 | |
Stoke Therapeutics, Inc.(a) | | | 966 | | | | 23,174 | |
Surface Oncology, Inc.(a) | | | 4,415 | | | | 21,104 | |
Sutro Biopharma, Inc.(a) | | | 4,252 | | | | 63,270 | |
Taysha Gene Therapies, Inc.(a) | | | 3,969 | | | | 46,239 | |
| | | | | | | | |
| Security | | Shares | | | Value | |
| | |
Biotechnology (continued) | | | | | | | | |
TCR2 Therapeutics, Inc.(a) | | | 4,603 | | | $ | 21,450 | |
TG Therapeutics, Inc.(a) | | | 8,275 | | | | 157,225 | |
Tonix Pharmaceuticals Holding Corp.(a) | | | 62,405 | | | | 22,322 | |
Travere Therapeutics, Inc.(a) | | | 2,019 | | | | 62,670 | |
Twist Bioscience Corp.(a) | | | 4,652 | | | | 360,018 | |
Tyme Technologies, Inc.(a)(b) | | | 16,692 | | | | 10,067 | |
Ultragenyx Pharmaceutical, Inc.(a) | | | 3,282 | | | | 275,983 | |
United Therapeutics Corp.(a) | | | 143 | | | | 30,899 | |
UNITY Biotechnology, Inc.(a) | | | 5,174 | | | | 7,554 | |
UroGen Pharma Ltd.(a) | | | 1,960 | | | | 18,640 | |
Veracyte, Inc.(a) | | | 7,257 | | | | 298,988 | |
Vertex Pharmaceuticals, Inc.(a) | | | 1,042 | | | | 228,823 | |
Verve Therapeutics, Inc.(a) | | | 1,026 | | | | 37,829 | |
Vincerx Pharma, Inc.(a) | | | 1,674 | | | | 17,058 | |
Vir Biotechnology, Inc.(a) | | | 5,237 | | | | 219,273 | |
Yumanity Therapeutics, Inc.(a) | | | 2,431 | | | | 7,196 | |
Zentalis Pharmaceuticals, Inc.(a) | | | 1,831 | | | | 153,914 | |
| | | | | | | | |
| | |
| | | | | | | 24,437,092 | |
| | |
| Building Products — 0.8% | | | | | | |
A O Smith Corp. | | | 203 | | | | 17,428 | |
Advanced Drainage Systems, Inc. | | | 197 | | | | 26,818 | |
Allegion plc | | | 518 | | | | 68,604 | |
Armstrong World Industries, Inc. | | | 155 | | | | 17,999 | |
Assa Abloy AB, Class B | | | 4,034 | | | | 122,960 | |
AZEK Co., Inc.(a) | | | 365 | | | | 16,878 | |
Builders FirstSource, Inc.(a)(b) | | | 16,692 | | | | 1,430,671 | |
Carlisle Cos., Inc. | | | 167 | | | | 41,436 | |
Carrier Global Corp. | | | 4,160 | | | | 225,638 | |
China Lesso Group Holdings Ltd. | | | 69,000 | | | | 99,199 | |
Cie de Saint-Gobain | | | 1,489 | | | | 104,746 | |
Cornerstone Building Brands, Inc.(a) | | | 11,970 | | | | 208,757 | |
Daikin Industries Ltd. | | | 800 | | | | 181,215 | |
Fortune Brands Home & Security, Inc. | | | 437 | | | | 46,715 | |
Geberit AG, Registered Shares | | | 71 | | | | 57,874 | |
Gibraltar Industries, Inc.(a) | | | 837 | | | | 55,811 | |
Griffon Corp. | | | 3,577 | | | | 101,873 | |
JELD-WEN Holding, Inc.(a) | | | 8,996 | | | | 237,135 | |
Johnson Controls International PLC | | | 3,597 | | | | 292,472 | |
Kajaria Ceramics Ltd. | | | 5,868 | | | | 101,687 | |
Kingspan Group PLC | | | 571 | | | | 68,112 | |
Lennox International, Inc. | | | 557 | | | | 180,668 | |
LG Hausys Ltd. | | | 2,779 | | | | 143,519 | |
Lixil Corp. | | | 400 | | | | 10,671 | |
Masco Corp. | | | 8,033 | | | | 564,077 | |
Nibe Industrier AB, B Shares | | | 7,305 | | | | 110,378 | |
Owens Corning | | | 2,850 | | | | 257,925 | |
Resideo Technologies, Inc.(a) | | | 11,785 | | | | 306,763 | |
Rockwool International A/S, B Shares | | | 112 | | | | 48,908 | |
Trane Technologies PLC(b) | | | 7,391 | | | | 1,493,204 | |
Trex Co., Inc.(a)(b) | | | 2,055 | | | | 277,487 | |
UFP Industries, Inc. | | | 6,979 | | | | 642,138 | |
Xinyi Glass Holdings Ltd. | | | 7,000 | | | | 17,534 | |
Zurn Water Solutions Corp. | | | 3,810 | | | | 138,684 | |
| | | | | | | | |
| | |
| | | | | | | 7,715,984 | |
| | |
| Capital Markets — 1.8% | | | | | | |
3i Group PLC | | | 2,475 | | | | 48,518 | |
Abrdn PLC | | | 4,951 | | | | 16,130 | |
Affiliated Managers Group, Inc. | | | 133 | | | | 21,880 | |
Ameriprise Financial, Inc. | | | 593 | | | | 178,884 | |
Amundi SA(c) | | | 666 | | | | 54,935 | |
Apollo Global Management, Inc. | | | 5,638 | | | | 408,360 | |
Ares Management Corp., Class A | | | 447 | | | | 36,328 | |
| | |
| 6 | | 2 0 2 1 BLACK ROCK ANNUAL REPORT TO SHAREHOLDERS |
| | |
Schedule of Investments (continued) December 31, 2021 | | Diversified Equity Master Portfolio (Percentages shown are based on Net Assets) |
| | | | | | | | |
| Security | | Shares | | | Value | |
| | |
Capital Markets (continued) | | | | | | | | |
Artisan Partners Asset Management, Inc., Class A | | | 10,477 | | | $ | 499,124 | |
ASX Ltd. | | | 815 | | | | 55,081 | |
B3 SA - Brasil Bolsa Balcao | | | 187,278 | | | | 372,942 | |
Bank of New York Mellon Corp. | | | 2,112 | | | | 122,665 | |
Blackstone, Inc. | | | 2,279 | | | | 294,880 | |
Cboe Global Markets, Inc. | | | 173 | | | | 22,559 | |
Charles Schwab Corp. | | | 4,184 | | | | 351,874 | |
China Galaxy Securities Co. Ltd., Class H | | | 361,500 | | | | 207,779 | |
CITIC Securities Co. Ltd., Class A | | | 171,100 | | | | 711,096 | |
CITIC Securities Co. Ltd., Class H | | | 95,000 | | | | 248,127 | |
CME Group, Inc. | | | 1,000 | | | | 228,460 | |
Cohen & Steers, Inc. | | | 3,061 | | | | 283,173 | |
Cowen, Inc., Class A | | | 3,472 | | | | 125,339 | |
Credit Suisse Group AG, Registered Shares | | | 7,047 | | | | 68,325 | |
Daiwa Securities Group, Inc. | | | 6,300 | | | | 35,551 | |
Deutsche Bank AG, Registered Shares(a) | | | 5,907 | | | | 73,572 | |
Deutsche Boerse AG | | | 655 | | | | 109,368 | |
Donnelley Financial Solutions, Inc.(a) | | | 2,028 | | | | 95,600 | |
EQT AB | | | 1,178 | | | | 63,859 | |
Euronext NV(c) | | | 227 | | | | 23,600 | |
Evercore, Inc., Class A(b) | | | 126 | | | | 17,117 | |
FactSet Research Systems, Inc.(b) | | | 1,458 | | | | 708,603 | |
Franklin Resources, Inc. | | | 433 | | | | 14,501 | |
Futu Holdings Ltd., ADR(a)(b) | | | 124 | | | | 5,369 | |
GF Securities Co. Ltd., Class H | | | 72,000 | | | | 137,305 | |
Goldman Sachs Group, Inc. | | | 1,702 | | | | 651,100 | |
Hamilton Lane, Inc., Class A | | | 3,585 | | | | 371,478 | |
Hargreaves Lansdown PLC | | | 965 | | | | 17,733 | |
HDFC Asset Management Co. Ltd.(c) | | | 4,224 | | | | 138,542 | |
Hong Kong Exchanges & Clearing Ltd. | | | 2,800 | | | | 163,755 | |
Houlihan Lokey, Inc.(b) | | | 3,779 | | | | 391,202 | |
Interactive Brokers Group, Inc., Class A | | | 261 | | | | 20,729 | |
Intercontinental Exchange, Inc. | | | 4,277 | | | | 584,965 | |
Invesco Ltd. | | | 444 | | | | 10,221 | |
Janus Henderson Group PLC | | | 555 | | | | 23,277 | |
Japan Exchange Group, Inc. | | | 1,800 | | | | 39,437 | |
Jefferies Financial Group, Inc. | | | 711 | | | | 27,587 | |
Julius Baer Group Ltd. | | | 452 | | | | 30,226 | |
KKR & Co., Inc. | | | 2,086 | | | | 155,407 | |
Lazard Ltd., Class A | | | 308 | | | | 13,438 | |
London Stock Exchange Group PLC | | | 931 | | | | 87,579 | |
LPL Financial Holdings, Inc. | | | 259 | | | | 41,463 | |
Macquarie Group Ltd. | | | 1,188 | | | | 177,589 | |
Magellan Financial Group Ltd. | | | 571 | | | | 8,823 | |
MarketAxess Holdings, Inc. | | | 65 | | | | 26,733 | |
Moelis & Co., Class A | | | 5,630 | | | | 351,931 | |
Moody’s Corp. | | | 1,360 | | | | 531,189 | |
Morgan Stanley | | | 10,739 | | | | 1,054,140 | |
Morningstar, Inc. | | | 76 | | | | 25,991 | |
MSCI, Inc. | | | 290 | | | | 177,680 | |
Nasdaq, Inc. | | | 202 | | | | 42,422 | |
Nomura Holdings, Inc. | | | 13,200 | | | | 57,495 | |
Northern Trust Corp. | | | 495 | | | | 59,207 | |
Open Lending Corp., Class A(a) | | | 6,475 | | | | 145,558 | |
Partners Group Holding AG | | | 65 | | | | 107,303 | |
Piper Sandler Cos | | | 1,256 | | | | 224,209 | |
Raymond James Financial, Inc. | | | 289 | | | | 29,016 | |
S&P Global, Inc.(b) | | | 6,090 | | | | 2,874,054 | |
SBI Holdings, Inc. | | | 800 | | | | 21,821 | |
Schroders PLC | | | 232 | | | | 11,198 | |
Sculptor Capital Management, Inc. | | | 2,234 | | | | 47,696 | |
Silvercrest Asset Management Group, Inc., Class A | | | 2,743 | | | | 47,097 | |
| | | | | | | | |
| Security | | Shares | | | Value | |
| | |
Capital Markets (continued) | | | | | | | | |
St James’s Place PLC | | | 1,305 | | | $ | 29,822 | |
State Street Corp. | | | 868 | | | | 80,724 | |
Stifel Financial Corp. | | | 36,216 | | | | 2,550,331 | |
T. Rowe Price Group, Inc. | | | 605 | | | | 118,967 | |
Tradeweb Markets, Inc., Class A | | | 106 | | | | 10,615 | |
UBS Group AG, Registered Shares | | | 8,872 | | | | 159,246 | |
Virtu Financial, Inc., Class A | | | 298 | | | | 8,591 | |
Virtus Investment Partners, Inc. | | | 933 | | | | 277,194 | |
| | | | | | | | |
| | |
| | | | | | | 17,665,685 | |
| | |
| Chemicals — 1.8% | | | | | | |
Air Liquide SA | | | 1,500 | | | | 261,606 | |
Akzo Nobel NV | | | 865 | | | | 95,033 | |
Albemarle Corp. | | | 123 | | | | 28,754 | |
Arkema SA | | | 399 | | | | 56,317 | |
Asahi Kasei Corp. | | | 2,200 | | | | 20,725 | |
Ashland Global Holdings, Inc. | | | 179 | | | | 19,271 | |
Asian Paints Ltd. | | | 12,693 | | | | 576,766 | |
Avient Corp. | | | 13,949 | | | | 780,447 | |
Axalta Coating Systems Ltd.(a) | | | 670 | | | | 22,190 | |
BASF SE | | | 3,943 | | | | 276,741 | |
Cabot Corp. | | | 502 | | | | 28,212 | |
Chemours Co. | | | 535 | | | | 17,955 | |
Corteva, Inc. | | | 6,771 | | | | 320,133 | |
Covestro AG(c) | | | 548 | | | | 33,728 | |
Croda International PLC | | | 117 | | | | 16,026 | |
Diversey Holdings Ltd.(a) | | | 162 | | | | 2,156 | |
Dongyue Group Ltd. | | | 44,000 | | | | 68,731 | |
Dow, Inc. | | | 271 | | | | 15,371 | |
DuPont de Nemours, Inc. | | | 1,318 | | | | 106,468 | |
Ecolab, Inc. | | | 7,606 | | | | 1,784,292 | |
Element Solutions, Inc. | | | 752 | | | | 18,259 | |
Formosa Plastics Corp. | | | 241,000 | | | | 904,538 | |
Givaudan SA, Registered Shares | | | 17 | | | | 89,192 | |
Guangzhou Tinci Materials Technology Co. Ltd., Class A | | | 5,700 | | | | 102,791 | |
Hawkins, Inc. | | | 7,908 | | | | 311,971 | |
HB Fuller Co. | | | 12,690 | | | | 1,027,890 | |
Hengli Petrochemical Co. Ltd., Class A | | | 46,900 | | | | 169,588 | |
Huntsman Corp. | | | 685 | | | | 23,893 | |
Innospec, Inc. | | | 7,519 | | | | 679,266 | |
International Flavors & Fragrances, Inc. | | | 666 | | | | 100,333 | |
Kansai Paint Co. Ltd. | | | 2,300 | | | | 50,016 | |
Kolon Industries, Inc.(a) | | | 915 | | | | 54,499 | |
LG Chem Ltd. | | | 1,189 | | | | 614,667 | |
Livent Corp.(a)(b) | | | 4,758 | | | | 116,000 | |
Lotte Chemical Corp. | | | 2,008 | | | | 366,300 | |
Mitsubishi Chemical Holdings Corp. | | | 1,900 | | | | 14,093 | |
Mosaic Co. | | | 4,736 | | | | 186,077 | |
Nan Ya Plastics Corp. | | | 404,000 | | | | 1,244,620 | |
NewMarket Corp. | | | 21 | | | | 7,197 | |
Nippon Sanso Holdings Corp. | | | 1,100 | | | | 24,060 | |
Nissan Chemical Corp. | | | 200 | | | | 11,632 | |
Novozymes A/S, B Shares | | | 305 | | | | 25,043 | |
Orica Ltd. | | | 1,698 | | | | 16,933 | |
Petronas Chemicals Group Bhd | | | 80,800 | | | | 173,004 | |
PhosAgro PJSC | | | 707 | | | | 54,764 | |
PhosAgro PJSC, GDR, Registered Shares | | | 15,215 | | | | 328,284 | |
PPG Industries, Inc. | | | 578 | | | | 99,670 | |
PTT Global Chemical PCL, NVDR | | | 134,500 | | | | 236,399 | |
Quaker Chemical Corp.(b) | | | 620 | | | | 143,084 | |
SABIC Agri-Nutrients Co. | | | 2,224 | | | | 104,404 | |
Sahara International Petrochemical Co. | | | 7,028 | | | | 78,325 | |
| | | | |
MASTER PORTFOLIO SCHEDULE OF INVESTMENTS | | | 7 | |
| | |
Schedule of Investments (continued) December 31, 2021 | | Diversified Equity Master Portfolio (Percentages shown are based on Net Assets) |
| | | | | | | | |
| Security | | Shares | | | Value | |
| | |
Chemicals (continued) | | | | | | | | |
Saudi Basic Industries Corp. | | | 63,743 | | | $ | 1,965,796 | |
Saudi Kayan Petrochemical Co.(a) | | | 11,763 | | | | 53,141 | |
Scotts Miracle-Gro Co. | | | 133 | | | | 21,413 | |
Sensient Technologies Corp. | | | 4,826 | | | | 482,890 | |
Shanghai Putailai New Energy Technology Co. Ltd., Class A | | | 7,000 | | | | 176,839 | |
Shenzhen Capchem Technology Co. Ltd., Class A | | | 12,800 | | | | 227,471 | |
Sherwin-Williams Co. | | | 2,029 | | | | 714,533 | |
Shin-Etsu Chemical Co. Ltd. | | | 1,200 | | | | 208,290 | |
Sika AG, Registered Shares | | | 293 | | | | 121,776 | |
Sinopec Shanghai Petrochemical Co. Ltd., Class H | | | 652,000 | | | | 149,766 | |
Solvay SA | | | 745 | | | | 86,611 | |
SRF Ltd. | | | 4,885 | | | | 158,716 | |
Stepan Co. | | | 3,507 | | | | 435,885 | |
Umicore SA | | | 473 | | | | 19,296 | |
UPL Ltd. | | | 19,450 | | | | 194,721 | |
USI Corp. | | | 105,000 | | | | 119,579 | |
Valvoline, Inc. | | | 589 | | | | 21,964 | |
Westlake Chemical Corp. | | | 108 | | | | 10,490 | |
| | | | | | | | |
| | |
| | | | | | | 17,076,891 | |
| | |
| Commercial Services & Supplies — 0.4% | | | | | | |
ABM Industries, Inc. | | | 5,984 | | | | 244,446 | |
ACCO Brands Corp. | | | 32,148 | | | | 265,542 | |
ADT, Inc. | | | 514 | | | | 4,323 | |
Aris Water Solution, Inc.(a) | | | 6,520 | | | | 84,434 | |
Brambles Ltd. | | | 6,883 | | | | 53,249 | |
BrightView Holdings, Inc.(a) | | | 11,251 | | | | 158,414 | |
Cimpress PLC(a) | | | 2,526 | | | | 180,887 | |
Cintas Corp. | | | 193 | | | | 85,532 | |
Clean Harbors, Inc.(a) | | | 165 | | | | 16,462 | |
Copart, Inc.(a) | | | 986 | | | | 149,497 | |
Dai Nippon Printing Co. Ltd. | | | 600 | | | | 15,100 | |
Deluxe Corp. | | | 2,512 | | | | 80,660 | |
Driven Brands Holdings, Inc.(a) | | | 175 | | | | 5,884 | |
IAA, Inc.(a)(b) | | | 438 | | | | 22,172 | |
KAR Auction Services, Inc.(a)(b) | | | 8,845 | | | | 138,159 | |
Kimball International, Inc., Class B | | | 22,633 | | | | 231,536 | |
MSA Safety, Inc. | | | 119 | | | | 17,964 | |
Quad/Graphics, Inc.(a) | | | 12,121 | | | | 48,484 | |
Rentokil Initial PLC | | | 9,760 | | | | 77,258 | |
Republic Services, Inc. | | | 203 | | | | 28,308 | |
Rollins, Inc. | | | 684 | | | | 23,400 | |
RR Donnelley & Sons Co.(a) | | | 4,881 | | | | 54,960 | |
Saudi Airlines Catering Co.(a) | | | 17,908 | | | | 371,082 | |
Secom Co. Ltd. | | | 1,200 | | | | 83,383 | |
Securitas AB, B Shares | | | 1,626 | | | | 22,368 | |
Sohgo Security Services Co. Ltd. | | | 400 | | | | 15,894 | |
Steelcase, Inc., Class A | | | 24,172 | | | | 283,296 | |
Stericycle, Inc.(a) | | | 297 | | | | 17,713 | |
Tetra Tech, Inc. | | | 6,171 | | | | 1,047,836 | |
Toppan Inc. | | | 700 | | | | 13,136 | |
Waste Connections, Inc. | | | 1,510 | | | | 205,768 | |
Waste Management, Inc. | | | 1,216 | | | | 202,950 | |
| | | | | | | | |
| | |
| | | | | | | 4,250,097 | |
| | |
| Communications Equipment — 0.3% | | | | | | |
Applied Optoelectronics, Inc.(a) | | | 8,336 | | | | 42,847 | |
Calix, Inc.(a) | | | 7,782 | | | | 622,326 | |
Casa Systems, Inc.(a) | | | 6,565 | | | | 37,223 | |
Ciena Corp.(a) | | | 501 | | | | 38,562 | |
CommScope Holding Co., Inc.(a) | | | 652 | | | | 7,198 | |
Extreme Networks, Inc.(a) | | | 10,098 | | | | 158,539 | |
| | | | | | | | |
| Security | | Shares | | | Value | |
| | |
Communications Equipment (continued) | | | | | | | | |
Harmonic, Inc.(a) | | | 14,184 | | | $ | 166,804 | |
Infinera Corp.(a)(b) | | | 15,761 | | | | 151,148 | |
Juniper Networks, Inc. | | | 16,791 | | | | 599,607 | |
Lumentum Holdings, Inc.(a) | | | 246 | | | | 26,019 | |
NETGEAR, Inc.(a) | | | 8,056 | | | | 235,316 | |
Ubiquiti, Inc. | | | 21 | | | | 6,441 | |
ViaSat, Inc.(a)(b) | | | 226 | | | | 10,066 | |
Viavi Solutions, Inc.(a) | | | 8,723 | | | | 153,699 | |
ZTE Corp., Class A | | | 63,086 | | | | 332,389 | |
ZTE Corp., Class H | | | 57,400 | | | | 157,277 | |
| | | | | | | | |
| | |
| | | | | | | 2,745,461 | |
| | |
| Construction & Engineering — 0.6% | | | | | | |
AECOM(a) | | | 443 | | | | 34,266 | |
Ameresco, Inc., Class A(a) | | | 3,168 | | | | 258,002 | |
Bouygues SA | | | 610 | | | | 21,836 | |
Comfort Systems USA, Inc.(b) | | | 3,241 | | | | 320,664 | |
Dycom Industries, Inc.(a) | | | 1,043 | | | | 97,792 | |
EMCOR Group, Inc. | | | 20,058 | | | | 2,555,189 | |
Ferrovial SA | | | 1,242 | | | | 38,842 | |
Fluor Corp.(a)(b) | | | 9,166 | | | | 227,042 | |
Kajima Corp. | | | 1,100 | | | | 12,642 | |
Larsen & Toubro Ltd. | | | 6,899 | | | | 175,234 | |
MasTec, Inc.(a) | | | 3,977 | | | | 366,997 | |
Matrix Service Co.(a) | | | 6,515 | | | | 48,993 | |
Metallurgical Corp. of China Ltd., Class A | | | 190,800 | | | | 115,235 | |
MYR Group, Inc.(a) | | | 1,427 | | | | 157,755 | |
Obayashi Corp. | | | 1,200 | | | | 9,287 | |
Primoris Services Corp. | | | 10,252 | | | | 245,843 | |
Quanta Services, Inc. | | | 450 | | | | 51,597 | |
Samsung Engineering Co. Ltd.(a) | | | 5,230 | | | | 100,557 | |
Sino-Thai Engineering & Construction PCL | | | 273,700 | | | | 120,273 | |
Skanska AB, B Shares | | | 661 | | | | 17,081 | |
Taisei Corp. | | | 700 | | | | 21,287 | |
Tutor Perini Corp.(a) | | | 8,422 | | | | 104,180 | |
Valmont Industries, Inc. | | | 68 | | | | 17,034 | |
Vinci SA | | | 1,471 | | | | 155,359 | |
WillScot Mobile Mini Holdings Corp.(a) | | | 9,762 | | | | 398,680 | |
| | | | | | | | |
| | |
| | | | | | | 5,671,667 | |
| | |
| Construction Materials — 0.4% | | | | | | |
Cemex SAB de CV(a) | | | 489,752 | | | | 334,626 | |
Cemex SAB de CV, ADR(a) | | | 19,836 | | | | 134,488 | |
China Jushi Co. Ltd. | | | 66,900 | | | | 191,599 | |
China National Building Material Co. Ltd., Class H | | | 210,000 | | | | 257,825 | |
China Resources Cement Holdings Ltd. | | | 712,000 | | | | 538,508 | |
CRH PLC | | | 2,819 | | | | 149,238 | |
Eagle Materials, Inc. | | | 134 | | | | 22,306 | |
HeidelbergCement AG | | | 229 | | | | 15,498 | |
Holcim Ltd., Registered Shares | | | 2,814 | | | | 143,117 | |
James Hardie Industries PLC | | | 1,910 | | | | 76,882 | |
Siam Cement PCL, NVDR | | | 43,500 | | | | 502,908 | |
Summit Materials, Inc., Class A(a)(b) | | | 13,167 | | | | 528,523 | |
UltraTech Cement Ltd. | | | 2,305 | | | | 234,786 | |
Vulcan Materials Co. | | | 4,157 | | | | 862,910 | |
West China Cement Ltd. | | | 812,000 | | | | 144,777 | |
| | | | | | | | |
| | |
| | | | | | | 4,137,991 | |
| | |
| Consumer Finance — 0.6% | | | | | | |
Ally Financial, Inc. | | | 33,319 | | | | 1,586,318 | |
American Express Co. | | | 5,891 | | | | 963,768 | |
Bajaj Finance Ltd. | | | 6,317 | | | | 590,027 | |
Capital One Financial Corp. | | | 4,944 | | | | 717,325 | |
Credit Acceptance Corp.(a)(b) | | | 28 | | | | 19,255 | |
| | |
| 8 | | 2 0 2 1 BLACK ROCK ANNUAL REPORT TO SHAREHOLDERS |
| | |
Schedule of Investments (continued) December 31, 2021 | | Diversified Equity Master Portfolio (Percentages shown are based on Net Assets) |
| | | | | | | | |
| Security | | Shares | | | Value | |
| | |
Consumer Finance (continued) | | | | | | | | |
Discover Financial Services | | | 750 | | | $ | 86,670 | |
Encore Capital Group, Inc.(a)(b) | | | 582 | | | | 36,148 | |
Enova International, Inc.(a) | | | 6,217 | | | | 254,648 | |
Ezcorp, Inc., Class A(a) | | | 28,966 | | | | 213,479 | |
Isracard Ltd. | | | 1 | | | | 5 | |
LendingClub Corp.(a) | | | 7,075 | | | | 171,073 | |
LendingTree, Inc.(a) | | | 2,593 | | | | 317,902 | |
Mahindra & Mahindra Financial Services Ltd. | | | 39,998 | | | | 79,890 | |
OneMain Holdings, Inc. | | | 365 | | | | 18,265 | |
Oportun Financial Corp.(a) | | | 3,212 | | | | 65,043 | |
PRA Group, Inc.(a)(b) | | | 12,408 | | | | 623,006 | |
PROG Holdings, Inc.(a) | | | 6,537 | | | | 294,884 | |
Regional Management Corp. | | | 1,681 | | | | 96,590 | |
Santander Consumer USA Holdings, Inc.(b) | | | 196 | | | | 8,236 | |
SLM Corp. | | | 991 | | | | 19,493 | |
Synchrony Financial | | | 1,140 | | | | 52,885 | |
Upstart Holdings Inc(a) | | | 54 | | | | 8,170 | |
| | | | | | | | |
| | |
| | | | | | | 6,223,080 | |
| | |
| Containers & Packaging — 0.3% | | | | | | |
AptarGroup, Inc. | | | 213 | | | | 26,088 | |
Ardagh Group SA(a) | | | 56 | | | | 1,264 | |
Ardagh Metal Packaging SA(a) | | | 127 | | | | 1,147 | |
Avery Dennison Corp. | | | 2,451 | | | | 530,813 | |
Ball Corp. | | | 3,403 | | | | 327,607 | |
Berry Global Group, Inc.(a) | | | 439 | | | | 32,389 | |
Crown Holdings, Inc. | | | 2,925 | | | | 323,564 | |
Graphic Packaging Holding Co. | | | 917 | | | | 17,882 | |
Greif, Inc., Class A | | | 1,369 | | | | 82,647 | |
Klabin SA | | | 37,815 | | | | 173,900 | |
Packaging Corp. of America(b) | | | 831 | | | | 113,141 | |
Sealed Air Corp. | | | 1,405 | | | | 94,795 | |
Silgan Holdings, Inc. | | | 272 | | | | 11,652 | |
Smurfit Kappa Group PLC | | | 673 | | | | 37,093 | |
Sonoco Products Co. | | | 319 | | | | 18,467 | |
Westrock Co. | | | 12,134 | | | | 538,264 | |
Yunnan Energy New Material Co. Ltd., Class A | | | 7,100 | | | | 279,325 | |
| | | | | | | | |
| | |
| | | | | | | 2,610,038 | |
| | |
| Distributors — 0.1% | | | | | | |
Genuine Parts Co. | | | 2,608 | | | | 365,642 | |
LKQ Corp. | | | 2,350 | | | | 141,070 | |
Pool Corp. | | | 313 | | | | 177,158 | |
| | | | | | | | |
| | |
| | | | | | | 683,870 | |
| | |
| Diversified Consumer Services — 0.2% | | | | | | |
2U, Inc.(a) | | | 14,399 | | | | 288,988 | |
Bright Horizons Family Solutions, Inc.(a) | | | 197 | | | | 24,798 | |
Carriage Services, Inc. | | | 2,401 | | | | 154,720 | |
Chegg, Inc.(a) | | | 1,980 | | | | 60,786 | |
Coursera, Inc.(a)(b) | | | 7,033 | | | | 171,887 | |
frontdoor, Inc.(a) | | | 279 | | | | 10,225 | |
Grand Canyon Education, Inc.(a) | | | 145 | | | | 12,428 | |
H&R Block, Inc. | | | 26,728 | | | | 629,712 | |
Houghton Mifflin Harcourt Co.(a) | | | 9,650 | | | | 155,365 | |
IDP Education Ltd. | | | 420 | | | | 10,581 | |
Mister Car Wash, Inc.(a) | | | 130 | | | | 2,367 | |
Nerdy, Inc.(a) | | | 11,341 | | | | 51,035 | |
Service Corp. International | | | 7,267 | | | | 515,884 | |
Strategic Education, Inc. | | | 3,390 | | | | 196,078 | |
Terminix Global Holdings, Inc.(a) | | | 405 | | | | 18,318 | |
| | | | | | | | |
| Security | | Shares | | | Value | |
| | |
Diversified Consumer Services (continued) | | | | | | | | |
Universal Technical Institute, Inc.(a) | | | 5,992 | | | $ | 46,857 | |
WW International, Inc.(a) | | | 2,616 | | | | 42,196 | |
| | | | | | | | |
| | |
| | | | | | | 2,392,225 | |
| | |
| Diversified Financial Services — 0.7% | | | | | | |
Alerus Financial Corp. | | | 2,021 | | | | 59,175 | |
Berkshire Hathaway, Inc., Class B(a) | | | 8,982 | | | | 2,685,618 | |
Chailease Holding Co. Ltd. | | | 20,000 | | | | 190,236 | |
Equitable Holdings, Inc. | | | 2,142 | | | | 70,236 | |
Eurazeo SE | | | 163 | | | | 14,221 | |
EXOR NV | | | 109 | | | | 9,757 | |
Far East Horizon Ltd. | | | 109,000 | | | | 96,733 | |
FirstRand Ltd. | | | 235,489 | | | | 898,423 | |
Groupe Bruxelles Lambert SA | | | 734 | | | | 81,978 | |
Industrivarden AB, A Shares | | | 1,164 | | | | 36,985 | |
Industrivarden AB, C Shares | | | 1,439 | | | | 45,085 | |
Investor AB | | | 3,079 | | | | 81,001 | |
Investor AB, B Shares | | | 8,806 | | | | 220,972 | |
Kinnevik AB, Class B(a) | | | 971 | | | | 34,523 | |
L E Lundbergforetagen AB, B Shares | | | 502 | | | | 28,125 | |
M&G PLC | | | 5,424 | | | | 14,674 | |
Mitsubishi HC Capital, Inc. | | | 3,900 | | | | 19,295 | |
ORIX Corp. | | | 4,300 | | | | 87,755 | |
Remgro Ltd. | | | 34,523 | | | | 284,135 | |
Sofina SA | | | 96 | | | | 47,156 | |
Voya Financial, Inc. | | | 31,987 | | | | 2,121,058 | |
Wendel SE | | | 169 | | | | 20,251 | |
| | | | | | | | |
| | |
| | | | | | | 7,147,392 | |
|
| Diversified Telecommunication Services — 0.5% | |
Bandwidth, Inc., Class A(a)(b) | | | 7,562 | | | | 542,649 | |
BT Group PLC | | | 17,682 | | | | 40,677 | |
Cellnex Telecom SA(c) | | | 775 | | | | 44,894 | |
Cogent Communications Holdings, Inc. | | | 1,758 | | | | 128,650 | |
Deutsche Telekom AG, Registered Shares | | | 8,767 | | | | 161,992 | |
EchoStar Corp., Class A(a)(b) | | | 6,922 | | | | 182,395 | |
Emirates Telecommunications Group Co. PJSC | | | 97,162 | | | | 839,515 | |
Globalstar, Inc.(a)(b) | | | 31,230 | | | | 36,227 | |
IDT Corp., Class B(a)(b) | | | 4,445 | | | | 196,291 | |
Iridium Communications, Inc.(a)(b) | | | 15,415 | | | | 636,485 | |
Koninklijke KPN NV | | | 4,794 | | | | 14,900 | |
KT Corp., ADR(a) | | | 37,836 | | | | 475,599 | |
Nippon Telegraph & Telephone Corp. | | | 2,800 | | | | 76,575 | |
Ooma, Inc.(a) | | | 6,884 | | | | 140,709 | |
Orange SA | | | 3,644 | | | | 38,926 | |
Singapore Telecommunications Ltd. | | | 38,500 | | | | 66,277 | |
Spark New Zealand Ltd. | | | 9,384 | | | | 29,020 | |
Telefonica SA | | | 5,865 | | | | 25,432 | |
Telenor ASA | | | 3,436 | | | | 54,011 | |
Telia Co. AB | | | 17,757 | | | | 69,447 | |
Telkom SA SOC Ltd.(a) | | | 36,963 | | | | 125,445 | |
Telstra Corp. Ltd. | | | 17,290 | | | | 52,548 | |
Turk Telekomunikasyon AS | | | 200,934 | | | | 146,269 | |
Verizon Communications, Inc. | | | 6,172 | | | | 320,697 | |
| | | | | | | | |
| | |
| | | | | | | 4,445,630 | |
| | |
| Electric Utilities — 1.1% | | | | | | |
AusNet Services Ltd. | | | 41,843 | | | | 78,275 | |
Avangrid, Inc.(b) | | | 186 | | | | 9,278 | |
CK Infrastructure Holdings Ltd. | | | 24,000 | | | | 152,909 | |
CPFL Energia SA | | | 17,883 | | | | 86,140 | |
Edison International | | | 5,773 | | | | 394,007 | |
Electricite de France SA | | | 4,196 | | | | 49,350 | |
| | | | |
MASTER PORTFOLIO SCHEDULE OF INVESTMENTS | | | 9 | |
| | |
Schedule of Investments (continued) December 31, 2021 | | Diversified Equity Master Portfolio (Percentages shown are based on Net Assets) |
| | | | | | | | |
| Security | | Shares | | | Value | |
| | |
Electric Utilities (continued) | | | | | | | | |
Elia Group SA/NV | | | 1,154 | | | $ | 152,104 | |
Endesa SA | | | 6,988 | | | | 160,874 | |
Enel SpA | | | 37,669 | | | | 301,204 | |
Energisa SA | | | 58,399 | | | | 464,408 | |
Entergy Corp. | | | 3,693 | | | | 416,016 | |
Eversource Energy | | | 4,794 | | | | 436,158 | |
Exelon Corp. | | | 10,831 | | | | 625,599 | |
FirstEnergy Corp. | | | 7,711 | | | | 320,700 | |
Fortum OYJ | | | 4,737 | | | | 145,286 | |
Hawaiian Electric Industries, Inc. | | | 343 | | | | 14,234 | |
Iberdrola SA | | | 31,227 | | | | 369,727 | |
Inter RAO UES PJSC(a) | | | 2,801,942 | | | | 158,970 | |
Light SA | | | 63,259 | | | | 133,057 | |
Manila Electric Co. | | | 12,150 | | | | 70,308 | |
Mercury NZ Ltd. | | | 23,863 | | | | 99,972 | |
NextEra Energy, Inc. | | | 22,008 | | | | 2,054,667 | |
OGE Energy Corp. | | | 33,044 | | | | 1,268,229 | |
Orsted A/S(c) | | | 946 | | | | 121,151 | |
Pinnacle West Capital Corp. | | | 1,437 | | | | 101,438 | |
PNM Resources, Inc. | | | 3,148 | | | | 143,580 | |
Portland General Electric Co. | | | 18,012 | | | | 953,195 | |
Red Electrica Corp. SA | | | 138 | | | | 2,984 | |
SSE PLC | | | 8,681 | | | | 194,065 | |
Tenaga Nasional Bhd | | | 236,300 | | | | 529,687 | |
Terna SPA | | | 19,479 | | | | 157,578 | |
Verbund AG | | | 688 | | | | 77,320 | |
| | | | | | | | |
| | |
| | | | | | 10,242,470 | |
| | |
| Electrical Equipment — 0.6% | | | | | | |
ABB Ltd., Registered Shares | | | 348 | | | | 13,263 | |
Acuity Brands, Inc. | | | 115 | | | | 24,348 | |
Amara Raja Batteries Ltd. | | | 23,106 | | | | 197,524 | |
AMETEK, Inc. | | | 3,750 | | | | 551,400 | |
Atkore, Inc.(a) | | | 5,387 | | | | 598,981 | |
AZZ, Inc. | | | 2,734 | | | | 151,163 | |
Bizlink Holding, Inc. | | | 21,000 | | | | 197,637 | |
Bloom Energy Corp., Class A(a) | | | 12,765 | | | | 279,936 | |
ChargePoint Holdings, Inc.(a) | | | 340 | | | | 6,477 | |
Contemporary Amperex Technology Co. Ltd., Class A | | | 12,600 | | | | 1,163,538 | |
Encore Wire Corp. | | | 1,163 | | | | 166,425 | |
FuelCell Energy, Inc.(a)(b) | | | 12,130 | | | | 63,076 | |
Havells India Ltd. | | | 22,439 | | | | 420,954 | |
Hubbell, Inc. | | | 176 | | | | 36,656 | |
Legrand SA | | | 592 | | | | 69,336 | |
LS Electric Co. Ltd. | | | 7,122 | | | | 333,470 | |
Mitsubishi Electric Corp. | | | 5,200 | | | | 66,004 | |
Nidec Corp. | | | 800 | | | | 94,635 | |
nVent Electric PLC | | | 541 | | | | 20,558 | |
Regal Rexnord Corp. | | | 914 | | | | 155,545 | |
Schneider Electric SE | | | 1,250 | | | | 245,744 | |
Shoals Technologies Group, Inc., Class A(a)(b) | | | 332 | | | | 8,068 | |
Siemens Energy AG(a) | | | 547 | | | | 13,956 | |
Sunrun, Inc.(a)(b) | | | 3,495 | | | | 119,878 | |
Suzhou Maxwell Technologies Co. Ltd. | | | 1,400 | | | | 141,371 | |
Vertiv Holdings Co. | | | 972 | | | | 24,271 | |
Vestas Wind Systems A/S | | | 3,155 | | | | 96,086 | |
Voltronic Power Technology Corp. | | | 5,000 | | | | 278,940 | |
Xinjiang Goldwind Science & Technology Co. Ltd., Class H | | | 60,200 | | | | 117,525 | |
| | | | | | | | |
| | |
| | | | | | 5,656,765 | |
|
| Electronic Equipment, Instruments & Components — 1.2% | |
AU Optronics Corp. | | | 281,000 | | | | 232,292 | |
| | | | | | | | |
| Security | | Shares | | | Value | |
|
Electronic Equipment, Instruments & Components (continued) | |
Avnet, Inc. | | | 322 | | | $ | 13,276 | |
Belden, Inc. | | | 1,261 | | | | 82,885 | |
Benchmark Electronics, Inc. | | | 8,345 | | | | 226,149 | |
BOE Technology Group Co. Ltd., Class A | | | 166,200 | | | | 132,037 | |
Coherent, Inc.(a) | | | 79 | | | | 21,057 | |
E Ink Holdings, Inc. | | | 47,000 | | | | 255,947 | |
Elite Material Co. Ltd. | | | 20,000 | | | | 200,435 | |
ePlus, Inc.(a) | | | 12,200 | | | | 657,336 | |
Fabrinet(a) | | | 1,145 | | | | 135,648 | |
Flex Ltd.(a) | | | 3,586 | | | | 65,731 | |
GoerTek, Inc., Class A | | | 20,900 | | | | 178,112 | |
Gold Circuit Electronics Ltd. | | | 36,000 | | | | 98,566 | |
Hamamatsu Photonics KK | | | 300 | | | | 19,161 | |
Hexagon AB, B Shares | | | 4,365 | | | | 69,144 | |
Hon Hai Precision Industry Co. Ltd. | | | 338,000 | | | | 1,267,547 | |
II-VI, Inc.(a)(b) | | | 3,606 | | | | 246,398 | |
Insight Enterprises, Inc.(a) | | | 3,109 | | | | 331,419 | |
Itron, Inc.(a)(b) | | | 1,279 | | | | 87,637 | |
Jabil, Inc. | | | 462 | | | | 32,502 | |
Keyence Corp. | | | 500 | | | | 314,379 | |
Keysight Technologies, Inc.(a)(b) | | | 3,404 | | | | 702,960 | |
Knowles Corp.(a) | | | 40,320 | | | | 941,472 | |
Kyocera Corp. | | | 600 | | | | 37,516 | |
Largan Precision Co. Ltd. | | | 6,000 | | | | 533,795 | |
LG Display Co. Ltd.(a) | | | 6,442 | | | | 132,819 | |
LG Display Co. Ltd., ADR(a)(b) | | | 16,991 | | | | 171,609 | |
Littelfuse, Inc. | | | 78 | | | | 24,545 | |
Murata Manufacturing Co. Ltd. | | | 1,200 | | | | 95,715 | |
Nan Ya Printed Circuit Board Corp. | | | 15,000 | | | | 308,976 | |
National Instruments Corp. | | | 431 | | | | 18,822 | |
OSI Systems, Inc.(a) | | | 8,645 | | | | 805,714 | |
PAR Technology Corp.(a) | | | 627 | | | | 33,087 | |
PC Connection, Inc. | | | 6,382 | | | | 275,256 | |
Samsung Electro-Mechanics Co. Ltd. | | | 5,905 | | | | 979,351 | |
Samsung SDI Co. Ltd.(a) | | | 863 | | | | 474,626 | |
ScanSource, Inc.(a) | | | 10,528 | | | | 369,322 | |
SYNNEX Corp. | | | 135 | | | | 15,439 | |
Taiwan Union Technology Corp. | | | 47,000 | | | | 172,961 | |
Tong Hsing Electronic Industries Ltd. | | | 11,000 | | | | 117,790 | |
Trimble, Inc.(a) | | | 149 | | | | 12,991 | |
Unimicron Technology Corp. | | | 65,000 | | | | 540,928 | |
Venture Corp. Ltd. | | | 2,900 | | | | 39,408 | |
Vishay Intertechnology, Inc. | | | 5,901 | | | | 129,055 | |
Vontier Corp. | | | 549 | | | | 16,871 | |
Wuxi Lead Intelligent Equipment Co. Ltd., Class A | | | 15,700 | | | | 183,576 | |
Zebra Technologies Corp., Class A(a) | | | 247 | | | | 147,014 | |
| | | | | | | | |
| | |
| | | | | | 11,949,276 | |
| | |
| Energy Equipment & Services — 0.4% | | | | | | |
Archrock, Inc. | | | 8,294 | | | | 62,039 | |
Baker Hughes Co. | | | 3,221 | | | | 77,497 | |
Cactus, Inc., Class A | | | 1,468 | | | | 55,975 | |
ChampionX Corp.(a)(b) | | | 19,937 | | | | 402,927 | |
Dril-Quip, Inc.(a) | | | 2,523 | | | | 49,653 | |
Expro Group Holdings NV(a) | | | 2,544 | | | | 36,506 | |
Halliburton Co. | | | 4,615 | | | | 105,545 | |
Helix Energy Solutions Group, Inc.(a) | | | 21,289 | | | | 66,422 | |
Helmerich & Payne, Inc. | | | 7,406 | | | | 175,522 | |
Natural Gas Services Group, Inc.(a) | | | 3,703 | | | | 38,770 | |
Newpark Resources, Inc.(a) | | | 5,681 | | | | 16,702 | |
NOV, Inc. | | | 1,266 | | | | 17,154 | |
Oceaneering International, Inc.(a) | | | 29,609 | | | | 334,878 | |
Oil States International, Inc.(a) | | | 6,846 | | | | 34,025 | |
| | |
| 10 | | 2 0 2 1 BLACK ROCK ANNUAL REPORT TO SHAREHOLDERS |
| | |
Schedule of Investments (continued) December 31, 2021 | | Diversified Equity Master Portfolio (Percentages shown are based on Net Assets) |
| | | | | | | | |
| Security | | Shares | | | Value | |
|
Energy Equipment & Services (continued) | |
Patterson-UTI Energy, Inc. | | | 30,117 | | | $ | 254,489 | |
ProPetro Holding Corp.(a) | | | 41,274 | | | | 334,319 | |
Schlumberger NV | | | 62,731 | | | | 1,878,794 | |
Smart Sand, Inc.(a) | | | 600 | | | | 1,068 | |
| | | | | | | | |
| | |
| | | | | | | 3,942,285 | |
| | |
| Entertainment — 1.0% | | | | | | |
Activision Blizzard, Inc. | | | 2,437 | | | | 162,134 | |
AMC Entertainment Holdings, Inc., Class A(a)(b) | | | 31,937 | | | | 868,686 | |
Bilibili, Inc., ADR(a) | | | 1,265 | | | | 58,696 | |
Bollore SA | | | 5,718 | | | | 31,984 | |
Cinemark Holdings, Inc.(a) | | | 15,911 | | | | 256,485 | |
Electronic Arts, Inc. | | | 880 | | | | 116,072 | |
Embracer Group AB(a) | | | 1,893 | | | | 20,083 | |
Eros STX Global Corp.(a) | | | 34,220 | | | | 8,203 | |
Gaia, Inc.(a) | | | 4,042 | | | | 34,640 | |
Krafton, Inc.(a) | | | 460 | | | | 177,787 | |
Liberty Media Corp.-Liberty Formula One,
Class A(a) | | | 81 | | | | 4,807 | |
Liberty Media Corp.-Liberty Formula One,
Class C(a) | | | 1,175 | | | | 74,307 | |
Lions Gate Entertainment Corp., Class A(a)(b) | | | 9,608 | | | | 159,877 | |
Lions Gate Entertainment Corp., Class B(a) | | | 1,964 | | | | 30,226 | |
Live Nation Entertainment, Inc.(a) | | | 888 | | | | 106,285 | |
Madison Square Garden Sports Corp.(a) | | | 61 | | | | 10,598 | |
NCSoft Corp. | | | 911 | | | | 492,057 | |
NetEase, Inc. | | | 58,755 | | | | 1,187,945 | |
Netflix, Inc.(a) | | | 1,774 | | | | 1,068,729 | |
Nexon Co. Ltd. | | | 700 | | | | 13,535 | |
NHN Corp.(a) | | | 3,456 | | | | 130,752 | |
Nintendo Co. Ltd. | | | 300 | | | | 140,357 | |
Playtika Holding Corp.(a) | | | 338 | | | | 5,844 | |
PVR Ltd.(a) | | | 6,184 | | | | 107,835 | |
Roku, Inc.(a) | | | 2,550 | | | | 581,910 | |
Sea Ltd., ADR(a) | | | 413 | | | | 92,392 | |
Skillz, Inc.(a) | | | 957 | | | | 7,120 | |
Spotify Technology SA(a) | | | 1,931 | | | | 451,912 | |
Take-Two Interactive Software, Inc.(a) | | | 288 | | | | 51,183 | |
Ubisoft Entertainment SA(a) | | | 150 | | | | 7,317 | |
Universal Music Group NV | | | 2,525 | | | | 71,235 | |
Walt Disney Co.(a) | | | 15,835 | | | | 2,452,683 | |
World Wrestling Entertainment, Inc., Class A(b) | | | 145 | | | | 7,154 | |
Zynga, Inc., Class A(a) | | | 80,344 | | | | 514,202 | |
| | | | | | | | |
| | |
| | | | | | | 9,505,032 | |
| |
| Equity Real Estate Investment Trusts (REITs) — 2.5% | | | | |
Acadia Realty Trust | | | 13,219 | | | | 288,571 | |
Alexander & Baldwin, Inc. | | | 6,623 | | | | 166,171 | |
Alexandria Real Estate Equities, Inc. | | | 593 | | | | 132,215 | |
Alpine Income Property Trust, Inc. | | | 3,002 | | | | 60,160 | |
American Assets Trust, Inc. | | | 6,609 | | | | 248,036 | |
American Campus Communities, Inc. | | | 445 | | | | 25,494 | |
American Finance Trust, Inc. | | | 19,091 | | | | 174,301 | |
American Homes 4 Rent, Class A | | | 17,179 | | | | 749,176 | |
American Tower Corp. | | | 1,604 | | | | 469,170 | |
Americold Realty Trust | | | 848 | | | | 27,806 | |
Apartment Income REIT Corp. | | | 508 | | | | 27,772 | |
Armada Hoffler Properties, Inc. | | | 5,752 | | | | 87,545 | |
Ascendas Real Estate Investment Trust | | | 28,500 | | | | 62,443 | |
AvalonBay Communities, Inc. | | | 452 | | | | 114,171 | |
Boston Properties, Inc.(b) | | | 566 | | | | 65,192 | |
Braemar Hotels & Resorts, Inc.(a)(b) | | | 60,795 | | | | 310,055 | |
Brandywine Realty Trust | | | 11,319 | | | | 151,901 | |
British Land Co. PLC | | | 770 | | | | 5,560 | |
Brixmor Property Group, Inc. | | | 962 | | | | 24,444 | |
| | | | | | | | |
| Security | | Shares | | | Value | |
|
Equity Real Estate Investment Trusts (REITs) (continued) | |
Camden Property Trust | | | 203 | | | $ | 36,272 | |
CapitaLand Integrated Commercial Trust | | | 32,409 | | | | 49,034 | |
CIM Commercial Trust Corp. | | | 6,228 | | | | 45,776 | |
Clipper Realty, Inc. | | | 10,412 | | | | 103,495 | |
CorEnergy Infrastructure Trust, Inc.(b) | | | 7,858 | | | | 24,596 | |
CorePoint Lodging, Inc.(a) | | | 4,389 | | | | 68,907 | |
Corporate Office Properties Trust | | | 24,452 | | | | 683,922 | |
Cousins Properties, Inc. | | | 482 | | | | 19,415 | |
Covivio | | | 169 | | | | 13,872 | |
Crown Castle International Corp. | | | 1,615 | | | | 337,115 | |
CTO Realty Growth, Inc.(b) | | | 4,005 | | | | 245,987 | |
CubeSmart | | | 26,895 | | | | 1,530,594 | |
CyrusOne, Inc. | | | 403 | | | | 36,157 | |
Daiwa House REIT Investment Corp. | | | 8 | | | | 24,235 | |
Dexus | | | 4,445 | | | | 35,942 | |
DiamondRock Hospitality Co.(a) | | | 20,234 | | | | 194,449 | |
Digital Realty Trust, Inc. | | | 1,091 | | | | 192,965 | |
DigitalBridge Group, Inc.(a) | | | 26,968 | | | | 224,643 | |
Douglas Emmett, Inc. | | | 541 | | | | 18,124 | |
Duke Realty Corp. | | | 1,138 | | | | 74,698 | |
Easterly Government Properties, Inc. | | | 10,253 | | | | 234,999 | |
EastGroup Properties, Inc. | | | 11,331 | | | | 2,581,768 | |
EPR Properties | | | 240 | | | | 11,398 | |
Equinix, Inc. | | | 333 | | | | 281,665 | |
Equity LifeStyle Properties, Inc. | | | 507 | | | | 44,444 | |
Equity Residential | | | 1,232 | | | | 111,496 | |
Essential Properties Realty Trust, Inc. | | | 2,932 | | | | 84,530 | |
Essex Property Trust, Inc. | | | 220 | | | | 77,491 | |
Extra Space Storage, Inc. | | | 2,424 | | | | 549,594 | |
Federal Realty Investment Trust(b) | | | 251 | | | | 34,216 | |
First Industrial Realty Trust, Inc. | | | 8,744 | | | | 578,853 | |
Four Corners Property Trust, Inc. | | | 15,342 | | | | 451,208 | |
Gaming and Leisure Properties, Inc. | | | 716 | | | | 34,841 | |
Gecina SA | | | 116 | | | | 16,232 | |
GLP J-REIT | | | 9 | | | | 15,557 | |
Goodman Group | | | 5,636 | | | | 108,644 | |
GPT Group | | | 7,591 | | | | 29,933 | |
Healthcare Realty Trust, Inc. | | | 7,374 | | | | 233,313 | |
Healthcare Trust of America, Inc., Class A | | | 707 | | | | 23,607 | |
Healthpeak Properties, Inc. | | | 1,668 | | | | 60,198 | |
Highwoods Properties, Inc. | | | 334 | | | | 14,893 | |
Host Hotels & Resorts, Inc.(a) | | | 1,890 | | | | 32,867 | |
Hudson Pacific Properties, Inc. | | | 482 | | | | 11,910 | |
Independence Realty Trust, Inc. | | | 8,483 | | | | 219,116 | |
Invitation Homes, Inc. | | | 2,137 | | | | 96,892 | |
Iron Mountain, Inc.(b) | | | 907 | | | | 47,463 | |
iStar, Inc.(b) | | | 5,082 | | | | 131,268 | |
Japan Metropolitan Fund Invest | | | 12 | | | | 10,338 | |
Japan Real Estate Investment Corp. | | | 5 | | | | 28,383 | |
JBG SMITH Properties | | | 402 | | | | 11,541 | |
Kilroy Realty Corp. | | | 377 | | | | 25,055 | |
Kimco Realty Corp. | | | 1,888 | | | | 46,539 | |
Klepierre SA | | | 715 | | | | 16,919 | |
Lamar Advertising Co., Class A | | | 280 | | | | 33,964 | |
Land Securities Group PLC | | | 1,607 | | | | 16,960 | |
Life Storage, Inc. | | | 8,197 | | | | 1,255,616 | |
Link REIT | | | 5,700 | | | | 50,213 | |
Macerich Co.(b) | | | 14,373 | | | | 248,365 | |
Mapletree Commercial Trust | | | 19,000 | | | | 28,134 | |
Mapletree Logistics Trust | | | 27,262 | | | | 38,449 | |
Medical Properties Trust, Inc. | | | 1,945 | | | | 45,960 | |
Mid-America Apartment Communities, Inc. | | | 352 | | | | 80,763 | |
| | | | |
MASTER PORTFOLIO SCHEDULE OF INVESTMENTS | | | 11 | |
| | |
Schedule of Investments (continued) December 31, 2021 | | Diversified Equity Master Portfolio (Percentages shown are based on Net Assets) |
| | | | | | | | |
| Security | | Shares | | | Value | |
|
| Equity Real Estate Investment Trusts (REITs) (continued) | |
Mirvac Group | | | 11,725 | | | $ | 24,819 | |
National Retail Properties, Inc. | | | 568 | | | | 27,304 | |
National Storage Affiliates Trust | | | 13,307 | | | | 920,844 | |
Nippon Building Fund, Inc. | | | 6 | | | | 34,948 | |
Nippon Prologis REIT, Inc. | | | 4 | | | | 14,139 | |
Nomura Real Estate Master Fund, Inc. | | | 14 | | | | 19,703 | |
Omega Healthcare Investors, Inc. | | | 770 | | | | 22,784 | |
Orion Office REIT, Inc.(a) | | | 177 | | | | 3,305 | |
Orix JREIT, Inc. | | | 8 | | | | 12,506 | |
Outfront Media, Inc.(b) | | | 19,207 | | | | 515,132 | |
Paramount Group, Inc. | | | 26,451 | | | | 220,601 | |
Park Hotels & Resorts, Inc.(a) | | | 763 | | | | 14,405 | |
Pennsylvania Real Estate Investment Trust(a)(b) | | | 18,057 | | | | 18,418 | |
Physicians Realty Trust | | | 12,343 | | | | 232,419 | |
Piedmont Office Realty Trust, Inc., Class A | | | 16,368 | | | | 300,844 | |
Preferred Apartment Communities, Inc. | | | 3,692 | | | | 66,678 | |
Prologis, Inc. | | | 17,999 | | | | 3,030,312 | |
Public Storage | | | 545 | | | | 204,135 | |
Rayonier, Inc. | | | 456 | | | | 18,404 | |
Realty Income Corp.(b) | | | 1,960 | | | | 140,316 | |
Regency Centers Corp. | | | 442 | | | | 33,305 | |
Retail Value, Inc. | | | 952 | | | | 6,112 | |
Rexford Industrial Realty, Inc. | | | 448 | | | | 36,337 | |
SBA Communications Corp. | | | 371 | | | | 144,326 | |
Scentre Group | | | 17,708 | | | | 40,735 | |
Segro PLC | | | 3,198 | | | | 62,239 | |
Simon Property Group, Inc. | | | 1,117 | | | | 178,463 | |
SITE Centers Corp. | | | 10,844 | | | | 171,661 | |
SL Green Realty Corp.(b) | | | 217 | | | | 15,559 | |
Spirit Realty Capital, Inc. | | | 386 | | | | 18,601 | |
Stockland | | | 8,624 | | | | 26,605 | |
STORE Capital Corp. | | | 794 | | | | 27,314 | |
Sun Communities, Inc. | | | 499 | | | | 104,775 | |
Terreno Realty Corp. | | | 13,451 | | | | 1,147,236 | |
UDR, Inc. | | | 832 | | | | 49,912 | |
Unibail-Rodamco-Westfield(a)(b) | | | 384 | | | | 26,872 | |
Ventas, Inc. | | | 1,117 | | | | 57,101 | |
VICI Properties, Inc.(b) | | | 1,882 | | | | 56,667 | |
Vicinity Centres | | | 9,210 | | | | 11,327 | |
Vornado Realty Trust | | | 308 | | | | 12,893 | |
Welltower, Inc. | | | 1,514 | | | | 129,856 | |
Weyerhaeuser Co. | | | 2,450 | | | | 100,891 | |
Whitestone REIT | | | 6,569 | | | | 66,544 | |
WP Carey, Inc. | | | 798 | | | | 65,476 | |
| | | | | | | | |
| | |
| | | | | | | 23,638,799 | |
| | |
| Food & Staples Retailing — 1.0% | | | | | | |
Albertsons Cos., Inc., Class A | | | 505 | | | | 15,246 | |
Andersons, Inc. | | | 7,510 | | | | 290,712 | |
Avenue Supermarts Ltd.(a)(c) | | | 1,595 | | | | 100,051 | |
BGF retail Co. Ltd. | | | 1,463 | | | | 178,763 | |
BJ’s Wholesale Club Holdings, Inc.(a) | | | 10,231 | | | | 685,170 | |
Carrefour SA | | | 441 | | | | 8,085 | |
Chefs’ Warehouse, Inc.(a) | | | 1,655 | | | | 55,111 | |
Clicks Group Ltd. | | | 28,651 | | | | 567,320 | |
Coles Group Ltd. | | | 4,508 | | | | 58,821 | |
Costco Wholesale Corp. | | | 5,553 | | | | 3,152,438 | |
E-MART, Inc.(a) | | | 760 | | | | 96,346 | |
Endeavour Group Ltd. | | | 2,526 | | | | 12,396 | |
Grocery Outlet Holding Corp.(a) | | | 284 | | | | 8,032 | |
HelloFresh SE(a) | | | 642 | | | | 49,202 | |
Jeronimo Martins SGPS SA | | | 3,487 | | | | 79,796 | |
| | | | | | | | |
| Security | | Shares | | | Value | |
|
Food & Staples Retailing (continued) | |
Koninklijke Ahold Delhaize NV | | | 6,807 | | | $ | 233,591 | |
Natural Grocers by Vitamin Cottage, Inc. | | | 1,834 | | | | 26,135 | |
Ocado Group PLC(a) | | | 741 | | | | 16,859 | |
Performance Food Group Co.(a) | | | 16,602 | | | | 761,866 | |
Rite Aid Corp.(a) | | | 4,428 | | | | 65,047 | |
Shoprite Holdings Ltd. | | | 28,498 | | | | 373,559 | |
SpartanNash Co. | | | 4,277 | | | | 110,176 | |
Sprouts Farmers Market, Inc.(a) | | | 13,249 | | | | 393,230 | |
Sun Art Retail Group Ltd. | | | 279,000 | | | | 111,993 | |
US Foods Holding Corp.(a) | | | 718 | | | | 25,008 | |
Wal-Mart de Mexico SAB de CV | | | 191,967 | | | | 713,378 | |
Walmart, Inc. | | | 8,015 | | | | 1,159,690 | |
Woolworths Group Ltd. | | | 3,556 | | | | 98,300 | |
| | | | | | | | |
| | |
| | | | | | | 9,446,321 | |
| | |
| Food Products — 0.7% | | | | | | |
Associated British Foods PLC | | | 835 | | | | 22,857 | |
AVI Ltd. | | | 55,562 | | | | 257,674 | |
Beyond Meat, Inc.(a)(b) | | | 186 | | | | 12,120 | |
China Feihe Ltd.(c) | | | 117,000 | | | | 156,979 | |
CJ CheilJedang Corp. | | | 1,513 | | | | 492,894 | |
Dali Foods Group Co. Ltd.(c) | | | 178,500 | | | | 93,399 | |
Danone SA | | | 1,173 | | | | 72,913 | |
Darling Ingredients, Inc.(a) | | | 525 | | | | 36,377 | |
Flowers Foods, Inc.(b) | | | 609 | | | | 16,729 | |
Freshpet, Inc.(a) | | | 133 | | | | 12,671 | |
Grupo Bimbo SAB de CV, Series A | | | 134,610 | | | | 413,977 | |
Hain Celestial Group, Inc.(a) | | | 305 | | | | 12,996 | |
Hostess Brands, Inc.(a) | | | 30,080 | | | | 614,234 | |
Ingredion, Inc. | | | 218 | | | | 21,068 | |
JDE Peet’s NV | | | 408 | | | | 12,628 | |
Kellogg Co. | | | 6,000 | | | | 386,520 | |
Kerry Group PLC, Class A | | | 317 | | | | 40,898 | |
Kikkoman Corp. | | | 500 | | | | 42,106 | |
Kuala Lumpur Kepong Bhd | | | 35,300 | | | | 184,550 | |
Lamb Weston Holdings, Inc. | | | 471 | | | | 29,852 | |
Landec Corp.(a) | | | 12,828 | | | | 142,391 | |
Marfrig Global Foods SA | | | 62,014 | | | | 245,718 | |
McCormick & Co., Inc. | | | 776 | | | | 74,969 | |
Mowi ASA | | | 1,514 | | | | 35,831 | |
Nestle SA, Registered Shares | | | 7,655 | | | | 1,068,770 | |
Orion Corp./Republic of Korea | | | 1,947 | | | | 169,488 | |
Orkla ASA | | | 3,028 | | | | 30,351 | |
Pilgrim’s Pride Corp.(a) | | | 154 | | | | 4,343 | |
Post Holdings, Inc.(a) | | | 192 | | | | 21,644 | |
Seaboard Corp. | | | 1 | | | | 3,935 | |
Seneca Foods Corp., Class A(a) | | | 651 | | | | 31,215 | |
Sovos Brands, Inc.(a) | | | 5,215 | | | | 78,486 | |
Tattooed Chef, Inc.(a)(b) | | | 1,415 | | | | 21,989 | |
Thai Union Group PCL, NVDR | | | 620,800 | | | | 362,543 | |
Tingyi Cayman Islands Holding Corp. | | | 198,000 | | | | 407,205 | |
Uni-President China Holdings Ltd. | | | 214,000 | | | | 207,441 | |
Uni-President Enterprises Corp. | | | 160,000 | | | | 396,131 | |
Universal Robina Corp. | | | 37,040 | | | | 92,977 | |
Vita Coco Co., Inc.(a) | | | 8,731 | | | | 97,525 | |
Vital Farms, Inc.(a)(b) | | | 10,090 | | | | 182,225 | |
| | | | | | | | |
| | |
| | | | | | | 6,608,619 | |
| | |
| Gas Utilities — 0.5% | | | | | | |
APA Group | | | 19,754 | | | | 144,516 | |
Atmos Energy Corp. | | | 657 | | | | 68,834 | |
Beijing Enterprises Holdings Ltd. | | | 59,000 | | | | 203,558 | |
Brookfield Infrastructure Corp., Class A | | | 6,976 | | | | 476,182 | |
| | |
| 12 | | 2 0 2 1 BLACK ROCK ANNUAL REPORT TO SHAREHOLDERS |
| | |
Schedule of Investments (continued) December 31, 2021 | | Diversified Equity Master Portfolio (Percentages shown are based on Net Assets) |
| | | | | | | | |
| Security | | Shares | | | Value | |
|
Gas Utilities (continued) | |
China Gas Holdings Ltd. | | | 141,400 | | | $ | 294,124 | |
China Resources Gas Group Ltd. | | | 20,000 | | | | 112,984 | |
Enn Energy Holdings Ltd. | | | 14,300 | | | | 269,579 | |
Hong Kong & China Gas Co. Ltd. | | | 28,380 | | | | 44,266 | |
Indraprastha Gas Ltd. | | | 64,740 | | | | 408,394 | |
Korea Gas Corp.(a) | | | 12,207 | | | | 401,433 | |
Kunlun Energy Co. Ltd. | | | 120,000 | | | | 112,599 | |
National Fuel Gas Co. | | | 284 | | | | 18,159 | |
Naturgy Energy Group SA | | | 6,344 | | | | 206,340 | |
Northwest Natural Holding Co. | | | 3,768 | | | | 183,803 | |
Osaka Gas Co. Ltd. | | | 5,500 | | | | 90,966 | |
Perusahaan Gas Negara Tbk PT(a) | | | 3,400,500 | | | | 328,314 | |
Snam SpA | | | 29,454 | | | | 177,407 | |
South Jersey Industries, Inc.(b) | | | 28,973 | | | | 756,775 | |
Southwest Gas Holdings, Inc. | | | 8,862 | | | | 620,783 | |
Tokyo Gas Co. Ltd. | | | 4,000 | | | | 71,802 | |
UGI Corp. | | | 1,708 | | | | 78,414 | |
| | | | | | | | |
| | |
| | | | | | | 5,069,232 | |
| |
| Health Care Equipment & Supplies — 1.4% | | | | |
Abbott Laboratories | | | 10,858 | | | | 1,528,155 | |
Accuray, Inc.(a) | | | 27,163 | | | | 129,568 | |
Alcon, Inc. | | | 1,142 | | | | 100,731 | |
Align Technology, Inc.(a) | | | 737 | | | | 484,342 | |
Asahi Intecc Co. Ltd. | | | 400 | | | | 8,593 | |
AtriCure, Inc.(a)(b) | | | 5,003 | | | | 347,859 | |
Atrion Corp. | | | 216 | | | | 152,258 | |
Axonics, Inc.(a) | | | 4,041 | | | | 226,296 | |
Baxter International, Inc. | | | 1,897 | | | | 162,838 | |
Becton Dickinson and Co. | | | 417 | | | | 104,867 | |
BioLife Solutions, Inc.(a) | | | 1,871 | | | | 69,732 | |
Boston Scientific Corp.(a) | | | 1,966 | | | | 83,516 | |
Cardiovascular Systems, Inc.(a) | | | 4,776 | | | | 89,693 | |
Carl Zeiss Meditec AG | | | 210 | | | | 44,053 | |
Cerus Corp.(a)(b) | | | 22,221 | | | | 151,325 | |
Cochlear Ltd. | | | 153 | | | | 24,013 | |
Coloplast A/S, Class B | | | 208 | | | | 36,624 | |
CryoLife, Inc.(a)(b) | | | 6,406 | | | | 130,362 | |
Cutera, Inc.(a) | | | 606 | | | | 25,040 | |
DexCom, Inc.(a) | | | 1,306 | | | | 701,257 | |
Edwards Lifesciences Corp.(a) | | | 856 | | | | 110,895 | |
Envista Holdings Corp.(a)(b) | | | 523 | | | | 23,566 | |
Figs, Inc., Class A(a) | | | 123 | | | | 3,390 | |
Fisher & Paykel Healthcare Corp. Ltd. | | | 2,476 | | | | 55,471 | |
Getinge AB | | | 380 | | | | 16,561 | |
Glaukos Corp.(a) | | | 3,214 | | | | 142,830 | |
Globus Medical, Inc., Class A(a) | | | 251 | | | | 18,122 | |
Haemonetics Corp.(a) | | | 8,750 | | | | 464,100 | |
Heska Corp.(a) | | | 1,320 | | | | 240,887 | |
Hologic, Inc.(a) | | | 1,413 | | | | 108,179 | |
Hoya Corp. | | | 1,100 | | | | 163,231 | |
ICU Medical, Inc.(a) | | | 65 | | | | 15,427 | |
IDEXX Laboratories, Inc.(a) | | | 3,429 | | | | 2,257,859 | |
Inmode Ltd.(a) | | | 174 | | | | 12,281 | |
Insulet Corp.(a) | | | 270 | | | | 71,839 | |
Integer Holdings Corp.(a) | | | 6,258 | | | | 535,622 | |
Integra LifeSciences Holdings Corp.(a) | | | 235 | | | | 15,743 | |
Intersect ENT, Inc.(a) | | | 2,276 | | | | 62,158 | |
Intuitive Surgical, Inc.(a) | | | 636 | | | | 228,515 | |
iRhythm Technologies, Inc.(a)(b) | | | 395 | | | | 46,488 | |
Koninklijke Philips NV | | | 2,552 | | | | 94,454 | |
LivaNova PLC(a) | | | 2,536 | | | | 221,722 | |
Medtronic PLC | | | 7,066 | | | | 730,978 | |
| | | | | | | | |
| Security | | Shares | | | Value | |
|
Health Care Equipment & Supplies (continued) | |
Merit Medical Systems, Inc.(a) | | | 7,827 | | | $ | 487,622 | |
Natus Medical, Inc.(a) | | | 7,931 | | | | 188,203 | |
Nemaura Medical, Inc.(a)(b) | | | 2,006 | | | | 9,147 | |
Olympus Corp. | | | 3,200 | | | | 73,687 | |
OraSure Technologies, Inc.(a) | | | 8,936 | | | | 77,654 | |
Ortho Clinical Diagnostics Holdings PLC(a) | | | 12,150 | | | | 259,888 | |
Orthofix Medical, Inc.(a) | | | 1,643 | | | | 51,081 | |
Outset Medical, Inc.(a) | | | 1,583 | | | | 72,960 | |
Paragon 28, Inc.(a) | | | 3,407 | | | | 60,270 | |
Penumbra, Inc.(a) | | | 110 | | | | 31,605 | |
Quidel Corp.(a) | | | 119 | | | | 16,064 | |
ResMed, Inc. | | | 121 | | | | 31,518 | |
Shockwave Medical, Inc.(a) | | | 3,613 | | | | 644,306 | |
SI-BONE, Inc.(a) | | | 3,075 | | | | 68,296 | |
Siemens Healthineers AG(c) | | | 1,360 | | | | 101,401 | |
Silk Road Medical, Inc.(a) | | | 1,384 | | | | 58,972 | |
Smith & Nephew PLC | | | 2,463 | | | | 42,985 | |
Sonova Holding AG, Registered Shares | | | 83 | | | | 32,436 | |
St Shine Optical Co. Ltd. | | | 9,000 | | | | 101,997 | |
STAAR Surgical Co.(a) | | | 3,628 | | | | 331,236 | |
Straumann Holding AG, Registered Shares | | | 17 | | | | 35,948 | |
Stryker Corp. | | | 574 | | | | 153,499 | |
Sysmex Corp. | | | 500 | | | | 67,491 | |
Tactile Systems Technology, Inc.(a) | | | 4,036 | | | | 76,805 | |
Tandem Diabetes Care, Inc.(a) | | | 198 | | | | 29,803 | |
Terumo Corp. | | | 1,900 | | | | 80,257 | |
Treace Medical Concepts, Inc.(a) | | | 1,511 | | | | 28,165 | |
Vapotherm, Inc.(a) | | | 3,207 | | | | 66,417 | |
Varex Imaging Corp.(a) | | | 5,823 | | | | 183,716 | |
| | | | | | | | |
| | |
| | | | | | | 13,704,869 | |
| |
| Health Care Providers & Services — 1.6% | | | | |
1Life Healthcare, Inc.(a) | | | 16,354 | | | | 287,340 | |
Acadia Healthcare Co., Inc.(a)(b) | | | 287 | | | | 17,421 | |
Accolade, Inc.(a) | | | 5,363 | | | | 141,369 | |
Addus HomeCare Corp.(a) | | | 2,475 | | | | 231,437 | |
Agilon Health, Inc.(a) | | | 221 | | | | 5,967 | |
Amedisys, Inc.(a) | | | 104 | | | | 16,836 | |
AMN Healthcare Services, Inc.(a) | | | 2,563 | | | | 313,532 | |
Anthem, Inc. | | | 4,058 | | | | 1,881,045 | |
Apollo Hospitals Enterprise Ltd. | | | 3,975 | | | | 267,566 | |
Apollo Medical Holdings, Inc.(a) | | | 408 | | | | 29,980 | |
Aveanna Healthcare Holdings, Inc.(a)(b) | | | 20,105 | | | | 148,777 | |
Bangkok Dusit Medical Services PCL, NVDR | | | 616,300 | | | | 423,894 | |
Castle Biosciences, Inc.(a) | | | 330 | | | | 14,147 | |
Centene Corp.(a) | | | 1,756 | | | | 144,694 | |
Chemed Corp. | | | 50 | | | | 26,452 | |
Cigna Corp. | | | 2,829 | | | | 649,623 | |
Community Health Systems, Inc.(a) | | | 6,250 | | | | 83,188 | |
Covetrus, Inc.(a) | | | 2,927 | | | | 58,452 | |
Cross Country Healthcare, Inc.(a) | | | 4,776 | | | | 132,582 | |
CVS Health Corp. | | | 8,574 | | | | 884,494 | |
Dr Lal PathLabs Ltd.(c) | | | 1,899 | | | | 97,346 | |
Encompass Health Corp. | | | 317 | | | | 20,687 | |
Ensign Group, Inc.(b) | | | 5,677 | | | | 476,641 | |
Five Star Senior Living, Inc.(a) | | | 2,992 | | | | 8,826 | |
Fleury SA | | | 28,662 | | | | 92,345 | |
Fresenius Medical Care AG & Co. KGaA | | | 1,026 | | | | 66,514 | |
Fresenius SE & Co. KGaA | | | 1,832 | | | | 73,634 | |
Fulgent Genetics, Inc.(a) | | | 1,822 | | | | 183,275 | |
Guardant Health, Inc.(a) | | | 292 | | | | 29,206 | |
Hanger, Inc.(a)(b) | | | 6,969 | | | | 126,348 | |
HealthEquity, Inc.(a) | | | 3,667 | | | | 162,228 | |
| | | | |
MASTER PORTFOLIO SCHEDULE OF INVESTMENTS | | | 13 | |
| | |
Schedule of Investments (continued) December 31, 2021 | | Diversified Equity Master Portfolio (Percentages shown are based on Net Assets) |
| | | | | | | | |
| Security | | Shares | | | Value | |
|
Health Care Providers & Services (continued) | |
Humana, Inc. | | | 397 | | | $ | 184,152 | |
IHH Healthcare Bhd | | | 212,000 | | | | 373,519 | |
Jinxin Fertility Group Ltd.(a)(c) | | | 96,000 | | | | 107,323 | |
LHC Group, Inc.(a) | | | 5,385 | | | | 738,984 | |
Life Healthcare Group Holdings Ltd.(a) | | | 154,477 | | | | 232,952 | |
LifeStance Health Group, Inc.(a)(b) | | | 5,730 | | | | 54,550 | |
Magellan Health, Inc.(a) | | | 1,627 | | | | 154,549 | |
McKesson Corp. | | | 5,430 | | | | 1,349,735 | |
Molina Healthcare, Inc.(a) | | | 463 | | | | 147,271 | |
Netcare Ltd.(a) | | | 267,308 | | | | 266,385 | |
Option Care Health, Inc.(a)(b) | | | 6,292 | | | | 178,944 | |
Owens & Minor, Inc.(b) | | | 3,589 | | | | 156,121 | |
Patterson Cos., Inc. | | | 9,256 | | | | 271,664 | |
PetIQ, Inc.(a) | | | 6,338 | | | | 143,936 | |
Premier, Inc., Class A | | | 395 | | | | 16,262 | |
Progyny, Inc.(a)(b) | | | 6,391 | | | | 321,787 | |
R1 RCM, Inc.(a) | | | 8,363 | | | | 213,173 | |
RadNet, Inc.(a) | | | 736 | | | | 22,161 | |
Ramsay Health Care Ltd. | | | 542 | | | | 28,168 | |
Ryman Healthcare Ltd. | | | 2,009 | | | | 16,846 | |
Select Medical Holdings Corp. | | | 9,853 | | | | 289,678 | |
Sharps Compliance Corp.(a) | | | 2,786 | | | | 19,864 | |
Signify Health, Inc., Class A(a) | | | 200 | | | | 2,844 | |
Sinopharm Group Co. Ltd., Class H | | | 132,400 | | | | 288,162 | |
Sonic Healthcare Ltd. | | | 1,177 | | | | 39,920 | |
Surgery Partners, Inc.(a) | | | 2,692 | | | | 143,780 | |
Tenet Healthcare Corp.(a) | | | 3,583 | | | | 292,695 | |
UnitedHealth Group, Inc. | | | 4,073 | | | | 2,045,216 | |
| | | | | | | | |
| | |
| | | | | | | 15,196,487 | |
| |
| Health Care Technology — 0.4% | | | | |
Allscripts Healthcare Solutions, Inc.(a) | | | 37,366 | | | | 689,403 | |
American Well Corp., Class A(a) | | | 23,444 | | | | 141,602 | |
Castlight Health, Inc., Class B(a) | | | 55,979 | | | | 86,208 | |
Certara, Inc.(a) | | | 295 | | | | 8,384 | |
Change Healthcare, Inc.(a) | | | 813 | | | | 17,382 | |
Doximity, Inc., Class A(a) | | | 1,731 | | | | 86,775 | |
Evolent Health, Inc., Class A(a)(b) | | | 8,293 | | | | 229,467 | |
Inspire Medical Systems, Inc.(a) | | | 1,666 | | | | 383,280 | |
M3, Inc. | | | 1,300 | | | | 65,548 | |
Multiplan Corp.(a)(b) | | | 31,497 | | | | 139,532 | |
NextGen Healthcare, Inc.(a) | | | 7,887 | | | | 140,310 | |
Omnicell, Inc.(a)(b) | | | 4,650 | | | | 839,046 | |
Phreesia, Inc.(a) | | | 5,357 | | | | 223,172 | |
Schrodinger, Inc.(a) | | | 3,145 | | | | 109,540 | |
Teladoc Health, Inc.(a) | | | 6,160 | | | | 565,611 | |
Veeva Systems, Inc., Class A(a) | | | 273 | | | | 69,746 | |
Vocera Communications, Inc.(a) | | | 7,366 | | | | 477,611 | |
| | | | | | | | |
| | |
| | | | | | | 4,272,617 | |
| |
| Hotels, Restaurants & Leisure — 1.5% | | | | |
Accel Entertainment, Inc.(a) | | | 20,365 | | | | 265,152 | |
Accor SA(a) | | | 242 | | | | 7,844 | |
Airbnb, Inc., Class A(a) | | | 480 | | | | 79,915 | |
Aramark | | | 733 | | | | 27,011 | |
Aristocrat Leisure Ltd. | | | 952 | | | | 30,200 | |
Biglari Holdings, Inc., Class B(a) | | | 397 | | | | 56,600 | |
Bloomin’ Brands, Inc.(a) | | | 15,539 | | | | 326,008 | |
Booking Holdings, Inc.(a) | | | 616 | | | | 1,477,926 | |
Boyd Gaming Corp.(a) | | | 267 | | | | 17,507 | |
Brinker International, Inc.(a) | | | 4,975 | | | | 182,035 | |
Caesars Entertainment, Inc.(a) | | | 1,002 | | | | 93,717 | |
Carnival Corp.(a) | | | 6,663 | | | | 134,060 | |
| | | | | | | | |
| Security | | Shares | | | Value | |
|
Hotels, Restaurants & Leisure (continued) | |
Century Casinos, Inc.(a) | | | 2,317 | | | $ | 28,221 | |
Cheesecake Factory, Inc.(a)(b) | | | 8,720 | | | | 341,388 | |
Chipotle Mexican Grill, Inc.(a) | | | 73 | | | | 127,622 | |
Choice Hotels International, Inc. | | | 113 | | | | 17,627 | |
Churchill Downs, Inc. | | | 120 | | | | 28,908 | |
Compass Group PLC(a) | | | 6,779 | | | | 152,620 | |
Darden Restaurants, Inc. | | | 231 | | | | 34,798 | |
Dave & Buster’s Entertainment, Inc.(a) | | | 4,198 | | | | 161,203 | |
Devyani International Ltd.(a) | | | 38,023 | | | | 83,849 | |
Domino’s Pizza, Inc. | | | 50 | | | | 28,217 | |
DraftKings, Inc., Class A(a) | | | 2,135 | | | | 58,648 | |
El Pollo Loco Holdings, Inc.(a) | | | 7,058 | | | | 100,153 | |
Entain PLC(a) | | | 1,124 | | | | 25,691 | |
Everi Holdings, Inc.(a) | | | 7,154 | | | | 152,738 | |
Evolution AB(c) | | | 658 | | | | 93,002 | |
Expedia Group, Inc.(a) | | | 721 | | | | 130,299 | |
F45 Training Holdings, Inc.(a)(b) | | | 2,584 | | | | 28,140 | |
Flutter Entertainment PLC(a) | | | 461 | | | | 72,983 | |
Gourmet Master Co. Ltd. | | | 25,000 | | | | 101,617 | |
Hilton Grand Vacations, Inc.(a) | | | 12,594 | | | | 656,273 | |
Hilton Worldwide Holdings, Inc.(a) | | | 1,173 | | | | 182,976 | |
Hyatt Hotels Corp., Class A(a) | | | 154 | | | | 14,769 | |
InterContinental Hotels Group PLC(a) | | | 808 | | | | 52,236 | |
International Game Technology PLC | | | 28,494 | | | | 823,762 | |
Jiumaojiu International Holdings Ltd.(c) | | | 35,000 | | | | 61,545 | |
La Francaise des Jeux SAEM(c) | | | 330 | | | | 14,625 | |
Marriott International, Inc., Class A(a) | | | 1,215 | | | | 200,767 | |
Marriott Vacations Worldwide Corp. | | | 135 | | | | 22,812 | |
McDonald’s Corp. | | | 5,977 | | | | 1,602,254 | |
McDonald’s Holdings Co. Japan Ltd. | | | 300 | | | | 13,277 | |
MGM Resorts International | | | 1,729 | | | | 77,598 | |
Norwegian Cruise Line Holdings Ltd.(a) | | | 1,200 | | | | 24,888 | |
OPAP SA | | | 21,301 | | | | 301,696 | |
Oriental Land Co. Ltd. | | | 600 | | | | 101,176 | |
Papa John’s International, Inc. | | | 5,266 | | | | 702,853 | |
Penn National Gaming, Inc.(a) | | | 1,278 | | | | 66,264 | |
Planet Fitness, Inc., Class A(a) | | | 271 | | | | 24,547 | |
PlayAGS, Inc.(a) | | | 5,959 | | | | 40,462 | |
Portillo’s, Inc.(a) | | | 2,735 | | | | 102,672 | |
Red Rock Resorts, Inc., Class A | | | 637 | | | | 35,041 | |
Royal Caribbean Cruises Ltd.(a) | | | 1,089 | | | | 83,744 | |
Rush Street Interactive, Inc.(a) | | | 6,884 | | | | 113,586 | |
Scientific Games Corp., Class A(a) | | | 3,460 | | | | 231,232 | |
SeaWorld Entertainment, Inc.(a)(b) | | | 2,867 | | | | 185,954 | |
Shake Shack, Inc., Class A(a) | | | 6,432 | | | | 464,133 | |
Six Flags Entertainment Corp.(a) | | | 251 | | | | 10,688 | |
Sodexo SA | | | 729 | | | | 63,910 | |
Starbucks Corp. | | | 3,148 | | | | 368,222 | |
Sweetgreen, Inc., Class A, Class A(a) | | | 1,401 | | | | 44,832 | |
Target Hospitality Corp.(a) | | | 13,591 | | | | 48,384 | |
Texas Roadhouse, Inc. | | | 3,494 | | | | 311,944 | |
Travel + Leisure Co. | | | 13,187 | | | | 728,845 | |
Trip.com Group Ltd., ADR(a) | | | 7,951 | | | | 195,754 | |
Vail Resorts, Inc. | | | 237 | | | | 77,712 | |
Wendy’s Co. | | | 579 | | | | 13,809 | |
Wingstop, Inc. | | | 3,057 | | | | 528,250 | |
Wyndham Hotels & Resorts, Inc. | | | 298 | | | | 26,716 | |
Wynn Resorts Ltd.(a)(b) | | | 1,849 | | | | 157,239 | |
Xiabuxiabu Catering Management China Holdings Co. Ltd.(c) | | | 132,000 | | | | 103,153 | |
| | |
| 14 | | 2 0 2 1 BLACK ROCK ANNUAL REPORT TO SHAREHOLDERS |
| | |
Schedule of Investments (continued) December 31, 2021 | | Diversified Equity Master Portfolio (Percentages shown are based on Net Assets) |
| | | | | | | | |
| Security | | Shares | | | Value | |
| | |
Hotels, Restaurants & Leisure (continued) | | | | | | | | |
Yum China Holdings, Inc.(b) | | | 12,731 | | | $ | 634,513 | |
Yum! Brands, Inc. | | | 785 | | | | 109,005 | |
| | | | | | | | |
| | |
| | | | | | | 14,089,817 | |
| | |
| Household Durables — 1.1% | | | | | | |
Beazer Homes USA, Inc.(a) | | | 3,532 | | | | 82,013 | |
Casper Sleep, Inc.(a) | | | 5,901 | | | | 39,419 | |
Century Communities, Inc. | | | 868 | | | | 70,994 | |
D.R. Horton, Inc. | | | 9,957 | | | | 1,079,837 | |
Ecovacs Robotics Co. Ltd., Class A | | | 4,700 | | | | 111,596 | |
Ethan Allen Interiors, Inc.(b) | | | 9,142 | | | | 240,343 | |
GoPro, Inc., Class A(a) | | | 27,806 | | | | 286,680 | |
Green Brick Partners, Inc.(a) | | | 5,876 | | | | 178,219 | |
Haier Smart Home Co. Ltd., Class H | | | 74,200 | | | | 313,816 | |
Hangzhou Robam Appliances Co. Ltd., Class A | | | 31,100 | | | | 176,247 | |
Helen of Troy Ltd.(a) | | | 1,122 | | | | 274,295 | |
iRobot Corp.(a)(b) | | | 5,885 | | | | 387,704 | |
La-Z-Boy, Inc. | | | 1,252 | | | | 45,460 | |
Leggett & Platt, Inc. | | | 432 | | | | 17,781 | |
Lennar Corp., B Shares | | | 51 | | | | 4,877 | |
Lennar Corp., Class A | | | 5,079 | | | | 589,977 | |
LG Electronics, Inc.(a) | | | 5,406 | | | | 625,910 | |
LGI Homes, Inc.(a)(b) | | | 2,869 | | | | 443,203 | |
MDC Holdings, Inc. | | | 20,755 | | | | 1,158,752 | |
Meritage Homes Corp.(a) | | | 4,405 | | | | 537,674 | |
NVR, Inc.(a) | | | 75 | | | | 443,165 | |
Panasonic Corp. | | | 3,800 | | | | 41,773 | |
PulteGroup, Inc. | | | 6,532 | | | | 373,369 | |
Sonos, Inc.(a) | | | 19,897 | | | | 592,931 | |
Sony Group Corp. | | | 3,600 | | | | 454,601 | |
TCL Technology Group Corp., Class A | | | 281,600 | | | | 273,431 | |
Tempur Sealy International, Inc. | | | 591 | | | | 27,795 | |
Toll Brothers, Inc. | | | 365 | | | | 26,422 | |
TopBuild Corp.(a)(b) | | | 107 | | | | 29,522 | |
Tri Pointe Homes, Inc.(a) | | | 8,506 | | | | 237,232 | |
Whirlpool Corp.(b) | | | 4,159 | | | | 975,951 | |
| | | | | | | | |
| | |
| | | | | | | 10,140,989 | |
| | |
| Household Products — 0.5% | | | | | | |
Central Garden & Pet Co.(a)(b) | | | 788 | | | | 41,473 | |
Central Garden & Pet Co., Class A(a) | | | 10,565 | | | | 505,535 | |
Colgate-Palmolive Co. | | | 28,016 | | | | 2,390,886 | |
Essity AB, Class B | | | 562 | | | | 18,335 | |
Procter & Gamble Co. | | | 11,399 | | | | 1,864,648 | |
Reckitt Benckiser Group PLC | | | 2,167 | | | | 186,543 | |
Reynolds Consumer Products Inc. | | | 177 | | | | 5,558 | |
Spectrum Brands Holdings, Inc. | | | 136 | | | | 13,834 | |
Unicharm Corp. | | | 300 | | | | 13,052 | |
| | | | | | | | |
| | |
| | | | | | | 5,039,864 | |
|
| Independent Power and Renewable Electricity Producers — 0.3% | |
B Grimm Power PCL, NVDR | | | 62,800 | | | | 76,261 | |
Brookfield Renewable Corp., Class A | | | 7,615 | | | | 280,460 | |
China Longyuan Power Group Corp. Ltd., Class H | | | 48,000 | | | | 112,119 | |
Clearway Energy, Inc., Class A | | | 10,854 | | | | 363,392 | |
Clearway Energy, Inc., Class C | | | 12,015 | | | | 432,900 | |
EDP Renovaveis SA | | | 3,697 | | | | 91,935 | |
Energy Absolute PCL, NVDR(b) | | | 93,000 | | | | 266,916 | |
Meridian Energy Ltd. | | | 23,236 | | | | 77,127 | |
Sichuan Chuantou Energy Co. Ltd., Class A | | | 33,600 | | | | 66,064 | |
| | | | | | | | |
| Security | | Shares | | | Value | |
|
Independent Power and Renewable Electricity Producers (continued) | |
Sunnova Energy International, Inc.(a)(b) | | | 26,628 | | | $ | 743,454 | |
Uniper SE | | | 3,267 | | | | 155,118 | |
| | | | | | | | |
| | |
| | | | | | | 2,665,746 | |
| | |
| Industrial Conglomerates — 0.3% | | | | | | |
3M Co. | | | 455 | | | | 80,822 | |
Bidvest Group Ltd. | | | 18,244 | | | | 216,902 | |
CK Hutchison Holdings Ltd. | | | 16,000 | | | | 103,015 | |
Doosan Co. Ltd. | | | 1,435 | | | | 142,134 | |
General Electric Co. | | | 722 | | | | 68,207 | |
GT Capital Holdings, Inc. | | | 9,480 | | | | 100,391 | |
Hitachi Ltd. | | | 2,500 | | | | 135,433 | |
Honeywell International, Inc. | | | 4,587 | �� | | | 956,435 | |
Investment AB Latour, B Shares | | | 587 | | | | 23,849 | |
Lifco AB | | | 2,241 | | | | 66,936 | |
Roper Technologies, Inc. | | | 541 | | | | 266,096 | |
Samsung C&T Corp. | | | 2,380 | | | | 237,810 | |
Siemens AG, Registered Shares | | | 1,953 | | | | 338,265 | |
Sime Darby Bhd | | | 322,800 | | | | 179,896 | |
SM Investments Corp. | | | 13,280 | | | | 245,586 | |
Smiths Group PLC | | | 1,400 | | | | 29,968 | |
Toshiba Corp. | | | 1,100 | | | | 45,263 | |
| | | | | | | | |
| | |
| | | | | | | 3,237,008 | |
| | |
| Insurance — 2.3% | | | | | | |
Admiral Group PLC | | | 692 | | | | 29,621 | |
Aegon NV | | | 4,801 | | | | 23,868 | |
Aflac, Inc. | | | 4,356 | | | | 254,347 | |
Ageas SA | | | 332 | | | | 17,193 | |
AIA Group Ltd. | | | 37,200 | | | | 375,454 | |
Alleghany Corp.(a) | | | 189 | | | | 126,175 | |
Allianz SE, Registered Shares | | | 1,438 | | | | 339,165 | |
Allstate Corp. | | | 3,513 | | | | 413,304 | |
American Equity Investment Life Holding Co. | | | 2,131 | | | | 82,939 | |
American Financial Group, Inc. | | | 856 | | | | 117,546 | |
American International Group, Inc. | | | 2,763 | | | | 157,104 | |
Aon PLC, Class A | | | 1,700 | | | | 510,952 | |
Arch Capital Group Ltd.(a) | | | 4,108 | | | | 182,601 | |
Arthur J. Gallagher & Co. | | | 1,793 | | | | 304,218 | |
Assicurazioni Generali SpA | | | 1,630 | | | | 34,450 | |
Assurant, Inc.(b) | | | 386 | | | | 60,162 | |
Assured Guaranty Ltd. | | | 229 | | | | 11,496 | |
Athene Holding Ltd., Class A(a) | | | 1,791 | | | | 149,244 | |
Aviva PLC | | | 8,988 | | | | 50,101 | |
AXA SA | | | 6,867 | | | | 204,384 | |
Axis Capital Holdings Ltd. | | | 252 | | | | 13,726 | |
Baloise Holding AG, Registered Shares | | | 233 | | | | 38,029 | |
Brighthouse Financial, Inc.(a) | | | 269 | | | | 13,934 | |
Brown & Brown, Inc. | | | 2,762 | | | | 194,113 | |
BRP Group, Inc., Class A(a) | | | 1,062 | | | | 38,349 | |
Bupa Arabia for Cooperative Insurance Co. | | | 2,176 | | | | 76,158 | |
China Life Insurance Co. Ltd., Class H | | | 352,000 | | | | 583,500 | |
China Pacific Insurance Group Co. Ltd., Class H | | | 30,800 | | | | 83,680 | |
Cincinnati Financial Corp. | | | 1,237 | | | | 140,931 | |
CNA Financial Corp. | | | 90 | | | | 3,967 | |
CNP Assurances | | | 861 | | | | 21,297 | |
Crawford & Co., Class A | | | 25,070 | | | | 187,774 | |
Dai-ichi Life Holdings, Inc. | | | 3,400 | | | | 68,578 | |
Donegal Group, Inc., Class A | | | 7,946 | | | | 113,548 | |
Erie Indemnity Co., Class A | | | 607 | | | | 116,945 | |
Everest Re Group Ltd. | | | 510 | | | | 139,699 | |
FedNat Holding Co. | | | 4,457 | | | | 6,284 | |
| | | | |
MASTER PORTFOLIO SCHEDULE OF INVESTMENTS | | | 15 | |
| | |
Schedule of Investments (continued) December 31, 2021 | | Diversified Equity Master Portfolio (Percentages shown are based on Net Assets) |
| | | | | | | | |
| Security | | Shares | | | Value | |
| | |
Insurance (continued) | | | | | | | | |
Fidelity National Financial, Inc. | | | 2,956 | | | $ | 154,244 | |
First American Financial Corp. | | | 346 | | | | 27,068 | |
Genworth Financial, Inc., Class A(a) | | | 20,040 | | | | 81,162 | |
Gjensidige Forsikring ASA | | | 1,595 | | | | 38,696 | |
Globe Life, Inc. | | | 561 | | | | 52,577 | |
GoHealth, Inc., Class A(a) | | | 151 | | | | 572 | |
Goosehead Insurance, Inc., Class A | | | 477 | | | | 62,048 | |
Hannover Rueck SE | | | 394 | | | | 74,701 | |
Hanover Insurance Group, Inc. | | | 116 | | | | 15,203 | |
Hartford Financial Services Group, Inc. | | | 2,944 | | | | 203,254 | |
HDFC Life Insurance Co. Ltd.(c) | | | 73,048 | | | | 636,697 | |
Heritage Insurance Holdings, Inc. | | | 18,142 | | | | 106,675 | |
Insurance Australia Group Ltd. | | | 11,093 | | | | 34,377 | |
Investors Title Co. | | | 307 | | | | 60,525 | |
Japan Post Holdings Co. Ltd. | | | 11,400 | | | | 88,809 | |
Japan Post Insurance Co. Ltd. | | | 700 | | | | 11,245 | |
Kemper Corp. | | | 195 | | | | 11,464 | |
Legal & General Group PLC | | | 18,319 | | | | 73,977 | |
Lemonade, Inc.(a)(b) | | | 124 | | | | 5,222 | |
Lincoln National Corp. | | | 1,132 | | | | 77,270 | |
Loews Corp. | | | 2,470 | | | | 142,667 | |
Markel Corp.(a) | | | 114 | | | | 140,676 | |
Marsh & McLennan Cos., Inc. | | | 16,783 | | | | 2,917,221 | |
Medibank Pvt Ltd. | | | 11,654 | | | | 28,385 | |
Mercury General Corp. | | | 86 | | | | 4,563 | |
MetLife, Inc. | | | 37,368 | | | | 2,335,126 | |
MS&AD Insurance Group Holdings, Inc. | | | 2,800 | | | | 86,218 | |
Muenchener Rueckversicherungs-Gesellschaft AG in Muenchen, Registered Shares | | | 561 | | | | 165,612 | |
New China Life Insurance Co. Ltd., Class H | | | 60,200 | | | | 161,072 | |
NN Group NV | | | 1,882 | | | | 101,779 | |
Old Mutual Ltd. | | | 407,814 | | | | 335,260 | |
Old Republic International Corp. | | | 910 | | | | 22,368 | |
People’s Insurance Co. Group of China Ltd. | | | 98,000 | | | | 72,457 | |
People’s Insurance Co. Group of China Ltd., Class H | | | 678,000 | | | | 205,314 | |
Phoenix Group Holdings PLC | | | 2,365 | | | | 20,935 | |
PICC Property & Casualty Co. Ltd., Class H | | | 196,000 | | | | 160,219 | |
Ping An Insurance Group Co. of China Ltd., Class H | | | 333,500 | | | | 2,403,239 | |
Primerica, Inc. | | | 127 | | | | 19,465 | |
Principal Financial Group, Inc. | | | 1,450 | | | | 104,879 | |
Progressive Corp. | | | 4,636 | | | | 475,885 | |
Prudential Financial, Inc. | | | 1,981 | | | | 214,423 | |
Prudential PLC | | | 7,780 | | | | 134,538 | |
QBE Insurance Group Ltd. | | | 3,662 | | | | 30,240 | |
Reinsurance Group of America, Inc. | | | 1,591 | | | | 174,199 | |
RenaissanceRe Holdings Ltd. | | | 151 | | | | 25,569 | |
RLI Corp. | | | 4,141 | | | | 464,206 | |
Sampo OYJ, A Shares | | | 1,247 | | | | 62,410 | |
Sanlam Ltd. | | | 37,748 | | | | 140,616 | |
Selective Insurance Group, Inc. | | | 3,078 | | | | 252,211 | |
Selectquote, Inc.(a)(b) | | | 2,250 | | | | 20,385 | |
Sompo Holdings, Inc. | | | 1,600 | | | | 67,478 | |
Suncorp Group Ltd. | | | 6,511 | | | | 52,421 | |
Swiss Life Holding AG, Registered Shares | | | 92 | | | | 56,210 | |
Swiss Re AG | | | 930 | | | | 91,804 | |
T&D Holdings, Inc. | | | 1,300 | | | | 16,609 | |
Tokio Marine Holdings, Inc. | | | 2,800 | | | | 155,875 | |
Travelers Cos., Inc. | | | 9,968 | | | | 1,559,294 | |
Trean Insurance Group, Inc.(a) | | | 5,265 | | | | 46,911 | |
Trupanion, Inc.(a) | | | 4,335 | | | | 572,350 | |
Tryg A/S(b) | | | 1,848 | | | | 45,604 | |
United Insurance Holdings Corp. | | | 7,811 | | | | 33,900 | |
| | | | | | | | |
| Security | | Shares | | | Value | |
| | |
Insurance (continued) | | | | | | | | |
Unum Group | | | 662 | | | $ | 16,265 | |
W.R. Berkley Corp. | | | 1,893 | | | | 155,964 | |
White Mountains Insurance Group Ltd. | | | 10 | | | | 10,139 | |
Willis Towers Watson PLC | | | 3,257 | | | | 773,505 | |
Zurich Insurance Group AG | | | 482 | | | | 211,154 | |
| | | | | | | | |
| | |
| | | | | | | 22,388,242 | |
| | |
| Interactive Media & Services — 3.7% | | | | | | |
Adevinta ASA(a) | | | 1,456 | | | | 19,342 | |
Alphabet, Inc., Class A(a) | | | 3,087 | | | | 8,943,163 | |
Alphabet, Inc., Class C(a) | | | 2,281 | | | | 6,600,279 | |
Auto Trader Group PLC(c) | | | 2,801 | | | | 28,052 | |
Autohome, Inc., ADR | | | 2,071 | | | | 61,053 | |
Baidu, Inc., ADR(a)(b) | | | 6,168 | | | | 917,737 | |
Baidu, Inc., Class A(a) | | | 4,350 | | | | 81,131 | |
Cargurus, Inc.(a) | | | 4,212 | | | | 141,692 | |
Eventbrite, Inc., Class A(a) | | | 8,697 | | | | 151,676 | |
EverQuote, Inc., Class A(a) | | | 7,162 | | | | 112,157 | |
fuboTV, Inc.(a)(b) | | | 12,300 | | | | 190,896 | |
Hello Group, Inc., ADR | | | 4,317 | | | | 38,767 | |
IAC/InterActiveCorp(a) | | | 292 | | | | 38,167 | |
JOYY, Inc., ADR | | | 1,494 | | | | 67,872 | |
Kakao Corp.(a) | | | 7,384 | | | | 697,288 | |
Kuaishou Technology(a)(c) | | | 10,400 | | | | 96,423 | |
Match Group, Inc.(a)(b) | | | 1,033 | | | | 136,614 | |
MediaAlpha, Inc., Class A(a) | | | 1,281 | | | | 19,779 | |
Meta Platforms, Inc., Class A(a) | | | 15,235 | | | | 5,124,292 | |
NAVER Corp. | | | 5,464 | | | | 1,734,390 | |
Outbrain, Inc.(a) | | | 2,847 | | | | 39,858 | |
Pinterest, Inc., Class A(a) | | | 2,186 | | | | 79,461 | |
QuinStreet, Inc.(a) | | | 10,582 | | | | 192,487 | |
REA Group Ltd. | | | 301 | | | | 36,704 | |
Scout24 AG(c) | | | 191 | | | | 13,337 | |
SEEK Ltd. | | | 1,232 | | | | 29,370 | |
Snap, Inc., Class A(a) | | | 404 | | | | 19,000 | |
Tencent Holdings Ltd. | | | 153,700 | | | | 8,968,564 | |
TripAdvisor, Inc.(a) | | | 320 | | | | 8,723 | |
TrueCar, Inc.(a) | | | 10,229 | | | | 34,779 | |
Twitter, Inc.(a) | | | 6,152 | | | | 265,889 | |
Vimeo, Inc.(a)(b) | | | 467 | | | | 8,387 | |
Yelp, Inc.(a) | | | 6,164 | | | | 223,383 | |
Z Holdings Corp. | | | 6,600 | | | | 38,082 | |
ZoomInfo Technologies, Inc.(a) | | | 493 | | | | 31,651 | |
| | | | | | | | |
| | |
| | | | | | | 35,190,445 | |
|
| Internet & Direct Marketing Retail — 2.9% | |
1-800-Flowers.com, Inc., Class A(a) | | | 10,332 | | | | 241,459 | |
aka Brands Holding Corp.(a)(b) | | | 1,630 | | | | 15,078 | |
Alibaba Group Holding Ltd.(a) | | | 411,160 | | | | 6,042,235 | |
Amazon.com, Inc.(a) | | | 3,865 | | | | 12,887,224 | |
Chewy, Inc., Class A(a)(b) | | | 882 | | | | 52,012 | |
Delivery Hero SE(a)(c) | | | 648 | | | | 71,727 | |
DoorDash, Inc., Class A(a)(b) | | | 1,364 | | | | 203,100 | |
eBay, Inc. | | | 4,077 | | | | 271,120 | |
Etsy, Inc.(a) | | | 865 | | | | 189,383 | |
Fiverr International Ltd.(a) | | | 119 | | | | 13,530 | |
JD.com, Inc., Class A(a) | | | 37,036 | | | | 1,275,977 | |
Just Eat Takeaway.com NV(a)(c) | | | 596 | | | | 32,381 | |
Lands’ End, Inc.(a)(b) | | | 3,918 | | | | 76,910 | |
Liquidity Services, Inc.(a) | | | 1,087 | | | | 24,001 | |
Meituan, Class B(a)(c) | | | 100,400 | | | | 2,903,314 | |
MercadoLibre, Inc.(a) | | | 52 | | | | 70,117 | |
Mercari, Inc.(a) | | | 500 | | | | 25,439 | |
momo.com Inc. | | | 3,000 | | | | 175,637 | |
| | |
| 16 | | 2 0 2 1 BLACK ROCK ANNUAL REPORT TO SHAREHOLDERS |
| | |
Schedule of Investments (continued) December 31, 2021 | | Diversified Equity Master Portfolio (Percentages shown are based on Net Assets) |
| | | | | | | | |
| Security | | Shares | | | Value | |
| | |
Internet & Direct Marketing Retail (continued) | | | | | | | | |
Naspers Ltd., N Shares | | | 7,670 | | | $ | 1,190,469 | |
Overstock.com, Inc.(a) | | | 5,957 | | | | 351,523 | |
PChome Online Inc. | | | 11,000 | | | | 50,891 | |
Pinduoduo, Inc., ADR(a) | | | 10,591 | | | | 617,455 | |
Prosus NV | | | 3,018 | | | | 249,966 | |
Qurate Retail, Inc., Series A | | | 1,208 | | | | 9,181 | |
Rakuten Group, Inc.(a) | | | 3,200 | | | | 32,106 | |
RealReal, Inc.(a)(b) | | | 8,596 | | | | 99,800 | |
Revolve Group, Inc.(a) | | | 2,636 | | | | 147,721 | |
Shutterstock, Inc. | | | 3,083 | | | | 341,843 | |
Stitch Fix, Inc., Class A(a) | | | 8,695 | | | | 164,509 | |
Vipshop Holdings Ltd., ADR(a) | | | 20,270 | | | | 170,268 | |
Wayfair, Inc., Class A(a)(b) | | | 633 | | | | 120,251 | |
Zalando SE(a)(c) | | | 781 | | | | 62,915 | |
ZOZO, Inc. | | | 300 | | | | 9,354 | |
| | | | | | | | |
| | |
| | | | | | | 28,188,896 | |
| | |
| IT Services — 3.2% | | | | | | |
Accenture PLC, Class A | | | 3,720 | | | | 1,542,126 | |
Adyen NV(a)(c) | | | 62 | | | | 162,750 | |
Afterpay Ltd.(a) | | | 613 | | | | 37,005 | |
Akamai Technologies, Inc.(a)(b) | | | 480 | | | | 56,179 | |
Alliance Data Systems Corp. | | | 162 | | | | 10,784 | |
Amadeus IT Group SA(a) | | | 1,298 | | | | 87,828 | |
Amdocs Ltd. | | | 420 | | | | 31,433 | |
Automatic Data Processing, Inc.(b) | | | 6,219 | | | | 1,533,481 | |
Backblaze, Inc.(a) | | | 2,670 | | | | 45,096 | |
BigCommerce Holdings, Inc., Series-1(a) | | | 3,868 | | | | 136,811 | |
Block, Inc., Class A(a) | | | 1,348 | | | | 217,715 | |
Broadridge Financial Solutions, Inc. | | | 184 | | | | 33,639 | |
Capgemini SE | | | 508 | | | | 124,501 | |
Cielo SA | | | 170,506 | | | | 68,408 | |
Cloudflare, Inc., Class A(a) | | | 1,351 | | | | 177,657 | |
Cognizant Technology Solutions Corp., Class A | | | 1,553 | | | | 137,782 | |
Computershare Ltd. | | | 423 | | | | 6,158 | |
Concentrix Corp. | | | 137 | | | | 24,471 | |
Conduent, Inc.(a) | | | 38,775 | | | | 207,059 | |
CSG Systems International, Inc. | | | 10,995 | | | | 633,532 | |
DigitalOcean Holdings, Inc.(a) | | | 3,631 | | | | 291,678 | |
DXC Technology Co.(a) | | | 816 | | | | 26,267 | |
Edenred | | | 622 | | | | 28,723 | |
EPAM Systems, Inc.(a) | | | 377 | | | | 252,006 | |
Euronet Worldwide, Inc.(a) | | | 165 | | | | 19,663 | |
Fastly, Inc., Class A(a) | | | 344 | | | | 12,195 | |
Fidelity National Information Services, Inc. | | | 15,259 | | | | 1,665,520 | |
Fiserv, Inc.(a)(b) | | | 1,795 | | | | 186,303 | |
Flywire Corp.(a) | | | 2,777 | | | | 105,693 | |
Fujitsu Ltd. | | | 500 | | | | 85,913 | |
Gartner, Inc.(a) | | | 277 | | | | 92,607 | |
Genpact Ltd. | | | 11,441 | | | | 607,288 | |
Global Payments, Inc. | | | 3,778 | | | | 510,710 | |
Globant SA(a) | | | 131 | | | | 41,146 | |
GMO Payment Gateway, Inc. | | | 200 | | | | 24,905 | |
GoDaddy, Inc., Class A(a) | | | 551 | | | | 46,758 | |
HCL Technologies Ltd. | | | 15,774 | | | | 279,041 | |
Infosys Ltd. | | | 108,571 | | | | 2,749,639 | |
Infosys Ltd., ADR(b) | | | 34,576 | | | | 875,119 | |
International Business Machines Corp. | | | 2,921 | | | | 390,421 | |
Jack Henry & Associates, Inc. | | | 79 | | | | 13,192 | |
Kyndryl Holdings, Inc.(a)(b) | | | 582 | | | | 10,534 | |
Larsen & Toubro Infotech Ltd.(c) | | | 2,712 | | | | 266,730 | |
LiveRamp Holdings, Inc.(a)(b) | | | 9,722 | | | | 466,170 | |
| | | | | | | | |
| Security | | Shares | | | Value | |
| | |
IT Services (continued) | | | | | | | | |
Mastercard, Inc., Class A(b) | | | 6,903 | | | $ | 2,480,386 | |
Mindtree Ltd. | | | 6,583 | | | | 422,358 | |
MongoDB, Inc.(a)(b) | | | 203 | | | | 107,458 | |
Mphasis Ltd. | | | 4,840 | | | | 220,668 | |
NEC Corp. | | | 400 | | | | 18,496 | |
Nexi SpA(a)(c) | | | 734 | | | | 11,631 | |
Nomura Research Institute Ltd. | | | 1,000 | | | | 42,751 | |
NTT Data Corp. | | | 3,400 | | | | 72,934 | |
Obic Co. Ltd. | | | 300 | | | | 56,145 | |
Okta, Inc.(a)(b) | | | 3,424 | | | | 767,558 | |
Otsuka Corp. | | | 800 | | | | 38,146 | |
Paya Holdings, Inc.(a) | | | 2,539 | | | | 16,097 | |
Paychex, Inc. | | | 750 | | | | 102,375 | |
Paymentus Holdings, Inc., Class A(a)(b) | | | 5,637 | | | | 197,182 | |
PayPal Holdings, Inc.(a) | | | 9,867 | | | | 1,860,719 | |
Paysafe Ltd.(a) | | | 1,353 | | | | 5,290 | |
Perficient, Inc.(a) | | | 2,564 | | | | 331,500 | |
Persistent Systems Ltd. | | | 4,393 | | | | 288,634 | |
Rackspace Technology, Inc.(a) | | | 4,427 | | | | 59,632 | |
Repay Holdings Corp.(a) | | | 6,619 | | | | 120,929 | |
Sabre Corp.(a) | | | 1,031 | | | | 8,856 | |
SCSK Corp. | | | 900 | | | | 17,912 | |
Shift4 Payments, Inc., Class A(a) | | | 140 | | | | 8,110 | |
Snowflake, Inc., Class A(a) | | | 1,105 | | | | 374,319 | |
SolarWinds Corp. | | | 110 | | | | 1,561 | |
StoneCo Ltd., Class A(a) | | | 719 | | | | 12,122 | |
Switch, Inc., Class A | | | 372 | | | | 10,654 | |
Tata Consultancy Services Ltd. | | | 43,548 | | | | 2,184,172 | |
Tech Mahindra Ltd. | | | 36,435 | | | | 874,250 | |
TIS, Inc. | | | 500 | | | | 14,868 | |
TTEC Holdings, Inc.(b) | | | 2,193 | | | | 198,576 | |
Twilio, Inc., Class A(a) | | | 599 | | | | 157,741 | |
VeriSign, Inc.(a) | | | 170 | | | | 43,149 | |
Verra Mobility Corp.(a) | | | 2,890 | | | | 44,593 | |
Visa, Inc., Class A(b) | | | 23,028 | | | | 4,990,398 | |
WEX, Inc.(a) | | | 145 | | | | 20,357 | |
Wipro Ltd. | | | 24,796 | | | | 237,604 | |
Wix.com Ltd.(a) | | | 617 | | | | 97,356 | |
Worldline SA(a)(c) | | | 1,348 | | | | 75,030 | |
| | | | | | | | |
| | |
| | | | | | | 30,915,153 | |
| | |
| Leisure Products — 0.1% | | | | | | |
Bandai Namco Holdings, Inc. | | | 400 | | | | 31,275 | |
Brunswick Corp. | | | 253 | | | | 25,485 | |
Callaway Golf Co.(a) | | | 2,875 | | | | 78,890 | |
Hasbro, Inc. | | | 1,483 | | | | 150,940 | |
Hayward Holdings, Inc.(a) | | | 121 | | | | 3,174 | |
Johnson Outdoors, Inc., Class A | | | 192 | | | | 17,988 | |
Malibu Boats, Inc., Class A(a) | | | 2,248 | | | | 154,505 | |
Mattel, Inc.(a) | | | 1,133 | | | | 24,428 | |
Peloton Interactive, Inc., Class A(a)(b) | | | 6,422 | | | | 229,651 | |
Polaris, Inc.(b) | | | 185 | | | | 20,333 | |
Shimano, Inc. | | | 200 | | | | 53,264 | |
Yamaha Corp. | | | 200 | | | | 9,867 | |
YETI Holdings, Inc.(a) | | | 1,022 | | | | 84,652 | |
| | | | | | | | |
| | |
| | | | | | | 884,452 | |
| | |
| Life Sciences Tools & Services — 1.5% | | | | | | |
10X Genomics, Inc., Class A(a) | | | 389 | | | | 57,945 | |
Adaptive Biotechnologies Corp.(a) | | | 354 | | | | 9,933 | |
Agilent Technologies, Inc. | | | 13,654 | | | | 2,179,861 | |
Akoya Biosciences, Inc.(a) | | | 2,265 | | | | 34,677 | |
Avantor, Inc.(a) | | | 3,757 | | | | 158,320 | |
| | | | |
MASTER PORTFOLIO SCHEDULE OF INVESTMENTS | | | 17 | |
| | |
Schedule of Investments (continued) December 31, 2021 | | Diversified Equity Master Portfolio (Percentages shown are based on Net Assets) |
| | | | | | | | |
| Security | | Shares | | | Value | |
| | |
Life Sciences Tools & Services (continued) | | | | | | | | |
Berkeley Lights, Inc.(a) | | | 8,064 | | | $ | 146,603 | |
Bionano Genomics, Inc.(a)(b) | | | 15,618 | | | | 46,698 | |
Bio-Rad Laboratories, Inc., Class A(a) | | | 97 | | | | 73,290 | |
Bio-Techne Corp. | | | 146 | | | | 75,532 | |
Bruker Corp. | | | 4,678 | | | | 392,531 | |
Charles River Laboratories International, Inc.(a) | | | 133 | | | | 50,112 | |
Codex DNA, Inc.(a)(b) | | | 1,062 | | | | 11,470 | |
Codexis, Inc.(a) | | | 5,580 | | | | 174,486 | |
Cytek Biosciences, Inc.(a)(b) | | | 2,116 | | | | 34,533 | |
Danaher Corp. | | | 8,556 | | | | 2,815,009 | |
Eurofins Scientific SE | | | 424 | | | | 52,530 | |
Hangzhou Tigermed Consulting Co. Ltd.,
Class H(c) | | | 3,900 | | | | 49,485 | |
Illumina, Inc.(a) | | | 1,110 | | | | 422,288 | |
IQVIA Holdings, Inc.(a) | | | 720 | | | | 203,141 | |
Lonza Group AG, Registered Shares | | | 202 | | | | 168,183 | |
Maravai LifeSciences Holdings, Inc., Class A(a) | | | 330 | | | | 13,827 | |
MaxCyte, Inc.(a) | | | 4,433 | | | | 45,172 | |
Medpace Holdings, Inc.(a) | | | 3,776 | | | | 821,809 | |
Mettler-Toledo International, Inc.(a) | | | 105 | | | | 178,207 | |
NanoString Technologies, Inc.(a) | | | 6,613 | | | | 279,267 | |
Nautilus Biotechnology, Inc.(a)(b) | | | 2,672 | | | | 13,841 | |
NeoGenomics, Inc.(a)(b) | | | 8,433 | | | | 287,734 | |
Pacific Biosciences of California, Inc.(a) | | | 14,941 | | | | 305,693 | |
PerkinElmer, Inc.(b) | | | 491 | | | | 98,720 | |
Personalis, Inc.(a) | | | 12,488 | | | | 178,204 | |
Pharmaron Beijing Co. Ltd. | | | 6,100 | | | | 135,548 | |
Pharmaron Beijing Co. Ltd., Class H(c) | | | 2,500 | | | | 38,607 | |
QIAGEN NV(a) | | | 1,717 | | | | 95,304 | |
Quantum-Si, Inc.(a) | | | 5,825 | | | | 45,843 | |
Repligen Corp.(a)(b) | | | 293 | | | | 77,598 | |
Sartorius Stedim Biotech | | | 77 | | | | 42,289 | |
Seer, Inc., Class A(a)(b) | | | 4,189 | | | | 95,551 | |
Singular Genomics Systems, Inc.(a) | | | 863 | | | | 9,976 | |
Sotera Health Co.(a) | | | 323 | | | | 7,607 | |
Syneos Health, Inc.(a) | | | 331 | | | | 33,987 | |
Thermo Fisher Scientific, Inc. | | | 2,448 | | | | 1,633,403 | |
Waters Corp.(a) | | | 221 | | | | 82,345 | |
West Pharmaceutical Services, Inc. | | | 177 | | | | 83,015 | |
WuXi AppTec Co. Ltd., Class A | | | 6,300 | | | | 117,549 | |
WuXi AppTec Co. Ltd., Class H(c) | | | 46,048 | | | | 795,631 | |
Wuxi Biologics Cayman, Inc.(a)(c) | | | 110,500 | | | | 1,308,198 | |
| | | | | | | | |
| | |
| | | | | | | 13,981,552 | |
| | |
| Machinery — 1.7% | | | | | | |
AGCO Corp. | | | 203 | | | | 23,552 | |
Alfa Laval AB | | | 1,150 | | | | 46,195 | |
Allison Transmission Holdings, Inc. | | | 342 | | | | 12,432 | |
Alstom SA | | | 424 | | | | 15,056 | |
Altra Industrial Motion Corp. | | | 9,211 | | | | 475,011 | |
Astec Industries, Inc. | | | 3,845 | | | | 266,343 | |
Atlas Copco AB, A Shares | | | 809 | | | | 55,903 | |
Atlas Copco AB, B Shares | | | 1,519 | | | | 89,226 | |
Caterpillar, Inc. | | | 4,967 | | | | 1,026,878 | |
Chart Industries, Inc.(a)(b) | | | 922 | | | | 147,050 | |
CIMC Enric Holdings Ltd. | | | 144,000 | | | | 209,655 | |
Colfax Corp.(a) | | | 380 | | | | 17,469 | |
Crane Co. | | | 160 | | | | 16,277 | |
Cummins India Ltd. | | | 7,509 | | | | 94,883 | |
Cummins, Inc. | | | 154 | | | | 33,594 | |
Daimler Truck Holding AG(a) | | | 1,265 | | | | 46,504 | |
Deere & Co. | | | 766 | | | | 262,654 | |
| | | | | | | | |
| Security | | Shares | | | Value | |
| | |
Machinery (continued) | | | | | | | | |
Desktop Metal, Inc., Class A(a)(b) | | | 17,177 | | | $ | 85,026 | |
Donaldson Co., Inc. | | | 410 | | | | 24,297 | |
Doosan Bobcat, Inc.(a) | | | 7,585 | | | | 259,580 | |
Dover Corp. | | | 59 | | | | 10,714 | |
EnPro Industries, Inc. | | | 2,286 | | | | 251,620 | |
Epiroc AB, Class B | | | 900 | | | | 19,032 | |
Evoqua Water Technologies Corp.(a) | | | 11,726 | | | | 548,191 | |
FANUC Corp. | | | 400 | | | | 85,025 | |
Flowserve Corp. | | | 423 | | | | 12,944 | |
Fortive Corp. | | | 6,175 | | | | 471,091 | |
Franklin Electric Co., Inc. | | | 15,527 | | | | 1,468,233 | |
Gates Industrial Corp. PLC(a) | | | 309 | | | | 4,916 | |
Gencor Industries, Inc.(a) | | | 5,434 | | | | 62,654 | |
Graco, Inc. | | | 546 | | | | 44,019 | |
Hiwin Technologies Corp. | | | 40,720 | | | | 450,653 | |
Hoshizaki Corp. | | | 300 | | | | 22,571 | |
Hurco Cos., Inc. | | | 1,217 | | | | 36,145 | |
Husqvarna AB, B Shares | | | 687 | | | | 10,984 | |
Hydrofarm Holdings Group, Inc.(a) | | | 3,046 | | | | 86,171 | |
Hyliion Holdings Corp.(a) | | | 18,648 | | | | 115,618 | |
Hyundai Construction Equipment Co. Ltd.(a) | | | 3,570 | | | | 121,454 | |
IDEX Corp. | | | 48 | | | | 11,343 | |
Illinois Tool Works, Inc. | | | 10,555 | | | | 2,604,974 | |
ITT, Inc. | | | 280 | | | | 28,613 | |
John Bean Technologies Corp. | | | 1,782 | | | | 273,644 | |
Kennametal, Inc. | | | 8,568 | | | | 307,677 | |
Komatsu Ltd. | | | 2,500 | | | | 58,465 | |
Kone OYJ, Class B | | | 419 | | | | 30,067 | |
Kornit Digital Ltd.(a) | | | 181 | | | | 27,557 | |
Kubota Corp. | | | 3,600 | | | | 80,050 | |
Lincoln Electric Holdings, Inc. | | | 187 | | | | 26,081 | |
Makita Corp. | | | 1,100 | | | | 46,695 | |
Manitowoc Co., Inc.(a) | | | 13,046 | | | | 242,525 | |
Meritor, Inc.(a) | | | 11,607 | | | | 287,621 | |
Middleby Corp.(a) | | | 179 | | | | 35,220 | |
Mitsubishi Heavy Industries Ltd. | | | 300 | | | | 6,936 | |
Nikola Corp.(a) | | | 11,955 | | | | 117,996 | |
Oshkosh Corp. | | | 222 | | | | 25,022 | |
Otis Worldwide Corp. | | | 17,340 | | | | 1,509,794 | |
PACCAR, Inc. | | | 637 | | | | 56,222 | |
Parker-Hannifin Corp. | | | 86 | | | | 27,358 | |
Proto Labs, Inc.(a)(b) | | | 4,090 | | | | 210,022 | |
Rational AG | | | 20 | | | | 20,455 | |
Sandvik AB | | | 4,435 | | | | 123,619 | |
SKF AB, B Shares | | | 1,419 | | | | 33,559 | |
SMC Corp. | | | 200 | | | | 135,172 | |
Snap-on, Inc. | | | 45 | | | | 9,692 | |
Spirax-Sarco Engineering PLC | | | 207 | | | | 45,050 | |
SPX FLOW, Inc. | | | 578 | | | | 49,985 | |
Stanley Black & Decker, Inc. | | | 286 | | | | 53,945 | |
Techtronic Industries Co. Ltd. | | | 6,000 | | | | 119,609 | |
Timken Co. | | | 209 | | | | 14,482 | |
Toro Co. | | | 349 | | | | 34,869 | |
Toyota Industries Corp. | | | 800 | | | | 63,994 | |
Volvo AB, A Shares | | | 1,365 | | | | 32,019 | |
Volvo AB, B Shares | | | 6,768 | | | | 156,520 | |
Wartsila OYJ Abp | | | 986 | | | | 13,829 | |
Watts Water Technologies, Inc., Class A | | | 5,374 | | | | 1,043,470 | |
Welbilt, Inc.(a) | | | 8,965 | | | | 213,098 | |
Woodward, Inc. | | | 187 | | | | 20,469 | |
Xylem, Inc. | | | 662 | | | | 79,387 | |
| | |
| 18 | | 2 0 2 1 BLACK ROCK ANNUAL REPORT TO SHAREHOLDERS |
| | |
Schedule of Investments (continued) December 31, 2021 | | Diversified Equity Master Portfolio (Percentages shown are based on Net Assets) |
| | | | | | | | |
| Security | | Shares | | | Value | |
| | |
Machinery (continued) | | | | | | | | |
Yaskawa Electric Corp. | | | 400 | | | $ | 19,626 | |
Zoomlion Heavy Industry Science and Technology Co. Ltd., Class A | | | 197,400 | | | | 222,824 | |
Zoomlion Heavy Industry Science and Technology Co. Ltd., Class H | | | 439,600 | | | | 276,916 | |
| | | | | | | | |
| | |
| | | | | | | 15,826,091 | |
| | |
| Marine — 0.2% | | | | | | |
AP Moeller - Maersk A/S, Class A | | | 22 | | | | 72,987 | |
COSCO SHIPPING Holdings Co. Ltd., Class A(a) | | | 52,800 | | | | 155,871 | |
COSCO SHIPPING Holdings Co. Ltd., Class H(a) | | | 202,600 | | | | 392,833 | |
Costamare, Inc. | | | 6,705 | | | | 84,818 | |
Evergreen Marine Corp. Taiwan Ltd. | | | 103,000 | | | | 527,661 | |
Kirby Corp.(a) | | | 194 | | | | 11,528 | |
Kuehne + Nagel International AG, Registered Shares | | | 40 | | | | 12,882 | |
Nippon Yusen KK | | | 400 | | | | 30,501 | |
Precious Shipping PCL, NVDR | | | 131,300 | | | | 65,085 | |
SITC International Holdings Co. Ltd. | | | 13,000 | | | | 47,017 | |
Star Bulk Carriers Corp. | | | 3,931 | | | | 89,116 | |
Yang Ming Marine Transport Corp.(a) | | | 25,000 | | | | 108,738 | |
| | | | | | | | |
| | |
| | | | | | | 1,599,037 | |
| | |
| Media — 0.8% | | | | | | |
Altice USA, Inc., Class A(a) | | | 17,026 | | | | 275,481 | |
AMC Networks, Inc., Class A(a) | | | 5,646 | | | | 194,448 | |
Cable One, Inc.(b) | | | 46 | | | | 81,119 | |
Cardlytics, Inc.(a)(b) | | | 3,332 | | | | 220,212 | |
Charter Communications, Inc., Class A(a)(b) | | | 670 | | | | 436,820 | |
Comcast Corp., Class A | | | 45,860 | | | | 2,308,134 | |
ComScore, Inc.(a) | | | 13,300 | | | | 44,422 | |
Cumulus Media, Inc., Class A(a) | | | 3,764 | | | | 42,345 | |
CyberAgent, Inc. | | | 600 | | | | 10,002 | |
Dentsu Group, Inc. | | | 200 | | | | 7,119 | |
Discovery, Inc., Class A(a)(b) | | | 1,349 | | | | 31,755 | |
Discovery, Inc., Class C(a)(b) | | | 3,911 | | | | 89,562 | |
DISH Network Corp., Class A(a) | | | 1,193 | | | | 38,701 | |
Emerald Holding, Inc.(a)(b) | | | 7,770 | | | | 30,847 | |
Entravision Communications Corp., Class A | | | 19,206 | | | | 130,217 | |
EW Scripps Co., Class A | | | 17,996 | | | | 348,223 | |
Fox Corp., Class A(b) | | | 13,336 | | | | 492,098 | |
Fox Corp., Class B | | | 1,130 | | | | 38,725 | |
Gannett Co., Inc.(a) | | | 8,039 | | | | 42,848 | |
Gray Television, Inc. | | | 1,775 | | | | 35,784 | |
Informa PLC(a) | | | 5,081 | | | | 35,575 | |
Interpublic Group of Cos., Inc. | | | 2,464 | | | | 92,277 | |
Liberty Broadband Corp., Class A(a) | | | 211 | | | | 33,950 | |
Liberty Broadband Corp., Class C(a) | | | 865 | | | | 139,352 | |
Liberty Media Corp. - Liberty SiriusXM, Class A(a) | | | 289 | | | | 14,696 | |
Liberty Media Corp. - Liberty SiriusXM, Class C(a) | | | 1,192 | | | | 60,613 | |
Loyalty Ventures, Inc.(a) | | | 63 | | | | 1,894 | |
Magnite, Inc.(a)(b) | | | 9,462 | | | | 165,585 | |
National CineMedia, Inc. | | | 13,432 | | | | 37,744 | |
New York Times Co., Class A | | | 536 | | | | 25,889 | |
News Corp., Class A | | | 1,904 | | | | 42,478 | |
News Corp., Class B | | | 394 | | | | 8,865 | |
Nexstar Media Group, Inc., Class A | | | 678 | | | | 102,364 | |
Omnicom Group, Inc. | | | 1,494 | | | | 109,465 | |
Pearson PLC | | | 2,443 | | | | 20,266 | |
Publicis Groupe SA | | | 592 | | | | 39,885 | |
Schibsted ASA, Class A | | | 355 | | | | 13,687 | |
Schibsted ASA, B Shares | | | 463 | | | | 15,615 | |
Sirius XM Holdings, Inc.(b) | | | 87,289 | | | | 554,285 | |
TechTarget, Inc.(a) | | | 382 | | | | 36,542 | |
| | | | | | | | |
| Security | | Shares | | | Value | |
| | |
Media (continued) | | | | | | | | |
TEGNA, Inc. | | | 21,549 | | | $ | 399,949 | |
Thryv Holdings, Inc.(a)(b) | | | 1,520 | | | | 62,518 | |
Townsquare Media, Inc., Class A(a) | | | 5,405 | | | | 72,049 | |
ViacomCBS, Inc., Class A(b) | | | 26 | | | | 868 | |
ViacomCBS, Inc., Class B | | | 4,569 | | | | 137,892 | |
Vivendi SE | | | 3,259 | | | | 44,084 | |
WPP PLC | | | 2,535 | | | | 38,602 | |
| | | | | | | | |
| | |
| | | | | | | 7,205,851 | |
| | |
| Metals & Mining — 1.4% | | | | | | |
Alcoa Corp. | | | 607 | | | | 36,165 | |
Alrosa AO(a) | | | 707,317 | | | | 1,151,713 | |
Aluminum Corp. of China Ltd., Class A(a) | | | 123,600 | | | | 119,074 | |
Angang Steel Co. Ltd., Class H | | | 980,000 | | | | 436,983 | |
AngloGold Ashanti Ltd. | | | 12,695 | | | | 267,300 | |
Antofagasta PLC | | | 8,207 | | | | 149,262 | |
APL Apollo Tubes Ltd.(a) | | | 10,649 | | | | 142,574 | |
ArcelorMittal SA | | | 1,945 | | | | 62,393 | |
Arconic Corp.(a) | | | 3,449 | | | | 113,851 | |
Baoshan Iron & Steel Co. Ltd., Class A | | | 253,400 | | | | 286,349 | |
BlueScope Steel Ltd. | | | 3,393 | | | | 51,799 | |
Boliden AB | | | 1,930 | | | | 74,420 | |
China Hongqiao Group Ltd. | | | 297,000 | | | | 313,915 | |
China Molybdenum Co. Ltd., Class H | | | 318,000 | | | | 167,981 | |
China Steel Corp. | | | 235,000 | | | | 299,875 | |
Cleveland-Cliffs, Inc.(a)(b) | | | 1,481 | | | | 32,241 | |
Commercial Metals Co. | | | 12,574 | | | | 456,310 | |
Constellium SE(a) | | | 28,923 | | | | 518,011 | |
CSN Mineracao SA | | | 47,931 | | | | 57,931 | |
Dongkuk Steel Mill Co. Ltd. | | | 1,686 | | | | 22,516 | |
Evraz PLC | | | 1,887 | | | | 15,428 | |
Fortescue Metals Group Ltd. | | | 1,666 | | | | 23,419 | |
Ganfeng Lithium Co. Ltd., Class A | | | 5,000 | | | | 112,594 | |
Ganfeng Lithium Co. Ltd., Class H(c) | | | 12,600 | | | | 198,406 | |
Glencore PLC | | | 38,348 | | | | 195,394 | |
Gold Fields Ltd. | | | 27,426 | | | | 303,447 | |
Gold Fields Ltd., ADR | | | 5,957 | | | | 65,467 | |
Hecla Mining Co. | | | 11,181 | | | | 58,365 | |
Hitachi Metals Ltd.(a) | | | 800 | | | | 14,823 | |
Hochschild Mining PLC | | | 52,450 | | | | 92,766 | |
Hunan Valin Steel Co. Ltd., Class A | | | 302,100 | | | | 243,429 | |
Impala Platinum Holdings Ltd. | | | 19,124 | | | | 269,777 | |
JFE Holdings, Inc. | | | 900 | | | | 11,482 | |
Korea Zinc Co. Ltd. | | | 200 | | | | 86,054 | |
Maanshan Iron & Steel Co. Ltd. | | | 566,000 | | | | 208,095 | |
Materion Corp. | | | 1,987 | | | | 182,685 | |
MMC Norilsk Nickel PJSC | | | 909 | | | | 276,499 | |
MMG Ltd.(a) | | | 132,000 | | | | 42,461 | |
MP Materials Corp.(a) | | | 4,298 | | | | 195,215 | |
Newcrest Mining Ltd. | | | 3,906 | | | | 69,957 | |
Nippon Steel Corp. | | | 2,300 | | | | 37,573 | |
Norsk Hydro ASA | | | 10,867 | | | | 85,508 | |
Novagold Resources, Inc.(a) | | | 19,716 | | | | 135,252 | |
Novolipetsk Steel PJSC(a) | | | 107,954 | | | | 312,208 | |
Olympic Steel, Inc. | | | 3,046 | | | | 71,581 | |
POSCO | | | 3,866 | | | | 896,474 | |
POSCO, ADR(b) | | | 3,165 | | | | 184,488 | |
Press Metal Aluminium Holdings Bhd | | | 40,000 | | | | 55,497 | |
Reliance Steel & Aluminum Co.(b) | | | 848 | | | | 137,563 | |
Rio Tinto Ltd. | | | 1,242 | | | | 90,631 | |
Rio Tinto PLC | | | 3,690 | | | | 243,342 | |
Royal Gold, Inc. | | | 213 | | | | 22,410 | |
Ryerson Holding Corp. | | | 6,360 | | | | 165,678 | |
| | | | |
MASTER PORTFOLIO SCHEDULE OF INVESTMENTS | | | 19 | |
| | |
Schedule of Investments (continued) December 31, 2021 | | Diversified Equity Master Portfolio (Percentages shown are based on Net Assets) |
| | | | | | | | |
| Security | | Shares | | | Value | |
| | |
Metals & Mining (continued) | | | | | | | | |
Saudi Arabian Mining Co.(a) | | | 12,903 | | | $ | 269,283 | |
Schnitzer Steel Industries, Inc., Class A | | | 10,247 | | | | 532,024 | |
Seah Besteel Corp. | | | 3,074 | | | | 51,404 | |
Severstal PAO | | | 6,166 | | | | 131,535 | |
Shandong Nanshan Aluminum Co. Ltd., Class A | | | 248,300 | | | | 184,718 | |
Shanxi Taigang Stainless Steel Co. Ltd. | | | 53,200 | | | | 59,169 | |
South32 Ltd. | | | 31,134 | | | | 91,054 | |
Southern Copper Corp. | | | 4,647 | | | | 286,766 | |
Sumitomo Metal Mining Co. Ltd. | | | 2,100 | | | | 79,536 | |
TimkenSteel Corp.(a) | | | 2,201 | | | | 36,317 | |
United States Steel Corp. | | | 869 | | | | 20,691 | |
Vale SA | | | 40,002 | | | | 557,360 | |
voestalpine AG | | | 336 | | | | 12,191 | |
Worthington Industries, Inc. | | | 4,638 | | | | 253,513 | |
Zhejiang Huayou Cobalt Co. Ltd., Class A | | | 7,400 | | | | 128,516 | |
Zijin Mining Group Co. Ltd., Class A | | | 193,000 | | | | 295,306 | |
Zijin Mining Group Co. Ltd., Class H | | | 280,000 | | | | 334,401 | |
| | | | | | | | |
| | |
| | | | | | | 13,188,415 | |
|
| Mortgage Real Estate Investment Trusts (REITs) — 0.2% | |
AFC Gamma, Inc. | | | 3,769 | | | | 85,783 | |
AG Mortgage Investment Trust, Inc. | | | 3,556 | | | | 36,449 | |
Arbor Realty Trust, Inc. | | | 29,703 | | | | 544,159 | |
Blackstone Mortgage Trust, Inc., Class A | | | 22,868 | | | | 700,218 | |
Ellington Financial, Inc. | | | 8,813 | | | | 150,614 | |
Great Ajax Corp. | | | 1,180 | | | | 15,529 | |
New Residential Investment Corp. | | | 1,406 | | | | 15,058 | |
Redwood Trust, Inc. | | | 7,121 | | | | 93,926 | |
Starwood Property Trust, Inc. | | | 891 | | | | 21,651 | |
| | | | | | | | |
| | |
| | | | | | | 1,663,387 | |
| | |
| Multiline Retail — 0.6% | | | | | | |
Dillard’s, Inc., Class A(b) | | | 505 | | | | 123,735 | |
Dollar General Corp. | | | 1,557 | | | | 367,187 | |
Dollar Tree, Inc.(a) | | | 1,723 | | | | 242,116 | |
Franchise Group, Inc. | | | 3,887 | | | | 202,746 | |
Kohl’s Corp.(b) | | | 1,592 | | | | 78,629 | |
Macy’s, Inc. | | | 24,326 | | | | 636,855 | |
Matahari Department Store Tbk PT | | | 336,000 | | | | 97,842 | |
Nordstrom, Inc.(a)(b) | | | 17,024 | | | | 385,083 | |
Ollie’s Bargain Outlet Holdings, Inc.(a) | | | 212 | | | | 10,852 | |
Pan Pacific International Holdings Corp. | | | 1,400 | | | | 19,297 | |
Shinsegae, Inc.(a) | | | 512 | | | | 109,262 | |
Target Corp.(b) | | | 12,845 | | | | 2,972,847 | |
Trent Ltd. | | | 4,285 | | | | 61,183 | |
Wesfarmers Ltd. | | | 1,467 | | | | 63,296 | |
Woolworths Holdings Ltd. | | | 103,415 | | | | 336,561 | |
| | | | | | | | |
| | |
| | | | | | | 5,707,491 | |
| | |
| Multi-Utilities — 0.9% | | | | | | |
Black Hills Corp. | | | 9,261 | | | | 653,549 | |
CMS Energy Corp. | | | 3,739 | | | | 243,222 | |
Consolidated Edison, Inc.(b) | | | 22,711 | | | | 1,937,702 | |
DTE Energy Co. | | | 14,534 | | | | 1,737,394 | |
E.ON SE | | | 21,240 | | | | 295,182 | |
Engie SA | | | 14,397 | | | | 213,153 | |
MDU Resources Group, Inc. | | | 648 | | | | 19,984 | |
National Grid PLC | | | 24,739 | | | | 356,719 | |
NiSource, Inc. | | | 21,406 | | | | 591,020 | |
NorthWestern Corp. | | | 17,572 | | | | 1,004,415 | |
Public Service Enterprise Group, Inc. | | | 10,858 | | | | 724,554 | |
| | | | | | | | |
| Security | | Shares | | | Value | |
| | |
Multi-Utilities (continued) | | | | | | | | |
Sempra Energy | | | 4,077 | | | $ | 539,306 | |
Suez SA | | | 5,269 | | | | 118,835 | |
Veolia Environnement SA | | | 4,633 | | | | 170,142 | |
| | | | | | | | |
| | |
| | | | | | | 8,605,177 | |
| | |
| Oil, Gas & Consumable Fuels — 3.0% | | | | | | |
Aker BP ASA | | | 582 | | | | 17,896 | |
Ampol Ltd. | | | 1,623 | | | | 35,045 | |
Antero Midstream Corp. | | | 1,086 | | | | 10,512 | |
Antero Resources Corp.(a) | | | 29,118 | | | | 509,565 | |
APA Corp. | | | 1,226 | | | | 32,967 | |
Ardmore Shipping Corp.(a)(b) | | | 13,146 | | | | 44,433 | |
BP PLC | | | 68,237 | | | | 305,744 | |
Brigham Minerals, Inc., Class A | | | 10,438 | | | | 220,137 | |
Callon Petroleum Co.(a) | | | 3,551 | | | | 167,785 | |
Centennial Resource Development, Inc.,
Class A(a)(b) | | | 19,117 | | | | 114,320 | |
Cheniere Energy, Inc. | | | 738 | | | | 74,848 | |
Chesapeake Energy Corp.(b) | | | 10,059 | | | | 649,007 | |
Chevron Corp. | | | 7,923 | | | | 929,764 | |
China Petroleum & Chemical Corp., Class H | | | 1,936,000 | | | | 901,829 | |
Civitas Resources, Inc.(b) | | | 870 | | | | 42,604 | |
Clean Energy Fuels Corp.(a)(b) | | | 28,326 | | | | 173,638 | |
CNX Resources Corp.(a) | | | 21,171 | | | | 291,101 | |
ConocoPhillips | | | 4,791 | | | | 345,814 | |
Continental Resources, Inc. | | | 211 | | | | 9,444 | |
Coterra Energy, Inc. | | | 2,509 | | | | 47,671 | |
Delek US Holdings, Inc.(a) | | | 11,004 | | | | 164,950 | |
Denbury, Inc.(a) | | | 2,263 | | | | 173,323 | |
Devon Energy Corp. | | | 10,631 | | | | 468,296 | |
Diamondback Energy, Inc. | | | 934 | | | | 100,732 | |
DTE Midstream LLC(a) | | | 314 | | | | 15,066 | |
ENEOS Holdings, Inc. | | | 22,300 | | | | 83,309 | |
Energy Fuels, Inc.(a) | | | 6,152 | | | | 46,940 | |
Eni SpA | | | 10,458 | | | | 145,343 | |
EOG Resources, Inc. | | | 26,560 | | | | 2,359,325 | |
EQT Corp.(a) | | | 989 | | | | 21,570 | |
Equinor ASA | | | 4,928 | | | | 130,490 | |
Equitrans Midstream Corp. | | | 10,962 | | | | 113,347 | |
Evolution Petroleum Corp. | | | 24,769 | | | | 125,083 | |
Exxon Mobil Corp. | | | 19,030 | | | | 1,164,446 | |
Falcon Minerals Corp. | | | 15,200 | | | | 74,024 | |
Galp Energia SGPS SA | | | 4,683 | | | | 45,440 | |
Gazprom PJSC, ADR | | | 41,498 | | | | 383,198 | |
Gevo, Inc.(a)(b) | | | 8,992 | | | | 38,486 | |
Golar LNG Ltd.(a) | | | 1,491 | | | | 18,473 | |
Green Plains, Inc.(a) | | | 2,171 | | | | 75,464 | |
Grupa Lotos SA(a) | | | 4,376 | | | | 66,140 | |
Gulfport Energy Operating Corp.(a) | | | 1,387 | | | | 99,906 | |
Hess Corp. | | | 1,149 | | | | 85,060 | |
HollyFrontier Corp. | | | 486 | | | | 15,931 | |
Idemitsu Kosan Co. Ltd. | | | 2,000 | | | | 51,039 | |
Inpex Corp. | | | 3,600 | | | | 31,304 | |
Kinder Morgan, Inc. | | | 16,005 | | | | 253,839 | |
Kosmos Energy Ltd.(a) | | | 21,380 | | | | 73,975 | |
Laredo Petroleum, Inc.(a)(b) | | | 943 | | | | 56,703 | |
LUKOIL PJSC | | | 15,528 | | | | 1,382,662 | |
LUKOIL PJSC, ADR | | | 36,328 | | | | 3,255,020 | |
Lundin Energy AB | | | 1,614 | | | | 57,753 | |
Magnolia Oil & Gas Corp., Class A(b) | | | 2,018 | | | | 38,080 | |
Marathon Oil Corp. | | | 2,549 | | | | 41,855 | |
| | |
| 20 | | 2 0 2 1 BLACK ROCK ANNUAL REPORT TO SHAREHOLDERS |
| | |
Schedule of Investments (continued) December 31, 2021 | | Diversified Equity Master Portfolio (Percentages shown are based on Net Assets) |
| | | | | | | | |
| Security | | Shares | | | Value | |
|
Oil, Gas & Consumable Fuels (continued) | |
Marathon Petroleum Corp. | | | 2,024 | | | $ | 129,516 | |
Matador Resources Co. | | | 7,746 | | | | 285,982 | |
MOL Hungarian Oil & Gas PLC | | | 51,838 | | | | 402,324 | |
Neste OYJ | | | 1,450 | | | | 71,363 | |
New Fortress Energy, Inc.(b) | | | 83 | | | | 2,004 | |
Northern Oil and Gas, Inc.(b) | | | 6,856 | | | | 141,096 | |
Novatek PJSC, GDR, Registered Shares | | | 3,369 | | | | 787,689 | |
Occidental Petroleum Corp. | | | 3,532 | | | | 102,393 | |
Occidental Petroleum Corp.(a) | | | 365 | | | | 4,603 | |
OMV AG | | | 869 | | | | 49,144 | |
ONEOK, Inc. | | | 1,398 | | | | 82,146 | |
Ovintiv, Inc. | | | 28,524 | | | | 961,259 | |
Par Pacific Holdings, Inc.(a) | | | 5,327 | | | | 87,842 | |
PBF Energy, Inc., Class A(a)(b) | | | 10,757 | | | | 139,518 | |
PetroChina Co. Ltd., Class A | | | 382,800 | | | | 296,111 | |
PetroChina Co. Ltd., Class H | | | 606,000 | | | | 268,395 | |
Phillips 66 | | | 7,856 | | | | 569,246 | |
Pioneer Natural Resources Co. | | | 919 | | | | 167,148 | |
PTT Exploration & Production PCL, NVDR | | | 35,100 | | | | 123,742 | |
PTT PCL, NVDR | | | 612,300 | | | | 694,858 | |
Range Resources Corp.(a) | | | 9,002 | | | | 160,506 | |
Ranger Oil Corp., Class A(a) | | | 3,288 | | | | 88,513 | |
Reliance Industries Ltd. | | | 58,251 | | | | 1,850,435 | |
Renewable Energy Group, Inc.(a) | | | 3,007 | | | | 127,617 | |
Repsol SA | | | 7,658 | | | | 90,695 | |
SandRidge Energy, Inc.(a) | | | 5,103 | | | | 53,377 | |
Santos Ltd. | | | 7,343 | | | | 33,825 | |
Saudi Arabian Oil Co.(c) | | | 37,027 | | | | 352,912 | |
Scorpio Tankers, Inc. | | | 11,144 | | | | 142,755 | |
SFL Corp. Ltd. | | | 10,495 | | | | 85,534 | |
SK Innovation Co. Ltd.(a) | | | 453 | | | | 90,705 | |
SM Energy Co. | | | 8,982 | | | | 264,789 | |
S-Oil Corp. | | | 3,257 | | | | 234,088 | |
Southwestern Energy Co.(a) | | | 63,246 | | | | 294,726 | |
Talos Energy, Inc.(a) | | | 11,252 | | | | 110,270 | |
Targa Resources Corp. | | | 1,245 | | | | 65,039 | |
Tatneft PJSC | | | 79,242 | | | | 526,449 | |
Tellurian, Inc.(a)(b) | | | 16,832 | | | | 51,843 | |
Texas Pacific Land Corp. | | | 19 | | | | 23,729 | |
TotalEnergies SE | | | 10,104 | | | | 514,296 | |
Turkiye Petrol Rafinerileri A/S(a) | | | 16,218 | | | | 189,390 | |
Ultrapar Participacoes SA | | | 92,041 | | | | 244,045 | |
Ultrapar Participacoes SA, ADR(b) | | | 27,149 | | | | 71,673 | |
Uranium Energy Corp.(a) | | | 8,594 | | | | 28,790 | |
Ur-Energy, Inc.(a) | | | 12,570 | | | | 15,335 | |
Valero Energy Corp. | | | 2,305 | | | | 173,129 | |
Vertex Energy, Inc.(a) | | | 7,657 | | | | 34,686 | |
W&T Offshore, Inc.(a) | | | 71,961 | | | | 232,434 | |
Williams Cos., Inc.(b) | | | 17,490 | | | | 455,440 | |
Woodside Petroleum Ltd. | | | 2,629 | | | | 41,911 | |
World Fuel Services Corp. | | | 5,743 | | | | 152,017 | |
| | | | | | | | |
| | |
| | | | | | | 28,348,028 | |
| | |
| Paper & Forest Products — 0.1% | | | | | | |
Long Chen Paper Co. Ltd. | | | 125,000 | | | | 110,055 | |
Louisiana-Pacific Corp. | | | 308 | | | | 24,132 | |
Mondi PLC | | | 2,771 | | | | 68,732 | |
Nine Dragons Paper Holdings Ltd. | | | 375,000 | | | | 402,721 | |
Sylvamo Corp.(a) | | | 116 | | | | 3,235 | |
| | | | | | | | |
| | |
| | | | | | | 608,875 | |
| | |
| Personal Products — 0.5% | | | | | | |
Amorepacific Corp. | | | 1,191 | | | | 167,140 | |
| | | | | | | | |
| Security | | Shares | | | Value | |
|
Personal Products (continued) | |
Coty, Inc., Class A(a) | | | 1,106 | | | $ | 11,613 | |
Dabur India Ltd. | | | 65,911 | | | | 513,599 | |
Edgewell Personal Care Co. | | | 604 | | | | 27,609 | |
Estee Lauder Cos., Inc., Class A | | | 4,510 | | | | 1,669,602 | |
Hengan International Group Co. Ltd. | | | 38,000 | | | | 195,772 | |
Herbalife Nutrition Ltd.(a) | | | 341 | | | | 13,957 | |
Honest Co., Inc.(a) | | | 4,757 | | | | 38,484 | |
LG Household & Health Care Ltd. | | | 423 | | | | 390,414 | |
L’Oreal SA | | | 790 | | | | 376,682 | |
Medifast, Inc. | | | 1,800 | | | | 376,974 | |
Natura & Co. Holding SA(a) | | | 17,488 | | | | 80,639 | |
Natural Health Trends Corp. | | | 3 | | | | 20 | |
Nature’s Sunshine Products, Inc. | | | 2,873 | | | | 53,150 | |
Nu Skin Enterprises, Inc., Class A | | | 2,193 | | | | 111,295 | |
Shiseido Co. Ltd. | | | 400 | | | | 22,315 | |
Unilever PLC | | | 8,138 | | | | 436,575 | |
| | | | | | | | |
| | |
| | | | | | | 4,485,840 | |
| | |
| Pharmaceuticals — 2.9% | | | | | | |
Aclaris Therapeutics, Inc.(a)(b) | | | 10,094 | | | | 146,767 | |
Alkem Laboratories Ltd. | | | 2,847 | | | | 138,678 | |
Amneal Pharmaceuticals, Inc.(a) | | | 13,679 | | | | 65,522 | |
Amphastar Pharmaceuticals, Inc.(a) | | | 13,169 | | | | 306,706 | |
Arvinas, Inc.(a) | | | 3,456 | | | | 283,876 | |
Aspen Pharmacare Holdings Ltd. | | | 12,969 | | | | 182,665 | |
Astellas Pharma, Inc. | | | 5,200 | | | | 84,633 | |
AstraZeneca PLC | | | 4,537 | | | | 529,782 | |
Asymchem Laboratories Tianjin Co. Ltd., Class A | | | 3,400 | | | | 232,639 | |
Atea Pharmaceuticals, Inc.(a) | | | 9,455 | | | | 84,528 | |
BioDelivery Sciences International, Inc.(a) | | | 19,969 | | | | 61,904 | |
Bristol-Myers Squibb Co. | | | 27,358 | | | | 1,705,771 | |
Cassava Sciences, Inc.(a)(b) | | | 3,354 | | | | 146,570 | |
Catalent, Inc.(a) | | | 1,544 | | | | 197,678 | |
China Medical System Holdings Ltd. | | | 36,000 | | | | 60,178 | |
Chugai Pharmaceutical Co. Ltd. | | | 2,100 | | | | 68,452 | |
Collegium Pharmaceutical, Inc.(a)(b) | | | 5,615 | | | | 104,888 | |
Corcept Therapeutics, Inc.(a) | | | 7,766 | | | | 153,767 | |
CSPC Pharmaceutical Group Ltd. | | | 541,520 | | | | 589,655 | |
Cymabay Therapeutics, Inc.(a) | | | 5,003 | | | | 16,910 | |
Daiichi Sankyo Co. Ltd. | | | 5,000 | | | | 127,257 | |
Dr Reddy’s Laboratories Ltd. | | | 2,577 | | | | 169,810 | |
Eisai Co. Ltd. | | | 600 | | | | 34,061 | |
Elanco Animal Health, Inc.(a) | | | 5,165 | | | | 146,583 | |
Eli Lilly & Co. | | | 9,455 | | | | 2,611,660 | |
Endo International PLC(a) | | | 12,114 | | | | 45,549 | |
Flexion Therapeutics Ltd.(d) | | | 3,275 | | | | 2,030 | |
GlaxoSmithKline PLC | | | 15,560 | | | | 338,784 | |
Hanmi Pharm Co. Ltd. | | | 244 | | | | 56,603 | |
Hansoh Pharmaceutical Group Co. Ltd.(c) | | | 46,000 | | | | 112,320 | |
Harmony Biosciences Holdings, Inc.(a) | | | 2,401 | | | | 102,379 | |
Intra-Cellular Therapies, Inc.(a) | | | 2,903 | | | | 151,943 | |
Jazz Pharmaceuticals PLC(a) | | | 773 | | | | 98,480 | |
Johnson & Johnson | | | 34,191 | | | | 5,849,054 | |
Kala Pharmaceuticals, Inc.(a)(b) | | | 2,505 | | | | 3,031 | |
Kalbe Farma Tbk PT | | | 816,800 | | | | 92,554 | |
Kyowa Kirin Co. Ltd. | | | 700 | | | | 19,086 | |
Lannett Co., Inc.(a) | | | 9,376 | | | | 15,189 | |
Luye Pharma Group Ltd.(a)(b)(c) | | | 228,500 | | | | 104,219 | |
Mega Lifesciences PCL | | | 41,600 | | | | 62,746 | |
Merck & Co., Inc. | | | 23,429 | | | | 1,795,599 | |
Merck KGaA | | | 484 | | | | 124,512 | |
Mind Medicine MindMed, Inc.(a) | | | 15,081 | | | | 20,812 | |
Nektar Therapeutics(a) | | | 577 | | | | 7,795 | |
| | | | |
MASTER PORTFOLIO SCHEDULE OF INVESTMENTS | | | 21 | |
| | |
Schedule of Investments (continued) December 31, 2021 | | Diversified Equity Master Portfolio (Percentages shown are based on Net Assets) |
| | | | | | | | |
| Security | | Shares | | | Value | |
|
Pharmaceuticals (continued) | |
NGM Biopharmaceuticals, Inc.(a) | | | 5,557 | | | $ | 98,414 | |
Novartis AG, Registered Shares | | | 6,043 | | | | 531,010 | |
Novo Nordisk A/S, Class B | | | 4,552 | | | | 511,307 | |
Nuvation Bio, Inc.(a) | | | 2,617 | | | | 22,244 | |
Ono Pharmaceutical Co. Ltd. | | | 1,200 | | | | 29,826 | |
Optinose, Inc.(a) | | | 4,371 | | | | 7,081 | |
Oramed Pharmaceuticals, Inc.(a)(b) | | | 2,439 | | | | 34,829 | |
Organon & Co. | | | 824 | | | | 25,091 | |
Otsuka Holdings Co. Ltd. | | | 1,400 | | | | 50,933 | |
Perrigo Co. PLC | | | 434 | | | | 16,883 | |
Pfizer, Inc. | | | 44,518 | | | | 2,628,788 | |
Phathom Pharmaceuticals, Inc.(a) | | | 1,525 | | | | 29,997 | |
Pliant Therapeutics, Inc.(a) | | | 4,720 | | | | 63,720 | |
Prestige Consumer Healthcare, Inc.(a) | | | 3,207 | | | | 194,505 | |
Provention Bio, Inc.(a) | | | 2,579 | | | | 14,494 | |
Relmada Therapeutics, Inc.(a) | | | 3,882 | | | | 87,461 | |
Roche Holding AG | | | 2,063 | | | | 861,715 | |
Royalty Pharma PLC, Class A | | | 2,385 | | | | 95,042 | |
Sanofi | | | 3,265 | | | | 327,623 | |
Shionogi & Co. Ltd. | | | 600 | | | | 42,208 | |
Sihuan Pharmaceutical Holdings Group Ltd. | | | 351,000 | | | | 66,684 | |
Sino Biopharmaceutical Ltd. | | | 320,000 | | | | 224,574 | |
Sun Pharmaceutical Industries Ltd. | | | 17,552 | | | | 199,427 | |
Takeda Pharmaceutical Co. Ltd. | | | 5,700 | | | | 155,657 | |
Teva Pharmaceutical Industries Ltd., ADR(a) | | | 4,819 | | | | 38,600 | |
TherapeuticsMD, Inc.(a) | | | 37,248 | | | | 13,242 | |
Theravance Biopharma, Inc.(a)(b) | | | 4,402 | | | | 48,642 | |
UCB SA | | | 263 | | | | 30,015 | |
Viatris, Inc. | | | 13,557 | | | | 183,426 | |
Vifor Pharma AG | | | 78 | | | | 13,857 | |
Xeris Biopharma Holdings, Inc.(a) | | | 14,566 | | | | 42,678 | |
Zhangzhou Pientzehuang Pharmaceutical Co. Ltd., Class A | | | 1,000 | | | | 68,875 | |
Zoetis, Inc.(b) | | | 13,234 | | | | 3,229,493 | |
Zogenix, Inc.(a) | | | 16,071 | | | | 261,154 | |
| | | | | | | | |
| | |
| | | | | | | 27,503,120 | |
| | |
| Professional Services — 0.9% | | | | | | |
Adecco Group AG, Registered Shares | | | 1,360 | | | | 69,302 | |
ASGN, Inc.(a) | | | 4,580 | | | | 565,172 | |
Benefit One Inc. | | | 300 | | | | 12,889 | |
Booz Allen Hamilton Holding Corp. | | | 160 | | | | 13,566 | |
CACI International, Inc., Class A(a) | | | 75 | | | | 20,191 | |
Clarivate PLC(a) | | | 1,795 | | | | 42,218 | |
CoStar Group, Inc.(a) | | | 1,308 | | | | 103,371 | |
Dun & Bradstreet Holdings, Inc.(a)(b) | | | 520 | | | | 10,655 | |
Equifax, Inc. | | | 5,592 | | | | 1,637,282 | |
Experian PLC | | | 2,753 | | | | 135,601 | |
Exponent, Inc. | | | 2,983 | | | | 348,206 | |
First Advantage Corp.(a) | | | 3,370 | | | | 64,165 | |
Forrester Research, Inc.(a) | | | 4,028 | | | | 236,564 | |
Franklin Covey Co.(a) | | | 6,282 | | | | 291,234 | |
FTI Consulting, Inc.(a)(b) | | | 109 | | | | 16,723 | |
Heidrick & Struggles International, Inc. | | | 6,028 | | | | 263,604 | |
HireRight Holdings Corp.(a) | | | 3,089 | | | | 49,424 | |
IHS Markit Ltd. | | | 2,927 | | | | 389,057 | |
Insperity, Inc. | | | 8,778 | | | | 1,036,770 | |
Intertek Group PLC | | | 201 | | | | 15,334 | |
KBR, Inc. | | | 6,295 | | | | 299,768 | |
Kelly Services, Inc., Class A | | | 7,769 | | | | 130,286 | |
Kforce, Inc. | | | 8,999 | | | | 676,905 | |
Korn Ferry | | | 496 | | | | 37,562 | |
L&T Technology Services Ltd.(c) | | | 2,172 | | | | 163,149 | |
| | | | | | | | |
| Security | | Shares | | | Value | |
|
Professional Services (continued) | |
Legalzoom.com, Inc.(a)(b) | | | 60 | | | $ | 964 | |
ManpowerGroup, Inc. | | | 176 | | | | 17,130 | |
Mistras Group, Inc.(a) | | | 5,359 | | | | 39,817 | |
Nielsen Holdings PLC | | | 1,162 | | | | 23,833 | |
Nihon M&A Center Holdings, Inc. | | | 1,200 | | | | 29,435 | |
Randstad NV | | | 669 | | | | 45,637 | |
Recruit Holdings Co. Ltd. | | | 4,300 | | | | 261,680 | |
RELX PLC | | | 9,178 | | | | 299,633 | |
Robert Half International, Inc. | | | 266 | | | | 29,664 | |
Science Applications International Corp. | | | 188 | | | | 15,715 | |
Teleperformance | | | 169 | | | | 75,556 | |
TransUnion | | | 1,600 | | | | 189,728 | |
TriNet Group, Inc.(a) | | | 6,082 | | | | 579,371 | |
Upwork, Inc.(a)(b) | | | 7,280 | | | | 248,685 | |
Verisk Analytics, Inc. | | | 378 | | | | 86,460 | |
Wolters Kluwer NV | | | 1,009 | | | | 118,760 | |
| | | | | | | | |
| | |
| | | | | | | 8,691,066 | |
|
| Real Estate Management & Development — 0.7% | |
Agile Group Holdings Ltd. | | | 124,000 | | | | 67,311 | |
Aldar Properties PJSC | | | 91,060 | | | | 98,881 | |
A-Living Smart City Services Co. Ltd., Class H(c) | | | 22,750 | | | | 38,866 | |
Altisource Portfolio Solutions SA(a) | | | 4,042 | | | | 45,351 | |
Aroundtown SA | | | 5,196 | | | | 31,344 | |
Azrieli Group Ltd. | | | 526 | | | | 50,186 | |
Capitaland Investment Ltd.(a) | | | 15,800 | | | | 39,949 | |
CBRE Group, Inc., Class A(a) | | | 5,261 | | | | 570,871 | |
China Overseas Land & Investment Ltd. | | | 104,000 | | | | 246,355 | |
CIFI Holdings Group Co. Ltd. | | | 376,000 | | | | 226,153 | |
City Developments Ltd. | | | 1,700 | | | | 8,601 | |
CK Asset Holdings Ltd. | | | 6,000 | | | | 37,848 | |
Country Garden Holdings Co. Ltd. | | | 531,000 | | | | 471,567 | |
Country Garden Services Holdings Co. Ltd. | | | 38,000 | | | | 228,149 | |
Cushman & Wakefield PLC(a) | | | 9,295 | | | | 206,721 | |
Daito Trust Construction Co. Ltd. | | | 100 | | | | 11,472 | |
Daiwa House Industry Co. Ltd. | | | 1,800 | | | | 51,730 | |
Emaar Properties PJSC | | | 118,183 | | | | 157,051 | |
ESR Cayman Ltd.(a)(c) | | | 3,000 | | | | 10,148 | |
eXp World Holdings, Inc.(b) | | | 2,259 | | | | 76,106 | |
Fastighets AB Balder, B Shares(a) | | | 514 | | | | 36,989 | |
Guangzhou R&F Properties Co. Ltd., Class H | | | 338,800 | | | | 126,072 | |
Hang Lung Properties Ltd. | | | 4,000 | | | | 8,228 | |
Henderson Land Development Co. Ltd. | | | 9,000 | | | | 38,390 | |
Hongkong Land Holdings Ltd.(b) | | | 5,900 | | | | 30,678 | |
Howard Hughes Corp.(a) | | | 135 | | | | 13,740 | |
Hulic Co. Ltd. | | | 1,600 | | | | 15,215 | |
Jones Lang LaSalle, Inc.(a) | | | 164 | | | | 44,172 | |
KE Holdings, Inc., ADR(a) | | | 5,316 | | | | 106,958 | |
Kennedy-Wilson Holdings, Inc. | | | 21,305 | | | | 508,763 | |
KWG Group Holdings Ltd. | | | 120,500 | | | | 78,916 | |
LEG Immobilien SE | | | 194 | | | | 27,048 | |
Lendlease Corp. Ltd. | | | 2,647 | | | | 20,611 | |
Logan Group Co. Ltd. | | | 107,000 | | | | 81,785 | |
Marcus & Millichap, Inc.(a) | | | 19,413 | | | | 998,993 | |
Mitsubishi Estate Co. Ltd. | | | 4,900 | | | | 67,975 | |
Mitsui Fudosan Co. Ltd. | | | 3,000 | | | | 59,462 | |
NEPI Rockcastle PLC | | | 37,023 | | | | 246,278 | |
New World Development Co. Ltd. | | | 8,000 | | | | 31,674 | |
Opendoor Technologies Inc.(a) | | | 1,461 | | | | 21,345 | |
Powerlong Real Estate Holdings Ltd. | | | 129,000 | | | | 67,540 | |
RE/MAX Holdings, Inc., Class A | | | 7,941 | | | | 242,121 | |
Realogy Holdings Corp.(a) | | | 24,092 | | | | 404,986 | |
Redfin Corp.(a)(b) | | | 3,339 | | | | 128,184 | |
| | |
| 22 | | 2 0 2 1 BLACK ROCK ANNUAL REPORT TO SHAREHOLDERS |
| | |
Schedule of Investments (continued) December 31, 2021 | | Diversified Equity Master Portfolio (Percentages shown are based on Net Assets) |
| | | | | | | | |
| Security | | Shares | | | Value | |
|
Real Estate Management & Development (continued) | |
RMR Group, Inc., Class A | | | 2,195 | | | $ | 76,123 | |
S-Enjoy Service Group Co. Ltd. | | | 45,000 | | | | 64,619 | |
Shimao Services Holdings Ltd.(c) | | | 54,000 | | | | 37,587 | |
Sino Land Co. Ltd. | | | 4,000 | | | | 4,981 | |
Sumitomo Realty & Development Co. Ltd. | | | 900 | | | | 26,533 | |
Sun Hung Kai Properties Ltd. | | | 5,000 | | | | 60,671 | |
Sunac China Holdings Ltd. | | | 316,000 | | | | 478,024 | |
Sunac Services Holdings Ltd.(a)(c) | | | 39,000 | | | | 39,808 | |
Swire Pacific Ltd., Class A | | | 1,500 | | | | 8,532 | |
Swire Properties Ltd. | | | 3,000 | | | | 7,521 | |
Swiss Prime Site AG, Registered Shares | | | 367 | | | | 36,028 | |
UOL Group Ltd. | | | 5,500 | | | | 28,951 | |
Vonovia SE | | | 2,563 | | | | 141,227 | |
Wharf Real Estate Investment Co. Ltd. | | | 5,000 | | | | 25,406 | |
Zillow Group, Inc., Class A(a) | | | 202 | | | | 12,568 | |
Zillow Group, Inc., Class C(a) | | | 655 | | | | 41,822 | |
| | | | | | | | |
| | |
| | | | | | | 7,171,184 | |
| | |
| Road & Rail — 0.9% | | | | | | |
AMERCO | | | 84 | | | | 61,003 | |
ArcBest Corp. | | | 2,791 | | | | 334,501 | |
Avis Budget Group, Inc.(a) | | | 1,758 | | | | 364,556 | |
BTS Group Holdings PCL, NVDR | | | 466,000 | | | | 130,253 | |
Canadian Pacific Railway Ltd. | | | 2,742 | | | | 197,259 | |
Central Japan Railway Co. | | | 500 | | | | 66,536 | |
CJ Logistics Corp.(a) | | | 1,017 | | | | 107,705 | |
Container Corp. Of India Ltd. | | | 40,874 | | | | 337,004 | |
Covenant Logistics Group, Inc.(a) | | | 5,672 | | | | 149,911 | |
CSX Corp. | | | 10,850 | | | | 407,960 | |
East Japan Railway Co. | | | 900 | | | | 55,328 | |
Hankyu Hanshin Holdings, Inc. | | | 900 | | | | 25,577 | |
JB Hunt Transport Services, Inc. | | | 540 | | | | 110,376 | |
Keio Corp. | | | 400 | | | | 17,649 | |
Keisei Electric Railway Co. Ltd. | | | 400 | | | | 10,821 | |
Kintetsu Group Holdings Co. Ltd.(a) | | | 400 | | | | 11,182 | |
Knight-Swift Transportation Holdings, Inc. | | | 953 | | | | 58,076 | |
Landstar System, Inc. | | | 5,492 | | | | 983,178 | |
Lyft, Inc., Class A(a)(b) | | | 5,213 | | | | 222,751 | |
Marten Transport Ltd. | | | 8,346 | | | | 143,217 | |
MTR Corp. Ltd. | | | 10,500 | | | | 56,365 | |
Nippon Express Co. Ltd.(a)(d) | | | 300 | | | | 17,774 | |
Norfolk Southern Corp. | | | 1,254 | | | | 373,328 | |
Odakyu Electric Railway Co. Ltd. | | | 1,000 | | | | 18,591 | |
Old Dominion Freight Line, Inc. | | | 1,033 | | | | 370,207 | |
Ryder System, Inc. | | | 9,901 | | | | 816,139 | |
Saia, Inc.(a) | | | 978 | | | | 329,615 | |
Schneider National, Inc., Class B | | | 10,904 | | | | 293,427 | |
Tobu Railway Co. Ltd. | | | 500 | | | | 11,410 | |
Tokyu Corp. | | | 1,300 | | | | 17,282 | |
TuSimple Holdings, Inc., Class A(a) | | | 106 | | | | 3,800 | |
Uber Technologies, Inc.(a) | | | 10,063 | | | | 421,942 | |
Union Pacific Corp. | | | 2,935 | | | | 739,415 | |
United International Transportation Co. | | | 4,922 | | | | 60,990 | |
Werner Enterprises, Inc. | | | 24,926 | | | | 1,187,973 | |
West Japan Railway Co. | | | 600 | | | | 25,094 | |
XPO Logistics, Inc.(a) | | | 315 | | | | 24,390 | |
| | | | | | | | |
| | |
| | | | | | | 8,562,585 | |
| |
| Semiconductors & Semiconductor Equipment — 5.7% | | | | |
Advanced Micro Devices, Inc.(a)(b) | | | 13,382 | | | | 1,925,670 | |
Advantest Corp. | | | 300 | | | | 28,410 | |
Allegro MicroSystems, Inc.(a) | | | 128 | | | | 4,631 | |
Ambarella, Inc.(a) | | | 3,065 | | | | 621,858 | |
| | | | | | | | |
| Security | | Shares | | | Value | |
|
Semiconductors & Semiconductor Equipment (continued) | |
Amkor Technology, Inc. | | | 8,353 | | | $ | 207,071 | |
Analog Devices, Inc.(b) | | | 1,996 | | | | 350,837 | |
Anpec Electronics Corp. | | | 14,000 | | | | 140,316 | |
Applied Materials, Inc.(b) | | | 11,313 | | | | 1,780,214 | |
ASE Technology Holding Co. Ltd. | | | 136,000 | | | | 525,533 | |
ASM International NV | | | 217 | | | | 95,788 | |
ASML Holding NV | | | 860 | | | | 688,877 | |
ASPEED Technology, Inc. | | | 1,000 | | | | 128,944 | |
Azenta Inc. | | | 238 | | | | 24,540 | |
Broadcom, Inc. | | | 1,096 | | | | 729,289 | |
Cirrus Logic, Inc.(a) | | | 5,269 | | | | 484,853 | |
CMC Materials, Inc. | | | 2,192 | | | | 420,184 | |
Cohu, Inc.(a) | | | 2,762 | | | | 105,205 | |
eMemory Technology, Inc. | | | 2,000 | | | | 157,849 | |
Enphase Energy, Inc.(a) | | | 489 | | | | 89,458 | |
Entegris, Inc. | | | 1,118 | | | | 154,932 | |
Everlight Electronics Co. Ltd. | | | 34,000 | | | | 64,587 | |
Faraday Technology Corp. | | | 42,000 | | | | 361,833 | |
First Solar, Inc.(a) | | | 344 | | | | 29,983 | |
Gigadevice Semiconductor Beijing, Inc., Class A | | | 5,300 | | | | 146,659 | |
Global Unichip Corp. | | | 11,000 | | | | 232,322 | |
Ichor Holdings Ltd.(a) | | | 6,727 | | | | 309,644 | |
Impinj, Inc.(a) | | | 1,654 | | | | 146,710 | |
Infineon Technologies AG | | | 4,349 | | | | 200,221 | |
Intel Corp. | | | 49,681 | | | | 2,558,571 | |
JCET Group Co. Ltd., Class A | | | 57,900 | | | | 282,545 | |
Kinsus Interconnect Technology Corp. | | | 35,000 | | | | 293,395 | |
KLA Corp. | | | 1,042 | | | | 448,175 | |
Kulicke & Soffa Industries, Inc.(b) | | | 4,437 | | | | 268,616 | |
Lam Research Corp. | | | 1,410 | | | | 1,014,001 | |
Lasertec Corp. | | | 100 | | | | 30,630 | |
Lattice Semiconductor Corp.(a) | | | 23,152 | | | | 1,784,093 | |
Macronix International Co. Ltd. | | | 143,000 | | | | 217,578 | |
Marketech International Corp. | | | 13,000 | | | | 85,334 | |
Marvell Technology, Inc. | | | 1,016 | | | | 88,890 | |
MaxLinear, Inc.(a) | | | 4,425 | | | | 333,601 | |
MediaTek, Inc. | | | 44,000 | | | | 1,888,018 | |
Meta Materials, Inc.(a)(b) | | | 7,773 | | | | 19,122 | |
Microchip Technology, Inc. | | | 1,664 | | | | 144,868 | |
Micron Technology, Inc. | | | 2,012 | | | | 187,418 | |
MKS Instruments, Inc. | | | 180 | | | | 31,351 | |
Nanya Technology Corp. | | | 291,000 | | | | 819,635 | |
NAURA Technology Group Co. Ltd., Class A | | | 1,800 | | | | 98,347 | |
Novatek Microelectronics Corp. | | | 27,000 | | | | 524,294 | |
NVIDIA Corp. | | | 18,321 | | | | 5,388,389 | |
NXP Semiconductors NV | | | 1,305 | | | | 297,253 | |
ON Semiconductor Corp.(a) | | | 803 | | | | 54,540 | |
Onto Innovation, Inc.(a) | | | 4,675 | | | | 473,250 | |
Parade Technologies Ltd. | | | 2,000 | | | | 152,160 | |
Power Integrations, Inc. | | | 10,041 | | | | 932,708 | |
Qualcomm, Inc. | | | 5,946 | | | | 1,087,345 | |
Rambus, Inc.(a) | | | 10,923 | | | | 321,027 | |
Realtek Semiconductor Corp. | | | 57,000 | | | | 1,190,918 | |
Renesas Electronics Corp.(a) | | | 5,000 | | | | 62,103 | |
Rohm Co. Ltd. | | | 300 | | | | 27,291 | |
Semtech Corp.(a) | | | 1,203 | | | | 106,983 | |
SG Micro Corp., Class A | | | 2,449 | | | | 119,119 | |
Silergy Corp. | | | 2,000 | | | | 361,993 | |
Silicon Laboratories, Inc.(a)(b) | | | 9,206 | | | | 1,900,302 | |
SiTime Corp.(a) | | | 496 | | | | 145,100 | |
SK Hynix, Inc.(a) | | | 8,303 | | | | 911,940 | |
SolarEdge Technologies, Inc.(a) | | | 203 | | | | 56,956 | |
| | | | |
MASTER PORTFOLIO SCHEDULE OF INVESTMENTS | | | 23 | |
| | |
Schedule of Investments (continued) December 31, 2021 | | Diversified Equity Master Portfolio (Percentages shown are based on Net Assets) |
| | | | | | | | |
| Security | | Shares | | | Value | |
|
Semiconductors & Semiconductor Equipment (continued) | |
StarPower Semiconductor Ltd. | | | 1,200 | | | $ | 71,814 | |
STMicroelectronics NV | | | 1,764 | | | | 86,745 | |
SUMCO Corp. | | | 800 | | | | 16,290 | |
SunPower Corp.(a)(b) | | | 6,506 | | | | 135,780 | |
Synaptics, Inc.(a) | | | 3,545 | | | | 1,026,313 | |
Taiwan Semiconductor Manufacturing Co. Ltd. | | | 674,000 | | | | 14,909,550 | |
Taiwan Semiconductor Manufacturing Co. Ltd., ADR | | | 3,380 | | | | 406,648 | |
Teradyne, Inc.(b) | | | 70 | | | | 11,447 | |
Texas Instruments, Inc. | | | 3,730 | | | | 702,993 | |
Tokyo Electron Ltd. | | | 300 | | | | 172,672 | |
Ultra Clean Holdings, Inc.(a) | | | 4,318 | | | | 247,680 | |
United Microelectronics Corp. | | | 423,000 | | | | 990,992 | |
United Microelectronics Corp., ADR | | | 12,801 | | | | 149,772 | |
Universal Display Corp. | | | 141 | | | | 23,269 | |
Vanguard International Semiconductor Corp. | | | 59,000 | | | | 336,078 | |
Wolfspeed, Inc.(a) | | | 375 | | | | 41,914 | |
Xilinx, Inc. | | | 1,843 | | | | 390,771 | |
| | | | | | | | |
| | |
| | | | | | | 54,585,005 | |
| | |
| Software — 5.5% | | | | | | |
ACI Worldwide, Inc.(a) | | | 15,800 | | | | 548,260 | |
Adobe, Inc.(a) | | | 6,780 | | | | 3,844,667 | |
Alarm.com Holdings, Inc.(a) | | | 3,253 | | | | 275,887 | |
Altair Engineering, Inc., Class A(a) | | | 6,413 | | | | 495,853 | |
Alteryx, Inc., Class A(a) | | | 191 | | | | 11,556 | |
Anaplan, Inc.(a) | | | 456 | | | | 20,908 | |
ANSYS, Inc.(a) | | | 315 | | | | 126,353 | |
Appfolio, Inc., Class A(a)(b) | | | 428 | | | | 51,814 | |
Appian Corp.(a) | | | 4,451 | | | | 290,250 | |
Asana, Inc., Class A(a) | | | 6,104 | | | | 455,053 | |
Aspen Technology, Inc.(a) | | | 221 | | | | 33,636 | |
Atlassian Corp. PLC, Class A(a) | | | 637 | | | | 242,882 | |
Autodesk, Inc.(a) | | | 724 | | | | 203,582 | |
Avalara, Inc.(a) | | | 236 | | | | 30,470 | |
Avaya Holdings Corp.(a)(b) | | | 5,632 | | | | 111,514 | |
Bentley Systems, Inc., Class B(b) | | | 557 | | | | 26,920 | |
Bill.Com Holdings, Inc.(a) | | | 257 | | | | 64,032 | |
Birlasoft Ltd. | | | 20,085 | | | | 146,825 | |
Black Knight, Inc.(a) | | | 219 | | | | 18,153 | |
Blackline, Inc.(a) | | | 3,274 | | | | 338,990 | |
Bottomline Technologies DE, Inc.(a) | | | 1,829 | | | | 103,284 | |
Box, Inc., Class A(a) | | | 19,727 | | | | 516,650 | |
Braze, Inc.(a) | | | 52 | | | | 4,012 | |
BTRS Holdings, Inc.(a) | | | 18,754 | | | | 146,656 | |
C3.AI, Inc., Class A(a) | | | 111 | | | | 3,469 | |
Cadence Design Systems, Inc.(a) | | | 2,923 | | | | 544,701 | |
CDK Global, Inc. | | | 396 | | | | 16,529 | |
Cerence, Inc.(a)(b) | | | 1,708 | | | | 130,901 | |
Ceridian HCM Holding, Inc.(a)(b) | | | 540 | | | | 56,408 | |
Check Point Software Technologies Ltd.(a) | | | 1,026 | | | | 119,591 | |
Citrix Systems, Inc. | | | 376 | | | | 35,566 | |
Coupa Software, Inc.(a) | | | 267 | | | | 42,199 | |
Crowdstrike Holdings, Inc., Class A(a) | | | 1,028 | | | | 210,483 | |
CyberArk Software Ltd.(a) | | | 136 | | | | 23,566 | |
Dassault Systemes SE | | | 2,732 | | | | 162,131 | |
Datadog, Inc., Class A(a) | | | 721 | | | | 128,417 | |
Datto Holding Corp.(a) | | | 75 | | | | 1,976 | |
Digital Turbine, Inc.(a) | | | 5,386 | | | | 328,492 | |
DocuSign, Inc.(a) | | | 659 | | | | 100,372 | |
Dolby Laboratories, Inc., Class A | | | 209 | | | | 19,901 | |
Domo, Inc., Class B(a) | | | 1,317 | | | | 65,323 | |
DoubleVerify Holdings, Inc.(a)(b) | | | 80 | | | | 2,662 | |
| | | | | | | | |
| Security | | Shares | | | Value | |
| | |
Software (continued) | | | | | | | | |
Dropbox, Inc., Class A(a) | | | 756 | | | $ | 18,552 | |
Duck Creek Technologies, Inc.(a) | | | 233 | | | | 7,016 | |
Dynatrace, Inc.(a) | | | 1,460 | | | | 88,111 | |
E2open Parent Holdings, Inc.(a)(b) | | | 16,159 | | | | 181,950 | |
Elastic NV(a) | | | 226 | | | | 27,818 | |
Envestnet, Inc.(a) | | | 4,160 | | | | 330,054 | |
Everbridge, Inc.(a) | | | 125 | | | | 8,416 | |
Expensify, Inc.(a) | | | 2,808 | | | | 123,552 | |
Fair Isaac Corp.(a) | | | 62 | | | | 26,888 | |
Five9, Inc.(a) | | | 217 | | | | 29,798 | |
Fortinet, Inc.(a) | | | 419 | | | | 150,589 | |
Gitlab, Inc., Class A(a) | | | 791 | | | | 68,817 | |
Guidewire Software, Inc.(a) | | | 45 | | | | 5,109 | |
HashiCorp, Inc., Class A, Class A(a) | | | 2,335 | | | | 212,578 | |
HubSpot, Inc.(a) | | | 891 | | | | 587,303 | |
Intuit, Inc. | | | 4,809 | | | | 3,093,245 | |
Jamf Holding Corp.(a)(b) | | | 172 | | | | 6,538 | |
JFrog Ltd.(a) | | | 8,189 | | | | 243,213 | |
LivePerson, Inc.(a) | | | 7,247 | | | | 258,863 | |
Mandiant, Inc.(a) | | | 762 | | | | 13,365 | |
Manhattan Associates, Inc.(a) | | | 1,469 | | | | 228,415 | |
Marathon Digital Holdings, Inc.(a)(b) | | | 3,038 | | | | 99,829 | |
Marin Software, Inc.(a) | | | 1,610 | | | | 5,973 | |
McAfee Corp., Class A | | | 221 | | | | 5,700 | |
Microsoft Corp. | | | 57,076 | | | | 19,195,800 | |
MicroStrategy, Inc., Class A(a) | | | 488 | | | | 265,711 | |
Mimecast Ltd.(a) | | | 4,914 | | | | 391,007 | |
Model N, Inc.(a) | | | 3,360 | | | | 100,901 | |
Momentive Global, Inc.(a) | | | 11,075 | | | | 234,236 | |
Monday.com Ltd.(a) | | | 188 | | | | 58,039 | |
N-Able, Inc.(a) | | | 125 | | | | 1,388 | |
nCino, Inc.(a) | | | 182 | | | | 9,985 | |
NCR Corp.(a) | | | 414 | | | | 16,643 | |
Nemetschek SE | | | 133 | | | | 17,006 | |
New Relic, Inc.(a) | | | 168 | | | | 18,473 | |
Nice Ltd.(a) | | | 342 | | | | 103,713 | |
NortonLifeLock, Inc. | | | 1,410 | | | | 36,632 | |
Nuance Communications, Inc.(a) | | | 310 | | | | 17,149 | |
Nutanix, Inc., Class A(a) | | | 626 | | | | 19,944 | |
ON24, Inc.(a) | | | 2,500 | | | | 43,375 | |
Oracle Corp. | | | 5,483 | | | | 478,172 | |
Oracle Financial Services Software Ltd. | | | 1,433 | | | | 76,135 | |
PagerDuty, Inc.(a) | | | 20,307 | | | | 705,668 | |
Palantir Technologies, Inc., Class A(a) | | | 6,056 | | | | 110,280 | |
Palo Alto Networks, Inc.(a) | | | 290 | | | | 161,460 | |
Paycom Software, Inc.(a) | | | 157 | | | | 65,185 | |
Paycor HCM, Inc.(a)(b) | | | 106 | | | | 3,054 | |
Paylocity Holding Corp.(a) | | | 308 | | | | 72,737 | |
Pegasystems, Inc. | | | 133 | | | | 14,872 | |
Ping Identity Holding Corp.(a) | | | 10,468 | | | | 239,508 | |
Procore Technologies, Inc.(a) | | | 32 | | | | 2,559 | |
Progress Software Corp. | | | 10,816 | | | | 522,088 | |
PROS Holdings, Inc.(a)(b) | | | 4,118 | | | | 142,030 | |
PTC, Inc.(a) | | | 351 | | | | 42,524 | |
Q2 Holdings, Inc.(a) | | | 1,324 | | | | 105,179 | |
Rapid7, Inc.(a)(b) | | | 6,005 | | | | 706,728 | |
RingCentral, Inc., Class A(a)(b) | | | 550 | | | | 103,043 | |
Riot Blockchain, Inc.(a)(b) | | | 3,461 | | | | 77,284 | |
Riskified Ltd.(a) | | | 2,548 | | | | 20,027 | |
Sage Group PLC | | | 2,024 | | | | 23,420 | |
SailPoint Technologies Holding, Inc.(a)(b) | | | 7,386 | | | | 357,039 | |
salesforce.com, Inc.(a) | | | 7,146 | | | | 1,816,013 | |
| | |
| 24 | | 2 0 2 1 BLACK ROCK ANNUAL REPORT TO SHAREHOLDERS |
| | |
Schedule of Investments (continued) December 31, 2021 | | Diversified Equity Master Portfolio (Percentages shown are based on Net Assets) |
| | | | | | | | |
| Security | | Shares | | | Value | |
| | |
Software (continued) | | | | | | | | |
SAP SE | | | 3,413 | | | $ | 480,344 | |
ServiceNow, Inc.(a) | | | 4,605 | | | | 2,989,152 | |
Sinch AB(a)(c) | | | 1,490 | | | | 18,801 | |
Smartsheet, Inc., Class A(a) | | | 390 | | | | 30,206 | |
Splunk, Inc.(a) | | | 425 | | | | 49,181 | |
Sprout Social, Inc., Class A(a) | | | 5,025 | | | | 455,717 | |
SPS Commerce, Inc.(a) | | | 2,377 | | | | 338,366 | |
SS&C Technologies Holdings, Inc. | | | 480 | | | | 39,350 | |
Sumo Logic, Inc.(a) | | | 8,020 | | | | 108,751 | |
Synchronoss Technologies, Inc.(a) | | | 11,580 | | | | 28,255 | |
Synopsys, Inc.(a) | | | 401 | | | | 147,769 | |
Temenos AG, Registered Shares | | | 216 | | | | 29,774 | |
Tenable Holdings, Inc.(a) | | | 10,642 | | | | 586,055 | |
Teradata Corp.(a)(b) | | | 354 | | | | 15,034 | |
Trade Desk, Inc., Class A(a) | | | 1,420 | | | | 130,129 | |
Trend Micro, Inc.(a) | | | 600 | | | | 33,310 | |
Tyler Technologies, Inc.(a) | | | 73 | | | | 39,270 | |
Unity Software, Inc.(a) | | | 495 | | | | 70,780 | |
Varonis Systems, Inc.(a) | | | 16,389 | | | | 799,455 | |
Viant Technology, Inc., Class A(a) | | | 1,855 | | | | 18,003 | |
VMware, Inc., Class A | | | 2,445 | | | | 283,327 | |
WiseTech Global Ltd. | | | 312 | | | | 13,232 | |
Workday, Inc., Class A(a) | | | 7,380 | | | | 2,016,068 | |
Workiva, Inc.(a) | | | 6,189 | | | | 807,603 | |
Xero Ltd.(a) | | | 461 | | | | 47,188 | |
Yext, Inc.(a) | | | 21,805 | | | | 216,306 | |
Zendesk, Inc.(a) | | | 405 | | | | 42,237 | |
Zoom Video Communications, Inc., Class A(a) | | | 762 | | | | 140,139 | |
Zscaler, Inc.(a) | | | 262 | | | | 84,188 | |
Zuora, Inc., Class A(a) | | | 12,067 | | | | 225,412 | |
| | | | | | | | |
| | |
| | | | | | | 52,580,995 | |
| | |
| Specialty Retail — 1.7% | | | | | | |
Aaron’s Co., Inc.(b) | | | 5,959 | | | | 146,889 | |
Abercrombie & Fitch Co., Class A(a) | | | 1,512 | | | | 52,663 | |
Abu Dhabi National Oil Co. for Distribution PJSC | | | 59,088 | | | | 68,691 | |
Academy Sports & Outdoors, Inc.(a) | | | 8,655 | | | | 379,955 | |
Advance Auto Parts, Inc. | | | 1,627 | | | | 390,285 | |
American Eagle Outfitters, Inc.(b) | | | 30,984 | | | | 784,515 | |
Asbury Automotive Group, Inc.(a)(b) | | | 2,084 | | | | 359,969 | |
AutoNation, Inc.(a) | | | 1,140 | | | | 133,209 | |
AutoZone, Inc.(a) | | | 43 | | | | 90,145 | |
Bath & Body Works, Inc. | | | 1,466 | | | | 102,312 | |
Bed Bath & Beyond, Inc.(a)(b) | | | 7,039 | | | | 102,629 | |
Best Buy Co., Inc. | | | 614 | | | | 62,382 | |
Big 5 Sporting Goods Corp. | | | 1,011 | | | | 19,219 | |
Boot Barn Holdings, Inc.(a) | | | 3,186 | | | | 392,037 | |
Buckle, Inc. | | | 3,785 | | | | 160,143 | |
Burlington Stores, Inc.(a) | | | 588 | | | | 171,408 | |
Camping World Holdings, Inc., Class A(b) | | | 3,654 | | | | 147,622 | |
CarMax, Inc.(a) | | | 388 | | | | 50,529 | |
Carvana Co.(a) | | | 228 | | | | 52,848 | |
Chico’s FAS, Inc.(a) | | | 9,133 | | | | 49,136 | |
China Yongda Automobiles Services Holdings Ltd. | | | 138,000 | | | | 184,918 | |
Citi Trends, Inc.(a)(b) | | | 953 | | | | 90,297 | |
Conn’s, Inc.(a)(b) | | | 10,438 | | | | 245,502 | |
Designer Brands, Inc., Class A(a) | | | 8,775 | | | | 124,693 | |
Dick’s Sporting Goods, Inc.(b) | | | 993 | | | | 114,185 | |
Fast Retailing Co. Ltd. | | | 200 | | | | 113,689 | |
Fawaz Abdulaziz Al Hokair & Co.(a) | | | 17,940 | | | | 74,285 | |
Five Below, Inc.(a) | | | 179 | | | | 37,033 | |
Floor & Decor Holdings, Inc., Class A(a) | | | 331 | | | | 43,033 | |
Foot Locker, Inc. | | | 2,579 | | | | 112,522 | |
| | | | | | | | |
| Security | | Shares | | | Value | |
| | |
Specialty Retail (continued) | | | | | | | | |
Foschini Group Ltd.(a) | | | 52,949 | | | $ | 411,696 | |
GameStop Corp., Class A(a)(b) | | | 209 | | | | 31,014 | |
Gap, Inc. | | | 654 | | | | 11,543 | |
Group 1 Automotive, Inc.(b) | | | 1,226 | | | | 239,340 | |
Guess?, Inc. | | | 3,470 | | | | 82,170 | |
H & M Hennes & Mauritz AB, B Shares | | | 4,993 | | | | 97,973 | |
Haverty Furniture Cos., Inc.(b) | | | 3,236 | | | | 98,925 | |
Hibbett, Inc.(b) | | | 1,443 | | | | 103,795 | |
Home Depot, Inc.(b) | | | 5,978 | | | | 2,480,930 | |
Home Product Center PCL, NVDR | | | 304,400 | | | | 132,056 | |
Industria de Diseno Textil SA | | | 4,432 | | | | 142,932 | |
JD Sports Fashion PLC | | | 3,590 | | | | 10,585 | |
JUMBO SA | | | 10,497 | | | | 150,581 | |
Kingfisher PLC | | | 3,904 | | | | 17,957 | |
Leslie’s, Inc.(a) | | | 432 | | | | 10,221 | |
Lithia Motors, Inc. | | | 1,028 | | | | 305,265 | |
Lowe’s Cos., Inc. | | | 3,569 | | | | 922,515 | |
MarineMax, Inc.(a) | | | 7,146 | | | | 421,900 | |
Mr Price Group Ltd. | | | 27,043 | | | | 339,166 | |
Murphy USA, Inc. | | | 339 | | | | 67,542 | |
National Vision Holdings, Inc.(a) | | | 7,894 | | | | 378,833 | |
Nitori Holdings Co. Ltd. | | | 200 | | | | 29,914 | |
O’Reilly Automotive, Inc.(a) | | | 142 | | | | 100,285 | |
Penske Automotive Group, Inc.(b) | | | 4,189 | | | | 449,145 | |
Pepkor Holdings Ltd.(a)(c) | | | 140,103 | | | | 192,460 | |
Petco Health & Wellness Co., Inc.(a)(b) | | | 3,202 | | | | 63,368 | |
Rent-A-Center, Inc. | | | 2,096 | | | | 100,692 | |
RH(a) | | | 56 | | | | 30,013 | |
Ross Stores, Inc. | | | 2,494 | | | | 285,014 | |
Shift Technologies, Inc.(a) | | | 3,044 | | | | 10,380 | |
Shinsegae International, Inc.(a) | | | 605 | | | | 73,872 | |
Shoe Carnival, Inc.(b) | | | 3,053 | | | | 119,311 | |
Signet Jewelers Ltd. | | | 5,305 | | | | 461,694 | |
Sleep Number Corp.(a) | | | 1,740 | | | | 133,284 | |
Sonic Automotive, Inc., Class A(b) | | | 10,860 | | | | 537,027 | |
Tilly’s, Inc., Class A | | | 4,559 | | | | 73,446 | |
TJX Cos., Inc. | | | 7,321 | | | | 555,810 | |
Tractor Supply Co. | | | 2,019 | | | | 481,733 | |
Truworths International Ltd. | | | 95,292 | | | | 312,457 | |
Ulta Beauty, Inc.(a) | | | 409 | | | | 168,647 | |
Urban Outfitters, Inc.(a) | | | 11,714 | | | | 343,923 | |
Victoria’s Secret & Co.(a) | | | 252 | | | | 13,996 | |
Vroom, Inc.(a)(b) | | | 374 | | | | 4,035 | |
Williams-Sonoma, Inc.(b) | | | 244 | | | | 41,268 | |
Zumiez, Inc.(a)(b) | | | 2,867 | | | | 137,587 | |
| | | | | | | | |
| | |
| | | | | | | 16,033,043 | |
|
| Technology Hardware, Storage & Peripherals — 4.1% | |
3D Systems Corp.(a)(b) | | | 7,515 | | | | 161,873 | |
Apple, Inc. | | | 122,052 | | | | 21,672,774 | |
Avid Technology, Inc.(a) | | | 957 | | | | 31,169 | |
Brother Industries Ltd. | | | 300 | | | | 5,782 | |
Canon, Inc.(b) | | | 2,200 | | | | 53,666 | |
Dell Technologies, Inc., Class C(a) | | | 36,453 | | | | 2,047,565 | |
FUJIFILM Holdings Corp. | | | 1,000 | | | | 74,134 | |
Hewlett Packard Enterprise Co. | | | 96,971 | | | | 1,529,233 | |
HP, Inc. | | | 4,943 | | | | 186,203 | |
Immersion Corp.(a)(b) | | | 2,838 | | | | 16,205 | |
Lenovo Group Ltd. | | | 762,000 | | | | 875,756 | |
Logitech International SA, Registered Shares | | | 82 | | | | 6,879 | |
Micro-Star International Co. Ltd. | | | 36,000 | | | | 208,511 | |
NetApp, Inc. | | | 8,666 | | | | 797,185 | |
Pure Storage, Inc., Class A(a) | | | 1,980 | | | | 64,449 | |
| | | | |
MASTER PORTFOLIO SCHEDULE OF INVESTMENTS | | | 25 | |
| | |
Schedule of Investments (continued) December 31, 2021 | | Diversified Equity Master Portfolio (Percentages shown are based on Net Assets) |
| | | | | | | | |
| Security | | Shares | | | Value | |
|
Technology Hardware, Storage & Peripherals (continued) | |
Quanta Computer, Inc. | | | 116,000 | | | $ | 396,166 | |
Ricoh Co. Ltd. | | | 1,200 | | | | 11,185 | |
Samsung Electronics Co. Ltd. | | | 152,070 | | | | 9,987,184 | |
Samsung Electronics Co. Ltd., Registered Shares, GDR | | | 122 | | | | 200,619 | |
Super Micro Computer, Inc.(a) | | | 5,116 | | | | 224,848 | |
Western Digital Corp.(a) | | | 8,271 | | | | 539,352 | |
Xerox Holdings Corp.(b) | | | 461 | | | | 10,437 | |
Xiaomi Corp., Class B(a)(c) | | | 223,400 | | | | 541,535 | |
| | | | | | | | |
| | |
| | | | | | | 39,642,710 | |
| | |
| Textiles, Apparel & Luxury Goods — 0.8% | | | | | | |
Adidas AG | | | 589 | | | | 169,600 | |
Aditya Birla Fashion and Retail Ltd.(a) | | | 17,890 | | | | 65,265 | |
Anta Sports Products Ltd. | | | 47,400 | | | | 711,869 | |
Bosideng International Holdings Ltd. | | | 174,000 | | | | 109,621 | |
Capri Holdings Ltd.(a) | | | 480 | | | | 31,157 | |
Carter’s, Inc. | | | 140 | | | | 14,171 | |
Columbia Sportswear Co. | | | 130 | | | | 12,667 | |
Crocs, Inc.(a) | | | 2,209 | | | | 283,238 | |
Culp, Inc. | | | 3,408 | | | | 32,410 | |
Deckers Outdoor Corp.(a) | | | 89 | | | | 32,602 | |
EssilorLuxottica SA | | | 861 | | | | 183,287 | |
Fossil Group, Inc.(a)(b) | | | 9,431 | | | | 97,045 | |
G-III Apparel Group Ltd.(a) | | | 1,093 | | | | 30,210 | |
Hanesbrands, Inc. | | | 1,128 | | | | 18,860 | |
Hermes International | | | 64 | | | | 111,832 | |
Kering SA | | | 170 | | | | 136,400 | |
Kontoor Brands, Inc.(b) | | | 4,611 | | | | 236,314 | |
Levi Strauss & Co., Class A | | | 7,797 | | | | 195,159 | |
Li Ning Co. Ltd. | | | 72,000 | | | | 789,842 | |
Lululemon Athletica, Inc.(a) | | | 1,209 | | | | 473,263 | |
LVMH Moet Hennessy Louis Vuitton SE | | | 775 | | | | 640,486 | |
Makalot Industrial Co. Ltd. | | | 11,000 | | | | 98,112 | |
NIKE, Inc., Class B | | | 7,928 | | | | 1,321,360 | |
Page Industries Ltd. | | | 134 | | | | 72,680 | |
Pandora A/S | | | 206 | | | | 25,625 | |
Puma SE | | | 455 | | | | 55,566 | |
PVH Corp. | | | 231 | | | | 24,636 | |
Ralph Lauren Corp. | | | 3,840 | | | | 456,422 | |
Shenzhou International Group Holdings Ltd. | | | 19,700 | | | | 381,464 | |
Skechers USA, Inc., Class A(a) | | | 428 | | | | 18,575 | |
Steven Madden Ltd. | | | 8,150 | | | | 378,730 | |
Tapestry, Inc. | | | 907 | | | | 36,824 | |
Titan Co. Ltd. | | | 11,103 | | | | 375,603 | |
Under Armour, Inc., Class A(a) | | | 612 | | | | 12,968 | |
Under Armour, Inc., Class C(a) | | | 644 | | | | 11,618 | |
VF Corp.(b) | | | 4,338 | | | | 317,628 | |
Xtep International Holdings Ltd. | | | 50,500 | | | | 84,248 | |
| | | | | | | | |
| | |
| | | | | | 8,047,357 | |
| | |
| Thrifts & Mortgage Finance — 0.6% | | | | | | |
Essent Group Ltd. | | | 22,886 | | | | 1,042,000 | |
Federal Agricultural Mortgage Corp., Class C | | | 5,999 | | | | 743,456 | |
Flagstar Bancorp, Inc. | | | 3,507 | | | | 168,126 | |
FS Bancorp, Inc. | | | 2,778 | | | | 93,424 | |
Housing Development Finance Corp. Ltd. | | | 46,277 | | | | 1,601,142 | |
Merchants Bancorp | | | 5,254 | | | | 248,672 | |
MGIC Investment Corp. | | | 1,098 | | | | 15,833 | |
New York Community Bancorp, Inc. | | | 1,467 | | | | 17,912 | |
NMI Holdings, Inc., Class A(a) | | | 4,847 | | | | 105,907 | |
OP Bancorp | | | 7,924 | | | | 101,110 | |
Premier Financial Corp. | | | 14,120 | | | | 436,449 | |
| | | | | | | | |
| Security | | Shares | | | Value | |
| | |
Thrifts & Mortgage Finance (continued) | | | | | | | | |
Radian Group, Inc. | | | 21,904 | | | $ | 462,831 | |
Riverview Bancorp, Inc. | | | 53,230 | | | | 409,339 | |
Rocket Cos., Inc., Class A(b) | | | 449 | | | | 6,286 | |
Southern Missouri Bancorp, Inc. | | | 4,471 | | | | 233,252 | |
TFS Financial Corp. | | | 160 | | | | 2,859 | |
UWM Holdings Corp.(b) | | | 294 | | | | 1,740 | |
Walker & Dunlop, Inc. | | | 1,901 | | | | 286,823 | |
Washington Federal, Inc. | | | 2,726 | | | | 90,994 | |
Western New England Bancorp, Inc. | | | 9,066 | | | | 79,418 | |
| | | | | | | | |
| | |
| | | | | | | 6,147,573 | |
| | |
| Tobacco — 0.1% | | | | | | |
ITC Ltd. | | | 185,851 | | | | 543,780 | |
KT&G Corp.(a) | | | 1,505 | | | | 99,989 | |
| | | | | | | | |
| | |
| | | | | | | 643,769 | |
| | |
| Trading Companies & Distributors — 0.7% | | | | | | |
Air Lease Corp. | | | 348 | | | | 15,392 | |
Applied Industrial Technologies, Inc. | | | 8,984 | | | | 922,657 | |
Ashtead Group PLC | | | 1,113 | | | | 89,724 | |
Boise Cascade Co. | | | 4,658 | | | | 331,650 | |
Bunzl PLC | | | 1,996 | | | | 77,974 | |
Core & Main, Inc., Class A(a)(b) | | | 111 | | | | 3,368 | |
Fastenal Co. | | | 3,614 | | | | 231,513 | |
Ferguson PLC | | | 300 | | | | 53,288 | |
GATX Corp.(b) | | | 1,917 | | | | 199,732 | |
GMS, Inc.(a) | | | 8,016 | | | | 481,842 | |
Herc Holdings, Inc. | | | 542 | | | | 84,850 | |
ITOCHU Corp. | | | 4,100 | | | | 125,435 | |
Karat Packaging, Inc.(a) | | | 3,924 | | | | 79,304 | |
Marubeni Corp. | | | 2,000 | | | | 19,486 | |
Mitsubishi Corp. | | | 3,700 | | | | 117,486 | |
Mitsui & Co. Ltd. | | | 4,300 | | | | 101,901 | |
MonotaRO Co. Ltd. | | | 1,600 | | | | 28,778 | |
MRC Global, Inc.(a) | | | 19,456 | | | | 133,857 | |
MSC Industrial Direct Co., Inc., Class A | | | 146 | | | | 12,273 | |
NOW, Inc.(a) | | | 3,794 | | | | 32,401 | |
Rush Enterprises, Inc., Class A | | | 6,729 | | | | 374,402 | |
SiteOne Landscape Supply, Inc.(a)(b) | | | 8,060 | | | | 1,952,777 | |
Sumitomo Corp. | | | 4,500 | | | | 66,597 | |
Titan Machinery, Inc.(a) | | | 3,638 | | | | 122,564 | |
Toyota Tsusho Corp. | | | 300 | | | | 13,829 | |
Triton International Ltd. | | | 2,952 | | | | 177,799 | |
United Rentals, Inc.(a)(b) | | | 487 | | | | 161,825 | |
Univar Solutions, Inc.(a) | | | 544 | | | | 15,422 | |
Veritiv Corp.(a) | | | 496 | | | | 60,795 | |
W.W. Grainger, Inc. | | | 377 | | | | 195,376 | |
Watsco, Inc. | | | 106 | | | | 33,165 | |
WESCO International, Inc.(a) | | | 3,183 | | | | 418,851 | |
| | | | | | | | |
| | |
| | | | | | | 6,736,313 | |
| | |
| Transportation Infrastructure — 0.1% | | | | | | |
Auckland International Airport Ltd.(a) | | | 7,773 | | | | 40,916 | |
Grupo Aeroportuario del Centro Norte SAB de C.V., ADR(a) | | | 2,292 | | | | 123,057 | |
International Container Terminal Services, Inc. | | | 80,060 | | | | 314,007 | |
Malaysia Airports Holdings Bhd(a) | | | 12,800 | | | | 18,372 | |
Shenzhen International Holdings Ltd. | | | 160,500 | | | | 166,733 | |
Sydney Airport(a) | | | 2,997 | | | | 18,921 | |
Transurban Group | | | 12,461 | | | | 125,162 | |
Westports Holdings Bhd | | | 73,400 | | | | 71,356 | |
| | | | | | | | |
| | |
| | | | | | | 878,524 | |
| | |
| Water Utilities — 0.2% | | | | | | |
Aclara Resources, Inc.(a) | | | 7,206 | | | | 8,209 | |
| | |
| 26 | | 2 0 2 1 BLACK ROCK ANNUAL REPORT TO SHAREHOLDERS |
| | |
Schedule of Investments (continued) December 31, 2021 | | Diversified Equity Master Portfolio (Percentages shown are based on Net Assets) |
| | | | | | | | |
| Security | | Shares | | | Value | |
| | |
Water Utilities (continued) | | | | | | | | |
American Water Works Co., Inc. | | | 3,527 | | | $ | 666,109 | |
Cia de Saneamento de Minas Gerais-COPASA | | | 125,883 | | | | 286,803 | |
Essential Utilities, Inc. | | | 5,582 | | | | 299,698 | |
Severn Trent PLC | | | 4,493 | | | | 179,414 | |
United Utilities Group PLC | | | 10,292 | | | | 151,863 | |
| | | | | | | | |
| | |
| | | | | | | 1,592,096 | |
| |
| Wireless Telecommunication Services — 0.4% | | | | |
Bharti Airtel Ltd.(a) | | | 64,644 | | | | 593,746 | |
Etihad Etisalat Co. | | | 36,073 | | | | 299,207 | |
Far EasTone Telecommunications Co. Ltd. | | | 87,000 | | | | 202,963 | |
KDDI Corp. | | | 4,000 | | | | 116,975 | |
MTN Group Ltd.(a) | | | 40,396 | | | | 433,003 | |
SK Telecom Co. Ltd. | | | 762 | | | | 37,030 | |
SK Telecom Co. Ltd., ADR(b) | | | 5,886 | | | | 156,980 | |
Softbank Corp. | | | 7,700 | | | | 97,255 | |
SoftBank Group Corp. | | | 3,000 | | | | 143,820 | |
Taiwan Mobile Co. Ltd. | | | 66,000 | | | | 238,361 | |
Tele2 AB, B Shares | | | 1,855 | | | | 26,463 | |
Telephone & Data Systems, Inc. | | | 1,287 | | | | 25,933 | |
T-Mobile US, Inc.(a) | | | 1,879 | | | | 217,926 | |
Turkcell Iletisim Hizmetleri A/S | | | 48,794 | | | | 68,088 | |
United States Cellular Corp.(a) | | | 15,346 | | | | 483,706 | |
Vodacom Group Ltd. | | | 29,054 | | | | 245,243 | |
Vodafone Group PLC | | | 81,981 | | | | 123,483 | |
| | | | | | | | |
| | |
| | | | | | 3,510,182 | |
| | | | | | | | |
| |
Total Common Stocks — 85.9%
(Cost: $649,943,838) | | | | 822,949,876 | |
| | | | | | | | |
| |
Preferred Securities | | | | | |
| | |
Preferred Stocks — 0.4% | | | | | | | | |
| | |
| Airlines — 0.0% | | | | | | |
Azul SA, Preference Shares(a) | | | 12,300 | | | | 53,821 | |
| | | | | | | | |
| | |
| Automobiles — 0.1% | | | | | | |
Bayerische Motoren Werke AG, Preference Shares | | | 339 | | | | 28,112 | |
Porsche Automobil Holding SE, Preference Shares | | | 632 | | | | 59,669 | |
Volkswagen AG, Preference Shares | | | 534 | | | | 107,271 | |
| | | | | | | | |
| | |
| | | | | | 195,052 | |
| | |
| Banks — 0.2% | | | | | | |
Banco Bradesco SA, Preference Shares | | | 453,183 | | | | 1,571,099 | |
Itau Unibanco Holding SA, Preference Shares | | | 130,698 | | | | 492,553 | |
| | | | | | | | |
| | |
| | | | | | 2,063,652 | |
| |
| Health Care Equipment & Supplies — 0.0% | | | | |
Sartorius AG, Preference Shares | | | 123 | | | | 83,190 | |
| | | | | | | | |
| | |
| Metals & Mining — 0.0% | | | | | | |
Gerdau SA, Preference Shares | | | 32,094 | | | | 157,768 | |
| | | | | | | | |
| | | | | | | | |
| Security | | Shares | | | Value | |
| |
Oil, Gas & Consumable Fuels — 0.1% | | | | | |
Petroleo Brasileiro SA, Preference Shares | | | 109,861 | | | $ | 558,109 | |
| | | | | | | | |
| |
| Real Estate Management & Development — 0.0% | | | | |
Brookfield Property Preferred LP(a) | | | 7 | | | | 183 | |
| | | | | | | | |
| |
| Trading Companies & Distributors — 0.0% | | | | |
WESCO International, Inc.(a)(e) | | | 1,463 | | | | 44,841 | |
| | | | | | | | |
| |
Total Preferred Stocks — 0.4% | | | | 3,156,616 | |
| | | | | | | | |
| |
Total Preferred Securities — 0.4%
(Cost: $3,146,021) | | | | 3,156,616 | |
| | | | | | | | |
| |
Rights | | | | | |
| |
Metals & Mining — 0.0% | | | | | |
Pan American Silver Corp., (Expires 02/22/29)(a) | | | 16,660 | | | | 12,973 | |
| | | | | | | | |
| |
Total Rights — 0.0%
(Cost: $3,539) | | | 12,973 | |
| | | | | | | | |
| |
Total Long-Term Investments — 86.3%
(Cost: $653,093,398) | | | 826,119,465 | |
| | | | | | | | |
| |
Short-Term Securities | | | | | |
| |
Money Market Funds — 16.8% | | | | | |
BlackRock Cash Funds: Institutional, SL Agency Shares, 0.10%(f)(g)(h) | | | 48,706,998 | | | | 48,721,610 | |
BlackRock Cash Funds: Treasury, SL Agency Shares, 0.01%(f)(g) | | | 112,285,491 | | | | 112,285,491 | |
| | | | | | | | |
| |
Total Short-Term Securities — 16.8%
(Cost: $160,999,092) | | | 161,007,101 | |
| | | | | | | | |
| |
Total Investments — 103.1%
(Cost: $814,092,490) | | | 987,126,566 | |
| |
Liabilities in Excess of Other Assets — (3.1)% | | | | (29,284,870 | ) |
| | | | | | | | |
| |
Net Assets — 100.0% | | | $ | 957,841,696 | |
| | | | | | | | |
| (a) | Non-income producing security. |
| (b) | All or a portion of this security is on loan. |
| (c) | Security exempt from registration pursuant to Rule 144A under the Securities Act of 1933, as amended. These securities may be resold in transactions exempt from registration to qualified institutional investors. |
| (d) | Security is valued using significant unobservable inputs and is classified as Level 3 in the fair value hierarchy. |
| (e) | Variable rate security. Interest rate resets periodically. The rate shown is the effective interest rate as of period end. Security description also includes the reference rate and spread if published and available. |
| (f) | Affiliate of the Master Portfolio. |
| (g) | Annualized 7-day yield as of period end. |
| (h) | All or a portion of this security was purchased with the cash collateral from loaned securities. |
For Master Portfolio compliance purposes, the Master Portfolio’s industry classifications refer to one or more of the industry sub-classifications used by one or more widely recognized market indexes or rating group indexes, and/or as defined by the investment adviser. These definitions may not apply for purposes of this report, which may combine such industry sub-classifications for reporting ease.
| | |
MASTER PORTFOLIO SCHEDULE OF INVESTMENTS | | 27 |
| | |
Schedule of Investments (continued) December 31, 2021 | | Diversified Equity Master Portfolio |
Affiliates
Investments in issuers considered to be affiliate(s) of the Master Portfolio during the year ended December 31, 2021 for purposes of Section 2(a)(3) of the Investment Company Act of 1940, as amended, were as follows:
| | | | | | | | | | | | | | | | | | | | | | | | | | | | | | | | | | | | |
| | | | | | | | | | |
| Affiliated Issuer | | Value at 12/31/20 | | | Purchases at Cost | | | Proceeds from Sales | | | Net
Realized
Gain (Loss) | | | Change in Unrealized Appreciation (Depreciation) | | | Value at 12/31/21 | | | Shares Held at 12/31/21 | | | Income | | | Capital Gain Distributions from Underlying Funds | |
| | | | | | | | | |
BlackRock Cash Funds: Institutional, SL Agency Shares | | $ | 35,734,117 | | | $ | 13,001,733 | (a) | | $ | — | | | $ | (7,489 | ) | | $ | (6,751 | ) | | $ | 48,721,610 | | | | 48,706,998 | | | $ | 149,277 | (b) | | $ | — | |
BlackRock Cash Funds: Treasury, SL Agency Shares | | | 27,191,885 | | | | 85,093,606 | (a) | | | — | | | | — | | | | — | | | | 112,285,491 | | | | 112,285,491 | | | | 8,053 | | | | — | |
| | | | | | | | | | | | | | | | | | | | | | | | | | | | | | | | | | | | |
| | | | | | | | | |
| | | | | | | | | | | | | | $ | (7,489 | ) | | $ | (6,751 | ) | | $ | 161,007,101 | | | | | | | $ | 157,330 | | | $ | — | |
| | | | | | | | | | | | | | | | | | | | | | | | | | | | | | | | | | | | |
| | (a) | Represents net amount purchased (sold). | |
| | (b) | All or a portion represents securities lending income earned from the reinvestment of cash collateral from loaned securities, net of fees and collateral investment expenses, and other payments to and from borrowers of securities. | |
Derivative Financial Instruments Outstanding as of Period End
Futures Contracts
| | | | | | | | | | | | | | | | |
| | | | | |
| Description | | Number of Contracts | | | Expiration
Date | | | Notional
Amount (000) | | | Value/ Unrealized Appreciation (Depreciation) | |
| | | | |
Long Contracts | | | | | | | | | | | | | | | | |
MSCI Emerging Markets Index | | | 73 | | | | 03/18/22 | | | $ | 4,476 | | | $ | 33,829 | |
Russell 2000 E-Mini Index | | | 15 | | | | 03/18/22 | | | | 1,682 | | | | 6,847 | |
S&P 500 E-Mini Index | | | 106 | | | | 03/18/22 | | | | 25,220 | | | | 204,708 | |
| | | | | | | | | | | | | | | | |
| | | | |
| | | | | | | | | | | | | | | 245,384 | |
| | | | | | | | | | | | | | | | |
Short Contracts | | | | | | | | | | | | | | | | |
MSCI EAFE Index | | | 418 | | | | 03/18/22 | | | | 48,526 | | | | (679,572 | ) |
MSCI Emerging Markets Index | | | 1,331 | | | | 03/18/22 | | | | 81,610 | | | | (194,024 | ) |
Russell 2000 E-Mini Index | | | 1,825 | | | | 03/18/22 | | | | 204,656 | | | | (3,124,536 | ) |
| | | | | | | | | | | | | | | | |
| | | | |
| | | | | | | | | | | | | | | (3,998,132 | ) |
| | | | | | | | | | | | | | | | |
| | | | |
| | | | | | | | | | | | | | $ | (3,752,748 | ) |
| | | | | | | | | | | | | | | | |
Forward Foreign Currency Exchange Contracts
| | | | | | | | | | | | | | | | | | | | |
| | | | | |
| Currency Purchased | | | Currency Sold | | | Counterparty | | Settlement Date | | | Unrealized
Appreciation
(Depreciation) | |
| | | | | | |
| AUD | | | 809,000 | | | USD | | | 575,794 | | | Bank of America N.A. | | | 03/16/22 | | | $ | 12,896 | |
| CHF | | | 583,000 | | | USD | | | 632,629 | | | Bank of America N.A. | | | 03/16/22 | | | | 8,378 | |
| CHF | | | 252,000 | | | USD | | | 274,942 | | | Goldman Sachs International | | | 03/16/22 | | | | 2,131 | |
| GBP | | | 540,000 | | | USD | | | 717,582 | | | Bank of America N.A. | | | 03/16/22 | | | | 13,113 | |
| NZD | | | 118,000 | | | USD | | | 80,316 | | | Morgan Stanley & Co. International PLC | | | 03/16/22 | | | | 415 | |
| SEK | | | 1,101,000 | | | USD | | | 121,661 | | | Barclays Bank PLC | | | 03/16/22 | | | | 254 | |
| SGD | | | 165,000 | | | USD | | | 120,823 | | | BNP Paribas SA | | | 03/16/22 | | | | 1,571 | |
| | | | | | |
| | | | | | | | | | | | | | | | | | | 38,758 | |
| JPY | | | 60,541,000 | | | USD | | | 537,536 | | | Bank of America N.A. | | | 03/16/22 | | | | (10,930 | ) |
| USD | | | 890,061 | | | AUD | | | 1,249,000 | | | Bank of America N.A. | | | 03/16/22 | | | | (18,807 | ) |
| USD | | | 138,983 | | | CAD | | | 178,000 | | | Bank of America N.A. | | | 03/16/22 | | | | (1,713 | ) |
| USD | | | 1,042,144 | | | EUR | | | 918,000 | | | Bank of America N.A. | | | 03/16/22 | | | | (4,535 | ) |
| USD | | | 24,231 | | | NOK | | | 221,000 | | | Bank of America N.A. | | | 03/16/22 | | | | (830 | ) |
| USD | | | 591,939 | | | SEK | | | 5,376,000 | | | Morgan Stanley & Co. International PLC | | | 03/16/22 | | | | (3,352 | ) |
| | | | | | | | | | | | | | | | | | | | |
| | | | | | |
| | | | | | | | | | | | | | | | | | | (40,167 | ) |
| | | | | | | | | | | | | | | | | | | | |
| | | | | | |
| | | | | | | | | | | | | | | | | | $ | (1,409 | ) |
| | | | | | | | | | | | | | | | | | | | |
| | |
| 28 | | 2 0 2 1 BLACK ROCK ANNUAL REPORT TO SHAREHOLDERS |
| | |
Schedule of Investments (continued) December 31, 2021 | | Diversified Equity Master Portfolio |
OTC Total Return Swaps
| | | | | | | | | | | | | | | | | | | | | | | | | | | | | | | | | | | | | | |
| | | | | | | | | | | | | |
| | | | | | | | | | | | | | | | | | | | | | | | | | | | | | Upfront | | | | | |
| | Paid by the Master Portfolio | | | | | | Received by the Master Portfolio | | | | | | | | | | | | | | | | | | Premium | | | | Unrealized | |
| | Rate/Reference | | Frequency | | | | | | Rate/Reference | | Frequency | | Counterparty | | Effective Date | | Termination Date | | | Notional Amount (000) | | | Value | | | Paid (Received) | | | Appreciation
Depreciation | |
| | | | | | | | | | | | | | |
| | MSCI Emerging Markets | | Quarterly | | | | | | 3-Month LIBOR minus
0.17%, 0.21% | | Quarterly | | Goldman Sachs International | | N/A | | | 05/04/22 | | | USD | | | 34,651 | | | $ | 890,498 | | | $ | — | | | $ | 890,498 | |
| | 1-Day SOFR plus 0.55%, 0.05% | | Quarterly | | | | | | Russell 1000 Index | | Quarterly | | Goldman Sachs International | | N/A | | | 05/04/22 | | | USD | | | 141,182 | | | | 1,313,342 | | | | — | | | | 1,313,342 | |
| | 1-Day SOFR plus 0.61%, 0.05% | | Quarterly | | | | | | Russell 1000 Index | | Quarterly | | Merrill Lynch International | | N/A | | | 05/04/22 | | | USD | | | 140,875 | | | | 1,701,924 | | | | — | | | | 1,701,924 | |
| | 1-Day SOFR plus 0.63%, 0.05% | | Quarterly | | | | | | Russell 1000 Index | | Quarterly | | Citibank N.A. | | N/A | | | 05/04/22 | | | USD | | | 140,875 | | | | 1,700,749 | | | | — | | | | 1,700,749 | |
| | MSCI Emerging Markets | | Quarterly | | | | | | 1-Day SOFR plus 0.17%, 0.05% | | Quarterly | | JPMorgan Chase Bank N.A. | | N/A | | | 11/08/22 | | | USD | | | 34,977 | | | | 924,171 | | | | — | | | | 924,171 | |
| | MSCI Emerging Markets | | Quarterly | | | | | | 1-Day SOFR plus 0.18%, 0.05% | | Quarterly | | Merrill Lynch International | | N/A | | | 11/08/22 | | | USD | | | 34,182 | | | | 121,995 | | | | — | | | | 121,995 | |
| | MSCI Emerging Markets | | Quarterly | | | | | | 1-Day SOFR plus 0.22%, 0.05% | | Quarterly | | Citibank N.A. | | N/A | | | 11/08/22 | | | USD | | | 34,182 | | | | 122,565 | | | | — | | | | 122,565 | |
| | 1-Day SOFR plus 0.51%, 0.05% | | Quarterly | | | | | | Russell 1000 Index | | Quarterly | | JPMorgan Chase Bank N.A. | | N/A | | | 11/08/22 | | | USD | | | 141,836 | | | | 671,043 | | | | — | | | | 671,043 | |
| | | | | | | | | | | | | | | | | | | | | | | | | | | | | | | | | | | | | | |
| | | | | | | | | | | | | | |
| | | | | | | | | | | | | | | | | | | | | | | | | | | | $ | 7,446,287 | | | $ | — | | | $ | 7,446,287 | |
| | | | | | | | | | | | | | | | | | | | | | | | | | | | | | | | | | | | | | |
Balances Reported in the Statement of Assets and Liabilities for OTC Swaps
| | | | | | | | | | | | | | | | |
| | | | | |
| Description | | Swap
Premiums
Paid | | | Swap
Premiums
Received | | | Unrealized
Appreciation
| | | Unrealized
Depreciation
| |
| | | | |
OTC Swaps | | $ | — | | | $ | — | | | $ | 7,446,287 | | | $ | — | |
Derivative Financial Instruments Categorized by Risk Exposure
As of period end, the fair values of derivative financial instruments located in the Statement of Assets and Liabilities were as follows:
| | | | | | | | | | | | | | | | | | | | | | | | | | | | |
| | | | | | | | |
| | | Commodity Contracts | | | Credit
Contracts | | | Equity
Contracts | | | Foreign Currency Exchange Contracts | | | Interest Rate Contracts | | | Other Contracts | | | Total | |
| | | | | | | |
Assets — Derivative Financial Instruments | | | | | | | | | | | | | | | | | | | | | | | | | | | | |
Futures contracts | | | | | | | | | | | | | | | | | | | | | | | | | | | | |
Unrealized appreciation on futures contracts(a) | | $ | — | | | $ | — | | | $ | 245,384 | | | $ | — | | | $ | — | | | $ | — | | | $ | 245,384 | |
Forward foreign currency exchange contracts | | | | | | | | | | | | | | | | | | | | | | | | | | | | |
Unrealized appreciation on forward foreign currency exchange contracts | | | — | | | | — | | | | — | | | | 38,758 | | | | — | | | | — | | | | 38,758 | |
Swaps — OTC | | | | | | | | | | | | | | | | | | | | | | | | | | | | |
Unrealized appreciation on OTC swaps; Swap premiums paid | | | — | | | | — | | | | 7,446,287 | | | | — | | | | — | | | | — | | | | 7,446,287 | |
| | | | | | | | | | | | | | | | | | | | | | | | | | | | |
| | | | | | | |
| | $ | — | | | $ | — | | | $ | 7,691,671 | | | $ | 38,758 | | | $ | — | | | $ | — | | | $ | 7,730,429 | |
| | | | | | | | | | | | | | | | | | | | | | | | | | | | |
| | | | | | | |
Liabilities — Derivative Financial Instruments | | | | | | | | | | | | | | | | | | | | | | | | | | | | |
Futures contracts | | | | | | | | | | | | | | | | | | | | | | | | | | | | |
Unrealized depreciation on futures contracts(a) | | $ | — | | | $ | — | | | $ | 3,998,132 | | | $ | — | | | $ | — | | | $ | — | | | $ | 3,998,132 | |
Forward foreign currency exchange contracts | | | | | | | | | | | | | | | | | | | | | | | | | | | | |
Unrealized depreciation on forward foreign currency exchange contracts | | | — | | | | — | | | | — | | | | 40,167 | | | | — | | | | — | | | | 40,167 | |
| | | | | | | | | | | | | | | | | | | | | | | | | | | | |
| | | | | | | |
| | $ | — | | | $ | — | | | $ | 3,998,132 | | | $ | 40,167 | | | $ | — | | | $ | — | | | $ | 4,038,299 | |
| | | | | | | | | | | | | | | | | | | | | | | | | | | | |
| | (a) | Net cumulative unrealized appreciation (depreciation) on futures contracts and centrally cleared swaps, if any, are reported in the Master Portfolio Schedule of Investments. In the Statement of Assets and Liabilities, only current day’s variation margin is reported in receivables or payables and the net cumulative unrealized appreciation (depreciation) is included in net unrealized appreciation (depreciation). | |
| | |
MASTER PORTFOLIO SCHEDULE OF INVESTMENTS | | 29 |
| | |
Schedule of Investments (continued) December 31, 2021 | | Diversified Equity Master Portfolio |
For the period ended December 31, 2021, the effect of derivative financial instruments in the Statement of Operations was as follows:
| | | | | | | | | | | | | | | | | | | | | | | | | | | | |
| | | | | | | | |
| | | Commodity Contracts | | | Credit Contracts | | | Equity Contracts | | | Foreign Currency Exchange Contracts | | | Interest Rate Contracts | | | Other Contracts | | | Total | |
| | | | | | | |
Net Realized Gain (Loss) from: | | | | | | | | | | | | | | | | | | | | | | | | | | | | |
Futures contracts | | $ | — | | | $ | — | | | $ | 2,353,768 | | | $ | — | | | $ | — | | | $ | — | | | $ | 2,353,768 | |
Forward foreign currency exchange contracts | | | — | | | | — | | | | — | | | | 103,461 | | | | — | | | | — | | | | 103,461 | |
Swaps | | | — | | | | — | | | | 97,230,853 | | | | — | | | | — | | | | — | | | | 97,230,853 | |
| | | | | | | | | | | | | | | | | | | | | | | | | | | | |
| | | | | | | |
| | $ | — | | | $ | — | | | $ | 99,584,621 | | | $ | 103,461 | | | $ | — | | | $ | — | | | $ | 99,688,082 | |
| | | | | | | | | | | | | | | | | | | | | | | | | | | | |
| | | | | | | |
Net Change in Unrealized Appreciation (Depreciation) on: | | | | | | | | | | | | | | | | | | | | | | | | | | | | |
Futures contracts | | $ | — | | | $ | — | | | $ | (4,824,440 | ) | | $ | — | | | $ | — | | | $ | — | | | $ | (4,824,440 | ) |
Forward foreign currency exchange contracts | | | — | | | | — | | | | — | | | | (41,393 | ) | | | — | | | | — | | | | (41,393 | ) |
Swaps | | | — | | | | — | | | | 7,446,287 | | | | — | | | | — | | | | — | | | | 7,446,287 | |
| | | | | | | | | | | | | | | | | | | | | | | | | | | | |
| | | | | | | |
| | $ | — | | | $ | — | | | $ | 2,621,847 | | | $ | (41,393 | ) | | $ | — | | | $ | — | | | $ | 2,580,454 | |
| | | | | | | | | | | | | | | | | | | | | | | | | | | | |
Average Quarterly Balances of Outstanding Derivative Financial Instruments
| | | | |
| | |
Futures contracts: | | | | |
Average notional value of contracts — long | | $ | 29,888,711 | |
Average notional value of contracts — short | | $ | 288,488,405 | |
Forward foreign currency exchange contracts: | | | | |
Average amounts purchased — in USD | | $ | 2,752,638 | |
Average amounts sold — in USD | | $ | 2,905,465 | |
Total return swaps: | | | | |
Average notional value | | $ | 662,467,647 | |
For more information about the Master Portfolio’s investment risks regarding derivative financial instruments, refer to the Notes to Financial Statements.
Derivative Financial Instruments — Offsetting as of Period End
The Master Portfolio’s derivative assets and liabilities (by type) were as follows:
| | | | | | | | |
| | | |
| | | Assets | | | Liabilities | |
| | |
Derivative Financial Instruments | | | | | | | | |
Futures contracts | | $ | 867,145 | | | $ | 101,523 | |
Forward foreign currency exchange contracts | | | 38,758 | | | | 40,167 | |
Swaps — OTC(a) | | | 7,446,287 | | | | — | |
| | | | | | | | |
| | |
Total derivative assets and liabilities in the Statement of Assets and Liabilities | | | 8,352,190 | | | | 141,690 | |
| | | | | | | | |
| | |
Derivatives not subject to a Master Netting Agreement or similar agreement (“MNA”) | | | (867,145 | ) | | | (101,523 | ) |
| | | | | | | | |
| | |
Total derivative assets and liabilities subject to an MNA | | $ | 7,485,045 | | | $ | 40,167 | |
| | | | | | | | |
| | (a) | Includes unrealized appreciation (depreciation) on OTC swaps and swap premiums (paid/received) in the Statement of Assets and Liabilities. | |
The following table presents the Master Portfolio’s derivative assets and liabilities by counterparty net of amounts available for offset under an MNA and net of the related collateral received (and pledged) by the Master Portfolio:
| | | | | | | | | | | | | | | | | | | | |
| | | | | | |
| Counterparty | |
| Derivative
Assets Subject to an MNA by Counterparty |
| |
| Derivatives
Available for Offset |
(a) | |
| Non-Cash
Collateral Received |
| |
| Cash
Collateral Received |
(b) | |
| Net Amount
of Derivative Assets |
(c) |
| | | | | |
Bank of America N.A. | | $ | 34,387 | | | $ | (34,387 | ) | | $ | — | | | $ | — | | | $ | — | |
Barclays Bank PLC | | | 254 | | | | — | | | | — | | | | — | | | | 254 | |
BNP Paribas SA | | | 1,571 | | | | — | | | | — | | | | — | | | | 1,571 | |
Citibank N.A. | | | 1,823,314 | | | | — | | | | — | | | | (1,823,314 | ) | | | — | |
Goldman Sachs International | | | 2,205,971 | | | | — | | | | — | | | | (2,205,971 | ) | | | — | |
JPMorgan Chase Bank N.A. | | | 1,595,214 | | | | — | | | | — | | | | (1,595,214 | ) | | | — | |
Merrill Lynch International | | | 1,823,919 | | | | — | | | | — | | | | (1,823,919 | ) | | | — | |
Morgan Stanley & Co. International PLC | | | 415 | | | | (415 | ) | | | — | | | | — | | | | — | |
| | | | | | | | | | | | | | | | | | | | |
| | | | | |
| | $ | 7,485,045 | | | $ | (34,802 | ) | | $ | — | | | $ | (7,448,418 | ) | | $ | 1,825 | |
| | | | | | | | | | | | | | | | | | | | |
| | |
| 30 | | 2 0 2 1 BLACK ROCK ANNUAL REPORT TO SHAREHOLDERS |
| | |
Schedule of Investments (continued) December 31, 2021 | | Diversified Equity Master Portfolio |
| | | | | | | | | | | | | | | | | | | | |
| | | | | | |
| Counterparty | |
| Derivative
Liabilities Subject to an MNA by Counterparty |
| |
| Derivatives
Available for Offset |
(a) | |
| Non-Cash
Collateral Pledged |
| |
| Cash
Collateral Pledged |
| |
| Net Amount
of Derivative Liabilities |
(d)(e) |
| | | | | |
Bank of America N.A. | | $ | 36,815 | | | $ | (34,387 | ) | | $ | — | | | $ | — | | | $ | 2,428 | |
Morgan Stanley & Co. International PLC | | | 3,352 | | | | (415 | ) | | | — | | | | — | | | | 2,937 | |
| | | | | | | | | | | | | | | | | | | | |
| | | | | |
| | $ | 40,167 | | | $ | (34,802 | ) | | $ | — | | | $ | — | | | $ | 5,365 | |
| | | | | | | | | | | | | | | | | | | | |
| | (a) | The amount of derivatives available for offset is limited to the amount of derivative asset and/or liabilities that are subject to an MNA. | |
| | (b) | Excess of collateral received from the individual counterparty is not shown for financial reporting purposes. | |
| | (c) | Net amount represents the net amount receivable from the counterparty in the event of default. | |
| | (d) | Net amount may also include forward foreign currency exchange contracts that are not required to be collateralized. | |
| | (e) | Net amount represents the net amount payable due to counterparty in the event of default. | |
Fair Value Hierarchy as of Period End
Various inputs are used in determining the fair value of financial instruments. For a description of the input levels and information about the Master Portfolio’s policy regarding valuation of financial instruments, refer to the Notes to Financial Statements.
The following table summarizes the Master Portfolio’s financial instruments categorized in the fair value hierarchy. The breakdown of the Master Portfolio’s financial instruments into major categories is disclosed in the Schedule of Investments above.
| | | | | | | | | | | | | | | | |
| | | | | |
| | | Level 1 | | | Level 2 | | | Level 3 | | | Total | |
| | | | |
Assets | | | | | | | | | | | | | | | | |
Investments | | | | | | | | | | | | | | | | |
Long-Term Investments | | | | | | | | | | | | | | | | |
Common Stocks | | | | | | | | | | | | | | | | |
Aerospace & Defense | | $ | 3,220,000 | | | $ | 216,424 | | | $ | — | | | $ | 3,436,424 | |
Air Freight & Logistics | | | 5,234,360 | | | | 694,009 | | | | — | | | | 5,928,369 | |
Airlines | | | 743,879 | | | | 464,268 | | | | — | | | | 1,208,147 | |
Auto Components | | | 4,170,287 | | | | 1,294,683 | | | | — | | | | 5,464,970 | |
Automobiles | | | 10,429,891 | | | | 5,015,329 | | | | — | | | | 15,445,220 | |
Banks | | | 32,364,634 | | | | 27,326,507 | | | | — | | | | 59,691,141 | |
Beverages | | | 5,625,894 | | | | 3,427,958 | | | | — | | | | 9,053,852 | |
Biotechnology | | | 22,950,836 | | | | 1,482,786 | | | | 3,470 | | | | 24,437,092 | |
Building Products | | | 6,649,181 | | | | 1,066,803 | | | | — | | | | 7,715,984 | |
Capital Markets | | | 14,388,928 | | | | 3,276,757 | | | | — | | | | 17,665,685 | |
Chemicals | | | 7,699,068 | | | | 9,377,823 | | | | — | | | | 17,076,891 | |
Commercial Services & Supplies | | | 3,598,627 | | | | 651,470 | | | | — | | | | 4,250,097 | |
Communications Equipment | | | 2,255,795 | | | | 489,666 | | | | — | | | | 2,745,461 | |
Construction & Engineering | | | 4,884,034 | | | | 787,633 | | | | — | | | | 5,671,667 | |
Construction Materials | | | 1,882,853 | | | | 2,255,138 | | | | — | | | | 4,137,991 | |
Consumer Finance | | | 5,553,158 | | | | 669,922 | | | | — | | | | 6,223,080 | |
Containers & Packaging | | | 2,118,456 | | | | 491,582 | | | | — | | | | 2,610,038 | |
Distributors | | | 683,870 | | | | — | | | | — | | | | 683,870 | |
Diversified Consumer Services | | | 2,381,644 | | | | 10,581 | | | | — | | | | 2,392,225 | |
Diversified Financial Services | | | 5,316,955 | | | | 1,830,437 | | | | — | | | | 7,147,392 | |
Diversified Telecommunication Services | | | 2,946,316 | | | | 1,499,314 | | | | — | | | | 4,445,630 | |
Electric Utilities | | | 6,737,101 | | | | 3,505,369 | | | | — | | | | 10,242,470 | |
Electrical Equipment | | | 2,206,782 | | | | 3,449,983 | | | | — | | | | 5,656,765 | |
Electronic Equipment, Instruments & Components | | | 5,564,195 | | | | 6,385,081 | | | | — | | | | 11,949,276 | |
Energy Equipment & Services | | | 3,942,285 | | | | — | | | | — | | | | 3,942,285 | |
Entertainment | | | 7,195,380 | | | | 2,309,652 | | | | — | | | | 9,505,032 | |
Equity Real Estate Investment Trusts (REITs) | | | 22,814,058 | | | | 824,741 | | | | — | | | | 23,638,799 | |
Food & Staples Retailing | | | 8,481,914 | | | | 964,407 | | | | — | | | | 9,446,321 | |
Food Products | | | 3,089,584 | | | | 3,519,035 | | | | — | | | | 6,608,619 | |
Gas Utilities | | | 2,315,934 | | | | 2,753,298 | | | | — | | | | 5,069,232 | |
Health Care Equipment & Supplies | | | 12,624,936 | | | | 1,079,933 | | | | — | | | | 13,704,869 | |
Health Care Providers & Services | | | 13,694,769 | | | | 1,501,718 | | | | — | | | | 15,196,487 | |
Health Care Technology | | | 4,207,069 | | | | 65,548 | | | | — | | | | 4,272,617 | |
Hotels, Restaurants & Leisure | | | 12,810,393 | | | | 1,279,424 | | | | — | | | | 14,089,817 | |
Household Durables | | | 8,143,615 | | | | 1,997,374 | | | | — | | | | 10,140,989 | |
Household Products | | | 4,821,934 | | | | 217,930 | | | | — | | | | 5,039,864 | |
Independent Power and Renewable Electricity Producers | | | 1,886,270 | | | | 779,476 | | | | — | | | | 2,665,746 | |
| | |
MASTER PORTFOLIO SCHEDULE OF INVESTMENTS | | 31 |
| | |
Schedule of Investments (continued) December 31, 2021 | | Diversified Equity Master Portfolio |
Fair Value Hierarchy as of Period End (continued)
| | | | | | | | | | | | | | | | |
| | | | | |
| | | Level 1 | | | Level 2 | | | Level 3 | | | Total | |
| | | | |
Common Stocks (continued) | | | | | | | | | | | | | | | | |
Industrial Conglomerates | | $ | 1,934,439 | | | $ | 1,302,569 | | | $ | — | | | $ | 3,237,008 | |
Insurance | | | 15,230,847 | | | | 7,157,395 | | | | — | | | | 22,388,242 | |
Interactive Media & Services | | | 23,447,762 | | | | 11,742,683 | | | | — | | | | 35,190,445 | |
Internet & Direct Marketing Retail | | | 16,117,376 | | | | 12,071,520 | | | | — | | | | 28,188,896 | |
IT Services | | | 22,417,953 | | | | 8,497,200 | | | | — | | | | 30,915,153 | |
Leisure Products | | | 790,046 | | | | 94,406 | | | | — | | | | 884,452 | |
Life Sciences Tools & Services | | | 11,354,794 | | | | 2,626,758 | | | | — | | | | 13,981,552 | |
Machinery | | | 12,860,469 | | | | 2,965,622 | | | | — | | | | 15,826,091 | |
Marine | | | 185,462 | | | | 1,413,575 | | | | — | | | | 1,599,037 | |
Media | | | 6,996,631 | | | | 209,220 | | | | — | | | | 7,205,851 | |
Metals & Mining | | | 3,560,090 | | | | 9,628,325 | | | | — | | | | 13,188,415 | |
Mortgage Real Estate Investment Trusts (REITs) | | | 1,663,387 | | | | — | | | | — | | | | 1,663,387 | |
Multiline Retail | | | 5,356,611 | | | | 350,880 | | | | — | | | | 5,707,491 | |
Multi-Utilities | | | 7,569,981 | | | | 1,035,196 | | | | — | | | | 8,605,177 | |
Oil, Gas & Consumable Fuels | | | 14,593,439 | | | | 13,754,589 | | | | — | | | | 28,348,028 | |
Paper & Forest Products | | | 27,367 | | | | 581,508 | | | | — | | | | 608,875 | |
Personal Products | | | 2,302,704 | | | | 2,183,136 | | | | — | | | | 4,485,840 | |
Pharmaceuticals | | | 21,766,603 | | | | 5,734,487 | | | | 2,030 | | | | 27,503,120 | |
Professional Services | | | 7,464,090 | | | | 1,226,976 | | | | — | | | | 8,691,066 | |
Real Estate Management & Development | | | 4,061,268 | | | | 3,109,916 | | | | — | | | | 7,171,184 | |
Road & Rail | | | 7,593,024 | | | | 951,787 | | | | 17,774 | | | | 8,562,585 | |
Semiconductors & Semiconductor Equipment | | | 28,164,225 | | | | 26,420,780 | | | | — | | | | 54,585,005 | |
Software | | | 51,429,116 | | | | 1,151,879 | | | | — | | | | 52,580,995 | |
Specialty Retail | | | 14,815,696 | | | | 1,217,347 | | | | — | | | | 16,033,043 | |
Technology Hardware, Storage & Peripherals | | | 27,281,293 | | | | 12,361,417 | | | | — | | | | 39,642,710 | |
Textiles, Apparel & Luxury Goods | | | 4,035,857 | | | | 4,011,500 | | | | — | | | | 8,047,357 | |
Thrifts & Mortgage Finance | | | 4,546,431 | | | | 1,601,142 | | | | — | | | | 6,147,573 | |
Tobacco | | | — | | | | 643,769 | | | | — | | | | 643,769 | |
Trading Companies & Distributors | | | 6,041,815 | | | | 694,498 | | | | — | | | | 6,736,313 | |
Transportation Infrastructure | | | 508,420 | | | | 370,104 | | | | — | | | | 878,524 | |
Water Utilities | | | 965,807 | | | | 626,289 | | | | — | | | | 1,592,096 | |
Wireless Telecommunication Services | | | 952,633 | | | | 2,557,549 | | | | — | | | | 3,510,182 | |
Preferred Securities | | | | | | | | | | | | | | | | |
Preferred Stocks | | | | | | | | | | | | | | | | |
Airlines | | | — | | | | 53,821 | | | | — | | | | 53,821 | |
Automobiles | | | — | | | | 195,052 | | | | — | | | | 195,052 | |
Banks | | | — | | | | 2,063,652 | | | | — | | | | 2,063,652 | |
Health Care Equipment & Supplies | | | — | | | | 83,190 | | | | — | | | | 83,190 | |
Metals & Mining | | | — | | | | 157,768 | | | | — | | | | 157,768 | |
Oil, Gas & Consumable Fuels | | | — | | | | 558,109 | | | | — | | | | 558,109 | |
Real Estate Management & Development | | | 183 | | | | — | | | | — | | | | 183 | |
Trading Companies & Distributors | | | 44,841 | | | | — | | | | — | | | | 44,841 | |
Rights | | | 12,973 | | | | — | | | | — | | | | 12,973 | |
Short-Term Securities | | | | | | | | | | | | | | | | |
Money Market Funds | | | 161,007,101 | | | | — | | | | — | | | | 161,007,101 | |
| | | | | | | | | | | | | | | | |
| | | | |
| | $ | 752,735,619 | | | $ | 234,367,673 | | | $ | 23,274 | | | $ | 987,126,566 | |
| | | | | | | | | | | | | | | | |
Derivative Financial Instruments(a) | | | | | | | | | | | | | | | | |
Assets | | | | | | | | | | | | | | | | |
Equity Contracts | | $ | 245,384 | | | $ | 7,446,287 | | | $ | — | | | $ | 7,691,671 | |
Foreign Currency Exchange Contracts | | | — | | | | 38,758 | | | | — | | | | 38,758 | |
Liabilities | | | | | | | | | | | | | | | | |
Equity Contracts | | | (3,998,132 | ) | | | — | | | | — | | | | (3,998,132 | ) |
Foreign Currency Exchange Contracts | | | — | | | | (40,167 | ) | | | — | | | | (40,167 | ) |
| | | | | | | | | | | | | | | | |
| | | | |
| | $ | (3,752,748 | ) | | $ | 7,444,878 | | | $ | — | | | $ | 3,692,130 | |
| | | | | | | | | | | | | | | | |
| | (a) | Derivative financial instruments are swaps, futures contracts and forward foreign currency exchange contracts. Swaps, futures contracts and forward foreign currency exchange contracts are valued at the unrealized appreciation (depreciation) on the instrument. | |
See notes to financial statements.
| | |
| 32 | | 2 0 2 1 BLACK ROCK ANNUAL REPORT TO SHAREHOLDERS |
Statement of Assets and Liabilities
December 31, 2021
| | | | |
| | | Diversified Equity Master Portfolio | |
| |
| |
ASSETS | | | | |
Investments, at value — unaffiliated(a)(b) | | $ | 826,119,465 | |
Investments, at value — affiliated(c) | | | 161,007,101 | |
Cash | | | 113,933 | |
Cash pledged for futures contracts | | | 20,595,000 | |
Foreign currency, at value(d) | | | 822,629 | |
Receivables: | | | | |
Securities lending income — affiliated | | | 10,365 | |
Dividends — unaffiliated | | | 1,021,028 | |
Dividends — affiliated | | | 456 | |
Variation margin on futures contracts | | | 867,145 | |
Unrealized appreciation on: | | | | |
Forward foreign currency exchange contracts | | | 38,758 | |
OTC swaps | | | 7,446,287 | |
Prepaid expenses | | | 2,409 | |
| | | | |
| |
Total assets | | | 1,018,044,576 | |
| | | | |
| |
LIABILITIES | | | | |
Cash received as collateral for OTC derivatives | | | 10,130,000 | |
Collateral on securities loaned | | | 48,787,369 | |
Payables: | | | | |
Administration fees | | | 80,204 | |
Deferred foreign capital gain tax | | | 287,003 | |
Investment advisory fees | | | 38,674 | |
Trustees’ fees | | | 3,873 | |
Professional fees | | | 24,067 | |
Variation margin on futures contracts | | | 101,523 | |
Unrealized depreciation on forward foreign currency exchange contracts | | | 40,167 | |
Other liabilities | | | 710,000 | |
| | | | |
| |
Total liabilities | | | 60,202,880 | |
| | | | |
| |
NET ASSETS | | $ | 957,841,696 | |
| | | | |
| |
NET ASSETS CONSIST OF | | | | |
Investors’ capital | | $ | 781,400,814 | |
Net unrealized appreciation (depreciation) | | | 176,440,882 | |
| | | | |
| |
NET ASSETS | | $ | 957,841,696 | |
| | | | |
| |
(a) Investments, at cost — unaffiliated | | $ | 653,093,398 | |
(b) Securities loaned, at value | | $ | 47,198,505 | |
(c) Investments, at cost — affiliated | | $ | 160,999,092 | |
(d) Foreign currency, at cost | | $ | 822,690 | |
See notes to financial statements.
| | |
MASTER PORTFOLIO FINANCIAL STATEMENTS | | 33 |
Statement of Operations
Year Ended December 31, 2021
| | | | |
| | | Diversified Equity Master Portfolio | |
| |
| |
INVESTMENT INCOME | | | | |
Dividends — unaffiliated | | $ | 12,977,074 | |
Dividends — affiliated | | | 11,466 | |
Securities lending income — affiliated — net | | | 145,864 | |
Foreign taxes withheld | | | (845,534 | ) |
| | | | |
| |
Total investment income | | | 12,288,870 | |
| | | | |
| |
EXPENSES | | | | |
Investment advisory | | | 2,150,529 | |
Administration | | | 860,211 | |
Professional | | | 23,146 | |
Trustees | | | 9,652 | |
| | | | |
| |
Total expenses | | | 3,043,538 | |
Less: | | | | |
Fees waived and/or reimbursed by the Administrator | | | (860,211 | ) |
Fees waived and/or reimbursed by the Manager | | | (903,717 | ) |
| | | | |
| |
Total expenses after fees waived and/or reimbursed | | | 1,279,610 | |
| | | | |
| |
Net investment income | | | 11,009,260 | |
| | | | |
| |
REALIZED AND UNREALIZED GAIN (LOSS) | | | | |
Net realized gain (loss) from: | | | | |
Investments — unaffiliated(a) | | | 98,928,930 | |
Investments — affiliated | | | (7,489 | ) |
Forward foreign currency exchange contracts | | | 103,461 | |
Foreign currency transactions | | | (321,394 | ) |
Futures contracts | | | 2,353,768 | |
Swaps | | | 97,230,853 | |
| | | | |
| |
| | | 198,288,129 | |
| | | | |
Net change in unrealized appreciation (depreciation) on: | | | | |
Investments — unaffiliated(b) | | | (3,974,686 | ) |
Investments — affiliated | | | (6,751 | ) |
Forward foreign currency exchange contracts | | | (41,393 | ) |
Foreign currency translations | | | (2,865 | ) |
Futures contracts | | | (4,824,440 | ) |
Swaps | | | 7,446,287 | |
| | | | |
| |
| | | (1,403,848 | ) |
| | | | |
| |
Net realized and unrealized gain | | | 196,884,281 | |
| | | | |
| |
NET INCREASE IN NET ASSETS RESULTING FROM OPERATIONS | | $ | 207,893,541 | |
| | | | |
| |
(a) Net of foreign capital gain tax and capital gain tax refund, if applicable of | | $ | (524,938 | ) |
(b) Net of reduction in deferred foreign capital gain tax of | | $ | 52,613 | |
See notes to financial statements.
| | |
| 34 | | 2 0 2 1 BLACK ROCK ANNUAL REPORT TO SHAREHOLDERS |
Statements of Changes in Net Assets
| | | | | | | | |
| | | Diversified Equity Master Portfolio | |
| | | | |
| |
| | | Year Ended December 31, | |
| | | | |
| | |
| | | 2021 | | | 2020 | |
| |
| | |
INCREASE (DECREASE) IN NET ASSETS | | | | | | | | |
| | |
OPERATIONS | | | | | | | | |
Net investment income | | $ | 11,009,260 | | | $ | 8,931,072 | |
Net realized gain | | | 198,288,129 | | | | 7,174,186 | |
Net change in unrealized appreciation (depreciation) | | | (1,403,848 | ) | | | 111,301,384 | |
| | | | | | | | |
| | |
Net increase in net assets resulting from operations | | | 207,893,541 | | | | 127,406,642 | |
| | | | | | | | |
| | |
CAPITAL TRANSACTIONS | | | | | | | | |
Proceeds from contributions | | | 91,448,184 | | | | 290,682,031 | |
Value of withdrawals | | | (75,303,566 | ) | | | (191,423,104 | ) |
| | | | | | | | |
| | |
Net increase in net assets derived from capital transactions | | | 16,144,618 | | | | 99,258,927 | |
| | | | | | | | |
| | |
NET ASSETS | | | | | | | | |
Total increase in net assets | | | 224,038,159 | | | | 226,665,569 | |
Beginning of year | | | 733,803,537 | | | | 507,137,968 | |
| | | | | | | | |
| | |
End of year | | $ | 957,841,696 | | | $ | 733,803,537 | |
| | | | | | | | |
See notes to financial statements.
| | |
MASTER PORTFOLIO FINANCIAL STATEMENTS | | 35 |
Financial Highlights
| | | | | | | | | | | | | | | | | | | | |
| | | Diversified Equity Master Portfolio | |
| |
| | | Year Ended December 31, | |
| | | | | |
| | | 2021 | | | 2020 | | | 2019 | | | 2018 | | | 2017 | |
| | | | | |
Total Return | | | | | | | | | | | | | | | | | | | | |
Total return | | | 27.62 | % | | | 19.60 | % | | | 31.98 | % | | | (3.90 | )% | | | 22.15 | % |
| | | | | | | | | | | | | | | | | | | | |
| | | | | |
Ratios to Average Net Assets(a) | | | | | | | | | | | | | | | | | | | | |
Total expenses | | | 0.35 | % | | | 0.36 | % | | | 0.36 | % | | | 0.36 | % | | | 0.36 | % |
| | | | | | | | | | | | | | | | | | | | |
| | | | | |
Total expenses after fees waived and/or reimbursed | | | 0.15 | % | | | 0.15 | % | | | 0.15 | % | | | 0.15 | % | | | 0.15 | % |
| | | | | | | | | | | | | | | | | | | | |
| | | | | |
Net investment income | | | 1.28 | % | | | 1.52 | % | | | 1.85 | % | | | 1.88 | % | | | 1.69 | % |
| | | | | | | | | | | | | | | | | | | | |
| | | | | |
Supplemental Data | | | | | | | | | | | | | | | | | | | | |
Net assets, end of year (000) | | $ | 957,842 | | | $ | 733,804 | | | $ | 507,138 | | | $ | 429,098 | | | $ | 535,456 | |
| | | | | | | | | | | | | | | | | | | | |
| | | | | |
Portfolio turnover rate | | | 127 | % | | | 150 | % | | | 172 | % | | | 150 | % | | | 252 | % |
| | | | | | | | | | | | | | | | | | | | |
| (a) | Excludes fees and expenses incurred indirectly as a result of investments in underlying funds. |
See notes to financial statements.
| | |
| 36 | | 2 0 2 1 BLACK ROCK ANNUAL REPORT TO SHAREHOLDERS |
Notes to Financial Statements
Master Investment Portfolio (“MIP”) is registered under the Investment Company Act of 1940, as amended (the “1940 Act”), as an open-end management investment company. MIP is organized as a Delaware statutory trust. Diversified Equity Master Portfolio (the “Master Portfolio”) is a series of MIP. The Master Portfolio is classified as diversified.
The Master Portfolio, together with certain other registered investment companies advised by BlackRock Fund Advisors (the “Manager”) or its affiliates, is included in a complex of open-end equity, multi-asset, index and money market funds referred to as the BlackRock Multi-Asset Complex.
| 2. | SIGNIFICANT ACCOUNTING POLICIES |
The financial statements are prepared in conformity with accounting principles generally accepted in the United States of America (“U.S. GAAP”), which may require management to make estimates and assumptions that affect the reported amounts of assets and liabilities in the financial statements, disclosure of contingent assets and liabilities at the date of the financial statements and the reported amounts of increases and decreases in net assets from operations during the reporting period. Actual results could differ from those estimates. The Master Portfolio is considered an investment company under U.S. GAAP and follows the accounting and reporting guidance applicable to investment companies. Below is a summary of significant accounting policies:
Investment Transactions and Income Recognition: For financial reporting purposes, investment transactions are recorded on the dates the transactions are executed. Realized gains and losses on investment transactions are determined using the specific identification method. Dividend income and capital gain distributions, if any, are recorded on the ex-dividend dates. Non-cash dividends, if any, are recorded on the ex-dividend dates at fair value. Dividends from foreign securities where the ex-dividend dates may have passed are subsequently recorded when the Master Portfolio is informed of the ex-dividend dates. Under the applicable foreign tax laws, a withholding tax at various rates may be imposed on capital gains, dividends and interest. Upon notification from issuers, a portion of the dividend income received from a real estate investment trust may be redesignated as a reduction of cost of the related investment and/or realized gain.
Foreign Currency Translation: The Master Portfolio’s books and records are maintained in U.S. dollars. Securities and other assets and liabilities denominated in foreign currencies are translated into U.S. dollars using exchange rates determined as of the close of trading on the New York Stock Exchange (“NYSE”). Purchases and sales of investments are recorded at the rates of exchange prevailing on the respective dates of such transactions. Generally, when the U.S. dollar rises in value against a foreign currency, the investments denominated in that currency will lose value; the opposite effect occurs if the U.S. dollar falls in relative value.
The Master Portfolio does not isolate the effect of fluctuations in foreign exchange rates from the effect of fluctuations in the market prices of investments for financial reporting purposes. Accordingly, the effects of changes in exchange rates on investments are not segregated in the Statement of Operations from the effects of changes in market prices of those investments, but are included as a component of net realized and unrealized gain (loss) from investments. The Master Portfolio reports realized currency gains (losses) on foreign currency related transactions as components of net realized gain (loss) for financial reporting purposes, whereas such components are generally treated as ordinary income for U.S. federal income tax purposes.
Foreign Taxes: The Master Portfolio may be subject to foreign taxes (a portion of which may be reclaimable) on income, stock dividends, capital gains on investments, or certain foreign currency transactions. All foreign taxes are recorded in accordance with the applicable foreign tax regulations and rates that exist in the foreign jurisdictions in which the Master Portfolio invests. These foreign taxes, if any, are paid by the Master Portfolio and are reflected in its Statement of Operations as follows: foreign taxes withheld at source are presented as a reduction of income, foreign taxes on securities lending income are presented as a reduction of securities lending income, foreign taxes on stock dividends are presented as “Foreign taxes withheld”, and foreign taxes on capital gains from sales of investments and foreign taxes on foreign currency transactions are included in their respective net realized gain (loss) categories. Foreign taxes payable or deferred as of December 31, 2021, if any, are disclosed in the Statement of Assets and Liabilities.
The Master Portfolio files withholding tax reclaims in certain jurisdictions to recover a portion of amounts previously withheld. The Master Portfolio may record a reclaim receivable based on collectability, which includes factors such as the jurisdiction’s applicable laws, payment history and market convention. The Statement of Operations includes tax reclaims recorded as well as professional and other fees, if any, associated with recovery of foreign withholding taxes.
Segregation and Collateralization: In cases where the Master Portfolio enters into certain investments (e.g. futures contracts, forward foreign currency exchange contracts) that would be treated as “senior securities” for 1940 Act purposes, the Master Portfolio may segregate or designate on its books and records cash or liquid assets having a market value at least equal to the amount of its future obligations under such investments. Doing so allows the investments to be excluded from treatment as a “senior security.” Furthermore, if required by an exchange or counterparty agreement, the Master Portfolio may be required to deliver/deposit cash and/or securities to/with an exchange, or broker-dealer or custodian as collateral for certain investments or obligations.
Indemnifications: In the normal course of business, the Master Portfolio enters into contracts that contain a variety of representations that provide general indemnification. The Master Portfolio’s maximum exposure under these arrangements is unknown because it involves future potential claims against the Master Portfolio, which cannot be predicted with any certainty.
Other: Expenses directly related to the Master Portfolio are charged to the Master Portfolio. Other operating expenses shared by several funds, including other funds managed by the Manager, are prorated among those funds on the basis of relative net assets or other appropriate methods.
| | |
MASTER PORTFOLIO NOTES TO FINANCIAL STATEMENTS | | 37 |
Notes to Financial Statements (continued)
| 3. | INVESTMENT VALUATION AND FAIR VALUE MEASUREMENTS |
Investment Valuation Policies: The Master Portfolio’s investments are valued at fair value (also referred to as “market value” within the financial statements) each day that the Master Portfolio is open for business and, for financial reporting purposes, as of the report date. U.S. GAAP defines fair value as the price a fund would receive to sell an asset or pay to transfer a liability in an orderly transaction between market participants at the measurement date. The Master Portfolio determines the fair values of its financial instruments using various independent dealers or pricing services under policies approved by the Board. If a security’s market price is not readily available or does not otherwise accurately represent the fair value of the security, the security will be valued in accordance with a policy approved by the Board as reflecting fair value. The BlackRock Global Valuation Methodologies Committee (the “Global Valuation Committee”) is the committee formed by management to develop global pricing policies and procedures and to oversee the pricing function for all financial instruments.
Fair Value Inputs and Methodologies: The following methods and inputs are used to establish the fair value of the Master Portfolio’s assets and liabilities:
| | • | | Equity investments traded on a recognized securities exchange are valued at that day’s official closing price, as applicable, on the exchange where the stock is primarily traded. Equity investments traded on a recognized exchange for which there were no sales on that day may be valued at the last available bid (long positions) or ask (short positions) price. |
| | • | | Investments in open-end U.S. mutual funds (including money market funds) are valued at that day’s published net asset value (“NAV”). |
| | • | | Futures contracts are valued based on that day’s last reported settlement or trade price on the exchange where the contract is traded. |
| | • | | Forward foreign currency exchange contracts are valued at the mean between the bid and ask prices and are determined as of the close of trading on the NYSE based on that day’s prevailing forward exchange rate for the underlying currencies. |
| | • | | Swap agreements are valued utilizing quotes received daily by independent pricing services or through brokers, which are derived using daily swap curves and models that incorporate a number of market data factors, such as discounted cash flows, trades and values of the underlying reference instruments. |
Generally, trading in foreign instruments is substantially completed each day at various times prior to the close of trading on the NYSE. Each business day, the Master Portfolio uses current market factors supplied by independent pricing services to value certain foreign instruments (“Systematic Fair Value Price”). The Systematic Fair Value Price is designed to value such foreign securities at fair value as of the close of trading on the NYSE, which follows the close of the local markets.
If events (e.g., market volatility, company announcement or a natural disaster) occur that are expected to materially affect the value of such investment, or in the event that application of these methods of valuation results in a price for an investment that is deemed not to be representative of the market value of such investment, or if a price is not available, the investment will be valued by the Global Valuation Committee, or its delegate, in accordance with a policy approved by the Board as reflecting fair value (“Fair Valued Investments”). The fair valuation approaches that may be used by the Global Valuation Committee include market approach, income approach and cost approach. Valuation techniques such as discounted cash flow, use of market comparables and matrix pricing are types of valuation approaches and are typically used in determining fair value. When determining the price for Fair Valued Investments, the Global Valuation Committee, or its delegate, seeks to determine the price that the Master Portfolio might reasonably expect to receive or pay from the current sale or purchase of that asset or liability in an arm’s-length transaction. Fair value determinations shall be based upon all available factors that the Global Valuation Committee, or its delegate, deems relevant and consistent with the principles of fair value measurement. The pricing of all Fair Valued Investments is subsequently reported to the Board or a committee thereof on a quarterly basis.
For investments in equity or debt issued by privately held companies or funds (“Private Company” or collectively, the “Private Companies”) and other Fair Valued Investments, the fair valuation approaches that are used by the Global Valuation Committee and third-party pricing services utilize one or a combination of, but not limited to, the following inputs.
| | | | |
| | |
| | | Standard Inputs Generally Considered By Third-Party Pricing Services |
| | |
Market approach | | (i) | | recent market transactions, including subsequent rounds of financing, in the underlying investment or comparable issuers; |
| | (ii) | | recapitalizations and other transactions across the capital structure; and |
| | | (iii) | | market multiples of comparable issuers. |
| | |
Income approach | | (i) | | future cash flows discounted to present and adjusted as appropriate for liquidity, credit, and/or market risks; |
| | (ii) | | quoted prices for similar investments or assets in active markets; and |
| | | (iii) | | other risk factors, such as interest rates, yield curves, volatilities, prepayment speeds, loss severities, credit risks, recovery rates, liquidation amounts and/or default rates. |
| | |
Cost approach | | (i) | | audited or unaudited financial statements, investor communications and financial or operational metrics issued by the Private Company; |
| | (ii) | | changes in the valuation of relevant indices or publicly traded companies comparable to the Private Company; |
| | (iii) | | relevant news and other public sources; and |
| | | (iv) | | known secondary market transactions in the Private Company’s interests and merger or acquisition activity in companies comparable to the Private Company. |
Investments in series of preferred stock issued by Private Companies are typically valued utilizing market approach in determining the enterprise value of the company. Such investments often contain rights and preferences that differ from other series of preferred and common stock of the same issuer. Enterprise valuation techniques such as an option pricing model (“OPM”), a probability weighted expected return model (“PWERM”), current value method or a hybrid of those techniques are used as deemed appropriate under the circumstances. The use of these valuation techniques involve a determination of the exit scenarios of the investment in order to appropriately allocate the enterprise value of the company among the various parts of its capital structure.
| | |
| 38 | | 2 0 2 1 BLACK ROCK ANNUAL REPORT TO SHAREHOLDERS |
Notes to Financial Statements (continued)
The Private Companies are not subject to the public company disclosure, timing, and reporting standards applicable to other investments held by the Master Portfolio. Typically, the most recently available information by a Private Company is as of a date that is earlier than the date the Master Portfolio is calculating its NAV. This factor may result in a difference between the value of the investment and the price the Master Portfolio could receive upon the sale of the investment.
Fair Value Hierarchy: Various inputs are used in determining the fair value of financial instruments. These inputs to valuation techniques are categorized into a fair value hierarchy consisting of three broad levels for financial reporting purposes as follows:
| | • | | Level 1 – Unadjusted price quotations in active markets/exchanges for identical assets or liabilities that the Master Portfolio has the ability to access; |
| | • | | Level 2 – Other observable inputs (including, but not limited to, quoted prices for similar assets or liabilities in markets that are active, quoted prices for identical or similar assets or liabilities in markets that are not active, inputs other than quoted prices that are observable for the assets or liabilities (such as interest rates, yield curves, volatilities, prepayment speeds, loss severities, credit risks and default rates) or other market-corroborated inputs); and |
| | • | | Level 3 – Unobservable inputs based on the best information available in the circumstances, to the extent observable inputs are not available (including the Global Valuation Committee’s assumptions used in determining the fair value of financial instruments). |
The hierarchy gives the highest priority to unadjusted quoted prices in active markets for identical assets or liabilities (Level 1 measurements) and the lowest priority to unobservable inputs (Level 3 measurements). Accordingly, the degree of judgment exercised in determining fair value is greatest for instruments categorized in Level 3. The inputs used to measure fair value may fall into different levels of the fair value hierarchy. In such cases, for disclosure purposes, the fair value hierarchy classification is determined based on the lowest level input that is significant to the fair value measurement in its entirety. Investments classified within Level 3 have significant unobservable inputs used by the Global Valuation Committee in determining the price for Fair Valued Investments. Level 3 investments include equity or debt issued by Private Companies that may not have a secondary market and/or may have a limited number of investors. The categorization of a value determined for financial instruments is based on the pricing transparency of the financial instruments and is not necessarily an indication of the risks associated with investing in those securities.
| 4. | SECURITIES AND OTHER INVESTMENTS |
Preferred Stocks: Preferred stock has a preference over common stock in liquidation (and generally in receiving dividends as well), but is subordinated to the liabilities of the issuer in all respects. As a general rule, the market value of preferred stock with a fixed dividend rate and no conversion element varies inversely with interest rates and perceived credit risk, while the market price of convertible preferred stock generally also reflects some element of conversion value. Because preferred stock is junior to debt securities and other obligations of the issuer, deterioration in the credit quality of the issuer will cause greater changes in the value of a preferred stock than in a more senior debt security with similar stated yield characteristics. Unlike interest payments on debt securities, preferred stock dividends are payable only if declared by the issuer’s board of directors. Preferred stock also may be subject to optional or mandatory redemption provisions.
Securities Lending: The Master Portfolio may lend its securities to approved borrowers, such as brokers, dealers and other financial institutions. The borrower pledges and maintains with the Master Portfolio collateral consisting of cash, an irrevocable letter of credit issued by a bank, or securities issued or guaranteed by the U.S. Government. The initial collateral received by the Master Portfolio is required to have a value of at least 102% of the current value of the loaned securities for securities traded on U.S. exchanges and a value of at least 105% for all other securities. The collateral is maintained thereafter at a value equal to at least 100% of the current market value of the securities on loan. The market value of the loaned securities is determined at the close of each business day of the Master Portfolio and any additional required collateral is delivered to the Master Portfolio, or excess collateral returned by the Fund, on the next business day. During the term of the loan, the Master Portfolio is entitled to all distributions made on or in respect of the loaned securities, but does not receive interest income on securities received as collateral. Loans of securities are terminable at any time and the borrower, after notice, is required to return borrowed securities within the standard time period for settlement of securities transactions.
As of period end, any securities on loan were collateralized by cash and/or U.S. Government obligations. Cash collateral invested by the securities lending agent, BlackRock Institutional Trust Company, N.A. (“BTC”), if any, is disclosed in the Schedule of Investments. Any non-cash collateral received cannot be sold, re-invested or pledged by the Fund, except in the event of borrower default. The securities on loan, if any, are disclosed in the Master Portfolio’s Schedule of Investments,. The market value of any securities on loan and the value of any related collateral are shown separately in the Statement of Assets and Liabilities as a component of investments at value – unaffiliated, and collateral on securities loaned at value, respectively.
Securities lending transactions are entered into by the Master Portfolio under Master Securities Lending Agreements (each, an “MSLA”), which provide the right, in the event of default (including bankruptcy or insolvency), for the non-defaulting party to liquidate the collateral and calculate a net exposure to the defaulting party or request additional collateral. In the event that a borrower defaults, the Master Portfolio, as lender, would offset the market value of the collateral received against the market value of the securities loaned. When the value of the collateral is greater than that of the market value of the securities loaned, the lender is left with a net amount payable to the defaulting party. However, bankruptcy or insolvency laws of a particular jurisdiction may impose restrictions on or prohibitions against such a right of offset in the event of an MSLA counterparty’s bankruptcy or insolvency. Under the MSLA, absent an event of default, the borrower can resell or re-pledge the loaned securities, and the Master Portfolio can reinvest cash collateral received in connection with loaned securities. Upon an event of default, the parties’ obligations to return the securities or collateral to the other party are extinguished, and the parties can resell or re-pledge the loaned securities or the collateral received in connection with the loaned securities in order to satisfy the defaulting party’s net payment obligation for all transactions under the MSLA. The defaulting party remains liable for any deficiency.
As of period end, the following table is a summary of the Master Portfolio’s securities on loan by counterparty which are subject to offset under an MSLA:
| | | | | | | | | | | | | | | | |
| |
| | | | |
| Counterparty | |
| Securities
Loaned at Value |
| |
| Cash Collateral
Received |
(a) | |
| Non-Cash Collateral
Received at Fair Value |
(a) | |
| Net
Amount |
|
| |
| | | | |
Barclays Bank PLC | | $ | 3,872,165 | | | $ | (3,872,165 | ) | | $ | — | | | $ | — | |
BNP Paribas SA | | | 9,893,795 | | | | (9,893,795 | ) | | | — | | | | — | |
| | |
MASTER PORTFOLIO NOTES TO FINANCIAL STATEMENTS | | 39 |
Notes to Financial Statements (continued)
| | | | | | | | | | | | | | | | |
| |
| | | | |
| Counterparty | |
| Securities
Loaned at Value |
| |
| Cash Collateral
Received |
(a) | |
| Non-Cash Collateral
Received at Fair Value |
(a) | |
| Net
Amount |
|
| |
| | | | |
Citadel Clearing LLC | | $ | 1,491 | | | $ | (1,491 | ) | | $ | — | | | $ | — | |
Credit Suisse Securities (USA) LLC | | | 2,952,765 | | | | (2,952,765 | ) | | | — | | | | — | |
Goldman Sachs & Co. LLC | | | 3,811,030 | | | | (3,811,030 | ) | | | — | | | | — | |
HSBC Bank PLC | | | 666,311 | | | | (666,311 | ) | | | — | | | | — | |
ING Financial Markets LLC | | | 172,176 | | | | (172,176 | ) | | | — | | | | — | |
J.P. Morgan Securities LLC | | | 6,115,651 | | | | (6,115,651 | ) | | | — | | | | — | |
Jefferies LLC | | | 953,004 | | | | (953,004 | ) | | | — | | | | — | |
Morgan Stanley | | | 7,317,053 | | | | (7,317,053 | ) | | | — | | | | — | |
Scotia Capital (USA), Inc. | | | 1,837,689 | | | | (1,837,689 | ) | | | — | | | | — | |
Toronto Dominion Bank | | | 1,331,084 | | | | (1,331,084 | ) | | | — | | | | — | |
UBS AG | | | 4,125,838 | | | | (4,125,838 | ) | | | — | | | | — | |
UBS Securities LLC | | | 1,354,314 | | | | (1,354,314 | ) | | | — | | | | — | |
Virtu Americas LLC | | | 2,794,139 | | | | (2,794,139 | ) | | | — | | | | — | |
| | | | | | | | | | | | | | | | |
| | | | |
| | $ | 47,198,505 | | | $ | (47,198,505 | ) | | $ | — | | | $ | — | |
| | | | | | | | | | | | | | | | |
| | (a) | Collateral received in excess of the market value of securities on loan is not presented in this table. The total cash collateral received by the Master Portfolio is disclosed in the Master Portfolio’s Statement of Assets and Liabilities. | |
The risks of securities lending include the risk that the borrower may not provide additional collateral when required or may not return the securities when due. To mitigate these risks, the Master Portfolio benefits from a borrower default indemnity provided by BlackRock, Inc. (“BlackRock”). BlackRock’s indemnity allows for full replacement of the securities loaned to the extent the collateral received does not cover the value on the securities loaned in the event of borrower default. The Master Portfolio could incur a loss if the value of an investment purchased with cash collateral falls below the market value of loaned securities or if the value of an investment purchased with cash collateral falls below the value of the original cash collateral received. Such losses are borne entirely by the Master Portfolio.
| 5. | DERIVATIVE FINANCIAL INSTRUMENTS |
The Master Portfolio engages in various portfolio investment strategies using derivative contracts both to increase the returns of the Master Portfolio and/or to manage its exposure to certain risks such as credit risk, equity risk, interest rate risk, foreign currency exchange rate risk, commodity price risk or other risks (e.g., inflation risk). Derivative financial instruments categorized by risk exposure are included in the Schedule of Investments. These contracts may be transacted on an exchange or over-the-counter (“OTC”).
Futures Contracts: Futures contracts are purchased or sold to gain exposure to, or manage exposure to, changes in interest rates (interest rate risk) and changes in the value of equity securities (equity risk) or foreign currencies (foreign currency exchange rate risk).
Futures contracts are exchange-traded agreements between the Master Portfolio and a counterparty to buy or sell a specific quantity of an underlying instrument at a specified price and on a specified date. Depending on the terms of a contract, it is settled either through physical delivery of the underlying instrument on the settlement date or by payment of a cash amount on the settlement date. Upon entering into a futures contract, the Master Portfolio is required to deposit initial margin with the broker in the form of cash or securities in an amount that varies depending on a contract’s size and risk profile. The initial margin deposit must then be maintained at an established level over the life of the contract. Amounts pledged, which are considered restricted, are included in cash pledged for futures contracts in the Statement of Assets and Liabilities.
Securities deposited as initial margin are designated in the Schedule of Investments and cash deposited, if any, are shown as cash pledged for futures contracts in the Statement of Assets and Liabilities. Pursuant to the contract, the Master Portfolio agrees to receive from or pay to the broker an amount of cash equal to the daily fluctuation in market value of the contract (“variation margin”). Variation margin is recorded as unrealized appreciation (depreciation) and, if any, shown as variation margin receivable (or payable) on futures contracts in the Statement of Assets and Liabilities. When the contract is closed, a realized gain or loss is recorded in the Statement of Operations equal to the difference between the notional amount of the contract at the time it was opened and the notional amount at the time it was closed. The use of futures contracts involves the risk of an imperfect correlation in the movements in the price of futures contracts and interest rates, foreign currency exchange rates or underlying assets.
Forward Foreign Currency Exchange Contracts: Forward foreign currency exchange contracts are entered into to gain or reduce exposure to foreign currencies (foreign currency exchange rate risk).
A forward foreign currency exchange contract is an agreement between two parties to buy and sell a currency at a set exchange rate on a specified date. These contracts help to manage the overall exposure to the currencies in which some of the investments held by the Master Portfolio are denominated and in some cases, may be used to obtain exposure to a particular market. The contracts are traded OTC and not on an organized exchange.
The contract is marked-to-market daily and the change in market value is recorded as unrealized appreciation (depreciation) in the Statement of Assets and Liabilities. When a contract is closed, a realized gain or loss is recorded in the Statement of Operations equal to the difference between the value at the time it was opened and the value at the time it was closed. Non-deliverable forward foreign currency exchange contracts are settled with the counterparty in cash without the delivery of foreign currency. The use of forward foreign currency exchange contracts involves the risk that the value of a forward foreign currency exchange contract changes unfavorably due to movements in the value of the referenced foreign currencies, and such value may exceed the amount(s) reflected in the Statement of Assets and Liabilities. Cash amounts pledged for forward foreign currency exchange contracts are considered restricted and are included in cash pledged as collateral for OTC derivatives in the Statement of Assets and Liabilities. A Master Portfolio’s risk of loss from counterparty credit risk on OTC derivatives is generally limited to the aggregate unrealized gain netted against any collateral held by the Master Portfolio.
| | |
| 40 | | 2 0 2 1 BLACK ROCK ANNUAL REPORT TO SHAREHOLDERS |
Notes to Financial Statements (continued)
Swaps: Swap contracts are entered into to manage exposure to issuers, markets and securities. Such contracts are agreements between the Master Portfolio and a counterparty to make periodic net payments on a specified notional amount or a net payment upon termination. Swap agreements are privately negotiated in the OTC market and may be entered into as a bilateral contract (“OTC swaps”) or centrally cleared (“centrally cleared swaps”).
For OTC swaps, any upfront premiums paid and any upfront fees received are shown as swap premiums paid and swap premiums received, respectively, in the Statement of Assets and Liabilities and amortized over the term of the contract. The daily fluctuation in market value is recorded as unrealized appreciation (depreciation) on OTC Swaps in the Statement of Assets and Liabilities. Payments received or paid are recorded in the Statement of Operations as realized gains or losses, respectively. When an OTC swap is terminated, a realized gain or loss is recorded in the Statement of Operations equal to the difference between the proceeds from (or cost of) the closing transaction and the Master Portfolio’s basis in the contract, if any. Generally, the basis of the contract is the premium received or paid.
In a centrally cleared swap, immediately following execution of the swap contract, the swap contract is novated to a central counterparty (the “CCP”) and the CCP becomes the Master Portfolio’s counterparty on the swap. The Master Portfolio is required to interface with the CCP through the broker. Upon entering into a centrally cleared swap, the Master Portfolio is required to deposit initial margin with the broker in the form of cash or securities in an amount that varies depending on the size and risk profile of the particular swap. Securities deposited as initial margin are designated in the Schedule of Investments and cash deposited is shown as cash pledged for centrally cleared swaps in the Statement of Assets and Liabilities. Amounts pledged, which are considered restricted cash, are included in cash pledged for centrally cleared swaps in the Statement of Assets and Liabilities. Pursuant to the contract, the Master Portfolio agrees to receive from or pay to the broker variation margin. Variation margin is recorded as unrealized appreciation (depreciation) and shown as variation margin receivable (or payable) on centrally cleared swaps in the Statement of Assets and Liabilities. Payments received from (paid to) the counterparty are amortized over the term of the contract and recorded as realized gains (losses) in the Statement of Operations, including those at termination.
| | • | | Total return swaps — Total return swaps are entered into to obtain exposure to a security or market without owning such security or investing directly in such market or to exchange the risk/return of one security or market (e.g., fixed-income) with another security or market (e.g., equity or commodity prices) (equity risk, commodity price risk and/or interest rate risk). |
Total return swaps are agreements in which there is an exchange of cash flows whereby one party commits to make payments based on the total return (distributions plus capital gains/losses) of an underlying instrument, or basket of underlying instruments, in exchange for fixed or floating rate interest payments. If the total return of the instrument(s) or index underlying the transaction exceeds or falls short of the offsetting fixed or floating interest rate obligation, the Master Portfolio receives payment from or makes a payment to the counterparty.
Master Netting Arrangements: In order to define its contractual rights and to secure rights that will help it mitigate its counterparty risk, the Master Portfolio may enter into an International Swaps and Derivatives Association, Inc. Master Agreement (“ISDA Master Agreement”) or similar agreement with its counterparties. An ISDA Master Agreement is a bilateral agreement between a Master Portfolio and a counterparty that governs certain OTC derivatives and typically contains, among other things, collateral posting terms and netting provisions in the event of a default and/or termination event. Under an ISDA Master Agreement, a Master Portfolio may, under certain circumstances, offset with the counterparty certain derivative financial instruments’ payables and/or receivables with collateral held and/or posted and create one single net payment. The provisions of the ISDA Master Agreement typically permit a single net payment in the event of default including the bankruptcy or insolvency of the counterparty. However, bankruptcy or insolvency laws of a particular jurisdiction may impose restrictions on or prohibitions against the right of offset in bankruptcy, insolvency or other events.
Collateral Requirements: For derivatives traded under an ISDA Master Agreement, the collateral requirements are typically calculated by netting the mark-to-market amount for each transaction under such agreement and comparing that amount to the value of any collateral currently pledged by the Master Portfolio and the counterparty.
Cash collateral that has been pledged to cover obligations of the Master Portfolio and cash collateral received from the counterparty, if any, is reported separately in the Statement of Assets and Liabilities as cash pledged as collateral and cash received as collateral, respectively. Non-cash collateral pledged by the Master Portfolio, if any, is noted in the Schedule of Investments. Generally, the amount of collateral due from or to a counterparty is subject to a certain minimum transfer amount threshold before a transfer is required, which is determined at the close of business of the Master Portfolio. Any additional required collateral is delivered to/pledged by the Master Portfolio on the next business day. Typically, the counterparty is not permitted to sell, re-pledge or use cash and non-cash collateral it receives. The Master Portfolio generally agrees not to use non-cash collateral that it receives but may, absent default or certain other circumstances defined in the underlying ISDA Master Agreement, be permitted to use cash collateral received. In such cases, interest may be paid pursuant to the collateral arrangement with the counterparty. To the extent amounts due to the Master Portfolio from the counterparties are not fully collateralized, the Master Portfolio bears the risk of loss from counterparty non-performance. Likewise, to the extent the Master Portfolio has delivered collateral to a counterparty and stands ready to perform under the terms of its agreement with such counterparty, the Master Portfolio bears the risk of loss from a counterparty in the amount of the value of the collateral in the event the counterparty fails to return such collateral. Based on the terms of agreements, collateral may not be required for all derivative contracts.
For financial reporting purposes, the Master Portfolio does not offset derivative assets and derivative liabilities that are subject to netting arrangements, if any, in the Statement of Assets and Liabilities.
| 6. | INVESTMENT ADVISORY AGREEMENT AND OTHER TRANSACTIONS WITH AFFILIATES |
Investment Advisory: MIP, on behalf of the Master Portfolio, entered into an Investment Advisory Agreement with the Manager, the Master Portfolio’s investment adviser and an indirect, wholly-owned subsidiary of BlackRock, to provide investment advisory services. The Manager is responsible for the management of the Master Portfolio’s portfolio and provides the personnel, facilities, equipment and certain other services necessary to the operations of the Master Portfolio.
| | |
MASTER PORTFOLIO NOTES TO FINANCIAL STATEMENTS | | 41 |
Notes to Financial Statements (continued)
For such services, the Master Portfolio pays the Manager a monthly fee at an annual rate equal to the following percentages of the average daily value of the Master Portfolio’s net assets:
| | | | |
| | |
| Average Daily Net Assets | | Investment Advisory Fees | |
| |
First $1 billion | | | 0.25 | % |
$1 billion — $3 billion | | | 0.24 | |
$3 billion — $5 billion | | | 0.23 | |
$5 billion — $10 billion | | | 0.22 | |
Greater than $10 billion | | | 0.21 | |
MIP, on behalf of the Master Portfolio entered into an Administration Agreement with BlackRock Advisors, LLC (“BAL”), which has agreed to provide general administrative services (other than investment advice and related portfolio activities). BAL has agreed to bear all of the Master Portfolio’s ordinary operating expenses, excluding, generally, investment advisory fees, distribution fees, brokerage and other expenses related to the execution of portfolio transactions, extraordinary expenses and certain other expenses which are borne by the Master Portfolio. BAL is entitled to receive for these administrative services an annual fee of 0.10% based on the average daily net assets of the Master Portfolio.
From time to time, BAL may waive such fees in whole or in part. Any such waiver will reduce the expenses of the Master Portfolio and, accordingly, have a favorable impact on its performance. BAL may delegate certain of its administration duties to sub-administrators.
Expense Waivers and Reimbursements: The Manager has voluntarily agreed to waive 0.095% of the investment advisory fees payable by the Master Portfolio. This voluntary waiver may be terminated at any time. This amount is included in fees waived and/or reimbursed by the Manager in the Statement of Operations. During the year ended December 31, 2021, the Manager waived $817,281 pursuant to this agreement.
BAL voluntarily agreed to waive all of its administration fees payable by the Master Portfolio. This arrangement is voluntary and may be terminated by BAL at any time. This amount is included in fees waived and/or reimbursed by the Administrator in the Statement of Operations. For the year ended December 31, 2021, the amount waived was $860,211.
The fees and expenses of MIP’s trustees who are not “interested persons” of MIP, as defined in the 1940 Act (“Independent Trustees”), counsel to the Independent Trustees and the Master Portfolio’s independent registered public accounting firm (together, the “independent expenses”) are paid directly by the Master Portfolio. Each of BAL and BFA has contractually agreed to reimburse the Master Portfolio or provide an offsetting credit against the investment advisory fees paid by the Master Portfolio in an amount equal to these independent expenses through June 30, 2023. For the year ended December 31, 2021, the amount waived was $32,798 which is included in fees waived and/or reimbursed by the Manager in the Statement of Operations.
With respect to the Master Portfolio, the Manager contractually agreed to waive its investment advisory fees by the amount of investment advisory fees the Master Portfolio pays to the Manager indirectly through its investment in affiliated money market funds (the “affiliated money market fund waiver”) through June 30, 2023. The contractual agreement may be terminated upon 90 days’ notice by a majority of the Independent Trustees, or by a vote of a majority of the outstanding voting securities of the Master Portfolio. This amount is included in fees waived and/or reimbursed by the Manager in the Statement of Operations. For the year ended December 31, 2021, the amount waived was $53,638.
The Manager has contractually agreed to waive its investment advisory fee with respect to any portion of the Master Portfolio’s assets invested in affiliated equity and fixed-income mutual funds and affiliated exchange-traded funds that have a contractual management fee through June 30, 2023. The agreement can be renewed for annual periods thereafter, and may be terminated on 90 days’ notice, each subject to approval by a majority of the Master Portfolio’s Independent Trustees. For the year ended December 31, 2021, there were no fees waived by the Manager pursuant to this arrangement.
Securities Lending: The U.S. Securities and Exchange Commission (“SEC”) has issued an exemptive order which permits BTC, an affiliate of the Manager, to serve as securities lending agent for the Master Portfolio, subject to applicable conditions. As securities lending agent, BTC bears all operational costs directly related to securities lending, including any custodial costs. The Master Portfolio is responsible for fees in connection with the investment of cash collateral received for securities on loan (the “collateral investment fees”). The cash collateral is invested in a money market fund, BlackRock Cash Funds: Institutional or BlackRock Cash Funds: Treasury, managed by the Manager or its affiliates. However, BTC has agreed to reduce the amount of securities lending income it receives in order to effectively limit the collateral investment fees the Master Portfolio bears to an annual rate of 0.04%. The SL Agency Shares of such money market fund will not be subject to a sales load, distribution fee or service fee. The money market fund in which the cash collateral has been invested may, under certain circumstances, impose a liquidity fee of up to 2% of the value redeemed or temporarily restrict redemptions for up to 10 business days during a 90 day period, in the event that the money market fund’s weekly liquid assets fall below certain thresholds.
Securities lending income is equal to the total of income earned from the reinvestment of cash collateral, net of fees and other payments to and from borrowers of securities, and less the collateral investment fees. The Master Portfolio retains a portion of securities lending income and remits a remaining portion to BTC as compensation for its services as securities lending agent.
Pursuant to the current securities lending agreement, the Master Portfolio retains 82% of securities lending income (which excludes collateral investment fees), and this amount retained can never be less than 70% of the total of securities lending income plus the collateral investment fees.
In addition, commencing the business day following the date that the aggregate securities lending income earned across the BlackRock Multi-Asset Complex in a calendar year exceeds a specified threshold, the Master Portfolio, pursuant to the securities lending agreement, will retain for the remainder of that calendar year securities lending income in an amount equal to 85% of securities lending income (which excludes collateral investment fees), and this amount retained can never be less than 70% of the total of securities lending income plus the collateral investment fees.
| | |
| 42 | | 2 0 2 1 BLACK ROCK ANNUAL REPORT TO SHAREHOLDERS |
Notes to Financial Statements (continued)
The share of securities lending income earned by the Master Portfolio is shown as securities lending income — affiliated — net in the Statement of Operations. For the year ended December 31, 2021, the Master Portfolio paid BTC $48,247 for securities lending agent services.
Interfund Lending: In accordance with an exemptive order (the “Order”) from the SEC, the Master Portfolio may participate in a joint lending and borrowing facility for temporary purposes (the “Interfund Lending Program”), subject to compliance with the terms and conditions of the Order, and to the extent permitted by the Master Portfolio’s investment policies and restrictions. The Master Portfolio is currently permitted to borrow and lend under the Interfund Lending Program.
A lending BlackRock fund may lend in aggregate up to 15% of its net assets but may not lend more than 5% of its net assets to any one borrowing fund through the Interfund Lending Program. A borrowing BlackRock fund may not borrow through the Interfund Lending Program or from any other source more than 33 1/3% of its total assets (or any lower threshold provided for by the fund’s investment restrictions). If a borrowing BlackRock fund’s total outstanding borrowings exceed 10% of its total assets, each of its outstanding interfund loans will be subject to collateralization of at least 102% of the outstanding principal value of the loan. All interfund loans are for temporary or emergency purposes and the interest rate to be charged will be the average of the highest current overnight repurchase agreement rate available to a lending fund and the bank loan rate, as calculated according to a formula established by the Board.
During the year ended December 31, 2021, the Master Portfolio did not participate in the Interfund Lending Program.
Trustees and Officers: Certain trustees and/or officers of MIP are directors and/or officers of BlackRock or its affiliates.
Other Transactions: The Master Portfolio may purchase securities from, or sell securities to, an affiliated fund provided the affiliation is due solely to having a common investment adviser, common officers, or common trustees. For the year ended December 31, 2021, the purchase and sale transactions and any net realized gains (losses) with affiliated funds in compliance with Rule 17a-7 under the 1940 Act were as follows:
| | | | | | | | | | | | |
| |
| | | |
| Master Portfolio Name | | Purchases | | | Sales | | | Net Realized Gain (Loss) | |
| |
| | | |
Diversified Equity Master Portfolio | | $ | 333,856 | | | $ | 147,141 | | | $ | 24,312 | |
| |
For the year ended December 31, 2021, purchases and sales of investments, excluding short-term investments, were $996,832,271 and $933,637,875, respectively.
The Master Portfolio is classified as a partnership for U.S. federal income tax purposes. As such, each investor in the Master Portfolio is treated as the owner of its proportionate share of net assets, income, expenses and realized and unrealized gains and losses of the Master Portfolio. Therefore, no U.S. federal income tax provision is required. It is intended that the Master Portfolio’s assets will be managed so an investor in the Master Portfolio can satisfy the requirements of Subchapter M of the Internal Revenue Code of 1986, as amended.
The Master Portfolio files U.S. federal and various state and local tax returns. No income tax returns are currently under examination. The statute of limitations on the Master Portfolio’s U.S. federal tax returns generally remains open for a period of three fiscal years after they are filed. The statutes of limitations on the Master Portfolio’s state and local tax returns may remain open for an additional year depending upon the jurisdiction.
Management has analyzed tax laws and regulations and their application to the Master Portfolio as of December 31, 2021, inclusive of the open tax return years, and does not believe that there are any uncertain tax positions that require recognition of a tax liability in the Master Portfolio’s financial statements.
As of December 31, 2021, gross unrealized appreciation and depreciation based on cost of investments (including short positions and derivatives, if any) for U.S. federal income tax purposes were as follows:
| | | | | | | | | | | | | | | | |
| |
| | | | |
| Master Portfolio Name | | Tax Cost | | | Gross Unrealized Appreciation | | | Gross Unrealized Depreciation | | | Net Unrealized Appreciation (Depreciation) | |
| |
| | | | |
Diversified Equity Master Portfolio | | $ | 828,128,192 | | | $ | 202,212,733 | | | $ | (43,212,788 | ) | | $ | 158,999,945 | |
| |
MIP, on behalf of the Master Portfolio, along with certain other funds managed by the Manager and its affiliates (“Participating Funds”), is a party to a 364-day, $2.25 billion credit agreement with a group of lenders. Under this agreement, the Master Portfolio may borrow to fund shareholder redemptions. Excluding commitments designated for certain individual funds, the Participating Funds, including the Master Portfolio, can borrow up to an aggregate commitment amount of $1.75 billion at any time outstanding, subject to asset coverage and other limitations as specified in the agreement. The credit agreement has the following terms: a fee of 0.10% per annum on unused commitment amounts and interest at a rate equal to the higher of (a) one-month London Interbank Offered Rate (“LIBOR”) (but, in any event, not less than 0.00%) on the date the loan is made plus 0.80% per annum or (b) the Fed Funds rate (but, in any event, not less than 0.00%) in effect from time to time plus 0.80% per annum on amounts borrowed. The agreement expires in April 2022 unless extended or renewed. These fees were allocated among such funds based upon portions of the aggregate commitment available to them and relative net assets of Participating Funds. During the year ended December 31, 2021, the Master Portfolio did not borrow under the credit agreement.
| | |
MASTER PORTFOLIO NOTES TO FINANCIAL STATEMENTS | | 43 |
Notes to Financial Statements (continued)
In the normal course of business, the Master Portfolio invests in securities or other instruments and may enter into certain transactions, and such activities subject the Master Portfolio to various risks, including among others, fluctuations in the market (market risk) or failure of an issuer to meet all of its obligations. The value of securities or other instruments may also be affected by various factors, including, without limitation: (i) the general economy; (ii) the overall market as well as local, regional or global political and/or social instability; (iii) regulation, taxation or international tax treaties between various countries; or (iv) currency, interest rate and price fluctuations. Local, regional or global events such as war, acts of terrorism, the spread of infectious illness or other public health issues, recessions, or other events could have a significant impact on the Master Portfolio and its investments. The Master Portfolio’s prospectus provides details of the risks to which the Master Portfolio is subject.
The Master Portfolio may be exposed to additional risks when reinvesting cash collateral in money market funds that do not seek to maintain a stable NAV per share of $1.00, which may be subject to redemption gates or liquidity fees under certain circumstances.
Market Risk: An outbreak of respiratory disease caused by a novel coronavirus has developed into a global pandemic and has resulted in closing borders, quarantines, disruptions to supply chains and customer activity, as well as general concern and uncertainty. The impact of this pandemic, and other global health crises that may arise in the future, could affect the economies of many nations, individual companies and the market in general in ways that cannot necessarily be foreseen at the present time. This pandemic may result in substantial market volatility and may adversely impact the prices and liquidity of a fund’s investments. The duration of this pandemic and its effects cannot be determined with certainty.
Valuation Risk: The market values of equities, such as common stocks and preferred securities or equity related investments, such as futures and options, may decline due to general market conditions which are not specifically related to a particular company. They may also decline due to factors which affect a particular industry or industries. The Master Portfolio may invest in illiquid investments. An illiquid investment is any investment that the Master Portfolio reasonably expects cannot be sold or disposed of in current market conditions in seven calendar days or less without the sale or disposition significantly changing the market value of the investment. The Master Portfolio may experience difficulty in selling illiquid investments in a timely manner at the price that it believes the investments are worth. Prices may fluctuate widely over short or extended periods in response to company, market or economic news. Markets also tend to move in cycles, with periods of rising and falling prices. This volatility may cause the Master Portfolio’s NAV to experience significant increases or decreases over short periods of time. If there is a general decline in the securities and other markets, the NAV of the Master Portfolio may lose value, regardless of the individual results of the securities and other instruments in which the Master Portfolio invests.
The price the Master Portfolio could receive upon the sale of any particular portfolio investment may differ from the Master Portfolio’s valuation of the investment, particularly for securities that trade in thin or volatile markets or that are valued using a fair valuation technique or a price provided by an independent pricing service. Changes to significant unobservable inputs and assumptions (i.e., publicly traded company multiples, growth rate, time to exit) due to the lack of observable inputs may significantly impact the resulting fair value and therefore the Master Portfolio’s results of operations. As a result, the price received upon the sale of an investment may be less than the value ascribed by the Master Portfolio, and the Master Portfolio could realize a greater than expected loss or lesser than expected gain upon the sale of the investment. The Master Portfolio’s ability to value its investments may also be impacted by technological issues and/or errors by pricing services or other third-party service providers.
Counterparty Credit Risk: The Master Portfolio may be exposed to counterparty credit risk, or the risk that an entity may fail to or be unable to perform on its commitments related to unsettled or open transactions, including making timely interest and/or principal payments or otherwise honoring its obligations. The Master Portfolio manages counterparty credit risk by entering into transactions only with counterparties that the Manager believes have the financial resources to honor their obligations and by monitoring the financial stability of those counterparties. Financial assets, which potentially expose the Master Portfolio to market, issuer and counterparty credit risks, consist principally of financial instruments and receivables due from counterparties. The extent of the Master Portfolio’s exposure to market, issuer and counterparty credit risks with respect to these financial assets is approximately their value recorded in the Statement of Assets and Liabilities, less any collateral held by the Master Portfolio.
A derivative contract may suffer a mark-to-market loss if the value of the contract decreases due to an unfavorable change in the market rates or values of the underlying instrument. Losses can also occur if the counterparty does not perform under the contract.
With exchange-traded futures and centrally cleared swaps, there is less counterparty credit risk to the Master Portfolio since the exchange or clearinghouse, as counterparty to such instruments, guarantees against a possible default. The clearinghouse stands between the buyer and the seller of the contract; therefore, credit risk is limited to failure of the clearinghouse. While offset rights may exist under applicable law, the Master Portfolio does not have a contractual right of offset against a clearing broker or clearinghouse in the event of a default (including the bankruptcy or insolvency). Additionally, credit risk exists in exchange-traded futures and centrally cleared swaps with respect to initial and variation margin that is held in a clearing broker’s customer accounts. While clearing brokers are required to segregate customer margin from their own assets, in the event that a clearing broker becomes insolvent or goes into bankruptcy and at that time there is a shortfall in the aggregate amount of margin held by the clearing broker for all its clients, typically the shortfall would be allocated on a pro rata basis across all the clearing broker’s customers, potentially resulting in losses to the Master Portfolio.
Concentration Risk: A diversified portfolio, where this is appropriate and consistent with a fund’s objectives, minimizes the risk that a price change of a particular investment will have a material impact on the NAV of a fund. The investment concentrations within the Master Portfolio’s portfolio are disclosed in its Schedule of Investments.
LIBOR Transition Risk: The United Kingdom’s Financial Conduct Authority announced a phase out of the LIBOR. Although many LIBOR rates will cease to be published or no longer will be representative of the underlying market they seek to measure after December 31, 2021, a selection of widely used USD LIBOR rates will continue to be published through June 2023 in order to assist with the transition. The Master Portfolio may be exposed to financial instruments tied to LIBOR to determine payment obligations, financing terms, hedging strategies or investment value. The transition process away from LIBOR might lead to increased volatility and illiquidity in markets for, and reduce the effectiveness of new hedges placed against instruments whose terms currently include LIBOR. The ultimate effect of the LIBOR transition process on the Master Portfolio is uncertain.
| | |
| 44 | | 2 0 2 1 BLACK ROCK ANNUAL REPORT TO SHAREHOLDERS |
Notes to Financial Statements (continued)
Management has evaluated the impact of all subsequent events on the Master Portfolio through the date the financial statements were issued and has determined that there were no subsequent events requiring adjustment or additional disclosure in the financial statements.
| | |
MASTER PORTFOLIO NOTES TO FINANCIAL STATEMENTS | | 45 |
Report of Independent Registered Public Accounting Firm
To the Board of Trustees of Master Investment Portfolio and Investors of Diversified Equity Master Portfolio
Opinion on the Financial Statements
We have audited the accompanying statement of assets and liabilities, including the schedule of investments, of Diversified Equity Master Portfolio (one of the series constituting Master Investment Portfolio, referred to hereafter as the “Master Portfolio”) as of December 31, 2021, the related statement of operations for the year ended December 31, 2021, the statements of changes in net assets for each of the two years in the period ended December 31, 2021, including the related notes, and the financial highlights for each of the five years in the period ended December 31, 2021 (collectively referred to as the “financial statements”). In our opinion, the financial statements present fairly, in all material respects, the financial position of the Master Portfolio as of December 31, 2021, the results of its operations for the year then ended, the changes in its net assets for each of the two years in the period ended December 31, 2021 and the financial highlights for each of the five years in the period ended December 31, 2021 in conformity with accounting principles generally accepted in the United States of America.
Basis for Opinion
These financial statements are the responsibility of the Master Portfolio’s management. Our responsibility is to express an opinion on the Master Portfolio’s financial statements based on our audits. We are a public accounting firm registered with the Public Company Accounting Oversight Board (United States) (PCAOB) and are required to be independent with respect to the Master Portfolio in accordance with the U.S. federal securities laws and the applicable rules and regulations of the Securities and Exchange Commission and the PCAOB.
We conducted our audits of these financial statements in accordance with the standards of the PCAOB. Those standards require that we plan and perform the audit to obtain reasonable assurance about whether the financial statements are free of material misstatement, whether due to error or fraud.
Our audits included performing procedures to assess the risks of material misstatement of the financial statements, whether due to error or fraud, and performing procedures that respond to those risks. Such procedures included examining, on a test basis, evidence regarding the amounts and disclosures in the financial statements. Our audits also included evaluating the accounting principles used and significant estimates made by management, as well as evaluating the overall presentation of the financial statements. Our procedures included confirmation of securities owned as of December 31, 2021 by correspondence with the custodian, transfer agent and brokers. We believe that our audits provide a reasonable basis for our opinion.
|
| /s/PricewaterhouseCoopers LLP |
| Philadelphia, Pennsylvania |
| February 24, 2022 |
We have served as the auditor of one or more BlackRock investment companies since 2000.
| | |
| 46 | | 2 0 2 1 BLACK ROCK ANNUAL REPORT TO SHAREHOLDERS |
Statement Regarding Liquidity Risk Management Program
In compliance with Rule 22e-4 under the Investment Company Act of 1940, as amended (the “Liquidity Rule”), Master Investment Portfolio (“MIP”) has adopted and implemented a liquidity risk management program (the “Program”) for Diversified Equity Master Portfolio (the “Fund”), a series of MIP, which is reasonably designed to assess and manage the Fund’s liquidity risk.
The Board of Trustees (the “Board”) of MIP, on behalf of the Fund, met on November 9-10, 2021 (the “Meeting”) to review the Program. The Board previously appointed BlackRock Advisors, LLC or BlackRock Fund Advisors (“BlackRock”), each an investment adviser to certain BlackRock funds, as the program administrator for the Fund’s Program, as applicable. BlackRock also previously delegated oversight of the Program to the 40 Act Liquidity Risk Management Committee (the “Committee”). At the Meeting, the Committee, on behalf of BlackRock, provided the Board with a report that addressed the operation of the Program and assessed its adequacy and effectiveness of implementation, including the management of the Fund’s Highly Liquid Investment Minimum (“HLIM”) where applicable, and any material changes to the Program (the “Report”). The Report covered the period from October 1, 2020 through September 30, 2021 (the “Program Reporting Period”).
The Report described the Program’s liquidity classification methodology for categorizing the Fund’s investments (including derivative transactions) into one of four liquidity buckets. It also referenced the methodology used by BlackRock to establish the Fund’s HLIM and noted that the Committee reviews and ratifies the HLIM assigned to the Fund no less frequently than annually. The Report also discussed notable events affecting liquidity over the Program Reporting Period, including the imposition of capital controls in certain countries.
The Report noted that the Program complied with the key factors for consideration under the Liquidity Rule for assessing, managing and periodically reviewing the Fund’s liquidity risk, as follows:
| | a) | The Fund’s investment strategy and liquidity of portfolio investments during both normal and reasonably foreseeable stressed conditions. During the Program Reporting Period, the Committee reviewed whether the Fund’s strategy is appropriate for an open-end fund structure with a focus on funds with more significant and consistent holdings of less liquid and illiquid assets. The Committee also factored a fund’s concentration in an issuer into the liquidity classification methodology by taking issuer position sizes into account. Where a fund participated in borrowings for investment purposes (such as tender option bonds or reverse repurchase agreements), such borrowings were factored into the Program’s calculation of a fund’s liquidity bucketing. Derivative exposure was also considered in such calculation. |
| | b) | Short-term and long-term cash flow projections during both normal and reasonably foreseeable stressed conditions. During the Program Reporting Period, the Committee reviewed historical redemption activity and used this information as a component to establish the Fund’s reasonably anticipated trading size (“RATS”). The Fund has adopted an in-kind redemption policy which may be utilized to meet larger redemption requests. The Committee may also take into consideration a fund’s shareholder ownership concentration (which, depending on product type and distribution channel, may or may not be available), a fund’s distribution channels, and the degree of certainty associated with a fund’s short-term and long-term cash flow projections. |
| | c) | Holdings of cash and cash equivalents, as well as borrowing arrangements. The Committee considered the terms of the credit facility committed to the Fund, the financial health of the institution providing the facility and the fact that the credit facility is shared among multiple funds (including that a portion of the aggregate commitment amount is specifically designated for BlackRock Floating Rate Income Portfolio, a series of BlackRock Funds V). The Committee also considered other types of borrowing available to the Master Portfolio, such as the ability to use reverse repurchase agreements and interfund lending, as applicable. |
There were no material changes to the Program during the Program Reporting Period other than the enhancement of certain model components in the Program’s methodology. The Report provided to the Board stated that the Committee concluded that based on the operation of the functions, as described in the Report, the Program is operating as intended and is effective in implementing the requirements of the Liquidity Rule.
| | |
STATEMENT REGARDING LIQUIDITY RISK MANAGEMENT PROGRAM | | 47 |
Trustee and Officer Information
| | | | | | | | |
| Independent Trustees(a) |
| | | | | |
Name Year of Birth(b) | | Position(s) Held (Length of Service)(c) | | Principal Occupation(s) During Past Five Years | | Number of BlackRock-Advised Registered Investment Companies (“RICs”) Consisting of Investment Portfolios (“Portfolios”) Overseen | | Public Company and Other Investment Company Directorships Held During Past Five Years |
| | | | |
Mark Stalnecker 1951 | | Chair of the Board (Since 2019) and Trustee (Since 2015) | | Chief Investment Officer, University of Delaware from 1999 to 2013; Trustee and Chair of the Finance and Investment Committees, Winterthur Museum and Country Estate from 2005 to 2016; Member of the Investment Committee, Delaware Public Employees’ Retirement System since 2002; Member of the Investment Committee, Christiana Care Health System from 2009 to 2017; Member of the Investment Committee, Delaware Community Foundation from 2013 to 2014; Director and Chair of the Audit Committee, SEI Private Trust Co. from 2001 to 2014. | | 30 RICs consisting of 159 Portfolios | | None |
| | | | |
Bruce R. Bond 1946 | | Trustee (Since 2019) | | Board Member, Amsphere Limited (software) since 2018; Trustee and Member of the Governance Committee, State Street Research Mutual Funds from 1997 to 2005; Board Member of Governance, Audit and Finance Committee, Avaya Inc. (computer equipment) from 2003 to 2007. | | 30 RICs consisting of 159 Portfolios | | None |
| | | | |
Susan J. Carter 1956 | | Trustee (Since 2016) | | Director, Pacific Pension Institute from 2014 to 2018; Advisory Board Member, Center for Private Equity and Entrepreneurship at Tuck School of Business since 1997; Senior Advisor, Commonfund Capital, Inc. (“CCI”) (investment adviser) in 2015; Chief Executive Officer, CCI from 2013 to 2014; President & Chief Executive Officer, CCI from 1997 to 2013; Advisory Board Member, Girls Who Invest from 2015 to 2018 and Board Member thereof since 2018; Advisory Board Member, Bridges Fund Management since 2016; Trustee, Financial Accounting Foundation since 2017; Practitioner Advisory Board Member, Private Capital Research Institute (“PCRI”) since 2017; Lecturer in the Practice of Management, Yale School of Management since 2019; Advisor to Finance Committee, Altman Foundation since 2020. | | 30 RICs consisting of 159 Portfolios | | None |
| | | | |
Collette Chilton 1958 | | Trustee (Since 2015) | | Chief Investment Officer, Williams College since 2006; Chief Investment Officer, Lucent Asset Management Corporation from 1998 to 2006; Director, Boys and Girls Club of Boston since 2017; Director, B1 Capital since 2018; Director, David and Lucile Packard Foundation since 2020. | | 30 RICs consisting of 159 Portfolios | | None |
| | | | |
Neil A. Cotty 1954 | | Trustee (Since 2016) | | Bank of America Corporation from 1996 to 2015, serving in various senior finance leadership roles, including Chief Accounting Officer from 2009 to 2015, Chief Financial Officer of Global Banking, Markets and Wealth Management from 2008 to 2009, Chief Accounting Officer from 2004 to 2008, Chief Financial Officer of Consumer Bank from 2003 to 2004, Chief Financial Officer of Global Corporate Investment Bank from 1999 to 2002. | | 30 RICs consisting of 159 Portfolios | | None |
| | | | |
Lena G. Goldberg 1949 | | Trustee (Since 2019) | | Director, Charles Stark Draper Laboratory, Inc. since 2013; Senior Lecturer, Harvard Business School, from 2008 to 2021; FMR LLC/Fidelity Investments (financial services) from 1996 to 2008, serving in various senior roles including Executive Vice President - Strategic Corporate Initiatives and Executive Vice President and General Counsel; Partner, Sullivan & Worcester LLP from 1985 to 1996 and Associate thereof from 1979 to 1985. | | 30 RICs consisting of 159 Portfolios | | None |
| | |
| 48 | | 2 0 2 1 BLACK ROCK ANNUAL REPORT TO SHAREHOLDERS |
Trustee and Officer Information (continued)
| | | | | | | | |
| Independent Trustees(a) (continued) |
| | | | | |
Name Year of Birth(b) | | Position(s) Held (Length of Service)(c) | | Principal Occupation(s) During Past Five Years | | Number of BlackRock-Advised Registered Investment Companies (“RICs”) Consisting of Investment Portfolios (“Portfolios”) Overseen | | Public Company
and Other Investment Company Directorships Held During Past Five Years |
| | | | |
Henry R. Keizer 1956 | | Trustee (Since 2019) | | Director, Park Indemnity Ltd. (captive insurer) since 2010; Director, MUFG Americas Holdings Corporation and MUFG Union Bank, N.A. (financial and bank holding company) from 2014 to 2016; Director, American Institute of Certified Public Accountants from 2009 to 2011; Director, KPMG LLP (audit, tax and advisory services) from 2004 to 2005 and 2010 to 2012; Director, KPMG International in 2012, Deputy Chairman and Chief Operating Officer thereof from 2010 to 2012 and U.S. Vice Chairman of Audit thereof from 2005 to 2010; Global Head of Audit, KPMGI (consortium of KPMG firms) from 2006 to 2010; Director, YMCA of Greater New York from 2006 to 2010. | | 30 RICs consisting of 159 Portfolios | | Hertz Global Holdings (car rental); Sealed Air Corp. (packaging); GrafTech International Ltd. (materials manufacturing); Montpelier Re Holdings, Ltd. (publicly held property and casualty reinsurance) from 2013 to 2015; WABCO (commercial vehicle safety systems) from 2015 to 2020. |
| | | | |
Cynthia A. Montgomery 1952 | | Trustee (Since 2009) | | Professor, Harvard Business School since 1989. | | 30 RICs consisting of 159 Portfolios | | Newell Rubbermaid, Inc. (manufacturing) from 1995 to 2016. |
| | | | |
Donald C. Opatrny 1952 | | Trustee (Since 2019) | | Trustee, Vice Chair, Member of the Executive Committee and Chair of the Investment Committee, Cornell University from 2004 to 2019; President, Trustee and Member of the Investment Committee, The Aldrich Contemporary Art Museum from 2007 to 2014; Member of the Board and Investment Committee, University School from 2007 to 2018; Member of the Investment Committee, Mellon Foundation from 2009 to 2015; Trustee, Artstor (a Mellon Foundation affiliate) from 2010 to 2015; President and Trustee, the Center for the Arts, Jackson Hole from 2011 to 2018; Director, Athena Capital Advisors LLC (investment management firm) since 2013; Trustee and Chair of the Investment Committee, Community Foundation of Jackson Hole since 2014; Member of Affordable Housing Supply Board of Jackson, Wyoming since 2017; Member, Investment Funds Committee, State of Wyoming since 2017; Trustee, Phoenix Art Museum since 2018; Trustee, Arizona Community Foundation and Member of Investment Committee since 2020. | | 30 RICs consisting of 159 Portfolios | | None |
| | | | |
Joseph P. Platt 1947 | | Trustee (Since 2009) | | General Partner, Thorn Partners, LP (private investments) since 1998; Director, WQED Multi-Media (public broadcasting not-for-profit) since 2001; Chair, Basic Health International (non-profit) since 2015. | | 30 RICs consisting of 159 Portfolios | | Greenlight Capital Re, Ltd. (reinsurance company); Consol Energy Inc. |
| | |
TRUSTEE AND OFFICER INFORMATION | | 49 |
Trustee and Officer Information (continued)
| | | | | | | | |
| Independent Trustees(a) (continued) |
| | | | | |
Name Year of Birth(b) | | Position(s) Held (Length of Service)(c) | | Principal Occupation(s) During Past Five Years | | Number of BlackRock-Advised Registered Investment Companies (“RICs”) Consisting of Investment Portfolios (“Portfolios”) Overseen | | Public Company and Other Investment Company Directorships Held During Past Five Years |
| | | | |
Kenneth L. Urish 1951 | | Trustee (Since 2009) | | Managing Partner, Urish Popeck & Co., LLC (certified public accountants and consultants) since 1976; Past- Chairman of the Professional Ethics Committee of the Pennsylvania Institute of Certified Public Accountants and Committee Member thereof since 2007; Member of External Advisory Board, The Pennsylvania State University Accounting Department since founding in 2001; Principal, UP Strategic Wealth Investment Advisors, LLC since 2013; Trustee, The Holy Family Institute from 2001 to 2010; President and Trustee, Pittsburgh Catholic Publishing Associates from 2003 to 2008; Director, Inter- Tel from 2006 to 2007; Member, Advisory Board, ESG Competent Boards since 2020. | | 30 RICs consisting of 159 Portfolios | | None |
| | | | |
Claire A. Walton 1957 | | Trustee (Since 2016) | | Chief Operating Officer and Chief Financial Officer of Liberty Square Asset Management, LP from 1998 to 2015; General Partner of Neon Liberty Capital Management, LLC since 2003; Director, Boston Hedge Fund Group from 2009 to 2018; Director, Woodstock Ski Runners since 2013; Director, Massachusetts Council on Economic Education from 2013 to 2015. | | 30 RICs consisting of 159 Portfolios | | None |
| | |
| 50 | | 2 0 2 1 BLACK ROCK ANNUAL REPORT TO SHAREHOLDERS |
Trustee and Officer Information (continued)
| | | | | | | | |
| Interested Trustees(a)(d) |
| | | | | |
Name Year of Birth(b) | | Position(s) Held (Length of Service)(c) | | Principal Occupation(s) During Past Five Years | | Number of BlackRock-Advised Registered Investment Companies (“RICs”) Consisting of Investment Portfolios (“Portfolios”) Overseen | | Public Company and Other Investment Company Directorships Held During Past Five Years |
| | | | |
Robert Fairbairn 1965 | | Trustee (Since 2018) | | Vice Chairman of BlackRock, Inc. since 2019; Member of BlackRock’s Global Executive and Global Operating Committees; Co-Chair of BlackRock’s Human Capital Committee; Senior Managing Director of BlackRock, Inc. from 2010 to 2019; oversaw BlackRock’s Strategic Partner Program and Strategic Product Management Group from 2012 to 2019; Member of the Board of Managers of BlackRock Investments, LLC from 2011 to 2018; Global Head of BlackRock’s Retail and iShares® businesses from 2012 to 2016. | | 103 RICs consisting of 261 Portfolios | | None |
| | | | |
John M. Perlowski(e) 1964 | | Trustee (Since 2015)
President and Chief Executive Officer (Since 2010) | | Managing Director of BlackRock, Inc. since 2009; Head of BlackRock Global Accounting and Product Services since 2009; Advisory Director of Family Resource Network (charitable foundation) since 2009. | | 105 RICs consisting of 263 Portfolios | | None |
| (a) | The address of each Trustee is c/o BlackRock, Inc., 55 East 52nd Street, New York, New York 10055. |
| (b) | Independent Trustees serve until their resignation, retirement, removal or death, or until December 31 of the year in which they turn 75. The Board may determine to extend the terms of Independent Trustees on a case-by-case basis, as appropriate. |
| (c) | In connection with the acquisition of Barclays Global Investors by BlackRock, Inc. in December 2009, certain Independent Trustees were elected to the Board. Furthermore, effective January 1, 2019, three BlackRock Fund Complexes were realigned and consolidated into two BlackRock Fund Complexes. As a result, although the chart shows the year that each Independent Trustee joined the Board, certain Independent Trustees first became members of the boards of other BlackRock-advised Funds or legacy BlackRock funds as follows: Bruce R. Bond, 2005; Cynthia A. Montgomery, 1994; Joseph P. Platt, 1999; Kenneth L. Urish, 1999; Lena G. Goldberg, 2016; Henry R. Keizer, 2016; Donald C. Opatrny, 2015. |
| (d) | Mr. Fairbairn and Mr. Perlowski are both “interested persons,” as defined in the 1940 Act, of MIP based on their positions with BlackRock, Inc. and its affiliates. Mr. Fairbairn and Mr. Perlowski are also board members of the BlackRock Fixed-Income Complex. |
| (e) | Mr. Perlowski is also a trustee of the BlackRock Credit Strategies Fund and BlackRock Private Investments Fund. |
| | | | |
| Officers Who Are Not Trustees(a) |
| | | |
Name Year of Birth(b) | | Position(s) Held (Length of Service) | | Principal Occupation(s) During Past Five Years |
| | |
Thomas Callahan 1968 | | Vice President (Since 2016) | | Managing Director of BlackRock, Inc. since 2013; Member of the Board of Managers of BlackRock Investments, LLC (principal underwriter) since 2019 and Managing Director thereof since 2017; Head of BlackRock’s Global Cash Management Business since 2016; Co-Head of the Global Cash Management Business from 2014 to 2016; Deputy Head of the Global Cash Management Business from 2013 to 2014; Member of the Cash Management Group Executive Committee since 2013; Chief Executive Officer of NYSE Liffe U.S. from 2008 to 2013. |
| | |
Jennifer McGovern 1977 | | Vice President (Since 2014) | | Managing Director of BlackRock, Inc. since 2016; Director of BlackRock, Inc. from 2011 to 2015; Head of Americas Product Development and Governance for BlackRock’s Global Product Group since 2019; Head of Product Structure and Oversight for BlackRock’s U.S. Wealth Advisory Group from 2013 to 2019. |
| | |
Trent Walker 1974 | | Chief Financial Officer (Since 2021) | | Managing Director of BlackRock, Inc. since September 2019; Executive Vice President of PIMCO from 2016 to 2019; Senior Vice President of PIMCO from 2008 to 2015; Treasurer from 2013 to 2019 and Assistant Treasurer from 2007 to 2017 of PIMCO Funds, PIMCO Variable Insurance Trust, PIMCO ETF Trust, PIMCO Equity Series, PIMCO Equity Series VIT, PIMCO Managed Accounts Trust, 2 PIMCO-sponsored interval funds and 21 PIMCO-sponsored closed-end funds. |
| | |
Jay M. Fife 1970 | | Treasurer (Since 2009) | | Managing Director of BlackRock, Inc. since 2007. |
| | |
Charles Park 1967 | | Chief Compliance Officer (Since 2014) | | Anti-Money Laundering Compliance Officer for certain BlackRock-advised Funds from 2014 to 2015; Chief Compliance Officer of BlackRock Advisors, LLC and the BlackRock-advised Funds in the BlackRock Multi-Asset Complex and the BlackRock Fixed-Income Complex since 2014; Principal of and Chief Compliance Officer for iShares® Delaware Trust Sponsor LLC since 2012 and BlackRock Fund Advisors (“BFA”) since 2006; Chief Compliance Officer for the BFA-advised iShares® exchange traded funds since 2006; Chief Compliance Officer for BlackRock Asset Management International Inc. since 2012. |
| | |
TRUSTEE AND OFFICER INFORMATION | | 51 |
Trustee and Officer Information (continued)
| | | | |
| Officers Who Are Not Trustees(a) (continued) |
| | | |
Name Year of Birth(b) | | Position(s) Held (Length of Service) | | Principal Occupation(s) During Past Five Years |
| | |
Lisa Belle 1968 | | Anti-Money Laundering Compliance Officer (Since 2019) | | Managing Director of BlackRock, Inc. since 2019; Global Financial Crime Head for Asset and Wealth Management of JP Morgan from 2013 to 2019; Managing Director of RBS Securities from 2012 to 2013; Head of Financial Crimes for Barclays Wealth Americas from 2010 to 2012. |
| | |
Janey Ahn 1975 | | Secretary (Since 2019) | | Managing Director of BlackRock, Inc. since 2018; Director of BlackRock, Inc. from 2009 to 2017. |
| (a) | The address of each Officer is c/o BlackRock, Inc., 55 East 52nd Street, New York, New York 10055. |
| (b) | Officers of MIP serve at the pleasure of the Board. |
Further information about MIP’s Trustees and Officers is available in MIP’s Statement of Additional Information, which can be obtained without charge by calling (800) 441-7762.
Effective December 31, 2021, Bruce R. Bond retired as a Trustee of MIP.
| | |
| 52 | | 2 0 2 1 BLACK ROCK ANNUAL REPORT TO SHAREHOLDERS |
Additional Information
Regulation Regarding Derivatives
On October 28, 2020, the Securities and Exchange Commission (the “SEC”) adopted regulations governing the use of derivatives by registered investment companies (“Rule 18f-4”). The Master Portfolio will be required to implement and comply with Rule 18f-4 by August 19, 2022. Once implemented, Rule 18f-4 will impose limits on the amount of derivatives a fund can enter into, eliminate the asset segregation framework currently used by funds to comply with Section 18 of the 1940 Act, treat derivatives as senior securities and require funds whose use of derivatives is more than a limited specified exposure amount to establish and maintain a comprehensive derivatives risk management program and appoint a derivatives risk manager.
General Information
Quarterly performance, semi-annual and annual reports and other information regarding the Master Portfolio may be found on BlackRock’s website, which can be accessed at blackrock.com. Any reference to BlackRock’s website in this report is intended to allow investors public access to information regarding the Master Portfolio and does not, and is not intended to, incorporate BlackRock’s website in this report.
Householding
The Master Portfolio will mail only one copy of shareholder documents, including prospectuses, annual and semi-annual reports, Rule 30e-3 notices and proxy statements, to shareholders with multiple accounts at the same address. This practice is commonly called “householding” and is intended to reduce expenses and eliminate duplicate mailings of shareholder documents. Mailings of your shareholder documents may be householded indefinitely unless you instruct us otherwise. If you do not want the mailing of these documents to be combined with those for other members of your household, please call the Master Portfolio at (800) 441-7762.
Availability of Quarterly Schedule of Investments
The Master Portfolio files its complete schedule of portfolio holdings with the SEC for the first and third quarters of each fiscal year as an exhibit to its reports on Form N-PORT. The Master Portfolio’s Form N-PORT is available on the SEC’s website at sec.gov. Additionally, the Master Portfolio makes its portfolio holdings for the first and third quarters of each fiscal year available at blackrock.com/fundreports.
Availability of Proxy Voting Policies, Procedures and Voting Records
A description of the policies and procedures that the Master Portfolio uses to determine how to vote proxies relating to portfolio securities and information about how the Master Portfolio voted proxies relating to securities held in the Master Portfolio’s portfolio during the most recent 12-month period ended June 30 is available without charge, upon request (1) by calling (800) 441-7762; (2) on the BlackRock website at blackrock.com; and (3) on the SEC’s website at sec.gov.
BlackRock’s Mutual Fund Family
BlackRock offers a diverse lineup of open-end mutual funds crossing all investment styles and managed by experts in equity, fixed-income and tax-exempt investing. Visit blackrock.com for more information.
Shareholder Privileges
Account Information
Call us at (800) 441-7762 from 8:00 AM to 6:00 PM ET on any business day to get information about your account balances, recent transactions and share prices. You can also visit blackrock.com for more information.
Automatic Investment Plans
Investor class shareholders who want to invest regularly can arrange to have $50 or more automatically deducted from their checking or savings account and invested in any of the BlackRock funds.
Systematic Withdrawal Plans
Investor class shareholders can establish a systematic withdrawal plan and receive periodic payments of $50 or more from their BlackRock funds, as long as their account balance is at least $10,000.
Retirement Plans
Shareholders may make investments in conjunction with Traditional, Rollover, Roth, Coverdell, Simple IRAs, SEP IRAs and 403(b) Plans.
| | |
ADDITIONAL INFORMATION | | 53 |
Additional Information (continued)
BlackRock Privacy Principles
BlackRock is committed to maintaining the privacy of its current and former fund investors and individual clients (collectively, “Clients”) and to safeguarding their non-public personal information. The following information is provided to help you understand what personal information BlackRock collects, how we protect that information and why in certain cases we share such information with select parties.
If you are located in a jurisdiction where specific laws, rules or regulations require BlackRock to provide you with additional or different privacy-related rights beyond what is set forth below, then BlackRock will comply with those specific laws, rules or regulations.
BlackRock obtains or verifies personal non-public information from and about you from different sources, including the following: (i) information we receive from you or, if applicable, your financial intermediary, on applications, forms or other documents; (ii) information about your transactions with us, our affiliates, or others; (iii) information we receive from a consumer reporting agency; and (iv) from visits to our websites.
BlackRock does not sell or disclose to non-affiliated third parties any non-public personal information about its Clients, except as permitted by law or as is necessary to respond to regulatory requests or to service Client accounts. These non-affiliated third parties are required to protect the confidentiality and security of this information and to use it only for its intended purpose.
We may share information with our affiliates to service your account or to provide you with information about other BlackRock products or services that may be of interest to you. In addition, BlackRock restricts access to non-public personal information about its Clients to those BlackRock employees with a legitimate business need for the information. BlackRock maintains physical, electronic and procedural safeguards that are designed to protect the non-public personal information of its Clients, including procedures relating to the proper storage and disposal of such information.
Master Portfolio and Service Providers
Investment Adviser
BlackRock Fund Advisors
San Francisco, CA 94105
Administrator
BlackRock Advisors, LLC
Wilmington, DE 19809
Accounting Agent and Custodian
State Street Bank and Trust Company
Boston, MA 02111
Transfer Agent
BNY Mellon Investment Servicing (US) Inc.
Wilmington, DE 19809
Independent Registered Public Accounting Firm
PricewaterhouseCoopers LLP
Philadelphia, PA 19103
Legal Counsel
Sidley Austin LLP
New York, NY 10019
Address of MIP
400 Howard Street
San Francisco, CA 94105
| | |
| 54 | | 2 0 2 1 BLACK ROCK ANNUAL REPORT TO SHAREHOLDERS |
Glossary of Terms Used in this Report
| | |
| Currency Abbreviation |
| |
| AUD | | Australian Dollar |
| |
| CAD | | Canadian Dollar |
| |
| CHF | | Swiss Franc |
| |
| EUR | | Euro |
| |
| GBP | | British Pound |
| |
| JPY | | Japanese Yen |
| |
| NOK | | Norwegian Krone |
| |
| NZD | | New Zealand Dollar |
| |
| SEK | | Swedish Krona |
| |
| SGD | | Singapore Dollar |
| |
| USD | | United States Dollar |
|
| Portfolio Abbreviation |
| |
| ADR | | American Depositary Receipt |
| |
| GDR | | Global Depositary Receipt |
| |
| LIBOR | | London Interbank Offered Rate |
| |
| MSCI | | Morgan Stanley Capital International |
| |
| NVDR | | Non-Voting Depositary Receipt |
| |
| PCL | | Public Company Limited |
| |
| PJSC | | Public Joint Stock Company |
| |
| REIT | | Real Estate Investment Trust |
| |
| S&P | | Standard & Poor’s |
| |
| SAB | | Special Assessment Bonds |
| |
| SOFR | | Secured Overnight Financing Rate |
| |
| SRF | | State Revolving Fund |
| | |
GLOSSARY OF TERMS USED IN THIS REPORT | | 55 |
| | |
| Master Portfolio Information as of December 31, 2021 | | International Tilts Master Portfolio |
TEN LARGEST HOLDINGS
| | | | |
| |
| |
| Security | | Percent of Net Assets | |
| |
ASML Holding NV | | | 2% | |
Novartis AG, Registered Shares | | | 2 | |
SAP SE | | | 2 | |
Novo Nordisk A/S, Class B | | | 2 | |
Siemens AG, Registered Shares | | | 2 | |
L’Oreal SA | | | 2 | |
Nestle SA, Registered Share | | | 1 | |
Tokyo Electron Ltd. | | | 1 | |
Schneider Electric SE | | | 1 | |
Deutsche Post AG | | | 1 | |
| |
GEOGRAPHIC ALLOCATION
| | | | |
| |
| |
| Country/Geographic Region | | Percent of Net Assets | |
| |
Japan | | | 21% | |
France | | | 13 | |
United Kingdom | | | 11 | |
Germany | | | 10 | |
Switzerland | | | 9 | |
Netherlands | | | 7 | |
Australia | | | 6 | |
Sweden | | | 4 | |
United States | | | 4 | |
Denmark | | | 3 | |
Finland | | | 3 | |
Italy | | | 2 | |
Hong Kong | | | 2 | |
Spain | | | 1 | |
Israel | | | 1 | |
Ireland | | | 1 | |
Singapore | | | 1 | |
Norway | | | 1 | |
Austria | | | 1 | |
Belgium | | | 1 | |
Other# | | | —(a) | |
Liabilities in Excess of Other Assets | | | (2) | |
| |
| (a) | Rounds to less than 1% of net assets. |
| # | Includes holdings within countries/geographic regions that are less than 1% of net assets. Please refer to the Schedule of Investments for such countries/geographic regions. |
Derivative Financial Instruments
International Tilts Master Portfolio (the “Master Portfolio”) may invest in various derivative financial instruments. These instruments are used to obtain exposure to a security, commodity, index, market, and/or other assets without owning or taking physical custody of securities, commodities and/or other referenced assets or to manage market, equity, credit, interest rate, foreign currency exchange rate, commodity and/or other risks. Derivative financial instruments may give rise to a form of economic leverage and involve risks, including the imperfect correlation between the value of a derivative financial instrument and the underlying asset, possible default of the counterparty to the transaction or illiquidity of the instrument. The Master Portfolio’s successful use of a derivative financial instrument depends on the investment adviser’s ability to predict pertinent market movements accurately, which cannot be assured. The use of these instruments may result in losses greater than if they had not been used, may limit the amount of appreciation the Master Portfolio can realize on an investment and/or may result in lower distributions paid to shareholders. The Master Portfolio’s investments in these instruments, if any, are discussed in detail in the Master Portfolio Notes to Financial Statements.
| | |
PORTFOLIO INFORMATION / DERIVATIVE FINANCIAL INSTRUMENTS | | 1 |
| | |
Schedule of Investments December 31, 2021 | | International Tilts Master Portfolio (Percentages shown are based on Net Assets) |
| | | | | | | | |
| Security | | Shares | | | Value | |
| |
| | |
Common Stocks | | | | | | | | |
| | |
| Australia — 5.5% | | | | | | |
AGL Energy Ltd. | | | 78,289 | | | $ | 349,777 | |
Alumina Ltd. | | | 115,873 | | | | 157,624 | |
AMP Ltd.(a) | | | 47,652 | | | | 35,026 | |
Aristocrat Leisure Ltd. | | | 43,850 | | | | 1,391,034 | |
Aurizon Holdings Ltd. | | | 197,571 | | | | 501,954 | |
Beach Energy Ltd. | | | 14,459 | | | | 13,275 | |
BHP Group Ltd. | | | 88,434 | | | | 2,669,975 | |
BHP Group PLC | | | 3,507 | | | | 104,350 | |
Charter Hall Group | | | 1,231 | | | | 18,416 | |
CSL Ltd. | | | 6,788 | | | | 1,435,664 | |
CSR Ltd. | | | 3,319 | | | | 14,210 | |
Flight Centre Travel Group Ltd.(a) | | | 3,787 | | | | 48,593 | |
Glencore PLC | | | 80,586 | | | | 410,608 | |
Goodman Group | | | 55,613 | | | | 1,072,042 | |
Harvey Norman Holdings Ltd. | | | 13,169 | | | | 47,334 | |
Insignia Financial Ltd. | | | 11,045 | | | | 29,103 | |
JB Hi-Fi Ltd. | | | 7,342 | | | | 258,177 | |
Macquarie Group Ltd. | | | 1,006 | | | | 150,382 | |
Medibank Pvt Ltd. | | | 699,735 | | | | 1,704,275 | |
Metcash Ltd. | | | 14,862 | | | | 48,613 | |
Mirvac Group | | | 165,294 | | | | 349,890 | |
Nine Entertainment Co. Holdings Ltd. | | | 6,558 | | | | 13,859 | |
Nufarm Ltd. | | | 1 | | | | 4 | |
Orora Ltd. | | | 8,543 | | | | 21,803 | |
Platinum Asset Management Ltd. | | | 4,529 | | | | 8,896 | |
QBE Insurance Group Ltd. | | | 10,523 | | | | 86,896 | |
REA Group Ltd. | | | 15,339 | | | | 1,870,462 | |
Scentre Group | | | 651,387 | | | | 1,498,436 | |
Shopping Centres Australasia Property Group | | | 7,657 | | | | 16,549 | |
Sonic Healthcare Ltd. | | | 346 | | | | 11,735 | |
South32 Ltd. | | | 164,987 | | | | 482,518 | |
Stockland(b) | | | 89,551 | | | | 276,266 | |
WiseTech Global Ltd. | | | 11,902 | | | | 504,781 | |
Woodside Petroleum Ltd. | | | 6,387 | | | | 101,821 | |
Worley Ltd.(b) | | | 14,500 | | | | 112,334 | |
| | | | | | | | |
| | |
| | | | | | | 15,816,682 | |
| | |
| Austria — 1.0% | | | | | | |
ANDRITZ AG | | | 6,282 | | | | 323,102 | |
BAWAG Group AG(c) | | | 6,316 | | | | 387,368 | |
Erste Group Bank AG | | | 29,117 | | | | 1,365,016 | |
Raiffeisen Bank International AG | | | 19,930 | | | | 585,355 | |
Verbund AG | | | 226 | | | | 25,399 | |
Vienna Insurance Group AG Wiener Versicherung Gruppe | | | 1,945 | | | | 55,208 | |
Wienerberger AG | | | 474 | | | | 17,407 | |
| | | | | | | | |
| | |
| | | | | | | 2,758,855 | |
| | |
| Belgium — 0.6% | | | | | | |
D’ieteren Group | | | 248 | | | | 48,346 | |
Groupe Bruxelles Lambert SA | | | 8,029 | | | | 896,734 | |
Solvay SA | | | 5,040 | | | | 585,929 | |
Telenet Group Holding NV | | | 847 | | | | 30,911 | |
Warehouses De Pauw CVA | | | 810 | | | | 38,875 | |
| | | | | | | | |
| | |
| | | | | | | 1,600,795 | |
| | |
| China — 0.1% | | | | | | |
BOC Hong Kong Holdings Ltd. | | | 85,000 | | | | 278,758 | |
| | | | | | | | |
| | |
| Denmark — 2.8% | | | | | | |
AP Moeller - Maersk A/S, Class B | | | 185 | | | | 660,323 | |
Carlsberg A/S, Class B | | | 1,470 | | | | 253,792 | |
| | | | | | | | |
| Security | | Shares | | | Value | |
| |
| | |
| Denmark (continued) | | | | | | |
Coloplast A/S, Class B | | | 7,570 | | | $ | 1,332,889 | |
Demant A/S(a) | | | 362 | | | | 18,537 | |
DSV A/S | | | 480 | | | | 111,854 | |
Genmab A/S(a) | | | 1,425 | | | | 568,793 | |
Novo Nordisk A/S, Class B | | | 42,577 | | | | 4,782,498 | |
Novozymes A/S, B Shares | | | 1,231 | | | | 101,077 | |
SimCorp A/S | | | 1,064 | | | | 115,967 | |
| | | | | | | | |
| | |
| | | | | | | 7,945,730 | |
| | |
| Finland — 2.8% | | | | | | |
Kesko OYJ, B Shares | | | 13,376 | | | | 445,832 | |
Kone OYJ, Class B | | | 38,165 | | | | 2,738,670 | |
Neste OYJ | | | 12,916 | | | | 635,671 | |
Nokia OYJ(a) | | | 260,378 | | | | 1,649,152 | |
Nordea Bank Abp | | | 198,824 | | | | 2,425,364 | |
Outokumpu OYJ(a) | | | 4,463 | | | | 27,988 | |
| | | | | | | | |
| | |
| | | | | | | 7,922,677 | |
| | |
| France — 12.6% | | | | | | |
Air Liquide SA | | | 11,341 | | | | 1,977,919 | |
Airbus SE(a) | | | 338 | | | | 43,245 | |
Amundi SA(c) | | | 8,620 | | | | 711,016 | |
Arkema SA | | | 593 | | | | 83,699 | |
Atos SE | | | 2,012 | | | | 85,231 | |
AXA SA | | | 32,557 | | | | 969,002 | |
BioMerieux | | | 191 | | | | 27,160 | |
BNP Paribas SA | | | 10,611 | | | | 733,655 | |
Capgemini SE | | | 8,603 | | | | 2,108,427 | |
Carrefour SA | | | 12,726 | | | | 233,312 | |
Credit Agricole SA | | | 30,480 | | | | 434,563 | |
Dassault Systemes SE | | | 43,497 | | | | 2,581,344 | |
Electricite de France SA | | | 90,800 | | | | 1,067,925 | |
Engie SA | | | 167,449 | | | | 2,479,146 | |
EssilorLuxottica SA | | | 218 | | | | 46,407 | |
Eurazeo SE | | | 241 | | | | 21,026 | |
Hermes International | | | 1,161 | | | | 2,028,700 | |
Kering SA | | | 2,965 | | | | 2,378,972 | |
Klepierre SA | | | 8,281 | | | | 195,947 | |
Legrand SA | | | 6,280 | | | | 735,520 | |
L’Oreal SA | | | 9,414 | | | | 4,488,715 | |
LVMH Moet Hennessy Louis Vuitton SE | | | 2,083 | | | | 1,721,461 | |
Pernod Ricard SA | | | 2,191 | | | | 527,106 | |
Publicis Groupe SA | | | 3,081 | | | | 207,579 | |
Remy Cointreau SA | | | 237 | | | | 57,607 | |
Renault SA(a) | | | 2,085 | | | | 72,329 | |
Rexel SA | | | 2,323 | | | | 47,047 | |
Rubis SCA | | | 27,913 | | | | 834,689 | |
Safran SA | | | 102 | | | | 12,487 | |
Sanofi | | | 5,285 | | | | 530,318 | |
Sartorius Stedim Biotech | | | 626 | | | | 343,803 | |
Schneider Electric SE | | | 18,904 | | | | 3,716,439 | |
Societe Generale SA | | | 51,849 | | | | 1,781,983 | |
Sodexo SA | | | 2,275 | | | | 199,445 | |
Teleperformance | | | 1,856 | | | | 829,773 | |
TotalEnergies SE | | | 27,728 | | | | 1,411,361 | |
Unibail-Rodamco-Westfield(a)(b) | | | 3,076 | | | | 215,256 | |
Veolia Environnement SA | | | 3,007 | | | | 110,429 | |
Wendel SE | | | 111 | | | | 13,301 | |
| | | | | | | | |
| | |
| | | | | | | 36,063,344 | |
| | |
| Germany — 9.8% | | | | | | |
Allianz SE, Registered Shares | | | 12,143 | | | | 2,864,031 | |
Bayer AG, Registered Shares | | | 18,100 | | | | 966,618 | |
Bayerische Motoren Werke AG | | | 15,045 | | | | 1,505,135 | |
| | |
| 2 | | 2 0 2 1 BLACK ROCK ANNUAL REPORT TO SHAREHOLDERS |
| | |
Schedule of Investments (continued) December 31, 2021 | | International Tilts Master Portfolio (Percentages shown are based on Net Assets) |
| | | | | | | | |
| Security | | Shares | | | Value | |
| |
| | |
| Germany (continued) | | | | | | |
Covestro AG(c) | | | 4,499 | | | $ | 276,904 | |
Daimler AG, Registered Shares | | | 2,716 | | | | 207,514 | |
Deutsche Boerse AG | | | 4,478 | | | | 747,711 | |
Deutsche Post AG, Registered Shares | | | 57,139 | | | | 3,675,224 | |
Deutsche Telekom AG, Registered Shares | | | 20,515 | | | | 379,066 | |
DWS Group GmbH & Co. KGaA(c) | | | 7,422 | | | | 299,300 | |
Evonik Industries AG | | | 65,757 | | | | 2,124,311 | |
Fraport AG Frankfurt Airport Services Worldwide(a) | | | 3,325 | | | | 222,630 | |
Freenet AG | | | 8,995 | | | | 237,720 | |
Gerresheimer AG | | | 4,596 | | | | 441,901 | |
HelloFresh SE(a) | | | 2,429 | | | | 186,154 | |
Hochtief AG | | | 2,474 | | | | 199,246 | |
HUGO BOSS AG | | | 2,548 | | | | 154,241 | |
Jenoptik AG | | | 2 | | | | 84 | |
Merck KGaA | | | 1,612 | | | | 414,698 | |
MTU Aero Engines AG | | | 3,384 | | | | 687,100 | |
Muenchener Rueckversicherungs-Gesellschaft AG in Muenchen, Registered Shares | | | 1,367 | | | | 403,550 | |
Nemetschek SE | | | 1,148 | | | | 146,788 | |
ProSiebenSat.1 Media SE | | | 1,604 | | | | 25,481 | |
SAP SE | | | 35,569 | | | | 5,005,963 | |
Schaeffler AG | | | 11 | | | | 91 | |
Scout24 AG(c) | | | 20,160 | | | | 1,407,698 | |
Siemens AG, Registered Shares | | | 27,283 | | | | 4,725,492 | |
Symrise AG | | | 1,173 | | | | 173,480 | |
TAG Immobilien AG | | | 710 | | | | 19,832 | |
Telefonica Deutschland Holding AG | | | 41,225 | | | | 114,349 | |
Wacker Chemie AG | | | 2,747 | | | | 408,372 | |
| | | | | | | | |
| | |
| | | | | | | 28,020,684 | |
| | |
| Hong Kong — 2.0% | | | | | | |
AIA Group Ltd. | | | 337,600 | | | | 3,407,343 | |
ASM Pacific Technology Ltd. | | | 3,100 | | | | 33,501 | |
CK Asset Holdings Ltd. | | | 36,500 | | | | 230,241 | |
Hang Lung Group Ltd.(b) | | | 5,000 | | | | 10,691 | |
Kerry Properties Ltd. | | | 148,500 | | | | 386,747 | |
Link REIT | | | 11,600 | | | | 102,187 | |
NWS Holdings Ltd. | | | 11,000 | | | | 10,319 | |
Swire Properties Ltd. | | | 113,800 | | | | 285,283 | |
Techtronic Industries Co. Ltd. | | | 61,000 | | | | 1,216,029 | |
| | | | | | | | |
| | |
| | | | | | | 5,682,341 | |
| | |
| Ireland — 1.3% | | | | | | |
AIB Group PLC(a) | | | 10,185 | | | | 24,815 | |
Experian PLC | | | 32,704 | | | | 1,610,864 | |
James Hardie Industries PLC | | | 35,151 | | | | 1,414,903 | |
Kerry Group PLC, Class A | | | 1,016 | | | | 131,080 | |
Kingspan Group PLC | | | 3,354 | | | | 400,082 | |
Smurfit Kappa Group PLC | | | 1,155 | | | | 63,659 | |
| | | | | | | | |
| | |
| | | | | | | 3,645,403 | |
| | |
| Israel — 1.3% | | | | | | |
Bank Hapoalim BM | | | 104,330 | | | | 1,073,760 | |
Bank Leumi Le-Israel BM | | | 2,673 | | | | 28,671 | |
Isracard Ltd. | | | 270 | | | | 1,333 | |
Israel Discount Bank Ltd., Class A | | | 92,990 | | | | 624,359 | |
Mizrahi Tefahot Bank Ltd. | | | 2,503 | | | | 96,392 | |
Nice Ltd.(a) | | | 4,541 | | | | 1,377,083 | |
Shapir Engineering and Industry Ltd. | | | 1,403 | | | | 12,396 | |
Strauss Group Ltd. | | | 460 | | | | 14,343 | |
Teva Pharmaceutical Industries Ltd.(a)(b) | | | 70,997 | | | | 579,880 | |
| | | | | | | | |
| | |
| | | | | | | 3,808,217 | |
| | | | | | | | |
| Security | | Shares | | | Value | |
| |
| | |
| Italy — 2.0% | | | | | | |
Amplifon SpA | | | 5,748 | | | $ | 309,289 | |
Banca Generali SpA | | | 1,047 | | | | 45,928 | |
Banca Mediolanum SpA | | | 37,771 | | | | 372,363 | |
Banco BPM SpA | | | 30,571 | | | | 91,533 | |
BPER Banca | | | 177,139 | | | | 366,096 | |
De’ Longhi SpA | | | 333 | | | | 11,913 | |
Enel SpA | | | 48,758 | | | | 389,873 | |
Hera SpA | | | 27,210 | | | | 113,095 | |
Interpump Group SpA | | | 161 | | | | 11,793 | |
Intesa Sanpaolo SpA | | | 686,900 | | | | 1,774,210 | |
Italgas SpA | | | 50,863 | | | | 349,625 | |
Mediobanca Banca di Credito Finanziario SpA | | | 112,855 | | | | 1,295,629 | |
Moncler SpA | | | 1,300 | | | | 93,949 | |
Pirelli & C SpA(c) | | | 22,746 | | | | 157,755 | |
PRADA SpA | | | 3,200 | | | | 20,490 | |
Reply SpA | | | 241 | | | | 48,949 | |
UniCredit SpA | | | 27,658 | | | | 425,141 | |
Unipol Gruppo SpA | | | 3,469 | | | | 18,786 | |
| | | | | | | | |
| | |
| | | | | | | 5,896,417 | |
| | |
| Japan — 20.5% | | | | | | |
Advantest Corp. | | | 9,900 | | | | 937,521 | |
Air Water, Inc. | | | 2,000 | | | | 30,911 | |
Ajinomoto Co., Inc. | | | 2,200 | | | | 66,973 | |
Alps Alpine Co. Ltd. | | | 3,700 | | | | 34,898 | |
Amada Co. Ltd. | | | 59,900 | | | | 593,122 | |
Asahi Kasei Corp. | | | 44,900 | | | | 422,974 | |
Astellas Pharma, Inc. | | | 1,400 | | | | 22,786 | |
Benesse Holdings, Inc. | | | 8,000 | | | | 157,098 | |
Bridgestone Corp.(b) | | | 50,800 | | | | 2,180,979 | |
Calbee, Inc. | | | 8,000 | | | | 185,762 | |
Canon, Inc.(b) | | | 14,900 | | | | 363,465 | |
Casio Computer Co. Ltd. | | | 37,800 | | | | 486,732 | |
Chugai Pharmaceutical Co. Ltd. | | | 12,400 | | | | 404,190 | |
Chugoku Electric Power Co., Inc. | | | 6,200 | | | | 50,276 | |
COMSYS Holdings Corp. | | | 800 | | | | 17,822 | |
Dai-ichi Life Holdings, Inc. | | | 5,900 | | | | 119,003 | |
Daiichi Sankyo Co. Ltd. | | | 14,900 | | | | 379,226 | |
Daikin Industries Ltd. | | | 5,500 | | | | 1,245,855 | |
Daito Trust Construction Co. Ltd. | | | 5,800 | | | | 665,382 | |
Daiwa House Industry Co. Ltd. | | | 500 | | | | 14,370 | |
Dentsu Group, Inc. | | | 400 | | | | 14,237 | |
Disco Corp. | | | 300 | | | | 91,696 | |
DMG Mori Co. Ltd. | | | 8,200 | | | | 141,080 | |
Ebara Corp.(b) | | | 1,600 | | | | 88,883 | |
Eisai Co. Ltd. | | | 7,300 | | | | 414,405 | |
FANUC Corp. | | | 2,600 | | | | 552,661 | |
Fast Retailing Co. Ltd. | | | 300 | | | | 170,533 | |
Fuji Oil Holdings, Inc. | | | 5,300 | | | | 107,032 | |
FUJIFILM Holdings Corp. | | | 3,900 | | | | 289,124 | |
Hikari Tsushin, Inc. | | | 1,700 | | | | 261,813 | |
Hisamitsu Pharmaceutical Co., Inc. | | | 2,800 | | | | 96,725 | |
Honda Motor Co. Ltd. | | | 11,900 | | | | 338,564 | |
Hoya Corp. | | | 11,000 | | | | 1,632,309 | |
Hulic Co. Ltd. | | | 13,700 | | | | 130,280 | |
Inpex Corp. | | | 73,200 | | | | 636,518 | |
ITOCHU Corp. | | | 44,000 | | | | 1,346,131 | |
Itochu Techno-Solutions Corp. | | | 400 | | | | 12,867 | |
Japan Post Holdings Co. Ltd. | | | 172,300 | | | | 1,342,264 | |
Japan Tobacco, Inc.(b) | | | 139,500 | | | | 2,816,776 | |
Kao Corp. | | | 14,300 | | | | 748,952 | |
KDDI Corp. | | | 22,600 | | | | 660,908 | |
Keyence Corp. | | | 3,500 | | | | 2,200,653 | |
| | | | |
MASTER PORTFOLIO SCHEDULE OF INVESTMENTS | | | 3 | |
| | |
Schedule of Investments (continued) December 31, 2021 | | International Tilts Master Portfolio (Percentages shown are based on Net Assets) |
| | | | | | | | |
| Security | | Shares | | | Value | |
| |
| | |
| Japan (continued) | | | | | | |
Komatsu Ltd. | | | 900 | | | $ | 21,047 | |
Kuraray Co. Ltd.(b) | | | 13,500 | | | | 117,404 | |
Kyocera Corp. | | | 500 | | | | 31,263 | |
Lintec Corp. | | | 3,500 | | | | 80,286 | |
Lion Corp. | | | 19,900 | | | | 266,024 | |
M3, Inc. | | | 1,200 | | | | 60,506 | |
Mani Inc. | | | 600 | | | | 8,327 | |
Marubeni Corp. | | | 46,000 | | | | 448,178 | |
Mitsubishi Corp. | | | 3,600 | | | | 114,311 | |
Mitsubishi Electric Corp. | | | 5,300 | | | | 67,273 | |
Mitsubishi HC Capital, Inc. | | | 31,700 | | | | 156,837 | |
Mitsubishi Heavy Industries Ltd. | | | 1,700 | | | | 39,305 | |
Mitsubishi Materials Corp. | | | 6,300 | | | | 108,269 | |
MS&AD Insurance Group Holdings, Inc. | | | 51,400 | | | | 1,582,724 | |
Murata Manufacturing Co. Ltd. | | | 10,200 | | | | 813,577 | |
Nagase & Co. Ltd. | | | 600 | | | | 9,725 | |
NEC Corp.(b) | | | 19,400 | | | | 897,050 | |
NET One Systems Co. Ltd. | | | 3,200 | | | | 86,105 | |
Nexon Co. Ltd. | | | 9,300 | | | | 179,827 | |
NGK Spark Plug Co. Ltd. | | | 7,900 | | | | 137,557 | |
NH Foods Ltd. | | | 3,500 | | | | 126,196 | |
Nihon Kohden Corp. | | | 400 | | | | 10,966 | |
Nihon M&A Center Holdings, Inc. | | | 4,700 | | | | 115,287 | |
Nikon Corp. | | | 20,200 | | | | 217,598 | |
Nippon Telegraph & Telephone Corp. | | | 5,400 | | | | 147,681 | |
Nomura Real Estate Holdings, Inc. | | | 1,500 | | | | 34,563 | |
Obic Co. Ltd. | | | 1,900 | | | | 355,583 | |
Olympus Corp. | | | 52,300 | | | | 1,204,324 | |
Omron Corp. | | | 6,900 | | | | 687,566 | |
Oracle Corp. Japan | | | 600 | | | | 45,584 | |
Otsuka Holdings Co. Ltd. | | | 900 | | | | 32,743 | |
Rakus Co. Ltd. | | | 5,000 | | | | 134,179 | |
Recruit Holdings Co. Ltd. | | | 33,300 | | | | 2,026,494 | |
Relo Group, Inc. | | | 1,500 | | | | 27,070 | |
Secom Co. Ltd. | | | 6,200 | | | | 430,815 | |
Seiko Epson Corp. | | | 1,000 | | | | 18,010 | |
Sekisui House Ltd. | | | 71,300 | | | | 1,534,072 | |
Shimadzu Corp. | | | 1,500 | | | | 63,357 | |
Shimamura Co. Ltd. | | | 300 | | | | 25,176 | |
Shin-Etsu Chemical Co. Ltd. | | | 6,400 | | | | 1,110,882 | |
Softbank Corp. | | | 45,800 | | | | 578,480 | |
SoftBank Group Corp. | | | 19,600 | | | | 939,627 | |
Sojitz Corp. | | | 900 | | | | 13,523 | |
Sony Group Corp. | | | 2,300 | | | | 290,440 | |
Subaru Corp. | | | 20,100 | | | | 359,143 | |
Sumitomo Chemical Co. Ltd. | | | 556,800 | | | | 2,625,763 | |
Sumitomo Corp. | | | 116,500 | | | | 1,724,129 | |
Sumitomo Heavy Industries Ltd. | | | 900 | | | | 21,846 | |
Sumitomo Mitsui Financial Group, Inc. | | | 95,800 | | | | 3,271,309 | |
Sumitomo Rubber Industries Ltd.(b) | | | 25,300 | | | | 258,064 | |
Sundrug Co. Ltd. | | | 3,400 | | | | 88,888 | |
Suntory Beverage & Food Ltd. | | | 5,500 | | | | 199,171 | |
Sysmex Corp. | | | 2,000 | | | | 269,963 | |
T&D Holdings, Inc. | | | 22,100 | | | | 282,344 | |
Taiheiyo Cement Corp. | | | 2,300 | | | | 45,419 | |
Taisei Corp. | | | 500 | | | | 15,205 | |
TDK Corp. | | | 1,500 | | | | 58,539 | |
Teijin Ltd. | | | 2,200 | | | | 27,078 | |
Terumo Corp. | | | 38,100 | | | | 1,609,367 | |
Tokio Marine Holdings, Inc. | | | 28,700 | | | | 1,597,719 | |
Tokyo Electron Ltd. | | | 6,700 | | | | 3,856,335 | |
Tokyo Gas Co. Ltd. | | | 36,700 | | | | 658,779 | |
| | | | | | | | |
| Security | | Shares | | | Value | |
| |
| | |
| Japan (continued) | | | | | | |
Toshiba Corp. | | | 6,500 | | | $ | 267,465 | |
Toyota Motor Corp. | | | 48,000 | | | | 887,164 | |
Trend Micro, Inc.(a)(b) | | | 10,300 | | | | 571,815 | |
Unicharm Corp. | | | 33,500 | | | | 1,457,490 | |
Yamada Holdings Co. Ltd. | | | 167,800 | | | | 573,658 | |
Yamaha Motor Co. Ltd. | | | 7,900 | | | | 189,751 | |
Yamazaki Baking Co. Ltd. | | | 6,600 | | | | 87,728 | |
| | | | | | | | |
| | |
| | | | | | | 58,873,699 | |
| | |
| Luxembourg — 0.1% | | | | | | |
RTL Group SA(a) | | | 5,789 | | | | 306,827 | |
SES SA | | | 5 | | | | 39 | |
| | | | | | | | |
| | |
| | | | | | | 306,866 | |
| | |
| Netherlands — 6.9% | | | | | | |
Aalberts NV | | | 313 | | | | 20,755 | |
Adyen NV(a)(c) | | | 340 | | | | 892,500 | |
Argenx SE(a) | | | 345 | | | | 122,685 | |
ASML Holding NV | | | 7,920 | | | | 6,344,077 | |
ASR Nederland NV | | | 25,260 | | | | 1,163,305 | |
EXOR NV | | | 1,010 | | | | 90,413 | |
IMCD NV | | | 3,521 | | | | 778,152 | |
JDE Peet’s NV | | | 4,497 | | | | 139,191 | |
Koninklijke Ahold Delhaize NV | | | 69,989 | | | | 2,401,766 | |
Koninklijke KPN NV | | | 162,469 | | | | 504,971 | |
Koninklijke Philips NV | | | 1,388 | | | | 51,372 | |
NN Group NV | | | 2,348 | | | | 126,980 | |
OCI NV(a) | | | 434 | | | | 11,328 | |
PostNL NV | | | 106,555 | | | | 463,319 | |
Randstad NV | | | 22,427 | | | | 1,529,908 | |
Royal Dutch Shell PLC, A Shares | | | 86,580 | | | | 1,897,349 | |
Royal Dutch Shell PLC, B Shares | | | 45,883 | | | | 1,007,433 | |
Signify NV(c) | | | 1,468 | | | | 68,162 | |
Wolters Kluwer NV | | | 18,035 | | | | 2,122,735 | |
| | | | | | | | |
| | |
| | | | | | | 19,736,401 | |
| | |
| New Zealand — 0.4% | | | | | | |
Fisher & Paykel Healthcare Corp. Ltd. | | | 37,136 | | | | 831,979 | |
Mainfreight Ltd. | | | 235 | | | | 15,096 | |
Spark New Zealand Ltd. | | | 57,457 | | | | 177,685 | |
Vector Ltd. | | | 5,687 | | | | 15,612 | |
Xero Ltd.(a) | | | 1,783 | | | | 182,506 | |
| | | | | | | | |
| | |
| | | | | | | 1,222,878 | |
| | |
| Norway — 1.0% | | | | | | |
Aker BP ASA | | | 2,134 | | | | 65,618 | |
Aker Carbon Capture ASA(a) | | | 9 | | | | 28 | |
Aker Offshore Wind AS(a) | | | 9 | | | | 5 | |
Aker Solutions ASA(a) | | | 13 | | | | 34 | |
DNB Bank ASA | | | 10,086 | | | | 230,704 | |
Dolphin Drilling ASA(a)(b)(d) | | | 8 | | | | — | |
Equinor ASA | | | 90,900 | | | | 2,406,967 | |
Gjensidige Forsikring ASA | | | 4,590 | | | | 111,358 | |
Nordic Semiconductor ASA(a) | | | 318 | | | | 10,665 | |
Norsk Hydro ASA | | | 3,510 | | | | 27,619 | |
| | | | | | | | |
| | |
| | | | | | | 2,852,998 | |
| | |
| Portugal — 0.2% | | | | | | |
EDP - Energias de Portugal SA | | | 26,094 | | | | 143,342 | |
Jeronimo Martins SGPS SA | | | 17,583 | | | | 402,367 | |
| | | | | | | | |
| | |
| | | | | | | 545,709 | |
| | |
| Singapore — 1.0% | | | | | | |
Jardine Cycle & Carriage Ltd. | | | 53,700 | | | | 820,166 | |
Mapletree Logistics Trust | | | 10,400 | | | | 14,668 | |
Oversea-Chinese Banking Corp. Ltd. | | | 54,500 | | | | 461,274 | |
| | |
| 4 | | 2 0 2 1 BLACK ROCK ANNUAL REPORT TO SHAREHOLDERS |
| | |
Schedule of Investments (continued) December 31, 2021 | | International Tilts Master Portfolio (Percentages shown are based on Net Assets) |
| | | | | | | | |
| Security | | Shares | | | Value | |
| |
| | |
| Singapore (continued) | | | | | | |
Singapore Telecommunications Ltd. | | | 710,900 | | | $ | 1,223,800 | |
Suntec Real Estate Investment Trust | | | 11,800 | | | | 13,217 | |
United Overseas Bank Ltd. | | | 18,800 | | | | 375,468 | |
| | | | | | | | |
| | |
| | | | | | | 2,908,593 | |
| | |
| Spain — 1.5% | | | | | | |
Acciona SA | | | 2,748 | | | | 523,050 | |
Banco Bilbao Vizcaya Argentaria SA | | | 66,660 | | | | 395,359 | |
Banco de Sabadell SA(a) | | | 66,594 | | | | 44,382 | |
Banco Santander SA | | | 33,322 | | | | 110,665 | |
Bankinter SA | | | 35,857 | | | | 182,696 | |
Fluidra SA | | | 13,183 | | | | 525,767 | |
Grifols SA | | | 403 | | | | 7,755 | |
Iberdrola SA | | | 10,974 | | | | 129,932 | |
Industria de Diseno Textil SA | | | 55,408 | | | | 1,786,910 | |
Mediaset Espana Comunicacion SA(a) | | | 9 | | | | 42 | |
Repsol SA | | | 46,692 | | | | 552,979 | |
Telefonica SA | | | 2,113 | | | | 9,163 | |
| | | | | | | | |
| | |
| | | | | | | 4,268,700 | |
| | |
| Sweden — 4.3% | | | | | | |
Assa Abloy AB, Class B | | | 10,603 | | | | 323,190 | |
Atlas Copco AB, A Shares | | | 26,578 | | | | 1,836,562 | |
Atlas Copco AB, B Shares | | | 8,265 | | | | 485,488 | |
Avanza Bank Holding AB | | | 1,348 | | | | 49,376 | |
Castellum AB | | | 7,843 | | | | 210,900 | |
Elekta AB, -B Shares | | | 34,978 | | | | 442,245 | |
Evolution AB(c) | | | 2,171 | | | | 306,851 | |
Getinge AB | | | 648 | | | | 28,241 | |
Hexagon AB, B Shares | | | 42,143 | | | | 667,568 | |
Indutrade AB | | | 4,939 | | | | 150,793 | |
Investment AB Latour, B Shares | | | 420 | | | | 17,064 | |
Investor AB | | | 1,750 | | | | 46,038 | |
Investor AB, B Shares | | | 92,022 | | | | 2,309,136 | |
L E Lundbergforetagen AB, B Shares | | | 3,938 | | | | 220,629 | |
Lundin Energy AB | | | 13,987 | | | | 500,494 | |
Saab AB | | | 37,920 | | | | 963,157 | |
Sagax AB, Class B | | | 7,969 | | | | 268,057 | |
Samhallsbyggnadsbolaget i Norden AB | | | 32,765 | | | | 240,258 | |
SSAB AB, -A Shares(a) | | | 12,822 | | | | 74,111 | |
Svenska Handelsbanken AB, A Shares | | | 11,534 | | | | 124,659 | |
Swedish Match AB | | | 254,214 | | | | 2,018,124 | |
Tele2 AB, B Shares | | | 17,033 | | | | 242,987 | |
Telefonaktiebolaget LM Ericsson, B Shares | | | 55,701 | | | | 612,880 | |
Trelleborg AB | | | 1,161 | | | | 30,462 | |
Volvo AB, B Shares | | | 3,961 | | | | 91,604 | |
| | | | | | | | |
| | |
| | | | | | | 12,260,874 | |
| | |
| Switzerland — 8.5% | | | | | | |
ABB Ltd., Registered Shares | | | 95,953 | | | | 3,657,035 | |
Adecco Group AG, Registered Shares | | | 6,031 | | | | 307,324 | |
Baloise Holding AG, Registered Shares | | | 1,193 | | | | 194,713 | |
Banque Cantonale Vaudoise, Registered Shares | | | 547 | | | | 42,428 | |
Cie Financiere Richemont SA, Class A, Registered Shares | | | 16,155 | | | | 2,414,119 | |
Givaudan SA, Registered Shares | | | 567 | | | | 2,974,824 | |
IWG PLC(a) | | | 10,004 | | | | 39,428 | |
Lonza Group AG, Registered Shares | | | 101 | | | | 84,091 | |
Nestle SA, Registered Shares | | | 29,471 | | | | 4,114,661 | |
Novartis AG, Registered Shares | | | 64,010 | | | | 5,624,685 | |
Partners Group Holding AG | | | 640 | | | | 1,056,518 | |
PSP Swiss Property AG, Registered Shares | | | 298 | | | | 37,135 | |
Roche Holding AG | | | 6,253 | | | | 2,601,391 | |
| | | | | | | | |
| Security | | Shares | | | Value | |
| |
| | |
| Switzerland (continued) | | | | | | |
Sika AG, Registered Shares | | | 729 | | | $ | 302,985 | |
Sonova Holding AG, Registered Shares | | | 182 | | | | 71,125 | |
Tecan Group AG, Registered Shares | | | 284 | | | | 172,492 | |
VAT Group AG(c) | | | 328 | | | | 162,532 | |
Zurich Insurance Group AG | | | 1,322 | | | | 579,141 | |
| | | | | | | | |
| | |
| | | | | | | 24,436,627 | |
| | |
| United Kingdom — 11.2% | | | | | | |
Anglo American PLC | | | 28,699 | | | | 1,180,454 | |
Ashtead Group PLC | | | 37,430 | | | | 3,017,402 | |
Associated British Foods PLC | | | 24,591 | | | | 673,153 | |
AstraZeneca PLC | | | 26,235 | | | | 3,063,444 | |
Auto Trader Group PLC(c) | | | 17,795 | | | | 178,215 | |
Bellway PLC | | | 4,879 | | | | 221,751 | |
BP PLC | | | 476,022 | | | | 2,132,874 | |
British American Tobacco PLC | | | 89,745 | | | | 3,332,385 | |
BT Group PLC | | | 179,316 | | | | 412,516 | |
Burberry Group PLC | | | 17,526 | | | | 432,581 | |
CK Hutchison Holdings Ltd. | | | 18,500 | | | | 119,111 | |
Compass Group PLC(a) | | | 14,431 | | | | 324,895 | |
Croda International PLC | | | 2,319 | | | | 317,637 | |
Diageo PLC | | | 35,943 | | | | 1,965,221 | |
Dunelm Group PLC | | | 3 | | | | 56 | |
Electrocomponents PLC | | | 782 | | | | 12,824 | |
Ferguson PLC | | | 2,098 | | | | 372,661 | |
Future PLC | | | 3,900 | | | | 201,908 | |
GlaxoSmithKline PLC | | | 26,773 | | | | 582,922 | |
Greggs PLC | | | 6,009 | | | | 271,999 | |
Halma PLC | | | 1,798 | | | | 77,959 | |
HomeServe PLC | | | 36,098 | | | | 427,285 | |
Howden Joinery Group PLC | | | 6,636 | | | | 81,283 | |
IG Group Holdings PLC | | | 12,663 | | | | 139,968 | |
IMI PLC | | | 12,584 | | | | 296,781 | |
Imperial Brands PLC | | | 25,574 | | | | 560,449 | |
International Consolidated Airlines Group SA(a) | | | 129,759 | | | | 252,541 | |
Intertek Group PLC | | | 694 | | | | 52,943 | |
ITV PLC(a) | | | 363,746 | | | | 546,934 | |
Kingfisher PLC | | | 76,145 | | | | 350,247 | |
Lloyds Banking Group PLC | | | 2,816,202 | | | | 1,828,817 | |
Micro Focus International PLC(b) | | | 43,740 | | | | 247,673 | |
Next PLC | | | 4,520 | | | | 499,926 | |
Phoenix Group Holdings PLC | | | 14,112 | | | | 124,920 | |
RELX PLC | | | 31,133 | | | | 1,016,396 | |
Rightmove PLC | | | 137,782 | | | | 1,486,776 | |
Rio Tinto PLC | | | 4,274 | | | | 281,854 | |
Rolls-Royce Holdings PLC(a) | | | 26,476 | | | | 44,192 | |
Royal Mail PLC | | | 32,520 | | | | 222,964 | |
Smiths Group PLC | | | 47,424 | | | | 1,015,124 | |
Spectris PLC | | | 849 | | | | 42,259 | |
SSE PLC | | | 4,074 | | | | 91,075 | |
Standard Chartered PLC | | | 57,017 | | | | 346,708 | |
Subsea 7 SA | | | 7 | | | | 50 | |
Taylor Wimpey PLC | | | 79,842 | | | | 190,354 | |
Tesco PLC | | | 178,554 | | | | 702,980 | |
Tritax Big Box REIT PLC | | | 24,024 | | | | 81,047 | |
Unilever PLC | | | 31,259 | | | | 1,676,916 | |
WH Smith PLC(a) | | | 845 | | | | 16,984 | |
| | | | |
MASTER PORTFOLIO SCHEDULE OF INVESTMENTS | | | 5 | |
| | |
Schedule of Investments (continued) December 31, 2021 | | International Tilts Master Portfolio (Percentages shown are based on Net Assets) |
| | | | | | | | |
| Security | | Shares | | | Value | |
| |
| | |
| United Kingdom (continued) | | | | | | |
Whitbread PLC(a) | | | 16,976 | | | $ | 690,543 | |
WPP PLC | | | 4,216 | | | | 64,200 | |
| | | | | | | | |
| | |
| | | | | | | 32,272,157 | |
| | | | | | | | |
| | |
Total Common Stocks — 97.4%
(Cost: $244,761,781) | | | | | | | 279,125,405 | |
| | | | | | | | |
| | |
Preferred Securities | | | | | | | | |
| | |
| Preferred Stocks — 0.5% | | | | | | |
| | |
| Germany — 0.5% | | | | | | |
Bayerische Motoren Werke AG, Preference Shares | | | 385 | | | | 31,927 | |
Fuchs Petrolub SE, Preference Shares | | | 498 | | | | 22,504 | |
Sartorius AG, Preference Shares | | | 1,458 | | | | 986,104 | |
Volkswagen AG, Preference Shares | | | 2,435 | | | | 489,150 | |
| | | | | | | | |
| | |
| | | | | | | 1,529,685 | |
| | | | | | | | |
| | |
Total Preferred Securities — 0.5%
(Cost: $1,375,246) | | | | | | | 1,529,685 | |
| | | | | | | | |
| | |
Total Long-Term Investments — 97.9%
(Cost: $246,137,027) | | | | | | | 280,655,090 | |
| | | | | | | | |
| | |
Short-Term Securities | | | | | | | | |
| | |
| Money Market Funds — 3.8% | | | | | | |
BlackRock Cash Funds: Institutional, SL Agency Shares, 0.10%(e)(f)(g) | | | 5,393,094 | | | | 5,394,712 | |
BlackRock Cash Funds: Treasury, SL Agency Shares, 0.01%(e)(f) | | | 5,557,708 | | | | 5,557,708 | |
| | | | | | | | |
| |
Total Short-Term Securities — 3.8%
(Cost: $10,951,793) | | | | 10,952,420 | |
| | | | | | | | |
| |
Total Investments — 101.7%
(Cost: $257,088,820) | | | | 291,607,510 | |
Liabilities in Excess of Other Assets — (1.7)% | | | | (4,907,936 | ) |
| | | | | | | | |
| | |
Net Assets — 100.0% | | | | | | $ | 286,699,574 | |
| | | | | | | | |
| (a) | Non-income producing security. |
| (b) | All or a portion of this security is on loan. |
| (c) | Security exempt from registration pursuant to Rule 144A under the Securities Act of 1933, as amended. These securities may be resold in transactions exempt from registration to qualified institutional investors. |
| (d) | Security is valued using significant unobservable inputs and is classified as Level 3 in the fair value hierarchy. |
| (e) | Affiliate of the Master Portfolio. |
| (f) | Annualized 7-day yield as of period end. |
| (g) | All or a portion of this security was purchased with the cash collateral from loaned securities. |
Affiliates
Investments in issuers considered to be affiliate(s) of the Master Portfolio during the year ended December 31, 2021 for purposes of Section 2(a)(3) of the Investment Company Act of 1940, as amended, were as follows:
| | | | | | | | | | | | | | | | | | | | | | | | | | | | | | | | | | | | |
| | | | | | | | | | |
| Affiliated Issuer | | Value at 12/31/20 | | | Purchases at Cost | | | Proceeds from Sales | | | Net Realized Gain (Loss) | | | Change in Unrealized Appreciation (Depreciation) | | | Value at 12/31/21 | | | Shares Held at
12/31/21 | | | Income | | | Capital Gain Distributions from Underlying Funds | |
| | | | | | | | | |
BlackRock Cash Funds: Institutional, SL Agency Shares | | $ | 6,180,790 | | | $ | — | | | $ | (784,311 | )(a) | | $ | (557 | ) | | $ | (1,210 | ) | | $ | 5,394,712 | | | | 5,393,094 | | | $ | 23,619 | (b) | | $ | — | |
BlackRock Cash Funds: Treasury, SL Agency Shares | | | 5,615,009 | | | | — | | | | (57,301 | )(a) | | | — | | | | — | | | | 5,557,708 | | | | 5,557,708 | | | | 661 | | | | — | |
| | | | | | | | | | | | | | | | | | | | | | | | | | | | | | | | | | | | |
| | | | | | | | | |
| | | | | | | | | | | | | | $ | (557 | ) | | $ | (1,210 | ) | | $ | 10,952,420 | | | | | | | $ | 24,280 | | | $ | — | |
| | | | | | | | | | | | | | | | | | | | | | | | | | | | | | | | | | | | |
| | (a) | Represents net amount purchased (sold). | |
| | (b) | All or a portion represents securities lending income earned from the reinvestment of cash collateral from loaned securities, net of fees and collateral investment expenses, and other payments to and from borrowers of securities. | |
| | |
| 6 | | 2 0 2 1 BLACK ROCK ANNUAL REPORT TO SHAREHOLDERS |
| | |
Schedule of Investments (continued) December 31, 2021 | | International Tilts Master Portfolio |
Derivative Financial Instruments Outstanding as of Period End
Futures Contracts
| | | | | | | | | | | | | | | | |
| |
| | | | |
| Description | | Number of Contracts | | | Expiration Date | | | Notional Amount (000) | | | Value/ Unrealized Appreciation (Depreciation) | |
| |
| | | | |
Long Contracts | | | | | | | | | | | | | | | | |
MSCI EAFE Index | | | 45 | | | | 03/18/22 | | | $ | 5,224 | | | $ | 108,788 | |
| | | | | | | | | | | | | | | | |
Derivative Financial Instruments Categorized by Risk Exposure
As of period end, the fair values of derivative financial instruments located in the Statement of Assets and Liabilities were as follows:
| | | | | | | | | | | | | | | | | | | | | | | | | | | | |
| |
| | | | | | | |
| | | Commodity Contracts | | | Credit Contracts | | | Equity Contracts | | | Foreign Currency Exchange Contracts | | | Interest Rate Contracts | | | Other Contracts | | | Total | |
| |
| | | | | | | |
Assets — Derivative Financial Instruments | | | | | | | | | | | | | | | | | | | | | | | | | | | | |
Futures contracts | | | | | | | | | | | | | | | | | | | | | | | | | | | | |
Unrealized appreciation on futures contracts(a) | | $ | — | | | $ | — | | | $ | 108,788 | | | $ | — | | | $ | — | | | $ | — | | | $ | 108,788 | |
| | | | | | | | | | | | | | | | | | | | | | | | | | | | |
| | (a) | Net cumulative unrealized appreciation (depreciation) on futures contracts and centrally cleared swaps, if any, are reported in the Master Portfolio Schedule of Investments. In the Statement of Assets and Liabilities, only current day’s variation margin is reported in receivables or payables and the net cumulative unrealized appreciation (depreciation) is included in net unrealized appreciation (depreciation). | |
For the period ended December 31, 2021, the effect of derivative financial instruments in the Statement of Operations was as follows:
| | | | | | | | | | | | | | | | | | | | | | | | | | | | |
| |
| | | | | | | |
| | | Commodity Contracts | | | Credit Contracts | | | Equity Contracts | | | Foreign Currency Exchange Contracts | | | Interest Rate Contracts | | | Other Contracts | | | Total | |
| |
| | | | | | | |
Net Realized Gain (Loss) from: | | | | | | | | | | | | | | | | | | | | | | | | | | | | |
Futures contracts | | $ | — | | | $ | — | | | $ | 819,492 | | | $ | — | | | $ | — | | | $ | — | | | $ | 819,492 | |
| | | | | | | | | | | | | | | | | | | | | | | | | | | | |
| | | | | | | |
Net Change in Unrealized Appreciation (Depreciation) on: | | | | | | | | | | | | | | | | | | | | | | | | | | | | |
Futures contracts | | $ | — | | | $ | — | | | $ | 61,022 | | | $ | — | | | $ | — | | | $ | — | | | $ | 61,022 | |
| | | | | | | | | | | | | | | | | | | | | | | | | | | | |
Average Quarterly Balances of Outstanding Derivative Financial Instruments
| | | | | | | | | | | | | | | | | | | | | | | | | | | | |
| |
| | | | | | | |
Futures contracts: | | | | | | | | | | | | | | | | | | | | | | | | | | | | |
| | | | | | | |
Average notional value of contracts — long | | | | | | | | | | | | | | | | | | | | | | | | | | $ | 6,654,173 | |
| |
For more information about the Master Portfolio’s investment risks regarding derivative financial instruments, refer to the Notes to Financial Statements.
Fair Value Hierarchy as of Period End
Various inputs are used in determining the fair value of financial instruments. For a description of the input levels and information about the Master Portfolio’s policy regarding valuation of financial instruments, refer to the Notes to Financial Statements.
The following table summarizes the Master Portfolio’s financial instruments categorized in the fair value hierarchy. The breakdown of the Master Portfolio’s financial instruments into major categories is disclosed in the Schedule of Investments above.
| | | | | | | | | | | | | | | | |
| |
| | | | |
| | | Level 1 | | | Level 2 | | | Level 3 | | | Total | |
| |
| | | | |
Assets | | | | | | | | | | | | | | | | |
Investments | | | | | | | | | | | | | | | | |
Long-Term Investments | | | | | | | | | | | | | | | | |
Common Stocks | | | | | | | | | | | | | | | | |
Australia | | $ | — | | | $ | 15,816,682 | | | $ | — | | | $ | 15,816,682 | |
Austria | | | — | | | | 2,758,855 | | | | — | | | | 2,758,855 | |
Belgium | | | — | | | | 1,600,795 | | | | — | | | | 1,600,795 | |
China | | | — | | | | 278,758 | | | | — | | | | 278,758 | |
Denmark | | | — | | | | 7,945,730 | | | | — | | | | 7,945,730 | |
Finland | | | — | | | | 7,922,677 | | | | — | | | | 7,922,677 | |
| | | | |
MASTER PORTFOLIO SCHEDULE OF INVESTMENTS | | | 7 | |
| | |
Schedule of Investments (continued) December 31, 2021 | | International Tilts Master Portfolio |
Fair Value Hierarchy as of Period End (continued)
| | | | | | | | | | | | | | | | |
| |
| | | | |
| | | Level 1 | | | Level 2 | | | Level 3 | | | Total | |
| |
| | | | |
Common Stocks (continued) | | | | | | | | | | | | | | | | |
France | | $ | 27,160 | | | $ | 36,036,184 | | | $ | — | | | $ | 36,063,344 | |
Germany | | | — | | | | 28,020,684 | | | | — | | | | 28,020,684 | |
Hong Kong | | | — | | | | 5,682,341 | | | | — | | | | 5,682,341 | |
Ireland | | | 24,815 | | | | 3,620,588 | | | | — | | | | 3,645,403 | |
Israel | | | — | | | | 3,808,217 | | | | — | | | | 3,808,217 | |
Italy | | | — | | | | 5,896,417 | | | | — | | | | 5,896,417 | |
Japan | | | — | | | | 58,873,699 | | | | — | | | | 58,873,699 | |
Luxembourg | | | — | | | | 306,866 | | | | — | | | | 306,866 | |
Netherlands | | | 504,971 | | | | 19,231,430 | | | | — | | | | 19,736,401 | |
New Zealand | | | — | | | | 1,222,878 | | | | — | | | | 1,222,878 | |
Norway | | | — | | | | 2,852,998 | | | | — | | | | 2,852,998 | |
Portugal | | | 402,367 | | | | 143,342 | | | | — | | | | 545,709 | |
Singapore | | | — | | | | 2,908,593 | | | | — | | | | 2,908,593 | |
Spain | | | — | | | | 4,268,700 | | | | — | | | | 4,268,700 | |
Sweden | | | — | | | | 12,260,874 | | | | — | | | | 12,260,874 | |
Switzerland | | | — | | | | 24,436,627 | | | | — | | | | 24,436,627 | |
United Kingdom | | | 427,341 | | | | 31,844,816 | | | | — | | | | 32,272,157 | |
Preferred Securities | | | | | | | | | | | | | | | | |
Preferred Stocks | | | — | | | | 1,529,685 | | | | — | | | | 1,529,685 | |
| | | | |
Short-Term Securities | | | | | | | | | | | | | | | | |
Money Market Funds | | | 10,952,420 | | | | — | | | | — | | | | 10,952,420 | |
| | | | | | | | | | | | | | | | |
| | | | |
| | $ | 12,339,074 | | | $ | 279,268,436 | | | $ | — | | | $ | 291,607,510 | |
| | | | | | | | | | | | | | | | |
| | | | |
Derivative Financial Instruments(a) | | | | | | | | | | | | | | | | |
Assets | | | | | | | | | | | | | | | | |
Equity Contracts | | $ | 108,788 | | | $ | — | | | $ | — | | | $ | 108,788 | |
| | | | | | | | | | | | | | | | |
| | (a) | Derivative financial instruments are futures contracts. Futures contracts are valued at the unrealized appreciation (depreciation) on the instrument. | |
See notes to financial statements.
| | |
| 8 | | 2 0 2 1 BLACK ROCK ANNUAL REPORT TO SHAREHOLDERS |
Statement of Assets and Liabilities
December 31, 2021
| | | | |
| | | International Tilts Master Portfolio | |
| |
| |
ASSETS | | | | |
Investments, at value — unaffiliated(a)(b) | | $ | 280,655,090 | |
Investments, at value — affiliated(c) | | | 10,952,420 | |
Cash pledged for futures contracts | | | 275,910 | |
Foreign currency, at value(d) | | | 12,431 | |
Receivables: | | | | |
Securities lending income — affiliated | | | 582 | |
Dividends — unaffiliated | | | 310,404 | |
Dividends — affiliated | | | 24 | |
Prepaid expenses | | | 2,542 | |
| | | | |
| |
Total assets | | | 292,209,403 | |
| | | | |
| |
LIABILITIES | | | | |
Collateral on securities loaned | | | 5,394,039 | |
Payables: | | | | |
Administration fees | | | 11,901 | |
Investment advisory fees | | | 74,013 | |
Trustees’ and Officer’s fees | | | 3,496 | |
Professional fees | | | 23,422 | |
Variation margin on futures contracts | | | 2,958 | |
| | | | |
| |
Total liabilities | | | 5,509,829 | |
| | | | |
| |
NET ASSETS | | $ | 286,699,574 | |
| | | | |
| |
NET ASSETS CONSIST OF | | | | |
Investors’ capital | | $ | 252,071,466 | |
Net unrealized appreciation (depreciation) | | | 34,628,108 | |
| | | | |
| |
NET ASSETS | | $ | 286,699,574 | |
| | | | |
| |
(a) Investments, at cost — unaffiliated | | $ | 246,137,027 | |
(b) Securities loaned, at value | | $ | 4,953,636 | |
(c) Investments, at cost — affiliated | | $ | 10,951,793 | |
(d) Foreign currency, at cost | | $ | 13,199 | |
See notes to financial statements.
| | |
MASTER PORTFOLIO FINANCIAL STATEMENTS | | 9 |
Statement of Operations
Year Ended December 31, 2021
| | | | |
| | | International
Tilts Master
Portfolio | |
| |
| |
INVESTMENT INCOME | | | | |
Dividends — unaffiliated | | $ | 7,146,252 | |
Dividends — affiliated | | | 957 | |
Securities lending income — affiliated — net | | | 23,323 | |
Foreign taxes withheld | | | (930,884 | ) |
| | | | |
| |
Total investment income | | | 6,239,648 | |
| | | | |
| |
EXPENSES | | | | |
Investment advisory | | | 1,027,836 | |
Administration | | | 128,479 | |
Professional | | | 23,179 | |
Trustees and Officer | | | 8,289 | |
| | | | |
| |
Total expenses | | | 1,187,783 | |
Less: | | | | |
Fees waived and/or reimbursed by the Manager | | | (163,605 | ) |
| | | | |
| |
Total expenses after fees waived and/or reimbursed | | | 1,024,178 | |
| | | | |
| |
Net investment income | | | 5,215,470 | |
| | | | |
| |
REALIZED AND UNREALIZED GAIN (LOSS) | | | | |
Net realized gain (loss) from: | | | | |
Investments — unaffiliated | | | 24,787,084 | |
Investments — affiliated | | | (557 | ) |
Foreign currency transactions | | | 21,530 | |
Futures contracts | | | 819,492 | |
| | | | |
| |
| | | 25,627,549 | |
| | | | |
Net change in unrealized appreciation (depreciation) on: | | | | |
Investments — unaffiliated | | | (334,976 | ) |
Investments — affiliated | | | (1,210 | ) |
Foreign currency translations | | | (7,086 | ) |
Futures contracts | | | 61,022 | |
| | | | |
| |
| | | (282,250 | ) |
| | | | |
| |
Net realized and unrealized gain | | | 25,345,299 | |
| | | | |
| |
NET INCREASE IN NET ASSETS RESULTING FROM OPERATIONS | | $ | 30,560,769 | |
| | | | |
See notes to financial statements.
| | |
| 10 | | 2 0 2 1 BLACK ROCK ANNUAL REPORT TO SHAREHOLDERS |
Statements of Changes in Net Assets
| | | | | | | | |
| |
| | | International Tilts Master Portfolio | |
| | | | |
| |
| | | Year Ended December 31, | |
| | | | |
| | |
| | | 2021 | | | 2020 | |
| |
| | |
INCREASE (DECREASE) IN NET ASSETS | | | | | | | | |
| | |
OPERATIONS | | | | | | | | |
Net investment income | | $ | 5,215,470 | | | $ | 3,050,568 | |
Net realized gain | | | 25,627,549 | | | | 2,805,737 | |
Net change in unrealized appreciation (depreciation) | | | (282,250 | ) | | | 18,280,364 | |
| | | | | | | | |
| | |
Net increase in net assets resulting from operations | | | 30,560,769 | | | | 24,136,669 | |
| | | | | | | | |
| | |
CAPITAL TRANSACTIONS | | | | | | | | |
Proceeds from contributions | | | 43,597,486 | | | | 73,950,928 | |
Value of withdrawals | | | (7,672,392 | ) | | | (53,939,763 | ) |
| | | | | | | | |
| | |
Net increase in net assets derived from capital transactions | | | 35,925,094 | | | | 20,011,165 | |
| | | | | | | | |
| | |
NET ASSETS | | | | | | | | |
Total increase in net assets | | | 66,485,863 | | | | 44,147,834 | |
Beginning of year | | | 220,213,711 | | | | 176,065,877 | |
| | | | | | | | |
| | |
End of year | | $ | 286,699,574 | | | $ | 220,213,711 | |
| | | | | | | | |
See notes to financial statements.
| | |
MASTER PORTFOLIO FINANCIAL STATEMENTS | | 11 |
Financial Highlights
| | | | | | | | | | | | | | | | | | | | | | | | |
| | | International Tilts Master Portfolio | |
| |
| | | Year Ended December 31, | |
| | | | | | |
| | | | | | 2021 | | | 2020 | | | 2019 | | | 2018 | | | 2017 | |
| | | | | | |
Total Return | | | | | | | | | | | | | | | | | | | | | | | | |
Total return | | | | | | | 13.15 | % | | | 6.88 | % | | | 22.30 | % | | | (15.06 | )% | | | 29.06 | % |
| | | | | | | | | | | | | | | | | | | | | | | | |
| | | | | | |
Ratios to Average Net Assets(a) | | | | | | | | | | | | | | | | | | | | | | | | |
Total expenses | | | | | | | 0.46 | % | | | 0.47 | % | | | 0.47 | % | | | 0.46 | % | | | 0.47 | % |
| | | | | | | | | | | | | | | | | | | | | | | | |
| | | | | | |
Total expenses after fees waived and/or reimbursed | | | | | | | 0.40 | % | | | 0.40 | % | | | 0.40 | % | | | 0.40 | % | | | 0.40 | % |
| | | | | | | | | | | | | | | | | | | | | | | | |
| | | | | | |
Net investment income | | | | | | | 2.03 | % | | | 1.78 | % | | | 3.22 | % | | | 2.68 | %(b) | | | 2.81 | % |
| | | | | | | | | | | | | | | | | | | | | | | | |
| | | | | | |
Supplemental Data | | | | | | | | | | | | | | | | | | | | | | | | |
Net assets, end of year (000) | | | | | | $ | 286,700 | | | $ | 220,214 | | | $ | 176,066 | | | $ | 147,377 | | | $ | 163,969 | |
| | | | | | | | | | | | | | | | | | | | | | | | |
| | | | | | |
Portfolio turnover rate | | | | | | | 180 | % | | | 261 | % | | | 151 | % | | | 130 | % | | | 106 | % |
| | | | | | | | | | | | | | | | | | | | | | | | |
| (a) | Excludes fees and expenses incurred indirectly as a result of investments in underlying funds. |
| (b) | The ratio of net investment income to average net assets includes 0.04% resulting from a special dividend. |
See notes to financial statements.
| | |
| 12 | | 2 0 2 1 BLACK ROCK ANNUAL REPORT TO SHAREHOLDERS |
Notes to Financial Statements
Master Investment Portfolio (“MIP”) is registered under the Investment Company Act of 1940, as amended (the “1940 Act”), as an open-end management investment company. MIP is organized as a Delaware statutory trust. International Tilts Master Portfolio (the “Master Portfolio”) is a series of MIP. The Master Portfolio is classified as diversified.
The Master Portfolio, together with certain other registered investment companies advised by BlackRock Advisors, LLC (the “Manager”) or its affiliates, is included in a complex of open-end equity, multi-asset, index and money market funds referred to as the BlackRock Multi-Asset Complex.
| 2. | SIGNIFICANT ACCOUNTING POLICIES |
The financial statements are prepared in conformity with accounting principles generally accepted in the United States of America (“U.S. GAAP”), which may require management to make estimates and assumptions that affect the reported amounts of assets and liabilities in the financial statements, disclosure of contingent assets and liabilities at the date of the financial statements and the reported amounts of increases and decreases in net assets from operations during the reporting period. Actual results could differ from those estimates. The Master Portfolio is considered an investment company under U.S. GAAP and follows the accounting and reporting guidance applicable to investment companies. Below is a summary of significant accounting policies:
Investment Transactions and Income Recognition: For financial reporting purposes, investment transactions are recorded on the dates the transactions are executed. Realized gains and losses on investment transactions are determined using the specific identification method. Dividend income and capital gain distributions, if any, are recorded on the ex-dividend dates. Non-cash dividends, if any, are recorded on the ex-dividend dates at fair value. Dividends from foreign securities where the ex-dividend dates may have passed are subsequently recorded when the Master Portfolio is informed of the ex-dividend dates. Under the applicable foreign tax laws, a withholding tax at various rates may be imposed on capital gains, dividends and interest. Upon notification from issuers, a portion of the dividend income received from a real estate investment trust may be redesignated as a reduction of cost of the related investment and/or realized gain.
Foreign Currency Translation: The Master Portfolio’s books and records are maintained in U.S. dollars. Securities and other assets and liabilities denominated in foreign currencies are translated into U.S. dollars using exchange rates determined as of the close of trading on the New York Stock Exchange (“NYSE”). Purchases and sales of investments are recorded at the rates of exchange prevailing on the respective dates of such transactions. Generally, when the U.S. dollar rises in value against a foreign currency, the investments denominated in that currency will lose value; the opposite effect occurs if the U.S. dollar falls in relative value.
The Master Portfolio does not isolate the portion of the results of operations arising as a result of changes in the exchange rates from the changes in the market prices of investments held or sold for financial reporting purposes. Accordingly, the effects of changes in exchange rates on investments are not segregated in the Statement of Operations from the effects of changes in market prices of those investments, but are included as a component of net realized and unrealized gain (loss) from investments. Realized currency gains (losses) on foreign currency related transactions are reported as components of net realized gain (loss) for financial reporting purposes, whereas such components are generally treated as ordinary income for U.S. federal income tax purposes. The Master Portfolio has elected to treat realized gains (losses) from certain forward foreign currency exchange contracts as capital gain (loss) for U.S. federal income tax purposes.
Foreign Taxes: The Master Portfolio may be subject to foreign taxes (a portion of which may be reclaimable) on income, stock dividends, capital gains on investments, or certain foreign currency transactions. All foreign taxes are recorded in accordance with the applicable foreign tax regulations and rates that exist in the foreign jurisdictions in which the Master Portfolio invests. These foreign taxes, if any, are paid by the Master Portfolio and are reflected in its Statement of Operations as follows: foreign taxes withheld at source are presented as a reduction of income, foreign taxes on securities lending income are presented as a reduction of securities lending income, foreign taxes on stock dividends are presented as “Foreign taxes withheld”, and foreign taxes on capital gains from sales of investments and foreign taxes on foreign currency transactions are included in their respective net realized gain (loss) categories. Foreign taxes payable or deferred as of December 31, 2021, if any, are disclosed in the Statement of Assets and Liabilities.
The Master Portfolio files withholding tax reclaims in certain jurisdictions to recover a portion of amounts previously withheld. The Master Portfolio may record a reclaim receivable based on collectability, which includes factors such as the jurisdiction’s applicable laws, payment history and market convention. The Statement of Operations includes tax reclaims recorded as well as professional and other fees, if any, associated with recovery of foreign withholding taxes.
Segregation and Collateralization: In cases where the Master Portfolio enters into certain investments (e.g., futures contracts) that would be treated as “senior securities” for 1940 Act purposes, the Master Portfolio may segregate or designate on its books and records cash or liquid assets having a market value at least equal to the amount of its future obligations under such investments. Doing so allows the investments to be excluded from treatment as a “senior security.” Furthermore, if required by an exchange or counterparty agreement, the Master Portfolio may be required to deliver/deposit cash and/or securities to/with an exchange, or broker-dealer or custodian as collateral for certain investments or obligations.
Indemnifications: In the normal course of business, the Master Portfolio enters into contracts that contain a variety of representations that provide general indemnification. The Master Portfolio’s maximum exposure under these arrangements is unknown because it involves future potential claims against the Master Portfolio, which cannot be predicted with any certainty.
Other: Expenses directly related to the Master Portfolio are charged to the Master Portfolio. Other operating expenses shared by several funds, including other funds managed by the Manager, are prorated among those funds on the basis of relative net assets or other appropriate methods.
| | |
MASTER PORTFOLIO NOTES TO FINANCIAL STATEMENTS | | 13 |
Notes to Financial Statements (continued)
| 3. | INVESTMENT VALUATION AND FAIR VALUE MEASUREMENTS |
Investment Valuation Policies: The Master Portfolio’s investments are valued at fair value (also referred to as “market value” within the financial statements) each day that the Master Portfolio is open for business and, for financial reporting purposes, as of the report date. U.S. GAAP defines fair value as the price a fund would receive to sell an asset or pay to transfer a liability in an orderly transaction between market participants at the measurement date. The Master Portfolio determines the fair values of its financial instruments using various independent dealers or pricing services under policies approved by the Board of Trustees of the MIP (the “Board”). If a security’s market price is not readily available or does not otherwise accurately represent the fair value of the security, the security will be valued in accordance with a policy approved by the Board as reflecting fair value. The BlackRock Global Valuation Methodologies Committee (the “Global Valuation Committee”) is the committee formed by management to develop global pricing policies and procedures and to oversee the pricing function for all financial instruments.
Fair Value Inputs and Methodologies: The following methods and inputs are used to establish the fair value of the Master Portfolio’s assets and liabilities:
| | • | | Equity investments traded on a recognized securities exchange are valued at that day’s official closing price, as applicable, on the exchange where the stock is primarily traded. Equity investments traded on a recognized exchange for which there were no sales on that day may be valued at the last available bid (long positions) or ask (short positions) price. |
| | • | | Investments in open-end U.S. mutual funds (including money market funds) are valued at that day’s published net asset value (“NAV”). |
| | • | | Futures contracts are valued based on that day’s last reported settlement or trade price on the exchange where the contract is traded. |
Generally, trading in foreign instruments is substantially completed each day at various times prior to the close of trading on the NYSE. Each business day, the Master Portfolio uses current market factors supplied by independent pricing services to value certain foreign instruments (“Systematic Fair Value Price”). The Systematic Fair Value Price is designed to value such foreign securities at fair value as of the close of trading on the NYSE, which follows the close of the local markets.
If events (e.g., market volatility, company announcement or a natural disaster) occur that are expected to materially affect the value of such investment, or in the event that application of these methods of valuation results in a price for an investment that is deemed not to be representative of the market value of such investment, or if a price is not available, the investment will be valued by the Global Valuation Committee, or its delegate, in accordance with a policy approved by the Board as reflecting fair value (“Fair Valued Investments”). The fair valuation approaches that may be used by the Global Valuation Committee include market approach, income approach and cost approach. Valuation techniques such as discounted cash flow, use of market comparables and matrix pricing are types of valuation approaches and are typically used in determining fair value. When determining the price for Fair Valued Investments, the Global Valuation Committee, or its delegate, seeks to determine the price that the Master Portfolio might reasonably expect to receive or pay from the current sale or purchase of that asset or liability in an arm’s-length transaction. Fair value determinations shall be based upon all available factors that the Global Valuation Committee, or its delegate, deems relevant and consistent with the principles of fair value measurement. The pricing of all Fair Valued Investments is subsequently reported to the Board or a committee thereof on a quarterly basis.
For investments in equity or debt issued by privately held companies or funds (“Private Company” or collectively, the “Private Companies”) and other Fair Valued Investments, the fair valuation approaches that are used by the Global Valuation Committee and third-party pricing services utilize one or a combination of, but not limited to, the following inputs.
| | |
| | | Standard Inputs Generally Considered By Third-Party Pricing Services |
| |
Market approach | | (i) recent market transactions, including subsequent rounds of financing, in the underlying investment or comparable issuers; (ii) recapitalizations and other transactions across the capital structure; and (iii) market multiples of comparable issuers. |
| |
Income approach | | (i) future cash flows discounted to present and adjusted as appropriate for liquidity, credit, and/or market risks; (ii) quoted prices for similar investments or assets in active markets; and (iii) other risk factors, such as interest rates, yield curves, volatilities, prepayment speeds, loss severities, credit risks, recovery rates, liquidation amounts and/or default rates. |
| |
Cost approach | | (i) audited or unaudited financial statements, investor communications and financial or operational metrics issued by the Private Company; (ii) changes in the valuation of relevant indices or publicly traded companies comparable to the Private Company; (iii) relevant news and other public sources; and (iv) known secondary market transactions in the Private Company’s interests and merger or acquisition activity in companies comparable to the Private Company. |
Investments in series of preferred stock issued by Private Companies are typically valued utilizing market approach in determining the enterprise value of the company. Such investments often contain rights and preferences that differ from other series of preferred and common stock of the same issuer. Enterprise valuation techniques such as an option pricing model (“OPM”), a probability weighted expected return model (“PWERM”), current value method or a hybrid of those techniques are used as deemed appropriate under the circumstances. The use of these valuation techniques involve a determination of the exit scenarios of the investment in order to appropriately allocate the enterprise value of the company among the various parts of its capital structure.
The Private Companies are not subject to the public company disclosure, timing, and reporting standards applicable to other investments held by the Master Portfolio. Typically, the most recently available information by a Private Company is as of a date that is earlier than the date the Master Portfolio is calculating its NAV. This factor may result in a difference between the value of the investment and the price the Master Portfolio could receive upon the sale of the investment.
Fair Value Hierarchy: Various inputs are used in determining the fair value of financial instruments. These inputs to valuation techniques are categorized into a fair value hierarchy consisting of three broad levels for financial reporting purposes as follows:
| | |
| 14 | | 2 0 2 1 BLACK ROCK ANNUAL REPORT TO SHAREHOLDERS |
Notes to Financial Statements (continued)
| | • | | Level 1 – Unadjusted price quotations in active markets/exchanges for identical assets or liabilities that the Master Portfolio has the ability to access; |
| | • | | Level 2 – Other observable inputs (including, but not limited to, quoted prices for similar assets or liabilities in markets that are active, quoted prices for identical or similar assets or liabilities in markets that are not active, inputs other than quoted prices that are observable for the assets or liabilities (such as interest rates, yield curves, volatilities, prepayment speeds, loss severities, credit risks and default rates) or other market-corroborated inputs); and |
| | • | | Level 3 – Unobservable inputs based on the best information available in the circumstances, to the extent observable inputs are not available (including the Global Valuation Committee’s assumptions used in determining the fair value of financial instruments). |
The hierarchy gives the highest priority to unadjusted quoted prices in active markets for identical assets or liabilities (Level 1 measurements) and the lowest priority to unobservable inputs (Level 3 measurements). Accordingly, the degree of judgment exercised in determining fair value is greatest for instruments categorized in Level 3. The inputs used to measure fair value may fall into different levels of the fair value hierarchy. In such cases, for disclosure purposes, the fair value hierarchy classification is determined based on the lowest level input that is significant to the fair value measurement in its entirety. Investments classified within Level 3 have significant unobservable inputs used by the Global Valuation Committee in determining the price for Fair Valued Investments. Level 3 investments include equity or debt issued by Private Companies that may not have a secondary market and/or may have a limited number of investors. The categorization of a value determined for financial instruments is based on the pricing transparency of the financial instruments and is not necessarily an indication of the risks associated with investing in those securities.
| 4. | SECURITIES AND OTHER INVESTMENTS |
Preferred Stocks: Preferred stock has a preference over common stock in liquidation (and generally in receiving dividends as well), but is subordinated to the liabilities of the issuer in all respects. As a general rule, the market value of preferred stock with a fixed dividend rate and no conversion element varies inversely with interest rates and perceived credit risk, while the market price of convertible preferred stock generally also reflects some element of conversion value. Because preferred stock is junior to debt securities and other obligations of the issuer, deterioration in the credit quality of the issuer will cause greater changes in the value of a preferred stock than in a more senior debt security with similar stated yield characteristics. Unlike interest payments on debt securities, preferred stock dividends are payable only if declared by the issuer’s board of directors. Preferred stock also may be subject to optional or mandatory redemption provisions.
Securities Lending: The Master Portfolio may lend its securities to approved borrowers, such as brokers, dealers and other financial institutions. The borrower pledges and maintains with the Master Portfolio collateral consisting of cash, an irrevocable letter of credit issued by a bank, or securities issued or guaranteed by the U.S. Government. The initial collateral received by the Master Portfolio is required to have a value of at least 102% of the current value of the loaned securities for securities traded on U.S. exchanges and a value of at least 105% for all other securities. The collateral is maintained thereafter at a value equal to at least 100% of the current market value of the securities on loan. The market value of the loaned securities is determined at the close of each business day of the Master Portfolio and any additional required collateral is delivered to the Master Portfolio, or excess collateral returned by the Master Portfolio, on the next business day. During the term of the loan, the Master Portfolio is entitled to all distributions made on or in respect of the loaned securities, but does not receive interest income on securities received as collateral. Loans of securities are terminable at any time and the borrower, after notice, is required to return borrowed securities within the standard time period for settlement of securities transactions.
As of period end, any securities on loan were collateralized by cash and/or U.S. Government obligations. Cash collateral invested by the securities lending agent, BlackRock Institutional Trust Company, N.A. (“BTC”), if any, is disclosed in the Schedule of Investments. Any non-cash collateral received cannot be sold, re-invested or pledged by the Master Portfolio, except in the event of borrower default. The securities on loan, if any, are disclosed in the Master Portfolio’s Schedule of Investments. The market value of any securities on loan and the value of any related collateral are shown separately in the Statement of Assets and Liabilities as a component of investments at value –unaffiliated and collateral on securities loaned at value, respectively.
Securities lending transactions are entered into by the Master Portfolio under Master Securities Lending Agreements (each, an “MSLA”), which provide the right, in the event of default (including bankruptcy or insolvency), for the non-defaulting party to liquidate the collateral and calculate a net exposure to the defaulting party or request additional collateral. In the event that a borrower defaults, the Master Portfolio, as lender, would offset the market value of the collateral received against the market value of the securities loaned. When the value of the collateral is greater than that of the market value of the securities loaned, the lender is left with a net amount payable to the defaulting party. However, bankruptcy or insolvency laws of a particular jurisdiction may impose restrictions on or prohibitions against such a right of offset in the event of an MSLA counterparty’s bankruptcy or insolvency. Under the MSLA, absent an event of default, the borrower can resell or re-pledge the loaned securities, and the Master Portfolio can reinvest cash collateral received in connection with loaned securities. Upon an event of default, the parties’ obligations to return the securities or collateral to the other party are extinguished, and the parties can resell or re-pledge the loaned securities or the collateral received in connection with the loaned securities in order to satisfy the defaulting party’s net payment obligation for all transactions under the MSLA. The defaulting party remains liable for any deficiency.
As of period end, the following table is a summary of the Master Portfolio’s securities on loan by counterparty which are subject to offset under an MSLA:
| | | | | | | | | | | | | | | | |
| |
| | | | |
| Counterparty | |
| Securities
Loaned at Value |
| |
| Cash Collateral
Received |
(a) | |
| Non-Cash Collateral
Received at Fair Value |
| |
| Net
Amount |
|
| |
| | | | |
BofA Securities, Inc. | | $ | 184,321 | | | $ | (184,321 | ) | | $ | — | | | $ | — | |
Credit Suisse Securities (USA) LLC | | | 361,026 | | | | (361,026 | ) | | | — | | | | — | |
Goldman Sachs & Co. LLC | | | 2,373,200 | | | | (2,373,200 | ) | | | — | | | | — | |
HSBC Bank PLC | | | 249,008 | | | | (249,008 | ) | | | — | | | | — | |
J.P. Morgan Securities LLC | | | 1,287,980 | | | | (1,287,980 | ) | | | — | | | | — | |
| | |
MASTER PORTFOLIO NOTES TO FINANCIAL STATEMENTS | | 15 |
Notes to Financial Statements (continued)
| | | | | | | | | | | | | | | | |
| |
| | | | |
| Counterparty | |
| Securities
Loaned at Value |
| |
| Cash Collateral
Received |
(a) | |
| Non-Cash Collateral
Received at Fair Value |
| |
| Net
Amount |
|
| |
| | | | |
Morgan Stanley & Co. LLC | | $ | 424,117 | | | $ | (424,117 | ) | | $ | — | | | $ | — | |
State Street Bank & Trust Co. | | | 73,984 | | | | (73,984 | ) | | | — | | | | — | |
| | | | | | | | | | | | | | | | |
| | | | |
| | $ | 4,953,636 | | | $ | (4,953,636 | ) | | $ | — | | | $ | — | |
| | | | | | | | | | | | | | | | |
| | (a) | Collateral received in excess of the market value of securities on loan is not presented in this table. The total cash collateral received by the Master Portfolio is disclosed in the Master Portfolio’s Statement of Assets and Liabilities. | |
The risks of securities lending include the risk that the borrower may not provide additional collateral when required or may not return the securities when due. To mitigate these risks, the Master Portfolio benefits from a borrower default indemnity provided by BlackRock, Inc. (“BlackRock”). BlackRock’s indemnity allows for full replacement of the securities loaned to the extent the collateral received does not cover the value on the securities loaned in the event of borrower default. The Master Portfolio could incur a loss if the value of an investment purchased with cash collateral falls below the market value of loaned securities or if the value of an investment purchased with cash collateral falls below the value of the original cash collateral received. Such losses are borne entirely by the Master Portfolio.
| 5. | DERIVATIVE FINANCIAL INSTRUMENTS |
The Master Portfolio engages in various portfolio investment strategies using derivative contracts both to increase the returns of the Master Portfolio and/or to manage its exposure to certain risks such as credit risk, equity risk, interest rate risk, foreign currency exchange rate risk, commodity price risk or other risks (e.g., inflation risk). Derivative financial instruments categorized by risk exposure are included in the Schedule of Investments. These contracts may be transacted on an exchange or over-the-counter (“OTC”).
Futures Contracts: Futures contracts are purchased or sold to gain exposure to, or manage exposure to, changes in interest rates (interest rate risk) and changes in the value of equity securities (equity risk) or foreign currencies (foreign currency exchange rate risk).
Futures contracts are exchange-traded agreements between the Master Portfolio and a counterparty to buy or sell a specific quantity of an underlying instrument at a specified price and on a specified date. Depending on the terms of a contract, it is settled either through physical delivery of the underlying instrument on the settlement date or by payment of a cash amount on the settlement date. Upon entering into a futures contract, the Master Portfolio is required to deposit initial margin with the broker in the form of cash or securities in an amount that varies depending on a contract’s size and risk profile. The initial margin deposit must then be maintained at an established level over the life of the contract. Amounts pledged, which are considered restricted, are included in cash pledged for futures contracts in the Statement of Assets and Liabilities.
Securities deposited as initial margin are designated in the Schedule of Investments and cash deposited, if any, are shown as cash pledged for futures contracts in the Statement of Assets and Liabilities. Pursuant to the contract, the Master Portfolio agrees to receive from or pay to the broker an amount of cash equal to the daily fluctuation in market value of the contract (“variation margin”). Variation margin is recorded as unrealized appreciation (depreciation) and, if any, shown as variation margin receivable (or payable) on futures contracts in the Statement of Assets and Liabilities. When the contract is closed, a realized gain or loss is recorded in the Statement of Operations equal to the difference between the notional amount of the contract at the time it was opened and the notional amount at the time it was closed. The use of futures contracts involves the risk of an imperfect correlation in the movements in the price of futures contracts and interest rates, foreign currency exchange rates or underlying assets.
| 6. | INVESTMENT ADVISORY AGREEMENT AND OTHER TRANSACTIONS WITH AFFILIATES |
Investment Advisory: MIP, on behalf of the Master Portfolio, entered into an Investment Advisory Agreement with the Manager, the Master Portfolio’s investment adviser and an indirect, wholly-owned subsidiary of BlackRock, to provide investment advisory services. The Manager is responsible for the management of the Master Portfolio’s portfolio and provides the personnel, facilities, equipment and certain other services necessary to the operations of the Master Portfolio.
For such services, the Master Portfolio pays the Manager a monthly fee at an annual rate equal to the following percentages of the average daily value of the Master Portfolio’s net assets:
| | | | |
| |
| |
| Average Daily Net Assets | | Investment
Advisory Fees | |
| |
| |
First $1 billion | | | 0.40% | |
$1 billion -$3 billion | | | 0.38 | |
$3 billion -$5 billion | | | 0.36 | |
$5 billion -$10 billion | | | 0.35 | |
Greater than $10 billion | | | 0.34 | |
| |
MIP, on behalf of the Master Portfolio entered into an Administration Agreement with the Manager, which has agreed to provide general administrative services (other than investment advice and related portfolio activities). The Manager has agreed to bear all of the Master Portfolio’s ordinary operating expenses, excluding, generally, investment advisory fees, distribution fees, brokerage and other expenses related to the execution of portfolio transactions, extraordinary expenses and certain other expenses which are borne by the Master Portfolio. The Manager is entitled to receive for these administrative services an annual fee of 0.05% based on the average daily net assets of the Master Portfolio.
| | |
| 16 | | 2 0 2 1 BLACK ROCK ANNUAL REPORT TO SHAREHOLDERS |
Notes to Financial Statements (continued)
The Manager entered into separate sub-advisory agreements with BlackRock Fund Advisors (“BFA”) and BlackRock International Limited (“BIL”) (collectively, the “Sub-Advisers”), each an affiliate of the Manager. The Manager pays BFA and BIL for services they provide for that portion of the Master Portfolio for which BFA and BIL, as applicable, acts as sub-adviser, a monthly fee that is equal to a percentage of the investment advisory fees paid by the Master Portfolio to the Manager.
Expense Waivers and Reimbursements: The fees and expenses of MIP’s trustees who are not “interested persons” of MIP, as defined in the 1940 Act (“Independent Trustees”), counsel to the Independent Trustees and the Master Portfolio’s independent registered public accounting firm (together, the “independent expenses”) are paid directly by the Master Portfolio. The Manager has contractually agreed to reimburse the Master Portfolio or provide an offsetting credit against the administration fees paid by the Master Portfolio in an amount equal to these independent expenses through June 30, 2023. Such contractual arrangement may not be terminated prior to July 1, 2023 without the consent of the Board of MIP. This amount is included in fees waived and/or reimbursed by the Manager in the Statement of Operations. For the year ended December 31, 2021, the amount waived was $31,468.
The Manager contractually agreed to waive its investment advisory fees by the amount of investment advisory fees the Master Portfolio pays to the Manager indirectly through its investment in affiliated money market funds (the “affiliated money market fund waiver”) through June 30, 2023. The contractual agreement may be terminated upon 90 days’ notice by a majority of the Independent Trustees, or by a vote of a majority of the outstanding voting securities of the Master Portfolio. This amount is included in fees waived and/or reimbursed by the Manager in the Statement of Operations. For the year ended December 31, 2021, the amounts waived were $3,658.
The Manager has contractually agreed to waive its investment advisory fee with respect to any portion of the Master Portfolio’s assets invested in affiliated equity and fixed-income mutual funds and affiliated exchange-traded funds that have a contractual management fee through June 30, 2023. The contractual agreement may be terminated upon 90 days’ notice by a majority of the Independent Trustees, or by a vote of a majority of the outstanding voting securities of the Master Portfolio. For the year ended December 31, 2021, there were no fees waived and/or reimbursed by the Manager pursuant to this arrangement.
The Manager has contractually agreed to waive administration fees through June 30, 2023. This waiver agreement may be terminated upon 90 days’ notice by a majority of the Independent Trustees or by a majority of the outstanding voting securities of the Master Portfolio. This amount is included in fees waived and/or reimbursed by the Manager in the Statement of Operations. For the year ended December 31, 2021, the Manager waived $128,479.
Securities Lending: The U.S. Securities and Exchange Commission (“SEC”) has issued an exemptive order which permits BTC, an affiliate of the Manager, to serve as securities lending agent for the Master Portfolio, subject to applicable conditions. As securities lending agent, BTC bears all operational costs directly related to securities lending, including any custodial costs. The Master Portfolio is responsible for fees in connection with the investment of cash collateral received for securities on loan (the “collateral investment fees”). The cash collateral is invested in a money market fund, BlackRock Cash Funds: Institutional or BlackRock Cash Funds: Treasury, managed by the Manager or its affiliates. However, BTC has agreed to reduce the amount of securities lending income it receives in order to effectively limit the collateral investment fees the Master Portfolio bears to an annual rate of 0.04%. The SL Agency Shares of such money market fund will not be subject to a sales load, distribution fee or service fee. The money market fund in which the cash collateral has been invested may, under certain circumstances, impose a liquidity fee of up to 2% of the value redeemed or temporarily restrict redemptions for up to 10 business days during a 90 day period, in the event that the money market fund’s weekly liquid assets fall below certain thresholds.
Securities lending income is equal to the total of income earned from the reinvestment of cash collateral, net of fees and other payments to and from borrowers of securities, and less the collateral investment fees. The Master Portfolio retains a portion of securities lending income and remits a remaining portion to BTC as compensation for its services as securities lending agent.
Pursuant to the current securities lending agreement, the Master Portfolio retains 82% of securities lending income (which excludes collateral investment fees), and this amount retained can never be less than 70% of the total of securities lending income plus the collateral investment fees.
In addition, commencing the business day following the date that the aggregate securities lending income earned across the BlackRock Multi-Asset Complex in a calendar year exceeds a specified threshold, the Master Portfolio, pursuant to the securities lending agreement, will retain for the remainder of that calendar year securities lending income in an amount equal to 85% of securities lending income (which excludes collateral investment fees), and this amount retained can never be less than 70% of the total of securities lending income plus the collateral investment fees.
The share of securities lending income earned by the Master Portfolio is shown as securities lending income — affiliated — net in the Statement of Operations. For the year ended December 31, 2021, the Master Portfolio paid BTC $6,676 for securities lending agent services.
Interfund Lending: In accordance with an exemptive order (the “Order”) from the SEC, the Master Portfolio may participate in a joint lending and borrowing facility for temporary purposes (the “Interfund Lending Program”), subject to compliance with the terms and conditions of the Order, and to the extent permitted by the Master Portfolio’s investment policies and restrictions. The Master Portfolio is currently permitted to borrow and lend under the Interfund Lending Program.
A lending BlackRock fund may lend in aggregate up to 15% of its net assets but may not lend more than 5% of its net assets to any one borrowing fund through the Interfund Lending Program. A borrowing BlackRock fund may not borrow through the Interfund Lending Program or from any other source more than 33 1/3% of its total assets (or any lower threshold provided for by the fund’s investment restrictions). If a borrowing BlackRock fund’s total outstanding borrowings exceed 10% of its total assets, each of its outstanding interfund loans will be subject to collateralization of at least 102% of the outstanding principal value of the loan. All interfund loans are for temporary or emergency purposes and the interest rate to be charged will be the average of the highest current overnight repurchase agreement rate available to a lending fund and the bank loan rate, as calculated according to a formula established by the Board.
| | |
MASTER PORTFOLIO NOTES TO FINANCIAL STATEMENTS | | 17 |
Notes to Financial Statements (continued)
During the year ended December 31, 2021, the Master Portfolio did not participate in the Interfund Lending Program.
Trustees and Officers: Certain trustees and/or officers of MIP are directors and/or officers of BlackRock or its affiliates.
Other Transactions: The Master Portfolio may purchase securities from, or sell securities to, an affiliated fund provided the affiliation is due solely to having a common investment adviser, common officers, or common trustees. For the year ended December 31, 2021, the purchase and sale transactions and any net realized gains (losses) with affiliated funds in compliance with Rule 17a-7 under the 1940 Act were as follows:
| | | | | | | | | | | | |
| |
| | | |
| Master Portfolio Name | | Purchases | | | Sales | | | Net Realized
Gain (Loss) | |
| |
| | | |
International Tilts Master Portfolio | | $ | 3,394,988 | | | $ | — | | | $ | — | |
| |
For the year ended December 31, 2021, purchases and sales of investments, excluding short-term investments, were $485,402,330 and $443,254,404, respectively.
The Master Portfolio is classified as a partnership for U.S. federal income tax purposes. As such, each investor in the Master Portfolio is treated as the owner of its proportionate share of net assets, income, expenses and realized and unrealized gains and losses of the Master Portfolio. Therefore, no U.S. federal income tax provision is required. It is intended that the Master Portfolio’s assets will be managed so an investor in the Master Portfolio can satisfy the requirements of Subchapter M of the Internal Revenue Code of 1986, as amended.
The Master Portfolio files U.S. federal and various state and local tax returns. No income tax returns are currently under examination. The statute of limitations on the Master Portfolio’s U.S. federal tax returns generally remains open for a period of three fiscal years after they are filed. The statutes of limitations on the Master Portfolio’s state and local tax returns may remain open for an additional year depending upon the jurisdiction.
Management has analyzed tax laws and regulations and their application to the Master Portfolio as of December 31, 2021, inclusive of the open tax return years, and does not believe that there are any uncertain tax positions that require recognition of a tax liability in the Master Portfolio’s financial statements.
As of December 31, 2021, gross unrealized appreciation and depreciation based on cost of investments (including short positions and derivatives, if any) for U.S. federal income tax purposes were as follows:
| | | | | | | | | | | | | | | | |
| |
| | | | |
| Master Portfolio Name | | Tax Cost | | | Gross Unrealized
Appreciation | | | Gross Unrealized
Depreciation | | | Net Unrealized
Appreciation
(Depreciation) | |
| |
| | | | |
International Tilts Master Portfolio | | $ | 261,399,136 | | | $ | 39,285,059 | | | $ | (9,076,685 | ) | | $ | 30,208,374 | |
| |
MIP, on behalf of the Master Portfolio, along with certain other funds managed by the Manager and its affiliates (“Participating Funds”), is a party to a 364-day, $2.25 billion credit agreement with a group of lenders. Under this agreement, the Master Portfolio may borrow to fund shareholder redemptions. Excluding commitments designated for certain individual funds, the Participating Funds, including the Master Portfolio, can borrow up to an aggregate commitment amount of $1.75 billion at any time outstanding, subject to asset coverage and other limitations as specified in the agreement. The credit agreement has the following terms: a fee of 0.10% per annum on unused commitment amounts and interest at a rate equal to the higher of (a) one-month London Interbank Offered Rate (“LIBOR”) (but, in any event, not less than 0.00%) on the date the loan is made plus 0.80% per annum or (b) the Fed Funds rate (but, in any event, not less than 0.00%) in effect from time to time plus 0.80% per annum on amounts borrowed. The agreement expires in April 2022 unless extended or renewed. These fees were allocated among such funds based upon portions of the aggregate commitment available to them and relative net assets of Participating Funds. During the year ended December 31, 2021, the Master Portfolio did not borrow under the credit agreement.
In the normal course of business, the Master Portfolio invests in securities or other instruments and may enter into certain transactions, and such activities subject the Master Portfolio to various risks, including among others, fluctuations in the market (market risk) or failure of an issuer to meet all of its obligations. The value of securities or other instruments may also be affected by various factors, including, without limitation: (i) the general economy; (ii) the overall market as well as local, regional or global political and/or social instability; (iii) regulation, taxation or international tax treaties between various countries; or (iv) currency, interest rate and price fluctuations. Local, regional or global events such as war, acts of terrorism, the spread of infectious illness or other public health issues, recessions, or other events could have a significant impact on the Master Portfolio and its investments. The Master Portfolio’s prospectus provides details of the risks to which the Master Portfolio is subject.
| | |
| 18 | | 2 0 2 1 BLACK ROCK ANNUAL REPORT TO SHAREHOLDERS |
Notes to Financial Statements (continued)
The Master Portfolio may be exposed to additional risks when reinvesting cash collateral in money market funds that do not seek to maintain a stable NAV per share of $1.00, which may be subject to redemption gates or liquidity fees under certain circumstances.
Market Risk: An outbreak of respiratory disease caused by a novel coronavirus has developed into a global pandemic and has resulted in closing borders, quarantines, disruptions to supply chains and customer activity, as well as general concern and uncertainty. The impact of this pandemic, and other global health crises that may arise in the future, could affect the economies of many nations, individual companies and the market in general in ways that cannot necessarily be foreseen at the present time. This pandemic may result in substantial market volatility and may adversely impact the prices and liquidity of a fund’s investments. The duration of this pandemic and its effects cannot be determined with certainty.
Valuation Risk: The market values of equities, such as common stocks and preferred securities or equity related investments, such as futures and options, may decline due to general market conditions which are not specifically related to a particular company. They may also decline due to factors which affect a particular industry or industries. The Master Portfolio may invest in illiquid investments. An illiquid investment is any investment that the Master Portfolio reasonably expects cannot be sold or disposed of in current market conditions in seven calendar days or less without the sale or disposition significantly changing the market value of the investment. The Master Portfolio may experience difficulty in selling illiquid investments in a timely manner at the price that it believes the investments are worth. Prices may fluctuate widely over short or extended periods in response to company, market or economic news. Markets also tend to move in cycles, with periods of rising and falling prices. This volatility may cause the Master Portfolio’s NAV to experience significant increases or decreases over short periods of time. If there is a general decline in the securities and other markets, the NAV of the Master Portfolio may lose value, regardless of the individual results of the securities and other instruments in which the Master Portfolio invests.
The price the Master Portfolio could receive upon the sale of any particular portfolio investment may differ from the Master Portfolio’s valuation of the investment, particularly for securities that trade in thin or volatile markets or that are valued using a fair valuation technique or a price provided by an independent pricing service. Changes to significant unobservable inputs and assumptions (i.e., publicly traded company multiples, growth rate, time to exit) due to the lack of observable inputs may significantly impact the resulting fair value and therefore the Master Portfolio’s results of operations. As a result, the price received upon the sale of an investment may be less than the value ascribed by the Master Portfolio, and the Master Portfolio could realize a greater than expected loss or lesser than expected gain upon the sale of the investment. The Master Portfolio’s ability to value its investments may also be impacted by technological issues and/or errors by pricing services or other third-party service providers.
Counterparty Credit Risk: The Master Portfolio may be exposed to counterparty credit risk, or the risk that an entity may fail to or be unable to perform on its commitments related to unsettled or open transactions, including making timely interest and/or principal payments or otherwise honoring its obligations. The Master Portfolio manages counterparty credit risk by entering into transactions only with counterparties that the Manager believes have the financial resources to honor their obligations and by monitoring the financial stability of those counterparties. Financial assets, which potentially expose the Master Portfolio to market, issuer and counterparty credit risks, consist principally of financial instruments and receivables due from counterparties. The extent of the Master Portfolio’s exposure to market, issuer and counterparty credit risks with respect to these financial assets is approximately their value recorded in the Statement of Assets and Liabilities, less any collateral held by the Master Portfolio.
A derivative contract may suffer a mark-to-market loss if the value of the contract decreases due to an unfavorable change in the market rates or values of the underlying instrument. Losses can also occur if the counterparty does not perform under the contract.
With exchange-traded futures, there is less counterparty credit risk to the Master Portfolio since the exchange or clearinghouse, as counterparty to such instruments, guarantees against a possible default. The clearinghouse stands between the buyer and the seller of the contract; therefore, credit risk is limited to failure of the clearinghouse. While offset rights may exist under applicable law, the Master Portfolio does not have a contractual right of offset against a clearing broker or clearinghouse in the event of a default (including the bankruptcy or insolvency). Additionally, credit risk exists in exchange-traded futures with respect to initial and variation margin that is held in a clearing broker’s customer accounts. While clearing brokers are required to segregate customer margin from their own assets, in the event that a clearing broker becomes insolvent or goes into bankruptcy and at that time there is a shortfall in the aggregate amount of margin held by the clearing broker for all its clients, typically the shortfall would be allocated on a pro rata basis across all the clearing broker’s customers, potentially resulting in losses to the Master Portfolio.
Concentration Risk: A diversified portfolio, where this is appropriate and consistent with a fund’s objectives, minimizes the risk that a price change of a particular investment will have a material impact on the NAV of a fund. The investment concentrations within the Master Portfolio’s portfolio are disclosed in its Schedule of Investments.
The Master Portfolio invests a significant portion of its assets in securities of issuers located in Europe or with significant exposure to European issuers or countries. The European financial markets have recently experienced volatility and adverse trends due to concerns about economic downturns in, or rising government debt levels of, several European countries. These events may spread to other countries in Europe and may affect the value and liquidity of certain of the Master Portfolio’s investments.
Responses to the financial problems by European governments, central banks and others, including austerity measures and reforms, may not work, may result in social unrest and may limit future growth and economic recovery or have other unintended consequences. Further defaults or restructurings by governments and others of their debt could have additional adverse effects on economies, financial markets and asset valuations around the world. In addition, the United Kingdom has withdrawn from the European Union, and one or more other countries may withdraw from the European Union and/or abandon the Euro, the common currency of the European Union. The impact of these actions, especially if they occur in a disorderly fashion, is not clear but could be significant and far reaching.
LIBOR Transition Risk: The United Kingdom’s Financial Conduct Authority announced a phase out of the LIBOR. Although many LIBOR rates will cease to be published or no longer will be representative of the underlying market they seek to measure after December 31, 2021, a selection of widely used USD LIBOR rates will continue to be published through June 2023 in order to assist with the transition. The Master Portfolio may be exposed to financial instruments tied to LIBOR to determine payment obligations, financing terms, hedging strategies or investment value. The transition process away from LIBOR might lead to increased volatility and illiquidity in markets for, and reduce the effectiveness of new hedges placed against instruments whose terms currently include LIBOR. The ultimate effect of the LIBOR transition process on the Master Portfolio is uncertain.
| | |
MASTER PORTFOLIO NOTES TO FINANCIAL STATEMENTS | | 19 |
Notes to Financial Statements (continued)
Management has evaluated the impact of all subsequent events on the Master Portfolio through the date the financial statements were issued and has determined that there were no subsequent events requiring adjustment or additional disclosure in the financial statements.
| | |
| 20 | | 2 0 2 1 BLACK ROCK ANNUAL REPORT TO SHAREHOLDERS |
Report of Independent Registered Public Accounting Firm
To the Board of Trustees of Master Investment Portfolio and Investors of International Tilts Master Portfolio
Opinion on the Financial Statements
We have audited the accompanying statement of assets and liabilities, including the schedule of investments, of International Tilts Master Portfolio (one of the series constituting Master Investment Portfolio, referred to hereafter as the “Master Portfolio”) as of December 31, 2021, the related statement of operations for the year ended December 31, 2021, the statements of changes in net assets for each of the two years in the period ended December 31, 2021, including the related notes, and the financial highlights for each of the five years in the period ended December 31, 2021 (collectively referred to as the “financial statements”). In our opinion, the financial statements present fairly, in all material respects, the financial position of the Master Portfolio as of December 31, 2021, the results of its operations for the year then ended, the changes in its net assets for each of the two years in the period ended December 31, 2021 and the financial highlights for each of the five years in the period ended December 31, 2021 in conformity with accounting principles generally accepted in the United States of America.
Basis for Opinion
These financial statements are the responsibility of the Master Portfolio’s management. Our responsibility is to express an opinion on the Master Portfolio’s financial statements based on our audits. We are a public accounting firm registered with the Public Company Accounting Oversight Board (United States) (PCAOB) and are required to be independent with respect to the Master Portfolio in accordance with the U.S. federal securities laws and the applicable rules and regulations of the Securities and Exchange Commission and the PCAOB.
We conducted our audits of these financial statements in accordance with the standards of the PCAOB. Those standards require that we plan and perform the audit to obtain reasonable assurance about whether the financial statements are free of material misstatement, whether due to error or fraud.
Our audits included performing procedures to assess the risks of material misstatement of the financial statements, whether due to error or fraud, and performing procedures that respond to those risks. Such procedures included examining, on a test basis, evidence regarding the amounts and disclosures in the financial statements. Our audits also included evaluating the accounting principles used and significant estimates made by management, as well as evaluating the overall presentation of the financial statements. Our procedures included confirmation of securities owned as of December 31, 2021 by correspondence with the custodian, transfer agent and brokers. We believe that our audits provide a reasonable basis for our opinion.
/s/PricewaterhouseCoopers LLP
Philadelphia, Pennsylvania
February 24, 2022
We have served as the auditor of one or more BlackRock investment companies since 2000.
| | |
MASTER PORTFOLIO REPORT OF INDEPENDENT REGISTERED PUBLIC ACCOUNTING FIRM | | 21 |
Statement Regarding Liquidity Risk Management Program
In compliance with Rule 22e-4 under the Investment Company Act of 1940, as amended (the “Liquidity Rule”), Master Investment Portfolio (“MIP”) has adopted and implemented a liquidity risk management program (the “Program”) for International Tilts Master Portfolio (the “Fund”), a series of MIP, which is reasonably designed to assess and manage the Fund’s liquidity risk.
The Board of Trustees (the “Board”) of MIP, on behalf of the Fund, met on November 9-10, 2021 (the “Meeting”) to review the Program. The Board previously appointed BlackRock Advisors, LLC or BlackRock Fund Advisors (“BlackRock”), each an investment adviser to certain BlackRock funds, as the program administrator for the Fund’s Program, as applicable. BlackRock also previously delegated oversight of the Program to the 40 Act Liquidity Risk Management Committee (the “Committee”). At the Meeting, the Committee, on behalf of BlackRock, provided the Board with a report that addressed the operation of the Program and assessed its adequacy and effectiveness of implementation, including the management of the Fund’s Highly Liquid Investment Minimum (“HLIM”) where applicable, and any material changes to the Program (the “Report”). The Report covered the period from October 1, 2020 through September 30, 2021 (the “Program Reporting Period”).
The Report described the Program’s liquidity classification methodology for categorizing the Fund’s investments (including derivative transactions) into one of four liquidity buckets. It also referenced the methodology used by BlackRock to establish the Fund’s HLIM and noted that the Committee reviews and ratifies the HLIM assigned to the Fund no less frequently than annually. The Report also discussed notable events affecting liquidity over the Program Reporting Period, including the imposition of capital controls in certain countries.
The Report noted that the Program complied with the key factors for consideration under the Liquidity Rule for assessing, managing and periodically reviewing the Fund’s liquidity risk, as follows:
| | a) | The Fund’s investment strategy and liquidity of portfolio investments during both normal and reasonably foreseeable stressed conditions. During the Program Reporting Period, the Committee reviewed whether the Fund’s strategy is appropriate for an open-end fund structure with a focus on funds with more significant and consistent holdings of less liquid and illiquid assets. The Committee also factored a fund’s concentration in an issuer into the liquidity classification methodology by taking issuer position sizes into account. Where a fund participated in borrowings for investment purposes (such as tender option bonds or reverse repurchase agreements), such borrowings were factored into the Program’s calculation of a fund’s liquidity bucketing. Derivative exposure was also considered in such calculation. |
| | b) | Short-term and long-term cash flow projections during both normal and reasonably foreseeable stressed conditions. During the Program Reporting Period, the Committee reviewed historical redemption activity and used this information as a component to establish the Fund’s reasonably anticipated trading size (“RATS”). The Fund has adopted an in-kind redemption policy which may be utilized to meet larger redemption requests. The Committee may also take into consideration a fund’s shareholder ownership concentration (which, depending on product type and distribution channel, may or may not be available), a fund’s distribution channels, and the degree of certainty associated with a fund’s short-term and long-term cash flow projections. |
| | c) | Holdings of cash and cash equivalents, as well as borrowing arrangements. The Committee considered the terms of the credit facility committed to the Fund, the financial health of the institution providing the facility and the fact that the credit facility is shared among multiple funds (including that a portion of the aggregate commitment amount is specifically designated for BlackRock Floating Rate Income Portfolio, a series of BlackRock Funds V). The Committee also considered other types of borrowing available to the Master Portfolio, such as the ability to use reverse repurchase agreements and interfund lending, as applicable. |
There were no material changes to the Program during the Program Reporting Period other than the enhancement of certain model components in the Program’s methodology. The Report provided to the Board stated that the Committee concluded that based on the operation of the functions, as described in the Report, the Program is operating as intended and is effective in implementing the requirements of the Liquidity Rule.
| | |
| 22 | | 2 0 2 1 BLACK ROCK ANNUAL REPORT TO SHAREHOLDERS |
Trustee and Officer Information
| | | | | | | | |
| Independent Trustees(a) |
| | | | | |
Name Year of Birth(b) | | Position(s) Held (Length of Service)(c) | | Principal Occupation(s) During Past Five Years | | Number of BlackRock-Advised Registered Investment Companies (“RICs”) Consisting of Investment Portfolios (“Portfolios”) Overseen | | Public Company
and Other Investment
Company
Directorships Held
During Past Five Years |
| | | | |
Mark Stalnecker 1951 | | Chair of the Board (Since 2019) and Trustee (Since 2015) | | Chief Investment Officer, University of Delaware from 1999 to 2013; Trustee and Chair of the Finance and Investment Committees, Winterthur Museum and Country Estate from 2005 to 2016; Member of the Investment Committee, Delaware Public Employees’ Retirement System since 2002; Member of the Investment Committee, Christiana Care Health System from 2009 to 2017; Member of the Investment Committee, Delaware Community Foundation from 2013 to 2014; Director and Chair of the Audit Committee, SEI Private Trust Co. from 2001 to 2014. | | 30 RICs consisting of 159 Portfolios | | None |
| | | | |
Bruce R. Bond 1946 | | Trustee (Since 2019) | | Board Member, Amsphere Limited (software) since 2018; Trustee and Member of the Governance Committee, State Street Research Mutual Funds from 1997 to 2005; Board Member of Governance, Audit and Finance Committee, Avaya Inc. (computer equipment) from 2003 to 2007. | | 30 RICs consisting of 159 Portfolios | | None |
| | | | |
Susan J. Carter 1956 | | Trustee (Since 2016) | | Director, Pacific Pension Institute from 2014 to 2018; Advisory Board Member, Center for Private Equity and Entrepreneurship at Tuck School of Business since 1997; Senior Advisor, Commonfund Capital, Inc. (“CCI”) (investment adviser) in 2015; Chief Executive Officer, CCI from 2013 to 2014; President & Chief Executive Officer, CCI from 1997 to 2013; Advisory Board Member, Girls Who Invest from 2015 to 2018 and Board Member thereof since 2018; Advisory Board Member, Bridges Fund Management since 2016; Trustee, Financial Accounting Foundation since 2017; Practitioner Advisory Board Member, Private Capital Research Institute (“PCRI”) since 2017; Lecturer in the Practice of Management, Yale School of Management since 2019; Advisor to Finance Committee, Altman Foundation since 2020. | | 30 RICs consisting of 159 Portfolios | | None |
| | | | |
Collette Chilton 1958 | | Trustee (Since 2015) | | Chief Investment Officer, Williams College since 2006; Chief Investment Officer, Lucent Asset Management Corporation from 1998 to 2006; Director, Boys and Girls Club of Boston since 2017; Director, B1 Capital since 2018; Director, David and Lucile Packard Foundation since 2020. | | 30 RICs consisting of 159 Portfolios | | None |
| | | | |
Neil A. Cotty 1954 | | Trustee (Since 2016) | | Bank of America Corporation from 1996 to 2015, serving in various senior finance leadership roles, including Chief Accounting Officer from 2009 to 2015, Chief Financial Officer of Global Banking, Markets and Wealth Management from 2008 to 2009, Chief Accounting Officer from 2004 to 2008, Chief Financial Officer of Consumer Bank from 2003 to 2004, Chief Financial Officer of Global Corporate Investment Bank from 1999 to 2002. | | 30 RICs consisting of 159 Portfolios | | None |
| | | | |
Lena G. Goldberg 1949 | | Trustee (Since 2019) | | Director, Charles Stark Draper Laboratory, Inc. since 2013; Senior Lecturer, Harvard Business School, from 2008 to 2021; FMR LLC/Fidelity Investments (financial services) from 1996 to 2008, serving in various senior roles including Executive Vice President - Strategic Corporate Initiatives and Executive Vice President and General Counsel; Partner, Sullivan & Worcester LLP from 1985 to 1996 and Associate thereof from 1979 to 1985. | | 30 RICs consisting of 159 Portfolios | | None |
| | |
TRUSTEE AND OFFICER INFORMATION | | 23 |
Trustee and Officer Information (continued)
| | | | | | | | |
| Independent Trustees(a) (continued) |
| | | | | |
Name Year of Birth(b) | | Position(s) Held (Length of Service)(c) | | Principal Occupation(s) During Past Five Years | | Number of BlackRock-Advised Registered Investment Companies (“RICs”) Consisting of Investment Portfolios (“Portfolios”) Overseen | | Public Company
and Other Investment Company Directorships Held During Past Five Years |
| | | | |
Henry R. Keizer 1956 | | Trustee (Since 2019) | | Director, Park Indemnity Ltd. (captive insurer) since 2010; Director, MUFG Americas Holdings Corporation and MUFG Union Bank, N.A. (financial and bank holding company) from 2014 to 2016; Director, American Institute of Certified Public Accountants from 2009 to 2011; Director, KPMG LLP (audit, tax and advisory services) from 2004 to 2005 and 2010 to 2012; Director, KPMG International in 2012, Deputy Chairman and Chief Operating Officer thereof from 2010 to 2012 and U.S. Vice Chairman of Audit thereof from 2005 to 2010; Global Head of Audit, KPMGI (consortium of KPMG firms) from 2006 to 2010; Director, YMCA of Greater New York from 2006 to 2010. | | 30 RICs consisting of 159 Portfolios | | Hertz Global Holdings (car rental); Sealed Air Corp. (packaging); GrafTech International Ltd. (materials manufacturing); Montpelier Re Holdings, Ltd. (publicly held property and casualty reinsurance) from 2013 to 2015; WABCO (commercial vehicle safety systems) from 2015 to 2020. |
| | | | |
Cynthia A. Montgomery 1952 | | Trustee (Since 2009) | | Professor, Harvard Business School since 1989. | | 30 RICs consisting of 159 Portfolios | | Newell Rubbermaid, Inc. (manufacturing) from 1995 to 2016. |
| | | | |
Donald C. Opatrny 1952 | | Trustee (Since 2019) | | Trustee, Vice Chair, Member of the Executive Committee and Chair of the Investment Committee, Cornell University from 2004 to 2019; President, Trustee and Member of the Investment Committee, The Aldrich Contemporary Art Museum from 2007 to 2014; Member of the Board and Investment Committee, University School from 2007 to 2018; Member of the Investment Committee, Mellon Foundation from 2009 to 2015; Trustee, Artstor (a Mellon Foundation affiliate) from 2010 to 2015; President and Trustee, the Center for the Arts, Jackson Hole from 2011 to 2018; Director, Athena Capital Advisors LLC (investment management firm) since 2013; Trustee and Chair of the Investment Committee, Community Foundation of Jackson Hole since 2014; Member of Affordable Housing Supply Board of Jackson, Wyoming since 2017; Member, Investment Funds Committee, State of Wyoming since 2017; Trustee, Phoenix Art Museum since 2018; Trustee, Arizona Community Foundation and Member of Investment Committee since 2020. | | 30 RICs consisting of 159 Portfolios | | None |
| | | | |
Joseph P. Platt 1947 | | Trustee (Since 2009) | | General Partner, Thorn Partners, LP (private investments) since 1998; Director, WQED Multi-Media (public broadcasting not-for-profit) since 2001; Chair, Basic Health International (non-profit) since 2015. | | 30 RICs consisting of 159 Portfolios | | Greenlight Capital Re, Ltd. (reinsurance company); Consol Energy Inc. |
| | |
| 24 | | 2 0 2 1 BLACK ROCK ANNUAL REPORT TO SHAREHOLDERS |
Trustee and Officer Information (continued)
| | | | | | | | |
| Independent Trustees(a) (continued) |
| | | | | |
Name Year of Birth(b) | | Position(s) Held (Length of Service)(c) | | Principal Occupation(s) During Past Five Years | | Number of BlackRock-Advised Registered Investment Companies (“RICs”) Consisting of Investment Portfolios (“Portfolios”) Overseen | | Public Company and Other Investment Company Directorships Held During Past Five Years |
| | | | |
Kenneth L. Urish 1951 | | Trustee (Since 2009) | | Managing Partner, Urish Popeck & Co., LLC (certified public accountants and consultants) since 1976; Past- Chairman of the Professional Ethics Committee of the Pennsylvania Institute of Certified Public Accountants and Committee Member thereof since 2007; Member of External Advisory Board, The Pennsylvania State University Accounting Department since founding in 2001; Principal, UP Strategic Wealth Investment Advisors, LLC since 2013; Trustee, The Holy Family Institute from 2001 to 2010; President and Trustee, Pittsburgh Catholic Publishing Associates from 2003 to 2008; Director, Inter- Tel from 2006 to 2007; Member, Advisory Board, ESG Competent Boards since 2020. | | 30 RICs consisting of 159 Portfolios | | None |
| | | | |
Claire A. Walton 1957 | | Trustee (Since 2016) | | Chief Operating Officer and Chief Financial Officer of Liberty Square Asset Management, LP from 1998 to 2015; General Partner of Neon Liberty Capital Management, LLC since 2003; Director, Boston Hedge Fund Group from 2009 to 2018; Director, Woodstock Ski Runners since 2013; Director, Massachusetts Council on Economic Education from 2013 to 2015. | | 30 RICs consisting of 159 Portfolios | | None |
| | |
TRUSTEE AND OFFICER INFORMATION | | 25 |
Trustee and Officer Information (continued)
| | | | | | | | |
| Interested Trustees(a)(d) |
| | | | | |
Name Year of Birth(b) | | Position(s) Held (Length of Service)(c) | | Principal Occupation(s) During Past Five Years | | Number of BlackRock-Advised Registered Investment Companies (“RICs”) Consisting of Investment Portfolios (“Portfolios”) Overseen | | Public Company and Other Investment Company Directorships Held During Past Five Years |
| | | | |
Robert Fairbairn 1965 | | Trustee (Since 2018) | | Vice Chairman of BlackRock, Inc. since 2019; Member of BlackRock’s Global Executive and Global Operating Committees; Co-Chair of BlackRock’s Human Capital Committee; Senior Managing Director of BlackRock, Inc. from 2010 to 2019; oversaw BlackRock’s Strategic Partner Program and Strategic Product Management Group from 2012 to 2019; Member of the Board of Managers of BlackRock Investments, LLC from 2011 to 2018; Global Head of BlackRock’s Retail and iShares® businesses from 2012 to 2016. | | 103 RICs consisting of 261 Portfolios | | None |
| | | | |
John M. Perlowski(e) 1964 | | Trustee (Since 2015) President and Chief Executive Officer (Since 2010) | | Managing Director of BlackRock, Inc. since 2009; Head of BlackRock Global Accounting and Product Services since 2009; Advisory Director of Family Resource Network (charitable foundation) since 2009. | | 105 RICs consisting of 263 Portfolios | | None |
|
(a) The address of each Trustee is c/o BlackRock, Inc., 55 East 52nd Street, New York, New York 10055. (b) Independent Trustees serve until their resignation, retirement, removal or death, or until December 31 of the year in which they turn 75. The Board may determine to extend the terms of Independent Trustees on a case-by-case basis, as appropriate. (c) In connection with the acquisition of Barclays Global Investors by BlackRock, Inc. in December 2009, certain Independent Trustees were elected to the Board. Furthermore, effective January 1, 2019, three BlackRock Fund Complexes were realigned and consolidated into two BlackRock Fund Complexes. As a result, although the chart shows the year that each Independent Trustee joined the Board, certain Independent Trustees first became members of the boards of other BlackRock-advised Funds or legacy BlackRock funds as follows: Bruce R. Bond, 2005; Cynthia A. Montgomery, 1994; Joseph P. Platt, 1999; Kenneth L. Urish, 1999; Lena G. Goldberg, 2016; Henry R. Keizer, 2016; Donald C. Opatrny, 2015. (d) Mr. Fairbairn and Mr. Perlowski are both “interested persons,” as defined in the 1940 Act, of the MIP based on their positions with BlackRock, Inc. and its affiliates. Mr. Fairbairn and Mr. Perlowski are also board members of the BlackRock Fixed-Income Complex. (e) Mr. Perlowski is also a trustee of the BlackRock Credit Strategies Fund and BlackRock Private Investments Fund. |
| | | | |
| Officers Who Are Not Trustees(a) |
| | | |
Name Year of Birth(b) | | Position(s) Held (Length of Service) | | Principal Occupation(s) During Past Five Years |
| | |
Thomas Callahan 1968 | | Vice President (Since 2016) | | Managing Director of BlackRock, Inc. since 2013; Member of the Board of Managers of BlackRock Investments, LLC (principal underwriter) since 2019 and Managing Director thereof since 2017; Head of BlackRock’s Global Cash Management Business since 2016; Co-Head of the Global Cash Management Business from 2014 to 2016; Deputy Head of the Global Cash Management Business from 2013 to 2014; Member of the Cash Management Group Executive Committee since 2013; Chief Executive Officer of NYSE Liffe U.S. from 2008 to 2013. |
| | |
Jennifer McGovern 1977 | | Vice President (Since 2014) | | Managing Director of BlackRock, Inc. since 2016; Director of BlackRock, Inc. from 2011 to 2015; Head of Americas Product Development and Governance for BlackRock’s Global Product Group since 2019; Head of Product Structure and Oversight for BlackRock’s U.S. Wealth Advisory Group from 2013 to 2019. |
| | |
Trent Walker 1974 | | Chief Financial Officer (Since 2021) | | Managing Director of BlackRock, Inc. since September 2019; Executive Vice President of PIMCO from 2016 to 2019; Senior Vice President of PIMCO from 2008 to 2015; Treasurer from 2013 to 2019 and Assistant Treasurer from 2007 to 2017 of PIMCO Funds, PIMCO Variable Insurance Trust, PIMCO ETF Trust, PIMCO Equity Series, PIMCO Equity Series VIT, PIMCO Managed Accounts Trust, 2 PIMCO-sponsored interval funds and 21 PIMCO-sponsored closed-end funds. |
| | |
Jay M. Fife 1970 | | Treasurer (Since 2009) | | Managing Director of BlackRock, Inc. since 2007. |
| | |
Charles Park 1967 | | Chief Compliance Officer (Since 2014) | | Anti-Money Laundering Compliance Officer for certain BlackRock-advised Funds from 2014 to 2015; Chief Compliance Officer of BlackRock Advisors, LLC and the BlackRock-advised Funds in the BlackRock Multi-Asset Complex and the BlackRock Fixed-Income Complex since 2014; Principal of and Chief Compliance Officer for iShares® Delaware Trust Sponsor LLC since 2012 and BlackRock Fund Advisors (“BFA”) since 2006; Chief Compliance Officer for the BFA-advised iShares® exchange traded funds since 2006; Chief Compliance Officer for BlackRock Asset Management International Inc. since 2012. |
| | |
| 26 | | 2 0 2 1 BLACK ROCK ANNUAL REPORT TO SHAREHOLDERS |
Trustee and Officer Information (continued)
| | | | |
| Officers Who Are Not Trustees(a) (continued) |
| | | |
Name Year of Birth(b) | | Position(s) Held (Length of Service) | | Principal Occupation(s) During Past Five Years |
| | |
Lisa Belle 1968 | | Anti-Money Laundering Compliance Officer (Since 2019) | | Managing Director of BlackRock, Inc. since 2019; Global Financial Crime Head for Asset and Wealth Management of JP Morgan from 2013 to 2019; Managing Director of RBS Securities from 2012 to 2013; Head of Financial Crimes for Barclays Wealth Americas from 2010 to 2012. |
| | |
Janey Ahn 1975 | | Secretary (Since 2019) | | Managing Director of BlackRock, Inc. since 2018; Director of BlackRock, Inc. from 2009 to 2017. |
|
(a) The address of each Officer is c/o BlackRock, Inc., 55 East 52nd Street, New York, New York 10055. (b) Officers of the MIP serve at the pleasure of the Board. |
Further information about MIP’s Trustees and Officers is available in the Master Portfolio’s Statement of Additional Information, which can be obtained without charge by calling (800) 441-7762.
Effective December 31, 2021, Bruce R. Bond retired as a Trustee of the MIP.
| | |
TRUSTEE AND OFFICER INFORMATION | | 27 |
Additional Information
Regulation Regarding Derivatives
On October 28, 2020, the Securities and Exchange Commission (the “SEC”) adopted regulations governing the use of derivatives by registered investment companies (“Rule 18f-4”). The Master Portfolio will be required to implement and comply with Rule 18f-4 by August 19, 2022. Once implemented, Rule 18f-4 will impose limits on the amount of derivatives a fund can enter into, eliminate the asset segregation framework currently used by funds to comply with Section 18 of the 1940 Act, treat derivatives as senior securities and require funds whose use of derivatives is more than a limited specified exposure amount to establish and maintain a comprehensive derivatives risk management program and appoint a derivatives risk manager.
General Information
Quarterly performance, semi-annual and annual reports and other information regarding the Master Portfolio may be found on BlackRock’s website, which can be accessed at blackrock.com. Any reference to BlackRock’s website in this report is intended to allow investors public access to information regarding the Master Portfolio and does not, and is not intended to, incorporate BlackRock’s website in this report.
Householding
The Master Portfolio will mail only one copy of shareholder documents, including prospectuses, annual and semi-annual reports, Rule 30e-3 notices and proxy statements, to shareholders with multiple accounts at the same address. This practice is commonly called “householding” and is intended to reduce expenses and eliminate duplicate mailings of shareholder documents. Mailings of your shareholder documents may be householded indefinitely unless you instruct us otherwise. If you do not want the mailing of these documents to be combined with those for other members of your household, please call the Master Portfolio at (800) 441-7762.
Availability of Quarterly Schedule of Investments
The Master Portfolio files its complete schedule of portfolio holdings with the SEC for the first and third quarters of each fiscal year as an exhibit to its reports on Form N-PORT. The Master Portfolio’s Form N-PORT is available on the SEC’s website at sec.gov. Additionally, the Master Portfolio makes its portfolio holdings for the first and third quarters of each fiscal year available at blackrock.com/fundreports.
Availability of Proxy Voting Policies, Procedures and Voting Records
A description of the policies and procedures that the Master Portfolio uses to determine how to vote proxies relating to portfolio securities and information about how the Master Portfolio voted proxies relating to securities held in the Master Portfolio’s portfolio during the most recent 12-month period ended June 30 is available without charge, upon request (1) by calling (800) 441-7762; (2) on the BlackRock website at blackrock.com; and (3) on the SEC’s website at sec.gov.
BlackRock’s Mutual Fund Family
BlackRock offers a diverse lineup of open-end mutual funds crossing all investment styles and managed by experts in equity, fixed-income and tax-exempt investing. Visit blackrock.com for more information.
Shareholder Privileges
Account Information
Call us at (800) 441-7762 from 8:00 AM to 6:00 PM ET on any business day to get information about your account balances, recent transactions and share prices. You can also visit blackrock.com for more information.
Automatic Investment Plans
Investor class shareholders who want to invest regularly can arrange to have $50 or more automatically deducted from their checking or savings account and invested in any of the BlackRock funds.
Systematic Withdrawal Plans
Investor class shareholders can establish a systematic withdrawal plan and receive periodic payments of $50 or more from their BlackRock funds, as long as their account balance is at least $10,000.
Retirement Plans
Shareholders may make investments in conjunction with Traditional, Rollover, Roth, Coverdell, Simple IRAs, SEP IRAs and 403(b) Plans.
| | |
| 28 | | 2 0 2 1 BLACK ROCK ANNUAL REPORT TO SHAREHOLDERS |
Additional Information (continued)
BlackRock Privacy Principles
BlackRock is committed to maintaining the privacy of its current and former fund investors and individual clients (collectively, “Clients”) and to safeguarding their non-public personal information. The following information is provided to help you understand what personal information BlackRock collects, how we protect that information and why in certain cases we share such information with select parties.
If you are located in a jurisdiction where specific laws, rules or regulations require BlackRock to provide you with additional or different privacy-related rights beyond what is set forth below, then BlackRock will comply with those specific laws, rules or regulations.
BlackRock obtains or verifies personal non-public information from and about you from different sources, including the following: (i) information we receive from you or, if applicable, your financial intermediary, on applications, forms or other documents; (ii) information about your transactions with us, our affiliates, or others; (iii) information we receive from a consumer reporting agency; and (iv) from visits to our websites.
BlackRock does not sell or disclose to non-affiliated third parties any non-public personal information about its Clients, except as permitted by law or as is necessary to respond to regulatory requests or to service Client accounts. These non-affiliated third parties are required to protect the confidentiality and security of this information and to use it only for its intended purpose.
We may share information with our affiliates to service your account or to provide you with information about other BlackRock products or services that may be of interest to you. In addition, BlackRock restricts access to non-public personal information about its Clients to those BlackRock employees with a legitimate business need for the information. BlackRock maintains physical, electronic and procedural safeguards that are designed to protect the non-public personal information of its Clients, including procedures relating to the proper storage and disposal of such information.
Master Portfolio and Service Providers
| | |
| Investment Adviser and Administrator | | Transfer Agent |
| |
BlackRock Advisors, LLC | | BNY Mellon Investment Servicing (US) Inc. |
| |
Wilmington, DE 19809 | | Wilmington, DE 19809 |
| |
| Sub-Adviser | | Independent Registered Public Accounting Firm |
| |
BlackRock Fund Advisors | | PricewaterhouseCoopers LLP |
| |
San Francisco, CA 94105 | | Philadelphia, PA 19103 |
| |
BlackRock International Limited | | Legal Counsel |
| |
Edinburgh, EH3 8BL | | Sidley Austin LLP |
| |
United Kingdom | | New York, NY 10019 |
| |
| Accounting Agent and Custodian | | Address of MIP |
| |
State Street Bank and Trust Company | | 400 Howard Street |
| |
Boston, MA 02111 | | San Francisco, CA 94105 |
| | |
ADDITIONAL INFORMATION | | 29 |
Glossary of Terms Used in this Report
| | |
| Portfolio Abbreviation |
| |
| CVA | | Certificaten Van Aandelen (Dutch Certificate) |
| |
| MSCI | | Morgan Stanley Capital International |
| |
| REIT | | Real Estate Investment Trust |
| |
| SCA | | Societe en Commandite par Actions |
| | |
| 30 | | 2 0 2 1 BLACK ROCK ANNUAL REPORT TO SHAREHOLDERS |
(b) Not Applicable
| Item 2 – | Code of Ethics – Each registrant (or each, a “Fund”) has adopted a code of ethics, as of the end of the period covered by this report, applicable to the registrants’ principal executive officer, principal financial officer, principal accounting officer or controller, or persons performing similar functions. During the period covered by this report, the code of ethics was amended to update certain information and to make other non-material changes. During the period covered by this report, there have been no waivers granted under the code of ethics. The registrants undertake to provide a copy of the code of ethics to any person upon request, without charge, who calls 1-800-441-7762. |
| Item 3 – | Audit Committee Financial Expert – Each registrant’s board of directors (the “board of directors”), has determined that (i) the registrant has the following audit committee financial expert serving on its audit committee and (ii) each audit committee financial expert is independent: |
Neil A. Cotty
Henry R. Keizer
Kenneth L. Urish
Under applicable securities laws, a person determined to be an audit committee financial expert will not be deemed an “expert” for any purpose, including without limitation for the purposes of Section 11 of the Securities Act of 1933, as a result of being designated or identified as an audit committee financial expert. The designation or identification of a person as an audit committee financial expert does not impose on such person any duties, obligations, or liabilities greater than the duties, obligations, and liabilities imposed on such person as a member of the audit committee and board of directors in the absence of such designation or identification. The designation or identification of a person as an audit committee financial expert does not affect the duties, obligations, or liability of any other member of the audit committee or board of directors.
| Item 4 – | Principal Accountant Fees and Services |
The following table presents fees billed by PricewaterhouseCoopers LLP (“PwC”) in each of the last two fiscal years for the services rendered to the Funds:
| | | | | | | | | | | | | | | | |
| | | | | |
| | | (a) Audit Fees | | (b) Audit-Related Fees1 | | (c) Tax Fees2 | | (d) All Other Fees |
| | | | | | | | | |
Entity Name | | Current
Fiscal Year
End | | Previous
Fiscal Year
End | | Current
Fiscal
Year End | | Previous
Fiscal
Year End | | Current
Fiscal
Year End | | Previous
Fiscal
Year End | | Current
Fiscal
Year End | | Previous
Fiscal
Year End |
| BlackRock Cash Funds: Institutional | | $11,000 | | $11,000 | | $0 | | $0 | | $2,900 | | $2,900 | | $0 | | $0 |
| | | | | | | | | |
| BlackRock Cash Funds: Treasury | | $11,000 | | $11,000 | | $0 | | $0 | | $2,900 | | $2,900 | | $0 | | $0 |
| BlackRock LifePath Dynamic 2025 Fund | | $22,000 | | $22,000 | | $323 | | $0 | | $9,600 | | $9,600 | | $0 | | $0 |
| BlackRock LifePath Dynamic 2030 Fund | | $22,000 | | $22,000 | | $323 | | $0 | | $9,600 | | $9,600 | | $0 | | $0 |
| BlackRock LifePath Dynamic 2035 Fund | | $22,000 | | $22,000 | | $323 | | $0 | | $9,600 | | $9,600 | | $0 | | $0 |
| BlackRock LifePath Dynamic 2040 Fund | | $22,000 | | $22,000 | | $323 | | $0 | | $9,600 | | $9,600 | | $0 | | $0 |
| BlackRock LifePath Dynamic 2045 Fund | | $22,000 | | $22,000 | | $323 | | $0 | | $9,600 | | $9,600 | | $0 | | $0 |
| BlackRock LifePath Dynamic 2050 Fund | | $22,000 | | $22,000 | | $323 | | $0 | | $9,600 | | $9,600 | | $0 | | $0 |
| BlackRock LifePath Dynamic 2055 Fund | | $22,000 | | $22,000 | | $323 | | $0 | | $9,600 | | $9,600 | | $0 | | $0 |
| | | | | | | | | | | | | | | | |
| BlackRock LifePath Dynamic 2060 Fund | | $22,000 | | $22,000 | | $323 | | $0 | | $ 9,600 | | $9,600 | | $0 | | $0 |
| Blackrock LifePath Dynamic 2065 Fund | | $22,000 | | $22,000 | | $323 | | $0 | | $9,600 | | $9,600 | | $0 | | $0 |
| BlackRock LifePath Dynamic Retirement Fund | | $22,000 | | $22,000 | | $323 | | $0 | | $9,600 | | $9,600 | | $0 | | $0 |
| iShares MSCI Total International Index Fund | | $11,000 | | $11,000 | | $0 | | $0 | | $8,100 | | $8,100 | | $0 | | $0 |
| iShares Russell 1000 Large-Cap Index Fund | | $11,000 | | $11,000 | | $207 | | $0 | | $8,100 | | $8,100 | | $0 | | $0 |
| iShares S&P 500 Index Fund | | $13,400 | | $13,400 | | $0 | | $0 | | $8,100 | | $8,100 | | $0 | | $0 |
| iShares U.S. Aggregate Bond Index Fund | | $12,200 | | $12,200 | | $0 | | $0 | | $8,100 | | $8,100 | | $0 | | $0 |
| Diversified Equity Master Portfolio (Formerly Active Stock Master Portfolio) | | $22,000 | | $22,000 | | $0 | | $0 | | $18,550 | | $18,550 | | $0 | | $0 |
| International Tilts Master Portfolio | | $22,000 | | $22,000 | | $0 | | $0 | | $20,900 | | $20,900 | | $0 | | $0 |
| Large Cap Index Master Portfolio | | $22,000 | | $22,000 | | $0 | | $0 | | $20,900 | | $20,900 | | $0 | | $0 |
| Money Market Master Portfolio | | $12,400 | | $12,400 | | $0 | | $0 | | $0 | | $0 | | $0 | | $0 |
| S&P 500 Index Master Portfolio | | $22,000 | | $22,000 | | $0 | | $0 | | $20,900 | | $20,900 | | $0 | | $0 |
| Total International ex U.S. Index Master Portfolio | | $22,000 | | $22,000 | | $0 | | $0 | | $20,900 | | $20,900 | | $0 | | $0 |
| Treasury Money Market Master Portfolio | | $12,400 | | $12,400 | | $0 | | $0 | | $7,100 | | $7,100 | | $0 | | $0 |
| U.S. Total Bond Index Master Portfolio | | $24,100 | | $24,100 | | $0 | | $0 | | $18,550 | | $18,550 | | $0 | | $0 |
The following table presents fees billed by PwC that were required to be approved by each registrant’s audit committee (each a “Committee”) for services that relate directly to the operations or financial reporting of each Fund and that are rendered on behalf of BlackRock Advisors, LLC (the “Investment Adviser” or “BlackRock”)and entities controlling, controlled by, or under common control with BlackRock (not including any sub-adviser whose role is primarily portfolio management and is subcontracted with or overseen by another investment adviser) that provide ongoing services to each Fund (“Affiliated Service Providers”):
| | | | |
| | | Current Fiscal Year End | | Previous Fiscal Year End |
(b) Audit-Related Fees1 | | $0 | | $0 |
(c) Tax Fees2 | | $0 | | $0 |
(d) All Other Fees3 | | $0 | | $0 |
1 The nature of the services includes assurance and related services reasonably related to the performance of the audit or review of financial statements not included in Audit Fees, including accounting consultations, agreed-upon procedure reports, attestation reports, comfort letters, out-of-pocket expenses and internal control reviews not required by regulators.
2 The nature of the services includes tax compliance and/or tax preparation, including services relating to the filing or amendment of federal, state or local income tax returns, regulated investment company qualification reviews, taxable income and tax distribution calculations.
3 Aggregate fees borne by BlackRock in connection with the review of compliance procedures and attestation thereto performed by PwC with respect to all of the registered closed-end funds and some of the registered open-end funds advised by BlackRock.
(e)(1) Audit Committee Pre-Approval Policies and Procedures:
Each Committee has adopted policies and procedures with regard to the pre-approval of services. Audit, audit-related and tax compliance services provided to the registrant on an annual basis require specific pre-approval by the Committee. The Committee also must approve other non-audit services provided to the registrant and those non-audit services provided to the Investment Adviser and Affiliated Service Providers that relate directly to the operations and the financial reporting of the registrant. Certain
of these non-audit services that the Committee believes are (a) consistent with the SEC’s auditor independence rules and (b) routine and recurring services that will not impair the independence of the independent accountants may be approved by the Committee without consideration on a specific case-by-case basis (“general pre-approval”). The term of any general pre-approval is 12 months from the date of the pre-approval, unless the Committee provides for a different period. Tax or other non-audit services provided to the registrant which have a direct impact on the operations or financial reporting of the registrant will only be deemed pre-approved provided that any individual project does not exceed $10,000 attributable to the registrant or $50,000 per project. For this purpose, multiple projects will be aggregated to determine if they exceed the previously mentioned cost levels.
Any proposed services exceeding the pre-approved cost levels will require specific pre-approval by the registrant’s Committee, as will any other services not subject to general pre-approval (e.g., unanticipated but permissible services). The Committee is informed of each service approved subject to general pre-approval at the next regularly scheduled in-person board meeting. At this meeting, an analysis of such services is presented to the Committee for ratification. The Committee may delegate to the Committee Chairman the authority to approve the provision of and fees for any specific engagement of permitted non-audit services, including services exceeding pre-approved cost levels.
(e)(2) None of the services described in each of Items 4(b) through (d) were approved by the Committee pursuant to the de minimis exception in paragraph (c)(7)(i)(C) of Rule 2-01 of Regulation S-X.
(f) Not Applicable
(g) The aggregate non-audit fees, defined as the sum of the fees shown under “Audit-Related Fees,” “Tax Fees” and “All Other Fees,” paid to the accountant for services rendered by the accountant to the registrant, the Investment Adviser and the Affiliated Service Providers were:
| | | | | | | | | | | | |
| | | | |
Entity Name | | Current
Fiscal
Year End | | Previous
Fiscal Year
End | | |
| | | | |
BlackRock Cash Funds: Institutional | | $2,900 | | $2,900 | | |
| | | | |
BlackRock Cash Funds: Treasury | | $2,900 | | $2,900 | | |
| | | | |
BlackRock LifePath Dynamic 2025 Fund | | $9,923 | | $9,600 | | |
| | | | |
BlackRock LifePath Dynamic 2030 Fund | | $9,923 | | $9,600 | | |
| | | | |
BlackRock LifePath Dynamic 2035 Fund | | $9,923 | | $9,600 | | |
| | | | |
BlackRock LifePath Dynamic 2040 Fund | | $9,923 | | $9,600 | | |
| | | | |
BlackRock LifePath Dynamic 2045 Fund | | $9,923 | | $9,600 | | |
| | | | |
BlackRock LifePath Dynamic 2050 Fund | | $9,923 | | $9,600 | | |
| | | | |
BlackRock LifePath Dynamic 2055 Fund | | $9,923 | | $9,600 | | |
| | | | |
BlackRock LifePath Dynamic 2060 Fund | | $9,923 | | $9,600 | | |
| | | | |
BlackRock LifePath Dynamic 2065 Fund | | $9,923 | | $9,600 | | |
| | | | |
BlackRock LifePath Dynamic Retirement Fund | | $9,923 | | $9,600 | | |
| | | | |
iShares MSCI Total International Index Fund | | $8,100 | | $8,100 | | |
| | | | | | |
| | | | |
| iShares Russell 1000 Large-Cap Index Fund | | $8,307 | | $8,100 | | |
| | | | |
| iShares S&P 500 Index Fund | | $8,100 | | $8,100 | | |
| | | | |
| iShares U. S. Aggregate Bond Index Fund | | $8,100 | | $8,100 | | |
| | | | |
| Diversified Equity Master Portfolio (Formerly Active Stock Master Portfolio) | | $18,550 | | $18,550 | | |
| | | | |
| International Tilts Master Portfolio | | $20,900 | | $20,900 | | |
| | | | |
| Large Cap Index Master Portfolio | | $20,900 | | $20,900 | | |
| | | | |
| Money Market Master Portfolio | | $0 | | $0 | | |
| | | | |
| S&P 500 Index Master Portfolio | | $20,900 | | $20,900 | | |
| | | | |
| Total International ex U.S. Index Master Portfolio | | $20,900 | | $20,900 | | |
| | | | |
| Treasury Money Market Master Portfolio | | $7,100 | | $7,100 | | |
| | | | |
| U.S. Total Bond Index Master Portfolio | | $18,550 | | $18,550 | | |
(h) Each Committee has considered and determined that the provision of non-audit services that were rendered to the Investment Adviser and the Affiliated Service Providers that were not pre-approved pursuant to paragraph (c)(7)(ii) of Rule 2-01 of Regulation S-X is compatible with maintaining the principal accountant’s independence.
| Item 5 – | Audit Committee of Listed Registrants – Not Applicable |
(a) The registrants’ Schedules of Investments are included as part of the Report to Stockholders filed under Item 1(a) of this Form.
(b) Not Applicable due to no such divestments during the semi-annual period covered since the previous Form N-CSR filing.
| Item 7 – | Disclosure of Proxy Voting Policies and Procedures for Closed-End Management Investment Companies – Not Applicable |
| Item 8 – | Portfolio Managers of Closed-End Management Investment Companies – Not Applicable |
| Item 9 – | Purchases of Equity Securities by Closed-End Management Investment Company and Affiliated Purchasers – Not Applicable |
| Item 10 – | Submission of Matters to a Vote of Security Holders – There have been no material changes to these procedures. |
| Item 11 – | Controls and Procedures |
(a) The registrants’ principal executive and principal financial officers, or persons performing similar functions, have concluded that the registrants’ disclosure controls and procedures (as defined in Rule 30a-3(c) under the Investment Company Act of 1940, as amended (the “1940 Act”)) are effective as of a date within 90 days of the filing of this report based on the evaluation of these controls and procedures required by Rule 30a-3(b) under the 1940 Act and Rule 15d-15(b) under the Securities Exchange Act of 1934, as amended.
(b) There were no changes in the registrants’ internal control over financial reporting (as defined in Rule 30a-3(d) under the 1940 Act) that occurred during the period covered by this report that have materially affected, or are reasonably likely to materially affect, the registrants’ internal control over financial reporting.
| Item 12 – | Disclosure of Securities Lending Activities for Closed-End Management Investment Companies – Not Applicable |
| Item 13 – | Exhibits attached hereto |
(a)(1) Code of Ethics – See Item 2
(a)(2) Section 302 Certifications are attached
(a)(3) Any written solicitation to purchase securities under Rule 23c-1 – Not Applicable
(a)(4) Change in Registrant’s independent public accountant – Not Applicable
(b) Section 906 Certifications are attached
Pursuant to the requirements of the Securities Exchange Act of 1934 and the Investment Company Act of 1940, each registrant has duly caused this report to be signed on its behalf by the undersigned, thereunto duly authorized.
BlackRock Funds III and Master Investment Portfolio
| | | | |
| | By: | | /s/ John M. Perlowski |
| | | | John M. Perlowski |
| | | | Chief Executive Officer (principal executive officer) of |
| | | | BlackRock Funds III and Master Investment Portfolio |
Date: February 24, 2022
Pursuant to the requirements of the Securities Exchange Act of 1934 and the Investment Company Act of 1940, this report has been signed below by the following persons on behalf of each registrant and in the capacities and on the dates indicated.
| | | | |
| | By: | | /s/ John M. Perlowski |
| | | | John M. Perlowski |
| | | | Chief Executive Officer (principal executive officer) of |
| | | | BlackRock Funds III and Master Investment Portfolio |
Date: February 24, 2022
| | | | |
| | By: | | /s/ Trent Walker |
| | | | Trent Walker |
| | | | Chief Financial Officer (principal financial officer) of |
| | | | BlackRock Funds III and Master Investment Portfolio |
Date: February 24, 2022