UNITED STATES
SECURITIES AND EXCHANGE COMMISSION
WASHINGTON, D.C. 20549
FORM N-CSR
CERTIFIED SHAREHOLDER REPORT OF REGISTERED MANAGEMENT
INVESTMENT COMPANIES
Investment Company Act file number 811-8168
Aquila Rocky Mountain Equity Fund
(Exact name of Registrant as specified in charter)
380 Madison Avenue
New York, New York 10017
(Address of principal executive offices) (Zip code)
Joseph P. DiMaggio
380 Madison Avenue
New York, New York 10017
(Name and address of agent for service)
Registrant's telephone number, including area code: (212) 697-6666
Date of fiscal year end: 12/31/09
Date of reporting period: 12/31/09
FORM N-CSR
| ITEM 1. | REPORTS TO STOCKHOLDERS. |
| |
|
| December 31, 2009 |
| |
| |
An investment designed for growth at a reasonable price |
| |
| Aquila Rocky Mountain Equity Fund “Growth Stocks Don’t Necessarily Receive the Attention They Deserve” | |
February, 2010
Dear Fellow Shareholder,
In the past fifteen years in the U.S stock market, small growth stocks may not have received the attention they deserve. Small emerging companies that build a successful business model and execute it well over a period of time can grow significantly faster than the overall economy.
In looking at the sixteen year period from 1995 through 2009, small growth companies as measured by Russell indices led the U.S. stock market in only one year - 2003. In addition, small growth companies were the worst performers in five of the past sixteen years.
Market leadership tends to rotate among large, mid-sized and small growth and value stocks based on economic conditions and factors at work in the overall economy. In seven out of the past ten years, value stocks such as financial and cyclical companies outperformed as the economy leveraged up and grew rapidly.
We believe that over the next ten years as consumers and businesses deleverage, growth stocks such as technology and health care are more likely to outperform. In a slow growth economy, small companies that can grow because of unique products and services may, therefore, receive more investor attention.
Rocky Invests in Some of the “Best Small Companies”
Each year Forbes Magazine identifies 200 Best Small Companies that have annual revenue between $5 million and $750 million, have been publicly traded for at least a year and have a stock price no lower than $5. Rankings are based on earnings growth, sales growth and return on equity over the past year and past five years.
Four companies in Aquila Rocky Mountain Equity Fund made the list in 2009. The companies include:
Dynamic Materials. Headquartered in Boulder, Colorado, the company produces clad metal using explosives and shock synthesis for pressure vessels and heat exchangers and provides welding for the aerospace and defense industries. The company has also recently made several small acquisitions in the oil service industry. With revenues of $233 million, the company had a return on assets of 10.24% for its year ended December 2008. The company generates an above average return on assets due to its proprietary metalworking expertise.
Knight Transportation. Knight Transportation is the only U.S. company to have been named to the Forbes Best Small Company List for 15 years in a row. With 2009 revenues of $652 million, Knight is headquartered in Phoenix. Arizona. The company is a short to medium haul dry van truckload carrier. In recent years the company has added a refrigerated van business, a broker and a port drayage business. The company is known for its careful use of assets and logistics to drive returns.
Rocky Mountain Chocolate Factory. Rocky Mountain Chocolate Factory had revenues of $29 million in its fiscal year ended, February, 2009. Headquartered in Durango, Colorado, the company owns and franchises its stores, for which it manufactures a line of chocolates. The company had a return on assets of 22.54% last year. Most recently, the company has been co-branding its stores with Cold Stone Creamery, a gourmet ice cream.
NOT A PART OF THE ANNUAL REPORT
JDA Software. JDA was first named to the Forbes List of the 200 Best Small Companies in 2009. The company had revenues of $386 million in 2009. The company had its IPO in 1996 and is headquartered in Scottsdale, Arizona. Over the past 14 years the company has made a series of acquisitions to build software solutions for supply chain management. Nearby Arizona State University is ranked #4 in supply chain management. The company just completed the acquisition of i2 Technologies.
Medium Sized Growth Stocks
Medium sized growth stocks have received more attention but still have led the U.S. stock market in only two years out of the past 16 years - in 1999 and 2009. One stock which we think may be underappreciated in the mid-cap space is Microchip Technologies. With a yield of over 5%, the company had a return on assets of 10.1% for their fiscal year ending in March 2009. During the downturn, the company reduced pay levels, shared unpaid time off, cross trained and was fully prepared for the upturn without any loss of productivity. During the upturn, as other companies have had to hire and retrain workers, Microchip has been gaining market share. Last year Microchip acquired a company with touch screen technology and is likely to participate in growth of the smart grid with its microcontrollers and memory products.
Slower Growth Economy – Investors May Be Willing To Pay More
If we do begin to see more leadership of growth stocks in the U.S stock market, we believe investors would likely participate in earnings growth as well as an expansion of the multiple of earnings which investors are willing to pay for the stocks. In a slower growth economy, investors may be willing to pay more for those companies that produce above-average earnings growth.
Sincerely,
| | |
| | | |
| Barbara S. Walchli | | Diana P. Herrmann |
| Senior Vice President and Portfolio Manager | | President and Trustee |
The opinions are those of the authors as of February, 2010 and are subject to change at any time due to changes in market or economic conditions. These comments should not be construed as a recommendation or solicitation, but as an illustration of broader themes. Past performance is no guarantee of future results.
NOT A PART OF THE ANNUAL REPORT
| Aquila Rocky Mountain Equity Fund ANNUAL REPORT Management Discussion | |
Aquila Rocky Mountain Equity Fund’s Class A shares had a total return of 30.62%, without provision for sales charges but reflecting contractually waived fund expenses, for the twelve months ended December 31, 2009. This compares to the S&P 500 with a total return of 26.47%, the S&P Midcap Index with a 37.38% total return, the Russell 2000 with a total return of 27.17% and the Russell Microcap Index with a total return of 29.22%.
Geographically at year-end, 40% of the Fund was invested in companies headquartered in Arizona, 35% in Colorado, 17% in Utah, 5% in Montana, 2% in Nevada and 1% in Idaho.
At year-end, 13.0% of the equity investments in the Fund were in companies with a market capitalization over $10 billion (large cap companies), 39.5% of the equity investments in the Fund were in companies with a market capitalization between $2 billion and $10 billion (mid-cap) and 38.3% of the equity investments in the Fund were in companies with market capitalizations between $300 million and $2 billion (small cap). In addition, 9.2% of the equity investments in the Fund were in companies with market capitalizations below $300 million (micro-cap).
During 2009 we experienced the takeover of only one company in the Fund. The acquisition of Semitool, Inc. was completed in December by Applied Materials. Semitool, of Kalispell, Montana, was acquired because of proprietary technology that it had developed for the production process of semiconductor and solar cells. The number of takeovers in the portfolio slowed considerably from 2007 when seven companies were taken over and 2008 when two companies were acquired.
During the year, Myriad Genetics spun off its pharmaceutical drug development company, Myriad Pharmaceuticals. Myriad Pharmaceuticals is working on a number of small molecule drugs for cancer and HIV treatment.
We continue to strive to invest the Fund strategically and at year-end had holdings of 41 companies in the portfolio across a number of industries. We have added several new companies to the Fund during 2009 including Chipotle Mexican Grill, Micron Technology and Ramtron International. Micron is likely to benefit from the corporate spending cycle in technology over the next several years, while Ramtron has proprietary ferroelectric technology. This allows the company to provide certain read write memory applications that are useful for inventory and energy management such as the smart grid. We continue to look for the best businesses and management teams in the Rocky Mountain region to invest in for our shareholders when we can obtain them at a reasonable price.
During 2009 the best performing stocks came from three states and five industries. Providence Service Corp., headquartered in Tucson, Arizona, was the best performing, rising 989.7% for the year. Providence provides outsourced social services for government agencies, delivering them in a home based setting. It also uses best practices that it has developed over time. The second best performing stock was Liberty Media – Interactive, headquartered in Englewood, Colorado, which was up 247.4% for the year. The company owns QVC along with a number of Internet sites which market products related to outdoor and backcountry sports gear and clothing as well as nutrition, body building and fitness.
MANAGEMENT DISCUSSION (continued)
The third best performing stock was Freeport-McMoRan Copper & Gold which rose 228.5% due to strong copper and gold prices. Freeport-McMoRan is headquartered in Phoenix, Arizona. Spectranetics, headquartered in Colorado Springs, Colorado rose 166.7% for the year, benefitting from news about its new products and growth in its laser treatments for opening blood vessels and removing old cardiac pacemaker leads. RightNow Technologies, headquartered in Bozeman, Montana rose 124.7% for the year due to their success with their cloud computing (available over the Internet) customer service products. The company has recently added a group of products to help companies monitor what is being said about them on the Internet. This has helped companies identify product problems or customer dissatisfaction early.
Three of the worst performing stocks in 2009 came from the health care industry due to new product disappointments or concern about health care reform. AspenBio Pharma, headquartered in Castle Rock, Colorado, declined 71.8% for the year after its blood test for appendicitis was disappointing in its clinical trial. However, the company has repositioned the product and is doing a supplemental trial which it hopes will be successful. Array BioPharma Inc, headquartered in Boulder, Colorado, declined 30.6% in 2009 after its rheumatoid arthritis pill failed its clinical trial. However, the company has a number of other small molecule drugs in its pipeline including cancer, leukemia and multiple myeloma drugs along with collaborations with Genentech, Amgen and AstraZeneca.
CIBER, Inc. headquartered in Greenwood Village, Colorado, declined 28.3% for the year after a stock offering diluted earnings significantly. However, the company recently announced a $26 million contract to provide information technology services for the NASA Marshal Flight Center. In addition, the company was also recently named the #1 provider of Enterprise Resource Planning (ERP) for the U.S. and the U.K by the 2009 Black Book of Outsourcing.
The past ten years have been a difficult decade for U.S. equity investors. The total return for the S&P 500 was -9.1% over the ten year period or -0.95% a year, well below historical returns. While Aquila Rocky Mountain Equity Fund did better with a 27.6% total return or 2.46% a year before sales charges but reflecting contractually waived expenses, returns were also below historical averages. Strategists point to Federal Reserve policy that held interest rates too low for too long and created a boom and then bust scenario. Due to increased public debate about Federal Reserve policy, we are hopeful that we will see a more steady policy over the next ten years that will create a more positive environment for equity investments. The Federal Reserve has already begun to withdraw many of the stimulative policies of the past eighteen months. We are hopeful that the Federal Reserve will appropriately time an increase in interest rates over the next six months. We also believe the U.S. Congress also needs to bring spending under control. The recent Senatorial race in Massachusetts has hopefully caused Congress to focus more attention on spending.
PERFORMANCE REPORT
The graph below illustrates the value of $10,000 invested in Class A Shares of Aquila Rocky Mountain Equity Fund (the “Fund”) for the 10-year period ended December 31, 2009 as compared with a hypothetical similar-size investment in the Russell 2000 Stock Index (the “Index”) over the same period. The Fund was originally managed to provide capital appreciation through selection of equity-oriented securities primarily on a value-basis. It was reoriented to a growth at a reasonable price style as of July, 1999. The Fund’s universe of companies are primarily within the eight-state Rocky Mountain region.
The performance of each of the other classes is not shown in the graph, but is included in the table below. It should be noted that the Index does not include operating expenses nor sales charges but does reflect reinvestment of dividends. It should also be noted that the Index is nationally-oriented and consisted, over the period covered by the graph, of an unmanaged group of 2000 equity securities throughout the United States, mostly of companies having relatively small capitalization. However, the Fund’s investment portfolio consisted over the same period of a significant lesser number of equity securities primarily of companies domiciled in the eight-state Rocky Mountain region of our country.
The market prices and behavior of the individual securities in the Fund’s investment portfolio can be affected by local and regional factors which might well result in variances from the market action of the securities in the Index. Furthermore, the difference in the performance in the Index versus the Fund may also be attributed to the lack of application of annual operating expenses and sales charges to the Index.
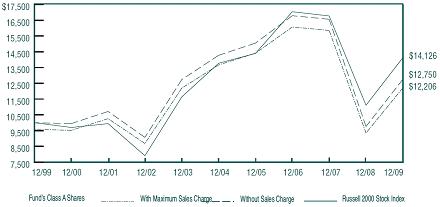
| | | | | | Average Annual Total Return | | | | | | |
| | | for periods ended December 31, 2009 | | | |
| | | | | | | | | | | | Since | | | |
| Class and Inception Date | | 1 Year | | | 5 Years | | | 10 Years | | | Inception | | | |
| Class A (commenced operations on 7/22/94) | | | | | | | | | | | | | | |
| With Maximum Sales Charge | | | 25.07 | % | | | (3.08 | )% | | | 2.01 | % | | | 5.67 | % | | |
| Without Sales Charge | | | 30.62 | % | | | (2.24 | )% | | | 2.46 | % | | | 6.00 | % | | |
| Class C (commenced operations on 5/01/96) | | | | | | | | | | | | | | | | | | |
| With CDSC | | | 28.67 | % | | | (2.96 | )% | | | 1.70 | % | | | 4.12 | % | | |
| Without CDSC | | | 29.67 | % | | | (2.96 | )% | | | 1.70 | % | | | 4.12 | % | | |
| Class I (commenced operations on 12/01/05) | | | | | | | | | | | | | | | | | | |
| No Sales Charge | | | 31.08 | % | | | N/A | | | | N/A | | | | (4.33 | )% | | |
| Class Y (commenced operations on 5/01/96) | | | | | | | | | | | | | | | | | | |
| No Sales Charge | | | 30.94 | % | | | (1.98 | )% | | | 2.73 | % | | | 5.09 | % | | |
| Russell 2000 Stock Index | | | 27.17 | % | | | 0.51 | % | | | 3.51 | % | | | 7.69 | % | | (Class A) |
| | | | | | | | | | | | | | | | 4.99 | % | | (Class C&Y) |
| | | | | | | | | | | | | | | | (1.04 | )% | | (Class I) |
Total return figures shown for the Fund reflect any change in price and assume all distributions within the period were invested in additional shares. Returns for Class A shares are calculated with and without the effect of the initial 4.25% maximum sales charge. Returns for Class C shares are calculated with and without the effect of the 1% contingent deferred sales charge (CDSC) imposed on redemptions made within the first 12 months after purchase. Class I and Y shares are sold without any sales charge. The rates of return will vary and the principal value of an investment will fluctuate with market conditions. Shares, if redeemed, may be worth more or less than their original cost. Past performance is not predictive of future investment results.
REPORT OF INDEPENDENT REGISTERED PUBLIC ACCOUNTING FIRM
To the Board of Trustees and Shareholders of
Aquila Rocky Mountain Equity Fund:
We have audited the accompanying statement of assets and liabilities, including the schedule of investments, of Aquila Rocky Mountain Equity Fund as of December 31, 2009 and the related statement of operations for the year then ended, the statements of changes in net assets for each of the two years in the period then ended, and the financial highlights for each of the five years in the period then ended. These financial statements and financial highlights are the responsibility of the Fund’s management. Our responsibility is to express an opinion on these financial statements and financial highlights based on our audits.
We conducted our audits in accordance with the standards of the Public Company Accounting Oversight Board (United States). Those standards require that we plan and perform the audit to obtain reasonable assurance about whether the financial statements and financial highlights are free of material misstatement. The Fund is not required to have, nor were we engaged to perform, an audit of the Fund’s internal control over financial reporting. Our audits included consideration of internal control over financial reporting as a basis for designing audit procedures that are appropriate in the circumstances, but not for the purpose of expressing an opinion on the effectiveness of the Fund’s internal control over financial reporting. Accordingly, we express no such opinion. An audit also includes examining, on a test basis, evidence supporting the amounts and disclosures in the financial statements. Our procedures included confirmation of securities owned as of December 31, 2009, by correspondence with the custodian. An audit also includes assessing the accounting principles used and significant estimates made by management, as well as evaluating the overall financial statement presentation. We believe that our audits provide a reasonable basis for our opinion.
In our opinion, the financial statements and financial highlights referred to above present fairly, in all material respects, the financial position of Aquila Rocky Mountain Equity Fund as of December 31, 2009, the results of its operations for the year then ended, the changes in its net assets for each of the two years in the period then ended, and the financial highlights for each of the five years in the period then ended, in conformity with accounting principles generally accepted in the United States of America.
TAIT, WELLER & BAKER LLP
Philadelphia, Pennsylvania
February 26, 2010
| | | AQUILA ROCKY MOUNTAIN EQUITY FUND | | | |
| | | SCHEDULE OF INVESTMENTS | | | |
| | | DECEMBER 31, 2009 | | | |
| | |
| | | | | Market | |
| Shares | | Common Stocks (95.6%) | | Value | |
| | | Basic Industry (19.4%) | | | |
| | 4,000 | | Ball Corp | | $ | 206,800 | |
| | 2,000 | | Freeport-McMoRan Copper & Gold, Inc | | | 160,580 | |
| | 32,000 | | Knight Transportation, Inc | | | 617,280 | |
| | 8,000 | | Newmont Mining Corp | | | 378,480 | |
| | 10,000 | | Republic Services, Inc. (Class A) | | | 283,100 | |
| | 15,000 | | SkyWest, Inc | | | 253,800 | |
| | | | | | | 1,900,040 | |
| | | | Business Services (2.8%) | | | | |
| | 5,000 | | IHS, Inc. (Class A)+ | | | 274,050 | |
| | | | Capital Spending (3.3%) | | | | |
| | 5,000 | | Dynamic Materials Corp | | | 100,250 | |
| | 16,000 | | Mobile Mini, Inc.+ | | | 225,440 | |
| | | | | | | 325,690 | |
| | | | Consumer Cyclicals (1.6%) | | | | |
| | 5,000 | | M.D.C. Holdings, Inc | | | 155,200 | |
| | | | Consumer Services (7.1%) | | | | |
| | 8,000 | | Dish Network Corp. (Series A) | | | 166,160 | |
| | 2,000 | | Grand Canyon Education, Inc.+ | | | 38,020 | |
| | 7,000 | | Liberty Media Interactive (Series A)+ | | | 75,880 | |
| | 10,000 | | PetSmart, Inc | | | 266,900 | |
| | 5,000 | | Pinnacle Entertainment, Inc.+ | | | 44,900 | |
| | 12,000 | | Shuffle Master, Inc.+ | | | 98,880 | |
| | | | | | | 690,740 | |
| | | | Consumer Staples (2.7%) | | | | |
| | 1,000 | | Chipotle Mexican Grill, Inc.+ | | | 88,160 | |
| | 4,000 | | Discovery Communications, Inc. (Series A)+ | | | 122,680 | |
| | 6,000 | | Rocky Mountain Chocolate Factory, Inc | | | 48,600 | |
| | | | | | | 259,440 | |
| | | | Energy (9.2%) | | | | |
| | 8,000 | | Bill Barrett Corp.+ | | | 248,880 | |
| | 6,000 | | Cimarex Energy Co | | | 317,820 | |
| | 8,000 | | Questar Corp | | | 332,560 | |
| | | | | | | 899,260 | |
| | | | Financial (9.3%) | | | | |
| | 14,000 | | Glacier Bancorp, Inc | | | 192,080 | |
| | 28,000 | | Janus Capital Group, Inc | | | 376,600 | |
| | 18,000 | | Western Union Co | | | 339,300 | |
| | | | | | | 907,980 | |
AQUILA ROCKY MOUNTAIN EQUITY FUND
SCHEDULE OF INVESTMENTS (continued)
DECEMBER 31, 2009
| | | | | | | | Market | |
| Shares | | Common Stocks (continued) | | | | | Value | |
| | | Health Care (18.7%) | | | | | | |
| | 20,000 | | Array BioPharma, Inc.+ | | | | | $ | 56,200 | |
| | 25,000 | | AspenBio Pharma, Inc.+ | | | | | | 43,500 | |
| | 11,000 | | Medicis Pharmaceutical Corp. (Class A) | | | | | | 297,550 | |
| | 30,000 | | Merit Medical Systems, Inc.+ | | | | | | 578,700 | |
| | 6,000 | | Myriad Genetics, Inc.+ | | | | | | 156,600 | |
| | 2,000 | | Myriad Pharmaceuticals, Inc.+ | | | | | | 10,060 | |
| | 16,000 | | Providence Service Corp.+ | | | | | | 252,800 | |
| | 30,000 | | Spectranetics Corp.+ | | | | | | 208,800 | |
| | 7,000 | | USANA Health Services, Inc.+ | | | | | | 223,300 | |
| | | | | | | | | | 1,827,510 | |
| | | | Technology (21.5%) | | | | | | | |
| | 18,000 | | Avnet, Inc.+ | | | | | | 542,880 | |
| | 46,000 | | CIBER, Inc.+ | | | | | | 158,700 | |
| | 14,000 | | JDA Software Group, Inc.+ | | | | | | 356,580 | |
| | 24,000 | | Microchip Technology, Inc | | | | | | 697,440 | |
| | 6,000 | | Micron Technology, Inc.+ | | | | | | 63,360 | |
| | 25,000 | | Ramtron International Corp.+ | | | | | | 44,250 | |
| | 14,000 | | RightNow Technologies, Inc.+ | | | | | | 243,180 | |
| | | | | | | | | | 2,106,390 | |
| | | | Total Investments (cost $7,754,377*) | | | 95.6 | % | | | 9,346,300 | |
| | | | Other assets less liabilities | | | 4.4 | | | | 428,104 | |
| | | | Net Assets | | | 100.0 | % | | $ | 9,774,404 | |
| | |
| | | | | | Percent of | | | | |
| | | | Portfolio Distribution | | Portfolio | | | | |
| | | | Rocky Mountain Region (unaudited) | | | | | | | | |
| | | | Arizona | | | 40.0 | % | | | | |
| | | | Colorado | | | 35.2 | | | | | |
| | | | Idaho | | | 0.7 | | | | | |
| | | | Montana | | | 4.7 | | | | | |
| | | | Nevada | | | 1.5 | | | | | |
| | | | Utah | | | 16.6 | | | | | |
| | | | | | | 98.7 | | | | | |
| | | | Other Investments | | | 1.3 | | | | | |
| | | | | | | 100.0 | % | | | | |
| | | | | | |
| | | | * Cost for Federal income tax and financial reporting purposes is identical. | | |
| | | | + Non-income producing security. | | |
| | | | | | | | | | | | |
See accompanying notes to financial statements.
| | | | |
| AQUILA ROCKY MOUNTAIN EQUITY FUND | |
| STATEMENT OF ASSETS AND LIABILITIES | |
| DECEMBER 31, 2009 | |
| | |
| ASSETS | | | |
| Investments at market value (cost $7,754,377) | | $ | 9,346,300 | |
| Cash | | | 407,249 | |
| Receivable for Fund shares sold | | | 39,270 | |
| Receivable for investment securities sold | | | 38,897 | |
| Receivable from Manager | | | 11,327 | |
| Dividends receivable | | | 4,960 | |
| Other assets | | | 4,294 | |
| Total assets | | | 9,852,297 | |
| LIABILITIES | | | | |
| Payable for Fund shares redeemed | | | 27,617 | |
| Accrued expenses | | | 50,276 | |
| Total liabilities | | | 77,893 | |
| NET ASSETS | | $ | 9,774,404 | |
| Net Assets consist of: | | | | |
| Capital Stock - Authorized an unlimited number of shares, par value $0.01 per share | | $ | 4,284 | |
| Additional paid-in capital | | | 8,236,635 | |
| Net unrealized appreciation on investments (note 4) | | | 1,591,923 | |
| Accumulated net realized loss on investments | | | (58,438 | ) |
| | | $ | 9,774,404 | |
| CLASS A | | | | |
| Net Assets | | $ | 8,681,836 | |
| Capital shares outstanding | | | 378,335 | |
| Net asset value and redemption price per share | | $ | 22.95 | |
| Maximum offering price per share (100/95.75 of $22.95 adjusted to nearest cent) | | $ | 23.97 | |
| CLASS C | | | | |
| Net Assets | | $ | 636,899 | |
| Capital shares outstanding | | | 30,813 | |
| Net asset value and offering price per share | | $ | 20.67 | |
| Redemption price per share (*a charge of 1% is imposed on the redemption | | | | |
| proceeds of the shares, or on the original price, whichever is lower, if redeemed | | | | |
| during the first 12 months after purchase) | | $ | 20.67 | * |
| CLASS I | | | | |
| Net Assets | | $ | 8,412 | |
| Capital shares outstanding | | | 362 | |
| Net asset value, offering and redemption price per share | | $ | 23.24 | |
| CLASS Y | | | | |
| Net Assets | | $ | 447,257 | |
| Capital shares outstanding | | | 18,841 | |
| Net asset value, offering and redemption price per share | | $ | 23.74 | |
See accompanying notes to financial statements.
| AQUILA ROCKY MOUNTAIN EQUITY FUND | |
| STATEMENT OF OPERATIONS | |
| YEAR ENDED DECEMBER 31, 2009 | |
| | |
| Investment Income: | | | | | | |
| | |
| Dividends | | | | | $ | 120,318 | |
| | |
| Expenses: | | | | | | | |
| | |
| Management fee (note 3) | | $ | 146,132 | | | | | |
| Trustees’ fees and expenses | | | 77,733 | | | | | |
| Legal fees (note 3) | | | 54,238 | | | | | |
| Registration fees and dues | | | 50,309 | | | | | |
| Transfer and shareholder servicing agent fees (note 3) | | | 45,332 | | | | | |
| Distribution and service fees (note 3) | | | 28,957 | | | | | |
| Shareholders’ reports | | | 18,826 | | | | | |
| Auditing and tax fees | | | 12,651 | | | | | |
| Chief compliance officer (note 3) | | | 4,289 | | | | | |
| Custodian fees (note 5) | | | 2,930 | | | | | |
| Insurance | | | 770 | | | | | |
| Miscellaneous | | | 29,226 | | | | | |
| Total expenses | | | 471,393 | | | | | |
| | |
| Management fee waived (note 3) | | | (146,132 | ) | | | | |
| Reimbursement of expenses by Manager (note 3) | | | (174,449 | ) | | | | |
| Expenses paid indirectly (note 5) | | | (93 | ) | | | | |
| Net expenses | | | | | | | 150,719 | |
| | |
| Net investment loss | | | | | | | (30,401 | ) |
| | |
| Realized and Unrealized Gain (Loss) on Investments: | | | | | | | | |
| | |
| Net realized gain (loss) from securities transactions | | | (42,554 | ) | | | | |
| Change in unrealized depreciation on investments | | | 2,673,221 | | | | | |
| | |
| Net realized and unrealized gain (loss) on investments | | | | | | | 2,630,667 | |
| Net change in net assets resulting from operations | | | | | | $ | 2,600,266 | |
See accompanying notes to financial statements.
| AQUILA ROCKY MOUNTAIN EQUITY FUND | |
| STATEMENTS OF CHANGES IN NET ASSETS | |
| | |
| | | Year Ended | | | Year Ended | |
| | | December 31, 2009 | | | December 31, 2008 | |
| OPERATIONS: | | | | | | |
| Net investment loss | | $ | (30,401 | ) | | $ | (133,640 | ) |
| Net realized gain (loss) from securities transactions | | | (42,554 | ) | | | (15,884 | ) |
| Change in unrealized appreciation (depreciation) on investments | | | 2,673,221 | | | | (8,758,240 | ) |
| Change in net assets from operations | | | 2,600,266 | | | | (8,907,764 | ) |
| | |
| DISTRIBUTIONS TO SHAREHOLDERS (note 8): | | | | | | | | |
| Class A Shares: | | | | | | | | |
| Net realized gain on investments | | | – | | | | (167,310 | ) |
| | |
| Class C Shares: | | | | | | | | |
| Net realized gain on investments | | | – | | | | (20,745 | ) |
| | |
| Class I Shares: | | | | | | | | |
| Net realized gain on investments | | | – | | | | (120 | ) |
| | |
| Class Y Shares: | | | | | | | | |
| Net realized gain on investments | | | – | | | | (10,238 | ) |
| Change in net assets from distributions | | | – | | | | (198,413 | ) |
| | |
| CAPITAL SHARE TRANSACTIONS (note 7): | | | | | | | | |
| Proceeds from shares sold | | | 487,944 | | | | 1,373,163 | |
| Short-term trading redemption fee | | | 42 | | | | 428 | |
| Reinvested distributions | | | – | | | | 130,284 | |
| Cost of shares redeemed | | | (3,640,426 | ) | | | (7,544,226 | ) |
| Change in net assets from capital share transactions | | | (3,152,440 | ) | | | (6,040,351 | ) |
| | |
| Change in net assets | | | (552,174 | ) | | | (15,146,528 | ) |
| | |
| NET ASSETS: | | | | | | | | |
| Beginning of period | | | 10,326,578 | | | | 25,473,106 | |
| | |
| End of period | | $ | 9,774,404 | | | $ | 10,326,578 | |
See accompanying notes to financial statements.
| AQUILA ROCKY MOUNTAIN EQUITY FUND |
| NOTES TO FINANCIAL STATEMENTS |
| DECEMBER 31, 2009 |
1. Organization
Aquila Rocky Mountain Equity Fund (the “Fund”), a diversified, open-end investment company, was organized on November 3, 1993 as a Massachusetts business trust and commenced operations on July 22, 1994. The Fund is authorized to issue an unlimited number of shares and, since its inception to May 1, 1996, offered only one class of shares. On that date, the Fund began offering two additional classes of shares, Class C and Class Y Shares. All shares outstanding prior to that date were designated as Class A Shares and are sold with a front-payment sales charge and bear an annual distribution fee. Class C Shares are sold with a level-payment sales charge with no payment at time of purchase but level service and distribution fees from date of purchase through a period of six years thereafter. A contingent deferred sales charge of 1% is assessed to any Class C shareholder who redeems shares of this Class within one year from the date of purchase. Class C Shares, together with a pro rata portion of all Class C Shares acquired through reinvestment of dividends or other distributions paid in additional Class C Shares, automatically convert to Class A Shares after 6 years. The Class Y Shares are only offered to institutions acting for an investor in a fiduciary, advisory, agency, custodian or similar capacity and are not offered directly to retail investors. Class Y Shares are sold at net asset value without any sales charge, redemption fees, contingent deferred sales charge or distribution or service fees. On April 30, 1998 the Fund established Class I Shares, which are offered and sold only through financial intermediaries and are not offered directly to retail investors. Class I Shares commenced operations on December 1, 2005. Class I Shares are sold at net asset value without any sales charge, redemption fees, or contingent deferred sales charge. Class I Shares carry a distribution fee and service fee. All classes of shares represent interests in the same portfolio of investments and are identical as to rights and privileges but differ with respect to the effect of sales charges, the distribution and/or service fees borne by each class, expenses specific to each class, voting rights on matters affecting a single class and the exchange privileges of each class.
2. Significant Accounting Policies
The following is a summary of significant accounting policies followed by the Fund in the preparation of its financial statements. The policies are in conformity with accounting principles generally accepted in the United States of America for investment companies.
| a) | Portfolio valuation: Securities listed on a national securities exchange or designated as national market system securities are valued at the last sale price on such exchanges or market system. Securities listed only on NASDAQ are valued in accordance with the NASDAQ Official Closing Price. Securities for which market quotations are not readily available are valued at fair value as determined in good faith by or at the direction of the Board of Trustees. Short-term investments maturing in 60 days or less are valued at amortized cost. |
| b) | Fair Value Measurements: The Fund follows a fair value hierarchy that distinguishes between market data obtained from independent sources (observable inputs) and the Fund’s own market assumptions (unobservable inputs). These inputs are used in determining the value of the Fund’s investments and are summarized in the following fair value hierarchy: |
| AQUILA ROCKY MOUNTAIN EQUITY FUND |
| NOTES TO FINANCIAL STATEMENTS (continued) |
| DECEMBER 31, 2009 |
Level 1 – Unadjusted quoted prices in active markets for identical assets or liabilities that the Fund has the ability to access.
Level 2 – Observable inputs other than quoted prices included in level 1 that are observable for the asset or liability, either directly or indirectly. These inputs may include quoted prices for the identical instrument on an inactive market, prices for similar instruments, interest rates, prepayment speeds, credit risk, yield curves, default rates and similar data.
Level 3 – Unobservable inputs for the asset or liability, to the extent relevant observable inputs are not available, representing the Fund’s own assumptions about the assumptions a market participant would use in valuing the asset or liability, and would be based on the best information available.
The inputs or methodology used for valuing securities are not an indication of the risk associated with investing in those securities.
The following is a summary of the valuation inputs, representing 100% of the Fund’s investments (details of which can be found in the schedule of investments) used to value the Fund’s net assets as of December 31, 2009:
| Valuation Inputs | | Investments in Securities | |
| Level 1 – Quoted Prices – Common Stocks | | $ | 9,346,300 | |
| Level 2 – Other Significant Observable Inputs | | | — | |
| Level 3 – Significant Unobservable Inputs | | | — | |
| Total | | $ | 9,346,300 | |
| c) | Subsequent events: In preparing these financial statements, the Fund has evaluated events and transactions for potential recognition or disclosure through February 26, 2010, the date the financial statements were issued. |
| d) | Securities transactions and related investment income: Securities transactions are recorded on the trade date. Realized gains and losses from securities transactions are reported on the identified cost basis. Dividend income is recorded on the ex-dividend date. Interest income is recorded daily on the accrual basis. |
| e) | Federal income taxes: It is the policy of the Fund to qualify as a regulated investment company by complying with the provisions of the Internal Revenue Code applicable to certain investment companies. The Fund intends to make distributions of income and securities profits sufficient to relieve it from all, or substantially all, Federal income and excise taxes. Management has reviewed the tax positions for each of the open tax years (2006-2009) and has concluded that there are no significant uncertain tax positions that would require recognition in the financial statements. |
| f) | Multiple class allocations: All income, expenses (other than class-specific expenses), and realized and unrealized gains or losses are allocated daily to each class of shares based on the relative net assets of each class. Class-specific expenses, which include distribution and service fees and any other items that are specifically attributed to a particular class, are charged directly to such class. |
| AQUILA ROCKY MOUNTAIN EQUITY FUND |
| NOTES TO FINANCIAL STATEMENTS (continued) |
| DECEMBER 31, 2009 |
| g) | Use of estimates: The preparation of financial statements in conformity with accounting principles generally accepted in the United States of America requires management to make estimates and assumptions that affect the reported amounts of assets and liabilities and disclosure of contingent assets and liabilities at the date of the financial statements and the reported amounts of increases and decreases in net assets from operations during the reporting period. Actual results could differ from those estimates. |
| h) | Reclassification of capital accounts: Accounting principles generally accepted in the United States of America require that certain components of net assets relating to permanent differences be reclassified between financial and tax reporting. On December 31, 2009 the Fund decreased undistributed net investment loss by $30,401, decreased accumulated net realized loss on investments by $58 and decreased additional paid-in capital by $30,459. These reclassifications were due to a net investment loss and use of equalization for tax purposes and have no effect on net assets or net asset value per share. |
| i) | Accounting pronouncement: In January 2010, the Financial Accounting Standards Board (“FASB”) issued Accounting Standards Update “Improving Disclosures about Fair Value Measurements” that requires additional disclosures regarding fair value measurements. Certain required disclosures are effective for interim and annual reporting periods beginning after December 15, 2009, and other required disclosures are effective for fiscal years beginning after December 15, 2010, and for interim periods within those fiscal years. Management is currently evaluating the impact it will have on its financial statement disclosures. |
3. Fees and Related Party Transactions
a) Management Arrangements:
The Fund has an Advisory and Administration Agreement with Aquila Investment Management LLC (the “Manager”), a wholly-owned subsidiary of Aquila Management Corporation, the Fund’s founder and sponsor. Under this agreement, the Manager supervises the investments of the Fund and the composition of its portfolio, arranges for the purchases and sales of portfolio securities, and provides for daily pricing of the Fund’s portfolio. Besides its advisory services, the Manager also provides all administrative services to the Fund. This includes providing the office of the Fund and all related services as well as managing relationships with all the various support organizations to the Fund such as the shareholder servicing agent, custodian, legal counsel, auditors and distributor and additionally maintaining the Fund’s accounting books and records. For its services, the Manager is entitled to receive a fee which is payable monthly and computed as of the close of business each day on the net assets of the Fund at the following annual rates; 1.50% on the first $15 million; 1.20% on the next $35 million and 0.90% on the excess over $50 million.
For the year ended December 31, 2009, the Fund incurred management fees of $146,132, all of which was waived. Additionally, during this period the Manager reimbursed the Fund for other expenses in the amount of $174,449. The Manager has contractually undertaken to waive fees and/or reimburse Fund expenses during fiscal years ending December 31, 2009 and December 31, 2010 so that total Fund expenses will not exceed 1.50% for Class A Shares, 2.25% for Class C Shares, 1.34% for Class I Shares or 1.25% for Class Y Shares. A similar contractual undertaking is in place through 2010.
| AQUILA ROCKY MOUNTAIN EQUITY FUND |
| NOTES TO FINANCIAL STATEMENTS (continued) |
| DECEMBER 31, 2009 |
Under a Compliance Agreement with the Manager, the Manager is compensated for Chief Compliance Officer related services provided to enable the Fund to comply with Rule 38a-1 of the Investment Company Act of 1940.
Specific details as to the nature and extent of the services provided by the Manager are more fully defined in the Fund’s Prospectus and Statement of Additional Information.
b) Distribution and Service Fees:
The Fund has adopted a Distribution Plan (the “Plan”) pursuant to Rule 12b-1 (the “Rule”) under the Investment Company Act of 1940. Under one part of the Plan, with respect to Class A Shares, the Fund is authorized to make distribution fee payments to broker-dealers or others (“Qualified Recipients”) selected by Aquila Distributors, Inc. (the “Distributor”), including, but not limited to, any principal underwriter of the Fund, with which the Distributor has entered into written agreements contemplated by the Rule and which have rendered assistance in the distribution and/or retention of the Fund’s shares or servicing of shareholder accounts. The Fund makes payment of this distribution fee at the annual rate of 0.25% of the Fund’s average net assets represented by Class A Shares. For the year ended December 31, 2009, distribution fees on Class A Shares amounted to $21,072 of which the Distributor retained $3,225.
Under another part of the Plan, the Fund is authorized to make payments with respect to Class C Shares to Qualified Recipients which have rendered assistance in the distribution and/or retention of the Fund’s Class C shares or servicing of shareholder accounts. These payments are made at the annual rate of 0.75% of the Fund’s average net assets represented by Class C Shares and for the year ended December 31, 2009, amounted to $5,904. In addition, under a Shareholder Services Plan, the Fund is authorized to make service fee payments with respect to Class C Shares to Qualified Recipients for providing personal services and/or maintenance of shareholder accounts. These payments are made at the annual rate of 0.25% of the Fund’s average net assets represented by Class C Shares and for the year ended December 31, 2009, amounted to $1,968. The total of these payments with respect to Class C Shares amounted to $7,872 of which the Distributor retained $1,871.
Under another part of the Plan, the Fund is authorized to make payments with respect to Class I Shares to Qualified Recipients. Class I payments, under the Plan, may not exceed, for any fiscal year of the Fund a rate (currently 0.20%) set from time to time by the Board of Trustees of not more than 0.25% of the average annual net assets represented by the Class I Shares. In addition, the Fund has a Shareholder Services Plan under which it may pay service fees (currently 0.15%) of not more than 0.25% of the average annual net assets of the Fund represented by Class I Shares. That is, the total payments under both plans will not exceed 0.50% of such net assets. For the year ended December 31, 2009, these payments were made at the average annual rate of 0.35% of such net assets and amounted to $23 of which $13 related to the Plan and $10 related to the Shareholder Services Plan.
| AQUILA ROCKY MOUNTAIN EQUITY FUND |
| NOTES TO FINANCIAL STATEMENTS (continued) |
| DECEMBER 31, 2009 |
Specific details about the Plans are more fully defined in the Fund’s Prospectus and Statement of Additional Information.
Under a Distribution Agreement, the Distributor serves as the exclusive distributor of the Fund’s shares. Through agreements between the Distributor and various brokerage and advisory firms (“intermediaries”), the Fund’s shares are sold primarily through the facilities of intermediaries, with the bulk of any sales commissions inuring to such intermediaries. For the year ended December 31, 2009, total commissions on sales of Class A Shares amounted to $6,244 of which the Distributor received $833.
c) Other Related Party Transactions:
For the year ended December 31, 2009, the Fund incurred $54,233 of legal fees allocable to Butzel Long PC, counsel to the Fund, for legal services in conjunction with the Fund’s ongoing operations. The Secretary of the Fund is a shareholder of that firm.
4. Purchases and Sales of Securities
During the year ended December 31, 2009, purchases of securities and proceeds from the sales of securities (excluding short-term investments) aggregated $240,577 and $4,062,276, respectively.
At December 31, 2009, the aggregate tax cost for all securities was $7,754,377. At December 31, 2009, the aggregate gross unrealized appreciation for all securities in which there is an excess of market value over tax cost amounted to $2,723,313 and aggregate gross unrealized depreciation for all securities in which there is an excess of tax cost over market value amounted to $1,131,390 for a net unrealized appreciation of $1,591,923.
5. Expenses
The Fund has negotiated an expense offset arrangement with its custodian wherein it receives credit toward the reduction of custodian fees and other Fund expenses whenever there are uninvested cash balances. The Statement of Operations reflects the total expenses before any offset, the amount of offset and the net expenses.
6. Portfolio Orientation
The Fund primarily invests in the securities of companies based or with significant operations within the eight state Rocky Mountain region consisting of Arizona, Colorado, Idaho, Montana, Nevada, New Mexico, Utah and Wyoming. These securities therefore are subject to economic and other conditions affecting the various states which comprise the region. Accordingly, the investment performance of the Fund might not be comparable with that of a broader universe of companies.
| AQUILA ROCKY MOUNTAIN EQUITY FUND | |
| NOTES TO FINANCIAL STATEMENTS (continued) | |
| DECEMBER 31, 2009 | |
| | |
| | |
| 7. Capital Share Transactions | | | | | | | | | | | | |
| | | | | | | | | | | | | |
a) Transactions in Capital Shares of the Fund were as follows: | | | | | | | |
| | | Year Ended | | | Year Ended | |
| | | December 31, 2009 | | | December 31, 2008 | |
| | | Shares | | | Amount | | | Shares | | | Amount | |
| Class A Shares: | | | | | | | | | | | | |
| Proceeds from shares sold | | | 20,818 | | | $ | 424,175 | | | | 44,105 | | | $ | 1,178,222 | |
| Reinvested distributions | | | – | | | | – | | | | 6,428 | | | | 112,969 | |
| Cost of shares redeemed | | | (144,676 | ) | | | (2,834,791 | )(a) | | | (237,743 | ) | | | (5,766,961 | )(a) |
| Net change | | | (123,858 | ) | | | (2,410,616 | ) | | | (187,210 | ) | | | (4,475,770 | ) |
| Class C Shares: | | | | | | | | | | | | | | | | |
| Proceeds from shares sold | | | 1,341 | | | | 24,843 | | | | 3,298 | | | | 76,334 | |
| Reinvested distributions | | | – | | | | – | | | | 723 | | | | 11,520 | |
| Cost of shares redeemed | | | (29,457 | ) | | | (515,999 | ) | | | (47,289 | ) | | | (1,036,874 | ) |
| Net change | | | (28,116 | ) | | | (491,156 | ) | | | (43,268 | ) | | | (949,020 | ) |
| Class I Shares: | | | | | | | | | | | | | | | | |
| Proceeds from shares sold | | | – | | | | – | | | | – | | | | – | |
| Reinvested distributions | | | – | | | | – | | | | 7 | | | | 120 | |
| Cost of shares redeemed | | | – | | | | – | | | | – | | | | – | |
| Net change | | | – | | | | – | | | | 7 | | | | 120 | |
| Class Y Shares: | | | | | | | | | | | | | | | | |
| Proceeds from shares sold | | | 2,045 | | | | 38,926 | | | | 4,824 | | | | 118,511 | |
| Reinvested distributions | | | – | | | | – | | | | 318 | | | | 5,771 | |
| Cost of shares redeemed | | | (13,998 | ) | | | (289,594 | ) | | | (27,691 | ) | | | (739,963 | )(b) |
| Net change | | | (11,953 | ) | | | (250,668 | ) | | | (22,549 | ) | | | (615,681 | ) |
Total transactions in Fund shares | | | (163,927 | ) | | $ | (3,152,440 | ) | | | (253,020 | ) | | $ | (6,040,351 | ) |
| (a) | Net of short-term trading redemption fees of $42 and $227, for 2009 and 2008, respectively. (See note 7b) |
| (b) | Net of short-term trading redemption fees of $201 for 2008. |
| b) | Short-Term Trading Redemption Fee: The Fund and the Distributor may reject any order for the purchase of shares, on a temporary or permanent basis, from investors exhibiting a pattern of frequent or short-term trading in Fund shares. In addition, the Fund imposes a redemption fee of 2.00% of the shares’ redemption value on any redemption of Class A Shares on which a sales charge is not imposed or of Class I and Class Y Shares, if the redemption occurs within 90 days of purchase. The fee is paid to the Fund and is designed to offset the costs to the Fund caused by short-term trading in Fund shares. The Fund retains the fee charged as paid-in capital which becomes part of the Fund’s daily net asset value (NAV) calculation. The fee does not apply to shares sold under an Automatic Withdrawal Plan, or sold due to the shareholder’s death or disability. For the year ended December 31, 2009, fees collected did not have a material effect on the financial highlights. |
AQUILA ROCKY MOUNTAIN EQUITY FUND
NOTES TO FINANCIAL STATEMENTS (continued)
DECEMBER 31, 2009
8. Income Tax Information and Distributions
The Fund declares annual distributions to shareholders from net investment income, if any, and from net realized capital gains, if any. Distributions are recorded by the Fund on the ex-dividend date and paid in additional shares at the net asset value per share, in cash, or in a combination of both, at the shareholder’s option. Dividends from net investment income and distributions from realized gains from investment transactions are determined in accordance with Federal income tax regulations, which may differ from investment income and realized gains determined under generally accepted accounting principles. These “book/tax” differences are either considered temporary or permanent in nature. To the extent these differences are permanent in nature, such amounts are reclassified within the capital accounts based on their federal tax-basis treatment; temporary differences do not require reclassification. Dividends and distributions which exceed net investment income and net realized capital gains for financial reporting purposes, but not for tax purposes, are reported as dividends in excess of net investment income or distributions in excess of net realized capital gains. To the extent they exceed net investment income and net realized capital gains for tax purposes, they are reported as distributions from paid-in capital. As of December 31, 2009, there were post October capital losses deferred of $87,099 which will be recognized in the following year.
| The tax character of distributions: | | | | | | |
| | | Year Ended December 31, | |
| | | 2009 | | | 2008 | |
| | | | | | | | | |
| Long-term capital gain | | $ | 0 | | | $ | 198,413 | |
As of December 31, 2009, the components of distributable earnings on a tax basis were as follows:
| Accumulated net realized gains | | $ | 28,661 | | | | | |
| Deferred post October losses | | | (87,099 | ) | | | | |
| Unrealized depreciation | | | 1,591,923 | | | | | |
| | | $ | 1,533,485 | | | | | |
| AQUILA ROCKY MOUNTAIN EQUITY FUND |
| FINANCIAL HIGHLIGHTS |
For a share outstanding throughout each period
| | | Class A | | Class C |
| | | Year Ended December 31, | | Year Ended December 31, |
| | | 2009 | | 2008 | | 2007 | | 2006 | | 2005 | | 2009 | | 2008 | | 2007 | | 2006 | | 2005 |
| Net asset value, beginning of period | | $ | 17.57 | | | $ | 30.39 | | | $ | 32.47 | | | $ | 29.45 | | | $ | 27.93 | | | $ | 15.94 | | | $ | 27.84 | | | $ | 30.11 | | | $ | 27.54 | | | $ | 26.31 | |
| Income (loss) from investment operations: | | | | | | | | | | | | | | | | | | | | | | | | | | | | | | | | | | | | | | | | |
| Net investment income (loss) | | | (0.05 | )†† | | | (0.17 | )†† | | | (0.20 | )†† | | | (0.11 | )† | | | (0.11 | )† | | | (0.18 | )†† | | | (0.33 | )†† | | | (0.42 | )†† | | | (0.32 | )† | | | (0.30 | )† |
Net gain (loss) on securities (both realized and unrealized) | | | 5.43 | | | | (12.31 | ) | | | (0.19 | ) | | | 3.51 | | | | 1.63 | | | | 4.91 | | | | (11.23 | ) | | | (0.16 | ) | | | 3.27 | | | | 1.53 | |
| Total from investment operations | | | 5.38 | | | | (12.48 | ) | | | (0.39 | ) | | | 3.40 | | | | 1.52 | | | | 4.73 | | | | (11.56 | ) | | | (0.58 | ) | | | 2.95 | | | | 1.23 | |
| Less distributions (note 8): | | | | | | | | | | | | | | | | | | | | | | | | | | | | | | | | | | | | | | | | |
| Distributions from capital gains | | | – | | | | (0.34 | ) | | | (1.69 | ) | | | (0.38 | ) | | | – | | | | – | | | | (0.34 | ) | | | (1.69 | ) | | | (0.38 | ) | | | – | |
| Net asset value, end of period | | $ | 22.95 | | | $ | 17.57 | | | $ | 30.39 | | | $ | 32.47 | | | $ | 29.45 | | | $ | 20.67 | | | $ | 15.94 | | | $ | 27.84 | | | $ | 30.11 | | | $ | 27.54 | |
| Total return (not reflecting sales charge) | | | 30.62 | % | | | (41.07 | )% | | | (1.34 | )% | | | 11.54 | % | | | 5.44 | % | | | 29.67 | % | | | (41.53 | )% | | | (2.08 | )% | | | 10.71 | % | | | 4.68 | % |
| Ratios/supplemental data | | | | | | | | | | | | | | | | | | | | | | | | | | | | | | | | | | | | | | | | |
Net assets, end of period (in thousands) | | $ | 8,682 | | | $ | 8,822 | | | $ | 20,950 | | | $ | 23,121 | | | $ | 17,684 | | | $ | 637 | | | $ | 940 | | | $ | 2,845 | | | $ | 3,449 | | | $ | 2,607 | |
| Ratio of expenses to average net assets | | | 1.50 | % | | | 1.51 | % | | | 1.54 | % | | | 1.72 | % | | | 1.59 | % | | | 2.25 | % | | | 2.26 | % | | | 2.29 | % | | | 2.47 | % | | | 2.34 | % |
Ratio of net investment loss to average net assets | | | (0.26 | )% | | | (0.67 | )% | | | (0.64 | )% | | | (0.57 | )% | | | (0.48 | )% | | | (1.04 | )% | | | (1.43 | )% | | | (1.38 | )% | | | (1.32 | )% | | | (1.24 | )% |
| Portfolio turnover rate | | | 2.51 | % | | | 3.70 | % | | | 16.81 | % | | | 13.31 | % | | | 9.78 | % | | | 2.51 | % | | | 3.70 | % | | | 16.81 | % | | | 13.31 | % | | | 9.78 | % |
| | | | | | | | | | | | | | | | | | | | | | | | | | | | | | | | | | | | | | | | | |
| The expense and net investment income ratios without the effect of the waiver of fees and the expense reimbursement were (note 3): | | |
| | | |
| Ratio of expenses to average net assets | | | 4.79 | % | | | 3.51 | % | | | 2.73 | % | | | 2.70 | % | | | 3.23 | % | | | 5.58 | % | | | 4.22 | % | | | 3.47 | % | | | 3.45 | % | | | 3.98 | % |
| | | | | | | | | | | | | | | | | | | | | | | | | | | | | | | | | | | | | | | | | |
Ratio of net investment loss to average net assets | | | (3.55 | )% | | | (2.68 | )% | | | (1.82 | )% | | | (1.55 | )% | | | (2.11 | )% | | | (4.37 | )% | | | (3.39 | )% | | | (2.56 | )% | | | (2.30 | )% | | | (2.87 | )% |
| | | | | | | | | | | | | | | | | | | | | | | | | | | | | | | | | | | | | | | | | |
| The expense ratios after giving effect to the waivers, reimbursements and expense offset for uninvested cash balances were (note 3): | |
| | |
| Ratio of expenses to average net assets | | | 1.50 | % | | | 1.50 | % | | | 1.50 | % | | | 1.50 | % | | | 1.50 | % | | | 2.25 | % | | | 2.25 | % | | | 2.25 | % | | | 2.25 | % | | | 2.25 | % |
_____________________
| † | Per share amounts have been calculated using the monthly average shares method. |
| †† | Per share amounts have been calculated using the daily average shares method. |
See accompanying notes to financial statements.
| AQUILA ROCKY MOUNTAIN EQUITY FUND |
| FINANCIAL HIGHLIGHTS (continued) |
For a share outstanding throughout each period
| | | Class I | | Class Y |
| | | Year Ended December 31, | | | | Year Ended December 31, |
| | | 2009 | | 2008 | | 2007 | | 2006 | | 12/31/05(1) | | 2009 | | 2008 | | 2007 | | 2006 | | 2005 |
| Net asset value, beginning of period | | $ | 17.73 | | | $ | 30.58 | | | $ | 32.51 | | | $ | 29.46 | | | $ | 30.26 | | | $ | 18.13 | | | $ | 31.25 | | | $ | 33.25 | | | $ | 30.08 | | | $ | 28.45 | |
| Income (loss) from investment operations: | | | | | | | | | | | | | | | | | | | | | | | | | | | | | | | | | | | | | | | | |
| Net investment income (loss) | | | 0.03 | †† | | | (0.11 | )†† | | | (0.14 | )†† | | | (0.08 | )† | | | (0.02 | )† | | | (0.01 | )†† | | | (0.11 | )†† | | | (0.12 | )†† | | | (0.03 | )† | | | (0.05 | )† |
Net gain (loss) on securities (both realized and unrealized) | | | 5.48 | | | | (12.40 | ) | | | (0.10 | ) | | | 3.51 | | | | (0.78 | ) | | | 5.62 | | | | (12.67 | ) | | | (0.19 | ) | | | 3.58 | | | | 1.68 | |
| Total from investment operations | | | 5.51 | | | | (12.51 | ) | | | (0.24 | ) | | | 3.43 | | | | (0.80 | ) | | | 5.61 | | | | (12.78 | ) | | | (0.31 | ) | | | 3.55 | | | | 1.63 | |
| Less distributions (note 8): | | | | | | | | | | | | | | | | | | | | | | | | | | | | | | | | | | | | | | | | |
| Distributions from capital gains | | | – | | | | (0.34 | ) | | | (1.69 | ) | | | (0.38 | ) | | | – | | | | – | | | | (0.34 | ) | | | (1.69 | ) | | | (0.38 | ) | | | – | |
| Net asset value, end of period | | $ | 23.24 | | | $ | 17.73 | | | $ | 30.58 | | | $ | 32.51 | | | $ | 29.46 | | | $ | 23.74 | | | $ | 18.13 | | | $ | 31.25 | | | $ | 33.25 | | | $ | 30.08 | |
| Total return (not reflecting sales charge) | | | 31.08 | % | | | (40.92 | )% | | | (0.87 | )% | | | 11.64 | % | | | (2.64 | )%* | | | 30.94 | % | | | (40.90 | )% | | | (1.07 | )% | | | 11.80 | % | | | 5.73 | % |
| Ratios/supplemental data | | | | | | | | | | | | | | | | | | | | | | | | | | | | | | | | | | | | | | | | |
| | | | | | | | | | | | | | | | | | | | | | | | | | | | | | | | | | | | | | | | | |
Net assets, end of period (in thousands) | | $ | 8 | | | $ | 6 | | | $ | 11 | | | $ | 28 | | | $ | 24 | | | $ | 447 | | | $ | 558 | | | $ | 1,667 | | | $ | 1,616 | | | $ | 1,430 | |
| Ratio of expenses to average net assets | | | 1.12 | % | | | 1.30 | % | | | 1.38 | % | | | 1.64 | % | | | 1.43 | %** | | | 1.25 | % | | | 1.26 | % | | | 1.29 | % | | | 1.47 | % | | | 1.34 | % |
Ratio of net investment income (loss) to average net assets | | | 0.14 | % | | | (0.46 | )% | | | (0.46 | )% | | | (0.48 | )% | | | (0.64 | )%** | | | (0.03 | )% | | | (0.43 | )% | | | (0.39 | )% | | | (0.31 | )% | | | (0.26 | )% |
| Portfolio turnover rate | | | 2.51 | % | | | 3.70 | % | | | 16.81 | % | | | 13.31 | % | | | 9.78 | %* | | | 2.51 | % | | | 3.70 | % | | | 16.81 | % | | | 13.31 | % | | | 9.78 | % |
| | | | | | | | | | | | | | | | | | | | | | | | | | | | | | | | | | | | | | | | | |
| The expense and net investment income ratios without the effect of the waiver of fees and the expense reimbursement were (note 3): | | | | | |
| | | | | | |
| Ratio of expenses to average net assets | | | 4.40 | % | | | 3.37 | % | | | 2.55 | % | | | 2.69 | % | | | 2.67 | %** | | | 4.55 | % | | | 3.21 | % | | | 2.48 | % | | | 2.45 | % | | | 2.99 | % |
| | | | | | | | | | | | | | | | | | | | | | | | | | | | | | | | | | | | | | | | | |
Ratio of net investment loss to average net assets | | | (3.14 | )% | | | (2.53 | )% | | | (1.63 | )% | | | (1.53 | )% | | | (1.89 | )%** | | | (3.33 | )% | | | (2.38 | )% | | | (1.59 | )% | | | (1.30 | )% | | | (1.91 | )% |
| | | | | | | | | | | | | | | | | | | | | | | | | | | | | | | | | | | | | | | | | |
| The expense ratios after giving effect to the waivers, reimbursements and expense offset for uninvested cash balances were: | | | | |
| | | | | |
| Ratio of expenses to average net assets | | | 1.12 | % | | | 1.29 | % | | | 1.34 | % | | | 1.42 | % | | | 1.42 | %** | | | 1.25 | % | | | 1.25 | % | | | 1.25 | % | | | 1.25 | % | | | 1.25 | % |
_____________________
| † | Per share amounts have been calculated using the monthly average shares method. |
| †† | Per share amounts have been calculated using the daily average shares method. |
| (1) | Commenced operations on December 1, 2005. |
See accompanying notes to financial statements.
Analysis of Expenses (unaudited)
As a shareholder of the Fund, you may incur two types of costs: (1) transaction costs, including front-end sales charges with respect to Class A shares or contingent deferred sales charges (“CDSC”) with respect to Class C shares; and (2) ongoing costs, including management fees; distribution and/or service (12b-1) fees; and other Fund expenses. The table below is intended to help you understand your ongoing costs (in dollars) of investing in the Fund and to compare these costs with the ongoing costs of investing in other mutual funds.
The table below is based on an investment of $1,000 invested on July 1, 2009 and held for the six months ended December 31, 2009.
Actual Expenses
This table provides information about actual account values and actual expenses. You may use the information provided in this table, together with the amount you invested, to estimate the expenses that you paid over the period. To estimate the expenses you paid on your account, divide your ending account value by $1,000 (for example, an $8,600 ending account value divided by $1,000 = 8.6), then multiply the result by the number under the heading entitled “Expenses Paid During the Period”.
| Six months ended December 31, 2009 | | | | | | |
| | | | | | | |
| | | Actual | | | | | | |
| | | Total Return | | Beginning | | Ending | | Expenses |
| | | Without | | Account | | Account | | Paid During |
| | | Sales Charges(1) | | Value | | Value | | the Period(2) |
| Class A | | 22.92% | | $1,000.00 | | $1,229.20 | | $8.43 |
| Class C | | 22.45% | | $1,000.00 | | $1,224.50 | | $12.62 |
| Class I | | 23.16% | | $1,000.00 | | $1,231.60 | | $6.49 |
| Class Y | | 23.07% | | $1,000.00 | | $1,230.70 | | $7.03 |
| (1) | Assumes reinvestment of all dividends and capital gain distributions, if any, at net asset value and does not reflect the deduction of the applicable sales charges with respect to Class A shares or the applicable contingent deferred sales charges (“CDSC”) with respect to Class C shares. Total return is not annualized, as it may not be representative of the total return for the year. |
| (2) | Expenses are equal to the annualized expense ratio of 1.50%, 2.25%, 1.15% and 1.25% for the Fund’s Class A, C, I and Y shares, respectively, multiplied by the average account value over the period, multiplied by 184/365 (to reflect the one-half year period). |
Analysis of Expenses (unaudited) (continued)
Hypothetical Example for Comparison Purposes
The table below provides information about hypothetical account values and hypothetical expenses based on the actual expense ratio and an assumed rate of return of 5.00% per year before expenses, which is not the Fund’s actual return. The hypothetical account values and expenses may not be used to estimate the actual ending account balance or expenses you paid for the period. You may use the information provided in this table to compare the ongoing costs of investing in the Fund and other mutual funds. To do so, compare this 5.00% hypothetical example relating to the Fund with the 5.00% hypothetical examples that appear in the shareholder reports of other mutual funds.
Please note that the expenses shown in the table below are meant to highlight your ongoing costs only and do not reflect any transactional costs with respect to Class A shares. The example does not reflect the deduction of contingent deferred sales charges (“CDSC”) with respect to Class C shares. Therefore, the table is useful in comparing ongoing costs only, and will not help you determine the relative total costs of owning different mutual funds. In addition, if these transaction costs were included, your costs would have been higher.
| Six months ended December 31, 2009 | | | | | | |
| | | | | | | |
| | | Hypothetical | | | | | | |
| | | Annualized | | Beginning | | Ending | | Expenses |
| | | Total | | Account | | Account | | Paid During |
| | | Return | | Value | | Value | | the Period(1) |
| Class A | | 5.00% | | $1,000.00 | | $1,017.64 | | $ 7.63 |
| Class C | | 5.00% | | $1,000.00 | | $1,013.86 | | $11.43 |
| Class I | | 5.00% | | $1,000.00 | | $1,019.39 | | $ 5.87 |
| Class Y | | 5.00% | | $1,000.00 | | $1,018.90 | | $ 6.37 |
| (1) | Expenses are equal to the annualized expense ratio of 1.50%, 2.25%, 1.15% and 1.25% for the Fund’s Class A, C , I and Y shares, respectively, multiplied by the average account value over the period, multiplied by 184/365 (to reflect the one-half year period). |
Information Available (unaudited)
Much of the information that the funds in the Aquila Group of Funds produce is automatically sent to you and all other shareholders. Specifically, you are routinely sent your Fund’s entire list of portfolio securities twice a year in the semi-annual and annual reports you receive. Additionally, under Fund policies, the Fund may also disclose other portfolio holdings as of a specified date (currently the Fund discloses its five largest holdings by value as of the close of the last business day of each calendar quarter in a posting to its website on approximately the 30th business day following the month end). Such information remains accessible until the next schedule is made publicly available. You may obtain a copy of the Fund’s portfolio holding schedule for the most recently completed period by visiting the Fund’s website at www.aquilafunds.com. Whenever you wish to see a listing of your Fund’s portfolio other than in your shareholder reports, please check our website at www.aquilafunds.com or call us at 1-800-437-1020.
The Fund additionally files a complete list of its portfolio holdings with the SEC for the first and third quarters of each fiscal year on Form N-Q. Forms N-Q are available free of charge on the SEC website at www.sec.gov. You may also review or, for a fee, copy the forms at the SEC’s Public Reference Room in Washington, D.C. or by calling 1-800-SEC-0330.
Proxy Voting Record (unaudited)
Proxy Voting Guidelines and Procedures of the Fund are available without charge, upon request, by calling our toll-free number (1-800-437-1020). This information is also available at www.aquilafunds.com/armef/armefproxy.htm or on the SEC’s website www.sec.gov.
Federal Tax Status of Distributions (unaudited)
For the calendar year ended December 31, 2009, there were no distributions paid by Aquila Rocky Mountain Equity Fund.
Additional Information (unaudited)
Trustees(1)
and Officers
| | | | | | | | | |
| | | | | | | Number of | | |
| | | Positions | | | | Portfolios | | Other Directorships |
| | | Held with | | | | in Fund | | Held by Trustee |
| Name, | | Fund and | | Principal | | Complex | | (The position held is |
Address(2) | | Length of | | Occupation(s) | | Overseen | | a directorship unless |
| and Date of Birth | | Service(3) | | During Past 5 Years | | by Trustee | | indicated otherwise.) |
| Interested Trustee(4) | | | | | | | | |
| | | | | | | | | |
| Diana P. Herrmann New York, NY (02/25/58) | | Trustee since 1997 and President since 2002 | | Vice Chair and Chief Executive Officer of Aquila Management Corporation, Founder of the Aquila Group of Funds(5) and parent of Aquila Investment Management LLC, Manager since 2004, President since 1997, Chief Operating Officer, 1997-2008, a Director since 1984, Secretary since 1986 and previously its Executive Vice President, Senior Vice President or Vice President, 1986-1997; Chief Executive Officer and Vice Chair since 2004, President and Manager of the Manager since 2003, and Chief Operating Officer of the Manager, 2003-2008; Chair, Vice Chair, President, Executive Vice President and/or Senior Vice President of funds in the Aquila Group of Funds since 1986; Director of the Distributor since 1997; Governor, Investment Company Institute (the trade organization for the U.S. mutual fund industry dedicated to protecting shareholder interests and educating the public about investing) for various periods, since 2004, and head of its Small Funds Committee, 2004-2009; active in charitable and volunteer organizations. | | 12 | | ICI Mutual Insurance Company (2006-2009) |
| | | | | | | | | |
| Non-interested Trustees | | | | | | | | |
| | | | | | | | | |
Tucker Hart Adams Colorado Springs, CO (01/11/38) | | Chair of the Board of Trustees since 2005 and Trustee since 1993 | | President, The Adams Group, Inc., an economic consulting firm, since 1989; formerly Chief Economist, United Banks of Colorado; currently or formerly active with numerous professional and community organizations. | | 4 | | Griffis/Blessings, Inc. (commercial property development and management); Kachi Partners (middle market buyouts); Colorado Health Facilities Authority |
| | | | | | | | | |
| | | | | | | Number of | | |
| | | Positions | | | | Portfolios | | Other Directorships |
| | | Held with | | | | in Fund | | Held by Trustee |
| Name, | | Fund and | | Principal | | Complex | | (The position held is |
Address(2) | | Length of | | Occupation(s) | | Overseen | | a directorship unless |
| and Date of Birth | | Service(3) | | During Past 5 Years | | by Trustee | | indicated otherwise.) |
Gary C. Cornia Orem, UT (06/24/48) | | Trustee since 2002 | | Dean, Marriott School of Management, Brigham Young University, since 2008; Director, Romney Institute of Public Management, Marriott School of Management, 2004-2008; Professor, Marriott School of Management, 1980-present; Past President, National Tax Association; Fellow, Lincoln Institute of Land Policy, 2002-present; Associate Dean, Marriott School of Management, Brigham Young University, 1991-2000; member, Utah Governor's Tax Review Committee, 1993-2009. | | 5 | | Lincoln Institute of Land Policy, Cambridge, MA |
| | | | | | | | | |
Grady Gammage, Jr. Phoenix, AZ (10/01/51) | | Trustee since 2004 | | Founding partner, Gammage & Burnham, PLC, a law firm, Phoenix, Arizona, since 1983; director, Central Arizona Water Conservation District, 1992-2004; director, Arizona State University Foundation since 1998; active with Maricopa Partnership for Arts & Culture; Public Architecture; Arizona Historical Foundation. | | 4 | | None |
| | | | | | | | | |
Glenn P. O’Flaherty Denver, CO (08/03/58) | | Trustee since 2007 | | Chief Financial Officer and Chief Operating Officer of Lizard Investors, LLC, February-December, 2008; Co-Founder, Chief Financial Officer and Chief Compliance Officer of Three Peaks Capital Management, LLC, 2003-2005; Vice President –Investment Accounting, Global Trading and Trade Operations, Janus Capital Corporation, and Chief Financial Officer and Treasurer, Janus Funds, 1991-2002. | | 6 | | None |
| | | | | | | | | |
| | | | | | | Number of | | |
| | | Positions | | | | Portfolios | | Other Directorships |
| | | Held with | | | | in Fund | | Held by Trustee |
| Name, | | Fund and | | Principal | | Complex | | (The position held is |
Address(2) | | Length of | | Occupation(s) | | Overseen | | a directorship unless |
| and Date of Birth | | Service(3) | | During Past 5 Years | | by Trustee | | indicated otherwise.) |
Other Individuals
Chairman Emeritus(6)
Lacy B. Herrmann New York, NY (05/12/29) | | Founder and Chairman Emeritus since 2006, Chairman of the Board of Trustees, 1993-2005 | | Founder and Chairman of the Board, Aquila Management Corporation, the sponsoring organization and parent of the Manager or Administrator and/or Adviser to each fund of the Aquila Group of Funds; Chairman of the Manager or Administrator and/or Adviser to each since 2004; Founder and Chairman Emeritus of each fund in the Aquila Group of Funds; previously Chairman and a Trustee of each fund in the Aquila Group of Funds since its establishment until 2004 or 2005; Director of the Distributor since 1981 and formerly Vice President or Secretary, 1981-1998; Director or trustee, Premier VIT, 1994-2009; Director or trustee of Oppenheimer Quest Value Funds Group, Oppenheimer Small Cap Value Fund, Oppenheimer Midcap Fund, 1987-2009, and Oppenheimer Rochester Group of Funds, 1995-2009; Trustee Emeritus, Brown University and the Hopkins School; active in university, school and charitable organizations. | | N/A | | |
| | | | | | | | | |
| | | | | | | | |
| | | | | | | | | |
Charles E. Childs, III New York, NY (04/01/57) | | Executive Vice President since 2003 | | Executive Vice President of all funds in the Aquila Group of Funds and the Manager and the Manager’s parent since 2003; Executive Vice President and Chief Operating Officer of the Manager and the Manager’s parent since 2008; formerly Senior Vice President, corporate development, Vice President, Assistant Vice President and Associate of the Manager’s parent since 1987; Senior Vice President, Vice President or Assistant Vice President of the Aquila Money-Market Funds, 1988-2003. | | N/A | | N/A |
| | | | | | | | | |
| | | | | | | Number of | | |
| | | Positions | | | | Portfolios | | Other Directorships |
| | | Held with | | | | in Fund | | Held by Trustee |
| Name, | | Fund and | | Principal | | Complex | | (The position held is |
Address(2) | | Length of | | Occupation(s) | | Overseen | | a directorship unless |
| and Date of Birth | | Service(3) | | During Past 5 Years | | by Trustee | | indicated otherwise.) |
Maryann Bruce Cornelius, NC (04/01/60) | | Senior Vice President since 2009 | | President, Aquila Distributors, Inc., since 2008; Senior Vice President of each of the equity and bond funds in the Aquila Group of Funds since 2009; Executive Managing Director, Evergreen Investments, 2004-2007, President, Evergreen Investment Services, Inc., 1999-2007; President and CEO, Allstate Financial Distributors, Inc., 1998-1999; Senior Vice President and Director Financial Institution Division, OppenheimerFunds, Inc., 1990-1998, Regional Vice President, 1987-1990; Vice President and Mutual Fund Marketing Manager, J.C. Bradford & Company, 1982-1987. | | N/A | | |
| | | | | | | | | |
Marie E. Aro Denver, CO (02/10/55) | | Senior Vice President since 2004 | | Senior Vice President, Aquila Rocky Mountain Equity Fund, and Vice President, Tax-Free Trust of Arizona, since 2004; Senior Vice President, Aquila Three Peaks High Income Fund, since 2006; Vice President, INVESCO Funds Group, 1998-2003; Vice President of the Distributor, 1993-1997. | | N/A | | N/A |
| | | | | | | | | |
Barbara S. Walchli Phoenix, AZ (09/24/52) | | Senior Vice President since 1999 | | Senior Vice President and Portfolio Manager of Aquila Rocky Mountain Equity Fund since 1999; Fund Co-manager, One Group Large Company Growth Fund and One Group Income Equity Fund, Banc One Investment Advisors, 1996-1997; Director of Research, Senior Vice President, First Interstate Capital Management, 1995-1996; Investment Committee, Arizona Community Foundation 1986-2007; member, Institute of Chartered Financial Analysts, Association for Investment Management and Research and the Phoenix Society of Financial Analysts; formerly Senior Analyst, Banc One Investment Advisors and Director of Research, Valley National Bank. | | N/A | | N/A |
| | | | | | | | | |
| | | | | | | Number of | | |
| | | Positions | | | | Portfolios | | Other Directorships |
| | | Held with | | | | in Fund | | Held by Trustee |
| Name, | | Fund and | | Principal | | Complex | | (The position held is |
Address(2) | | Length of | | Occupation(s) | | Overseen | | a directorship unless |
| and Date of Birth | | Service(3) | | During Past 5 Years | | by Trustee | | indicated otherwise.) |
R. Lynn Yturri Scottsdale, AZ (08/29/42) | | Senior Vice President Investments since 2006 | | Senior Vice President Investments, Aquila Investment Management LLC since 2005, Senior Vice President Investments, Aquila Rocky Mountain Equity Fund since 2006; Senior Vice President and equity fund manager, JP Morgan Chase, formerly One Group, Bank One’s mutual fund family, 1992-2004. | | N/A | | |
| | | | | | | | | |
Stephen J. Caridi New York, NY (05/06/61) | | Vice President since 2006 | | Vice President of the Distributor since 1995; Vice President, Hawaiian Tax-Free Trust since 1998; Senior Vice President, Narragansett Insured Tax-Free Income Fund since 1998, Vice President 1996-1997; Senior Vice President, Tax-Free Fund of Colorado, 2004-2009; Vice President, Aquila Rocky Mountain Equity Fund since 2006. | | N/A | | N/A |
| | | | | | | | | |
Sherri Foster Lahaina, HI (07/27/50) | | Vice President since 2006 | | Senior Vice President, Hawaiian Tax-Free Trust since 1993 and formerly Vice President or Assistant Vice President; Vice President since 1997 and formerly Assistant Vice President of the three Aquila Money-Market Funds; Vice President, Aquila Rocky Mountain Equity Fund since 2006; Registered Representative of the Distributor since 1985. | | N/A | | N/A |
| | | | | | | | | |
Jason T. McGrew Elizabethtown, KY (08/14/71) | | Vice President since 2006 | | Vice President, Churchill Tax-Free Fund of Kentucky since 2001, Assistant Vice President, 2000-2001; Vice President, Aquila Rocky Mountain Equity Fund since 2006; Investment Broker with Raymond James Financial Services 1999-2000 and with J.C. Bradford and Company 1997-1999; Associate Broker at Prudential Securities 1996-1997. | | N/A | | N/A |
| | | | | | | | | |
Christine L. Neimeth Portland, OR (02/10/64) | | Vice President since 1999 | | Vice President of Aquila Rocky Mountain Equity Fund and Tax-Free Trust of Oregon. | | N/A | | N/A |
| | | | | | | | | |
| | | | | | | Number of | | |
| | | Positions | | | | Portfolios | | Other Directorships |
| | | Held with | | | | in Fund | | Held by Trustee |
| Name, | | Fund and | | Principal | | Complex | | (The position held is |
Address(2) | | Length of | | Occupation(s) | | Overseen | | a directorship unless |
| and Date of Birth | | Service(3) | | During Past 5 Years | | by Trustee | | indicated otherwise.) |
Alan R. Stockman Glendale, AZ (07/31/54) | | Vice President since 1999 | | Senior Vice President, Tax-Free Fund of Colorado, since 2009; Senior Vice President, Tax-Free Trust of Arizona since 2001, Vice President, 1999-2001; Vice President, Aquila Rocky Mountain Equity Fund since 1999; Bank One, Commercial Client Services representative, 1997-1999; Trader and Financial Consultant, National Bank of Arizona (Zions Investment Securities Inc.), Phoenix, Arizona 1996-1997. | | N/A | | |
| | | | | | | | | |
M. Kayleen Willis Salt Lake City, UT (06/11/63) | | Vice President since 2004 | | Vice President, Tax-Free Fund For Utah since September 2003, Assistant Vice President, 2002-2003; Vice President, Aquila Rocky Mountain Equity Fund, since 2004. | | N/A | | N/A |
| | | | | | | | | |
Robert S. Driessen New York, NY (10/12/47) | | Chief Compliance Officer since 2009 | | Chief Compliance Officer of the Fund and each of the other funds in the Aquila Group of Funds, the Manager and the Distributor since December 2009; Vice President, Chief Compliance Officer, Curian Capital, LLC, 2004-2008; Vice President, Chief Compliance Officer, Phoenix Investment Partners, Ltd., 1999- 2004; Vice President, Risk Liaison, Corporate Compliance, Bank of America, 1996-1999; Vice President, Securities Compliance, Prudential Insurance Company of America, 1993-1996; various positions to Branch Chief, US Securities and Exchange Commission, 1972-1993. | | N/A | | N/A |
| | | | | | | | | |
Joseph P. DiMaggio New York, NY (11/06/56) | | Chief Financial Officer since 2003 and Treasurer since 2000 | | Chief Financial Officer of each fund in the Aquila Group of Funds since 2003 and Treasurer since 2000. | | N/A | | N/A |
| | | | | | | | | |
| | | | | | | Number of | | |
| | | Positions | | | | Portfolios | | Other Directorships |
| | | Held with | | | | in Fund | | Held by Trustee |
| Name, | | Fund and | | Principal | | Complex | | (The position held is |
Address(2) | | Length of | | Occupation(s) | | Overseen | | a directorship unless |
| and Date of Birth | | Service(3) | | During Past 5 Years | | by Trustee | | indicated otherwise.) |
Edward M. W. Hines New York, NY (12/16/39) | | | | Shareholder of Butzel Long, a professional corporation, counsel to the Fund, since 2007; Partner of Hollyer Brady Barrett & Hines LLP, its predecessor as counsel, 1989-2007; Secretary of each fund in the Aquila Group of Funds. | | N/A | | |
| | | | | | | | | |
John M. Herndon New York, NY (12/17/39) | | Assistant Secretary since 1995 | | Assistant Secretary of each fund in the Aquila Group of Funds since 1995 and Vice President of the three Aquila Money-Market Funds since 1990; Vice President of the Manager or its predecessor and current parent since 1990. | | N/A | | N/A |
| | | | | | | | | |
Lori A. Vindigni New York, NY (11/02/66) | | Assistant Treasurer since 2000 | | Assistant Treasurer of each fund in the Aquila Group of Funds since 2000; Assistant Vice President of the Manager or its predecessor and current parent since 1998; Fund Accountant for the Aquila Group of Funds, 1995-1998. | | N/A | | N/A |
___________________________
| (1) | The Fund’s Statement of Additional Information includes additional information about the Trustees and is available, without charge, upon request by calling 800-437-1020 (toll-free) or by visiting the EDGAR Database at the SEC’s internet site at www.sec.gov. |
| (2) | The mailing address of each Trustee and officer is c/o Aquila Rocky Mountain Equity Fund, 380 Madison Avenue, Suite 2300, New York, NY 10017. |
| (3) | Because the Fund does not hold annual meetings, each Trustee holds office for an indeterminate term. The term of office of each officer is one year. |
| (4) | Ms. Herrmann is an interested person of the Fund as an officer of the Fund, as a director, officer and shareholder of the Manager’s corporate parent, as an officer and Manager of the Manager, and as a shareholder and director of the Distributor. Ms. Herrmann is the daughter of Lacy B. Herrmann, the Founder and Chairman Emeritus of the Fund. |
| (5) | In this material Pacific Capital Cash Assets Trust, Pacific Capital U.S. Government Securities Cash Assets Trust and Pacific Capital Tax-Free Cash Assets Trust, each of which is a money-market fund, are called the “Aquila Money-Market Funds”; Tax-Free Trust of Arizona, Tax-Free Fund of Colorado, Hawaiian Tax-Free Trust, Churchill Tax-Free Fund of Kentucky, Tax-Free Trust of Oregon, Narragansett Insured Tax-Free Income Fund and Tax-Free Fund For Utah, each of which is a tax-free municipal bond fund, are called the “Aquila Municipal Bond Funds”; Aquila Rocky Mountain Equity Fund is an equity fund; and Aquila Three Peaks High Income Fund is a high income corporate bond fund; considered together, these 12 funds are called the “Aquila Group of Funds.” |
| (6) | The Chairman Emeritus may attend Board meetings but has no voting power. |
PRIVACY NOTICE (unaudited)
Aquila Rocky Mountain Equity Fund
Our Privacy Policy. In providing services to you as an individual who owns or is considering investing in shares of the Fund, we collect certain non-public personal information about you. Our policy is to keep this information strictly safeguarded and confidential, and to use or disclose it only as necessary to provide services to you or as otherwise permitted by law. Our privacy policy applies equally to former shareholders and persons who inquire about the Fund.
Information We Collect. ”Non-public personal information” is personally identifiable financial information about you as an individual or your family. The kinds of non-public personal information we have about you may include the information you provide us on your share purchase application or in telephone calls or correspondence with us, and information about your fund transactions and holdings, how you voted your shares and the account where your shares are held.
Information We Disclose. We disclose non-public personal information about you to companies that provide necessary services to us, such as the Fund’s transfer agent, distributor, investment adviser or sub-adviser, if any, as permitted or required by law, or as authorized by you. Any other use is strictly prohibited. We do not sell information about you or any of our fund shareholders to anyone.
Non-California Residents: We also may disclose some of this information to another fund in the Aquila Group of Funds (or its service providers) under joint marketing agreements that permit the funds to use the information only to provide you with information about other funds in the Aquila Group of Funds or new services we are offering that may be of interest to you.
California Residents Only: In addition, unless you “opt-out” of the following disclosures using the form that was mailed to you under separate cover, we may disclose some of this information to another fund in the Aquila Group of Funds (or its sevice providers) under joint marketing agreements that permit the funds to use the information only to provide you with information about other funds in the Aquila Group of Funds or new services we are offering that may be of interest to you.
How We Safeguard Your Information. We restrict access to non-public personal information about you to only those persons who need it to provide services to you or who are permitted by law to receive it. We maintain physical, electronic and procedural safeguards to protect the confidentiality of all non-public personal information we have about you.
If you have any questions regarding our Privacy Policy, please contact us at 1-800-437-1020.
Aquila Distributors, Inc.
Aquila Investment Management LLC
This Privacy Policy also has been adopted by Aquila Distributors, Inc. and Aquila Investment Management LLC and applies to all non-public information about you that each of these companies may obtain in connection with services provided to the Fund or to you as a shareholder of the Fund.
| Founders |
| Lacy B. Herrmann, Chairman Emeritus |
| Aquila Management Corporation |
| |
| Manager |
| AQUILA INVESTMENT MANAGEMENT LLC |
| 380 Madison Avenue, Suite 2300 |
| New York, New York 10017 |
| |
| Board of Trustees |
| Tucker Hart Adams, Chair |
| Gary C. Cornia |
| Grady Gammage, Jr. |
| Diana P. Herrmann |
| Glenn P. O’Flaherty |
| |
| Officers |
| Diana P. Herrmann, President |
Barbara S. Walchli, Senior Vice President and Portfolio Manager |
| Maryann Bruce, Senior Vice President |
| Marie E. Aro, Senior Vice President |
| R. Lynn Yturri, Senior Vice President - Investments |
| Robert S. Driessen, Chief Compliance Officer |
Joseph P. DiMaggio, Chief Financial Officer and Treasurer |
| Edward M.W. Hines, Secretary |
| |
| Distributor |
| AQUILA DISTRIBUTORS, INC. |
| 380 Madison Avenue, Suite 2300 |
| New York, New York 10017 |
| |
| Transfer and Shareholder Servicing Agent |
| PNC Global Investment Servicing |
| 101 Sabin Street |
| Pawtucket, RI 02860 |
| |
| Custodian |
| JPMORGAN CHASE BANK, N.A. |
| 1111 Polaris Parkway |
| Columbus, OH 43240 |
| |
| Independent Registered Public Accounting Firm |
| TAIT, WELLER & BAKER LLP |
| 1818 Market Street, Suite 2400 |
| Philadelphia, PA 19103 |
| |
| Further information is contained in the Prospectus, |
| which must precede or accompany this report. |
(a) As of December 31, 2009 (the end of the reporting period) the Trust has adopted a code of ethics that applies to the Trust's principal executive officer(s)and principal financial officer(s) and persons performing similar functions ("Covered Officers") as defined in the Aquila Group of Funds Code of Ethics for Principal Executive and Senior Financial Officers under Section 406 of the Sarbanes-Oxley Act of 2002;
(f)(1) Pursuant to Item 10(a)(1), a copy of the Trust's Code of Ethics that applies to the Trust's principal executive officer(s) and principal financial officer(s) and persons performing similar functions is included as an exhibit to its annual report on this Form N-CSR;
(f)(2) The text of the Trust's Code of Ethics that applies to the Trust's principal executive officer(s) and principal financial officer(s) and persons performing similar functions has been posted on its Internet website which can be found at the Trust's Internet address at aquilafunds.com.
| ITEM 3. | AUDIT COMMITTEE FINANCIAL EXPERT. |
(a) (1) (i) The Registrant's board of trustees has determined that Mr. Glenn O'Flaherty, a member of its audit committee, is an audit committee financial expert. Mr. O'Flaherty is 'independent' as such term is defined in Form N-CSR.
| ITEM 4. | PRINCIPAL ACCOUNTANT FEES AND SERVICES. |
a) Audit Fees - The aggregate fees billed for professional services rendered by the principal accountant for the audit of the Registrant's annual financial statements were $10,500 in 2008 and $11,000 in 2009.
b) Audit Related Fees - There were no amounts billed for audit-related fees over the past two years.
c) Tax Fees - The Registrant was billed by the principal accountant $3,100 and $3,200 in 2008 and 2009, respectively, for return preparation and tax compliance.
d) All Other Fees - There were no additional fees paid for audit and non-audit services other than those disclosed in a) thorough c) above.
e)(1) Currently, the audit committee of the Registrant pre-approves audit services and fees on an engagement-by-engagement basis
e)(2) None of the services described in b) through d) above were approved by the audit committee pursuant to paragraph (c)(7)(i)(C) of Rule 2-01 of Regulation S-X, all were pre-approved on an engagement-by-engagement basis.
f) No applicable.
g) There were no non-audit services fees billed by the Registrant's accountant to the Registrant's investment adviser or distributor over the past two years
h) Not applicable.
| ITEM 5. | AUDIT COMMITTEE OF LISTED REGISTRANTS. |
Not applicable
| ITEM 6. | SCHEDULE OF INVESTMENTS. |
Included in Item 1 above
| ITEM 7. | DISCLOSURE OF PROXY VOTING POLICIES AND PROCEDURES FOR CLOSED-END MANAGEMENT INVESTMENT COMPANIES. |
Not applicable
| ITEM 8. | PORTFOLIO MANAGERS OF CLOSED-END MANAGEMENT INVESTMENT COMPANIES. |
Not applicable
| ITEM 9. | PURCHASES OF EQUITY SECURITIES BY CLOSED-END MANAGEMENT INVESTMENT COMPANY AND AFFILIATED PURCHASERS. |
Not applicable
| ITEM 10. | SUBMISSION OF MATTERS TO A VOTE OF SECURITY HOLDERS. |
The Board of Directors of the Registrant has adopted a Nominating Committee Charter which provides that the Nominating Committee (the 'Committee') may consider and evaluate nominee candidates properly submitted by shareholders if a vacancy among the Independent Trustees of the Registrant occurs and if, based on the Board's then current size, composition and structure, the Committee determines that the vacancy should be filled. The Committee will consider candidates submitted by shareholders on the same basis as it considers and evaluates candidates recommended by other sources. A copy of the qualifications and procedures that must be met or followed by shareholders to properly submit a nominee candidate to the Committee may be obtained by submitting a request in writing to the Secretary of the Registrant.
| ITEM 11. | CONTROLS AND PROCEDURES. |
(a) Based on their evaluation of the registrant's disclosure controls and procedures (as defined in Rule 30a-2(c) under the Investment Company Act of 1940) as of a date within 90 days of the filing of this report, the registrant's chief financial and executive officers have concluded that the disclosure controls and procedures of the registrant are appropriately designed to ensure that information required to be disclosed in the registrant's reports that are filed under the Securities Exchange Act of 1934 are accumulated and communicated to registrant's management, including its principal executive officer(s) and principal financial officer(s), to allow timely decisions regarding required disclosure and is recorded, processed, summarized and reported, within the time periods specified in the rules and forms adopted by the Securities and Exchange Commission.
(b) There have been no significant changes in registrant's internal controls or in other factors that could significantly affect registrant's internal controls subsequent to the date of the most recent evaluation, including no significant deficiencies or material weaknesses that required corrective action.
(a)(1) Aquila Group of Funds Code of Ethics for Principal Executive and Senior Financial Officers under Section 406 of the Sarbanes-Oxley Act of 2002.
(a)(2) Certifications of principal executive officer and principal financial officer as required by Rule 30a-2(a) under the Investment Company Act of 1940.
(b) Certifications of principal executive officer and principal financial officer as required by Rule 30a-2(b) under the Investment Company Act of 1940.
SIGNATURES
Pursuant to the requirements of the Securities Exchange Act of 1934 and the Investment Company Act of 1940, the registrant has duly caused this report to be signed on its behalf by the undersigned thereunto duly authorized.
AQUILA ROCKY MOUNTAIN EQUITY FUND
By: /s/ Diana P. Herrmann
President and Trustee
March 11, 2010
By: /s/ Joseph P. DiMaggio
Chief Financial Officer and Treasurer
March 11, 2010
Pursuant to the requirements of the Securities Exchange Act of 1934 and the Investment Company Act of 1940, this report has been signed below by the following persons on behalf of the registrant and in the capacities and on the dates indicated.
By: /s/ Diana P. Herrmann
Diana P. Herrmann
President and Trustee
March 11, 2010
By: /s/ Joseph P. DiMaggio
Joseph P. DiMaggio
Chief Financial Officer and Treasurer
March 11, 2010
AQUILA ROCKY MOUNTAIN EQUITY FUND
EXHIBIT INDEX
(a)(1) Aquila Group of Funds Code of Ethics for Principal Executive and Senior Financial Officers under Section 406 of the Sarbanes-Oxley Act of 2002.
(a) (2) Certifications of principal executive officer and principal financial officer as required by Rule 30a-2(a) under the Investment Company Act of 1940.
(b) Certification of chief executive officer and chief financial officer as required by Rule 30a-2(b) of the Investment Company Act of 1940.