Balance Sheet Improvement and High Yield Metrics
We search for companies which we believe have fiscally prudent management teams that recognize they can improve their equity valuations by focusing on credit specific improvements. These measures may include improving their leverage ratios (moving debt lower versus their cash flows) and coverage ratios (moving cash flows higher versus their interest expense), as well as seeking better credit ratings, which can lead to a lower cost of capital. While these factors are not always the primary focus of many equity analysts, we believe our high yield process for finding improving bond stories leads us to these types of improving equity stories. A high percentage of stocks in the Fund have undergone fundamental balance sheet improvement and laid the groundwork for what we believe is a migration to higher stock values. This improvement could also take the form of successful refinancing in terms of new high yield deals to push maturities out, securing lower coupons and possibly removing restrictive covenants. Many of our companies have been so successful at balance sheet improvement that their debt has been upgraded to investment grade.
Since we derive our equity ideas primarily from our high yield expertise, we believe monitoring the health of the high yield market is of paramount importance. Thus, we will be highlighting important aspects of high yield on a continuing basis, as we believe it helps clarify the backdrop for the equities we own. The stocks we generally focus on have high yield balance sheets or at least some component of leverage.
Bond yields can also be an important piece of the equity valuation puzzle. From a company-specific point-of-view, it is our belief that declining bond yields can signal good opportunities to buy a company’s equity, and conversely, rising bond yields can signal credit issues and a good signal to sell a company’s equity. We monitor bond yields for all credits in the Fund, which adds another layer of depth to our differentiated stock selection process.
Important high yield metrics are as follows:
Spreads – Spreads started the year at 655 basis points (bps) and finished the year at 577 bps, a 78 bps improvement. Spreads that are moving lower are positive from a fixed income point-of-view and we believe should also be looked at positively from an equity point-of-view. Spreads ended the year approximately 50 bps wide of the historical 20-year median and remain well above the ’04-’07 timeframe, when spreads were roughly 400 bps. Although there have been selected individual months of minor spread widening, the spread picture has generally been signaling improvement from its wide level of 1,925 bps in December 2008.
MANAGEMENT DISCUSSION (continued)
Default Rate – Default activity in the high yield market has been steadily improving for the past two years. During 2010, 21 companies defaulted on $7.9 billion of bonds, which is a healthy change from 2009 when 70 companies defaulted on $94.6 billion. After starting the year at 10.23%, the default rate steadily declined to finish near a multi-year low of 0.79%. We believe the high yield market is suggesting a very strong credit profile picture, and as the default rate declines or remains low, as we expect for 2011, we would see this as yet another positive credit market signal that should be welcomed by equity investors. Another measure that we place emphasis on is the distressed ratio, or the ratio of bonds trading below 70% of par, which was only 1.9% of the market at year end, an improvement from the 4% seen at the beginning of 2010. As a leading indicator for defaults, the distressed ratio is suggesting a low rate of defaults for the immediate future and we believe this bodes well for equity valuations going forward.
New Issue Review – The high yield market experienced a record amount of new issuance during the fourth quarter, as well as 2010. For the fourth quarter, 195 issues priced for $91.3 billion while 653 issues priced for $302 billion during the full year. To put this magnitude in perspective, the previous record in 2009 was $180.2 billion in new issuance. Companies are using the low rate environment and health of high yield inflows to refinance upcoming maturities and push out maturity risk, often at favorable coupons relative to the coupons being taken out. This not only helps lower interest expense, but alleviates credit risk by removing near term maturities. Nearly 70% of new issuance activity in 2010 was for refinancing and only 8% of the new deals were CCC-rated. Such issuance helps create the backdrop for lower defaults. Due to these positive attributes, robust high yield issuance has been a positive from an equity perspective.
Performance Overview - Fourth Quarter 2010
The Russell 3000 Index was up 11.59% for the fourth quarter, driven by a strong monthly gain of 6.77% in December. The materials and energy segments led the Index’s performance for the fourth quarter, with gains of 19.03% and 22.2%, respectively. In fact, all sectors within the Index were positive for the fourth quarter, the period during which we assumed portfolio management responsibility for your Fund.
The Aquila Three Peaks Opportunity Growth Fund Class Y shares (ATGYX) posted a 12.78% return for the quarter, outperforming the Russell 3000 Index by 119 bps, driven also by a strong monthly return in December of 6.77%.
Our rigorous high yield research process, which was already in place, helps our investment team uncover what we believe to be new equity ideas. This includes company visits, frequent communication with management teams and detailed models. We believe that our high yield-focused research process, in addition to the positive economic indicators that we are seeing from the fixed income markets, provides Aquila Three Peaks Opportunity Growth Fund with a positive backdrop as we head into 2011.
PERFORMANCE REPORT
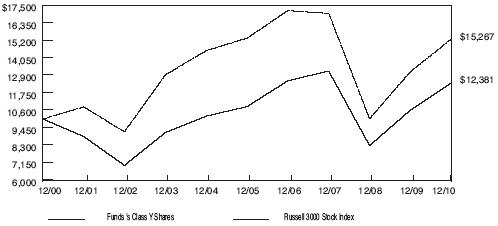
The graph below illustrates the value of $10,000 invested in Class Y Shares of Aquila Three Peaks Opportunity Growth Fund (the “Fund”) for the 10-year period ended December 31, 2010 as compared with a hypothetical similar-size investment in the Russell 3000 Stock Index (the “Index”) over the same period. In prior Annual Reports, Class A shares performance was graphed versus the Russell 2000 Stock Index. The chart below now shows Class Y shares which is consistent with the bar chart disclosure in the Fund’s prospectus. The Fund’s universe of companies was primarily within the eight-state Rocky Mountain region until October 15, 2010 when the orientation of the Fund was changed to investing primarily in the equity securities of companies located throughout the United States and the comparative index was changed. It was originally managed to provide capital appreciation through selection of equity-oriented securities primarily on a value-basis and was then reoriented to a growth at a reasonable price style as of July, 1999.
The performance of each of the other classes is not shown in the graph, but is included in the table below. It should be noted that the Index does not include operating expenses nor sales charges but does reflect reinvestment of dividends. It should also be noted that the Index is nationally-oriented and consisted, over the period covered by the graph, of an unmanaged group of 3000 equity securities throughout the United States, mostly of companies having relatively small capitalization. However, the Fund’s investment portfolio consisted over most of the period (1/1/00 - 10/14/10) of a significant lesser number of equity securities primarily of companies domiciled in the eight-state Rocky Mountain region of our country.
Prior to October 15, 2010, the market prices and behavior of the individual securities in the Fund’s investment portfolio could have been affected by local and regional factors which might have resulted in variances from the market action of the securities in the Index. Furthermore, the difference in the performance in the Index versus the Fund may also be attributed to the lack of application of annual operating expenses and sales charges to the Index. These returns represent results under the Fund’s prior investment strategies and various portfolio managers in effect from inception in 1993 through October 14, 2010, under the name, “Aquila Rocky Mountain Equity Fund.” They should not be considered predictive or representative of results the Fund may experience under its new strategy and investment sub-adviser.
| | | | | | | | | | | | | |
| PERFORMANCE REPORT (continued) | |
| | |
| | | Average Annual Total Return for periods ended December 31, 2010 | |
| | | | | | | | | | | | Since | |
| Class and Inception Date | | 1 Year | | | 5 Years | | | 10 Years | | | Inception | |
| Class A (commenced operations on 7/22/94) | | | | | | | | | | | | |
| With Maximum Sales Charge | | | 11.14 | % | | | (1.20 | )% | | | 3.60 | % | | | 6.27 | % |
| Without Sales Charge | | | 16.08 | | | | (0.34 | ) | | | 4.05 | | | | 6.59 | |
| Class C (commenced operations on 5/01/96) | | | | | | | | | | | | | | | | |
| With CDSC | | | 14.19 | | | | (1.09 | ) | | | 3.27 | | | | 4.84 | |
| Without CDSC | | | 15.19 | | | | (1.09 | ) | | | 3.27 | | | | 4.84 | |
| Class I (commenced operations on 12/01/05) | | | | | | | | | | | | | | | | |
| No Sales Charge | | | 16.52 | | | | (0.03 | ) | | | N/A | | | | (0.55 | ) |
| Class Y (commenced operations on 5/01/96) | | | | | | | | | | | | | | | | |
| No Sales Charge | | | 16.39 | | | | (0.08 | ) | | | 4.32 | | | | 5.83 | |
Russell 3000 Stock Index(1) | | | 16.93 | | | | 2.74 | | | | 2.16 | | | | N/A | * (Class A) |
| | | | | | | | | | | | | | | | 6.64 | (Class C&Y) |
| | | | | | | | | | | | | | | | 2.61 | (Class I) |
(1) Effective October 15, 2010, the Russell 3000 is deemed to be the Fund’s primary index.
* Index commenced on 1/01/95.
Total return figures shown for the Fund reflect any change in price and assume all distributions within the period were invested in additional shares. Returns for Class A shares are calculated with and without the effect of the initial 4.25% maximum sales charge. Returns for Class C shares are calculated with and without the effect of the 1% contingent deferred sales charge (CDSC) imposed on redemptions made within the first 12 months after purchase. Class I and Y shares are sold without any sales charge. The rates of return will vary and the principal value of an investment will fluctuate with market conditions. Shares, if redeemed, may be worth more or less than their original cost. Past performance is not predictive of future investment results.
REPORT OF INDEPENDENT REGISTERED PUBLIC ACCOUNTING FIRM
To the Board of Trustees and Shareholders of
Aquila Three Peaks Opportunity Growth Fund:
We have audited the accompanying statement of assets and liabilities, including the schedule of investments, of Aquila Three Peaks Opportunity Growth Fund (formerly Aquila Rocky Mountain Equity Fund) as of December 31, 2010 and the related statement of operations for the year then ended, the statements of changes in net assets for each of the two years in the period then ended, and the financial highlights for each of the five years in the period then ended. These financial statements and financial highlights are the responsibility of the Fund’s management. Our responsibility is to express an opinion on these financial statements and financial highlights based on our audits.
We conducted our audits in accordance with the standards of the Public Company Accounting Oversight Board (United States). Those standards require that we plan and perform the audit to obtain reasonable assurance about whether the financial statements and financial highlights are free of material misstatement. The Fund is not required to have, nor were we engaged to perform, an audit of the Fund’s internal control over financial reporting. Our audits included consideration of internal control over financial reporting as a basis for designing audit procedures that are appropriate in the circumstances, but not for the purpose of expressing an opinion on the effectiveness of the Fund’s internal control over financial reporting. Accordingly, we express no such opinion. An audit also includes examining, on a test basis, evidence supporting the amounts and disclosures in the financial statements. Our procedures included confirmation of securities owned as of December 31, 2010, by correspondence with the custodian and brokers or by other appropriate auditing procedures where replies from brokers were not received. An audit also includes assessing the accounting principles used and significant estimates made by management, as well as evaluating the overall financial statement presentation. We believe that our audits provide a reasonable basis for our opinion.
In our opinion, the financial statements and financial highlights referred to above present fairly, in all material respects, the financial position of Aquila Three Peaks Opportunity Growth Fund as of December 31, 2010, the results of its operations for the year then ended, the changes in its net assets for each of the two years in the period then ended, and the financial highlights for each of the five years in the period then ended, in conformity with accounting principles generally accepted in the United States of America.
TAIT, WELLER & BAKER LLP
Philadelphia, Pennsylvania
February 25, 2011
| | | | | | |
| | | AQUILA THREE PEAKS OPPORTUNITY GROWTH FUND | | | |
| | | SCHEDULE OF INVESTMENTS | | | |
| | | DECEMBER 31, 2010 | | | |
| | |
| | | | | Market | |
| Shares | | Common Stocks (96.8%) | | Value | |
| | | Advertising Agencies (0.8%) | | | |
| | 11,215 | | Interpublic Group of Companies+ | | $ | 119,103 | |
| | | | Apparel Manufacturers (1.3%) | | | | |
| | 7,417 | | Hanesbrands, Inc.+ | | | 188,392 | |
| | | | Beverages - Wine/Spirits (2.1%) | | | | |
| | 13,617 | | Constellation Brands, Inc.+ | | | 301,617 | |
| | | | Broadcast Service/Programming (0.5%) | | | | |
| | 1,086 | | Liberty Media Corp. - Capital+ | | | 67,940 | |
| | | | Cable/Satellite TV (4.7%) | | | | |
| | 11,933 | | DIRECTV+ | | | 476,485 | |
| | 9,251 | | Dish Network Corp. (Series A) | | | 181,875 | |
| | | | | | | 658,360 | |
| | | | Cellular Telecommunications (0.6%) | | | | |
| | 19,608 | | Sprint Nextel Corp.+ | | | 82,942 | |
| | | | Coal (2.4%) | | | | |
| | 4,350 | | Arch Coal, Inc | | | 152,511 | |
| | 1,214 | | CONSOL Energy, Inc | | | 59,170 | |
| | 2,081 | | Peabody Energy Corp | | | 133,142 | |
| | | | | | | 344,823 | |
| | | | Commercial Services (1.8%) | | | | |
| | 10,114 | | Iron Mountain, Inc | | | 252,951 | |
| | | | Consumer Products - Miscellaneous (0.9%) | | | | |
| | 4,124 | | Jarden Corp | | | 127,308 | |
| | | | Containers - Metal/Glass (9.9%) | | | | |
| | 5,435 | | Ball Corp | | | 369,852 | |
| | 18,613 | | Crown Holdings, Inc.+ | | | 621,302 | |
| | 8,285 | | Owens - Illinois, Inc.+ | | | 254,350 | |
| | 4,384 | | Silgan Holdings, Inc | | | 156,991 | |
| | | | | | | 1,402,495 | |
| | | | Containers - Paper/Plastic (2.0%) | | | | |
| | 13,303 | | Graham Packaging Co., Inc.+ | | | 173,471 | |
| | 2,091 | | Rock - Tenn Co | | | 112,809 | |
| | | | | | | 286,280 | |
| | | | Dialysis Centers (0.7%) | | | | |
| | 1,421 | | DaVita, Inc.+ | | | 98,745 | |
| | | | | | |
| | | AQUILA THREE PEAKS OPPORTUNITY GROWTH FUND | | | |
| | | SCHEDULE OF INVESTMENTS (continued) | | | |
| | | DECEMBER 31, 2010 | | | |
| | |
| | | | | Market | |
| Shares | | Common Stocks (continued) | | Value | |
| | | E-Commerce Services (0.8%) | | | |
| | 7,532 | | Liberty Media Corporation-Interactive+ | | $ | 118,780 | |
| | | | Electronic Components - Miscellaneous (2.6%) | | | | |
| | 20,595 | | Celestica, Inc.+ | | | 199,771 | |
| | 21,987 | | Flextronics International Ltd.+ | | | 172,598 | |
| | | | | | | 372,369 | |
| | | | Electronic Components - Semiconductor (3.8%) | | | | |
| | 19,634 | | Amkor Technology, Inc.+ | | | 145,095 | |
| | 13,803 | | Avago Technologies Ltd | | | 392,971 | |
| | | | | | | 538,066 | |
| | | | Food - Canned (0.9%) | | | | |
| | 2,498 | | Treehouse Foods, Inc.+ | | | 127,623 | |
| | | | Food - Retail (2.9%) | | | | |
| | 11,745 | | Ingles Markets, Inc. Class A | | | 225,504 | |
| | 18,659 | | SuperValu, Inc | | | 179,686 | |
| | | | | | | 405,190 | |
| | | | Funeral Services & Related Items (3.6%) | | | | |
| | 38,349 | | Service Corp. International | | | 316,379 | |
| | 28,390 | | Stewart Enterprises, Inc. Class A | | | 189,929 | |
| | | | | | | 506,308 | |
| | | | Hotels & Motels (0.7%) | | | | |
| | 1,622 | | Starwood Hotels & Resorts | | | 98,585 | |
| | | | Intimate Apparel (1.6%) | | | | |
| | 3,986 | | Warnaco Group, Inc. (The)+ | | | 219,509 | |
| | | | Medical - Biomedical/Gene (1.3%) | | | | |
| | 1,719 | | Bio-Rad Laboratories, Inc.+ | | | 178,518 | |
| | | | Medical - Hospitals (4.1%) | | | | |
| | 15,339 | | Community Health Systems, Inc.+ | | | 573,218 | |
| | | | Medical Instruments (0.8%) | | | | |
| | 1,499 | | Beckman Coulter, Inc | | | 112,770 | |
| | | | Medical Products (6.0%) | | | | |
| | 6,554 | | Cooper Companies, Inc | | | 369,252 | |
| | 22,781 | | Hanger Orthopedic Group, Inc.+ | | | 482,729 | |
| | | | | | | 851,981 | |
| | | | | | |
| | | AQUILA THREE PEAKS OPPORTUNITY GROWTH FUND | | | |
| | | SCHEDULE OF INVESTMENTS (continued) | | | |
| | | DECEMBER 31, 2010 | | | |
| | |
| | | | | Market | |
| Shares | | Common Stocks (continued) | | Value | |
| | | Non-Hazardous Waste Disposal (2.1%) | | | |
| | 10,001 | | Republic Services, Inc | | $ | 298,630 | |
| | | | Oil Company - Exploration & Production (6.1%) | | | | |
| | 4,768 | | Berry Petroleum Co | | | 208,362 | |
| | 4,674 | | Bill Barrett Corp.+ | | | 192,242 | |
| | 6,349 | | Denbury Resources, Inc.+ | | | 121,202 | |
| | 8,451 | | Petrohawk Energy Corp.+ | | | 154,231 | |
| | 4,098 | | Range Resources Corp | | | 184,328 | |
| | | | | | | 860,365 | |
| | | | Pipelines (0.8%) | | | | |
| | 8,000 | | El Paso Corp | | | 110,080 | |
| | | | Printing/Commercial (0.9%) | | | | |
| | 3,988 | | Valassis Communications, Inc.+ | | | 129,012 | |
| | | | Private Corrections (4.1%) | | | | |
| | 23,177 | | Corrections Co | | | 580,816 | |
| | | | Real Estate Investment Trust-Hotels (2.4%) | | | | |
| | 29,942 | | Felcor Lodging Trust, Inc.+ | | | 210,792 | |
| | 7,235 | | Host Hotels & Resorts, Inc | | | 129,289 | |
| | | | | | | 340,081 | |
| | | | Rental - Auto/Equipment (1.7%) | | | | |
| | 10,394 | | United Rentals, Inc.+ | | | 236,463 | |
| | | | Resorts/Theme Parks (2.2%) | | | | |
| | 5,931 | | Vail Resorts, Inc.+ | | | 308,649 | |
| | | | Retail - Apparel/Shoe (0.4%) | | | | |
| | 947 | | Phillips-Van Heusen Corp | | | 59,670 | |
| | | | Satellite Telecommunications (2.5%) | | | | |
| | 8,233 | | GeoEye, Inc.+ | | | 348,997 | |
| | | | Telecom Services (1.2%) | | | | |
| | 9,567 | | tw telecom holdings, inc.+ | | | 163,117 | |
| | | | Telephone - Integrated (6.9%) | | | | |
| | 11,568 | | Frontier Communications Corp | | | 112,557 | |
| | 89,282 | | Qwest Communications International | | | 679,436 | |
| | 12,908 | | Windstream Corp | | | 179,938 | |
| | | | | | | 971,931 | |
| | | | | | | | | |
| | | AQUILA THREE PEAKS OPPORTUNITY GROWTH FUND SCHEDULE OF INVESTMENTS (continued) | | | | |
| | |
| | | | | | | | Market | |
| Shares | | Common Stocks (continued) | | | | | Value | |
| | | Theaters (1.7%) | | | | | | |
| | 7,374 | | Cinemark Holdings, Inc | | | | | $ | 127,128 | |
| | 8,974 | | Regal Entertainment Group Class A | | | | | | 105,355 | |
| | | | | | | | | | 232,483 | |
| | | | Transport - Rail (1.2%) | | | | | | | |
| | 3,632 | | Kansas City Southern+ | | | | | | 173,828 | |
| | | | Water Treatment Systems (1.5%) | | | | | | | |
| | 6,406 | | Nalco Holding Co | | | | | | 204,608 | |
| | | | Wireless Equipment (4.3%) | | | | | | | |
| | 6,106 | | American Tower Corp.+ | | | | | | 315,314 | |
| | 6,599 | | Crown Castle International Corp.+ | | | | | | 289,234 | |
| | | | | | | | | | 604,548 | |
| | |
| | | | Total Investments (cost $13,043,419*) | | 96.8 | % | | | 13,657,151 | |
| | | | Other assets less liabilities | | 3.2 | | | | 452,598 | |
| | | | Net Assets | | 100.0 | % | | $ | 14,109,749 | |
| | * Cost for Federal income tax and financial reporting purposes is identical. | |
| | + Non-income producing security. | |
| | | | | | | | | |
| AQUILA THREE PEAKS OPPORTUNITY GROWTH FUND | |
| SCHEDULE OF INVESTMENTS (continued) | |
| DECEMBER 31, 2010 | |
| | |
| Portfolio | | Percent of | | | Portfolio | | Percent of | |
| Distribution (unaudited) | | Investments | | | Distribution (unaudited) | | Investments | |
| Advertising Agencies | | | 0.9 | % | | Intimate Apparel | | | 1.6 | % |
| Apparel Manufacturers | | | 1.4 | | | Medical - Biomedical/Gene | | | 1.3 | |
| Beverage - Wine/Spirits | | | 2.2 | | | Medical - Hospitals | | | 4.2 | |
| Broadcast Service/Programming | | | 0.5 | | | Medical Instruments | | | 0.8 | |
| Cable/Satellite TV | | | 4.8 | | | Medical Products | | | 6.2 | |
| Cellular Telecommunications | | | 0.6 | | | Non-Hazardous Waste Disposal | | | 2.2 | |
| Coal | | | 2.5 | | | Oil Company - Exploration & | | | | |
| Commercial Services | | | 1.9 | | | Production | | | 6.3 | |
| Consumer Products- | | | | | | Pipelines | | | 0.8 | |
| Miscellaneous | | | 0.9 | | | Printing/Commercial | | | 1.0 | |
| Containers - Metal/Glass | | | 10.3 | | | Private Corrections | | | 4.3 | |
| Containers - Paper/Plastic | | | 2.1 | | | Real Estate Investment Trust - Hotels | | | 2.5 | |
| Dialysis Centers | | | 0.7 | | | Rental - Auto/Equipment | | | 1.7 | |
| E-Commerce Services | | | 0.9 | | | Resorts/Theme Parks | | | 2.3 | |
| Electronic - Components- | | | | | | Retail - Apparel/Shoe | | | 0.4 | |
| Miscellaneous | | | 2.7 | | | Satellite Telecommunications | | | 2.6 | |
| Electronic Components- | | | | | | Telecom Services | | | 1.2 | |
| Semiconductor | | | 3.9 | | | Telephone - Integrated | | | 7.1 | |
| Food - Canned | | | 0.9 | | | Theaters | | | 1.7 | |
| Food - Retail | | | 3.0 | | | Transport - Rail | | | 1.3 | |
| Funeral Service & Related Items | | | 3.7 | | | Water Treatment Systems | | | 1.5 | |
| Hotels & Motels | | | 0.7 | | | Wireless Equipment | | | 4.4 | |
| | | | | | | | | | 100.0 | % |
See accompanying notes to financial statements.
| | | | |
| AQUILA THREE PEAKS OPPORTUNITY GROWTH FUND | |
| STATEMENT OF ASSETS AND LIABILITIES | |
| DECEMBER 31, 2010 | |
| | |
| ASSETS | | | |
| Investments at market value (cost $13,043,419) | | $ | 13,657,151 | |
| Cash | | | 472,986 | |
| Receivable for Fund shares sold | | | 244,990 | |
| Receivable from Manager | | | 102,309 | |
| Dividends receivable | | | 7,049 | |
| Other assets | | | 758 | |
| Total assets | | | 14,485,243 | |
| LIABILITIES | | | | |
| Payable for investment securities purchased | | | 301,485 | |
| Payable for Fund shares redeemed | | | 48,471 | |
| Distribution and service fees payable | | | 45 | |
| Accrued expenses | | | 25,493 | |
| Total liabilities | | | 375,494 | |
| NET ASSETS | | $ | 14,109,749 | |
| Net Assets consist of: | | | | |
| Capital Stock - Authorized an unlimited number of shares, par value $0.01 per share | | $ | 5,292 | |
| Additional paid-in capital | | | 11,526,353 | |
| Net unrealized appreciation on investments (note 4) | | | 613,732 | |
| Accumulated net realized gain on investments | | | 1,964,372 | |
| | | $ | 14,109,749 | |
| CLASS A | | | | |
| Net Assets | | $ | 10,052,857 | |
| Capital shares outstanding | | | 377,363 | |
| Net asset value and redemption price per share | | $ | 26.64 | |
| Maximum offering price per share (100/95.75 of $26.64 adjusted to nearest cent) | | $ | 27.82 | |
| CLASS C | | | | |
| Net Assets | | $ | 854,846 | |
| Capital shares outstanding | | | 35,896 | |
| Net asset value and offering price per share | | $ | 23.81 | |
| Redemption price per share (*a charge of 1% is imposed on the redemption | | | | |
| proceeds of the shares, or on the original price, whichever is lower, if redeemed | | | | |
| during the first 12 months after purchase) | | $ | 23.81 | * |
| CLASS I | | | | |
| Net Assets | | $ | 23,861 | |
| Capital shares outstanding | | | 881 | |
| Net asset value, offering and redemption price per share | | $ | 27.08 | |
| CLASS Y | | | | |
| Net Assets | | $ | 3,178,185 | |
| Capital shares outstanding | | | 115,020 | |
| Net asset value, offering and redemption price per share | | $ | 27.63 | |
See accompanying notes to financial statements.
| | | | | | | |
| AQUILA THREE PEAKS OPPORTUNITY GROWTH FUND | |
| STATEMENT OF OPERATIONS | |
| YEAR ENDED DECEMBER 31, 2010 | |
| | |
| Investment Income: | | | | | | |
| | |
| Dividends | | | | | $ | 97,002 | |
| | |
| Expenses: | | | | | | | |
| | |
| Management fee (note 3) | | $ | 115,043 | | | | | |
| Distribution and service fees (note 3) | | | 24,110 | | | | | |
| Legal fees (note 3) | | | 265,336 | | | | | |
| Trustees’ fees and expenses | | | 83,824 | | | | | |
| Registration fees and dues | | | 52,844 | | | | | |
| Shareholders’ reports and proxy statements | | | 32,361 | | | | | |
| Transfer and shareholder servicing agent fees (note 3) | | | 30,397 | | | | | |
| Auditing and tax fees | | | 15,750 | | | | | |
| Chief compliance officer (note 3) | | | 4,508 | | | | | |
| Custodian fees (note 5) | | | 2,989 | | | | | |
| Fund accounting fees | | | 557 | | | | | |
| Insurance | | | 482 | | | | | |
| Miscellaneous | | | 25,225 | | | | | |
| Total expenses | | | 653,426 | | | | | |
| | |
| Management fee waived (note 3) | | | (115,043 | ) | | | | |
| Reimbursement of expenses by Manager (note 3) | | | (408,005 | ) | | | | |
| Class A distribution fee waiver (note 3) | | | (765 | ) | | | | |
| Expenses paid indirectly (note 5) | | | (35 | ) | | | | |
| Net expenses | | | | | | | 129,578 | |
| | |
| Net investment loss | | | | | | | (32,576 | ) |
| | |
| Realized and Unrealized Gain (Loss) on Investments: | | | | | | | | |
| | |
| Net realized gain (loss) from securities transactions | | | 2,235,957 | | | | | |
| Change in unrealized appreciation on investments | | | (978,191 | ) | | | | |
| | |
| Net realized and unrealized gain (loss) on investments | | | | | | | 1,257,766 | |
| Net change in net assets resulting from operations | | | | | | $ | 1,225,190 | |
See accompanying notes to financial statements.
| | | | | | | |
| AQUILA THREE PEAKS OPPORTUNITY GROWTH FUND | |
| STATEMENTS OF CHANGES IN NET ASSETS | |
| | |
| | | Year Ended | | | Year Ended | |
| | | December 31, 2010 | | | December 31, 2009 | |
| OPERATIONS: | | | | | | |
| Net investment loss | | $ | (32,576 | ) | | $ | (30,401 | ) |
| Net realized gain (loss) from securities transactions | | | 2,235,957 | | | | (42,554 | ) |
| Change in unrealized appreciation (depreciation) on investments | | | (978,191 | ) | | | 2,673,221 | |
| Change in net assets from operations | | | 1,225,190 | | | | 2,600,266 | |
| | |
| DISTRIBUTIONS TO SHAREHOLDERS (note 8): | | | | | | | | |
| Class A Shares: | | | | | | | | |
| Net realized gain on investments | | | – | | | | – | |
| | |
| Class C Shares: | | | | | | | | |
| Net realized gain on investments | | | – | | | | – | |
| | |
| Class I Shares: | | | | | | | | |
| Net realized gain on investments | | | – | | | | – | |
| | |
| Class Y Shares: | | | | | | | | |
| Net realized gain on investments | | | – | | | | – | |
| Change in net assets from distributions | | | – | | | | – | |
| | |
| CAPITAL SHARE TRANSACTIONS (note 7): | | | | | | | | |
| Proceeds from shares sold | | | 7,385,425 | | | | 487,944 | |
| Short-term trading redemption fee | | | 556 | | | | 42 | |
| Cost of shares redeemed | | | (4,275,826 | ) | | | (3,640,426 | ) |
| Change in net assets from capital share transactions | | | 3,110,155 | | | | (3,152,440 | ) |
| | |
| Change in net assets | | | 4,335,345 | | | | (552,174 | ) |
| | |
| NET ASSETS: | | | | | | | | |
| Beginning of period | | | 9,774,404 | | | | 10,326,578 | |
| | |
| End of period | | $ | 14,109,749 | | | $ | 9,774,404 | |
See accompanying notes to financial statements.
| |
| AQUILA THREE PEAKS OPPORTUNITY GROWTH FUND |
| NOTES TO FINANCIAL STATEMENTS |
| DECEMBER 31, 2010 |
1. Organization
Aquila Three Peaks Opportunity Growth Fund (the “Fund”), a diversified, open-end investment company, was organized as a Massachusetts business trust. The Fund was originally organized on November 3, 1993 under the name Aquila Rocky Mountain Equity Fund (“ARMEF”) and commenced operations on July 22, 1994. From that date through October 14, 2010, ARMEF’s universe of companies was primarily within the eight-state Rocky Mountain region. The Fund now invests primarily in the equity securities of companies located throughout the United States. On October 15, 2010, the Fund began its operations under its current name with a new and expanded investment strategy that continues to seek capital appreciation.
The Fund is authorized to issue an unlimited number of shares and offers four classes of shares, Class A, Class C, Class I and Class Y Shares. Class A Shares are sold at net asset value plus a sales charge (of varying size depending upon a variety of factors) paid at the time of purchase and bear a distribution fee. Class C Shares are sold at net asset value with no sales charge payable at the time of purchase but with a level charge for service and distribution fees for six years thereafter. Class C Shares automatically convert to Class A Shares after six years. Class Y Shares are sold only through institutions acting for investors in a fiduciary, advisory, agency, custodial or similar capacity, and are not offered directly to retail customers. Class Y Shares are sold at net asset value with no sales charge, no redemption fee, no contingent deferred sales charge (“CDSC”) and no distribution fee. Class I Shares are offered and sold only through financial intermediaries and are not offered directly to retail customers. Class I Shares are sold at net asset value with no sales charge and no redemption fee or CDSC, although a financial intermediary may charge a fee for effecting a purchase or other transaction on behalf of its customers. Class I Shares may carry a distribution and a service fee. All classes of shares represent interests in the same portfolio of investments and are identical as to rights and privileges but differ with respect to the effect of sales charges, the distribution and/or service fees borne by each class, expenses specific to each class, voting rights on matters affecting a single class and the exchange privileges of each class.
2. Significant Accounting Policies
The following is a summary of significant accounting policies followed by the Fund in the preparation of its financial statements. The policies are in conformity with accounting principles generally accepted in the United States of America for investment companies.
| a) | Portfolio valuation: Securities listed on a national securities exchange or designated as national market system securities are valued at the last sale price on such exchanges or market system. Securities listed only on NASDAQ are valued in accordance with the NASDAQ Official Closing Price. Securities for which market quotations are not readily available are valued at fair value as determined in good faith by or at the direction of the Board of Trustees. Short-term investments maturing in 60 days or less are valued at amortized cost. |
| |
| AQUILA THREE PEAKS OPPORTUNITY GROWTH FUND |
| NOTES TO FINANCIAL STATEMENTS (continued) |
| DECEMBER 31, 2010 |
| b) | Fair Value Measurements: The Fund follows a fair value hierarchy that distinguishes between market data obtained from independent sources (observable inputs) and the Fund’s own market assumptions (unobservable inputs). These inputs are used in determining the value of the Fund’s investments and are summarized in the following fair value hierarchy: |
Level 1 – Unadjusted quoted prices in active markets for identical assets or liabilities that the Fund has the ability to access.
Level 2 – Observable inputs other than quoted prices included in Level 1 that are observable for the asset or liability, either directly or indirectly. These inputs may include quoted prices for the identical instrument on an inactive market, prices for similar instruments, interest rates, prepayment speeds, credit risk, yield curves, default rates and similar data.
Level 3 – Unobservable inputs for the asset or liability, to the extent relevant observable inputs are not available, representing the Fund’s own assumptions about the assumptions a market participant would use in valuing the asset or liability, and would be based on the best information available.
The inputs or methodology used for valuing securities are not an indication of the risk associated with investing in those securities.
The following is a summary of the valuation inputs, representing 100% of the Fund’s investments, used to value the Fund’s net assets as of December 31, 2010:
| | | | |
| Valuation Inputs | | | Investments in Securities | |
| Level 1 – Quoted Prices – Common Stocks* | | $ | 13,657,151 | |
| Level 2 – Other Significant Observable Inputs | | | — | |
| Level 3 – Significant Unobservable Inputs | | | — | |
| Total | | $ | 13,657,151 | |
* See schedule of investments for a detailed listing of securities.
| c) | Subsequent events: In preparing these financial statements, the Fund has evaluated events and transactions for potential recognition or disclosure through the date these financial statements were issued. |
| d) | Securities transactions and related investment income: Securities transactions are recorded on the trade date. Realized gains and losses from securities transactions are reported on the identified cost basis. Dividend income is recorded on the ex-dividend date. Interest income is recorded daily on the accrual basis. |
| e) | Federal income taxes: It is the policy of the Fund to continue to qualify as a regulated investment company by complying with the provisions of the Internal Revenue Code applicable to certain investment companies. The Fund intends to make distributions of income and securities profits sufficient to relieve it from all, or substantially all, Federal income and excise taxes. |
| |
| AQUILA THREE PEAKS OPPORTUNITY GROWTH FUND |
| NOTES TO FINANCIAL STATEMENTS (continued) |
| DECEMBER 31, 2010 |
Management has reviewed the tax positions for each of the open tax years (2007-2009) or expected to be taken in the Fund’s 2010 tax returns and has concluded that there are no significant uncertain tax positions that would require recognition in the financial statements.
| f) | Multiple class allocations: All income, expenses (other than class-specific expenses), and realized and unrealized gains or losses are allocated daily to each class of shares based on the relative net assets of each class. Class-specific expenses, which include distribution and service fees and any other items that are specifically attributed to a particular class, are also charged directly to such class on a daily basis. |
| g) | Use of estimates: The preparation of financial statements in conformity with accounting principles generally accepted in the United States of America requires management to make estimates and assumptions that affect the reported amounts of assets and liabilities and disclosure of contingent assets and liabilities at the date of the financial statements and the reported amounts of increases and decreases in net assets from operations during the reporting period. Actual results could differ from those estimates. |
| h) | Reclassification of capital accounts: Accounting principles generally accepted in the United States of America require that certain components of net assets relating to permanent differences be reclassified between financial and tax reporting. On December 31, 2010 the Fund decreased undistributed net investment loss by $32,576, decreased accumulated net gain on investments by $213,147 and increased additional paid-in capital by $180,571. These reclassifications were due to a net investment loss and tax equalization and had no effect on net assets or net asset value per share. |
| i) | Accounting pronouncement: In January 2010, the Financial Accounting Standards Board (“FASB”) issued Accounting Standards Update “Improving Disclosures about Fair Value Measurements” (“ASU”). The ASU requires enhanced disclosures about a) transfers into and out of Levels 1 and 2, and b) purchases, sales, issuances, and settlements on a gross basis relating to Level 3 measurements. The first disclosure became effective for the first reporting period beginning after December 15, 2009, and for interim periods within those fiscal years. There were no significant transfers into and out of Levels 1 and 2 during the current period presented. |
The second disclosure will become effective for fiscal year ends beginning after December 15, 2010, and for interim periods within those fiscal years. Management has evaluated the impact and has incorporated the appropriate disclosures required by the ASU in its financial statement disclosures.
3. Fees and Related Party Transactions
a) Management Arrangements:
Aquila Investment Management LLC (the “Manager”), a wholly-owned subsidiary of Aquila Management Corporation, the Fund’s founder and sponsor, serves as the Manager for the Fund under an Advisory and Administration Agreement with the Fund. The portfolio management of the Fund has been delegated to a Sub-Adviser as described below. Under the Advisory and Administrative Agreement, the
| |
| AQUILA THREE PEAKS OPPORTUNITY GROWTH FUND |
| NOTES TO FINANCIAL STATEMENTS (continued) |
| DECEMBER 31, 2010 |
Manager provides all administrative services to the Fund, other than those relating to the day-to-day portfolio management. The Manager’s services include providing the office of the Fund and all related services as well as overseeing the activities of the Sub-Adviser and all the various support organizations to the Fund such as the shareholder servicing agent, custodian, legal counsel, fund accounting agent, auditors and distributor. For its services, beginning October 15, 2010, the Manager is entitled to receive a fee which is payable monthly and computed as of the close of business each day at the annual rate of 0.90 of 1% on the Fund’s net assets up to $100 million, 0.85 of 1% on such assets above $100 million up to $250 million, and 0.80% of 1% on assets above $250 million. Prior to October 15, 2010, the Manager supervised the investments of the Fund and the composition of its portfolio, arranged for the purchases and sales of portfolio securities and provided for daily pricing of the Fund’s portfolio at the following annual rates based on the Fund’s net assets at the close of each business day: 1.50% on the first $15 million; 1.20% on the next $35 million and 0.90% on the excess over $50 million.
Three Peaks Capital Management, LLC (the “Sub-Adviser”) serves as the Investment Sub-Adviser for the Fund under a Sub-Advisory Agreement between the Manager and the Sub-Adviser. Under this agreement, the Sub-Adviser continuously provides, subject to oversight of the Manager and the Board of Trustees of the Fund, the investment program of the Fund and the composition of its portfolio and arranges for the purchases and sales of portfolio securities. For its services, the Sub-Adviser is entitled to receive a fee from the Manager which is payable monthly and computed as of the close of business each day at the annual rate of 0.50 of 1% on the Fund’s net assets up to $100 million, 0.45 of 1% on such assets above $100 million up to $250 million, and 0.40 of 1% on assets above $250 million.
For the year ended December 31, 2010, the Fund incurred management fees of $115,043, all of which was waived. Additionally, during this period the Manager reimbursed the Fund for other expenses in the amount of $408,005. The Manager has contractually undertaken to waive fees and/or reimburse Fund expenses during the period January 1, 2010 through October 15, 2011 so that total Fund expenses will not exceed 1.50% for Class A Shares, 2.25% for Class C Shares, 1.18% for Class I Shares and 1.25% for Class Y Shares. The Sub-Adviser has agreed to waive its fee in the same proportion as the Manager is required to waive its fee in connection with the aforementioned undertaking. Beginning in fiscal 2011, for a period of three years, subsequent to the end of each of the Fund’s fiscal years, the Manager may recover from the Fund certain fees and expenses waived or reimbursed subject to contractual limitations.
Under a Compliance Agreement with the Manager, the Manager is compensated for Chief Compliance Officer related services provided to enable the Fund to comply with Rule 38a-1 of the Investment Company Act of 1940.
Specific details as to the nature and extent of the services provided by the Manager are more fully defined in the Fund’s Prospectus and Statement of Additional Information.
| |
| AQUILA THREE PEAKS OPPORTUNITY GROWTH FUND |
| NOTES TO FINANCIAL STATEMENTS (continued) |
| DECEMBER 31, 2010 |
b) Distribution and Service Fees:
The Fund has adopted a Distribution Plan (the “Plan”) pursuant to Rule 12b-1 (the “Rule”) under the Investment Company Act of 1940. Under one part of the Plan, with respect to Class A Shares, the Fund is authorized to make distribution fee payments to broker-dealers or others (“Qualified Recipients”) selected by Aquila Distributors, Inc. (the “Distributor”), including, but not limited to, any principal underwriter of the Fund, with which the Distributor has entered into written agreements contemplated by the Rule and which have rendered assistance in the distribution and/or retention of the Fund’s shares or servicing of shareholder accounts. The Fund makes payment of this distribution fee at the annual rate of 0.30% of the Fund’s average net assets represented by Class A Shares. During the period of October 15, 2010 to October 15, 2011, 0.05% of the fee has been and will continue to be waived. Prior to October 15, 2010 ARMEF made payment of this distribution fee at the annual rate of 0.25%. For the year ended December 31, 2010, distribution fees on Class A Shares amounted to $19,135 of which the Distributor retained $2,698.
Under another part of the Plan, the Fund is authorized to make payments with respect to Class C Shares to Qualified Recipients which have rendered assistance in the distribution and/or retention of the Fund’s Class C shares or servicing of shareholder accounts. These payments are made at the annual rate of 0.75% of the Fund’s average net assets represented by Class C Shares and for the year ended December 31, 2010, amounted to $3,715. In addition, under a Shareholder Services Plan, the Fund is authorized to make service fee payments with respect to Class C Shares to Qualified Recipients for providing personal services and/or maintenance of shareholder accounts. These payments are made at the annual rate of 0.25% of the Fund’s average net assets represented by Class C Shares and for the year ended December 31, 2010, amounted to $1,239. The total of these payments with respect to Class C Shares amounted to $4,954 of which the Distributor retained $1,148.
Under another part of the Plan, the Fund is authorized to make payments with respect to Class I Shares to Qualified Recipients. Class I payments, under the Plan, may not exceed, for any fiscal year of the Fund a rate (currently 0.20%) set from time to time by the Board of Trustees of not more than 0.25% of the average annual net assets represented by the Class I Shares. In addition, the Fund has a Shareholder Services Plan under which it may pay service fees (currently 0.15%) of not more than 0.25% of the average annual net assets of the Fund represented by Class I Shares. That is, the total payments under both plans will not exceed 0.50% of such net assets. For the year ended December 31, 2010, these payments were made at the average annual rate of 0.35% of such net assets and amounted to $37 of which $21 related to the Plan and $16 related to the Shareholder Services Plan.
Specific details about the Plans are more fully defined in the Fund’s Prospectus and Statement of Additional Information.
Under a Distribution Agreement, the Distributor serves as the exclusive distributor of the Fund’s shares. Through agreements between the Distributor and various brokerage and advisory firms
| |
| AQUILA THREE PEAKS OPPORTUNITY GROWTH FUND |
| NOTES TO FINANCIAL STATEMENTS (continued) |
| DECEMBER 31, 2010 |
(“intermediaries”), the Fund’s shares are sold primarily through the facilities of intermediaries, with the bulk of any sales commissions inuring to such intermediaries. For the year ended December 31, 2010, total commissions on sales of Class A Shares amounted to $51,773 of which the Distributor received $4,550.
c) Other Related Party Transactions:
For the year ended December 31, 2010, the Fund incurred $265,317 of legal fees allocable to Butzel Long PC, counsel to the Fund, for legal services in conjunction with the Fund’s ongoing operations and proxy. These fees included extraordinary one-time expenses in connection with the change in the Fund’s investment strategy. The Secretary of the Fund is Of Counsel to that firm.
4. Purchases and Sales of Securities
During the year ended December 31, 2010, purchases of securities and proceeds from the sales of securities (excluding short-term investments) aggregated $12,854,664 and $9,801,759, respectively.
At December 31, 2010, the aggregate tax cost for all securities was $13,043,419. At December 31, 2010, the aggregate gross unrealized appreciation for all securities in which there is an excess of market value over tax cost amounted to $777,742 and aggregate gross unrealized depreciation for all securities in which there is an excess of tax cost over market value amounted to $164,010 for a net unrealized appreciation of $613,732.
5. Expenses
The Fund has negotiated an expense offset arrangement with its custodian wherein it receives credit toward the reduction of custodian fees and other Fund expenses whenever there are uninvested cash balances. The Statement of Operations reflects the total expenses before any offset, the amount of offset and the net expenses.
6. Portfolio Orientation
The Fund may invest no less than 70% of its net assets in equity securities believed to have the potential for capital appreciation. The Fund may invest in a range of stock market capitalizations that could include small-cap, mid-cap, and large cap. Thus the Fund may invest in common stocks without regard to whether they could be described as “growth” or “value”. The Fund may, from time-to-time, hold as much as 30% of its net assets in fixed-income securities including lower quality corporate debt securities (often referred to as high yield or “junk” bonds). These bonds generally have a greater credit risk than other types of fixed-income securities.
| | | | | | | | | | | | | |
| AQUILA THREE PEAKS OPPORTUNITY GROWTH FUND | |
| NOTES TO FINANCIAL STATEMENTS (continued) | |
| DECEMBER 31, 2010 | |
| | |
| 7. Capital Share Transactions | |
| | |
a) Transactions in Capital Shares of the Fund were as follows: | |
| | |
| | | Year Ended | | | Year Ended | |
| | | December 31, 2010 | | | December 31, 2009 | |
| | | Shares | | | Amount | | | Shares | | | Amount | |
| Class A Shares: | | | | | | | | | | | | |
| Proceeds from shares sold | | | 162,683 | | | $ | 4,211,631 | | | | 20,818 | | | $ | 424,175 | |
| Reinvested distributions | | | – | | | | – | | | | – | | | | – | |
| Cost of shares redeemed | | | (163,656 | ) | | | (3,844,553 | )(a) | | | (144,676 | ) | | | (2,834,791 | )(a) |
| Net change | | | (973 | ) | | | 367,078 | | | | (123,858 | ) | | | (2,410,616 | ) |
| Class C Shares: | | | | | | | | | | | | | | | | |
| Proceeds from shares sold | | | 20,684 | | | | 480,090 | | | | 1,341 | | | | 24,843 | |
| Reinvested distributions | | | – | | | | – | | | | – | | | | – | |
| Cost of shares redeemed | | | (15,601 | ) | | | (325,494 | ) | | | (29,457 | ) | | | (515,999 | ) |
| Net change | | | 5,083 | | | | 154,596 | | | | (28,116 | ) | | | (491,156 | ) |
| Class I Shares: | | | | | | | | | | | | | | | | |
| Proceeds from shares sold | | | 520 | | | | 13,250 | | | | – | | | | – | |
| Reinvested distributions | | | – | | | | – | | | | – | | | | – | |
| Cost of shares redeemed | | | – | | | | – | | | | – | | | | – | |
| Net change | | | 520 | | | | 13,250 | | | | – | | | | – | |
| Class Y Shares: | | | | | | | | | | | | | | | | |
| Proceeds from shares sold | | | 100,521 | | | | 2,680,454 | | | | 2,045 | | | | 38,926 | |
| Reinvested distributions | | | – | | | | – | | | | – | | | | – | |
| Cost of shares redeemed | | | (4,341 | ) | | | (105,223 | )(b) | | | (13,998 | ) | | | (289,594 | ) |
| Net change | | | 96,180 | | | | 2,575,231 | | | | (11,953 | ) | | | (250,668 | ) |
| Total transactions in Fund | | | | | | | | | | | | | | | | |
| shares | | | 100,810 | | | $ | 3,110,155 | | | | (163,927 | ) | | $ | (3,152,440 | ) |
(a) Net of short-term trading redemption fees of $408 and $42 for 2010 and 2009, respectively. (See note 7b)
(b) Net of short-term trading redemption fees of $148.
| b) | Short-Term Trading Redemption Fee: The Fund and the Distributor may reject any order for the purchase of shares, on a temporary or permanent basis, from investors exhibiting a pattern of frequent or short-term trading in Fund shares. In addition, the Fund imposes a redemption fee of 2.00% of the shares’ redemption value on any redemption of Class A Shares on which a sales charge is not imposed or of Class I and Class Y Shares, if the redemption occurs within 90 days of purchase. The fee is paid to the Fund and is designed |
| |
| AQUILA THREE PEAKS OPPORTUNITY GROWTH FUND |
| NOTES TO FINANCIAL STATEMENTS (continued) |
| DECEMBER 31, 2010 |
to offset the costs to the Fund caused by short-term trading in Fund shares. The Fund retains the fee charged as paid-in capital which becomes part of the Fund’s daily net asset value (NAV) calculation. The fee does not apply to shares sold under an Automatic Withdrawal Plan, or sold due to the shareholder’s death or disability.
8. Income Tax Information and Distributions
The Fund declares annual distributions to shareholders from net investment income, if any, and from net realized capital gains, if any. Distributions are recorded by the Fund on the ex-dividend date and paid in additional shares at the net asset value per share, in cash, or in a combination of both, at the shareholder’s option. Dividends from net investment income and distributions from realized gains from investment transactions are determined in accordance with Federal income tax regulations, which may differ from investment income and realized gains determined under generally accepted accounting principles. These “book/tax” differences are either considered temporary or permanent in nature. To the extent these differences are permanent in nature, such amounts are reclassified within the capital accounts based on their federal tax-basis treatment; temporary differences do not require reclassification. To the extent dividends exceed net investment income and net realized capital gains for tax purposes, they are reported as distributions from paid-in capital.
| | | | | | | |
| The tax character of distributions: | | | | | | |
| | | Year Ended December 31, | |
| | | 2010 | | | 2009 | |
| Long-term capital gain | | $ | 0 | | | $ | 0 | |
| As of December 31, 2010, the components of distributable earnings on a tax basis were as follows: |
| | |
| Accumulated net realized gains | | $ | 1,964,372 | |
| Deferred post October losses | | | – | |
| Unrealized appreciation | | | 613,732 | |
| | | $ | 2,578,104 | |
| | | | | | | | | | | | | | | | | | | | | | | | | | | | | | | |
| AQUILA THREE PEAKS OPPORTUNITY GROWTH FUND | |
| FINANCIAL HIGHLIGHTS | |
| | |
| For a share outstanding throughout each period | |
| | |
| | | Class A | | Class C |
| | | Year Ended December 31, | | Year Ended December 31, |
| | | 2010 | | 2009 | | 2008 | | 2007 | | 2006 | | 2010 | | 2009 | | 2008 | | 2007 | | 2006 |
| Net asset value, beginning of period | | $ | 22.95 | | | $ | 17.57 | | | $ | 30.39 | | | $ | 32.47 | | | $ | 29.45 | | | $ | 20.67 | | | $ | 15.94 | | | $ | 27.84 | | | $ | 30.11 | | | $ | 27.54 | |
| Income (loss) from investment operations: | | | | | | | | | | | | | | | | | | | | | | | | | | | | | | | | | | | | | | | | |
| Net investment income (loss) | | | (0.09 | )(1) | | | (0.05 | )(1) | | | (0.17 | )(1) | | | (0.20 | )(1) | | | (0.11 | )(2) | | | (0.23 | )(1) | | | (0.18 | )(1) | | | (0.33 | )(1) | | | (0.42 | )(1) | | | (0.32 | )(2) |
| Net gain (loss) on securities (both | | | | | | | | | | | | | | | | | | | | | | | | | | | | | | | | | | | | | | | | |
| realized and unrealized) | | | 3.78 | | | | 5.43 | | | | (12.31 | ) | | | (0.19 | ) | | | 3.51 | | | | 3.37 | | | | 4.91 | | | | (11.23 | ) | | | (0.16 | ) | | | 3.27 | |
| Total from investment operations | | | 3.69 | | | | 5.38 | | | | (12.48 | ) | | | (0.39 | ) | | | 3.40 | | | | 3.14 | | | | 4.73 | | | | (11.56 | ) | | | (0.58 | ) | | | 2.95 | |
| Less distributions (note 8): | | | | | | | | | | | | | | | | | | | | | | | | | | | | | | | | | | | | | | | | |
| Distributions from capital gains | | | – | | | | – | | | | (0.34 | ) | | | (1.69 | ) | | | (0.38 | ) | | | – | | | | – | | | | (0.34 | ) | | | (1.69 | ) | | | (0.38 | ) |
| Net asset value, end of period | | $ | 26.64 | | | $ | 22.95 | | | $ | 17.57 | | | $ | 30.39 | | | $ | 32.47 | | | $ | 23.81 | | | $ | 20.67 | | | $ | 15.94 | | | $ | 27.84 | | | $ | 30.11 | |
| Total return | | | 16.08 | %(3) | | | 30.62 | %(3) | | | (41.07 | )%(3) | | | (1.34 | )%(3) | | | 11.54 | %(3) | | | 15.19 | %(4) | | | 29.67 | %(4) | | | (41.53 | )%(4) | | | (2.08 | )%(4) | | | 10.71 | %(4) |
| Ratios/supplemental data | | | | | | | | | | | | | | | | | | | | | | | | | | | | | | | | | | | | | | | | |
| Net assets, end of period | | | | | | | | | | | | | | | | | | | | | | | | | | | | | | | | | | | | | | | | |
| (in thousands) | | $ | 10,053 | | | $ | 8,682 | | | $ | 8,822 | | | $ | 20,950 | | | $ | 23,121 | | | $ | 855 | | | $ | 637 | | | $ | 940 | | | $ | 2,845 | | | $ | 3,449 | |
| Ratio of expenses to average net assets | | | 1.50 | % | | | 1.50 | % | | | 1.51 | % | | | 1.54 | % | | | 1.72 | % | | | 2.25 | % | | | 2.25 | % | | | 2.26 | % | | | 2.29 | % | | | 2.47 | % |
| Ratio of net investment loss to average | | | | | | | | | | | | | | | | | | | | | | | | | | | | | | | | | | | | | | | | |
| net assets | | | (0.40 | )% | | | (0.26 | )% | | | (0.67 | )% | | | (0.64 | )% | | | (0.57 | )% | | | (1.11 | )% | | | (1.04 | )% | | | (1.43 | )% | | | (1.38 | )% | | | (1.32 | )% |
| Portfolio turnover rate | | | 115.93 | % | | | 2.51 | % | | | 3.70 | % | | | 16.81 | % | | | 13.31 | % | | | 115.93 | % | | | 2.51 | % | | | 3.70 | % | | | 16.81 | % | | | 13.31 | % |
| The expense and net investment income ratios without the effect of the contractual expense cap were (note 3): | |
| Ratio of expenses to average net assets | | | 7.47 | % | | | 4.79 | % | | | 3.51 | % | | | 2.73 | % | | | 2.70 | % | | | 8.27 | % | | | 5.58 | % | | | 4.22 | % | | | 3.47 | % | | | 3.45 | % |
| Ratio of net investment loss to average | | | | | | | | | | | | | | | | | | | | | | | | | | | | | | | | | | | | | | | | |
| net assets | | | (6.37 | )% | | | (3.55 | )% | | | (2.68 | )% | | | (1.82 | )% | | | (1.55 | )% | | | (7.13 | )% | | | (4.37 | )% | | | (3.39 | )% | | | (2.56 | )% | | | (2.30 | )% |
| The expense ratios after giving effect to the contractual expense cap and expense offset for uninvested cash balances were (note 3): | |
| Ratio of expenses to average net assets | | | 1.50 | % | | | 1.50 | % | | | 1.50 | % | | | 1.50 | % | | | 1.50 | % | | | 2.25 | % | | | 2.25 | % | | | 2.25 | % | | | 2.25 | % | | | 2.25 | % |
__________
(1) Per share amounts have been calculated using the daily average shares method.
(2) Per share amounts have been calculated using the monthly average shares method.
(3) Not reflecting sales charges.
(4) Not reflecting CDSC.
Note: On October 15, 2010, the Fund began operations under the name Aquila Three Peaks Opportunity Growth Fund, with Three Peaks Capital Management, LLC as sub-adviser and an investment strategy that differs meaningfully from the prior strategy pursued by the Fund.
See accompanying notes to financial statements.
| | | | | | | | | | | | | | | | | | | | | | | | | | | | | | | |
| AQUILA THREE PEAKS OPPORTUNITY GROWTH FUND | |
| FINANCIAL HIGHLIGHTS (continued) | |
| | |
| For a share outstanding throughout each period | |
| | |
| | | Class I | | Class Y |
| | | Year Ended December 31, | | Year Ended December 31, |
| | | 2010 | | 2009 | | 2008 | | 2007 | | 2006 | | 2010 | | 2009 | | 2008 | | 2007 | | 2006 |
| Net asset value, beginning of period | | $ | 23.24 | | | $ | 17.73 | | | $ | 30.58 | | | $ | 32.51 | | | $ | 29.46 | | | $ | 23.74 | | | $ | 18.13 | | | $ | 31.25 | | | $ | 33.25 | | | $ | 30.08 | |
| Income (loss) from investment operations: | | | | | | | | | | | | | | | | | | | | | | | | | | | | | | | | | | | | | | | | |
| Net investment income (loss) | | | 0.06 | (1) | | | 0.03 | (1) | | | (0.11 | )(1) | | | (0.14 | )(1) | | | (0.08 | )(2) | | | 0.08 | (1) | | | (0.01 | )(1) | | | (0.11 | )(1) | | | (0.12 | )(1) | | | (0.03 | )(2) |
| Net gain (loss) on securities | | | | | | | | | | | | | | | | | | | | | | | | | | | | | | | | | | | | | | | | |
| (both realized and unrealized) | | | 3.78 | | | | 5.48 | | | | (12.40 | ) | | | (0.10 | ) | | | 3.51 | | | | 3.81 | | | | 5.62 | | | | (12.67 | ) | | | (0.19 | ) | | | 3.58 | |
| Total from investment operations | | | 3.84 | | | | 5.51 | | | | (12.51 | ) | | | (0.24 | ) | | | 3.43 | | | | 3.89 | | | | 5.61 | | | | (12.78 | ) | | | (0.31 | ) | | | 3.55 | |
| Less distributions (note 8): | | | | | | | | | | | | | | | | | | | | | | | | | | | | | | | | | | | | | | | | |
| Distributions from capital gains | | | – | | | | – | | | | (0.34 | ) | | | (1.69 | ) | | | (0.38 | ) | | | – | | | | – | | | | (0.34 | ) | | | (1.69 | ) | | | (0.38 | ) |
| Net asset value, end of period | | $ | 27.08 | | | $ | 23.24 | | | $ | 17.73 | | | $ | 30.58 | | | $ | 32.51 | | | $ | 27.63 | | | $ | 23.74 | | | $ | 18.13 | | | $ | 31.25 | | | $ | 33.25 | |
| Total return | | | 16.52 | % | | | 31.08 | % | | | (40.92 | )% | | | (0.87 | )% | | | 11.64 | % | | | 16.39 | % | | | 30.94 | % | | | (40.90 | )% | | | (1.07 | )% | | | 11.80 | % |
| Ratios/supplemental data | | | | | | | | | | | | | | | | | | | | | | | | | | | | | | | | | | | | | | | | |
| Net assets, end of period | | | | | | | | | | | | | | | | | | | | | | | | | | | | | | | | | | | | | | | | |
| (in thousands) | | $ | 24 | | | $ | 8 | | | $ | 6 | | | $ | 11 | | | $ | 28 | | | $ | 3,178 | | | $ | 447 | | | $ | 558 | | | $ | 1,667 | | | $ | 1,616 | |
| Ratio of expenses to average net assets | | | 1.13 | % | | | 1.12 | % | | | 1.30 | % | | | 1.38 | % | | | 1.64 | % | | | 1.25 | % | | | 1.25 | % | | | 1.26 | % | | | 1.29 | % | | | 1.47 | % |
| Ratio of net investment income (loss) | | | | | | | | | | | | | | | | | | | | | | | | | | | | | | | | | | | | | | | | |
| to average net assets | | | 0.26 | % | | | 0.14 | % | | | (0.46 | )% | | | (0.46 | )% | | | (0.48 | )% | | | 0.31 | % | | | (0.03 | )% | | | (0.43 | )% | | | (0.39 | )% | | | (0.31 | )% |
| Portfolio turnover rate | | | 115.93 | % | | | 2.51 | % | | | 3.70 | % | | | 16.81 | % | | | 13.31 | % | | | 115.93 | % | | | 2.51 | % | | | 3.70 | % | | | 16.81 | % | | | 13.31 | % |
| The expense and net investment income ratios without the effect of the contractual expense cap were (note 3): | |
| Ratio of expenses to average net assets | | | 8.68 | % | | | 4.40 | % | | | 3.37 | % | | | 2.55 | % | | | 2.69 | % | | | 9.48 | % | | | 4.55 | % | | | 3.21 | % | | | 2.48 | % | | | 2.45 | % |
| Ratio of net investment loss to | | | | | | | | | | | | | | | | | | | | | | | | | | | | | | | | | | | | | | | | |
| average net assets | | | (7.29 | )% | | | (3.14 | )% | | | (2.53 | )% | | | (1.63 | )% | | | (1.53 | )% | | | (7.93 | )% | | | (3.33 | )% | | | (2.38 | )% | | | (1.59 | )% | | | (1.30 | )% |
| The expense ratios after giving effect to the contractual expense cap and expense offset for uninvested cash balances were: | |
| Ratio of expenses to average net assets | | | 1.13 | % | | | 1.12 | % | | | 1.29 | % | | | 1.34 | % | | | 1.42 | % | | | 1.25 | % | | | 1.25 | % | | | 1.25 | % | | | 1.25 | % | | | 1.25 | % |
__________
(1) Per share amounts have been calculated using the daily average shares method.
(2) Per share amounts have been calculated using the monthly average shares method.
Note: On October 15, 2010, the Fund began operations under the name Aquila Three Peaks Opportunity Growth Fund, with Three Peaks Capital Management, LLC as sub-adviser and an investment strategy that differs meaningfully from the prior strategy pursued by the Fund.
See accompanying notes to financial statements.
Analysis of Expenses (unaudited)
As a shareholder of the Fund, you may incur two types of costs: (1) transaction costs, including front-end sales charges with respect to Class A shares or contingent deferred sales charges (“CDSC”) with respect to Class C shares; and (2) ongoing costs, including management fees; distribution and/or service (12b-1) fees; and other Fund expenses. The table below is intended to help you understand your ongoing costs (in dollars) of investing in the Fund and to compare these costs with the ongoing costs of investing in other mutual funds.
The table below is based on an investment of $1,000 invested on July 1, 2010 and held for the six months ended December 31, 2010.
Actual Expenses
This table provides information about actual account values and actual expenses. You may use the information provided in this table, together with the amount you invested, to estimate the expenses that you paid over the period. To estimate the expenses you paid on your account, divide your ending account value by $1,000 (for example, an $8,600 ending account value divided by $1,000 = 8.6), then multiply the result by the number under the heading entitled “Expenses Paid During the Period”.
| | | | | |
| Six months ended December 31, 2010 |
| | Actual | | | |
| | Total Return | Beginning | Ending | Expenses |
| | Without | Account | Account | Paid During |
| | Sales Charges(1) | Value | Value | the Period(2) |
| Class A | 22.71% | $1,000.00 | $1,227.10 | $ 8.42 |
| Class C | 22.23% | $1,000.00 | $1,222.30 | $12.60 |
| Class I | 22.92% | $1,000.00 | $1,229.20 | $ 6.29 |
| Class Y | 22.85% | $1,000.00 | $1,228.50 | $ 7.02 |
| (1) | Assumes reinvestment of all dividends and capital gain distributions, if any, at net asset value and does not reflect the deduction of the applicable sales charges with respect to Class A shares or the applicable contingent deferred sales charges (“CDSC”) with respect to Class C shares. Total return is not annualized, as it may not be representative of the total return for the year. |
| (2) | Expenses are equal to the annualized expense ratio of 1.50%, 2.25%, 1.12% and 1.25% for the Fund’s Class A, C, I and Y shares, respectively, multiplied by the average account value over the period, multiplied by 184/365 (to reflect the one-half year period). |
Analysis of Expenses (unaudited) (continued)
Hypothetical Example for Comparison Purposes
The table below provides information about hypothetical account values and hypothetical expenses based on the actual expense ratio and an assumed rate of return of 5.00% per year before expenses, which is not the Fund’s actual return. The hypothetical account values and expenses may not be used to estimate the actual ending account balance or expenses you paid for the period. You may use the information provided in this table to compare the ongoing costs of investing in the Fund and other mutual funds. To do so, compare this 5.00% hypothetical example relating to the Fund with the 5.00% hypothetical examples that appear in the shareholder reports of other mutual funds.
Please note that the expenses shown in the table below are meant to highlight your ongoing costs only and do not reflect any transactional costs with respect to Class A shares. The example does not reflect the deduction of contingent deferred sales charges (“CDSC”) with respect to Class C shares. Therefore, the table is useful in comparing ongoing costs only, and will not help you determine the relative total costs of owning different mutual funds. In addition, if these transaction costs were included, your costs would have been higher.
| | | | | |
| Six months ended December 31, 2010 | | | |
| | Hypothetical | | | |
| | Annualized | Beginning | Ending | Expenses |
| | Total | Account | Account | Paid During |
| | Return | Value | Value | the Period(1) |
| Class A | 5.00% | $1,000.00 | $1,017.64 | $ 7.63 |
| Class C | 5.00% | $1,000.00 | $1,013.86 | $11.42 |
| Class I | 5.00% | $1,000.00 | $1,019.56 | $ 5.70 |
| Class Y | 5.00% | $1,000.00 | $1,018.90 | $ 6.36 |
| (1) | Expenses are equal to the annualized expense ratio of 1.50%, 2.25%, 1.12% and 1.25% for the Fund’s Class A, C , I and Y shares, respectively, multiplied by the average account value over the period, multiplied by 184/365 (to reflect the one-half year period). |
Shareholder Meeting Results (unaudited)
The Annual Meeting of Shareholders of Aquila Rocky Mountain Equity Fund was held on October 8, 2010. The holders of shares representing 86% of the total net asset value of the shares entitled to vote were present in person or by proxy. At the meeting, the following matters were voted upon and approved by the shareholders (the resulting votes are presented below).
| Dollar Amount of Votes |
| |
| Trustee | For | Withheld |
| Tucker Hart Adams | $6,648,615 | $68,153 |
| Gary C. Cornia | $6,659,775 | $57,015 |
| Grady Gammage, Jr. | $6,659,595 | $57,195 |
| Diana P. Herrmann | $6,700,792 | $15,975 |
| Glenn P. O’Flaherty | $6,649,595 | $57,195 |
Shareholder Meeting Results (unaudited)
A Special Meeting of Shareholders of Aquila Rocky Mountain Equity Fund was held on October 8, 2010. The holders of shares representing 55% of the total net asset value of the shares entitled to vote on Proposals No. 1, 2 and 3; and holders of shares representing 56% of the total net asset value of Class A shares and 51% of the total net asset value of Class C shares entitled to vote on Proposal No. 4 were present in person or by proxy. At the meeting, the following matters were voted upon and approved by the shareholders (the resulting votes for each matter are presented below).
1. Act on elimination of the Fund’s fundamental policies:
| | Dollar Amount of Votes | |
| |
| For | Against | Abstain |
| $4,087,260 | $85,207 | $80,730 |
2. Act on a new Advisory and Administration Agreement with Aquila Investment Management LLC:
| | Dollar Amount of Votes | |
| | | |
| For | Against | Abstain |
| $4,114,327 | $56,700 | $82,192 |
3. Act on a new Sub-Advisory Agreement with Three Peaks Capital Management, LLC:
| | | |
| | Dollar Amount of Votes | |
| | | |
| For | Against | Abstain |
| $4,111,830 | $56,992 | $84,375 |
4. Act on amendment of the Distribution Plan with respect to:
Class A Shares:
| | Dollar Amount of Votes | |
| | | |
| For | Against | Abstain |
| $3,672,022 | $114,525 | $44,730 |
Class C Shares:
| | Dollar Amount of Votes | |
| | | |
| For | Against | Abstain |
| $222,232 | $12,375 | $35,527 |
Information Available (unaudited)
Much of the information that the funds in the Aquila Group of Funds produce is automatically sent to you and all other shareholders. Specifically, you are routinely sent your Fund’s entire list of portfolio securities twice a year in the semi-annual and annual reports you receive. Additionally, under Fund policies, the Fund may also disclose other portfolio holdings as of a specified date (currently the Fund discloses its five largest holdings by value as of the close of the last business day of each calender quarter in a posting to its website on approximately the 30th business day following the month end). Such information remains accessible until the next schedule is made publicly available. You may obtain a copy of the Fund’s portfolio holdings schedule for the most recently completed period by visiting the Fund’s website at www.aquilafunds.com. Whenever you wish to see a listing of your Fund’s portfolio other than in your shareholder reports, please check our website at www.aquilafunds.com or call us at 1-800-437-1020.
The Fund additionally files a complete list of its portfolio holdings with the SEC for the first and third quarters of each fiscal year on Form N-Q. Forms N-Q are available free of charge on the SEC website at www.sec.gov. You may also review or, for a fee, copy the forms at the SEC’s Public Reference Room in Washington, D.C. or by calling 1-800-SEC-0330.
Proxy Voting Record (unaudited)
Proxy Voting Guidelines and Procedures of the Fund are available without charge, upon request, by calling our toll-free number (1-800-437-1020). This information is also available at www.aquilafunds.com/armef/armefproxy.htm or on the SEC’s website www.sec.gov.
Federal Tax Status of Distributions (unaudited)
For the calendar year ended December 31, 2010, there were no distributions paid by the Fund.
| | | | | | | | | |
| Additional Information (unaudited) | | | | | | |
| | | | | | | | | |
Trustees(1) | | | | | | | | |
| and Officers | | | | | | | | |
| | | | | | | Number of | | |
| | | Positions | | | | Portfolios | | Other Directorships |
| | | Held with | | | | in Fund | | Held by Trustee |
| Name, | | Fund and | | Principal | | Complex | | (The position held is |
Address(2) | | Length of | | Occupation(s) | | Overseen | | a directorship unless |
| and Date of Birth | | Service(3) | | During Past 5 Years | | by Trustee | | indicated otherwise.) |
| |
Interested Trustee(4) |
| | | | | | | | | |
Diana P. Herrmann New York, NY (02/25/58) | | Trustee since 1997 and President since 2002 | | Vice Chair and Chief Executive Officer of Aquila Management Corporation, Founder of the Aquila Group of Funds(5) and parent of Aquila Investment Management LLC, Manager since 2004, President since 1997, Chief Operating Officer, 1997-2008, a Director since 1984, Secretary since 1986 and previously its Executive Vice President, Senior Vice President or Vice President, 1986-1997; Chief Executive Officer and Vice Chair since 2004, President and Manager since 2003, and Chief Operating Officer (2003-2008), of the Manager; Chair, Vice Chair, President, Executive Vice President and/or Senior Vice President of funds in the Aquila Group of Funds since 1986; Director of the Distributor since 1997; Governor, Investment Company Institute (the trade organization for the U.S. mutual fund industry dedicated to protecting shareholder interests and educating the public about investing) for various periods since 2004, and head of its Small Funds Committee, 2004-2009; active in charitable and volunteer organizations. | | 12 | | ICI Mutual Insurance Company, a Risk Retention Group (2006-2009 and since 2010) |
| | | | | | | | | |
Non-interested Trustees |
| | | | | | | | | |
Tucker Hart Adams Colorado Springs, CO (01/11/38) | | Chair of the Board of Trustees since 2005 and Trustee since 1993 | | Senior Partner, Summit Economics, since 2010; President, The Adams Group, an economic consulting firm, 1989-2010; formerly Chief Economist, United Banks of Colorado; currently or formerly active with numerous professional and community organizations. | | 4 | | Trustee, Colorado Health Facilities Authority; advisory board, Griffis/Blessings, Inc. (commercial property development and management); advisory board, Kachi Partners (middle market buyouts); formerly Director, Touch America and Mortgage Analysis Computer Corp. |
| | | | | | | | | |
| | | | | | | Number of | | |
| | | Positions | | | | Portfolios | | Other Directorships |
| | | Held with | | | | in Fund | | Held by Trustee |
| Name, | | Fund and | | Principal | | Complex | | (The position held is |
Address(2) | | Length of | | Occupation(s) | | Overseen | | a directorship unless |
| and Date of Birth | | Service(3) | | During Past 5 Years | | by Trustee | | indicated otherwise.) |
| | | | | | | | | |
Gary C. Cornia Orem, UT (06/24/48) | | Trustee since 2002 | | Dean, Marriott School of Management, Brigham Young University, since 2008; Director, Romney Institute of Public Management, Marriott School of Management, 2004-2008; Professor, Marriott School of Management, 1980-present; Past President, National Tax Association; Fellow, Lincoln Institute of Land Policy, 2002-present; Associate Dean, Marriott School of Management, Brigham Young University, 1991-2000; member, Utah Governor's Tax Review Committee, 1993-2009. | | 5 | | Lincoln Institute of Land Policy, Cambridge, MA |
| | | | | | | | | |
Grady Gammage, Jr. Phoenix, AZ (10/01/51) | | Trustee since 2004 | | Founding partner, Gammage & Burnham, PLC, a law firm, Phoenix, Arizona, since 1983; director, Central Arizona Water Conservation District, 1992-2004; director, Arizona State University Foundation since 1998; Senior Fellow, Morrison Institute for Public Policy; active with Urban Land Institute. | | 4 | | None |
| | | | | | | | | |
Glenn P. O’Flaherty Denver, CO (08/03/58) | | Trustee since 2007 | | Chief Financial Officer and Chief Operating Officer of Lizard Investors, LLC, February-December 2008; Co-Founder, Chief Financial Officer and Chief Compliance Officer of Three Peaks Capital Management, LLC, 2003-2005; Vice President –Investment Accounting, Global Trading and Trade Operations, Janus Capital Corporation, and Chief Financial Officer and Treasurer, Janus Funds, 1991-2002. | | 6 | | None |
| | | | | | | | | |
| | | | | | | Number of | | |
| | | Positions | | | | Portfolios | | Other Directorships |
| | | Held with | | | | in Fund | | Held by Trustee |
| Name, | | Fund and | | Principal | | Complex | | (The position held is |
Address(2) | | Length of | | Occupation(s) | | Overseen | | a directorship unless |
| and Date of Birth | | Service(3) | | During Past 5 Years | | by Trustee | | indicated otherwise.) |
| |
| Other Individuals |
| |
Chairman Emeritus(6) |
| | | | | | | | | |
Lacy B. Herrmann New York, NY (05/12/29) | | Founder and Chairman Emeritus since 2006, Chairman of the Board of Trustees, 1993-2005 | | Founder and Chairman of the Board, Aquila Management Corporation, the sponsoring organization and parent of the Manager or Administrator and/or Adviser to each fund of the Aquila Group of Funds; Chairman of the Manager or Administrator and/or Adviser to each since 2004; Founder and Chairman Emeritus of each fund in the Aquila Group of Funds; previously Chairman and a Trustee of each fund in the Aquila Group of Funds since its establishment until 2004 or 2005; Director of the Distributor since 1981 and formerly Vice President or Secretary, 1981-1998; Director or trustee, Premier VIT, 1994-2009; Oppenheimer Quest Value Funds Group, Oppenheimer Small Cap Value Fund, Oppenheimer Midcap Fund, 1987-2009, and Oppenheimer Rochester Group of Funds, 1995-2009; Trustee Emeritus, Brown University and the Hopkins School; active in university, school and charitable organizations. | | N/A | | N/A |
| | | | | | | | | |
Officers |
| | | | | | | | | |
Charles E. Childs, III New York, NY (04/01/57) | | Executive Vice President since 2003 | | Executive Vice President of all funds in the Aquila Group of Funds and the Manager and the Manager’s parent since 2003; Chief Operating Officer of the Manager and the Manager’s parent since 2008; formerly Senior Vice President, corporate development, Vice President, Assistant Vice President and Associate of the Manager’s parent since 1987; Senior Vice President, Vice President or Assistant Vice President of the Aquila Money-Market Funds, 1988-2003. | | N/A | | N/A |
| | | | | | | | | |
| | | | | | | Number of | | |
| | | Positions | | | | Portfolios | | Other Directorships |
| | | Held with | | | | in Fund | | Held by Trustee |
| Name, | | Fund and | | Principal | | Complex | | (The position held is |
Address(2) | | Length of | | Occupation(s) | | Overseen | | a directorship unless |
| and Date of Birth | | Service(3) | | During Past 5 Years | | by Trustee | | indicated otherwise.) |
| | | | | | | | | |
Marie E. Aro Denver, CO (02/10/55) | | Senior Vice President since 2004 | | Co-President of the Distributor since 2010, Vice President, 1993-1997; Senior Vice President, Aquila Three Peaks Opportunity Growth Fund since 2004; Senior Vice President, Tax-Free Trust of Arizona since 2010 and Vice President, 2004-2010; Senior Vice President, Aquila Three Peaks High Income Fund since 2006; Senior Vice President, Tax-Free Fund For Utah, Tax-Free Fund of Colorado, Tax-Free Trust of Oregon, Churchill Tax-Free Fund of Kentucky and Narragansett Insured Tax-Free Income Fund since 2010; Vice President, INVESCO Funds Group, 1998-2003. | | N/A | | N/A |
| | | | | | | | | |
Paul G. O’Brien Charlotte, NC (11/28/59) | | Senior Vice President since 2010 | | Co-President, Aquila Distributors, Inc. since 2010, Managing Director, 2009-2010; Senior Vice President of Aquila Three Peaks Opportunity Growth Fund, Aquila Three Peaks High Income Fund, and each of the Aquila Municipal Bond Funds since 2010; held various positions to Senior Vice President and Chief Administrative Officer of Evergreen Investments Services, Inc., 1997 - 2008; Mergers and Acquisitions Coordinator for Wachovia Corporation, 1994 - 1997. | | N/A | | N/A |
| | | | | | | | | |
Stephen J. Caridi New York, NY (05/06/61) | | Vice President since 2006 | | Vice President of the Distributor since 1995; Vice President, Hawaiian Tax-Free Trust since 1998; Senior Vice President, Narragansett Insured Tax-Free Income Fund since 1998, Vice President 1996-1997; Senior Vice President, Tax-Free Fund of Colorado 2004-2009; Vice President, Aquila Three Peaks Opportunity Growth Fund since 2006. | | N/A | | N/A |
| | | | | | | | | |
| | | | | | | Number of | | |
| | | Positions | | | | Portfolios | | Other Directorships |
| | | Held with | | | | in Fund | | Held by Trustee |
| Name, | | Fund and | | Principal | | Complex | | (The position held is |
Address(2) | | Length of | | Occupation(s) | | Overseen | | a directorship unless |
| and Date of Birth | | Service(3) | | During Past 5 Years | | by Trustee | | indicated otherwise.) |
| | | | | | | | | |
Sherri Foster Lahaina, HI (07/27/50) | | Vice President since 2006 | | Senior Vice President, Hawaiian Tax-Free Trust since 1993 and formerly Vice President or Assistant Vice President; Vice President since 1997 and formerly Assistant Vice President of the three Aquila Money-Market Funds; Vice President, Aquila Three Peaks Opportunity Growth Fund since 2006; Registered Representative of the Distributor since 1985. | | N/A | | N/A |
| | | | | | | | | |
Jason T. McGrew Elizabethtown, KY (08/14/71) | | Vice President since 2006 | | Vice President, Churchill Tax-Free Fund of Kentucky since 2001, Assistant Vice President, 2000-2001; Vice President, Aquila Three Peaks Opportunity Growth Fund since 2006; Investment Broker with Raymond James Financial Services 1999-2000 and with J.C. Bradford and Company 1997-1999; Associate Broker at Prudential Securities 1996-1997. | | N/A | | N/A |
| | | | | | | | | |
Christine L. Neimeth Portland, OR (02/10/64) | | Vice President since 1999 | | Vice President of Aquila Three Peaks Opportunity Growth Fund and Tax-Free Trust of Oregon. | | N/A | | N/A |
| | | | | | | | | |
Alan R. Stockman Glendale, AZ (07/31/54) | | Vice President since 1999 | | Senior Vice President, Tax-Free Fund of Colorado, since 2009; Senior Vice President, Tax-Free Trust of Arizona since 2001, Vice President, 1999-2001; Vice President, Aquila Three Peaks Opportunity Growth Fund since 1999; Bank One, Commercial Client Services representative, 1997-1999; Trader and Financial Consultant, National Bank of Arizona (Zions Investment Securities Inc.), Phoenix, Arizona 1996-1997. | | N/A | | N/A |
| | | | | | | | | |
M. Kayleen Willis Salt Lake City, UT (06/11/63) | | Vice President since 2004 | | Vice President, Tax-Free Fund For Utah since September 2003, Assistant Vice President, 2002-2003; Vice President, Aquila Three Peaks Opportunity Growth Fund, since 2004. | | N/A | | N/A |
| | | | | | | | | |
| | | | | | | Number of | | |
| | | Positions | | | | Portfolios | | Other Directorships |
| | | Held with | | | | in Fund | | Held by Trustee |
| Name, | | Fund and | | Principal | | Complex | | (The position held is |
Address(2) | | Length of | | Occupation(s) | | Overseen | | a directorship unless |
| and Date of Birth | | Service(3) | | During Past 5 Years | | by Trustee | | indicated otherwise.) |
| | | | | | | | | |
Robert S. Driessen New York, NY (10/12/47) | | Chief Compliance Officer since 2009 | | Chief Compliance Officer of each fund in the Aquila Group of Funds, the Manager and the Distributor since December 2009; Vice President, Chief Compliance Officer, Curian Capital, LLC, 2004-2008; Vice President, Chief Compliance Officer, Phoenix Investment Partners, Ltd., 1999-2004; Vice President, Risk Liaison, Corporate Compliance, Bank of America, 1996-1999; Vice President, Securities Compliance, Prudential Insurance Company of America, 1993-1996; various positions to Branch Chief, U.S. Securities and Exchange Commission, 1972-1993. | | N/A | | N/A |
| | | | | | | | | |
Joseph P. DiMaggio New York, NY (11/06/56) | | Chief Financial Officer since 2003 and Treasurer since 2000 | | Chief Financial Officer of each fund in the Aquila Group of Funds since 2003 and Treasurer since 2000. | | N/A | | N/A |
| | | | | | | | | |
Edward M. W. Hines New York, NY (12/16/39) | | Secretary since 1993 | | Of Counsel to Butzel Long, a professional corporation, counsel to the Fund, since 2010 and previously Shareholder since 2007; Partner of Hollyer Brady Barrett & Hines LLP, its predecessor as counsel, 1989-2007; Secretary of each fund in the Aquila Group of Funds. | | N/A | | N/A |
| | | | | | | | | |
John M. Herndon New York, NY (12/17/39) | | Assistant Secretary since 1995 | | Assistant Secretary of each fund in the Aquila Group of Funds since 1995 and Vice President of the three Aquila Money-Market Funds since 1990; Vice President of the Manager or its predecessor and current parent since 1990. | | N/A | | N/A |
| | | | | | | | | |
| | | | | | | Number of | | |
| | | Positions | | | | Portfolios | | Other Directorships |
| | | Held with | | | | in Fund | | Held by Trustee |
| Name, | | Fund and | | Principal | | Complex | | (The position held is |
Address(2) | | Length of | | Occupation(s) | | Overseen | | a directorship unless |
| and Date of Birth | | Service(3) | | During Past 5 Years | | by Trustee | | indicated otherwise.) |
| | | | | | | | | |
Yolonda S. Reynolds New York, NY (04/23/60) | | Assistant Treasurer since 2010 | | Director of Fund Accounting for the Aquila Group of Funds since 2007; Investment Accountant, TIIA-CREF, 2007; Sr. Fund Accountant, JP Morgan Chase, 2003-2006. | | N/A | | N/A |
| | | | | | | | | |
Lori A. Vindigni New York, NY (11/02/66) | | Assistant Treasurer since 2000 | | Assistant Treasurer of each fund in the Aquila Group of Funds since 2000; Assistant Vice President of the Manager or its predecessor and current parent since 1998; Fund Accountant for the Aquila Group of Funds, 1995-1998. | | N/A | | N/A |
____________________
(1) The Fund’s Statement of Additional Information includes additional information about the Trustees and is available, without charge, upon request by calling 800-437-1020 (toll-free) or by visiting www.aquilafunds.com or the EDGAR Database at the SEC’s internet site at www.sec.gov.
(2) The mailing address of each Trustee and officer is c/o Aquila Three Peaks Opportunity Growth Fund, 380 Madison Avenue, Suite 2300, New York, NY 10017.
(3) Because the Fund does not hold annual meetings, each Trustee holds office for an indeterminate term. The term of office of each officer is one year.
(4) Ms. Herrmann is an interested person of the Fund as an officer of the Fund, as a director, officer and shareholder of the Manager’s corporate parent, as an officer and Manager of the Manager, and as a shareholder and director of the Distributor. Ms. Herrmann is the daughter of Lacy B. Herrmann, the Founder and Chairman Emeritus of the Fund.
(5) In this material Pacific Capital Cash Assets Trust, Pacific Capital Tax-Free Cash Assets Trust and Pacific Capital U.S. Government Securities Cash Assets Trust, each of which is a money-market fund, are called the “Aquila Money-Market Funds”; Tax-Free Trust of Arizona, Tax-Free Fund of Colorado, Hawaiian Tax-Free Trust, Churchill Tax-Free Fund of Kentucky, Tax-Free Trust of Oregon, Narragansett Insured Tax-Free Income Fund (Rhode Island) and Tax-Free Fund For Utah, each of which is a tax-free municipal bond fund, are called the “Aquila Municipal Bond Funds”; Aquila Three Peaks Opportunity Growth Fund (formerly known as Aquila Rocky Mountain Equity Fund) is an equity fund; and Aquila Three Peaks High Income Fund is a high income corporate bond fund; considered together, these 12 funds are called the “Aquila Group of Funds.”
(6) The Chairman Emeritus may attend Board meetings but has no voting power.
PRIVACY NOTICE (unaudited)
Aquila Three Peaks Opportunity Growth Fund
Our Privacy Policy. In providing services to you as an individual who owns or is considering investing in shares of the Fund, we collect certain non-public personal information about you. Our policy is to keep this information strictly safeguarded and confidential, and to use or disclose it only as necessary to provide services to you or as otherwise permitted by law. Our privacy policy applies equally to former shareholders and persons who inquire about the Fund.
Information We Collect. ”Non-public personal information” is personally identifiable financial information about you as an individual or your family. The kinds of non-public personal information we have about you may include the information you provide us on your share purchase application or in telephone calls or correspondence with us, and information about your fund transactions and holdings, how you voted your shares and the account where your shares are held.
Information We Disclose. We disclose non-public personal information about you to companies that provide necessary services to us, such as the Fund’s transfer agent, distributor, investment adviser or sub-adviser, if any, as permitted or required by law, or as authorized by you. Any other use is strictly prohibited. We do not sell information about you or any of our fund shareholders to anyone.
Non-California Residents: We also may disclose some of this information to another fund in the Aquila Group of Funds (or its service providers) under joint marketing agreements that permit the funds to use the information only to provide you with information about other funds in the Aquila Group of Funds or new services we are offering that may be of interest to you.
California Residents Only: In addition, unless you “opt-out” of the following disclosures using the form that was mailed to you under separate cover, we may disclose some of this information to another fund in the Aquila Group of Funds (or its sevice providers) under joint marketing agreements that permit the funds to use the information only to provide you with information about other funds in the Aquila Group of Funds or new services we are offering that may be of interest to you.
How We Safeguard Your Information. We restrict access to non-public personal information about you to only those persons who need it to provide services to you or who are permitted by law to receive it. We maintain physical, electronic and procedural safeguards to protect the confidentiality of all non-public personal information we have about you.
If you have any questions regarding our Privacy Policy, please contact us at 1-800-437-1020.
Aquila Distributors, Inc.
Aquila Investment Management LLC
This Privacy Policy also has been adopted by Aquila Distributors, Inc. and Aquila Investment Management LLC and applies to all non-public information about you that each of these companies may obtain in connection with services provided to the Fund or to you as a shareholder of the Fund.
| |
| Founders |
| Lacy B. Herrmann, Chairman Emeritus |
| Aquila Management Corporation |
| |
| Manager |
| AQUILA INVESTMENT MANAGEMENT LLC |
| 380 Madison Avenue, Suite 2300 |
| New York, New York 10017 |
| |
| Investment Sub-Adviser |
| THREE PEAKS CAPITAL MANAGEMENT, LLC |
| 3750 Dacoro Lane, Suite 100 |
| Castle Rock, Colorado 80109 |
| |
| Board of Trustees |
| Tucker Hart Adams, Chair |
| Gary C. Cornia |
| Grady Gammage, Jr. |
| Diana P. Herrmann |
| Glenn P. O’Flaherty |
| |
| Officers |
| Diana P. Herrmann, President |
| Marie E. Aro, Senior Vice President |
| Paul G. O’Brien, Senior Vice President |
| Robert S. Driessen, Chief Compliance Officer |
| Joseph P. DiMaggio, Chief Financial Officer |
| and Treasurer |
| Edward M.W. Hines, Secretary |
| |
| Distributor |
| AQUILA DISTRIBUTORS, INC. |
| 380 Madison Avenue, Suite 2300 |
| New York, New York 10017 |
| |
| Transfer and Shareholder Servicing Agent |
| BNY MELLON INVESTMENT SERVICING (US) INC. |
| 101 Sabin Street |
| Pawtucket, Rhode Island 02860 |
| |
| Custodian |
| JPMORGAN CHASE BANK, N.A. |
| 1111 Polaris Parkway |
| Columbus, Ohio 43240 |
| |
| Independent Registered Public Accounting Firm |
| TAIT, WELLER & BAKER LLP |
| 1818 Market Street, Suite 2400 |
| Philadelphia, PA 19103 |
| |
| Further information is contained in the Prospectus, |
| which must precede or accompany this report. |
(a) As of December 31, 2010 (the end of the reporting period) the Trust has adopted a code of ethics that applies to the Trust's principal executive officer(s)and principal financial officer(s) and persons performing similar functions ("Covered Officers") as defined in the Aquila Group of Funds Code of Ethics for Principal Executive and Senior Financial Officers under Section 406 of the Sarbanes-Oxley Act of 2002;
(f)(1) Pursuant to Item 10(a)(1), a copy of the Trust's Code of Ethics that applies to the Trust's principal executive officer(s) and principal financial officer(s) and persons performing similar functions is included as an exhibit to its annual report on this Form N-CSR;
(f)(2) The text of the Trust's Code of Ethics that applies to the Trust's principal executive officer(s) and principal financial officer(s) and persons performing similar functions has been posted on its Internet website which can be found at the Trust's Internet address at aquilafunds.com.
| ITEM 3. | AUDIT COMMITTEE FINANCIAL EXPERT. |
a) (1) (i) The Registrant's board of trustees has determined that Mr. Glenn O'Flaherty, a member of its audit committee, is an audit committee financial expert. Mr. O'Flaherty is 'independent' as such term is defined in Form N-CSR.
| ITEM 4. | PRINCIPAL ACCOUNTANT FEES AND SERVICES. |
a) Audit Fees - The aggregate fees billed for professional services rendered by the principal accountant for the audit of the Registrant's annual financial statements were $11,000 in 2009 and $11,000 in 2010.
b) Audit Related Fees - There were no amounts billed for audit-related fees over the past two years.
c) Tax Fees - The Registrant was billed by the principal accountant $3,200 and $3,200 in 2009 and 2010, respectively, for return preparation and tax compliance.
d) All Other Fees - There were no additional fees paid for audit and non-audit services other than those disclosed in a) through c) above.
e)(1) Currently, the audit committee of the Registrant pre-approves audit services and fees on an engagement-by-engagement basis
e)(2) None of the services described in b) through d) above were approved by the audit committee pursuant to paragraph (c)(7)(i)(C) of Rule 2-01 of Regulation S-X, all were pre-approved on an engagement-by-engagement basis.
f) No applicable.
g) There were no non-audit services fees billed by the Registrant's accountant to the Registrant's investment adviser or distributor over the past two years
h) Not applicable.
| ITEM 5. | AUDIT COMMITTEE OF LISTED REGISTRANTS. |
Not applicable.
| ITEM 6. | SCHEDULE OF INVESTMENTS. |
Included in Item 1 above
| ITEM 7. | DISCLOSURE OF PROXY VOTING POLICIES AND PROCEDURES FOR CLOSED-END MANAGEMENT INVESTMENT COMPANIES. |
Not applicable.
| ITEM 8. | PORTFOLIO MANAGERS OF CLOSED-END MANAGEMENT INVESTMENT COMPANIES. |
Not applicable.
| ITEM 9. | PURCHASES OF EQUITY SECURITIES BY CLOSED-END MANAGEMENT INVESTMENT COMPANY AND AFFILIATED PURCHASERS. |
Not applicable.
| ITEM 10. | SUBMISSION OF MATTERS TO A VOTE OF SECURITY HOLDERS. |
The Board of Directors of the Registrant has adopted a Nominating Committee Charter which provides that the Nominating Committee (the 'Committee') may consider and evaluate nominee candidates properly submitted by shareholders if a vacancy among the Independent Trustees of the Registrant occurs and if, based on the Board's then current size, composition and structure, the Committee determines that the vacancy should be filled. The Committee will consider candidates submitted by shareholders on the same basis as it considers and evaluates candidates recommended by other sources. A copy of the qualifications and procedures that must be met or followed by shareholders to properly submit a nominee candidate to the Committee may be obtained by submitting a request in writing to the Secretary of the Registrant.
(a) Based on their evaluation of the registrant's disclosure controls and procedures (as defined in Rule 30a-2(c) under the Investment Company Act of 1940) as of a date within 90 days of the filing of this report, the registrant's chief financial and executive officers have concluded that the disclosure controls and procedures of the registrant are appropriately designed to ensure that information required to be disclosed in the registrant's reports that are filed under the Securities Exchange Act of 1934 are accumulated and communicated to registrant's management, including its principal executive officer(s) and principal financial officer(s), to allow timely decisions regarding required disclosure and is recorded, processed, summarized and reported, within the time periods specified in the rules and forms adopted by the Securities and Exchange Commission.
(b) There have been no significant changes in registrant's internal controls or in other factors that could significantly affect registrant's internal controls subsequent to the date of the most recent evaluation, including no significant deficiencies or material weaknesses that required corrective action.
(a)(1) Aquila Group of Funds Code of Ethics for Principal Executive and Senior Financial Officers under Section 406 of the Sarbanes-Oxley Act of 2002, as amended.
(a)(2) Certifications of principal executive officer and principal financial officer as required by Rule 30a-2(a) under the Investment Company Act of 1940.
(b) Certifications of principal executive officer and principal financial officer as required by Rule 30a-2(b) under the Investment Company Act of 1940.
SIGNATURES
Pursuant to the requirements of the Securities Exchange Act of 1934 and the Investment Company Act of 1940, the registrant has duly caused this report to be signed on its behalf by the undersigned thereunto duly authorized.
AQUILA THREE PEAKS OPPORTUNITY GROWTH FUND
| By: | /s/ Diana P. Herrmann | |
| | March 7, 2011 | |
| | | |
| | | |
| By: | /s/ Joseph P. DiMaggio | |
| | Chief Financial Officer and Treasurer | |
Pursuant to the requirements of the Securities Exchange Act of 1934 and the Investment Company Act of 1940, this report has been signed below by the following persons on behalf of the registrant and in the capacities and on the dates indicated.
| By: | /s/ Diana P. Herrmann | |
| | Diana P. Herrmann President and Trustee | |
| | | |
| | | |
| By: | /s/ Joseph P. DiMaggio | |
| | Joseph P. DiMaggioChief Financial Officer and Treasurer | |
AQUILA THREE PEAKS OPPORTUNITY GROWTH FUND
EXHIBIT INDEX
(a)(1) Aquila Group of Funds Code of Ethics for Principal Executive and Senior Financial Officers under Section 406 of the Sarbanes-Oxley Act of 2002, as amended.
(a)(2) Certifications of principal executive officer and principal financial officer as required by Rule 30a-2(a) under the Investment Company Act of 1940.
(b) Certification of chief executive officer and chief financial officer as required by Rule 30a-2(b) of the Investment Company Act of 1940.