The fourth quarter of 2012 produced a relatively flat return for the Russell 3000 Index as the markets ended the year amidst protracted negotiations over averting the U.S. fiscal cliff. The Russell 3000 generated a 16.42% return for 2012, while the high yield market finished 2012 with another year of solid double-digit returns as the Barclays High Yield Bond Index posted a 15.81% return. The Federal Reserve’s (the “Fed”) recent language stating that short-term rates would remain “low” as long as unemployment was above 6.5% and inflation below 2.5% seemed to indicate that there could be a prolonged period of accommodative policy from the Fed. This could further lengthen the low-rate environment, the weak U.S. dollar environment and continue to force investors into higher-risk assets, such as high yield bonds and equities, as they seek out higher returns.
We will be watching for inflationary pressures brought about by continued low rates and accommodative monetary policy. The massive expansion of the Federal Reserve’s balance sheet coupled with the increase in money supply could have the undesired effect of sparking a true inflationary cycle. We believe any upward pressure on Treasury yields caused by better economic growth could create the potential for the equity market to experience positive mutual fund flows, as investors could begin shifting money from the fixed-income market to the equity market in an attempt to capture incremental return. While 2012 surprised many investors with the degree of positive equity returns, retail fund flows did not start moving into equities until December. From the point of view of our equity positioning, our macro thesis is taken from many data-points, but predominantly from high yield spreads, the high yield new issue market, and the specific bond yields of our equity names. Throughout 2012, we saw declining bond yields, a very strong high yield issuance calendar and tightening spreads. Therefore, we have upheld a positive view on the equity markets.
From a research perspective, we continue to monitor all signs of economic activity including energy prices, food prices, apparel prices, and new home prices, and their impact on consumer and business enterprise decisions.. This research approach in combination with our detailed modeling process and emphasis on credit metrics, gives us confidence as we continue to find what we believe to be new and exciting equity opportunities.
Performance Overview – 2012
The Russell 3000 Index posted a 0.25% return for the fourth quarter of 2012. The Aquila Three Peaks Opportunity Growth Fund (the “Fund”) Class Y shares (ATGYX) posted a 4.02% total return for the fourth quarter, outperforming the Russell 3000 Index return by over 375 basis points. To give further perspective on levered equities, the Credit Suisse Levered Equity Index produced a 4.88% return for the fourth quarter. While your Fund doesn’t compare directly to this index, it does encompass all high yield credits with public equities, and is therefore of interest to us. We were pleased to have roughly kept pace with this index for the quarter, as it was once again one of the top performing indices that we follow.
1 | Aquila Three Peaks Opportunity Growth Fund
MANAGEMENT DISCUSSION (continued)
Your Fund is mainly composed of the equities of high yield credits that are either currently owned or were previously owned in Aquila Three Peaks High Income Fund. The search for cash-flowing companies that are engaged in improving their leverage profile is our principle thesis. Generally, the industries we avoid in Aquila Three Peaks Opportunity Growth Fund are the same industries that we avoid in the Aquila Three Peaks High Income Fund, including financials, autos, airlines and other highly-cyclical sectors.
For the fourth quarter, the 10-year Treasury note returned -0.20%, the Barclays U.S. Aggregate Bond Index returned 0.22%, the Barclays High Yield Bond Index returned 1.58%, the S&P 500 returned -0.38%, the Dow Jones Industrial Average returned -1.74% and the NASDAQ Composite returned -2.48%.
For the calendar year 2012, the Aquila Three Peaks Opportunity Growth Fund Class Y shares generated a 24.55% total return compared to the Russell 3000 Index which returned 16.42%. The Credit Suisse Levered Equity Index returned 20.67%, the 10-year Treasury note returned 4.17%, the Barclays U.S. Aggregate Bond Index returned 4.21%, the Barclays High Yield Bond Index returned 15.81%, the S&P 500 returned 15.99%, the Dow Jones Industrial Average returned 10.23% and the NASDAQ Composite returned 17.73%.
We were very pleased with the performance of Aquila Three Peaks Opportunity Growth Fund in 2012. The Fund not only exhibited good performance during positive return months, but it also performed very well during the more volatile months such as April and October when the general indices were negative, yet the Fund generated positive returns. We believe our weightings in less cyclical industries, with little reliance on the technology and financial sectors, helped to drive such performance and deliver less correlation to the overall indices. In addition, as we search for what we believe to be balance sheet improvement stories, we feel that these equities can provide returns that are less driven by the overall markets and more from the improvements on a company-specific basis.
Market Commentary – 2012 into 2013
We note that even with an agreement reached to avoid the “fiscal cliff”, the economic growth environment remains moderate, as many strategists expect less than 2% U.S. Gross Domestic Product (“GDP”) growth for 2013. Job growth also remains tepid, with the U.S. economy averaging only 153,000 new jobs per month in 2012. As a result, the outlook on economic growth remains muted as we head into 2013. We believe the prospects for inflation remain high though, with an expanded Fed balance sheet and language indicating that rates will remain low until targets for employment and inflation are crossed. Considering this backdrop, we furthermore believe that: (1) the high yield market should remain one of the better performing fixed-income alternatives, even with rates potentially moving higher, and (2) flows into the equity asset class could begin to accelerate as low fixed-income yields force investors into more risk-based assets.
The Fund’s strategy is, in our view, very well positioned for this less-robust growth environment, as our strategy is not based on finding companies with rapid revenue growth metrics or momentum-oriented earnings per share growth. In our opinion, we are finding companies that use their balance sheet to improve equity performance. We furthermore believe that the fiscally prudent use of leverage should give the companies we follow opportunities to grow their earnings and cash flow. We closely track our companies’ leverage ratios, and we will sell companies that increase their leverage beyond what we define as an “out-of-bounds leverage” range, as we believe that while using debt to grow may be beneficial in certain periods, too much debt can be detrimental in the long-run.
2 | Aquila Three Peaks Opportunity Growth Fund
MANAGEMENT DISCUSSION (continued)
Important High Yield Metrics
Since we derive our equity ideas primarily from our understanding of the high yield market, we believe monitoring the health of the high yield market is of paramount importance. Thus, we highlight important aspects of the high yield market, as we believe it helps clarify the backdrop for the equities we own. The stocks we generally focus on have high yield balance sheets or at least some component of leverage.
High Yield Bond Yield Spreads – According to JPMorgan, the yield differential for high yield bonds vs. U.S. Treasury bonds (“high yield spreads”) started 2012 at 754 basis points (“b.p.s”) and declined throughout the year by 215 b.p.s. The 2012 year-end average spread of 539 b.p.s is fairly close to historical averages, and therefore looks compelling compared to a spread level that has been much tighter in past years. The yield-to-worst of the high yield market touched an all-time low of 6.28% in December, based on the JPMorgan Global High Yield Bond Index, and it finished the year at a near-record low of 6.20%, highlighting the strength of the high yield market. We believe that the yield-to-worst of the market may be a better indicator of the relative strength of the high yield asset class rather than only looking at spreads, which are not yet near their lows of 265 b.p.s in 2006.
Default Rate – The low default rate in today’s high yield market is indicative of the general growth in earnings profiles of U.S. companies, the declining leverage of these companies, and also the ability to refinance maturities that are in some cases many years off. While the 1.9% default rate at the end of 2012 is well below the historical average of 4.1%, we would not be surprised to see it trend slightly higher throughout 2013 and into 2014. A low default rate suggests strength in the credit profiles of the high yield market and, in our opinion, suggests positive trends for the equities of these companies.
New Issue Review – Issuance in today’s environment has substantially improved the maturity profiles for our credits, while reducing interest costs. In the current slow-growth economic environment and with attractive financing terms in the fixed-income markets, we expect companies to become more aggressive in financing acquisitions, share repurchases or dividends in an attempt to boost shareholder returns. We will be closely monitoring the use of debt in an attempt to avoid future risks associated with higher leverage profiles.
The Three Peaks Approach
We continue to search for companies which have what we believe to be fiscally prudent management teams who recognize that they can improve their equity valuations by focusing on credit-specific measures. These improvements include reducing the company’s leverage ratio (reducing debt relative to cash flow) and increasing the company’s coverage ratios (increasing cash flow relative to interest expense), as well as seeking better credit ratings, which can lead to a lower cost of capital. In addition, credit improvement can also take the form of using high yield bonds to refinance existing debt in order to extend maturities, secure lower coupons, or possibly to remove restrictive covenants. While these factors are not always the primary focus of many equity analysts, we believe our high yield process which is specifically designed to find improving high yield bond stories leads us to these types of improving equity stories. A high percentage of the companies we are invested in have undergone fundamental balance sheet improvement and laid the groundwork for what we believe is a migration to higher stock values. Several of our companies have been so successful at improving the balance sheet that their debt has been upgraded to investment grade.
3 | Aquila Three Peaks Opportunity Growth Fund
MANAGEMENT DISCUSSION (continued)
In our opinion, our focus on understanding covenants gives a distinct advantage to our research in stock selection. Frequently, high yield issuers have maximum leverage ratios, minimum coverage ratios and restrictions on the amounts of stock they can repurchase or dividends they can pay out. These covenants can change as a company’s financial strength and credit ratings improve, which may impact corporate decisions that could lead to higher stock values. We intend to continue to emphasize in our research the covenants within our high yield equity stories, as we believe this analysis is unique and sets our strategy apart from other equity managers.
Bond yields and spreads can also be an important piece of the equity valuation puzzle. From a company-specific point of view, it is our belief that a declining bond yield spread can signal good opportunities to buy a company’s equity, and conversely, a rising bond yield spread can indicate credit issues and therefore serve as a good signal to sell a company’s equity. We monitor bond yields and bond yield spreads of all names in the portfolio, which adds another layer of depth to our differentiated stock selection process.
As previously mentioned, we intend to take cues from the high yield market and other fixed-income markets, including spreads, defaults, the Treasury curve and the new issue calendar, to help us decipher the equity landscape. Our rigorous high yield research process, which is already in place, helps our investment team uncover what we believe to be new equity ideas. This includes company visits, frequent communication with management teams and detailed models. We believe our high yield focused research process, in addition to the positive economic indicators that we are seeing from the fixed-income markets, should provide Aquila Three Peaks Opportunity Growth Fund with a positive backdrop as we enter 2013.
Thank you for your continued support and investment.
4 | Aquila Three Peaks Opportunity Growth Fund
PERFORMANCE REPORT
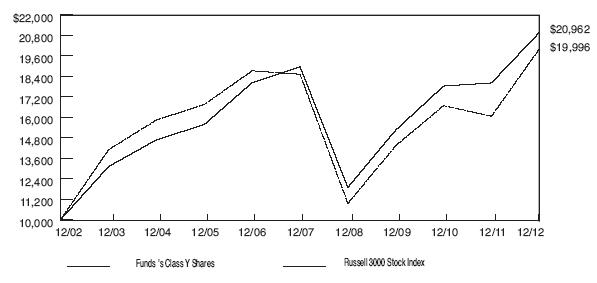
The graph below illustrates the value of $10,000 invested in Class Y Shares of Aquila Three Peaks Opportunity Growth Fund (the “Fund”) for the 10-year period ended December 31, 2012 as compared with a hypothetical similar-size investment in the Russell 3000 Stock Index (the “Index”) over the same period. The Fund’s universe of companies was primarily within the eight-state Rocky Mountain region until October 15, 2010 when the orientation of the Fund was changed to investing primarily in the equity securities of companies located throughout the United States and the comparative index was changed. Furthermore, the Fund was originally managed to provide capital appreciation through selection of equity-oriented securities primarily on a value-basis and was then reoriented to a growth at a reasonable price style as of July, 1999.
The performance of each of the other classes is not shown in the graph, but is included in the table below. It should be noted that the Index does not include any operating expenses nor sales charges but does reflect reinvestment of dividends, if any. It should also be noted that while the Index is nationally-oriented and consisted, over the period covered by the graph, of an unmanaged group of 3000 equity securities, mostly of companies having relatively small capitalization, the Fund’s investment portfolio consisted over most of the period (until 10/15/10) of a significant lesser number of equity securities primarily of companies domiciled in the eight-state Rocky Mountain region of our country.
Prior to October 15, 2010, the market prices and behavior of the individual securities in the Fund’s investment portfolio could have been affected by local and regional factors which might have resulted in variances from the market action of the securities in the Index. Furthermore, the difference in the performance in the Index versus the Fund may also be attributed to the lack of application of annual operating expenses and sales charges to the Index. These returns represent results under the Fund’s prior investment strategies and various portfolio managers in effect from inception in 1993 through October 14, 2010, under the name, “Aquila Rocky Mountain Equity Fund.” They should not be considered predictive or representative of results the Fund may experience under its current strategy and investment sub-adviser.
5 | Aquila Three Peaks Opportunity Growth Fund
PERFORMANCE REPORT (continued)
| | | Average Annual Total Return | |
| | | for periods ended December 31, 2012 | |
| | |
| | | | | | | | | | | | Since | |
| Class and Inception Date | | 1 Year | | | 5 Years | | | 10 Years | | | Inception | |
| Class A (commenced operations | | | | | | | | | | | | |
| on 7/22/94) | | | | | | | | | | | | |
| With Maximum Sales Charge | | | 18.84 | % | | | 0.38 | % | | | 6.41 | % | | | 6.58 | % |
| Without Sales Charge | | | 24.12 | | | | 1.26 | | | | 6.88 | | | | 6.86 | |
| Class C (commenced operations | | | | | | | | | | | | | | | | |
| on 5/01/96) | | | | | | | | | | | | | | | | |
| With CDSC** | | | 22.22 | | | | 0.50 | | | | 6.08 | | | | 5.25 | |
| Without CDSC | | | 23.22 | | | | 0.50 | | | | 6.08 | | | | 5.25 | |
| Class I (commenced operations | | | | | | | | | | | | | | | | |
| on 12/01/05) | | | | | | | | | | | | | | | | |
| No Sales Charge | | | 24.55 | | | | 1.61 | | | | N/A | | | | 2.20 | |
| Class Y (commenced operations | | | | | | | | | | | | | | | | |
| on 5/01/96) | | | | | | | | | | | | | | | | |
| No Sales Charge | | | 24.55 | | | | 1.55 | | | | 7.18 | | | | 6.26 | |
Russell 3000 Stock Index(1) | | | 16.42 | | | | 2.04 | | | | 7.68 | | | N/A* | (Class A) |
| | | | | | | | | | | | | | | 6.86 | (Class C &Y) |
| | | | | | | | | | | | | | | 4.30 | (Class I) |
Total return figures shown for the Fund reflect any change in price and assume all distributions within the period were invested in additional shares. The rates of return will vary and the principal value of an investment will fluctuate with market conditions. Shares, if redeemed, may be worth more or less than their original cost. Past performance is not predictive of future investment results.
(1) The Fund’s primary index since October 15, 2010.
* Index commenced on 1/01/95.
** CDSC = 1% contingent deferred sales charge imposed on redemptions made within the first 12 months after purchase
6 | Aquila Three Peaks Opportunity Growth Fund
REPORT OF INDEPENDENT REGISTERED PUBLIC ACCOUNTING FIRM
To the Board of Trustees and Shareholders of
Aquila Three Peaks Opportunity Growth Fund:
We have audited the accompanying statement of assets and liabilities, including the schedule of investments, of Aquila Three Peaks Opportunity Growth Fund as of December 31, 2012 and the related statement of operations for the year then ended, the statements of changes in net assets for each of the two years in the period then ended, and the financial highlights for each of the five years in the period then ended. These financial statements and financial highlights are the responsibility of the Fund’s management. Our responsibility is to express an opinion on these financial statements and financial highlights based on our audits.
We conducted our audits in accordance with the standards of the Public Company Accounting Oversight Board (United States). Those standards require that we plan and perform the audit to obtain reasonable assurance about whether the financial statements and financial highlights are free of material misstatement. The Fund is not required to have, nor were we engaged to perform, an audit of the Fund’s internal control over financial reporting. Our audits included consideration of internal control over financial reporting as a basis for designing audit procedures that are appropriate in the circumstances, but not for the purpose of expressing an opinion on the effectiveness of the Fund’s internal control over financial reporting. Accordingly, we express no such opinion. An audit also includes examining, on a test basis, evidence supporting the amounts and disclosures in the financial statements. Our procedures included confirmation of securities owned as of December 31, 2012, by correspondence with the custodian and brokers or by other appropriate auditing procedures where replies from brokers were not received. An audit also includes assessing the accounting principles used and significant estimates made by management, as well as evaluating the overall financial statement presentation. We believe that our audits provide a reasonable basis for our opinion.
In our opinion, the financial statements and financial highlights referred to above present fairly, in all material respects, the financial position of Aquila Three Peaks Opportunity Growth Fund as of December 31, 2012, the results of its operations for the year then ended, the changes in its net assets for each of the two years in the period then ended, and the financial highlights for each of the five years in the period then ended, in conformity with accounting principles generally accepted in the United States of America.
TAIT, WELLER & BAKER LLP
Philadelphia, Pennsylvania
February 25, 2013
7 | Aquila Three Peaks Opportunity Growth Fund
AQUILA THREE PEAKS OPPORTUNITY GROWTH FUND
SCHEDULE OF INVESTMENTS
DECEMBER 31, 2012
| | | | | Market | |
| Shares | | Common Stocks (90.4%) | | Value | |
| | |
| | | Beverages - Wine/ Spirits (2.7%) | | | |
| | 18,874 | | Constellation Brands, Inc.+ | | $ | 667,951 | |
| | |
| | | | Broadcast Service/ Programming (2.7%) | | | | |
| | 5,742 | | Liberty Media Corp.+ | | | 666,129 | |
| | |
| | | | Cable & Satellite TV (6.8%) | | | | |
| | 6,376 | | Charter Communications, Inc.+ | | | 486,106 | |
| | 6,712 | | DIRECTV+ | | | 336,674 | |
| | 19,801 | | Dish Network Corp. | | | 720,756 | |
| | 4,592 | | EchoStar Corp.+ | | | 157,138 | |
| | | | | | | 1,700,674 | |
| | | | Casino Hotels (1.2%) | | | | |
| | 11,214 | | Ameristar Casinos, Inc | | | 294,255 | |
| | |
| | | | Commercial Services (1.9%) | | | | |
| | 15,263 | | Iron Mountain, Inc. | | | 473,916 | |
| | |
| | | | Containers - Metal/ Glass (8.0%) | | | | |
| | 14,755 | | Ball Corp | | | 660,286 | |
| | 25,268 | | Crown Holdings, Inc.+ | | | 930,115 | |
| | 9,706 | | Silgan Holdings, Inc. | | | 403,673 | |
| | | | | | | 1,994,074 | |
| | | | Containers - Paper/Plastic (6.4%) | | | | |
| | 37,127 | | Berry Plastics Group, Inc | | | 597,002 | |
| | 140,167 | | Graphic Packaging Holding Co.+ | | | 905,479 | |
| | 5,313 | | Sealed Air Corp | | | 93,031 | |
| | | | | | | 1,595,512 | |
| | | | Diversified Manufacturing Operations (0.8%) | | | | |
| �� | 2,797 | | SPX Corp | | | 196,210 | |
| | |
| | | | E-Commerce/ Services (4.7%) | | | | |
| | 9,833 | | Expedia, Inc. | | | 604,238 | |
| | 28,807 | | Liberty Interactive Corp.+ | | | 566,922 | |
| | | | | | | 1,171,160 | |
| | | | Food - Canned (1.2%) | | | | |
| | 5,627 | | Treehouse Foods, Inc.+ | | | 293,336 | |
| | |
| | | | Food - Miscellaneous/Diversified (0.4%) | | | | |
| | 3,709 | | B&G Foods, Inc | | | 105,002 | |
| | |
| | | | Funeral Services & Related Items (4.1%) | | | | |
| | 52,061 | | Service Corp. International | | | 718,962 | |
| | 39,739 | | Stewart Enterprises, Inc. | | | 303,606 | |
| | | | | | | 1,022,568 | |
8 | Aquila Three Peaks Opportunity Growth Fund
AQUILA THREE PEAKS OPPORTUNITY GROWTH FUND
SCHEDULE OF INVESTMENTS (continued)
DECEMBER 31, 2012
| | | | | Market | |
| Shares | | Common Stocks (continued) | | Value | |
| | |
| | | Generic Pharmaceuticals (1.4%) | | | |
| | 3,999 | | Watson Pharmaceuticals, Inc.+ | | $ | 343,914 | |
| | |
| | | | Health Care Facilities (3.4%) | | | | |
| | 9,082 | | Cooper Companies, Inc. | | | 839,903 | |
| | |
| | | | Hotels & Motels (1.6%) | | | | |
| | 10,195 | | Ryman Hospitality Properties, Inc. | | | 392,115 | |
| | |
| | | | Industrial Supply Distributor (0.5%) | | | | |
| | 4,651 | | MRC Global, Inc.+ | | | 129,205 | |
| | |
| | | | Internet Based Services (1.0%) | | | | |
| | 3,788 | | Liberty Ventures+ | | | 256,675 | |
| | |
| | | | Lodging (2.9%) | | | | |
| | 12,377 | | Starwood Hotels & Resorts Worldwide, Inc. | | | 709,945 | |
| | |
| | | | Medical - Biomedical (1.0%) | | | | |
| | 2,406 | | Bio-Rad Laboratories, Inc.+ | | | 252,750 | |
| | |
| | | | Medical - Generic Drugs (2.4%) | | | | |
| | 21,983 | | Mylan, Inc.+ | | | 604,093 | |
| | |
| | | | Medical - Hospitals (3.2%) | | | | |
| | 26,420 | | HCA Holdings, Inc. | | | 797,091 | |
| | |
| | | | Medical Products (0.9%) | | | | |
| | 3,211 | | Teleflex, Inc. | | | 228,976 | |
| | |
| | | | Motion Pictures & Services (2.0%) | | | | |
| | 30,772 | | Lions Gate Entertainment Corp.+ | | | 504,661 | |
| | |
| | | | Non-Hazardous Waste Disposal (2.1%) | | | | |
| | 6,464 | | Covanta Holding Corp. | | | 119,067 | |
| | 13,578 | | Republic Services, Inc. | | | 398,243 | |
| | | | | | | 517,310 | |
| | |
| | | | Oil Company - Exploration & Production (4.8%) | | | | |
| | 6,945 | | Berry Petroleum Co. | | | 233,005 | |
| | 24,287 | | Denbury Resources, Inc.+ | | | 393,449 | |
| | 16,088 | | Halcon Resources Group+ | | | 111,329 | |
| | 10,568 | | Whiting Petroleum Corp.+ | | | 458,334 | |
| | | | | | | 1,196,117 | |
| | |
| | | | Private Corrections (4.6%) | | | | |
| | 21,710 | | Corrections Corporation of America | | | 770,054 | |
| | 14,551 | | GEO Group, Inc. | | | 410,336 | |
| | | | | | | 1,180,390 | |
9 | Aquila Three Peaks Opportunity Growth Fund
AQUILA THREE PEAKS OPPORTUNITY GROWTH FUND
SCHEDULE OF INVESTMENTS (continued)
DECEMBER 31, 2012
| | | | | | | | | |
| | | | | | | | Market | |
| Shares | | Common Stocks (continued) | | | | | Value | |
| | |
| | | Publishing - Periodicals (1.3%) | | | |
| | 10,772 | | Nielsen Holdings N.V.+ | | $ | 329,516 | |
| | | | | | | | |
| | | | Real Estate Investment Trust - Hotels (1.9%) | | | | |
| | 29,941 | | Host Hotels & Resorts, Inc. | | | 469,175 | |
| | | | | | | | |
| | | | Real Estate Investment Trust - Specialty & Other (1.1%) | | | | |
| | 3,584 | | American Tower Corp. | | | 276,936 | |
| | | | | | | | |
| | | | Rental - Auto/ Equipment (2.3%) | | | | |
| | 12,273 | | United Rentals, Inc.+ | | | 558,667 | |
| | | | | | | | |
| | | | Semiconductor Devices (1.4%) | | | | |
| | 13,552 | | NXP Semiconductors N.V.+ | | | 357,366 | |
| | | | | | | | |
| | | | Semiconductor Equipment (1.5%) | | | | |
| | 11,566 | | Sensata Technologies Holdings N.V.+ | | | 375,664 | |
| | | | | | | | |
| | | | Speciality Pharmaceuticals (0.5%) | | | | |
| | 1,929 | | Valeant Pharmaceuticals International, Inc.+ | | | 115,296 | |
| | | | | | | | |
| | | | Telecom Services (1.8%) | | | | |
| | 17,959 | | tw telecom holdings, inc.+ | | | 457,416 | |
| | | | | | | | |
| | | | Telephone - Integrated (1.4%) | | | | |
| | 9,087 | | CenturyLink, Inc. | | | 355,483 | |
| | | | | | | | |
| | | | Theaters (4.0%) | | | | |
| | 15,691 | | Cinemark Holdings, Inc. | | | 407,652 | |
| | 20,652 | | National CineMedia, Inc. | | | | | | 291,813 | |
| | 21,413 | | Regal Entertainment Group | | | | | | 298,711 | |
| | | | | | | | | | 998,176 | |
| | | | Wireless Equipment (0.5%) | | | | |
| | 3,190 | | ViaSat, Inc.+ | | | | | | 124,091 | |
| | |
| | | | Total Investments (cost $18,607,502*) | | | 90.6 | % | | | 22,551,718 | |
| | | | Other assets less liabilities | | | 9.4 | | | | 2,338,445 | |
| | | | Net Assets | | | 100.0 | % | | $ | 24,890,163 | |
| | |
| | * | | Cost for Federal income tax and financial reporting purposes is identical. | | | | | |
| | | | | | | | | | | | |
| | + | | Non-income producing security. | | | | | | | | |
10 | Aquila Three Peaks Opportunity Growth Fund
AQUILA THREE PEAKS OPPORTUNITY GROWTH FUND
SCHEDULE OF INVESTMENTS (continued)
DECEMBER 31, 2012
| | | | | | | | |
| Portfolio | | Percent of | | Portfolio | | Percent of | |
| Distribution | | Investments | | Distribution | | Investments | |
| | | | | | | | |
| Beverages - Wine/Spirits | | | 3.0 | % | Medical - Hospitals | | | 3.5 | % |
| Broadcast Service/Programming | | | 3.0 | | Medical Products | | | 1.0 | |
| Cable & Satellite TV | | | 7.5 | | Motion Pictures & Services | | | 2.2 | |
| Casino Hotels | | | 1.3 | | Non-Hazardous Waste | | | | |
| Commercial Services | | | 2.1 | | Disposal | | | 2.3 | |
| Containers - Metal/Glass | | | 8.8 | | Oil Company - Exploration | | | | |
| Containers - Paper/Plastic | | | 7.1 | | & Production | | | 5.3 | |
| Diversified Manufacturing | | | | | Private Corrections | | | 5.2 | |
| Operations | | | 0.9 | | Publishing - Periodicals | | | 1.5 | |
| E-Commerce/Services | | | 5.2 | | Real Estate Investment | | | | |
| Food - Canned | | | 1.3 | | Trust - Hotels | | | 2.1 | |
| Food - Miscellaneous/Diversified | | | 0.5 | | Real Estate Investment Trust - | | | | |
| Funeral Services & Related Items | | | 4.5 | | Specialty & Other | | | 1.2 | |
| Generic Pharmaceuticals | | | 1.5 | | Rental - Auto/Equipment | | | 2.5 | |
| Health Care Facilities | | | 3.7 | | Semiconductor Devices | | | 1.6 | |
| Hotels & Motels | | | 1.7 | | Semiconductor Equipment | | | 1.7 | |
| Industrial Supply Distributor | | | 0.6 | | Specialty Pharmaceuticals | | | 0.5 | |
| Internet Based Services | | | 1.1 | | Telecom Services | | | 2.0 | |
| Lodging | | | 3.2 | | Telephone - Integrated | | | 1.6 | |
| Medical - Biomedical | | | 1.1 | | Theaters | | | 4.4 | |
| Medical - Generic Drugs | | | 2.7 | | Wireless Equipment | | | 0.6 | |
| | | | | | | | | 100.0 | % |
See accompanying notes to financial statements.
11 | Aquila Three Peaks Opportunity Growth Fund
AQUILA THREE PEAKS OPPORTUNITY GROWTH FUND
STATEMENT OF ASSETS AND LIABILITIES
DECEMBER 31, 2012
| ASSETS | | | |
| Investments at market value (cost $18,607,502) | | $ | 22,551,718 | |
| Cash | | | 925,383 | |
| Receivable for Fund shares sold | | | 2,407,629 | |
| Dividends receivable | | | 10,613 | |
| Other assets | | | 6,978 | |
| Total assets | | | 25,902,321 | |
| LIABILITIES | | | | |
| Payable for investment securities purchased | | | 665,114 | |
| Payable for Fund shares redeemed | | | 244,002 | |
| Distribution payable | | | 64,152 | |
| Distribution and service fees payable | | | 867 | |
| Management fees payable | | | 842 | |
| Accrued expenses | | | 37,181 | |
| Total liabilities | | | 1,012,158 | |
| NET ASSETS | | $ | 24,890,163 | |
| Net Assets consist of: | | | | |
| Capital Stock - Authorized an unlimited number of shares, | | | | |
| par value $0.01 per share | | $ | 8,844 | |
| Additional paid-in capital | | | 21,476,624 | |
| Net unrealized appreciation on investments (note 4) | | | 3,944,216 | |
| Accumulated net realized loss on investments | | | (539,521 | ) |
| | | $ | 24,890,163 | |
| CLASS A | | | | |
| Net Assets | | $ | 14,369,278 | |
| Capital shares outstanding | | | 511,748 | |
| Net asset value and redemption price per share | | $ | 28.08 | |
| Maximum offering price per share (100/95.75 of $28.08 adjusted | | | | |
| to nearest cent) | | $ | 29.33 | |
| CLASS C | | | | |
| Net Assets | | $ | 2,110,618 | |
| Capital shares outstanding | | | 86,325 | |
| Net asset value and offering price per share | | $ | 24.45 | |
| Redemption price per share (*a charge of 1% is imposed on the | | | | |
| redemption proceeds of the shares, or on the original price, | | | | |
| whichever is lower, if redeemed during the first 12 months | | | | |
| after purchase) | | $ | 24,45 | * |
| CLASS I | | | | |
| Net Assets | | $ | 118,582 | |
| Capital shares outstanding | | | 4,129 | |
| Net asset value, offering and redemption price per share | | $ | 28.72 | |
| CLASS Y | | | | |
| Net Assets | | $ | 8,291,685 | |
| Capital shares outstanding | | | 282,245 | |
| Net asset value, offering and redemption price per share | | $ | 29.38 | |
See accompanying notes to financial statements.
12 | Aquila Three Peaks Opportunity Growth Fund
AQUILA THREE PEAKS OPPORTUNITY GROWTH FUND
STATEMENT OF OPERATIONS
YEAR ENDED DECEMBER 31, 2012
| Investment Income: | | | | | | |
| | |
| Dividends | | | | | $ | 614,945 | |
| | |
| Expenses: | | | | | | | |
| | |
| Management fee (note 3) | | $ | 182,736 | | | | | |
| Trustees’ fees and expenses | | | 86,356 | | | | | |
| Legal fees | | | 84,016 | | | | | |
| Distribution and service fees (note 3) | | | 58,413 | | | | | |
| Registration fees and dues | | | 49,092 | | | | | |
| Transfer and shareholder servicing agent | | | | | | | | |
| fees (note 3) | | | 39,424 | | | | | |
| Shareholders’ reports | | | 21,929 | | | | | |
| Auditing and tax fees | | | 13,504 | | | | | |
| Custodian fees (note 5) | | | 5,855 | | | | | |
| Chief compliance officer services (note 3) | | | 5,452 | | | | | |
| Fund accounting fees | | | 3,636 | | | | | |
| Insurance | | | 916 | | | | | |
| Miscellaneous | | | 18,363 | | | | | |
| Total expenses | | | 569,692 | | | | | |
| | |
| Management fee waived (note 3) | | | (182,736 | ) | | | | |
| Reimbursement of expenses by Manager | | | | | | | | |
| (note 3) | | | (74,620 | ) | | | | |
| Class A distribution fee waiver (note 3) | | | (2,144 | ) | | | | |
| Expenses paid indirectly (note 5) | | | (357 | ) | | | | |
| Net expenses | | | | | | | 309,835 | |
| | |
| Net investment income | | | | | | | 305,110 | |
| | |
| Realized and Unrealized Gain (Loss) on Investments: | | | | | | | | |
| | |
| Net realized gain (loss) from securities | | | | | | | | |
| transactions | | | (463,426 | ) | | | | |
| Change in unrealized depreciation on | | | | | | | | |
| investments | | | 4,491,560 | | | | | |
| | |
| Net realized and unrealized gain (loss) on | | | | | | | | |
| investments | | | | | | | 4,028,134 | |
| Net change in net assets resulting from | | | | | | | | |
| operations | | | | | | $ | 4,333,244 | |
See accompanying notes to financial statements.
13 | Aquila Three Peaks Opportunity Growth Fund
AQUILA THREE PEAKS OPPORTUNITY GROWTH FUND
STATEMENTS OF CHANGES IN NET ASSETS
| | | Year Ended | | | Year Ended | |
| | | December 31, 2012 | | | December 31, 2011 | |
| | |
| OPERATIONS: | | | | | | |
| Net investment income | | $ | 305,110 | | | $ | (60,030 | ) |
| Net realized gain (loss) from securities | | | | | | | | |
| transactions | | | (463,426 | ) | | | 2,432 | |
| Change in unrealized depreciation on | | | | | | | | |
| investments | | | 4,491,560 | | | | (1,161,076 | ) |
| Change in net assets from operations | | | 4,333,244 | | | | (1,218,674 | ) |
| | |
| DISTRIBUTIONS TO SHAREHOLDERS (note 8): | | | | | | | | |
| Class A Shares: | | | | | | | | |
| Net investment income | | | (181,489 | ) | | | — | |
| Net realized gain on investments | | | (11,282 | ) | | | (1,239,093 | ) |
| | |
| Class C Shares: | | | | | | | | |
| Net investment income | | | (18,938 | ) | | | — | |
| Net realized gain on investments | | | (1,910 | ) | | | (208,454 | ) |
| | |
| Class I Shares: | | | | | | | | |
| Net investment income | | | (1,891 | ) | | | — | |
| Net realized gain on investments | | | (91 | ) | | | (2,188 | ) |
| | |
| Class Y Shares: | | | | | | | | |
| Net investment income | | | (102,796 | ) | | | — | |
| Net realized gain on investments | | | (5,210 | ) | | | (482,072 | ) |
| Change in net assets from distributions | | | (323,607 | ) | | | (1,931,807 | ) |
| | |
| CAPITAL SHARE TRANSACTIONS (note 7): | | | | | | | | |
| Proceeds from shares sold | | | 7,710,588 | | | | 12,238,909 | |
| Reinvested distributions | | | 259,545 | | | | 1,550,785 | |
| Short-term trading redemption fee | | | 6,063 | | | | 7,520 | |
| Cost of shares redeemed | | | (5,592,024 | ) | | | (6,260,128 | ) |
| Change in net assets from capital share | | | | | | | | |
| transactions | | | 2,384,172 | | | | 7,537,086 | |
| | |
| Change in net assets | | | 6,393,809 | | | | 4,386,605 | |
| | |
| NET ASSETS: | | | | | | | | |
| Beginning of period | | | 18,496,354 | | | | 14,109,749 | |
| | |
| End of period | | $ | 24,890,163 | | | $ | 18,496,354 | |
See accompanying notes to financial statements.
14 | Aquila Three Peaks Opportunity Growth Fund
AQUILA THREE PEAKS OPPORTUNITY GROWTH FUND
NOTES TO FINANCIAL STATEMENTS
December 31, 2012
1. Organization
Aquila Three Peaks Opportunity Growth Fund (the “Fund”), a diversified, open-end investment company, was organized as a Massachusetts business trust. The Fund was originally organized on November 3, 1993 under the name Aquila Rocky Mountain Equity Fund (“ARMEF”) and commenced operations on July 22, 1994. From that date through October 14, 2010, ARMEF’s universe of companies was primarily within the eight-state Rocky Mountain region. The Fund continues to seek capital appreciation while operating under its new name and expanded investment strategy, whereby it invests primarily in the equity securities of companies located throughout the United States.
The Fund is authorized to issue an unlimited number of shares and offers four classes of shares, Class A, Class C, Class I and Class Y Shares. Class A Shares are sold at net asset value plus a sales charge of varying size (depending upon a variety of factors) paid at the time of purchase and bear a distribution fee. Class C Shares are sold at net asset value with no sales charge payable at the time of purchase but with a level charge for service and distribution fees for six years thereafter. Class C Shares automatically convert to Class A Shares after six years. Class Y Shares are sold only through authorized financial institutions acting for investors in a fiduciary, advisory, agency, custodial or similar capacity, and are not offered directly to retail customers. Class Y Shares are sold at net asset value with no sales charge, no redemption fee, no contingent deferred sales charge (“CDSC”) and no distribution fee. Class I Shares are offered and sold only through financial intermediaries and are not offered directly to retail customers. Class I Shares are sold at net asset value with no sales charge and no redemption fee or CDSC, although a financial intermediary may charge a fee for effecting a purchase or other transaction on behalf of its customers. Class I Shares carry a distribution and a service fee. All classes of shares represent interests in the same portfolio of investments and are identical as to rights and privileges but differ with respect to the effect of sales charges, the distribution and/or service fees borne by each class, expenses specific to each class, voting rights on matters affecting a single class and the exchange privileges of each class.
2. Significant Accounting Policies
The following is a summary of significant accounting policies followed by the Fund in the preparation of its financial statements. The policies are in conformity with accounting principles generally accepted in the United States of America for investment companies.
| a) | Portfolio valuation: Securities listed on a national securities exchange or designated as national market system securities are valued at the last sale price on such exchanges or market system. Securities listed only on NASDAQ are valued in accordance with the NASDAQ Official Closing Price. Securities for which market quotations are not readily available are valued at fair value as determined in good faith by or at the direction of the Board of Trustees. Securities which mature in 60 days or less are generally valued at amortized cost if their term to maturity at purchase is 60 days or less, or by amortizing their unrealized appreciation or depreciation on the 61st day prior to maturity, if their term to maturity at purchase exceeds 60 days. |
15 | Aquila Three Peaks Opportunity Growth Fund
AQUILA THREE PEAKS OPPORTUNITY GROWTH FUND
NOTES TO FINANCIAL STATEMENTS (continued)
DECEMBER 31, 2012
b) | Fair value measurements: The Fund follows a fair value hierarchy that distinguishes between market data obtained from independent sources (observable inputs) and the Fund’s own market assumptions (unobservable inputs). These inputs are used in determining the value of the Fund’s investments and are summarized in the following fair value hierarchy: Level 1 – Unadjusted quoted prices in active markets for identical assets or liabilities that the Fund has the ability to access. |
Level 2 – Observable inputs other than quoted prices included in Level 1 that are observable for the asset or liability, either directly or indirectly. These inputs may include quoted prices for the identical instrument on an inactive market, prices for similar instruments, interest rates, prepayment speeds, credit risk, yield curves, default rates and similar data.
Level 3 – Unobservable inputs for the asset or liability, to the extent relevant observable inputs are not available, representing the Fund’s own assumptions about the assumptions a market participant would use in valuing the asset or liability, based on the best information available.
The inputs or methodology used for valuing securities are not an indication of the risk associated with investing in those securities.
The following is a summary of the valuation inputs, representing 100% of the Fund’s investments, used to value the Fund’s net assets as of December 31, 2012:
| Valuation Inputs | | | Investments in Securities | |
| | |
| Level 1 – Quoted Prices – Common Stocks* | | $ | 22,551,718 | |
| Level 2 – Other Significant Observable Inputs | | | — | |
| Level 3 – Significant Unobservable Inputs | | | — | |
| Total | | $ | 22,551,718 | |
* See schedule of investments for a detailed listing of securities.
| c) | Subsequent events: In preparing these financial statements, the Fund has evaluated events and transactions for potential recognition or disclosure through the date these financial statements were issued. |
| d) | Securities transactions and related investment income: Securities transactions are recorded on the trade date. Realized gains and losses from securities transactions are reported on the identified cost basis. Dividend income is recorded on the ex-dividend date. Interest income is recorded daily on the accrual basis. |
| e) | Federal income taxes: It is the policy of the Fund to continue to qualify as a regulated investment company by complying with the provisions of the Internal Revenue Code applicable to certain investment companies. The Fund intends to make distributions of income and securities profits sufficient to relieve it from all, or substantially all, Federal income and excise taxes. |
16 | Aquila Three Peaks Opportunity Growth Fund
AQUILA THREE PEAKS OPPORTUNITY GROWTH FUND
NOTES TO FINANCIAL STATEMENTS (continued)
DECEMBER 31, 2012
Management has reviewed the tax positions for each of the open tax years (2009-2011) or expected to be taken in the Fund’s 2012 tax returns and has concluded that there are no significant uncertain tax positions that would require recognition in the financial statements.
| f) | Multiple class allocations: All income, expenses (other than class-specific expenses), and realized and unrealized gains or losses are allocated daily to each class of shares based on the relative net assets of each class. Class-specific expenses, which include distribution and service fees and any other items that are specifically attributed to a particular class, are also charged directly to such class on a daily basis. |
| g) | Use of estimates: The preparation of financial statements in conformity with accounting principles generally accepted in the United States of America requires management to make estimates and assumptions that affect the reported amounts of assets and liabilities and disclosure of contingent assets and liabilities at the date of the financial statements and the reported amounts of increases and decreases in net assets from operations during the reporting period. Actual results could differ from those estimates. |
| h) | Reclassification of capital accounts: Accounting principles generally accepted in the United States of America require that certain components of net assets relating to permanent differences be reclassified between financial and tax reporting. On December 31, 2012 the Fund decreased accumulated net realized loss on investments by $11 and decreased additional paid-in capital by $11. These reclassifications had no effect on net assets or net asset value per share. |
| i) | Accounting pronouncement: In December 2011, FASB (the “Financial Accounting Standards Board”) issued ASU (“Accounting Standards Update”) No. 2011-11 related to disclosures about offsetting assets and liabilities. The amendments in this ASU require an entity to disclose information about offsetting and related arrangements to enable users of its financial statements to understand the effect of those arrangements on its financial position. The ASU is effective for annual reporting periods beginning on or after January 1, 2013, and interim periods within those annual periods. The guidance requires retrospective application for all comparative periods presented. Management is currently evaluating the impact this amendment may have on the Fund’s financial statements. |
3. Fees and Related Party Transactions
a) Management Arrangements:
Aquila Investment Management LLC (the “Manager”), a wholly-owned subsidiary of Aquila Management Corporation, the Fund’s founder and sponsor, serves as the Manager for the Fund under an Advisory and Administration Agreement with the Fund. The portfolio management of the Fund has been delegated to a Sub-Adviser as described below. Under the Advisory and Administrative Agreement, the Manager provides all administrative services to the Fund, other than those relating to the day-to-day portfolio management. The Manager’s services include providing the office of the Fund and all related services as well as overseeing the activities of the Sub-Adviser and all the various support organizations to the Fund such as the shareholder servicing agent, custodian, legal counsel, fund accounting agent, pricing agent, auditors and distributor. For its services, the Manager is entitled to receive a fee which is payable monthly and computed as of the close of business each day at the annual rate of 0.90 of 1% on the Fund’s net assets up to $100 million, 0.85 of 1% on such assets above $100 million up to $250 million, and 0.80 of 1% on assets above $250 million.
17 | Aquila Three Peaks Opportunity Growth Fund
AQUILA THREE PEAKS OPPORTUNITY GROWTH FUND
NOTES TO FINANCIAL STATEMENTS (continued)
DECEMBER 31, 2012
Three Peaks Capital Management, LLC (the “Sub-Adviser”) serves as the Investment Sub-Adviser for the Fund under a Sub-Advisory Agreement between the Manager and the Sub-Adviser. Under this agreement, the Sub-Adviser continuously provides, subject to oversight of the Manager and the Board of Trustees of the Fund, the investment program of the Fund and the composition of its portfolio and arranges for the purchases and sales of portfolio securities. For its services, the Sub-Adviser is entitled to receive a fee from the Manager which is payable monthly and computed as of the close of business each day at the annual rate of 0.50 of 1% on the Fund’s net assets up to $100 million, 0.45 of 1% on such assets above $100 million up to $250 million, and 0.40 of 1% on assets above $250 million.
For the year ended December 31, 2012, the Fund incurred management fees of $182,736, all of which were waived. Additionally, during this period the Manager reimbursed the Fund for other expenses in the amount of $74,620. The Manager has contractually undertaken to waive fees and/or reimburse Fund expenses during the period May 1, 2012 through April 30, 2013 so that total Fund expenses will not exceed 1.55% for Class A Shares, 2.25% for Class C Shares, 1.18% for Class I Shares and 1.25% for Class Y Shares. The Sub-Adviser has agreed to waive its fee in the same proportion as the Manager is required to waive its fee in connection with the aforementioned undertaking. For a period of three years, subsequent to the end of each of the Fund’s fiscal years, the Manager may recover from the Fund certain fees and expenses waived or reimbursed to the extent that the net unreimbursed Total Annual Fund Operating Expenses do not exceed any contractual limitations. As of December 31, 2012, the total of these amounts was $508,195 of which $250,839 expires on December 31, 2014 and $257,356 expires on December 31, 2015.
Under a Compliance Agreement with the Manager, the Manager is compensated by the Fund for Chief Compliance Officer related services provided to enable the Fund to comply with Rule 38a-1 of the Investment Company Act of 1940.
Specific details as to the nature and extent of the services provided by the Manager are more fully defined in the Fund’s Prospectus and Statement of Additional Information.
18 | Aquila Three Peaks Opportunity Growth Fund
AQUILA THREE PEAKS OPPORTUNITY GROWTH FUND
NOTES TO FINANCIAL STATEMENTS (continued)
DECEMBER 31, 2012
b) Distribution and Service Fees:
The Fund has adopted a Distribution Plan (the “Plan”) pursuant to Rule 12b-1 (the “Rule”) under the Investment Company Act of 1940. Under one part of the Plan, with respect to Class A Shares, the Fund is authorized to make distribution fee payments to broker-dealers or others (“Qualified Recipients”) selected by Aquila Distributors, Inc. (the “Distributor”), including, but not limited to, any principal underwriter of the Fund, with which the Distributor has entered into written agreements contemplated by the Rule and which have rendered assistance in the distribution and/or retention of the Fund’s shares or servicing of shareholder accounts. The Fund makes payment of this distribution fee at the annual rate of 0.30% of the Fund’s average net assets represented by Class A Shares. During the period January 1, 2012 to April 30, 2012, 0.05% (annualized) of the Class A distribution fee was waived. For the year ended December 31, 2012, distribution fees on Class A Shares amounted to $39,552, excluding waivers of $2,144, of which the Distributor retained $2,523.
Under another part of the Plan, the Fund is authorized to make payments with respect to Class C Shares to Qualified Recipients which have rendered assistance in the distribution and/or retention of the Fund’s Class C shares or servicing of shareholder accounts. These payments are made at the annual rate of 0.75% of the Fund’s average net assets represented by Class C Shares and for the year ended December 31, 2012, amounted to $14,110. In addition, under a Shareholder Services Plan, the Fund is authorized to make service fee payments with respect to Class C Shares to Qualified Recipients for providing personal services and/or maintenance of shareholder accounts. These payments are made at the annual rate of 0.25% of the Fund’s average net assets represented by Class C Shares and for the year ended December 31, 2012, amounted to $4,703. The total of these payments with respect to Class C Shares amounted to $18,813 of which the Distributor retained $3,727.
Under another part of the Plan, the Fund is authorized to make payments with respect to Class I Shares to Qualified Recipients. Class I payments, under the Plan, may not exceed, for any fiscal year of the Fund a rate (currently 0.20%) set from time to time by the Board of Trustees of not more than 0.25% of the average annual net assets represented by the Class I Shares. In addition, the Fund has a Shareholder Services Plan under which it may pay service fees (currently 0.15%) of not more than 0.25% of the average annual net assets of the Fund represented by Class I Shares. That is, the total payments under both plans will not exceed 0.50% of such net assets. For the year ended December 31, 2012, these payments were made at the average annual rate of 0.35% of such net assets and amounted to $83 of which $48 related to the Plan and $35 related to the Shareholder Services Plan.
Specific details about the Plans are more fully defined in the Fund’s Prospectus and Statement of Additional Information.
Under a Distribution Agreement, the Distributor serves as the exclusive distributor of the Fund’s shares. Through agreements between the Distributor and various brokerage and advisory firms (“intermediaries”), the Fund’s shares are sold primarily through these intermediaries with the bulk of any sales commissions inuring to such intermediaries. For the year ended December 31, 2012, total commissions on sales of Class A Shares amounted to $30,143 of which the Distributor received $3,000.
19 | Aquila Three Peaks Opportunity Growth Fund
AQUILA THREE PEAKS OPPORTUNITY GROWTH FUND
NOTES TO FINANCIAL STATEMENTS (continued)
DECEMBER 31, 2012
4. Purchases and Sales of Securities
During the year ended December 31, 2012, purchases of securities and proceeds from the sales of securities (excluding short-term investments) aggregated $8,804,665 and $8,726,659, respectively.
At December 31, 2012, the aggregate tax cost for all securities was $18,611,286. At December 31, 2012, the aggregate gross unrealized appreciation for all securities in which there is an excess of market value over tax cost amounted to $4,259,527 and aggregate gross unrealized depreciation for all securities in which there is an excess of tax cost over market value amounted to $319,095 for a net unrealized appreciation of $3,940,432.
5. Expenses
The Fund has negotiated an expense offset arrangement with its custodian wherein it receives credit toward the reduction of custodian fees and other Fund expenses whenever there are uninvested cash balances. The Statement of Operations reflects the total expenses before any offset, the amount of offset and the net expenses.
6. Portfolio Orientation
The Fund may invest no less than 70% of its net assets in equity securities believed to have the potential for capital appreciation. The Fund may invest in a range of stock market capitalizations that could include small-cap, mid-cap, and large cap. Thus the Fund may invest in common stocks without regard to whether they could be described as “growth” or “value”. The Fund may, from time-to-time, hold as much as 30% of its net assets in fixed-income securities including lower quality corporate debt securities (often referred to as high yield or “junk” bonds). These bonds generally have a greater credit risk than other types of fixed-income securities.
20 | Aquila Three Peaks Opportunity Growth Fund
AQUILA THREE PEAKS OPPORTUNITY GROWTH FUND
NOTES TO FINANCIAL STATEMENTS (continued)
DECEMBER 31, 2012
7. Capital Share Transactions
a) Transactions in Capital Shares of the Fund were as follows:
| | | Year Ended | | | Year Ended | |
| | | December 31, 2012 | | | December 31, 2011 | |
| | | Shares | | | Amount | | | Shares | | | Amount | |
| Class A Shares: | | | | | | | | | | | | |
| Proceeds from shares sold | | | 92,443 | | | $ | 2,412,829 | | | | 212,236 | | | $ | 5,747,454 | |
| Reinvested distributions | | | 5,199 | | | | 145,966 | | | | 41,885 | | | | 960,843 | |
| Cost of shares redeemed | | | (104,929 | ) | | | (2,703,235 | )(a) | | | (112,449 | ) | | | (3,004,779 | )(a) |
| Net change | | | (7,287 | ) | | | (144,440 | ) | | | 141,672 | | | | 3,703,518 | |
| Class C Shares: | | | | | | | | | | | | | | | | |
| Proceeds from shares sold | | | 20,151 | | | | 463,007 | | | | 82,163 | | | | 2,009,564 | |
| Reinvested distributions | | | 609 | | | | 14,889 | | | | 6,844 | | | | 137,223 | |
| Cost of shares redeemed | | | (22,848 | ) | | | (510,426 | ) | | | (36,489 | ) | | | (848,131 | ) |
| Net change | | | (2,088 | ) | | | (32,530 | ) | | | 52,518 | | | | 1,298,656 | |
| Class I Shares: | | | | | | | | | | | | | | | | |
| Proceeds from shares sold | | | 3,736 | | | | 107,048 | | | | 309 | | | | 8,007 | |
| Reinvested distributions | | | 51 | | | | 1,467 | | | | 93 | | | | 2,188 | |
| Cost of shares redeemed | | | (579 | ) | | | (15,219 | ) | | | (362 | ) | | | (9,809 | ) |
| Net change | | | 3,208 | | | | 93,296 | | | | 40 | | | | 386 | |
| Class Y Shares: | | | | | | | | | | | | | | | | |
| Proceeds from shares sold | | | 165,156 | | | | 4,727,704 | | | | 157,869 | | | | 4,473,884 | |
| Reinvested distributions | | | 3,309 | | | | 97,223 | | | | 18,804 | | | | 450,531 | |
| Cost of shares redeemed | | | (86,473 | ) | | | (2,357,081 | )(b) | | | (91,441 | ) | | | (2,389,889 | )(b) |
| Net change | | | 81,992 | | | | 2,467,846 | | | | 85,232 | | | | 2,534,526 | |
| Total transactions in Fund | | | | | | | | | | | | | | | | |
| shares | | | 75,825 | | | $ | 2,384,172 | | | | 279,462 | | | $ | 7,537,086 | |
(a) Net of short-term trading redemption fees of $1,640 and $3,500 for 2012 and 2011, respectively. (See note 7b)
(b) Net of short-term trading redemption fees of $4,423 and $4,020 for 2012 and 2011, respectively. (See note 7b)
| b) | Short-Term Trading Redemption Fee: The Fund and the Distributor may reject any order for the purchase of shares, on a temporary or permanent basis, from investors exhibiting a pattern of frequent or short-term trading in Fund shares. In addition, the Fund imposes a redemption fee of 2.00% of the shares’ redemption value on any redemption of Class A Shares on which a sales charge is not imposed or of Class I and Class Y Shares, if the redemption occurs within 90 days of purchase. The fee is paid to the Fund and is designed to offset the costs to the Fund caused by short-term trading in Fund shares. The Fund retains the fee charged as paid-in capital which becomes part of the Fund’s daily net asset value (NAV) calculation. The fee does not apply to shares sold under an Automatic Withdrawal Plan, or sold due to the shareholder’s death or disability. |
21 | Aquila Three Peaks Opportunity Growth Fund
AQUILA THREE PEAKS OPPORTUNITY GROWTH FUND
NOTES TO FINANCIAL STATEMENTS (continued)
DECEMBER 31, 2012
8. Income Tax Information and Distributions
The Fund declares annual distributions to shareholders from net investment income, if any, and from net realized capital gains, if any. Distributions are recorded by the Fund on the ex-dividend date and paid in additional shares at the net asset value per share, in cash, or in a combination of both, at the shareholder’s option. Dividends from net investment income and distributions from realized gains from investment transactions are determined in accordance with Federal income tax regulations, which may differ from investment income and realized gains determined under generally accepted accounting principles. These “book/tax” differences are either considered temporary or permanent in nature. To the extent these differences are permanent in nature, such amounts are reclassified within the capital accounts based on their Federal tax-basis treatment; temporary differences do not require reclassification. To the extent dividends exceed net investment income and net realized capital gains for tax purposes, they are reported as distributions from paid-in capital. As of December 31, 2012, there were post October capital loss deferrals of $150,506 which will be recognized in the following year. At December 31, 2012, the Fund had capital loss carryforwards of $385,231 that has no expiration and retains its character of short-term.
The tax character of distributions:
| | | Year Ended December 31, | |
| | | 2012 | | | 2011 | |
| | |
| Ordinary income | | $ | 321,736 | | | $ | 4,208 | |
| Long-term capital gain | | | 1,871 | | | | 1,927,599 | |
| | | $ | 323,607 | | | $ | 1,931,807 | |
As of December 31, 2012, the components of distributable earnings on a tax basis were as follows:
| Accumulated net realized loss | | $ | (385,231 | ) |
| Deferred post October losses | | | (150,506 | ) |
| Unrealized appreciation | | | 3,940,432 | |
| | | $ | 3,404,695 | |
22 | Aquila Three Peaks Opportunity Growth Fund
AQUILA THREE PEAKS OPPORTUNITY GROWTH FUND
FINANCIAL HIGHLIGHTS
For a share outstanding throughout each period
| | | Class A | |
| | | Year Ended December 31, | |
| | | 2012 | | | 2011 | | | 2010 | | | 2009 | | | 2008 | |
| Net asset value, beginning of period | | $ | 22.93 | | | $ | 26.64 | | | $ | 22.95 | | | $ | 17.57 | | | $ | 30.39 | |
| Income (loss) from investment operations: | | | | | | | | | | | | | | | | | | | | |
Net investment income (loss)(1) | | | 0.38 | | | | (0.08 | ) | | | (0.09 | ) | | | (0.05 | ) | | | (0.17 | ) |
| Net gain (loss) on securities (both | | | | | | | | | | | | | | | | | | | | |
| realized and unrealized) | | | 5.15 | | | | (1.00 | ) | | | 3.78 | | | | 5.43 | | | | (12.31 | ) |
| Total from investment operations | | | 5.53 | | | | (1.08 | ) | | | 3.69 | | | | 5.38 | | | | (12.48 | ) |
| Less distributions (note 8): | | | | | | | | | | | | | | | | | | | | |
| Dividends from net investment income | | | (0.36 | ) | | | – | | | | – | | | | – | | | | – | |
| Distributions from capital gains | | | (0.02 | ) | | | (2.64 | ) | | | – | | | | – | | | | (0.34 | ) |
| Total distributions | | | (0.38 | ) | | | (2.64 | ) | | | – | | | | – | | | | (0.34 | ) |
| Paid-in capital from redemption | | | | | | | | | | | | | | | | | | | | |
| fees (note 7b) | | | – | | | | 0.01 | | | | – | | | | – | | | | – | |
| Net asset value, end of period | | $ | 28.08 | | | $ | 22.93 | | | $ | 26.64 | | | $ | 22.95 | | | $ | 17.57 | |
| Total return (not reflecting sales charges) | | | 24.12 | % | | | (4.01 | )% | | | 16.08 | % | | | 30.62 | % | | | (41.07 | )% |
| Ratios/supplemental data | | | | | | | | | | | | | | | | | | | | |
| Net assets, end of period (in thousands) | | $ | 14,369 | | | $ | 11,904 | | | $ | 10,053 | | | $ | 8,682 | | | $ | 8,822 | |
| Ratio of expenses to average net assets | | | 1.53 | % | | | 1.50 | % | | | 1.50 | % | | | 1.50 | % | | | 1.51 | % |
| Ratio of net investment income (loss) | | | | | | | | | | | | | | | | | | | | |
| to average net assets | | | 1.47 | % | | | (0.31 | )% | | | (0.40 | )% | | | (0.26 | )% | | | (0.67 | )% |
| Portfolio turnover rate | | | 44 | % | | | 39 | % | | | 116 | % | | | 3 | % | | | 4 | % |
| | |
| The expense and net investment income ratios without the effect of the contractual expense cap were (note 3): | |
| | |
| Ratio of expenses to average net assets | | | 2.82 | % | | | 2.87 | % | | | 7.47 | % | | | 4.79 | % | | | 3.51 | % |
| Ratio of net investment income (loss) to | | | | | | | | | | | | | | | | | | | | |
| average net assets | | | 0.18 | % | | | (1.68 | )% | | | (6.37 | )% | | | (3.55 | )% | | | 2.68 | )% |
| | |
The expense ratios after giving effect to the contractual expense cap and expense offset for uninvested cash balances were (note 3): | |
| | |
| Ratio of expenses to average net assets | | | 1.53 | % | | | 1.50 | % | | | 1.50 | % | | | 1.50 | % | | | 1.50 | % |
_________________
(1) Per share amounts have been calculated using the daily average shares method.
Note: On October 15, 2010, the Fund began operations under the name Aquila Three Peaks Opportunity Growth Fund, with Three Peaks Capital Management, LLC as investment sub-adviser and an investment strategy that differs meaningfully from the prior strategy pursued by the Fund.
See accompanying notes to financial statements.
23 | Aquila Three Peaks Opportunity Growth Fund
AQUILA THREE PEAKS OPPORTUNITY GROWTH FUND
FINANCIAL HIGHLIGHTS (continued)
For a share outstanding throughout each period
| | | Class C | |
| | | Year Ended December 31, | |
| | | 2012 | | | 2011 | | | 2010 | | | 2009 | | | 2008 | |
| Net asset value, beginning of period | | $ | 20.04 | | | $ | 23.81 | | | $ | 20.67 | | | $ | 15.94 | | | $ | 27.84 | |
| Income (loss) from investment operations: | | | | | | | | | | | | | | | | | | | | |
Net investment income (loss)(1) | | | 0.18 | | | | (0.24 | ) | | | (0.23 | ) | | | (0.18 | ) | | | (0.33 | ) |
| Net gain (loss) on securities (both | | | | | | | | | | | | | | | | | | | | |
| realized and unrealized) | | | 4.47 | | | | (0.89 | ) | | | 3.37 | | | | 4.91 | | | | (11.23 | ) |
| Total from investment operations | | | 4.65 | | | | (1.13 | ) | | | 3.14 | | | | 4.73 | | | | (11.56 | ) |
| Less distributions (note 8): | | | | | | | | | | | | | | | | | | | | |
| Dividends from net investment income | | | (0.22 | ) | | | – | | | | – | | | | – | | | | – | |
| Distributions from capital gains | | | (0.02 | ) | | | (2.64 | ) | | | – | | | | – | | | | (0.34 | ) |
| Total distributions | | | (0.24 | ) | | | (2.64 | ) | | | – | | | | – | | | | (0.34 | ) |
| Net asset value, end of period | | $ | 24.45 | | | $ | 20.04 | | | $ | 23.81 | | | $ | 20.67 | | | $ | 15.94 | |
| Total return (not reflecting CDSC) | | | 23.22 | % | | | (4.74 | )% | | | 15.19 | % | | | 29.67 | % | | | (41.53 | )% |
| Ratios/supplemental data | | | | | | | | | | | | | | | | | | | | |
| Net assets, end of period (in thousands) | | $ | 2,111 | | | $ | 1,772 | | | $ | 855 | | | $ | 637 | | | $ | 940 | |
| Ratio of expenses to average net assets | | | 2.25 | % | | | 2.25 | % | | | 2.25 | % | | | 2.25 | % | | | 2.26 | % |
| Ratio of net investment income (loss) | | | | | | | | | | | | | | | | | | | | |
| to average net assets | | | 0.77 | % | | | (1.03 | )% | | | (1.11 | )% | | | (1.04 | )% | | | (1.43 | )% |
| Portfolio turnover rate | | | 44 | % | | | 39 | % | | | 116 | % | | | 3 | % | | | 4 | % |
| | |
| The expense and net investment income ratios without the effect of the contractual expense cap were (note 3): | |
| | |
| Ratio of expenses to average net assets | | | 3.52 | % | | | 3.50 | % | | | 8.27 | % | | | 5.58 | % | | | 4.22 | % |
| Ratio of net investment loss to average | | | | | | | | | | | | | | | | | | | | |
| net assets | | | (0.49 | )% | | | (2.27 | )% | | | (7.13 | )% | | | (4.37 | )% | | | (3.39 | )% |
| | |
The expense ratios after giving effect to the contractual expense cap and expense offset for uninvested cash balances were (note 3): | |
| | | | | | | | | | | | | | | | | | | | | |
| Ratio of expenses to average net assets | | | 2.25 | % | | | 2.25 | % | | | 2.25 | % | | | 2.25 | % | | | 2.25 | % |
_________________
(1) Per share amounts have been calculated using the daily average shares method.
Note: On October 15, 2010, the Fund began operations under the name Aquila Three Peaks Opportunity Growth Fund, with Three Peaks Capital Management, LLC as investment sub-adviser and an investment strategy that differs meaningfully from the prior strategy pursued by the Fund.
See accompanying notes to financial statements.
24 | Aquila Three Peaks Opportunity Growth Fund
AQUILA THREE PEAKS OPPORTUNITY GROWTH FUND
FINANCIAL HIGHLIGHTS (continued)
For a share outstanding throughout each period
| | | Class I | |
| | | Year Ended December 31, | |
| | | 2012 | | | 2011 | | | 2010 | | | 2009 | | | 2008 | |
| Net asset value, beginning of period | | $ | 23.45 | | | $ | 27.08 | | | $ | 23.24 | | | $ | 17.73 | | | $ | 30.58 | |
| Income (loss) from investment operations: | | | | | | | | | | | | | | | | | | | | |
Net investment income (loss)(1) | | | 1.08 | | | | 0.04 | | | | 0.06 | | | | 0.03 | | | | (0.11 | ) |
| Net gain (loss) on securities (both | | | | | | | | | | | | | | | | | | | | |
| realized and unrealized) | | | 4.67 | | | | (1.03 | ) | | | 3.78 | | | | 5.48 | | | | (12.40 | ) |
| Total from investment operations | | | 5.75 | | | | (0.99 | ) | | | 3.84 | | | | 5.51 | | | | (12.51 | ) |
| Less distributions (note 8): | | | | | | | | | | | | | | | | | | | | |
| Dividends from net investment income | | | (0.46 | ) | | | – | | | | – | | | | – | | | | – | |
| Distributions from capital gains | | | (0.02 | ) | | | (2.64 | ) | | | – | | | | – | | | | (0.34 | ) |
| Total distributions | | | (0.48 | ) | | | (2.64 | ) | | | – | | | | – | | | | (0.34 | ) |
| Net asset value, end of period | | $ | 28.72 | | | $ | 23.45 | | | $ | 27.08 | | | $ | 23.24 | | | $ | 17.73 | |
| Total return | | | 24.55 | % | | | (3.65 | )% | | | 16.52 | % | | | 31.08 | % | | | (40.92 | )% |
| Ratios/supplemental data | | | | | | | | | | | | | | | | | | | | |
| Net assets, end of period (in thousands) | | $ | 119 | | | $ | 21 | | | $ | 24 | | | $ | 8 | | | $ | 6 | |
| Ratio of expenses to average net assets | | | 1.17 | % | | | 1.13 | % | | | 1.13 | % | | | 1.12 | % | | | 1.30 | % |
| Ratio of net investment income (loss) | | | | | | | | | | | | | | | | | | | | |
| to average net assets | | | 3.95 | % | | | 0.14 | % | | | 0.26 | % | | | 0.14 | % | | | (0.46 | )% |
| Portfolio turnover rate | | | 44 | % | | | 39 | % | | | 116 | % | | | 3 | % | | | 4 | % |
| | |
| The expense and net investment income ratios without the effect of the contractual expense cap were (note 3): | |
| | |
| Ratio of expenses to average net assets | | | 2.55 | % | | | 2.76 | % | | | 8.68 | % | | | 4.40 | % | | | 3.37 | % |
| Ratio of net investment income (loss) | | | | | | | | | | | | | | | | | | | | |
| to average net assets | | | 2.57 | % | | | (1.48 | )% | | | (7.29 | )% | | | (3.14 | )% | | | (2.53 | )% |
| | |
The expense ratios after giving effect to the contractual expense cap and expense offset for uninvested cash balances were (note 3): | |
| | | | | | | | | | | | | | | | | | | | | |
| Ratio of expenses to average net assets | | | 1.17 | % | | | 1.13 | % | | | 1.13 | % | | | 1.12 | % | | | 1.29 | % |
_________________
(1) Per share amounts have been calculated using the daily average shares method.
Note: On October 15, 2010, the Fund began operations under the name Aquila Three Peaks Opportunity Growth Fund, with Three Peaks Capital Management, LLC as investment sub-adviser and an investment strategy that differs meaningfully from the prior strategy pursued by the Fund.
See accompanying notes to financial statements.
25 | Aquila Three Peaks Opportunity Growth Fund
AQUILA THREE PEAKS OPPORTUNITY GROWTH FUND
FINANCIAL HIGHLIGHTS (continued)
For a share outstanding throughout each period
| | | Class Y | |
| | | Year Ended December 31, | |
| | | 2012 | | | 2011 | | | 2010 | | | 2009 | | | 2008 | |
| Net asset value, beginning of period | | $ | 23.96 | | | $ | 27.63 | | | $ | 23.74 | | | $ | 18.13 | | | $ | 31.25 | |
| Income (loss) from investment operations: | | | | | | | | | | | | | | | | | | | | |
Net investment income (loss)(1) | | | 0.50 | | | | (0.02 | ) | | | 0.08 | | | | (0.01 | ) | | | (0.11 | ) |
| Net gain (loss) on securities (both | | | | | | | | | | | | | | | | | | | | |
| realized and unrealized) | | | 5.36 | | | | (1.03 | ) | | | 3.81 | | | | 5.62 | | | | (12.67 | ) |
| Total from investment operations | | | 5.86 | | | | (1.05 | ) | | | 3.89 | | | | 5.61 | | | | (12.78 | ) |
| Less distributions (note 8): | | | | | | | | | | | | | | | | | | | | |
| Dividends from net investment income | | | (0.44 | ) | | | – | | | | – | | | | – | | | | – | |
| Distributions from capital gains | | | (0.02 | ) | | | (2.64 | ) | | | – | | | | – | | | | (0.34 | ) |
| Total distributions | | | (0.46 | ) | | | (2.64 | ) | | | – | | | | – | | | | (0.34 | ) |
| Paid-in capital from redemption | | | | | | | | | | | | | | | | | | | | |
| fees (note 7b) | | | 0.02 | | | | 0.02 | | | | – | | | | – | | | | – | |
| Net asset value, end of period | | $ | 29.38 | | | $ | 23.96 | | | $ | 27.63 | | | $ | 23.74 | | | $ | 18.13 | |
| Total return | | | 24.55 | % | | | (3.72 | )% | | | 16.39 | % | | | 30.94 | % | | | (40.90 | )% |
| Ratios/supplemental data | | | | | | | | | | | | | | | | | | | | |
| Net assets, end of period (in thousands) | | $ | 8,292 | | | $ | 4,799 | | | $ | 3,178 | | | $ | 447 | | | $ | 558 | |
| Ratio of expenses to average net assets | | | 1.25 | % | | | 1.25 | % | | | 1.25 | % | | | 1.25 | % | | | 1.26 | % |
| Ratio of net investment income (loss) | | | | | | | | | | | | | | | | | | | | |
| to average net assets | | | 1.84 | % | | | (0.06 | )% | | | 0.31 | % | | | (0.03 | )% | | | (0.43 | )% |
| Portfolio turnover rate | | | 44 | % | | | 39 | % | | | 116 | % | | | 3 | % | | | 4 | % |
| | |
| The expense and net investment income ratios without the effect of the contractual expense cap were (note 3): | |
| | |
| Ratio of expenses to average net assets | | | 2.51 | % | | | 2.52 | % | | | 9.48 | % | | | 4.55 | % | | | 3.21 | % |
| Ratio of net investment income (loss) | | | | | | | | | | | | | | | | | | | | |
| to average net assets | | | 0.58 | % | | | (1.34 | )% | | | (7.93 | )% | | | (3.33 | )% | | | (2.38 | )% |
| | |
The expense ratios after giving effect to the contractual expense cap and expense offset for uninvested cash balances were (note 3): | |
| | | | | | | | | | | | | | | | | | | | | |
| Ratio of expenses to average net assets | | | 1.25 | % | | | 1.25 | % | | | 1.25 | % | | | 1.25 | % | | | 1.25 | % |
_________________
(1) Per share amounts have been calculated using the daily average shares method.
Note: On October 15, 2010, the Fund began operations under the name Aquila Three Peaks Opportunity Growth Fund, with Three Peaks Capital Management, LLC as investment sub-adviser and an investment strategy that differs meaningfully from the prior strategy pursued by the Fund.
See accompanying notes to financial statements.
26 | Aquila Three Peaks Opportunity Growth Fund
| Additional Information (unaudited) | | | | |
Trustees(1) | | | | | |
| and Officers | | | | | |
| | | | | Number of | |
| | Positions | | | Portfolios | |
| | Held with | | | in Fund | |
| Name, | Fund and | | Principal | Complex(4) | Other Directorships |
Address(2) | Length of | | Occupation(s) | Overseen | Held by Trustee |
| and Year of Birth | Service(3) | | During Past 5 Years | by Trustee | During Past 5 Years |
| | | | | | |
Interested Trustee(5) | | | | | |
| | | | | | |
Diana P. Herrmann New York, NY (1958) | Trustee since 1997 and President since 2002 | | Vice Chair and Chief Executive Officer of Aquila Management Corporation, Founder and Sponsor of the Aquila Group of Funds(6) and parent of Aquila Investment Management LLC, Manager, since 2004, President since 1997, Chief Operating Officer, 1997-2008, a Director since 1984, Secretary since 1986 and previously its Executive Vice President, Senior Vice President or Vice President, 1986-1997; Chief Executive Officer and Vice Chair since 2004, President and Manager since 2003, and Chief Operating Officer (2003-2008), of the Manager; Chair, Vice Chair, President, Executive Vice President and/ or Senior Vice President of funds in the Aquila Group of Funds since 1986; Director of the Distributor since 1997; Governor, Investment Company Institute (the U.S. mutual fund industry trade organization dedicated to protecting shareholder interests and educating the public about investing) for various periods since 2004, and head of its Small Funds Committee, 2004-2009; active in charitable and volunteer organizations. | 11 | ICI Mutual Insurance Company, a Risk Retention Group (2006-2009 and since 2010); Vice Chair and Trustee of Pacific Capital Funds of Cash Assets Trust (three Aquila money-market funds) 2004-2012 |
| | | | | | |
Non-interested Trustees | | | | | |
| | | | | | |
Tucker Hart Adams Colorado Springs, CO (1938) | Chair of the Board of Trustees since 2005 and Trustee since 1993 | | Senior Partner, Summit Economics, since 2010; President, The Adams Group, an economic consulting firm, 1989-2010; formerly Chief Economist, United Banks of Colorado; currently or formerly active with numerous professional and community organizations. | 4 | Trustee, Colorado Health Facilities Authority; advisory board, Griffis/ Blessings, Inc. (commercial property development and management); advisory board, Kachi Partners (middle market buyouts); formerly Director, Touch America and Mortgage Analysis Computer Corp. |
27 | Aquila Three Peaks Opportunity Growth Fund
| | | | | Number of | |
| | Positions | | | Portfolios | |
| | Held with | | | in Fund | |
| Name, | Fund and | | Principal | Complex(4) | Other Directorships |
Address(2) | Length of | | Occupation(s) | Overseen | Held by Trustee |
| and Year of Birth | Service(3) | | During Past 5 Years | by Trustee | During Past 5 Years |
| | | | | | |
Gary C. Cornia Orem, UT (1948) | Trustee since 2002 | | Dean, Marriott School of Management, Brigham Young University, since 2008; Director, Romney Institute of Public Management, Marriott School of Management, 2004-2008; Professor, Marriott School of Management, 1980-present; Past President, National Tax Association; Fellow, Lincoln Institute of Land Policy, 2002-present; Associate Dean, Marriott School of Management, Brigham Young University, 1991-2000; member, Utah Governor’s Tax Review Committee, 1993-2009. | 5 | Utah Foundation, Salt Lake City, UT; formerly director, Lincoln Institute of Land Policy, Cambridge, MA |
| | | | | | |
Grady Gammage, Jr. Phoenix, AZ (1951) | Trustee since 2004 | | Founding partner, Gammage & Burnham, PLC, a law firm, Phoenix, Arizona, since 1983; director, Central Arizona Water Conservation District, 1992-2004; director, Arizona State University Foundation since 1998; Senior Fellow, Morrison Institute for Public Policy; active with Urban Land Institute. | 4 | None |
| | | | | | |
Glenn P. O’Flaherty Denver, CO (1958) | Trustee since 2007 | | Chief Financial Officer and Chief Operating Officer of Lizard Investors, LLC, 2008; Co-Founder, Chief Financial Officer and Chief Compliance Officer of Three Peaks Capital Management, LLC, 2003-2005; Vice President – Investment Accounting, Global Trading and Trade Operations, Janus Capital Corporation, and Chief Financial Officer and Treasurer, Janus Funds, 1991-2002. | 3 | Trustee of Pacific Capital Funds of Cash Assets Trust (three Aquila money-market funds) 2009-2012 |
28 | Aquila Three Peaks Opportunity Growth Fund
| | | | |
| | Positions | | |
| | Held with | | |
| Name, | Fund and | | |
Address(2) | Length of | | |
| and Year of Birth | Service(3) | | Principal Occupation(s) During Past 5 Years |
| | | | |
| Officers | | | |
| | | | |
Charles E. Childs, III New York, NY (1957) | Executive Vice President since 2006 and Secretary since 2011 | | Executive Vice President of all funds in the Aquila Group of Funds and the Manager and the Manager’s parent since 2003; Chief Operating Officer of the Manager and the Manager’s parent since 2008; Secretary of all funds in the Aquila Group of Funds since 2011; formerly Senior Vice President, corporate development, Vice President, Assistant Vice President and Associate of the Manager’s parent since 1987; Executive Vice President, Senior Vice President, Vice President or Assistant Vice President of the Aquila money-market funds, 1988-2012; Director of the Distributor since 2012. |
| | | | |
Marie E. Aro Denver, CO (1955) | Senior Vice President since 2006 | | Co-President of the Distributor since 2010, Vice President, 1993-1997; Senior Vice President, Aquila Three Peaks Opportunity Growth Fund since 2004; Senior Vice President, Tax-Free Trust of Arizona since 2010 and Vice President, 2004-2010; Senior Vice President, Aquila Three Peaks High Income Fund since 2006; Senior Vice President, Churchill Tax-Free Fund of Kentucky, Hawaiian Tax-Free Trust, Aquila Narragansett Tax-Free Income Fund, Tax-Free Fund For Utah, Tax-Free Fund of Colorado and Tax-Free Trust of Oregon since 2010; Vice President, INVESCO Funds Group, 1998-2003. |
| | | | |
Paul G. O’Brien Charlotte, NC (1959) | Senior Vice President since 2010 | | Co-President, Aquila Distributors, Inc. since 2010, Managing Director, 2009-2010; Senior Vice President of Aquila Three Peaks High Income Fund, Aquila Three Peaks Opportunity Growth Fund, and each of the Aquila Municipal Bond Funds since 2010; held various positions to Senior Vice President and Chief Administrative Officer of Evergreen Investments Services, Inc., 1997-2008; Mergers and Acquisitions Coordinator for Wachovia Corporation, 1994-1997. |
| | | | |
Stephen J. Caridi New York, NY (1961) | Vice President since 2006 | | Vice President of the Distributor since 1995; Vice President, Hawaiian Tax-Free Trust since 1998; Senior Vice President, Aquila Narragansett Tax-Free Income Fund since 1998, Vice President 1996-1997; Senior Vice President, Tax-Free Fund of Colorado 2004-2009; Vice President, Aquila Three Peaks Opportunity Growth Fund since 2006. |
| | | | |
Sherri Foster Lahaina, HI (1950) | Vice President since 2006 | | Senior Vice President, Hawaiian Tax-Free Trust since 1993 and formerly Vice President or Assistant Vice President; Vice President 1997-2012 and formerly Assistant Vice President of the three Aquila money-market funds; Vice President, Aquila Three Peaks Opportunity Growth Fund since 2006; Registered Representative of the Distributor since 1985. |
29 | Aquila Three Peaks Opportunity Growth Fund
| | | | |
| | Positions | | |
| | Held with | | |
| Name, | Fund and | | |
Address(2) | Length of | | |
| and Year of Birth | Service(3) | | Principal Occupation(s) During Past 5 Years |
| | | | |
Christine L. Neimeth Portland, OR (1964) | Vice President since 1999 | | Vice President of Aquila Three Peaks Opportunity Growth Fund and Tax-Free Trust of Oregon. |
| | | | |
Alan R. Stockman Glendale, AZ (1954) | Vice President since 1999 | | Senior Vice President, Tax-Free Fund of Colorado, since 2009; Senior Vice President, Tax-Free Trust of Arizona since 2001, Vice President, 1999-2001; Vice President, Aquila Three Peaks Opportunity Growth Fund since 1999; Bank One, Commercial Client Services representative, 1997-1999; Trader and Financial Consultant, National Bank of Arizona (Zions Investment Securities Inc.), Phoenix, Arizona 1996-1997. |
| | | | |
M. Kayleen Willis Salt Lake City, UT (1963) | Vice President since 2004 | | Vice President, Tax-Free Fund For Utah since September 2003, Assistant Vice President, 2002-2003; Vice President, Aquila Three Peaks Opportunity Growth Fund, since 2004. |
| | | | |
Randall S. Fillmore New York, NY (1960) | Chief Compliance Officer since 2012 | | Chief Compliance Officer of each fund in the Aquila Group of Funds, the Manager and the Distributor since 2012; Managing Director, Fillmore & Associates, 2009-2012; Fund and Adviser Chief Compliance Officer (2002-2009), Senior Vice President - Broker Dealer Compliance (2004-2009), Schwab Funds Anti Money Laundering Officer and Identity Theft Prevention Officer (2004-2009), Vice President - Internal Audit (2000-2002), Charles Schwab Corporation; National Director, Information Systems Risk Management - Consulting Services (1999-2000), National Director, Investment Management Audit and Business Advisory Services (1992-1999), Senior Manager, Manager, Senior and Staff Roles (1983-1992), PricewaterhouseCoopers LLP. |
| | | | |
Joseph P. DiMaggio New York, NY (1956) | Chief Financial Officer since 2003 and Treasurer since 2000 | | Chief Financial Officer of each fund in the Aquila Group of Funds since 2003 and Treasurer since 2000. |
| | | | |
Yolonda S. Reynolds New York, NY (1960) | Assistant Treasurer since 2010 | | Assistant Treasurer of each fund in the Aquila Group of Funds since 2010; Director of Fund Accounting for the Aquila Group of Funds since 2007; Investment Accountant, TIAA-CREF, 2007; Senior Fund Accountant, JP Morgan Chase, 2003-2006. |
30 | Aquila Three Peaks Opportunity Growth Fund
| | | | |
| | Positions | | |
| | Held with | | |
| Name, | Fund and | | |
Address(2) | Length of | | |
| and Year of Birth | Service(3) | | Principal Occupation(s) During Past 5 Years |
| | | | |
Lori A. Vindigni New York, NY (1966) | Assistant Treasurer since 2000 | | Assistant Treasurer of each fund in the Aquila Group of Funds since 2000; Assistant Vice President of the Manager or its predecessor and current parent since 1998; Fund Accountant for the Aquila Group of Funds, 1995-1998. |
________________
(1) The Fund’s Statement of Additional Information includes additional information about the Trustees and is available, without charge, upon request by calling 800-437-1020 (toll-free) or by visiting www.aquilafunds.com or the EDGAR Database at the SEC’s internet site at www.sec.gov.
(2) The mailing address of each Trustee and officer is c/o Aquila Three Peaks Opportunity Growth Fund, 380 Madison Avenue, Suite 2300, New York, NY 10017.
(3) Each Trustee holds office until the next annual meeting of shareholders or until his or her successor is elected and qualifies. The term of office of each officer is one year.
(4) Includes certain Aquila-sponsored funds that are dormant and have no public shareholders.
(5) Ms. Herrmann is an interested person of the Fund as an officer of the Fund, as a director, officer and shareholder of the Manager’s corporate parent, as an officer and Manager of the Manager, and as a shareholder and director of the Distributor. Ms. Herrmann is the daughter of Lacy B. Herrmann, the Founder and former Trustee, Chairman and Chairman Emeritus of the Fund.
(6) The “Aquila Group of Funds” includes: Tax-Free Trust of Arizona, Tax-Free Fund of Colorado, Hawaiian Tax-Free Trust, Churchill Tax-Free Fund of Kentucky, Tax-Free Trust of Oregon, Aquila Narragansett Tax-Free Income Fund (Rhode Island) and Tax-Free Fund For Utah, each of which is a tax-free municipal bond fund and are called the “Aquila Municipal Bond Funds”; Aquila Three Peaks Opportunity Growth Fund, which is an equity fund; and Aquila Three Peaks High Income Fund, which is a high-income corporate bond fund.
31 | Aquila Three Peaks Opportunity Growth Fund
Analysis of Expenses (unaudited)
As a shareholder of the Fund, you may incur two types of costs: (1) transaction costs, including front-end sales charges with respect to Class A shares or contingent deferred sales charges (“CDSC”) with respect to Class C shares; and (2) ongoing costs, including management fees; distribution and/or service (12b-1) fees; and other Fund expenses. The table below is intended to help you understand your ongoing costs (in dollars) of investing in the Fund and to compare these costs with the ongoing costs of investing in other mutual funds.
The table below is based on an investment of $1,000 invested on July 1, 2012 and held for the six months ended December 31, 2012.
Actual Expenses
This table provides information about actual account values and actual expenses. You may use the information provided in this table, together with the amount you invested, to estimate the expenses that you paid over the period. To estimate the expenses you paid on your account, divide your ending account value by $1,000 (for example, an $8,600 ending account value divided by $1,000 = 8.6), then multiply the result by the number under the heading “Expenses Paid During the Period”.
Six months ended December 31, 2012
| | Actual | | | |
| | Total Return | Beginning | Ending | Expenses |
| | Without | Account | Account | Paid During |
| | Sales Charges(1) | Value | Value | the Period(2) |
| Class A | 11.66% | $1,000.00 | $1,116.60 | $ 8.25 |
| Class C | 11.23% | $1,000.00 | $1,112.30 | $11.95 |
| Class I | 11.81% | $1,000.00 | $1,118.10 | $ 6.28 |
| Class Y | 11.81% | $1,000.00 | $1,118.10 | $ 6.66 |
| (1) | Assumes reinvestment of all dividends and capital gain distributions, if any, at net asset value and does not reflect the deduction of the applicable sales charges with respect to Class A shares or the applicable CDSC with respect to Class C shares. Total return is not annualized, as it may not be representative of the total return for the year. |
| (2) | Expenses are equal to the annualized expense ratio of 1.55%, 2.25%, 1.18% and 1.25% for the Fund’s Class A, C, I and Y shares, respectively, multiplied by the average account value over the period, multiplied by 184/366 (to reflect the one-half year period). |
32 | Aquila Three Peaks Opportunity Growth Fund
Analysis of Expenses (unaudited) (continued)
Hypothetical Example for Comparison Purposes
The table below provides information about hypothetical account values and hypothetical expenses based on the actual expense ratio and an assumed rate of return of 5.00% per year before expenses, which is not the Fund’s actual return. The hypothetical account values and expenses may not be used to estimate the actual ending account balance or expenses you paid for the period. You may use the information provided in this table to compare the ongoing costs of investing in the Fund and other mutual funds. To do so, compare this 5.00% hypothetical example relating to the Fund with the 5.00% hypothetical examples that appear in the shareholder reports of other mutual funds.
Please note that the expenses shown in the table below are meant to highlight your ongoing costs only and do not reflect any transactional costs with respect to Class A shares. The example does not reflect the deduction of CDSC with respect to Class C shares. Therefore, the table is useful in comparing ongoing costs only, and will not help you determine the relative total costs of owning different mutual funds. In addition, if these transaction costs were included, your costs would have been higher.
Six months ended December 31, 2012
| | Hypothetical | | | |
| | Annualized | Beginning | Ending | Expenses |
| | Total | Account | Account | Paid During |
| | Return | Value | Value | the Period(1) |
| Class A | 5.00% | $1,000.00 | $1,017.34 | $ 7.86 |
| Class C | 5.00% | $1,000.00 | $1,013.83 | $11.39 |
| Class I | 5.00% | $1,000.00 | $1,019.20 | $ 5.99 |
| Class Y | 5.00% | $1,000.00 | $1,018.85 | $ 6.34 |
| (1) | Expenses are equal to the annualized expense ratio of 1.55%, 2.25%, 1.18% and 1.25% for the Fund’s Class A, C , I and Y shares, respectively, multiplied by the average account value over the period, multiplied by 184/366 (to reflect the one-half year period). |
33 | Aquila Three Peaks Opportunity Growth Fund
Information Available (unaudited)
Much of the information that the funds in the Aquila Group of Funds produce is automatically sent to you and all other shareholders. Specifically, you are routinely sent your Fund’s entire list of portfolio securities twice a year in the semi-annual and annual reports you receive. Additionally, under Fund policies, the Fund may also disclose other portfolio holdings as of a specified date (currently the Fund discloses its five largest holdings and/or sector holdings by value as of the close of the last business day of each calendar quarter in a posting to its website on approximately the 30th business day following the month end). Such information remains accessible until the next schedule is made publicly available. You may obtain a copy of the Fund’s portfolio holdings schedule for the most recently completed period by visiting the Fund’s website at www.aquilafunds. com. Whenever you wish to see a listing of your Fund’s portfolio other than in your shareholder reports, please check our website at www.aquilafunds.com or call us at 1-800-437-1020.
The Fund additionally files a complete list of its portfolio holdings with the SEC for the first and third quarters of each fiscal year on Form N-Q. Forms N-Q are available free of charge on the SEC website at www.sec.gov. You may also review or, for a fee, copy the forms at the SEC’s Public Reference Room in Washington, D.C. or by calling 1-800-SEC-0330.
Proxy Voting Record (unaudited)
Proxy Voting Guidelines and Procedures of the Fund are available without charge, upon request, by calling our toll-free number (1-800-437-1020). This information is also available at www.aquilafunds.com/ATPOGF/ATPOGFproxy.htm or on the SEC’s website www.sec.gov.
Federal Tax Status of Distributions (unaudited)
This information is presented in order to comply with a requirement of the Internal Revenue Code. No current action on the part of shareholders is required.
For the calendar year ended December 31, 2012, 99.42% of distributions paid by Aquila Three Peaks Opportunity Growth Fund during calendar year 2012 are taxable as ordinary dividend income, and the balance was long-term capital gains.
Prior to February 15, 2013, shareholders will be mailed the appropriate tax form(s) which will contain information on the status of distributions paid for the 2012 calendar year.
34 | Aquila Three Peaks Opportunity Growth Fund
PRIVACY NOTICE (unaudited)
Aquila Three Peaks Opportunity Growth Fund
Our Privacy Policy. In providing services to you as an individual who owns or is considering investing in shares of the Fund, we collect certain non-public personal information about you. Our policy is to keep this information strictly safeguarded and confidential, and to use or disclose it only as necessary to provide services to you or as otherwise permitted by law. Our privacy policy applies equally to former shareholders and persons who inquire about the Fund.
Information We Collect. ”Non-public personal information” is personally identifiable financial information about you as an individual or your family. The kinds of non-public personal information we have about you may include the information you provide us on your share purchase application or in telephone calls or correspondence with us, and information about your fund transactions and holdings, how you voted your shares and the account where your shares are held.
Information We Disclose. We disclose non-public personal information about you to companies that provide necessary services to us, such as the Fund’s transfer agent, distributor, investment adviser or sub-adviser, if any, as permitted or required by law, or as authorized by you. Any other use is strictly prohibited. We do not sell information about you or any of our fund shareholders to anyone.
Non-California Residents: We also may disclose some of this information to another fund in the Aquila Group of Funds (or its service providers) under joint marketing agreements that permit the funds to use the information only to provide you with information about other funds in the Aquila Group of Funds or new services we are offering that may be of interest to you.
California Residents Only: In addition, unless you “opt-out” of the following disclosures using the form that was mailed to you under separate cover, we may disclose some of this information to another fund in the Aquila Group of Funds (or its service providers) under joint marketing agreements that permit the funds to use the information only to provide you with information about other funds in the Aquila Group of Funds or new services we are offering that may be of interest to you.
How We Safeguard Your Information. We restrict access to non-public personal information about you to only those persons who need it to provide services to you or who are permitted by law to receive it. We maintain physical, electronic and procedural safeguards to protect the confidentiality of all non-public personal information we have about you.
If you have any questions regarding our Privacy Policy, please contact us at 1-800-437-1020.
Aquila Distributors, Inc.
Aquila Investment Management LLC
This Privacy Policy also has been adopted by Aquila Distributors, Inc. and Aquila Investment Management LLC and applies to all non-public information about you that each of these companies may obtain in connection with services provided to the Fund or to you as a shareholder of the Fund.
35 | Aquila Three Peaks Opportunity Growth Fund
(THIS PAGE INTENTIONALLY LEFT BLANK)
Founders
Lacy B. Herrmann (1929-2012)
Aquila Management Corporation, Sponsor
Manager
AQUILA INVESTMENT MANAGEMENT LLC
380 Madison Avenue, Suite 2300
New York, New York 10017
Investment Sub-Adviser
THREE PEAKS CAPITAL MANAGEMENT, LLC
3750 Dacoro Lane, Suite 100
Castle Rock, Colorado 80109
Board of Trustees
Tucker Hart Adams, Chair
Gary C. Cornia
Grady Gammage, Jr.
Diana P. Herrmann
Glenn P. O’Flaherty
Officers
Diana P. Herrmann, President
Charles E. Childs, III, Executive Vice President and Secretary
Marie E. Aro, Senior Vice President
Paul G. O’Brien, Senior Vice President
Randall S. Fillmore, Chief Compliance Officer
Joseph P. DiMaggio, Chief Financial Officer and Treasurer
Distributor
AQUILA DISTRIBUTORS, INC.
380 Madison Avenue, Suite 2300
New York, New York 10017
Transfer and Shareholder Servicing Agent
BNY MELLON
4400 Computer Drive
Westborough, Massachusetts 01581
Custodian
JPMORGAN CHASE BANK, N.A.
1111 Polaris Parkway
Columbus, Ohio 43240
Independent Registered Public Accounting Firm
TAIT, WELLER & BAKER LLP
1818 Market Street, Suite 2400
Philadelphia, Pennsylvania 19103
Further information is contained in the Prospectus,
which must precede or accompany this report.