UNITED STATES
SECURITIES AND EXCHANGE COMMISSION
Washington, D.C. 20549
FORM N-CSR
CERTIFIED SHAREHOLDER REPORT OF REGISTERED
MANAGEMENT INVESTMENT COMPANIES
Investment Company Act file number: 811-08194
FINANCIAL INVESTORS TRUST
(Exact name of Registrant as specified in charter)
1290 Broadway, Suite 1000, Denver, Colorado 80203
(Address of principal executive offices) (Zip code)
Michael Lawlor, Esq., Secretary
Financial Investors Trust
1290 Broadway, Suite 1000
Denver, Colorado 80203
(Name and address of agent for service)
Registrant’s telephone number, including area code: 303-623-2577
Date of fiscal year end: April 30
Date of reporting period: May 1, 2023 – October 31, 2023
Item 1. Reports to Stockholders.
(a) Report of Shareholders.

TABLE OF CONTENTS
SEMI-ANNUAL REPORT
| SHAREHOLDER LETTER | 1 |
| PERFORMANCE UPDATE | 4 |
| DISCLOSURE OF FUND EXPENSES | 6 |
| PORTFOLIO OF INVESTMENTS | 7 |
| STATEMENT OF ASSETS AND LIABILITIES | 19 |
| STATEMENT OF OPERATIONS | 20 |
| STATEMENTS OF CHANGES IN NET ASSETS | 21 |
| FINANCIAL HIGHLIGHTS | 22 |
| NOTES TO FINANCIAL STATEMENTS | 24 |
| ADDITIONAL INFORMATION | 31 |
| LIQUIDITY RISK MANAGEMENT PROGRAM | 32 |
| PRIVACY POLICY | 33 |
Disciplined Growth Investors’ goal is to communicate clearly and transparently with our clients and mutual fund shareholders. It is mutually beneficial when our shareholders understand how we invest, what we are currently thinking and forecasting, and the specific investment decisions we have made. Our views and opinions regarding the investment prospects of our portfolio holdings and the Fund are “forward looking statements” which may or may not be accurate over the long term. While we believe we have a reasonable basis for these forecasts and have confidence in our investment team’s views, actual results may differ materially from those we anticipate. Information provided in this report should not be considered a recommendation to purchase or sell any particular security.
You can identify forward looking statements as those including words such as “believe”, “expect”, “anticipate”, “forecast”, and similar statement. We cannot assure future performance. These forward-looking statements are made only as-of the date of this report. Following the publication of this report, we will not update any of the forward-looking statements included here.
This material must be preceded or accompanied by a prospectus. Please read the prospectus carefully before investing.
| OCTOBER 31, 2023 | DGINV.COM |
| The Disciplined Growth Investors Fund | Shareholder Letter |
| | October 31, 2023 (Unaudited) |
October 31st marked The DGI Fund’s fiscal year midway point. For the last six months, The Fund returned 7.42%. Stocks in the Fund were up 11.74%% while bonds declined 3.38%.
Since the Fund’s Inception (8/12/2011-10/31/2023), the DGI Fund has returned 10.31% (annualized). The stocks and bonds in the fund have returned annualized rates of 13.61% and 1.81%, respectively, in the same span.
For the remainder of this letter, we will focus on calendar year 2023 to-date and longer periods, as those hold more interesting and meaningful narratives than the last six months.
Calendar year 2022 presented the largest downturn since the Fund opened in 2011. Both in the Fund and in broad market indexes, stocks and bonds declined simultaneously for the first time since 1969.1 2023 has been a much different story, especially for equities. 2023 has also been a good example of how the stock market and the economy can act differently.
Coming into 2023, there was broad concern of an economic recession. Prices were continuing to increase, albeit less sharply than in 2022 and 2021. The consumer’s purchasing power was significantly eroded since the start of 2021. Rising interest rates caused a slight cooling in the housing market and likely negatively impacted private equity markets. With more interest rate hikes, bond prices fell through most of 2023. Banks struggled to absorb the pace of rate changes, with some well-publicized bank failures in March and many other bank stocks shedding value. Yet the stock market maintained an upward climb, with some hiccups in August, September, and October.
For the year-to-date, the Fund increased 14.97%, with stocks up 21.29% and bonds down slightly, returning -0.16%. Performance in stocks was both broad based and driven by a single holding. Of the 44 stocks in the Fund, 31 have increased in value thus far in the year, while 13 have posted negative performance. Super Micro Computer alone added 10.63% to the Fund’s total return. The stock is also the largest holding of The DGI Fund, at 12.03% of assets (10/31/23).
Super Micro Computer (SMCI)
The Fund’s initial purchase of SMCI was over 10 years ago. We were attracted to the way the founder had developed the company. He founded the company over thirty years ago with no venture capital money. His company has never had layoffs, has never done an acquisition and has never had a fiscal year during which the company lost money. By the time we invested, his company was generating annual sales of around $700 million.
For the first nine years the Fund held SMCI, the stock made no meaningful progress and faced some challenges. We were impressed with the reaction and transparency demonstrated by the senior management of Super Micro around these issues, and felt they were serious about becoming a major server company. The CEO’s behavior backed this view, as he cut his pay to just $1 per year and agreed to a 100% performance-based incentive program which would only pay if SMCI’s revenue and share price increased substantially.
Revenue growth came first. In 2022, Super Micro’s quarterly revenue growth was 50% or higher each quarter. This was quickly followed by expansion in profit margins – both gross and operating profits. SMCI’s operating profit margin ranged between 1.1% and 6.8% from 2020 through mid-2022. In the last three quarters of 2022, it was above 10% and has remained above pre-2022 highs during 2023.
The stock price has reflected this progress, increasing 190.85% in the calendar year-to-date.
| Semi-Annual Report | October 31, 2023 | 1 |
| The Disciplined Growth Investors Fund | Shareholder Letter |
| | October 31, 2023 (Unaudited) |
In addition to feeling good about a stock working well for us and our clients, Super Micro is encouraging to us as corporate governance is one key item in our research process. Management alignment with fundamental financial progress is something we believe is important to sustained growth.
At this point, SMCI is in a unique position in the Fund. It is the largest holding and we are keenly aware of the high allocation, yet we believe it still holds significant potential. We have trimmed the position slightly at times to manage allocation risk. That said, we are primarily focused on continuing to develop our understanding of the depth and durability of the long-term competitive advantage for SMCI and the size of their addressable market. Today, the company is generating annual revenues of about $7 billion. We believe their addressable market is around $60 billion and may well grow to $100 billion over the next decade. It is rare for a company to be both the performance leader and low-cost provider in an industry, but Super Micro appears to be executing on exactly those seemingly contradictory fronts.
A Mixed Bag for Bonds
The bond portfolio in The DGI Fund has contended with a mixture of price declines and increased yields on new purchases. The painful part, we believe, is likely mostly in the rear-view mirror. When interest rates increase, prices of existing bonds fall. For anyone not previously familiar with this dynamic, 2022 and 2023 have provided an uncomfortable primer.
On March 16, 2022, the U.S. Federal Reserve undertook the first of eight interest rate increases. Prior to the increases, the baseline Fed Funds rate was 0.25%. As of 10/31/23, it was 5.50%. The pace of the increase was nearly unprecedented in recent history. As a result, bonds in the Fund have returned -5.16% since the start of March 2022. That encapsulates the pain.
The forward-looking environment seems more favorable. At the start of March of 2022, the DGI Fund’s bond portfolio sported a yield to maturity of 2.29%. Today, that is at 6.03%, the highest such figure since we opened The DGI Fund in 2011.
The broad consensus forecast is that interest rates are likely to decline one to two years from now. We have no specific interest rate forecast, but given the improvement in yields available, our outlook for bonds is optimistic.
We entered 2023 optimistic about the Fund’s prospects, especially the equity portion. While this optimism has generally been validated so far, we still hold that view. Portfolio companies are executing well on a fundamental level. We believe stocks in the Fund are priced to offer forward returns above our hurdle rate.
New Purchases and Complete Sales
In the last six months, we did not add any new stocks to The DGI Fund or make any complete sales. We increased the position sizes of existing holdings Floor & Décor and Generac and trimmed the position sizes in Landstar System and Super Micro Computer.
Sincerely,
Frederick Martin, CFA – Portfolio Manager
Rob Nicoski, CPA* – Portfolio Manager
Nick Hansen, CFA, CAIA – Portfolio Manager
Jason Lima, CFA – Portfolio Manager
| 2 | 1-855-DGI-FUND (344-3863) | www.DGIfund.com |
| The Disciplined Growth Investors Fund | Shareholder Letter |
| | October 31, 2023 (Unaudited) |
| 1 | As measured by the S&P 500 Index’s calendar year returns and the Bloomberg Aggregate US Government/Credit Bond Index. |
The Barclay’s Government & Corporate Credit index includes both corporate (publicly-issued, fixed-rate, nonconvertible, investment grade, dollar-denominated, SEC-registered, corporate dept.) and government (Treasury Bond index, Agency Bond index, 1-3 Year Government index, and the 20+-Year treasury) indexes, including bonds with maturities up to ten years.
The S&P 500® Total Return Index is an unmanaged index of 500 common stocks chosen for market size, liquidity and industry group representation. It is a market-value weighted index. The Index is not actively managed and does not reflect any deductions for fees, expenses or taxes. An investor may not invest directly in the Index.
Asset class-specific performance is before fees. The Fund’s single fee – the management fee – is paid from the Fund’s holding of cash. Total Fund net-of-fees performance is presented in this letter, later in this annual report, and is updated monthly on the Fund’s website, www.dgifund.com.
The views of Disciplined Growth Investors, Inc. and information discussed in this commentary are as of the date of this report, are subject to change, and may not reflect the writers’ current views.
The views expressed are those of the Fund’s adviser only, and represent an assessment of market conditions at a specific point in time, are opinions only and should not be relied upon as investment advice regarding a particular investment or markets in general. Such information does not constitute a recommendation to buy or sell specific securities or investment vehicles. It should not be assumed that any investment will be profitable or will equal the performance of the portfolios or any securities or any sectors mentioned in this letter. The subject matter contained in this letter has been derived from several sources believed to be reliable and accurate at the time of compilation. Neither Disciplined Growth Investors, Inc. nor the Fund accepts any liability for losses either direct or consequential caused by the use of this information.
The Fund is distributed by ALPS Distributors, Inc.
The Fund is subject to investment risks, including possible loss of the principal amount invested and therefore is not suitable for all investors. The Fund may not achieve its objectives.
Diversification does not eliminate the risk of experiencing investment losses.
Fred Martin is a registered representative of ALPS Distributors, Inc. CFA Institute Marks are trademarks owned by the CFA Institute.
| Semi-Annual Report | October 31, 2023 | 3 |
| The Disciplined Growth Investors Fund | Performance Update |
| | October 31, 2023 (Unaudited) |
Annualized Total Return Performance (for the period ended October 31, 2023)
| | 6 Month | 1 Year | 3 Year | 5 Year | 10 Year | Since Inception* |
| The Disciplined Growth Investors Fund | 7.42% | 15.11% | 7.05% | 8.43% | 8.54% | 10.31% |
| S&P 500® Total Return Index(1) | 1.39% | 10.14% | 10.36% | 11.01% | 11.18% | 13.13% |
Performance data quoted represents past performance. Past performance does not guarantee future results. Investment return and principal value of an investment will fluctuate so that an investor’s shares, when sold or redeemed, may be worth more or less than the original cost. Current performance data may be higher or lower than actual data quoted. For the most current month-end performance data please call 1.855.DGI.FUND.
The table does not reflect the deductions of taxes a shareholder would pay on Fund distributions or redemptions of Fund shares.
Subject to investment risks, including possible loss of the principal amount invested.
Returns for periods less than 1 year are cumulative.
| * | Fund Inception date of August 12, 2011. |
| (1) | The S&P 500® Total Return Index is an unmanaged index of 500 common stocks chosen for market size, liquidity and industry group representation. It is a market-value weighted index. The Index is not actively managed and does not reflect any deductions for fees, expenses or taxes. An investor may not invest directly in the Index. |
| 4 | 1-855-DGI-FUND (344-3863) | www.DGIfund.com |
| The Disciplined Growth Investors Fund | Performance Update |
| | October 31, 2023 (Unaudited) |
Growth of $10,000 Investment in the Fund (for the period ended October 31, 2023)

The chart above represents historical performance of a hypothetical investment of $10,000 in the Fund since inception. Past performance does not guarantee future results. This chart does not reflect the deduction of taxes that a shareholder would pay on Fund distributions or the redemption of Fund shares.
Investing in the Fund is subject to investment risks, including possible loss of the principal amount invested.
Industry Sector Allocation
(as a % of Net Assets)*
| Technology | 43.71% |
| Consumer Discretionary | 11.25% |
| Energy | 5.59% |
| Industrials | 4.19% |
| Health Care | 3.82% |
| Producer Durables | 2.14% |
| Communications | 0.87% |
| Corporate Bonds | 22.79% |
| Foreign Corporate Bonds | 2.74% |
| Government Bond & Agency Obligations | 2.29% |
| Other Assets in Excess of Liabilities | 0.61% |
Top Ten Holdings
(as a % of Net Assets)*
| Super Micro Computer, Inc. | 12.03% |
| Plexus Corp. | 3.53% |
| Pure Storage, Inc. | 3.45% |
| Akamai Technologies, Inc. | 3.24% |
| Arista Networks, Inc. | 3.14% |
| Microchip Technology, Inc. | 3.06% |
| Power Integrations, Inc. | 2.78% |
| Southwestern Energy Co. | 2.78% |
| Gentex Corp. | 2.71% |
| Coterra Energy, Inc. | 2.64% |
| Top Ten Holdings | 39.36% |
| * | Holdings are subject to change, and may not reflect the current or future position of the portfolio. |
| Semi-Annual Report | October 31, 2023 | 5 |
| The Disciplined Growth Investors Fund | Disclosure of Fund Expenses |
| | October 31, 2023 (Unaudited) |
As a shareholder of the Fund, you incur two types of costs: (1) transaction costs, including sales charges (loads) on purchase payments, reinvested dividends, or other distributions; redemption fees; and exchange fees; and (2) ongoing costs, including management fees; distribution and/or service (12b-1) fees; and other fund operating expenses. This example is intended to help you understand your ongoing costs (in dollars), of investing in the Fund and to compare these costs with the ongoing costs of investing in other mutual funds.
This example is based on an investment of $1,000 invested at the beginning of the period and held for the entire six-month period of May 1, 2023 through October 31, 2023.
Actual Expenses The first line of the table below provides information about actual account values and actual expenses. You may use the information in this line, together with the amount you invested, to estimate the expenses that you paid over the period. Simply divide your account value by $1,000 (for example, an $8,600 account value divided by $1,000 = 8.6), then multiply the result by the number in the first line under the heading “Expenses Paid During Period” to estimate the expenses you paid on your account during this period.
Hypothetical Example for Comparison Purposes The second line of the table below provides information about hypothetical account values and hypothetical expenses based on the Fund’s actual expense ratio and an assumed rate of return of 5% per year before expenses, which is not the Fund’s actual return. The hypothetical account values and expenses may not be used to estimate the actual ending account balance or expenses you paid for the period. You may use this information to compare the ongoing costs of investing in the Fund and other mutual funds. To do so, compare this 5% hypothetical example with the 5% hypothetical examples that appear in the shareholder reports of the other funds.
Please note that the expenses shown in the table are meant to highlight your ongoing costs only and do not reflect transactional costs, such as sales charges (loads), redemption fees or exchange fees. Therefore, the second line of the table is useful in comparing ongoing costs only and will not help you determine the relative total costs of owning different funds. In addition, if these transactional costs were included, your costs would have been higher.
| | Beginning Account
Value
5/1/2023 | Ending Account
Value
10/31/2023 | Expense Ratio(a) | Expenses Paid During period 5/1/2023 -
10/31/2023(b) |
| Actual | $1,000.00 | $1,000.00 | 0.78% | $ 3.93 |
| Hypothetical (5% return before expenses) | $1,000.00 | $1,021.27 | 0.78% | $ 3.97 |
| (a) | The Fund's expense ratios have been annualized based on the Fund's most recent fiscal half-year expenses. |
| (b) | Expenses are equal to the Fund's annualized expense ratio, multiplied by the average account value over the period, multiplied by the number of days in the most recent fiscal half-year (184)/365 (to reflect the half-year period). |
| 6 | 1-855-DGI-FUND (344-3863) | www.DGIfund.com |
| The Disciplined Growth Investors Fund | Portfolio of Investments |
| | October 31, 2023 (Unaudited) |
| | | Shares | | | Value
(Note 2) | |
| COMMON STOCKS (71.57%) | | | | | | | | |
| COMMUNICATIONS (0.36%) | | | | | | | | |
| Media (0.36%) | | | | | | | | |
| Take-Two Interactive Software, Inc. (a) | | | 10,349 | | | $ | 1,384,179 | |
| | | | | | | | | |
| TOTAL COMMUNICATIONS | | | | | | | 1,384,179 | |
| | | | | | | | | |
| CONSUMER DISCRETIONARY (8.92%) | | | | | | | | |
| Consumer Discretionary Products (4.93%) | | | | | | | | |
| Gentex Corp. | | | 366,470 | | | | 10,510,360 | |
| Gentherm, Inc. (a) | | | 44,772 | | | | 1,800,730 | |
| LGI Homes, Inc. (a) | | | 36,758 | | | | 3,473,999 | |
| Under Armour, Inc. , Class A(a) | | | 482,930 | | | | 3,308,070 | |
| | | | | | | | 19,093,159 | |
| Consumer Discretionary Services (2.12%) | | | | | | | | |
| Royal Caribbean Cruises, Ltd. (a) | | | 66,644 | | | | 5,646,746 | |
| Strategic Education, Inc. | | | 31,052 | | | | 2,555,890 | |
| | | | | | | | 8,202,636 | |
| | | Shares | | | Value
(Note 2) | |
| CONSUMER DISCRETIONARY (continued) | | | | | | | | |
| Retail & Whsle - Discretionary (1.87%) | | | | | | | | |
| Floor & Decor Holdings, Inc. , Class A(a) | | | 65,962 | | | $ | 5,435,269 | |
| Sleep Number Corp. (a) | | | 98,188 | | | | 1,597,518 | |
| Stitch Fix, Inc. , Class A(a) | | | 62,314 | | | | 204,390 | |
| | | | | | | | 7,237,177 | |
| | | | | | | | | |
| TOTAL CONSUMER DISCRETIONARY | | | | | | | 34,532,972 | |
| | | | | | | | | |
| ENERGY (5.59%) | | | | | | | | |
| Oil & Gas (5.59%) | | | | | | | | |
| Core Laboratories, Inc. | | | 32,247 | | | | 690,731 | |
| Coterra Energy, Inc. | | | 371,382 | | | | 10,213,005 | |
| Southwestern Energy Co. (a) | | | 1,507,524 | | | | 10,748,646 | |
| | | | | | | | 21,652,382 | |
| | | | | | | | | |
| TOTAL ENERGY | | | | | | | 21,652,382 | |
| Semi-Annual Report | October 31, 2023 | 7 |
| The Disciplined Growth Investors Fund | Portfolio of Investments |
| | October 31, 2023 (Unaudited) |
| HEALTH CARE (3.82%) | | | | | | |
| Health Care (3.82%) | | | | | | |
| Align Technology, Inc. (a) | | | 31,218 | | | | 5,762,531 | |
| Intuitive Surgical, Inc. (a) | | | 27,295 | | | | 7,157,295 | |
| Myriad Genetics, Inc. (a) | | | 119,476 | | | | 1,861,436 | |
| | | | | | | | 14,781,262 | |
| | | | | | | | | |
| TOTAL HEALTH CARE | | | | | | | 14,781,262 | |
| | | | | | | | | |
| INDUSTRIALS (9.79%) | | | | | | | | |
| Industrial Products (6.11%) | | | | | | | | |
| Cognex Corp. | | | 185,508 | | | | 6,676,433 | |
| Generac Holdings, Inc. (a) | | | 28,824 | | | | 2,423,234 | |
| Graco, Inc. | | | 43,784 | | | | 3,255,340 | |
| Proto Labs, Inc. (a) | | | 115,345 | | | | 2,723,296 | |
| Snap-on, Inc. | | | 33,361 | | | | 8,605,136 | |
| | | | | | | | 23,683,439 | |
| Industrial Services (3.68%) | | | | | | | | |
| Alarm.com Holdings, Inc. (a) | | | 131,426 | | | | 6,719,811 | |
| Landstar System, Inc. | | | 31,606 | | | | 5,208,037 | |
| MSC Industrial Direct Co., Inc. , Class A | | | 24,516 | | | | 2,322,891 | |
| | | | | | | | 14,250,739 | |
| | | | | | | | | |
| TOTAL INDUSTRIALS | | | | | | | 37,934,178 | |
| | | | | | | | | |
| TECHNOLOGY (43.09%) | | | | | | | | |
| Software & Tech Services (7.76%) | | | | | | | | |
| Akamai Technologies, Inc. (a) | | | 121,431 | | | | 12,547,465 | |
| Autodesk, Inc. (a) | | | 37,045 | | | | 7,321,204 | |
| Intuit, Inc. | | | 19,113 | | | | 9,459,979 | |
| Paychex, Inc. | | | 6,506 | | | | 722,491 | |
| | | | | | | | 30,051,139 | |
| 8 | 1-855-DGI-FUND (344-3863) | www.DGIfund.com |
| The Disciplined Growth Investors Fund | Portfolio of Investments |
| | October 31, 2023 (Unaudited) |
| | | Shares | | | Value
(Note 2) | |
| TECHNOLOGY (continued) | | | | | | | | |
| Tech Hardware & Semiconductors (35.33%) | | | | | | | | |
| Arista Networks, Inc. (a) | | | 60,657 | | | $ | 12,153,843 | |
| Dolby Laboratories, Inc. , Class A | | | 113,187 | | | | 9,161,356 | |
| Garmin, Ltd. | | | 88,200 | | | | 9,043,146 | |
| InterDigital, Inc. | | | 45,019 | | | | 3,387,680 | |
| IPG Photonics Corp. (a) | | | 37,687 | | | | 3,237,313 | |
| Microchip Technology, Inc. | | | 166,007 | | | | 11,834,639 | |
| Plexus Corp. (a) | | | 139,018 | | | | 13,668,250 | |
| Power Integrations, Inc. | | | 155,567 | | | | 10,785,460 | |
| Pure Storage, Inc. , Class A(a) | | | 394,706 | | | | 13,345,010 | |
| Semtech Corp. (a) | | | 45,375 | | | | 633,435 | |
| Super Micro Computer, Inc. (a) | | | 194,531 | | | | 46,584,338 | |
| Viasat, Inc. (a) | | | 163,161 | | | | 3,008,689 | |
| | | | | | | | 136,843,159 | |
| | | | | | | | | |
| TOTAL TECHNOLOGY | | | | | | | 166,894,298 | |
| | | | | | | | | |
| TOTAL COMMON STOCKS | | | | | | | | |
| (Cost $204,425,324) | | | | | | $ | 277,179,271 | |
| | | Principal
Amount | | | Value
(Note 2) | |
| CORPORATE BONDS (22.79%) | | | | | | | | |
| COMMUNICATIONS (1.21%) | | | | | | | | |
| Cable & Satellite (0.31%) | | | | | | | | |
| Comcast Corp. | | | | | | | | |
| 2.650% 02/01/2030 | | $ | 1,440,000 | | | $ | 1,195,396 | |
| | | | | | | | | |
| Entertainment Content (0.29%) | | | | | | | | |
| Paramount Global | | | | | | | | |
| 7.875% 07/30/2030 | | | 1,140,000 | | | | 1,122,945 | |
| | | | | | | | | |
| Wireless Telecommunications Services (0.61%) | | | | | | | | |
| AT&T, Inc. | | | | | | | | |
| 4.350% 03/01/2029 | | | 1,280,000 | | | | 1,178,636 | |
| Verizon Communications, Inc. | | | | | | | | |
| 4.329% 09/21/2028 | | | 1,264,000 | | | | 1,177,381 | |
| | | | | | | | 2,356,017 | |
| | | | | | | | | |
| TOTAL COMMUNICATIONS | | | | | | | 4,674,358 | |
| Semi-Annual Report | October 31, 2023 | 9 |
| The Disciplined Growth Investors Fund | Portfolio of Investments |
| | October 31, 2023 (Unaudited) |
| | | Principal
Amount | | | Value
(Note 2) | |
| CONSUMER DISCRETIONARY (2.30%) | | | | | | | | |
| Airlines (0.29%) | | | | | | | | |
| Southwest Airlines Co. | | | | | | | | |
| 3.450% 11/16/2027 | | $ | 1,244,000 | | | $ | 1,125,418 | |
| | | | | | | | | |
| Automobiles Manufacturing (0.26%) | | | | | | | | |
| General Motors Co. | | | | | | | | |
| 5.400% 10/15/2029 | | | 1,100,000 | | | | 1,033,301 | |
| | | | | | | | | |
| Consumer Services (0.29%) | | | | | | | | |
| Cintas Corp. No 2 | | | | | | | | |
| 6.150% 08/15/2036 | | | 1,120,000 | | | | 1,114,306 | |
| | | | | | | | | |
| Restaurants (0.60%) | | | | | | | | |
| McDonald's Corp., Series MTN | | | | | | | | |
| 6.300% 03/01/2038 | | | 1,121,000 | | | | 1,131,192 | |
| Starbucks Corp. | | | | | | | | |
| 4.000% 11/15/2028 | | | 1,270,000 | | | | 1,180,969 | |
| | | | | | | | 2,312,161 | |
| | | | | | | | | |
| Retail - Consumer Discretionary (0.86%) | | | | | | | | |
| Advance Auto Parts, Inc. | | | | | | | | |
| 3.900% 04/15/2030 | | | 1,394,000 | | | | 1,130,972 | |
| Amazon.com, Inc. | | | | | | | | |
| 5.200% 12/03/2025 | | | 1,035,000 | | | | 1,033,404 | |
| Lowe's Cos., Inc. | | | | | | | | |
| 3.650% 04/05/2029 | | | 1,305,000 | | | | 1,171,074 | |
| | | | | | | | | |
| TOTAL CONSUMER DISCRETIONARY | | | | | | | 8,920,636 | |
| | | | | | | | | |
| CONSUMER STAPLES (0.91%) | | | | | | | | |
| Consumer Products (0.30%) | | | | | | | | |
| Clorox Co. | | | | | | | | |
| 3.100% 10/01/2027 | | | 1,300,000 | | | | 1,179,842 | |
| | | | | | | | | |
| Food & Beverage (0.31%) | | | | | | | | |
| Hormel Foods Corp. | | | | | | | | |
| 1.700% 06/03/2028 | | | 1,400,000 | | | | 1,188,020 | |
| 10 | 1-855-DGI-FUND (344-3863) | www.DGIfund.com |
| The Disciplined Growth Investors Fund | Portfolio of Investments |
| | October 31, 2023 (Unaudited) |
| | | Principal
Amount | | | Value
(Note 2) | |
| CONSUMER STAPLES (continued) | | | | | | | | |
| Mass Merchants (0.30%) | | | | | | | | |
| Costco Wholesale Corp. | | | | | | | | |
| 1.600% 04/20/2030 | | $ | 1,480,000 | | | $ | 1,170,617 | |
| | | | | | | | | |
| TOTAL CONSUMER STAPLES | | | | | | | 3,538,479 | |
| | | | | | | | | |
| ENERGY (2.32%) | | | | | | | | |
| Exploration & Production (0.27%) | | | | | | | | |
| ConocoPhillips Co. | | | | | | | | |
| 3.350% 05/15/2025 | | | 1,100,000 | | | | 1,057,807 | |
| | | | | | | | | |
| Integrated Oils (0.30%) | | | | | | | | |
| BP Capital Markets America, Inc. | | | | | | | | |
| 4.893% 09/11/2033 | | | 1,253,000 | | | | 1,147,544 | |
| | | | | | | | | |
| Pipeline (1.45%) | | | | | | | | |
| El Paso Natural Gas Co. LLC | | | | | | | | |
| 7.500% 11/15/2026 | | | 1,000,000 | | | | 1,039,071 | |
| Energy Transfer LP | | | | | | | | |
| 5.250% 04/15/2029 | | | 1,245,000 | | | | 1,181,964 | |
| Enterprise Products Operating LLC | | | | | | | | |
| 3.125% 07/31/2029 | | | 1,355,000 | | | | 1,176,709 | |
| MPLX LP | | | | | | | | |
| 2.650% 08/15/2030 | | | 1,463,000 | | | | 1,156,272 | |
| ONEOK, Inc. | | | | | | | | |
| 6.875% 09/30/2028 | | | 1,062,000 | | | | 1,080,435 | |
| | | | | | | | 5,634,451 | |
| Refining & Marketing (0.30%) | | | | | | | | |
| Phillips 66 | | | | | | | | |
| 2.150% 12/15/2030 | | | 1,498,000 | | | | 1,157,972 | |
| | | | | | | | | |
| TOTAL ENERGY | | | | | | | 8,997,774 | |
| | | | | | | | | |
| FINANCIALS (4.40%) | | | | | | | | |
| Banks (1.16%) | | | | | | | | |
| Regions Financial Corp. | | | | | | | | |
| 1.800% 08/12/2028 | | | 1,465,000 | | | | 1,145,373 | |
| Truist Financial Corp., Series MTN | | | | | | | | |
| 3.875% 03/19/2029 | | | 1,364,000 | | | | 1,166,281 | |
| US Bancorp, Series DMTN | | | | | | | | |
| 3.000% 07/30/2029 | | | 1,416,000 | | | | 1,158,538 | |
| Semi-Annual Report | October 31, 2023 | 11 |
| The Disciplined Growth Investors Fund | Portfolio of Investments |
| | October 31, 2023 (Unaudited) |
| | | Principal
Amount | | | Value
(Note 2) | |
| FINANCIALS (continued) | | | | | | | | |
| Banks (continued) | | | | | | | | |
| Wachovia Corp. | | | | | | | | |
| 7.574% 08/01/2026 | | $ | 995,000 | | | $ | 1,030,510 | |
| | | | | | | | 4,500,702 | |
| Commercial Finance (0.30%) | | | | | | | | |
| GATX Corp. | | | | | | | | |
| 4.700% 04/01/2029 | | | 1,275,000 | | | | 1,176,155 | |
| | | | | | | | | |
| Consumer Finance (0.56%) | | | | | | | | |
| American Express Co. | | | | | | | | |
| 3.300% 05/03/2027 | | | 1,176,000 | | | | 1,076,656 | |
| Capital One Financial Corp. | | | | | | | | |
| 4.200% 10/29/2025 | | | 1,150,000 | | | | 1,090,918 | |
| | | | | | | | 2,167,574 | |
| Diversified Banks (0.91%) | | | | | | | | |
| Bank of America Corp., Series L | | | | | | | | |
| 4.183% 11/25/2027 | | | 1,280,000 | | | | 1,177,841 | |
| Citigroup, Inc. | | | | | | | | |
| 4.125% 07/25/2028 | | | 1,300,000 | | | | 1,167,479 | |
| JPMorgan Chase & Co. | | | | | | | | |
| 4.125% 12/15/2026 | | | 1,255,000 | | | | 1,186,095 | |
| | | | | | | | 3,531,415 | |
| Financial Services (0.57%) | | | | | | | | |
| Morgan Stanley | | | | | | | | |
| 5.000% 11/24/2025 | | | 1,030,000 | | | | 1,006,689 | |
| Northern Trust Corp. | | | | | | | | |
| 3M US L + 1.131% 05/08/2032 (b) | | | 1,349,000 | | | | 1,186,461 | |
| | | | | | | | 2,193,150 | |
| Life Insurance (0.29%) | | | | | | | | |
| Principal Financial Group, Inc. | | | | | | | | |
| 3.100% 11/15/2026 | | | 1,201,000 | | | | 1,107,996 | |
| | | | | | | | | |
| Real Estate (0.61%) | | | | | | | | |
| Simon Property Group LP | | | | | | | | |
| 2.450% 09/13/2029 | | | 1,440,000 | | | | 1,176,066 | |
| 12 | 1-855-DGI-FUND (344-3863) | www.DGIfund.com |
| The Disciplined Growth Investors Fund | Portfolio of Investments |
| | October 31, 2023 (Unaudited) |
| | | Principal
Amount | | | Value
(Note 2) | |
| FINANCIALS (continued) | | | | | | | | |
| Real Estate (continued) | | | | | | | | |
| Welltower OP LLC | | | | | | | | |
| 4.125% 03/15/2029 | | $ | 1,310,000 | | | $ | 1,183,065 | |
| | | | | | | | 2,359,131 | |
| | | | | | | | | |
| TOTAL FINANCIALS | | | | | | | 17,036,123 | |
| | | | | | | | | |
| HEALTH CARE (1.49%) | | | | | | | | |
| Health Care Facilities & Services (0.30%) | | | | | | | | |
| CVS Health Corp. | | | | | | | | |
| 3.250% 08/15/2029 | | | 1,362,000 | | | | 1,177,193 | |
| | | | | | | | | |
| Managed Care (0.31%) | | | | | | | | |
| Elevance Health, Inc. | | | | | | | | |
| 3.650% 12/01/2027 | | | 1,284,000 | | | | 1,183,291 | |
| | | | | | | | | |
| Pharmaceuticals (0.88%) | | | | | | | | |
| AbbVie, Inc. | | | | | | | | |
| 4.250% 11/14/2028 | | | 1,255,000 | | | | 1,181,942 | |
| Astrazeneca Finance LLC | | | | | | | | |
| 1.750% 05/28/2028 | | | 1,400,000 | | | | 1,191,998 | |
| Bristol-Myers Squibb Co. | | | | | | | | |
| 6.800% 11/15/2026 | | | 1,000,000 | | | | 1,046,361 | |
| | | | | | | | 3,420,301 | |
| | | | | | | | | |
| TOTAL HEALTH CARE | | | | | | | 5,780,785 | |
| | | | | | | | | |
| INDUSTRIALS (3.08%) | | | | | | | | |
| Aerospace & Defense (0.87%) | | | | | | | | |
| General Dynamics Corp. | | | | | | | | |
| 3.500% 05/15/2025 | | | 1,100,000 | | | | 1,067,738 | |
| Northrop Grumman Corp. | | | | | | | | |
| 4.400% 05/01/2030 | | | 1,224,000 | | | | 1,129,022 | |
| RTX Corp. | | | | | | | | |
| 7.500% 09/15/2029 | | | 1,085,000 | | | | 1,166,430 | |
| | | | | | | | 3,363,190 | |
| Engineering & Construction (0.18%) | | | | | | | | |
| Fluor Corp. | | | | | | | | |
| 4.250% 09/15/2028 | | | 750,000 | | | | 680,850 | |
| Semi-Annual Report | October 31, 2023 | 13 |
| The Disciplined Growth Investors Fund | Portfolio of Investments |
| | October 31, 2023 (Unaudited) |
| | | Principal
Amount | | | Value
(Note 2) | |
| INDUSTRIALS (continued) | | | | | | | | |
| Industrial Other (0.30%) | | | | | | | | |
| Emerson Electric Co. | | | | | | | | |
| 2.000% 12/21/2028 | | $ | 1,370,000 | | | $ | 1,161,458 | |
| | | | | | | | | |
| Railroad (0.59%) | | | | | | | | |
| CSX Corp. | | | | | | | | |
| 3.400% 08/01/2024 | | | 1,124,000 | | | | 1,103,632 | |
| Union Pacific Corp. | | | | | | | | |
| 2.400% 02/05/2030 | | | 1,419,000 | | | | 1,166,523 | |
| | | | | | | | 2,270,155 | |
| Transportation & Logistics (0.58%) | | | | | | | | |
| FedEx Corp. | | | | | | | | |
| 2.400% 05/15/2031 | | | 1,468,000 | | | | 1,148,336 | |
| United Parcel Service, Inc. | | | | | | | | |
| 6.200% 01/15/2038 | | | 1,092,000 | | | | 1,118,839 | |
| | | | | | | | 2,267,175 | |
| Waste & Environment Services & Equipment (0.56%) | | | | | | | | |
| Republic Services, Inc. | | | | | | | | |
| 2.300% 03/01/2030 | | | 1,429,000 | | | | 1,159,956 | |
| Waste Management, Inc. | | | | | | | | |
| 7.000% 07/15/2028 | | | 953,000 | | | | 1,016,566 | |
| | | | | | | | 2,176,522 | |
| | | | | | | | | |
| TOTAL INDUSTRIALS | | | | | | | 11,919,350 | |
| | | | | | | | | |
| MATERIALS (0.31%) | | | | | | | | |
| Chemicals (0.31%) | | | | | | | | |
| Dow Chemical Co. | | | | | | | | |
| 7.375% 11/01/2029 | | | 1,108,000 | | | | 1,172,001 | |
| DuPont de Nemours, Inc. | | | | | | | | |
| 4.725% 11/15/2028 | | | 14,000 | | | | 13,387 | |
| | | | | | | | 1,185,388 | |
| | | | | | | | | |
| TOTAL MATERIALS | | | | | | | 1,185,388 | |
| | | | | | | | | |
| UTILITIES (6.77%) | | | | | | | | |
| Utilities (6.77%) | | | | | | | | |
| Ameren Corp. | | | | | | | | |
| 1.750% 03/15/2028 | | | 1,410,000 | | | | 1,181,927 | |
| Appalachian Power Co., Series AA | | | | | | | | |
| 2.700% 04/01/2031 | | | 1,464,000 | | | | 1,154,382 | |
| 14 | 1-855-DGI-FUND (344-3863) | www.DGIfund.com |
| The Disciplined Growth Investors Fund | Portfolio of Investments |
| | October 31, 2023 (Unaudited) |
| | | Principal
Amount | | | Value
(Note 2) | |
| UTILITIES (continued) | | | | | | | | |
| Utilities (continued) | | | | | | | | |
| Arizona Public Service Co. | | | | | | | | |
| 2.600% 08/15/2029 | | $ | 1,405,000 | | | $ | 1,192,416 | |
| Black Hills Corp. | | | | | | | | |
| 3.050% 10/15/2029 | | | 1,410,000 | | | | 1,170,140 | |
| CenterPoint Energy, Inc. | | | | | | | | |
| 4.250% 11/01/2028 | | | 1,201,000 | | | | 1,100,298 | |
| CMS Energy Corp. | | | | | | | | |
| 3.450% 08/15/2027 | | | 1,303,000 | | | | 1,193,618 | |
| Commonwealth Edison Co., Series 122 | | | | | | | | |
| 2.950% 08/15/2027 | | | 1,300,000 | | | | 1,179,947 | |
| DTE Electric Co. | | | | | | | | |
| 6.350% 10/15/2032 | | | 1,023,000 | | | | 1,032,394 | |
| Duke Energy Corp. | | | | | | | | |
| 3.400% 06/15/2029 | | | 1,342,000 | | | | 1,176,030 | |
| Eastern Energy Gas Holdings LLC, Series B | | | | | | | | |
| 3.000% 11/15/2029 | | | 939,000 | | | | 784,417 | |
| Interstate Power and Light Co. | | | | | | | | |
| 3.600% 04/01/2029 | | | 1,300,000 | | | | 1,167,080 | |
| National Rural Utilities Cooperative Finance Corp. | | | | | | | | |
| 1.650% 06/15/2031 | | | 1,500,000 | | | | 1,096,983 | |
| Nevada Power Co., Series N | | | | | | | | |
| 6.650% 04/01/2036 | | | 1,330,000 | | | | 1,339,294 | |
| NextEra Energy Capital Holdings, Inc. | | | | | | | | |
| 3.500% 04/01/2029 | | | 1,330,000 | | | | 1,172,561 | |
| NiSource, Inc. | | | | | | | | |
| 2.950% 09/01/2029 | | | 1,325,000 | | | | 1,128,418 | |
| Oncor Electric Delivery Co. LLC | | | | | | | | |
| 3.700% 11/15/2028 | | | 1,289,000 | | | | 1,180,790 | |
| PPL Electric Utilities Corp. | | | | | | | | |
| 6.450% 08/15/2037 | | | 963,000 | | | | 953,046 | |
| Public Service Electric and Gas Co. | | | | | | | | |
| 3.200% 05/15/2029 | | | 1,340,000 | | | | 1,180,851 | |
| Puget Energy, Inc. | | | | | | | | |
| 4.100% 06/15/2030 | | | 1,355,000 | | | | 1,158,721 | |
| Southern Co., Series 21-B | | | | | | | | |
| 1.750% 03/15/2028 | | | 1,415,000 | | | | 1,188,797 | |
| Tampa Electric Co. | | | | | | | | |
| 3.875% 07/12/2024 | | | 1,120,000 | | | | 1,103,929 | |
| WEC Energy Group, Inc. | | | | | | | | |
| 4.750% 01/15/2028 | | | 1,240,000 | | | | 1,186,227 | |
| Semi-Annual Report | October 31, 2023 | 15 |
| The Disciplined Growth Investors Fund | Portfolio of Investments |
| | October 31, 2023 (Unaudited) |
| | | Principal
Amount | | | Value
(Note 2) | |
| UTILITIES (continued) | | | | | | | | |
| Utilities (continued) | | | | | | | | |
| Xcel Energy, Inc. | | | | | | | | |
| 2.600% 12/01/2029 | | $ | 1,420,000 | | | $ | 1,174,409 | |
| | | | | | | | 26,196,675 | |
| | | | | | | | | |
| TOTAL UTILITIES | | | | | | | 26,196,675 | |
| | | | | | | | | |
| TOTAL CORPORATE BONDS | | | | | | | | |
| (Cost $97,665,625) | | | | | | $ | 88,249,568 | |
| | | | | | | | | |
| FOREIGN CORPORATE BONDS (2.74%) | | | | | | | | |
| ENERGY (0.90%) | | | | | | | | |
| Exploration & Production (0.31%) | | | | | | | | |
| Canadian Natural Resources, Ltd. | | | | | | | | |
| 3.850% 06/01/2027 | | | 1,280,000 | | | | 1,187,040 | |
| | | | | | | | | |
| Pipeline (0.59%) | | | | | | | | |
| Enbridge, Inc. | | | | | | | | |
| 5.700% 03/08/2033 | | | 1,223,000 | | | | 1,144,116 | |
| TransCanada PipeLines, Ltd. | | | | | | | | |
| 7.250% 08/15/2038 | | | 1,130,000 | | | | 1,162,550 | |
| | | | | | | | 2,306,666 | |
| | | | | | | | | |
| TOTAL ENERGY | | | | | | | 3,493,706 | |
| | | | | | | | | |
| FINANCIALS (0.92%) | | | | | | | | |
| Diversified Banks (0.92%) | | | | | | | | |
| Bank of Nova Scotia | | | | | | | | |
| 4.750% 02/02/2026 | | | 1,225,000 | | | | 1,194,066 | |
| Royal Bank of Canada, Series GMTN | | | | | | | | |
| 4.650% 01/27/2026 | | | 1,229,000 | | | | 1,191,832 | |
| Toronto-Dominion Bank | | | | | | | | |
| 1.200% 06/03/2026 | | | 1,340,000 | | | | 1,188,382 | |
| | | | | | | | | |
| TOTAL FINANCIALS | | | | | | | 3,574,280 | |
| | | | | | | | | |
| HEALTH CARE (0.30%) | | | | | | | | |
| Pharmaceuticals (0.30%) | | | | | | | | |
| Pfizer Investment Enterprises Pte, Ltd. | | | | | | | | |
| 4.450% 05/19/2028 | | | 1,220,000 | | | | 1,166,605 | |
| | | | | | | | | |
| TOTAL HEALTH CARE | | | | | | | 1,166,605 | |
| 16 | 1-855-DGI-FUND (344-3863) | www.DGIfund.com |
| The Disciplined Growth Investors Fund | Portfolio of Investments |
| | October 31, 2023 (Unaudited) |
| | | Principal
Amount | | | Value
(Note 2) | |
| INDUSTRIALS (0.31%) | | | | | | | | |
| Railroad (0.31%) | | | | | | | | |
| Canadian Pacific Railway Co. | | | | | | | | |
| 2.900% 02/01/2025 | | $ | 1,250,000 | | | $ | 1,205,348 | |
| | | | | | | | | |
| TOTAL INDUSTRIALS | | | | | | | 1,205,348 | |
| | | | | | | | | |
| MATERIALS (0.31%) | | | | | | | | |
| Metals & Mining (0.31%) | | | | | | | | |
| BHP Billiton Finance USA, Ltd. | | | | | | | | |
| 4.750% 02/28/2028 | | | 1,220,000 | | | | 1,178,421 | |
| | | | | | | | | |
| TOTAL MATERIALS | | | | | | | 1,178,421 | |
| | | | | | | | | |
| TOTAL FOREIGN CORPORATE BONDS | | | | | | | | |
| (Cost $11,343,544) | | | | | | $ | 10,618,360 | |
| | | | | | | | | |
| GOVERNMENT & AGENCY OBLIGATIONS (2.29%) | | | | | | | | |
| U.S. Treasury Bonds | | | | | | | | |
| 2.875% 08/15/2028 | | | 290,000 | | | | 265,514 | |
| U.S. Treasury Notes | | | | | | | | |
| 0.250% 06/15/2024 | | | 3,000,000 | | | | 2,904,463 | |
| 0.250% 08/31/2025 | | | 3,500,000 | | | | 3,205,234 | |
| 4.125% 06/15/2026 | | | 670,000 | | | | 656,705 | |
| 4.250% 05/31/2025 | | | 670,000 | | | | 660,421 | |
| 4.500% 11/15/2025 | | | 1,200,000 | | | | 1,187,016 | |
| | | | | | | | | |
| TOTAL GOVERNMENT & AGENCY OBLIGATIONS | | | | | | | | |
| (Cost $8,955,676) | | | | | | $ | 8,879,353 | |
| | | Yield | | | Shares | | | Value
(Note 2) | |
| SHORT TERM INVESTMENTS (0.31%) | | | | | | | | | | | | |
| MONEY MARKET FUND (0.31%) | | | | | | | | | | | | |
| First American Treasury Obligations | | | | | | | | | | | | |
| Fund, 12/31/2049 | | | 5.270 | %(c) | | | 1,173,314 | | | | 1,173,314 | |
| | | | | | | | | | | | | |
| TOTAL SHORT TERM INVESTMENTS | | | | | | | | | | | | |
| (Cost $1,173,314) | | | | | | | | | | $ | 1,173,314 | |
| Semi-Annual Report | October 31, 2023 | 17 |
| The Disciplined Growth Investors Fund | Portfolio of Investments |
| | October 31, 2023 (Unaudited) |
| TOTAL INVESTMENTS (99.70%) | | | | | | | | | |
| (Cost $323,563,483) | | | | | | | | | | $ | 386,099,866 | |
| | | | | | | | | | | | | |
| Other Assets In Excess Of Liabilities (0.30%) | | | | | | | | | | | 1,173,036 | |
| | | | | | | | | | | | | |
| NET ASSETS (100.00%) | | | | | | | | | | $ | 387,272,902 | |
| (a) | Non-Income Producing Security. |
| (b) | Floating or variable rate security. The reference rate is described below. The rate in effect as of October 31, 2023 is based on the reference rate plus the displayed spread as of the securities last reset date. |
| (c) | Represents the 7-day yield. |
Common Abbreviations:
LLC - Limited Liability Company
LP - Limited Partnership
Ltd. - Limited
Reference Rates:
3M US L - 3 Month Synthetic LIBOR as of October 31, 2023 was 5.64%
As a result of supervisory guidance and requirements of law, regulated entities have generally ceased investing in LIBOR contracts. Moreover, most LIBOR settings have ceased to be published. Some LIBOR settings continue to be published but only on a temporary, synthetic and non-representative basis. All such synthetic LIBOR settings are expected to be discontinued by September 30, 2024.
For Fund compliance purposes, the Fund's industry classifications refer to any one or more of the industry sub-classifications used by one or more widely recognized market indexes or ratings group indexes, and/or as defined by Fund management. This definition may not apply for purposes of this report, which may combine industry sub-classifications for reporting ease. Industries are shown as a percent of net assets.
See Notes to Financial Statements.
| 18 | 1-855-DGI-FUND (344-3863) | www.DGIfund.com |
| The Disciplined Growth Investors Fund | Statement of Assets and Liabilities |
| | October 31, 2023 (Unaudited) |
| ASSETS | | | |
| Investments, at value | | $ | 386,099,866 | |
| Receivable for investments sold | | | 1,194,664 | |
| Receivable for shares sold | | | 280,000 | |
| Dividends and interest receivable | | | 1,188,573 | |
| Total assets | | | 388,763,103 | |
| | | | | |
| LIABILITIES | | | | |
| Payable for investments purchased | | | 1,108,655 | |
| Payable for shares redeemed | | | 115,591 | |
| Payable to adviser | | | 265,955 | |
| Total liabilities | | | 1,490,201 | |
| NET ASSETS | | $ | 387,272,902 | |
| | | | | |
| NET ASSETS CONSIST OF | | | | |
| Paid-in capital (Note 5) | | $ | 315,724,882 | |
| Distributable Earnings | | | 71,548,020 | |
| NET ASSETS | | $ | 387,272,902 | |
| | | | | |
| INVESTMENTS, AT COST | | $ | 323,563,483 | |
| | | | | |
| PRICING OF SHARES | | | | |
| Net Asset Value, offering and redemption price per share | | $ | 21.79 | |
| Shares of beneficial interest outstanding | | | 17,773,197 | |
See Notes to Financial Statements.
| Semi-Annual Report | October 31, 2023 | 19 |
| The Disciplined Growth Investors Fund | Statement of Operations |
| | | For the Six Months Ended October 31, 2023 (Unaudited) | |
| INVESTMENT INCOME | | | | |
| Dividends | | $ | 927,882 | |
| Interest | | | 2,226,710 | |
| Total investment income | | | 3,154,592 | |
| | | | | |
| EXPENSES | | | | |
| Investment advisory fees (Note 6) | | | 1,600,203 | |
| Total expenses | | | 1,600,203 | |
| NET INVESTMENT INCOME | | | 1,554,389 | |
| | | | | |
| REALIZED AND UNREALIZED GAIN ON INVESTMENTS | | | | |
| Net realized gain on investments | | | 10,281,856 | |
| Net change in unrealized appreciation on investments | | | 14,491,327 | |
| NET REALIZED AND UNREALIZED GAIN ON INVESTMENTS | | | 24,773,183 | |
| NET INCREASE IN NET ASSETS RESULTING FROM OPERATIONS | | $ | 26,327,572 | |
See Notes to Financial Statements.
| 20 | 1-855-DGI-FUND (344-3863) | www.DGIfund.com |
| Statements of Changes in Net Assets |
| | | For the Six Months Ended October 31, 2023 (Unaudited) | | | For the Year Ended April 30, 2023 | |
| OPERATIONS | | | | | | | | |
| Net investment income | | $ | 1,554,389 | | | $ | 3,070,654 | |
| Net realized gain/(loss) | | | 10,281,856 | | | | (1,397,790 | ) |
| Net change in unrealized appreciation | | | 14,491,327 | | | | 4,616,078 | |
| Net increase in net assets resulting from operations | | | 26,327,572 | | | | 6,288,942 | |
| | | | | | | | | |
| DISTRIBUTIONS (Note 3) | | | | | | | | |
| From distributable earnings | | | (1,519,362 | ) | | | (8,142,755 | ) |
| Net decrease in net assets from distributions | | | (1,519,362 | ) | | | (8,142,755 | ) |
| | | | | | | | | |
| CAPITAL SHARE TRANSACTIONS (Note 5) | | | | | | | | |
| Proceeds from sales of shares | | | 10,464,332 | | | | 29,649,276 | |
| Issued to shareholders in reinvestment of distributions | | | 1,498,568 | | | | 8,078,561 | |
| Cost of shares redeemed | | | (7,795,835 | ) | | | (22,079,671 | ) |
| Net increase from capital share transactions | | | 4,167,065 | | | | 15,648,166 | |
| | | | | | | | | |
| Net increase in net assets | | | 28,975,275 | | | | 13,794,353 | |
| | | | | | | | | |
| NET ASSETS | | | | | | | | |
| Beginning of period | | | 358,297,627 | | | | 344,503,274 | |
| End of period | | $ | 387,272,902 | | | $ | 358,297,627 | |
| | | | | | | | | |
| OTHER INFORMATION | | | | | | | | |
| Share Transactions | | | | | | | | |
| Issued | | | 444,254 | | | | 1,494,874 | |
| Issued to shareholders in reinvestment of distributions | | | 63,844 | | | | 412,883 | |
| Redeemed | | | (335,219 | ) | | | (1,100,819 | ) |
| Net increase in share transactions | | | 172,879 | | | | 806,938 | |
See Notes to Financial Statements.
| Semi-Annual Report | October 31, 2023 | 21 |
| The Disciplined Growth Investors Fund |
| NET ASSET VALUE, BEGINNING OF PERIOD |
| |
| INCOME FROM OPERATIONS |
| Net investment income(a) |
| Net realized and unrealized gain/(loss) on investments |
| Total from investment operations |
| |
| DISTRIBUTIONS |
| From net investment income |
| From net realized gain on investments |
| Total distributions |
| |
| INCREASE/(DECREASE) IN NET ASSET VALUE |
| |
| NET ASSET VALUE, END OF PERIOD |
| |
| TOTAL RETURN |
| |
| RATIOS AND SUPPLEMENTAL DATA |
| Net assets, end of period (000's) |
| |
| RATIOS TO AVERAGE NET ASSETS |
| Expenses |
| Net investment income |
| |
| PORTFOLIO TURNOVER RATE |
| (a) | Per share numbers have been calculated using the average shares method. |
See Notes to Financial Statements.
| 22 | 1-855-DGI-FUND (344-3863) | www.DGIfund.com |
| Financial Highlights |
| For a share outstanding during the period or years presented |
| For the Six Months Ended October 31, 2023 (Unaudited) | | | For the Year Ended April 30, 2023 | | | For the Year Ended April 30, 2022 | | | For the Year Ended April 30, 2021 | | | For the Year Ended April 30, 2020 | | | For the Year Ended April 30, 2019 | |
| $ | 20.36 | | | $ | 20.51 | | | $ | 25.94 | | | $ | 19.42 | | | $ | 21.15 | | | $ | 19.12 | |
| | | | | | | | | | | | | | | | | | | | | | | |
| | 0.09 | | | | 0.18 | | | | 0.08 | | | | 0.09 | | | | 0.18 | | | | 0.16 | |
| | 1.43 | | | | 0.14 | | | | (2.84 | ) | | | 8.83 | | | | (1.14 | ) | | | 2.55 | |
| | 1.52 | | | | 0.32 | | | | (2.76 | ) | | | 8.92 | | | | (0.96 | ) | | | 2.71 | |
| | | | | | | | | | | | | | | | | | | | | | | |
| | (0.09 | ) | | | (0.17 | ) | | | (0.08 | ) | | | (0.10 | ) | | | (0.17 | ) | | | (0.12 | ) |
| | – | | | | (0.30 | ) | | | (2.59 | ) | | | (2.30 | ) | | | (0.60 | ) | | | (0.56 | ) |
| | (0.09 | ) | | | (0.47 | ) | | | (2.67 | ) | | | (2.40 | ) | | | (0.77 | ) | | | (0.68 | ) |
| | | | | | | | | | | | | | | | | | | | | | | |
| | 1.43 | | | | (0.15 | ) | | | (5.43 | ) | | | 6.52 | | | | (1.73 | ) | | | 2.03 | |
| $ | 21.79 | | | $ | 20.36 | | | $ | 20.51 | | | $ | 25.94 | | | $ | 19.42 | | | $ | 21.15 | |
| | | | | | | | | | | | | | | | | | | | | | | |
| | 7.42 | %(b) | | | 1.67 | % | | | (11.86 | %) | | | 47.00 | % | | | (4.79 | %) | | | 14.74 | % |
| | | | | | | | | | | | | | | | | | | | | | | |
| $ | 387,273 | | | $ | 358,298 | | | $ | 344,503 | | | $ | 345,450 | | | $ | 226,591 | | | $ | 240,172 | |
| | | | | | | | | | | | | | | | | | | | | | | |
| | | | | | | | | | | | | | | | | | | | | | | |
| | 0.78 | %(c) | | | 0.78 | % | | | 0.78 | % | | | 0.78 | % | | | 0.78 | % | | | 0.78 | % |
| | 0.76 | %(c) | | | 0.89 | % | | | 0.32 | % | | | 0.39 | % | | | 0.86 | % | | | 0.80 | % |
| | | | | | | | | | | | | | | | | | | | | | | |
| | 10 | %(b) | | | 26 | % | | | 21 | % | | | 31 | % | | | 29 | % | | | 22 | % |
| Semi-Annual Report | October 31, 2023 | 23 |
| The Disciplined Growth Investors Fund | Notes to Financial Statements |
| | October 31, 2023 (Unaudited) |
1. ORGANIZATION
Financial Investors Trust (the “Trust”), a Delaware statutory trust, is an open-end management investment company registered under the Investment Company Act of 1940, as amended (“1940 Act”). The Trust consists of multiple separate portfolios or series. This semi-annual report describes The Disciplined Growth Investors Fund (the “Fund”). The Fund seeks long-term capital growth and as a secondary objective, modest income with reasonable risk.
2. SIGNIFICANT ACCOUNTING POLICIES
The accompanying financial statements were prepared in accordance with accounting principles generally accepted in the United States of America (“U.S. GAAP”). The preparation of financial statements in conformity with U.S. GAAP requires management to make certain estimates and assumptions that affect the reported amounts of assets and liabilities and disclosures of contingent assets and liabilities at the date of the financial statements and the reported amounts of revenue and expenses during the period. Actual results could differ from those estimates. The Fund is considered an investment company for financial reporting purposes under U.S. GAAP and follows the accounting and reporting guidance applicable to investment companies in the Financial Accounting Standards Board Accounting Standards Codification Topic 946. The following is a summary of significant accounting policies consistently followed by the Fund in preparation of its financial statements.
Investment Valuation: The Fund generally values its securities based on market prices determined at the close of regular trading on the New York Stock Exchange (“NYSE”), normally 4:00 p.m. Eastern Time, on each day the NYSE is open for trading.
For equity securities and mutual funds that are traded on an exchange, the market price is usually the closing sale or official closing price on that exchange. In the case of equity securities not traded on an exchange, or if such closing prices are not otherwise available, the securities are valued at the mean of the most recent bid and ask prices on such day. Redeemable securities issued by open-end registered investment companies are valued at the investment company’s applicable net asset value, with the exception of exchange-traded open-end investment companies, which are priced as equity securities.
The market price for debt obligations is generally the price supplied by an independent third-party pricing service, which may use a matrix, formula or other objective method that takes into consideration quotations from dealers, market transactions in comparable investments, market indices and yield curves. If vendors are unable to supply a price, or if the price supplied is deemed to be unreliable, the market price may be determined using quotations received from one or more broker–dealers that make a market in the security. Fixed-income obligations, excluding municipal securities, having a remaining maturity of greater than 60 days, are typically valued at the mean between the evaluated bid and ask prices formulated by an independent pricing service. Corporate Bonds, U.S. Government & Agency, and U.S. Treasury Bonds & Notes are valued using market models that consider trade data, quotations from dealers and active market makers, relevant yield curve and spread data, creditworthiness, trade data or market information on comparable securities, and other relevant security specific information. Publicly traded Foreign Government Debt securities and Foreign Corporate Bonds are typically traded internationally in the over-the-counter market and are
| 24 | 1-855-DGI-FUND (344-3863) | www.DGIfund.com |
| The Disciplined Growth Investors Fund | Notes to Financial Statements |
| | October 31, 2023 (Unaudited) |
valued at the mean between the bid and asked prices as of the close of business of that market. Mortgage-related and asset-backed securities are valued based on models that consider trade data, prepayment and default projections, benchmark yield and spread data and estimated cash flows of each tranche of the issuer. Publicly traded foreign government debt securities are typically traded internationally in the over-the-counter market and are valued at the mean between the bid and asked prices as of the close of business of that market.
When such prices or quotations are not available, or when Disciplined Growth Investors, Inc. (the “Adviser”) believes that they are unreliable, securities may be priced using fair value procedures established by the Adviser pursuant to Rule 2a-5 under the 1940 Act and approved by and subject to the oversight of the Board of Trustees of the Trust (the “Board” or the “Trustees”).
Fair Value Measurements: Pursuant to Rule 2a-5 under the Investment Company Act of 1940, the Board has appointed the Adviser to serve as the Valuation Designee to perform fair value determinations for investments in the Fund. When such prices or quotations are not available, or when the Valuation Designee believes that they are unreliable, securities may be priced using fair value procedures approved by the Board. The fair valuation policies and procedures (“FV Procedures”) have been adopted by the Board for the fair valuation of portfolio assets held by the Fund in the event that (1) market quotations for the current price of a portfolio security or asset are not readily available, or (2) available market quotations that would otherwise be used to value a portfolio security or asset in accordance with the Fund’s Pricing Procedures appear to be unreliable or not indicative of fair value. The Pricing Procedures reflect certain pricing methodologies (or “logics”) that are not “readily available market quotations” and thus are viewed and treated as fair valuations. The Valuation Designee routinely meets to discuss fair valuations of portfolio securities and other instruments held by the Fund.
The Fund discloses the classification of its fair value measurements following a three-tier hierarchy based on the inputs used to measure fair value. Inputs refer broadly to the assumptions that market participants would use in pricing the asset or liability, including assumptions about risk. Inputs may be observable or unobservable. Observable inputs reflect the assumptions market participants would use in pricing the asset or liability that are developed based on market data obtained from sources independent of the reporting entity. Unobservable inputs reflect the reporting entity’s own assumptions about the assumptions market participants would use in pricing the asset or liability that are developed based on the best information available.
Various inputs are used in determining the value of the Fund’s investments as of the end of the reporting period. When inputs used fall into different levels of the fair value hierarchy, the level in the hierarchy within which the fair value measurement falls is determined based on the lowest level input that is significant to the fair value measurement in its entirety. The designated input levels are not necessarily an indication of the risk or liquidity associated with these investments. These inputs are categorized in the following hierarchy under applicable financial accounting standards:
| Level 1 – | Unadjusted quoted prices in active markets for identical investments, unrestricted assets or liabilities that the Fund has the ability to access at the measurement date; |
| | |
| Level 2 – | Quoted prices which are not active, quoted prices for similar assets or liabilities in active markets or inputs other than quoted prices that are observable (either directly or indirectly) for substantially the full term of the asset or liability; and |
| Semi-Annual Report | October 31, 2023 | 25 |
| The Disciplined Growth Investors Fund | Notes to Financial Statements |
| | October 31, 2023 (Unaudited) |
| Level 3 – | Significant unobservable prices or inputs (including the Fund’s own assumptions in determining the fair value of investments) where there is little or no market activity for the asset or liability at the measurement date. |
The following is a summary of each input used to value the Fund as of October 31, 2023:
| Investments in Securities at Value | | Level 1 - Unadjusted Quoted Prices | | | Level 2 - Other Significant Observable Inputs | | | Level 3 - Significant Unobservable Inputs | | | Total | |
| Common Stocks(a) | | $ | 277,179,271 | | | $ | – | | | $ | – | | | $ | 277,179,271 | |
| Corporate Bonds(a) | | | – | | | | 88,249,568 | | | | – | | | | 88,249,568 | |
| Foreign Corporate Bonds(a) | | | – | | | | 10,618,360 | | | | – | | | | 10,618,360 | |
| Government & Agency Obligations | | | – | | | | 8,879,353 | | | | – | | | | 8,879,353 | |
| Short Term Investments | | | 1,173,314 | | | | – | | | | – | | | | 1,173,314 | |
| TOTAL | | $ | 278,352,585 | | | $ | 107,747,281 | | | $ | – | | | $ | 386,099,866 | |
| (a) | For detailed descriptions of the underlying industries, see the accompanying Portfolio of Investments. |
For the six months ended October 31, 2023, the Fund did not have any securities that used significant unobservable inputs (Level 3) in determining fair value. There were no transfers in/out of Level 3 securities during the six months ended October 31, 2023.
Investment Transactions and Investment Income: Investment transactions are accounted for on the date the investments are purchased or sold (trade date). Realized gains and losses from investment transactions are reported on an identified cost basis, which is the same basis the Fund uses for federal income tax purposes. Interest income, which includes accretion of discounts, is accrued and recorded as earned. Dividend income is recognized on the ex-dividend date or for certain foreign securities, as soon as information is available to the Fund.
Trust Expenses: Some expenses of the Trust can be directly attributed to the Fund. Expenses which cannot be directly attributed to the Fund are apportioned among all funds in the Trust based on average net assets of each fund.
Fund Expenses: Expenses that are specific to the Fund are charged directly to the Fund.
Federal Income Taxes: The Fund complies with the requirements under Subchapter M of the Internal Revenue Code of 1986, as amended, applicable to regulated investment companies and intends to distribute substantially all of their net taxable income and net capital gains, if any, each year so that it will not be subject to excise tax on undistributed income and gains. The Fund is not subject to income taxes to the extent such distributions are made.
As of and during the six months ended October 31, 2023 the Fund did not have a liability for any unrecognized tax benefits. The Fund files U.S. federal, state, and local tax returns as required. The Fund’s tax returns are subject to examination by the relevant tax authorities until expiration of the applicable statute of limitations, which is generally three years after the filing of the tax return for
| 26 | 1-855-DGI-FUND (344-3863) | www.DGIfund.com |
| The Disciplined Growth Investors Fund | Notes to Financial Statements |
| | October 31, 2023 (Unaudited) |
federal purposes and four years for most state returns. Tax returns for open years have incorporated no uncertain tax positions that require a provision for income taxes.
Distributions to Shareholders: The Fund normally pays dividends, if any, quarterly and distributes capital gains, if any, on an annual basis. Income dividend distributions are derived from dividends and other income the Fund receives from its investments, including short term capital gains. Long term capital gain distributions are derived from gains realized when the Fund sells a security it has owned for more than a year. The Fund may make additional distributions and dividends at other times if the portfolio manager believes doing so may be necessary for the Fund to avoid or reduce taxes.
3. TAX BASIS INFORMATION
Tax Basis of Investments: As of October 31, 2023, the aggregate cost of investments, gross unrealized appreciation/(depreciation) and net unrealized appreciation for Federal tax purposes was as follows:
| | | The Disciplined Growth Investors Fund | |
| Gross appreciation | | | | |
| (excess of value over tax cost) | | $ | 106,920,669 | |
| Gross depreciation | | | | |
| (excess of tax cost over value) | | | (44,384,286 | ) |
| Net unrealized appreciation | | $ | 62,536,383 | |
| Cost of investments for income tax purposes | | $ | 323,563,483 | |
Tax Basis of Distributions to Shareholders: The character of distributions made during the year from net investment income or net realized gains may differ from its ultimate characterization for federal income tax purposes. Also, due to the timing of dividend distributions, the fiscal year in which amounts are distributed may differ from the fiscal year in which the income or realized gain was recorded by the Fund.
The tax character of distributions paid during the year ended April 30, 2023, were as follows:
| | | Ordinary Income | | | Long-Term Capital Gain | |
| The Disciplined Growth Investors Fund | | $ | 2,946,749 | | | $ | 5,196,006 | |
The amounts and characteristics of tax basis distributions and composition of distributable earnings/(accumulated losses) are finalized at fiscal year-end. Accordingly, tax basis balances have not been determined as of October 31, 2023.
| Semi-Annual Report | October 31, 2023 | 27 |
| The Disciplined Growth Investors Fund | Notes to Financial Statements |
| | October 31, 2023 (Unaudited) |
4. SECURITIES TRANSACTIONS
The cost of purchases and proceeds from sales of securities (excluding short-term securities and U.S. Government Obligations) during the six months ended October 31, 2023, were as follows:
| Fund | | Purchases of Securities | | | Proceeds From Sales of Securities | |
| The Disciplined Growth Investors Fund | | $ | 32,599,298 | | | $ | 28,969,669 | |
Investment transactions in U.S. Government Obligations during the six months ended October 31, 2023 were as follows:
| Fund | | Purchases of Securities | | | Proceeds From Sales of Securities | |
| The Disciplined Growth Investors Fund | | $ | 8,086,115 | | | $ | 9,619,545 | |
The cost of purchases in kind, proceeds from sales in kind along with their realized gain/(loss) included in above transactions during the six months ended October 31, 2023 were as follows:
| Fund | | Purchases | | | Proceeds | | | Net Realized Gain/(Loss) | |
| Disciplined Growth Investors Fund | | $ | 1,388,820 | | | $ | – | | | $ | – | |
5. SHARES OF BENEFICIAL INTEREST
The capitalization of the Trust consists of an unlimited number of shares of beneficial interest with no par value per share. Holders of the shares of the Fund of the Trust have one vote for each share held and a proportionate fraction of a vote for each fractional share. All shares issued and outstanding are fully paid and are transferable and redeemable at the option of the shareholder. Purchasers of the shares do not have any obligation to make payments to the Trust or its creditors (other than the purchase price for the shares or make contributions to the Trust or its creditors solely by reason of the purchasers’ ownership of the shares. Shares have no pre-emptive rights.
6. MANAGEMENT AND RELATED-PARTY TRANSACTIONS
The Adviser, subject to the authority of the Board, is responsible for the overall management and administration of the Fund’s business affairs. The Adviser manages the investments of the Fund in accordance with the Fund’s investment objective, policies and limitations and investment guidelines established jointly by the Adviser and the Trustees. Pursuant to the Advisory Agreement, the Fund pays the Adviser a unitary management fee for the services and facilities it provides payable on a monthly basis at the annual rate of 0.78% of the Fund’s average daily net assets. The management fee is paid on a monthly basis.
Out of the unitary management fee, the Adviser pays substantially all expenses of the Fund, including the cost of transfer agency, custody, fund administration, bookkeeping and pricing
| 28 | 1-855-DGI-FUND (344-3863) | www.DGIfund.com |
| The Disciplined Growth Investors Fund | Notes to Financial Statements |
| | October 31, 2023 (Unaudited) |
services, legal, audit and other services, except for interest expenses, brokerage expenses, taxes and extraordinary expenses not incurred in the ordinary course of the Fund’s business. Also included are Trustee fees which were $11,384 for the six months ended October 31, 2023.
Fund Administrator Fees and Expenses
ALPS Fund Services, Inc. (“ALPS”) serves as administrator to the Fund. Pursuant to an Administration Agreement, ALPS provides operational services to the Fund including, but not limited to, fund accounting and fund administration and generally assists in the Fund’s operations. Officers of the Trust are employees of ALPS. The Fund’s administration fee is accrued on a daily basis and paid monthly. The Administrator is also reimbursed for certain out-of-pocket expenses. The administrative fee and out-of-pocket expenses are included in the unitary management fee paid to the Adviser.
Transfer Agent
ALPS serves as transfer, dividend paying and shareholder servicing agent for the Fund. ALPS receives an annual minimum fee, a fee based upon the number of shareholder accounts, and is also reimbursed for certain out-of-pocket expenses. The fee and out-of-pocket expenses are included in the unitary management fee paid to the Adviser.
Compliance Services
ALPS provides services that assist the Trust’s chief compliance officer in monitoring and testing the policies and procedures of the Trust in conjunction with requirements under Rule 38a-1 under the 1940 Act and receives an annual base fee. ALPS is reimbursed for certain out-of-pocket expenses. The fee and out-of-pocket expenses are included in the unitary management fee paid to the Adviser.
Principal Financial Officer
ALPS receives an annual fee for providing principal financial officer services to the Fund. The fee is included in the unitary management fee paid to the Adviser.
Distributor
ALPS Distributors, Inc. (“ADI” or the “Distributor”) (an affiliate of ALPS) acts as the distributor of the Fund’s shares pursuant to a Distribution Agreement with the Trust. Shares are sold on a continuous basis by ADI as agent for the Fund, and ADI has agreed to use its best efforts to solicit orders for the sale of the Fund’s shares, although it is not obliged to sell any particular amount of shares. ADI is not entitled to any compensation for its services as Distributor. ADI is registered as a broker-dealer with the Securities and Exchange Commission.
Trustees
The fees and expenses of the Trustees of the Board are presented in the Statements of Operations
| Semi-Annual Report | October 31, 2023 | 29 |
| The Disciplined Growth Investors Fund | Notes to Financial Statements |
| | October 31, 2023 (Unaudited) |
7. INDEMNIFICATIONS
Under the Trust’s organizational documents, its officers and Trustees are indemnified against certain liability arising out of the performance of their duties to the Trust. Additionally, in the normal course of business, the Trust enters into contracts with service providers that may contain general indemnification clauses, which may permit indemnification to the extent permissible under applicable law. The Trust’s maximum exposure under these arrangements is unknown, as this would involve future claims that may be made against the Trust that have not yet occurred.
8. SUBSEQUENT EVENT
Subsequent events after the date of the Statements of Assets and Liabilities have been evaluated through the date the financial Statements were issued.
| 30 | 1-855-DGI-FUND (344-3863) | www.DGIfund.com |
| The Disciplined Growth Investors Fund | Additional Information |
| | October 31, 2023 (Unaudited) |
1. FUND HOLDINGS
The Fund files its complete schedule of portfolio holdings with the Securities and Exchange Commission (SEC) for the first and third quarters of each fiscal year as an exhibit to its reports on Form N-PORT. The Fund’s Form N-PORT reports are available on the SEC’s Web site at http://www.sec.gov. The Fund’s Form N-PORT reports are also available upon request by calling toll-free (855) 344-3863.
2. FUND PROXY VOTING POLICIES, PROCEDURES AND SUMMARIES
The Fund’s policies and procedures used in determining how to vote proxies and information regarding how the Fund voted proxies relating to portfolio securities during the most recent prior 12-month period ending June 30 are available without charge, (1) upon request, by calling (toll-free) 855-DGI-Fund and (2) on the SEC’s website at http://www.sec.gov.
| Semi-Annual Report | October 31, 2023 | 31 |
| The Disciplined Growth Investors Fund | Liquidity Risk
Management Program |
| | October 31, 2023 (Unaudited) |
The Financial Investors Trust (the “Trust”) has established a liquidity risk management program (the “Program”) to govern the Trust’s approach to managing liquidity risk for each fund in the Trust (each a “Fund”). The Program is overseen by the Liquidity Committee (the “Committee”), a committee comprised of representatives of the Trust’s investment advisers, sub-advisers, and Officers of the Trust. The Trust’s Board of Trustees (the “Board”) has approved the designation of the Committee to oversee the Program.
The Program’s principal objectives include supporting each Fund’s compliance with limits on investments in illiquid assets and mitigating the risk that a Fund will be unable to meet its redemption obligations in a timely manner. The Program also includes a number of elements that support the management and assessment of liquidity risk, including a periodic assessment of factors that influence a Fund’s liquidity and the periodic classification and re-classification of the Fund’s investments into groupings that reflect the Committee’s assessment of their relative liquidity under current market conditions.
At a meeting of the Board held on June 13, 2023, the Trustees received a report from the Committee regarding the design and operational effectiveness of the Program during the calendar year 2022. The Committee determined, and reported to the Board, that the Program is reasonably designed to assess and manage each Fund’s liquidity risk and has operated adequately and effectively to manage each Fund’s liquidity risk since implementation.
The Committee reported that during the period covered by the report, there were no liquidity events that impacted the Funds or their ability to timely meet redemptions without dilution to existing shareholders. Among other things, the Board noted that the Funds are not required to have a highly liquid investment minimum based on their liquidity classifications. The Board further noted that no material changes have been made to the Program since its implementation.
| 32 | 1-855-DGI-FUND (344-3863) | www.DGIfund.com |
| The Disciplined Growth Investors Fund | Privacy Policy |
| WHO WE ARE | |
| Who is providing this notice? | The Disciplined Growth Investors Fund |
| WHAT WE DO | |
| How does the Fund protect my personal information? | To protect your personal information from unauthorized access and use, we use security measures that comply with federal law. These measures include computer safeguards and secured files and buildings. |
| How does the Fund collect my personal information? | We collect your personal information, for example, when you ● open an account ● provide account information or give us your contact information ● make a wire transfer or deposit money |
| Why can’t I limit all sharing? | Federal law gives you the right to limit only ● sharing for affiliates’ everyday business purposes-information about your creditworthiness ● affiliates from using your information to market to you ● sharing for non-affiliates to market to you State laws and individual companies may give you additional rights to limit sharing. |
| DEFINITIONS | |
| Affiliates | Companies related by common ownership or control. They can be financial and nonfinancial companies. |
| Non-affiliates | Companies not related by common ownership or control. They can be financial and nonfinancial companies. ● The Fund does not share with non-affiliates so they can market to you. |
| Joint marketing | A formal agreement between non-affiliated financial companies that together market financial products or services to you. ● The Fund does not jointly market. |
| Semi-Annual Report | October 31, 2023 | 33 |
| The Disciplined Growth Investors Fund | Privacy Policy |
| FACTS | WHAT DOES THE FUND DO WITH YOUR PERSONAL INFORMATION? |
| WHY? | Financial companies choose how they share your personal information. Federal law gives consumers the right to limit some but not all sharing. Federal law also requires us to tell you how we collect, share, and protect your personal information. Please read this notice carefully to understand what we do. |
| WHAT? | The types of personal information we collect and share depend on the product or service you have with us. This information can include: ● Social Security number and account transactions ● Account balances and transaction history ● Wire transfer instructions |
| HOW? | All financial companies need to share customers’ personal information to run their everyday business. In the section below, we list the reasons financial companies can share their customers’ personal information; the reasons the Fund chooses to share; and whether you can limit this sharing. |
REASONS WE CAN SHARE YOUR
PERSONAL INFORMATION | DOES THE
FUND SHARE: | CAN YOU LIMIT
THIS SHARING? |
For our everyday business purposes –
such as to process your transactions, maintain your account(s), respond to court orders and legal investigations, or report to credit bureaus | Yes | No |
For our marketing purposes –
to offer our products and services to you | No | We do not share. |
| For joint marketing with other financial companies | No | We do not share. |
For our affiliates’ everyday business purposes –
information about your transactions and experiences | Yes | No |
For our affiliates’ everyday business purposes –
information about your creditworthiness | No | We do not share. |
| For non-affiliates to market to you | No | We do not share. |
| 34 | 1-855-DGI-FUND (344-3863) | www.DGIfund.com |
| The Disciplined Growth Investors Fund | Privacy Policy |
| OTHER IMPORTANT INFORMATION |
| California Residents | If your account has a California home address, your personal information will not be disclosed to nonaffiliated third parties except as permitted by applicable California law, and we will limit sharing such personal information with our affiliates to comply with California privacy laws that apply to us. |
| Vermont Residents | The State of Vermont requires financial institutions to obtain your consent prior to sharing personal information that they collect about you with affiliated companies and nonaffiliated third parties other than in certain limited circumstances. Except as permitted by law, we will not share personal information we collect about you with nonaffiliated third parties or other affiliated companies unless you provide us with your written consent to share such information. |
| Semi-Annual Report | October 31, 2023 | 35 |


TABLE OF CONTENTS
| Manager Commentary | |
| Emerald Growth Fund | 1 |
| Emerald Insights Fund | 6 |
| Emerald Finance & Banking Innovation Fund | 10 |
| Disclosure of Fund Expenses | 19 |
| Schedule of Investments | |
| Emerald Growth Fund | 21 |
| Emerald Insights Fund | 23 |
| Emerald Finance & Banking Innovation Fund | 25 |
| Statements of Assets and Liabilities | 27 |
| Statements of Operations | 28 |
| Statements of Changes in Net Assets | |
| Emerald Growth Fund | 29 |
| Emerald Insights Fund | 31 |
| Emerald Finance & Banking Innovation Fund | 33 |
| Financial Highlights | |
| Emerald Growth Fund | 34 |
| Emerald Insights Fund | 38 |
| Emerald Finance & Banking Innovation Fund | 42 |
| Notes to Financial Statements | 46 |
| Additional Information | 52 |
| Liquidity Risk Management Program Disclosure | 53 |
| Privacy Policy | 54 |
| Emerald Growth Fund | Manager Commentary |
| | October 31, 2023 (Unaudited) |
Dear Shareholders:
Investment Results
The performance of the Emerald Growth Fund’s Class A shares (without sales load), for the six months ended October 31, 2023, declined by 6.68%, outpacing its benchmark, the Russell 2000 Growth Index, which declined by 7.36%. Please see page 3 for more information.
Over the last six months, U.S. Treasury yields have demonstrated heightened volatility as recession probabilities have waxed and waned. The volatility in the most recent three-month period has been outsized relative to history as the collision of a persistently stronger labor market, a rapidly widening fiscal deficit and increasing bond supply propelled U.S. Treasury yields higher across the curve. The long-end of the curve hit escape velocity with the 10-year yield peaking at 4.98% on October 19th. As yields pushed higher, equities retreated. Small capitalization stocks were again laggards with the Russell 2000 falling 5.29% and trailing the Russell 1000, which gained 1.37%. From a style perspective, while the Russell 2000 Value declined 3.47% outpacing the Russell 2000 Growth, which declined 7.36%, both subcomponents lagged their respective Russell 1000 peer. At the constituent level, within the Russell 2000, the rising cost of capital weighed particularly hard on the fastest growing companies as measured by sales growth as well as the non-revenue/non-earnings generating companies within the benchmark.
Investment Analysis
The Emerald Growth Fund outperformed the Russell 2000 Growth Index for trailing six-month period ended October driven by the positive contribution from selection effect. At the sector level, stock selection driven relative outperformance within the healthcare, technology, and basic materials sectors more than offset by relative underperformance within the consumer discretionary and industrials sectors.
The healthcare sector was the largest positive contributor to return driven by holdings within the biotechnology and pharmaceuticals industries. The portfolio also experienced a positive contribution to return from holdings within the technology and basic materials sectors and more specifically positions held within computer hardware and iron and steel industries.
Partially offsetting the positive contributors to return was stock selection driven relative underperformance within the consumer discretionary and industrials sectors. The consumer discretionary sector was the largest detractor to return as stock selection within the casinos and gambling, restaurants, recreational services, and specialty retail industries detracted from returns. The portfolio held an underweight position in the consumer discretionary sector exiting the month of October.
Relative underperformance within the industrials sector also detracted from return, driven by both stock selection and allocation effect. The industrials sector of the Russell 2000 Growth index returned -1.13% for the trailing six-month period, significantly outpacing the -7.36% return posted by the index overall. As a result, the Fund’s sizeable underweight position, which averaged approximately 528 basis points over the period, was a headwind to performance from an allocation perspective. The allocation headwind was compounded by stock selection where challenges were most noteworthy within the transaction processing services, industrial machinery, and trucking industries. At period end, Emerald has maintained the Fund’s underweight position in the industrials sector, although the variation to the benchmark has narrowed in recent months.
Exiting October, the portfolio held the largest active exposures in the healthcare, consumer staples, and financials sectors. Thoughts as of period end on those sectors and other notable areas of exposure are highlighted below.
| • | The healthcare sector represented the portfolio’s largest nominal and active exposure. At the industry level, the portfolio held the largest nominal and relative overweight positions within the medical equipment, biotechnology, pharmaceuticals, and medical services industries. We continue to be focused on medical devices and diagnostic companies that are profitable and not trading on a revenue multiple. For therapeutics, we are focused on profitable companies and those with what we believe to be quality assets generating revenue with a view towards profitability. Approximately 70% of the Fund’s therapeutics (biotech + pharma) exposure is in companies that have revenue. |
| • | The portfolio also exited October 2023 with an overweight position within the consumer staples sector. We remain positive on the fundamental outlook for growth-oriented consumer packaged goods companies. We see mounting evidence that the broad-based cost inflation and supply chain issues that plagued the industry throughout 2022 are abating, which we think should result in higher profit margins entering 2024. We continue to focus on companies with disruptive brands, category leadership positions, strong secular growth opportunities, and improving profit margins that may enable them to navigate an often-turbulent business environment, resulting in industry leading revenue and earnings growth. |
| • | The Fund also held an overweight position within the financial sector driven by holdings within the bank, full line insurance, investment services, and property and casualty insurance industries. The Fund’s largest concentration of exposure is held within the full line and |
| Semi-Annual Report | October 31, 2023 | 1 |
| Emerald Growth Fund | Manager Commentary |
| | October 31, 2023 (Unaudited) |
property casualty insurance industries where Emerald continues to focus on companies we believe have strong balance sheets, and exposure to growing specialty end-markets with sustained pricing power.
Outlook (as of October 31, 2023)
The tenor of the market shifted significantly to start November. Treasuries rallied across the curve and equities ripped higher, led by small capitalization stocks, as the pressure from tax loss selling ebbed, the size of the announced treasury refunding was below expectations, Federal Reserve Chairman Powell and other Federal Reserve officials acknowledged that financial conditions had tightening meaningful through the third quarter, leading to a substantial decline in the market assessed probabilities for future rate hikes and economic data surprised to the downside with both the Institute of Supply Managers Survey and labor market report falling below expectations.
Corporate earnings season is providing additional near-term support to the market move, with earnings, generally trending better than expected. While small capitalization stocks are earlier in their reporting cycle, earnings thus far are trending better than expected.
In this regard, while we have been early in our call for a shift in leadership back toward small capitalization stocks, tactically we believe that given the significant year-to-date relative underperformance of the Russell 2000 -4.45% to the Russell 1000 +10.28% as of October 31, 2023, there continues to be near-term opportunity for small capitalization stocks to claw back some of that recent underperformance. According to a September 30, 2023 report from Steve DeSanctis Equity Strategist at Jefferies, the Russell 2000 rallied more than 10% during the fourth quarter 12x in its 44-history, with those rallies largely occurring when small caps have lagged large caps through the first 9-months of the year.
On a longer-term basis, the sizeable underperformance of the small cap segment remains an outlier relative to history with the rolling 5-year return for the Russell 2000 standing at 2.7% vs. 10% for the Russell 1000, a differential of 7.3% which falls in the 7th percentile relative to history, according to same report cited above. The relative valuation of the Russell 2000 to the Russell 1000 is now sitting in the 8th percentile vs. history, with the index trading at a double-digit discount relative to the long-term average based on trailing P/E, forward P/E, price to book, price to cash flow, price to sales and P/E to growth. Market concentration continues to be historically high, with the top 10 names now accounting for 28.8% of the Russell 1000 index, and over 51.2% of the Russell 1000 Growth Index. For reference, at the peak of the Tech Bubble, the top-10 positions within those indices accounted for 23.8% and 36.5%, respectively.
While it is always difficult to call the exact inflection point, we believe that a durable resumption in small capitalization stock leadership will be predicated on a further deceleration in the rate of inflation, a stabilization in employment gains and wage growth, a definitive end to the Federal Reserve hiking cycle, and further confidence in a reacceleration in the corporate earnings growth in 2024. All of that being said, the early October Hamas attack, declaration of war from Israel, and the prospect of U.S. involvement remain a tail risk.
Emerald, as always, remains vigilant and focused on utilizing our fundamental bottom-up research process to identify the most attractive growth opportunities within the small capitalization universe.
| Top Contributors: | Top Detractors: | |
| Super Micro Computer Inc. | Treace Medical Concepts, Inc. | |
| Reata Pharmaceuticals, Inc. | TransMedics Group, Inc. | |
| Celsius Holdings, Inc. | Shift4 Payments, Inc. | |
| Varonis Systems, Inc. | Planet Fitness, Inc. | |
| FTAI Aviation Ltd. | Churchill Downs Incorporated | |
| | | |
| Kenneth G. Mertz II, CFA | Stacey L. Sears | Joseph W. Garner |
| Chief Investment Officer | Portfolio Manager | Portfolio Manager |
| Portfolio Manager | | |
| | | |
| Emerald Mutual Fund Advisers Trust | | |
| 2 | www.emeraldmutualfunds.com |
| Emerald Growth Fund | Manager Commentary |
| | October 31, 2023 (Unaudited) |
Past performance does not guarantee future results. Fund prices fluctuate as the underlying assets have exposure to market fluctuations and other risks, as described in the Fund’s prospectus. Please visit www.emeraldmutualfunds.com to obtain current performance information and for the current prospectus and statement of additional information. This material must be preceded or accompanied by a prospectus. Please read the prospectus carefully before investing.
The views of Emerald Mutual Fund Advisers Trust and information discussed in this commentary are as of the date of publication, are subject to change, and may not reflect the writer's current views. The views expressed are those of the author only, and represent an assessment of market conditions at a specific point in time, are opinions only and should not be relied upon as investment advice regarding a particular investment or markets in general. Such information does not constitute a recommendation to buy or sell specific securities or investment vehicles. It should not be assumed that any investment will be profitable or will equal the performance of the Fund or any securities or any sectors mentioned in this letter. The subject matter contained in this letter has been derived from several sources believed to be reliable and accurate at the time of compilation. Neither Emerald Mutual Fund Advisers Trust nor the Fund accepts any liability for losses either direct or consequential caused by the use of this information.
The Emerald Growth Fund is distributed by ALPS Distributors, Inc.
The Fund is subject to investment risks, including possible loss of the principal amount invested and therefore is not suitable for all investors. The Fund may not achieve its objectives.
Diversification does not eliminate the risk of experiencing investment losses.
The Russell 2000® Growth Index measures the performance of the small-cap growth segment of the U.S. equity universe. It includes those Russell 2000® Index companies with higher price-to-value ratios and higher forecasted growth values. The Index is not actively managed and does not reflect any deductions for fees, expenses or taxes. An investor may not invest directly into the Index.
The Russell 2000® Value Index measures the performance of small-cap value segment of the U.S. equity universe. It includes those Russell 2000 companies with lower price-to-book ratios (A ratio used to compare a stock's market value to its book value. It is calculated by dividing the current closing price of the stock by the latest quarter's book value per share.) and lower forecasted growth values. The Index is not actively managed and does not reflect any deductions for fees, expenses or taxes. An investor may not invest directly into the Index.
Emerald's Dynamic Barbell approach utilizes Emerald's in-house research team to monitor and dynamically adjust factors such as sizes of companies, sectors and industries and portfolio weightings. Like a barbell, the approach balances offsetting factors such as large/small companies; cyclical/secular trends and companies with more international/domestic exposure.
Basis points refers to a common unit of measure for interest rates and other percentages in finance. One basis point is equal to 1/100th of 1%, or 0.01%, or 0.0001, and is used to denote the percentage change in a financial instrument. The relationship between percentage changes and basis points can be summarized as follows: 1% change = 100 basis points and 0.01% = 1 basis point.
| Semi-Annual Report | October 31, 2023 | 3 |
| Emerald Growth Fund | Manager Commentary |
| | October 31, 2023 (Unaudited) |
TOP TEN HOLDINGS
(as a % of Net Assets)*
| Carpenter Technology Corp. | 2.41% |
| Simply Good Foods Co. | 2.20% |
| ACADIA Pharmaceuticals, Inc. | 1.95% |
| Churchill Downs, Inc. | 1.93% |
| Blueprint Medicines Corp. | 1.91% |
| Super Micro Computer, Inc. | 1.86% |
| FTAI Aviation Ltd | 1.79% |
| Tenable Holdings, Inc. | 1.77% |
| Varonis Systems, Inc. | 1.76% |
| Freshpet, Inc. | 1.72% |
| Top Ten Holdings | 19.30% |
INDUSTRY SECTOR ALLOCATION
(as a % of Net Assets)
| Health Care | 23.26% |
| Industrials | 20.58% |
| Technology | 17.69% |
| Consumer Discretionary | 8.81% |
| Financials | 7.93% |
| Energy | 5.59% |
| Consumer Staples | 5.55% |
| Consumer, Non-cyclical | 3.93% |
| Consumer, Cyclical | 1.42% |
| Producer Durables | 0.83% |
| Real Estate | 1.31% |
| Cash, Cash Equivalents, & Other Net Assets | 3.10% |
| Total | 100.00% |
| * | Holdings are subject to change, and may not reflect the current or future position of the portfolio. |
ANNUALIZED TOTAL RETURN (for the year ended October 31, 2023)
| | 6 Month | 1 Year | 3 Year | 5 Year | 10 Year | Since Inception(1) | Expense Gross(2) | Ratio Net(2) |
| Class A (NAV) | -6.68% | -8.00% | -2.13% | 3.74% | 6.57% | 9.93% | 1.13% | 1.13% |
| Class A (LOAD) | -11.13% | -12.36% | -3.71% | 2.73% | 6.06% | 9.76% | 1.13% | 1.13% |
| Russell 2000® Growth Index(3) | -7.36% | -7.63% | -1.83% | 2.68% | 5.67% | 7.34% | | |
| Class C (NAV) | -6.99% | -8.60% | -2.76% | 3.07% | 5.89% | 5.54% | 1.78% | 1.78% |
| Class C (LOAD) | -7.88% | -9.47% | -2.76% | 3.07% | 5.89% | 5.54% | 1.78% | 1.78% |
| Russell 2000® Growth Index(3) | -7.36% | -7.63% | -1.83% | 2.68% | 5.67% | 4.66% | | |
| Investor Class | -6.54% | -8.06% | -2.18% | 3.70% | 6.63% | 8.16% | 1.17% | 1.17% |
| Russell 2000® Growth Index(3) | -7.36% | -7.63% | -1.83% | 2.68% | 5.67% | 7.02% | | |
| Institutional Class | -6.70% | -7.72% | -1.83% | 4.07% | 6.91% | 11.19% | 0.82% | 0.82% |
| Russell 2000® Growth Index(3) | -7.36% | -7.63% | -1.83% | | 5.67% | 10.01% | | |
Performance quoted represents past performance, does not guarantee future results and current performance may be lower or higher than the data quoted. The investment return and principal value of an investment will fluctuate so that shares, when redeemed, may be worth more or less than their original cost. Performance data current to the most recent month end may be obtained at www.emeraldmutualfunds.com.
Performance shown for periods prior to March 16, 2012, reflects the performance of the Forward Growth Fund, a series of Forward Funds (as a result of a reorganization of the Forward Growth Fund into the Emerald Growth Fund).
Returns for periods less than 1 year are cumulative.
The table does not reflect the deduction of taxes that a shareholder would pay on Fund distributions or the redemption of Fund shares.
Subject to investment risks, including possible loss of the principal amount invested.
Maximum Offering Price (MOP) for Class A shares includes the Fund's maximum sales charge of 4.75%. Performance shown at NAV does not include these sales charges and would have been lower had it been taken into account.
A Contingent Deferred Sales Charge (CDSC) of 1.00% may apply to Class C shares redeemed within the first 12 months after a purchase.
| (1) | Inception Dates - Class A: 10/01/1992, Class C: 07/01/2000, Institutional Class: 10/21/2008, Investor Class: 05/01/2011 |
| (2) | Emerald Mutual Fund Advisers Trust ("Emerald" or the "Adviser") has agreed contractually to waive a portion of its fees and reimburse other expenses in amounts necessary to limit the Fund's operating expenses (exclusive of Acquired Fund Fees and Expenses, brokerage expenses, interest expense, taxes and extraordinary expense) for Class A, Class C, Institutional Class, and Investor Class shares to an annual rate (as percentage of the Fund's average daily net assets) of 1.13%, 1.78%, 0.82% and 1.17% respectively. This agreement (the "Expense Agreement") shall continue at least through August 31, 2024. The Adviser will be permitted to recapture, on a class-by-class basis, expenses it has borne through the Expense Agreement to the extent that the Fund's expenses in later periods fall below the annual rates set forth in the Expense Agreement; provided, however, that such recapture payments do not cause the Fund's expense ratio (after recapture) to exceed the lesser of (i) the expense cap in effect at the time of the waiver and (ii) the expense cap in effect at the time of the recapture. Notwithstanding the foregoing, the Fund will not be obligated to pay any such deferred fees and expenses more than three years after the date on which the fee and expenses were deferred. The Adviser may not discontinue this waiver, prior to August 31, 2024, without the approval by the Fund's Board of Trustees. Ratios as of the Prospectus dated August 31, 2023 and may differ from the ratios presented in the Financial Highlights. |
| (3) | The Russell 2000® Growth Index measures the performance of the small-cap growth segment of the U.S. equity universe. It includes those Russell 2000® Index companies with higher price-to-value ratios and higher forecasted growth values. The Index is not actively managed and does not reflect any deduction for fees, expenses or taxes. An investor may not invest directly into the Index. |
| 4 | www.emeraldmutualfunds.com |
| Emerald Growth Fund | Manager Commentary |
| | October 31, 2023 (Unaudited) |
GROWTH OF $10,000 INVESTMENT IN THE FUND (for the year ended October 31, 2023)
Comparison of change in value of a $10,000 investment (includes applicable sales loads)
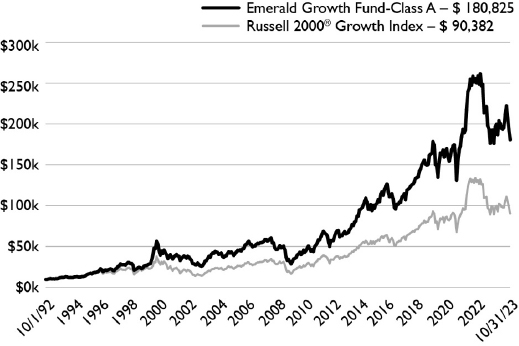
The chart represents historical performance of a hypothetical investment of $10,000 in the Fund since inception. Past performance does not guarantee future results. This chart does not reflect the deduction of taxes that a shareholder would pay on Fund distributions or the redemption of Fund shares.
Investing in the Fund is subject to investment risks, including possible loss of the principal amount invested.
| Semi-Annual Report | October 31, 2023 | 5 |
| Emerald Insights Fund | Manager Commentary |
| | October 31, 2023 (Unaudited) |
Dear Shareholders:
Investment Results
The performance of the Emerald Insights Fund Class A Shares (without the sales load) for the six months ended October 31, 2023, reflected a return of 4.15%, trailing the Russell 3000 Growth Index benchmark return of 5.91% by 176 basis points. Performance was driven by strength in Energy, offset by weakness in Industrials, Consumer Discretionary, and Healthcare.
Investment Analysis
The first half of the Emerald Insights Fund’s fiscal year (ended October 31, 2023) was marked by the continued significant concentration of returns in the largest index constituents. The first half of calendar year 2023 marked the narrowest market breadth in history, with just 25% of stocks outperforming the S&P500 and that concentration of returns continued, largely unabated, throughout the Fund’s reporting period. The market did broaden somewhat early in the summer, only to contract again as investors took a decidedly risk-off attitude due to macro factors such as interest rates, fears of a government shutdown, and a continued hawkish U.S. Federal Reserve. The Fund benefitted from stock selection in Energy and Technology sectors, although the Fund’s structural underweight to the largest capitalization technology companies detracted from returns. The Fund’s overweight to several small cap names detracted from performance, with small-caps/mid-caps lagging large-caps for the 4th consecutive quarter.
Growth-oriented indices have become increasingly concentrated, with the Top 10 names in the Russell 1000 Growth Index accounting for over 50% of that Index’ weight. Using our Dynamic Barbell strategy, we were able to maintain a sizable mega-cap weight during the period, but also maintain more diversification than the Russell 3000 Growth Index, which has a Technology weighting of close to 50%. Technology has been the Fund’s largest underweight vs. the Index, with Energy being the largest overweight.
As has been the case for many quarters, the Insights Fund remained overweight small- and mid-cap stocks vs. the benchmark during the period, given our thoughts on relative valuation and growth, with small caps relative valuations vs. large trading at levels not seen since 2002.
Outlook (as of October 31, 2023)
We have repeatedly questioned the sustainability of the Mega-Cap driven rally, which accounts for a huge percentage of major growth equity index YTD returns. We have, thus far, been wrong. The disparity between small and large has persisted and grown, despite an increasing valuation disparity and unprecedented index concentration. But we stick by our Dynamic Barbell, which has us overweighting selected small and midcap stocks and have courage in our conviction that market breadth will improve, and small caps can and will make up some of their longer-term underperformance.
We do believe a recession is coming. We look at the Leading Economic Indicators which have registered negative readings for the last 18 consecutive months - a timeframe that has always predicted a recession. Money supply, which historically correlates in some way to GDP, has been in negative territory for several months - the first time in history. Banks’ lending standards have tightened, signaling recessionary conditions, while at the same time, loan demand has deteriorated due to increased interest rates. The ISM Manufacturing survey also remains in contraction although at levels just above those signaling recession.
While we talk about macro forces, small caps and recessions, the fact is we are a fundamental, bottom-up driven manager focusing on finding companies with superior earnings and revenue growth and exemplary management teams. We believe in our core that EPS and revenue growth drives stock prices.
Our team’s ability to generate alpha through stock selection has been a hallmark of Emerald throughout our 30-year history and we believe the ability to identify secular themes and company-specific growth opportunities, coupled with the ability to bias portfolios across the market capitalization spectrum without losing sight of the broader benchmark will provide enduring opportunities to outperform.
| 6 | www.emeraldmutualfunds.com |
| Emerald Insights Fund | Manager Commentary |
| | October 31, 2023 (Unaudited) |
| Top 10 Contributors | Top 10 Detractors |
| NVIDIA Corporation | Babcock & Wilcox Enterprises Inc |
| TETRA Technologies, Inc. | Ameresco, Inc. Class A |
| Amazon.com, Inc. | SkyWater Technology Inc |
| Microsoft Corporation | TransMedics Group, Inc. |
| Super Micro Computer, Inc. | Churchill Downs Incorporated |
| Alphabet Inc. Class A | Ebix, Inc. |
| Reata Pharmaceuticals, Inc. Class A | MP Materials Corp Class A |
| CrowdStrike Holdings, Inc. Class A | Excelerate Energy, Inc. Class A |
| Pure Storage, Inc. Class A | Amylyx Pharmaceuticals, Inc. |
| Palo Alto Networks, Inc. | DocGo Inc. |
| | |
| David A. Volpe, CFA | Stephen L. Amsterdam |
| Deputy Chief Investment Officer | Portfolio Manager |
| Portfolio Manager | |
| | |
| Emerald Mutual Fund Advisers Trust | |
Past performance does not guarantee future results. Fund prices fluctuate as the underlying assets have exposure to market fluctuations and other risks, as described in the Fund’s prospectus. Please visit www.emeraldmutualfunds.com to obtain current performance information and for the current prospectus and statement of additional information. This material must be preceded or accompanied by a prospectus. Please read the prospectus carefully before investing.
The views of Emerald Mutual Fund Advisers Trust and information discussed in this commentary are as of the date of publication, are subject to change, and may not reflect the writer's current views. The views expressed are those of the author only, and represent an assessment of market conditions at a specific point in time, are opinions only and should not be relied upon as investment advice regarding a particular investment or markets in general. Such information does not constitute a recommendation to buy or sell specific securities or investment vehicles. It should not be assumed that any investment will be profitable or will equal the performance of the Fund or any securities or any sectors mentioned in this letter. The subject matter contained in this letter has been derived from several sources believed to be reliable and accurate at the time of compilation. Neither Emerald Mutual Fund Advisers Trust nor the Fund accepts any liability for losses either direct or consequential caused by the use of this information.
The Emerald Insights Fund is distributed by ALPS Distributors, Inc.
The Fund is subject to investment risks, including possible loss of the principal amount invested and therefore is not suitable for all investors. The Fund may not achieve its objectives.
Diversification does not eliminate the risk of experiencing investment losses.
The Russell 3000® Growth Index is a market capitalization weighted index based on the Russell 3000® index. The Russell 3000® Growth Index includes companies that display signs of above average growth. The index is used to provide a gauge of the performance of growth stocks in the United States. The Index is not actively managed and does not reflect any deductions for fees, expenses or taxes. An investor may not invest directly into the Index.
Basis points refers to a common unit of measure for interest rates and other percentages in finance. One basis point is equal to 1/100th of 1%, or 0.01%, or 0.0001, and is used to denote the percentage change in a financial instrument.
| Semi-Annual Report | October 31, 2023 | 7 |
| Emerald Insights Fund | Manager Commentary |
| | October 31, 2023 (Unaudited) |
TOP TEN HOLDINGS
(as a % of Net Assets)*
| Microsoft Corp. | 10.69% |
| Apple, Inc. | 8.31% |
| NVIDIA Corp. | 5.52% |
| Amazon.com, Inc. | 5.43% |
| Alphabet, Inc. | 5.16% |
| Meta Platforms, Inc. | 3.30% |
| TJX Cos., Inc. | 1.99% |
| Visa, Inc. | 1.95% |
| ACADIA Pharmaceuticals, Inc. | 1.89% |
| GXO Logistics, Inc. | 1.85% |
| Top Ten Holdings | 46.09% |
INDUSTRY SECTOR ALLOCATION
(as a % of Net Assets)
| Technology | 44.30% |
| Consumer Discretionary | 16.64% |
| Health Care | 11.54% |
| Industrials | 10.79% |
| Energy | 7.86% |
| Financials | 2.32% |
| Communications | 2.11% |
| Consumer Staples | 1.52% |
| Consumer, Cyclical | 0.60% |
| Cash, Cash Equivalents, & Other Net Assets | 2.32% |
| Total | 100.00% |
| * | Holdings are subject to change, and may not reflect the current or future position of the portfolio. |
ANNUALIZED TOTAL RETURN (for the year ended October 31, 2023)
| | 6 Month | 1 Year | 3 Year | 5 Year | Since Inception(1) | Expense Gross(2) | Ratio Net(2) |
| Class A (NAV) | 4.15% | 14.38% | 7.21% | 13.35% | 10.19% | 1.94% | 1.35% |
| Class A (LOAD) | -0.82% | 8.98% | 5.49% | 12.26% | 9.61% | 1.94% | 1.35% |
| Russell 3000® Growth Index(3) | 5.91% | 17.32% | 8.07% | 13.49% | 13.28% | | |
| Class C (NAV) | 3.82% | 13.57% | 6.49% | 12.61% | 9.45% | 2.59% | 2.00% |
| Class C (LOAD) | 2.82% | 12.57% | 6.49% | 12.61% | 9.45% | 2.59% | 2.00% |
| Russell 3000® Growth Index(3) | 5.91% | 17.32% | 8.07% | 13.49% | 13.28% | | |
| Investor Class | 4.28% | 14.33% | 7.16% | 13.32% | 10.12% | 1.99% | 1.40% |
| Russell 3000® Growth Index(3) | 5.91% | 17.32% | 8.07% | 13.49% | 13.28% | | |
| Institutional Class | 4.11% | 14.73% | 7.52% | 13.69% | 10.50% | 1.64% | 1.05% |
| Russell 3000® Growth Index(3) | 5.91% | 17.32% | 8.07% | 13.49% | 13.28% | | |
The performance quoted represents past performance, does not guarantee future results and current performance may be lower or higher than the data quoted. The investment return and principal value of an investment will fluctuate so that shares, when redeemed, may be worth more or less than their original cost. Performance data current to the most recent month end may be obtained at www.emeraldmutualfunds.com.
Returns for periods less than 1 year are cumulative.
The table does not reflect the deduction of taxes that a shareholder would pay on Fund distributions or the redemption of Fund shares.
Subject to investment risks, including possible loss of the principal amount invested.
Maximum Offering Price (MOP) for Class A shares includes the Fund's maximum sales charge of 4.75%. Performance shown at NAV does not include these sales charges and would have been lower had it been taken into account.
A Contingent Deferred Sales Charge (CDSC) of 1.00% may apply to Class C shares redeemed within the first 12 months after a purchase.
| (1) | Inception Date – August 1, 2014. |
| (2) | Emerald Mutual Fund Advisers Trust ("Emerald" or the "Adviser") has agreed contractually to waive a portion of its fees and reimburse other expenses in amounts necessary to limit the Fund's operating expenses (exclusive of Acquired Fund Fees and Expenses, brokerage expenses, interest expenses, taxes and extraordinary expense) for Class A, Class C, Institutional Class, and Investor Class shares to an annual rate (as percentage of the Fund's average daily net assets) of 1.35%, 2.00%, 1.05% and 1.40% respectively. This agreement (the "Expense Agreement") shall continue at least through August 31, 2024. The Adviser will be permitted to recapture, on a class-by-class basis, expenses it has borne through the Expense Agreement to the extent that the Fund's expenses in later periods fall below the annual rates set forth in the Expense Agreement; provided, however, that such recapture payments do not cause the Fund's expense ratio (after recapture) to exceed the lesser of (i) the expense cap in effect at the time of the waiver and (ii) the expense cap in effect at the time of the recapture. Notwithstanding the foregoing, the Fund will not be obligated to pay any such deferred fees and expenses more than three years after the date on which the fee and expenses were deferred. The Adviser may not discontinue this waiver, prior to August 31, 2024, without the approval by the Fund's Board of Trustees. Ratios as of the Prospectus dated August 31, 2023 and may differ from the ratios presented in the Financial Highlights. |
| (3) | The Russell 3000® Growth Index is a market capitalization weighted index based on the Russell 3000® index. The Russell 3000® Growth Index includes companies that display signs of above average growth. The index is used to provide a gauge of the performance of growth stocks in the United States. The Index is not actively managed and does not reflect any deductions for fees, expenses or taxes. An investor may not invest directly into the Index. |
Important Risks
Investing in smaller companies generally will present greater investment risks, including: greater price volatility, greater sensitivity to changing economic conditions and less liquidity than the securities of larger, more mature companies.
| 8 | www.emeraldmutualfunds.com |
| Emerald Insights Fund | Manager Commentary |
| | October 31, 2023 (Unaudited) |
GROWTH OF $10,000 INVESTMENT IN THE FUND (for the year ended October 31, 2023)
Comparison of change in value of a $10,000 investment (includes applicable sales loads)

The chart represents historical performance of a hypothetical investment of $10,000 in the Fund since inception. Past performance does not guarantee future results. This chart does not reflect the deduction of taxes that a shareholder would pay on Fund distributions or the redemption of Fund shares.
Investing in the Fund is subject to investment risks, including possible loss of the principal amount invested.
| Semi-Annual Report | October 31, 2023 | 9 |
| Emerald Finance & Banking Innovation Fund | Manager Commentary |
| | October 31, 2023 (Unaudited) |
Dear Shareholders:
Investment Results
In September, for the second month in a row, the US banking sector experienced broad-based selling pressure, which pushed valuations down to their lowest level since May. The median price to adjusted tangible book value (TBV) for the 211 banks in the S&P Global Market Intelligence analysis was 113.6% on Sept. 29, down from 119.7% at the end of August and 129.5% at the end of July.
The selling pressure increased in the last two weeks of September as the market digested the Federal Reserve's decision to maintain the rates range. Bank stocks fell on Sept. 20 after the Fed said it would keep the federal funds rate within the range of 5.25% to 5.5%. The central bank also signaled its intention to keep interest rates higher for longer, driving government bond yields to surge to their highest levels since before the Great Recession.
The median return of major exchange-traded banks was -4.7% for the month, compared with -7.2% in August. The S&P US BMI Banks index's return was -8.8%, while the S&P 500's return was -4.8%. The S&P US BMI Banks index's return started falling to more than 6% two days before the Fed announced the rate decision. It reached the nadir on Sept. 25, at -10%.
Investment Analysis
We believe there could be a modest reversal in the "extreme negativity" against owning bank stocks in the near term given that while funding pressure continued in the third quarter 2023 the quarter-over-quarter increase in the cost of deposits slowed sequentially. While the quarter was not perfect, we believe results started to show signs of net interest margins “troughing”.
Additionally, US banks' uninsured deposit total continued to fall in the third quarter but at a much slower rate. The industry's uninsured deposits dropped just 0.5% quarter over quarter, compared to sequential declines of 7.8% in the first quarter and 2.4% in the second quarter, according to S&P Global Market Intelligence data.
While sharper sequential drops have stalled, levels are still down from historical trends as US banks' $6.851 trillion in uninsured deposits on September 30 marks the lowest level since the first quarter of 2020, while the 41.1% percentage of total deposits is the lowest in more than three years.
Uninsured deposits came under a microscope after the failures of Silicon Valley Bank (SI) and Signature Bank (SBNY), both of which had high levels of uninsured deposits. Since then, the industry's uninsured deposit total began falling as banks took a second look at what they include in their tally and also made steps to reduce their exposure, such as through "deposit spreading" services like those offered by IntraFi Network LLC.
Additionally, most banks' net interest margins declined in the third quarter, but the pace of contraction slowed from the prior period.
Funding costs rose at a far faster clip than earning-asset yields in the first and second quarters as banks' reliance on higher-cost funding like certificates of deposits grew, but the two metrics increased at the same pace in the third quarter. The dynamic resulted in a relatively small decline in margins in the third quarter. The median, taxable equivalent net interest margin of the banking industry dipped to 3.37%, down 3 basis points (bps) sequentially, after falling 5 bps in the second quarter and 15 bps in the first quarter, according to S&P Global Market Intelligence data.
Banks continued to experience deposit outflows over the last six months with deposits falling 0.5% quarter over quarter in the third quarter, driven by declines in non-brokered deposits. The decline marks the sixth straight quarter of decreases in non-brokered deposits, but outflows slowed in the last two quarters as banks paid up to defend their funding, leading to notably higher deposit costs.
The banking industry's aggregate cost of deposits rose to 2.03% in the third quarter, up 32 bps from a quarter earlier. While the increase was smaller than the 38-bps sequential increase in the second quarter, the beta, or the percentage of change in fed funds passed on to depositors, was 117.5% in the period, compared to 79.1% in the previous quarter.
We believe that if the federal reserve has halted raising interest rates pricing pressure on deposits will lessen, but banks have also seen the mix of deposits change considerably as customers shifted funds out of noninterest-bearing deposits and into higher-cost products for institutions like brokered deposits and certificates of deposits. That mix continued into September and October 2023.
While credit metrics across the industry remain benign, we have seen several one-off cases of credit deterioration. These issues have been across various industries and markets, and while we do not believe it represents a significant deterioration in credit metrics, we do believe this is the beginning of the “normalization” we have been expecting.
| 10 | www.emeraldmutualfunds.com |
| Emerald Finance & Banking Innovation Fund | Manager Commentary |
| | October 31, 2023 (Unaudited) |
We believe the end of COVID-19-era stimulus, post-pandemic changes in consumer behavior and borrowers facing a larger debt service due to higher rates will cause community banks to increase reserves for loan losses during the remainder of 2023 and again further in 2024. We believe margin compression and increased credit costs will serve as a headwind to earnings during those periods.
Overdue commercial real estate loans at US banks jumped over the last six months as high interest rates and office vacancies continued to put the portfolios under pressure. The commercial real estate (CRE) loan delinquency rate across the industry increased 21 basis points sequentially to 1.03% in the third quarter, according to data from S&P Global Market Intelligence. That was the biggest sequential increase in at least five years and pushed the delinquency rate above its early-pandemic high of 1.02% in the fourth quarter of 2020.
Despite the stress, banks generally continue to describe CRE loan problems as manageable, with a number that have significant exposure to the office sector building loss reserves to the high-single-digit percentages for those loans.
US banks active in lending against warehouse and industrial real estate properties ramped up their exposure to the property sector significantly year over year as of October 31. We believe industrial lending remains a relative safe haven for banks paring back their exposure to office properties, a core commercial real estate (CRE) sector that has faced stronger headwinds amid persistent work-from-home trends.
The balance sheet composition of the US banking industry continued shifting over the past six months toward wholesale funding on the liability side and loans and leases on the asset side.
That transformation is taking place as the industry gradually shrinks. Total assets for US commercial banks, savings banks and savings and loan associations were $23.406 trillion on September 30, representing a 0.2% decline from June 30 and a 2.4% decrease since the all-time peak on March 31, 2022, according to data from S&P Global Market Intelligence.
Non-brokered deposits totaled $17.256 trillion on Sept. 30, down 1.0% sequentially and representing the sixth consecutive quarterly decline.
During the last six months, banks have been replacing securities with loans and leases. Following a slight downturn in the first quarter, tepid loan growth resumed in the second quarter and continued in the third quarter, albeit at an even slower rate. Meanwhile, total securities have gone down for six quarters in a row. Since March 31, 2022, loans and leases are up 8.7%, while securities have fallen 15.3%.
Pre-provision net revenue (net interest income plus non-interest income minus non-interest expense) fell to a four-quarter low of $108.47 billion. Quarter-over-quarter, a lower non-interest expense level was not enough to offset less non-interest income and flat net interest income. However, the industry as a whole enjoyed margin expansion for the first time this year. The net interest margin on a fully taxable equivalent basis moved up 2 basis points from the second quarter to 3.23%. Another boost to bottom-line profitability was lower provisioning. The provision for credit losses declined 11.1% quarter over quarter. As credit quality continues to normalize to pre-pandemic levels, net charge-offs to average loans crept up again in the third quarter to a three-year high, and problem asset ratios are on the upswing.
Most banks' net interest margins declined in the third quarter, but the pace of contraction slowed from the prior period. Funding costs rose at a far faster clip than earning-asset yields in the first and second quarters as banks' reliance on higher-cost funding like certificates of deposits grew, but the two metrics increased at the same pace in the third quarter. The dynamic resulted in a relatively small decline in margins in the third quarter. The median, taxable equivalent net interest margin of the banking industry dipped to 3.37%, down 3 basis points (bps) sequentially, after falling 5 bps in the second quarter and 15 bps in the first quarter, according to S&P Global Market Intelligence data.
Banks continued to experience deposit outflows in the third quarter, with deposits falling 0.5% quarter over quarter, driven by declines in non-brokered deposits. The decline marks the sixth straight quarter of decreases in non-brokered deposits, but outflows slowed in the last two quarters as banks paid up to defend their funding, leading to notably higher deposit costs.
According to S&P Global, the banking industry's aggregate cost of deposits rose to 2.03% in the third quarter, up 32 bps from a quarter earlier. While the increase was smaller than the 38-bps sequential increase in the second quarter, the beta, or the percentage of change in fed funds passed on to depositors, was 117.5% in the period, compared to 79.1% in the previous quarter.
We believe banks have competed for deposits not only with other depositories but also with higher-yielding alternatives in the Treasury and money markets. The gap between what banks paid on their deposits and the rates available in the market narrowed some in the third quarter and could continue to decrease as funding costs grind higher while the Federal Reserve holds rates steady.
| Semi-Annual Report | October 31, 2023 | 11 |
| Emerald Finance & Banking Innovation Fund | Manager Commentary |
| | October 31, 2023 (Unaudited) |
A pivot in rates would ease pricing pressure on deposits, but banks have also seen the mix of deposits change considerably as customers shifted funds out of noninterest-bearing deposits and into higher-cost products for institutions like brokered deposits and certificates of deposits. That mix continued in the third quarter.
Additionally, banks continued to prize liquidity and securities balances continued to shrink over the last six months, while loans grew at a slower pace. In the third quarter, total loans rose 0.4% from the linked quarter, after growing 0.7% on a sequential basis in the second quarter. Modest loan growth and pressure on deposits caused the industry's loan-to-deposit ratio to rise further, increasing to 66.5% from just shy of 66% in the prior quarter and 62% a year earlier.
While the Fed continues to engage in quantitative tightening as of period end, we believe the narrowing gap between banks' deposit costs and higher-yielding alternatives should help limit future deposit outflows. If funding stabilizes, we believe bank margins could soon find a floor for some institutions as they continue to see their loan yields move higher. Loan yields have received a boost from higher rates but have also increased as some fixed rate credits mature and refinance at higher rates. Loan yields rose 29 bps quarter over quarter in the third quarter after climbing 38 bps in the second quarter.
Outlook (as of October 31, 2023)
We believe the higher for longer interest rate environment will keep liquidity in focus at community banks over the next few quarters and could cause some institutions to rethink their independence. We think community bank earnings will fall this year as institutions face liquidity pressures and prepare for higher credit losses by building reserves. Stubborn funding costs and a slippage in credit quality could keep earnings under pressure in 2024 amid a higher for longer interest rate environment. The decline in earnings and returns would be far from severe but still might be enough to encourage more strategic activity from boards and management teams facing stagnant earnings over the next few years.
US bank deal activity picked up in recent months, with 39 announcements since July 1 totaling $3.21 billion in announced deal value, or 84% of all announced deal value so far this year. However, the impact of high interest rates on deal math and prolonged closing timelines still makes it hard to get things across the finish line.
High interest rates and long regulatory approval timelines are still making it hard to close deals, but bankers believe those same factors will soon lead to a wave of consolidation. We believe we will see a boom in US bank M&A activity as banks are forced to pair up to better deal with intensifying headwinds.
We do believe that community bank earnings will benefit in the fourth quarter of 2023 and into 2024, as we believe the Fed will slow the pace if not pause rate increases. If indeed the Fed pauses, we believe the increase in cost of deposits will slow. As cost of deposits stabilize and bank loan portfolios re-rate higher from lower yielding loans made over the past three to five years to higher yielding new loans, we believe the industry will experience improved net interest margins and net interest income. As a result, we believe community bank stocks are attractively valued and would expect valuations to normalize throughout 2024. That said, we expect bank stocks to perform well over the next one-to-two years from current levels, as EPS uncertainty declines and interest rate normalize, allowing for trading multiple normalization/reversion to higher levels on higher, more normalized FY25 EPS. Banks still trade at notable discounts on a relative P/E basis vs. historical trends (54%/47% on FY24 EPS for mid/large cap banks, vs. 82%/71%, respectively, for the 20-year medians).
Large cap banks are trading at 8.8x/7.8x FY24/25E EPS and at 1.56x TBV, vs. the historical medians of 11.2x FY2 (the next full year out) EPS and 1.76x, respectively. FactSet consensus FY24/25 EPS growth estimates are now -3%/+11% vs. the historical 10%-12% growth rates expected. The large cap bank P/E on FY24/25 is 47%/47% of the S&P P/E, vs. a 71% median and quartile range of 62%-80% since 2000.
Mid cap banks are trading at 10.0x/9.2x FY24/25E EPS and at 1.42x TBV, vs. the historical medians of 12.8x FY2 EPS and 1.86x, respectively. The FactSet consensus FY24/25 EPS growth estimates are now -6%/+7%, vs. the historical 10%-12% growth rates expected. The mid cap bank P/E on FY24/25 is 54%/55% of the S&P P/E, vs. an 82% median and quartile range of 67%-101% since 2000.
We believe the liquidity crunch that emerged in March changed the competitive landscape for deposits. Many institutions, including those responding out of an abundance of caution, bolstered liquidity with higher-cost funding sources such as brokered deposits, borrowings from the Federal Home Loan Banks and certificates of deposits (CDs). While deposit outflows have slowed and fears over the stability of banks have subsided, efforts to bolster funding woke up depositors to the significantly higher rates available in the marketplace, with more institutions marketing CDs at elevated rates. In fact, more than 662 banks, 96% of which were community banks, were marketing one-year CDs with rates above 4% as of Sept. 15, a 29% increase since the end of June and a 106% increase from the end of March, according to S&P Global. According to S&P Global, community banks grew CDs by 23% through the first six months of 2023, climbing to 22.8% of deposits from 18.6% at year-end 2022. We believe CDs will end 2023 at 26% of community bank deposits. Further growth in CDs will continue the trend of interest-bearing deposits becoming larger portions of community banks' funding bases.
| 12 | www.emeraldmutualfunds.com |
| Emerald Finance & Banking Innovation Fund | Manager Commentary |
| | October 31, 2023 (Unaudited) |
Noninterest-bearing deposits fell to 25.2% of total deposits in the second quarter from 27.3% in the fourth quarter of 2022 according to S&P Global, and we expect that concentration to drop to 22.5% by year-end 2023. We believe that the shifts in deposits will cause funding costs to rise significantly in 2023 serving as a headwind to banks' net interest margins.
In the second quarter, community banks recorded a deposit beta on all deposits, including non-interest-bearing funds, of 77.2% when compared to the prior quarter. That is up from 49.0% in the first quarter and 22.5% in the fourth quarter of 2022.
We believe community banks' funding costs will rise at a quicker pace than earning-asset yields and pressure net interest margins. As a result, we believe more community banks could look to pro-actively manage their bond portfolios as did Pinnacle Financial Partners Inc. (PNFP), which will help to alleviate margin pressure. However, pro-active management of the bond portfolio comes with the capital hit associated with selling underwater bonds.
The challenges to future earnings growth could lead to a rebound in M&A activity and encourage some institutions to rethink their independence later this year and early in 2024. Bank M&A activity through the first nine months of 2023 remained abysmal as institutions grappled with uncertainty over the economy, interest rates, their own funding bases, and future credit quality. Many potential deals would also be hungry for new capital since the required marks that a buyer must take on a seller's balance sheet often leave the target with little equity. However, the three largest deals in 2023 came in the last few months and bankers say that M&A discussions are picking up as many bank boards feel stuck in the current operating environment.
We believe that given the uncertainty that abounds about NIMs, NII and unrealized losses embedded in the available for sale (AFS) securities portfolios of banks there will be a slower pace of merger and acquisition (M&A) activity in the banking industry. However, we witnessed an uptick in M&A activity in the third quarter with thirty-four deal announcements, up from 20 and 25 in the first and second quarters, respectively. The total value of deals announced in the third quarter increased to $2.76 billion from just $432.8 million in the first quarter and from $197.1 million in the second quarter.
Third-quarter deal value was boosted by a handful of large deals during the period. Banc of California Inc. (BANC) and PacWest Bancorp's (PACW) pending $1.04 billion merger marked the biggest US bank deal so far in 2023, and Eastern Bankshares Inc.'s (EBC) proposed $527.1 million acquisition of Cambridge Bancorp (CATC) is on track to be the second-largest transaction of the year.
With the increase in large deal announcements since July 1, four of the year's five largest US bank deals were announced in the third quarter. The deals announced in the third quarter accounted for 81% of the $3.39 billion in transaction value for 2023 so far. However, yearly activity still lags historic numbers because of the slow start to the year. Only 79 US bank deals have been announced in the year to Sept. 30, less than half of the 165 deals announced for the full year 2022. The total deal value of $3.39 billion for the first three quarters of 2023 is just over one-third of the $9.02 billion in all of 2022.
We believe that several hurdles remain in place that will keep M&A activity muted, including the impact of interest rates on deal math. Several recently announced deals saw increased dilution and prolonged earn back periods because of interest rate marks, which we believe drove negative stock reactions. In fact, Eastern Bankshares' (EBC) stock price closed 5.9% lower after announcing its planned purchase of Cambridge (CATC). We believe that reaction was partly driven by the impact of interest rate marks, which caused the deal to be 7.5% dilutive to tangible book value (TBV) with an earnback period of 2.75 years, instead of 11% accretive without rate marks.
When EBC announced its planned acquisition of CATC at the same time it announced the sale of the Eastern Insurance Group. EBC has been one of the most active bank acquirers of insurance businesses, with eleven such deals since 2016. Now, the company is exiting the space by selling the unit Eastern Insurance Group LLC to Arthur J. Gallagher & Co. for about $510 million in cash. According to S&P Global, Eastern Insurance Group is the third-largest bank-affiliated insurance brokerage in the US. Management indicated that the bank struck simultaneous deals to capitalize on climbing insurance valuations and depressed bank valuations.
The banking industry has announced six insurance business sales so far in 2023, outpacing the number of acquisitions by one. US banks are off-loading insurance units more than they are acquiring them for the first time in at least eight years. Two of those sales have come from two of the largest banks in the space, Eastern Bankshares Inc. and Truist Financial Corp., both of which said the valuations in the insurance industry attracted them to strike deals.
Price-to-earnings (P/E) ratios of the insurance brokerage industry have been trending upward, sitting at 23.7x in 2023 compared to 16.6x in 2013, according to S&P Global. The sale of Eastern Insurance Group at $510 million values the company at 35x P/E based on the insurance agency's expected net income of $14 million in 2024.
| Semi-Annual Report | October 31, 2023 | 13 |
| Emerald Finance & Banking Innovation Fund | Manager Commentary |
| | October 31, 2023 (Unaudited) |
We have also witnessed an increase in the merger-of-equals (MOE). US bank merger of equals activity has increased in 2023 after hitting a five-year low in 2022. The MOE announcement between Burke & Herbert Financial Services Corp. (BHRB) and Summit Financial Group Inc. (SMMF) marks the largest such deal since 2021 and brings the yearly total of US bank MOE announcements to four so far this year according to S&P Global.
MOEs make up 6% of all US bank M&A activity in 2023 through Aug. 28, higher than the last two years, according to S&P Global Market Intelligence data. Moreover, the four MOEs announced so far this year represent a combined total deal value of about $659.5 million, or 25% of total deal value through Aug. 28.
While broader M&A appetite soured this year and led to a slowdown in activity, MOE activity was unwavering as banks increasingly viewed those deals as an attractive alternative to pair up and gain scale to tackle ongoing headwinds amid a lack of buyers and low valuations. These deals are especially attractive for smaller community banks. Among the four MOEs announced so far this year, all involved community banks. Similarly, community banks were involved in the majority of the twenty most recent US bank MOEs. As such, the average asset size of the buyers involved in those twenty deals was $8.80 billion, while the targets had an average asset size of $8.65 billion. We believe some community banks view MOEs as an attractive pathway to boosting their value for a future sale to a larger lender.
We believe Community banks are preparing for a “normalization” of credit quality by tightening lending standards and building reserves for loan losses. We expect low single digit annualized loan growth in 2023 as community banks seem to be approaching new loans with a focus on being a paid a higher yield on newly originated earning assets given a “higher-for-longer” rate environment and economic uncertainty. We also expect banks to continue to build reserves as they work to shore up their balance sheets to clear any potential hurdles ahead.
As a result, we believe we are in a “stock-pickers-market,” and we believe those community banks with conservative underwriting, pro-active balance sheet management, and disciplined loan and deposit pricing will outperform their peers over the next twelve to eighteen months.
Given the historically low community bank stock valuations the portfolio is heavily concentrated in the bank stocks, about 90% of the portfolio, and this is also apparent in our top ten holdings list.
| Top Contributors: | Top Detractors: |
| Customers Bancorp, Inc. | First Foundation, Inc. |
| Western Alliance Bancorp | Ebix, Inc. |
| PacWest Bancorp | First Horizon Corporation |
| First Citizens BancShares, Inc. | Community Heritage Financial, Inc. |
| Northeast Bank | Power REIT |
| | |
| Kenneth G. Mertz II, CFA | Steven E. Russell, Esq., MBA |
| Chief Investment Officer | Portfolio Manager |
| Portfolio Manager | |
| | |
| Emerald Mutual Fund Advisers Trust | |
| 14 | www.emeraldmutualfunds.com |
| Emerald Finance & Banking Innovation Fund | Manager Commentary |
| | October 31, 2023 (Unaudited) |
Past performance does not guarantee future results. Fund prices fluctuate as the underlying assets have exposure to market fluctuations and other risks, as described in the Fund’s prospectus. Please visit www.emeraldmutualfunds.com to obtain current performance information and for the current prospectus and statement of additional information. This material must be preceded or accompanied by a prospectus. Please read the prospectus carefully before investing.
The views of Emerald Mutual Fund Advisers Trust and information discussed in this commentary are as of the date of publication, are subject to change, and may not reflect the writer's current views. The views expressed are those of the author only, and represent an assessment of market conditions at a specific point in time, are opinions only and should not be relied upon as investment advice regarding a particular investment or markets in general. Such information does not constitute a recommendation to buy or sell specific securities or investment vehicles. It should not be assumed that any investment will be profitable or will equal the performance of the Fund or any securities or any sectors mentioned in this letter. The subject matter contained in this letter has been derived from several sources believed to be reliable and accurate at the time of compilation. Neither Emerald Mutual Fund Advisers Trust nor the Fund accepts any liability for losses either direct or consequential caused by the use of this information.
The Emerald Finance & Banking Innovation Fund is distributed by ALPS Distributors, Inc.
The Fund is subject to investment risks, including possible loss of the principal amount invested and therefore is not suitable for all investors. The Fund may not achieve its objectives.
Diversification does not eliminate the risk of experiencing investment losses.
The Russell 2000® Index measures the performance of the small-cap segment of the U.S. equity universe. The Russell 2000® Index is a subset of the Russell 3000® Index representing approximately 10% of the total market capitalization of that index. It includes approximately 2000 of the smallest securities based on a combination of their market cap and current index membership. The Index is not actively managed and does not reflect any deduction of fees, expenses or taxes. An investor may not invest directly into the Index.
The Russell 2000® Financial Services Index – is comprised of the smallest financial services companies in the Russell 3000 Index. The Index is not actively managed and does not reflect any deductions for fees, expense, or taxes. An investor may not invest directly in the Index.
The Russell 2000® Value Index measures the performance of small-cap value segment of the U.S. equity universe. It includes those Russell 2000 companies with lower price-to-book ratios (A ratio used to compare a stock's market value to its book value. It is calculated by dividing the current closing price of the stock by the latest quarter's book value per share.) and lower forecasted growth values. The Index is not actively managed and does not reflect any deductions for fees, expenses or taxes. An investor may not invest directly into the Index.
| Semi-Annual Report | October 31, 2023 | 15 |
| Emerald Finance & Banking Innovation Fund | Manager Commentary |
| | October 31, 2023 (Unaudited) |
TOP TEN HOLDINGS
(as a % of Net Assets)*
| Finwise Bancorp | 4.91% |
| Western Alliance Bancorp | 3.48% |
| Community Heritage Financial, Inc. | 3.19% |
| Kinsale Capital Group, Inc. | 2.75% |
| Northeast Bancorp | 2.73% |
| Skyward Specialty Insurance Group, Inc. | 2.39% |
| Metropolitan Bank Holding Corp. | 2.36% |
| First Citizens BancShares, Inc., Class A | 2.31% |
| Mechanics Bank/Walnut Creek CA | 2.20% |
| First Horizon National Corp. | 2.12% |
| Top Ten Holdings | 28.44% |
INDUSTRY SECTOR ALLOCATION
(as a % of Net Assets)
| Banks | 63.00% |
| Banks: Diversified | 22.65% |
| Property And Casualty Insurance | 2.75% |
| Insurance | 2.39% |
| Commercial Banks | 2.12% |
| Open End And Miscellaneous Investment Vehicles | 1.46% |
| Telecommunications | 1.24% |
| Banks: Savings, Thrift & Mortgage | 1.15% |
| Banks Regional | 1.02% |
| Investment Services | 0.84% |
| Software | 0.55% |
| Full Line Insurance | 0.24% |
| Infrastructure REITs | 0.07% |
| Transaction Processing Services | 0.00% |
| Cash, Cash Equivalents, & Other Net Assets | 0.52% |
| Total | 100.00% |
| * | Holdings are subject to change, and may not reflect the current or future position of the portfolio. |
ANNUALIZED TOTAL RETURN (for the year ended October, 31 2023)
| | 6 Month | 1 Year | 3 Year | 5 Year | 10 Year | Since Inception(1) | Expense Gross(2) | Ratio Net(2) |
| Class A (NAV) | -0.69% | -22.22% | -9.27% | -9.13% | 1.19% | 5.39% | 1.85% | 1.85% |
| Class A (LOAD) | -5.43% | -25.91% | -10.73% | -10.01% | 0.70% | 5.20% | 1.85% | 1.85% |
| Russell 2000® Index(3) | -5.29% | -8.57% | 3.95% | 3.31% | 5.63% | 7.20% | | |
| Russell 2000® Financial Services Index(4) | -0.72% | -17.69% | 5.88% | 1.30% | 5.19% | 7.09% | | |
| Class C (NAV) | -0.98% | -22.74% | -9.87% | -9.72% | 0.54% | 4.81% | 2.49% | 2.49% |
| Class C (LOAD) | -1.97% | -23.51% | -9.87% | -9.72% | 0.54% | 4.81% | 2.49% | 2.49% |
| Russell 2000® Index(3) | -5.29% | -8.57% | 3.95% | 3.31% | 5.63% | 6.55% | | |
| Russell 2000® Financial Services Index(4) | -0.72% | -17.69% | 5.88% | 1.30% | 5.19% | 7.59% | | |
| Investor Class | -0.46% | -22.25% | -9.30% | -9.16% | 1.19% | 4.12% | 1.51% | 1.51% |
| Russell 2000® Index(3) | -5.29% | -8.57% | 3.95% | 3.31% | 5.63% | 8.23% | | |
| Russell 2000® Financial Services Index(4) | -0.72% | -17.69% | 5.88% | 1.30% | 5.19% | 7.48% | | |
| Institutional Class | -0.68% | -21.94% | -8.94% | -8.81% | 1.54% | 4.46% | 1.89% | 1.89% |
| Russell 2000® Index(3) | -5.29% | -8.57% | 3.95% | 3.31% | 5.63% | 7.53% | | |
| Russell 2000® Financial Services Index(4) | -0.80% | -17.69% | 5.88% | 1.30% | 5.19% | 7.22% | | |
The performance quoted represents past performance, does not guarantee future results and current performance may be lower or higher than the data quoted. The investment return and principal value of an investment will fluctuate so that shares, when redeemed, may be worth more or less than their original cost. Performance data current to the most recent month end may be obtained at www.emeraldmutualfunds.com.
Performance shown for periods prior to March 16, 2012, reflects the performance of the Forward Banking & Finance Fund, a series of Forward Funds (as a result of a reorganization of the Forward Banking & Finance Fund into the Emerald Banking & Finance Fund).
Returns for periods less than 1 year are cumulative.
The table does not reflect the deduction of taxes that a shareholder would pay on Fund distributions or the redemption of Fund shares.
Subject to investment risks, including possible loss of the principal amount invested.
Maximum Offering Price (MOP) for Class A shares includes the Fund's maximum sales charge of 4.75%. Performance shown at NAV does not include these sales charges and would have been lower had it been taken into account.
A Contingent Deferred Sales Charge (CDSC) of 1.00% may apply to Class C shares redeemed within the first 12 months after a purchase.
| (1) | Inception Dates - Class A: 02/18/1997, Class C: 07/01/2000, Institutional Class: 03/19/2012, Investor Class: 03/16/2010 |
| (2) | Emerald Mutual Fund Advisers Trust ("Emerald" or the "Adviser") has agreed contractually to waive a portion of its fees and reimburse other expenses in amounts necessary to limit the Fund's operating expenses (exclusive of Acquired Fund Fees and Expenses, brokerage expenses, interest expense, taxes and extraordinary expense) for Class A, Class C, Institutional Class, and Investor Class shares to an annual rate (as percentage of the Fund's average daily net assets) of 1.82%, 2.46%, 1.48% and 1.86% respectively. This agreement (the "Expense Agreement") shall continue at least through August 31, 2024. The Adviser will be permitted to recapture, on a class-by-class basis, expenses it has borne through the Expense Agreement to the extent that the Fund's expenses in later periods fall below the annual rates set forth in the Expense Agreement; provided, however, that such recapture payments do not cause the Fund's expense ratio (after recapture) to exceed the lesser of (i) the expense cap in effect at the time of the waiver and (ii) the expense cap in effect at the time of the recapture. Notwithstanding the foregoing, the Fund will not be obligated to pay any |
| 16 | www.emeraldmutualfunds.com |
| Emerald Finance & Banking Innovation Fund | Manager Commentary |
| | October 31, 2023 (Unaudited) |
such deferred fees and expenses more than three years after the date on which the fee and expenses were deferred. The Adviser may not discontinue this waiver, prior to August 31, 2024, without the approval by the Fund's Board of Trustees. Ratios as of the Prospectus dated August 31, 2023 and may differ from the ratios presented in the Financial Highlights.
| (3) | The Russell 2000® Index measures the performance of the small-cap segment of the U.S. equity universe. The Russell 2000® is a subset of the Russell 3000® Index representing approximately 8% of the total market capitalization of that index. It includes approximately 2000 of the smallest securities based on a combination of their market cap and current index membership. The index is not actively managed and does not reflect any deductions for fees, expenses or taxes. An investor may not invest directly into an index. |
| (4) | The Russell 2000® Financial Services Index is an additional index, and is comprised of the smallest financial services companies in the Russell 3000® Index. The Index is not actively managed and does not reflect any deductions for fees, expense, or taxes. An investor may not invest directly in the Index. |
Important Risks
A fund that concentrates in a particular industry will involve a greater degree of risk than a fund with a more diversified portfolio. Investing in smaller companies generally will present greater investment risks, including: greater price volatility, greater sensitivity to changing economic conditions and less liquidity than the securities of larger, more mature companies.
| Semi-Annual Report | October 31, 2023 | 17 |
| Emerald Finance & Banking Innovation Fund | Manager Commentary |
| | October 31, 2023 (Unaudited) |
GROWTH OF $10,000 INVESTMENT IN THE FUND (for the year ended October 31, 2023)
Comparison of change in value of a $10,000 investment (includes applicable sales loads)
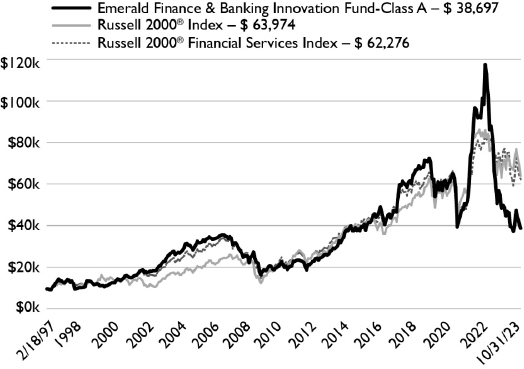
The chart represents historical performance of a hypothetical investment of $10,000 in the Fund since inception. Past performance does not guarantee future results. This chart does not reflect the deduction of taxes that a shareholder would pay on Fund distributions or the redemption of Fund shares.
Investing in the Fund is subject to investment risks, including possible loss of the principal amount invested.
| 18 | www.emeraldmutualfunds.com |
| Emerald Funds | Disclosure of Fund Expenses |
| | October 31, 2023 (Unaudited) |
As a shareholder of the Funds, you incur two types of costs: (1) transaction costs, including applicable sales charges (loads); and (2) ongoing costs, including management fees, distribution and service (12b-1) fees, shareholder services fees and other Fund expenses. This example is intended to help you understand your ongoing costs (in dollars) of investing in the Funds and to compare these costs with the ongoing costs of investing in other mutual funds. The example is based on an investment of $1,000 invested at the beginning of the (six-month) period and held for the entire period May 1, 2023 to October 31, 2023.
Actual Expenses
The first line for each share class of the Fund in the table below provides information about actual account values and actual expenses. You may use this information, together with the amount you invested, to estimate the expenses that you paid over the period. Simply divide your account value by $1,000 (for example, an $8,600 account value divided by $1,000 = 8.6), then multiply the result by the number in the applicable line under the heading titled “Expenses Paid During Period” to estimate the expenses you paid on your account during this period.
Hypothetical Example For Comparison Purposes
The second line for each share class of each Fund in the table below provides information about hypothetical account values and hypothetical expenses based on the Fund’s actual expense ratio and an assumed rate of return of 5% per year before expenses, which is not the Fund’s actual return. The hypothetical account values and expenses may not be used to estimate the actual ending account balance or expenses you paid for the period. You may use this information to compare the ongoing costs of investing in the Funds and other funds. To do so, compare this 5% hypothetical example with the 5% hypothetical examples that appear in the shareholder reports of other mutual funds.
Please note that the expenses shown in the table below are meant to highlight your ongoing costs only and do not reflect any transactional costs, such as sales charges (loads), redemption fees or exchange fees. Therefore, the second line for each share class of the Fund within the table is useful in comparing ongoing costs only, and will not help you determine the relative total costs of owning different funds. If these transactional costs were included, your costs would have been higher.
| | | Beginning Account Value 05/01/23 | | | Ending Account Value 10/31/23 | | | Expense Ratio(a) | | | Expense Paid During Period 05/01/23 - 10/31/23(b) | |
| Emerald Growth Fund | | | | | | | | | | | | |
| Class A | | | | | | | | | | | | | | | | |
| Actual | | $ | 1,000.00 | | | $ | 933.20 | | | | 1.09 | % | | $ | 5.31 | |
| Hypothetical (5% return before expenses) | | $ | 1,000.00 | | | $ | 1,019.71 | | | | 1.09 | % | | $ | 5.55 | |
| Class C | | | | | | | | | | | | | | | | |
| Actual | | $ | 1,000.00 | | | $ | 930.10 | | | | 1.74 | % | | $ | 8.46 | |
| Hypothetical (5% return before expenses) | | $ | 1,000.00 | | | $ | 1,016.43 | | | | 1.74 | % | | $ | 8.84 | |
| Institutional Class | | | | | | | | | | | | | | | | |
| Actual | | $ | 1,000.00 | | | $ | 934.60 | | | | 0.79 | % | | $ | 3.85 | |
| Hypothetical (5% return before expenses) | | $ | 1,000.00 | | | $ | 1,021.22 | | | | 0.79 | % | | $ | 4.02 | |
| Investor Class | | | | | | | | | | | | | | | | |
| Actual | | $ | 1,000.00 | | | $ | 933.00 | | | | 1.21 | % | | $ | 5.90 | |
| Hypothetical (5% return before expenses) | | $ | 1,000.00 | | | $ | 1,019.11 | | | | 1.21 | % | | $ | 6.16 | |
| Semi-Annual Report | October 31, 2023 | 19 |
| Emerald Funds | Disclosure of Fund Expenses |
| | October 31, 2023 (Unaudited) |
| | | Beginning Account Value 05/01/23 | | | Ending Account Value 10/31/23 | | | Expense Ratio(a) | | | Expense Paid During Period 05/01/23 - 10/31/23(b) | |
| Emerald Insights Fund | | | | | | | | | | | | |
| Class A | | | | | | | | | | | | | | | | |
| Actual | | $ | 1,000.00 | | | $ | 1,041.50 | | | | 1.35 | % | | $ | 6.95 | |
| Hypothetical (5% return before expenses) | | $ | 1,000.00 | | | $ | 1,018.40 | | | | 1.35 | % | | $ | 6.87 | |
| Class C | | | | | | | | | | | | | | | | |
| Actual | | $ | 1,000.00 | | | $ | 1,038.20 | | | | 1.99 | % | | $ | 10.22 | |
| Hypothetical (5% return before expenses) | | $ | 1,000.00 | | | $ | 1,015.17 | | | | 1.99 | % | | $ | 10.11 | |
| Institutional Class | | | | | | | | | | | | | | | | |
| Actual | | $ | 1,000.00 | | | $ | 1,042.80 | | | | 1.05 | % | | $ | 5.41 | |
| Hypothetical (5% return before expenses) | | $ | 1,000.00 | | | $ | 1,019.91 | | | | 1.05 | % | | $ | 5.35 | |
| Investor Class | | | | | | | | | | | | | | | | |
| Actual | | $ | 1,000.00 | | | $ | 1,041.10 | | | | 1.40 | % | | $ | 7.20 | |
| Hypothetical (5% return before expenses) | | $ | 1,000.00 | | | $ | 1,018.15 | | | | 1.40 | % | | $ | 7.12 | |
| | | | | | | | | | | | | | | | | |
| Emerald Finance & Banking Innovation Fund | | | | | | | | | | | | | | | | |
| Class A | | | | | | | | | | | | | | | | |
| Actual | | $ | 1,000.00 | | | $ | 993.10 | | | | 1.80 | % | | $ | 9.04 | |
| Hypothetical (5% return before expenses) | | $ | 1,000.00 | | | $ | 1,016.13 | | | | 1.80 | % | | $ | 9.15 | |
| Class C | | | | | | | | | | | | | | | | |
| Actual | | $ | 1,000.00 | | | $ | 990.20 | | | | 2.46 | % | | $ | 12.34 | |
| Hypothetical (5% return before expenses) | | $ | 1,000.00 | | | $ | 1,012.80 | | | | 2.46 | % | | $ | 12.48 | |
| Institutional Class | | | | | | | | | | | | | | | | |
| Actual | | $ | 1,000.00 | | | $ | 995.40 | | | | 1.49 | % | | $ | 7.49 | |
| Hypothetical (5% return before expenses) | | $ | 1,000.00 | | | $ | 1,017.69 | | | | 1.49 | % | | $ | 7.58 | |
| Investor Class | | | | | | | | | | | | | | | | |
| Actual | | $ | 1,000.00 | | | $ | 993.20 | | | | 1.88 | % | | $ | 9.45 | |
| Hypothetical (5% return before expenses) | | $ | 1,000.00 | | | $ | 1,015.73 | | | | 1.88 | % | | $ | 9.55 | |
| (a) | The Fund's expense ratios have been based on the Fund's most recent fiscal half-year expenses. |
| (b) | Expenses are equal to the Fund's annualized expense ratio multiplied by the average account value over the period, multiplied by the number of days in the most recent fiscal half-year (184)/366 (to reflect the half-year period). |
| 20 | www.emeraldmutualfunds.com |
| Emerald Growth Fund | Schedule of Investments |
| | October 31, 2023 (Unaudited) |
| Shares | | | | | Value
(Note 2) | |
| COMMON STOCKS: 96.90% | | | | |
| Consumer Discretionary: 8.81% | | | | |
| | 640,411 | | | Arhaus, Inc.(a) | | $ | 5,520,343 | |
| | 133,934 | | | BJ's Restaurants, Inc.(a) | | | 3,444,783 | |
| | 139,573 | | | Churchill Downs, Inc. | | | 15,330,698 | |
| | 213,194 | | | Chuy's Holdings, Inc.(a) | | | 7,176,110 | |
| | 495,961 | | | Everi Holdings, Inc.(a) | | | 5,351,419 | |
| | 108,286 | | | Jack in the Box, Inc. | | | 6,841,509 | |
| | 100,782 | | | National Vision Holdings, Inc.(a) | | | 1,566,152 | |
| | 51,840 | | | Ollie's Bargain Outlet Holdings, Inc.(a) | | | 4,004,122 | |
| | 709,735 | | | PlayAGS, Inc.(a) | | | 5,067,508 | |
| | 422,925 | | | Portillo's, Inc.(a) | | | 6,322,729 | |
| | 60,783 | | | SeaWorld Entertainment, Inc.(a) | | | 2,618,532 | |
| | 103,512 | | | Sun Country Airlines Holdings, Inc.(a) | | | 1,347,726 | |
| | 45,695 | | | Visteon Corp.(a) | | | 5,260,865 | |
| | | | | | | | 69,852,496 | |
| | | | | | | | | |
| Consumer Staples: 5.55% | | | | |
| | 46,701 | | | Celsius Holdings, Inc.(a) | | | 7,102,755 | |
| | 237,734 | | | Freshpet, Inc.(a) | | | 13,645,932 | |
| | 468,874 | | | Simply Good Foods Co.(a) | | | 17,484,311 | |
| | 386,967 | | | Utz Brands, Inc. | | | 4,717,128 | |
| | 549,239 | | | Zevia PBC, Class A(a) | | | 1,065,524 | |
| | | | | | | | 44,015,650 | |
| | | | | | | | | |
| Consumer, Cyclical: 1.42% | | | | |
| | 49,074 | | | Light & Wonder, Inc.(a) | | | 3,587,800 | |
| | 154,376 | | | OneSpaWorld Holdings, Ltd.(a) | | | 1,617,860 | |
| | 403,214 | | | Savers Value Village, Inc.(a) | | | 6,036,114 | |
| | | | | | | | 11,241,774 | |
| | | | | | | | | |
| Consumer, Non-cyclical: 3.93% | | | | |
| | 242,995 | | | Bridgebio Pharma, Inc.(a) | | | 6,327,590 | |
| | 427,580 | | | Cymabay Therapeutics, Inc.(a) | | | 7,003,760 | |
| | 84,735 | | | Flywire Corp.(a) | | | 2,278,524 | |
| | 228,830 | | | Quanterix Corp.(a) | | | 4,970,188 | |
| | 215,189 | | | RadNet, Inc.(a) | | | 5,801,495 | |
| | 107,983 | | | Soleno Therapeutics, Inc.(a) | | | 2,575,395 | |
| | 336,709 | | | Travere Therapeutics, Inc.(a) | | | 2,181,874 | |
| | | | | | | | 31,138,826 | |
| | | | | | | | | |
| Energy: 5.59% | | | | |
| | 28,333 | | | Ameresco, Inc., Class A(a) | | | 740,908 | |
| | 219,155 | | | Cactus, Inc. | | | 10,287,136 | |
| | 218,255 | | | ChampionX Corp. | | | 6,722,254 | |
| | 56,432 | | | Matador Resources Co. | | | 3,481,290 | |
| | 202,297 | | | Northern Oil and Gas, Inc. | | | 7,756,067 | |
| | 926,312 | | | TETRA Technologies, Inc.(a) | | | 4,390,719 | |
| | 79,865 | | | Valaris, Ltd.(a) | | | 5,274,284 | |
| | 61,219 | | | Weatherford International PLC(a) | | | 5,698,877 | |
| | | | | | | | 44,351,535 | |
| | | | | | | | | |
| Financial Services: 7.93% | | | | |
| | 99,094 | | | Axos Financial, Inc.(a) | | | 3,570,357 | |
| Shares | | | | | Value (Note 2) | |
| Financial Services (continued) | | | | |
| | 387,715 | | | BRP Group, Inc., Class A(a) | | $ | 8,114,875 | |
| | 55,000 | | | First Foundation, Inc. | | | 249,700 | |
| | 72,313 | | | Houlihan Lokey, Inc. | | | 7,268,903 | |
| | 162,281 | | | Mid Penn Bancorp, Inc. | | | 3,093,076 | |
| | 203,402 | | | Moelis & Co., Class A | | | 8,469,659 | |
| | 138,548 | | | Pacific Premier Bancorp, Inc. | | | 2,632,412 | |
| | 328,146 | | | PacWest Bancorp | | | 2,323,274 | |
| | 200,469 | | | Palomar Holdings, Inc.(a) | | | 10,039,487 | |
| | 29,900 | | | Popular, Inc. | | | 1,944,696 | |
| | 379,465 | | | Skyward Specialty Insurance Group, Inc.(a) | | | 10,681,940 | |
| | 329,741 | | | Trinity Capital, Inc. | | | 4,527,344 | |
| | | | | | | | 62,915,723 | |
| | | | | | | | | |
| Health Care: 23.26% | | | | |
| | 685,811 | | | ACADIA Pharmaceuticals, Inc.(a) | | | 15,478,754 | |
| | 326,937 | | | Amylyx Pharmaceuticals, Inc.(a) | | | 5,332,342 | |
| | 77,648 | | | ANI Pharmaceuticals, Inc.(a) | | | 4,793,988 | |
| | 220,514 | | | AtriCure, Inc.(a) | | | 7,638,605 | |
| | 257,877 | | | Blueprint Medicines Corp.(a) | | | 15,178,640 | |
| | 294,978 | | | Collegium Pharmaceutical, Inc.(a) | | | 6,418,721 | |
| | 226,534 | | | CVRx, Inc.(a) | | | 3,031,025 | |
| | 997,027 | | | DocGo, Inc.(a) | | | 5,922,340 | |
| | 51,264 | | | Haemonetics Corp.(a) | | | 4,369,231 | |
| | 3,244 | | | ICU Medical, Inc.(a) | | | 318,107 | |
| | 779,483 | | | ImmunoGen, Inc.(a) | | | 11,583,117 | |
| | 388,998 | | | Insmed, Inc.(a) | | | 9,748,290 | |
| | 11,678 | | | Integer Holdings Corp.(a) | | | 947,903 | |
| | 163,991 | | | Intra-Cellular Therapies, Inc.(a) | | | 8,160,192 | |
| | 4,839 | | | Karuna Therapeutics, Inc.(a) | | | 806,226 | |
| | 118,628 | | | Lantheus Holdings, Inc.(a) | | | 7,663,369 | |
| | 260,231 | | | LivaNova PLC(a) | | | 12,764,331 | |
| | 1,244,311 | | | MannKind Corp.(a) | | | 5,338,094 | |
| | 163,062 | | | Merit Medical Systems, Inc.(a) | | | 11,208,882 | |
| | 817,438 | | | NeoGenomics, Inc.(a) | | | 11,460,481 | |
| | 13,378 | | | Orthofix Medical, Inc.(a) | | | 147,693 | |
| | 394,926 | | | Privia Health Group, Inc.(a) | | | 8,301,345 | |
| | 466,609 | | | Replimune Group, Inc.(a) | | | 6,798,493 | |
| | 203,133 | | | TransMedics Group, Inc.(a) | | | 7,613,425 | |
| | 618,090 | | | Treace Medical Concepts, Inc.(a) | | | 6,199,443 | |
| | 203,776 | | | Ultragenyx Pharmaceutical, Inc.(a) | | | 7,213,670 | |
| | | | | | | | 184,436,707 | |
| | | | | | | | | |
| Industrials: 20.58% | | | | |
| | 188,509 | | | AAR Corp.(a) | | | 11,189,894 | |
| | 99,550 | | | AeroVironment, Inc.(a) | | | 11,414,403 | |
| | 483,075 | | | Applied Digital Corp.(a) | | | 2,357,406 | |
| | 266,007 | | | ATI, Inc.(a) | | | 10,047,084 | |
| | 340,306 | | | Babcock & Wilcox Enterprises, Inc.(a) | | | 895,005 | |
| | 305,290 | | | Carpenter Technology Corp. | | | 19,147,789 | |
| | 106,526 | | | Chart Industries, Inc.(a) | | | 12,381,517 | |
| | 84,063 | | | Exponent, Inc. | | | 6,160,977 | |
| | 10,312 | | | Fabrinet(a) | | | 1,598,360 | |
| Semi-Annual Report | October 31, 2023 | 21 |
| Emerald Growth Fund | Schedule of Investments |
| | October 31, 2023 (Unaudited) |
| Shares | | | | | Value (Note 2) | |
| Industrials (continued) | | | | |
| | 560,093 | | | First Advantage Corp. | | $ | 7,286,810 | |
| | 16,534 | | | Forward Air Corp. | | | 1,064,955 | |
| | 378,372 | | | FTAI Aviation Ltd | | | 14,230,571 | |
| | 55,672 | | | Herc Holdings, Inc. | | | 5,945,213 | |
| | 781,929 | | | Kratos Defense & Security Solutions, Inc.(a) | | | 13,331,889 | |
| | 334,579 | | | Montrose Environmental Group, Inc.(a) | | | 7,735,466 | |
| | 57,431 | | | NEXTracker, Inc.(a) | | | 1,996,302 | |
| | 128,773 | | | NV5 Global, Inc.(a) | | | 12,149,733 | |
| | 130,509 | | | RXO, Inc.(a) | | | 2,285,213 | |
| | 213,559 | | | Shift4 Payments, Inc.(a) | | | 9,507,647 | |
| | 121,634 | | | TriNet Group, Inc.(a) | | | 12,497,893 | |
| | | | | | | | 163,224,127 | |
| | | | | | | | | |
| Producer Durables: 0.83% | | | | |
| | 96,627 | | | Tidewater, Inc.(a) | | | 6,604,455 | |
| | | | | | | | | |
| Real Estate: 1.31% | | | | |
| | 66,884 | | | Ryman Hospitality Properties, Inc. | | | 5,725,270 | |
| | 88,357 | | | Terreno Realty Corp. | | | 4,707,661 | |
| | | | | | | | 10,432,931 | |
| | | | | | | | | |
| Technology: 17.69% | | | | |
| | 89,992 | | | Agilysys, Inc.(a) | | | 7,720,414 | |
| | 10,284 | | | Clear Secure, Inc. | | | 172,977 | |
| | 115,969 | | | Cogent Communications Holdings, Inc. | | | 7,535,666 | |
| | 90,297 | | | Coherent, Inc.(a) | | | 2,672,791 | |
| | 518,063 | | | Credo Technology Group Holding, Ltd.(a) | | | 7,366,856 | |
| | 245,090 | | | FormFactor, Inc.(a) | | | 8,303,649 | |
| | 197,735 | | | Harmonic, Inc.(a) | | | 2,133,561 | |
| | 51,802 | | | Impinj, Inc.(a) | | | 3,346,927 | |
| | 1,166,375 | | | indie Semiconductor, Inc.(a) | | | 5,703,574 | |
| | 34,015 | | | IPG Photonics Corp.(a) | | | 2,921,889 | |
| | 17,220 | | | Kulicke & Soffa Industries, Inc. | | | 716,524 | |
| | 121,293 | | | MACOM Technology Solutions Holdings, Inc.(a) | | | 8,556,008 | |
| | 93,831 | | | Model N, Inc.(a) | | | 2,261,327 | |
| | 44 | | | Napco Security Technologies, Inc. | | | 808 | |
| | 64,648 | | | Onto Innovation, Inc.(a) | | | 7,264,496 | |
| | 239,492 | | | PDF Solutions, Inc.(a) | | | 6,353,723 | |
| | 57,234 | | | Perficient, Inc.(a) | | | 3,330,446 | |
| | 157,661 | | | Rambus, Inc.(a) | | | 8,565,722 | |
| | 150,274 | | | Rapid7, Inc.(a) | | | 6,986,238 | |
| | 426,342 | | | SkyWater Technology, Inc.(a) | | | 2,101,866 | |
| | 61,744 | | | Super Micro Computer, Inc.(a) | | | 14,785,836 | |
| | 333,301 | | | Tenable Holdings, Inc.(a) | | | 14,035,305 | |
| | 414,017 | | | Varonis Systems, Inc.(a) | | | 13,927,532 | |
| Shares | | | | | Value (Note 2) | |
| Technology (continued) | | | | |
| | 473,832 | | | Zuora, Inc., Class A(a) | | $ | 3,511,095 | |
| | | | | | | | 140,275,230 | |
| | | | | | | | | |
| | | | | Total Common Stocks | | | | |
| | | | | (Cost $670,228,352) | | | 768,489,454 | |
| | | | | | | | | |
| SHORT-TERM INVESTMENT: 3.94% | | | | |
| | 31,254,552 | | | First American Government Obligations Fund 4.739% (12/31/49) | | | 31,254,552 | |
| | | | | | | | | |
| | | | | Total Short-Term Investment | | | | |
| | | | | (Cost $31,254,552) | | | 31,254,552 | |
| | | | | | | | | |
| Total Investments: 100.84% | | | | |
| (Cost $701,482,904) | | | 799,744,006 | |
| | | | | | | | | |
| Liabilities In Excess Of Other Assets: (0.84)% | | | (6,661,703 | ) |
| Net Assets: 100.00% | | $ | 793,082,303 | |
| (a) | Non-income producing security. |
For Fund compliance purposes, the Fund's industry classifications refer to any one or more of the industry sub-classifications used by one or more widely recognized market indexes or ratings group indexes, and/or as defined by Fund management. This definition may not apply for purposes of this report, which may combine industry sub-classifications for reporting ease. Industries are shown as a percentage of net assets.
See Notes to Financial Statements.
| 22 | www.emeraldmutualfunds.com |
| Emerald Insights Fund | Schedule of Investments |
| | October 31, 2023 (Unaudited) |
| Shares | | | | | Value (Note 2) | |
| COMMON STOCKS: 97.68% | | | | |
| Communications: 2.11% | | | | |
| | 108 | | | Netflix, Inc.(a) | | $ | 44,463 | |
| | 2,771 | | | Pinterest, Inc., Class A(a) | | | 82,797 | |
| | 4,095 | | | Uber Technologies, Inc.(a) | | | 177,232 | |
| | | | | | | | 304,492 | |
| | | | | | | | | |
| Consumer Discretionary: 16.64% | | | | |
| | 5,903 | | | Amazon.com, Inc.(a) | | | 785,630 | |
| | 58 | | | AutoZone, Inc.(a) | | | 143,674 | |
| | 39 | | | Chipotle Mexican Grill, Inc.(a) | | | 75,746 | |
| | 1,221 | | | Churchill Downs, Inc. | | | 134,115 | |
| | 276 | | | Costco Wholesale Corp. | | | 152,473 | |
| | 225 | | | Home Depot, Inc. | | | 64,055 | |
| | 692 | | | Hyatt Hotels Corp., Class A | | | 70,888 | |
| | 263 | | | Lululemon Athletica, Inc.(a) | | | 103,485 | |
| | 14,812 | | | PlayAGS, Inc.(a) | | | 105,758 | |
| | 7,486 | | | Sun Country Airlines Holdings, Inc.(a) | | | 97,468 | |
| | 1,072 | | | Take-Two Interactive Software, Inc.(a) | | | 143,380 | |
| | 1,213 | | | Tesla, Inc.(a) | | | 243,619 | |
| | 3,264 | | | TJX Cos., Inc. | | | 287,460 | |
| | | | | | | | 2,407,751 | |
| | | | | | | | | |
| Consumer Staples: 1.52% | | | | |
| | 614 | | | Constellation Brands, Inc., Class A | | | 143,768 | |
| | 1,336 | | | Freshpet, Inc.(a) | | | 76,686 | |
| | | | | | | | 220,454 | |
| | | | | | | | | |
| Consumer, Cyclical: 0.60% | | | | |
| | 5,842 | | | Savers Value Village, Inc.(a) | | | 87,455 | |
| | | | | | | | | |
| Energy: 7.86% | | | | |
| | 4,710 | | | Ameresco, Inc., Class A(a) | | | 123,167 | |
| | 2,947 | | | Cactus, Inc. | | | 138,332 | |
| | 1,213 | | | Cheniere Energy, Inc. | | | 201,867 | |
| | 605 | | | Enphase Energy, Inc.(a) | | | 48,146 | |
| | 1,844 | | | EQT Corp. | | | 78,149 | |
| | 4,806 | | | Excelerate Energy, Inc. | | | 68,341 | |
| | 9,881 | | | Helix Energy Solutions Group, Inc.(a) | | | 96,834 | |
| | 3,018 | | | Northern Oil and Gas, Inc. | | | 115,710 | |
| | 56,256 | | | TETRA Technologies, Inc.(a) | | | 266,653 | |
| | | | | | | | 1,137,199 | |
| | | | | | | | | |
| Financial Services: 2.32% | | | | |
| | 2,648 | | | Charles Schwab Corp. | | | 137,802 | |
| | 1,929 | | | Palomar Holdings, Inc.(a) | | | 96,604 | |
| | 2,455 | | | Western Alliance Bancorp | | | 100,901 | |
| | | | | | | | 335,307 | |
| | | | | | | | | |
| Health Care: 11.54% | | | | |
| | 1,848 | | | Abbott Laboratories | | | 174,728 | |
| | 12,083 | | | ACADIA Pharmaceuticals, Inc.(a) | | | 272,713 | |
| | 948 | | | BioMarin Pharmaceutical, Inc.(a) | | | 77,215 | |
| | 17,453 | | | DocGo, Inc.(a) | | | 103,671 | |
| Shares | | | | | Value (Note 2) | |
| Health Care (continued) | | | | |
| | 188 | | | Eli Lilly & Co. | | $ | 104,139 | |
| | 4,588 | | | Insmed, Inc.(a) | | | 114,975 | |
| | 1,461 | | | Integer Holdings Corp.(a) | | | 118,589 | |
| | 1,072 | | | Lantheus Holdings, Inc.(a) | | | 69,251 | |
| | 2,518 | | | LivaNova PLC(a) | | | 123,508 | |
| | 1,442 | | | Merit Medical Systems, Inc.(a) | | | 99,123 | |
| | 140 | | | Regeneron Pharmaceuticals, Inc.(a) | | | 109,185 | |
| | 1,919 | | | TransMedics Group, Inc.(a) | | | 71,924 | |
| | 430 | | | UnitedHealth Group, Inc. | | | 230,291 | |
| | | | | | | | 1,669,312 | |
| | | | | | | | | |
| Industrials: 10.79% | | | | |
| | 8,167 | | | Applied Digital Corp.(a) | | | 39,855 | |
| | 14,618 | | | Babcock & Wilcox Enterprises, Inc.(a) | | | 38,445 | |
| | 1,275 | | | Chart Industries, Inc.(a) | | | 148,193 | |
| | 5,285 | | | GXO Logistics, Inc.(a) | | | 266,945 | |
| | 10,849 | | | Kratos Defense & Security Solutions, Inc.(a) | | | 184,976 | |
| | 1,007 | | | MasTec, Inc.(a) | | | 59,856 | |
| | 9,636 | | | MP Materials Corp.(a) | | | 158,031 | |
| | 1,841 | | | Shift4 Payments, Inc.(a) | | | 81,961 | |
| | 1,199 | | | Visa, Inc., Class A | | | 281,885 | |
| | 4,759 | | | WillScot Mobile Mini Holdings Corp.(a) | | | 187,552 | |
| | 1,485 | | | XPO, Inc.(a) | | | 112,578 | |
| | | | | | | | 1,560,277 | |
| | | | | | | | | |
| Technology: 44.30% | | | | |
| | 280 | | | Adobe, Inc.(a) | | | 148,977 | |
| | 6,014 | | | Alphabet, Inc., Class A(a) | | | 746,217 | |
| | 7,042 | | | Apple, Inc. | | | 1,202,562 | |
| | 857 | | | Cadence Design Systems, Inc.(a) | | | 205,552 | |
| | 1,113 | | | Crowdstrike Holdings, Inc., Class A(a) | | | 196,745 | |
| | 2,698 | | | Darling Ingredients, Inc.(a) | | | 119,494 | |
| | 5,768 | | | Ebix, Inc. | | | 35,127 | |
| | 13,863 | | | indie Semiconductor, Inc.(a) | | | 67,790 | |
| | 2,823 | | | Match Group, Inc.(a) | | | 97,676 | |
| | 1,584 | | | Meta Platforms, Inc., Class A(a) | | | 477,212 | |
| | 4,576 | | | Microsoft Corp. | | | 1,547,190 | |
| | 352 | | | Mongodb Inc(a) | | | 121,296 | |
| | 1,957 | | | NVIDIA Corp. | | | 798,065 | |
| | 803 | | | Palo Alto Networks, Inc.(a) | | | 195,145 | |
| | 6,456 | | | Pure Storage, Inc., Class A(a) | | | 218,277 | |
| | 17,788 | | | SkyWater Technology, Inc.(a) | | | 87,695 | |
| | 3,417 | | | Tenable Holdings, Inc.(a) | | | 143,890 | |
| | | | | | | | 6,408,910 | |
| | | | | Total Common Stocks | | | | |
| | | | | (Cost $10,358,027) | | | 14,131,157 | |
| Semi-Annual Report | October 31, 2023 | 23 |
Emerald Insights Fund | Schedule of Investments |
| | October 31, 2023 (Unaudited) |
| Shares | | | | | Value (Note 2) | |
| Technology (continued) |
| SHORT-TERM INVESTMENT: 2.72% | | | | |
| | 393,345 | | | First American Government Obligations Fund 4.739% (12/31/49) | | $ | 393,345 | |
| | | | | | | | | |
| | | | | Total Short-Term Investment | | | | |
| | | | | (Cost $393,345) | | | 393,345 | |
| | | | | | | | | |
| Total Investments: 100.40% | | | | |
| (Cost $10,751,371) | | | 14,524,502 | |
| | | | | | | | | |
| Liabilities In Excess Of Other Assets: (0.40)% | | | (57,270 | ) |
| Net Assets: 100.00% | | $ | 14,467,232 | |
| (a) | Non-income producing security. |
For Fund compliance purposes, the Fund's industry classifications refer to any one or more of the industry sub-classifications used by one or more widely recognized market indexes or ratings group indexes, and/or as defined by Fund management. This definition may not apply for purposes of this report, which may combine industry sub-classifications for reporting ease. Industries are shown as a percentage of net assets.
See Notes to Financial Statements.
| 24 | www.emeraldmutualfunds.com |
| Emerald Finance & Banking Innovation Fund | Schedule of Investments |
| | October 31, 2023 (Unaudited) |
| Shares | | | | | Value (Note 2) | |
| COMMON STOCKS: 99.48% | | | | |
| Communications: 1.24% | | | | |
| Telecommunications: 1.24% | | | | |
| | 43,855 | | | DigitalBridge Group, Inc. | | $ | 695,102 | |
| | | | | | | | | |
| Computer Services: 0.55% | | | | |
| Software: 0.55% | | | | |
| | 74,737 | | | Cleanspark, Inc.(a) | | | 306,421 | |
| | | | | | | | | |
| Financial Services: 97.62% | | | | |
| Banks: 63.00% | | | | |
| | 5,295 | | | Atlantic Union Bankshares Corp. | | | 152,549 | |
| | 23,707 | | | Axos Financial, Inc.(a) | | | 854,163 | |
| | 95,795 | | | Banc of California, Inc. | | | 1,073,862 | |
| | 33,233 | | | Bancorp, Inc.(a) | | | 1,184,756 | |
| | 17,690 | | | Bank OZK | | | 633,479 | |
| | 16,270 | | | Byline Bancorp, Inc. | | | 308,642 | |
| | 28,341 | | | Citizens Financial Group, Inc. | | | 664,030 | |
| | 50,680 | | | CNB Financial Corp. | | | 921,362 | |
| | 26,310 | | | Coastal Financial Corp.(a) | | | 977,943 | |
| | 115,742 | | | Community Heritage Financial, Inc. | | | 1,788,214 | |
| | 24,264 | | | Community West Bancshares | | | 305,969 | |
| | 72,301 | | | ConnectOne Bancorp, Inc. | | | 1,177,783 | |
| | 24,098 | | | Customers Bancorp, Inc.(a) | | | 968,981 | |
| | 17,640 | | | Esquire Financial Holdings, Inc. | | | 807,912 | |
| | 4,530 | | | Fifth Third Bancorp | | | 107,406 | |
| | 323,496 | | | Finwise Bancorp(a) | | | 2,749,717 | |
| | 21,418 | | | First BanCorp | | | 285,930 | |
| | 20,920 | | | First Financial Bankshares, Inc. | | | 503,126 | |
| | 245,213 | | | First Foundation, Inc. | | | 1,113,267 | |
| | 18,040 | | | Five Star Bancorp | | | 351,239 | |
| | 23,252 | | | Flushing Financial Corp. | | | 286,930 | |
| | 83,340 | | | F.N.B. Corp. | | | 890,905 | |
| | 112,091 | | | LINKBANCORP, Inc. | | | 700,569 | |
| | 14,004 | | | Live Oak Bancshares, Inc. | | | 404,015 | |
| | 5,279 | | | M&T Bank Corp. | | | 595,207 | |
| | 53 | | | Mechanics Bank/Walnut Creek CA | | | 1,229,600 | |
| | 40,807 | | | Metropolitan Bank Holding Corp.(a) | | | 1,322,555 | |
| | 22,300 | | | MVB Financial Corp. | | | 438,195 | |
| | 18,534 | | | National Bank Holdings Corp. | | | 577,890 | |
| | 57,983 | | | New York Community Bancorp, Inc. | | | 549,679 | |
| | 32,033 | | | Northeast Bancorp | | | 1,529,255 | |
| | 9,770 | | | OFG Bancorp | | | 289,387 | |
| | 26,263 | | | Pacific Premier Bancorp, Inc. | | | 498,997 | |
| | 16,572 | | | Pathward Financial, Inc. | | | 750,546 | |
| | 17,240 | | | Pinnacle Financial Partners, Inc. | | | 1,075,086 | |
| | 11,196 | | | Popular, Inc. | | | 728,188 | |
| | 68,143 | | | Primis Financial Corp. | | | 637,818 | |
| | 10,563 | | | Prosperity Bancshares, Inc. | | | 576,106 | |
| | 7,460 | | | Seacoast Banking Corp. of Florida | | | 150,767 | |
| | 1,820 | | | South State Corp. | | | 120,302 | |
| | 19,108 | | | Third Coast Bancshares, Inc.(a) | | | 296,365 | |
| | 1,163 | | | Triumph Financial, Inc.(a) | | | 72,397 | |
| | 28,927 | | | Univest Financial Corp. | | | 481,924 | |
| Shares | | | | | Value (Note 2) | |
| Banks (continued) | | | | |
| | 43,600 | | | Valley National Bancorp | | $ | 339,208 | |
| | 11,022 | | | WaFd, Inc. | | | 272,023 | |
| | 19,470 | | | Webster Financial Corp. | | | 739,276 | |
| | 47,437 | | | Western Alliance Bancorp | | | 1,949,661 | |
| | 11,390 | | | Wintrust Financial Corp | | | 850,719 | |
| | | | | | | | 35,283,900 | |
| | | | | | | | | |
| Banks Regional: 1.02% | | | | |
| | 6,301 | | | Cullen/Frost Bankers, Inc. | | | 573,328 | |
| | | | | | | | | |
| Banks: Diversified: 22.65% | | | | |
| | 18,502 | | | Ameris Bancorp | | | 690,125 | |
| | 30,260 | | | Cadence Bank | | | 640,907 | |
| | 30,416 | | | Columbia Banking System, Inc. | | | 598,283 | |
| | 14,464 | | | Comerica, Inc. | | | 569,882 | |
| | 12,617 | | | East West Bancorp, Inc. | | | 676,524 | |
| | 938 | | | First Citizens BancShares, Inc., Class A, Class A | | | 1,295,134 | |
| | 33,746 | | | First Internet Bancorp | | | 552,422 | |
| | 19,350 | | | First Merchants Corp. | | | 528,448 | |
| | 31,500 | | | Home BancShares, Inc. | | | 644,175 | |
| | 10,275 | | | Huntington Bancshares, Inc. | | | 99,154 | |
| | 16,946 | | | Independent Bank Group, Inc. | | | 599,041 | |
| | 93,343 | | | KeyCorp | | | 953,965 | |
| | 13,110 | | | QCR Holdings, Inc. | | | 622,069 | |
| | 58,688 | | | Shore Bancshares, Inc. | | | 602,139 | |
| | 25,937 | | | Summit Financial Group, Inc. | | | 557,645 | |
| | 10,408 | | | Synovus Financial Corp. | | | 271,337 | |
| | 21,455 | | | Texas Capital Bancshares, Inc.(a) | | | 1,181,312 | |
| | 34,953 | | | Veritex Holdings, Inc. | | | 601,891 | |
| | 32,452 | | | Zions Bancorporation | | | 1,001,144 | |
| | | | | | | | 12,685,597 | |
| | | | | | | | | |
| Banks: Savings, Thrift & Mortgage: 1.15% | | | | |
| | 35,072 | | | Dime Community Bancshares, Inc. | | | 644,974 | |
| | | | | | | | | |
| Commercial Banks: 2.12% | | | | |
| | 110,671 | | | First Horizon National Corp. | | | 1,189,713 | |
| | | | | | | | | |
| Full Line Insurance: 0.24% | | | | |
| | 12,050 | | | Eastern Bankshares, Inc. | | | 132,670 | |
| | | | | | | | | |
| Insurance: 2.39% | | | | |
| | 47,605 | | | Skyward Specialty Insurance Group, Inc.(a) | | | 1,340,081 | |
| | | | | | | | | |
| Investment Services: 0.84% | | | | |
| | 23,038 | | | Marathon Digital Holdings, Inc.(a) | | | 202,965 | |
| | 27,305 | | | Riot Platforms, Inc.(a) | | | 267,043 | |
| | | | | | | | 470,008 | |
| | | | | | | | | |
| Open End And Miscellaneous Investment Vehicles: 1.46% | | | | |
| | 59,403 | | | Trinity Capital, Inc. | | | 815,603 | |
| Semi-Annual Report | October 31, 2023 | 25 |
| Emerald Finance & Banking Innovation Fund | Schedule of Investments |
| | October 31, 2023 (Unaudited) |
| Shares | | | | | Value (Note 2) | |
| Property And Casualty Insurance: 2.75% | | | | |
| | 4,612 | | | Kinsale Capital Group, Inc. | | $ | 1,539,993 | |
| | | | | | | | | |
| Real Estate: 0.07% | | | | |
| Infrastructure REITs: 0.07% | | | | |
| | 56,307 | | | Power REIT(a) | | | 38,852 | |
| | | | | | | | | |
| | | | | Total Common Stocks | | | | |
| | | | | (Cost $60,362,555) | | | 55,716,242 | |
| | | | | | | | | |
| WARRANTS: 0.00% | | | | |
| | 62,749 | | | Paysafe, Ltd., Strike Price $138.00, Expiration Date 0 | | | 1,500 | |
| | | | | | | | | |
| | | | | Total Warrants | | | | |
| | | | | (Cost $211,219) | | | 1,500 | |
| | | | | | | | | |
| SHORT-TERM INVESTMENT: 1.01% | | | | |
| | 565,136 | | | First American Government Obligations Fund 4.739% (12/31/2049) | | | 565,136 | |
| | | | | | | | | |
| | | | | Total Short-Term Investment | | | | |
| | | | | (Cost $565,136) | | | 565,136 | |
| | | | | | | | | |
| Total Investments: 100.49% | | | | |
| (Cost $61,138,911) | | | 56,282,878 | |
| | | | | | | | | |
| Liabilities In Excess Of Other Assets: (0.49)% | | | (274,095 | ) |
| Net Assets: 100.00% | | $ | 56,008,783 | |
| (a) | Non-income producing security. |
For Fund compliance purposes, the Fund's industry classifications refer to any one or more of the industry sub-classifications used by one or more widely recognized market indexes or ratings group indexes, and/or as defined by Fund management. This definition may not apply for purposes of this report, which may combine industry sub-classifications for reporting ease. Industries are shown as a percentage of net assets.
See Notes to Financial Statements.
| 26 | www.emeraldmutualfunds.com |
| Emerald Funds | Statements of Assets and Liabilities |
| | October 31, 2023 (Unaudited) |
| | | Emerald Growth Fund | | | Emerald Insights Fund | | | Emerald Finance & Banking Innovation Fund | |
| ASSETS: | | | | | | | | | | | | |
| Investments, at value | | $ | 799,744,006 | | | $ | 14,524,502 | | | $ | 56,282,878 | |
| Receivable for investments sold | | | 7,166,207 | | | | 17,095 | | | | 323,218 | |
| Receivable for shares sold | | | 603,318 | | | | 500 | | | | 13,338 | |
| Interest and dividends receivable | | | 65,590 | | | | 809 | | | | 18,041 | |
| Other assets | | | 38,181 | | | | 22,136 | | | | 39,813 | |
| Total Assets | | | 807,617,302 | | | | 14,565,042 | | | | 56,677,288 | |
| LIABILITIES: | | | | | | | | | | | | |
| Payable for investments purchased | | | 12,898,758 | | | | – | | | | 310,326 | |
| Payable for shares redeemed | | | 744,081 | | | | 57,666 | | | | 77,835 | |
| Investment advisory fees payable | | | 439,521 | | | | 2,330 | | | | 49,522 | |
| Payable to fund accounting and administration | | | 72,221 | | | | 6,712 | | | | 14,369 | |
| Payable for distribution and service fees | | | 242,486 | | | | 6,161 | | | | 67,316 | |
| Payable for trustee fees and expenses | | | 13,847 | | | | 180 | | | | 3,964 | |
| Payable for transfer agency fees | | | 32,688 | | | | 9,163 | | | | 35,916 | |
| Payable for chief compliance officer fee | | | 15,022 | | | | 181 | | | | 1,111 | |
| Payable for principal financial officer fee | | | 3,179 | | | | 86 | | | | 242 | |
| Payable for professional fees | | | 4,604 | | | | 9,311 | | | | 39,727 | |
| Accrued expenses and other liabilities | | | 68,592 | | | | 6,020 | | | | 68,177 | |
| Total Liabilities | | | 14,534,999 | | | | 97,810 | | | | 668,505 | |
| NET ASSETS | | $ | 793,082,303 | | | $ | 14,467,232 | | | $ | 56,008,783 | |
| NET ASSETS CONSIST OF: | | | | | | | | | | | | |
| Paid-in capital (Note 5) | | $ | 669,796,751 | | | $ | 11,284,663 | | | $ | 124,494,845 | |
| Total distributable earnings | | | 123,285,552 | | | | 3,182,569 | | | | (68,486,062 | ) |
| NET ASSETS | | $ | 793,082,303 | | | $ | 14,467,232 | | | $ | 56,008,783 | |
| INVESTMENTS, AT COST | | $ | 701,482,904 | | | $ | 10,751,371 | | | $ | 61,138,911 | |
| PRICING OF SHARES | | | | | | | | | | | | |
| Class A: (a) | | | | | | | | | | | | |
| Net Asset Value, offering and redemption price per share | | $ | 18.92 | | | $ | 14.56 | | | $ | 18.62 | |
| Net Assets | | $ | 75,515,265 | | | $ | 9,972,188 | | | $ | 18,891,633 | |
| Shares of beneficial interest outstanding | | | 3,991,331 | | | | 684,792 | | | | 1,014,395 | |
| Maximum offering price per share (NAV/.9525, based on maximum sales charge of 4.75% of the offering price) | | $ | 19.86 | | | $ | 15.29 | | | $ | 19.55 | |
| Class C: (a) | | | | | | | | | | | | |
| Net Asset Value, offering and redemption price per share | | $ | 13.62 | | | $ | 13.31 | | | $ | 15.12 | |
| Net Assets | | $ | 3,100,924 | | | $ | 17,637 | | | $ | 3,315,474 | |
| Shares of beneficial interest outstanding | | | 227,710 | | | | 1,325 | | | | 219,209 | |
| Institutional Class: | | | | | | | | | | | | |
| Net Asset Value, offering and redemption price per share | | $ | 20.52 | | | $ | 15.11 | | | $ | 19.53 | |
| Net Assets | | $ | 647,429,222 | | | $ | 3,744,430 | | | $ | 27,187,951 | |
| Shares of beneficial interest outstanding | | | 31,552,090 | | | | 247,789 | | | | 1,392,211 | |
| Investor Class: | | | | | | | | | | | | |
| Net Asset Value, offering and redemption price per share | | $ | 18.74 | | | $ | 14.44 | | | $ | 17.47 | |
| Net Assets | | $ | 67,036,892 | | | $ | 732,977 | | | $ | 6,613,725 | |
| Shares of beneficial interest outstanding | | | 3,578,078 | | | | 50,771 | | | | 378,625 | |
| (a) | Redemption price per share may be reduced for any applicable contingent deferred sales charge. For a description of a possible sales charge, please see the Funds' Prospectus. |
See Notes to Financial Statement
| Semi-Annual Report | October 31, 2023 | 27 |
| Emerald Funds | Statements of Operations |
| | For Six Months Ended October 31, 2023 (Unaudited) |
| | | Emerald Growth Fund | | | Emerald Insights Fund | | | Emerald Finance & Banking Innovation Fund | |
| INVESTMENT INCOME: | | | | | | | | | | | | |
| Dividends | | $ | 3,321,683 | | | $ | 34,678 | | | $ | 1,405,491 | |
| Foreign taxes withheld | | | (3,289 | ) | | | – | | | | (1,232 | ) |
| Total Investment Income | | | 3,318,394 | | | | 34,678 | | | | 1,404,259 | |
| | | | | | | | | | | | | |
| EXPENSES: | | | | | | | | | | | | |
| Investment advisory fee (Note 6) | | | 2,797,642 | | | | 57,675 | | | | 316,721 | |
| Administration fee | | | 276,096 | | | | 13,149 | | | | 27,209 | |
| Custodian fee | | | 35,234 | | | | 4,260 | | | | 3,409 | |
| Professional fees | | | 26,244 | | | | 13,075 | | | | 7,183 | |
| Transfer agent fee | | | 83,093 | | | | 20,046 | | | | 59,796 | |
| Delegated transfer agent equivalent services fees | | | | | | | | | | | | |
| Class A | | | 1,342 | | | | 34 | | | | 543 | |
| Class C | | | 121 | | | | – | | | | 56 | |
| Institutional Class | | | 448 | | | | – | | | | 239 | |
| Investor Class | | | 144 | | | | – | | | | 18 | |
| Trustee fees and expenses | | | 31,403 | | | | 643 | | | | 2,830 | |
| Registration/filing fees | | | 25,576 | | | | 14,774 | | | | 23,431 | |
| Reports to shareholder and printing fees | | | 26,234 | | | | 886 | | | | 7,619 | |
| Distribution and service fees | | | | | | | | | | | | |
| Class A | | | 148,229 | | | | 18,239 | | | | 36,275 | |
| Class C | | | 29,191 | | | | 151 | | | | 20,980 | |
| Institutional Class | | | 176,348 | | | | 975 | | | | 6,444 | |
| Investor Class | | | 176,532 | | | | 2,000 | | | | 18,370 | |
| Chief compliance officer fee | | | 38,767 | | | | 567 | | | | 2,600 | |
| Principal financial officer fee | | | 8,254 | | | | 140 | | | | 559 | |
| Other | | | 13,747 | | | | 8,035 | | | | 8,973 | |
| Total expenses before waiver | | | 3,894,645 | | | | 154,649 | | | | 543,255 | |
| Less fees waived/reimbursed by investment advisor (Note 6) | | | – | | | | (56,455 | ) | | | (1,425 | ) |
| Total Net Expenses | | | 3,894,645 | | | | 98,194 | | | | 541,830 | |
| NET INVESTMENT INCOME/(LOSS): | | | (576,251 | ) | | | (63,516 | ) | | | 862,429 | |
| | | | | | | | | | | | | |
| REALIZED AND UNREALIZED GAIN/(LOSS) | | | | | | | | | | | | |
| Net realized gain/(loss) | | | 30,302,455 | | | | 1,166,936 | | | | (5,690,981 | ) |
| Net change in foreign currency transactions | | | – | | | | – | | | | (62 | ) |
| Net change in unrealized appreciation/(depreciation) | | | (83,348,665 | ) | | | (460,152 | ) | | | 4,845,077 | |
| NET REALIZED AND UNREALIZED GAIN/(LOSS) | | | (53,046,210 | ) | | | 706,784 | | | | (845,966 | ) |
| NET INCREASE/(DECREASE) IN NET ASSETS RESULTING FROM OPERATIONS | | $ | (53,622,461 | ) | | $ | 643,268 | | | $ | 16,463 | |
See Notes to Financial Statements.
| 28 | www.emeraldmutualfunds.com |
| Emerald Growth Fund | Statements of Changes in Net Assets |
| | | For the Six Months Ended October 31, 2023 (Unaudited) | | | Year Ended April 30, 2023 | |
| OPERATIONS: | | | | | | | | |
| Net investment loss | | $ | (576,251 | ) | | $ | (3,748,040 | ) |
| Net realized gain | | | 30,302,455 | | | | 32,622,795 | |
| Net change in unrealized depreciation | | | (83,348,665 | ) | | | (54,339,428 | ) |
| Net decrease in net assets resulting from operations | | | (53,622,461 | ) | | | (25,464,673 | ) |
| DISTRIBUTIONS TO SHAREHOLDERS (NOTE 3): | | | | | | | | |
| Total distributable earnings | | | | | | | | |
| Class A | | | (3,081,755 | ) | | | (8,293,933 | ) |
| Class C | | | (324,463 | ) | | | (989,129 | ) |
| Institutional Class | | | (25,007,845 | ) | | | (51,089,283 | ) |
| Investor Class | | | (2,745,932 | ) | | | (5,970,084 | ) |
| Net decrease in net assets from distributions | | | (31,159,995 | ) | | | (66,342,429 | ) |
| SHARE TRANSACTIONS (NOTE 5): | | | | | | | | |
| Class A | | | | | | | | |
| Proceeds from sale of shares | | | 5,469,397 | | | | 9,795,173 | |
| Issued to shareholders in reinvestment of distributions | | | 2,854,857 | | | | 7,737,114 | |
| Cost of shares redeemed | | | (6,363,523 | ) | | | (41,614,699 | ) |
| Net increase/(decrease) from share transactions | | | 1,960,731 | | | | (24,082,412 | ) |
| Class C | | | | | | | | |
| Proceeds from sale of shares | | | 52,308 | | | | 353,979 | |
| Issued to shareholders in reinvestment of distributions | | | 311,881 | | | | 929,042 | |
| Cost of shares redeemed | | | (4,145,180 | ) | | | (4,316,317 | ) |
| Net decrease from share transactions | | | (3,780,991 | ) | | | (3,033,296 | ) |
| Institutional Class | | | | | | | | |
| Proceeds from sale of shares | | | 61,510,294 | | | | 219,002,818 | |
| Issued to shareholders in reinvestment of distributions | | | 20,997,210 | | | | 44,782,452 | |
| Cost of shares redeemed | | | (94,572,236 | ) | | | (197,494,406 | ) |
| Net increase/(decrease) from share transactions | | | (12,064,732 | ) | | | 66,290,864 | |
| Investor Class | | | | | | | | |
| Proceeds from sale of shares | | | 8,354,024 | | | | 23,244,966 | |
| Issued to shareholders in reinvestment of distributions | | | 571,809 | | | | 1,401,007 | |
| Cost of shares redeemed | | | (8,332,364 | ) | | | (20,859,900 | ) |
| Net increase from share transactions | | | 593,469 | | | | 3,786,073 | |
| Net decrease in net assets | | $ | (98,073,979 | ) | | $ | (48,845,873 | ) |
| NET ASSETS: | | | | | | | | |
| Beginning of year | | | 891,156,282 | | | | 940,002,155 | |
| End of year | | $ | 793,082,303 | | | $ | 891,156,282 | |
| Semi-Annual Report | October 31, 2023 | 29 |
| Emerald Growth Fund | Statements of Changes in Net Assets |
| | | For the Six Months Ended October 31, 2023 (Unaudited) | | | Year Ended April 30, 2023 | |
| Other Information: | | | | | | | | |
| SHARE TRANSACTIONS: | | | | | | | | |
| Class A | | | | | | | | |
| Sold | | | 256,253 | | | | 458,697 | |
| Distributions reinvested | | | 127,563 | | | | 346,800 | |
| Redeemed | | | (297,730 | ) | | | (1,983,708 | ) |
| Net increase/(decrease) in shares outstanding | | | 86,086 | | | | (1,178,211 | ) |
| Class C | | | | | | | | |
| Sold | | | 3,386 | | | | 22,494 | |
| Distributions reinvested | | | 19,323 | | | | 56,683 | |
| Redeemed | | | (267,112 | ) | | | (271,404 | ) |
| Net decrease in shares outstanding | | | (244,403 | ) | | | (192,227 | ) |
| Institutional Class | | | | | | | | |
| Sold | | | 2,665,920 | | | | 9,514,052 | |
| Distributions reinvested | | | 865,864 | | | | 1,862,831 | |
| Redeemed | | | (4,084,176 | ) | | | (8,714,134 | ) |
| Net increase/(decrease) in shares outstanding | | | (552,392 | ) | | | 2,662,749 | |
| Investor Class | | | | | | | | |
| Sold | | | 397,448 | | | | 1,090,950 | |
| Distributions reinvested | | | 25,792 | | | | 63,337 | |
| Redeemed | | | (389,694 | ) | | | (986,276 | ) |
| Net increase in shares outstanding | | | 33,546 | | | | 168,011 | |
See Notes to Financial Statements.
| 30 | www.emeraldmutualfunds.com |
| Emerald Insights Fund | Statements of Changes in Net Assets |
| | | For the Six Months Ended October 31, 2023 (Unaudited) | | | Year Ended April 30, 2023 | |
| OPERATIONS: | | | | | | | | |
| Net investment loss | | $ | (63,516 | ) | | $ | (133,308 | ) |
| Net realized gain/(loss) | | | 1,166,936 | | | | (842,569 | ) |
| Net change in unrealized depreciation | | | (460,152 | ) | | | (290,999 | ) |
| Net increase/(decrease) in net assets resulting from operations | | | 643,268 | | | | (1,266,876 | ) |
| DISTRIBUTIONS TO SHAREHOLDERS (NOTE 3): | | | | | | | | |
| Total distributable earnings | | | | | | | | |
| Class A | | | – | | | | (685,859 | ) |
| Class C | | | – | | | | (4,516 | ) |
| Institutional Class | | | – | | | | (184,623 | ) |
| Investor Class | | | – | | | | (35,572 | ) |
| Net decrease in net assets from distributions | | | – | | | | (910,570 | ) |
| SHARE TRANSACTIONS (NOTE 5): | | | | | | | | |
| Class A | | | | | | | | |
| Proceeds from sale of shares | | | 684,417 | | | | 1,875,927 | |
| Issued to shareholders in reinvestment of distributions | | | – | | | | 684,529 | |
| Cost of shares redeemed | | | (1,115,315 | ) | | | (6,394,550 | ) |
| Net decrease from share transactions | | | (430,898 | ) | | | (3,834,094 | ) |
| Class C | | | | | | | | |
| Proceeds from sale of shares | | | 2,500 | | | | – | |
| Issued to shareholders in reinvestment of distributions | | | – | | | | 4,152 | |
| Cost of shares redeemed | | | (27,022 | ) | | | (133,656 | ) |
| Net decrease from share transactions | | | (24,522 | ) | | | (129,504 | ) |
| Institutional Class | | | | | | | | |
| Proceeds from sale of shares | | | 194,541 | | | | 457,709 | |
| Issued to shareholders in reinvestment of distributions | | | – | | | | 184,623 | |
| Cost of shares redeemed | | | (249,924 | ) | | | (956,803 | ) |
| Net decrease from share transactions | | | (55,383 | ) | | | (314,471 | ) |
| Investor Class | | | | | | | | |
| Proceeds from sale of shares | | | 245,817 | | | | 362,065 | |
| Issued to shareholders in reinvestment of distributions | | | – | | | | 29,579 | |
| Cost of shares redeemed | | | (379,922 | ) | | | (198,230 | ) |
| Net increase/(decrease) from share transactions | | | (134,105 | ) | | | 193,414 | |
| Net decrease in net assets | | $ | (1,640 | ) | | $ | (6,262,101 | ) |
| NET ASSETS: | | | | | | | | |
| Beginning of year | | | 14,468,872 | | | | 20,730,973 | |
| End of year | | $ | 14,467,232 | | | $ | 14,468,872 | |
| Semi-Annual Report | October 31, 2023 | 31 |
| Emerald Insights Fund | Statements of Changes in Net Assets |
| | | For the Six Months Ended October 31, 2023 (Unaudited) | | | Year Ended April 30, 2023 | |
| Other Information: | | | | | | | | |
| SHARE TRANSACTIONS: | | | | | | | | |
| Class A | | | | | | | | |
| Sold | | | 44,928 | | | | 139,478 | |
| Distributions reinvested | | | – | | | | 46,982 | |
| Redeemed | | | (71,756 | ) | | | (498,073 | ) |
| Net decrease in shares outstanding | | | (26,828 | ) | | | (311,613 | ) |
| Class C | | | | | | | | |
| Sold | | | 175 | | | | – | |
| Distributions reinvested | | | – | | | | 309 | |
| Redeemed | | | (1,792 | ) | | | (10,625 | ) |
| Net decrease in shares outstanding | | | (1,617 | ) | | | (10,316 | ) |
| Institutional Class | | | | | | | | |
| Sold | | | 11,820 | | | | 32,828 | |
| Distributions reinvested | | | – | | | | 12,259 | |
| Redeemed | | | (16,479 | ) | | | (70,080 | ) |
| Net decrease in shares outstanding | | | (4,659 | ) | | | (24,993 | ) |
| Investor Class | | | | | | | | |
| Sold | | | 15,728 | | | | 26,027 | |
| Distributions reinvested | | | – | | | | 2,047 | |
| Redeemed | | | (24,363 | ) | | | (14,434 | ) |
| Net increase/(decrease) in shares outstanding | | | (8,635 | ) | | | 13,640 | |
See Notes to Financial Statements.
| 32 | www.emeraldmutualfunds.com |
Emerald Finance & Banking Innovation Fund | Statements of Changes in Net Assets |
| | | For the Six Months Ended October 31, 2023 (Unaudited) | | | Year Ended April 30, 2023 | |
| OPERATIONS: | | | | | | | | |
| Net investment income | | $ | 862,429 | | | $ | 243,865 | |
| Net realized loss | | | (5,690,981 | ) | | | (34,886,718 | ) |
| Net realized loss on foreign currency transactions | | | – | | | | (21,891 | ) |
| Net change in unrealized appreciation/(depreciation) | | | 4,845,077 | | | | (23,621,839 | ) |
| Net change in foreign currency transactions | | | (62 | ) | | | 2,248 | |
| Net increase/(decrease) in net assets resulting from operations | | | 16,463 | | | | (58,284,335 | ) |
| | | | | | | | | |
| SHARE TRANSACTIONS (NOTE 5): | | | | | | | | |
| Class A | | | | | | | | |
| Proceeds from sale of shares | | | 1,225,781 | | | | 2,834,208 | |
| Cost of shares redeemed | | | (2,172,538 | ) | | | (9,461,963 | ) |
| Net decrease from share transactions | | | (946,757 | ) | | | (6,627,755 | ) |
| Class C | | | | | | | | |
| Proceeds from sale of shares | | | 40,392 | | | | 237,474 | |
| Cost of shares redeemed | | | (1,323,557 | ) | | | (3,703,976 | ) |
| Net decrease from share transactions | | | (1,283,165 | ) | | | (3,466,502 | ) |
| Institutional Class | | | | | | | | |
| Proceeds from sale of shares | | | 1,623,189 | | | | 17,557,423 | |
| Cost of shares redeemed | | | (4,527,386 | ) | | | (43,969,428 | ) |
| Net decrease from share transactions | | | (2,904,197 | ) | | | (26,412,005 | ) |
| Investor Class | | | | | | | | |
| Proceeds from sale of shares | | | 290,431 | | | | 1,064,123 | |
| Cost of shares redeemed | | | (1,827,085 | ) | | | (4,734,921 | ) |
| Net decrease from share transactions | | | (1,536,654 | ) | | | (3,670,798 | ) |
| Net decrease in net assets | | $ | (6,654,310 | ) | | $ | (98,461,395 | ) |
| NET ASSETS: | | | | | | | | |
| Beginning of year | | | 62,663,093 | | | | 161,124,488 | |
| End of year | | $ | 56,008,783 | | | $ | 62,663,093 | |
| Other Information: | | | | | | | | |
| SHARE TRANSACTIONS: | | | | | | | | |
| Class A | | | | | | | | |
| Sold | | | 59,747 | | | | 121,543 | |
| Redeemed | | | (109,592 | ) | | | (415,487 | ) |
| Net decrease in shares outstanding | | | (49,845 | ) | | | (293,944 | ) |
| Class C | | | | | | | | |
| Sold | | | 2,558 | | | | 12,833 | |
| Redeemed | | | (79,390 | ) | | | (197,085 | ) |
| Net decrease in shares outstanding | | | (76,832 | ) | | | (184,252 | ) |
| Institutional Class | | | | | | | | |
| Sold | | | 77,266 | | | | 698,082 | |
| Redeemed | | | (216,990 | ) | | | (1,748,556 | ) |
| Net decrease in shares outstanding | | | (139,724 | ) | | | (1,050,474 | ) |
| Investor Class | | | | | | | | |
| Sold | | | 14,418 | | | | 50,419 | |
| Redeemed | | | (97,962 | ) | | | (217,049 | ) |
| Net decrease in shares outstanding | | | (83,544 | ) | | | (166,630 | ) |
See Notes to Financial Statements.
| Semi-Annual Report | October 31, 2023 | 33 |
Emerald Growth Fund | Financial Highlights |
| | For a share outstanding throughout the period or years presented |
| | | CLASS A | |
| | | For the Six Months Ended October 31, 2023 (Unaudited) | | | Year Ended
April 30, 2023 | | | Year Ended
April 30, 2022 | | | Year Ended
April 30, 2021 | | | Year Ended
April 30, 2020 | | | Year Ended
April 30, 2019 | |
| NET ASSET VALUE, BEGINNING OF PERIOD | | $ | 21.00 | | | $ | 23.23 | | | $ | 36.29 | | | $ | 23.06 | | | $ | 26.00 | | | $ | 25.99 | |
| INCOME/(LOSS) FROM OPERATIONS: | | | | | | | | | | | | | | | | | | | | | | | | |
| Net investment loss(a) | | | (0.04 | ) | | | (0.12 | ) | | | (0.12 | ) | | | (0.22 | ) | | | (0.16 | ) | | | (0.13 | ) |
| Net realized and unrealized gain/(loss) on investments | | | (1.24 | ) | | | (0.33 | ) | | | (7.38 | ) | | | 16.30 | | | | (2.40 | ) | | | 2.61 | |
| Total from Investment Operations | | | (1.28 | ) | | | (0.45 | ) | | | (7.50 | ) | | | 16.08 | | | | (2.56 | ) | | | 2.48 | |
| | | | | | | | | | | | | | | | | | | | | | | | | |
| LESS DISTRIBUTIONS: | | | | | | | | | | | | | | | | | | | | | | | | |
| From capital gains | | | (0.80 | ) | | | (1.78 | ) | | | (5.56 | ) | | | (2.85 | ) | | | (0.38 | ) | | | (2.47 | ) |
| Tax return of capital | | | – | | | | – | | | | – | | | | – | | | | – | | | | – | |
| Total Distributions | | | (0.80 | ) | | | (1.78 | ) | | | (5.56 | ) | | | (2.85 | ) | | | (0.38 | ) | | | (2.47 | ) |
| NET INCREASE/(DECREASE) IN NET ASSET VALUE | | | (2.08 | ) | | | (2.23 | ) | | | (13.06 | ) | | | 13.23 | | | | (2.94 | ) | | | 0.01 | |
| NET ASSET VALUE, END OF PERIOD | | $ | 18.92 | | | $ | 21.00 | | | $ | 23.23 | | | $ | 36.29 | | | $ | 23.06 | | | $ | 26.00 | |
| | | | | | | | | | | | | | | | | | | | | | | | | |
| TOTAL RETURN(b) | | | (6.68 | )%(c) | | | (2.39 | )% | | | (23.19 | )% | | | 70.77 | % | | | (10.00 | )% | | | 11.79 | % |
| RATIOS/SUPPLEMENTAL DATA: | | | | | | | | | | | | | | | | | | | | | | | | |
| Net Assets, End of Period (000s) | | $ | 75,515 | | | $ | 82,009 | | | $ | 118,082 | | | $ | 168,322 | | | $ | 134,755 | | | $ | 188,883 | |
| RATIOS TO AVERAGE NET ASSETS: | | | | | | | | | | | | | | | | | | | | | | | | |
| Net Investment loss | | | (0.36 | )%(d) | | | (0.55 | )% | | | (0.39 | )% | | | (0.72 | )% | | | (0.64 | )% | | | (0.50 | )% |
| Operating expenses excluding reimbursement/waiver | | | 1.09 | %(d) | | | 1.13 | % | | | 1.03 | % | | | 1.01 | % | | | 1.02 | % | | | 1.01 | % |
| Operating expenses including reimbursement/waiver | | | 1.09 | %(d) | | | 1.13 | % | | | 1.03 | % | | | 1.01 | % | | | 1.02 | % | | | 1.01 | % |
| PORTFOLIO TURNOVER RATE | | | 28 | %(c) | | | 62 | % | | | 38 | % | | | 66 | % | | | 48 | % | | | 64 | % |
| (a) | Per share amounts are based upon average shares outstanding. |
| (b) | Total return does not reflect the effect of sales charges. |
See Notes to Financial Statements.
| 34 | www.emeraldmutualfunds.com |
| Emerald Growth Fund | Financial Highlights |
| | For a share outstanding throughout the period or years presented |
| | | CLASS C | |
| | | For the Six Months Ended October 31, 2023 (Unaudited) | | | Year Ended
April 30, 2023 | | | Year Ended
April 30, 2022 | | | Year Ended
April 30, 2021 | | | Year Ended
April 30, 2020 | | | Year Ended
April 30, 2019 | |
| NET ASSET VALUE, BEGINNING OF PERIOD | | $ | 15.37 | | | $ | 17.56 | | | $ | 29.09 | | | $ | 18.97 | | | $ | 21.59 | | | $ | 22.18 | |
| INCOME/(LOSS) FROM OPERATIONS: | | | | | | | | | | | | | | | | | | | | | | | | |
| Net investment loss(a) | | | (0.08 | ) | | | (0.19 | ) | | | (0.26 | ) | | | (0.35 | ) | | | (0.27 | ) | | | (0.26 | ) |
| Net realized and unrealized gain/(loss) on investments | | | (0.87 | ) | | | (0.22 | ) | | | (5.71 | ) | | | 13.32 | | | | (1.97 | ) | | | 2.14 | |
| Total from Investment Operations | | | (0.95 | ) | | | (0.41 | ) | | | (5.97 | ) | | | 12.97 | | | | (2.24 | ) | | | 1.88 | |
| | | | | | | | | | | | | | | | | | | | | | | | | |
| LESS DISTRIBUTIONS: | | | | | | | | | | | | | | | | | | | | | | | | |
| From capital gains | | | (0.80 | ) | | | (1.78 | ) | | | (5.56 | ) | | | (2.85 | ) | | | (0.38 | ) | | | (2.47 | ) |
| Tax return of capital | | | – | | | | – | | | | – | | | | – | | | | – | | | | – | |
| Total Distributions | | | (0.80 | ) | | | (1.78 | ) | | | (5.56 | ) | | | (2.85 | ) | | | (0.38 | ) | | | (2.47 | ) |
| NET INCREASE/(DECREASE) IN NET ASSET VALUE | | | (1.75 | ) | | | (2.19 | ) | | | (11.53 | ) | | | 10.12 | | | | (2.62 | ) | | | (0.59 | ) |
| NET ASSET VALUE, END OF PERIOD | | $ | 13.62 | | | $ | 15.37 | | | $ | 17.56 | | | $ | 29.09 | | | $ | 18.97 | | | $ | 21.59 | |
| | | | | | | | | | | | | | | | | | | | | | | | | |
| TOTAL RETURN(b) | | | (6.99 | )%(c) | | | (3.00 | )% | | | (23.71 | )% | | | 69.60 | % | | | (10.57 | )% | | | 11.08 | % |
| RATIOS/SUPPLEMENTAL DATA: | | | | | | | | | | | | | | | | | | | | | | | | |
| Net Assets, End of Period (000s) | | $ | 3,101 | | | $ | 7,255 | | | $ | 11,668 | | | $ | 22,447 | | | $ | 17,434 | | | $ | 29,975 | |
| RATIOS TO AVERAGE NET ASSETS: | | | | | | | | | | | | | | | | | | | | | | | | |
| Net Investment loss | | | (1.00 | )%(d) | | | (1.19 | )% | | | (1.02 | )% | | | (1.37 | )% | | | (1.29 | )% | | | (1.15 | )% |
| Operating expenses excluding reimbursement/waiver | | | 1.74 | %(d) | | | 1.78 | % | | | 1.68 | % | | | 1.66 | % | | | 1.68 | % | | | 1.66 | % |
| Operating expenses including reimbursement/waiver | | | 1.74 | %(d) | | | 1.78 | % | | | 1.68 | % | | | 1.66 | % | | | 1.68 | % | | | 1.66 | % |
| PORTFOLIO TURNOVER RATE | | | 28 | %(c) | | | 62 | % | | | 38 | % | | | 66 | % | | | 48 | % | | | 64 | % |
| (a) | Per share amounts are based upon average shares outstanding. |
| (b) | Total return does not reflect the effect of sales charges. |
See Notes to Financial Statements.
| Semi-Annual Report | October 31, 2023 | 35 |
| Emerald Growth Fund | Financial Highlights |
| | For a share outstanding throughout the period or years presented |
| | | INSTITUTIONAL CLASS | |
| | | For the Six Months Ended October 31, 2023 (Unaudited) | | | Year Ended
April 30, 2023 | | | Year Ended
April 30, 2022 | | | Year Ended
April 30, 2021 | | | Year Ended
April 30, 2020 | | | Year Ended
April 30, 2019 | |
| NET ASSET VALUE, BEGINNING OF PERIOD | | $ | 22.68 | | | $ | 24.88 | | | $ | 38.32 | | | $ | 24.18 | | | $ | 27.16 | | | $ | 26.94 | |
| INCOME/(LOSS) FROM OPERATIONS: | | | | | | | | | | | | | | | | | | | | | | | | |
| Net investment loss(a) | | | (0.01 | ) | | | (0.06 | ) | | | (0.02 | ) | | | (0.13 | ) | | | (0.08 | ) | | | (0.05 | ) |
| Net realized and unrealized gain/(loss) on investments | | | (1.35 | ) | | | (0.36 | ) | | | (7.86 | ) | | | 17.12 | | | | (2.52 | ) | | | 2.74 | |
| Total from Investment Operations | | | (1.36 | ) | | | (0.42 | ) | | | (7.88 | ) | | | 16.99 | | | | (2.60 | ) | | | 2.69 | |
| | | | | | | | | | | | | | | | | | | | | | | | | |
| LESS DISTRIBUTIONS: | | | | | | | | | | | | | | | | | | | | | | | | |
| From capital gains | | | (0.80 | ) | | | (1.78 | ) | | | (5.56 | ) | | | (2.85 | ) | | | (0.38 | ) | | | (2.47 | ) |
| Tax return of capital | | | – | | | | – | | | | – | | | | – | | | | – | | | | – | |
| Total Distributions | | | (0.80 | ) | | | (1.78 | ) | | | (5.56 | ) | | | (2.85 | ) | | | (0.38 | ) | | | (2.47 | ) |
| NET INCREASE/(DECREASE) IN NET ASSET VALUE | | | (2.16 | ) | | | (2.20 | ) | | | (13.44 | ) | | | 14.14 | | | | (2.98 | ) | | | 0.22 | |
| NET ASSET VALUE, END OF PERIOD | | $ | 20.52 | | | $ | 22.68 | | | $ | 24.88 | | | $ | 38.32 | | | $ | 24.18 | | | $ | 27.16 | |
| | | | | | | | | | | | | | | | | | | | | | | | | |
| TOTAL RETURN | | | (6.54 | )%(b) | | | (2.10 | )% | | | (22.94 | )% | | | 71.27 | % | | | (9.72 | )% | | | 12.17 | % |
| RATIOS/SUPPLEMENTAL DATA: | | | | | | | | | | | | | | | | | | | | | | | | |
| Net Assets, End of Period (000s) | | $ | 647,429 | | | $ | 728,115 | | | $ | 732,429 | | | $ | 1,375,765 | | | $ | 863,360 | | | $ | 1,050,538 | |
| RATIOS TO AVERAGE NET ASSETS: | | | | | | | | | | | | | | | | | | | | | | | | |
| Net Investment income/(loss) | | | (0.06 | )%(c) | | | (0.24 | )% | | | 0.06 | % | | | (0.41 | )% | | | (0.32 | )% | | | (0.18 | )% |
| Operating expenses excluding reimbursement/waiver | | | 0.79 | %(c) | | | 0.82 | % | | | 0.72 | % | | | 0.70 | % | | | 0.70 | % | | | 0.69 | % |
| Operating expenses including reimbursement/waiver | | | 0.79 | %(c) | | | 0.82 | % | | | 0.72 | % | | | 0.70 | % | | | 0.70 | % | | | 0.69 | % |
| PORTFOLIO TURNOVER RATE | | | 28 | %(b) | | | 62 | % | | | 38 | % | | | 66 | % | | | 48 | % | | | 64 | % |
| (a) | Per share amounts are based upon average shares outstanding. |
See Notes to Financial Statements.
| 36 | www.emeraldmutualfunds.com |
| Emerald Growth Fund | Financial Highlights |
| | For a share outstanding throughout the period or years presented |
| | | INVESTOR CLASS | |
| | | For the Six Months Ended October 31, 2023 (Unaudited) | | | Year Ended
April 30, 2023 | | | Year Ended
April 30, 2022 | | | Year Ended
April 30, 2021 | | | Year Ended
April 30, 2020 | | | Year Ended
April 30, 2019 | |
| NET ASSET VALUE, BEGINNING OF PERIOD | | $ | 20.81 | | | $ | 23.05 | | | $ | 36.07 | | | $ | 22.94 | | | $ | 25.88 | | | $ | 25.88 | |
| INCOME/(LOSS) FROM OPERATIONS: | | | | | | | | | | | | | | | | | | | | | | | | |
| Net investment loss(a) | | | (0.05 | ) | | | (0.12 | ) | | | (0.14 | ) | | | (0.23 | ) | | | (0.17 | ) | | | (0.14 | ) |
| Net realized and unrealized gain/(loss) on investments | | | (1.22 | ) | | | (0.34 | ) | | | (7.32 | ) | | | 16.21 | | | | (2.39 | ) | | | 2.61 | |
| Total from Investment Operations | | | (1.27 | ) | | | (0.46 | ) | | | (7.46 | ) | | | 15.98 | | | | (2.56 | ) | | | 2.47 | |
| | | | | | | | | | | | | | | | | | | | | | | | | |
| LESS DISTRIBUTIONS: | | | | | | | | | | | | | | | | | | | | | | | | |
| From capital gains | | | (0.80 | ) | | | (1.78 | ) | | | (5.56 | ) | | | (2.85 | ) | | | (0.38 | ) | | | (2.47 | ) |
| Tax return of capital | | | – | | | | – | | | | – | | | | – | | | | – | | | | – | |
| Total Distributions | | | (0.80 | ) | | | (1.78 | ) | | | (5.56 | ) | | | (2.85 | ) | | | (0.38 | ) | | | (2.47 | ) |
| NET INCREASE/(DECREASE) IN NET ASSET VALUE | | | (2.07 | ) | | | (2.24 | ) | | | (13.02 | ) | | | 13.13 | | | | (2.94 | ) | | | 0.00 | |
| NET ASSET VALUE, END OF PERIOD | | $ | 18.74 | | | $ | 20.81 | | | $ | 23.05 | | | $ | 36.07 | | | $ | 22.94 | | | $ | 25.88 | |
| | | | | | | | | | | | | | | | | | | | | | | | | |
| TOTAL RETURN | | | (6.70 | )%(b) | | | (2.44 | )% | | | (23.22 | )% | | | 70.71 | % | | | (10.05 | )% | | | 11.81 | % |
| RATIOS/SUPPLEMENTAL DATA: | | | | | | | | | | | | | | | | | | | | | | | | |
| Net Assets, End of Period (000s) | | $ | 67,037 | | | $ | 73,777 | | | $ | 77,823 | | | $ | 103,326 | | | $ | 80,740 | | | $ | 104,403 | |
| RATIOS TO AVERAGE NET ASSETS: | | | | | | | | | | | | | | | | | | | | | | | | |
| Net Investment loss | | | (0.48 | )%(c) | | | (0.59 | )% | | | (0.44 | )% | | | (0.75 | )% | | | (0.68 | )% | | | (0.53 | )% |
| Operating expenses excluding reimbursement/waiver | | | 1.21 | %(c) | | | 1.17 | % | | | 1.07 | % | | | 1.05 | % | | | 1.06 | % | | | 1.04 | % |
| Operating expenses including reimbursement/waiver | | | 1.21 | %(c) | | | 1.17 | % | | | 1.07 | % | | | 1.05 | % | | | 1.06 | % | | | 1.04 | % |
| PORTFOLIO TURNOVER RATE | | | 28 | %(b) | | | 62 | % | | | 38 | % | | | 66 | % | | | 48 | % | | | 64 | % |
| (a) | Per share amounts are based upon average shares outstanding. |
See Notes to Financial Statements.
| Semi-Annual Report | October 31, 2023 | 37 |
| Emerald Insights Fund | Financial Highlights |
| | For a share outstanding throughout the period or years presented |
| | | CLASS A | |
| | | For the Six Months Ended October 31, 2023 (Unaudited) | | | Year Ended
April 30, 2023 | | | Year Ended
April 30, 2022 | | | Year Ended
April 30, 2021 | | | Year Ended
April 30, 2020 | | | Year Ended
April 30, 2019 | |
| NET ASSET VALUE, BEGINNING OF PERIOD | | $ | 13.98 | | | $ | 15.16 | | | $ | 20.18 | | | $ | 12.13 | | | $ | 11.51 | | | $ | 13.09 | |
| INCOME/(LOSS) FROM OPERATIONS: | | | | | | | | | | | | | | | | | | | | | | | | |
| Net investment loss(a) | | | (0.07 | ) | | | (0.11 | ) | | | (0.18 | ) | | | (0.14 | ) | | | (0.10 | ) | | | (0.09 | ) |
| Net realized and unrealized gain/(loss) on investments | | | 0.65 | | | | (0.42 | ) | | | (1.98 | ) | | | 9.80 | | | | 0.72 | | | | 1.04 | |
| Total from Investment Operations | | | 0.58 | | | | (0.53 | ) | | | (2.16 | ) | | | 9.66 | | | | 0.62 | | | | 0.95 | |
| | | | | | | | | | | | | | | | | | | | | | | | | |
| LESS DISTRIBUTIONS: | | | | | | | | | | | | | | | | | | | | | | | | |
| From capital gains | | | – | | | | (0.65 | ) | | | (2.86 | ) | | | (1.61 | ) | | | 0.00 | (b) | | | (2.53 | ) |
| Total Distributions | | | – | | | | (0.65 | ) | | | (2.86 | ) | | | (1.61 | ) | | | – | | | | (2.53 | ) |
| NET INCREASE/(DECREASE) IN NET ASSET VALUE | | | 0.58 | | | | (1.18 | ) | | | (5.02 | ) | | | 8.05 | | | | 0.62 | | | | (1.58 | ) |
| NET ASSET VALUE, END OF PERIOD | | $ | 14.56 | | | $ | 13.98 | | | $ | 15.16 | | | $ | 20.18 | | | $ | 12.13 | | | $ | 11.51 | |
| | | | | | | | | | | | | | | | | | | | | | | | | |
| TOTAL RETURN(c) | | | 4.15 | %(d) | | | (3.68 | %) | | | (12.78 | %) | | | 82.17 | % | | | 5.43 | % | | | 11.53 | % |
| RATIOS/SUPPLEMENTAL DATA: | | | | | | | | | | | | | | | | | | | | | | | | |
| Net Assets, End of Period (000s) | | $ | 9,972 | | | $ | 9,950 | | | $ | 15,516 | | | $ | 17,618 | | | $ | 10,174 | | | $ | 9,397 | |
| RATIOS TO AVERAGE NET ASSETS: | | | | | | | | | | | | | | | | | | | | | | | | |
| Net Investment loss | | | (0.90 | %)(e) | | | (0.80 | %) | | | (0.92 | %) | | | (0.86 | %) | | | (0.83 | %) | | | (0.71 | %) |
| Operating expenses excluding reimbursement/waiver | | | 2.08 | %(e) | | | 1.94 | % | | | 1.73 | % | | | 1.92 | % | | | 2.25 | % | | | 2.18 | % |
| Operating expenses including reimbursement/waiver | | | 1.35 | %(e) | | | 1.35 | % | | | 1.35 | % | | | 1.35 | % | | | 1.35 | % | | | 1.35 | % |
| PORTFOLIO TURNOVER RATE | | | 32 | %(d) | | | 64 | % | | | 70 | % | | | 89 | % | | | 94 | % | | | 63 | % |
| (a) | Per share amounts are based upon average shares outstanding. |
| (b) | Less than $(0.005) per share. |
| (c) | Total return does not reflect the effect of sales charges. |
See Notes to Financial Statements.
| 38 | www.emeraldmutualfunds.com |
| Emerald Insights Fund | Financial Highlights |
| | For a share outstanding throughout the period or years presented |
| | | CLASS C | |
| | | For the Six Months Ended October 31, 2023 (Unaudited) | | | Year Ended
April 30, 2023 | | | Year Ended
April 30, 2022 | | | Year Ended
April 30, 2021 | | | Year Ended
April 30, 2020 | | | Year Ended
April 30, 2019 | |
| NET ASSET VALUE, BEGINNING OF PERIOD | | $ | 12.82 | | | $ | 14.05 | | | $ | 19.02 | | | $ | 11.57 | | | $ | 11.04 | | | $ | 12.75 | |
| INCOME/(LOSS) FROM OPERATIONS: | | | | | | | | | | | | | | | | | | | | | | | | |
| Net investment loss(a) | | | (0.11 | ) | | | (0.18 | ) | | | (0.28 | ) | | | (0.24 | ) | | | (0.16 | ) | | | (0.16 | ) |
| Net realized and unrealized gain/(loss) on investments | | | 0.60 | | | | (0.40 | ) | | | (1.83 | ) | | | 9.30 | | | | 0.69 | | | | 0.98 | |
| Total from Investment Operations | | | 0.49 | | | | (0.58 | ) | | | (2.11 | ) | | | 9.06 | | | | 0.53 | | | | 0.82 | |
| | | | | | | | | | | | | | | | | | | | | | | | | |
| LESS DISTRIBUTIONS: | | | | | | | | | | | | | | | | | | | | | | | | |
| From capital gains | | | – | | | | (0.65 | ) | | | (2.86 | ) | | | (1.61 | ) | | | 0.00 | (b) | | | (2.53 | ) |
| Total Distributions | | | – | | | | (0.65 | ) | | | (2.86 | ) | | | (1.61 | ) | | | – | | | | (2.53 | ) |
| NET INCREASE/(DECREASE) IN NET ASSET VALUE | | | 0.49 | | | | (1.23 | ) | | | (4.97 | ) | | | 7.45 | | | | 0.53 | | | | (1.71 | ) |
| NET ASSET VALUE, END OF PERIOD | | $ | 13.31 | | | $ | 12.82 | | | $ | 14.05 | | | $ | 19.02 | | | $ | 11.57 | | | $ | 11.04 | |
| | | | | | | | | | | | | | | | | | | | | | | | | |
| TOTAL RETURN(c) | | | 3.82 | %(d) | | | (4.33 | %) | | | (13.32 | %) | | | 80.92 | % | | | 4.84 | % | | | 10.75 | % |
| RATIOS/SUPPLEMENTAL DATA: | | | | | | | | | | | | | | | | | | | | | | | | |
| Net Assets, End of Period (000s) | | $ | 18 | | | $ | 38 | | | $ | 186 | | | $ | 246 | | | $ | 138 | | | $ | 141 | |
| RATIOS TO AVERAGE NET ASSETS: | | | | | | | | | | | | | | | | | | | | | | | | |
| Net Investment loss | | | (1.55 | %)(e) | | | (1.42 | %) | | | (1.58 | %) | | | (1.51 | %) | | | (1.48 | %) | | | (1.36 | %) |
| Operating expenses excluding reimbursement/waiver | | | 2.77 | %(e) | | | 2.55 | % | | | 2.38 | % | | | 2.57 | % | | | 2.90 | % | | | 2.84 | % |
| Operating expenses including reimbursement/waiver | | | 2.00 | %(e) | | | 2.00 | % | | | 2.00 | % | | | 2.00 | % | | | 2.00 | % | | | 2.00 | % |
| PORTFOLIO TURNOVER RATE | | | 32 | %(d) | | | 64 | % | | | 70 | % | | | 89 | % | | | 94 | % | | | 63 | % |
| (a) | Per share amounts are based upon average shares outstanding. |
| (b) | Less than $(0.005) per share. |
| (c) | Total return does not reflect the effect of sales charges. |
See Notes to Financial Statements.
| Semi-Annual Report | October 31, 2023 | 39 |
| Emerald Insights Fund | Financial Highlights |
| | For a share outstanding throughout the period or years presented |
| | | INSTITUTIONAL CLASS | |
| | | For the Six Months Ended October 31, 2023 (Unaudited) | | | Year Ended
April 30, 2023 | | | Year Ended
April 30, 2022 | | | Year Ended
April 30, 2021 | | | Year Ended
April 30, 2020 | | | Year Ended
April 30, 2019 | |
| NET ASSET VALUE, BEGINNING OF PERIOD | | $ | 14.49 | | | $ | 15.64 | | | $ | 20.67 | | | $ | 12.37 | | | $ | 11.69 | | | $ | 13.22 | |
| INCOME/(LOSS) FROM OPERATIONS: | | | | | | | | | | | | | | | | | | | | | | | | |
| Net investment loss(a) | | | (0.05 | ) | | | (0.07 | ) | | | (0.12 | ) | | | (0.10 | ) | | | (0.06 | ) | | | (0.05 | ) |
| Net realized and unrealized gain/(loss) on investments | | | 0.67 | | | | (0.43 | ) | | | (2.05 | ) | | | 10.01 | | | | 0.74 | | | | 1.05 | |
| Total from Investment Operations | | | 0.62 | | | | (0.50 | ) | | | (2.17 | ) | | | 9.91 | | | | 0.68 | | | | 1.00 | |
| | | | | | | | | | | | | | | | | | | | | | | | | |
| LESS DISTRIBUTIONS: | | | | | | | | | | | | | | | | | | | | | | | | |
| From capital gains | | | – | | | | (0.65 | ) | | | (2.86 | ) | | | (1.61 | ) | | | 0.00 | (b) | | | (2.53 | ) |
| Total Distributions | | | – | | | | (0.65 | ) | | | (2.86 | ) | | | (1.61 | ) | | | – | | | | (2.53 | ) |
| NET INCREASE/(DECREASE) IN NET ASSET VALUE | | | 0.62 | | | | (1.15 | ) | | | (5.03 | ) | | | 8.30 | | | | 0.68 | | | | (1.53 | ) |
| NET ASSET VALUE, END OF PERIOD | | $ | 15.11 | | | $ | 14.49 | | | $ | 15.64 | | | $ | 20.67 | | | $ | 12.37 | | | $ | 11.69 | |
| | | | | | | | | | | | | | | | | | | | | | | | | |
| TOTAL RETURN | | | 4.28 | %(c) | | | (3.40 | %) | | | (12.51 | %) | | | 82.62 | % | | | 5.85 | % | | | 11.81 | % |
| RATIOS/SUPPLEMENTAL DATA: | | | | | | | | | | | | | | | | | | | | | | | | |
| Net Assets, End of Period (000s) | | $ | 3,744 | | | $ | 3,657 | | | $ | 4,340 | | | $ | 3,658 | | | $ | 1,462 | | | $ | 1,383 | |
| RATIOS TO AVERAGE NET ASSETS: | | | | | | | | | | | | | | | | | | | | | | | | |
| Net Investment loss | | | (0.60 | %)(d) | | | (0.51 | %) | | | (0.62 | %) | | | (0.57 | %) | | | (0.53 | %) | | | (0.41 | %) |
| Operating expenses excluding reimbursement/waiver | | | 1.77 | %(d) | | | 1.65 | % | | | 1.42 | % | | | 1.60 | % | | | 1.93 | % | | | 1.87 | % |
| Operating expenses including reimbursement/waiver | | | 1.05 | %(d) | | | 1.05 | % | | | 1.05 | % | | | 1.05 | % | | | 1.05 | % | | | 1.05 | % |
| PORTFOLIO TURNOVER RATE | | | 32 | %(c) | | | 64 | % | | | 70 | % | | | 89 | % | | | 94 | % | | | 63 | % |
| (a) | Per share amounts are based upon average shares outstanding. |
| (b) | Less than $(0.005) per share. |
See Notes to Financial Statements.
| 40 | www.emeraldmutualfunds.com |
| Emerald Insights Fund | Financial Highlights |
| | For a share outstanding throughout the period or years presented |
| | | INVESTOR CLASS | |
| | | For the Six Months Ended October 31, 2023 (Unaudited) | | | Year Ended
April 30, 2023 | | | Year Ended
April 30, 2022 | | | Year Ended
April 30, 2021 | | | Year Ended
April 30, 2020 | | | Year Ended
April 30, 2019 | |
| NET ASSET VALUE, BEGINNING OF PERIOD | | $ | 13.87 | | | $ | 15.05 | | | $ | 20.06 | | | $ | 12.07 | | | $ | 11.45 | | | $ | 13.05 | |
| INCOME/(LOSS) FROM OPERATIONS: | | | | | | | | | | | | | | | | | | | | | | | | |
| Net investment loss(a) | | | (0.07 | ) | | | (0.12 | ) | | | (0.18 | ) | | | (0.15 | ) | | | (0.09 | ) | | | (0.10 | ) |
| Net realized and unrealized gain/(loss) on investments | | | 0.64 | | | | (0.41 | ) | | | (1.97 | ) | | | 9.75 | | | | 0.71 | | | | 1.03 | |
| Total from Investment Operations | | | 0.57 | | | | (0.53 | ) | | | (2.15 | ) | | | 9.60 | | | | 0.62 | | | | 0.93 | |
| | | | | | | | | | | | | | | | | | | | | | | | | |
| LESS DISTRIBUTIONS: | | | | | | | | | | | | | | | | | | | | | | | | |
| From capital gains | | | – | | | | (0.65 | ) | | | (2.86 | ) | | | (1.61 | ) | | | 0.00 | (b) | | | (2.53 | ) |
| Total Distributions | | | – | | | | (0.65 | ) | | | (2.86 | ) | | | (1.61 | ) | | | – | | | | (2.53 | ) |
| NET INCREASE/(DECREASE) IN NET ASSET VALUE | | | 0.57 | | | | (1.18 | ) | | | (5.01 | ) | | | 7.99 | | | | 0.62 | | | | (1.60 | ) |
| NET ASSET VALUE, END OF PERIOD | | $ | 14.44 | | | $ | 13.87 | | | $ | 15.05 | | | $ | 20.06 | | | $ | 12.07 | | | $ | 11.45 | |
| | | | | | | | | | | | | | | | | | | | | | | | | |
| TOTAL RETURN | | | 4.11 | %(c) | | | (3.75 | %) | | | (12.80 | %) | | | 82.08 | % | | | 5.45 | % | | | 11.41 | % |
| RATIOS/SUPPLEMENTAL DATA: | | | | | | | | | | | | | | | | | | | | | | | | |
| Net Assets, End of Period (000s) | | $ | 733 | | | $ | 824 | | | $ | 689 | | | $ | 638 | | | $ | 274 | | | $ | 174 | |
| RATIOS TO AVERAGE NET ASSETS: | | | | | | | | | | | | | | | | | | | | | | | | |
| Net Investment loss | | | (0.95 | %)(d) | | | (0.87 | %) | | | (0.97 | %) | | | (0.91 | %) | | | (0.82 | %) | | | (0.77 | %) |
| Operating expenses excluding reimbursement/waiver | | | 2.14 | %(d) | | | 1.97 | % | | | 1.71 | % | | | 1.86 | % | | | 2.17 | % | | | 2.08 | % |
| Operating expenses including reimbursement/waiver | | | 1.40 | %(d) | | | 1.40 | % | | | 1.40 | % | | | 1.40 | % | | | 1.40 | % | | | 1.40 | % |
| PORTFOLIO TURNOVER RATE | | | 32 | %(c) | | | 64 | % | | | 70 | % | | | 89 | % | | | 94 | % | | | 63 | % |
| (a) | Per share amounts are based upon average shares outstanding. |
| (b) | Less than $(0.005) per share. |
See Notes to Financial Statements.
| Semi-Annual Report | October 31, 2023 | 41 |
Emerald Finance
& Banking Innovation Fund | Financial Highlights |
| For a share outstanding throughout the period or years presented |
| | | CLASS A | |
| | | For the Six Months Ended October 31, 2023 (Unaudited) | | | Year Ended
April 30, 2023 | | | Year Ended
April 30, 2022 | | | Year Ended
April 30, 2021 | | | Year Ended
April 30, 2020 | | | Year Ended
April 30, 2019 | |
| NET ASSET VALUE, BEGINNING OF PERIOD | | $ | 18.75 | | | $ | 31.99 | | | $ | 51.56 | | | $ | 22.89 | | | $ | 32.71 | | | $ | 46.01 | |
| INCOME/(LOSS) FROM OPERATIONS: | | | | | | | | | | | | | | | | | | | | | | | | |
| Net investment income/(loss)(a) | | | 0.26 | | | | 0.13 | | | | 0.84 | | | | 0.06 | | | | (0.03 | ) | | | (0.24 | ) |
| Net realized and unrealized gain/(loss) on investments | | | (0.39 | ) | | | (13.37 | ) | | | (14.81 | ) | | | 28.61 | | | | (9.79 | ) | | | (5.35 | ) |
| Total from Investment Operations | | | (0.13 | ) | | | (13.24 | ) | | | (13.97 | ) | | | 28.67 | | | | (9.82 | ) | | | (5.59 | ) |
| | | | | | | | | | | | | | | | | | | | | | | | | |
| LESS DISTRIBUTIONS: | | | | | | | | | | | | | | | | | | | | | | | | |
| From investment income | | | – | | | | – | | | | (3.37 | ) | | | – | | | | – | | | | – | |
| From capital gains | | | – | | | | – | | | | (1.37 | ) | | | – | | | | – | | | | (7.71 | ) |
| Tax return of capital | | | – | | | | – | | | | (0.86 | ) | | | – | | | | – | | | | – | |
| Total Distributions | | | – | | | | – | | | | (5.60 | ) | | | – | | | | – | | | | (7.71 | ) |
| NET INCREASE/(DECREASE) IN NET ASSET VALUE | | | (0.13 | ) | | | (13.24 | ) | | | (19.57 | ) | | | 28.67 | | | | (9.82 | ) | | | (13.30 | ) |
| NET ASSET VALUE, END OF PERIOD | | $ | 18.62 | | | $ | 18.75 | | | $ | 31.99 | | | $ | 51.56 | | | $ | 22.89 | | | $ | 32.71 | |
| | | | | | | | | | | | | | | | | | | | | | | | | |
| TOTAL RETURN(b) | | | (0.69 | )%(c) | | | (41.40 | )% | | | (30.58 | )% | | | 125.21 | % | | | (30.02 | )% | | | (10.65 | )% |
| RATIOS/SUPPLEMENTAL DATA: | | | | | | | | | | | | | | | | | | | | | | | | |
| Net Assets, End of Period (000s) | | $ | 18,892 | | | $ | 19,949 | | | $ | 43,448 | | | $ | 68,778 | | | $ | 37,933 | | | $ | 87,267 | |
| RATIOS TO AVERAGE NET ASSETS: | | | | | | | | | | | | | | | | | | | | | | | | |
| Net Investment income/(loss) | | | 2.58 | %(d) | | | 0.52 | % | | | 1.70 | % | | | 0.18 | % | | | (0.10 | )% | | | (0.58 | )% |
| Operating expenses excluding reimbursement/waiver | | | 1.80 | %(d) | | | 1.82 | % | | | 1.78 | % | | | 1.53 | % | | | 1.48 | % | | | 1.42 | % |
| Operating expenses including reimbursement/waiver | | | 1.80 | %(d) | | | 1.82 | % | | | 1.48 | % | | | 1.53 | % | | | 1.48 | % | | | 1.42 | % |
| PORTFOLIO TURNOVER RATE | | | 46 | %(c) | | | 88 | % | | | 94 | % | | | 171 | % | | | 46 | % | | | 55 | % |
| (a) | Per share amounts are based upon average shares outstanding. |
| (b) | Total return does not reflect the effect of sales charges. |
See Notes to Financial Statements.
| 42 | www.emeraldmutualfunds.com |
Emerald Finance
& Banking Innovation Fund | Financial Highlights |
| For a share outstanding throughout the period or years presented |
| | | CLASS C | |
| | | For the Six Months Ended October 31, 2023 (Unaudited) | | | Year Ended
April 30, 2023 | | | Year Ended
April 30, 2022 | | | Year Ended
April 30, 2021 | | | Year Ended
April 30, 2020 | | | Year Ended
April 30, 2019 | |
| NET ASSET VALUE, BEGINNING OF PERIOD | | $ | 15.27 | | | $ | 26.23 | | | $ | 43.35 | | | $ | 19.38 | | | $ | 27.87 | | | $ | 40.83 | |
| INCOME/(LOSS) FROM OPERATIONS: | | | | | | | | | | | | | | | | | | | | | | | | |
| Net investment income/(loss)(a) | | | 0.17 | | | | (0.05 | ) | | | 0.40 | | | | (0.11 | ) | | | (0.20 | ) | | | (0.44 | ) |
| Net realized and unrealized gain/(loss) on investments | | | (0.32 | ) | | | (10.91 | ) | | | (12.11 | ) | | | 24.08 | | | | (8.29 | ) | | | (4.81 | ) |
| Total from Investment Operations | | | (0.15 | ) | | | (10.96 | ) | | | (11.71 | ) | | | 23.97 | | | | (8.49 | ) | | | (5.25 | ) |
| | | | | | | | | | | | | | | | | | | | | | | | | |
| LESS DISTRIBUTIONS: | | | | | | | | | | | | | | | | | | | | | | | | |
| From investment income | | | – | | | | – | | | | (3.27 | ) | | | – | | | | – | | | | – | |
| From capital gains | | | – | | | | – | | | | (1.37 | ) | | | – | | | | – | | | | (7.71 | ) |
| Tax return of capital | | | – | | | | – | | | | (0.77 | ) | | | – | | | | – | | | | – | |
| Total Distributions | | | – | | | | – | | | | (5.41 | ) | | | – | | | | – | | | | (7.71 | ) |
| NET INCREASE/(DECREASE) IN NET ASSET VALUE | | | (0.15 | ) | | | (10.96 | ) | | | (17.12 | ) | | | 23.97 | | | | (8.49 | ) | | | (12.96 | ) |
| NET ASSET VALUE, END OF PERIOD | | $ | 15.12 | | | $ | 15.27 | | | $ | 26.23 | | | $ | 43.35 | | | $ | 19.38 | | | $ | 27.87 | |
| | | | | | | | | | | | | | | | | | | | | | | | | |
| TOTAL RETURN(b) | | | (0.98 | )%(c) | | | (41.77 | )% | | | (31.05 | )% | | | 123.68 | % | | | (30.46 | )% | | | (11.21 | )% |
| RATIOS/SUPPLEMENTAL DATA: | | | | | | | | | | | | | | | | | | | | | | | | |
| Net Assets, End of Period (000s) | | $ | 3,315 | | | $ | 4,521 | | | $ | 12,600 | | | $ | 22,447 | | | $ | 16,804 | | | $ | 50,079 | |
| RATIOS TO AVERAGE NET ASSETS: | | | | | | | | | | | | | | | | | | | | | | | | |
| Net Investment income/(loss) | | | 2.10 | %(d) | | | (0.27 | )% | | | 0.98 | % | | | (0.40 | )% | | | (0.73 | )% | | | (1.23 | )% |
| Operating expenses excluding reimbursement/waiver | | | 2.46 | %(d) | | | 2.46 | % | | | 2.43 | % | | | 2.18 | % | | | 2.13 | % | | | 2.07 | % |
| Operating expenses including reimbursement/waiver | | | 2.46 | %(d) | | | 2.46 | % | | | 2.13 | % | | | 2.18 | % | | | 2.13 | % | | | 2.07 | % |
| PORTFOLIO TURNOVER RATE | | | 46 | %(c) | | | 88 | % | | | 94 | % | | | 171 | % | | | 46 | % | | | 55 | % |
| (a) | Per share amounts are based upon average shares outstanding. |
| (b) | Total return does not reflect the effect of sales charges. |
See Notes to Financial Statements.
| Semi-Annual Report | October 31, 2023 | 43 |
Emerald Finance
& Banking Innovation Fund | Financial Highlights |
| For a share outstanding throughout the period or years presented |
| | | INSTITUTIONAL CLASS | |
| | | For the Six Months Ended October 31, 2023 (Unaudited) | | | Year Ended
April 30, 2023 | | | Year Ended
April 30, 2022 | | | Year Ended
April 30, 2021 | | | Year Ended
April 30, 2020 | | | Year Ended
April 30, 2019 | |
| NET ASSET VALUE, BEGINNING OF PERIOD | | $ | 19.62 | | | $ | 33.38 | | | $ | 53.48 | | | $ | 23.67 | | | $ | 33.70 | | | $ | 46.95 | |
| INCOME/(LOSS) FROM OPERATIONS: | | | | | | | | | | | | | | | | | | | | | | | | |
| Net investment income/(loss)(a) | | | 0.31 | | | | 0.17 | | | | 1.00 | | | | 0.14 | | | | 0.09 | | | | (0.09 | ) |
| Net realized and unrealized gain/(loss) on investments | | | (0.40 | ) | | | (13.93 | ) | | | (15.39 | ) | | | 29.67 | | | | (10.12 | ) | | | (5.45 | ) |
| Total from Investment Operations | | | (0.09 | ) | | | (13.76 | ) | | | (14.39 | ) | | | 29.81 | | | | (10.03 | ) | | | (5.54 | ) |
| | | | | | | | | | | | | | | | | | | | | | | | | |
| LESS DISTRIBUTIONS: | | | | | | | | | | | | | | | | | | | | | | | | |
| From investment income | | | – | | | | – | | | | (3.53 | ) | | | – | | | | – | | | | – | |
| From capital gains | | | – | | | | – | | | | (1.37 | ) | | | – | | | | – | | | | (7.71 | ) |
| Tax return of capital | | | – | | | | – | | | | (0.81 | ) | | | – | | | | – | | | | – | |
| Total Distributions | | | – | | | | – | | | | (5.71 | ) | | | – | | | | – | | | | (7.71 | ) |
| NET INCREASE/(DECREASE) IN NET ASSET VALUE | | | (0.09 | ) | | | (13.76 | ) | | | (20.10 | ) | | | 29.81 | | | | (10.03 | ) | | | (13.25 | ) |
| NET ASSET VALUE, END OF PERIOD | | $ | 19.53 | | | $ | 19.62 | | | $ | 33.38 | | | $ | 53.48 | | | $ | 23.67 | | | $ | 33.70 | |
| | | | | | | | | | | | | | | | | | | | | | | | | |
| TOTAL RETURN | | | (0.46 | )%(b) | | | (41.21 | )% | | | (30.32 | )% | | | 125.94 | % | | | (29.76 | )% | | | (10.30 | )% |
| RATIOS/SUPPLEMENTAL DATA: | | | | | | | | | | | | | | | | | | | | | | | | |
| Net Assets, End of Period (000s) | | $ | 27,188 | | | $ | 30,063 | | | $ | 86,196 | | | $ | 134,767 | | | $ | 67,358 | | | $ | 162,910 | |
| RATIOS TO AVERAGE NET ASSETS: | | | | | | | | | | | | | | | | | | | | | | | | |
| Net Investment income/(loss) | | | 2.92 | %(c) | | | 0.68 | % | | | 1.95 | % | | | 0.39 | % | | | 0.28 | % | | | (0.23 | )% |
| Operating expenses excluding reimbursement/waiver | | | 1.49 | %(c) | | | 1.48 | % | | | 1.44 | % | | | 1.18 | % | | | 1.13 | % | | | 1.06 | % |
| Operating expenses including reimbursement/waiver | | | 1.48 | %(c) | | | 1.48 | % | | | 1.13 | % | | | 1.18 | % | | | 1.13 | % | | | 1.06 | % |
| PORTFOLIO TURNOVER RATE | | | 46 | %(b) | | | 88 | % | | | 94 | % | | | 171 | % | | | 46 | % | | | 55 | % |
| (a) | Per share amounts are based upon average shares outstanding. |
See Notes to Financial Statements.
| 44 | www.emeraldmutualfunds.com |
Emerald Finance
& Banking Innovation Fund | Financial Highlights |
| For a share outstanding throughout the period or years presented |
| | | INVESTOR CLASS | |
| | | For the Six Months Ended October 31, 2023 (Unaudited) | | | Year Ended
April 30, 2023 | | | Year Ended
April 30, 2022 | | | Year Ended
April 30, 2021 | | | Year Ended
April 30, 2020 | | | Year Ended
April 30, 2019 | |
| NET ASSET VALUE, BEGINNING OF PERIOD | | $ | 17.59 | | | $ | 30.03 | | | $ | 48.76 | | | $ | 21.66 | | | $ | 30.96 | | | $ | 44.05 | |
| INCOME/(LOSS) FROM OPERATIONS: | | | | | | | | | | | | | | | | | | | | | | | | |
| Net investment income/(loss)(a) | | | 0.24 | | | | 0.10 | | | | 0.73 | | | | 0.03 | | | | (0.04 | ) | | | (0.23 | ) |
| Net realized and unrealized gain/(loss) on investments | | | (0.36 | ) | | | (12.54 | ) | | | (13.85 | ) | | | 27.07 | | | | (9.26 | ) | | | (5.15 | ) |
| Total from Investment Operations | | | (0.12 | ) | | | (12.44 | ) | | | (13.12 | ) | | | 27.10 | | | | (9.30 | ) | | | (5.38 | ) |
| | | | | | | | | | | | | | | | | | | | | | | | | |
| LESS DISTRIBUTIONS: | | | | | | | | | | | | | | | | | | | | | | | | |
| From investment income | | | – | | | | – | | | | (3.10 | ) | | | – | | | | – | | | | – | |
| From capital gains | | | – | | | | – | | | | (1.37 | ) | | | – | | | | – | | | | (7.71 | ) |
| Tax return of capital | | | – | | | | – | | | | (1.14 | ) | | | – | | | | – | | | | – | |
| Total Distributions | | | – | | | | – | | | | (5.61 | ) | | | – | | | | – | | | | (7.71 | ) |
| NET INCREASE/(DECREASE) IN NET ASSET VALUE | | | (0.12 | ) | | | (12.44 | ) | | | (18.73 | ) | | | 27.10 | | | | (9.30 | ) | | | (13.09 | ) |
| NET ASSET VALUE, END OF PERIOD | | $ | 17.47 | | | $ | 17.59 | | | $ | 30.03 | | | $ | 48.76 | | | $ | 21.66 | | | $ | 30.96 | |
| | | | | | | | | | | | | | | | | | | | | | | | | |
| TOTAL RETURN | | | (0.68 | )%(b) | | | (41.43 | )% | | | (30.60 | )% | | | 125.07 | % | | | (30.04 | )% | | | (10.64 | )% |
| RATIOS/SUPPLEMENTAL DATA: | | | | | | | | | | | | | | | | | | | | | | | | |
| Net Assets, End of Period (000s) | | $ | 6,614 | | | $ | 8,129 | | | $ | 18,881 | | | $ | 31,147 | | | $ | 15,472 | | | $ | 41,410 | |
| RATIOS TO AVERAGE NET ASSETS: | | | | | | | | | | | | | | | | | | | | | | | | |
| Net Investment income/(loss) | | | 2.60 | %(c) | | | 0.46 | % | | | 1.53 | % | | | 0.11 | % | | | (0.12 | )% | | | (0.60 | )% |
| Operating expenses excluding reimbursement/waiver | | | 1.92 | %(c) | | | 1.86 | % | | | 1.81 | % | | | 1.56 | % | | | 1.51 | % | | | 1.43 | % |
| Operating expenses including reimbursement/waiver | | | 1.86 | %(c) | | | 1.86 | % | | | 1.51 | % | | | 1.56 | % | | | 1.51 | % | | | 1.43 | % |
| PORTFOLIO TURNOVER RATE | | | 46 | %(b) | | | 88 | % | | | 94 | % | | | 171 | % | | | 46 | % | | | 55 | % |
| (a) | Per share amounts are based upon average shares outstanding. |
See Notes to Financial Statements.
| Semi-Annual Report | October 31, 2023 | 45 |
| Emerald Funds | Notes to Financial Statements |
| | October 31, 2023 (Unaudited) |
1. ORGANIZATION
Financial Investors Trust (the “Trust”), a Delaware statutory trust, is an open-end management investment company registered under the Investment Company Act of 1940, as amended (the “1940 Act”). The Trust consists of multiple separate portfolios or series. This semi-annual report describes the Emerald Growth Fund, Emerald Insights Fund, and Emerald Finance & Banking Innovation Fund (formerly known as "Emerald Banking and Finance Fund") (each a “Fund” and collectively, the “Funds”).
The Emerald Growth Fund and Emerald Insights Fund seek to achieve long-term growth through capital appreciation. The Emerald Finance & Banking Innovation Fund seeks to achieve long-term growth through capital appreciation with income as a secondary objective.
2. SIGNIFICANT ACCOUNTING POLICIES
The accompanying financial statements were prepared in accordance with accounting principles generally accepted in the United States of America (“U.S. GAAP”). The preparation of financial statements in conformity with U.S. GAAP requires management to make certain estimates and assumptions that affect the reported amounts of assets and liabilities and disclosures of contingent assets and liabilities at the date of the financial statements and the reported amounts of revenue and expenses during the period. Actual results could differ from those estimates. The Funds are considered an investment company for financial reporting purposes under U.S. GAAP and follows the accounting and reporting guidance applicable to investment companies in the Financial Accounting Standards Board Accounting Standards Codification Topic 946. The following is a summary of significant accounting policies consistently followed by the Funds in preparation of their financial statements.
Investment Valuation: The Funds generally value their securities based on market prices determined at the close of regular trading on the New York Stock Exchange (“NYSE”), normally, 4:00 p.m. Eastern Time, on each business day the NYSE is open for trading.
For equity securities and mutual funds that are traded on an exchange, the market price is usually the closing sale or official closing price on that exchange. In the case of equity securities not traded on an exchange, or if such closing prices are not otherwise available, the securities are valued at the mean of the most recent bid and ask prices on such day. Redeemable securities issued by open-end registered investment companies are valued at the investment company’s applicable net asset value, with the exception of exchange-traded open-end investment companies, which are priced as equity securities.
The market price for debt obligations is generally the price supplied by an independent third-party pricing service, which may use a matrix, formula or other objective method that takes into consideration quotations from dealers, market transactions in comparable investments, market indices and yield curves. If vendors are unable to supply a price, or if the price supplied is deemed to be unreliable, the market price may be determined using quotations received from one or more brokers–dealers that make a market in the security.
Equity securities that are primarily traded on foreign securities exchanges are valued at the preceding closing values of such securities on their respective exchanges, except when an occurrence subsequent to the time a value was so established is likely to have changed such value. In such an event, the fair values of those securities are determined in good faith through consideration of other factors in accordance with procedures established by the valuation designee under the general supervision of the Board of Trustees of the Trust (the “Board”or the “Trustees”).
When such prices or quotations are not available, or when Emerald Mutual Fund Advisers Trust (the “Adviser”) believes that they are unreliable, securities may be priced using fair value procedures established by the Adviser pursuant to Rule 2a-5 under the 1940 Act and approved by and subject to the oversight of the Board.
Fair Value Measurements: Pursuant to Rule 2a-5 under the Investment Company Act of 1940, the Board has appointed the Adviser to serve as the Valuation Designee to perform fair value determinations for investments in the Funds. When such prices or quotations are not available, or when the Valuation Designee believes that they are unreliable, securities may be priced using fair value procedures approved by the Board. The fair valuation policies and procedures (“FV Procedures”) have been adopted by the Board for the fair valuation of portfolio assets held by the Fund(s) in the event that (1) market quotations for the current price of a portfolio security or asset are not readily available, or (2) available market quotations that would otherwise be used to value a portfolio security or asset in accordance with the Fund’ Pricing Procedures appear to be unreliable or not indicative of fair value. The Pricing Procedures reflect certain pricing methodologies (or “logics”) that are not “readily available market quotations” and thus are viewed and treated as fair valuations. The Valuation Designee routinely meets to discuss fair valuations of portfolio securities and other instruments held by the Fund(s).
Each Fund discloses the classification of its fair value measurements following a three-tier hierarchy based on the inputs used to measure fair value. Inputs may be observable or unobservable. Observable inputs are inputs that reflect the assumptions market participants would use in pricing the asset or liability that are developed based on market data obtained from sources independent of the reporting entity. Unobservable inputs are inputs that reflect the reporting entity’s own assumptions about the assumptions market participants would use in pricing the asset or liability that are
| 46 | www.emeraldmutualfunds.com |
| Emerald Funds | Notes to Financial Statements |
| | October 31, 2023 (Unaudited) |
developed based on the best information available. Various inputs are used in determining the value of each Fund’s investments as of the reporting period end. The designated input levels are not necessarily an indication of the risk or liquidity associated with these investments.
These inputs are categorized in the following hierarchy under applicable financial accounting standards:
| | Level 1 – | Unadjusted quoted prices in active markets for identical investments, unrestricted assets or liabilities that the Funds have the ability to access at the measurement date; |
| | | |
| | Level 2 – | Quoted prices which are not active, quoted prices for similar assets or liabilities in active markets or inputs other than quoted prices that are observable (either directly or indirectly) for substantially the full term of the asset or liability; and |
| | | |
| | Level 3 – | Significant unobservable prices or inputs (including the Funds’ own assumptions in determining the fair value of investments) where there is little or no market activity for the asset or liability at the measurement date. |
The following is a summary of each input used to value the Funds as of October 31, 2023:
| Investments in Securities at Value(a) | | Level 1 - Quoted Prices | | | Level 2 - Other Significant Observable Inputs | | | Level 3 - Significant Unobservable Inputs | | | Total | |
| Emerald Growth Fund | | | | | | | | | | | | | | | | |
| Common Stocks | | $ | 768,489,454 | | | $ | – | | | $ | – | | | $ | 768,489,454 | |
| Short-Term Investment | | | 31,254,552 | | | | – | | | | – | | | | 31,254,552 | |
| TOTAL | | $ | 799,744,006 | | | $ | – | | | $ | – | | | $ | 799,744,006 | |
| Investments in Securities at Value(a) | | Level 1 - Quoted Prices | | | Level 2 - Other Significant Observable Inputs | | | Level 3 - Significant Unobservable Inputs | | | Total | |
| Emerald Insights Fund | | | | | | | | | | | | | | | | |
| Common Stocks | | $ | 14,131,157 | | | $ | – | | | $ | – | | | $ | 14,131,157 | |
| Short-Term Investment | | | 393,345 | | | | – | | | | – | | | | 393,345 | |
| TOTAL | | $ | 14,524,502 | | | $ | – | | | $ | – | | | $ | 14,524,502 | |
| Investments in Securities at Value(a) | | Level 1 - Quoted Prices | | | Level 2 - Other Significant Observable Inputs | | | Level 3 - Significant Unobservable Inputs | | | Total | |
| Emerald Finance & Banking Innovation Fund | | | | | | | | | | | | | | | | |
| Common Stocks | | $ | – | | | $ | – | | | $ | – | | | $ | – | |
| Banks | | $ | 34,054,300 | | | $ | 1,229,600 | | | $ | – | | | $ | 35,283,900 | |
| Other | | | 20,432,342 | | | | – | | | | – | | | | 20,432,342 | |
| Short-Term Investment | | | 565,136 | | | | – | | | | – | | | | 565,136 | |
| Warrants | | | 1,500 | | | | – | | | | – | | | | 1,500 | |
| TOTAL | | $ | 55,053,278 | | | $ | 1,229,600 | | | $ | – | | | $ | 56,282,878 | |
| (a) | For detailed descriptions of sector and industry, see the accompanying Schedule of Investments. |
For the six months ended October 31, 2023, the Funds did not have any securities that used significant unobservable inputs (Level 3) in determining fair value. There were no transfers in/out of Level 3 securities during the period ended October 31, 2023.
Investment Transactions and Investment Income: Investment transactions are accounted for on the date the investments are purchased or sold (trade date). Realized gains and losses from investment transactions are reported on an identified cost basis, which is the same basis the Funds use for federal income tax purposes. Interest income, which includes accretion of discounts, is accrued and recorded as earned. Dividend income is recognized on the ex-dividend date or for certain foreign securities, as soon as information is available to the Funds. All of the realized and unrealized gains and losses and net investment income, are allocated daily to each class in proportion to its average daily net assets.
| Semi-Annual Report | October 31, 2023 | 47 |
| Emerald Funds | Notes to Financial Statements |
| | October 31, 2023 (Unaudited) |
Real Estate Investment Trusts (“REITs”): The Funds may invest a portion of their assets in REITs and are subject to certain risks associated with direct investment in REITs. REITs may be affected by changes in the value of their underlying properties and by defaults by borrowers or tenants. REITs depend generally on their ability to generate cash flow to make distributions to shareowners, and certain REITs have self-liquidation provisions by which mortgages held may be paid in full and distributions of capital returns may be made at any time. In addition, the performance of a REIT may be affected by its failure to qualify for tax-free pass-through of income under the Internal Revenue Code of 1986, as amended (the “Code”), or its failure to maintain exemption from registration under the 1940 Act. A Fund’s investments in REITs may result in such Fund’s receipt of cash in excess of the REITs’ earnings. If the Fund receives such distributions all or a portion of these distributions will constitute a return of capital to such Fund. Receiving a return of capital distribution from REITs will reduce the amount of income available to be distributed to Fund shareholders. Income from REITs generally will not be eligible for treatment as qualified dividend income. As the final character of the distributions is not known until reported by the REITs on their 1099s, the Funds utilize an average of the prior year’s reallocation information as an estimate for the current year character of distributions.
Trust Expenses: Some expenses of the Trust can be directly attributed to the Funds. Expenses which cannot be directly attributed to the Funds are apportioned among all funds in the Trust based on average net assets of each fund.
Fund and Class Expenses: Expenses that are specific to a Fund or class of shares of a Fund, including distribution fees (Rule 12b-1 fees) and shareholder servicing fees, are charged directly to that Fund or share class. All expenses of a Fund, other than class specific expenses, are allocated daily to each class in proportion to its average daily net assets. Expenses that are common to the Funds generally are allocated among the Funds in proportion to their average daily net assets.
Federal Income Taxes: Each Fund complies with the requirements under Subchapter M of the Code, applicable to regulated investment companies and intends to distribute substantially all of its net taxable income and net capital gains, if any, each year so that the Funds will not be subject to excise tax on undistributed income and gains. The Funds are not subject to income taxes to the extent such distributions are made.
As of and during the six month period ended October 31, 2023, the Funds did not have a liability for any unrecognized tax benefits. The Funds file U.S. federal, state, and local tax returns as required. The Funds’ tax returns are subject to examination by the relevant tax authorities until expiration of the applicable statute of limitations, which is generally three years after the filing of the tax return for federal purposes and four years for most state returns. Tax returns for open years have incorporated no uncertain tax positions that require a provision for income taxes.
Distributions to Shareholders: Each Fund normally pays dividends and distributes capital gains, if any, on an annual basis. Income dividend distributions are derived from dividends and other income each Fund receives from its investments, including short-term capital gains. Long term capital gain distributions are derived from gains realized when each Fund sells a security it has owned for more than a year. Each Fund may make additional distributions and dividends at other times if the portfolio manager believes doing so may be necessary for each Fund to avoid or reduce taxes.
3. TAX BASIS INFORMATION
Tax Basis of Investments: As of October 31, 2023, the aggregate cost of investments, gross unrealized appreciation/(depreciation) and net unrealized appreciation/(depreciation) for Federal tax purposes was as follows:
| | | Gross Appreciation (excess of value over tax cost) | | | Gross Depreciation (excess of tax cost over value) | | | Net Appreciation/
(Depreciation) of Foreign Currency and Derivatives | | | Net Unrealized Appreciation/
(Depreciation) | | | Cost of Investments for Income Tax Purposes | |
| Emerald Growth Fund | | $ | 170,522,198 | | | $ | (72,261,096 | ) | | $ | – | | | $ | 98,261,102 | | | $ | 701,482,904 | |
| Emerald Insights Fund | | | 4,746,509 | | | | (973,378 | ) | | | – | | | | 3,773,131 | | | | 10,751,371 | |
| Emerald Finance & Banking Innovation Fund | | | 5,779,780 | | | | (10,635,813 | ) | | | – | | | | (4,856,033 | ) | | | 61,138,911 | |
| 48 | www.emeraldmutualfunds.com |
| Emerald Funds | Notes to Financial Statements |
| | October 31, 2023 (Unaudited) |
Tax Basis of Distributions to Shareholders: The character of distributions made during the year from net investment income or net realized gains may differ from its ultimate characterization for federal income tax purposes. Also, due to the timing of dividend distributions, the fiscal year in which amounts are distributed may differ from the fiscal year in which the income or realized gain were recorded by each Fund.
The tax character of distributions paid for the year ending April 30, 2023 were as follows:
| | | Ordinary Income | | | Long-Term Capital | | | Gain Return of Capital | |
| Emerald Growth Fund | | $ | – | | | $ | 66,342,430 | | | $ | – | |
| Emerald Insights Fund | | | – | | | | 910,570 | | | | – | |
| Emerald Finance & Banking Innovation Fund | | | – | | | | – | | | | – | |
The amounts and characteristics of tax basis distributions and composition of distributable earnings/(accumulated losses) are finalized at fiscal year end. Accordingly, tax basis balances have not been determined as of October 31, 2023.
4. SECURITIES TRANSACTIONS
The cost of purchases and proceeds from sales of securities (excluding short-term securities) during the six month period ended October 31, 2023 was as follows:
| Funds | | Cost of Investments Purchased | | | Proceeds from Investments Sold | |
| Emerald Growth Fund | | $ | 244,399,254 | | | $ | 294,395,610 | |
| Emerald Insights Fund | | | 3,837,841 | | | | 4,587,317 | |
| Emerald Finance & Banking Innovation Fund | | | 28,163,843 | | | | 32,975,635 | |
5. SHARES OF BENEFICIAL INTEREST
The capitalization of the Trust consists of an unlimited number of shares of beneficial interest with no par value per share. Holders of the shares of the Funds of the Trust have one vote for each share held and a proportionate fraction of a vote for each fractional share. All shares issued and outstanding are fully paid and are transferable and redeemable at the option of the shareholder. Purchasers of the shares do not have any obligation to make payments to the Trust or its creditors (other than the purchase price for the shares) or make contributions to the Trust or its creditors solely by reason of the purchaser’s ownership of the shares. Shares have no pre-emptive rights.
6. MANAGEMENT AND RELATED-PARTY TRANSACTIONS
The Adviser, subject to the authority of the Board, is responsible for the overall management and administration of the Funds’ business affairs. The Adviser manages the investments of the Funds in accordance with the Funds’ investment objective, policies and limitations and investment guidelines established jointly by the Adviser and the Trustees. Pursuant to the Advisory Agreement, the Funds pay the Adviser fees for the services and facilities it provides payable on a monthly basis at the annual rate set forth below of the Funds’ average daily net assets. The management fee is paid on a monthly basis.
Emerald Growth Fund
| Average Total Net Assets | Contractual Fee |
| Up to and including $250M | 0.75% |
| Over $250M and including $500M | 0.65% |
| Over $500M and including $750M | 0.55% |
| Over $750M | 0.45% |
Emerald Insights Fund
| Average Total Net Assets | Contractual Fee |
| Up to and including $250M | 0.75% |
| Over $250M and including $500M | 0.65% |
| Over $500M and including $750M | 0.55% |
| Over $750M | 0.45% |
| Semi-Annual Report | October 31, 2023 | 49 |
| Emerald Funds | Notes to Financial Statements |
| | October 31, 2023 (Unaudited) |
Emerald Finance & Banking Innovation Fund
| Average Total Net Assets | Contractual Fee |
| Up to and including $100M | 1.00% |
| Over $100M | 0.90% |
The Adviser has contractually agreed to limit each Fund’s total annual operating expenses (exclusive of acquired fund fees and expenses, brokerage expenses, interest expenses, taxes and extraordinary expense) set forth to the annual shares (as percentages of a Funds average daily net assets) in the following table for Class A, Class C, Institutional Class, and Investor Class shares. This agreement (the “Expense Agreement”) is in effect from September 1, 2023 through August 31, 2024, for all Funds. The prior Expense Agreement was in effect from September 1, 2022 through August 31, 2023 for all Funds. The Adviser will be permitted to recapture, on a class-by-class basis, expenses it has borne through the Expense Agreement to the extent that the Fund's expenses in later periods fall below the annual rates set forth in the Expense Agreement; provided, however, that such recapture payments do not cause the Fund's expense ratio (after recapture) to exceed the lesser of (i) the expense cap in effect at the time of the waiver and (ii) the expense cap in effect at the time of the recapture. Notwithstanding the foregoing, the Fund will not be obligated to pay any such deferred fees and expenses more than three years after the date on which the fee and expenses were deferred. The Adviser may not discontinue this waiver, prior to August 31, 2024, without the approval by the Funds Board, for all Funds. Fees waived/reimbursed by the Adviser for the six month period ended October 31, 2023 are disclosed in the Statements of Operations.
Emerald Growth Fund
| Class A | Class C | Institutional Class | Investor Class |
| 1.13% | 1.78% | 0.82% | 1.17% |
Emerald Insights Fund
| Class A | Class C | Institutional Class | Investor Class |
| 1.35% | 2.00% | 1.05% | 1.40% |
Emerald Finance & Banking Innovation Fund
| Class A | Class C | Institutional Class | Investor Class |
| 1.82% | 2.46% | 1.48% | 1.86% |
For the six month period ended October 31, 2023, the fee waivers/reimbursements and recoupments of past waived fees were as follows:
| Fund | | Fees Waived/ Reimbursed By Adviser | | | Recoupment of Past Waived Fees By Adviser | |
| Emerald Insights Fund | | | | | | | | |
| Class A | | $ | 38,271 | | | $ | – | |
| Class C | | | 116 | | | | – | |
| Institutional Class | | | 14,492 | | | | – | |
| Investor Class | | | 3,576 | | | | – | |
| Emerald Finance & Banking Innovation Fund | | | | | | | | |
| Class A | | $ | – | | | $ | – | |
| Class C | | | – | | | | – | |
| Institutional Class | | | – | | | | – | |
| Investor Class | | | 1,425 | | | | – | |
As of October 31, 2023, the balances of recoupable expenses for each Fund were as follows:
| Fund | | Expires 2024 | | | Expires 2025 | | | Expires 2026 | | | Expires 2027 | | | Total | |
| Emerald Insights Fund | | | | | | | | | | | | | | | | | | | | |
| Class A | | $ | 41,306 | | | $ | 61,650 | | | $ | 76,343 | | | $ | 38,271 | | | $ | 217,570 | |
| Class C | | | 573 | | | | 872 | | | | 394 | | | | 116 | | | | 1,955 | |
| Institutional Class | | | 7,598 | | | | 14,261 | | | | 23,577 | | | | 14,492 | | | | 59,928 | |
| Investor Class | | | 1,020 | | | | 2,587 | | | | 4,394 | | | | 3,576 | | | | 11,577 | |
Fund Administrator Fees and Expenses: ALPS Fund Services, Inc. (“ALPS”) serves as administrator to the Funds and the Funds have agreed to pay expenses incurred in connection with their administrative activities. Pursuant to an Administration Agreement, ALPS provides operational services to the Funds including, but not limited to, fund accounting and fund administration and generally assist in the Funds’ operations. Officers of the Trust
| 50 | www.emeraldmutualfunds.com |
| Emerald Funds | Notes to Financial Statements |
| | October 31, 2023 (Unaudited) |
are employees of ALPS. The Funds’ administration fee is accrued on a daily basis and paid monthly. Administration fees paid by the Funds for the six month period ended October 31, 2023 are disclosed in the Statements of Operations.
The Administrator is also reimbursed by the Funds for certain out-of-pocket expenses.
Transfer Agent: ALPS serves as transfer, dividend paying and shareholder servicing agent for the Funds. ALPS receives an annual minimum fee, a fee based upon the number of shareholder accounts, and is also reimbursed by the Funds for certain out-of-pocket expenses. Transfer agent fees paid by the Funds for the six month period ended October 31, 2023 are disclosed in the Statements of Operations.
Compliance Services: ALPS provides services that assist the Trust’s chief compliance officer in monitoring and testing the policies and procedures of the Trust in conjunction with requirements under Rule 38a-1 under the 1940 Act and receives an annual base fee. ALPS is reimbursed for certain out-of-pocket expenses by the Funds. Compliance service fees paid by the Funds for the six month period ended October 31, 2023 are disclosed in the Statements of Operations.
Principal Financial Officer: ALPS receives an annual fee for providing principal financial officer services to the Funds. Principal financial officer fees paid by the Funds for the six month period ended October 31, 2023 are disclosed in the Statements of Operations.
Distributor: ALPS Distributors, Inc. (“ADI” or the “Distributor”) (an affiliate of ALPS) acts as the distributor of the Funds’ shares pursuant to a Distribution Agreement with the Trust. Shares are sold on a continuous basis by ADI as agent for the Funds, and ADI has agreed to use its best efforts to solicit orders for the sale of Funds’ shares, although it is not obliged to sell any particular amount of shares. ADI is not entitled to any compensation for its services as Distributor. ADI is registered as a broker-dealer with the U.S. Securities and Exchange Commission.
Each Fund has adopted a separate Distribution and Services Plan (each a “Plan” and collectively, the “Plans”) pursuant to Rule 12b-1 of the 1940 Act. The Plans allow each Fund, as applicable, to use each Fund’s assets to pay fees in connection with the distribution and marketing of the Funds’ shares and/or the provision of shareholder services to the Funds’ shareholders. The Plan permits payment for services in connection with the administration of plans or programs that use shares of each Fund as their funding medium and for related expenses. The recipients of such payments may include other affiliates of the Adviser, broker-dealers, financial institutions, plan sponsors and administrators and other financial intermediaries through which investors may purchase shares of the Fund. The Plans permit each Fund to make total payments at an annual rate of up to 0.35%, 0.75% and 0.25% of the average daily net asset value of Class A, Class C and Investor Class, respectively. Because these fees are paid out of the Funds’ assets on an ongoing basis, over time they will increase the cost of an investment in the Funds, and Plan fees may cost an investor more than other types of sales charges.
Each Fund, has adopted a Shareholder Services Plan (a “Shareholder Services Plan”) with respect to its Class C, Institutional Class and Investor Class shares. Under the Shareholder Services Plan, a Fund is authorized to compensate certain financial intermediaries, including broker-dealers and Fund affiliates which may include the Distributor, Adviser and/or the transfer agent (the “Participating Organizations”), an aggregate fee in an amount not to exceed on an annual basis 0.25%, 0.05% and 0.15% of the average daily net asset value of Class C, Institutional Class and Investor Class, respectively, of the Funds attributable to or held in the name of the Participating Organizations pursuant to an agreement with such Participating Organizations (the “Agreement”). Each Agreement will set forth the non-distribution related shareholder services to be performed by the Participating Organizations for the benefit of a Fund’s shareholders who have elected to have such Participating Organizations service their accounts. Any amount of such payment not paid to Participating Organizations during a Fund’s fiscal year for such service activities shall be reimbursed to the Fund as soon as practicable. Shareholder Services Plan fees are included with distribution and service fees in the Statements of Operations. Fees recaptured pursuant to the Shareholder Services Plan for the six month period ended October 31, 2023, are included as an offset to distribution and service fees as disclosed in the Statements of Operations.
Trustees
The fees and expenses of the Trustees of the Board are presented in the Statements of Operations for the six month period ended October 31, 2023.
7. INDEMNIFICATIONS
Under the Trust’s organizational documents, its officers and Trustees are indemnified against certain liability arising out of the performance of their duties to the Trust. Additionally, in the normal course of business, the Trust enters into contracts with service providers that may contain general indemnification clauses, which may permit indemnification to the extent permissible under applicable law. The Trust’s maximum exposure under these arrangements is unknown, as this would involve future claims that may be made against the Trust that have not yet occurred.
8. SUBSEQUENT EVENTS
Subsequent events after the date of the Statements of Assets and Liabilities have been evaluated through the date the financial statements were issued.
| Semi-Annual Report | October 31, 2023 | 51 |
Emerald Funds | Additional Information |
| | October 31, 2023 (Unaudited) |
1. FUND HOLDINGS
The Funds file their complete schedule of portfolio holdings with the Securities and Exchange Commission (SEC) for the first and third quarters of each fiscal year as an exhibit to its reports on Form N-PORT. The Funds’ Form N-PORT reports are available on the SEC's Web site at http://www.sec.gov. The Funds’ Form N-PORT reports are also available upon request by calling (toll-free) (855) 828-9909.
2. FUND PROXY VOTING POLICIES, PROCEDURES AND SUMMARIES
Each Fund’s policies and procedures used in determining how to vote proxies and information regarding how the Funds voted proxies relating to portfolio securities during the most recent prior 12-month period ending June 30 are available without charge, (1) upon request, by calling (toll-free) (855) 828-9909 and (2) on the SEC’s website at http://www.sec.gov.
| 52 | www.emeraldmutualfunds.com |
| Emerald Funds | Liquidity Risk Management Program Disclosure |
| | October 31, 2023 (Unaudited) |
The Financial Investors Trust (the “Trust”) has established a liquidity risk management program (the “Program”) to govern the Trust’s approach to managing liquidity risk for each fund in the Trust (each a “Fund”). The Program is overseen by the Liquidity Committee (the “Committee”), a committee comprised of representatives of the Trust’s investment advisers, sub-advisers, and Officers of the Trust. The Trust’s Board of Trustees (the “Board”) has approved the designation of the Committee to oversee the Program.
The Program’s principal objectives include supporting each Fund’s compliance with limits on investments in illiquid assets and mitigating the risk that a Fund will be unable to meet its redemption obligations in a timely manner. The Program also includes a number of elements that support the management and assessment of liquidity risk, including a periodic assessment of factors that influence a Fund’s liquidity and the periodic classification and re-classification of the Fund’s investments into groupings that reflect the Committee’s assessment of their relative liquidity under current market conditions.
At a meeting of the Board held on June 13, 2023, the Trustees received a report from the Committee regarding the design and operational effectiveness of the Program during the calendar year 2022. The Committee determined, and reported to the Board, that the Program is reasonably designed to assess and manage each Fund’s liquidity risk and has operated adequately and effectively to manage each Fund’s liquidity risk since implementation.
The Committee reported that during the period covered by the report, there were no liquidity events that impacted the Funds or their ability to timely meet redemptions without dilution to existing shareholders. Among other things, the Board noted that the Funds are not required to have a highly liquid investment minimum based on their liquidity classifications. The Board further noted that no material changes have been made to the Program since its implementation.
| Semi-Annual Report | October 31, 2023 | 53 |
| Emerald Funds | Privacy Policy |
| Who We Are | |
| Who is providing this notice? | Emerald Finance & Banking Innovation Fund, Emerald Growth Fund, Emerald Insights Fund |
| What We Do | |
| How do the Funds protect my personal information? | To protect your personal information from unauthorized access and use, we use security measures that comply with federal law. These measures include computer safeguards and secured files and buildings. |
| How do the Funds collect my personal information? | We collect your personal information, for example, when you ● open an account ● provide account information or give us your contact information ● make a wire transfer or deposit money |
| Why can’t I limit all sharing? | Federal law gives you the right to limit only ● sharing for affiliates’ everyday business purposes-information about your
creditworthiness ● affiliates from using your information to market to you ● sharing for non-affiliates to market to you State laws and individual companies may give you additional rights to limit sharing. |
| Definitions | |
| Affiliates | Companies related by common ownership or control. They can be financial and nonfinancial companies. |
| Non-affiliates | Companies not related by common ownership or control. They can be financial and nonfinancial companies. ● The Funds do not share with non-affiliates so they can market to you. |
| Joint marketing | A formal agreement between non-affiliated financial companies that together market financial products or services to you. ● The Funds do not jointly market. |
| Other Important Information | |
| California residents | If your account has a California home address, your personal information will not be disclosed to nonaffiliated third parties except as permitted by applicable California law, and we will limit sharing such personal information with our affiliates to comply with California privacy laws that apply to us. |
| Vermont residents | The State of Vermont requires financial institutions to obtain your consent prior to sharing personal information that they collect about you with affiliated companies and nonaffiliated third parties other than in certain limited circumstances. Except as permitted by law, we will not share personal information we collect about you with nonaffiliated third parties or other affiliated companies unless you provide us with your written consent to share such information. |
| 54 | www.emeraldmutualfunds.com |
| Emerald Funds | Privacy Policy |
| FACTS | WHAT DO THE FUNDS DO WITH YOUR PERSONAL INFORMATION? |
| WHY? | Financial companies choose how they share your personal information. Federal law gives consumers the right to limit some but not all sharing. Federal law also requires us to tell you how we collect, share, and protect your personal information. Please read this notice carefully to understand what we do. |
| WHAT? | The types of personal information we collect and share depend on the product or service you have with us. This information can include: ● Social Security number and account transactions ● Account balances and transaction history ● Wire transfer instructions |
| HOW? | All financial companies need to share customers’ personal information to run their everyday business. In the section below, we list the reasons financial companies can share their customers’ personal information; the reasons the Funds choose to share; and whether you can limit this sharing. |
| Reasons we can share your personal information | Do the funds share: | Can you limit this sharing? |
For our everyday business purposes –
such as to process your transactions, maintain your account(s), respond to court orders and legal investigations, or report to credit bureaus |
Yes |
No |
For our marketing purposes –
to offer our products and services to you | No | We do not share. |
| For joint marketing with other financial companies | No | We do not share. |
For our affiliates’ everyday business purposes –
information about your transactions and experiences | Yes | No |
For our affiliates’ everyday business purposes –
information about your creditworthiness | No | We do not share. |
| For non-affiliates to market to you | No | We do not share. |
| Semi-Annual Report | October 31, 2023 | 55 |

TABLE OF CONTENTS
| Performance Review | |
| Seafarer Overseas Growth and Income Fund | 1 |
| Seafarer Overseas Value Fund | 6 |
| Disclosure of Fund Expenses | 12 |
| Portfolio of Investments | 14 |
| Statements of Assets and Liabilities | 23 |
| Statements of Operations | 24 |
| Statements of Changes in Net Assets | 25 |
| Financial Highlights | 28 |
| Notes to Financial Statements | 36 |
| Additional Information | 46 |
| Liquidity Risk Management Program | 47 |
| Privacy Policy | 48 |
| Seafarer Overseas Growth and Income Fund | Performance Review |
| | October 31, 2023 |
SEAFARER OVERSEAS GROWTH AND INCOME FUND
PERFORMANCE REVIEW
This report addresses the first half of the 2023-2024 fiscal year (May 1, 2023 to October 31, 2023) for the Seafarer Overseas Growth and Income Fund (the “Growth and Income Fund” or the “Fund”).
During the semi-annual period, the Fund returned -3.43%, while the Fund’s benchmark indices, the Morningstar Emerging Markets Net Return USD Index and the Bloomberg Emerging Markets Large, Mid, and Small Cap Net Return USD Index, returned -3.52% and -4.27%, respectively.1 By way of broader comparison, the S&P 500 Index increased 1.39%.
The Fund began the fiscal year with a net asset value (NAV) of $11.77 per share. In June, the Fund paid a semi-annual distribution of $0.178 per share. That payment brought the cumulative distribution per share, as measured from the Fund’s inception, to $5.017.2 The Fund finished the semi-annual period with a value of $11.20 per share.3
* * *
During the semi-annual period, emerging market equities were weighed down by a number of factors: the prospect of further interest rate hikes in the U.S.; the reality of elevated energy prices; the corrosive effects of a correction in property markets, financial strain, and weak consumption in China; and the awful outbreak of war between Israel and Hamas. The cumulative uncertainty they beget makes it difficult to be enthusiastic about equities anywhere, let alone in the developing world.
However, what weighed most on stocks during the period was decidedly mixed reports of corporate performance. A subset of companies in the developing world continue to report strong profits; yet many more reported poor earnings. Varied factors weighed on earnings, but the most substantial seemed weak demand, especially within China.
Amid this broadly weak environment, the Growth and Income Fund’s returns paced those of the benchmark indices for the semi-annual period. Much like the market overall, the performance of the Fund’s holdings was mixed. Top detractors to Fund performance were a varied bunch: Venture, a firm that specializes in design and contract manufacturing services for clients that produce high-value machinery, equipment, and consumer devices; Samsung SDI, a South Korean battery manufacturer; UPL, an India-based agrichemical business that operates globally; Becle SAB, the maker of the eponymous tequila brand “Jose Cuervo;” and Rohm, a Japan-based semiconductor company, with sales predominantly directed to South Korea, China, and Taiwan.
Positive contributors to Fund performance during the period hail from disparate underlying sources: a Taiwan maker of network equipment (Accton); a Brazilian investment management firm (XP, Inc.); a pan-African property, casualty, and life insurance conglomerate (Sanlam); a United Arab Emirates-based supplier of district water cooling services (Tabreed – National Central Cooling Co.); and one of the largest property developers in the UAE (Emaar).
We have been confounded by the recent disconnection between corporate performance and stock price movements for many Fund holdings. We’ve seen a subset of companies produce, in our view, impressive results against the weak and uncertain economic backdrop, yet watched their share prices slip nonetheless. Still, even as market conditions are murky at period end, we remain confident in the sustained growth of your Fund’s holdings over time. Over the past year we have introduced new holdings to the Fund – holdings that we believe have strong brands, pricing power and superior distribution. These attributes should help the Fund independently derive growth rather than be dependent on broad-based macroeconomic conditions – especially vital when demand remains weak and the general outlook uncertain.
Thank you for entrusting us with your capital despite trying market conditions. We are honored to serve as your investment adviser in the emerging markets.
Andrew Foster
Portfolio Manager, Seafarer Overseas Growth and Income Fund
Seafarer Capital Partners, LLC
| Semi-annual Report – October 31, 2023 | 1 |
| Seafarer Overseas Growth and Income Fund | Performance Review |
| | October 31, 2023 |
The Morningstar Emerging Markets Net Return USD Index measures the performance of emerging markets targeting the top 97% of stocks by market capitalization. The index does not incorporate Morningstar’s environmental, social, or governance (ESG) criteria. Index code: MEMMN. The Bloomberg Emerging Markets Large, Mid, and Small Cap Net Return USD Index is a float market-cap-weighted equity index that covers 99% of the market capitalization of the emerging markets. Index code: EMLSN. The S&P 500 Total Return Index is a stock market index based on the market capitalizations of 500 large companies with common stock listed on the NYSE or NASDAQ. It is not possible to invest directly in an index.
The Fund is subject to investment risks, including possible loss of the principal amount invested and therefore is not suitable for all investors. The Fund may not achieve its objectives. Diversification does not ensure a profit or guarantee against loss.
The views and information discussed in this commentary are as of the date of publication, are subject to change, and may not reflect Seafarer’s current views. The views expressed represent an assessment of market conditions at a specific point in time, are opinions only and should not be relied upon as investment advice regarding a particular investment or markets in general. Such information does not constitute a recommendation to buy or sell specific securities or investment vehicles. It should not be assumed that any investment will be profitable or will equal the performance of the portfolios or any securities or any sectors mentioned herein. The subject matter contained herein has been derived from several sources believed to be reliable and accurate at the time of compilation. Seafarer does not accept any liability for losses either direct or consequential caused by the use of this information.
| 1. | References to the “Fund” pertain to the Fund’s Institutional share class (ticker: SIGIX). The Investor share class (ticker: SFGIX) returned -3.55% during the semi-annual period. |
| 2. | The Fund’s inception date is February 15, 2012. |
| 3 | The Fund’s Investor share class began the fiscal year with a net asset value of $11.70 per share; it paid a semi-annual distribution of $0.176 per share in June; and it finished the semi-annual period with a value of $11.12 per share. |
| 2 | (855) 732-9220 seafarerfunds.com |
| Seafarer Overseas Growth and Income Fund | Performance Review |
| | October 31, 2023 |
Total Returns
| As of October 31, 2023 | 6 Month | 1 Year | 3 Year | 5 Year | 7 Year | 10 Year | Since Inception Annualized1 | Gross Expense Ratio2 |
| Investor Class (SFGIX) | -3.55% | 6.98% | 1.42% | 5.31% | 3.32% | 3.23% | 4.47% | 0.99% |
| Institutional Class (SIGIX) | -3.43% | 7.23% | 1.52% | 5.42% | 3.44% | 3.35% | 4.59% | 0.89% |
| Morningstar Emerging Markets Net Return USD Index3 | -3.52% | 11.11% | -1.57% | 2.96% | 3.47% | 2.04% | 2.06% | |
| Bloomberg Emerging Markets Large, Mid, and Small Cap Net Return USD Index4 | -4.27% | 9.28% | -2.12% | 3.18% | 3.76% | 2.47% | 2.51% | |
Fund performance is presented in U.S. dollar terms, with U.S. jurisdiction distributions reinvested on a gross (pre-tax) basis. For the Morningstar and Bloomberg indices, performance is calculated to reflect the reinvestment of dividends, capital gains, and other corporate actions net of foreign jurisdiction withholding taxes. The performance data quoted represents past performance and does not guarantee future results. Future returns may be lower or higher. The investment return and principal value will fluctuate so that an investor's shares, when redeemed, may be worth more or less than the original cost. Prior to August 31, 2016, shares of the Fund redeemed or exchanged within 90 days of purchase were subject to a 2% redemption fee. Performance does not reflect this fee, which if deducted would reduce an individual's return. To obtain the Fund’s most recent month-end performance, visit seafarerfunds.com or call (855) 732-9220.
| 1 | Inception Date: February 15, 2012. |
| 2 | Ratios as of Prospectus dated August 31, 2023. Seafarer Capital Partners, LLC has agreed contractually to waive and/or reimburse fees or expenses in order to limit Total Annual Fund Operating Expenses After Fee Waiver/Expense Reimbursements (inclusive of acquired fund fees and expenses, and exclusive of brokerage expenses, interest expenses, taxes and extraordinary expenses) to 1.15% and 1.05% of the Fund’s average daily net assets for the Investor and Institutional share classes, respectively. This agreement shall continue at least through August 31, 2024. |
| 3 | The Morningstar Emerging Markets Net Return USD Index measures the performance of emerging markets targeting the top 97% of stocks by market capitalization. The index does not incorporate Morningstar’s environmental, social, or governance (ESG) criteria. Index code: MEMMN. The index is not actively managed and does not reflect any deductions for fees, expense or taxes. An investor may not invest directly in an index. |
| 4 | The Bloomberg Emerging Markets Large, Mid, and Small Cap Net Return USD Index is a float market-cap-weighted equity index that covers 99% of the market capitalization of the emerging markets. Index code: EMLSN. The index is not actively managed and does not reflect any deductions for fees, expense or taxes. An investor may not invest directly in an index. |
| Semi-annual Report – October 31, 2023 | 3 |
| Seafarer Overseas Growth and Income Fund | Performance Review |
| | October 31, 2023 |
Performance of a $10,000 Investment Since Inception
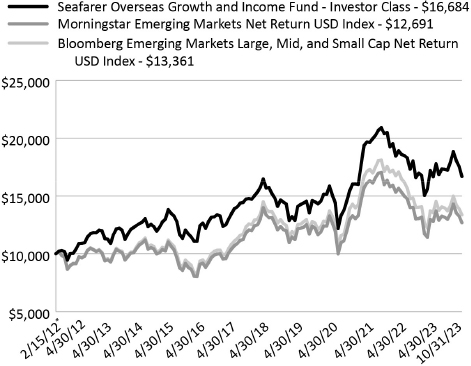
| * | Inception Date: February 15, 2012. |
The chart shown above represents historical performance of a hypothetical investment of $10,000 in the Fund’s Investor Class shares for the period from inception to October 31, 2023. All returns reflect reinvested dividends and/or distributions, but do not reflect the deduction of taxes that an investor would pay on distributions
or redemptions.
The Fund also offers Institutional Class shares, performance of which is not reflected in the chart above. The performance of Institutional Class shares may be higher or lower than the performance of the Investor Class shares shown above based upon differences in fees paid by shareholders investing in the Investor Class shares and Institutional Class shares.
Investment Objective
The Seafarer Overseas Growth and Income Fund seeks to provide long-term capital appreciation along with some current income. The Fund seeks to mitigate adverse volatility in returns as a secondary objective.
Strategy
The Fund invests primarily in the securities of companies located in developing countries. The Fund invests in several asset classes including dividend-paying common stocks, preferred stocks, and fixed-income securities.
The Fund seeks to offer investors a relatively stable means of participating in developing countries’ growth prospects, while attempting to mitigate adverse volatility in returns.
| 4 | (855) 732-9220 seafarerfunds.com |
| Seafarer Overseas Growth and Income Fund | Performance Review |
| | October 31, 2023 |
| Portfolio Composition by Region | % Net Assets |
| East & South Asia | 60.1% |
| Emerging Europe | 5.9% |
| Latin America | 15.3% |
| Middle East & Africa | 10.2% |
| Other | 5.1% |
| Cash & Other Assets, Less Liabilities | 3.4% |
| Total | 100.0% |
| Portfolio Composition by Sector | % Net Assets |
| Communications | 4.4% |
| Consumer Discretionary | 13.1% |
| Consumer Staples | 15.0% |
| Energy | 2.8% |
| Financials | 17.7% |
| Health Care | 8.9% |
| Industrials | 7.8% |
| Materials | 4.9% |
| Real Estate | 2.0% |
| Technology | 18.2% |
| Utilities | 1.8% |
| Cash & Other Assets, Less Liabilities | 3.4% |
| Total | 100.0% |
| Top 10 Holdings | % Net Assets |
| Hyundai Mobis Co., Ltd. | 4.7% |
| Sanlam, Ltd. | 3.6% |
| Samsung Electronics Co., Ltd. | 3.4% |
| Accton Technology Corp. | 3.3% |
| Richter Gedeon Nyrt | 3.2% |
| Samsung Biologics Co., Ltd. | 3.2% |
| Rohm Co., Ltd. | 3.1% |
| Wal-Mart de Mexico SAB de CV | 2.6% |
| Alibaba Group Holding, Ltd. | 2.6% |
| Novatek Microelectronics Corp. | 2.6% |
| Total | 32.3% |
| | |
| Total Number of Holdings | 50 |
Holdings are subject to change, and may not reflect the current or future position of the portfolio.
Source: ALPS Fund Services, Inc.
| Semi-annual Report – October 31, 2023 | 5 |
| Seafarer Overseas Value Fund | Performance Review |
| | October 31, 2023 |
SEAFARER OVERSEAS VALUE FUND
PERFORMANCE REVIEW
This report addresses the first half of the 2023-2024 fiscal year (May 1, 2023 to October 31, 2023) for the Seafarer Overseas Value Fund (the “Value Fund” or the “Fund”).
During the semi-annual period, the Fund returned -4.32% while the Fund’s benchmark indices, the Morningstar Emerging Markets Net Return USD Index and the Bloomberg Emerging Markets Large, Mid, and Small Cap Net Return USD Index, returned -3.52% and -4.27%, respectively.1 By way of broader comparison, the S&P 500 Index increased 1.39%.
The Fund began the fiscal year with a net asset value (NAV) of $13.43 per share. The Fund paid no distributions during the first half of the fiscal year, and it finished the period with a value of $12.85 per share.2
* * *
For the semi-annual period, the Value Fund’s performance, not unlike the benchmark indices, resulted in a low single-digit negative return.
Two of the top detractors to the Fund’s performance during the period were stocks pressured by negative sentiment related to Chinese consumption and a poor economic growth outlook: Melco International, a casino owner and operator in Macau (Asset Productivity and Breakup Value sources of value; Seafarer’s seven sources of value,3 hereafter referenced using parenthesized italics, are defined in Figure 1); and Shangri-La (Asset Productivity and Breakup Value), a hotel owner and operator in Asia. For the time being, this stock price action ignores the recent positive earnings momentum reported by these companies compared to losses in the same period last year, when China’s pandemic restrictions were still in place. As of period end, the Fund holds both positions due to their underlying balance sheet value: assets whose liquidation value and long-term cash flow generation appear to be overlooked by the market.
Figure 1. Sources of Value
Seafarer has identified seven distinct sources of value in emerging markets that may give rise to viable opportunities for long-term, value-oriented investments.
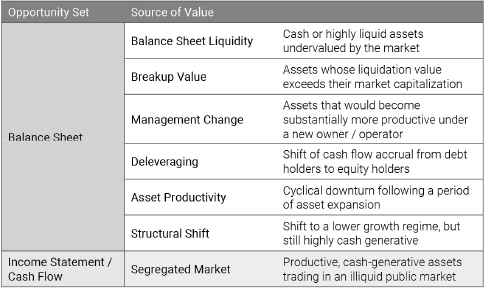
Source: Seafarer
| 6 | (855) 732-9220 seafarerfunds.com |
| Seafarer Overseas Value Fund | Performance Review |
| | October 31, 2023 |
Other top detractors to Fund performance include Samsung SDI (Structural Shift and Breakup Value), a South Korean battery manufacturer, and DFI Retail (Management Change and Asset Productivity), a multi-format retailer operating in Asia.
Standing out as the top contributor to the Fund’s performance in the period was XP, Inc. (Structural Shift), a Brazilian investment management platform. In 2022 and early 2023, the Fund took advantage of XP’s lower price and added to its position; market sentiment toward the stock then shifted rapidly (in a positive way); while much can still change, thus far it appears to have been the right call. XP’s share price volatility appears far more erratic than the changes to its long-term fundamental prospects. However, I would hazard to guess that some combination of the following factors was behind the positive shift in sentiment toward XP’s shares: a valuation that was just too cheap; resilient fundamentals that beat expectations; and possible forthcoming cuts by the Brazilian central bank to its benchmark SELIC interest rate (lower rates may divert savings from fixed income products towards XP’s more profitable equities segment).4
Additional contributors to the Fund’s return coalesced around the smaller countries in the emerging market investment universe: the United Arab Emirates (UAE), Georgia, and Vietnam. In the UAE, Emaar Properties (Breakup Value and Segregated Market), a property developer and investment company, continued to report strong financial results during the period and is studying the potential for further regional expansion. In the case of Tabreed (National Central Cooling Co.) (Deleveraging and Segregated Market), a supplier of district water cooling services, the market seemingly recognized the company’s low valuation relative to a newly listed peer, thus leading to a strong share price performance.
Contributors from Georgia and Vietnam reported strong earnings momentum. These names include: Bank of Georgia (Asset Productivity and Segregated Market), one of the largest banks in the country; Georgia Capital (Breakup Value and Segregated Market), a conglomerate; and PetroVietnam Technical Services (Management Change and Asset Productivity), a Vietnamese oil services company.
In the concluding month of this semi-annual period, war erupted in the Middle East, which together with the Ukraine-Russia war, compounds uncertainty in global geopolitics and energy markets. To me, this is another reminder that military conflict and geopolitical relationships do not conform to the forecasts of macro prognosticators. Furthermore, few could have predicted that the strength in the U.S. dollar, as tracked by the U.S. Dollar Index, would be compatible with an exponentially rising cost (approaching $1 trillion for 2023) of servicing U.S. federal government debt. The takeaway from these observations is that historical economic and financial relationships are in flux. In my opinion, the pursuit of future investment returns is better served by pursuing stock-specific insight over (not always relevant) macro views. The Outlook sections of the Value Fund’s first quarter 20235 and second quarter 20236 portfolio reviews explained how the Fund navigates macro volatility by focusing on stock fundamentals.
Thank you for entrusting us with your capital. We are honored to serve as your investment adviser in the emerging markets.
Paul Espinosa
Portfolio Manager, Seafarer Overseas Value Fund
Seafarer Capital Partners, LLC
The Morningstar Emerging Markets Net Return USD Index measures the performance of emerging markets targeting the top 97% of stocks by market capitalization. The index does not incorporate Morningstar’s environmental, social, or governance (ESG) criteria. Index code: MEMMN. The Bloomberg Emerging Markets Large, Mid, and Small Cap Net Return USD Index is a float market-cap-weighted equity index that covers 99% of the market capitalization of the emerging markets. Index code: EMLSN. The S&P 500 Total Return Index is a stock market index based on the market capitalizations of 500 large companies with common stock listed on the NYSE or NASDAQ. The U.S. Dollar Index tracks the performance of developed market currencies relative to the U.S. dollar. Index code: DXY. It is not possible to invest directly in an index.
The Fund is subject to investment risks, including possible loss of the principal amount invested and therefore is not suitable for all investors. The Fund may not achieve its objectives. Diversification does not ensure a profit or guarantee against loss.
Information on the Seafarer website and references to Seafarer publications are provided for textual reference only, and are not incorporated by reference into this report.
| Semi-annual Report – October 31, 2023 | 7 |
| Seafarer Overseas Value Fund | Performance Review |
| | October 31, 2023 |
The views and information discussed in this commentary are as of the date of publication, are subject to change, and may not reflect Seafarer’s current views. The views expressed represent an assessment of market conditions at a specific point in time, are opinions only and should not be relied upon as investment advice regarding a particular investment or markets in general. Such information does not constitute a recommendation to buy or sell specific securities or investment vehicles. It should not be assumed that any investment will be profitable or will equal the performance of the portfolios or any securities or any sectors mentioned herein. The subject matter contained herein has been derived from several sources believed to be reliable and accurate at the time of compilation. Seafarer does not accept any liability for losses either direct or consequential caused by the use of this information.
| 1 | References to the “Fund” pertain to the Fund’s Institutional share class (ticker: SIVLX). The Investor share class (ticker: SFVLX) returned -4.41% during the semi-annual period. Adjustments in accordance with accounting principles generally accepted in the U.S. (U.S. GAAP) were applied during the financial statement preparation as of April 30, 2023. As a result of the adjustments, the total return for shareholder transactions reported to the market may differ from the total return for financial reporting purposes. For the semi-annual period ended October 31, 2023, the total return for the Institutional share class decreased from -4.25% to -4.32%, and the total return for the Investor share class decreased from -4.33% to -4.41%. |
| 2 | The Fund’s Investor share class began the fiscal year with a net asset value of $13.39 per share. As of April 30, 2023, adjustments in accordance with U.S. GAAP were applied during the financial statement preparation and increased the Institutional share class net asset value from $13.42 to $13.43 and increased the Investor share class net asset value from $13.38 to $13.39. The Fund’s Investor class finished the period with a value of $12.80 per share. |
| 3 | Additional information on Seafarer’s seven sources of value is available in the white paper On Value in the Emerging Markets (www.seafarerfunds.com/value-in-em). |
| 4 | The SELIC Overnight Rate is the Brazilian Central Bank’s overnight rate; the interest rate at which a depository institution lends or borrows funds in the overnight market. |
| 5 | www.seafarerfunds.com/funds/ovl/portfolio-review/2023/03/Q1/#outlook |
| 6 | www.seafarerfunds.com/funds/ovl/portfolio-review/2023/06/Q2/#outlook |
| 8 | (855) 732-9220 seafarerfunds.com |
| Seafarer Overseas Value Fund | Performance Review |
| | October 31, 2023 |
Total Returns
| As of October 31, 2023 | 6 Month | 1 Year | 3 Year | 5 Year | 7 Year | Since Inception Annualized1 | Net Expense Ratio2 |
| Investor Class (SFVLX)3 | -4.41% | 12.19% | 9.57% | 6.33% | 5.77% | 5.80% | 1.15% |
| Institutional Class (SIVLX) 3 | -4.32% | 12.38% | 9.70% | 6.46% | 5.87% | 5.91% | 1.05% |
| Morningstar Emerging Markets Net Return USD Index4 | -3.52% | 11.11% | -1.57% | 2.96% | 3.47% | 5.01% | |
| Bloomberg Emerging Markets Large, Mid, and Small Cap Net Return USD Index5 | -4.27% | 9.28% | -2.12% | 3.18% | 3.76% | 5.20% | |
Gross expense ratio: 1.28% for Investor Class; 1.18% for Institutional Class.2
Fund performance is presented in U.S. dollar terms, with U.S. jurisdiction distributions reinvested on a gross (pre-tax) basis. For the Morningstar and Bloomberg indices, performance is calculated to reflect the reinvestment of dividends, capital gains, and other corporate actions net of foreign jurisdiction withholding taxes. The performance data quoted represents past performance and does not guarantee future results. Future returns may be lower or higher. The investment return and principal value will fluctuate so that an investor's shares, when redeemed, may be worth more or less than the original cost. Prior to August 31, 2016, shares of the Fund redeemed or exchanged within 90 days of purchase were subject to a 2% redemption fee. Performance does not reflect this fee, which if deducted would reduce an individual's return. To obtain the Fund’s most recent month-end performance, visit seafarerfunds.com or call (855) 732-9220.
| 1 | Inception Date: May 31, 2016. |
| 2 | Ratios as of Prospectus dated August 31, 2023. Seafarer Capital Partners, LLC has agreed contractually to waive and/or reimburse fees or expenses in order to limit Total Annual Fund Operating Expenses After Fee Waiver/Expense Reimbursements (inclusive of acquired fund fees and expenses, and exclusive of brokerage expenses, interest expenses, taxes and extraordinary expenses) to 1.15% and 1.05% of the Fund’s average daily net assets for the Investor and Institutional share classes, respectively. This agreement shall continue at least through August 31, 2024. |
| 3 | Adjustments in accordance with U.S. GAAP were applied during the financial statement preparation. As a result of the adjustments, the total return for shareholder transactions reported to the market may differ from the total return for financial reporting purposes. |
| 4 | The Morningstar Emerging Markets Net Return USD Index measures the performance of emerging markets targeting the top 97% of stocks by market capitalization. The index does not incorporate Morningstar’s environmental, social, or governance (ESG) criteria. Index code: MEMMN. The index is not actively managed and does not reflect any deductions for fees, expense or taxes. An investor may not invest directly in an index. |
| 5 | The Bloomberg Emerging Markets Large, Mid, and Small Cap Net Return USD Index is a float market-cap-weighted equity index that covers 99% of the market capitalization of the emerging markets. Index code: EMLSN. The index is not actively managed and does not reflect any deductions for fees, expense or taxes. An investor may not invest directly in an index. |
| Semi-annual Report – October 31, 2023 | 9 |
| Seafarer Overseas Value Fund | Performance Review |
| | October 31, 2023 |
Performance of a $10,000 Investment Since Inception

| * | Inception Date: May 31, 2016. |
The chart shown above represents historical performance of a hypothetical investment of $10,000 in the Fund’s Investor Class shares for the period from inception to October 31, 2023. All returns reflect reinvested dividends and/or distributions, but do not reflect the deduction of taxes that an investor would pay on distributions or redemptions.
The Fund also offers Institutional Class shares, performance of which is not reflected in the chart above. The performance of Institutional Class shares may be higher or lower than the performance of the Investor Class shares shown above based upon differences in fees paid by shareholders investing in the Investor Class shares and Institutional Class shares.
Investment Objective
The Seafarer Overseas Value Fund seeks to provide long-term capital appreciation.
Strategy
The Fund invests primarily in the securities of companies located in developing countries. The Fund invests in several asset classes including common stocks, preferred stocks, and fixed-income securities.
The Fund’s portfolio is comprised of securities identified through a bottom-up security selection process based on fundamental research. The Fund seeks to produce a minimum long-term rate of return by investing in securities priced at a discount to their intrinsic value.
| 10 | (855) 732-9220 seafarerfunds.com |
| Seafarer Overseas Value Fund | Performance Review |
| | October 31, 2023 |
| Portfolio Composition by Region | % Net Assets |
| East & South Asia | 54.6% |
| Emerging Europe | 7.8% |
| Latin America | 16.3% |
| Middle East & Africa | 14.1% |
| Other | 5.4% |
| Cash & Other Assets, Less Liabilities | 1.8% |
| Total | 100.0% |
| Portfolio Composition by Sector | % Net Assets |
| Communications | 3.0% |
| Consumer Discretionary | 11.2% |
| Consumer Staples | 21.7% |
| Energy | 5.6% |
| Financials | 17.5% |
| Health Care | 2.5% |
| Industrials | 14.6% |
| Materials | 11.7% |
| Real Estate | 2.8% |
| Technology | 2.4% |
| Utilities | 5.2% |
| Cash & Other Assets, Less Liabilities | 1.8% |
| Total | 100.0% |
| Top 10 Holdings | % Net Assets |
| XP, Inc. | 4.4% |
| WH Group, Ltd. | 3.5% |
| Mondi PLC | 3.3% |
| Pacific Basin Shipping, Ltd. | 3.1% |
| Salik Co. PJSC | 3.1% |
| Innocean Worldwide, Inc. | 3.1% |
| Qatar Gas Transport Co., Ltd. | 3.0% |
| PetroVietnam Technical Services Corp. | 3.0% |
| Moneta Money Bank AS | 2.9% |
| Emaar Properties PJSC | 2.8% |
| Total | 32.2% |
| | |
| Total Number of Holdings | 40 |
Holdings are subject to change, and may not reflect the current or future position of the portfolio.
Source: ALPS Fund Services, Inc.
| Semi-annual Report – October 31, 2023 | 11 |
| Seafarer Funds | Disclosure of Fund Expenses |
| | October 31, 2023 (Unaudited) |
DISCLOSURE OF FUND EXPENSES
As a shareholder of a Fund you will incur two types of costs: (1) transaction costs; and (2) ongoing costs, including management fees and other Fund expenses. The following examples are intended to help you understand your ongoing costs (in dollars) of investing in a Fund and to compare these costs with the ongoing costs of investing in other mutual funds. The examples are based on an investment of $1,000 invested on May 1, 2023 and held until October 31, 2023.
Actual Expenses. For each Fund and share class, the first line of the following table provides information about actual account values and actual expenses. You may use the information in this line, together with the amount you invested, to estimate the expenses that you paid over the period. Simply divide your account value by $1,000 (for example, an $8,600 account value divided by $1,000 = 8.6), then multiply the result by the number in the first line under the heading “Expenses Paid During Period” to estimate the expenses you paid on your account during this period.
Hypothetical Example for Comparison Purposes. For each Fund and share class, the second line of the following table provides information about hypothetical account values and hypothetical expenses based on the Fund’s actual expense ratio and an assumed rate of return of 5% per year before expenses, which is not the Fund’s actual return. The hypothetical account values and expenses may not be used to estimate the actual ending account balance or expenses you paid for the period. You may use this information to compare the ongoing costs of investing in the Fund and other mutual funds. To do so, compare this 5% hypothetical example with the 5% hypothetical examples that appear in the shareholder reports of the other mutual funds.
Please note the expenses shown in the following table are meant to highlight your ongoing costs only and do not reflect transaction costs. Therefore, for each Fund and share class, the second line of the following table is useful in comparing ongoing costs only, and will not help you determine the relative total costs of owning different funds. In addition, if these transactional costs were included, your costs would have been higher.
| 12 | (855) 732-9220 seafarerfunds.com |
| Seafarer Funds | Disclosure of Fund Expenses |
| | October 31, 2023 (Unaudited) |
| | Beginning
Account
Value 05/01/23 | Ending
Account
Value 10/31/23 | Expense Ratio(a) | Expenses Paid During Period
05/01/23 - 10/31/23(b) |
| SEAFARER OVERSEAS GROWTH AND INCOME FUND | | | | |
| Investor Class | | | | |
| Actual | $ 1,000.00 | $ 964.50 | 0.96% | $ 4.75 |
| Hypothetical (5% return before expenses) | $ 1,000.00 | $ 1,020.37 | 0.96% | $ 4.89 |
| Institutional Class | | | | |
| Actual | $ 1,000.00 | $ 965.70 | 0.86% | $ 4.26 |
| Hypothetical (5% return before expenses) | $ 1,000.00 | $ 1,020.87 | 0.86% | $ 4.38 |
| SEAFARER OVERSEAS VALUE FUND | | | | |
| Investor Class | | | | |
| Actual | $ 1,000.00 | $ 955.90 | 1.15% | $ 5.67 |
| Hypothetical (5% return before expenses) | $ 1,000.00 | $ 1,019.41 | 1.15% | $ 5.85 |
| Institutional Class | | | | |
| Actual | $ 1,000.00 | $ 956.80 | 1.05% | $ 5.18 |
| Hypothetical (5% return before expenses) | $ 1,000.00 | $ 1,019.91 | 1.05% | $ 5.35 |
| (a) | Annualized, based on the Fund's most recent fiscal half year expenses. |
| (b) | Expenses are equal to the Fund's annualized expense ratio multiplied by the average account value over the period, multiplied by the number of days in the most recent fiscal half-year (184)/365 (to reflect the half-year period). |
| Semi-annual Report – October 31, 2023 | 13 |
| Seafarer Overseas Growth and Income Fund | Portfolio of Investments |
| | October 31, 2023 (Unaudited) |
| | | Currency | | Shares | | | Value | |
| COMMON STOCKS (93.3%) | | | | | | | | | | |
| Belgium (1.5%) | | | | | | | | | | |
| Anheuser-Busch InBev SA, ADR | | USD | | | 700,000 | | | $ | 39,809,000 | |
| | | | | | | | | | | |
| Total Belgium | | | | | | | | | 39,809,000 | |
| | | | | | | | | | | |
| Brazil (7.1%) | | | | | | | | | | |
| Ambev SA, ADR | | USD | | | 17,700,000 | | | | 44,781,000 | |
| Itau Unibanco Holding SA, ADR | | USD | | | 9,450,000 | | | | 50,179,500 | |
| Odontoprev SA | | BRL | | | 10,800,000 | | | | 22,470,769 | |
| XP, Inc., Class A | | USD | | | 3,219,000 | | | | 64,380,000 | |
| | | | | | | | | | | |
| Total Brazil | | | | | | | | | 181,811,269 | |
| | | | | | | | | | | |
| China / Hong Kong (12.8%) | | | | | | | | | | |
| Alibaba Group Holding, Ltd.(a) | | HKD | | | 6,500,000 | | | | 66,918,014 | |
| China Foods, Ltd. | | HKD | | | 98,314,000 | | | | 34,045,660 | |
| DFI Retail Group Holdings, Ltd. | | USD | | | 13,000,000 | | | | 27,729,312 | |
| Jardine Matheson Holdings, Ltd. | | USD | | | 1,206,579 | | | | 48,891,955 | |
| Pacific Basin Shipping, Ltd. | | HKD | | | 153,000,000 | | | | 44,274,166 | |
| Want Want China Holdings, Ltd. | | HKD | | | 65,000,000 | | | | 40,388,397 | |
| WH Group, Ltd. | | HKD | | | 73,065,000 | | | | 43,636,843 | |
| Xinhua Winshare Publishing and Media Co., Ltd., Class H | | HKD | | | 30,002,000 | | | | 25,220,777 | |
| | | | | | | | | | | |
| Total China / Hong Kong | | | | | | | | | 331,105,124 | |
| | | | | | | | | | | |
| Czech Republic (1.5%) | | | | | | | | | | |
| Moneta Money Bank AS | | CZK | | | 10,113,000 | | | | 39,098,623 | |
| | | | | | | | | | | |
| Total Czech Republic | | | | | | | | | 39,098,623 | |
| | | | | | | | | | | |
| France (1.6%) | | | | | | | | | | |
| Hermes International SCA | | EUR | | | 22,300 | | | | 41,607,927 | |
| | | | | | | | | | | |
| Total France | | | | | | | | | 41,607,927 | |
| | | | | | | | | | | |
| Hungary (3.2%) | | | | | | | | | | |
| Richter Gedeon Nyrt | | HUF | | | 3,500,000 | | | | 82,065,338 | |
| | | | | | | | | | | |
| Total Hungary | | | | | | | | | 82,065,338 | |
| | | | | | | | | | | |
| India (6.8%) | | | | | | | | | | |
| Computer Age Management Services, Ltd. | | INR | | | 1,586,397 | | | | 42,821,667 | |
| L&T Technology Services, Ltd. | | INR | | | 1,009,500 | | | | 50,821,515 | |
| Petronet LNG, Ltd. | | INR | | | 17,000,000 | | | | 40,748,343 | |
| 14 | (855) 732-9220 seafarerfunds.com |
| Seafarer Overseas Growth and Income Fund | Portfolio of Investments |
| | October 31, 2023 (Unaudited) |
| | | Currency | | Shares | | | Value | |
| India (continued) | | | | | | | | | | |
| UPL, Ltd. | | INR | | | 6,100,000 | | | $ | 39,607,047 | |
| | | | | | | | | | | |
| Total India | | | | | | | | | 173,998,572 | |
| | | | | | | | | | | |
| Indonesia (2.1%) | | | | | | | | | | |
| Bank Central Asia Tbk PT | | IDR | | | 97,500,000 | | | | 53,714,764 | |
| | | | | | | | | | | |
| Total Indonesia | | | | | | | | | 53,714,764 | |
| | | | | | | | | | | |
| Japan (3.1%) | | | | | | | | | | |
| Rohm Co., Ltd. | | JPY | | | 4,975,000 | | | | 79,709,304 | |
| | | | | | | | | | | |
| Total Japan | | | | | | | | | 79,709,304 | |
| | | | | | | | | | | |
| Mexico (6.7%) | | | | | | | | | | |
| Becle SAB de CV | | MXN | | | 23,800,000 | | | | 42,111,043 | |
| Bolsa Mexicana de Valores SAB de CV | | MXN | | | 10,500,000 | | | | 16,347,829 | |
| Coca-Cola Femsa SAB de CV, ADR | | USD | | | 600,000 | | | | 45,612,000 | |
| Wal-Mart de Mexico SAB de CV | | MXN | | | 18,842,000 | | | | 67,513,073 | |
| | | | | | | | | | | |
| Total Mexico | | | | | | | | | 171,583,945 | |
| | | | | | | | | | | |
| Peru (1.5%) | | | | | | | | | | |
| Credicorp, Ltd. | | USD | | | 318,000 | | | | 39,737,280 | |
| | | | | | | | | | | |
| Total Peru | | | | | | | | | 39,737,280 | |
| | | | | | | | | | | |
| Poland (1.3%) | | | | | | | | | | |
| CD Projekt SA | | PLN | | | 1,300,000 | | | | 32,456,729 | |
| | | | | | | | | | | |
| Total Poland | | | | | | | | | 32,456,729 | |
| | | | | | | | | | | |
| Qatar (1.6%) | | | | | | | | | | |
| Qatar Gas Transport Co., Ltd. | | QAR | | | 42,613,950 | | | | 41,197,776 | |
| | | | | | | | | | | |
| Total Qatar | | | | | | | | | 41,197,776 | |
| | | | | | | | | | | |
| Singapore (4.8%) | | | | | | | | | | |
| Singapore Exchange, Ltd. | | SGD | | | 8,385,000 | | | | 58,054,913 | |
| Venture Corp., Ltd. | | SGD | | | 7,625,000 | | | | 65,104,752 | |
| | | | | | | | | | | |
| Total Singapore | | | | | | | | | 123,159,665 | |
| Semi-annual Report – October 31, 2023 | 15 |
| Seafarer Overseas Growth and Income Fund | Portfolio of Investments |
| | October 31, 2023 (Unaudited) |
| | | Currency | | Shares | | | Value | |
| South Africa (3.6%) | | | | | | | | | | |
| Sanlam, Ltd. | | ZAR | | | 26,501,488 | | | $ | 92,952,503 | |
| | | | | | | | | | | |
| Total South Africa | | | | | | | | | 92,952,503 | |
| | | | | | | | | | | |
| South Korea (17.0%) | | | | | | | | | | |
| Coway Co., Ltd. | | KRW | | | 1,130,000 | | | | 36,160,896 | |
| Hyundai Mobis Co., Ltd. | | KRW | | | 775,000 | | | | 120,020,191 | |
| Innocean Worldwide, Inc. | | KRW | | | 810,000 | | | | 26,215,206 | |
| NAVER Corp. | | KRW | | | 383,750 | | | | 53,649,469 | |
| Samsung Biologics Co., Ltd.(a) | | KRW | | | 155,000 | | | | 81,484,561 | |
| Samsung C&T Corp. | | KRW | | | 440,000 | | | | 34,788,922 | |
| Samsung Electronics Co., Ltd. | | KRW | | | 800,000 | | | | 39,819,902 | |
| Samsung SDI Co., Ltd. | | KRW | | | 148,000 | | | | 46,861,958 | |
| | | | | | | | | | | |
| Total South Korea | | | | | | | | | 439,001,105 | |
| | | | | | | | | | | |
| Taiwan (5.9%) | | | | | | | | | | |
| Accton Technology Corp. | | TWD | | | 5,560,000 | | | | 86,148,157 | |
| Novatek Microelectronics Corp. | | TWD | | | 4,725,000 | | | | 66,542,524 | |
| | | | | | | | | | | |
| Total Taiwan | | | | | | | | | 152,690,681 | |
| | | | | | | | | | | |
| Thailand (3.0%) | | | | | | | | | | |
| Bangkok Dusit Medical Services PCL, Class F | | THB | | | 57,000,000 | | | | 42,018,372 | |
| Siam Cement PCL | | THB | | | 4,490,000 | | | | 35,977,464 | |
| | | | | | | | | | | |
| Total Thailand | | | | | | | | | 77,995,836 | |
| | | | | | | | | | | |
| United Arab Emirates (5.0%) | | | | | | | | | | |
| Emaar Properties PJSC | | AED | | | 28,276,000 | | | | 51,512,760 | |
| National Central Cooling Co. PJSC | | AED | | | 48,197,777 | | | | 45,927,639 | |
| Salik Co. PJSC | | AED | | | 35,000,000 | | | | 30,397,495 | |
| | | | | | | | | | | |
| Total United Arab Emirates | | | | | | | | | 127,837,894 | |
| | | | | | | | | | | |
| United Kingdom (2.0%) | | | | | | | | | | |
| Mondi PLC | | GBP | | | 3,141,306 | | | | 50,812,284 | |
| | | | | | | | | | | |
| Total United Kingdom | | | | | | | | | 50,812,284 | |
| 16 | (855) 732-9220 seafarerfunds.com |
| Seafarer Overseas Growth and Income Fund | Portfolio of Investments |
| | October 31, 2023 (Unaudited) |
| | | Currency | | Shares | | | Value | |
| Vietnam (1.2%) | | | | | | | | | | |
| PetroVietnam Gas JSC | | VND | | | 9,900,000 | | | $ | 30,919,872 | |
| | | | | | | | | | | |
| Total Vietnam | | | | | | | | | 30,919,872 | |
| | | | | | | | | | | |
| TOTAL COMMON STOCKS | | | | | | | | | | |
| (Cost $2,570,782,216) | | | | | | | | | 2,403,265,491 | |
| | | | | | | | | | | |
| PREFERRED STOCKS (3.3%) | | | | | | | | | | |
| South Korea (3.3%) | | | | | | | | | | |
| Samsung Electronics Co., Ltd. | | KRW | | | 2,160,000 | | | | 86,237,411 | |
| | | | | | | | | | | |
| Total South Korea | | | | | | | | | 86,237,411 | |
| | | | | | | | | | | |
| TOTAL PREFERRED STOCKS | | | | | | | | | | |
| (Cost $82,125,308) | | | | | | | | | 86,237,411 | |
| | | | | | | | | | | |
| TOTAL INVESTMENTS | | | | | | | | | | |
| (Cost $2,652,907,524) (96.6%) | | | | | | | | $ | 2,489,502,902 | |
| | | | | | | | | | | |
| Cash and Other Assets, Less Liabilities (3.4%) | | | | | | | | | 86,783,278 | |
| NET ASSETS (100.0%) | | | | | | | | $ | 2,576,286,180 | |
Value is stated in local currency unless otherwise noted.
| (a) | Non-income producing security. |
ADR American Depositary Receipt
Currency Abbreviations
| AED | - | United Arab Emirates Dirham |
| BRL | - | Brazil Real |
| CZK | - | Czech Republic Koruna |
| EUR | - | European Union Euro |
| HKD | - | Hong Kong Dollar |
| HUF | - | Hungary Forint |
| GBP | - | United Kingdom Pound |
| IDR | - | Indonesia Rupiah |
| INR | - | India Rupee |
| JPY | - | Japan Yen |
| KRW | - | South Korea Won |
| MXN | - | Mexico Peso |
| QAR | - | Qatar Riyal |
| PLN | - | Poland Zloty |
| Semi-annual Report – October 31, 2023 | 17 |
| Seafarer Overseas Growth and Income Fund | Portfolio of Investments |
| | October 31, 2023 (Unaudited) |
| SGD | - | Singapore Dollar |
| THB | - | Thailand Baht |
| TWD | - | Taiwan New Dollar |
| USD | - | United States Dollar |
| VND | - | Vietnam Dong |
| ZAR | - | South Africa Rand |
For Fund compliance purposes, the Fund's geographical classifications refer to any one or more of the sub-classifications used by one or more widely recognized market indexes or ratings group indexes, and/or as defined by Fund management. This definition may not apply for purposes of this report, which may combine sub-classifications for reporting ease. Geographical regions are shown as a percentage of net assets.
| Industry Composition | |
| Advertising & Marketing | 1.0% |
| Asset Management | 6.1% |
| Auto Components | 6.3% |
| Banks | 7.1% |
| Beverages | 8.0% |
| Biotech & Pharma | 6.3% |
| Chemicals | 1.5% |
| Construction Materials | 1.4% |
| Containers & Packaging | 2.0% |
| E-Commerce Discretionary | 2.6% |
| Electric Utilities | 1.8% |
| Engineering & Construction | 3.2% |
| Entertainment | 1.3% |
| Food Products | 3.3% |
| Health Care Providers & Services | 2.5% |
| Home & Office Products | 1.4% |
| Institutional Financial Services | 2.9% |
| Interactive Media & Services | 2.1% |
| Oil & Gas Producers | 2.8% |
| Real Estate Management & Development | 2.0% |
| Retail - Consumer Staples | 3.7% |
| Retail - Discretionary | 1.9% |
| Semiconductors & Semiconductor Equipment | 5.7% |
| Specialty Finance | 1.7% |
| Technology Hardware, Storage & Peripherals | 12.6% |
| Transportation & Logistics | 4.5% |
| Wholesale - Discretionary | 0.9% |
| Cash and Other Assets, Less Liabilities | 3.4% |
| Total | 100.0% |
See accompanying Notes to Financial Statements.
| 18 | (855) 732-9220 seafarerfunds.com |
| Seafarer Overseas Value Fund | Portfolio of Investments |
| | October 31, 2023 (Unaudited) |
| | | Currency | | Shares | | | Value | |
| COMMON STOCKS (98.1%) | | | | | | | | | | |
| Belgium (2.1%) | | | | | | | | | | |
| Anheuser-Busch InBev SA, ADR | | USD | | | 32,000 | | | $ | 1,819,840 | |
| | | | | | | | | | | |
| Total Belgium | | | | | | | | | 1,819,840 | |
| | | | | | | | | | | |
| Brazil (11.6%) | | | | | | | | | | |
| Ambev SA, ADR | | USD | | | 699,000 | | | | 1,768,470 | |
| Itau Unibanco Holding SA, ADR | | USD | | | 424,000 | | | | 2,251,440 | |
| Odontoprev SA | | BRL | | | 1,000,000 | | | | 2,080,627 | |
| XP, Inc., Class A | | USD | | | 186,000 | | | | 3,720,000 | |
| | | | | | | | | | | |
| Total Brazil | | | | | | | | | 9,820,537 | |
| | | | | | | | | | | |
| China / Hong Kong (29.2%) | | | | | | | | | | |
| China Foods, Ltd. | | HKD | | | 6,603,000 | | | | 2,286,587 | |
| China Yangtze Power Co., Ltd., Class A | | CNY | | | 661,990 | | | | 2,042,176 | |
| DFI Retail Group Holdings, Ltd. | | USD | | | 1,019,000 | | | | 2,173,551 | |
| First Pacific Co., Ltd. | | HKD | | | 5,490,000 | | | | 2,078,323 | |
| Giordano International, Ltd. | | HKD | | | 5,200,000 | | | | 1,481,870 | |
| Jardine Matheson Holdings, Ltd. | | USD | | | 54,213 | | | | 2,196,772 | |
| Melco International Development, Ltd. | | HKD | | | 2,811,000 | | | | 1,964,870 | |
| Pacific Basin Shipping, Ltd. | | HKD | | | 9,211,000 | | | | 2,665,421 | |
| Pico Far East Holdings, Ltd. | | HKD | | | 5,538,000 | | | | 971,138 | |
| Shangri-La Asia, Ltd. | | HKD | | | 3,372,000 | | | | 2,151,260 | |
| Want Want China Holdings, Ltd. | | HKD | | | 2,767,000 | | | | 1,719,303 | |
| WH Group, Ltd. | | HKD | | | 4,945,000 | | | | 2,953,319 | |
| | | | | | | | | | | |
| Total China / Hong Kong | | | | | | | | | 24,684,590 | |
| | | | | | | | | | | |
| Czech Republic (2.9%) | | | | | | | | | | |
| Moneta Money Bank AS | | CZK | | | 634,000 | | | | 2,451,155 | |
| | | | | | | | | | | |
| Total Czech Republic | | | | | | | | | 2,451,155 | |
| | | | | | | | | | | |
| Georgia (4.9%) | | | | | | | | | | |
| Bank of Georgia Group PLC | | GBP | | | 46,000 | | | | 1,861,828 | |
| Georgia Capital PLC | | GBP | | | 203,174 | | | | 2,276,860 | |
| | | | | | | | | | | |
| Total Georgia | | | | | | | | | 4,138,688 | |
| | | | | | | | | | | |
| India (5.0%) | | | | | | | | | | |
| Petronet LNG, Ltd. | | INR | | | 920,000 | | | | 2,205,204 | |
| Semi-annual Report – October 31, 2023 | 19 |
| Seafarer Overseas Value Fund | Portfolio of Investments |
| | October 31, 2023 (Unaudited) |
| | | Currency | | Shares | | | Value | |
| India (continued) | | | | | | | | | | |
| UPL, Ltd. | | INR | | | 315,000 | | | $ | 2,045,282 | |
| | | | | | | | | | | |
| Total India | | | | | | | | | 4,250,486 | |
| | | | | | | | | | | |
| Mexico (2.0%) | | | | | | | | | | |
| Coca-Cola Femsa SAB de CV, ADR | | USD | | | 22,000 | | | | 1,672,440 | |
| | | | | | | | | | | |
| Total Mexico | | | | | | | | | 1,672,440 | |
| | | | | | | | | | | |
| Peru (2.7%) | | | | | | | | | | |
| Credicorp, Ltd. | | USD | | | 18,500 | | | | 2,311,760 | |
| | | | | | | | | | | |
| Total Peru | | | | | | | | | 2,311,760 | |
| | | | | | | | | | | |
| Qatar (3.0%) | | | | | | | | | | |
| Qatar Gas Transport Co., Ltd. | | QAR | | | 2,660,000 | | | | 2,571,601 | |
| | | | | | | | | | | |
| Total Qatar | | | | | | | | | 2,571,601 | |
| | | | | | | | | | | |
| Singapore (6.2%) | | | | | | | | | | |
| Genting Singapore, Ltd. | | SGD | | | 2,770,000 | | | | 1,740,268 | |
| HRnetgroup, Ltd. | | SGD | | | 3,023,000 | | | | 1,522,273 | |
| Wilmar International, Ltd. | | SGD | | | 759,000 | | | | 1,973,237 | |
| | | | | | | | | | | |
| Total Singapore | | | | | | | | | 5,235,778 | |
| | | | | | | | | | | |
| South Korea (7.6%) | | | | | | | | | | |
| Innocean Worldwide, Inc. | | KRW | | | 80,000 | | | | 2,589,155 | |
| Samsung C&T Corp. | | KRW | | | 24,000 | | | | 1,897,578 | |
| Samsung SDI Co., Ltd. | | KRW | | | 6,300 | | | | 1,994,800 | |
| | | | | | | | | | | |
| Total South Korea | | | | | | | | | 6,481,533 | |
| | | | | | | | | | | |
| Thailand (2.2%) | | | | | | | | | | |
| Siam Cement PCL | | THB | | | 234,000 | | | | 1,874,995 | |
| | | | | | | | | | | |
| Total Thailand | | | | | | | | | 1,874,995 | |
| | | | | | | | | | | |
| United Arab Emirates (11.2%) | | | | | | | | | | |
| Emaar Properties PJSC | | AED | | | 1,324,000 | | | | 2,412,042 | |
| Fertiglobe PLC | | AED | | | 2,400,000 | | | | 2,098,642 | |
| National Central Cooling Co. PJSC | | AED | | | 2,481,137 | | | | 2,364,274 | |
| 20 | (855) 732-9220 seafarerfunds.com |
| Seafarer Overseas Value Fund | Portfolio of Investments |
| | October 31, 2023 (Unaudited) |
| | | Currency | | Shares | | | Value | |
| United Arab Emirates (continued) | | | | | | | | | | |
| Salik Co. PJSC | | AED | | | 3,000,000 | | | $ | 2,605,499 | |
| | | | | | | | | | | |
| Total United Arab Emirates | | | | | | | | | 9,480,457 | |
| | | | | | | | | | | |
| United Kingdom (3.2%) | | | | | | | | | | |
| Mondi PLC | | GBP | | | 170,404 | | | | 2,756,375 | |
| | | | | | | | | | | |
| Total United Kingdom | | | | | | | | | 2,756,375 | |
| | | | | | | | | | | |
| Vietnam (4.3%) | | | | | | | | | | |
| Petrovietnam Fertilizer & Chemicals JSC | | VND | | | 1,010,000 | | | | 1,170,062 | |
| PetroVietnam Technical Services Corp. | | VND | | | 1,873,080 | | | | 2,515,992 | |
| | | | | | | | | | | |
| Total Vietnam | | | | | | | | | 3,686,054 | |
| | | | | | | | | | | |
| TOTAL COMMON STOCKS | | | | | | | | | | |
| (Cost $83,459,934) | | | | | | | | | 83,236,289 | |
| | | | | | | | | | | |
| PREFERRED STOCKS (0.1%) | | | | | | | | | | |
| South Korea (0.1%) | | | | | | | | | | |
| Samsung C&T Corp. | | KRW | | | 1,800 | | | | 108,849 | |
| | | | | | | | | | | |
| Total South Korea | | | | | | | | | 108,849 | |
| | | | | | | | | | | |
| TOTAL PREFERRED STOCKS | | | | | | | | | | |
| (Cost $184,192) | | | | | | | | | 108,849 | |
| | | | | | | | | | | |
| TOTAL INVESTMENTS | | | | | | | | | | |
| (Cost $83,644,126) (98.2%) | | | | | | | | $ | 83,345,138 | |
| | | | | | | | | | | |
| Cash and Other Assets, Less Liabilities (1.8%) | | | | | | | | | 1,488,163 | |
| NET ASSETS (100.0%) | | | | | | | | $ | 84,833,301 | |
Value is stated in local currency unless otherwise noted.
ADR American Depositary Receipt
Currency Abbreviations
| AED | - | United Arab Emirates Dirham |
| BRL | - | Brazil Real |
| CNY | - | China Yuan |
| CZK | - | Czech Republic Koruna |
| GBP | - | United Kingdom Pound |
| Semi-annual Report – October 31, 2023 | 21 |
| Seafarer Overseas Value Fund | Portfolio of Investments |
| | October 31, 2023 (Unaudited) |
| HKD | - | Hong Kong Dollar |
| INR | - | India Rupee |
| KRW | - | South Korea Won |
| QAR | - | Qatar Riyal |
| SGD | - | Singapore Dollar |
| THB | - | Thailand Baht |
| USD | - | United States Dollar |
| VND | - | Vietnam Dong |
For Fund compliance purposes, the Fund's geographical classifications refer to any one or more of the sub-classifications used by one or more widely recognized market indexes or ratings group indexes, and/or as defined by Fund management. This definition may not apply for purposes of this report, which may combine sub-classifications for reporting ease. Geographical regions are shown as a percentage of net assets.
| Industry Composition | |
| Advertising & Marketing | 3.1% |
| Asset Management | 7.1% |
| Banks | 10.5% |
| Beverages | 8.9% |
| Chemicals | 6.3% |
| Commercial Support Services | 2.9% |
| Construction Materials | 2.2% |
| Containers & Packaging | 3.2% |
| Electric Utilities | 5.2% |
| Engineering & Construction | 2.4% |
| Food & Staples Retailing | 10.5% |
| Health Care Facilities & Services | 2.5% |
| Hotels, Restaurants & Leisure | 6.9% |
| Oil, Gas & Consumable Fuels | 2.6% |
| Oil & Gas Services & Equipment | 3.0% |
| Real Estate Management & Development | 2.8% |
| Retail - Consumer Staples | 2.6% |
| Retail - Discretionary | 4.3% |
| Technology Hardware | 2.4% |
| Transportation & Logistics | 8.8% |
| Cash and Other Assets, Less Liabilities | 1.8% |
| Total | 100.0% |
See accompanying Notes to Financial Statements.
| 22 | (855) 732-9220 seafarerfunds.com |
| Seafarer Funds | Statements of Assets and Liabilities |
| | October 31, 2023 (Unaudited) |
| | | Seafarer Overseas Growth and Income Fund | | | Seafarer Overseas Value Fund | |
| ASSETS: | | | | | | |
| Investments, at value | | $ | 2,489,502,902 | | | $ | 83,345,138 | |
| Cash | | | 91,105,909 | | | | 1,211,144 | |
| Foreign currency, at value (Cost $5,002 and $65,240) | | | 4,864 | | | | 64,949 | |
| Receivable for investments sold | | | 440,355 | | | | 4,208 | |
| Receivable for shares sold | | | 2,504,264 | | | | 221,219 | |
| Interest and dividends receivable | | | 3,628,147 | | | | 126,985 | |
| Prepaid expenses and other assets | | | 36,261 | | | | 26,865 | |
| Total Assets | | | 2,587,222,702 | | | | 85,000,508 | |
| LIABILITIES: | | | | | | | | |
| Payable for investments purchased | | | 6,381,228 | | | | – | |
| Administrative fees payable | | | 234,280 | | | | 21,283 | |
| Shareholder service plan fees payable | | | 425,531 | | | | 10,526 | |
| Payable for shares redeemed | | | 1,728,288 | | | | 3,096 | |
| Investment advisory fees payable | | | 1,615,777 | | | | 50,194 | |
| Payable for chief compliance officer fees | | | 10,684 | | | | 9,589 | |
| Trustee fees and expenses payable | | | 59,479 | | | | 2,554 | |
| Payable for principal financial officer fees | | | 2,811 | | | | 2,840 | |
| Audit and tax fees payable | | | 15,330 | | | | 11,922 | |
| Accrued expenses and other liabilities | | | 463,114 | | | | 55,203 | |
| Total Liabilities | | | 10,936,522 | | | | 167,207 | |
| NET ASSETS | | $ | 2,576,286,180 | | | $ | 84,833,301 | |
| NET ASSETS CONSIST OF: | | | | | | | | |
| Paid-in capital (Note 5) | | $ | 2,849,984,273 | | | $ | 83,474,264 | |
| Total distributable earnings | | | (273,698,093 | ) | | | 1,359,037 | |
| NET ASSETS | | $ | 2,576,286,180 | | | $ | 84,833,301 | |
| INVESTMENTS, AT COST | | $ | 2,652,907,524 | | | $ | 83,644,126 | |
| PRICING OF SHARES | | | | | | | | |
| Investor Class: | | | | | | | | |
| Net Asset Value, offering and redemption price per share | | $ | 11.12 | | | $ | 12.80 | |
| Net Assets | | $ | 176,383,172 | | | $ | 594,154 | |
| Shares of beneficial interest outstanding | | | 15,855,672 | | | | 46,408 | |
| Institutional Class: | | | | | | | | |
| Net Asset Value, offering and redemption price per share | | $ | 11.20 | | | $ | 12.85 | |
| Net Assets | | $ | 2,399,903,008 | | | $ | 84,239,147 | |
| Shares of beneficial interest outstanding | | | 214,331,035 | | | | 6,556,939 | |
See accompanying Notes to Financial Statements.
| Semi-annual Report – October 31, 2023 | 23 |
| Seafarer Funds | Statements of Operations |
| | Six Months Ended October 31, 2023 (Unaudited) |
| | | Seafarer Overseas Growth and Income Fund | | | Seafarer Overseas Value Fund | |
| INVESTMENT INCOME: | | | | | | | | |
| Dividends | | $ | 39,994,259 | | | $ | 1,934,847 | |
| Foreign taxes withheld | | | (2,831,824 | ) | | | (46,481 | ) |
| Interest and other income | | | 2,403,768 | | | | 86,984 | |
| Total investment income | | | 39,566,203 | | | | 1,975,350 | |
| EXPENSES: | | | | | | | | |
| Investment advisory fees (Note 7) | | | 9,234,677 | | | | 318,033 | |
| Administrative and transfer agency fees | | | 323,631 | | | | 37,247 | |
| Trustee fees and expenses | | | 84,666 | | | | 2,605 | |
| Registration/filing fees | | | 36,210 | | | | 8,003 | |
| Shareholder service plan fees | | | | | | | | |
| Investor Class | | | 138,796 | | | | – | |
| Institutional Class | | | 587,320 | | | | 21,663 | |
| Legal fees | | | 19,277 | | | | 524 | |
| Audit and tax fees | | | 13,502 | | | | 11,004 | |
| Reports to shareholders and printing fees | | | 53,698 | | | | 2,606 | |
| Custody fees | | | 473,873 | | | | 33,526 | |
| Chief compliance officer fees | | | 13,619 | | | | 12,523 | |
| Principal financial officer fees | | | 3,744 | | | | 3,737 | |
| Insurance expense | | | 39,811 | | | | 1,740 | |
| Miscellaneous | | | 17,998 | | | | 6,349 | |
| Total expenses | | | 11,040,822 | | | | 459,560 | |
| Less fees waived/reimbursed by investment adviser (Note 7) | | | | | | | | |
| Investor Class | | | – | | | | (5 | ) |
| Institutional Class | | | – | | | | (929 | ) |
| Total net expenses | | | 11,040,822 | | | | 458,626 | |
| NET INVESTMENT INCOME: | | | 28,525,381 | | | | 1,516,724 | |
| Net realized gain/(loss) on investments | | | (4,197,490 | ) | | | 31 | |
| Net realized loss on foreign currency transactions | | | (432,400 | ) | | | (15,528 | ) |
| Net realized loss | | | (4,629,890 | ) | | | (15,497 | ) |
| Net change in unrealized depreciation on investments | | | (136,256,375 | ) | | | (5,565,021 | ) |
| Net change in unrealized depreciation on translation of assets and liabilities in foreign currency transactions | | | (24,243 | ) | | | (718 | ) |
| Net unrealized depreciation | | | (136,280,618 | ) | | | (5,565,739 | ) |
| NET REALIZED AND UNREALIZED LOSS ON INVESTMENTS AND FOREIGN CURRENCY TRANSLATIONS | | | (140,910,508 | ) | | | (5,581,236 | ) |
| NET DECREASE IN NET ASSETS RESULTING FROM OPERATIONS | | $ | (112,385,127 | ) | | $ | (4,064,512 | ) |
See accompanying Notes to Financial Statements.
| 24 | (855) 732-9220 seafarerfunds.com |
| Seafarer Overseas Growth and Income Fund | Statements of Changes in Net Assets |
| | | Six Months Ended October 31, 2023 (Unaudited) | | | Year Ended
April 30, 2023 | |
| OPERATIONS: | | | | | | | | |
| Net investment income | | $ | 28,525,381 | | | $ | 42,739,840 | |
| Net realized loss | | | (4,629,891 | ) | | | (110,659,649 | ) |
| Net change in unrealized appreciation/(depreciation) | | | (136,280,617 | ) | | | 65,176,796 | |
| Net decrease in net assets resulting from operations | | | (112,385,127 | ) | | | (2,743,013 | ) |
| DISTRIBUTIONS TO SHAREHOLDERS (NOTE 3): | | | | | | | | |
| Total amount of distribution | | | | | | | | |
| Investor Class | | | (2,670,699 | ) | | | (4,973,375 | ) |
| Institutional Class | | | (32,637,533 | ) | | | (49,920,102 | ) |
| Net decrease in net assets from distributions | | | (35,308,232 | ) | | | (54,893,477 | ) |
| BENEFICIAL INTEREST TRANSACTIONS (NOTE 5): | | | | | | | | |
| Shares sold | | | | | | | | |
| Investor Class | | | 18,049,577 | | | | 31,959,949 | |
| Institutional Class | | | 679,821,878 | | | | 899,433,848 | |
| Dividends reinvested | | | | | | | | |
| Investor Class | | | 2,598,905 | | | | 4,872,836 | |
| Institutional Class | | | 21,407,032 | | | | 32,779,952 | |
| Shares redeemed | | | | | | | | |
| Investor Class | | | (13,516,116 | ) | | | (48,821,966 | ) |
| Institutional Class | | | (208,037,598 | ) | | | (515,808,437 | ) |
| Net increase in net assets derived from beneficial interest transactions | | | 500,323,678 | | | | 404,416,182 | |
| Net increase in net assets | | | 352,630,319 | | | | 346,779,692 | |
| NET ASSETS: | | | | | | | | |
| Beginning of period | | | 2,223,655,861 | | | | 1,876,876,169 | |
| End of period | | $ | 2,576,286,180 | | | $ | 2,223,655,861 | |
| Other Information: | | | | | | | | |
| SHARE TRANSACTIONS: | | | | | | | | |
| Investor Class | | | | | | | | |
| Sold | | | 1,507,228 | | | | 2,784,996 | |
| Distributions reinvested | | | 218,763 | | | | 431,843 | |
| Redeemed | | | (1,132,206 | ) | | | (4,329,431 | ) |
| Net increase/(decrease) in shares outstanding | | | 593,785 | | | | (1,112,592 | ) |
| Institutional Class | | | | | | | | |
| Sold | | | 56,287,326 | | | | 77,436,657 | |
| Distributions reinvested | | | 1,791,383 | | | | 2,891,189 | |
| Redeemed | | | (17,478,229 | ) | | | (45,008,887 | ) |
| Net increase in shares outstanding | | | 40,600,480 | | | | 35,318,959 | |
See accompanying Notes to Financial Statements.
| Semi-annual Report – October 31, 2023 | 25 |
| Seafarer Overseas Value Fund | Statements of Changes in Net Assets |
| | | Six Months Ended October 31, 2023 (Unaudited) | | | Year Ended
April 30, 2023 | |
| OPERATIONS: | | | | | | | | |
| Net investment income | | $ | 1,516,724 | | | $ | 1,788,611 | |
| Net realized loss | | | (15,496 | ) | | | (852,453 | ) |
| Net change in unrealized appreciation/(depreciation) | | | (5,565,740 | ) | | | 3,956,408 | |
| Net increase/(decrease) in net assets resulting from operations | | | (4,064,512 | ) | | | 4,892,566 | |
| DISTRIBUTIONS TO SHAREHOLDERS (NOTE 3): | | | | | | | | |
| Total amount of distribution | | | | | | | | |
| Investor Class | | | – | | | | (8,732 | ) |
| Institutional Class | | | – | | | | (1,035,534 | ) |
| Net decrease in net assets from distributions | | | – | | | | (1,044,266 | ) |
| BENEFICIAL INTEREST TRANSACTIONS (NOTE 5): | | | | | | | | |
| Shares sold | | | | | | | | |
| Investor Class | | | 21,300 | | | | 178,346 | |
| Institutional Class | | | 12,252,920 | | | | 38,638,763 | |
| Dividends reinvested | | | | | | | | |
| Investor Class | | | – | | | | 7,535 | |
| Institutional Class | | | – | | | | 1,026,657 | |
| Shares redeemed | | | | | | | | |
| Investor Class | | | – | | | | (13,147 | ) |
| Institutional Class | | | (4,126,663 | ) | | | (4,746,546 | ) |
| Net increase in net assets derived from beneficial interest transactions | | | 8,147,557 | | | | 35,091,608 | |
| Net increase in net assets | | | 4,083,045 | | | | 38,939,908 | |
| NET ASSETS: | | | | | | | | |
| Beginning of period | | | 80,750,256 | | | | 41,810,348 | |
| End of period | | $ | 84,833,301 | | | $ | 80,750,256 | |
| Other Information: | | | | | | | | |
| SHARE TRANSACTIONS: | | | | | | | | |
| Investor Class | | | | | | | | |
| Sold | | | 1,568 | | | | 13,742 | |
| Distributions reinvested | | | – | | | | 601 | |
| Redeemed | | | – | | | | (1,113 | ) |
| Net increase in shares outstanding | | | 1,568 | | | | 13,230 | |
| Institutional Class | | | | | | | | |
| Sold | | | 891,565 | | | | 3,040,712 | |
| Distributions reinvested | | | – | | | | 81,740 | |
| Redeemed | | | (303,885 | ) | | | (373,540 | ) |
| Net increase in shares outstanding | | | 587,680 | | | | 2,748,912 | |
See accompanying Notes to Financial Statements
| 26 | (855) 732-9220 seafarerfunds.com |
Page Intentionally Left Blank
| Seafarer Overseas Growth and Income Fund |
| Investor Class |
| NET ASSET VALUE, BEGINNING OF PERIOD |
| INCOME FROM OPERATIONS: |
| Net investment income(a) |
| Net realized and unrealized gain/(loss) on investments |
| Total from investment operations |
| LESS DISTRIBUTIONS: |
| From net investment income |
| From net realized gains on investments |
| Total distributions |
| NET INCREASE/(DECREASE) IN NET ASSET VALUE |
| NET ASSET VALUE, END OF PERIOD |
| |
| TOTAL RETURN(b) |
| SUPPLEMENTAL DATA: |
| Net assets, end of period (in 000s) |
| RATIOS TO AVERAGE NET ASSETS: |
| Operating expenses excluding reimbursement/waiver |
| Operating expenses including reimbursement/waiver |
| Net investment income including reimbursement/waiver |
| PORTFOLIO TURNOVER RATE(d) |
| (a) | Calculated using the average shares method. |
| (b) | Total returns are for the periods indicated and have not been annualized. Returns shown do not reflect the deduction of taxes that a shareholder would pay on Fund distributions or the redemption of Fund shares. |
| (d) | Portfolio turnover rate for periods less than one full year have not been annualized. |
| 28 | (855) 732-9220 seafarerfunds.com |
| Financial Highlights |
| For a share outstanding through the periods or years presented |
| Six Months Ended October 31, 2023 (Unaudited) | | | Year Ended
April 30, 2023 | | | Year Ended
April 30, 2022 | | | Year Ended
April 30, 2021 | | | Year Ended
April 30, 2020 | | | Year Ended
April 30, 2019 | |
| $ | 11.70 | | | $ | 12.06 | | | $ | 15.31 | | | $ | 10.31 | | | $ | 11.56 | | | $ | 13.11 | |
| | | | | | | | | | | | | | | | | | | | | | | |
| | 0.13 | | | | 0.24 | | | | 0.33 | | | | 0.18 | | | | 0.21 | | | | 0.36 | |
| | (0.53 | ) | | | (0.27 | ) | | | (2.42 | ) | | | 5.14 | | | | (1.15 | ) | | | (1.02 | ) |
| | (0.40 | ) | | | (0.03 | ) | | | (2.09 | ) | | | 5.32 | | | | (0.94 | ) | | | (0.66 | ) |
| | | | | | | | | | | | | | | | | | | | | | | |
| | (0.18 | ) | | | (0.20 | ) | | | (0.28 | ) | | | (0.17 | ) | | | (0.31 | ) | | | (0.01 | ) |
| | – | | | | (0.13 | ) | | | (0.88 | ) | | | (0.15 | ) | | | – | | | | (0.88 | ) |
| | (0.18 | ) | | | (0.33 | ) | | | (1.16 | ) | | | (0.32 | ) | | | (0.31 | ) | | | (0.89 | ) |
| | (0.58 | ) | | | (0.36 | ) | | | (3.25 | ) | | | 5.00 | | | | (1.25 | ) | | | (1.55 | ) |
| $ | 11.12 | | | $ | 11.70 | | | $ | 12.06 | | | $ | 15.31 | | | $ | 10.31 | | | $ | 11.56 | |
| | | | | | | | | | | | | | | | | | | | | | | |
| | (3.55 | %) | | | (0.13 | %) | | | (14.48 | %) | | | 52.15 | % | | | (8.44 | %) | | | (4.36 | %) |
| | | | | | | | | | | | | | | | | | | | | | | |
| $ | 176,383 | | | $ | 178,566 | | | $ | 197,523 | | | $ | 228,690 | | | $ | 154,017 | | | $ | 233,072 | |
| | 0.96 | %(c) | | | 1.00 | % | | | 1.00 | % | | | 1.02 | % | | | 1.02 | % | | | 0.99 | % |
| | 0.96 | %(c) | | | 1.00 | % | | | 1.00 | % | | | 1.02 | % | | | 1.02 | % | | | 0.99 | % |
| | 2.20 | %(c) | | | 2.05 | % | | | 2.33 | % | | | 1.35 | % | | | 1.88 | % | | | 3.02 | % |
| | 1 | % | | | 22 | % | | | 16 | % | | | 47 | % | | | 29 | % | | | 52 | % |
See accompanying Notes to Financial Statements.
| Semi-annual Report – October 31, 2023 | 29 |
| Seafarer Overseas Growth and Income Fund |
| Institutional Class |
| NET ASSET VALUE, BEGINNING OF PERIOD |
| INCOME FROM OPERATIONS: |
| Net investment income(a) |
| Net realized and unrealized gain/(loss) on investments |
| Total from investment operations |
| LESS DISTRIBUTIONS: |
| From net investment income |
| From net realized gains on investments |
| Total distributions |
| REDEMPTION FEES ADDED TO PAID IN CAPITAL |
| NET INCREASE/(DECREASE) IN NET ASSET VALUE |
| NET ASSET VALUE, END OF PERIOD |
| |
| TOTAL RETURN(c) |
| SUPPLEMENTAL DATA: |
| Net assets, end of period (in 000s) |
| RATIOS TO AVERAGE NET ASSETS: |
| Operating expenses excluding reimbursement/waiver |
| Operating expenses including reimbursement/waiver |
| Net investment income including reimbursement/waiver |
| PORTFOLIO TURNOVER RATE(e) |
| (a) | Calculated using the average shares method. |
| (b) | Less than $0.005 per share. |
| (c) | Total returns are for the periods indicated and have not been annualized. Returns shown do not reflect the deduction of taxes that a shareholder would pay on Fund distributions or the redemption of Fund shares. |
| (e) | Portfolio turnover rate for periods less than one full year have not been annualized. |
| 30 | (855) 732-9220 seafarerfunds.com |
| Financial Highlights |
| For a share outstanding through the periods or years presented |
| Six Months Ended October 31, 2023 (Unaudited) | | | Year Ended
April 30, 2023 | | | Year Ended
April 30, 2022 | | | Year Ended
April 30, 2021 | | | Year Ended
April 30, 2020 | | | Year Ended
April 30, 2019 | |
| $ | 11.77 | | | $ | 12.13 | | | $ | 15.39 | | | $ | 10.36 | | | $ | 11.61 | | | $ | 13.14 | |
| | | | | | | | | | | | | | | | | | | | | | | |
| | 0.14 | | | | 0.26 | | | | 0.35 | | | | 0.20 | | | | 0.22 | | | | 0.29 | |
| | (0.53 | ) | | | (0.28 | ) | | | (2.44 | ) | | | 5.16 | | | | (1.16 | ) | | | (0.93 | ) |
| | (0.39 | ) | | | (0.02 | ) | | | (2.09 | ) | | | 5.36 | | | | (0.94 | ) | | | (0.64 | ) |
| | | | | | | | | | | | | | | | | | | | | | | |
| | (0.18 | ) | | | (0.21 | ) | | | (0.29 | ) | | | (0.18 | ) | | | (0.31 | ) | | | (0.01 | ) |
| | – | | | | (0.13 | ) | | | (0.88 | ) | | | (0.15 | ) | | | – | | | | (0.88 | ) |
| | (0.18 | ) | | | (0.34 | ) | | | (1.17 | ) | | | (0.33 | ) | | | (0.31 | ) | | | (0.89 | ) |
| | – | | | | – | | | | – | | | | 0.00 | (b) | | | – | | | | – | |
| | (0.57 | ) | | | (0.36 | ) | | | (3.26 | ) | | | 5.03 | | | | (1.25 | ) | | | (1.53 | ) |
| $ | 11.20 | | | $ | 11.77 | | | $ | 12.13 | | | $ | 15.39 | | | $ | 10.36 | | | $ | 11.61 | |
| | | | | | | | | | | | | | | | | | | | | | | |
| | (3.43 | %) | | | (0.03 | %) | | | (14.41 | %) | | | 52.28 | % | | | (8.34 | %) | | | (4.17 | %) |
| | | | | | | | | | | | | | | | | | | | | | | |
| $ | 2,399,903 | | | $ | 2,045,090 | | | $ | 1,679,354 | | | $ | 1,827,624 | | | $ | 1,101,542 | | | $ | 1,304,491 | |
| | 0.86 | %(d) | | | 0.90 | % | | | 0.91 | % | | | 0.92 | % | | | 0.92 | % | | | 0.90 | % |
| | 0.86 | %(d) | | | 0.90 | % | | | 0.91 | % | | | 0.92 | % | | | 0.92 | % | | | 0.90 | % |
| | 2.25 | %(d) | | | 2.22 | % | | | 2.46 | % | | | 1.47 | % | | | 1.91 | % | | | 2.45 | % |
| | 1 | % | | | 22 | % | | | 16 | % | | | 47 | % | | | 29 | % | | | 52 | % |
See accompanying Notes to Financial Statements.
| Semi-annual Report – October 31, 2023 | 31 |
Seafarer Overseas Value Fund
| Investor Class |
| NET ASSET VALUE, BEGINNING OF PERIOD |
| INCOME FROM OPERATIONS: |
| Net investment income(b) |
| Net realized and unrealized gain/(loss) on investments |
| Total from investment operations |
| LESS DISTRIBUTIONS: |
| From net investment income |
| From net realized gains on investments |
| Total distributions |
| NET INCREASE/(DECREASE) IN NET ASSET VALUE |
| NET ASSET VALUE, END OF PERIOD |
| |
| TOTAL RETURN(c) |
| SUPPLEMENTAL DATA: |
| Net assets, end of period (in 000s) |
| RATIOS TO AVERAGE NET ASSETS: |
| Operating expenses excluding reimbursement/waiver |
| Operating expenses including reimbursement/waiver |
| Net investment income including reimbursement/waiver |
| PORTFOLIO TURNOVER RATE(e) |
| (a) | Adjustments in accordance with U.S. GAAP were applied during the financial statement preparation. As a result of the adjustments, the net asset value and total return for shareholder transactions reported to the market may differ from the net asset value and total return for financial reporting purposes. |
| (b) | Calculated using the average shares method. |
| (c) | Total returns are for the periods indicated and have not been annualized. In some periods, total returns would have been lower had certain expenses not been waived during the periods. Returns shown do not reflect the deduction of taxes that a shareholder would pay on Fund distributions or the redemption of Fund shares. |
| (e) | Portfolio turnover rate for periods less than one full year have not been annualized. |
| 32 | (855) 732-9220 seafarerfunds.com |
| Financial Highlights |
| For a share outstanding through the periods or years presented |
| Six Months Ended October 31, 2023 (Unaudited) | | | Year Ended
April 30, 2023 | | | Year Ended
April 30, 2022 | | | Year Ended
April 30, 2021 | | | Year Ended
April 30, 2020 | | | Year Ended
April 30, 2019 | |
| $ | 13.39 | (a) | | $ | 12.83 | (a) | | $ | 13.16 | | | $ | 9.46 | | | $ | 11.41 | | | $ | 11.95 | |
| | | | | | | | | | | | | | | | | | | | | | | |
| | 0.23 | | | | 0.38 | | | | 0.42 | | | | 0.22 | | | | 0.29 | | | | 0.29 | |
| | (0.82 | ) | | | 0.39 | | | | (0.29 | ) | | | 3.64 | | | | (1.88 | ) | | | (0.51 | ) |
| | (0.59 | ) | | | 0.77 | | | | 0.13 | | | | 3.86 | | | | (1.59 | ) | | | (0.22 | ) |
| | | | | | | | | | | | | | | | | | | | | | | |
| | – | | | | (0.21 | ) | | | (0.42 | ) | | | (0.16 | ) | | | (0.31 | ) | | | (0.29 | ) |
| | – | | | | – | | | | (0.04 | ) | | | – | | | | (0.05 | ) | | | (0.03 | ) |
| | – | | | | (0.21 | ) | | | (0.46 | ) | | | (0.16 | ) | | | (0.36 | ) | | | (0.32 | ) |
| | (0.59 | ) | | | 0.56 | | | | (0.33 | ) | | | 3.70 | | | | (1.95 | ) | | | (0.54 | ) |
| $ | 12.80 | | | $ | 13.39 | (a) | | $ | 12.83 | (a) | | $ | 13.16 | | | $ | 9.46 | | | $ | 11.41 | |
| | | | | | | | | | | | | | | | | | | | | | | |
| | (4.41 | %)(a) | | | 6.11 | %(a) | | | 0.94 | %(a) | | | 40.96 | % | | | (14.54 | %) | | | (1.50 | %) |
| | | | | | | | | | | | | | | | | | | | | | | |
| $ | 594 | | | $ | 600 | | | $ | 405 | | | $ | 431 | | | $ | 278 | | | $ | 327 | |
| | | | | | | | | | | | | | | | | | | | | | | |
| | 1.15 | %(d) | | | 1.23 | % | | | 1.48 | % | | | 1.49 | % | | | 1.44 | % | | | 1.45 | % |
| | 1.15 | %(d) | | | 1.15 | % | | | 1.15 | % | | | 1.15 | % | | | 1.15 | % | | | 1.15 | % |
| | 3.37 | %(d) | | | 2.98 | % | | | 3.15 | % | | | 1.99 | % | | | 2.61 | % | | | 2.59 | % |
| | 0 | % | | | 1 | % | | | 14 | % | | | 24 | % | | | 25 | % | | | 3 | % |
See accompanying Notes to Financial Statements.
| Semi-annual Report – October 31, 2023 | 33 |
| Seafarer Overseas Value Fund |
| Institutional Class |
| NET ASSET VALUE, BEGINNING OF PERIOD |
| INCOME FROM OPERATIONS: |
| Net investment income(b) |
| Net realized and unrealized gain/(loss) on investments |
| Total from investment operations |
| LESS DISTRIBUTIONS: |
| From net investment income |
| From net realized gains on investments |
| Total distributions |
| NET INCREASE/(DECREASE) IN NET ASSET VALUE |
| NET ASSET VALUE, END OF PERIOD |
| |
| TOTAL RETURN(c) |
| SUPPLEMENTAL DATA: |
| Net assets, end of period (in 000s) |
| RATIOS TO AVERAGE NET ASSETS: |
| Operating expenses excluding reimbursement/waiver |
| Operating expenses including reimbursement/waiver |
| Net investment income including reimbursement/waiver |
| PORTFOLIO TURNOVER RATE(e) |
| (a) | Adjustments in accordance with U.S. GAAP were applied during the financial statement preparation. As a result of the adjustments, the net asset value and total return for shareholder transactions reported to the market may differ from the net asset value and total return for financial reporting purposes. |
| (b) | Calculated using the average shares method. |
| (c) | Total returns are for the periods indicated and have not been annualized. In some periods, total returns would have been lower had certain expenses not been waived during the periods. Returns shown do not reflect the deduction of taxes that a shareholder would pay on Fund distributions or the redemption of Fund shares. |
| (e) | Portfolio turnover rate for periods less than one full year have not been annualized. |
| 34 | (855) 732-9220 seafarerfunds.com |
| Financial Highlights |
| For a share outstanding through the periods or years presented |
| Six Months Ended October 31, 2023 (Unaudited) | | | Year Ended
April 30, 2023 | | | Year Ended
April 30, 2022 | | | Year Ended
April 30, 2021 | | | Year Ended
April 30, 2020 | | | Year Ended
April 30, 2019 | |
| $ | 13.43 | (a) | | $ | 12.86 | (a) | | $ | 13.18 | | | $ | 9.48 | | | $ | 11.43 | | | $ | 11.96 | |
| | | | | | | | | | | | | | | | | | | | | | | |
| | 0.24 | | | | 0.40 | | | | 0.46 | | | | 0.25 | | | | 0.30 | | | | 0.30 | |
| | (0.82 | ) | | | 0.39 | | | | (0.32 | ) | | | 3.62 | | | | (1.88 | ) | | | (0.50 | ) |
| | (0.58 | ) | | | 0.79 | | | | 0.14 | | | | 3.87 | | | | (1.58 | ) | | | (0.20 | ) |
| | | | | | | | | | | | | | | | | | | | | | | |
| | – | | | | (0.22 | ) | | | (0.42 | ) | | | (0.17 | ) | | | (0.32 | ) | | | (0.30 | ) |
| | – | | | | – | | | | (0.04 | ) | | | – | | | | (0.05 | ) | | | (0.03 | ) |
| | – | | | | (0.22 | ) | | | (0.46 | ) | | | (0.17 | ) | | | (0.37 | ) | | | (0.33 | ) |
| | (0.58 | ) | | | 0.57 | | | | (0.32 | ) | | | 3.70 | | | | (1.95 | ) | | | (0.53 | ) |
| $ | 12.85 | | | $ | 13.43 | (a) | | $ | 12.86 | (a) | | $ | 13.18 | | | $ | 9.48 | | | $ | 11.43 | |
| | | | | | | | | | | | | | | | | | | | | | | |
| | (4.32 | %)(a) | | | 6.22 | %(a) | | | 1.08 | %(a) | | | 40.98 | % | | | (14.47 | %) | | | (1.34 | %) |
| | | | | | | | | | | | | | | | | | | | | | | |
| $ | 84,239 | | | $ | 80,150 | | | $ | 41,405 | | | $ | 34,714 | | | $ | 29,557 | | | $ | 28,849 | |
| | 1.05 | %(d) | | | 1.18 | % | | | 1.37 | % | | | 1.51 | % | | | 1.42 | % | | | 1.48 | % |
| | 1.05 | %(d) | | | 1.05 | % | | | 1.05 | % | | | 1.05 | % | | | 1.05 | % | | | 1.05 | % |
| | 3.47 | %(d) | | | 3.11 | % | | | 3.43 | % | | | 2.19 | % | | | 2.63 | % | | | 2.65 | % |
| | 0 | % | | | 1 | % | | | 14 | % | | | 24 | % | | | 25 | % | | | 3 | % |
See accompanying Notes to Financial Statements.
| Semi-annual Report – October 31, 2023 | 35 |
| Seafarer Funds | Notes to Financial Statements |
| | October 31, 2023 (Unaudited) |
NOTES TO FINANCIAL STATEMENTS
1. Organization
Financial Investors Trust (the “Trust”), a Delaware statutory trust, is an open-end management investment company registered under the Investment Company Act of 1940, as amended (“1940 Act”). The Trust consists of multiple separate portfolios or series. This semi-annual report describes the Seafarer Overseas Growth and Income Fund and the Seafarer Overseas Value Fund (individually a “Fund” and collectively, the “Funds”). The Seafarer Overseas Growth and Income Fund seeks to provide long-term capital appreciation along with some current income; it also seeks to mitigate adverse volatility in returns as a secondary objective. The Seafarer Overseas Value Fund seeks to provide long-term capital appreciation. The Funds each offer Investor Class and Institutional Class shares.
2. Significant Accounting Policies
The accompanying financial statements were prepared in accordance with accounting principles generally accepted in the United States of America (“U.S. GAAP”). The preparation of financial statements in conformity with U.S. GAAP requires management to make certain estimates and assumptions that affect the reported amounts of assets and liabilities and disclosures of contingent assets and liabilities at the date of the financial statements and the reported amounts of revenue and expenses during the period. Actual results could differ from those estimates. The Funds are considered an investment company for financial reporting purposes under U.S. GAAP and follow the accounting and reporting guidance applicable to investment companies in the Financial Accounting Standards Board Accounting Standards Codification Topic 946.The following is a summary of significant accounting policies consistently followed by the Funds in preparation of their financial statements.
Investment Valuation
Each Fund generally values its securities based on market prices determined at the close of regular trading on the New York Stock Exchange (“NYSE”), normally 4:00 p.m. Eastern Time, on each day the NYSE is open for trading.
For equity securities and exchange traded funds, the market price is usually the closing sale or official closing price on that exchange. In the case of equity securities not traded on an exchange, or if such closing prices are not otherwise available, the securities are valued at the mean of the most recent bid and ask prices on such day. Redeemable securities issued by open-end registered investment companies are valued at the investment company’s applicable net asset value, with the exception of exchange-traded open-end investment companies, which are priced as equity securities.
Equity securities that are primarily traded on foreign securities exchanges are valued at the closing values of such securities on their respective foreign exchanges, except when an event occurs subsequent to the close of the foreign exchange but before the close of the NYSE, such that the securities’ value would likely change. In such an event, the fair values of those securities are determined in good faith through consideration of other factors in accordance with procedures utilized by Seafarer Capital Partners, LLC (the “Adviser”), as the Funds' Valuation Designee and under the general supervision of the Board of Trustees of the Trust (the “Board” or the “Trustees”). Each Fund uses a fair valuation model provided by an independent pricing service, which is intended to reflect fair value when a security’s value or a meaningful portion of the Fund’s portfolio is believed to have been materially affected by a valuation event that has occurred between the close of the exchange or market on which the security is traded and the close of the regular trading day on the NYSE.
The market price for debt obligations is generally the price supplied by an independent third-party pricing service approved by the Board, which may use a matrix, formula or other objective method that takes into consideration quotations from dealers, market transactions in comparable investments, market indices and yield curves. If vendors are unable to supply a price, or if the price supplied is deemed to be unreliable, the market price may be determined using quotations received from one or more broker-dealers that make a market in the security. Corporate bonds and convertible bonds are
| 36 | (855) 732-9220 seafarerfunds.com |
| Seafarer Funds | Notes to Financial Statements |
| | October 31, 2023 (Unaudited) |
valued using market models that consider trade data, quotations from dealers and active market makers, relevant yield curve and spread data, creditworthiness, trade data or market information on comparable securities, and other relevant security specific information. Publicly traded foreign government debt securities and foreign corporate bonds are typically traded internationally in the over-the-counter market and are valued at the mean between the bid and asked prices as of the close of business of that market.
Forward currency exchange contracts have a market value determined by the prevailing foreign currency exchange daily rates and current foreign currency exchange forward rates. The foreign currency exchange forward rates are calculated using an automated system that estimates rates on the basis of the current day foreign currency exchange rates and forward foreign currency exchange rates supplied by a pricing service.
When such prices or quotations are not available, or when the Adviser, as the Funds' Valuation Designee believes that they are unreliable, securities may be priced using fair value procedures approved by the Board.
Certain foreign countries impose a tax on capital gains which is accrued by each Fund based on unrealized appreciation, if any, on affected securities. The tax is paid when the gain is realized.
Fair Value Measurements
Pursuant to Rule 2a-5 under the Investment Company Act of 1940, the Board has appointed the Adviser to serve as the Valuation Designee to perform fair value determinations for investments in the Funds. Fair valuation policies and procedures (“FV Procedures”) have been adopted by the Board for the fair valuation of portfolio assets held by the Fund(s) in the event that (1) market quotations for the current price of a portfolio security or asset are not readily available, or (2) available market quotations that would otherwise be used to value a portfolio security or asset in accordance with the Fund’s Pricing Procedures appear to be unreliable or not indicative of fair value. The Pricing Procedures reflect certain pricing methodologies (or “logics”) that are not “readily available market quotations” and thus are viewed and treated as fair valuations. The Valuation Designee routinely meets to discuss fair valuations of portfolio securities and other instruments held by the Fund(s).
Each Fund discloses the classification of its fair value measurements following a three-tier hierarchy based on the inputs used to measure fair value. Inputs refer broadly to the assumptions that market participants would use in pricing the asset or liability, including assumptions about risk. Inputs may be observable or unobservable. Observable inputs reflect the assumptions market participants would use in pricing the asset or liability. Such inputs are developed based on market data obtained from sources independent of the reporting entity. Unobservable inputs reflect the reporting entity’s own assumptions about the assumptions market participants would use in pricing the asset or liability, which are developed based on the information available and the reporting entity’s best efforts to interpret such information.
Various inputs are used in determining the value of the Funds’ investments as of the end of the reporting period. When inputs used fall into different levels of the fair value hierarchy, the level in the hierarchy within which the fair value measurement falls is determined based on the lowest level input that is significant to the fair value measurement in its entirety. The designated input levels are not necessarily an indication of the risk or liquidity associated with these investments. These inputs are categorized in the following hierarchy under applicable financial accounting standards:
Level 1 – Unadjusted quoted prices in active markets for identical investments, unrestricted assets or liabilities that the Funds have the ability to access at the measurement date;
Level 2 – Quoted prices which are not active, quoted prices for similar assets or liabilities in active markets or inputs other than quoted prices that are observable (either directly or indirectly) for substantially the full term of the asset or liability; and
Level 3 – Significant unobservable prices or inputs (including the Funds’ own assumptions in determining the fair value of investments) where there is little or no market activity for the asset or liability at the measurement date.
| Semi-annual Report – October 31, 2023 | 37 |
| Seafarer Funds | Notes to Financial Statements |
| | October 31, 2023 (Unaudited) |
The following is a summary of the inputs used to value each Fund as of October 31, 2023:
| Investments in Securities at Value(a) | | Level 1 - Quoted Prices | | | Level 2 - Other Significant Observable Inputs | | | Level 3 - Significant Unobservable Inputs | | | Total | |
| Seafarer Overseas Growth and Income Fund | | | | | | | | | | | | | | | | |
| Common Stocks | | | | | | | | | | | | | | | | |
| Belgium | | $ | 39,809,000 | | | $ | – | | | $ | – | | | $ | 39,809,000 | |
| Brazil | | | 181,811,269 | | | | – | | | | – | | | | 181,811,269 | |
| China / Hong Kong | | | – | | | | 331,105,124 | | | | – | | | | 331,105,124 | |
| Czech Republic | | | – | | | | 39,098,623 | | | | – | | | | 39,098,623 | |
| France | | | – | | | | 41,607,927 | | | | – | | | | 41,607,927 | |
| Hungary | | | 82,065,338 | | | | – | | | | – | | | | 82,065,338 | |
| India | | | – | | | | 173,998,572 | | | | – | | | | 173,998,572 | |
| Indonesia | | | – | | | | 53,714,764 | | | | – | | | | 53,714,764 | |
| Japan | | | – | | | | 79,709,304 | | | | – | | | | 79,709,304 | |
| Mexico | | | 171,583,945 | | | | – | | | | – | | | | 171,583,945 | |
| Peru | | | 39,737,280 | | | | – | | | | – | | | | 39,737,280 | |
| Poland | | | – | | | | 32,456,729 | | | | – | | | | 32,456,729 | |
| Qatar | | | 41,197,776 | | | | – | | | | – | | | | 41,197,776 | |
| Singapore | | | – | | | | 123,159,665 | | | | – | | | | 123,159,665 | |
| South Africa | | | 92,952,503 | | | | – | | | | – | | | | 92,952,503 | |
| South Korea | | | – | | | | 439,001,105 | | | | – | | | �� | 439,001,105 | |
| Taiwan | | | – | | | | 152,690,681 | | | | – | | | | 152,690,681 | |
| Thailand | | | 35,977,464 | | | | 42,018,372 | | | | – | | | | 77,995,836 | |
| United Arab Emirates | | | 76,325,134 | | | | 51,512,760 | | | | – | | | | 127,837,894 | |
| United Kingdom | | | – | | | | 50,812,284 | | | | – | | | | 50,812,284 | |
| Vietnam | | | – | | | | 30,919,872 | | | | – | | | | 30,919,872 | |
| Preferred Stocks | | | – | | | | 86,237,411 | | | | – | | | | 86,237,411 | |
| Total | | $ | 761,459,709 | | | $ | 1,728,043,193 | | | $ | – | | | $ | 2,489,502,902 | |
| 38 | (855) 732-9220 seafarerfunds.com |
| Seafarer Funds | Notes to Financial Statements |
| | October 31, 2023 (Unaudited) |
| Investments in Securities at Value(a) | | Level 1 -
Quoted Prices | | | Level 2 -
Other Significant Observable Inputs | | | Level 3 -
Significant
Unobservable
Inputs | | | Total | |
| Seafarer Overseas Value Fund | | | | | | | | | | | | | | | | |
| Common Stocks | | | | | | | | | | | | | | | | |
| Belgium | | $ | 1,819,840 | | | $ | – | | | $ | – | | | $ | 1,819,840 | |
| Brazil | | | 9,820,537 | | | | – | | | | – | | | | 9,820,537 | |
| China / Hong Kong | | | 1,481,870 | | | | 23,202,720 | | | | – | | | | 24,684,590 | |
| Czech Republic | | | – | | | | 2,451,155 | | | | – | | | | 2,451,155 | |
| Georgia | | | 4,138,688 | | | | – | | | | – | | | | 4,138,688 | |
| India | | | – | | | | 4,250,486 | | | | – | | | | 4,250,486 | |
| Mexico | | | 1,672,440 | | | | – | | | | – | | | | 1,672,440 | |
| Peru | | | 2,311,760 | | | | – | | | | – | | | | 2,311,760 | |
| Qatar | | | 2,571,601 | | | | – | | | | – | | | | 2,571,601 | |
| Singapore | | | – | | | | 5,235,778 | | | | – | | | | 5,235,778 | |
| South Korea | | | – | | | | 6,481,533 | | | | – | | | | 6,481,533 | |
| Thailand | | | 1,874,995 | | | | – | | | | – | | | | 1,874,995 | |
| United Arab Emirates | | | 4,969,773 | | | | 4,510,684 | | | | – | | | | 9,480,457 | |
| United Kingdom | | | – | | | | 2,756,375 | | | | – | | | | 2,756,375 | |
| Vietnam | | | 2,515,992 | | | | 1,170,062 | | | | – | | | | 3,686,054 | |
| Preferred Stocks | | | – | | | | 108,849 | | | | – | | | | 108,849 | |
| Total | | $ | 33,177,496 | | | $ | 50,167,642 | | | $ | – | | | $ | 83,345,138 | |
| (a) | For detailed descriptions of securities by country, see the accompanying Portfolio of Investments. |
For the six months ended October 31, 2023, the Funds did not have any securities that used significant unobservable inputs (Level 3) in determining fair value.
Investment Transactions and Investment Income
Investment transactions are accounted for on the date the investments are purchased or sold (trade date). Realized gains and losses from investment transactions are reported on an identified cost basis. Interest income, which includes accretion of discounts and amortization of premiums, is accrued and recorded as earned. Dividend income is recognized on the ex-dividend date or for certain foreign securities, as soon as information is available to the Funds. All of the realized and unrealized gains and losses and net investment income are allocated daily to each share class in proportion to its average daily net assets.
Cash Management Transactions
Each of the Funds subscribes to the Brown Brothers Harriman & Co. (“BBH”) Cash Management Service (“CMS”), whereby cash balances are automatically swept into overnight offshore demand deposits with either the BBH Grand Cayman branch or a branch of a pre-approved commercial bank. This fully automated program allows the Funds to earn interest on cash balances. Excess cash with deposit institutions domiciled outside of the U.S. are subject to sovereign actions in the jurisdiction of the deposit institution including, but not limited to, freeze, seizure or diminution. Cash balances in the BBH CMS are included on the Statements of Assets and Liabilities under Cash and Foreign currency, at value.
| Semi-annual Report – October 31, 2023 | 39 |
| Seafarer Funds | Notes to Financial Statements |
| | October 31, 2023 (Unaudited) |
As of October 31, 2023, the Funds had the following cash balances participating in the BBH CMS:
| Fund | | | |
| Seafarer Overseas Growth and Income Fund | | $ | 91,105,909 | |
| Seafarer Overseas Value Fund | | | 1,211,144 | |
As of October 31, 2023, the Funds had the following foreign cash balances participating in the BBH CMS (cost and value of foreign cash balances are equal):
| Fund | | | |
| Seafarer Overseas Growth and Income Fund | | $ | – | |
| Seafarer Overseas Value Fund | | | – | |
Foreign Securities
The Funds may directly purchase securities of foreign issuers. Investing in securities of foreign issuers involves special risks not typically associated with investing in securities of U.S. issuers. The risks include possible revaluation of currencies, the inability to repatriate foreign currency, less complete financial information about companies, and possible future adverse political and economic developments. Moreover, securities of many foreign issuers and their markets may be less liquid and their prices more volatile than those of securities of comparable U.S. issuers.
Foreign Currency Translation
The books and records of the Funds are maintained in U.S. dollars. Investment valuations and other assets and liabilities initially expressed in foreign currencies are converted each business day into U.S. dollars based upon current exchange rates. Prevailing foreign exchange rates may generally be obtained at the close of the NYSE (normally, 4:00 p.m. Eastern Time). The portion of realized and unrealized gains or losses on investments due to fluctuations in foreign currency exchange rates is not separately disclosed and is included in realized and unrealized gains or losses on investments, when applicable.
Foreign Currency Spot Contracts
Each Fund may enter into foreign currency spot contracts to facilitate transactions in foreign securities or to convert foreign currency receipts into U.S. dollars. A foreign currency spot contract is an agreement between two parties to buy and sell currencies at the current market rate, for settlement generally within two business days. The U.S. dollar value of a contract is determined using current currency exchange rates supplied by a pricing service. The contract is marked-to-market daily for settlements beyond one day and any change in market value is recorded as an unrealized gain or loss. When the contract is closed, the Fund records a realized gain or loss equal to the difference between the value on the open and close dates. Losses may arise from changes in the value of the foreign currency, or if the counterparties do not perform under the contract’s terms. The maximum potential loss from such contracts is the aggregate face value in U.S. dollars at the time the contract was opened.
Trust Expenses
Some expenses of the Trust can be directly attributed to the Funds. Expenses that cannot be directly attributed to the Funds are apportioned among all funds in the Trust based on the average daily net assets of each fund.
Fund and Class Expenses
Expenses that are specific to a Fund or class of shares of a Fund, including shareholder servicing fees, are charged directly to that Fund or share class. Expenses that are common to all Funds are generally allocated among the Funds in proportion to their average daily net assets.
| 40 | (855) 732-9220 seafarerfunds.com |
| Seafarer Funds | Notes to Financial Statements |
| | October 31, 2023 (Unaudited) |
Income Taxes
Each Fund complies with the requirements under Subchapter M of the Internal Revenue Code of 1986, as amended, applicable to regulated investment companies and intends to distribute substantially all of its net taxable income and net capital gains, if any, each year so that it will not be subject to excise tax on undistributed income and gains. The Funds are not subject to income taxes to the extent such distributions are made.
As of and during the six months ended October 31, 2023, the Funds did not have a liability for any unrecognized tax benefits. The Funds file U.S. federal, state, and local tax returns as required. The Funds’ tax returns are subject to examination by the relevant tax authorities until expiration of the applicable statute of limitations, which is generally three years after the filing due date of the tax return for federal purposes and four years for most state returns. Tax returns for open years have incorporated no uncertain tax positions that require a provision for income taxes.
Distributions to Shareholders
In general, the Seafarer Overseas Growth and Income Fund’s policy is to distribute to its shareholders substantially all net investment income paid out via semi-annual dividends, in June and December. The Seafarer Overseas Value Fund’s policy is to distribute to its shareholders substantially all net investment income via one annual dividend in December. It is also each Fund’s policy to distribute annually all net realized short-term and long-term capital gains, if any, after offsetting any capital loss carryovers. Income dividend distributions are derived from dividends and other income each Fund receives from its investments, including short-term capital gains. Long-term capital gain distributions are derived from gains realized when a Fund sells a security it has owned for more than one year. Each Fund may make additional distributions at other times if the Fund believes doing so may be necessary for the Fund to share tax obligations more ratably and more equitably across shareholders over time.
3. Tax Basis Information
Tax Basis of Investments
As of October 31, 2023, the aggregate cost of investments, gross unrealized appreciation/(depreciation), and net unrealized appreciation/(depreciation) for federal income tax purposes were as follows:
| Fund | | Cost of Investments | | | Gross Unrealized Appreciation | | | Gross Unrealized Depreciation | | | Net Unrealized Appreciation/ (Depreciation) | |
| Seafarer Overseas Growth and Income Fund | | | | | | | | | | | | | | | | |
| | | $ | 2,750,177,615 | | | $ | 223,296,203 | | | $ | (392,865,007 | ) | | $ | (169,568,804 | ) |
| Seafarer Overseas Value Fund | | | | | | | | | | | | | | | | |
| | | | 83,654,839 | | | | 9,713,621 | | | | (10,023,322 | ) | | | (309,701 | ) |
Tax Basis of Distributions to Shareholders
The character of distributions made during the fiscal year from net investment income or net realized gains may differ from the ultimate characterization for federal income tax purposes. Also, due to the timing of dividend distributions, the fiscal year in which amounts are distributed may differ from the fiscal year in which the income or realized gain is recorded by a Fund.
| Semi-annual Report – October 31, 2023 | 41 |
| Seafarer Funds | Notes to Financial Statements |
| | October 31, 2023 (Unaudited) |
The tax character of distributions paid by the Funds for the fiscal year ended April 30, 2023 was as follows:
| Fund | | Ordinary Income | | | Long-Term Capital Gain | |
| Seafarer Overseas Growth and Income Fund | | $ | 33,023,314 | | | $ | 21,870,163 | |
| Seafarer Overseas Value Fund | | | 1,044,266 | | | | – | |
The amounts and characteristics of tax basis distributions and composition of distributable earnings/(accumulated losses) are finalized at fiscal year-end. Accordingly, tax basis balances have not been determined as of October 31, 2023.
4. Securities Transactions
The cost of purchases and proceeds from sales of securities excluding short-term securities during the six months ended October 31, 2023 were as follows:
| Fund | | Purchases of Securities | | | Proceeds from Sales of Securities | |
| Seafarer Overseas Growth and Income Fund | | $ | 537,961,290 | | | $ | 30,516,800 | |
| Seafarer Overseas Value Fund | | | 15,859,168 | | | | – | |
5. Shares of Beneficial Interest
The capitalization of the Trust consists of an unlimited number of shares of beneficial interest with no par value per share. Holders of shares of the Funds of the Trust have one vote for each share held and a proportionate fraction of a vote for each fractional share. All shares issued and outstanding are fully paid and are transferable and redeemable at the option of the shareholder. Purchasers of the shares do not have any obligation to make payments to the Trust or its creditors solely by reason of the purchasers’ ownership of the shares. Shares have no pre-emptive rights.
6. Borrowings
On March 16, 2023, the Funds entered into a Credit Agreement with the Fund’s custodian, Brown Brothers Harriman & Co. (“BBH”). Under the terms of the Credit Agreement, the Seafarer Overseas Growth and Income Fund and the Seafarer Overseas Value Fund are collectively allowed to borrow up to $30,000,000. The borrowing of each Fund is several and not joint and subject to a 10:1 collateral-to-debt ratio. The collateral for the Credit Agreement is the assets of each Fund. Interest is charged at a rate of the higher of the Federal Funds Rate or the Adjusted Term Secured Overnight Financing Rate (SOFR) plus an applicable margin of 2%. For the six months ended October 31, 2023, and as of October 31, 2023, the Funds did not have outstanding borrowings.
7. Management and Related Party Transactions
The Adviser, subject to the authority of the Board, is responsible for the overall management and administration of the Funds’ business affairs. The Adviser manages the investments of the Funds in accordance with the Funds’ investment objectives, policies, limitations and investment guidelines established jointly by the Adviser and the Trustees. Pursuant to the investment advisory agreement, the Funds, in the aggregate, pay the Adviser an annual management fee of 0.75% of the aggregate average daily net assets of the Funds up to $1.5 billion and 0.70% of the aggregate average daily net assets of the Funds over $1.5 billion. Each Fund pays the Adviser a monthly fee at the annual rate using the
| 42 | (855) 732-9220 seafarerfunds.com |
| Seafarer Funds | Notes to Financial Statements |
| | October 31, 2023 (Unaudited) |
applicable management fee calculated based on the Fund’s pro rata share of the Funds’ combined average daily net assets.
Effective September 1, 2015, the Adviser contractually, through successive one-year agreements, agreed to waive and/or reimburse fees or expenses in order to limit Total Annual Fund Operating Expenses After Fee Waiver / Expense Reimbursements (excluding brokerage expenses, interest expenses, taxes and extraordinary expenses) to 1.15% and 1.05% of the Funds’ average daily net assets for the Investor and Institutional share classes, respectively. The current agreement (the “Expense Agreement”) is in effect through August 31, 2024. The Adviser will be permitted to recover, on a class-by-class basis, expenses it has borne through the Expense Agreement to the extent that the Funds’ expenses in later periods fall below the expense cap in effect at the time of waiver or reimbursement. The Funds will not be obligated to pay any such deferred fees and expenses more than three years after the date of the waiver. This agreement may not be terminated or modified prior to August 31, 2024, except with the approval of the Funds’ Board. During the six months ended October 31, 2023, the Adviser agreed that it will only seek to recoup waived management fees and will not recoup any reimbursed expenses. As of October 31, 2023, the Adviser had recouped all available waived management fees from the Seafarer Overseas Growth and Income Fund.
For the six months ended October 31, 2023, the fee waivers and/or reimbursements were as follows for the Seafarer Overseas Value Fund:
| Fund | | Fees Waived/ Reimbursed By Adviser | | | Recoupment of Past Waived Fees By Adviser | |
| Seafarer Overseas Value Fund | | | | | | | | |
| Investor Class | | $ | 50 | | | $ | 46 | |
| Institutional Class | | | 7,086 | | | | 6,157 | |
As of October 31, 2023 the balances of recoupable expenses for each class were as follows for the Funds:
| Fund | | Expires 2024 | | | Expires 2025 | | | Expires 2026 | | | Expires 2027 | | | Total | |
| Seafarer Overseas Growth and Income Fund | | | | | | | | | | | | | | | | | | | | |
| Investor Class | | $ | – | | | $ | – | | | $ | – | | | $ | – | | | $ | – | |
| Institutional Class | | | – | | | | – | | | | – | | | | – | | | | – | |
| Seafarer Overseas Value Fund | | | | | | | | | | | | | | | | | | | | |
| Investor Class | | $ | 382 | | | $ | 1,439 | | | $ | 406 | | | $ | 5 | | | $ | 2,232 | |
| Institutional Class | | | 58,797 | | | | 118,111 | | | | 72,311 | | | | 929 | | | | 250,148 | |
Fund Administrator
ALPS Fund Services, Inc. (“ALPS” and the “Administrator”) provides administrative, fund accounting and other services to the Funds under the Administration, Bookkeeping and Pricing Services Agreement with the Trust.
The Funds’ administrative fee is accrued on a daily basis and paid monthly. The Administrator is also reimbursed by the Funds for certain out-of-pocket expenses. Administrative fees paid by the Funds for the six months ended October 31, 2023 are disclosed in the Statements of Operations.
Transfer Agent
ALPS serves as transfer, dividend paying and shareholder servicing agent for the Funds (“Transfer Agent”). ALPS is paid an annual base fee per Fund and a fee based on the number of shareholder accounts. The Transfer Agent is also reimbursed by the Funds for certain out-of-pocket expenses.
| Semi-annual Report – October 31, 2023 | 43 |
| Seafarer Funds | Notes to Financial Statements |
| | October 31, 2023 (Unaudited) |
Transfer agent fees paid by the Funds for the six months ended October 31, 2023 are disclosed in the Statements of Operations.
Compliance Services
ALPS provides compliance services to the Funds under the Chief Compliance Officer Services Agreement with the Trust. ALPS provides services that assist the Trust’s chief compliance officer in monitoring and testing the policies and procedures of the Trust in accordance with the requirements of Rule 38a-1 under the 1940 Act. ALPS is paid an annual base fee and is reimbursed for certain out-of-pocket expenses. Compliance service fees paid by the Funds for the six months ended October 31, 2023 are disclosed in the Statements of Operations.
Principal Financial Officer
ALPS provides principal financial officer services to the Funds under the Principal Financial Officer Services Agreement with the Trust. Under this Agreement, ALPS is paid an annual base fee and is reimbursed for certain out-of-pocket expenses. Principal financial officer fees paid by the Funds for the six months ended October 31, 2023 are disclosed in the Statements of Operations.
Distributor
ALPS Distributors, Inc. (“ADI” or the “Distributor”) (an affiliate of ALPS) acts as the distributor of the Funds’ shares pursuant to the Distribution Agreement with the Trust. Under a side letter agreement, the Adviser pays ADI an annual base fee per Fund for the distribution services. The Adviser also reimburses ADI for certain out-of-pocket expenses. Shares are sold on a continuous basis by ADI as agent for the Funds, and ADI has agreed to use its best efforts to solicit orders for the sale of the Funds’ shares, although it is not obliged to sell any particular amount of shares. ADI is registered as a broker-dealer with the U.S. Securities and Exchange Commission.
Shareholder Service Plan for Investor Class and Institutional Class Shares
Each Fund has adopted a Shareholder Services Plan (a “Services Plan”) for each of its share classes. Under the Services Plan, each Fund is authorized to enter into shareholder service agreements with investment advisers, financial institutions and other service providers (“Participating Organizations”) to maintain and provide certain administrative and servicing functions in relation to the accounts of shareholders. Shareholder service arrangements typically include processing orders for shares, generating account and confirmation statements, sub-accounting, account maintenance, tax reporting, and disbursing cash dividends as well as other investment or administrative services required for a particular Participating Organizations’ products, programs, platform and accounts. The Services Plan will cause each Fund to pay an aggregate fee, not to exceed on an annual basis 0.15% and 0.05% of the average daily net asset value of the Investor and Institutional share classes, respectively. Such payments will be made on assets attributable to or held in the name of a Participating Organization, on behalf of its clients as compensation for providing service activities pursuant to an agreement with the Participating Organization. Participating Organizations may charge less than the maximum fees described above, and therefore the Funds may pay less than those maximum fees. Shareholder Services Plan fees paid by the Funds for the six months ended October 31, 2023 are disclosed in the Statements of Operations.
Trustees
The fees and expenses of the Trustees of the Board are presented in the Statements of Operations.
8. Indemnifications
Under the Trust’s organizational documents, its officers and Trustees are indemnified against certain liability arising out of the performance of their duties to the Trust. Additionally, in the normal course of business, the Trust enters into contracts with service providers that may contain general indemnification clauses, which may permit indemnification to the extent permissible under the
| 44 | (855) 732-9220 seafarerfunds.com |
| Seafarer Funds | Notes to Financial Statements |
| | October 31, 2023 (Unaudited) |
applicable law. The Trust’s maximum exposure under these arrangements is unknown, as this would involve future claims that may be made against the Trust that have not yet occurred.
9. Subsequent Event
Subsequent events after the date of the Statements of Assets and Liabilities have been evaluated through the date the financial Statements were issued.
| Semi-annual Report – October 31, 2023 | 45 |
| Seafarer Funds | Additional Information |
| | October 31, 2023 (Unaudited) |
ADDITIONAL INFORMATION
1. Fund Holdings
The Funds file their complete schedule of portfolio holdings with the U.S. Securities and Exchange Commission for the first and third quarters of each fiscal year as an exhibit to their reports on Form N-PORT. The Funds’ Form N-PORT reports are available on the Commission’s Web site at www.sec.gov. The Funds’ Form N-PORT reports are also available upon request by calling toll-free (855) 732-9220.
2. Fund Proxy Voting Policies, Procedures and Summaries
The Funds’ policies and procedures used in determining how to vote proxies and information regarding how the Funds voted proxies relating to portfolio securities during the most recent prior 12-month period ended June 30 are available without charge, (1) upon request, by calling toll-free (855) 732-9220 and (2) on the SEC’s website at www.sec.gov.
3. Index Provider Disclosure
The Seafarer Funds are not sponsored, endorsed, sold, or promoted by Morningstar, Inc. Morningstar, Inc. makes no representation or warranty, express or implied, to the shareholders of the Funds or any member of the public regarding the advisability of investing in the Funds or the ability of the Morningstar Emerging Markets Net Return U.S. Dollar Index to track general equity market performance of emerging markets.
Source for Bloomberg Emerging Markets Large, Mid, and Small Cap Net Return USD Index: Bloomberg Index Services Limited. BLOOMBERG® is a trademark and service mark of Bloomberg Finance L.P. and its affiliates (collectively “Bloomberg”). Bloomberg or Bloomberg’s licensors own all proprietary rights in the Bloomberg Indices. Neither Bloomberg nor Bloomberg’s licensors approves or endorses this material, or guarantees the accuracy or completeness of any information herein, or makes any warranty, express or implied, as to the results to be obtained therefrom and, to the maximum extent allowed by law, neither shall have any liability or responsibility for injury or damages arising in connection therewith.
| 46 | (855) 732-9220 seafarerfunds.com |
| Seafarer Funds | Liquidity Risk Management Program |
| | October 31, 2023 (Unaudited) |
LIQUIDITY RISK MANAGEMENT PROGRAM
The Financial Investors Trust (the “Trust”) has established a liquidity risk management program (the “Program”) to govern the Trust’s approach to managing liquidity risk for each fund in the Trust (each a “Fund”). The Program is overseen by the Liquidity Committee (the “Committee”), a committee comprised of representatives of the Trust’s investment advisers, sub-advisers, and Officers of the Trust. The Trust’s Board of Trustees (the “Board”) has approved the designation of the Committee to oversee the Program.
The Program’s principal objectives include supporting each Fund’s compliance with limits on investments in illiquid assets and mitigating the risk that a Fund will be unable to meet its redemption obligations in a timely manner. The Program also includes a number of elements that support the management and assessment of liquidity risk, including a periodic assessment of factors that influence a Fund’s liquidity and the periodic classification and re-classification of the Fund’s investments into groupings that reflect the Committee’s assessment of their relative liquidity under current market conditions.
At a meeting of the Board held on June 13, 2023, the Trustees received a report from the Committee regarding the design and operational effectiveness of the Program during the calendar year 2022. The Committee determined, and reported to the Board, that the Program is reasonably designed to assess and manage each Fund’s liquidity risk and has operated adequately and effectively to manage each Fund’s liquidity risk since implementation.
The Committee reported that during the period covered by the report, there were no liquidity events that impacted the Funds or their ability to timely meet redemptions without dilution to existing shareholders. Among other things, the Board noted that the Funds are not required to have a highly liquid investment minimum based on their liquidity classifications. The Board further noted that no material changes have been made to the Program since its implementation.
| Semi-annual Report – October 31, 2023 | 47 |
| Seafarer Funds | Privacy Policy |
| | October 31, 2023 (Unaudited) |
| FACTS | WHAT DO THE FUNDS DO WITH YOUR PERSONAL INFORMATION? |
| Why? | Financial companies choose how they share your personal information. Federal law gives consumers the right to limit some but not all sharing. Federal law also requires us to tell you how we collect, share, and protect your personal information. Please read this notice carefully to understand what we do. |
| What? | The types of personal information we collect and share depend on the product or service you have with us. This information can include: |
| | ● Social Security number and account transactions |
| | ● Account balances and transaction history |
| | ● Wire transfer instructions |
| How? | All financial companies need to share customers’ personal information to run their everyday business. In the section below, we list the reasons financial companies can share their customers’ personal information; the reasons the Funds choose to share; and whether you can limit this sharing. |
| Reasons we can share your personal information | Do we share: | Can you limit this sharing? |
| For our everyday business purposes – such as to process your transactions, maintain your account(s), respond to court orders and legal investigations, or report to credit bureaus | Yes | No |
| For our marketing purposes – to offer our products and services to you | No | We do not share. |
| For joint marketing with other financial companies | No | We do not share. |
| For our affiliates’ everyday business purposes – information about your transactions and experiences | Yes | No |
| For our affiliates’ everyday business purposes – information about your creditworthiness | No | We do not share. |
| For nonaffiliates to market to you | No | We do not share. |
| 48 | (855) 732-9220 seafarerfunds.com |
| Seafarer Funds | Privacy Policy |
| | October 31, 2023 (Unaudited) |
| Who We Are | |
| Who is providing this notice? | Seafarer Overseas Growth and Income Fund and Seafarer Overseas Value Fund. |
| What We Do | |
| How do the Funds protect my personal information? | To protect your personal information from unauthorized access and use, we use security measures that comply with federal law. These measures include computer safeguards and secured files and buildings. |
| How do the Funds collect my personal information? | We collect your personal information, for example, when you |
| | ● | open an account |
| | ● | provide account information or give us your contact information |
| | ● | make a wire transfer or deposit money |
| Why can’t I limit all sharing? | Federal law gives you the right to limit only |
| | ● | sharing for affiliates’ everyday business purposes-information about your creditworthiness |
| | ● | affiliates from using your information to market to you |
| | ● | sharing for non-affiliates to market to you |
| | State laws and individual companies may give you additional rights to limit sharing. |
| Definitions | |
| Affiliates | Companies related by common ownership or control. They can be financial and nonfinancial companies. |
| Non-affiliates | Companies not related by common ownership or control. They can be financial and nonfinancial companies. |
| | ● | The Funds do not share with non-affiliates so they can market to you. |
| Joint marketing | A formal agreement between non-affiliated financial companies that together market financial products or services to you. |
| | ● | The Funds do not jointly market. |
| Other Important Information | |
| California Residents | If your account has a California home address, your personal information will not be disclosed to nonaffiliated third parties except as permitted by applicable California law, and we will limit sharing such personal information with our affiliates to comply with California privacy laws that apply to us. |
| Vermont Residents | The State of Vermont requires financial institutions to obtain your consent prior to sharing personal information that they collect about you with affiliated companies and nonaffiliated third parties other than in certain limited circumstances. Except as permitted by law, we will not share personal information we collect about you with nonaffiliated third parties or other affiliated companies unless you provide us with your written consent to share such information. |
| Semi-annual Report – October 31, 2023 | 49 |

Table of Contents
| Contents | Page |
| Shareholder Letter | 1 |
| Fund Overview | |
| Vulcan Value Partners Fund | 4 |
| Vulcan Value Partners Small Cap Fund | 7 |
| Disclosure of Fund Expenses | |
| Vulcan Value Partners Fund | 6 |
| Vulcan Value Partners Small Cap Fund | 9 |
| Statements of Investments | |
| Vulcan Value Partners Fund | 10 |
| Vulcan Value Partners Small Cap Fund | 13 |
| Statements of Assets and Liabilities | 16 |
| Statements of Operations | 17 |
| Statements of Changes in Net Assets | |
| Vulcan Value Partners Fund | 18 |
| Vulcan Value Partners Small Cap Fund | 19 |
| Financial Highlights | |
| Vulcan Value Partners Fund | 20 |
| Vulcan Value Partners Small Cap Fund | 24 |
| Notes to Financial Statements | 28 |
| Additional Information | 38 |
| Liquidity Risk Management Program | 39 |
| Privacy Policy | 40 |
| Shareholder Letter |
| October 31, 2023 (Unaudited) |
PORTFOLIO REVIEW
General
For the six months ended October 31, 2023, the Vulcan Value Partners Fund returned 1.26% and the Vulcan Value Partners Small Cap Fund returned -9.66%. As we have often said, we place no weight on short-term results, good or bad. When we think we can improve our prospective long-term returns and lower risk, we will make those decisions without regard to their effect on short-term performance.
Vulcan Value Partners Fund Review
In the discussion that follows, we highlight a few holdings in the Vulcan Value Partners Fund. There was one material contributor, Amazon.com Inc., and one material detractor, NICE Ltd., to performance during the six-month period ending October 31, 2023.
We purchased Fiserv Inc. during the period. Fiserv is a global payments solutions and financial services provider. Their business consists of three segments: merchant acceptance, payments processing, and core bank processing. Based on information from Fiserv, each of these segments provides essential products and services to it's customers. Fiserv’s products have high switching costs, which aids in customer retention and increases the stickiness of their revenues. Currently, the company is generating over $3 billion of free cash flow annually, allowing management to invest in research and development, opportunistic M&A, and returning cash to shareholders. We are pleased to have the opportunity to purchase this company at a discount to our estimate of intrinsic value.
We sold Lam Research Corp. during the period. Lam Research designs and manufactures equipment used in the fabrication of semiconductors. In our opinion, Lam is a wonderful business with great long-term prospects. We think the company has shown tremendous financial resilience against what is currently a challenging industry backdrop. After a significant increase in its stock price over the last year, our margin of safety narrowed. We followed our discipline and sold the Fund’s position to reallocate capital into businesses with larger discounts.
Amazon.com Inc. was a material contributor during the period. Despite slowing growth and macro headwinds, Amazon experienced revenue growth in all three segments: AWS, Advertising, and Retail. Amazon is also addressing its cost structure to better align with its slower growth rates. We believe Amazon is a dominant, world-class company with powerful secular tailwinds. It is our opinion that Amazon is executing well, and we are pleased to own it at a discount to our estimate of its intrinsic value.
NICE Ltd. was a material detractor during the period. NICE is a global enterprise software company that provides mission-critical contact center software. We believe that the contact center market’s competitive landscape is healthy. Few companies have a cloud product that satisfies the needs of a large enterprise contact center and the barriers to entry are high in terms of the time, capital, product breadth, depth, and quality required for a new entrant to gain traction in this market. We believe that generative A.I. will continue to drive cloud adoption and that A.I. is more of an opportunity than a threat to the business.
| Semi-Annual Report | October 31, 2023 | 1 |
| Shareholder Letter |
| October 31, 2023 (Unaudited) |
Vulcan Value Partners Small Cap Fund Review
In the discussion that follows, we highlight a few holdings in the Vulcan Value Partners Small Cap Fund. There were no material contributors and five materials detractors. The material detractors were Ibstock plc, Victoria plc, ISS A/S, Sealed Air Corp., and Cushman & Wakefield plc.
We purchased Genpact Ltd. during the period. Genpact is an IT services company that was spun out of General Electric several years ago. Genpact focuses on business process outsourcing (BPO) and technology digitalization markets. It has a diverse client base that is spread across multiple industries. Complexity within the IT space is growing rapidly, and we think Genpact plays an important role in helping customers navigate the complexity. The Fund has owned Genpact in the past and are happy to have the opportunity to own it once again.
During the period, we sold Forward Air. The company announced its decision to acquire Omni Logistics for an enterprise value of $3.2 billion. Based on information from the company, the transaction will significantly increase leverage at the pro forma company and will materially dilute existing shareholders. We also think that the transaction has questionable strategic rationale and significant execution risk. In sum, the transaction not only reduced our estimate of intrinsic value per share, but made that estimate unstable, leading to our decision to exit the position.
MillerKnoll Inc. was the largest contributor during the period. MillerKnoll is a designer and manufacturer of premium furniture for the office and home. While there continues to be a fair amount of uncertainty as it relates to the future of office, the company performed well during the quarter due to strong execution, cost containment, and an indication from management that a positive inflection point in demand is in its sights. We continue to favor the quality of MillerKnoll’s collection of brands, its multi-channel distribution model, and its experienced management team.
ISS A/S was a material detractor during the period. ISS is a facilities management company based in Denmark specializing in services that are non-core to their customers such as cleaning, food management, building maintenance, security, technical support, and other services. During the quarter, the CFO, Kasper Fangel, became the CEO. The prior CEO left to become CEO at the much larger brewer Carlsberg Group. The company also announced its plans to exit its struggling French operations. We believe ISS has global scale to service multinational accounts and is benefitting from the trend of companies outsourcing non-core functions. In our opinion, the company has stable operating margins due to the inherent nature of its business contracts which allow it to pass through wage and other cost increases to its customers.
Closing
We appreciate the opportunity to work with you, our client partners. We continue to follow our discipline and lay the building blocks for future compounding. We look forward to updating you again soon.
C.T. Fitzpatrick
Chief Investment Officer
Vulcan Value Partners, LLC
| 2 | www.vulcanvaluepartners.com |
| Shareholder Letter |
| October 31, 2023 (Unaudited) |
Past performance does not guarantee future results. The Funds’ prices fluctuate as the underlying assets have exposure to market fluctuations and other risks, as described in the Funds’ prospectus. Please call 877.421.5078 to obtain current performance information and for the current prospectus and statement of additional information. This material must be preceded or accompanied by a prospectus. Please read the prospectus carefully before investing.
The views of the Vulcan Value Partners, LLC and information discussed in this commentary are as of the date of publication, are subject to change, and may not reflect the writer's current views. The views expressed represent an assessment of market conditions at a specific point in time, are opinions only and should not be relied upon as investment advice regarding a particular investment or markets in general. Such information does not constitute a recommendation to buy or sell specific securities or investment vehicles. It should not be assumed that any investment will be profitable or will equal the performance of the Funds or any securities or any sectors mentioned in this letter. The subject matter contained in this letter has been derived from several sources believed to be reliable and accurate at the time of compilation. Neither Vulcan Value Partners, LLC nor the Funds accept any liability for losses either direct or consequential caused by the use of this information.
The Funds are distributed by ALPS Distributors, Inc.
The Funds are subject to investment risks, including possible loss of the principal amount invested and therefore is not suitable for all investors. The Funds may not achieve their objectives.
Margin of Safety is a favorable difference between the price of a company’s shares and the estimated fair value of those shares.
An investor should consider investment objectives, risks, charges, and expenses carefully before investing. To obtain a prospectus, containing this and other information, visit https: //vulcanvaluepartners.com/mutual-funds/ or call 1.877.421.5078. Please read carefully before investing.
| Semi-Annual Report | October 31, 2023 | 3 |
| Fund Overview |
| October 31, 2023 (Unaudited) |
VULCAN VALUE PARTNERS FUND
Annualized Total Returns (as of October 31, 2023)
| | | | | | | | Expense Ratios(1) |
| | 6 Month | 1 Year | 3 Year | 5 Year | 10 Year | Since
Inception* | Total | Net(2) |
| Vulcan Value Partners Fund - Investor Class Shares(3) | 1.26% | 16.16% | 1.03% | 4.97% | 6.43% | 9.16% | 1.08% | 1.08% |
| Vulcan Value Partners Fund - Institutional Class Shares | 1.36% | 16.42% | 1.25% | – | – | 3.67% | 1.13% | 0.85% |
| S&P 500® Total Return Index(4) | 1.39% | 10.14% | 10.36% | 11.01% | 11.18% | 12.13% | | |
| Russell 1000® Value Index(5) | (4.22%) | 0.13% | 10.21% | 6.60% | 7.60% | 9.54% | | |
Performance data quoted represents past performance. Past performance does not guarantee future results. Investment return and principal value of an investment will fluctuate so that an investor’s shares, when sold or redeemed, may be worth more or less than the original cost. Current performance data may be higher or lower than actual data quoted. For the most current month-end performance data, please call 1.877-421-5078.
The table does not reflect the deduction of taxes that a shareholder would pay on Fund distributions or the redemption of Fund shares.
Subject to investment risks, including possible loss of the principal amount invested.
Returns for periods less than 1 year are cumulative.
| * | Inception Dates – Investor Class Shares: December 30, 2009, Institutional Class Shares: May 1, 2019 |
| (1) | Ratios as of the Prospectus dated August 31, 2023 and may differ from the ratios presented in the Financial Highlights. |
| (2) | Vulcan Value Partners, LLC (“Vulcan” or the “Adviser”) has contractually agreed to limit the Fund’s total annual fund operating expenses (exclusive of Acquired Fund Fees and Expenses, brokerage expenses, interest expense, taxes and extraordinary expenses) to 1.25% and 0.85% of the Fund’s average daily net assets with respect to Investor Class shares and Institutional Class shares, respectively. This agreement (the “Expense Agreement”) is in effect through August 31, 2024. The Adviser will be permitted to recapture expenses it has borne through the Expense Agreements to the extent that the Fund's expenses in later periods fall below the annual rates set forth in the Expense Agreements or in previous letter agreements; provided, however, that such recapture payments do not cause the Fund's expense ratio (after recapture) to exceed the lesser of (i) the expense cap in effect at the time of the waiver and (ii) the expense cap in effect at the time of the recapture. Notwithstanding the foregoing, the Fund will not be obligated to pay any such deferred fees and expenses more than three years after the date on which the fee and expenses were deferred. The Adviser may not discontinue or modify this waiver prior to August 31, 2024, without the approval by the Fund's Board of Trustees. |
| (3) | The initial share class of the Fund was redesignated as Investor Class shares effective April 23, 2019. |
| (4) | The S&P 500® Total Return Index is an unmanaged index of 500 common stocks chosen for market size, liquidity and industry group representation. It is a market-value weighted index. The Index is not actively managed and does not reflect any deductions for fees, expenses or taxes. An investor may not invest directly in the Index. |
| (5) | The Russell 1000® Value Index is presented here as an additional index, and measures the performance of the large-cap value segment of the U.S. equity universe. It includes those Russell 1000® companies with lower price-to-book ratios and lower expected growth values. The Index is not actively managed and does not reflect any deductions for fees, expenses or taxes. An investor may not invest directly in the Index. |
| 4 | www.vulcanvaluepartners.com |
| Fund Overview |
| October 31, 2023 (Unaudited) |
Growth of $10,000 Initial Investment (for the period ended October 31, 2023)

The chart above represents historical performance of a hypothetical investment of $10,000 in the Fund since inception. Past performance does not guarantee future results. This chart does not reflect the deduction of taxes that a shareholder would pay on Fund distributions or the redemption of Fund shares.
Investing in the Fund is subject to investment risks, including possible loss of the principal amount invested.
Industry Allocation (as a % of Net Assets)*
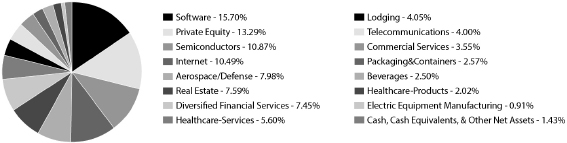
Top Ten Holdings (as a % of Net Assets)*
| Amazon.com, Inc. | 5.64% |
| TransDigm Group, Inc. | 4.98% |
| Microsoft Corp. | 4.94% |
| Alphabet, Inc. | 4.85% |
| Carlyle Group, Inc. | 4.82% |
| Jones Lang LaSalle, Inc. | 4.66% |
| Salesforce, Inc. | 4.57% |
| KKR & Co., Inc. | 4.54% |
| Elevance Health, Inc. | 4.21% |
| Qorvo, Inc. | 4.05% |
| Top Ten Holdings | 47.26% |
| * | Holdings are subject to change, and may not reflect the current or future position of the portfolio. |
| Semi-Annual Report | October 31, 2023 | 5 |
| Disclosure of Fund Expenses |
| October 31, 2023 (Unaudited) |
As a shareholder of the Vulcan Value Partners Fund (the “Fund”), you will incur two types of costs: (1) transaction costs, and (2) ongoing costs, including management fees and other fund operating expenses. The following examples are intended to help you understand your ongoing costs (in dollars) of investing in the Fund and to compare these costs with the ongoing costs of investing in other mutual funds. The examples are based on an investment of $1,000 invested on May 1, 2023 and held until October 31, 2023.
Actual Expenses. The first line of each table below provides information about actual account values and actual expenses. You may use the information in this line, together with the amount you invested, to estimate the expenses that you paid over the period. Simply divide your account value by $1,000 (for example, an $8,600 account value divided by $1,000 = 8.6), then multiply the result by the number in the first line under the heading “Expenses Paid During Period” to estimate the expenses you paid on your account during this period.
Hypothetical Example for Comparison Purposes. The second line of the table below provides information about hypothetical account values and hypothetical expenses based on the Fund’s actual expense ratio and an assumed rate of return of 5% per year before expenses, which is not the Fund’s actual return. The hypothetical account values and expenses may not be used to estimate the actual ending account balance or expenses you paid for the period. You may use this information to compare the ongoing costs of investing in the Fund and other mutual funds. To do so, compare this 5% hypothetical example with the 5% hypothetical examples that appear in the shareholder reports of the other mutual funds.
Please note the expenses shown in the table are meant to highlight ongoing Fund costs only and do not reflect transactional costs, such as redemption fees or exchange fees. Therefore, the second line of the table below is useful in comparing your ongoing costs only, and will not help you determine the relative total costs of owning different funds. In addition, if these transactional costs were included, your costs would have been higher.
Vulcan Value Partners Fund
| | | Beginning Account
Value
5/1/23 | | | Ending Account
Value
10/31/23 | | | Expense
Ratio(a) | | Expenses Paid
During period
5/1/23 - 10/31/23(b) | |
| Investor Class | | | | | | | | | | | | | | |
| Actual | | $ | 1,000.00 | | | $ | 1,012.60 | | | 1.08% | | $ | 5.48 | |
| Hypothetical (5% return before expenses) | | $ | 1,000.00 | | | $ | 1,019.76 | | | 1.08% | | $ | 5.50 | |
| Institutional Class | | | | | | | | | | | | | | |
| Actual | | $ | 1,000.00 | | | $ | 1,013.60 | | | 0.85% | | $ | 4.31 | |
| Hypothetical (5% return before expenses) | | $ | 1,000.00 | | | $ | 1,020.92 | | | 0.85% | | $ | 4.33 | |
| (a) | The Fund's expense ratios have been annualized based on the Fund's most recent fiscal half-year expenses. |
| (b) | Expenses are equal to the Fund's annualized expense ratio multiplied by the average account value over the period, multiplied by the number of days in the most recent fiscal half-year (184)/366 (to reflect the half-year period). |
| 6 | www.vulcanvaluepartners.com |
| Fund Overview |
| October 31, 2023 (Unaudited) |
VULCAN VALUE PARTNERS SMALL CAP FUND
Annualized Total Returns (as of October 31, 2023)
| | | | | | | | Expense Ratios(1) |
| | 6 Month | 1 Year | 3 Year | 5 Year | 10 Year | Since
Inception* | Total | Net(2) |
| Vulcan Value Partners Small Cap Fund – Investor Class Shares(3) | (9.66%) | (2.86%) | 1.10% | (1.11%) | 1.84% | 6.87% | 1.26% | 1.25% |
| Vulcan Value Partners Small Cap Fund – Institutional Class Shares | (9.55%) | (2.63%) | 1.36% | – | – | (3.61%) | 1.31% | 1.00% |
| Russell 2000® Value Index(4) | (3.44%) | (9.93%) | 9.73% | 3.26% | 5.20% | 7.97% | | |
| Russell 2000® Index(5) | (5.29%) | (8.57%) | 3.95% | 3.31% | 5.63% | 8.68% | | |
Performance data quoted represents past performance. Past performance does not guarantee future results. Investment return and principal value of an investment will fluctuate so that an investor’s shares, when sold or redeemed, may be worth more or less than the original cost. Current performance data may be higher or lower than actual data quoted. For the most current month-end performance data, please call 1.877-421-5078.
The table does not reflect the deduction of taxes that a shareholder would pay on Fund distributions or the redemption of Fund shares.
Subject to investment risks, including possible loss of the principal amount invested.
Returns for periods less than 1 year are cumulative.
| * | Inception Dates – Investor Class Shares: December 30, 2009, Institutional Class Shares: May 1, 2019 |
| (1) | Ratios as of the Prospectus dated August 31, 2023 and may differ from the ratios presented in the Financial Highlights. |
| (2) | Vulcan Value Partners, LLC (“Vulcan” or the “Adviser”) has contractually agreed to limit the Fund’s total annual fund operating expenses (exclusive of Acquired Fund Fees and Expenses, brokerage expenses, interest expense, taxes and extraordinary expenses) to 1.25% and 1.00% of the Fund’s average daily net assets with respect to Investor Class shares and Institutional Class shares, respectively. This agreement (the “Expense Agreement”) is in effect through August 31, 2024. The Adviser will be permitted to recapture expenses it has borne through the Expense Agreements to the extent that the Fund's expenses in later periods fall below the annual rates set forth in the Expense Agreements or in previous letter agreements; provided, however, that such recapture payments do not cause the Fund's expense ratio (after recapture) to exceed the lesser of (i) the expense cap in effect at the time of the waiver and (ii) the expense cap in effect at the time of the recapture. Notwithstanding the foregoing, the Fund will not be obligated to pay any such deferred fees and expenses more than three years after the date on which the fee and expenses were deferred. The Adviser may not discontinue or modify this waiver prior to August 31, 2024 without the approval by the Fund's Board of Trustees. |
| (3) | The initial share class of the Fund was redesignated as Investor Class shares effective April 23, 2019. |
| (4) | The Russell 2000® Value Index is presented here as the primary index, and measures the performance of small-cap value segment of the U.S.equity universe. It includes those Russell 2000® companies with lower price-to-book ratios and lower forecasted growth values. The Index is not actively managed and does not reflect any deductions for fees, expenses or taxes. An investor may not invest directly in the Index. |
| (5) | The Russell 2000® Index is presented here as an additional index, and measures the performance of the small-cap segment of the U.S. equity universe. The Russell 2000® Index is a subset of the Russell 3000® Index representing approximately 8% of the total market capitalization of that index. It includes approximately 2,000 of the smallest securities based on a combination of their market cap and current index membership. The Index is not actively managed and does not reflect any deductions for fees, expenses or taxes. An investor may not invest directly in the Index. |
| Semi-Annual Report | October 31, 2023 | 7 |
| Fund Overview |
| October 31, 2023 (Unaudited) |
Growth of $10,000 Initial Investment (for the period ended October 31, 2023)
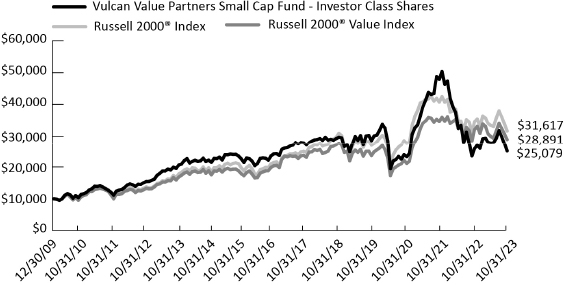
The chart above represents historical performance of a hypothetical investment of $10,000 in the Fund since inception. Past performance does not guarantee future results. This chart does not reflect the deduction of taxes that a shareholder would pay on Fund distributions or the redemption of Fund shares.
Investing in the Fund is subject to investment risks, including possible loss of the principal amount invested.
Industry Allocation (as a % of Net Assets)*
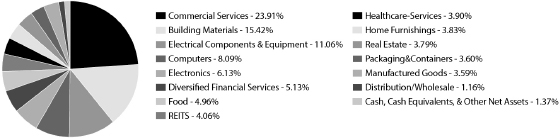
Top Ten Holdings (as a % of Net Assets)*
| Ituran Location and Control, Ltd. | 6.13% |
| Ibstock PLC | 5.36% |
| Virtus Investment Partners, Inc. | 5.13% |
| Premium Brands Holdings Corp. | 4.96% |
| Littelfuse, Inc. | 4.95% |
| Colliers International Group, Inc. | 4.83% |
| ABM Industries, Inc. | 4.67% |
| ISS A/S | 4.40% |
| Park Hotels & Resorts, Inc. | 4.06% |
| Genpact, Ltd. | 4.05% |
| Top Ten Holdings | 48.54% |
| * | Holdings are subject to change, and may not reflect the current or future position of the portfolio. |
| 8 | www.vulcanvaluepartners.com |
| Disclosure of Fund Expenses |
| October 31, 2023 (Unaudited) |
As a shareholder of the Vulcan Value Partners Small Cap Fund (the “Fund”), you will incur two types of costs: (1) transaction costs, and (2) ongoing costs, including management fees and other fund operating expenses. The following examples are intended to help you understand your ongoing costs (in dollars) of investing in the Fund and to compare these costs with the ongoing costs of investing in other mutual funds. The examples are based on an investment of $1,000 invested on May 1, 2023 and held until October 31, 2023.
Actual Expenses. The first line of each table below provides information about actual account values and actual expenses. You may use the information in this line, together with the amount you invested, to estimate the expenses that you paid over the period. Simply divide your account value by $1,000 (for example, an $8,600 account value divided by $1,000 = 8.6), then multiply the result by the number in the first line under the heading “Expenses Paid During Period” to estimate the expenses you paid on your account during this period.
Hypothetical Example for Comparison Purposes. The second line of the table below provides information about hypothetical account values and hypothetical expenses based on the Fund’s actual expense ratio and an assumed rate of return of 5% per year before expenses, which is not the Fund’s actual return. The hypothetical account values and expenses may not be used to estimate the actual ending account balance or expenses you paid for the period. You may use this information to compare the ongoing costs of investing in the Fund and other mutual funds. To do so, compare this 5% hypothetical example with the 5% hypothetical examples that appear in the shareholder reports of the other mutual funds.
Please note the expenses shown in the table are meant to highlight ongoing Fund costs only and do not reflect transactional costs, such as redemption fees or exchange fees. Therefore, the second line of the table below is useful in comparing your ongoing costs only, and will not help you determine the relative total costs of owning different funds. In addition, if these transactional costs were included, your costs would have been higher.
Vulcan Value Partners Small Cap Fund
| | | Beginning Account
Value
5/1/23 | | | Ending Account
Value
10/31/23 | | | Expense
Ratio(a) | | Expenses Paid
During period
5/1/23 - 10/31/23(b) | |
| Investor Class | | | | | | | | | | | | | | |
| Actual | | $ | 1,000.00 | | | $ | 903.40 | | | 1.25% | | $ | 6.00 | |
| Hypothetical (5% return before expenses) | | $ | 1,000.00 | | | $ | 1,018.90 | | | 1.25% | | $ | 6.36 | |
| Institutional Class | | | | | | | | | | | | | | |
| Actual | | $ | 1,000.00 | | | $ | 904.50 | | | 1.00% | | $ | 4.80 | |
| Hypothetical (5% return before expenses) | | $ | 1,000.00 | | | $ | 1,020.16 | | | 1.00% | | $ | 5.09 | |
| (a) | The Fund's expense ratios have been annualized based on the Fund's most recent fiscal half-year expenses. |
| (b) | Expenses are equal to the Fund's annualized expense ratio multiplied by the average account value over the period, multiplied by the number of days in the most recent fiscal half-year (184)/366 (to reflect the half-year period). |
| Semi-Annual Report | October 31, 2023 | 9 |
| Statement of Investments | Vulcan Value Partners Fund |
| October 31, 2023 (Unaudited) |
| | | Shares | | | Value (Note 2) | |
| COMMON STOCKS (98.57%) | | | | | | | | |
| Communications (14.49%) | | | | | | | | |
| Internet (10.49%) | | | | | | | | |
| Alphabet, Inc., Class C(a) | | | 261,663 | | | $ | 32,786,374 | |
| Amazon.com, Inc.(a) | | | 286,454 | | | | 38,124,163 | |
| | | | | | | | 70,910,537 | |
| Telecommunications (4.00%) | | | | | | | | |
| Nice, Ltd. | | | 175,230 | | | | 27,046,750 | |
| | | | | | | | | |
| TOTAL COMMUNICATIONS | | | | | | | 97,957,287 | |
| | | | | | | | | |
| Consumer, Cyclical (4.05%) | | | | | | | | |
| Lodging (4.05%) | | | | | | | | |
| InterContinental Hotels Group PLC, ADR | | | 189,244 | | | | 13,650,170 | |
| Marriott International, Inc., Class A | | | 72,680 | | | | 13,704,541 | |
| | | | | | | | 27,354,711 | |
| | | | | | | | | |
| TOTAL CONSUMER, CYCLICAL | | | | | | | 27,354,711 | |
| | | | | | | | | |
| Consumer, Non-cyclical (13.67%) | | | | | | | | |
| Beverages (2.50%) | | | | | | | | |
| Diageo PLC | | | 447,437 | | | | 16,897,036 | |
| | | | | | | | | |
| Commercial Services (3.55%) | | | | | | | | |
| CoStar Group, Inc.(a) | | | 326,912 | | | | 23,998,610 | |
| | | | | | | | | |
| Healthcare-Products (2.02%) | | | | | | | | |
| Abbott Laboratories | | | 144,405 | | | | 13,653,493 | |
| | | | | | | | | |
| Healthcare-Services (5.60%) | | | | | | | | |
| Elevance Health, Inc. | | | 63,270 | | | | 28,477,194 | |
| UnitedHealth Group, Inc. | | | 17,584 | | | | 9,417,287 | |
| | | | | | | | 37,894,481 | |
| | | | | | | | | |
| TOTAL CONSUMER, NON-CYCLICAL | | | | | | | 92,443,620 | |
| | | | | | | | | |
| Financial (28.33%) | | | | | | | | |
| Diversified Financial Services (7.45%) | | | | | | | | |
| Mastercard, Inc., Class A | | | 62,840 | | | | 23,649,834 | |
| Visa, Inc., Class A | | | 113,822 | | | | 26,759,552 | |
| | | | | | | | 50,409,386 | |
| | | | | | | | | |
| Private Equity (13.29%) | | | | | | | | |
| Ares Management Corp., Class A | | | 269,811 | | | | 26,600,667 | |
| Carlyle Group, Inc. | | | 1,182,247 | | | | 32,559,083 | |
| 10 | www.vulcanvaluepartners.com |
| Vulcan Value Partners Fund | Statement of Investments |
| | October 31, 2023 (Unaudited) |
| | | Shares | | | Value (Note 2) | |
| Financial (continued) | | | | | | | | |
| Private Equity (continued) | | | | | | | | |
| KKR & Co., Inc., Class A | | | 553,555 | | | $ | 30,666,947 | |
| | | | | | | | 89,826,697 | |
| | | | | | | | | |
| Real Estate (7.59%) | | | | | | | | |
| CBRE Group, Inc., Class A(a) | | | 285,522 | | | | 19,798,096 | |
| Jones Lang LaSalle, Inc.(a) | | | 246,344 | | | | 31,512,324 | |
| | | | | | | | 51,310,420 | |
| | | | | | | | | |
| TOTAL FINANCIAL | | | | | | | 191,546,503 | |
| | | | | | | | | |
| Industrial (11.46%) | | | | | | | | |
| Aerospace/Defense (7.98%) | | | | | | | | |
| HEICO Corp., Class A | | | 159,247 | | | | 20,245,071 | |
| TransDigm Group, Inc. | | | 40,697 | | | | 33,700,779 | |
| | | | | | | | 53,945,850 | |
| | | | | | | | | |
| Electric Equipment Manufacturing (0.91%) | | | | | | | | |
| General Electric Co. | | | 56,726 | | | | 6,162,145 | |
| | | | | | | | | |
| Packaging&Containers (2.57%) | | | | | | | | |
| Ball Corp. | | | 361,335 | | | | 17,398,280 | |
| | | | | | | | | |
| TOTAL INDUSTRIAL | | | | | | | 77,506,275 | |
| | | | | | | | | |
| Technology (26.57%) | | | | | | | | |
| Semiconductors (10.87%) | | | | | | | | |
| Applied Materials, Inc. | | | 78,759 | | | | 10,423,754 | |
| Qorvo, Inc.(a) | | | 313,053 | | | | 27,367,093 | |
| Skyworks Solutions, Inc. | | | 297,780 | | | | 25,829,437 | |
| Texas Instruments, Inc. | | | 69,206 | | | | 9,827,944 | |
| | | | | | | | 73,448,228 | |
| | | | | | | | | |
| Software (15.70%) | | | | | | | | |
| Fiserv, Inc.(a) | | | 154,233 | | | | 17,544,004 | |
| Microsoft Corp. | | | 98,817 | | | | 33,411,016 | |
| Salesforce, Inc.(a) | | | 153,941 | | | | 30,915,971 | |
| SS&C Technologies Holdings, Inc. | | | 483,177 | | | | 24,279,644 | |
| | | | | | | | 106,150,635 | |
| | | | | | | | | |
| TOTAL TECHNOLOGY | | | | | | | 179,598,863 | |
| | | | | | | | | |
| TOTAL COMMON STOCKS | | | | | | | | |
| (Cost $542,394,168) | | | | | | | 666,407,259 | |
| Semi-Annual Report | October 31, 2023 | 11 |
| Statement of Investments | Vulcan Value Partners Fund |
| October 31, 2023 (Unaudited) | |
| | | 7-Day Yield | | | Shares | | | Value (Note 2) | |
| SHORT TERM INVESTMENTS (1.14%) | | | | | | | | | | | | |
| Money Market Fund (1.14%) | | | | | | | | | | | | |
| Invesco Government & Agency Portfolio, Institutional Class | | | 2.260 | % | | | 7,687,208 | | | $ | 7,687,208 | |
| | | | | | | | | | | | | |
| TOTAL SHORT TERM INVESTMENTS | | | | | | | | | | | | |
| (Cost $7,687,208) | | | | | | | | | | | 7,687,208 | |
| | | | | | | | | | | | | |
| TOTAL INVESTMENTS (99.71%) | | | | | | | | | | | | |
| (Cost $550,081,376) | | | | | | | | | | $ | 674,094,467 | |
| | | | | | | | | | | | | |
| Other Assets In Excess Of Liabilities (0.29%) | | | | | | | | | | | 1,957,179 | |
| | | | | | | | | | | | | |
| NET ASSETS (100.00%) | | | | | | | | | | $ | 676,051,646 | |
| (a) | Non-Income Producing Security. |
For Fund compliance purposes, the Fund's industry classifications refer to any one or more of the industry sub-classifications used by one or more widely recognized market indexes or ratings group indexes, and/or as defined by Fund management. This definition may not apply for purposes of this report, which may combine industry sub-classifications for reporting ease. Industries are shown as a percentage of net assets.
See Accompanying Notes to Financial Statements.
| 12 | www.vulcanvaluepartners.com |
| Vulcan Value Partners Small Cap Fund | Statement of Investments |
| | October 31, 2023 (Unaudited) |
| | | Shares | | | Value (Note 2) | |
| COMMON STOCKS (98.63%) | | | | | | | | |
| Consumer, Cyclical (4.99%) | | | | | | | | |
| Distribution/Wholesale (1.16%) | | | | | | | | |
| Core & Main, Inc.(a) | | | 123,976 | | | $ | 3,729,198 | |
| | | | | | | | | |
| Home Furnishings (3.83%) | | | | | | | | |
| MillerKnoll, Inc. | | | 525,632 | | | | 12,352,352 | |
| | | | | | | | | |
| TOTAL CONSUMER, CYCLICAL | | | | | | | 16,081,550 | |
| | | | | | | | | |
| Consumer, Non-cyclical (32.77%) | | | | | | | | |
| Commercial Services (23.91%) | | | | | | | | |
| ABM Industries, Inc. | | | 383,038 | | | | 15,068,715 | |
| Colliers International Group, Inc. | | | 171,897 | | | | 15,596,215 | |
| Dun & Bradstreet Corp. | | | 1,478,802 | | | | 12,954,305 | |
| ISS A/S | | | 980,526 | | | | 14,178,792 | |
| PROG Holdings, Inc.(a) | | | 408,557 | | | | 11,190,376 | |
| Savills PLC | | | 849,306 | | | | 8,129,281 | |
| | | | | | | | 77,117,684 | |
| | | | | | | | | |
| Food (4.96%) | | | | | | | | |
| Premium Brands Holdings Corp. | | | 248,653 | | | | 16,008,466 | |
| | | | | | | | | |
| Healthcare-Services (3.90%) | | | | | | | | |
| Medpace Holdings, Inc.(a) | | | 51,872 | | | | 12,587,778 | |
| | | | | | | | | |
| TOTAL CONSUMER, NON-CYCLICAL | | | | | | | 105,713,928 | |
| | | | | | | | | |
| Financial (12.98%) | | | | | | | | |
| Diversified Financial Services (5.13%) | | | | | | | | |
| Virtus Investment Partners, Inc. | | | 89,891 | | | | 16,560,619 | |
| | | | | | | | | |
| Real Estate (3.79%) | | | | | | | | |
| Cushman & Wakefield PLC(a) | | | 1,657,692 | | | | 12,217,190 | |
| | | | | | | | | |
| REITS (4.06%) | | | | | | | | |
| Park Hotels & Resorts, Inc. | | | 1,136,649 | | | | 13,105,563 | |
| | | | | | | | | |
| TOTAL FINANCIAL | | | | | | | 41,883,372 | |
| | | | | | | | | |
| Industrial (39.80%) | | | | | | | | |
| Building Materials (15.42%) | | | | | | | | |
| Forterra PLC(b) | | | 6,033,461 | | | | 9,870,723 | |
| Ibstock PLC(b) | | | 11,603,046 | | | | 17,276,091 | |
| SmartRent, Inc.(a) | | | 5,329,207 | | | | 12,843,389 | |
| Semi-Annual Report | October 31, 2023 | 13 |
| Statement of Investments | Vulcan Value Partners Small Cap Fund |
| October 31, 2023 (Unaudited) | |
| | | Shares | | | Value (Note 2) | |
| Industrial (continued) | | | | | | | | |
| Building Materials (continued) | | | | | | | | |
| Victoria PLC(a) | | | 2,494,765 | | | $ | 9,763,891 | |
| | | | | | | | 49,754,094 | |
| | | | | | | | | |
| Electrical Components & Equipment (11.06%) | | | | | | | | |
| Acuity Brands, Inc. | | | 62,962 | | | | 10,197,955 | |
| EnerSys | | | 111,239 | | | | 9,519,834 | |
| Littelfuse, Inc. | | | 73,625 | | | | 15,952,329 | |
| | | | | | | | 35,670,118 | |
| | | | | | | | | |
| Electronics (6.13%) | | | | | | | | |
| Ituran Location and Control, Ltd. | | | 799,243 | | | | 19,765,279 | |
| | | | | | | | | |
| Manufactured Goods (3.59%) | | | | | | | | |
| Timken Co. | | | 167,565 | | | | 11,582,093 | |
| | | | | | | | | |
| Packaging&Containers (3.60%) | | | | | | | | |
| Sealed Air Corp. | | | 377,399 | | | | 11,620,115 | |
| | | | | | | | | |
| TOTAL INDUSTRIAL | | | | | | | 128,391,699 | |
| | | | | | | | | |
| Technology (8.09%) | | | | | | | | |
| Computers (8.09%) | | | | | | | | |
| Genpact, Ltd. | | | 389,390 | | | | 13,060,141 | |
| Sdiptech AB, Class B(a) | | | 665,388 | | | | 13,030,635 | |
| | | | | | | | 26,090,776 | |
| | | | | | | | | |
| TOTAL TECHNOLOGY | | | | | | | 26,090,776 | |
| | | | | | | | | |
| TOTAL COMMON STOCKS | | | | | | | | |
| (Cost $375,291,446) | | | | | | | 318,161,325 | |
| 14 | www.vulcanvaluepartners.com |
| Vulcan Value Partners Small Cap Fund | Statement of Investments |
| | October 31, 2023 (Unaudited) |
| | | 7-Day Yield | | | Shares | | | Value (Note 2) | |
| SHORT TERM INVESTMENTS (1.22%) | | | | | | | | | | | | |
| Money Market Fund (1.22%) | | | | | | | | | | | | |
| Invesco Government & Agency Portfolio, Institutional Class | | | 2.260 | % | | | 3,944,556 | | | $ | 3,944,556 | |
| | | | | | | | | | | | | |
| TOTAL SHORT TERM INVESTMENTS | | | | | | | | | | | | |
| (Cost $3,944,556) | | | | | | | | | | | 3,944,556 | |
| | | | | | | | | | | | | |
| TOTAL INVESTMENTS (99.85%) | | | | | | | | | | | | |
| (Cost $379,236,002) | | | | | | | | | | $ | 322,105,881 | |
| | | | | | | | | | | | | |
| Other Assets In Excess Of Liabilities (0.15%) | | | | | | | | | | | 485,010 | |
| | | | | | | | | | | | | |
| NET ASSETS (100.00%) | | | | | | | | | | $ | 322,590,891 | |
| (a) | Non-Income Producing Security. |
| (b) | Securities exempt from registration under Rule 144A of the Securities Act of 1933. These securities are not restricted and may normally be sold to qualified institutional buyers in transactions exempt from registration. Total fair value of Rule 144A securities amounts to $27,146,814, which represents 8.42% of net assets as of October 31, 2023. |
For Fund compliance purposes, the Fund's industry classifications refer to any one or more of the industry sub-classifications used by one or more widely recognized market indexes or ratings group indexes, and/or as defined by Fund management. This definition may not apply for purposes of this report, which may combine industry sub-classifications for reporting ease. Industries are shown as a percentage of net assets.
See Accompanying Notes to Financial Statements.
| Semi-Annual Report | October 31, 2023 | 15 |
| Statements of Assets and Liabilities |
| October 31, 2023 (Unaudited) |
| | | Vulcan Value Partners
Fund | | | Vulcan Value Partners
Small Cap Fund | |
| ASSETS: | | | | | | | | |
| Investments, at value | | $ | 674,094,467 | | | $ | 322,105,881 | |
| Receivable for investments sold | | | 1,061,841 | | | | 461,646 | |
| Receivable for shares sold | | | 1,024,254 | | | | 71,478 | |
| Dividends receivable | | | 333,870 | | | | 315,845 | |
| Other assets | | | 16,225 | | | | 35,649 | |
| Total assets | | | 676,530,657 | | | | 322,990,499 | |
| | | | | | | | | |
| LIABILITIES: | | | | | | | | |
| Payable for shares redeemed | | | 217,853 | | | | 74,998 | |
| Payable to adviser | | | 161,652 | | | | 261,060 | |
| Payable for administration fees | | | 21,296 | | | | 11,705 | |
| Payable for transfer agency fees | | | 26,897 | | | | 33,161 | |
| Payable for delegated transfer agent equivalent services fees | | | 3,124 | | | | 2,942 | |
| Payable for professional fees | | | 17,252 | | | | 14,449 | |
| Payable for trustee fees and expenses | | | 28,527 | | | | 503 | |
| Payable for principal financial officer fees | | | 2,410 | | | | 790 | |
| Total liabilities | | | 479,011 | | | | 399,608 | |
| NET ASSETS | | $ | 676,051,646 | | | $ | 322,590,891 | |
| | | | | | | | | |
| NET ASSETS CONSIST OF: | | | | | | | | |
| | | | | | | | | |
| Paid-in capital (Note 5) | | $ | 809,846,113 | | | $ | 769,452,749 | |
| Total distributable earnings | | | (133,794,467 | ) | | | (446,861,858 | ) |
| NET ASSETS | | $ | 676,051,646 | | | $ | 322,590,891 | |
| | | | | | | | | |
| INVESTMENTS, AT COST | | $ | 550,081,376 | | | $ | 379,236,002 | |
| | | | | | | | | |
| PRICING OF SHARES: | | | | | | | | |
| Investor Class: | | | | | | | | |
| Net Asset Value, offering and redemption price per share | | $ | 19.25 | | | $ | 9.82 | |
| Net Assets | | $ | 198,874,284 | | | $ | 47,512,766 | |
| Shares of beneficial interest outstanding (unlimited number of shares, no par value common stock authorized) | | | 10,328,701 | | | | 4,836,301 | |
| Institutional Class: | | | | | | | | |
| Net Asset Value, offering and redemption price per share | | | 19.41 | | | | 9.94 | |
| Net Assets | | | 477,177,363 | | | | 275,078,125 | |
| Shares of beneficial interest outstanding (unlimited number of shares, no par value common stock authorized) | | | 24,577,878 | | | | 27,667,474 | |
| See Accompanying Notes to Financial Statements. |
| 16 | www.vulcanvaluepartners.com |
| Statements of Operations |
| For the Six Months Ended October 31, 2023 (Unaudited) |
| | | Vulcan Value Partners
Fund | | | Vulcan Value Partners
Small Cap Fund | |
| INVESTMENT INCOME: | | | | | | | | |
| Dividends | | $ | 4,747,972 | | | $ | 4,095,161 | |
| Foreign taxes withheld | | | – | | | | (116,195 | ) |
| Total investment income | | | 4,747,972 | | | | 3,978,966 | |
| | | | | | | | | |
| EXPENSES: | | | | | | | | |
| Investment advisory fees (Note 6) | | | 4,440,598 | | | | 2,362,663 | |
| Administrative fees | | | 162,016 | | | | 79,470 | |
| Transfer agency fees | | | 37,059 | | | | 52,361 | |
| Delegated transfer agent equivalent services fees | | | | | | | | |
| Investor Class | | | 9,426 | | | | 5,356 | |
| Institutional Class | | | 193,226 | | | | 90,267 | |
| Professional fees | | | 18,456 | | | | 16,570 | |
| Custodian fees | | | 19,798 | | | | 26,574 | |
| Principal financial officer fees | | | 7,272 | | | | 2,965 | |
| Trustee fees and expenses | | | 19,562 | | | | 11,958 | |
| ReFlow Fees (Note 2) | | | – | | | | – | |
| Other | | | 37,507 | | | | 21,685 | |
| Total expenses before waiver | | | 4,944,920 | | | | 2,669,869 | |
| Less fees waived/reimbursed by investment adviser (Note 6) | | | | | | | | |
| Investor Class | | | – | | | | (6,628 | ) |
| Institutional Class | | | (911,967 | ) | | | (537,377 | ) |
| Total net expenses | | | 4,032,953 | | | | 2,125,864 | |
| NET INVESTMENT INCOME | | | 715,019 | | | | 1,853,102 | |
| | | | | | | | | |
| Net realized gain/(loss) on investments(a) | | | 101,100,296 | | | | (19,824,962 | ) |
| Net realized gain/(loss) on foreign currency transactions | | | 25,211 | | | | (32,829 | ) |
| Net realized gain/(loss) | | | 101,125,507 | | | | (19,857,791 | ) |
| Net change in unrealized depreciation of investments | | | (72,503,436 | ) | | | (17,974,592 | ) |
| Net change in unrealized depreciation on translation of assets and liabilities denominated in foreign currencies | | | (5,119 | ) | | | (12,716 | ) |
| Net change in unrealized depreciation | | | (72,508,555 | ) | | | (17,987,308 | ) |
| NET REALIZED AND UNREALIZED GAIN/(LOSS) ON INVESTMENTS | | | 28,616,952 | | | | (37,845,099 | ) |
| NET INCREASE/(DECREASE) IN NET ASSETS RESULTING FROM OPERATIONS | | $ | 29,331,971 | | | $ | (35,991,997 | ) |
| (a) | See Note 2 for gain/(loss) on In-Kind transactions. |
See Accompanying Notes to Financial Statements.
| Semi-Annual Report | October 31, 2023 | 17 |
| Statements of Changes in Net Assets | Vulcan Value Partners Fund |
| | | For the Six
Months Ended
October 31, 2023
(Unaudited) | | | For the
Year Ended
April 30, 2023 | |
| OPERATIONS: | | | | | | | | |
| Net investment income | | $ | 715,019 | | | $ | 1,297,600 | |
| Net realized gain/(loss) | | | 101,125,507 | | | | (324,181,574 | ) |
| Net change in unrealized appreciation/(depreciation) | | | (72,508,555 | ) | | | 248,543,334 | |
| Net increase/(decrease) in net assets resulting from operations | | | 29,331,971 | | | | (74,340,640 | ) |
| | | | | | | | | |
| DISTRIBUTIONS TO SHAREHOLDERS (Note 3): | | | | | | | | |
| From distributable earnings | | | | | | | | |
| Investor Class | | | – | | | | (13,928,273 | ) |
| Institutional Class | | | – | | | | (35,401,136 | ) |
| Net decrease in net assets from distributions | | | – | | | | (49,329,409 | ) |
| | | | | | | | | |
| SHARE TRANSACTIONS (Note 5): | | | | | | | | |
| Investor Class | | | | | | | | |
| Proceeds from sales of shares | | | 2,620,154 | | | | 10,502,788 | |
| Issued to shareholders in reinvestment of distributions | | | – | | | | 12,856,196 | |
| Cost of shares redeemed, net of redemption fees | | | (41,597,940 | ) | | | (187,167,100 | ) |
| Institutional Class | | | | | | | | |
| Proceeds from sales of shares | | | 62,885,742 | | | | 120,576,734 | |
| Issued to shareholders in reinvestment of distributions | | | – | | | | 33,617,847 | |
| Cost of shares redeemed, net of redemption fees | | | (306,606,408 | ) | | | (341,125,529 | ) |
| Net decrease from share transactions | | | (282,698,452 | ) | | | (350,739,064 | ) |
| | | | | | | | | |
| Net decrease in net assets | | | (253,366,481 | ) | | | (474,409,113 | ) |
| | | | | | | | | |
| NET ASSETS: | | | | | | | | |
| Beginning of year | | | 929,418,127 | | | | 1,403,827,240 | |
| End of period | | $ | 676,051,646 | | | $ | 929,418,127 | |
| See Accompanying Notes to Financial Statements. | |
| 18 | www.vulcanvaluepartners.com |
| Vulcan Value Partners Small Cap Fund | Statements of Changes in Net Assets |
| | | For the Six
Months Ended
October 31, 2023
(Unaudited) | | | For the
Year Ended
April 30, 2023 | |
| OPERATIONS: | | | | | | | | |
| Net investment income | | $ | 1,853,102 | | | $ | 2,124,969 | |
| Net realized loss | | | (19,857,791 | ) | | | (338,526,401 | ) |
| Net change in unrealized appreciation/(depreciation) | | | (17,987,308 | ) | | | 183,042,029 | |
| Net decrease in net assets resulting from operations | | | (35,991,997 | ) | | | (153,359,403 | ) |
| | | | | | | | | |
| DISTRIBUTIONS TO SHAREHOLDERS (Note 3): | | | | | | | | |
| From distributable earnings | | | | | | | | |
| Investor Class | | | – | | | | (14,357,975 | ) |
| Institutional Class | | | – | | | | (42,240,952 | ) |
| Net decrease in net assets from distributions | | | – | | | | (56,598,927 | ) |
| | | | | | | | | |
| SHARE TRANSACTIONS (Note 5): | | | | | | | | |
| Investor Class | | | | | | | | |
| Proceeds from sales of shares | | | 2,622,326 | | | | 12,041,666 | |
| Issued to shareholders in reinvestment of distributions | | | – | | | | 12,472,069 | |
| Cost of shares redeemed, net of redemption fees | | | (25,770,999 | ) | | | (116,071,465 | ) |
| Institutional Class | | | | | | | | |
| Proceeds from sales of shares | | | 34,497,462 | | | | 187,809,773 | |
| Issued to shareholders in reinvestment of distributions | | | – | | | | 31,035,572 | |
| Cost of shares redeemed, net of redemption fees | | | (71,316,532 | ) | | | (442,086,874 | ) |
| Net decrease from share transactions | | | (59,967,743 | ) | | | (314,799,259 | ) |
| | | | | | | | | |
| Net decrease in net assets | | | (95,959,740 | ) | | | (524,757,589 | ) |
| | | | | | | | | |
| NET ASSETS: | | | | | | | | |
| Beginning of year | | | 418,550,631 | | | | 943,308,220 | |
| End of period | | $ | 322,590,891 | | | $ | 418,550,631 | |
| See Accompanying Notes to Financial Statements. | |
| Semi-Annual Report | October 31, 2023 | 19 |
| Financial Highlights |
| For a share outstanding throughout the period or years presented. |
| Investor Class |
| NET ASSET VALUE, BEGINNING OF PERIOD |
| INCOME/(LOSS) FROM OPERATIONS: |
| Net investment income/(loss)(a) |
| Net realized and unrealized gain/(loss) on investments |
| Total from investment operations |
| |
| LESS DISTRIBUTIONS TO SHAREHOLDERS: |
| From net investment income |
| From net realized gains on investments |
| Total distributions |
| |
| Redemption fees added to paid-in capital |
| Increase/(decrease) in net asset value |
| NET ASSET VALUE, END OF PERIOD |
| |
| Total return |
| |
| RATIOS AND SUPPLEMENTAL DATA: |
| Net assets, end of period (000's) |
| |
| Ratio of expenses to average net assets without fee waivers/reimbursements |
| Ratio of expenses to average net assets including fee waivers/reimbursements |
| |
| Net investment income/(loss) to average net assets including fee waivers/reimbursements |
| |
| Portfolio turnover rate |
| (a) | Per share numbers have been calculated using the average shares method. |
| (b) | Less than $(0.005) per share. |
| (c) | Less than $0.005 per share. |
| See Accompanying Notes to Financial Statements. | |
| 20 | www.vulcanvaluepartners.com |
| Vulcan Value Partners Fund |
For the Six
Months Ended
October 31, 2023
(Unaudited) | | | For the Year
Ended April 30,
2023 | | | For the Year
Ended April 30,
2022 | | | For the Year
Ended April 30,
2021 | | | For the Year
Ended April 30,
2020 | | | For the Year
Ended April 30,
2019 | |
| $ | 19.01 | | | $ | 20.74 | | | $ | 29.87 | | | $ | 19.50 | | | $ | 21.05 | | | $ | 21.39 | |
| | | | | | | | | | | | | | | | | | | | | | | |
| | (0.00 | )(b) | | | 0.00 | (c) | | | (0.16 | ) | | | (0.14 | ) | | | 0.03 | | | | 0.08 | |
| | 0.24 | | | | (0.74 | ) | | | (5.75 | ) | | | 11.42 | | | | (0.53 | ) | | | 1.13 | |
| | 0.24 | | | | (0.74 | ) | | | (5.91 | ) | | | 11.28 | | | | (0.50 | ) | | | 1.21 | |
| | | | | | | | | | | | | | | | | | | | | | | |
| | – | | | | – | | | | – | | | | 0.00 | (c) | | | 0.00 | (c) | | | (0.13 | ) |
| | – | | | | (0.99 | ) | | | (3.22 | ) | | | (0.91 | ) | | | (1.05 | ) | | | (1.42 | ) |
| | – | | | | (0.99 | ) | | | (3.22 | ) | | | (0.91 | ) | | | (1.05 | ) | | | (1.55 | ) |
| | | | | | | | | | | | | | | | | | | | | | | |
| | – | | | | – | | | | – | | | | 0.00 | (c) | | | 0.00 | (c) | | | 0.00 | (c) |
| | 0.24 | | | | (1.73 | ) | | | (9.13 | ) | | | 10.37 | | | | (1.55 | ) | | | (0.34 | ) |
| $ | 19.25 | | | $ | 19.01 | | | $ | 20.74 | | | $ | 29.87 | | | $ | 19.50 | | | $ | 21.05 | |
| | | | | | | | | | | | | | | | | | | | | | | |
| | 1.26 | %(d) | | | (2.99 | %) | | | (22.93 | %) | | | 58.62 | % | | | (3.15 | %) | | | 6.80 | % |
| | | | | | | | | | | | | | | | | | | | | | | |
| $ | 198,874 | | | $ | 232,565 | | | $ | 437,470 | | | $ | 624,789 | | | $ | 500,309 | | | $ | 1,284,556 | |
| | | | | | | | | | | | | | | | | | | | | | | |
| | 1.08 | %(e) | | | 1.08 | % | | | 1.06 | % | | | 1.08 | % | | | 1.09 | % | | | 1.08 | % |
| | 1.08 | %(e) | | | 1.08 | % | | | 1.06 | % | | | 1.08 | % | | | 1.09 | % | | | 1.08 | % |
| | (0.02 | %)(e) | | | 0.01 | % | | | (0.54 | %) | | | (0.57 | %) | | | 0.12 | % | | | 0.38 | % |
| | 19 | %(d) | | | 40 | % | | | 49 | % | | | 67 | % | | | 80 | % | | | 73 | % |
| See Accompanying Notes to Financial Statements. | |
| Semi-Annual Report | October 31, 2023 | 21 |
| Financial Highlights | Vulcan Value Partners Fund |
| For a share outstanding throughout the period or years presented. |
| Institutional Class |
| NET ASSET VALUE, BEGINNING OF PERIOD |
| INCOME/(LOSS) FROM OPERATIONS: |
| Net investment income/(loss)(a) |
| Net realized and unrealized gain/(loss) on investments |
| Total from investment operations |
| |
| LESS DISTRIBUTIONS TO SHAREHOLDERS: |
| From net investment income |
| From net realized gains on investments |
| Total distributions |
| |
| Redemption fees added to paid-in capital |
| Increase/(decrease) in net asset value |
| NET ASSET VALUE, END OF PERIOD |
| |
| Total return |
| |
| RATIOS AND SUPPLEMENTAL DATA: |
| Net assets, end of period (000's) |
| |
| Ratio of expenses to average net assets without fee waivers/reimbursements |
| Ratio of expenses to average net assets including fee waivers/reimbursements |
| |
| Net investment income/(loss) to average net assets including fee waivers/reimbursements |
| |
| Portfolio turnover rate |
| (a) | Per share numbers have been calculated using the average shares method. |
| (b) | Less than $0.005 per share. |
| See Accompanying Notes to Financial Statements. | |
| 22 | www.vulcanvaluepartners.com |
| Vulcan Value Partners Fund |
For the Six Months
Ended
October 31, 2023
(Unaudited) | | | For the Year Ended
April 30, 2023 | | | For the Year Ended
April 30, 2022 | | | For the Year Ended
April 30, 2021 | | | For the Period
May 1, 2019
(Inception) to
April 30, 2020 | |
| $ | 19.15 | | | $ | 20.84 | | | $ | 29.93 | | | $ | 19.52 | | | $ | 21.02 | |
| | | | | | | | | | | | | | | | | | | |
| | 0.02 | | | | 0.04 | | | | (0.10 | ) | | | (0.09 | ) | | | 0.09 | |
| | 0.24 | | | | (0.74 | ) | | | (5.77 | ) | | | 11.46 | | | | (0.51 | ) |
| | 0.26 | | | | (0.70 | ) | | | (5.87 | ) | | | 11.37 | | | | (0.42 | ) |
| | | | | | | | | | | | | | | | | | | |
| | – | | | | – | | | | – | | | | (0.05 | ) | | | (0.03 | ) |
| | – | | | | (0.99 | ) | | | (3.22 | ) | | | (0.91 | ) | | | (1.05 | ) |
| | – | | | | (0.99 | ) | | | (3.22 | ) | | | (0.96 | ) | | | (1.08 | ) |
| | | | | | | | | | | | | | | | | | | |
| | – | | | | – | | | | – | | | | 0.00 | (b) | | | 0.00 | (b) |
| | 0.26 | | | | (1.69 | ) | | | (9.09 | ) | | | 10.41 | | | | (1.50 | ) |
| $ | 19.41 | | | $ | 19.15 | | | $ | 20.84 | | | $ | 29.93 | | | $ | 19.52 | |
| | | | | | | | | | | | | | | | | | | |
| | 1.36 | % | | | (2.78 | %) | | | (22.74 | %) | | | 59.02 | % | | | (2.83 | %)(c) |
| | | | | | | | | | | | | | | | | | | |
| $ | 477,177 | | | $ | 696,853 | | | $ | 966,357 | | | $ | 1,147,175 | | | $ | 768,726 | |
| | | | | | | | | | | | | | | | | | | |
| | 1.13 | % | | | 1.13 | % | | | 1.11 | % | | | 1.12 | % | | | 1.14 | %(d) |
| | 0.85 | % | | | 0.85 | % | | | 0.85 | % | | | 0.85 | % | | | 0.85 | %(d) |
| | 0.22 | % | | | 0.23 | % | | | (0.34 | %) | | | (0.36 | %) | | | 0.40 | %(d) |
| | 19 | % | | | 40 | % | | | 49 | % | | | 67 | % | | | 80 | %(c) |
| See Accompanying Notes to Financial Statements. | |
| Semi-Annual Report | October 31, 2023 | 23 |
| Financial Highlights |
| For a share outstanding throughout the period or years presented. |
| Investor Class |
| NET ASSET VALUE, BEGINNING OF PERIOD |
| INCOME/(LOSS) FROM OPERATIONS: |
| Net investment income/(loss)(a) |
| Net realized and unrealized gain/(loss) on investments |
| Total from investment operations |
| |
| LESS DISTRIBUTIONS TO SHAREHOLDERS: |
| From net investment income |
| From net realized gains on investments |
| Total distributions |
| |
| Redemption fees added to paid-in capital |
| Increase/(decrease) in net asset value |
| NET ASSET VALUE, END OF PERIOD |
| |
| Total return |
| |
| RATIOS AND SUPPLEMENTAL DATA: |
| Net assets, end of period (000's) |
| |
| Ratio of expenses to average net assets without fee waivers/reimbursements |
| Ratio of expenses to average net assets including fee waivers/reimbursements |
| |
| Net investment income/(loss) to average net assets including fee waivers/reimbursements |
| |
| Portfolio turnover rate |
| (a) | Per share numbers have been calculated using the average shares method. |
| (b) | Less than $0.005 per share. |
| See Accompanying Notes to Financial Statements. | |
| 24 | www.vulcanvaluepartners.com |
| Vulcan Value Partners Small Cap Fund |
For the Six
Months Ended
October 31,
2023
(Unaudited) | | | For the Year
Ended April 30,
2023 | | | For the Year
Ended April 30,
2022 | | | For the Year
Ended April 30,
2021 | | | For the Year
Ended April 30,
2020 | | | For the Year
Ended April 30,
2019 | |
| $ | 10.87 | | | $ | 14.47 | | | $ | 22.62 | | | $ | 12.01 | | | $ | 17.31 | | | $ | 19.52 | |
| | | | | | | | | | | | | | | | | | | | | | | |
| | 0.04 | | | | 0.01 | | | | (0.10 | ) | | | (0.10 | ) | | | 0.12 | | | | 0.10 | |
| | (1.09 | ) | | | (2.18 | ) | | | (3.22 | ) | | | 10.73 | | | | (4.57 | ) | | | 0.38 | |
| | (1.05 | ) | | | (2.17 | ) | | | (3.32 | ) | | | 10.63 | | | | (4.45 | ) | | | 0.48 | |
| | | | | | | | | | | | | | | | | | | | | | | |
| | – | | | | – | | | | – | | | | (0.02 | ) | | | (0.08 | ) | | | (0.12 | ) |
| | – | | | | (1.43 | ) | | | (4.83 | ) | | | – | | | | (0.77 | ) | | | (2.57 | ) |
| | – | | | | (1.43 | ) | | | (4.83 | ) | | | (0.02 | ) | | | (0.85 | ) | | | (2.69 | ) |
| | | | | | | | | | | | | | | | | | | | | | | |
| | – | | | | – | | | | – | | | | 0.00 | (b) | | | 0.00 | (b) | | | 0.00 | (b) |
| | (1.05 | ) | | | (3.60 | ) | | | (8.15 | ) | | | 10.61 | | | | (5.30 | ) | | | (2.21 | ) |
| $ | 9.82 | | | $ | 10.87 | | | $ | 14.47 | | | $ | 22.62 | | | $ | 12.01 | | | $ | 17.31 | |
| | | | | | | | | | | | | | | | | | | | | | | |
| | (9.66 | %)(c) | | | (14.39 | %) | | | (21.58 | %) | | | 88.51 | % | | | (27.28 | %) | | | 4.76 | % |
| | | | | | | | | | | | | | | | | | | | | | | |
| $ | 47,513 | | | $ | 75,271 | | | $ | 221,910 | | | $ | 310,600 | | | $ | 153,249 | | | $ | 543,174 | |
| | | | | | | | | | | | | | | | | | | | | | | |
| | 1.27 | %(d) | | | 1.26 | % | | | 1.25 | % | | | 1.25 | % | | | 1.26 | % | | | 1.27 | % |
| | 1.25 | %(d) | | | 1.25 | % | | | 1.25 | % | | | 1.25 | % | | | 1.25 | % | | | 1.25 | % |
| | 0.66 | %(d) | | | 0.12 | % | | | (0.47 | )% | | | (0.65 | )% | | | 0.75 | % | | | 0.54 | % |
| | 19 | %(c) | | | 26 | % | | | 69 | % | | | 75 | % | | | 102 | % | | | 68 | % |
| See Accompanying Notes to Financial Statements. | |
| Semi-Annual Report | October 31, 2023 | 25 |
| Financial Highlights | Vulcan Value Partners Small Cap Fund |
| For a share outstanding throughout the period or years presented. |
| Institutional Class |
| NET ASSET VALUE, BEGINNING OF PERIOD |
| INCOME/(LOSS) FROM OPERATIONS: |
| Net investment income/(loss)(a) |
| Net realized and unrealized gain/(loss) on investments |
| Total from investment operations |
| |
| LESS DISTRIBUTIONS TO SHAREHOLDERS: |
| From net investment income |
| From net realized gains on investments |
| Total distributions |
| |
| Redemption fees added to paid-in capital |
| Increase/(decrease) in net asset value |
| NET ASSET VALUE, END OF PERIOD |
| |
| Total return |
| |
| RATIOS AND SUPPLEMENTAL DATA: |
| Net assets, end of period (000's) |
| |
| Ratio of expenses to average net assets without fee waivers/reimbursements |
| Ratio of expenses to average net assets including fee waivers/reimbursements |
| |
| Net investment income/(loss) to average net assets including fee waivers/reimbursements |
| |
| Portfolio turnover rate |
| (a) | Per share numbers have been calculated using the average shares method. |
| (b) | Less than $0.005 per share. |
| See Accompanying Notes to Financial Statements. | |
| 26 | www.vulcanvaluepartners.com |
| Financial Highlights | Vulcan Value Partners Small Cap Fund |
For the Six Months
Ended
October 31, 2023
(Unaudited) | | | For the Year Ended
April 30, 2023 | | | For the Year Ended
April 30, 2022 | | | For the Year Ended
April 30, 2021 | | | For the Period
May 1, 2019
(Inception) to
April 30, 2020 | |
| $ | 10.99 | | | $ | 14.57 | | | $ | 22.70 | | | $ | 12.03 | | | $ | 17.18 | |
| | | | | | | | | | | | | | | | | | | |
| | 0.05 | | | | 0.05 | | | | (0.04 | ) | | | (0.06 | ) | | | 0.12 | |
| | (1.10 | ) | | | (2.20 | ) | | | (3.26 | ) | | | 10.77 | | | | (4.41 | ) |
| | (1.05 | ) | | | (2.15 | ) | | | (3.30 | ) | | | 10.71 | | | | (4.29 | ) |
| | | | | | | | | | | | | | | | | | | |
| | – | | | | – | | | | – | | | | (0.04 | ) | | | (0.09 | ) |
| | – | | | | (1.43 | ) | | | (4.83 | ) | | | – | | | | (0.77 | ) |
| | – | | | | (1.43 | ) | | | (4.83 | ) | | | (0.04 | ) | | | (0.86 | ) |
| | | | | | | | | | | | | | | | | | | |
| | – | | | | – | | | | – | | | | 0.00 | (b) | | | 0.00 | (b) |
| | (1.05 | ) | | | (3.58 | ) | | | (8.13 | ) | | | 10.67 | | | | (5.15 | ) |
| $ | 9.94 | | | $ | 10.99 | | | $ | 14.57 | | | $ | 22.70 | | | $ | 12.03 | |
| | | | | | | | | | | | | | | | | | | |
| | (9.55 | %) | | | (14.14 | %) | | | (21.40 | %) | | | 89.07 | % | | | (26.56 | %)(c) |
| | | | | | | | | | | | | | | | | | | |
| $ | 275,078 | | | $ | 343,279 | | | $ | 721,399 | | | $ | 710,679 | | | $ | 247,629 | |
| | | | | | | | | | | | | | | | | | | |
| | 1.30 | % | | | 1.31 | % | | | 1.27 | % | | | 1.29 | % | | | 1.32 | %(d) |
| | 1.00 | % | | | 1.00 | % | | | 1.00 | % | | | 1.00 | % | | | 1.00 | %(d) |
| | 0.94 | % | | | 0.42 | % | | | (0.19 | )% | | | (0.39 | )% | | | 0.76 | %(d) |
| | 19 | % | | | 26 | % | | | 69 | % | | | 75 | % | | | 102 | %(c) |
| See Accompanying Notes to Financial Statements. | |
| Semi-Annual Report | October 31, 2023 | 27 |
| Notes to Financial Statements |
| October 31, 2023 (Unaudited) |
1. ORGANIZATION
Financial Investors Trust (the “Trust”) is organized as a Delaware statutory trust and is registered as an open-end management investment company under the Investment Company Act of 1940, as amended (“1940 Act”). The Trust consists of multiple separate portfolios or series. This semi-annual report describes the Vulcan Value Partners Fund and Vulcan Value Partners Small Cap Fund (each a “Fund” and collectively, the “Funds”). The Funds seek to achieve long-term capital appreciation. The Funds offer Investor Class and Institutional Class shares.
2. SIGNIFICANT ACCOUNTING POLICIES
The accompanying financial statements were prepared in accordance with accounting principles generally accepted in the United States of America (“U.S. GAAP”), including policies specific to investment companies. The preparation of financial statements in conformity with U.S. GAAP requires management to make certain estimates and assumptions that affect the reported amounts of assets and liabilities and disclosures of contingent assets and liabilities at the date of the financial statements and the reported amounts of revenue and expenses during the period. Actual results could differ from those estimates. The Funds are considered an investment company for financial reporting purposes under U.S. GAAP and follows the accounting and reporting guidance applicable to investment companies in the Financial Accounting Standards Board Accounting Standards Codification Topic 946. The following is a summary of significant accounting policies consistently followed by the Funds in preparation of their financial statements.
Investment Valuation: The Funds generally value their securities based on market prices determined at the close of regular trading on the New York Stock Exchange (“NYSE”), normally 4:00 p.m. Eastern Time, on each day the NYSE is open for trading.
For equity securities and mutual funds that are traded on an exchange, the market price is usually the closing sale or official closing price on that exchange. In the case of equity securities not traded on an exchange, or if such closing prices are not otherwise available, the securities are valued at the mean of the most recent bid and ask prices on such day. Redeemable securities issued by open-end registered investment companies are valued at the investment company’s applicable net asset value, with the exception of exchange-traded open-end investment companies, which are priced as equity securities.
The market price for debt obligations is generally the quote supplied by an independent third-party pricing service utilized by the valuation designee which may use a matrix, formula or other objective method that takes into consideration quotations from dealers, market transactions in comparable investments, market indices and yield curves. If vendors are unable to supply a quote, or if the quote supplied is deemed to be unreliable, the market price may be determined using quotations received from one or more broker–dealers that make a market in the security.
Equity securities that are primarily traded on foreign securities exchanges are valued at the closing values of such securities on their respective foreign exchanges, except when an event occurs subsequent to the close of the foreign exchange but before the close of the NYSE, such that the securities’ value would likely change. In such an event, the fair values of those securities are determined in good faith through consideration of other factors in accordance with procedures utilized by Vulcan Value Partners, LLC (the “Adviser”), as the Funds' Valuation Designee and under the general supervision of the Board of Trustees of the Trust (the “Board” or the “Trustees”). Each
| 28 | www.vulcanvaluepartners.com |
| Notes to Financial Statements |
| October 31, 2023 (Unaudited) |
Fund uses a fair valuation model provided by an independent pricing service, which is intended to reflect fair value when a security’s value or a meaningful portion of the Fund’s portfolio is believed to have been materially affected by a valuation event that has occurred between the close of the exchange or market on which the security is traded and the close of the regular trading day on the NYSE.
When such prices or quotations are not available, or when the Adviser believes that they are unreliable, securities may be priced using fair value procedures utilized by the valuation designee.
Pursuant to Rule 2a-5 under the Investment Company Act of 1940, the Board has appointed the Adviser to serve as the Valuation Designee to perform fair value determinations for investments in the Funds. When such prices or quotations are not available, or when the Valuation Designee believes that they are unreliable, securities may be priced using fair value procedures approved by the Board. The fair valuation policies and procedures (“FV Procedures”) have been adopted by the Board for the fair valuation of portfolio assets held by the Fund(s) in the event that (1) market quotations for the current price of a portfolio security or asset are not readily available, or (2) available market quotations that would otherwise be used to value a portfolio security or asset in accordance with the Fund’s Pricing Procedures appear to be unreliable. The Pricing Procedures reflect certain pricing methodologies (or “logics”) that are not “readily available market quotations” and thus are viewed and treated as fair valuations. The Valuation Designee routinely meets to discuss fair valuations of portfolio securities and other instruments held by the Fund(s).
Fair Value Measurements: A three-tier hierarchy has been established to classify fair value measurements for disclosure purposes. Inputs refer broadly to the assumptions that market participants would use in pricing the asset or liability, including assumptions about risk. Inputs may be observable or unobservable. Observable inputs are inputs that reflect the assumptions market participants would use in pricing the asset or liability that are developed based on market data obtained from sources independent of the reporting entity. Unobservable inputs are inputs that reflect the reporting entity’s own assumptions about the assumptions market participants would use in pricing the asset or liability that are developed based on the best information available. Various inputs are used in determining the value of each Fund’s investments as of the reporting period end. The designated input levels are not necessarily an indication of the risk or liquidity associated with these investments. These inputs are categorized in the following hierarchy under applicable financial accounting standards:
| Level 1 – | Unadjusted quoted prices in active markets for identical investments, unrestricted assets or liabilities that the Funds have the ability to access at the measurement date; |
| Level 2 – | Quoted prices which are not active, quoted prices for similar assets or liabilities in active markets or inputs other than quoted prices that are observable (either directly or indirectly) for substantially the full term of the asset or liability; and |
| Level 3 – | Significant unobservable prices or inputs (including the Funds’ own assumptions in determining the fair value of investments) where there is little or no market activity for the asset or liability at the measurement date. |
| Semi-Annual Report | October 31, 2023 | 29 |
| Notes to Financial Statements |
| October 31, 2023 (Unaudited) |
The following is a summary of each input used to value each Fund’s investments as of October 31, 2023:
Vulcan Value Partners Fund:
| Investments in Securities at Value | | Level 1 -
Unadjusted
Quoted Prices | | | Level 2 - Other
Significant
Observable
Inputs | | | Level 3 -
Significant
Unobservable
Inputs | | | Total | |
| Common Stocks(a) | | $ | 666,407,259 | | | $ | – | | | $ | – | | | $ | 666,407,259 | |
| Short Term Investments | | | 7,687,208 | | | | – | | | | – | | | | 7,687,208 | |
| TOTAL | | $ | 674,094,467 | | | $ | – | | | $ | – | | | $ | 674,094,467 | |
Vulcan Value Partners Small Cap Fund:
| Investments in Securities at Value | | Level 1 -
Unadjusted
Quoted Prices | | | Level 2 - Other
Significant
Observable
Inputs | | | Level 3 -
Significant
Unobservable
Inputs | | | Total | |
| Common Stocks(a) | | $ | 318,161,325 | | | $ | – | | | $ | – | | | $ | 318,161,325 | |
| Short Term Investments | | | 3,944,556 | | | | – | | | | – | | | | 3,944,556 | |
| TOTAL | | $ | 322,105,881 | | | $ | – | | | $ | – | | | $ | 322,105,881 | |
| (a) | For detailed descriptions, see the accompanying Statements of Investments. |
For the six-months ended October 31, 2023, the Funds did not have any securities that used significant unobservable inputs (Level 3) in determining fair value.
Investment Transactions and Investment Income: Investment transactions are accounted for on the date the investments are purchased or sold (trade date). Realized gains and losses from investment transactions are reported on an identified cost basis, which is the same basis the Funds use for federal income tax purposes. Interest income, which includes accretion of discounts and amortization of premiums, is accrued and recorded as earned. Dividend income is recognized on the ex-dividend date or, for certain foreign securities, as soon as information is available to the Funds. All of the realized and unrealized gains and losses and net investment income, are allocated daily to each class in proportion to its average daily net assets.
ReFlow Liquidity Program: Each Fund may participate in the ReFlow liquidity program, which is designed to provide an alternative liquidity source for mutual funds experiencing net redemptions of their shares. Pursuant to the program, ReFlow Fund, LLC (“ReFlow”) provides participating mutual funds with a source of cash to meet net shareholder redemptions by standing ready each business day to purchase fund shares up to the value of the net shares redeemed by other shareholders that are to settle the next business day. ReFlow will purchase shares of the Fund at net asset value and will not be subject to any investment minimums. Following purchases of Fund shares, ReFlow then generally redeems those shares when the Fund experiences net subscriptions, at the end of a maximum holding period determined by ReFlow (currently 28 days), or at other times as the Fund may request. ReFlow may choose to redeem its position in the Fund with an in-kind transfer of securities, instead of cash, enabling the Fund to avoid a realization of capital gains on the securities it transfers. ReFlow will not be subject to any short-term redemption fees. While ReFlow holds Fund shares, it will have the same rights and privileges with respect to those shares as any other
| 30 | www.vulcanvaluepartners.com |
| Notes to Financial Statements |
| October 31, 2023 (Unaudited) |
shareholder. For use of the ReFlow service, a Fund pays a fee to ReFlow each time it purchases Fund shares, calculated by applying to the purchase amount a fee rate determined through an automated daily auction among participating mutual funds. The current minimum fee rate is 0.20% of the value of the Fund shares purchased by ReFlow although the Fund may submit a bid at a higher fee rate if it determines that doing so is in the best interest of Fund shareholders. In accordance with federal securities laws, ReFlow is prohibited from acquiring more than 3% of the outstanding voting securities of a Fund. There is no assurance that ReFlow will have sufficient funds available to meet the Funds’ liquidity needs on a particular day. During the six-months ended October 31, 2023, the Funds did not participate in ReFlow. Fees associated with ReFlow are disclosed in the Statements of Operations.
Real Estate Investment Trusts (“REITs”): The Funds may invest a portion of their assets in REITs and are subject to certain risks associated with direct investment in REITs. REITs may be affected by changes in the value of their underlying properties and by defaults by borrowers or tenants. REITs depend generally on their ability to generate cash flow to make distributions to shareowners, and certain REITs have self-liquidation provisions by which mortgages held may be paid in full and distributions of capital returns may be made at any time. In addition, the performance of a REIT may be affected by its failure to qualify for tax-free pass-through of income under the Internal Revenue Code of 1986, as amended (the “Code”), or its failure to maintain exemption from registration under the 1940 Act. A Fund’s investments in REITs may result in such Fund’s receipt of cash in excess of the REITs’ earnings. If the Fund receives such distributions all or a portion of these distributions will constitute a return of capital to such Fund. Receiving a return of capital distribution from REITs will reduce the amount of income available to be distributed to Fund shareholders. Income from REITs generally will not be eligible for treatment as qualified dividend income. As the final character of the distributions is not known until reported by the REITs on their 1099s, the Funds utilize an average of the prior year’s reallocation information as an estimate for the current year character of distributions.
Foreign Securities: The Funds may directly purchase securities of foreign issuers. Investing in securities of foreign issuers involves special risks not typically associated with investing in securities of U.S. issuers. The risks include possible reevaluation of currencies, the inability to repatriate foreign currency, less complete financial information about companies and possible future adverse political and economic developments. Moreover, securities of many foreign issuers and their markets may be less liquid and their prices more volatile than those of securities of comparable U.S. issuers.
Foreign Currency Translation: The books and records of the Funds are maintained in U.S. dollars. Investment valuations and other assets and liabilities initially expressed in foreign currencies are converted each business day into U.S. dollars based upon current exchange rates. Prevailing foreign exchange rates may generally be obtained at the close of the NYSE (normally, 4:00 p.m. Eastern Time). The portion of realized and unrealized gains or losses on investments due to fluctuations in foreign currency exchange rates is not separately disclosed and is included in realized and unrealized gains or losses on investments, when applicable.
In-Kind Redemptions: During the six-months ended October 31, 2023, the Vulcan Value Partners Fund distributed portfolio securities rather than cash as payment for certain redemptions of fund shares (in-kind redemptions) in the amount of $56,816,437. For financial reporting purposes, the
| Semi-Annual Report | October 31, 2023 | 31 |
| Notes to Financial Statements |
| October 31, 2023 (Unaudited) |
Vulcan Value Partners Fund recognized gains on the in-kind redemptions in the amount of $31,486,901. During the six-months ended October 31, 2023, the Vulcan Value Partners Small Cap Fund distributed portfolio securities rather than cash as payment for certain redemptions of fund shares (in-kind redemptions) in the amount of $7,893,202. For financial reporting purposes, the Vulcan Value Partners Small Cap Fund recognized gains on the in-kind redemptions in the amount of $2,880,528. For tax purposes, the gains are not recognized.
Trust Expenses: Some expenses of the Trust can be directly attributed to the Funds. Expenses which cannot be directly attributed are apportioned among all funds in the Trust based on average net assets of each fund.
Fund Expenses: Expenses that are specific to a Fund are charged directly to that Fund.
Federal Income Taxes: Each Fund complies with the requirements under Subchapter M of the Internal Revenue Code of 1986, as amended, applicable to regulated investment companies and intends to distribute substantially all of its net taxable income and net capital gains, if any, each year so that it will not be subject to excise tax on undistributed income and gains. The Funds are not subject to income taxes to the extent such distributions are made.
As of and during six-months ended October 31, 2023, the Funds did not have a liability for any unrecognized tax benefits. The Funds file U.S. federal, state, and local tax returns as required. The Fund’s tax returns are subject to examination by the relevant tax authorities until expiration of the applicable statute of limitations, which is generally three years after the filing of the tax return for federal purposes and four years for most state returns. Tax returns for open years have incorporated no uncertain tax positions that require a provision for income taxes.
Distributions to Shareholders: Each Fund normally pays dividends and distributes capital gains, if any, on an annual basis. Income dividend distributions are derived from dividends and other income each Fund receives from its investments, including short-term capital gains. Long term capital gain distributions are derived from gains realized when each Fund sells a security it has owned for more than a year. Each Fund may make additional distributions and dividends at other times if the portfolio manager believes doing so may be necessary for each Fund to avoid or reduce taxes.
3. TAX BASIS INFORMATION
Tax Basis of Investments: As of October 31, 2023, the aggregate cost of investments, gross unrealized appreciation/(depreciation) and net unrealized appreciation/(depreciation) for federal tax purposes was as follows:
| | | Vulcan Value Partners
Fund | | | Vulcan Value Partners
Small Cap Fund | |
| Gross appreciation | | | | | | | | |
| (excess of value over tax cost) | | $ | 152,202,409 | | | $ | 49,033,451 | |
| Gross depreciation | | | | | | | | |
| (excess of tax cost over value) | | | (28,629,913 | ) | | | (106,163,572 | ) |
| Net unrealized appreciation | | $ | 123,572,496 | | | $ | (57,130,121 | ) |
| Cost of investments for income tax purposes | | $ | 550,521,971 | | | $ | 379,236,002 | |
| 32 | www.vulcanvaluepartners.com |
| Notes to Financial Statements |
| October 31, 2023 (Unaudited) |
Tax Basis of Distributions to Shareholders: The character of distributions made during the year from net investment income or net realized gains may differ from its ultimate characterization for federal income tax purposes. Also, due to the timing of dividend distributions, the fiscal year in which amounts are distributed may differ from the fiscal year in which the income or realized gain were recorded by each Fund.
The tax character of distributions paid by the Funds for the fiscal year ended April 30, 2023 were as follows:
| | | Ordinary Income | | | Long-Term Capital
Gain | |
| Vulcan Value Partners Fund | | $ | 29,911,862 | | | $ | 19,417,547 | |
| Vulcan Value Partners Small Cap Fund | | | – | | | | 56,598,927 | |
The tax character of distributions paid by the Funds for the fiscal year ended April 30, 2022 were as follows:
| | | Ordinary Income | | | Long-Term Capital
Gain | |
| Vulcan Value Partners Fund | | $ | 62,751,029 | | | $ | 135,752,526 | |
| Vulcan Value Partners Small Cap Fund | | | 205,802,260 | | | | 40,920,109 | |
The amounts and characteristics of tax basis distributions and composition of distributable earnings/(accumulated losses) are finalized at fiscal year-end. Accordingly, tax basis balances have not been determined as of October 31, 2023.
4. SECURITIES TRANSACTIONS
The cost of purchases and proceeds from sales of securities (excluding short-term securities and in-kind redemptions) during the six-months ended October 31, 2023 were as follows:
| Fund | | Purchase of Securities | | | Proceeds From Sales of
Securities | |
| Vulcan Value Partners Fund | | $ | 158,629,129 | | | $ | 441,177,575 | |
| Vulcan Value Partners Small Cap Fund | | | 73,712,555 | | | | 129,711,219 | |
5. SHARES OF BENEFICIAL INTEREST
The capitalization of the Trust consists of an unlimited number of shares of beneficial interest with no par value per share. Holders of the shares of the Funds of the Trust have one vote for each share held and a proportionate fraction of a vote for each fractional share. All shares issued and outstanding are fully paid and are transferable and redeemable at the option of the shareholder. Purchasers of the shares do not have any obligation to make payments to the Trust or its creditors solely by reason of the purchasers’ ownership of the shares. Shares have no pre-emptive rights.
| Semi-Annual Report | October 31, 2023 | 33 |
| Notes to Financial Statements |
| October 31, 2023 (Unaudited) |
Transactions in shares of capital stock for the dates listed below were as follows:
| Vulcan Value Partners Fund | | For the Six
Months Ended
October 31, 2023
(Unaudited) | | | For the Year Ended
April 30, 2023 | |
| Shares Sold | | | | | | | | |
| Institutional Class | | | 3,057,717 | | | | 12,918,273 | |
| Investor Class | | | 131,907 | | | | – | |
| Shares Issued in Reinvestment of Dividends | | | | | | | | |
| Institutional Class | | | – | | | | 3,945,756 | |
| Less Shares Redeemed | | | | | | | | |
| Institutional Class | | | (14,873,128 | ) | | | (36,831,454 | ) |
| Investor Class | | | (2,036,151 | ) | | | – | |
| Net Decrease | | | (13,719,655 | ) | | | (19,967,425 | ) |
| Vulcan Value Partners Small Cap Fund | | For the Six
Months Ended
October 31, 2023
(Unaudited) | | | For the Year Ended
April 30, 2023 | |
| Shares Sold | | | | | | | | |
| Institutional Class | | | 3,067,829 | | | | 30,802,666 | |
| Investor Class | | | 233,754 | | | | – | |
| Shares Issued in Reinvestment of Dividends | | | | | | | | |
| Institutional Class | | | – | | | | 5,991,424 | |
| Less Shares Redeemed | | | | | | | | |
| Institutional Class | | | (6,646,099 | ) | | | (73,301,976 | ) |
| Investor Class | | | (2,322,853 | ) | | | – | |
| Net Decrease | | | (5,667,369 | ) | | | (36,507,886 | ) |
6. MANAGEMENT AND RELATED-PARTY TRANSACTIONS
The Adviser, subject to the authority of the Board, is responsible for the overall management and administration of the Funds’ business affairs. The Adviser manages the investments of the Funds in accordance with each Fund’s investment objective, policies and limitations and investment guidelines established jointly by the Adviser and the Board. Pursuant to the Investment Advisory Agreement (the “Advisory Agreement”), the Funds pay the Adviser an annual management fee of 1.00% and 1.15% for Vulcan Value Partners Fund and Vulcan Value Partners Small Cap Fund, respectively, based on each Fund’s average daily net assets. The management fee is paid on a monthly basis.
With respect to the Funds’ Investor Class, to the extent the Total Annual Fund Operating Expenses with respect to either Fund (exclusive of Acquired Fund Fees and Expenses (if any), brokerage expenses, interest expense, taxes and extraordinary expenses) (“Designated Annual Fund Operating Expenses”) exceed 1.25% of such Fund’s average daily net assets for a particular fiscal year of the
| 34 | www.vulcanvaluepartners.com |
| Notes to Financial Statements |
| October 31, 2023 (Unaudited) |
Fund, the Adviser will reduce the Management Fee and/or Other Expenses otherwise payable to the Adviser with respect to such Fund for such fiscal year by an amount equal to such excess, and/or the Adviser shall reimburse the Fund by the amount of such excess.
With respect to the Funds’ Institutional Class, to the extent the Total Annual Fund Operating Expenses with respect to either Fund (exclusive of Acquired Fund Fees and Expenses (if any), brokerage expenses, interest expense, taxes and extraordinary expenses) (“Designated Annual Fund Operating Expenses”) exceed 0.85% and 1.00% of the Vulcan Value Partners Fund’s and the Vulcan Value Partners Small Cap Fund’s average daily net assets, respectively, for a particular fiscal year of the Fund, the Adviser will reduce the Management Fee and/or Other Expenses otherwise payable to the Adviser with respect to such Fund for such fiscal year by an amount equal to such excess, and/or the Adviser shall reimburse the Fund by the amount of such excess.
The Adviser agrees that the foregoing fee waiver and reimbursement agreement for each Fund are effective as of September 1, 2023 and shall continue through August 31, 2024.
The Adviser will be permitted to recapture expenses it has borne through this letter agreement to the extent that a Fund’s expenses in later periods fall below the annual rates set forth in this letter agreement or in previous letter agreements; provided, however, that such recapture payments do not cause the Fund’s expense ratio (after recapture) to exceed the lesser of (i) the expense cap in effect at the time of the waiver and (ii) the expense cap in effect at the time of the recapture. Notwithstanding the foregoing, the Funds will not be obligated to pay any such deferred fees and expenses more than three years after the date on which the fee and expenses were deferred.
For the six-months ended October 31, 2023, the fee waivers and/or reimbursements and recoupment amounts were as follows:
| Fund | | Fees Waived/Reimbursed
By Adviser | | | Recoupment of Previously
Waived Fees by Adviser | |
| Vulcan Value Partners Fund | | | | | | | | |
| Investor | | $ | – | | | $ | – | |
| Institutional | | | (911,967 | ) | | | – | |
| Vulcan Value Partners Small Cap Fund | | | | | | | | |
| Investor | | | (6,628 | ) | | | – | |
| Institutional | | | (537,377 | ) | | | – | |
As of six-months ended October 31, 2023, the balances of recoupable expenses for each Fund were as follows:
| Fund | | Expires
2024 | | | Expires
2025 | | | Expires
2026 | | | Expires
2027 | | | Total | |
| Vulcan Value Partners Fund | | | | | | | | | | | | | | | | | | | | |
| Investor | | $ | - | | | $ | - | | | $ | - | | | $ | - | | | $ | - | |
| Institutional | | | 1,230,164 | | | | 3,139,514 | | | | 2,092,143 | | | | 911,967 | | | | 7,373,788 | |
| Vulcan Value Partners Small Cap Fund | | | | | | | | | | | | | | | | | | | | |
| Investor | | | 3,860 | | | | - | | | | 20,237 | | | | 6,628 | | | | 30,725 | |
| Institutional | | | 676,896 | | | | 2,306,194 | | | | 1,482,188 | | | | 537,377 | | | | 5,474,335 | |
| Semi-Annual Report | October 31, 2023 | 35 |
| Notes to Financial Statements |
| October 31, 2023 (Unaudited) |
Fund Administrator Fees and Expenses: ALPS Fund Services, Inc. (“ALPS”) serves as administrator to the Funds and the Funds have agreed to pay expenses incurred in connection with their administrative activities. Pursuant to an Administration Agreement, ALPS provides operational services to the Funds including, but not limited to fund accounting and fund administration and generally assist in each Fund’s operations. Officers of the Trust are employees of ALPS. The Funds’ administration fee is accrued on a daily basis and paid monthly. Administrative fees paid by the Funds for the six-months ended October 31, 2023 are disclosed in the Statements of Operations.
ALPS is reimbursed by the Funds for certain out-of-pocket expenses.
Transfer Agent: ALPS serves as transfer, dividend paying and shareholder servicing agent for the Funds. ALPS receives an annual minimum fee, a fee based upon the number of shareholder accounts, and is also reimbursed by the Funds for certain out-of-pocket expenses. Transfer agent fees paid by the Funds for the six-months ended October 31, 2023 are disclosed in the Statements of Operations.
Compliance Services: ALPS provides services that assist the Trust’s chief compliance officer in monitoring and testing the policies and procedures of the Trust in conjunction with requirements under Rule 38a-1 under the 1940 Act and receives an annual base fee. ALPS is reimbursed for certain out-of-pocket expenses by the Funds. Vulcan pays this fee on behalf of the Funds.
Principal Financial Officer: ALPS receives an annual fee for providing principal financial officer services to the Funds. Principal financial officer fees paid by the Fund for the six-months ended October 31, 2023 are disclosed in the Statements of Operations.
Distributor: ALPS Distributors, Inc. (“ADI” or the “Distributor”) (an affiliate of ALPS) acts as the distributor of each Fund’s shares pursuant to a Distribution Agreement with the Trust. Shares are sold on a continuous basis by ADI as agent for the Funds, and ADI has agreed to use its best efforts to solicit orders for the sale of each Fund’s shares, although it is not obliged to sell any particular amount of shares. ADI is not entitled to any compensation for its services as Distributor. ADI is registered as a broker-dealer with the U.S. Securities and Exchange Commission. Certain intermediaries may charge networking, omnibus account or other administrative fees with respect to transactions in shares of the Funds. Transactions may be processed through the National Securities Clearing Corporation (“NSCC”) or similar systems or processed on a manual basis. These fees are paid by the Funds to the Distributor, which uses such fees to reimburse intermediaries. In the event an intermediary receiving payments from the Distributor on behalf of the Funds converts from a networking structure to an omnibus account structure or otherwise experiences increased costs, fees borne by the Funds may increase. Fees are disclosed on the Statements of Operations as “Delegated transfer agent equivalent services fees”.
Trustees: The fees and expenses of the Trustees of the Board are presented in the Statements of Operations.
| 36 | www.vulcanvaluepartners.com |
| Notes to Financial Statements |
| October 31, 2023 (Unaudited) |
7. INDEMNIFICATIONS
Under the Trust’s organizational documents, its Officers and Trustees are indemnified against certain liability arising out of the performance of their duties to the Trust. Additionally, in the normal course of business, the Trust enters into contracts with service providers that may contain general indemnification clauses which may permit indemnification to the extent permissible under applicable law. The Trust’s maximum exposure under these arrangements is unknown, as this would involve future claims that may be made against the Trust that have not yet occurred.
8. SUBSEQUENT EVENT
Subsequent events after the date of the Statements of Assets and Liabilities have been evaluated through the date the financial statements were issued.
| Semi-Annual Report | October 31, 2023 | 37 |
| Additional Information |
| October 31, 2023 (Unaudited) |
1. FUND HOLDINGS
The Funds file its complete schedule of portfolio holdings with the Securities and Exchange Commission (SEC) for the first and third quarters of each fiscal year as an exhibit to its reports on Form N-PORT. The Funds’ Form N-PORT reports are available on the SEC's Web site at http://www.sec.gov. The Funds’ Form N-PORT reports are also available upon request by calling (toll-free) (866) 759-5679.
2. FUND PROXY VOTING POLICIES, PROCEDURES AND SUMMARIES
The Funds’ policies and procedures used in determining how to vote proxies and information regarding how the Fund voted proxies relating to portfolio securities during the most recent prior 12-month period ending June 30 are available without charge, (1) upon request, by calling (toll-free) (866)-759-5679 and (2) on the SEC’s website at http://www.sec.gov.
| 38 | www.vulcanvaluepartners.com |
| Liquidity Risk Management Program |
| October 31, 2023 (Unaudited) |
The Financial Investors Trust (the “Trust”) has established a liquidity risk management program (the “Program”) to govern the Trust’s approach to managing liquidity risk for each fund in the Trust (each a “Fund”). The Program is overseen by the Liquidity Committee (the “Committee”), a committee comprised of representatives of the Trust’s investment advisers, sub-advisers, and Officers of the Trust. The Trust’s Board of Trustees (the “Board”) has approved the designation of the Committee to oversee the Program.
The Program’s principal objectives include supporting each Fund’s compliance with limits on investments in illiquid assets and mitigating the risk that a Fund will be unable to meet its redemption obligations in a timely manner. The Program also includes a number of elements that support the management and assessment of liquidity risk, including a periodic assessment of factors that influence a Fund’s liquidity and the periodic classification and re-classification of the Fund’s investments into groupings that reflect the Committee’s assessment of their relative liquidity under current market conditions.
At a meeting of the Board held on June 13, 2023, the Trustees received a report from the Committee regarding the design and operational effectiveness of the Program during the calendar year 2022. The Committee determined, and reported to the Board, that the Program is reasonably designed to assess and manage each Fund’s liquidity risk and has operated adequately and effectively to manage each Fund’s liquidity risk since implementation.
The Committee reported that during the period covered by the report, there were no liquidity events that impacted the Funds or their ability to timely meet redemptions without dilution to existing shareholders. Among other things, the Board noted that the Funds are not required to have a highly liquid investment minimum based on their liquidity classifications. The Board further noted that no material changes have been made to the Program since its implementation.
| Semi-Annual Report | October 31, 2023 | 39 |
| Privacy Policy |
| October 31, 2023 (Unaudited) |
| WHO WE ARE | |
| Who is providing this notice? | Vulcan Value Partners Fund and Vulcan Value Partners Small Cap Fund. |
| WHAT WE DO | |
| How do the Funds protect my personal information? | To protect your personal information from unauthorized access and use, we use security measures that comply with federal law. These measures include computer safeguards and secured files and buildings. |
| How do the Funds collect my personal information? | We collect your personal information, for example, when you ● open an account ● provide account information or give us your contact information ● make a wire transfer or deposit money |
| Why can’t I limit all sharing? | Federal law gives you the right to limit only ● sharing for affiliates’ everyday business purposes-information about your creditworthiness ● affiliates from using your information to market to you ● sharing for non-affiliates to market to you State laws and individual companies may give you additional rights to limit sharing. |
| 40 | www.vulcanvaluepartners.com |
| Privacy Policy |
| October 31, 2023 (Unaudited) |
| FACTS | WHAT DO THE FUNDS DO WITH YOUR PERSONAL INFORMATION? |
| WHY? | Financial companies choose how they share your personal information. Federal law gives consumers the right to limit some but not all sharing. Federal law also requires us to tell you how we collect, share, and protect your personal information. Please read this notice carefully to understand what we do. |
| WHAT? | The types of personal information we collect and share depend on the product or service you have with us. This information can include: ● Social Security number and account transactions ● Account balances and transaction history ● Wire transfer instructions |
| HOW? | All financial companies need to share customers’ personal information to run their everyday business. In the section below, we list the reasons financial companies can share their customers’ personal information; the reasons the Funds choose to share; and whether you can limit this sharing. |
| REASONS WE CAN SHARE YOUR PERSONAL INFORMATION | DO THE FUNDS
SHARE: | CAN YOU
LIMIT
THIS
SHARING? |
For our everyday business purposes –
such as to process your transactions, maintain your account(s), respond to court orders and legal investigations, or report to credit bureaus | Yes | No |
For our marketing purposes – to offer our products and services to you | No | We do not share. |
| For joint marketing with other financial companies | No | We do not share. |
For our affiliates’ everyday business purposes –
information about your transactions and experiences | Yes | No |
For our affiliates’ everyday business purposes –
information about your creditworthiness | No | We do not share. |
| For non-affiliates to market to you | No | We do not share. |
| Semi-Annual Report | October 31, 2023 | 41 |

(b) Not applicable.
Not applicable to this Report.
| Item 3. | Audit Committee Financial Expert. |
Not applicable to this Report.
| Item 4. | Principal Accountant Fees and Services. |
Not applicable to this Report.
| Item 5. | Audit Committee of Listed Registrants. |
Not applicable to the Registrant.
| (a) | Schedule of Investments is included as part of the Reports to Stockholders filed under Item 1 of this Form N-CSR. |
| Item 7. | Disclosure of Proxy Voting Policies and Procedures for Closed-End Management Investment Companies. |
Not applicable to the Registrant.
| Item 8. | Portfolio Managers of Closed-End Management Investment Companies. |
Not applicable to the Registrant.
| Item 9. | Purchases of Equity Securities by Closed-End Management Investment Company and Affiliated Purchasers. |
Not applicable to the Registrant.
| Item 10. | Submission of Matters to a Vote of Security Holders. |
There have been no material changes to the procedures by which shareholders may recommend nominees to the Registrant’s Board of Trustees, where those changes were implemented after the Registrant last provided disclosure in response to the requirements of Item 407(c)(2)(iv) of Regulation S-K, or this Item.
| Item 11. | Controls and Procedures. |
| (a) | The Registrant’s principal executive officer and principal financial officer have concluded that the Registrant’s disclosure controls and procedures (as defined in Rule 30a-3(c) under the Investment Company Act of 1940, as amended) are effective based on their evaluation of these controls and procedures as of a date within 90 days of the filing date of this report. |
| (b) | There was no change in the Registrant’s internal control over financial reporting (as defined in Rule 30a-3(d) under the Investment Company Act of 1940, as amended) that occurred during the period covered by this report that has materially affected, or is reasonably likely to materially affect, the Registrant’s internal control over financial reporting. |
Item 12. Disclosure of Securities Lending Activities for Closed-End Management Investment Companies.
Not applicable to the Registrant.
| (a)(1) | Not applicable to this Report. |
| (a)(3) | Not applicable to the Registrant. |
| (a)(4) | Not applicable to the Registrant. |
SIGNATURES
Pursuant to the requirements of the Securities Exchange Act of 1934 and the Investment Company Act of 1940, the Registrant has duly caused this report to be signed on its behalf by the undersigned, thereunto duly authorized.
FINANCIAL INVESTORS TRUST
| By: | /s/ Lucas Foss | |
| | Lucas Foss (Principal Executive Officer) | |
| | President | |
| | | |
| Date: | January 5, 2024 | |
Pursuant to the requirements of the Securities Exchange Act of 1934 and the Investment Company Act of 1940, this report has been signed below by the following persons on behalf of the Registrant and in the capacities and on the dates indicated.
FINANCIAL INVESTORS TRUST
| By: | /s/ Lucas Foss | |
| | Lucas Foss (Principal Executive Officer) | |
| | President | |
| | | |
| Date: | January 5, 2024 | |
| | | |
| By: | /s/ Jennell Panella | |
| | Jennell Panella (Principal Financial Officer) | |
| | Treasurer | |
| | | |
| Date: | January 5, 2024 | |