UNITED STATES
SECURITIES AND EXCHANGE COMMISSION
WASHINGTON, D.C. 20549
FORM N-CSR
CERTIFIED SHAREHOLDER REPORT OF REGISTERED MANAGEMENT
INVESTMENT COMPANIES
Investment Company Act file number: 811-08188
ALLIANCEBERNSTEIN EMERGING MARKET DEBT FUND, INC.
(Exact name of registrant as specified in charter)
1345 Avenue of the Americas, New York, New York 10105
(Address of principal executive offices) (Zip code)
Joseph J. Mantineo
AllianceBernstein L.P.
1345 Avenue of the Americas
New York, New York 10105
(Name and address of agent for service)
Registrant’s telephone number, including area code: (800) 221-5672
Date of fiscal year end: October 31, 2007
Date of reporting period: October 31, 2007
| ITEM 1. | REPORTS TO STOCKHOLDERS. |
2
ANNUAL REPORT
AllianceBernstein Emerging Market Debt Fund

Annual Report
Investment Products Offered
| | • | | Are Not Bank Guaranteed |
The investment return and principal value of an investment in the Fund will fluctuate as the prices of the individual securities in which it invests fluctuate, so that your shares, when redeemed, may be worth more or less than their original cost. You should consider the investment objectives, risks, charges and expenses of the Fund carefully before investing. For a free copy of the Fund’s prospectus, which contains this and other information, visit our web site at www.alliancebernstein.com or call your financial advisor or AllianceBernstein® at (800) 227-4618. Please read the prospectus carefully before you invest.
You may obtain performance information current to the most recent month-end by visiting www.alliancebernstein.com.
This shareholder report must be preceded or accompanied by the Fund’s prospectus for individuals who are not current shareholders of the Fund.
You may obtain a description of the Fund’s proxy voting policies and procedures, and information regarding how the Fund voted proxies relating to portfolio securities during the most recent 12-month period ended June 30, without charge. Simply visit AllianceBernstein’s web site at www.alliancebernstein.com, or go to the Securities and Exchange Commission’s (the “Commission”) web site at www.sec.gov, or call AllianceBernstein at (800) 227-4618.
The Fund files its complete schedule of portfolio holdings with the Commission for the first and third quarters of each fiscal year on Form N-Q. The Fund’s Forms N-Q are available on the Commission’s web site at www.sec.gov. The Fund’s Forms N-Q may also be reviewed and copied at the Commission’s Public Reference Room in Washington, DC; information on the operation of the Public Reference Room may be obtained by calling (800) SEC-0330.
AllianceBernstein Investments, Inc. is an affiliate of AllianceBernstein L.P., the manager of the AllianceBernstein funds, and is a member of FINRA.
AllianceBernstein® and the AB Logo are registered trademarks and service marks used by permission of the owner, AllianceBernstein L.P.
December 19, 2007
Annual Report
This report provides management’s discussion of fund performance for AllianceBernstein Emerging Market Debt Fund (the “Fund”) for the annual reporting period ended October 31, 2007. On August 2, 2007, the Board of Directors of the Fund (the “Board”) approved renaming the Fund “AllianceBernstein High Income Fund, Inc.” and certain policy changes. These changes are intended to refocus the Fund’s investment strategy on a broader range of debt securities, including corporate debt and non-U.S. dollar-denominated fixed-income securities. In addition, the Board has approved the acquisition of the assets and liabilities of AllianceBernstein Corporate Bond Portfolio (“Corporate Bond”), a series of AllianceBernstein Bond Fund, Inc., and AllianceBernstein High Yield Fund, Inc. (“High Yield”). The acquisition of Corporate Bond and High Yield did not require approval by the Fund’s shareholders but did require approval by the shareholders of each of those funds. These acquisitions were approved by shareholders and are expected to occur in late 2007 or early 2008, and the changes to the Fund’s policies and change of the Fund’s name will also become effective at that time.
Investment Objectives and Policies
This open-end Fund’s investment objective is to maximize total returns from price appreciation and income. The Fund invests, under normal circumstances, at least 80% of its net assets in emerging market debt securities. The Fund invests at least 65% of
its total assets in sovereign debt obligations. The Fund’s investments in sovereign debt obligations and non-U.S. corporate fixed-income securities emphasize countries that are included in the J.P. Morgan Emerging Markets Bond Index Global (JPM EMBI Global) and are considered at time of purchase to be emerging markets or developing countries. The Fund may invest in debt securities with a range of maturities from short- to long-term.
The Fund generally invests in U.S. dollar-denominated sovereign debt obligations and corporate fixed-income securities. The Fund may also invest in non-U.S. dollar-denominated fixed-income securities but will invest no more than 5% of its assets in securities denominated in any one currency other than the U.S. dollar. As an operating policy, the Fund will limit its investments in non-U.S. dollar-denominated securities to no more than 25% of its assets. Substantially all of the Fund’s assets may be invested in lower-rated securities, which may include securities having the lowest rating for non-subordinated debt instruments (i.e., rated C by Moody’s Investors Service or CCC+ or lower by Standard & Poor’s and Fitch Ratings) and unrated securities of equivalent investment quality. The Fund also may invest in investment-grade securities and unrated securities. The Fund may use borrowings for investment purposes. The Fund may also make short sales of securities or maintain a short position. The Fund is non-diversified, meaning it may invest more of its assets in a fewer number of issuers.
| | |
| ALLIANCEBERNSTEIN EMERGING MARKET DEBT FUND • | | 1 |
The Fund may invest in mortgage-related and other asset-backed securities, loan participations, inflation-protected securities, structured securities, variable, floating, and inverse floating rate instruments, preferred stock, and may use other investment techniques. The Fund may use leverage for investment purposes. The Fund intends, among other things, to enter into transactions such as reverse repurchase agreements and dollar rolls. The Fund may invest, without limit, in derivatives, such as options, futures, forwards or swap agreements. For hedging purposes, the Fund may enter into forward currency exchange contracts and options on foreign currencies.
Investment Results
The table on page 5 shows the Fund’s performance compared to its benchmark, the JPM EMBI Global, which tracks total returns for U.S. dollar-denominated debt instruments issued by emerging market sovereign and quasi-sovereign entities, for the six- and 12-month periods ended October 31, 2007.
All of the Fund’s share classes without sales charges outperformed the benchmark for both the six- and 12-month periods ended October 31, 2007. Contributing positively to performance for both periods was the Fund’s exposure to unhedged local-currency emerging market debt, which significantly outperformed the benchmark. The Fund’s exposure to local debt, particularly within Brazil and Turkey, significantly added to the Fund’s premium. The Fund’s underweight position within
Venezuela—which underperformed—also contributed positively to performance, as did the Fund’s use of leverage.
Detracting from the Fund’s performance for both the six- and 12-month periods ended October 31, 2007, was an overweight position within Argentina, which performed poorly. However, the defensive security selection within Argentina offset some of the negative impact of the Fund’s overweight position within that country.
Market Review and Investment Strategy
Volatility returned to the capital markets, as the credit crisis in the U.S. subprime market spilled over, in the form of a liquidity crunch, into other sectors and asset classes. As investors flocked to the safety of the highest-quality securities, government bond yields fell worldwide, and yield spreads widened across fixed income.
Growth in emerging market countries remained quite strong, aided by solid commodity prices. Emerging market debt prices were supported throughout much of the reporting period by solid global growth, strong investor demand and ample financial-market liquidity. The second half of the annual period saw a pullback in investment risk taking as global liquidity concerns rose, resulting in significant spread-widening across fixed-income assets. Late in the period, inflows into the emerging market asset class slowed and external accounts turned somewhat less favorable. Dollar reserve accumulation slowed in key countries like Russia, Brazil and Argentina prior to a rebound in
| | |
| 2 | | • ALLIANCEBERNSTEIN EMERGING MARKET DEBT FUND |
October 2007. Despite the recent volatility in global markets, emerging market debt remained resilient, posting a positive return of 8.07% for the annual period. Emerging market spreads widened only seven basis points to end the period at 201 basis points over like-duration Treasuries.
For the 12-month reporting period, most emerging market countries posted positive returns, with divergence between countries appearing while the performance range across emerging market debt became more correlated with the strength of individual country fundamentals. Latin American countries, which returned 8.40% for the 12-month period ended October 31, 2007, outpaced the non-Latin region, which returned 7.70%. Outperforming countries within the benchmark during the reporting period included Brazil at 12.26%, Uruguay at 12.96%, Colombia at 11.59% and Turkey at 11.29%. Brazilian debt benefited from ongoing strength in economic fundamentals, as well as growing investor recognition that Brazil would continue to retire external debt. Lower financing needs, improved debt dynamics and conservative fiscal policies also led to strong returns in Uruguay. Turkey benefited from positive political and economic news. On the political front, investors expressed confidence that newly elected President Abdullah Gul would maintain Turkey’s debt-friendly fiscal and monetary policies. Positive economic developments included an official rate cut in September 2007 that prompted expectations of further cuts, and successful efforts to bring down inflation.
Underperforming countries for the 12-month period ended October 31, 2007, included Venezuela at -2.17% and Argentina at 4.53%. Venezuela suffered from poor government policies, a drop in reserves and increased supply of bonds. Argentina was negatively impacted by skepticism over the accuracy of government economic data, and by the viability of fiscal and monetary policies and the willingness of the presumed next president to change those policies.
Emerging market debt in local currency terms (unhedged to the U.S. dollar) was significantly stronger than U.S. dollar-denominated debt. Local currency emerging market debt overall returned 19.78% for the 12-month reporting period due to strong local currencies and falling interest rates. Brazil and Turkey, two of the Fund’s largest local-currency holdings, significantly outperformed, posting strong returns of 37.33% and 60.40%, respectively. The Brazilian réal excelled versus the U.S. dollar and enhanced the gains from the Fund’s longstanding overweight position within Brazil. Dollar-denominated Brazilian sovereigns benefited from ongoing strength in economic fundamentals, as well as growing investor recognition that Brazil would continue to retire external debt. Lastly, the appreciation of the Turkish lira during the period under review magnified the positive impact of political and economic news on Turkish debt prices. The lira was one of the world’s strongest currencies versus the U.S. dollar, which served to boost returns of Turkish bonds in dollar terms.
| | |
| ALLIANCEBERNSTEIN EMERGING MARKET DEBT FUND • | | 3 |
HISTORICAL PERFORMANCE
An Important Note About the Value of Historical Performance
The performance shown on the following pages represents past performance and does not guarantee future results. Current performance may be lower or higher than the performance information shown. You may obtain performance information current to the most recent month-end by visiting www.alliancebernstein.com.
The investment return and principal value of an investment in the Fund will fluctuate, so that your shares, when redeemed, may be worth more or less than their original cost. You should consider the investment objectives, risks, charges and expenses of the Fund carefully before investing. For a free copy of the Fund’s prospectus, which contains this and other information, visit our website at www.alliancebernstein.com or call your financial advisor or AllianceBernstein Investments at 800.227.4618. You should read the prospectus carefully before you invest.
All fees and expenses related to the operation of the Fund have been deducted. NAV returns do not reflect sales charges; if sales charges were reflected, the Fund’s quoted performance would be lower. SEC returns reflect the applicable sales charges for each share class: a 4.25% maximum front-end sales charge for Class A shares; the applicable contingent deferred sales charge for Class B shares (3% year 1, 2% year 2, 1% year 3, 0% year 4); and a 1% 1 year contingent deferred sales charge for Class C shares. Returns for the different share classes will vary due to different expenses associated with each class. Performance assumes reinvestment of distributions and does not account for taxes.
Benchmark Disclosure
The unmanaged J.P. Morgan Emerging Markets Bond Index Global (JPM EMBI Global) does not reflect fees and expenses associated with the active management of a mutual fund portfolio. The JPM EMBI Global tracks total returns for U.S. dollar-denominated debt instruments issued by emerging market sovereign and quasi-sovereign entities, Brady bonds, loans and Eurobonds. An investor cannot invest directly in an index, and its results are not indicative of the performance for any specific investment, including the Fund.
A Word About Risk
A substantial amount of the Fund’s assets will be invested in foreign securities in emerging market nations, which may present market, credit, currency, liquidity, legal, political and other risks different from or greater than the risks of investing in developed foreign countries. Investment in the Fund includes risks not associated with funds that invest exclusively in U.S. issues. The Fund can invest a significant portion of its assets in the securities of a single issuer, making the Fund more susceptible to risks associated with a single economic, political or regulatory occurrence than a more diversified portfolio might be. Price fluctuation in the Fund’s portfolio securities may be caused by changes in interest rates or bond credit quality ratings. Changes in interest rates have a greater effect on bonds with longer maturities than on those with shorter maturities. Please note, as interest rates rise, existing bond prices fall and can cause the value of your investment in the Fund to decline. The Fund may invest in high-yield bonds (i.e., “junk bonds”), which involve a greater risk of default and price volatility than other bonds. Investing in below-investment grade bonds presents special risks, including credit risk. The Fund can utilize leverage as an investment strategy. When a fund borrows money or otherwise leverages its portfolio, it may be volatile because leverage tends to exaggerate the effect of any increase or decrease in the value of a fund’s investments. The Fund may create leverage through the use of derivatives. While the Fund invests principally in bonds and other fixed-income securities, in order to achieve its investment objectives, the Fund may at times use certain types of investment derivatives, such as options, futures, forwards and swaps. These instruments involve risks different from, and in certain cases, greater than, the risks presented by more traditional investments. These risks are fully discussed in the Fund’s prospectus.
(Historical Performance continued on next page)
| | |
| 4 | | • ALLIANCEBERNSTEIN EMERGING MARKET DEBT FUND |
Historical Performance
HISTORICAL PERFORMANCE
(continued from previous page)
| | | | | | |
| | | | | | |
THE FUND VS. ITS BENCHMARK PERIODS ENDED OCTOBER 31, 2007 | | Returns | | |
| | 6 Months | | 12 Months | | |
AllianceBernstein Emerging Market Debt Fund | | | | | | |
Class A | | 3.98% | | 11.54% | | |
| | | |
Class B | | 3.45% | | 10.51% | | |
| | | |
Class C | | 3.45% | | 10.50% | | |
| | | |
J.P. Morgan Emerging Markets Bond Index Global | | 2.64% | | 8.07% | | |
| | | |
| | | | | | |
GROWTH OF A $10,000 INVESTMENT IN THE FUND
10/31/97 TO 10/31/07
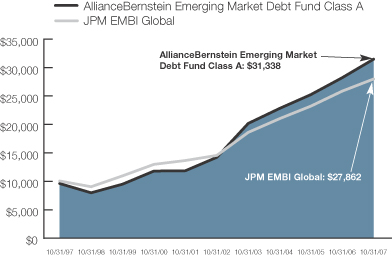
This chart illustrates the total value of an assumed $10,000 investment in AllianceBernstein Emerging Market Debt Fund Class A shares (from 10/31/97 to 10/31/07) as compared to its benchmark. The chart reflects the deduction of the maximum 4.25% sales charge from the initial $10,000 investment in the Fund and assumes the reinvestment of dividends and capital gains distributions.
See Historical Performance and Benchmark disclosures on previous page.
(Historical Performance continued on next page)
| | |
| ALLIANCEBERNSTEIN EMERGING MARKET DEBT FUND • | | 5 |
Historical Performance
HISTORICAL PERFORMANCE
(continued from previous page)
| | | | | | | | |
| AVERAGE ANNUAL RETURNS AS OF OCTOBER 31, 2007 | |
| | | NAV Returns | | | SEC Returns | | SEC Yields* | |
| | | | | | | | |
| Class A Shares | | | | | | | 6.01 | % |
1 Year | | 11.54 | % | | 6.78% | | | |
5 Years | | 17.24 | % | | 16.21% | | | |
10 Years | | 12.59 | % | | 12.10% | | | |
| | | | | | | | |
| Class B Shares | | | | | | | 5.54 | % |
1 Year | | 10.51 | % | | 7.51% | | | |
5 Years | | 16.30 | % | | 16.30% | | | |
10 Years(a) | | 12.03 | % | | 12.03% | | | |
| | | | | | | | |
| Class C Shares | | | | | | | 5.50 | % |
1 Year | | 10.50 | % | | 9.50% | | | |
5 Years | | 16.31 | % | | 16.31% | | | |
10 Years | | 11.70 | % | | 11.70% | | | |
| | | | | | | | |
SEC AVERAGE ANNUAL RETURNS (WITH SALES CHARGES) AS OF THE MOST RECENT CALENDAR QUARTER-END (SEPTEMBER 30, 2007) | |
| | | | | SEC Returns | | | |
| | | | | | | | |
| Class A Shares | | | | | | | | |
1 Year | | | | | 6.38% | | | |
5 Years | | | | | 17.73% | | | |
10 Years | | | | | 9.74% | | | |
| | | | | | | | |
| Class B Shares | | | | | | | | |
1 Year | | | | | 7.18% | | | |
5 Years | | | | | 17.80% | | | |
10 Years(a) | | | | | 9.68% | | | |
| | | | | | | | |
| Class C Shares | | | | | | | | |
1 Year | | | | | 9.18% | | | |
5 Years | | | | | 17.81% | | | |
10 Years | | | | | 9.36% | | | |
The Fund’s current prospectus fee table shows the Fund’s total annual operating expense ratios as 1.48%, 2.18% and 2.17% for Class A, Class B and Class C shares, respectively.
| (a) | Assumes conversion of Class B shares into Class A shares after six years. |
| * | SEC Yields are calculated based on SEC guidelines for the 30-day period ended October 31, 2007. |
See Historical Performance disclosures on page 4.
| | |
| 6 | | • ALLIANCEBERNSTEIN EMERGING MARKET DEBT FUND |
Historical Performance
FUND EXPENSES
As a shareholder of the Fund, you incur two types of costs: (1) transaction costs, including sales charges (loads) on purchase payments, contingent deferred sales charges on redemptions and (2) ongoing costs, including management fees; distribution (12b-1) fees; and other Fund expenses. This example is intended to help you understand your ongoing costs (in dollars) of investing in the Fund and to compare these costs with the ongoing costs of investing in other mutual funds.
The Example is based on an investment of $1,000 invested at the beginning of the period and held for the entire period as indicated below.
Actual Expenses
The first line of the table below provides information about actual account values and actual expenses. You may use the information in this line, together with the amount you invested, to estimate the expenses that you paid over the period. Simply divide your account value by $1,000 (for example, an $8,600 account value divided by $1,000 = 8.6), then multiply the result by the number in the first line under the heading entitled “Expenses Paid During Period” to estimate the expenses you paid on your account during this period.
Hypothetical Example for Comparison Purposes
The second line of the table below provides information about hypothetical account values and hypothetical expenses based on the Fund’s actual expense ratio and an assumed annual rate of return of 5% before expenses, which is not the Fund’s actual return. The hypothetical account values and expenses may not be used to estimate the actual ending account balance or expenses you paid for the period. You may use this information to compare the ongoing costs of investing in the Fund and other funds by comparing this 5% hypothetical example with the 5% hypothetical examples that appear in the shareholder reports of other funds.
Please note that the expenses shown in the table are meant to highlight your ongoing costs only and do not reflect any transactional costs, such as sales charges (loads), or contingent deferred sales charges on redemptions. Therefore, the second line of the table is useful in comparing ongoing costs only, and will not help you determine the relative total costs of owning different funds. In addition, if these transactional costs were included, your costs would have been higher.
| | | | | | | | | |
| | | Beginning
Account Value
May 1, 2007 | | Ending
Account Value
October 31, 2007 | | Expenses Paid
During Period* |
| Class A | | | | | | | | | |
Actual | | $ | 1,000 | | $ | 1,039.77 | | $ | 7.35 |
| Hypothetical (5% return before expenses) | | $ | 1,000 | | $ | 1,018.00 | | $ | 7.27 |
| Class B | | | | | | | | | |
Actual | | $ | 1,000 | | $ | 1,035.62 | | $ | 11.13 |
| Hypothetical (5% return before expenses) | | $ | 1,000 | | $ | 1,014.27 | | $ | 11.02 |
| Class C | | | | | | | | | |
Actual | | $ | 1,000 | | $ | 1,035.63 | | $ | 10.98 |
| Hypothetical (5% return before expenses) | | $ | 1,000 | | $ | 1,014.42 | | $ | 10.87 |
| * | Expenses are equal to the classes' annualized expense ratios of 1.43%, 2.17% and 2.14%, respectively, multiplied by the average account value over the period, multiplied by 184/365 (to reflect the one-half year period). |
| | |
| ALLIANCEBERNSTEIN EMERGING MARKET DEBT FUND • | | 7 |
Fund Expenses
PORTFOLIO SUMMARY
October 31, 2007
PORTFOLIO STATISTICS
Net Assets ($mil): $403.3
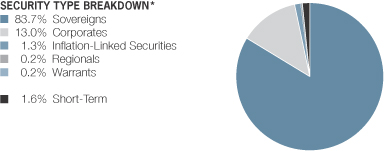
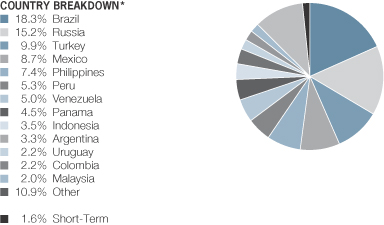
| * | All data are as of October 31, 2007. The Fund's security type and country breakdowns are expressed as a percentage of total investments and may vary over time. "Other" country weightings represents less than 2.0% in the following countries: Bulgaria, Costa Rica, Dominican Republic, Ecuador, El Salvador, Hong Kong, Hungary, Ireland, Jamaica, Kazakhstan, Lebanon, Nigeria, Pakistan, South Africa, South Korea, Ukraine and the United States. |
| | |
| 8 | | • ALLIANCEBERNSTEIN EMERGING MARKET DEBT FUND |
Portfolio Summary
PORTFOLIO OF INVESTMENTS
October 31, 2007
| | | | | | |
| | | Principal
Amount
(000) | | U.S. $ Value |
| |
| | | | | | |
SOVEREIGNS – 83.1% | | | | | | |
Argentina – 3.3% | | | | | | |
Argentina Bonos
10.50%, 6/12/12(a) | | ARS | 3,101 | | $ | 821,932 |
Republic of Argentina
5.389%, 8/03/12(a)(b) | | US$ | 6,521 | | | 5,919,649 |
8.28%, 12/31/33(a)(c) | | | 5,356 | | | 5,423,410 |
Series V
7.00%, 3/28/11(a) | | | 1,120 | | | 1,067,422 |
| | | | | | |
| | | | | | 13,232,413 |
| | | | | | |
Brazil – 16.3% | | | | | | |
Republic of Brazil
6.00%, 1/17/17(a) | | | 15,356 | | | 15,701,510 |
7.125%, 1/20/37(a) | | | 14,701 | | | 16,994,356 |
8.00%, 1/15/18(a) | | | 3,173 | | | 3,552,173 |
8.25%, 1/20/34(a) | | | 6,648 | | | 8,615,808 |
8.875%, 10/14/19-4/15/24(a) | | | 5,280 | | | 6,775,328 |
12.50%, 1/05/16(a) | | BRL | 21,650 | | | 14,186,057 |
| | | | | | |
| | | | | | 65,825,232 |
| | | | | | |
Bulgaria – 0.3% | | | | | | |
Republic of Bulgaria
8.25%, 1/15/15(a)(d) | | US$ | 1,124 | | | 1,328,006 |
| | | | | | |
| | |
Colombia – 2.0% | | | | | | |
Republic of Colombia
7.375%, 9/18/37(a) | | | 3,626 | | | 4,142,705 |
10.75%, 1/15/13(a) | | | 795 | | | 977,850 |
12.00%, 10/22/15(a) | | COP | 4,867,000 | | | 2,791,182 |
| | | | | | |
| | | | | | 7,911,737 |
| | | | | | |
Costa Rica – 0.5% | | | | | | |
Republic of Costa Rica
8.11%, 2/01/12(a)(d) | | US$ | 673 | | | 733,570 |
Republic of Costa Rica STP
Zero Coupon, 1/10/08 | | | 1,146 | | | 1,131,063 |
| | | | | | |
| | | | | | 1,864,633 |
| | | | | | |
Dominican Republic – 1.2% | | | | | | |
Dominican Republic
8.625%, 4/20/27(a)(d) | | | 1,223 | | | 1,406,450 |
Dominican Republic STP
Zero Coupon, 8/04/08 | | DOP | 1,583 | | | 1,429,132 |
Zero Coupon, 5/12/08 | | US$ | 1,725 | | | 1,552,860 |
Zero Coupon, 7/23/09 | | | 816 | | | 656,932 |
| | | | | | |
| | | | | | 5,045,374 |
| | | | | | |
Ecuador – 1.4% | | | | | | |
Republic of Ecuador
10.00%, 8/15/30(a)(d)(e) | | | 6,002 | | | 5,761,920 |
| | | | | | |
| | |
| ALLIANCEBERNSTEIN EMERGING MARKET DEBT FUND • | | 9 |
Portfolio of Investments
| | | | | | |
| | | Principal
Amount
(000) | | U.S. $ Value |
| |
| | | | | | |
El Salvador – 0.7% | | | | | | |
Republic of El Salvador
7.625%, 9/21/34(a)(d) | | US$ | 872 | | $ | 1,011,520 |
7.65%, 6/15/35(a)(d) | | | 1,711 | | | 1,984,760 |
| | | | | | |
| | | | | | 2,996,280 |
| | | | | | |
Hungary – 1.0% | | | | | | |
Hungary
6.50%, 8/12/09(a) | | HUF | 536,170 | | | 3,065,815 |
Republic of Hungary
Series 10/C
6.75%, 4/12/10(a) | | | 180,080 | | | 1,033,138 |
| | | | | | |
| | | | | | 4,098,953 |
| | | | | | |
Indonesia – 3.5% | | | | | | |
Indonesia – Recap Linked Note
11.00%, 10/15/14 | | US$ | 1,543 | | | 1,627,299 |
12.90%, 6/15/22 | | | 1,930 | | | 2,368,882 |
Republic of Indonesia
6.625%, 2/17/37(a)(d) | | | 2,560 | | | 2,512,288 |
6.75%, 3/10/14(a)(d) | | | 1,835 | | | 1,912,862 |
6.875%, 3/09/17(a)(d) | | | 407 | | | 429,385 |
6.875%, 3/09/17(c)(d) | | | 1,900 | | | 2,004,500 |
7.50%, 1/15/16(a)(d) | | | 1,000 | | | 1,090,000 |
8.50%, 10/12/35(a)(d) | | | 1,645 | | | 2,005,844 |
| | | | | | |
| | | | | | 13,951,060 |
| | | | | | |
Jamaica – 0.3% | | | | | | |
Government of Jamaica
9.25%, 10/17/25(a) | | | 324 | | | 366,120 |
10.625%, 6/20/17(a) | | | 835 | | | 997,825 |
| | | | | | |
| | | | | | 1,363,945 |
| | | | | | |
Lebanon – 1.1% | | | | | | |
Lebanese Republic
7.875%, 5/20/11(a)(d) | | | 875 | | | 848,750 |
10.125%, 8/06/08(a)(d) | | | 3,048 | | | 3,086,100 |
11.625%, 5/11/16(a)(d) | | | 394 | | | 441,280 |
| | | | | | |
| | | | | | 4,376,130 |
| | | | | | |
Malaysia – 1.3% | | | | | | |
Malaysia
7.50%, 7/15/11(a) | | | 5,000 | | | 5,428,315 |
| | | | | | |
| | |
Mexico – 7.3% | | | | | | |
Mexican Bonos
Series M
9.00%, 12/22/11(a) | | MXN | 33,515 | | | 3,292,354 |
Series M
20 10.00%, 12/05/24(a) | | | 43,840 | | | 4,913,959 |
Series MI10
9.00%, 12/20/12(a) | | | 19,297 | | | 1,903,971 |
| | |
| 10 | | • ALLIANCEBERNSTEIN EMERGING MARKET DEBT FUND |
Portfolio of Investments
| | | | | | |
| | | Principal
Amount
(000) | | U.S. $ Value |
| |
| | | | | | |
United Mexican States
5.625%, 1/15/17(a) | | US$ | 6,500 | | $ | 6,594,250 |
11.375%, 9/15/16(a) | | | 2,901 | | | 4,148,430 |
Series A
6.375%, 1/16/13(a) | | | 3,578 | | | 3,805,203 |
6.75%, 9/27/34(a) | | | 1,450 | | | 1,621,825 |
8.00%, 9/24/22(a) | | | 2,495 | | | 3,078,830 |
| | | | | | |
| | | | | | 29,358,822 |
| | | | | | |
Pakistan – 0.3% | | | | | | |
Republic of Pakistan
6.875%, 6/01/17(a)(d) | | | 1,227 | | | 1,116,570 |
| | | | | | |
| | |
Panama – 4.5% | | | | | | |
Republic of Panama
6.70%, 1/26/36(a) | | | 1,317 | | | 1,386,143 |
7.125%, 1/29/26(a) | | | 3,560 | | | 3,924,900 |
7.25%, 3/15/15(a) | | | 1,733 | | | 1,897,635 |
8.875%, 9/30/27(a) | | | 2,709 | | | 3,491,901 |
9.375%, 4/01/29(a) | | | 5,435 | | | 7,378,012 |
| | | | | | |
| | | | | | 18,078,591 |
| | | | | | |
Peru – 4.8% | | | | | | |
Peru Bono Soberano
6.90%, 8/12/37(a) | | PEN | 3,145 | | | 1,097,915 |
8.20%, 8/12/26 | | | 8,270 | | | 3,318,694 |
Series
7 8.60%, 8/12/17(a) | | | 11,995 | | | 4,686,997 |
Republic of Peru
7.35%, 7/21/25(a) | | US$ | 4,339 | | | 4,989,850 |
8.375%, 5/03/16(a) | | | 1,176 | | | 1,384,740 |
8.75%, 11/21/33(a) | | | 2,738 | | | 3,655,230 |
9.875%, 2/06/15(a) | | | 32 | | | 40,000 |
| | | | | | |
| | | | | | 19,173,426 |
| | | | | | |
Philippines – 7.4% | | | | | | |
Republic of Philippines
7.50%, 9/25/24(a) | | | 3,144 | | | 3,497,700 |
7.75%, 1/14/31(a) | | | 2,924 | | | 3,333,360 |
8.25%, 1/15/14(a) | | | 6,000 | | | 6,757,200 |
8.875%, 3/17/15(a) | | | 1,248 | | | 1,466,400 |
9.50%, 10/21/24-2/02/30(a) | | | 2,473 | | | 3,286,644 |
9.875%, 1/15/19(c) | | | 1,850 | | | 2,405,000 |
10.625%, 3/16/25(a) | | | 6,239 | | | 8,899,933 |
| | | | | | |
| | | | | | 29,646,237 |
| | | | | | |
Russia – 8.6% | | | | | | |
Russian Federation
7.50%, 3/31/30(a)(d) | | | 21,722 | | | 24,491,517 |
11.00%, 7/24/18(a)(d) | | | 1,615 | | | 2,291,685 |
| | |
| ALLIANCEBERNSTEIN EMERGING MARKET DEBT FUND • | | 11 |
Portfolio of Investments
| | | | | | |
| | | Principal
Amount
(000) | | U.S. $ Value |
| |
| | | | | | |
Russian Ministry of Finance
Series V
3.00%, 5/14/08(a) | | US$ | 5,947 | | $ | 5,865,526 |
Series VII 3.00%, 5/14/11(a) | | | 2,220 | | | 2,045,286 |
| | | | | | |
| | | | | | 34,694,014 |
| | | | | | |
South Africa – 0.5% | | | | | | |
Republic of South Africa
5.875%, 5/30/22(a) | | | 1,002 | | | 1,007,010 |
7.375%, 4/25/12(a) | | | 825 | | | 899,250 |
| | | | | | |
| | | | | | 1,906,260 |
| | | | | | |
Turkey – 9.8% | | | | | | |
Republic of Turkey
6.875%, 3/17/36(a) | | | 7,016 | | | 6,954,610 |
7.00%, 6/05/20(a) | | | 5,700 | | | 5,938,260 |
7.375%, 2/05/25(a) | | | 10,649 | | | 11,301,784 |
9.50%, 1/15/14(a) | | | 641 | | | 753,175 |
11.00%, 1/14/13(a) | | | 816 | | | 999,600 |
Turkey Government Bond
Zero Coupon, 11/26/08(a) | | TRY | 1,716 | | | 1,250,047 |
Zero Coupon, 2/04/09(a) | | | 7,327 | | | 5,175,873 |
Zero Coupon, 5/06/09(a) | | | 903 | | | 615,231 |
16.00%, 3/07/12(a) | | | 7,490 | | | 6,718,295 |
| | | | | | |
| | | | | | 39,706,875 |
| | | | | | |
Ukraine – 0.7% | | | | | | |
Government of Ukraine
6.58%, 11/21/16(a)(d) | | US$ | 1,368 | | | 1,391,940 |
7.65%, 6/11/13(a)(d) | | | 1,411 | | | 1,520,352 |
| | | | | | |
| | | | | | 2,912,292 |
| | | | | | |
Uruguay – 1.4% | | | | | | |
Republic of Uruguay
7.625%, 3/21/36(a) | | | 550 | | | 612,700 |
7.875%, 1/15/33(a)(f) | | | 1,377 | | | 1,549,608 |
9.25%, 5/17/17(a) | | | 2,814 | | | 3,404,940 |
| | | | | | |
| | | | | | 5,567,248 |
| | | | | | |
Venezuela – 4.9% | | | | | | |
Republic of Venezuela
5.75%, 2/26/16(a) | | | 3,342 | | | 2,882,044 |
6.00%, 12/09/20(a) | | | 2,097 | | | 1,756,237 |
7.00%, 12/01/18(a)(d) | | | 4,632 | | | 4,238,280 |
7.65%, 4/21/25(a) | | | 5,097 | | | 4,829,408 |
9.25%, 9/15/27(a) | | | 2,592 | | | 2,848,608 |
9.375%, 1/13/34(a) | | | 3,019 | | | 3,320,900 |
| | | | | | |
| | | | | | 19,875,477 |
| | | | | | |
Total Sovereigns
(cost $306,503,282) | | | | | | 335,219,810 |
| | | | | | |
| | |
| 12 | | • ALLIANCEBERNSTEIN EMERGING MARKET DEBT FUND |
Portfolio of Investments
| | | | | | |
| | | Principal
Amount
(000) | | U.S. $ Value |
| |
| | | | | | |
CORPORATES – 12.9% | | | | | | |
Brazil – 1.4% | | | | | | |
Banco BMG SA
9.15%, 1/15/16(a)(d) | | US$ | 1,300 | | $ | 1,381,250 |
Republic of Brazil
8.75%, 2/04/25(a) | | | 1,799 | | | 2,356,690 |
Vale Overseas Ltd.
6.875%, 11/21/36(a) | | | 1,995 | | | 2,073,888 |
| | | | | | |
| | | | | | 5,811,828 |
| | | | | | |
El Salvador – 0.3% | | | | | | |
MMG Fiduciary (AES El Salvador)
6.75%, 2/01/16(a)(d) | | | 1,200 | | | 1,197,360 |
| | | | | | |
| | |
Hong Kong – 0.8% | | | | | | |
Chaoda Modern Agriculture
7.75%, 2/08/10(a)(d) | | | 1,523 | | | 1,503,963 |
Noble Group Ltd.
6.625%, 3/17/15(a)(d) | | | 1,768 | | | 1,655,930 |
| | | | | | |
| | | | | | 3,159,893 |
| | | | | | |
Indonesia – 0.1% | | | | | | |
Majapahit Holding BV
7.875%, 6/29/37(a)(d) | | | 200 | | | 198,000 |
| | | | | | |
| | |
Ireland – 0.2% | | | | | | |
GPB Eurobond (Gazprombk)
6.50%, 9/23/15(a) | | | 750 | | | 717,088 |
| | | | | | |
| | |
Jamaica – 0.3% | | | | | | |
Digicel Ltd.
9.25%, 9/01/12(a)(d) | | | 1,344 | | | 1,377,600 |
| | | | | | |
| | |
Kazakhstan – 0.6% | | | | | | |
ALB Finance BV
9.25%, 9/25/13(a)(d) | | | 1,136 | | | 981,595 |
Kazkommerts International BV
8.50%, 4/16/13(a)(d) | | | 1,150 | | | 1,095,375 |
Tengizchevroil Finance Co.
6.124%, 11/15/14(a)(d) | | | 486 | | | 466,560 |
| | | | | | |
| | | | | | 2,543,530 |
| | | | | | |
Malaysia – 0.6% | | | | | | |
Petronas Capital Ltd.
7.00%, 5/22/12(a)(d) | | | 2,322 | | | 2,496,986 |
| | | | | | |
| | |
Mexico – 1.4% | | | | | | |
Pemex Proj Fdg Master Trust
5.75%, 3/01/18(a)(d) | | | 5,458 | | | 5,504,393 |
| | | | | | |
| | |
| ALLIANCEBERNSTEIN EMERGING MARKET DEBT FUND • | | 13 |
Portfolio of Investments
| | | | | | |
| | | Principal
Amount
(000) | | U.S. $ Value |
| |
| | | | | | |
Peru – 0.6% | | | | | | |
IIRSA Norte Finance Ltd.
8.75%, 5/30/24(a)(d) | | US$ | 836 | | $ | 973,583 |
Southern Copper Corp.
7.50%, 7/27/35(a) | | | 1,140 | | | 1,242,600 |
| | | | | | |
| | | | | | 2,216,183 |
| | | | | | |
Russia – 6.4% | | | | | | |
Alfa Bond Issuance PLC
8.625%, 12/09/15(a)(g) | | | 900 | | | 868,050 |
Citigroup (JSC Severstal)
9.25%, 4/19/14(a)(d) | | | 810 | | | 883,394 |
Evraz Group SA
8.25%, 11/10/15(a)(d) | | | 1,674 | | | 1,705,471 |
Gallery Capital SA
10.125%, 5/15/13(a)(d) | | | 960 | | | 903,795 |
Gaz Capital for Gazprom
6.51%, 3/07/22(a)(d) | | | 7,193 | | | 7,008,859 |
Gazprom
6.212%, 11/22/16(d) | | | 750 | | | 737,025 |
6.212%, 11/22/16(a)(d) | | | 624 | | | 615,264 |
6.51%, 3/07/22(a)(d) | | | 2,280 | | | 2,234,400 |
Gazstream SA
5.625%, 7/22/13(a)(d) | | | 585 | | | 577,945 |
Mobile Telesystems Finance
9.75%, 1/30/08(a)(d) | | | 1,500 | | | 1,510,250 |
Red Arrow Intl Leasing PLC
8.375%, 3/31/12(a) | | RUB | 53,076 | | | 2,180,322 |
Russia Agriculture Bank Rshb C
6.299%, 5/15/17(a)(d) | | US$ | 1,060 | | | 1,004,244 |
Russian Standard Finance
7.50%, 10/07/10(a)(d) | | | 1,273 | | | 1,161,613 |
TNK-BP Finance SA
7.50%, 7/18/16(a)(d) | | | 2,308 | | | 2,248,653 |
Tyumen Oil Co.
11.00%, 11/06/07(a)(d) | | | 280 | | | 280,280 |
VTB Capital SA
6.609%, 10/31/12(a)(d) | | | 2,055 | | | 2,051,852 |
| | | | | | |
| | | | | | 25,971,417 |
| | | | | | |
South Korea – 0.1% | | | | | | |
C&M Finance Ltd.
8.10%, 2/01/16(a)(d) | | | 530 | | | 519,400 |
| | | | | | |
| | |
United States – 0.1% | | | | | | |
JPMorgan Chase
7.00%, 6/28/17(a)(d) | | RUB | 14,000 | | | 540,517 |
| | | | | | |
| | |
Total Corporates
(cost $52,287,506) | | | | | | 52,254,195 |
| | | | | | |
| | | | | | |
| | |
| 14 | | • ALLIANCEBERNSTEIN EMERGING MARKET DEBT FUND |
Portfolio of Investments
| | | | | | |
| | | Principal
Amount
(000) | | U.S. $ Value |
| |
| | | | | | |
INFLATION-LINKED SECURITIES – 1.3% | | | |
Brazil – 0.5% | | | | | | |
Unibanco Grand Cayman
8.70%, 2/11/10(a)(d) | | BRL | 3,100 | | $ | 1,795,712 |
| | | | | | |
Uruguay – 0.8% | | | | | | |
Uruguay Government International Bond
3.70%, 6/26/37(a) | | UYU | 42,646 | | | 1,804,016 |
4.25%, 4/05/27(a) | | | 5,814 | | | 267,466 |
5.00%, 9/14/18(a) | | | 26,569 | | | 1,302,792 |
| | | | | | |
| | | | | | 3,374,274 |
| | | | | | |
Total Inflation-Linked Securities
(cost $4,536,947) | | | | | | 5,169,986 |
| | | | | | |
| | | | | | |
REGIONALS – 0.2% | | | | | | |
Colombia – 0.2% | | | | | | |
Bogota Distrio Capital
9.75%, 7/26/28(a)(d)
(cost $877,104) | | COP | 1,814,000 | | | 901,805 |
| | | | | | |
| | |
| | | Shares | | |
WARRANTS – 0.2% | | | | | | |
Central Bank of Nigeria,
expiring 11/15/20(a)(h) | | | 2,500 | | | 637,500 |
Republic of Venezuela,
expiring 4/15/20(h) | | | 48,195 | | | 0 |
| | | | | | |
Total Warrants
(cost $0) | | | | | | 637,500 |
| | | | | | |
| | | | | | |
| | |
| | | Principal
Amount
(000) | | |
SHORT-TERM INVESTMENTS – 1.6% | | | |
Time Deposit – 1.6% | | | | | | |
The Bank of New York Mellon Corp. 3.50%, 11/01/07 | | US$ | 699 | | | 699,000 |
Societe Generale
4.45%, 11/01/07 | | | 5,600 | | | 5,600,000 |
| | | | | | |
| | |
Total Short-Term Investments
(cost $6,299,000) | | | | | | 6,299,000 |
| | | | | | |
| | |
Total Investments – 99.3%
(cost $370,503,839) | | | | | | 400,482,296 |
Other assets less liabilities – 0.7% | | | | | | 2,778,241 |
| | | | | | |
| | |
Net Assets – 100.0% | | | | | $ | 403,260,537 |
| | | | | | |
| | |
| ALLIANCEBERNSTEIN EMERGING MARKET DEBT FUND • | | 15 |
Portfolio of Investments
CREDIT DEFAULT SWAP CONTRACTS (see Note D)
| | | | | | | | | | | | |
Swap Counterparty &
Referenced Obligation | | Notional
Amount
(000) | | Interest
Rate | | | Termination
Date | | Unrealized
Appreciation/
(Depreciation) | |
Sale Contracts: | | | | | | | | | | | | |
Citigroup Global Markets, Inc.
(Federal Republic of Brazil
12.25%, 3/6/30) | | $ | 7,110 | | 3.09 | % | | 8/20/10 | | $ | 515,774 | |
Citigroup Global Markets, Inc.
(Republic of Philippines 10.625%, 3/16/25) | | | 1,410 | | 4.95 | | | 3/20/09 | | | 91,419 | |
JPMorgan Chase
(OAO Gazprom
10.50%, 10/21/09) | | | 4,560 | | 1.04 | | | 10/20/10 | | | 7,321 | |
Lehman Brothers
(Republic of Venzuela
9.25%, 9/15/27) | | | 3,820 | | 0.69 | | | 4/20/08 | | | (12,546 | ) |
Morgan Stanley
(Federal Republic of Brazil
10.125%, 5/15/27) | | | 2,000 | | 17.75 | | | 2/13/08 | | | 179,217 | |
FORWARD CURRENCY EXCHANGE CONTRACTS (see Note D)
| | | | | | | | | | | | |
| | | Contract
Amount
(000) | | U.S. $
Value on
Origination
Date | | U.S. $
Value at
October 31, 2007 | | Unrealized
Appreciation/
(Depreciation) | |
Sale Contracts: | | | | | | | | | | | | |
Mexican Nuevo Peso
settling 12/06/07 | | 19,749 | | $ | 1,816,572 | | $ | 1,847,150 | | $ | (30,578 | ) |
Mexican Nuevo Peso
settling 12/06/07 | | 47,216 | | | 4,305,436 | | | 4,416,151 | | | (110,715 | ) |
REVERSE REPURCHASE AGREEMENTS (see Note D)
| | | | | | | | |
| Broker | | Interest Rate | | | Maturity | | Amount |
ABN Amro Securities | | 3.75 | % | | 12/31/07 | | $ | 1,941,698 |
UBS AG London | | 4.50 | | | 12/31/07 | | | 5,107,613 |
UBS Warburg | | 4.50 | | | 12/31/07 | | | 2,249,133 |
| | | | | | | | |
| | | | | | | $ | 9,298,444 |
| | | | | | | | |
| (a) | Position, or a portion thereof, has been segregated to collateralize forward currency exchange contracts. The aggregate market value of these securities amounted to $385,737,539. |
| (b) | Floating Rate Security. Stated interest rate was in effect at October 31, 2007. |
| (c) | Position, or a portion thereof, has been segregated to collateralize reverse repurchase agreements. The aggregate market value of these securities amounted to $9,781,395. |
| | |
| 16 | | • ALLIANCEBERNSTEIN EMERGING MARKET DEBT FUND |
Portfolio of Investments
| (d) | Security is exempt from registration under Rule 144A of the Securities Act of 1933. These securities are considered liquid and may be resold in transactions exempt from registration, normally to qualified institutional buyers. At October 31, 2007, the aggregate market value of these securities amounted to $107,120,653 or 26.6% of net assets. |
| (e) | Coupon rate adjusts periodically based upon a predetermined schedule. Stated interest rate in effect at October 31, 2007. |
| (f) | Pay-In-Kind Payments (PIK). |
| (g) | Variable rate coupon, rate shown as of October 31, 2007. |
| (h) | Non-income producing security. |
| See | notes to financial statements. |
| | |
| ALLIANCEBERNSTEIN EMERGING MARKET DEBT FUND • | | 17 |
Portfolio of Investments
STATEMENT OF ASSETS & LIABILITIES
October 31, 2007
| | | |
| Assets | | | |
Investments in securities, at value (cost $370,503,839) | | $ | 400,482,296 |
Cash | | | 3,512,698 |
Foreign cash, at value (cost $28) | | | 2,057 |
Receivable for investment securities sold | | | 14,689,295 |
Interest receivable | | | 6,534,229 |
Due from broker | | | 5,106,975 |
Receivable for capital stock sold | | | 2,060,599 |
Unrealized appreciation of credit default swap contracts | | | 793,731 |
| | | |
Total assets | | | 433,181,880 |
| | | |
| Liabilities | | | |
Due to broker | | | 5,691,201 |
Unrealized depreciation of forward
currency exchange contracts | | | 141,293 |
Unrealized depreciation of credit default swap contracts | | | 12,546 |
Payable for investment securities purchased | | | 11,137,674 |
Reverse repurchase agreements | | | 9,298,444 |
Payable for capital stock redeemed | | | 2,158,966 |
Dividends payable | | | 715,955 |
Distribution fee payable | | | 174,455 |
Advisory fee payable | | | 171,069 |
Transfer Agent fee payable | | | 24,981 |
Administrative fee payable | | | 16,826 |
Accrued expenses | | | 377,933 |
| | | |
Total liabilities | | | 29,921,343 |
| | | |
Net Assets | | $ | 403,260,537 |
| | | |
| Composition of Net Assets | | | |
Capital stock, at par | | $ | 44,588 |
Additional paid-in capital | | | 362,625,579 |
Undistributed net investment income | | | 847,743 |
Accumulated net realized gain on investment
and foreign currency transactions | | | 9,053,252 |
Net unrealized appreciation of investments
and foreign currency denominated assets and liabilities | | | 30,689,375 |
| | | |
| | $ | 403,260,537 |
| | | |
Net Asset Value Per Share—9 billion shares of capital stock authorized, $.001 par value
| | | | | | | | | |
| Class | | Net Assets | | Shares
Outstanding | | Net Asset
Value | |
| A | | $ | 281,677,459 | | 31,240,337 | | $ | 9.02 | * |
| | |
| B | | $ | 35,057,888 | | 3,855,003 | | $ | 9.09 | |
| | |
| C | | $ | 86,525,190 | | 9,492,660 | | $ | 9.11 | |
| | |
| * | The maximum offering price per share for Class A shares was $9.42 which reflects a sales charge of 4.25%. |
| See | notes to financial statements. |
| | |
| 18 | | • ALLIANCEBERNSTEIN EMERGING MARKET DEBT FUND |
Statement of Assets & Liabilities
STATEMENT OF OPERATIONS
Year Ended October 31, 2007
| | | | | | | | |
| Investment Income | | | | | | | | |
Interest | | | | | | $ | 29,738,631 | |
| Expenses | | | | | | | | |
Advisory fee (see Note B) | | $ | 1,948,219 | | | | | |
Distribution fee—Class A | | | 783,142 | | | | | |
Distribution fee—Class B | | | 402,173 | | | | | |
Distribution fee—Class C | | | 883,791 | | | | | |
Transfer agency—Class A | | | 323,246 | | | | | |
Transfer agency—Class B | | | 63,818 | | | | | |
Transfer agency—Class C | | | 118,913 | | | | | |
Custodian | | | 336,940 | | | | | |
Printing | | | 189,035 | | | | | |
Audit | | | 84,281 | | | | | |
Administrative | | | 80,284 | | | | | |
Registration | | | 67,594 | | | | | |
Legal | | | 51,709 | | | | | |
Directors’ fees | | | 41,520 | | | | | |
Miscellaneous | | | 14,031 | | | | | |
| | | | | | | | |
Total expenses before interest expense | | | 5,388,696 | | | | | |
Interest expense | | | 1,041,877 | | | | | |
| | | | | | | | |
Total expenses | | | 6,430,573 | | | | | |
Less: expense offset arrangement
(see Note B) | | | (16,726 | ) | | | | |
| | | | | | | | |
Net expenses | | | | | | | 6,413,847 | |
| | | | | | | | |
Net investment income | | | | | | | 23,324,784 | |
| | | | | | | | |
| Realized and Unrealized Gain (Loss) on Investment and Foreign Currency Transactions | | | | | | | | |
Net realized gain on: | | | | | | | | |
Investment transactions | | | | | | | 9,969,077 | |
Swap contracts | | | | | | | 1,352,527 | |
Foreign currency transactions | | | | | | | 2,670,956 | |
Net change in unrealized
appreciation/depreciation of: | | | | | | | | |
Investments | | | | | | | 3,912,675 | |
Swap contracts | | | | | | | (983,718 | ) |
Foreign currency denominated assets and liabilities | | | | | | | 265,640 | |
| | | | | | | | |
Net gain on investment and foreign currency transactions | | | | | | | 17,187,157 | |
| | | | | | | | |
Net Increase in Net Assets from Operations | | | | | | $ | 40,511,941 | |
| | | | | | | | |
See notes to financial statements.
| | |
| ALLIANCEBERNSTEIN EMERGING MARKET DEBT FUND • | | 19 |
Statement of Operations
STATEMENT OF CHANGES IN NET ASSETS
| | | | | | | | |
| | | Year Ended
October 31,
2007 | | | Year Ended
October 31,
2006 | |
Increase (Decrease) in Net Assets
from Operations | | | | | | | | |
Net investment income | | $ | 23,324,784 | | | $ | 22,465,806 | |
Net realized gain on investment and foreign currency transactions | | | 13,992,560 | | | | 14,925,917 | |
Net change in unrealized appreciation/depreciation of investments and foreign currency denominated assets and liabilities | | | 3,194,597 | | | | 2,281,323 | |
| | | | | | | | |
Net increase in net assets from operations | | | 40,511,941 | | | | 39,673,046 | |
Dividends and Distributions
to Shareholders from | | | | | | | | |
Net investment income | | | | | | | | |
Class A | | | (16,926,254 | ) | | | (15,229,164 | ) |
Class B | | | (2,290,180 | ) | | | (2,891,064 | ) |
Class C | | | (5,041,651 | ) | | | (5,286,303 | ) |
Net realized gain on investment and foreign currency transactions | | | | | | | | |
Class A | | | (9,777,229 | ) | | | (3,722,512 | ) |
Class B | | | (1,705,256 | ) | | | (860,065 | ) |
Class C | | | (3,425,008 | ) | | | (1,484,665 | ) |
| Capital Stock Transactions | | | | | | | | |
Net increase (decrease) | | | 32,973,033 | | | | (201,807 | ) |
| | | | | | | | |
Total increase | | | 34,319,396 | | | | 9,997,466 | |
| Net Assets | | | | | | | | |
Beginning of period | | | 368,941,141 | | | | 358,943,675 | |
| | | | | | | | |
End of period (including undistributed/(distributions in excess of) net investment income of $847,743 and ($2,471,655), respectively) | | $ | 403,260,537 | | | $ | 368,941,141 | |
| | | | | | | | |
See notes to financial statements.
| | |
| 20 | | • ALLIANCEBERNSTEIN EMERGING MARKET DEBT FUND |
Statement of Changes in Net Assets
NOTES TO FINANCIAL STATEMENTS
October 31, 2007
NOTE A
Significant Accounting Policies
AllianceBernstein Emerging Market Debt Fund, Inc. (the “Fund”) was incorporated in the State of Maryland on December 2, 1993, as a non-diversified, open-end management investment company. The Fund offers Class A, Class B and Class C shares. Class A shares are sold with a front-end sales charge of up to 4.25% for purchases not exceeding $1,000,000. With respect to purchases of $1,000,000 or more, Class A shares redeemed within one year of purchase may be subject to a contingent deferred sales charge of 1%. Class B shares are currently sold with a contingent deferred sales charge which declines from 3% to zero depending on the period of time the shares are held. Class B shares will automatically convert to Class A shares six years after the end of the calendar month of purchase. Class C shares are subject to a contingent deferred sales charge of 1% on redemptions made within the first year after purchase. All three classes of shares have identical voting, dividend, liquidation and other rights, except that the classes bear different distribution and transfer agency expenses. Each class has exclusive voting rights with respect to its distribution plan. The financial statements have been prepared in conformity with U.S. generally accepted accounting principles, which require management to make certain estimates and assumptions that affect the reported amounts of assets and liabilities in the financial statements and amounts of income and expenses during the reporting period. Actual results could differ from those estimates. The following is a summary of significant accounting policies followed by the Fund.
1. Security Valuation
Portfolio securities are valued at their current market value determined on the basis of market quotations or, if market quotations are not readily available or are deemed unreliable, at “fair value” as determined in accordance with procedures established by and under the general supervision of the Fund’s Board of Directors.
In general, the market value of securities which are readily available and deemed reliable are determined as follows. Securities listed on a national securities exchange (other than securities listed on The NASDAQ Stock Market, Inc. (“NASDAQ”)) or on a foreign securities exchange are valued at the last sale price at the close of the exchange or foreign securities exchange. If there has been no sale on such day, the securities are valued at the mean of the closing bid and asked prices on such day. Securities listed on more than one exchange are valued by reference to the principal exchange on which the securities are traded; securities listed only on NASDAQ are valued in accordance with the NASDAQ Official Closing Price; listed put or call options are valued at the last sale price. If there has been no sale on that day, such securities will be valued at the closing bid prices on that day; open futures contracts and options thereon are valued using the closing settlement price or, in the absence of such a price, the most recent quoted bid price. If there are no quotations available for the day of valuation, the last available closing settlement price is used; securities traded in the
| | |
| ALLIANCEBERNSTEIN EMERGING MARKET DEBT FUND • | | 21 |
Notes to Financial Statements
over-the-counter market, (“OTC”) are valued at the mean of the current bid and asked prices as reported by the National Quotation Bureau or other comparable sources; U.S. Government securities and other debt instruments having 60 days or less remaining until maturity are valued at amortized cost if their original maturity was 60 days or less; or by amortizing their fair value as of the 61st day prior to maturity if their original term to maturity exceeded 60 days; fixed-income securities, including mortgage backed and asset backed securities, may be valued on the basis of prices provided by a pricing service or at a price obtained from one or more of the major broker/dealers. In cases where broker/dealer quotes are obtained, AllianceBernstein L.P. (the “Adviser”) may establish procedures whereby changes in market yields or spreads are used to adjust, on a daily basis, a recently obtained quoted price on a security; and OTC and other derivatives are valued on the basis of a quoted bid price or spread from a major broker/ dealer in such security.
Securities for which market quotations are not readily available (including restricted securities) or are deemed unreliable are valued at fair value. Factors considered in making this determination may include, but are not limited to, information obtained by contacting the issuer, analysts, analysis of the issuer’s financial statements or other available documents. In addition, the Fund may use fair value pricing for securities primarily traded in non-U.S. markets because, most foreign markets close well before the Fund values its securities at 4:00 p.m., Eastern Time. The earlier close of these foreign markets gives rise to the possibility that significant events, including broad market moves, may have occurred in the interim and may materially affect the value of those securities.
2. Currency Translation
Assets and liabilities denominated in foreign currencies and commitments under forward currency exchange contracts are translated into U.S. dollars at the mean of the quoted bid and asked prices of such currencies against the U.S. dollar. Purchases and sales of portfolio securities are translated into U.S. dollars at the rates of exchange prevailing when such securities were acquired or sold. Income and expenses are translated into U.S. dollars at rates of exchange prevailing when accrued.
Net realized gain or loss on foreign currency transactions represents foreign exchange gains and losses from sales and maturities of foreign fixed income investments, foreign currency exchange contracts, holding of foreign currencies, currency gains or losses realized between the trade and settlement dates on foreign investment transactions, and the difference between the amounts of dividends, interest and foreign withholding taxes recorded on the Fund’s books and the U.S. dollar equivalent amounts actually received or paid. Net unrealized currency gains and losses from valuing foreign currency denominated assets and liabilities at period end exchange rates are reflected as a component of net unrealized appreciation and depreciation of investments and foreign currency denominated assets and liabilities.
| | |
| 22 | | • ALLIANCEBERNSTEIN EMERGING MARKET DEBT FUND |
Notes to Financial Statements
3. Taxes
It is the Fund’s policy to meet the requirements of the Internal Revenue Code applicable to regulated investment companies and to distribute all of its investment company taxable income and net realized gains, if any, to shareholders. Therefore, no provisions for federal income or excise taxes are required. The Fund may be subject to taxes imposed by countries in which it invests. Such taxes are generally based on income and/or capital gains earned or repatriated. Taxes are accrued and applied to net investment income, net realized gains and net unrealized appreciation/depreciation as such income and/or gains are earned.
4. Investment Income and Investment Transactions
Interest income is accrued daily. Investment transactions are accounted for on the date securities are purchased or sold. Investment gains and losses are determined on the identified cost basis. The Fund amortizes premiums and accretes discounts as adjustments to interest income.
5. Class Allocations
All income earned and expenses incurred by the Fund are borne on a pro-rata basis by each settled class of shares, based on the proportionate interest in the Fund represented by the net assets of such class, except for class specific expenses which are allocated to the respective class. Realized and unrealized gains and losses are allocated among the various share classes based on their respective net assets.
6. Dividends and Distributions
Dividends and distributions to shareholders are recorded on the ex-dividend date. Income and capital gains distributions are determined in accordance with federal tax regulations and may differ from those determined in accordance with U.S. generally accepted accounting principles. To the extent these differences are permanent, such amounts are reclassified within the capital accounts based on their federal tax basis treatment; temporary differences do not require such reclassification.
NOTE B
Advisory Fee and Other Transactions with Affiliates
Under the terms of the investment advisory agreement, the Fund pays the Adviser an advisory fee at an annual rate of .50% of the first $2.5 billion, .45% of the next $2.5 billion and .40% in excess of $5 billion, of the Fund’s average daily net assets. Prior to September 7, 2004, the Fund paid the Adviser an advisory fee at an annual rate of .75% of the Fund’s average daily net assets. The fee is accrued daily and paid monthly.
Pursuant to the advisory agreement, the Adviser provides certain legal and accounting services to the Fund. For the year ended October 31, 2007, such fees amounted to $80,284.
| | |
| ALLIANCEBERNSTEIN EMERGING MARKET DEBT FUND • | | 23 |
Notes to Financial Statements
The Fund compensates AllianceBernstein Investor Services, Inc. (ABIS), a wholly-owned subsidiary of the Adviser, under a Transfer Agency Agreement for providing personnel and facilities to perform transfer agency services for the Fund. ABIS may make payments to intermediaries that provide omnibus account services, sub-accounting services and/or networking services. Such compensation retained by ABIS amounted to $208,869 for the year ended October 31, 2007.
For the year ended October 31, 2007, the Fund’s expenses were reduced by $16,726 under an expense offset arrangement with ABIS.
AllianceBernstein Investments, Inc. (the “Distributor”), a wholly-owned subsidiary of the Adviser, serves as the distributor of the Fund’s shares. The Distributor has advised the Fund that it has retained front-end sales charges of $26,725 from the sale of Class A shares and received $402, $35,449, and $13,305 in contingent deferred sales charges imposed upon redemptions by shareholders of Class A, Class B and Class C shares, respectively, for the year ended October 31, 2007.
NOTE C
Distribution Services Agreement
The Fund has adopted a Distribution Services Agreement (the “Agreement”) pursuant to Rule 12b-1 under the Investment Company Act of 1940. Under the Agreement the Fund pays a distribution fee to the Distributor at an annual rate of up to .30% of the average daily net assets attributable to Class A shares and 1% of the average daily net assets attributable to Class B and Class C shares. The fees are accrued daily and paid monthly. The Agreement provides that the Distributor will use such payments in their entirety for distribution assistance and promotional activities. The Distributor has incurred expenses in excess of the distribution costs reimbursed by the Fund in the amounts of $3,945,859 and $3,118,887 for Class B and Class C shares, respectively. While such costs may be recovered from the Fund in future periods so long as the Agreement is in effect, the rate of the distribution and servicing fees payable under the Agreement may not be increased without a shareholder vote. In accordance with the Agreement, there is no provision for recovery of unreimbursed distribution costs, incurred by the Distributor, beyond the current fiscal year for Class A shares. The Agreement also provides that the Adviser may use its own resources to finance the distribution of the Fund’s shares.
NOTE D
Investment Transactions
Purchases and sales of investment securities (excluding short-term investments) for the year ended October 31, 2007, were as follows:
| | | | | | |
| | | Purchases | | Sales |
Investment securities (excluding
U.S. government securities) | | $ | 264,792,507 | | $ | 259,715,584 |
U.S. government securities | | | –0– | | | –0– |
| | |
| 24 | | • ALLIANCEBERNSTEIN EMERGING MARKET DEBT FUND |
Notes to Financial Statements
The cost of investments for federal income tax purposes, gross unrealized appreciation and unrealized depreciation (excluding forward currency exchange contracts and swap contracts) are as follows:
| | | | |
Cost | | $ | 370,858,264 | |
| | | | |
Gross unrealized appreciation | | $ | 31,830,172 | |
Gross unrealized depreciation | | | (2,206,140 | ) |
| | | | |
Net unrealized appreciation | | $ | 29,624,032 | |
| | | | |
1. Option Transactions
For hedging and investment purposes, the Fund may purchase and write (sell) put and call options on U.S. and foreign government securities and foreign currencies that are traded on U.S. and foreign securities exchanges and over-the-counter markets.
The risk associated with purchasing an option is that the Fund pays a premium whether or not the option is exercised. Additionally, the Fund bears the risk of loss of premium and change in market value should the counterparty not perform under the contract. Put and call options purchased are accounted for in the same manner as portfolio securities. The cost of securities acquired through the exercise of call options is increased by premiums paid. The proceeds from securities sold through the exercise of put options are decreased by the premiums paid.
When the Fund writes an option, the premium received by the Fund is recorded as a liability and is subsequently adjusted to the current market value of the option written. Premiums received from written options which expire unexercised are recorded by the Fund on the expiration date as realized gains from options written. The difference between the premium received and the amount paid on effecting a closing purchase transaction, including brokerage commissions, is also treated as a realized gain, or if the premium received is less than the amount paid for the closing purchase transaction, as a realized loss. If a written call option is exercised, the premium received is added to the proceeds from the sale of the underlying security or currency in determining whether the Fund has realized a gain or loss. If a written put option is exercised, the premium received reduces the cost basis of the security or currency purchased by the Fund. In writing an option, the Fund bears the market risk of an unfavorable change in the price of the security or currency underlying the written option. Exercise of an option written by the Fund could result in the Fund’s selling or buying a security or currency at a price different from the current market value.
For the year ended October 31, 2007, the Fund had no transactions in written options.
2. Forward Currency Exchange Contracts
The Fund may enter into forward currency exchange contracts in order to hedge its exposure to changes in foreign currency exchange rates on its foreign portfolio holdings, to hedge certain firm purchase and sale commitments denominated
| | |
| ALLIANCEBERNSTEIN EMERGING MARKET DEBT FUND • | | 25 |
Notes to Financial Statements
in foreign currencies and for investment purposes. A forward currency exchange contract is a commitment to purchase or sell a foreign currency on a future date at a negotiated forward rate. The gain or loss arising from the difference between the original contract and the closing of such contract would be included in net realized gain or loss on foreign currency transactions.
Fluctuations in the value of open forward currency exchange contracts are recorded for financial reporting purposes as unrealized appreciation and depreciation by the Fund.
The Fund’s custodian will place and maintain cash not available for investment or other liquid assets in a separate account of the Fund having a value at least equal to the aggregate amount of the Fund’s commitments under forward currency exchange contracts entered into with respect to position hedges.
Risks may arise from the potential inability of the counterparty to meet the terms of a contract and from unanticipated movements in the value of foreign currencies relative to the U.S. dollar. The face or contract amount, in U.S. dollars reflects the total exposure the Fund has in that particular currency contract.
3. Swap Agreements
The Fund may enter into swaps on sovereign debt obligations to protect itself from interest rate fluctuations on the underlying debt instruments and for investment purposes. A swap is an agreement that obligates two parties to exchange a series of cash flows at specified intervals based upon or calculated by reference to changes in specified prices or rates for a specified amount of an underlying asset. The payment flows are usually netted against each other, with the difference being paid by one party to the other.
Risks may arise as a result of the failure of the counterparty to the swap contract to comply with the terms of the swap contract. The loss incurred by the failure of a counterparty is generally limited to the net interim payment to be received by the Fund, and/or the termination value at the end of the contract. Therefore, the Fund considers the creditworthiness of each counterparty to a swap contract in evaluating potential credit risk. Additionally, risks may arise from unanticipated movements in interest rates or in the value of the underlying securities.
The Fund accrues for the interim payments on swap contracts on a daily basis, with the net amount recorded within unrealized appreciation/depreciation of swap contracts on the statement of assets and liabilities. Once the interim payments are settled in cash, the net amount is recorded as realized gain/loss on swaps, in addition to realized gain/loss recorded upon the termination of swap contracts on the statements of operations. Fluctuations in the value of swap contracts are recorded as a component of net change in unrealized appreciation/depreciation of investments.
| | |
| 26 | | • ALLIANCEBERNSTEIN EMERGING MARKET DEBT FUND |
Notes to Financial Statements
The Fund may enter into credit default swaps. The Fund may purchase credit protection on the referenced obligation of the credit default swap (“Buy Contract”) or provide credit protection on the referenced obligation of the credit default swap (“Sale Contract”). A sale/(buy) in a credit default swap provides upon the occurrence of a credit event, as defined in the swap agreement, for the Fund to buy/(sell) from/(to) the counterparty at the notional amount (the “Notional Amount”) and receive/(deliver) the principal amount of the referenced obligation. If a credit event occurs, the maximum payout amount for a Sale Contract is limited to the Notional Amount of the swap contract (“Maximum Payout Amount”). During the term of the swap agreement, the Fund receives/(pays) fixed payments from/(to) the respective counterparty, calculated at the agreed upon interest rate applied to the Notional Amount. These interim payments are recorded within unrealized appreciation/depreciation of swap contracts on the statement of assets and liabilities.
Credit default swaps may involve greater risks than if a Fund had invested in the referenced obligation directly. Credit default swaps are subject to general market risk, liquidity risk, counterparty risk and credit risk. If the Fund is a buyer and no credit event occurs, it will lose its investment. In addition, if the Fund is a seller and a credit event occurs, the value of the referenced obligation received by the Fund coupled with the periodic payments previously received, may be less than the Maximum Payout Amount it pays to the buyer, resulting in a loss to the Fund.
At October 31, 2007, the Fund had Sale Contracts outstanding with Maximum Payout Amounts aggregating $18,900,000, with net unrealized appreciation of $781,185 and terms ranging from 4 months to 3 years, as reflected in the portfolio of investments.
In certain circumstances, the Fund may hold Sale Contracts on the same referenced obligation and with the same counterparty from which it has purchased credit protection, which may reduce its obligation to make payments on Sale Contracts, if a credit event occurs. At October 31, 2007, the Fund had no Buy Contracts outstanding with the same referenced obligations and same counterparties as Sale Contracts outstanding.
4. Reverse Repurchase Agreements
Under a reverse repurchase agreement, the Fund sells securities and agrees to repurchase them at a mutually agreed upon date and price. At the time the Fund enters into a reverse repurchase agreement, it will establish a segregated account with the custodian containing liquid assets having a value at least equal to the repurchase price.
For the year ended October 31, 2007, the average amount of reverse repurchase agreements outstanding was $25,138,647 and the daily weighted average interest rate was 4.25%.
| | |
| ALLIANCEBERNSTEIN EMERGING MARKET DEBT FUND • | | 27 |
Notes to Financial Statements
NOTE E
Capital Stock
Each class consists of 3,000,000,000 authorized shares. Transactions in capital shares for each class were as follows:
| | | | | | | | | | | | | | | | | | |
| | | | | | | | | | | | | | | | | | |
| | | Shares | | | | | Amount | | | |
| | | Year Ended
October 31,
2007 | | | Year Ended
October 31,
2006 | | | | | Year Ended
October 31,
2007 | | | Year Ended
October 31,
2006 | | | |
| | | | | |
| Class A | | | | | | | | | | | | | | | | | | |
Shares sold | | 16,257,643 | | | 11,318,005 | | | | | $ | 144,048,619 | | | $ | 99,263,737 | | | |
| | | | | | | | | | | | | | | | | | | |
Shares issued in reinvestment of dividends and distributions | | 2,120,728 | | | 1,566,823 | | | | | | 18,776,774 | | | | 13,688,732 | | | |
| | | | | | | | | | | | | | | | | | | |
Shares converted from Class B | | 823,902 | | | 692,197 | | | | | | 7,276,687 | | | | 6,068,850 | | | |
| | | | | | | | | | | | | | | | | | | |
Shares redeemed | | (14,241,600 | ) | | (11,852,192 | ) | | | | | (125,180,713 | ) | | | (103,179,474 | ) | | |
| | | | | | | | | | | | | | | | | | | |
Net increase | | 4,960,673 | | | 1,724,833 | | | | | $ | 44,921,367 | | | $ | 15,841,845 | | | |
| | | | | | | | | | | | | | | | | | | |
| | | | | | | | | | | | | | | | | | |
| Class B | | | | | | | | | | | | | | | | | | |
Shares sold | | 562,014 | | | 828,235 | | | | | $ | 5,019,126 | | | $ | 7,318,676 | | | |
| | | | | | | | | | | | | | | | | | | |
Shares issued in reinvestment of dividends and distributions | | 290,330 | | | 312,220 | | | | | | 2,592,296 | | | | 2,751,321 | | | |
| | | | | | | | | | | | | | | | | | | |
Shares converted to Class A | | (816,644 | ) | | (686,157 | ) | | | | | (7,276,687 | ) | | | (6,068,850 | ) | | |
| | | | | | | | | | | | | | | | | | | |
Shares redeemed | | (1,169,028 | ) | | (1,578,237 | ) | | | | | (10,432,639 | ) | | | (13,870,804 | ) | | |
| | | | | | | | | | | | | | | | | | | |
Net decrease | | (1,133,328 | ) | | (1,123,939 | ) | | | | $ | (10,097,904 | ) | | $ | (9,869,657 | ) | | |
| | | | | | | | | | | | | | | | | | | |
| | | | | | | | | | | | | | | | | | |
| Class C | | | | | | | | | | | | | | | | | | |
Shares sold | | 1,881,699 | | | 2,050,082 | | | | | $ | 16,866,412 | | | $ | 18,215,726 | | | |
| | | | | | | | | | | | | | | | | | | |
Shares issued in reinvestment of dividends and distributions | | 617,737 | | | 457,845 | | | | | | 5,526,724 | | | | 4,042,911 | | | |
| | | | | | | | | | | | | | | | | | | |
Shares redeemed | | (2,717,636 | ) | | (3,222,307 | ) | | | | | (24,243,566 | ) | | | (28,432,632 | ) | | |
| | | | | | | | | | | | | | | | | | | |
Net decrease | | (218,200 | ) | | (714,380 | ) | | | | $ | (1,850,430 | ) | | $ | (6,173,995 | ) | | |
| | | | | | | | | | | | | | | | | | | |
NOTE F
Risks Involved in Investing in the Fund
Interest Rate Risk and Credit Risk — Interest rate risk is the risk that changes in interest rates will affect the value of the Fund’s investments in fixed-income debt securities such as bonds or notes. Increases in interest rates may cause the value of the Fund’s investments to decline. Credit risk is the risk that the issuer or guarantor of a debt security, or the counterparty to a derivative contract, will be unable or unwilling to make timely principal and/or interest payments, or to otherwise honor its obligations. The degree of risk for a particular security may
| | |
| 28 | | • ALLIANCEBERNSTEIN EMERGING MARKET DEBT FUND |
Notes to Financial Statements
be reflected in its credit risk rating. Credit risk is greater for medium quality and lower-rated securities. Lower-rated debt securities and similar unrated securities (commonly known as “junk bonds”) have speculative elements or are predominantly speculative risks.
Foreign Securities Risk — Investing in securities of foreign companies and foreign governments involves special risks which include changes in foreign currency exchange rates the possibility of future political and economic developments which could adversely affect the value of such securities. Moreover, securities of many foreign companies and foreign governments and their markets may be less liquid and their prices more volatile than those of comparable U.S. companies and the U.S. government. The Fund invests in the Sovereign Debt Obligations of countries that are considered emerging market countries at the time of purchase. Therefore, the Fund is susceptible to governmental factors and economic and debt restructuring developments adversely affecting the economies of these emerging market countries. In addition, these debt obligations may be less liquid and subject to greater volatility than debt obligations of more developed countries.
Leverage Risk — When the Fund borrows money or otherwise leverages its portfolio, it may be volatile because leverage tends to exaggerate the effect of any increase or decrease in the value of the Fund’s investments. The Fund may create leverage through the use of reverse repurchase arrangements, forward currency exchange contracts, forward commitments, dollar rolls or futures contracts or by borrowing money.
Indemnification Risk — In the ordinary course of business, the Fund enters into contracts that contain a variety of indemnifications. The Fund’s maximum exposure under these arrangements is unknown. However, the Fund has not had prior claims or losses pursuant to these indemnification provisions and expects the risk of loss thereunder to be remote.
NOTE G
Joint Credit Facility
A number of open-end mutual funds managed by the Adviser, including the Fund, participate in a $250 million revolving credit facility (the “Facility”) intended to provide short-term financing if necessary, subject to certain restrictions, in connection with abnormal redemption activity. Commitment fees related to the Facility are paid by the participating funds and are included in miscellaneous expenses in the statement of operations. The Fund did not utilize the Facility during the year ended October 31, 2007.
| | |
| ALLIANCEBERNSTEIN EMERGING MARKET DEBT FUND • | | 29 |
Notes to Financial Statements
NOTE H
Distributions to Shareholders
The tax character of distributions paid during the fiscal years ended October 31, 2007 and October 31, 2006 were as follows:
| | | | | | |
| | | Year Ended
October 31,
2007 | | Year Ended
October 31,
2006 |
Distributions paid from: | | | | | | |
Ordinary income | | $ | 27,212,303 | | $ | 23,406,531 |
Net long-term capital gains | | | 11,953,275 | | | 6,067,242 |
| | | | | | |
Total taxable distributions | | | 39,165,578 | | | 29,473,773 |
| | | | | | |
Total distributions paid | | $ | 39,165,578 | | $ | 29,473,773 |
| | | | | | |
As of October 31, 2007, the components of accumulated earnings/(deficit) on a tax basis were as follows:
| | | | |
Undistributed ordinary income | | $ | 4,931,397 | |
Undistributed long-term capital gains | | | 7,054,255 | |
Accumulated capital and other losses | | | (374,383 | )(a) |
Unrealized appreciation/(depreciation) | | | 29,695,058 | (b) |
| | | | |
Total accumulated earnings/(deficit) | | $ | 41,306,327 | (c) |
| | | | |
| (a) | For the year ended October 31, 2007, the cumulative deferred loss on straddles was $374,383. |
| (b) | The differences between book-basis and tax-basis unrealized appreciation/(depreciation) are attributable primarily to the tax deferral of losses on wash sales, the difference between book and tax amortization methods for premium, the difference between book and tax treatment of swap income, and the realization for tax purposes of gain/losses on certain derivative instruments. |
| (c) | The difference between book-basis and tax-basis components of accumulated earnings/ (deficit) is attributable to dividends payable. |
During the current fiscal year, permanent differences primarily due to the tax treatment of swap income, paydown reclassification, foreign currency reclassification, and the tax treatment of premium amortization resulted in a net decrease in distributions in excess of net investment income, and a net decrease in accumulated net realized gain on investment transactions and foreign currency transactions. This reclassification had no effect on net assets.
NOTE I
Legal Proceedings
On October 2, 2003, a purported class action complaint entitled Hindo, et al. v. AllianceBernstein Growth & Income Fund, et al. (“Hindo Complaint”) was filed against the Adviser, Alliance Capital Management Holding L.P. (“Alliance Holding”), Alliance Capital Management Corporation, AXA Financial, Inc., the AllianceBernstein Funds, certain officers of the Adviser (“AllianceBernstein
| | |
| 30 | | • ALLIANCEBERNSTEIN EMERGING MARKET DEBT FUND |
Notes to Financial Statements
defendants”), and certain other unaffiliated defendants, as well as unnamed Doe defendants. The Hindo Complaint was filed in the United States District Court for the Southern District of New York by alleged shareholders of two of the AllianceBernstein Funds. The Hindo Complaint alleges that certain of the AllianceBernstein defendants failed to disclose that they improperly allowed certain hedge funds and other unidentified parties to engage in “late trading” and “market timing” of AllianceBernstein Fund securities, violating Sections 11 and 15 of the Securities Act, Sections 10(b) and 20(a) of the Exchange Act and Sections 206 and 215 of the Advisers Act. Plaintiffs seek an unspecified amount of compensatory damages and rescission of their contracts with the Adviser, including recovery of all fees paid to the Adviser pursuant to such contracts.
Following October 2, 2003, 43 additional lawsuits making factual allegations generally similar to those in the Hindo Complaint were filed in various federal and state courts against the Adviser and certain other defendants. All state court actions against the Adviser either were voluntarily dismissed or removed to federal court. On February 20, 2004, the Judicial Panel on Multidistrict Litigation transferred all federal actions to the United States District Court for the District of Maryland. On September 29, 2004, plaintiffs filed consolidated amended complaints with respect to four claim types: mutual fund shareholder claims; mutual fund derivative claims; derivative claims brought on behalf of Alliance Holding; and claims brought under ERISA by participants in the Profit Sharing Plan for Employees of the Adviser. All four complaints include substantially identical factual allegations, which appear to be based in large part on the Order of the SEC dated December 18, 2003 as amended and restated January 15, 2004 (“SEC Order”) and the New York State Attorney General Assurance of Discontinuance dated September 1, 2004 (“NYAG Order”).
On April 21, 2006, the Adviser and attorneys for the plaintiffs in the mutual fund shareholder claims, mutual fund derivative claims, and ERISA claims entered into a confidential memorandum of understanding (“MOU”) containing their agreement to settle these claims. The agreement will be documented by a stipulation of settlement and will be submitted for court approval at a later date. The settlement amount ($30 million), which the Adviser previously accrued and disclosed, has been disbursed. The derivative claims brought on behalf of Alliance Holding, in which plaintiffs seek an unspecified amount of damages, remain pending.
It is possible that these matters and/or other developments resulting from these matters could result in increased redemptions of the AllianceBernstein Mutual Funds’ shares or other adverse consequences to the AllianceBernstein Mutual Funds. This may require the AllianceBernstein Mutual Funds to sell investments held by those funds to provide for sufficient liquidity and could also have an adverse effect on the investment performance of the AllianceBernstein Mutual Funds. However, the Adviser believes that these matters are not likely to have a material adverse effect on its ability to perform advisory services relating to the AllianceBernstein Mutual Funds.
| | |
| ALLIANCEBERNSTEIN EMERGING MARKET DEBT FUND • | | 31 |
Notes to Financial Statements
NOTE J
Recent Accounting Pronouncements
On July 13, 2006, the Financial Accounting Standards Board (“FASB”) released FASB Interpretation No. 48 “Accounting for Uncertainty in Income Taxes” (“FIN 48”). FIN 48 provides guidance for how uncertain tax positions should be recognized, measured, presented and disclosed in the financial statements. FIN 48 requires the evaluation of tax positions taken or expected to be taken in the course of preparing a fund’s tax returns to determine whether the tax positions are “more-likely-than-not” of being sustained by the applicable tax authority. Tax positions not deemed to meet the more-likely-than-not threshold would be recorded in the current period. Adoption of FIN 48 is required for fiscal years beginning after December 15, 2006 and is to be applied to all open tax years as of the effective date. On December 22, 2006, the Securities and Exchange Commission notified the industry that the implementation of FIN 48 by registered investment companies could be delayed until the last business day of the first required financial statement reporting period for fiscal years beginning after December 15, 2006. At this time, management is evaluating the implications of FIN 48 and its impact on the financial statements has not yet been determined.
On September 20, 2006, the FASB released Statement of Financial Accounting Standards No. 157 “Fair Value Measurements” (“FAS 157”). FAS 157 establishes an authoritative definition of fair value, sets out a framework for measuring fair value, and requires additional disclosures about fair-value measurements. The application of FAS 157 is required for fiscal years beginning after November 15, 2007 and interim periods within those fiscal years. At this time, management is evaluating the implications of FAS 157 and its impact on the financial statements has not yet been determined.
NOTE K
Subsequent Events
On November 16, 2007, the shareholders of AllianceBernstein Bond Fund, Inc. — AllianceBernstein Corporate Bond Portfolio (“Corporate Bond”) and AllianceBernstein High Yield, Inc. (“High Yield”) approved the acquisition of Corporate Bond and High Yield, respectively, by the Fund. The acquisition of Corporate Bond and High Yield is expected to take place early in the first quarter of 2008.
| | |
| 32 | | • ALLIANCEBERNSTEIN EMERGING MARKET DEBT FUND |
Notes to Financial Statements
FINANCIAL HIGHLIGHTS
Selected Data For A Share Of Capital Stock Outstanding Throughout Each Period
| | | | | | | | | | | | | | | | | | |
| | | Class A | |
| | | Year Ended October 31, | | | September 1,
2003 to
October 31,
2003(b) | | | Year
Ended
August 31,
2003 | |
| | | 2007 | | | 2006 | | | 2005 | | | 2004(a) | | | |
| | | |
Net asset value, beginning of period | | $ 8.97 | | | $ 8.70 | | | $ 8.38 | | | $ 8.00 | | | $ 7.72 | | | $ 6.02 | |
| | | |
Income From Investment Operations | | | | | | | | | | | | | | | | | | |
Net investment income(c) | | .56 | | | .55 | | | .53 | | | .49 | (d) | | .11 | | | .69 | |
Net realized and unrealized gain on investment transactions | | .41 | | | .43 | | | .34 | | | .50 | | | .28 | | | 1.71 | |
| | | |
Net increase in net asset value from operations | | .97 | | | .98 | | | .87 | | | .99 | | | .39 | | | 2.40 | |
| | | |
Less: Dividends and Distributions | | | | | | | | | | | | | | | | | | |
Dividends from net investment income | | (.57 | ) | | (.57 | ) | | (.55 | ) | | (.61 | ) | | (.11 | ) | | (.70 | ) |
Distribution from net realized gain on investment transactions | | (.35 | ) | | (.14 | ) | | –0 | – | | –0 | – | | –0 | – | | –0 | – |
| | | |
Total dividends and distributions | | (.92 | ) | | (.71 | ) | | (.55 | ) | | (.61 | ) | | (.11 | ) | | (.70 | ) |
| | | |
Net asset value, end of period | | $ 9.02 | | | $ 8.97 | | | $ 8.70 | | | $ 8.38 | | | $ 8.00 | | | $ 7.72 | |
| | | |
Total Return | | | | | | | | | | | | | | | | | | |
Total investment return based on net asset value(e) | | 11.54 | % | | 11.87 | % | | 10.70 | % | | 12.82 | % | | 5.11 | % | | 41.80 | % |
Ratios/Supplemental Data | | | | | | | | | | | | | | | | | | |
Net assets, end of period (000’s omitted) | | $281,677 | | | $235,763 | | | $213,652 | | | $156,469 | | | $137,709 | | | $118,669 | |
Ratio to average net assets of: | | | | | | | | | | | | | | | | | | |
Expenses, net of waivers/ reimbursements | | 1.41 | %* | | 1.48 | % | | 1.20 | % | | 1.23 | % | | 1.75 | %(f) | | 1.94 | % |
Expenses, before waivers/ reimbursements | | 1.41 | %* | | 1.48 | % | | 1.20 | % | | 1.40 | % | | 1.75 | %(f) | | 1.94 | % |
Expenses, excluding interest expense | | 1.14 | %* | | 1.14 | % | | 1.19 | % | | 1.21 | % | | 1.47 | %(f) | | 1.46 | % |
Net investment income | | 6.24 | %* | | 6.32 | % | | 6.14 | % | | 6.04 | %(d) | | 7.90 | %(f) | | 9.73 | % |
Portfolio turnover rate | | 67 | % | | 75 | % | | 100 | % | | 173 | % | | 20 | % | | 125 | % |
See footnote summary on page 36.
| | |
| ALLIANCEBERNSTEIN EMERGING MARKET DEBT FUND • | | 33 |
Financial Highlights
Selected Data For A Share Of Capital Stock Outstanding Throughout Each Period
| | | | | | | | | | | | | | | | | | |
| | | Class B | |
| | | Year Ended October 31, | | | September 1,
2003 to
October 31,
2003(b) | | | Year
Ended
August 31,
2003 | |
| | | 2007 | | | 2006 | | | 2005 | | | 2004(a) | | | |
| | | | | | | | | |
Net asset value, beginning of period | | $ 9.05 | | | $ 8.77 | | | $ 8.45 | | | $ 8.07 | | | $ 7.80 | | | $ 6.09 | |
| | | |
Income From Investment Operations | | | | | | | | | | | | | | | | | | |
Net investment
income(c) | | .49 | | | .49 | | | .47 | | | .62 | (d) | | .10 | | | .64 | |
Net realized and
unrealized gain on investment transactions | | .41 | | | .44 | | | .34 | | | .32 | | | .28 | | | 1.73 | |
| | | |
Net increase in net
asset value from operations | | .90 | | | .93 | | | .81 | | | .94 | | | .38 | | | 2.37 | |
| | | |
Less: Dividends and Distributions | | | | | | | | | | | | | | | | | | |
Dividends from net investment income | | (.51 | ) | | (.51 | ) | | (.49 | ) | | (.56 | ) | | (.11 | ) | | (.66 | ) |
Distribution from net realized gain on investment transactions | | (.35 | ) | | (.14 | ) | | – 0 | – | | – 0 | – | | – 0 | – | | – 0 | – |
| | | |
Total dividends and distributions | | (.86 | ) | | (.65 | ) | | (.49 | ) | | (.56 | ) | | (.11 | ) | | (.66 | ) |
| | | |
Net asset value, end of period | | $ 9.09 | | | $ 9.05 | | | $ 8.77 | | | $ 8.45 | | | $ 8.07 | | | $ 7.80 | |
| | | |
Total Return | | | | | | | | | | | | | | | | | | |
Total investment return based on net asset value(e) | | 10.51 | % | | 11.11 | % | | 9.81 | % | | 12.02 | % | | 4.84 | % | | 40.69 | % |
Ratios/Supplemental Data | | | | | | | | | | | | | | | | | | |
Net assets, end of period (000’s
omitted) | | $35,058 | | | $45,133 | | | $53,629 | | | $61,715 | | | $90,443 | | | $89,571 | |
Ratio to average net assets of: | | | | | | | | | | | | | | | | | | |
Expenses, net of waivers/ reimbursements | | 2.14 | %* | | 2.18 | % | | 1.89 | % | | 1.94 | % | | 2.45 | %(f) | | 2.64 | % |
Expenses, before waivers/ reimbursements | | 2.14 | %* | | 2.18 | % | | 1.90 | % | | 2.11 | % | | 2.45 | %(f) | | 2.64 | % |
Expenses, excluding interest expense | | 1.87 | %* | | 1.85 | % | | 1.89 | % | | 1.92 | % | | 2.17 | %(f) | | 2.17 | % |
Net investment income | | 5.45 | %* | | 5.55 | % | | 5.39 | % | | 7.57 | %(d) | | 7.11 | %(f) | | 9.07 | % |
Portfolio turnover rate | | 67 | % | | 75 | % | | 100 | % | | 173 | % | | 20 | % | | 125 | % |
See footnote summary on page 36.
| | |
| 34 | | • ALLIANCEBERNSTEIN EMERGING MARKET DEBT FUND |
Financial Highlights
Selected Data For A Share Of Capital Stock Outstanding Throughout Each Period
| | | | | | | | | | | | | | | | | | |
| | | Class C | |
| | | Year Ended October 31, | | | September 1,
2003 to
October 31,
2003(b) | | | Year
Ended
August 31,
2003 | |
| | | 2007 | | | 2006 | | | 2005 | | | 2004(a) | | | |
| | | | | | | | | |
Net asset value, beginning of period | | $ 9.07 | | | $ 8.79 | | | $ 8.47 | | | $ 8.09 | | | $ 7.82 | | | $ 6.10 | |
| | | | | | | | | |
Income From Investment Operations | | | | | | | | | | | | | | | | | | |
Net investment
income(c) | | .49 | | | .49 | | | .47 | | | .45 | (d) | | .10 | | | .63 | |
Net realized and
unrealized gain on investment transactions | | .41 | | | .44 | | | .34 | | | .49 | | | .28 | | | 1.75 | |
| | | | | | | | | |
Net increase in net
asset value from operations | | .90 | | | .93 | | | .81 | | | .94 | | | .38 | | | 2.38 | |
| | | | | | | | | |
Less: Dividends and Distributions | | | | | | | | | | | | | | | | | | |
Dividends from net investment income | | (.51 | ) | | (.51 | ) | | (.49 | ) | | (.56 | ) | | (.11 | ) | | (.66 | ) |
Distribution from net realized gain on investment transactions | | (.35 | ) | | (.14 | ) | | – 0 | – | | – 0 | – | | – 0 | – | | – 0 | – |
| | | | | | | | | |
Total dividends and distributions | | (.86 | ) | | (.65 | ) | | (.49 | ) | | (.56 | ) | | (.11 | ) | | (.66 | ) |
| | | | | | | | | |
Net asset value, end of period | | $ 9.11 | | | $ 9.07 | | | $ 8.79 | | | $ 8.47 | | | $ 8.09 | | | $ 7.82 | |
| | | |
Total Return | | | | | | | | | | | | | | | | | | |
Total investment return based on net asset value(e) | | 10.50 | % | | 11.10 | % | | 9.81 | % | | 12.00 | % | | 4.83 | % | | 40.80 | % |
Ratios/Supplemental Data | | | | | | | | | | | | | | | | | | |
Net assets, end of
period (000’s
omitted) | | $86,525 | | | $88,046 | | | $91,662 | | | $82,876 | | | $77,657 | | | $73,477 | |
Ratio to average net
assets of: | | | | | | | | | | | | | | | | | | |
Expenses, net of waivers/ reimbursements | | 2.11 | %* | | 2.17 | % | | 1.89 | % | | 1.92 | % | | 2.43 | %(f) | | 2.63 | % |
Expenses, before waivers/
reimbursements | | 2.11 | %* | | 2.17 | % | | 1.89 | % | | 2.09 | % | | 2.43 | %(f) | | 2.63 | % |
Expenses, excluding interest expense | | 1.85 | %* | | 1.84 | % | | 1.88 | % | | 1.90 | % | | 2.16 | %(f) | | 2.16 | % |
Net investment income | | 5.47 | %* | | 5.54 | % | | 5.38 | % | | 5.51 | %(d) | | 7.09 | %(f) | | 8.91 | % |
Portfolio turnover rate | | 67 | % | | 75 | % | | 100 | % | | 173 | % | | 20 | % | | 125 | % |
See footnote summary on page 36.
| | |
| ALLIANCEBERNSTEIN EMERGING MARKET DEBT FUND • | | 35 |
Financial Highlights
| a) | As of November 1, 2003, the Fund has adopted the method of accounting for interim payments on swap contracts in accordance with Financial Accounting Standards Board Statement No. 133. These interim payments are reflected within net realized and unrealized gain (loss) on swap contracts, however prior to November 1, 2003, these interim payments were reflected within interest income/expense on the statement of operations. The effect of this change for the year ended October 31, 2004, was to decrease net investment income per share by $.05, $.04 and $.05 and increase net realized and unrealized gain (loss) on investment transactions per share by $.05, $.04 and $.05 for Class A, Class B and Class C, respectively. Consequently, the ratios of net investment income to average net assets were decreased by 0.56%, 0.57% and 0.55% for Class A, Class B and Class C, respectively. |
| (b) | The Fund changed its fiscal year end from August 31 to October 31. |
| (c) | Based on average shares outstanding. |
| (d) | Net of expenses waived/reimbursed by the Adviser. |
| (e) | Total investment return is calculated assuming an initial investment made at the net asset value at the beginning of the year, reinvestment of all dividends and distributions at net asset value during the year, and redemption on the last day of the year. Initial sales charge or contingent deferred sales charge is not reflected in the calculation of total investment return. Total return does not reflect the deduction of taxes that a shareholder would pay on Fund distributions or the redemption of Fund shares. Total investment return calculated for a period of less than one year is not annualized. |
| * | The ratio includes expenses attributable to costs of proxy solicitation. |
| | |
| 36 | | • ALLIANCEBERNSTEIN EMERGING MARKET DEBT FUND |
Financial Highlights
REPORT OF INDEPENDENT REGISTERED
PUBLIC ACCOUNTING FIRM
To the Shareholders and Board of Directors of AllianceBernstein Emerging Market Debt Fund, Inc.
We have audited the accompanying statement of assets and liabilities of AllianceBernstein Emerging Market Debt Fund, Inc. (the “Fund”), including the portfolio of investments, as of October 31, 2007, and the related statement of operations for the year then ended, and the statement of changes in net assets for each of the two years in the period then ended and the financial highlights for each of the periods indicated therein. These financial statements and financial highlights are the responsibility of the Fund’s management. Our responsibility is to express an opinion on these financial statements and financial highlights based on our audits.
We conducted our audits in accordance with the standards of the Public Company Accounting Oversight Board (United States). Those standards require that we plan and perform the audit to obtain reasonable assurance about whether the financial statements and financial highlights are free of material misstatement. We were not engaged to perform an audit of the Fund’s internal control over financial reporting. Our audits included consideration of internal control over financial reporting as a basis for designing audit procedures that are appropriate in the circumstances, but not for the purpose of expressing an opinion on the effectiveness of the Fund’s internal control over financial reporting. Accordingly, we express no such opinion. An audit also includes examining, on a test basis, evidence supporting the amounts and disclosures in the financial statements and financial highlights, assessing the accounting principles used and significant estimates made by management, and evaluating the overall financial statement presentation. Our procedures included confirmation of securities owned as of October 31, 2007 by correspondence with the custodian and others, or by other appropriate auditing procedures where replies from others were not received. We believe that our audits provide a reasonable basis for our opinion.
In our opinion, the financial statements and financial highlights referred to above present fairly, in all material respects, the financial position of AllianceBernstein Emerging Market Debt Fund, Inc. at October 31, 2007, the results of its operations for the year then ended, and the changes in its net assets for each of the two years in the period then ended and the financial highlights for each of the periods indicated therein, in conformity with U.S. generally accepted accounting principles.

New York, New York
December 21, 2007
| | |
| ALLIANCEBERNSTEIN EMERGING MARKET DEBT FUND • | | 37 |
Report of Independent Registered Public Accounting Firm
TAX INFORMATION (unaudited)
For foreign shareholders, the Fund designates 1.7% of its ordinary dividends as qualified interest income.
| | |
| 38 | | • ALLIANCEBERNSTEIN EMERGING MARKET DEBT FUND |
Tax Information
BOARD OF DIRECTORS
William H. Foulk, Jr.(1), Chairman
Marc O. Mayer, President and Chief Executive Officer
David H. Dievler(1)
John H. Dobkin(1)
Michael J. Downey(1)
D. James Guzy(1)
Nancy P. Jacklin(1)
Marshall C. Turner, Jr.(1)
Earl D. Weiner(1)
OFFICERS
| | |
Philip L. Kirstein, Senior Vice President and Independent Compliance Officer Paul J. DeNoon(2), Vice President Fernando Grisales(2), Vice President Michael L. Mon(2), Vice President Douglas J. Peebles(2), Vice President | | Matthew S. Sheridan(2), Vice President Emilie D. Wrapp, Secretary Joseph J. Mantineo, Treasurer and Chief Financial Officer Vincent S. Noto, Controller |
| | |
Principal Underwriter AllianceBernstein Investments, Inc. 1345 Avenue of the Americas New York, NY 10105 Custodian The Bank of New York One Wall Street New York, NY 10286 Legal Counsel Seward & Kissel LLP One Battery Park Plaza New York, NY 10004 | | Transfer Agent AllianceBernstein Investor Services, Inc. P.O. Box 786003 San Antonio, TX 78278-6003 Toll-Free (800) 221-5672 Independent Registered Public Accounting Firm Ernst & Young LLP 5 Times Square New York, NY 10036 |
| (1) | Member of the Audit Committee, the Governance and Nominating Committee and the Independent Directors Committee. |
| (2) | The day-to-day management of and investment decisions for the Fund’s portfolio are made by the Global Fixed Income: Emerging Market Investment Team. Messrs. DeNoon, Grisales, Mon, Peebles, and Sheridan are the investment professionals with the most significant responsibility for the day-to-day management of the Fund’s portfolio. |
| | |
| ALLIANCEBERNSTEIN EMERGING MARKET DEBT FUND • | | 39 |
Board of Directors
MANAGEMENT OF THE FUND
Board of Directors Information
The business and affairs of the Fund are managed under the direction of the Board of Directors. Certain information concerning the Fund’s Directors is set forth below.
| | | | | | |
NAME,
ADDRESS* AND AGE
(FIRST YEAR ELECTED)** | | PRINCIPAL
OCCUPATION(S)
DURING PAST 5 YEARS | | PORTFOLIOS
IN FUND
COMPLEX
OVERSEEN BY
DIRECTOR | | OTHER
DIRECTORSHIPS
HELD BY DIRECTOR |
| INTERESTED DIRECTOR | | | | | | |
Marc O. Mayer, *** 1345 Avenue of the Americas New York, NY 10105
50
(2003) | | Executive Vice President of the Adviser since 2001 and Executive Managing Director of AllianceBernstein Investments, Inc. (“ABI”) since 2003; prior thereto, he was head of AllianceBernstein Institutional Investments, a unit of the Adviser from 2001-2003. Prior thereto, Chief Executive Officer of Sanford C. Bernstein & Co., LLC (institutional research and brokerage arm of Sanford C. Bernstein & Co., LLC (“SCB & Co.”)) and its predecessor since prior to 2002. | | 106 | | SCB Partners, Inc. and SCB Inc. |
| | | | | | |
| DISINTERESTED DIRECTORS | | | | |
William H. Foulk, Jr., #, ## Chairman of the Board 75 (1993) | | Investment Adviser and an Independent Consultant. He was formerly Senior Manager of Barrett Associates, Inc., a registered investment adviser, with which he had been associated since prior to 2002. He was formerly Deputy Comptroller and Chief Investment Officer of the State of New York and, prior thereto, Chief Investment Officer of the New York Bank for Savings. | | 108 | | None |
| | | | | | |
David H. Dievler, #
78
(1993) | | Independent Consultant. Until December 1994, he was Senior Vice President of AllianceBernstein Corporation (“AB Corp.”), (formerly, Alliance Capital Management Corporation) responsible for mutual fund administration. Prior to joining AB Corp. in 1984, he was Chief Financial Officer of Eberstadt Asset Management since 1968. Prior to that, he was a Senior Manager at Price Waterhouse & Co. Member of American Institute of Certified Public Accountants since 1953. | | 107 | | None |
| | |
| 40 | | • ALLIANCEBERNSTEIN EMERGING MARKET DEBT FUND |
Management of the Fund
| | | | | | |
NAME,
ADDRESS* AND AGE
(FIRST YEAR ELECTED)** | | PRINCIPAL
OCCUPATION(S)
DURING PAST 5 YEARS | | PORTFOLIOS
IN FUND
COMPLEX
OVERSEEN BY
DIRECTOR | | OTHER
DIRECTORSHIPS
HELD BY DIRECTOR |
DISINTERESTED DIRECTORS
(continued) | | | | |
John H. Dobkin, #
65
(1993) | | Consultant. Formerly, President of Save Venice, Inc. (preservation organization) from 2001-2002, Senior Advisor from June 1999-June 2000 and President of Historic Hudson Valley (historic preservation) from December 1989-May 1999. Previously, Director of the National Academy of Design and during 1988-1992, Director and Chairman of the Audit Committee of AB Corp. | | 106 | | None |
| | | | | | |
Michael J. Downey, #
63
(2005) | | Consultant since January 2004. Formerly, managing partner of Lexington Capital, LLC (investment advisory firm) from December 1997 until December 2003. Prior thereto, Chairman and CEO of Prudential Mutual Fund Management from 1987 to 1993. | | 106 | | Asia Pacific
Fund, Inc., The Merger Fund and Prospect Acquisition Corp. (financial services) |
| | | | | | |
D. James Guzy, #
71
(2005) | | Chairman of the Board of PLX Technology (semi-conductors) and of SRC Computers, Inc., with which he has been associated since prior to 2002. He is also President of the Arbor Company (private family investments). | | 106 | | Intel Corporation (semi-conductors) and Cirrus Logic Corporation (semi-conductors) |
| | | | | | |
Nancy P. Jacklin, #
59
(2006) | | Formerly, U.S. Executive Director of the International Monetary Fund (December 2002-May 2006); Partner, Clifford Chance (1992-2002); Sector Counsel, International Banking and Finance, and Associate General Counsel, Citicorp (1985-1992); Assistant General Counsel (International), Federal Reserve Board of Governors (1982-1985); and Attorney Advisor, U.S. Department of the Treasury (1973-1982). Member of the Bar of the District of Columbia and of New York; and member of the Council on Foreign Relations. | | 106 | | None |
| | |
| ALLIANCEBERNSTEIN EMERGING MARKET DEBT FUND • | | 41 |
Management of the Fund
| | | | | | |
NAME,
ADDRESS* AND AGE
(FIRST YEAR ELECTED)** | | PRINCIPAL
OCCUPATION(S)
DURING PAST 5 YEARS | | PORTFOLIOS
IN FUND
COMPLEX
OVERSEEN BY
DIRECTOR | | OTHER
DIRECTORSHIPS
HELD BY DIRECTOR |
DISINTERESTED DIRECTORS
(continued) | | | | |
Marshall C. Turner, Jr., #
66
(2005) | | Consultant. Formerly, President and CEO, Toppan Photomasks, Inc. (semi-conductor manufacturing services), 2005-2006, and Chairman and CEO from 2003 until 2005, when the company was acquired and renamed from Dupont Photomasks, Inc. Principal, Turner Venture Associates (venture capital and consulting) 1993-2003. | | 106 | | Xilinx, Inc. (semi-conductors) and MEMC Electronic Materials, Inc. (semi-conductor substrates) |
| | | | | | |
Earl D. Weiner, # 68 (2007) | | Of Counsel, and Partner prior to January 2007, of the law firm Sullivan & Cromwell LLP; member of ABA Federal Regulation of Securities Committee Task Force on Fund Director’s Guidebook; and member of Advisory Board of Sustainable Forestry Management Limited. | | 106 | | None |
| * | The address for each of the Fund’s disinterested Directors is AllianceBernstein L.P., c/o Philip L. Kirstein, 1345 Avenue of the Americas, New York, NY 10105. |
| ** | There is no stated term of office for the Fund’s Directors. |
| *** | Mr. Mayer is an “interested person”, as defined in the 1940 Act, due to his position as an Executive Vice President of the Adviser. |
| # | Member of the Audit Committee, the Governance and Nominating Committee and the Independent Directors Committee. |
| ## | Member of the Fair Value Pricing Committee. |
| | |
| 42 | | • ALLIANCEBERNSTEIN EMERGING MARKET DEBT FUND |
Management of the Fund
Officers of the Fund
Certain information concerning the Fund’s Officers is listed below.
| | | | |
NAME, ADDRESS*
AGE | | POSITION(S)
HELD WITH FUND | | PRINCIPAL OCCUPATION
DURING PAST 5 YEARS |
Marc O. Mayer,
50 | | President and Chief Executive Officer | | See biography above. |
| | | | |
Philip Kirstein,
62 | | Senior Vice President and Independent Compliance Officer | | Senior Vice President and Independent Compliance Officer of the AllianceBernstein Funds, with which he has been associated since October 2004. Prior thereto, he was Of Counsel to Kirkpatrick & Lockhart, LLP from October 2003 to October 2004, and General Counsel of Merrill Lynch Investment Managers, L.P. since prior to 2002 until March 2003. |
| | | | |
Paul J. DeNoon,
45 | | Vice President | | Senior Vice President of the Adviser**, with which he has been associated since prior to 2002. |
| | | | |
Fernando Grisales,
28 | | Vice President | | Assistant Vice President of the Adviser**, with which he has been associated since prior to 2002. |
| | | | |
Michael L. Mon,
38 | | Vice President | | Vice President of the Adviser**, with which he has been associated since prior to 2002. |
| | | | |
Douglas J. Peebles,
42 | | Vice President | | Executive Vice President of the Adviser**, with which he has been associated since prior to 2002. |
| | | | |
Matthew S. Sheridan,
32 | | Vice President | | Vice President of the Adviser**, with which he has been associated since prior to 2002. |
| | | | |
Emilie D. Wrapp,
52 | | Secretary | | Senior Vice President, Assistant General Counsel and Assistant Secretary of ABI**, with which she has been associated since prior to 2002. |
| | | | |
Joseph J. Mantineo,
48 | | Treasurer and Chief Financial Officer | | Senior Vice President of ABIS**, with which he has been associated since prior to 2002. |
| | | | |
Vincent S. Noto,
43 | | Controller | | Vice President of ABIS**, with which he has been associated since prior to 2002. |
| * | The address for each of the Fund’s Officers is 1345 Avenue of the Americas, New York, NY 10105. |
| ** | The Adviser, ABI, ABIS and SCB & Co. are affiliates of the Fund. |
| | The Fund’s Statement of Additional Information (“SAI”) has additional information about the Fund’s Directors and Officers and is available without charge upon request. Contact your financial representative or AllianceBernstein at (800) 227-4618 for a free prospectus or SAI. |
| | |
| ALLIANCEBERNSTEIN EMERGING MARKET DEBT FUND • | | 43 |
Management of the Fund
THE FOLLOWING IS NOT PART OF THE SHAREHOLDER REPORT OR THE FINANCIAL STATEMENTS
SUMMARY OF SENIOR OFFICER’S EVALUATION OF INVESTMENT ADVISORY AGREEMENT1
The following is a summary of the evaluation of the Investment Advisory Agreement between AllianceBernstein L.P. (the “Adviser”) and AllianceBernstein Emerging Market Debt Fund, Inc. (the “Fund”).2,3 The evaluation of the Investment Advisory Agreement was prepared by Philip L. Kirstein, the Senior Officer of the Fund for the Directors of the Fund, as required by an August 2004 agreement between the Adviser and the New York State Attorney General (the “NYAG”). The Senior Officer’s evaluation of the Investment Advisory Agreement is not meant to diminish the responsibility or authority of the Board of Directors of the Fund to perform its duties pursuant to Section 15 of the Investment Company Act of 1940 (the “40 Act”) and applicable state law. The purpose of the summary is to provide shareholders with a synopsis of the independent evaluation of the reasonableness of the advisory fees proposed to be paid by the Fund which was provided to the Directors in connection with their review of the proposed approval of the continuance of the Investment Advisory Agreement. The Senior Officer’s evaluation considered the following factors:
| | 1. | Advisory fees charged to institutional and other clients of the Adviser for like services; |
| | 2. | Advisory fees charged by other mutual fund companies for like services; |
| | 3. | Costs to the Adviser and its affiliates of supplying services pursuant to the advisory agreement, excluding any intra-corporate profit; |
| | 4. | Profit margins of the Adviser and its affiliates from supplying such services; |
| | 5. | Possible economies of scale as the Fund grows larger; and |
| | 6. | Nature and quality of the Adviser’s services including the performance of the Fund. |
FUND ADVISORY FEES, EXPENSE REIMBURSEMENTS & RATIOS
The Adviser proposed that the Fund pay the advisory fee set forth in the table below for receiving the services to be provided pursuant to the Investment Advisory Agreement. The fee schedule below, implemented in January 2004 in
1 | It should be noted that the Senior Officer’s fee evaluation was completed on October 18, 2007. |
2 | Future references to the Fund do not include “AllianceBernstein.” References in the fee summary pertaining to performance and expense ratios refer to the Class A shares of the Fund. |
3 | The Board of Directors approved a fixed-income fund realignment pursuant to which the Fund (the surviving fund) will merge its assets with that of AllianceBernstein Corporate Bond Portfolio and AllianceBernstein High Yield Fund, Inc., expand its non-fundamental investment policies, change its name to AllianceBernstein High Income Fund, add retirement classes to the Fund and implement expense caps for the Fund’s share classes. |
| | |
| 44 | | • ALLIANCEBERNSTEIN EMERGING MARKET DEBT FUND |
consideration of the Adviser’s settlement with the NYAG in December 2003, is based on a master schedule that contemplates eight categories of funds with almost all funds in each category having the same advisory fee schedule.4 It should be noted that the Fund’s advisory fee is based on the Fund’s average daily adjusted total assets (i.e., the average daily value of total assets minus the sum of accrued liabilities other than the principal amount of money borrowed) in contrast to most of the AllianceBernstein High Income mutual funds whose advisory fees are based on each of the those funds’ average daily net assets.
| | | | | | |
| Category | | Net Assets 09/30/07 ($MIL) | | Advisory Fee Based on % of
Average Daily Adjusted Total Assets | | Fund |
| High Income | | $ 392.3 | | 50 bp on 1st $2.5 billion | | Emerging Market |
| | | | 45 bp on next $2.5 billion | | Debt |
| | | | 40 bp on the balance | | |
The Adviser is reimbursed as specified in the Investment Advisory Agreement for certain clerical, legal, accounting, administrative and other services provided to the Fund. During the Fund’s most recently completed fiscal year, the Adviser received $101,500 (0.030% of the Fund’s average daily net assets) for such services.
Set forth below are the Fund’s total expense ratios annualized for the most recent semi-annual period:
| | | | | | | |
| Fund | | Total Expense
Ratio | | | Fiscal
Year End |
| Emerging Market Debt Fund, Inc.5 | | Class A | | 1.43 | % | | October 31 |
| | Class B | | 2.16 | % | | |
| | Class C | | 2.13 | % | | |
I. ADVISORY FEES CHARGED TO INSTITUTIONAL AND OTHER CLIENTS
The advisory fees charged to investment companies which the Adviser manages and sponsors are normally higher than those charged to similar sized institutional accounts, including pension plans and sub-advised investment companies. The fee differential reflects, among other things, different services provided to such clients, and different liabilities assumed. Services provided by the Adviser to the Fund that are not provided to non-investment company clients include providing office space and personnel to serve as Fund Officers, who among other responsibilities make the certifications required under the Sarbanes–Oxley Act of 2002, and coordinating with and monitoring the Fund’s third party service
4 | Most of the AllianceBernstein Mutual Funds, which the Adviser manages, were affected by the Adviser’s settlement with the NYAG. |
5 | Includes interest expense of 0.32%. Excluding interest expense (related to reverse repurchase agreements of the Fund), the expense ratios would be 1.11%, 1.84% and 1.81% for Classes A, B and C, respectively. The Adviser intends on implementing expense caps, effective sometime between November 2, 2007 and February 1, 2008. The expense caps would be 0.95%, 1.65%, 1.65%, 0.65%, 1.15%, 0.90% and 0.65% for classes A, B, C, Advisor (new), R (new), K (new), and I (new). |
| | |
| ALLIANCEBERNSTEIN EMERGING MARKET DEBT FUND • | | 45 |
providers such as Fund counsel, auditors, custodians, transfer agents and pricing services. The accounting, administrative, legal and compliance requirements for the Fund are more costly than those for institutional client assets due to the greater complexities and time required for investment companies, although as previously noted, a portion of these expenses are reimbursed by the Fund to the Adviser. Also, retail mutual funds managed by the Adviser are widely held. Servicing the Fund’s investors is more time consuming and labor intensive compared to institutional clients since the Adviser needs to communicate with a more extensive network of financial intermediaries and shareholders. In addition, managing the cash flow of an investment company may be more difficult than that of a stable pool of assets, such as an institutional account with little cash movement in either direction, particularly, if a fund is in net redemption and the Adviser is frequently forced to sell securities to raise cash for redemptions. However, managing a fund with positive cash flow may be easier at times than managing a stable pool of assets. Finally, in recent years, investment advisers have been sued by institutional clients and have suffered reputational damage both by the attendant publicity and outcomes other than complete victories. Accordingly, the legal and reputational risks associated with institutional accounts are greater than previously thought, although still not equal to those related to the mutual fund industry.
Notwithstanding the Adviser’s view that managing an investment company is not comparable to managing other institutional accounts because the services provided are different, it is worth considering information regarding the advisory fees charged to institutional accounts with a substantially similar investment style as the Fund.6 In addition to the AllianceBernstein Institutional fee schedule, set forth below is what would have been the effective advisory fee of the Fund had the AllianceBernstein Institutional fee schedule been applicable to the Fund versus the Fund’s advisory fees based on September 30, 2007 net assets.
| | | | | | | | |
| Fund | | Net Assets 09/30/07 ($MIL) | | AllianceBernstein (“AB”)
Institutional (“Inst.”) Fee Schedule | | Effective
AB Inst.
Adv. Fee | | Fund Advisory Fee |
| Emerging Market Debt Fund, Inc. | | $ 392.3 | | Emerging Market Debt Schedule 65 bp on 1st $20 million 35 bp on the balance Minimum account size: $25m | | 0.373% | | 0.500% |
The adviser manages the AllianceBernstein Variable Products Series Fund, Inc. (“AVPS”), which is available through variable annuity and variable life contracts offered by other financial institutions, offers policyholders the option to utilize
6 | The Adviser has indicated that with respect to institutional accounts with assets greater than $300 million, it will negotiate a fee schedule, although it should be noted that there were no such institutional accounts that are similar in investment style as the Fund, which opened in the last three years. Discounts that are negotiated vary based upon each client relationship. |
| | |
| 46 | | • ALLIANCEBERNSTEIN EMERGING MARKET DEBT FUND |
certain AVPS portfolios as the investment option underlying their insurance contracts. Set forth below is the fee schedule of the AVPS portfolio that has a similar investment style as the Fund.7 Also shown is what would have been the effective advisory fee of the Fund had the advisory fee schedule of the AVPS portfolio been applicable to the Fund versus the Fund’s advisory fee:
| | | | | | | | |
| Fund | | AVPS Portfolio | | Fee Schedule | | AVPS
Effective
Fee | | Fund
Advisory
Fee |
Emerging Market Debt | | Global Dollar | | 0.50% on first $2.5 billion | | 0.500% | | 0.500% |
Fund, Inc. | | Government | | 0.40% on next $2.5 billion | | | | |
| | Portfolio | | 0.35% on the balance | | | | |
The Adviser also manages and sponsors retail mutual funds, which are organized in jurisdictions outside the United States, generally Luxembourg and Japan, and sold to non-United States resident investors. The Adviser charges the following fee for Emerging Market Debt, a Luxembourg fund, which has a somewhat similar investment style as the Fund:
| | |
| Fund | | Fee8 |
| Emerging Market Debt | | |
Class A | | 1.10% |
Class I (Institutional) | | 0.55% |
The Alliance Capital Investment Trust Management mutual funds (“ACITM”), which are offered to investors in Japan, have an “all-in” fee to compensate the Adviser for investment advisory as well as fund accounting and administrative related services. The fee schedule of the ACITM mutual fund that has a somewhat similar investment style as the Fund is as follows:
| | | | |
| Fund | | ACITM Mutual Fund | | Fee |
| Emerging Market Debt Fund, Inc. | | Emerging Market Bond Fund | | |
| | FC/FD9 | | 0.70% |
| | P-H9 | | 0.10%10 |
The Adviser represented that it does not sub-advise any registered investment companies have a similar investment strategy as the Fund.
7 | It should be noted that AVPS was affected by the settlement between the Adviser and the NYAG. |
8 | Class A shares of the fund are charged an “all-in” fee, which covers investment advisory services and distribution related services. |
9 | This ACITM fund is privately placed or institutional. |
10 | In addition to the 0.10%, the Adviser charges the institutional account an additional fee for managing the assets of the institutional account. |
| | |
| ALLIANCEBERNSTEIN EMERGING MARKET DEBT FUND • | | 47 |
| II. | MANAGEMENT FEES CHARGED BY OTHER MUTUAL FUND COMPANIES FOR LIKE SERVICES. |
Lipper, Inc. (“Lipper”), an analytical service that is not affiliated with the Adviser, compared the fees charged to the Fund with fees charged to other investment companies for similar services by other investment advisers. Lipper’s analysis included the Fund’s ranking with respect to the contractual management fee relative to the median of the Fund’s Lipper Expense Group (“EG”) at the approximate current asset level of the Fund.11
Lipper describes an EG as a representative sample of comparable funds. Lipper’s standard methodology for screening funds to be included in an EG entails the consideration of several fund criteria, including fund type, investment classification/objective, load type and similar 12b-1/non-12b-1 service fees, asset (size) comparability, and expense components and attributes.12 An EG will typically consist of seven to twenty funds.
| | | | | | |
| Fund | | Contractual
Management Fee13 | | Lipper Group Median (%) | | Lipper
Group Rank |
| Emerging Market Debt | | 0.500 | | 0.765 | | 1/8 |
Lipper also compared the Fund’s most recently completed fiscal year total expense ratio to the median of the Fund’s EG and Lipper Expense Universe (“EU”). The EU is a broader group compared to the EG, consisting of all funds that have the same investment classification/objective and load type as the subject Fund.14 Pro-forma total expense ratio information (shown in bold and italicized) is included in the table below.
| | | | | | | | | | |
| Fund | | Expense Ratio
(%)15 | | Lipper Group
Median (%) | | Lipper Group Rank | | Lipper Universe Median (%) | | Lipper
Universe Rank |
| Emerging Market Debt | | 1.141 | | 1.205 | | 2/8 | | 1.374 | | 2/11 |
Pro-forma16 | | 0.950 | | 1.205 | | 1/8 | | 1.374 | | 1/11 |
11 | The contractual management fee is calculated by Lipper using the Fund’s contractual management fee rate at a hypothetical asset level. The hypothetical asset level is based on the combined net assets of all classes of the Fund, rounded up to the next $25 million. Lipper’s total expense ratio information is based on the most recent annual report except as otherwise noted. A ranking of “1” means that the Fund has the lowest effective fee rate in the Lipper peer group. |
12 | Lipper does not consider average account size when constructing EGs. Funds with relatively small average account sizes tend to have higher transfer agent expense ratios than comparable sized funds that have relatively large average account sizes. Note that there are limitations on Lipper expense category data because different funds categorize expenses differently. |
13 | The contractual management fee does not reflect any expense reimbursements made by the Fund to the Adviser for certain clerical, legal, accounting, administrative, and other services. |
14 | Except for asset size comparability, Lipper uses the same criteria for selecting an EG peer when selecting an EU peer. Unlike the EG, the EU allows for the same adviser to be represented by more than just one fund. |
15 | Most recently completed fiscal year Class A share total expense ratio. |
16 | Pro-forma shows what would have been the total expense ratio of the Fund had the anticipated expense limitation undertaking been in effect for the full fiscal year. |
| | |
| 48 | | • ALLIANCEBERNSTEIN EMERGING MARKET DEBT FUND |
Based on this analysis, the Fund has a more favorable ranking on a management fee basis and on a total expense ratio basis.
| III. | COSTS TO THE ADVISER AND ITS AFFILIATES OF SUPPLYING SERVICES PURSUANT TO THE ADVISORY FEE ARRANGEMENT, EXCLUDING ANY INTRA-CORPORATE PROFIT. |
The Adviser utilizes two profitability reporting systems, which operate independently but are aligned with each other, to estimate the Adviser’s profitability in connection with investment advisory services provided to the Fund. The Senior Officer has retained a consultant to provide independent advice regarding the alignment of the two profitability systems as well as the methodologies and allocations utilized by both profitability systems. See Section IV for additional discussion.
| IV. | PROFIT MARGINS OF THE ADVISER AND ITS AFFILIATES FOR SUPPLYING SUCH SERVICES. |
The profitability information for the Fund prepared by the Adviser for the Board of Directors was reviewed by the Senior Officer and the consultant. The Adviser’s profitability from providing investment advisory services to the Fund decreased during calendar year 2006, relative to 2005.
In addition to the Adviser’s direct profits from managing the Fund, certain of the Adviser’s affiliates have business relationships with the Fund and may earn a profit from providing other services to the Fund. The courts have referred to this type of business opportunity as “fall-out benefits” to the Adviser and indicated that such benefits should be factored into the evaluation of the total relationship between the Fund and the Adviser. Neither case law nor common business practice precludes the Adviser’s affiliates from earning a reasonable profit on this type of relationship. These affiliates provide transfer agent and distribution related services to the Fund and receive transfer agent fees, Rule 12b-1 payments, front-end sales loads and contingent deferred sales charges (“CDSC”).
AllianceBernstein Investments, Inc. (“ABI”), an affiliate of the Adviser, is the Fund’s principal underwriter. ABI and the Adviser have disclosed in the Fund’s prospectus that they may make revenue sharing payments from their own resources, in addition to revenues derived from sales loads and Rule 12b-1 fees, to firms that sell shares of the Fund. In 2006, ABI paid approximately 0.044% of the average monthly assets of the AllianceBernstein Mutual Funds or approximately $20.4 million for distribution services and educational support (revenue sharing payments). For 2007, it is anticipated, ABI will pay approximately 0.04% of the average monthly assets of the AllianceBernstein Mutual Funds or
| | |
| ALLIANCEBERNSTEIN EMERGING MARKET DEBT FUND • | | 49 |
approximately $20 million.17 During the Fund’s most recently completed fiscal year, ABI received from the Fund $25,959, $2,106,848 and $118,549 in front-end sales charges, Rule 12b-1 and CDSC fees, respectively.
Fees and reimbursements for out of pocket expenses charged by AllianceBernstein Investor Services, Inc. (“ABIS”), the affiliated transfer agent for the Fund, are charged on a per account basis, based on the level of service provided and the class of share held by the account. ABIS also receives a fee per shareholder sub-account for each account maintained by an intermediary on an omnibus basis. ABIS’ after-tax profitability decreased in 2006 in comparison to 2005. During the Fund’s most recently completed fiscal year, ABIS received $241,517 in fees from the Fund.18
| V. | POSSIBLE ECONOMIES OF SCALE |
The Adviser has indicated that economies of scale are being shared with shareholders through fee structures,19 subsidies and enhancement to services. Based on some of the professional literature that has considered economies of scale in the mutual fund industry, it is thought that to the extent economies of scale exist, they may more often exist across a fund family as opposed to a specific fund. This is because the costs incurred by the Adviser, such as investment research or technology for trading or compliance systems, can be spread across a greater asset base as the fund family increases in size. It is also possible that as the level of services required to operate a successful investment company has increased over time, and advisory firms have made such investments in their business to provide services, there may be a sharing of economies of scale without a reduction in advisory fees.
An independent consultant, retained by the Senior Officer, provided the Board of Directors an update of the Deli20 study on advisory fees and various fund characteristics. The preliminary results of the updated study, based on more recent data and using Lipper classifications, were found to be consistent with the results of the original study. The independent consultant observed patterns of
17 | ABI currently inserts the “Advance” in quarterly account statements and pays the incremental costs associated with the mailing. The incremental cost is less than what an “independent mailing” would cost. |
18 | The fees disclosed are net of any expense offsets with ABIS. An expense offset is created by the interest earned on the positive cash balance that occur within the transfer agent account as there is a one day lag with regards to money movement from the shareholder’s account to the transfer agent’s account and then the transfer agent’s account to the Fund’s account. During the Fund’s most recently completed fiscal year, the fees paid by the Fund to ABIS were reduced by $9,256 under the offset agreement between the Fund and ABIS. |
19 | Fee structures include fee reductions, pricing at scale and breakpoints in advisory fee schedules. |
20 | The Deli study was originally published in 2002 based on 1997 data. |
| | |
| 50 | | • ALLIANCEBERNSTEIN EMERGING MARKET DEBT FUND |
lower advisory fees for funds with larger asset sizes and funds from larger family sizes compared to funds with smaller asset sizes and funds from smaller family sizes, which according to the independent consultant is indicative of a sharing of economies of scale and scope. However, in less liquid and active markets, such is not the case, as the empirical analysis showed potential for diseconomies of scale in those markets. The empirical analysis also showed diminishing economies of scale and scope as funds surpassed a certain high level of assets.
| VI. | NATURE AND QUALITY OF THE ADVISER’S SERVICES, INCLUDING THE PERFORMANCE OF THE FUND |
With assets under management of approximately $813 billion as of September 30, 2007, the Adviser has the investment experience to manage and provide non-investment services (described in Section I) to the Fund.
The information below shows the 1, 3, 5 and 10 year performance returns and rankings of the Fund21 relative to its Lipper Performance Group (“PG”) and Lipper Performance Universe (“PU”)22 for the periods ended July 31, 2007.23
| | | | | | | | | | |
| | | Fund Return (%) | | PG Median (%) | | PU Median (%) | | PG Rank | | PU Rank |
1 year | | 10.24 | | 8.71 | | 8.64 | | 2/7 | | 7/14 |
3 year | | 11.80 | | 12.28 | | 11.77 | | 5/7 | | 5/10 |
5 year | | 18.75 | | 15.97 | | 15.97 | | 1/6 | | 1/9 |
10 year | | 10.05 | | 9.94 | | 9.89 | | 1/3 | | 2/6 |
Set forth below are the 1, 3, 5, 10 year and since inception performance returns of the Fund (in bold)24 versus its benchmarks.25 Note the Fund may utilize
21 | The performance returns and rankings are for the Class A shares of the Fund. It should be noted that the performance returns of the Fund that is shown was provided by the Adviser. Lipper maintains its own database that includes the Fund’s performance returns. However, differences in the distribution price (ex-date versus payable date) and rounding differences may cause the Adviser’s own performance returns of the Fund to be one or two basis points different from Lipper. To maintain consistency in this evaluation, the performance returns of the Fund, as reported by the Adviser, are provided instead of Lipper. |
22 | The Fund’s PG/PU are not identical to the Fund’s EG/EU as the criteria for including or excluding a fund in/from a PG/PU are somewhat different than that of an EU/EG. |
23 | Note that the current Lipper investment classification/objective dictates the PG and PU throughout the life of the Fund even if the Fund may have had a different investment classification/objective at different points in time. |
24 | The performance returns and risk measures shown in the table are for the Class A shares of the Fund. |
25 | The benchmark’s since inception performance return is from the nearest month-end after inception date. In contrast to the benchmark, the Fund’s since inception performance return is from the Fund’s actual inception date. |
| | |
| ALLIANCEBERNSTEIN EMERGING MARKET DEBT FUND • | | 51 |
leverage in contrast to the Fund’s benchmark, which has no leverage. Fund and benchmark volatility and reward-to-variability ratio (“Sharpe Ratio”) information is also shown.26
| | | | | | | | | | | | | | | | |
| | | Periods Ending July 31, 2007
Annualized Performance |
| | | 1 Year (%) | | 3 Year (%) | | 5 Year (%) | | 10 Year (%) | | Since
Inception (%) | | Annualized | | Risk
Period
(Year) |
| | | | | | | | Volatility (%) | | Sharpe
(%) | |
| | | | | | | | | | | | | | | | |
Emerging Market Debt Fund, Inc. | | 10.24 | | 11.80 | | 18.75 | | 10.05 | | 11.88 | | 17.44 | | 0.43 | | 10 |
JP Morgan EMBI Global Index | | 7.16 | | 10.56 | | 14.94 | | 9.17 | | 11.20 | | 13.59 | | 0.45 | | 10 |
Inception Date: February 25, 1994 | | | | | | | | | | | | | | | | |
CONCLUSION:
Based on the factors discussed above the Senior Officer’s conclusion is that the proposed advisory fee for the Fund is reasonable and within the range of what would have been negotiated at arms-length in light of all the surrounding circumstances. This conclusion in respect of the Fund is based on an evaluation of all of these factors and no single factor was dispositive.
Dated: November 26, 2007
26 | Fund volatility and Sharpe Ratio information was obtained through Lipper LANA, a database maintained by Lipper. Benchmark volatility and Share Ratio information was estimated by the Senior Officer using standard Lipper methodology. Volatility is a statistical measure of the tendency of a market price or yield to vary over time. A Sharpe Ratio is a risk adjusted measure of return that divides a fund’s return in excess of the riskless return by the fund’s standard deviation. A fund with a greater volatility would be seen as more risky than a fund with equivalent performance but lower volatility; for that reason, a greater return would be demanded for the more risky fund. A fund with a higher Sharpe Ratio would be viewed as better performing than a fund with a lower Sharpe Ratio. |
| | |
| 52 | | • ALLIANCEBERNSTEIN EMERGING MARKET DEBT FUND |
THIS PAGE IS NOT PART OF THE SHAREHOLDER REPORT OR THE FINANCIAL STATEMENTS
ALLIANCEBERNSTEIN FAMILY OF FUNDS
Wealth Strategies Funds
Balanced Wealth Strategy
Wealth Appreciation Strategy
Wealth Preservation Strategy
Tax-Managed Balanced Wealth Strategy
Tax-Managed Wealth Appreciation Strategy
Tax-Managed Wealth Preservation Strategy
Blended Style Funds
U.S. Large Cap Portfolio
International Portfolio
Tax-Managed International Portfolio
Growth Funds
Domestic
Growth Fund
Mid-Cap Growth Fund
Large Cap Growth Fund
Small Cap Growth Portfolio
Global & International
Global Health Care Fund
Global Research Growth Fund
Global Technology Fund
Greater China ‘97 Fund
International Growth Fund
International Research Growth Fund
Value Funds
Domestic
Balanced Shares
Focused Growth & Income Fund
Growth & Income Fund
Small/Mid-Cap Value Fund
Utility Income Fund
Value Fund
Global & International
Global Real Estate Investment Fund*
Global Value Fund
International Value Fund
Taxable Bond Funds
Corporate Bond Portfolio
Diversified Yield Fund*
Emerging Market Debt Fund
Global Bond Fund*
High Yield Fund
Intermediate Bond Portfolio
Short Duration Portfolio
Municipal Bond Funds
| | |
National
Insured National
Arizona
California
Insured California
Florida
Massachusetts | | Michigan
Minnesota
New Jersey
New York
Ohio
Pennsylvania
Virginia |
Intermediate Municipal Bond Funds
Intermediate California
Intermediate Diversified
Intermediate New York
Closed-End Funds
All-Market Advantage Fund
AllianceBernstein Global High Income Fund*
AllianceBernstein Income Fund*
AllianceBernstein National Municipal Income Fund*
ACM Managed Dollar Income Fund
California Municipal Income Fund
New York Municipal Income Fund
The Spain Fund
Retirement Strategies Funds
| | | | |
2000 Retirement Strategy | | 2020 Retirement Strategy | | 2040 Retirement Strategy |
2005 Retirement Strategy | | 2025 Retirement Strategy | | 2045 Retirement Strategy |
2010 Retirement Strategy | | 2030 Retirement Strategy | | 2050 Retirement Strategy |
2015 Retirement Strategy | | 2035 Retirement Strategy | | 2055 Retirement Strategy |
We also offer Exchange Reserves,** which serves as the money market fund exchange vehicle for the AllianceBernstein mutual funds.
You should consider the investment objectives, risks, charges and expenses of any AllianceBernstein fund/portfolio carefully before investing. For free copies of our prospectuses, which contain this and other information, visit us online at www.alliancebernstein.com or contact your financial advisor. Please read the prospectus carefully before investing.
| * | | Prior to January 26, 2007, AllianceBernstein Global High Income Fund was named Alliance World Dollar Government Fund II and AllianceBernstein Income Fund was named ACM Income Fund. Prior to March 1, 2007, Global Real Estate Investment Fund was named Real Estate Investment Fund. Prior to May 18, 2007, AllianceBernstein National Municipal Income Fund was named National Municipal Income Fund. Prior to November 5, 2007, Diversified Yield Fund was named Global Strategic Income Trust and Global Bond Fund was named Global Government Income Trust. |
| ** | An investment in the Fund is not a deposit in a bank and is not insured or guaranteed by the Federal Deposit Insurance Corporation or any other government agency. Although the Fund seeks to preserve the value of your investment at $1.00 per share, it is possible to lose money by investing in the Fund. |
| | |
| ALLIANCEBERNSTEIN EMERGING MARKET DEBT FUND • | | 53 |
AllianceBernstein Family of Funds
ALLIANCEBERNSTEIN EMERGING MARKET DEBT FUND
1345 Avenue of the Americas
New York, NY 10105
800.221.5672
| | |
| |
| EMD-0151-1007 | |  |
(a) The registrant has adopted a code of ethics that applies to its principal executive officer, principal financial officer and principal accounting officer. A copy of the registrant’s code of ethics is filed herewith as Exhibit 12(a)(1).
(b) During the period covered by this report, no material amendments were made to the provisions of the code of ethics adopted in 2(a) above.
(c) During the period covered by this report, no implicit or explicit waivers to the provisions of the code of ethics adopted in 2(a) above were granted.
| ITEM 3. | AUDIT COMMITTEE FINANCIAL EXPERT. |
The registrant’s Board of Directors has determined that independent directors David H. Dievler and William H. Foulk, Jr. qualify as audit committee financial experts.
| ITEM 4. | PRINCIPAL ACCOUNTANT FEES AND SERVICES. |
(a) - (c) The following table sets forth the aggregate fees billed by the independent registered public accounting firm Ernst & Young LLP, for the Fund’s last two fiscal years for professional services rendered for: (i) the audit of the Fund’s annual financial statements included in the Fund’s annual report to stockholders; (ii) assurance and related services that are reasonably related to the performance of the audit of the Fund’s financial statements and are not reported under (i), which include advice and education related to accounting and auditing issues and quarterly press release review (for those Funds which issue press releases), and preferred stock maintenance testing (for those Funds that issue preferred stock); and (iii) tax compliance, tax advice and tax return preparation.
| | | | | | | | | |
| | | Audit Fees | | Audit-Related Fees | | Tax Fees |
2006 | | $ | 58,000 | | $ | 5,686 | | $ | 19,300 |
2007 | | $ | 61,500 | | $ | 5,548 | | $ | 19,875 |
(d) Not applicable.
(e) (1) Beginning with audit and non-audit service contracts entered into on or after May 6, 2003, the Fund’s Audit Committee policies and procedures require the pre-approval of all audit and non-audit services provided to the Fund by the Fund’s independent registered public accounting firm. The Fund’s Audit Committee policies and procedures also require pre-approval of all audit and non-audit services provided to the Adviser and Service Affiliates to the extent that these services are directly related to the operations or financial reporting of the Fund.
(e) (2) All of the amounts for Audit Fees, Audit-Related Fees and Tax Fees in the table under Item 4 (a) – (c) are for services pre-approved by the Fund’s Audit Committee.
(f) Not applicable.
3
(g) The following table sets forth the aggregate non-audit services provided to the Fund, the Fund’s Adviser and entities that control, are controlled by or under common control with the Adviser that provide ongoing services to the Fund, which include preparing an annual internal control report pursuant to Statement on Auditing Standards No. 70 (“Service Affiliates”):
| | | | | | | |
| | | All Fees for Non-Audit Services Provided to the Portfolio, the Adviser and Service Affiliates | | Total Amount of
Foregoing Column Pre- approved by the Audit
Committee (Portion Comprised of
Audit Related Fees) (Portion Comprised of
Tax Fees) | |
2006 | | $ | 1,034,874 | | $ | 156,501 | |
| | | | | $ | (137,201 | ) |
| | | | | $ | (19,300 | ) |
2007 | | $ | 916,178 | | $ | 144,943 | |
| | | | | $ | (125,068 | ) |
| | | | | $ | (19,875 | ) |
(h) The Audit Committee of the Fund has considered whether the provision of any non-audit services not pre-approved by the Audit Committee provided by the Fund’s independent registered public accounting firm to the Adviser and Service Affiliates is compatible with maintaining the auditor’s independence.
| ITEM 5. | AUDIT COMMITTEE OF LISTED REGISTRANTS. |
Not applicable to the registrant.
| ITEM 6. | SCHEDULE OF INVESTMENTS. |
Please see Schedule of Investments contained in the Report to Shareholders included under Item 1 of this Form N-CSR.
| ITEM 7. | DISCLOSURE OF PROXY VOTING POLICIES AND PROCEDURES FOR CLOSED-END MANAGEMENT INVESTMENT COMPANIES. |
Not applicable to the registrant.
| ITEM 8. | PORTFOLIO MANAGERS OF CLOSED-END MANAGEMENT INVESTMENT COMPANIES. |
Not applicable to the registrant.
4
| ITEM 9. | PURCHASES OF EQUITY SECURITIES BY CLOSED-END MANAGEMENT INVESTMENT COMPANY AND AFFILIATED PURCHASERS. |
Not applicable to the registrant.
| ITEM 10. | SUBMISSION OF MATTERS TO A VOTE OF SECURITY HOLDERS. |
There have been no material changes to the procedures by which shareholders may recommend nominees to the Fund’s Board of Directors since the Fund last provided disclosure in response to this item.
| ITEM 11. | CONTROLS AND PROCEDURES. |
(a) The registrant’s principal executive officer and principal financial officer have concluded that the registrant’s disclosure controls and procedures (as defined in Rule 30a-3 (c) under the Investment Company Act of 1940, as amended) are effective at the reasonable assurance level based on their evaluation of these controls and procedures as of a date within 90 days of the filing date of this document.
(b) There were no changes in the registrant’s internal controls over financial reporting that occurred during the second fiscal quarter of the period that has materially affected, or is reasonably likely to materially affect, the registrant’s internal control over financial reporting.
The following exhibits are attached to this Form N-CSR:
| | |
EXHIBIT NO. | | DESCRIPTION OF EXHIBIT |
| 12 (a) (1) | | Code of Ethics that is subject to the disclosure of Item 2 hereof |
| |
| 12 (b) (1) | | Certification of Principal Executive Officer Pursuant to Section 302 of the Sarbanes-Oxley Act of 2002 |
| |
| 12 (b) (2) | | Certification of Principal Financial Officer Pursuant to Section 302 of the Sarbanes-Oxley Act of 2002 |
| |
| 12 (c) | | Certification of Principal Executive Officer and Principal Financial Officer Pursuant to Section 906 of the Sarbanes-Oxley Act of 2002 |
5
SIGNATURES
Pursuant to the requirements of the Securities Exchange Act of 1934 and the Investment Company Act of 1940, the registrant has duly caused this report to be signed on its behalf by the undersigned, thereunto duly authorized.
| | |
| (Registrant): AllianceBernstein Emerging Market Debt Fund, Inc. |
| |
| By: | | /s/ Marc O. Mayer |
| | Marc O. Mayer |
| | President |
| |
| Date: | | December 27, 2007 |
Pursuant to the requirements of the Securities Exchange Act of 1934 and the Investment Company Act of 1940, this report has been signed below by the following persons on behalf of the registrant and in the capacities and on the dates indicated.
| | |
| By: | | /s/ Marc O. Mayer |
| | Marc O. Mayer |
| | President |
| |
| Date: | | December 27, 2007 |
| |
| By: | | /s/ Joseph J. Mantineo |
| | Joseph J. Mantineo |
| | Treasurer and Chief Financial Officer |
| |
| Date: | | December 27, 2007 |
6