UNITED STATES
SECURITIES AND EXCHANGE COMMISSION
WASHINGTON, D.C. 20549
FORM N-CSR
CERTIFIED SHAREHOLDER REPORT OF REGISTERED MANAGEMENT
INVESTMENT COMPANIES
Investment Company Act file number: 811-08188
ALLIANCEBERNSTEIN HIGH INCOME FUND, INC.
(Exact name of registrant as specified in charter)
1345 Avenue of the Americas, New York, New York 10105
(Address of principal executive offices) (Zip code)
Joseph J. Mantineo
AllianceBernstein L.P.
1345 Avenue of the Americas
New York, New York 10105
(Name and address of agent for service)
Registrant’s telephone number, including area code: (800) 221-5672
Date of fiscal year end: October 31, 2008
Date of reporting period: October 31, 2008
| ITEM 1. | REPORTS TO STOCKHOLDERS. |
ANNUAL REPORT
AllianceBernstein
High Income Fund
(formerly Emerging Market Debt Fund)

Annual Report
Investment Products Offered
| | • | | Are Not Bank Guaranteed |
The investment return and principal value of an investment in the Fund will fluctuate as the prices of the individual securities in which it invests fluctuate, so that your shares, when redeemed, may be worth more or less than their original cost. You should consider the investment objectives, risks, charges and expenses of the Fund carefully before investing. For a free copy of the Fund’s prospectus, which contains this and other information, visit our web site at www.alliancebernstein.com or call your financial advisor or AllianceBernstein® at (800) 227-4618. Please read the prospectus carefully before you invest.
You may obtain performance information current to the most recent month-end by visiting www.alliancebernstein.com.
This shareholder report must be preceded or accompanied by the Fund’s prospectus for individuals who are not current shareholders of the Fund.
You may obtain a description of the Fund’s proxy voting policies and procedures, and information regarding how the Fund voted proxies relating to portfolio securities during the most recent 12-month period ended June 30, without charge. Simply visit AllianceBernstein’s web site at www.alliancebernstein.com, or go to the Securities and Exchange Commission’s (the “Commission”) web site at www.sec.gov, or call AllianceBernstein at (800) 227-4618.
The Fund files its complete schedule of portfolio holdings with the Commission for the first and third quarters of each fiscal year on Form N-Q. The Fund’s Forms N-Q are available on the Commission’s web site at www.sec.gov. The Fund’s Forms N-Q may also be reviewed and copied at the Commission’s Public Reference Room in Washington, DC; information on the operation of the Public Reference Room may be obtained by calling (800) SEC-0330. AllianceBernstein publishes full portfolio holdings for the Fund monthly at www.alliancebernstein.com.
AllianceBernstein Investments, Inc. is an affiliate of AllianceBernstein L.P., the manager of the AllianceBernstein funds, and is a member of FINRA.
AllianceBernstein® and the AB Logo are registered trademarks and service marks used by permission of the owner, AllianceBernstein L.P.
December 19, 2008
Annual Report
This report provides management’s discussion of fund performance for AllianceBernstein High Income Fund (the “Fund”) for the annual reporting period ended October 31, 2008. On August 2, 2007, the Board of Directors of the Fund (the “Board”) approved changing the Fund’s name from AllianceBernstein Emerging Market Debt Fund Inc. to “AllianceBernstein High Income Fund, Inc.” and certain policy changes. These changes were intended to refocus the Fund’s investment strategy on a broader range of debt securities, including corporate debt securities as well as emerging market debt securities. In addition, the Board approved the acquisition of the assets and liabilities of AllianceBernstein Corporate Bond Portfolio (“Corporate Bond”), a series of AllianceBernstein Bond Fund, Inc. and AllianceBernstein High Yield Fund, Inc. (“High Yield”). Shareholders of Corporate Bond and shareholders of High Yield approved the acquisitions of Corporate Bond and High Yield by the Fund, respectively. The acquisitions, changes to the Fund’s policies and change of the Fund’s name became effective in late January.
Investment Objectives and Policies
This open-end Fund’s investment objective is to maximize total returns from price appreciation and income. The Fund pursues income opportunities from government, corporate, emerging-market and high-yield sources. It has the flexibility to invest in a broad range of fixed-income securities in both developed and emerging-market countries. The Fund’s investments may include U.S. and non-U.S. corporate debt securities and sovereign debt securities. The Fund may invest, without limitation, in either U.S. dollar-denominated or non-U.S. dollar-denominated fixed-income securities.
The Fund may invest in debt securities with a range of maturities from short- to long-term. Substantially all of the Fund’s assets may be invested in lower-rated securities, which may include securities having the lowest rating for non-subordinated debt instruments (i.e., rated C by Moody’s Investors Service or CCC+ or lower by Standard & Poor’s Rating Services and Fitch Ratings, Ltd.) and unrated securities of equivalent investment quality. The Fund also may invest in investment-grade securities and unrated securities.
The Fund may also make short sales of securities or maintain a short position. The Fund is non-diversified, meaning it may invest more of its assets in a fewer number of issuers. The Fund may invest in mortgage-related and other asset-backed securities, loan participations, inflation-protected securities, structured securities, variable, floating, and inverse floating rate instruments, preferred stock, and may use other investment techniques. The Fund may use borrowings or other leverage for investment purposes. The Fund intends, among other things, to enter into transactions such as reverse repurchase agreements and dollar rolls. The Fund may invest, without limit, in derivatives, such as options, futures, forwards or swap agreements.
Investment Results
The table on page 6 shows the Fund’s performance compared with its new composite benchmark, which is composed of equal weightings of the JPMorgan Emerging Markets Bond Index Global (JPM EMBI Global), the JPM Government Bond Index- Emerging Markets (GBI-EM) (local-currency-denominated) and the Barclays Capital (BC) U.S. Corporate High Yield
| | |
| ALLIANCEBERNSTEIN HIGH INCOME FUND • | | 1 |
(HY) 2% Issuer Capped Index for the six- and 12-month periods ended October 31, 2008. Individual performance for each of these indices is also included for both time periods. The Fund is also compared to its broad-based benchmark, the JPM EMBI Global, which tracks total returns for U.S. dollar-denominated debt instruments issued by emerging market sovereign and quasi-sovereign entities.
The Fund’s Class A shares without sales charges underperformed its composite benchmark for both the six- and 12-month periods ended October 31, 2008. The Fund’s overweight to corporate high-yield debt, as well as security selection, was the primary detractor for both periods, as high-yield debt significantly underperformed. Within the Fund’s emerging market allocation, overall individual country selection also detracted for both periods. The Fund’s overweights in Russia, Ecuador and Argentina which underperformed within the composite index detracted, as did the Fund’s underweights in Chile and China, which outperformed.
The Fund’s allocation to non-financial investment-grade corporates contributed positively to relative performance as investment-grade corporate debt outperformed on a relative basis. Select issuers in the financial industry however detracted. Leverage during both the six- and 12-month periods detracted from performance.
Market Review and Investment Strategy
The credit crisis entered a new and more menacing phase late in the annual period with fear of counterparty risk paralyzing interbank lending and threatening the survival of
some of the world’s most powerful financial firms. Stocks fell sharply and government bonds rallied around the world. Credit spreads widened as investors sought safety in risk-free assets; spreads on global investment-grade corporates hit record highs, while three-month U.S. T-bill yields fell near zero for the first time and the U.S. dollar rose against most currencies.
Loss of confidence undermined several prominent financial firms, and their collapses further undermined confidence. The severe difficulties that financial firms faced prompted government rescues of the Federal National Mortgage Association (Fannie Mae), the Federal Home Loan Mortgage Corporation (Freddie Mac), American International Group and Citigroup Inc. in the U.S.; Bradford & Bingley in the UK; and Fortis Group and Dexia in the euro area. These difficulties also led to the bankruptcy of Lehman Brothers and the rapid announced consolidations of Merrill Lynch with Bank of America, HBOS with Lloyds TSB and Washington Mutual with JPMorgan Chase; and Wachovia with Wells Fargo.
Evidence also mounted that the global economic outlook was worsening as the credit crisis unfolded, darkening corporate profit outlooks. Major central banks responded to the deepening financial crisis by flooding the money markets with liquidity. The U.S. government moved forward on a $700 billion effort to aid the financial system while more recently announcing a pair of new programs to help unfreeze the credit markets and purchase up to
| | |
| 2 | | • ALLIANCEBERNSTEIN HIGH INCOME FUND |
$600 billion of agency debt. At the time of this writing, the Bush administration also announced a government loan of $17.4 billion for General Motors Corp. and Chrysler to maintain operations in exchange for a substantial restructuring of their business. The money is expected to be drawn from the Treasuries’ financial stabilization fund, with some of the restrictions in the original congressional legislation.
Emerging debt markets remained relatively resilient against developed market turbulence until September 2008. The late-period global risk aversion and flight to quality more than wiped out gains in emerging market debt during the annual period. For the annual period, emerging market debt, as represented by the JPM EMBI Global, returned -19.13%. Emerging market debt spreads widened 483 basis points to end the annual period at 684 basis points over neutral duration Treasuries.
The high-yield market was also swept up in the credit crisis and extreme flight to quality. High-yield returns followed the equity markets downward and high yield markets posted some of their worst returns in history during the months of September and October. For the 12-month period the high-yield market, as measured by the BC U.S. Corporate HY 2% Issuer Capped Index, posted a return of -25.41%.
In the Fund’s Global Fixed Income and Global Credit Investment Teams’ view, the global credit crisis has created some of the most compelling opportunities in fixed income in recent years. Valuations in many sectors became divorced from fundamentals as the credit crisis intensified and spreads, in the case of corporate debt, widened to levels hundreds of basis points above previous highs.
In emerging-market debt, the Teams are focusing their quantitative and fundamental research on identifying countries that successfully used the favorable pre-crisis global environment to solidify their economic and fiscal positions. Countries that meet a desired profile have the policies and resources not only to withstand the crisis, but also to move past it to better days. They amply meet criteria such as fiscal surpluses, current account surpluses, strong foreign-exchange reserves and supportive external-debt-to-GDP ratios. Additionally, their central banks and other policymakers are actively trying to strike an appropriate balance between encouraging growth and fighting inflation.
High-yield spreads are now at all-time wides, and the market is pricing in higher default rates, which are not in line with fundamentals. While dispersion has increased of late, the systemic nature of this sell-off has resulted in a more consistent weakening than that seen in 2002. New issue volumes are near record lows. To mitigate the current financial market volatility, the Fund’s corporate holdings remain diversified.
| | |
| ALLIANCEBERNSTEIN HIGH INCOME FUND • | | 3 |
HISTORICAL PERFORMANCE
An Important Note About the Value of Historical Performance
The performance shown on the following pages represents past performance and does not guarantee future results. Current performance may be lower or higher than the performance information shown. You may obtain performance information current to the most recent month-end by visiting www.alliancebernstein.com.
The investment return and principal value of an investment in the Fund will fluctuate, so that your shares, when redeemed, may be worth more or less than their original cost. You should consider the investment objectives, risks, charges and expenses of the Fund carefully before investing. For a free copy of the Fund’s prospectus, which contains this and other information, visit our website at www.alliancebernstein.com or call your financial advisor or AllianceBernstein Investments at 800.227.4618. You should read the prospectus carefully before you invest.
All fees and expenses related to the operation of the Fund have been deducted. NAV returns do not reflect sales charges; if sales charges were reflected, the Fund’s quoted performance would be lower. SEC returns reflect the applicable sales charges for each share class: a 4.25% maximum front-end sales charge for Class A shares; the applicable contingent deferred sales charge for Class B shares (3% year 1, 2% year 2, 1% year 3, 0% year 4); and a 1% 1 year contingent deferred sales charge for Class C shares. Returns for the different share classes will vary due to different expenses associated with each class. Performance assumes reinvestment of distributions and does not account for taxes.
Benchmark Disclosure
Neither the unmanaged JPMorgan Emerging Markets Bond Index Global (JPM EMBI Global), the JPM Government Bond Index-Emerging Markets (GBI-EM) nor the Barclays Capital (BC) U.S. Corporate High Yield (HY) 2% Issuer Capped Index reflects fees and expenses associated with the active management of a mutual fund portfolio. The unmanaged JPM EMBI Global tracks total returns for U.S. dollar-denominated debt instruments issued by emerging market sovereign and quasi-sovereign entities: Brady bonds, loans, eurobonds. The JPM GBI-EM is the first comprehensive, global local emerging markets index, and consists of regularly traded, liquid fixed-rate, domestic currency government bonds to which international investors can gain exposure. The BC U.S. Corporate HY 2% Issuer Capped Index is the 2% Issuer Cap component of the U.S. Corporate HY Index. The BC U.S. Corporate HY Index is an unmanaged index that includes all fixed-income securities having a maximum quality rating of Ba1, a minimum amount outstanding of $150 million, and at least 1 year to maturity. The Indices do not reflect fees and expenses associated with the active management of a mutual fund portfolio.
A Word About Risk
A substantial amount of the Fund’s assets will be invested in foreign securities in emerging market nations, which may present market, credit, currency, liquidity, legal, political and other risks different from or greater than the risks of investing in developed foreign countries. Investment in the Fund includes risks not associated with funds that invest exclusively in U.S. issues. The Fund can invest a significant portion of its assets in the securities of a single issuer, making the Fund more susceptible to risks associated with a single economic, political or regulatory occurrence than a more diversified portfolio might be. Price fluctuation in the Fund’s portfolio securities may be caused by changes in interest rates or bond credit quality ratings. Changes in
(Historical Performance continued on next page)
| | |
| 4 | | • ALLIANCEBERNSTEIN HIGH INCOME FUND |
Historical Performance
HISTORICAL PERFORMANCE
(continued from previous page)
interest rates have a greater effect on bonds with longer maturities than on those with shorter maturities. Please note, as interest rates rise, existing bond prices fall and can cause the value of your investment in the Fund to decline. The Fund may invest in high-yield bonds (i.e., “junk bonds”), which involve a greater risk of default and price volatility than other bonds. Investing in below-investment grade bonds presents special risks, including credit risk. While the Fund invests principally in bonds and other fixed-income securities, in order to achieve its investment objectives, the Fund may at times use certain types of investment derivatives, such as options, futures, forwards and swaps. These instruments involve risks different from, and in certain cases, greater than, the risks presented by more traditional investments. These risks are fully discussed in the Fund’s prospectus.
(Historical Performance continued on next page)
| | |
| ALLIANCEBERNSTEIN HIGH INCOME FUND • | | 5 |
Historical Performance
HISTORICAL PERFORMANCE
(continued from previous page)
| | | | | | | |
| | | | | | | |
THE FUND VS. ITS BENCHMARK
PERIODS ENDED OCTOBER 31, 2008 | | Returns | | | |
| | 6 Months | | 12 Months | | | |
AllianceBernstein High Income Fund* | | | | | | | |
Class A | | -27.25% | | -27.49% | | | |
| |
Class B** | | -27.61% | | -28.03% | | | |
| |
Class C | | -27.54% | | -27.95% | | | |
| |
Advisor Class† | | -27.09% | | -26.77% | ‡ | | |
| |
Class R† | | -27.33% | | -27.09% | ‡ | | |
| |
Class K† | | -27.22% | | -26.94% | ‡ | | |
| |
Class I† | | -27.25% | | -26.84% | ‡ | | |
| |
Current Composite Benchmark: 33% JPM GBI –
EM/33% JPM EMBI Global/33%
BC U.S. Corporate HY 2%
Issuer Capped Index^ | | -20.82% | | -19.30% | | | |
| |
JPM EMBI Global | | -20.64% | | -19.13% | | | |
| |
JPM GBI – EM | | -16.95% | | -13.17% | | | |
| |
BC U.S. Corporate HY 2% Issuer Capped Index^ | | -24.86% | | -25.41% | | | |
| |
* Includes the impact of proceeds received and credited to the Fund resulting from class action settlements, which enhanced the Fund’s performance for the year ended October 31, 2008, by 0.41%. |
**Effective January 31, 2009, Class B shares will no longer be available for purchase to new investors. For additional information, please contact your financial advisor or visit www.alliancebernstein.com. |
† Please note that these share classes are for investors purchasing shares through accounts established under certain fee-based programs sponsored and maintained by certain broker-dealers and financial intermediaries, institutional pension plans and/or investment advisory clients of, and certain other persons associated with, the Adviser and its affiliates or the Funds. |
‡ These returns are as of the classes’ inception on 1/28/08 and are cumulative. |
^ As of September 2008, all indices with the Lehman Brothers name were changed to Barclays Capital as part of an acquisition of Lehman Brothers’ North American investment banking and capital markets businesses by Barclays Capital. |
| | | | | | | |
See Historical Performance and Benchmark Disclosures on pages 4-5.
(Historical Performance continued on next page)
| | |
| 6 | | • ALLIANCEBERNSTEIN HIGH INCOME FUND |
Historical Performance
HISTORICAL PERFORMANCE
(continued from previous page)
GROWTH OF A $10,000 INVESTMENT IN THE FUND
12/31/01† TO 10/31/08
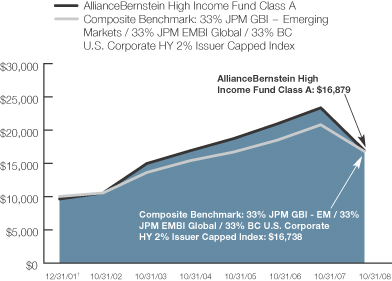
†Prior to 12/31/01, data was not available for the JPM GBI-EM. Therefore, the time period indicated is from the month-end closest to the benchmark’s actual inception date.
This chart illustrates the total value of an assumed $10,000 investment in AllianceBernstein High Income Fund Class A shares (from 12/31/01† to 10/31/08) as compared to the performance of the Fund’s new composite benchmark. The chart reflects the deduction of the maximum 4.25% sales charge from the initial $10,000 investment in the Fund and assumes the reinvestment of dividends and capital gains distributions.
Please note: $10,000 investment performance for the Fund compared to the previous benchmark may be found on the following page.
See Historical Performance and Benchmark Disclosures on pages 4-5.
(Historical Performance continued on next page)
| | |
| ALLIANCEBERNSTEIN HIGH INCOME FUND • | | 7 |
Historical Performance
HISTORICAL PERFORMANCE
(continued from previous page)
GROWTH OF A $10,000 INVESTMENT IN THE FUND
10/31/98 TO 10/31/08
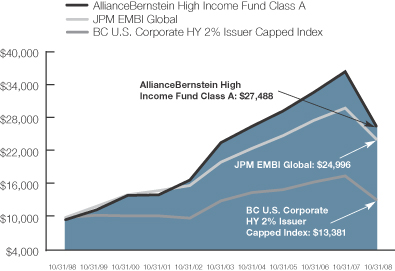
This chart illustrates the total value of an assumed $10,000 investment in AllianceBernstein High Income Fund Class A shares (10/31/98 to 10/31/08) as compared to the JPM EMBI Global and the BC U.S. Corporate HY 2% Issuer Capped Index. The chart reflects the deduction of the maximum 4.25% sales charge from the initial $10,000 investment in the Fund and assumes the reinvestment of dividends and capital gains distributions.
See Historical Performance and Benchmark disclosures on pages 4-5.
(Historical Performance continued on next page)
| | |
| 8 | | • ALLIANCEBERNSTEIN HIGH INCOME FUND |
Historical Performance
HISTORICAL PERFORMANCE
(continued from previous page)
| | | | | | | | | |
| AVERAGE ANNUAL RETURNS AS OF OCTOBER 31, 2008 | |
| | | NAV Returns | | | SEC Returns | | | SEC Yields* | |
| | | |
| Class A Shares | | | | | | | | 13.83 | % |
1 Year | | -27.49 | % | | -30.57 | % | | | |
5 Years | | 2.47 | % | | 1.58 | % | | | |
10 Years | | 11.12 | % | | 10.64 | % | | | |
| | | | | | | | | |
| Class B Shares | | | | | | | | 13.55 | % |
1 Year | | -28.03 | % | | -29.97 | % | | | |
5 Years | | 1.69 | % | | 1.69 | % | | | |
10 Years(a) | | 10.58 | % | | 10.58 | % | | | |
| | | | | | | | | |
| Class C Shares | | | | | | | | 13.49 | % |
1 Year | | -27.95 | % | | -28.60 | % | | | |
5 Years | | 1.70 | % | | 1.70 | % | | | |
10 Years | | 10.26 | % | | 10.26 | % | | | |
| | | | | | | | | |
| Advisor Class Shares‡ | | | | | | | | 14.77 | % |
Since Inception† | | -26.77 | % | | -26.77 | % | | | |
| | | | | | | | | |
| Class R Shares‡ | | | | | | | | 14.24 | % |
Since Inception† | | -27.09 | % | | -27.09 | % | | | |
| | | | | | | | | |
| Class K Shares‡ | | | | | | | | 14.52 | % |
Since Inception† | | -26.94 | % | | -26.94 | % | | | |
| | | | | | | | | |
| Class I Shares‡ | | | | | | | | 14.81 | % |
Since Inception† | | -26.84 | % | | -26.84 | % | | | |
The Fund’s current prospectus fee table shows the Fund’s total annual operating expense ratios as 1.32%, 2.04%, 2.02%, 1.02%, 1.61%, 1.30% and 0.97% for Class A, Class B, Class C, Advisor, Class R, Class K and Class I shares, respectively, gross of any fee waivers or expense reimbursements. Contractual fee waivers and/or expense reimbursements limit the Fund’s annual operating expense ratios to .95%, 1.65%, 1.65%, .65%, 1.15%, .90% and .65% for Class A, Class B, Class C, Advisor, Class R, Class K and Class I shares, respectively. These waivers/reimbursements extend throughout the Fund’s current fiscal year and may be extended by the Adviser for additional one-year terms. Absent reimbursements or waivers, performance would have been lower. The Financial Highlights section of this report sets forth expense ratio data for the current reporting period; the expense ratios shown above may differ from the expense ratios in the Financial Highlights sections since they are based on different time periods.
(a) | Assumes conversion of Class B shares into Class A shares after six years. |
| * | SEC Yields are calculated based on SEC guidelines for the 30-day period ended October 31, 2008. |
| † | Inception date: 1/28/08 for Advisor Class, Class R, Class K and Class I shares. Returns for these share classes are cumulative. |
| ‡ | These share classes are offered at net asset value (NAV) to eligible investors and their SEC returns are the same as the NAV returns. Please note that these share classes are for investors purchasing shares through accounts established under certain fee-based programs sponsored and maintained by certain broker-dealers and financial intermediaries, institutional pension plans and/or investment advisory clients of, and certain other persons associated with, the Adviser and its affiliates or the Funds. The inception date for these share classes is listed above. |
See Historical Performance disclosures on pages 4-5.
(Historical Performance continued on next page)
| | |
| ALLIANCEBERNSTEIN HIGH INCOME FUND • | | 9 |
Historical Performance
HISTORICAL PERFORMANCE
(continued from previous page)
| | | | | | | |
| SEC AVERAGE ANNUAL RETURNS (WITH ANY APPLICABLE SALES CHARGES) AS OF THE MOST RECENT CALENDAR QUARTER-END (SEPTEMBER 30, 2008) | |
| | | | | | | SEC Returns | |
| | | | | | | |
| Class A Shares | | | | | | | |
1 Year | | | | | | -12.84 | % |
5 Years | | | | | | 6.09 | % |
10 Years | | | | | | 13.84 | % |
| | | | | | | |
| Class B Shares | | | | | | | |
1 Year | | | | | | -12.12 | % |
5 Years | | | | | | 6.18 | % |
10 Years(a) | | | | | | 13.77 | % |
| | | | | | | |
| Class C Shares | | | | | | | |
1 Year | | | | | | -10.58 | % |
5 Years | | | | | | 6.18 | % |
10 Years | | | | | | 13.43 | % |
| | | | | | | |
| Advisor Class Shares‡ | | | | | | | |
Since Inception† | | | | | | -10.44 | % |
| | | | | | | |
| Class R Shares‡ | | | | | | | |
Since Inception† | | | | | | -10.80 | % |
| | | | | | | |
| Class K Shares‡ | | | | | | | |
Since Inception† | | | | | | -10.64 | % |
| | | | | | | |
| Class I Shares‡ | | | | | | | |
Since Inception† | | | | | | -10.42 | % |
(a) | Assumes conversion of Class B shares into Class A shares after six years. |
| † | Inception date: 1/28/08 for Advisor Class, Class R, Class K and Class I shares. Returns for these share classes are cumulative. |
‡ | Please note that these share classes are for investors purchasing shares through accounts established under certain fee-based programs sponsored and maintained by certain broker-dealers and financial intermediaries, institutional pension plans and/or investment advisory clients of, and certain other persons associated with, the Adviser and its affiliates or the Funds. The inception date for these share classes is listed above. |
See Historical Performance disclosures on pages 4-5.
| | |
| 10 | | • ALLIANCEBERNSTEIN HIGH INCOME FUND |
Historical Performance
FUND EXPENSES
As a shareholder of the Fund, you incur two types of costs: (1) transaction costs, including sales charges (loads) on purchase payments, contingent deferred sales charges on redemptions and (2) ongoing costs, including management fees; distribution (12b-1) fees; and other Fund expenses. This example is intended to help you understand your ongoing costs (in dollars) of investing in the Fund and to compare these costs with the ongoing costs of investing in other mutual funds.
The Example is based on an investment of $1,000 invested at the beginning of the period and held for the entire period as indicated below.
Actual Expenses
The first line of the table below provides information about actual account values and actual expenses. You may use the information in this line, together with the amount you invested, to estimate the expenses that you paid over the period. Simply divide your account value by $1,000 (for example, an $8,600 account value divided by $1,000 = 8.6), then multiply the result by the number in the first line under the heading entitled “Expenses Paid During Period” to estimate the expenses you paid on your account during this period.
Hypothetical Example for Comparison Purposes
The second line of the table below provides information about hypothetical account values and hypothetical expenses based on the Fund’s actual expense ratio and an assumed annual rate of return of 5% before expenses, which is not the Fund’s actual return. The hypothetical account values and expenses may not be used to estimate the actual ending account balance or expenses you paid for the period. You may use this information to compare the ongoing costs of investing in the Fund and other funds by comparing this 5% hypothetical example with the 5% hypothetical examples that appear in the shareholder reports of other funds.
| | | | | | | | | | | | | | | | | | |
| | | Beginning
Account Value
May 1, 2008 | | Ending
Account Value
October 31, 2008 | | Expenses Paid
During Period* |
| | | Actual | | Hypothetical | | Actual | | Hypothetical** | | Actual | | Hypothetical |
| Class A | | $ | 1,000 | | $ | 1,000 | | $ | 727.53 | | $ | 1,020.31 | | $ | 4.17 | | $ | 4.88 |
| Class B | | $ | 1,000 | | $ | 1,000 | | $ | 723.92 | | $ | 1,016.79 | | $ | 7.19 | | $ | 8.42 |
| Class C | | $ | 1,000 | | $ | 1,000 | | $ | 724.57 | | $ | 1,016.79 | | $ | 7.20 | | $ | 8.42 |
Advisor
Class | | $ | 1,000 | | $ | 1,000 | | $ | 729.08 | | $ | 1,021.82 | | $ | 2.87 | | $ | 3.35 |
| Class R | | $ | 1,000 | | $ | 1,000 | | $ | 726.72 | | $ | 1,019.30 | | $ | 5.03 | | $ | 5.89 |
| Class K | | $ | 1,000 | | $ | 1,000 | | $ | 727.84 | | $ | 1,020.61 | | $ | 3.91 | | $ | 4.57 |
| Class I | | $ | 1,000 | | $ | 1,000 | | $ | 727.48 | | $ | 1,021.82 | | $ | 2.87 | | $ | 3.35 |
| * | Expenses are equal to the classes’ annualized expense ratios of 0.96%, 1.66%, 1.66%, 0.66%, 1.16%, 0.90% and 0.66%, respectively, multiplied by the average account value over the period, multiplied by 184/366 (to reflect the one-half year period). |
| ** | Assumes 5% return before expenses. |
| | |
| ALLIANCEBERNSTEIN HIGH INCOME FUND • | | 11 |
Fund Expenses
PORTFOLIO SUMMARY
October 31, 2008
PORTFOLIO STATISTICS
Net Assets ($mil): $626.2
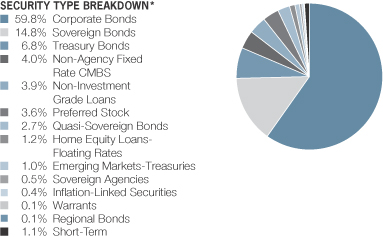
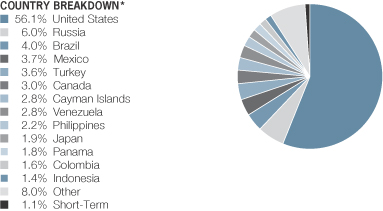
| * | All data are as of October 31, 2008. The Fund’s security type and country breakdowns are expressed as a percentage of total investments and may vary over time. “Other” country weightings represents 1.1% or less in the following countries: Argentina, Belgium, Bermuda, Dominican Republic, Ecuador, El Salvador, France, Germany, Hong Kong, India, Ireland, Italy, Jamaica, Kazakhstan, Luxembourg, Netherlands, Nigeria, Pakistan, Peru, Singapore, South Africa, Switzerland, Ukraine, United Kingdom and Uruguay. |
| | |
| 12 | | • ALLIANCEBERNSTEIN HIGH INCOME FUND |
Portfolio Summary
PORTFOLIO OF INVESTMENTS
October 31, 2008
| | | | | | | |
| | | | | Principal
Amount
(000) | | U.S. $ Value |
| | | | |
| | | | | | | |
CORPORATE BONDS – 58.6% | | | | | | | |
Belgium – 0.1% | | | | | | | |
WDAC Subsidiary Corp. | | | | | | | |
8.375%, 12/01/14(a)(b) | | US$ | | 1,283 | | $ | 500,370 |
| | | | | | | |
| | | |
Bermuda – 0.3% | | | | | | | |
Intelsat Bermuda Ltd. | | | | | | | |
11.25%, 6/15/16(a) | | | | 1,972 | | | 1,686,060 |
| | | | | | | |
| | | |
Brazil – 0.6% | | | | | | | |
Banco BMG SA | | | | | | | |
9.15%, 1/15/16(a)(b) | | | | 1,300 | | | 715,000 |
GTL Trade Finance, Inc. | | | | | | | |
7.25%, 10/20/17(a)(b) | | | | 1,094 | | | 804,496 |
Usiminas Commercial Ltd. | | | | | | | |
7.25%, 1/18/18(a)(b) | | | | 741 | | | 712,918 |
Vale Overseas Ltd. | | | | | | | |
6.875%, 11/21/36(a) | | | | 1,995 | | | 1,433,379 |
| | | | | | | |
| | | | | | | 3,665,793 |
| | | | | | | |
Canada – 2.9% | | | | | | | |
Algoma Acquisition Corp. | | | | | | | |
9.875%, 6/15/15(a)(b) | | | | 900 | | | 594,000 |
Bombardier, Inc. | | | | | | | |
6.30%, 5/01/14(a)(b) | | | | 1,415 | | | 1,124,925 |
8.00%, 11/15/14(a)(b) | | | | 1,060 | | | 906,300 |
Canadian Pacific Railway Co. | | | | | | | |
5.75%, 5/15/13(a) | | | | 975 | | | 871,943 |
Cascades, Inc. | | | | | | | |
7.25%, 2/15/13(a) | | | | 1,200 | | | 666,000 |
Celestica, Inc. | | | | | | | |
7.875%, 7/01/11(a) | | | | 1,200 | | | 1,080,000 |
Fairfax Financial Holdings Ltd. | | | | | | | |
7.75%, 6/15/17(a) | | | | 1,000 | | | 840,000 |
Inco Ltd. | | | | | | | |
5.70%, 10/15/15(a) | | | | 3,995 | | | 3,163,437 |
Nortel Networks Corp. | | | | | | | |
6.875%, 9/01/23(a) | | | | 1,000 | | | 370,000 |
Nortel Networks Ltd. | | | | | | | |
10.125%, 7/15/13(a) | | | | 537 | | | 287,295 |
Novelis, Inc. | | | | | | | |
7.25%, 2/15/15(a) | | | | 795 | | | 532,650 |
OPTI Canada, Inc. | | | | | | | |
8.25%, 12/15/14(a) | | | | 800 | | | 476,000 |
Quebecor Media, Inc. | | | | | | | |
7.75%, 3/15/16(a) | | | | 1,802 | | | 1,247,885 |
Shaw Communications, Inc. | | | | | | | |
7.20%, 12/15/11(a) | | | | 655 | | | 605,875 |
7.25%, 4/06/11(a) | | | | 1,235 | | | 1,154,725 |
| | |
| ALLIANCEBERNSTEIN HIGH INCOME FUND • | | 13 |
Portfolio of Investments
| | | | | | | |
| | | | | Principal
Amount
(000) | | U.S. $ Value |
| | | | |
| | | | | | | |
Teck Cominco Ltd. | | | | | | | |
6.125%, 10/01/35(a) | | US$ | | 5,000 | | $ | 2,734,215 |
TransCanada Pipelines Ltd. | | | | | | | |
6.35%, 5/15/67(a)(c) | | | | 2,500 | | | 1,735,402 |
| | | | | | | |
| | | | | | | 18,390,652 |
| | | | | | | |
Cayman Islands – 0.1% | | | | | | | |
Seagate Technology HDD Holding | | | | | | | |
6.375%, 10/01/11(a) | | | | 463 | | | 412,070 |
| | | | | | | |
| | | |
El Salvador – 0.1% | | | | | | | |
MMG Fiduc (AES El Salvador) | | | | | | | |
6.75%, 2/01/16(a)(b) | | | | 1,200 | | | 867,008 |
| | | | | | | |
| | | |
France – 0.3% | | | | | | | |
CIE Generale De Geophysique | | | | | | | |
7.50%, 5/15/15(a) | | | | 374 | | | 250,580 |
7.75%, 5/15/17(a) | | | | 69 | | | 46,230 |
Lafarge SA | | | | | | | |
7.125%, 7/15/36(a) | | | | 1,500 | | | 1,075,512 |
Thomson | | | | | | | |
5.75%, 9/25/15(a)(c) | | EUR | | 925 | | | 224,002 |
| | | | | | | |
| | | | | | | 1,596,324 |
| | | | | | | |
Germany – 0.1% | | | | | | | |
Grohe Holding GMBH | | | | | | | |
8.625%, 10/01/14(a)(b) | | | | 750 | | | 554,430 |
| | | | | | | |
| | | |
Hong Kong – 0.4% | | | | | | | |
Chaoda Modern Agriculture Holdings Ltd. | | | | | | | |
7.75%, 2/08/10(a)(b) | | US$ | | 1,523 | | | 913,800 |
Noble Group Ltd. | | | | | | | |
6.625%, 3/17/15(a)(b) | | | | 1,768 | | | 795,600 |
8.50%, 5/30/13(a)(b) | | | | 1,103 | | | 573,560 |
| | | | | | | |
| | | | | | | 2,282,960 |
| | | | | | | |
India – 0.3% | | | | | | | |
Vedanta Resources PLC | | | | | | | |
8.75%, 1/15/14(a)(b) | | | | 3,549 | | | 1,739,010 |
| | | | | | | |
| | | |
Ireland – 0.1% | | | | | | | |
Elan Finance PLC/Elan Finance Corp. | | | | | | | |
7.75%, 11/15/11(a) | | | | 1,058 | | | 703,570 |
| | | | | | | |
| | | |
Italy – 0.1% | | | | | | | |
Lottomatica SpA | | | | | | | |
8.25%, 3/31/66(a)(b)(c) | | EUR | | 675 | | | 490,384 |
| | | | | | | |
| | | |
Jamaica – 0.2% | | | | | | | |
Digicel Ltd.
9.25%, 9/01/12(a)(b) | | US$ | | 1,741 | | | 1,357,980 |
| | | | | | | |
| | |
| 14 | | • ALLIANCEBERNSTEIN HIGH INCOME FUND |
Portfolio of Investments
| | | | | | | |
| | | | | Principal
Amount
(000) | | U.S. $ Value |
| | | | |
| | | | | | | |
Japan – 1.8% | | | | | | | |
Aiful Corp.
6.00%, 12/12/11(a)(b) | | US$ | | 551 | | $ | 333,343 |
Mizuho Financial Group Cayman Ltd.
8.375%, 4/27/09(a) | | | | 5,100 | | | 4,373,199 |
MUFG Capital Finance 1 Ltd.
6.346%, 7/25/16(a)(c) | | | | 2,400 | | | 1,680,000 |
ORIX Corp.
5.48%, 11/22/11(a) | | | | 3,000 | | | 2,646,900 |
Resona Preferred Global Securities
7.191%, 7/30/15(a)(b)(c) | | | | 5,000 | | | 2,400,000 |
| | | | | | | |
| | | | | | | 11,433,442 |
| | | | | | | |
Kazakhstan – 0.4% | | | | | | | |
ALB Finance BV
9.25%, 9/25/13(a)(b) | | | | 1,136 | | | 397,600 |
ATF Bank
9.00%, 5/11/16(a)(b) | | | | 2,564 | | | 1,099,597 |
CenterCredit International BV
8.625%, 1/30/14(a)(b) | | | | 1,134 | | | 408,240 |
Kazkommerts International BV
8.50%, 4/16/13(a)(b) | | | | 1,150 | | | 540,500 |
| | | | | | | |
| | | | | | | 2,445,937 |
| | | | | | | |
Luxembourg – 0.1% | | | | | | | |
Sensata Technologies BV
8.00%, 5/01/14(a) | | | | 700 | | | 385,000 |
| | | | | | | |
| | | |
Netherlands – 0.2% | | | | | | | |
Basell AF SCA
8.375%, 8/15/15(a)(b) | | | | 1,924 | | | 673,400 |
Nielsen Finance LLC/Nielsen Finance Co.
12.50%, 8/01/16(a)(d) | | | | 700 | | | 269,500 |
NXP BV/NXP Funding LLC
7.503%, 10/15/13(a)(e) | | | | 620 | | | 272,800 |
9.50%, 10/15/15(a) | | | | 715 | | | 241,312 |
| | | | | | | |
| | | | | | | 1,457,012 |
| | | | | | | |
Peru – 0.1% | | | | | | | |
IIRSA Norte Finance Ltd.
8.75%, 5/30/24(a)(b) | | | | 910 | | | 701,021 |
| | | | | | | |
| | | |
Russia – 3.8% | | | | | | | |
Alfa Bond Issuance PLC
8.625%, 12/09/15(a) | | | | 900 | | | 506,106 |
Citigroup (JSC Severstal)
9.25%, 4/19/14(a)(b) | | | | 1,570 | | | 679,747 |
Evraz Group SA
8.25%, 11/10/15(a)(b) | | | | 2,534 | | | 1,064,280 |
8.875%, 4/24/13(a)(b) | | | | 843 | | | 362,490 |
Gallery Capital SA
10.125%, 5/15/13(a)(b) | | | | 960 | | | 192,000 |
| | |
| ALLIANCEBERNSTEIN HIGH INCOME FUND • | | 15 |
Portfolio of Investments
| | | | | | | |
| | | | | Principal
Amount
(000) | | U.S. $ Value |
| | | | |
| | | | | | | |
Gaz Capital SA
6.212%, 11/22/16(a)(b) | | US$ | | 7,124 | | $ | 4,394,380 |
6.51%, 3/07/22(a)(b) | | | | 9,473 | | | 5,206,620 |
Mobile Telesystems Finance SA
8.00%, 1/28/12(a)(b) | | | | 1,155 | | | 739,200 |
Red Arrow Intl Leasing PLC
8.375%, 6/30/12(a) | | RUB | | 40,282 | | | 1,376,413 |
RS Finance (RSB)
7.50%, 10/07/10(a)(b) | | US$ | | 2,587 | | | 905,450 |
Steel Capital SA for OAO Severstal
9.75%, 7/29/13(a)(b) | | | | 4,528 | | | 1,901,760 |
TNK-BP Finance SA
7.50%, 7/18/16(a)(b) | | | | 2,308 | | | 1,004,960 |
TransCapitalInvest Ltd. for OJSC AK Transneft
7.70%, 8/07/13(a)(b) | | | | 3,477 | | | 2,294,820 |
Vip Finance
8.375%, 4/30/13(a)(b) | | | | 2,545 | | | 1,527,000 |
VTB Capital SA
6.609%, 10/31/12(a)(b) | | | | 2,055 | | | 1,191,900 |
6.875%, 5/29/18(a)(b) | | | | 1,333 | | | 746,480 |
| | | | | | | |
| | | | | | | 24,093,606 |
| | | | | | | |
Singapore – 0.3% | | | | | | | |
Avago Technologies Finance
10.125%, 12/01/13(a) | | | | 963 | | | 808,920 |
Flextronics International Ltd.
6.50%, 5/15/13(a) | | | | 1,124 | | | 876,720 |
| | | | | | | |
| | | | | | | 1,685,640 |
| | | | | | | |
South Africa – 0.0% | | | | | | | |
Foodcorp Ltd.
8.875%, 6/15/12(a)(b) | | EUR | | 456 | | | 308,034 |
| | | | | | | |
| | | |
Switzerland – 0.3% | | | | | | | |
ZFS Finance USA Trust I
6.15%, 12/15/65(a)(b)(c) | | US$ | | 3,000 | | | 2,008,644 |
| | | | | | | |
| | | |
United Kingdom – 0.5% | | | | | | | |
BSKYB Finance UK PLC
6.50%, 10/15/35(a)(b) | | | | 2,000 | | | 1,502,992 |
Ineos Group Holdings PLC
8.50%, 2/15/16(a)(b) | | | | 2,105 | | | 778,850 |
Inmarsat Finance PLC
10.375%, 11/15/12(a)(d) | | | | 1,165 | | | 926,175 |
| | | | | | | |
| | | | | | | 3,208,017 |
| | | | | | | |
United States – 45.5% | | | | | | | |
ACCO Brands Corp.
7.625%, 8/15/15(a) | | | | 1,070 | | | 615,250 |
| | |
| 16 | | • ALLIANCEBERNSTEIN HIGH INCOME FUND |
Portfolio of Investments
| | | | | | | |
| | | | | Principal
Amount
(000) | | U.S. $ Value |
| | | | |
| | | | | | | |
The AES Corp.
7.75%, 3/01/14(a) | | US$ | | 2,196 | | $ | 1,778,760 |
8.00%, 10/15/17(a) | | | | 360 | | | 277,200 |
AFC Capital Trust I
Series B
8.207%, 2/03/27(a) | | | | 5,000 | | | 3,300,000 |
Affinia Group, Inc.
9.00%, 11/30/14(a) | | | | 850 | | | 510,000 |
AK Steel Corp.
7.75%, 6/15/12(a) | | | | 1,050 | | | 840,000 |
Alion Science and Technology Corp.
10.25%, 2/01/15(a) | | | | 1,313 | | | 722,150 |
Allbritton Communications Co.
7.75%, 12/15/12(a) | | | | 1,230 | | | 836,400 |
Allegheny Energy Supply Co. LLC
7.80%, 3/15/11(a) | | | | 723 | | | 661,545 |
8.25%, 4/15/12(a)(b) | | | | 925 | | | 846,375 |
Allied Waste North America, Inc.
6.375%, 4/15/11(a) | | | | 962 | | | 885,040 |
Series B
7.125%, 5/15/16(a) | | | | 362 | | | 318,560 |
7.375%, 4/15/14(a) | | | | 1,090 | | | 970,100 |
Alltel Corp.
7.875%, 7/01/32(a) | | | | 1,530 | | | 1,384,650 |
AMC Entertainment, Inc.
11.00%, 2/01/16(a) | | | | 910 | | | 718,900 |
American Media Operations, Inc.
8.875%, 1/15/11 | | | | 1,000 | | | 475,000 |
Amkor Technology, Inc.
9.25%, 6/01/16(a) | | | | 1,910 | | | 1,136,450 |
AMR Corp.
9.00%, 8/01/12 | | | | 906 | | | 561,720 |
Aquila, Inc.
11.875%, 7/01/12(a) | | | | 1,000 | | | 980,000 |
Aramark Corp.
8.50%, 2/01/15(a) | | | | 1,592 | | | 1,361,160 |
ArcelorMittal
6.50%, 4/15/14(a) | | | | 1,565 | | | 1,380,565 |
Arch Western Finance LLC
6.75%, 7/01/13(a) | | | | 643 | | | 540,120 |
Asbury Automotive Group, Inc.
8.00%, 3/15/14(a) | | | | 830 | | | 415,000 |
Associated Materials, Inc.
11.25%, 3/01/14(a)(d) | | | | 1,526 | | | 824,040 |
Avis Budget Car Rental
7.75%, 5/15/16(a) | | | | 1,838 | | | 670,870 |
Bausch & Lomb, Inc.
9.875%, 11/01/15(a)(b) | | | | 825 | | | 649,688 |
| | |
| ALLIANCEBERNSTEIN HIGH INCOME FUND • | | 17 |
Portfolio of Investments
| | | | | | | |
| | | | | Principal
Amount
(000) | | U.S. $ Value |
| | | | |
| | | | | | | |
Bear Stearns Co., Inc.
5.35%, 2/01/12(a) | | US$ | | 1,000 | | $ | 955,964 |
Beazer Homes USA, Inc.
6.875%, 7/15/15(a) | | | | 1,000 | | | 385,000 |
Berry Plastics Holding Corp.
8.875%, 9/15/14(a) | | | | 877 | | | 456,040 |
10.25%, 3/01/16(a) | | | | 672 | | | 322,560 |
Biomet, Inc.
11.625%, 10/15/17 | | | | 1,400 | | | 1,218,000 |
The Bon-Ton Dept Stores, Inc.
10.25%, 3/15/14(a) | | | | 1,600 | | | 256,000 |
Boston Scientific Corp.
6.00%, 6/15/11(a) | | | | 3,000 | | | 2,685,000 |
Bowater Canada Finance Corp.
7.95%, 11/15/11(a) | | | | 1,535 | | | 475,850 |
Boyd Gaming Corp.
7.75%, 12/15/12(a) | | | | 1,200 | | | 984,000 |
Broder Brothers Co.
Series B
11.25%, 10/15/10(a) | | | | 599 | | | 221,630 |
Burlington Coat Factory Warehouse Corp.
11.125%, 4/15/14(a) | | | | 896 | | | 349,440 |
CA, Inc.
4.75%, 12/01/09(a) | | | | 551 | | | 517,940 |
Cablevision Systems Corp.
Series B
8.00%, 4/15/12(a) | | | | 1,000 | | | 841,250 |
Capital One Financial Corp.
5.50%, 6/01/15(a) | | | | 3,700 | | | 3,082,629 |
Caraustar Industries, Inc.
7.375%, 6/01/09(a) | | | | 750 | | | 435,000 |
Case Corp.
7.25%, 1/15/16(a) | | | | 997 | | | 732,795 |
Case New Holland, Inc.
7.125%, 3/01/14(a) | | | | 1,324 | | | 986,380 |
Catalent Pharma Solutions, Inc.
9.50%, 4/15/15(a) | | | | 645 | | | 374,100 |
CCH I Holdings LLC
11.75%, 5/15/14(a)(f) | | | | 4,338 | | | 1,258,020 |
CCH I LLC
11.00%, 10/01/15 | | | | 570 | | | 256,500 |
Centennial Communications Corp.
10.00%, 1/01/13(a) | | | | 855 | | | 756,675 |
Chaparral Energy, Inc. | | | | | | | |
8.875%, 2/01/17(a) | | | | 1,000 | | | 510,000 |
Chesapeake Energy Corp.
6.50%, 8/15/17(a) | | | | 575 | | | 423,344 |
7.50%, 9/15/13(a) | | | | 404 | | | 339,360 |
| | |
| 18 | | • ALLIANCEBERNSTEIN HIGH INCOME FUND |
Portfolio of Investments
| | | | | | | |
| | | | | Principal
Amount
(000) | | U.S. $ Value |
| | | | |
| | | | | | | |
Chukchansi Economic Development Authority
8.00%, 11/15/13(a)(b) | | US$ | | 500 | | $ | 265,000 |
Cincinnati Bell, Inc.
8.375%, 1/15/14(a) | | | | 1,450 | | | 1,047,625 |
CIT Group Funding Co. of Canada
5.20%, 6/01/15(a) | | | | 3,600 | | | 1,885,248 |
CIT Group, Inc.
Series MTN
5.125%, 9/30/14(a) | | | | 4,200 | | | 2,109,127 |
Clear Channel Communications, Inc. | | | | | | | |
5.50%, 9/15/14(a) | | | | 1,205 | | | 271,125 |
5.75%, 1/15/13(a) | | | | 3,288 | | | 690,480 |
Comcast Cable Communications Holdings, Inc. | | | | | | | |
9.455%, 11/15/22(a) | | | | 2,500 | | | 2,402,425 |
Community Health Systems, Inc. | | | | | | | |
8.875%, 7/15/15(a) | | | | 1,500 | | | 1,256,250 |
Complete Production Services, Inc. | | | | | | | |
8.00%, 12/15/16(a) | | | | 1,000 | | | 680,000 |
Continental Airlines, Inc. | | | | | | | |
8.75%, 12/01/11(a) | | | | 703 | | | 463,980 |
Series RJO3 | | | | | | | |
7.875%, 7/02/18(a) | | | | 199 | | | 115,346 |
Cooper-Standard Automotive, Inc. | | | | | | | |
7.00%, 12/15/12(a) | | | | 845 | | | 532,350 |
Couche-Tard, Inc. | | | | | | | |
7.50%, 12/15/13(a) | | | | 1,242 | | | 956,340 |
Countrywide Financial Corp. | | | | | | | |
6.25%, 5/15/16(a) | | | | 1,005 | | | 888,239 |
Series MTN | | | | | | | |
5.80%, 6/07/12(a) | | | | 696 | | | 647,257 |
Countrywide Home Loans, Inc. | | | | | | | |
Series MTNL | | | | | | | |
4.00%, 3/22/11(a) | | | | 76 | | | 70,088 |
Coventry Health Care, Inc. | | | | | | | |
5.875%, 1/15/12(a) | | | | 664 | | | 537,588 |
5.95%, 3/15/17(a) | | | | 1,415 | | | 912,938 |
Cricket Communications, Inc. | | | | | | | |
9.375%, 11/01/14(a) | | | | 1,357 | | | 1,102,562 |
Crown Americas | | | | | | | |
7.625%, 11/15/13(a) | | | | 1,042 | | | 916,960 |
Crum & Forster Holdings Corp. | | | | | | | |
7.75%, 5/01/17(a) | | | | 457 | | | 317,615 |
CSC Holdings, Inc. | | | | | | | |
6.75%, 4/15/12(a) | | | | 1,482 | | | 1,281,930 |
7.875%, 2/15/18(a) | | | | 212 | | | 154,230 |
DaVita, Inc. | | | | | | | |
7.25%, 3/15/15(a) | | | | 815 | | | 696,825 |
| | |
| ALLIANCEBERNSTEIN HIGH INCOME FUND • | | 19 |
Portfolio of Investments
| | | | | | | |
| | | | | Principal
Amount
(000) | | U.S. $ Value |
| | | | |
| | | | | | | |
Dean Foods Co. | | | | | | | |
7.00%, 6/01/16(a) | | US$ | | 1,000 | | $ | 760,000 |
Del Monte Corp. | | | | | | | |
6.75%, 2/15/15(a) | | | | 750 | | | 618,750 |
Dex Media, Inc. | | | | | | | |
9.00%, 11/15/13(a)(d) | | | | 1,250 | | | 281,250 |
Dex Media West LLC | | | | | | | |
Series B | | | | | | | |
8.50%, 8/15/10(a) | | | | 326 | | | 249,390 |
DirecTV Holdings LLC | | | | | | | |
6.375%, 6/15/15(a) | | | | 5,155 | | | 4,278,650 |
Dole Food Co., Inc. | | | | | | | |
8.875%, 3/15/11(a) | | | | 769 | | | 530,610 |
Dollar General Corp. | | | | | | | |
10.625%, 7/15/15(a) | | | | 910 | | | 837,200 |
Dominion Resources, Inc. | | | | | | | |
7.50%, 6/30/66(a)(c) | | | | 4,100 | | | 2,255,000 |
Domtar Corp. | | | | | | | |
5.375%, 12/01/13(a) | | | | 500 | | | 367,500 |
DR Horton, Inc. | | | | | | | |
6.00%, 4/15/11(a) | | | | 1,756 | | | 1,352,120 |
Dresdner Funding Trust I | | | | | | | |
8.151%, 6/30/31(a)(b) | | | | 2,000 | | | 957,168 |
Duane Reade, Inc. | | | | | | | |
9.75%, 8/01/11(a) | | | | 780 | | | 468,000 |
Duke Capital LLC | | | | | | | |
8.00%, 10/01/19(a) | | | | 2,000 | | | 1,803,710 |
Dynegy Holdings, Inc. | | | | | | | |
8.375%, 5/01/16(a) | | | | 3,141 | | | 2,324,340 |
Dynegy Roseton/Danskammer Pass Through Trust | | | | | | | |
Series B | | | | | | | |
7.67%, 11/08/16(a) | | | | 1,129 | | | 847,879 |
E*Trade Financial Corp. | | | | | | | |
7.375%, 9/15/13 | | | | 375 | | | 240,000 |
Edison Mission Energy | | | | | | | |
7.00%, 5/15/17(a) | | | | 3,648 | | | 2,886,480 |
7.50%, 6/15/13(a) | | | | 1,062 | | | 894,735 |
7.75%, 6/15/16(a) | | | | 447 | | | 358,717 |
Education Management LLC | | | | | | | |
10.25%, 6/01/16(a) | | | | 950 | | | 655,500 |
El Paso Corp.
7.375%, 12/15/12(a) | | | | 394 | | | 338,764 |
Embarq Corp.
6.738%, 6/01/13(a) | | | | 2,500 | | | 2,175,000 |
Energy Future Holdings Corp.
10.875%, 11/01/17(a)(b) | | | | 490 | | | 377,300 |
Energy Transfer Partners LP
5.95%, 2/01/15(a) | | | | 1,500 | | | 1,251,184 |
| | |
| 20 | | • ALLIANCEBERNSTEIN HIGH INCOME FUND |
Portfolio of Investments
| | | | | | | |
| | | | | Principal
Amount
(000) | | U.S. $ Value |
| | | | |
| | | | | | | |
Energy XXI Gulf Coast, Inc.
10.00%, 6/15/13(a) | | US$ | | 530 | | $ | 303,425 |
Enterprise Products Operating LP
8.375%, 8/01/66(a)(c) | | | | 1,230 | | | 913,275 |
Series B
6.65%, 10/15/34(a) | | | | 1,500 | | | 1,037,343 |
Expedia, Inc.
8.50%, 7/01/16(b) | | | | 750 | | | 555,000 |
Fairpoint Communications, Inc.
13.125%, 4/01/18(b) | | | | 705 | | | 497,025 |
Farmers Insurance Exchange
8.625%, 5/01/24(a)(b) | | | | 3,000 | | | 2,319,507 |
First Data Corp.
9.875%, 9/24/15 | | | | 1,341 | | | 858,240 |
Fisher Scientific International, Inc.
6.125%, 7/01/15(a) | | | | 2,000 | | | 1,780,000 |
Ford Motor Co.
7.45%, 7/16/31(a) | | | | 2,265 | | | 713,475 |
Ford Motor Credit Co.
7.00%, 10/01/13(a) | | | | 974 | | | 539,552 |
7.569%, 1/13/12(a)(e) | | | | 640 | | | 387,280 |
8.00%, 12/15/16(a) | | | | 1,400 | | | 766,741 |
Forest Oil Corp.
7.25%, 6/15/19(a) | | | | 540 | | | 367,200 |
Freeport-McMoRan Copper & Gold, Inc.
8.375%, 4/01/17(a) | | | | 1,466 | | | 1,150,810 |
Freescale Semiconductor, Inc.
8.875%, 12/15/14(a) | | | | 1,480 | | | 658,600 |
10.125%, 12/15/16(a) | | | | 1,429 | | | 560,882 |
Frontier Communications Corp.
6.25%, 1/15/13(a) | | | | 1,222 | | | 1,011,205 |
Gaylord Entertainment Co.
8.00%, 11/15/13(a) | | | | 1,000 | | | 682,500 |
General Motors Acceptance Corp.
6.75%, 12/01/14(a) | | | | 962 | | | 485,805 |
6.875%, 9/15/11(a) | | | | 1,722 | | | 1,008,488 |
8.00%, 11/01/31(a) | | | | 659 | | | 298,785 |
General Motors Corp.
8.25%, 7/15/23(a) | | | | 1,993 | | | 637,760 |
8.375%, 7/15/33(a) | | | | 1,503 | | | 488,475 |
Georgia Gulf Corp.
10.75%, 10/15/16(a) | | | | 1,500 | | | 390,000 |
Georgia-Pacific Corp.
7.00%, 1/15/15(a)(b) | | | | 433 | | | 318,255 |
7.125%, 1/15/17(a)(b) | | | | 517 | | | 359,315 |
8.875%, 5/15/31(a) | | | | 300 | | | 193,500 |
The Goodyear Tire & Rubber Co.
8.625%, 12/01/11(a) | | | | 175 | | | 147,875 |
9.00%, 7/01/15(a) | | | | 502 | | | 399,090 |
| | |
| ALLIANCEBERNSTEIN HIGH INCOME FUND • | | 21 |
Portfolio of Investments
| | | | | | | |
| | | | | Principal
Amount
(000) | | U.S. $ Value |
| | | | |
| | | | | | | |
Graphic Packaging International Corp.
9.50%, 8/15/13(a) | | US$ | | 1,200 | | $ | 822,000 |
Greektown Holdings LLC
10.75%, 12/01/13(b)(g) | | | | 1,159 | | | 249,185 |
GSC Holdings Corp.
8.00%, 10/01/12(a) | | | | 2,784 | | | 2,582,160 |
Hanger Orthopedic Group, Inc.
10.25%, 6/01/14(a) | | | | 413 | | | 375,830 |
Harrah’s Operating Co., Inc.
5.375%, 12/15/13(a) | | | | 5,000 | | | 862,500 |
5.625%, 6/01/15(a) | | | | 1,935 | | | 309,600 |
5.75%, 10/01/17(a) | | | | 108 | | | 16,740 |
6.50%, 6/01/16(a) | | | | 1,177 | | | 185,377 |
HCA, Inc.
6.375%, 1/15/15(a) | | | | 1,267 | | | 753,865 |
6.50%, 2/15/16(a) | | | | 782 | | | 459,425 |
6.75%, 7/15/13(a) | | | | 816 | | | 522,240 |
9.625%, 11/15/16(a)(h) | | | | 1,007 | | | 810,635 |
Healthsouth Corp.
10.75%, 6/15/16(a) | | | | 1,400 | | | 1,267,000 |
Helix Energy Solutions Group, Inc.
9.50%, 1/15/16(a)(b) | | | | 500 | | | 320,000 |
Hertz Corp.
8.875%, 1/01/14(a) | | | | 947 | | | 691,310 |
Hexion US Finance Corp./Hexion Nova Scotia Finance ULC
7.304%, 11/15/14(a)(e) | | | | 815 | | | 537,900 |
9.75%, 11/15/14(a) | | | | 315 | | | 200,025 |
Hilcorp Energy I LP/Hilcorp Finance Co.
7.75%, 11/01/15(a)(b) | | | | 1,076 | | | 763,960 |
Hines Nurseries, Inc.
10.25%, 10/01/11(g) | | | | 1,000 | | | 562,500 |
Host Hotels & Resorts LP
6.875%, 11/01/14(a) | | | | 481 | | | 358,345 |
Series Q
6.75%, 6/01/16(a) | | | | 1,558 | | | 1,129,550 |
Hughes Network Systems LLC/HNS Finance Corp. | | | | | | | |
9.50%, 4/15/14(a) | | | | 950 | | | 807,500 |
Huntsman International LLC | | | | | | | |
7.875%, 11/15/14 | | | | 450 | | | 400,500 |
IASIS Healthcare Corp. | | | | | | | |
8.75%, 6/15/14(a) | | | | 1,341 | | | 1,059,390 |
Idearc, Inc. | | | | | | | |
8.00%, 11/15/16(a) | | | | 2,795 | | | 387,806 |
ILFC E-Capital Trust II | | | | | | | |
6.25%, 12/21/15(a)(b)(c) | | | | 1,500 | | | 485,578 |
| | |
| 22 | | • ALLIANCEBERNSTEIN HIGH INCOME FUND |
Portfolio of Investments
| | | | | | | |
| | | | | Principal
Amount
(000) | | U.S. $ Value |
| | | | |
| | | | | | | |
Indiantown Cogeneration LP | | | | | | | |
Series A-9 | | | | | | | |
9.26%, 12/15/10(a) | | US$ | | 3,997 | | $ | 4,096,391 |
Invacare Corp. | | | | | | | |
9.75%, 2/15/15(a) | | | | 750 | | | 675,000 |
iPayment, Inc. | | | | | | | |
9.75%, 5/15/14(a) | | | | 500 | | | 375,000 |
Iron Mountain, Inc. | | | | | | | |
6.625%, 1/01/16(a) | | | | 1,163 | | | 930,400 |
JC Penney Corp., Inc. | | | | | | | |
7.40%, 4/01/37(a) | | | | 4,100 | | | 2,796,237 |
Jefferson Smurfit Corp. US | | | | | | | |
8.25%, 10/01/12(a) | | | | 1,100 | | | 561,000 |
JPMorgan Chase | | | | | | | |
7.00%, 6/28/17(b) | | RUB | | 14,000 | | | 186,128 |
Kansas Gas & Electric | | | | | | | |
5.647%, 3/29/21 | | US$ | | 2,808 | | | 2,325,250 |
KB Home | | | | | | | |
5.875%, 1/15/15(a) | | | | 295 | | | 193,225 |
Key Energy Services, Inc. | | | | | | | |
8.375%, 12/01/14 | | | | 750 | | | 555,000 |
Keystone Automotive Operations, Inc. | | | | | | | |
9.75%, 11/01/13(a) | | | | 986 | | | 443,700 |
Kinder Morgan Finance Co. | | | | | | | |
5.70%, 1/05/16(a) | | | | 745 | | | 579,237 |
The Kroger Co. | | | | | | | |
7.50%, 4/01/31 | | | | 1,000 | | | 855,547 |
L-3 Communications Corp. | | | | | | | |
5.875%, 1/15/15(a) | | | | 656 | | | 537,920 |
Lamar Media Corp. | | | | | | | |
6.625%, 8/15/15(a) | | | | 1,291 | | | 948,885 |
Lear Corp. | | | | | | | |
Series B | | | | | | | |
5.75%, 8/01/14(a) | | | | 1,354 | | | 541,600 |
8.50%, 12/01/13(a) | | | | 221 | | | 83,980 |
8.75%, 12/01/16(a) | | | | 1,098 | | | 406,260 |
Lehman Brothers Holdings, Inc. | | | | | | | |
Series MTN | | | | | | | |
6.875%, 5/02/18(g) | | | | 1,600 | | | 208,000 |
Series MTNG | | | | | | | |
4.80%, 3/13/14(g) | | | | 1,800 | | | 234,000 |
Level 3 Financing, Inc. | | | | | | | |
8.75%, 2/15/17(a) | | | | 1,500 | | | 720,000 |
9.25%, 11/01/14(a) | | | | 628 | | | 357,960 |
Levi Strauss & Co. | | | | | | | |
8.875%, 4/01/16(a) | | | | 1,200 | | | 786,000 |
Liberty Media Corp. | | | | | | | |
5.70%, 5/15/13(a) | | | | 895 | | | 622,407 |
8.25%, 2/01/30 | | | | 310 | | | 170,319 |
| | |
| ALLIANCEBERNSTEIN HIGH INCOME FUND • | | 23 |
Portfolio of Investments
| | | | | | | |
| | | | | Principal
Amount
(000) | | U.S. $ Value |
| | | | |
| | | | | | | |
Liberty Mutual Group, Inc. | | | | | | | |
7.80%, 3/15/37(a)(b) | | US$ | | 3,104 | | $ | 1,530,800 |
Limited Brands, Inc. | | | | | | | |
5.25%, 11/01/14(a) | | | | 3,194 | | | 2,009,272 |
6.90%, 7/15/17(a) | | | | 3,710 | | | 2,273,874 |
LIN Television Corp. | | | | | | | |
6.50%, 5/15/13(a) | | | | 1,100 | | | 616,000 |
Lucent Technologies, Inc. | | | | | | | |
6.50%, 1/15/28(a) | | | | 1,650 | | | 808,500 |
M/I Homes, Inc. | | | | | | | |
6.875%, 4/01/12(a) | | | | 1,500 | | | 900,000 |
MacDermid, Inc. | | | | | | | |
9.50%, 4/15/17(a)(b) | | | | 715 | | | 378,950 |
Macys Retail Holdings, Inc. | | | | | | | |
6.625%, 4/01/11(a) | | | | 1,500 | | | 1,268,365 |
MagnaChip Semiconductor SA | | | | | | | |
8.00%, 12/15/14(a) | | | | 200 | | | 9,000 |
Masco Corp. | | | | | | | |
6.125%, 10/03/16(a) | | | | 2,315 | | | 1,638,413 |
Merisant Co. | | | | | | | |
9.50%, 7/15/13(a) | | | | 1,000 | | | 380,000 |
Meritage Homes Corp. | | | | | | | |
6.25%, 3/15/15(a) | | | | 750 | | | 384,375 |
MetroPCS Wireless, Inc. | | | | | | | |
9.25%, 11/01/14(a) | | | | 905 | | | 753,413 |
MGM Mirage | | | | | | | |
6.625%, 7/15/15 | | | | 1,537 | | | 899,145 |
6.75%, 9/01/12 | | | | 2,000 | | | 1,280,000 |
7.625%, 1/15/17(a) | | | | 315 | | | 187,425 |
8.375%, 2/01/11(a) | | | | 1,241 | | | 719,780 |
Michaels Stores, Inc. | | | | | | | |
10.00%, 11/01/14(a) | | | | 1,000 | | | 450,000 |
11.375%, 11/01/16(a) | | | | 500 | | | 172,500 |
Mirant Americas Generation LLC
8.50%, 10/01/21(a) | | | | 1,710 | | | 1,197,000 |
Mobile Satellite Ventures LP
14.00%, 4/01/13(a)(b)(d) | | | | 1,000 | | | 280,000 |
Mohegan Tribal Gaming Auth
7.125%, 8/15/14(a) | | | | 1,769 | | | 1,061,400 |
Momentive Performance Materials, Inc.
10.125%, 12/01/14(a)(h) | | | | 750 | | | 360,000 |
11.50%, 12/01/16(a) | | | | 750 | | | 322,500 |
Morgan Stanley
10.09%, 5/03/17(b) | | BRL | | 5,230 | | | 1,363,928 |
The Mosaic Co.
7.625%, 12/01/16(b)(f) | | US$ | | 1,433 | | | 1,251,397 |
Motorola, Inc.
6.50%, 9/01/25(a) | | | | 2,035 | | | 1,233,475 |
7.50%, 5/15/25(a) | | | | 325 | | | 253,285 |
| | |
| 24 | | • ALLIANCEBERNSTEIN HIGH INCOME FUND |
Portfolio of Investments
| | | | | | | |
| | | | | Principal
Amount
(000) | | U.S. $ Value |
| | | | |
| | | | | | | |
Multiplan, Inc.
10.375%, 4/15/16(a)(b) | | US$ | | 500 | | $ | 460,000 |
Neenah Foundary Co.
9.50%, 1/01/17(a) | | | | 700 | | | 416,500 |
Neiman-Marcus Group, Inc.
9.00%, 10/15/15(a)(h) | | | | 700 | | | 479,500 |
10.375%, 10/15/15(a) | | | | 500 | | | 332,500 |
New Albertsons, Inc.
7.45%, 8/01/29(a) | | | | 1,989 | | | 1,391,190 |
Newfield Exploration Co.
6.625%, 9/01/14 | | | | 475 | | | 366,938 |
NewMarket Corp.
7.125%, 12/15/16(a) | | | | 700 | | | 574,000 |
NewPage Corp.
10.00%, 5/01/12(a) | | | | 920 | | | 625,600 |
News America Holdings, Inc.
7.75%, 12/01/45(a) | | | | 1,800 | | | 1,502,570 |
News America, Inc.
6.40%, 12/15/35(a) | | | | 2,000 | | | 1,513,868 |
Nextel Communications, Inc.
Series D
7.375%, 8/01/15(a) | | | | 3,000 | | | 1,650,000 |
Series E
6.875%, 10/31/13(a) | | | | 5,000 | | | 2,850,000 |
North Front Pass Through Trust
5.81%, 12/15/24(a)(b)(c) | | | | 5,000 | | | 2,237,970 |
NRG Energy, Inc.
7.25%, 2/01/14(a) | | | | 245 | | | 214,375 |
7.375%, 2/01/16-1/15/17(a) | | | | 2,355 | | | 2,034,875 |
Oncor Electric Delivery Co.
7.00%, 5/01/32(a) | | | | 3,200 | | | 2,392,218 |
OSI Restaurant Partners, Inc.
10.00%, 6/15/15 | | | | 750 | | | 176,250 |
Owens Brockway Glass Container, Inc.
6.75%, 12/01/14(a) | | | | 830 | | | 717,950 |
Owens Corning, Inc.
6.50%, 12/01/16(a) | | | | 355 | | | 264,266 |
7.00%, 12/01/36(a) | | | | 4,450 | | | 2,818,350 |
Peabody Energy Corp.
Series B
6.875%, 3/15/13(a) | | | | 910 | | | 798,525 |
PetroHawk Energy Corp.
9.125%, 7/15/13(a) | | | | 944 | | | 726,880 |
Pinnacle Entertainment, Inc.
7.50%, 6/15/15 | | | | 750 | | | 468,750 |
Pinnacle Foods Finance LLC
10.625%, 4/01/17(a) | | | | 750 | | | 465,000 |
Plains Exploration & Production Co.
7.75%, 6/15/15(a) | | | | 1,000 | | | 730,000 |
| | |
| ALLIANCEBERNSTEIN HIGH INCOME FUND • | | 25 |
Portfolio of Investments
| | | | | | | |
| | | | | Principal
Amount
(000) | | U.S. $ Value |
| | | | |
| | | | | | | |
Plastipak Holdings, Inc.
8.50%, 12/15/15(a)(b) | | US$ | | 1,300 | | $ | 929,500 |
Quality Distribution LLC
9.00%, 11/15/10(a) | | | | 1,429 | | | 457,280 |
Quiksilver, Inc.
6.875%, 4/15/15(a) | | | | 1,150 | | | 552,000 |
Qwest Capital Funding, Inc.
7.25%, 2/15/11(a) | | | | 1,542 | | | 1,179,630 |
Qwest Corp.
7.625%, 6/15/15(a) | | | | 1,590 | | | 1,216,350 |
Rainbow National Services LLC
10.375%, 9/01/14(a)(b) | | | | 1,158 | | | 1,007,460 |
Range Resources Corp.
7.50%, 5/15/16(a) | | | | 500 | | | 407,500 |
RBS Global, Inc. and Rexnord Corp.
9.50%, 8/01/14(a) | | | | 1,092 | | | 753,480 |
11.75%, 8/01/16(a) | | | | 324 | | | 212,220 |
The Reader’s Digest Association, Inc.
9.00%, 2/15/17 | | | | 750 | | | 225,000 |
Realogy Corp.
10.50%, 4/15/14(a) | | | | 1,232 | | | 394,240 |
12.375%, 4/15/15(a) | | | | 500 | | | 98,750 |
Regency Energy Partners
8.375%, 12/15/13(a) | | | | 590 | | | 448,400 |
Reliant Energy, Inc.
7.625%, 6/15/14(a) | | | | 1,041 | | | 801,570 |
7.875%, 6/15/17(a) | | | | 1,293 | | | 989,145 |
Residential Capital LLC
9.625%, 5/15/15(b) | | | | 3,132 | | | 783,000 |
Reynolds American, Inc. | | | | | | | |
7.625%, 6/01/16(a) | | | | 1,376 | | | 1,128,835 |
RH Donnelley Corp. | | | | | | | |
8.875%, 10/15/17 | | | | 1,210 | | | 260,150 |
Series A-2 | | | | | | | |
6.875%, 1/15/13(a) | | | | 1,420 | | | 326,600 |
Series A-3 | | | | | | | |
8.875%, 1/15/16 | | | | 1,000 | | | 210,000 |
Rite Aid Corp. | | | | | | | |
6.875%, 8/15/13(a) | | | | 470 | | | 150,400 |
Royal Caribbean Cruises Ltd. | | | | | | | |
8.75%, 2/02/11(a) | | | | 727 | | | 625,220 |
RR Donnelley & Sons Co. | | | | | | | |
4.95%, 4/01/14(a) | | | | 2,400 | | | 1,815,374 |
Russell-Stanley Holdings, Inc. | | | | | | | |
9.00%, 11/30/08(g)(i)(j) | | | | 623 | | | 78,055 |
Safeway, Inc. | | | | | | | |
7.25%, 2/01/31(a) | | | | 2,000 | | | 1,647,568 |
Sally Holdings LLC | | | | | | | |
9.25%, 11/15/14(a) | | | | 700 | | | 560,000 |
| | |
| 26 | | • ALLIANCEBERNSTEIN HIGH INCOME FUND |
Portfolio of Investments
| | | | | | | |
| | | | | Principal
Amount
(000) | | U.S. $ Value |
| | | | |
| | | | | | | |
Sanmina Corp. | | | | | | | |
8.125%, 3/01/16(a) | | US$ | | 1,450 | | $ | 913,500 |
Sara Lee Corp. | | | | | | | |
6.125%, 11/01/32(a) | | | | 1,600 | | | 1,232,198 |
Sbarro, Inc. | | | | | | | |
10.375%, 2/01/15(a) | | | | 1,250 | | | 725,000 |
Select Medical Corp. | | | | | | | |
7.625%, 2/01/15(a) | | | | 1,283 | | | 801,875 |
Sensus Metering Systems, Inc. | | | | | | | |
8.625%, 12/15/13(a) | | | | 771 | | | 632,220 |
Sequa Corp. | | | | | | | |
11.75%, 12/01/15(b) | | | | 545 | | | 337,900 |
Serena Software, Inc. | | | | | | | |
10.375%, 3/15/16(a) | | | | 419 | | | 259,780 |
Service Corp. International | | | | | | | |
6.75%, 4/01/16(a) | | | | 700 | | | 535,500 |
Simmons Co. | | | | | | | |
10.00%, 12/15/14(a)(d) | | | | 800 | | | 224,000 |
Sirius Satellite Radio, Inc. | | | | | | | |
9.625%, 8/01/13(a) | | | | 1,249 | | | 387,190 |
Six Flags Operations, Inc. | | | | | | | |
12.25%, 7/15/16(b) | | | | 379 | | | 200,870 |
Six Flags, Inc. | | | | | | | |
9.625%, 6/01/14 | | | | 918 | | | 266,220 |
SLM Corp. | | | | | | | |
Series MTN | | | | | | | |
5.125%, 8/27/12(a) | | | | 399 | | | 266,476 |
Series MTNA | | | | | | | |
4.50%, 7/26/10(a) | | | | 399 | | | 312,274 |
5.00%, 10/01/13(a) | | | | 4,100 | | | 2,490,713 |
5.375%, 5/15/14(a) | | | | 3,800 | | | 2,330,635 |
Smurfit-Stone Container Enterprises, Inc. | | | | | | | |
8.00%, 3/15/17(a) | | | | 1,000 | | | 490,000 |
Source Gas LLC | | | | | | | |
5.90%, 4/01/17(a)(b) | | | | 3,000 | | | 2,237,898 |
Southern Union Co. | | | | | | | |
7.60%, 2/01/24(a) | | | | 3,200 | | | 2,223,280 |
Sprint Capital Corp. | | | | | | | |
6.875%, 11/15/28(a) | | | | 3,000 | | | 1,755,000 |
Standard Pacific Corp. | | | | | | | |
6.50%, 8/15/10(a) | | | | 750 | | | 573,750 |
Starwood Hotels & Resorts Worldwide, Inc. | | | | | | | |
7.375%, 11/15/15 | | | | 2,035 | | | 1,580,772 |
7.875%, 5/01/12 | | | | 2,500 | | | 2,180,995 |
Stater Brothers Holdings | | | | | | | |
8.125%, 6/15/12(a) | | | | 1,331 | | | 1,184,590 |
Station Casinos, Inc. | | | | | | | |
6.625%, 3/15/18(a) | | | | 1,755 | | | 157,950 |
6.875%, 3/01/16(a) | | | | 1,500 | | | 135,000 |
| | |
| ALLIANCEBERNSTEIN HIGH INCOME FUND • | | 27 |
Portfolio of Investments
| | | | | | | |
| | | | | Principal
Amount
(000) | | U.S. $ Value |
| | | | |
| | | | | | | |
Sun Healthcare Group, Inc. | | | | | | | |
9.125%, 4/15/15(a) | | US$ | | 700 | | $ | 591,500 |
Sungard Data Systems, Inc. | | | | | | | |
9.125%, 8/15/13(a) | | | | 853 | | | 707,990 |
10.25%, 8/15/15(a) | | | | 200 | | | 140,000 |
Teco Finance, Inc. | | | | | | | |
6.572%, 11/01/17 | | | | 2,048 | | | 1,588,865 |
7.00%, 5/01/12 | | | | 2,952 | | | 2,797,944 |
Telcordia Technologies, Inc. | | | | | | | |
10.00%, 3/15/13(a)(b) | | | | 805 | | | 474,950 |
Tenet Healthcare Corp. | | | | | | | |
7.375%, 2/01/13(a) | | | | 865 | | | 704,975 |
9.875%, 7/01/14(a) | | | | 83 | | | 67,853 |
Tenneco, Inc. | | | | | | | |
8.625%, 11/15/14(a) | | | | 500 | | | 236,250 |
Terex Corp. | | | | | | | |
8.00%, 11/15/17(a) | | | | 1,046 | | | 774,040 |
Terrestar Networks, Inc. | | | | | | | |
15.00%, 2/15/14(a)(b)(h) | | | | 1,075 | | | 731,000 |
Tesoro Corp. | | | | | | | |
6.25%, 11/01/12(a) | | | | 2,070 | | | 1,583,550 |
6.50%, 6/01/17(a) | | | | 409 | | | 274,030 |
Texas Competitive Electric Holdings Co. LLC | | | | | | | |
10.25%, 11/01/15(a)(b) | | | | 504 | | | 384,300 |
Ticketmaster Entertainment, Inc. | | | | | | | |
10.75%, 8/01/16(b) | | | | 670 | | | 562,800 |
Time Warner Telecom Holdings, Inc. | | | | | | | |
9.25%, 2/15/14(a) | | | | 1,196 | | | 968,760 |
Time Warner, Inc. | | | | | | | |
7.70%, 5/01/32(a) | | | | 2,500 | | | 2,019,510 |
Toll Brothers Finance Corp. | | | | | | | |
5.15%, 5/15/15(a) | | | | 1,900 | | | 1,336,394 |
Toys R US, Inc. | | | | | | | |
7.375%, 10/15/18(a) | | | | 1,200 | | | 624,000 |
Travelport LLC | | | | | | | |
9.875%, 9/01/14(a) | | | | 1,200 | | | 570,000 |
Trimas Corp. | | | | | | | |
9.875%, 6/15/12(a) | | | | 1,250 | | | 687,500 |
Trinity Industries, Inc. | | | | | | | |
6.50%, 3/15/14(a) | | | | 976 | | | 810,080 |
Tronox Worldwide LLC/Tronox Finance Corp. | | | | | | | |
9.50%, 12/01/12(a) | | | | 1,000 | | | 220,000 |
Tropicana Entertainment LLC | | | | | | | |
9.625%, 12/15/14(g) | | | | 750 | | | 35,625 |
Trump Entertainment Resorts, Inc. | | | | | | | |
8.50%, 6/01/15(a) | | | | 730 | | | 187,975 |
TRW Automotive, Inc. | | | | | | | |
7.25%, 3/15/17(a)(b) | | | | 2,300 | | | 1,322,500 |
| | |
| 28 | | • ALLIANCEBERNSTEIN HIGH INCOME FUND |
Portfolio of Investments
| | | | | | | |
| | | | | Principal
Amount
(000) | | U.S. $ Value |
| | | | |
| | | | | | | |
Turner Broadcasting System, Inc. | | | | | | | |
8.375%, 7/01/13(a) | | US$ | | 1,973 | | $ | 1,826,100 |
Turning Stone Resort Casino Enterprise | | | | | | | |
9.125%, 12/15/10-9/15/14(a)(b) | | | | 754 | | | 639,980 |
TXU Corp. | | | | | | | |
Series P | | | | | | | |
5.55%, 11/15/14(a) | | | | 1,380 | | | 746,966 |
Series Q | | | | | | | |
6.50%, 11/15/24(a) | | | | 1,007 | | | 480,370 |
Union Carbide Corp.
7.75%, 10/01/96(a) | | | | 2,500 | | | 1,822,365 |
Unisys Corp.
8.00%, 10/15/12(a) | | | | 1,100 | | | 694,375 |
United Rentals North America, Inc.
6.50%, 2/15/12(a) | | | | 500 | | | 350,000 |
7.75%, 11/15/13(a) | | | | 1,500 | | | 922,500 |
United States Steel Corp.
6.65%, 6/01/37(a) | | | | 3,300 | | | 1,961,418 |
Universal City Development Partners
11.75%, 4/01/10(a) | | | | 480 | | | 384,000 |
Universal Hospital Services, Inc.
6.302%, 6/01/15(a)(e) | | | | 500 | | | 340,000 |
Univision Communications, Inc.
7.85%, 7/15/11(a) | | | | 531 | | | 334,530 |
US Shipping Partners LP Shipping Finance Corp.
13.00%, 8/15/14(a) | | | | 700 | | | 206,500 |
Vanguard Health Holding Co.
11.25%, 10/01/15(a)(d) | | | | 1,350 | | | 1,059,750 |
Ventas Realty LP/Ventas Capital Corp.
6.75%, 4/01/17(a) | | | | 422 | | | 346,040 |
Verizon New York, Inc.
Series B
7.375%, 4/01/32(a) | | | | 2,290 | | | 1,790,762 |
Verso Paper Holdings LLC/Verso Paper, Inc.
Series B
11.375%, 8/01/16(a) | | | | 700 | | | 280,000 |
Viant Holdings, Inc.
10.125%, 7/15/17(a)(b) | | | | 579 | | | 324,240 |
Visant Corp.
7.625%, 10/01/12(a) | | | | 968 | | | 764,720 |
Visant Holding Corp.
8.75%, 12/01/13(a) | | | | 500 | | | 345,000 |
Visteon Corp.
7.00%, 3/10/14(a) | | | | 1,738 | | | 330,220 |
WCI Communities, Inc.
6.625%, 3/15/15(g) | | | | 750 | | | 120,000 |
| | |
| ALLIANCEBERNSTEIN HIGH INCOME FUND • | | 29 |
Portfolio of Investments
| | | | | | | |
| | | | | Principal
Amount
(000) | | U.S. $ Value |
| | | | |
| | | | | | | |
West Corp.
9.50%, 10/15/14(a) | | US$ | | 461 | | $ | 251,245 |
11.00%, 10/15/16(a) | | | | 500 | | | 233,750 |
Weyerhaeuser Co.
7.375%, 3/15/32(a) | | | | 1,408 | | | 965,946 |
William Lyon Homes, Inc.
10.75%, 4/01/13(a) | | | | 1,890 | | | 453,600 |
Williams Co., Inc.
7.625%, 7/15/19(a) | | | | 1,448 | | | 1,194,600 |
7.875%, 9/01/21(a) | | | | 374 | | | 308,550 |
Windstream Corp.
8.125%, 8/01/13(a) | | | | 1,827 | | | 1,502,708 |
8.625%, 8/01/16(a) | | | | 294 | | | 221,970 |
WMG Holdings Corp.
9.50%, 12/15/14(a)(d) | | | | 2,168 | | | 932,240 |
WR Berkley Corp.
5.60%, 5/15/15(a) | | | | 3,500 | | | 3,099,726 |
Wynn Las Vegas Capital Corp.
6.625%, 12/01/14(a) | | | | 1,319 | | | 972,763 |
| | | | | | | |
| | | | | | | 285,227,080 |
| | | | | | | |
Total Corporate Bonds
(cost $567,715,596) | | | | | | | 367,200,044 |
| | | | | | | |
| | | | | | | |
SOVEREIGN BONDS – 14.6% | | | | | | | |
Argentina – 0.2% | | | | | | | |
Argentina Bonos
7.00%, 10/03/15(a) | | | | 2,295 | | | 435,578 |
Republic of Argentina
8.28%, 12/31/33 | | | | 3,118 | | | 802,849 |
| | | | | | | |
| | | | | | | 1,238,427 |
| | | | | | | |
Brazil – 0.9% | | | | | | | |
Republic of Brazil
7.125%, 1/20/37(a) | | | | 6,161 | | | 5,658,879 |
| | | | | | | |
| | | |
Colombia – 1.1% | | | | | | | |
Republic of Colombia
7.375%, 9/18/37(a) | | | | 8,150 | | | 6,723,750 |
| | | | | | | |
| | | |
Dominican Republic – 0.2% | | | | | | | |
Dominican Republic
8.625%, 4/20/27(a)(b) | | | | 1,223 | | | 489,200 |
Dominican Republic STP
Zero Coupon, 7/23/09(b) | | | | 816 | | | 666,835 |
| | | | | | | |
| | | | | | | 1,156,035 |
| | | | | | | |
Ecuador – 0.6% | | | | | | | |
Republic of Ecuador
9.375%, 12/15/15(a)(b) | | | | 6,031 | | | 2,412,400 |
| | |
| 30 | | • ALLIANCEBERNSTEIN HIGH INCOME FUND |
Portfolio of Investments
| | | | | | | |
| | | | | Principal
Amount
(000) | | U.S. $ Value |
| | | | |
| | | | | | | |
10.00%, 8/15/30(a)(b)(f) | | US$ | | 4,215 | | $ | 1,222,350 |
| | | | | | | |
| | | | | | | 3,634,750 |
| | | | | | | |
El Salvador – 0.2% | | | | | | | |
Republic of El Salvador
7.625%, 9/21/34(a)(b) | | | | 872 | | | 523,200 |
7.65%, 6/15/35(a)(b) | | | | 1,711 | | | 906,830 |
| | | | | | | |
| | | | | | | 1,430,030 |
| | | | | | | |
Indonesia – 1.4% | | | | | | | |
Indonesia – Recap Linked Note
12.90%, 3/15/16(b) | | | | 1,930 | | | 1,213,198 |
Republic of Indonesia
6.625%, 2/17/37(b) | | | | 2,560 | | | 1,454,000 |
6.875%, 3/09/17-1/17/18(b) | | | | 3,452 | | | 2,377,220 |
7.50%, 1/15/16(a)(b) | | | | 1,000 | | | 780,000 |
7.75%, 1/17/38(a)(b) | | | | 2,447 | | | 1,639,490 |
8.50%, 10/12/35(a)(b) | | | | 1,645 | | | 1,135,050 |
| | | | | | | |
| | | | | | | 8,598,958 |
| | | | | | | |
Jamaica – 0.1% | | | | | | | |
Government of Jamaica
10.625%, 6/20/17 | | | | 735 | | | 602,700 |
| | | | | | | |
| | | |
Pakistan – 0.1% | | | | | | | |
Republic of Pakistan
6.875%, 6/01/17(a)(b) | | | | 1,227 | | | 441,720 |
| | | | | | | |
| | | |
Panama – 1.7% | | | | | | | |
Republic of Panama
6.70%, 1/26/36(a) | | | | 1,317 | | | 1,027,260 |
7.125%, 1/29/26 | | | | 2,560 | | | 2,048,000 |
8.875%, 9/30/27(a) | | | | 2,709 | | | 2,519,370 |
9.375%, 4/01/29(a) | | | | 5,435 | | | 5,271,950 |
| | | | | | | |
| | | | | | | 10,866,580 |
| | | | | | | |
Peru – 0.5% | | | | | | | |
Republic of Peru
7.35%, 7/21/25(a) | | | | 593 | | | 501,085 |
8.75%, 11/21/33(a) | | | | 2,738 | | | 2,601,100 |
| | | | | | | |
| | | | | | | 3,102,185 |
| | | | | | | |
Philippines – 2.2% | | | | | | | |
Republic of Philippines
7.50%, 9/25/24(a) | | | | 3,144 | | | 2,578,080 |
9.50%, 10/21/24-2/02/30(a) | | | | 2,473 | | | 2,446,860 |
9.875%, 1/15/19 | | | | 1,850 | | | 2,035,000 |
10.625%, 3/16/25(a) | | | | 6,239 | | | 6,800,510 |
| | | | | | | |
| | | | | | | 13,860,450 |
| | | | | | | |
Turkey – 2.6% | | | | | | | |
Republic of Turkey
6.875%, 3/17/36(a) | | | | 7,016 | | | 4,770,880 |
| | |
| ALLIANCEBERNSTEIN HIGH INCOME FUND • | | 31 |
Portfolio of Investments
| | | | | | | |
| | | | | Principal
Amount
(000) | | U.S. $ Value |
| | | | |
| | | | | | | |
7.00%, 6/05/20(a) | | US$ | | 3,400 | | $ | 2,584,000 |
7.375%, 2/05/25(a) | | | | 10,649 | | | 8,093,240 |
9.50%, 1/15/14(a) | | | | 641 | | | 602,540 |
| | | | | | | |
| | | | | | | 16,050,660 |
| | | | | | | |
Ukraine – 0.1% | | | | | | | |
Government of Ukraine
6.385%, 6/26/12(a)(b) | | | | 750 | | | 412,500 |
7.65%, 6/11/13(a)(b) | | | | 729 | | | 400,950 |
| | | | | | | |
| | | | | | | 813,450 |
| | | | | | | |
Uruguay – 0.6% | | | | | | | |
Republic of Uruguay
7.625%, 3/21/36(a) | | | | 550 | | | 341,000 |
7.875%, 1/15/33(a)(h) | | | | 1,377 | | | 854,006 |
9.25%, 5/17/17(a) | | | | 2,814 | | | 2,363,760 |
| | | | | | | |
| | | | | | | 3,558,766 |
| | | | | | | |
Venezuela – 2.1% | | | | | | | |
Republic of Venezuela
5.75%, 2/26/16(a)(b) | | | | 5,477 | | | 2,519,420 |
6.00%, 12/09/20(a) | | | | 6,959 | | | 2,783,400 |
7.00%, 12/01/18(a)(b) | | | | 4,632 | | | 2,130,720 |
7.00%, 3/31/38(a) | | | | 1,181 | | | 484,210 |
7.65%, 4/21/25(a) | | | | 5,588 | | | 2,528,570 |
9.25%, 5/07/28(b) | | | | 3,149 | | | 1,558,656 |
9.375%, 1/13/34(a) | | | | 3,019 | | | 1,539,690 |
| | | | | | | |
| | | | | | | 13,544,666 |
| | | | | | | |
Total Sovereign Bonds
(cost $135,540,408) | | | | | | | 91,282,006 |
| | | | | | | |
| | | | | | | |
TREASURY BONDS – 6.7% | | | | | | | |
Brazil – 2.2% | | | | | | | |
Republic of Brazil
10.25%, 1/10/28(a) | | BRL | | 2,401 | | | 781,309 |
12.50%, 1/05/16(k) | | | | 6,406 | | | 2,616,806 |
12.50%, 1/05/22(a) | | | | 25,811 | | | 10,067,064 |
| | | | | | | |
| | | | | | | 13,465,179 |
| | | | | | | |
Colombia – 0.4% | | | | | | | |
Republic of Colombia
12.00%, 10/22/15(a) | | COP | | 6,455,000 | | | 2,507,301 |
| | | | | | | |
| | | |
Mexico – 3.6% | | | | | | | |
Mexican Bonos
Series M 30
10.00%, 11/20/36 | | MXN | | 79,736 | | | 7,017,512 |
Series MI10
9.00%, 12/20/12 | | | | 197,309 | | | 15,644,745 |
| | | | | | | |
| | | | | | | 22,662,257 |
| | | | | | | |
| | |
| 32 | | • ALLIANCEBERNSTEIN HIGH INCOME FUND |
Portfolio of Investments
| | | | | | | |
| | | | | Principal
Amount
(000) | | U.S. $ Value |
| | | | |
| | | | | | | |
Peru – 0.5% | | | | | | | |
Peru Bono Soberano
8.20%, 8/12/26 | | PEN | | 5,561 | | $ | 1,585,292 |
Series 7
8.60%, 8/12/17(a) | | | | 5,058 | | | 1,556,054 |
| | | | | | | |
| | | | | | | 3,141,346 |
| | | | | | | |
Total Treasury Bonds
(cost $54,527,924) | | | | | | | 41,776,083 |
| | | | | | | |
| | | | | | | |
NON-AGENCY FIXED RATE CMBS – 3.9% | | | | | | | |
United States – 3.9% | | | | | | | |
Credit Suisse Mortgage Capital Certificates
Series 2006-C4, Class A3
5.467%, 9/15/39(a) | | US$ | | 5,320 | | | 4,012,475 |
Series 2006-C4, Class AM
5.509%, 9/15/39(a) | | | | 5,600 | | | 3,490,670 |
JP Morgan Chase Commercial Mortgage Securities
Series 2006-CB15, Class AM
5.855%, 6/12/43(a) | | | | 670 | | | 435,969 |
JP Morgan Chase Commercial Mortgage
Securities Corp.
Series 2007-C1, Class A4
5.716%, 2/15/51(a) | | | | 3,000 | | | 2,195,570 |
Merrill Lynch Countrywide Commercial Mortgage Trust
Series 2006-4, Class AM
5.204%, 12/12/49(a) | | | | 7,600 | | | 4,602,919 |
Morgan Stanley Capital
Series 2006-IQ12, Class A4
5.332%, 12/15/43(a) | | | | 7,100 | | | 5,341,449 |
Morgan Stanley Capital I
Series 2006-IQ12, Class AM
5.37%, 12/15/43(a) | | | | 7,300 | | | 4,445,114 |
| | | | | | | |
| | | |
Total Non-Agency Fixed Rate CMBS
(cost $32,800,397) | | | | | | | 24,524,166 |
| | | | | | | |
| | | | | | | |
NON-INVESTMENT GRADE LOANS – 3.8% | | | | | |
United States – 3.8% | | | | | | | |
Alltel Corp.
5.31%, 5/15/15(c) | | | | 1,489 | | | 1,413,363 |
Aramark Corp.
2.02%-2.47%, 1/27/14(c) | | | | 45 | | | 37,429 |
5.64%, 1/27/14(c) | | | | 705 | | | 589,158 |
Ashmore Energy International
3.66%, 3/30/12(c) | | | | 118 | | | 74,503 |
6.76%, 3/30/14(c) | | | | 853 | | | 537,275 |
| | |
| ALLIANCEBERNSTEIN HIGH INCOME FUND • | | 33 |
Portfolio of Investments
| | | | | | | |
| | | | | Principal
Amount
(000) | | U.S. $ Value |
| | | | |
| | | | | | | |
Asurion Corp.
5.79%-7.09%, 7/03/14(c) | | US$ | | 1,000 | | $ | 738,130 |
Carestream Health, Inc.
5.42%-5.76%, 4/30/13(c) | | | | 949 | | | 606,490 |
Celanese US Holdings LLC
5.55%, 4/02/14(c) | | | | 992 | | | 795,056 |
Charter Communications Operating LLC
5.00%-5.47%, 3/06/14(c) | | | | 995 | | | 734,908 |
8.77%, 3/06/14(c) | | | | 1,244 | | | 1,044,750 |
Chrysler Financial Services Americas LLC
6.82%, 8/03/12(c) | | | | 746 | | | 501,139 |
CSC Holdings, Inc. (Cablevision)
4.56%, 3/29/13(c) | | | | 1,240 | | | 1,053,062 |
First Data Corp.
5.94%-6.51%, 9/24/14(c) | | | | 1,489 | | | 1,088,003 |
FirstLight Power Resources, Inc.
2.65%-3.66%, 11/01/13(c) | | | | 55 | | | 45,131 |
5.75%, 11/01/13(c) | | | | 425 | | | 350,270 |
7.71%, 5/01/14(c) | | | | 1,000 | | | 790,000 |
Ford Motor Co.
7.59%, 12/15/13(c) | | | | 1,241 | | | 677,330 |
Freescale Semiconductor, Inc.
5.47%, 11/29/13(c) | | | | 1,244 | | | 829,379 |
Graham Packaging
5.06%-6.32%, 10/07/11(c) | | | | 992 | | | 798,302 |
Graphic Packaging Holding Co.
5.88%-7.50%, 5/16/14(c) | | | | 1,232 | | | 1,040,885 |
Harrah’s Operating Co., Inc.
6.53%-6.76%, 1/28/15(c) | | | | 1,493 | | | 1,011,019 |
HCA, Inc.
6.01%, 11/18/13(c) | | | | 1,737 | | | 1,432,500 |
Hexion Specialty
6.06%-6.19%, 5/05/13(c) | | | | 992 | | | 685,739 |
IDEARC, Inc. (Verizon)
5.12%-5.77%, 11/17/14(c) | | | | 1,489 | | | 617,784 |
Landsource Communities
8.25%, 6/01/09(c)(h) | | | | 1,139 | | | 386,186 |
Northeast Biofuels LLC
6/28/13(l) | | | | 500 | | | 220,000 |
Sabre, Inc.
5.00%-5.42%, 9/30/14(c) | | | | 1,250 | | | 701,387 |
Sungard Data Systems, Inc.
4.55%, 2/28/14(c) | | | | 744 | | | 568,012 |
Texas Competitive Electronics
6.30%-7.64%, 10/10/14(c) | | | | 1,737 | | | 1,359,860 |
Thomson Learning
5.62%, 7/03/14(c) | | | | 1,241 | | | 918,045 |
Univision Communications, Inc.
5.25%, 9/29/14(c) | | | | 625 | | | 337,694 |
| | |
| 34 | | • ALLIANCEBERNSTEIN HIGH INCOME FUND |
Portfolio of Investments
| | | | | | | |
| | | | | Principal
Amount
(000) | | U.S. $ Value |
| | | | |
| | | | | | | |
West Corp.
8.00%, 10/24/13(c) | | US$ | | 1,244 | | $ | 995,000 |
Wide Open West Finance LLC
5.31%-6.26%, 6/30/14(c) | | | | 1,000 | | | 605,000 |
Wrigley Jr Company
7.75%, 10/06/14(c) | | | | 300 | | | 284,064 |
| | | | | | | |
| | | |
Total Non-Investment Grade Loans
(cost $29,858,207) | | | | | | | 23,866,853 |
| | | | | | | |
| | | | | | | |
| | | | | Shares | | |
| PREFERRED STOCKS – 3.5% | | | | | | | |
Capital One Capital II
7.50%(a) | | | | 130,000 | | | 2,086,500 |
Centaur Funding Corp.
9.08%(a)(b) | | | | 20,280 | | | 17,085,900 |
Federal Home Loan Mortgage Corp.
Series Z
8.375%(a) | | | | 11,250 | | | 17,438 |
Federal National Mortgage Association
8.25%(a)(c) | | | | 51,350 | | | 107,835 |
Royal Bank of Scotland Group PLC
Series N
6.35%(a) | | | | 100,000 | | | 1,162,000 |
Santander Finance Preferred SA
Unipersonal
6.80%(a) | | | | 67,000 | | | 1,145,700 |
Sovereign REIT
12.00%(a)(b) | | | | 501 | | | 475,950 |
| | | | | | | |
| | | |
Total Preferred Stocks
(cost $29,902,192) | | | | | | | 22,081,323 |
| | | | | | | |
| | | | | | | |
| | | | | Principal
Amount
(000) | | |
| QUASI-SOVEREIGN BONDS – 2.7% | | | | | | | |
Russia – 2.1% | | | | | | | |
RSHB Capital SA for OJSC Russian Agricultural Bank
6.299%, 5/15/17(b) | | US$ | | 4,220 | | | 2,254,324 |
7.125%, 1/14/14(b) | | | | 4,785 | | | 3,205,950 |
7.75%, 5/29/18(b) | | | | 11,855 | | | 7,434,385 |
| | | | | | | |
| | | | | | | 12,894,659 |
| | | | | | | |
Venezuela – 0.6% | | | | | | | |
Petroleos de Venezuela SA
5.25%, 4/12/17(a)(b) | | | | 10,017 | | | 3,806,460 |
| | | | | | | |
| | | |
Total Quasi-Sovereign Bonds
(cost $24,052,190) | | | | | | | 16,701,119 |
| | | | | | | |
| | |
| ALLIANCEBERNSTEIN HIGH INCOME FUND • | | 35 |
Portfolio of Investments
| | | | | | | |
| | | | | Principal
Amount
(000) | | U.S. $ Value |
| | | | |
| | | | | | | |
HOME EQUITY LOANS – FLOATING RATES – 1.2% | | | | | | | |
United States – 1.2% | | | | | | | |
Countrywide Asset-Backed Certificates
Series 2006-S10, Class A1
3.369%, 10/25/36(a)(e) | | US$ | | 1,732 | | $ | 1,557,927 |
Series 2006-S5, Class A1
3.369%, 6/25/35(a)(e) | | | | 187 | | | 177,741 |
Series 2007-S2, Class A1
3.399%, 5/25/37(a)(e) | | | | 3,292 | | | 2,759,047 |
GMAC Mortgage Corp. Loan Trust
Series 2006-HE5, Class 2A1
3.329%, 2/25/37(e) | | | | 3,159 | | | 2,873,521 |
| | | | | | | |
| | | |
Total Home Equity Loans – Floating Rates
(cost $7,398,707) | | | | | | | 7,368,236 |
| | | | | | | |
| | | | | | | |
EMERGING MARKETS – TREASURIES – 1.0% | | | | | |
Colombia – 0.0% | | | | | | | |
Republic of Colombia
9.85%, 6/28/27(a) | | COP | | 726,000 | | | 226,232 |
| | | | | | | |
| | | |
Turkey – 1.0% | | | | | | | |
Turkey Government Bond
16.00%, 3/07/12 | | TRY | | 11,157 | | | 5,869,070 |
| | | | | | | |
| | | |
Total Emerging Markets – Treasuries
(cost $9,050,068) | | | | | | | 6,095,302 |
| | | | | | | |
| | | | | | | |
| SOVEREIGN AGENCIES – 0.5% | | | | | | | |
Indonesia – 0.0% | | | | | | | |
Majapahit Holding BV
7.875%, 6/29/37(a)(b) | | US$ | | 200 | | | 106,000 |
| | | | | | | |
| | | |
Kazakhstan – 0.5% | | | | | | | |
KazMunaiGaz Finance Sub BV
8.375%, 7/02/13(b) | | | | 4,530 | | | 3,035,100 |
| | | | | | | |
| | | |
Total Sovereign Agencies
(cost $4,730,074) | | | | | | | 3,141,100 |
| | | | | | | |
| | | | | | | |
INFLATION-LINKED SECURITIES – 0.4% | | | | | | | |
Brazil – 0.3% | | | | | | | |
Unibanco Grand Cayman
8.70%, 2/11/10(a)(b) | | BRL | | 3,793 | | | 1,625,819 |
| | | | | | | |
| | | |
Uruguay – 0.1% | | | | | | | |
Republic of Uruguay
3.70%, 6/26/37(a) | | UYU | | 45,810 | | | 741,556 |
| | | | | | | |
| | | |
Total Inflation-Linked Securities
(cost $3,726,690) | | | | | | | 2,367,375 |
| | | | | | | |
| | |
| 36 | | • ALLIANCEBERNSTEIN HIGH INCOME FUND |
Portfolio of Investments
| | | | | | | | |
| | | | |
Shares | | U.S. $ Value | |
| | | | | |
| | | | | | | | |
WARRANTS – 0.1% | | | | | | | | |
Nigeria – 0.1% | | | | | | | | |
Central Bank of Nigeria, expiring 11/15/20(m) | | | | 2,500 | | $ | 545,000 | |
| | | | | | | | |
| | | |
Venezuela – 0.0% | | | | | | | | |
Republic of Venezuela,
expiring 4/15/20(m) | | | | 48,195 | | | – 0 | – |
| | | | | | | | |
| | | |
Total Warrants
(cost $0) | | | | | | | 545,000 | |
| | | | | | | | |
| | | | | | | | |
| | | |
| | | | | Principal
Amount
(000) | | | |
REGIONAL BONDS – 0.0% | | | | | | | | |
Colombia – 0.0% | | | | | | | | |
Bogota Distrio Capital
9.75%, 7/26/28(a)(b)
(cost $521,499) | | COP | | 1,142,000 | | | 328,843 | |
| | | | | | | | |
| | | | | | | | |
| | | |
| | | | | Shares | | | |
SHORT-TERM INVESTMENTS – 1.1% | | | | | | | | |
Investment Companies – 1.1% | | | | | | | | |
AllianceBernstein Fixed-Income Shares, Inc. – Government STIF Portfolio(n)
(cost $6,973,403) | | | | 6,973,403 | | | 6,973,403 | |
| | | | | | | | |
| | | |
Total Investments – 98.1%
(cost $906,797,355) | | | | | | | 614,250,853 | |
Other assets less liabilities – 1.9% | | | | | | | 11,954,219 | |
| | | | | | | | |
| | | |
Net Assets – 100.0% | | | | | | $ | 626,205,072 | |
| | | | | | | | |
| | |
| ALLIANCEBERNSTEIN HIGH INCOME FUND • | | 37 |
Portfolio of Investments
CREDIT DEFAULT SWAP CONTRACTS (see Note D)
| | | | | | | | | | | | |
Swap Counterparty &
Referenced Obligation | | Notional
Amount
(000) | | Interest
Rate | | | Termination
Date | | Unrealized
Appreciation/
(Depreciation) | |
Sale Contracts: | | | | | | | | | | | | |
Citigroup Global Markets, Inc.
(Federal Republic of Brazil
12.25%, 3/6/30) | | $ | 7,110 | | 3.09 | % | | 8/20/10 | | $ | 70,580 | |
Citigroup Global Markets, Inc.
(Republic of Philippines
10.625% 3/16/25) | | | 1,410 | | 4.95 | | | 3/20/09 | | | 13,037 | |
JPMorgan Chase
(OAO Gazprom
10.50% 10/21/09) | | | 4,560 | | 1.04 | | | 10/20/10 | | | (772,082 | ) |
JPMorgan Chase
(Petroleos De Venezuela
6.62% 4/12/37) | | | 9,370 | | 6.62 | | | 5/20/09 | | | (562,213 | ) |
FORWARD CURRENCY EXCHANGE CONTRACTS (see Note D)
| | | | | | | | | | | | |
| | | Contract
Amount
(000) | | U.S. $
Value on
Origination
Date | | U.S. $
Value at
October 31,
2008 | | Unrealized
Appreciation/
(Depreciation) | |
Sale Contracts: | | | | | | | | | | | | |
Brazilian Real | | | | | | | | | | | | |
settling 12/02/08 | | 3,133 | | $ | 1,432,014 | | $ | 1,427,915 | | $ | 4,099 | |
Euro | | | | | | | | | | | | |
settling 12/11/08 | | 1,686 | | | 2,110,897 | | | 2,146,396 | | | (35,499 | ) |
Mexican Nuevo Peso | | | | | | | | | | | | |
settling 12/10/08 | | 164,353 | | | 11,917,645 | | | 12,627,124 | | | (709,479 | ) |
REVERSE REPURCHASE AGREEMENTS (see Note D)
| | | | | | | | |
| Broker | | Interest Rate | | | Maturity | | Amount |
Chase Manhattan Bank | | 0.25 | % | | 12/31/08 | | $ | 2,251,709 |
Chase Manhattan Bank | | 0.75 | | | 11/03/08 | | | 2,235,880 |
| | | | | | | | |
| | | | | | | $ | 4,487,589 |
| | | | | | | | |
| (a) | Position, or a portion thereof, has been segregated to collateralize forward currency exchange contracts. The aggregate market value of these securities amounted to $452,691,841. |
| (b) | Security is exempt from registration under Rule 144A of the Securities Act of 1933. These securities are considered liquid and may be resold in transactions exempt from registration, normally to qualified institutional buyers. At October 31, 2008, the aggregate market value of these securities amounted to $134,244,486 or 21.4% of net assets. |
| (c) | Variable rate coupon, rate shown as of October 31, 2008. |
| (d) | Indicates a security that has a zero coupon that remains in effect until a predetermined date at which time the stated coupon rate becomes effective until final maturity. |
| (e) | Floating Rate Security. Stated interest rate was in effect at October 31, 2008. |
| (f) | Coupon rate adjusts periodically based upon a predetermined schedule. Stated interest rate in effect at October 31, 2008. |
| (g) | Security is in default and is non-income producing. |
| (h) | Pay-In-Kind Payments (PIK). |
| | |
| 38 | | • ALLIANCEBERNSTEIN HIGH INCOME FUND |
Portfolio of Investments
| (i) | Illiquid security, valued at fair value. |
| (j) | Security is exempt from registration under Rule 144A of the Securities Act of 1933. This security, which represents 0.01% of net assets as of October 31, 2008, is considered illiquid and restricted. |
| | | | | | | | | | | |
| Restricted Securities | | Acquisition
Date | | Acquisition
Cost | | Market
Value | | Percentage of
Net Assets | |
Russell-Stanley Holdings, Inc. | | | | | | | | | | | |
9.00%, 11/30/08 | | 2/10/99-5/31/05 | | $ | 7,530,199 | | $ | 78,055 | | 0.01 | % |
| (k) | Position, or a portion thereof, has been segregated to collateralize reverse repurchase agreements. The market value of this security amounted to $2,616,806. |
| (l) | This position or a portion of this position represents an unsettled loan purchase. At October 31, 2008, the market value of these unsettled loan purchases amounted to $220,000. The coupon rate will be determined at the time of settlement and will be based upon the London-Interbank Offered Rate (“LIBOR”) plus a premium which was determined at the time of purchase. |
| (m) | Non-income producing security. |
| (n) | Investment in affiliated money market mutual fund. |
| | The Fund currently owns investments collateralized by subprime mortgage loans. Subprime loans are offered to homeowners who do not have a history of debt or who have had problems meeting their debt obligations. Because repayment is less certain, subprime borrowers pay a higher rate of interest than prime borrowers. As of October 31, 2008, the Fund’s total exposure to subprime investments was 0.47%. These investments are valued in accordance with the Fund’s Valuation Policies (see Note A for additional details). |
|
Currency Abbreviations: BRL – Brazilian Real COP – Colombian Peso EUR – Euro Dollar MXN – Mexican Peso PEN – Peruvian New Sol RUB – Russian Rouble TRY – New Turkish Lira UYU – Uruguayan Peso |
Glossary:
CMBS – Commercial Mortgage-Backed Securities
OJSC – Open Joint Stock Company
STP – Structured Product
See notes to financial statements.
| | |
| ALLIANCEBERNSTEIN HIGH INCOME FUND • | | 39 |
Portfolio of Investments
STATEMENT OF ASSETS & LIABILITIES
October 31, 2008
| | | | |
| Assets | | | | |
Investments in securities, at value | | | | |
Unaffiliated issuers (cost $899,823,952) | | $ | 607,277,450 | |
Affiliated issuers (cost $6,973,403) | | | 6,973,403 | |
Cash | | | 3,620,151 | (a) |
Foreign cash, at value (cost $130,872) | | | 128,378 | |
Unrealized appreciation of credit default swap contracts | | | 83,617 | |
Unrealized appreciation of forward currency exchange contracts | | | 4,099 | |
Interest receivable | | | 17,777,390 | |
Receivable for investment securities sold | | | 343,750 | |
Due from broker | | | 2,251,709 | |
Receivable for capital stock sold | | | 1,522,223 | |
| | | | |
Total assets | | | 639,982,170 | |
| | | | |
| Liabilities | | | | |
Unrealized depreciation of credit default swap contracts | | | 1,334,295 | |
Unrealized depreciation of forward currency exchange contracts | | | 744,978 | |
Reverse repurchase agreements | | | 4,487,589 | |
Payable for investment securities purchased | | | 1,264,674 | |
Payable for capital stock redeemed | | | 3,192,484 | |
Dividends payable | | | 1,950,813 | |
Distribution fee payable | | | 284,861 | |
Advisory fee payable | | | 111,670 | |
Transfer Agent fee payable | | | 76,514 | |
Administrative fee payable | | | 37,621 | |
Accrued expenses | | | 291,599 | |
| | | | |
Total liabilities | | | 13,777,098 | |
| | | | |
Net Assets | | $ | 626,205,072 | |
| | | | |
| Composition of Net Assets | | | | |
Capital stock, at par | | $ | 106,736 | |
Additional paid-in capital | | | 1,169,247,775 | |
Undistributed net investment income | | | 3,471,547 | |
Accumulated net realized loss on investment and foreign currency transactions | | | (251,745,442) | |
Net unrealized depreciation of investments and foreign currency denominated assets and liabilities | | | (294,875,544) | |
| | | | |
| | $ | 626,205,072 | |
| | | | |
Net Asset Value Per Share—21 billion shares of capital stock authorized, $.001 par value
| | | | | | | | | |
| Class | | Net Assets | | Shares
Outstanding | | Net Asset
Value | |
| A | | $ | 450,517,649 | | 76,998,760 | | $ | 5.85 | * |
| | |
| B | | $ | 54,724,057 | | 9,274,123 | | $ | 5.90 | |
| | |
| C | | $ | 112,507,871 | | 19,019,156 | | $ | 5.92 | |
| | |
| Advisor | | $ | 6,095,337 | | 1,040,330 | | $ | 5.86 | |
| | |
| R | | $ | 1,442,752 | | 246,630 | | $ | 5.85 | |
| | |
| K | | $ | 752,884 | | 128,651 | | $ | 5.85 | |
| | |
| I | | $ | 164,522 | | 28,102 | | $ | 5.85 | |
| | |
| (a) | An amount of $1,635,000 has been segregated to collateralize credit default swap contracts outstanding at October 31, 2008. |
| * | The maximum offering price per share for Class A shares was $6.11 which reflects a sales charge of 4.25%. |
See notes to financial statements.
| | |
| 40 | | • ALLIANCEBERNSTEIN HIGH INCOME FUND |
Statement of Assets & Liabilities
STATEMENT OF OPERATIONS
Year Ended October 31, 2008
| | | | | | | | |
| Investment Income | | | | | | | | |
Interest (net of foreign taxes withheld of $34) | | $ | 67,708,732 | | | | | |
Dividends | | | | | | | | |
Unaffiliated issuers | | | 1,936,909 | | | | | |
Affiliated issuers | | | 7,980 | | | $ | 69,653,621 | |
| | | | | | | | |
| Expenses | | | | | | | | |
Advisory fee (see Note B) | | | 4,026,514 | | | | | |
Distribution fee—Class A | | | 1,708,659 | | | | | |
Distribution fee—Class B | | | 781,900 | | | | | |
Distribution fee—Class C | | | 1,481,266 | | | | | |
Distribution fee—Class R | | | 7,505 | | | | | |
Distribution fee—Class K | | | 1,391 | | | | | |
Transfer agency—Class A | | | 711,460 | | | | | |
Transfer agency—Class B | | | 125,769 | | | | | |
Transfer agency—Class C | | | 193,048 | | | | | |
Transfer agency—Advisor Class | | | 9,331 | | | | | |
Transfer agency—Class R | | | 3,818 | | | | | |
Transfer agency—Class K | | | 1,023 | | | | | |
Transfer agency—Class I | | | 201 | | | | | |
Custodian | | | 330,115 | | | | | |
Printing | | | 326,449 | | | | | |
Registration | | | 186,967 | | | | | |
Audit | | | 99,496 | | | | | |
Administrative | | | 83,733 | | | | | |
Legal | | | 80,870 | | | | | |
Directors' fees | | | 54,143 | | | | | |
Miscellaneous | | | 35,398 | | | | | |
| | | | | | | | |
Total expenses before interest expense | | | 10,249,056 | | | | | |
Interest expense | | | 483,340 | | | | | |
| | | | | | | | |
Total expenses | | | 10,732,396 | | | | | |
Less: expenses waived by the Adviser (see Note B) | | | (805,944 | ) | | | | |
Less: expense offset arrangement (see Note B) | | | (31,335 | ) | | | | |
| | | | | | | | |
Net expenses | | | | | | | 9,895,117 | |
| | | | | | | | |
Net investment income | | | | | | | 59,758,504 | |
| | | | | | | | |
| Realized and Unrealized Gain (Loss) on Investment and Foreign Currency Transactions | | | | | | | | |
Net realized gain (loss) on: | | | | | | | | |
Investment transactions | | | | | | | (17,072,951 | ) |
Swap contracts | | | | | | | 667,641 | |
Foreign currency transactions | | | | | | | 5,230,531 | |
Net change in unrealized appreciation/ (depreciation) of: | | | | | | | | |
Investments | | | | | | | (295,209,399 | ) |
Swap contracts | | | | | | | (2,031,864 | ) |
Foreign currency denominated assets and liabilities | | | | | | | (1,008,096 | ) |
| | | | | | | | |
Net loss on investment and foreign currency transactions | | | | | | | (309,424,138 | ) |
| | | | | | | | |
Contribution from Adviser (see Note B) | | | | | | | 902 | |
| | | | | | | | |
Net Decrease in Net Assets from Operations | | | | | | $ | (249,664,732) | |
| | | | | | | | |
See notes to financial statements.
| | |
| ALLIANCEBERNSTEIN HIGH INCOME FUND • | | 41 |
Statement of Operations
STATEMENT OF CHANGES IN NET ASSETS
| | | | | | | | |
| | | Year Ended
October 31,
2008 | | | Year Ended
October 31,
2007 | |
| Increase (Decrease) in Net Assets from Operations | | | | | | | | |
Net investment income | | $ | 59,758,504 | | | $ | 23,324,784 | |
Net realized gain (loss) on investment and foreign currency transactions | | | (11,174,779 | ) | | | 13,992,560 | |
Net change in unrealized appreciation/depreciation of investments and foreign currency denominated assets and liabilities | | | (298,249,359 | ) | | | 3,194,597 | |
Contribution from Adviser | | | 902 | | | | – 0 | – |
| | | | | | | | |
Net increase (decrease) in net assets from operations | | | (249,664,732 | ) | | | 40,511,941 | |
| Dividends and Distributions to Shareholders from | | | | | | | | |
Net investment income | | | | | | | | |
Class A | | | (45,758,861 | ) | | | (16,926,254 | ) |
Class B | | | (5,640,505 | ) | | | (2,290,180 | ) |
Class C | | | (10,819,849 | ) | | | (5,041,651 | ) |
Advisor Class | | | (589,547 | ) | | | – 0 | – |
Class R | | | (115,063 | ) | | | – 0 | – |
Class K | | | (44,854 | ) | | | – 0 | – |
Class I | | | (14,863 | ) | | | – 0 | – |
Net realized gain on investment and foreign currency transactions | | | | | | | | |
Class A | | | (6,453,496 | ) | | | (9,777,229 | ) |
Class B | | | (874,556 | ) | | | (1,705,256 | ) |
Class C | | | (2,191,069 | ) | | | (3,425,008 | ) |
| Capital Stock Transactions | | | | | | | | |
Net increase | | | 545,111,930 | | | | 32,973,033 | |
| | | | | | | | |
Total increase | | | 222,944,535 | | | | 34,319,396 | |
| Net Assets | | | | | | | | |
Beginning of period | | | 403,260,537 | | | | 368,941,141 | |
| | | | | | | | |
End of period (including undistributed net investment income of $3,471,547 and $847,743, respectively) | | $ | 626,205,072 | | | $ | 403,260,537 | |
| | | | | | | | |
See notes to financial statements.
| | |
| 42 | | • ALLIANCEBERNSTEIN HIGH INCOME FUND |
Statement of Changes in Net Assets
NOTES TO FINANCIAL STATEMENTS
October 31, 2008
NOTE A
Significant Accounting Policies
AllianceBernstein High Income Fund, Inc. (the “Fund”), formerly known as AllianceBernstein Emerging Market Debt Fund, Inc., was incorporated in the State of Maryland on December 2, 1993, as a non-diversified, open-end management investment company. The Fund offers Class A, Class B, Class C, Advisor Class, Class R, Class K and Class I shares. Class A shares are sold with a front-end sales charge of up to 4.25% for purchases not exceeding $1,000,000. With respect to purchases of $1,000,000 or more, Class A shares redeemed within one year of purchase may be subject to a contingent deferred sales charge of 1%. Class B shares are currently sold with a contingent deferred sales charge which declines from 3% to zero depending on the period of time the shares are held. Class B shares will automatically convert to Class A shares six years after the end of the calendar month of purchase. Class C shares are subject to a contingent deferred sales charge of 1% on redemptions made within the first year after purchase. Class R and Class K shares are sold without an initial or contingent deferred sales charge. Advisor Class and Class I shares are sold without an initial or contingent deferred sales charge and are not subject to ongoing distribution expenses. All seven classes of shares have identical voting, dividend, liquidation and other rights, except that the classes bear different distribution and transfer agency expenses. Each class has exclusive voting rights with respect to its distribution plan. The financial statements have been prepared in conformity with U.S. generally accepted accounting principles, which require management to make certain estimates and assumptions that affect the reported amounts of assets and liabilities in the financial statements and amounts of income and expenses during the reporting period. Actual results could differ from those estimates. The following is a summary of significant accounting policies followed by the Fund.
1. Security Valuation
Portfolio securities are valued at their current market value determined on the basis of market quotations or, if market quotations are not readily available or are deemed unreliable, at “fair value” as determined in accordance with procedures established by and under the general supervision of the Fund’s Board of Directors.
In general, the market value of securities which are readily available and deemed reliable are determined as follows. Securities listed on a national securities exchange (other than securities listed on The NASDAQ Stock Market, Inc. (“NASDAQ”)) or on a foreign securities exchange are valued at the last sale price at the close of the exchange or foreign securities exchange. If there has been no sale on such day, the securities are valued at the mean of the closing bid and asked prices on such day. Securities listed on more than one exchange are valued by reference to the principal exchange on which the securities are traded; securities listed only on NASDAQ are valued in accordance with the NASDAQ
| | |
| ALLIANCEBERNSTEIN HIGH INCOME FUND • | | 43 |
Notes to Financial Statements
Official Closing Price; listed put or call options are valued at the last sale price. If there has been no sale on that day, such securities will be valued at the closing bid prices on that day; open futures contracts and options thereon are valued using the closing settlement price or, in the absence of such a price, the most recent quoted bid price. If there are no quotations available for the day of valuation, the last available closing settlement price is used; securities traded in the over-the-counter market (“OTC”) are valued at the mean of the current bid and asked prices as reported by the National Quotation Bureau or other comparable sources; U.S. government securities and other debt instruments having 60 days or less remaining until maturity are valued at amortized cost if their original maturity was 60 days or less; or by amortizing their fair value as of the 61 st day prior to maturity if their original term to maturity exceeded 60 days; fixed-income securities, including mortgage backed and asset backed securities, may be valued on the basis of prices provided by a pricing service or at a price obtained from one or more of the major broker/dealers. In cases where broker/dealer quotes are obtained, AllianceBernstein L.P. (the “Adviser”) may establish procedures whereby changes in market yields or spreads are used to adjust, on a daily basis, a recently obtained quoted price on a security; and OTC and other derivatives are valued on the basis of a quoted bid price or spread from a major broker/dealer in such security. Investments in money market funds are valued at their net asset value each day.
Securities for which market quotations are not readily available (including restricted securities) or are deemed unreliable are valued at fair value. Factors considered in making this determination may include, but are not limited to, information obtained by contacting the issuer, analysts, analysis of the issuer’s financial statements or other available documents. In addition, the Fund may use fair value pricing for securities primarily traded in non-U.S. markets because, most foreign markets close well before the Fund values its securities at 4:00 p.m., Eastern Time. The earlier close of these foreign markets gives rise to the possibility that significant events, including broad market moves, may have occurred in the interim and may materially affect the value of those securities.
2. Currency Translation
Assets and liabilities denominated in foreign currencies and commitments under forward currency exchange contracts are translated into U.S. dollars at the mean of the quoted bid and asked prices of such currencies against the U.S. dollar. Purchases and sales of portfolio securities are translated into U.S. dollars at the rates of exchange prevailing when such securities were acquired or sold. Income and expenses are translated into U.S. dollars at rates of exchange prevailing when accrued.
Net realized gain or loss on foreign currency transactions represents foreign exchange gains and losses from sales and maturities of foreign fixed income investments, foreign currency exchange contracts, holding of foreign currencies, currency gains or losses realized between the trade and settlement dates on
| | |
| 44 | | • ALLIANCEBERNSTEIN HIGH INCOME FUND |
Notes to Financial Statements
foreign investment transactions, and the difference between the amounts of dividends, interest and foreign withholding taxes recorded on the Fund’s books and the U.S. dollar equivalent amounts actually received or paid. Net unrealized currency gains and losses from valuing foreign currency denominated assets and liabilities at period end exchange rates are reflected as a component of unrealized appreciation and depreciation of investments and foreign currency denominated assets and liabilities.
3. Taxes
It is the Fund’s policy to meet the requirements of the Internal Revenue Code applicable to regulated investment companies and to distribute all of its investment company taxable income and net realized gains, if any, to shareholders. Therefore, no provisions for federal income or excise taxes are required. The Fund may be subject to taxes imposed by countries in which it invests. Such taxes are generally based on income and/or capital gains earned or repatriated. Taxes are accrued and applied to net investment income, net realized gains and net unrealized appreciation/depreciation as such income and/or gains are earned.
In accordance with the Financial Accounting Standards Board (“FASB”) Interpretation No. 48, “Accounting for Uncertainties in Income Taxes” (“FIN 48”), management has analyzed the Fund’s tax positions taken on federal and state income tax returns for all open tax years (the current and the prior three tax years) and has concluded that no provision for income tax is required in the Fund’s financial statements.
4. Investment Income and Investment Transactions
Dividend income is recorded on the ex-dividend date or as soon as the Fund is informed of the dividend. Interest income is accrued daily. Investment transactions are accounted for on the date securities are purchased or sold. Investment gains and losses are determined on the identified cost basis. The Fund amortizes premiums and accretes discounts as adjustments to interest income.
5. Class Allocations
All income earned and expenses incurred by the Fund are borne on a pro-rata basis by each settled class of shares, based on the proportionate interest in the Fund represented by the net assets of such class, except for class specific expenses which are allocated to the respective class. Realized and unrealized gains and losses are allocated among the various share classes based on their respective net assets.
6. Dividends and Distributions
Dividends and distributions to shareholders are recorded on the ex-dividend date. Income and capital gains distributions are determined in accordance with federal tax regulations and may differ from those determined in accordance with U.S. generally accepted accounting principles. To the extent these differences are
| | |
| ALLIANCEBERNSTEIN HIGH INCOME FUND • | | 45 |
Notes to Financial Statements
permanent, such amounts are reclassified within the capital accounts based on their federal tax basis treatment; temporary differences do not require such reclassification.
NOTE B
Advisory Fee and Other Transactions with Affiliates
Under the terms of the investment advisory agreement, the Fund pays the Adviser an advisory fee at an annual rate of .50% of the first $2.5 billion, .45% of the next $2.5 billion and .40% in excess of $5 billion, of the Fund’s average daily net assets.
Effective January 25, 2008, the Adviser has agreed to waive its fees and bear certain expenses to the extent necessary to limit total fund operating expenses on an annual basis to .95%, 1.65%, 1.65%, .65%, 1.15%, .90% and .65% of the average daily net assets of Class A, Class B, Class C, Advisor Class, Class R. Class K and Class I shares, respectively. This waiver extends through October 31, 2009 and then may be extended by the Adviser for additional one-year terms. For the period ended October 31, 2008, such reimbursement amounted to $805,944.
During the year ended October 31, 2008, the Adviser reimbursed the Fund $902 for losses incurred due to a trade processing error.
Pursuant to the investment advisory agreement, the Fund paid $83,733 to the Adviser representing the cost of certain legal and accounting services provided to the Fund by the Adviser for the year ended October 31, 2008.
The Fund compensates AllianceBernstein Investor Services, Inc. (ABIS), a wholly-owned subsidiary of the Adviser, under a Transfer Agency Agreement for providing personnel and facilities to perform transfer agency services for the Fund. ABIS may make payments to intermediaries that provide omnibus account services, sub-accounting services and/or networking services. Such compensation retained by ABIS amounted to $607,506 for the year ended October 31, 2008.
For the year ended October 31, 2008, the expenses of Class A, Class B, Class C and Adviser Class shares were reduced by $31,335 under an expense offset arrangement with ABIS.
The Fund may invest in the AllianceBernstein Fixed-Income Shares, Inc.—Government STIF Portfolio, an open-end management investment company managed by the Adviser. The Government STIF Portfolio is offered as a cash management option to mutual funds and other institutional accounts of the Adviser, and is not available for direct purchase by members of the public. The Government STIF Portfolio pays no investment management fees but does bear its own expenses. A summary of the Fund’s transactions in shares of the Government STIF Portfolio for the year ended October 31, 2008 is as follows:
| | | | | | | | | | | | |
Market Value
October 31, 2007
(000) | | Purchases
at Cost
(000) | | Sales
Proceeds
(000) | | Dividend
Income
(000) | | Market Value
October 31, 2008
(000) |
| $ – 0 – | | $ | 33,746 | | $ | 26,773 | | $ | 8 | | $ | 6,973 |
| | |
| 46 | | • ALLIANCEBERNSTEIN HIGH INCOME FUND |
Notes to Financial Statements
AllianceBernstein Investments, Inc. (the “Distributor”), a wholly-owned subsidiary of the Adviser, serves as the distributor of the Fund’s shares. The Distributor has advised the Fund that it has retained front-end sales charges of $33,817 from the sale of Class A shares and received $8,355, $50,423, and $21,648 in contingent deferred sales charges imposed upon redemptions by shareholders of Class A, Class B and Class C shares, respectively, for the year ended October 31, 2008.
NOTE C
Distribution Services Agreement
The Fund has adopted a Distribution Services Agreement (the “Agreement”) pursuant to Rule 12b-1 under the Investment Company Act of 1940. Under the Agreement the Fund pays a distribution fee to the Distributor at an annual rate of up to .30% of the average daily net assets attributable to Class A shares, 1% of the Fund’s average daily net assets attributable to both Class B and Class C shares, .50% of the Fund’s average daily net assets attributable to Class R shares and .25% of the Fund’s average daily net assets attributable to Class K shares. There are no distribution and servicing fees on the Advisor Class and Class I shares. The fees are accrued daily and paid monthly. The Agreement provides that the Distributor will use such payments in their entirety for distribution assistance and promotional activities. The Distributor has incurred expenses in excess of the distribution costs reimbursed by the Fund in the amounts of $33,876,921, $11,085,776, $32,504 and $6,435 for Class B, Class C, Class R and Class K shares, respectively. While such costs may be recovered from the Fund in future periods so long as the Agreement is in effect, the rate of the distribution and servicing fees payable under the Agreement may not be increased without a shareholder vote. In accordance with the Agreement, there is no provision for recovery of unreimbursed distribution costs, incurred by the Distributor, beyond the current fiscal year for Class A shares. The Agreement also provides that the Adviser may use its own resources to finance the distribution of the Fund’s shares.
NOTE D
Investment Transactions
Purchases and sales of investment securities (excluding short-term investments) for the year ended October 31, 2008, were as follows:
| | | | | | | | |
| | | Purchases | | | Sales | |
Investment securities (excluding
U.S. government securities) | | $ | 1,137,595,223 | | | $ | 585,976,185 | |
U.S. government securities | | | – 0 | – | | | – 0 | – |
The cost of investments for federal income tax purposes, gross unrealized appreciation and unrealized depreciation (excluding forward currency exchange contracts and swap contracts) are as follows:
| | | | |
Cost | | $ | 906,995,979 | |
| | | | |
Gross unrealized appreciation | | $ | 1,229,091 | |
Gross unrealized depreciation | | | (293,974,217 | ) |
| | | | |
Net unrealized depreciation | | $ | (292,745,126 | ) |
| | | | |
| | |
| ALLIANCEBERNSTEIN HIGH INCOME FUND • | | 47 |
Notes to Financial Statements
1. Forward Currency Exchange Contracts
The Fund may enter into forward currency exchange contracts in order to hedge its exposure to changes in foreign currency exchange rates on its foreign portfolio holdings, or to hedge certain firm purchase and sale commitments denominated in foreign currencies and non-hedging purposes as a means of making direct investments in foreign currencies, as described below under “Currency Transactions”. A forward currency exchange contract is a commitment to purchase or sell a foreign currency at a future date at a negotiated forward rate. The gain or loss arising from the difference between the original contract and the closing of such contract would be included in net realized gain or loss on foreign currency transactions.
Fluctuations in the value of open forward currency exchange contracts are recorded for financial reporting purposes as unrealized appreciation or depreciation by the Fund.
The Fund’s custodian will place and maintain cash not available for investment or other liquid assets in an account of the Fund having a value at least equal to the aggregate amount of the Fund’s commitments under forward currency exchange contracts entered into with respect to position hedges. Risks may arise from the potential inability of the counterparty to meet the terms of a contract and from unanticipated movements in the value of foreign currency relative to the U.S. dollar. The face or contract amount, in U.S. dollars reflects the total exposure the Fund has in that particular currency contract.
2. Option Transactions
For hedging purposes, the Fund may purchase and write (sell) put and call options on U.S. and foreign securities, including government securities and foreign currencies that are traded on U.S. and foreign securities exchanges and over-the-counter markets. The Fund may also use options transactions for non-hedging purposes as a means of making direct investments in foreign currencies, as described below under “Currency Transactions”.
The risk associated with purchasing an option is that the Fund pays a premium whether or not the option is exercised. Additionally, the Fund bears the risk of loss of the premium and change in market value should the counterparty not perform under the contract. Put and call options purchased are accounted for in the same manner as portfolio securities. The cost of securities acquired through the exercise of call options is increased by premiums paid. The proceeds from securities sold through the exercise of put options are decreased by the premiums paid.
When the Fund writes an option, the premium received by the Fund is recorded as a liability and is subsequently adjusted to the current market value of the option written. Premiums received from written options which expire unexercised are recorded by the Fund on the expiration date as realized gains from options written. The difference between the premium received and the amount paid on effecting a closing purchase transaction, including brokerage
| | |
| 48 | | • ALLIANCEBERNSTEIN HIGH INCOME FUND |
Notes to Financial Statements
commissions, is also treated as a realized gain, or if the premium received is less than the amount paid for the closing purchase transaction, as a realized loss. If a call option is exercised, the premium received is added to the proceeds from the sale of the underlying security or currency in determining whether the Fund has realized a gain or loss. If a put option is exercised, the premium received reduces the cost basis of the security or currency purchased by the Fund. In writing an option, the Fund bears the market risk of an unfavorable change in the price of the security or currency underlying the written option. Exercise of an option written by the Fund could result in the Fund’s selling or buying a security or currency at a price different from the current market value.
For the year ended October 31, 2008, the Fund had no transactions in written options.
3. Swap Agreements
The Fund may enter into swaps to hedge its exposure to interest rates, credit risk or currencies. The Fund may also enter into swaps for non-hedging purposes as a means of making direct investments in foreign currencies, as described below under “Currency Transactions”. A swap is an agreement that obligates two parties to exchange a series of cash flows at specified intervals based upon or calculated by reference to changes in specified prices or rates for a specified amount of an underlying asset. The payment flows are usually netted against each other, with the difference being paid by one party to the other.
Risks may arise as a result of the failure of the counterparty to the swap contract to comply with the terms of the swap contract. The loss incurred by the failure of a counterparty is generally limited to the net interim payment to be received by the Fund, and/or the termination value at the end of the contract. Therefore, the Fund considers the creditworthiness of each counterparty to a swap contract in evaluating potential credit risk. Additionally, risks may arise from unanticipated movements in interest rates or in the value of the underlying securities.
The Fund accrues for the interim payments on swap contracts on a daily basis, with the net amount recorded within unrealized appreciation/depreciation of swap contracts on the statement of assets and liabilities. Once the interim payments are settled in cash, the net amount is recorded as realized gain/loss on swaps, in addition to realized gain/loss recorded upon the termination of swap contracts on the statements of operations. Fluctuations in the value of swap contracts are recorded as a component of net change in unrealized appreciation/depreciation of investments.
The Fund may enter into credit default swaps. The Fund may purchase credit protection on the referenced obligation of the credit default swap (“Buy Contract”) or provide credit protection on the referenced obligation of the credit default swap (“Sale Contract”). A sale/(buy) in a credit default swap provides upon the occurrence of a credit event, as defined in the swap agreement,
| | |
| ALLIANCEBERNSTEIN HIGH INCOME FUND • | | 49 |
Notes to Financial Statements
for the Fund to buy/(sell) from/(to) the counterparty at the notional amount (the “Notional Amount”) and receive/(deliver) the principal amount of the referenced obligation. If a credit event occurs, the maximum payout amount for a Sale Contract is limited to the Notional Amount of the swap contract (“Maximum Payout Amount”). During the term of the swap agreement, the Fund receives/(pays) fixed payments from/(to) the respective counterparty, calculated at the agreed upon interest rate applied to the Notional Amount. These interim payments are recorded within unrealized appreciation/depreciation of swap contracts on the statement of assets and liabilities.
Credit default swaps may involve greater risks than if a Fund had invested in the referenced obligation directly. Credit default swaps are subject to general market risk, liquidity risk, counterparty risk and credit risk. If the Fund is a buyer and no credit event occurs, it will lose its investment. In addition, if the Fund is a seller and a credit event occurs, the value of the referenced obligation received by the Fund coupled with the periodic payments previously received, may be less than the Maximum Payout Amount it pays to the buyer, resulting in a loss to the Fund.
At October 31, 2008, the Fund had Sale Contracts outstanding with Maximum Payout Amounts aggregating $22,450,000, with net unrealized depreciation of $(1,250,678) and terms ranging from 5 months to 2 years, as reflected in the portfolio of investments.
In certain circumstances, the Fund may hold Sale Contracts on the same referenced obligation and with the same counterparty from which it has purchased credit protection, which may reduce its obligation to make payments on Sale Contracts, if a credit event occurs. At October 31, 2008, the Fund had no Buy Contracts outstanding with the same referenced obligations and same counterparties as Sale Contracts outstanding.
4. Currency Transactions
The Fund may invest in non-U.S. Dollar securities on a currency hedged or unhedged basis. The Fund may seek investment opportunities by taking long or short positions in currencies through the use of currency-related derivatives, including forward currency exchange contracts, futures and options on futures, swaps, and options. The Fund may enter into transactions for investment opportunities when it anticipates that a foreign currency will appreciate or depreciate in value but securities denominated in that currency are not held by the Fund and do not present attractive investment opportunities. Such transactions may also be used when the Adviser believes that it may be more efficient than a direct investment in a foreign currency-denominated security. The Fund may also conduct currency exchange contracts on a spot basis (i.e., for cash at the spot rate prevailing in the currency exchange market for buying or selling currencies).
5. Reverse Repurchase Agreements
Under a reverse repurchase agreement, the Fund sells securities and agrees to repurchase them at a mutually agreed upon date and price. At the time the Fund
| | |
| 50 | | • ALLIANCEBERNSTEIN HIGH INCOME FUND |
Notes to Financial Statements
enters into a reverse repurchase agreement, it will establish a segregated account with the custodian containing liquid assets having a value at least equal to the repurchase price.
For the year ended October 31, 2008, the average amount of reverse repurchase agreements outstanding was $18,988,521 and the daily weighted average interest rate was 2.29%.
NOTE E
Capital Stock
Each class consists of 3,000,000,000 authorized shares. Transactions in capital shares for each class were as follows:
| | | | | | | | | | | | | | | | | | |
| | | | | | | | | | | | | | | | | | |
| | | Shares | | | | | Amount | | | |
| | | Year Ended
October 31,
2008 | | | Year Ended
October 31,
2007 | | | | | Year Ended
October 31,
2008 | | | Year Ended
October 31,
2007 | | | |
| | | | | |
| Class A | | | | | | | | | | | | | | | | | | |
Shares sold | | 11,780,467 | | | 16,257,643 | | | | | $ | 96,299,338 | | | $ | 144,048,619 | | | |
| | | | |
Shares issued in reinvestment of dividends and distributions | | 4.279,159 | | | 2,120,728 | | | | | | 34,483,748 | | | | 18,776,774 | | | |
| | | | |
Shares converted from Class B | | 3,280,213 | | | 823,902 | | | | | | 26,679,696 | | | | 7,276,687 | | | |
| | | | |
Shares issued in connection with the acquisition of High Yield Fund and Corporate Bond Portfolio | | 60,482,629 | | | – 0 | – | | | | | 515,229,751 | | | | – 0 | – | | |
| | | | |
Shares redeemed | | (34,064,045 | ) | | (14,241,600 | ) | | | | | (273,928,589 | ) | | | (125,180,713 | ) | | |
| | | | |
Net increase | | 45,758,423 | | | 4,960,673 | | | | | $ | 398,763,944 | | | $ | 44,921,367 | | | |
| | | | |
| | | | | | | | | | | | | | | | | | |
| Class B | | | | | | | | | | | | | | | | | | |
Shares sold | | 859,088 | | | 562,014 | | | | | $ | 7,038,599 | | | $ | 5,019,126 | | | |
| | | | |
Shares issued in reinvestment of dividends and distributions | | 495,659 | | | 290,330 | | | | | | 4,045,564 | | | | 2,592,296 | | | |
| | | | |
Shares issued in connection with the acquisition of High Yield Fund and Corporate Bond Portfolio | | 10,243,982 | | | – 0 | – | | | | | 88,036,037 | | | | – 0 | – | | |
| | | | |
Shares converted to Class A | | (3,251,905 | ) | | (816,644 | ) | | | | | (26,679,696 | ) | | | (7,276,687 | ) | | |
| | | | |
Shares redeemed | | (2,927,704 | ) | | (1,169,028 | ) | | | | | (23,418,204 | ) | | | (10,432,639 | ) | | |
| | | | |
Net increase (decrease) | | 5,419,120 | | | (1,133,328 | ) | | | | $ | 49,022,300 | | | $ | (10,097,904 | ) | | |
| | | | |
| | |
| ALLIANCEBERNSTEIN HIGH INCOME FUND • | | 51 |
Notes to Financial Statements
| | | | | | | | | | | | | | | | | | |
| | | Shares | | | | | Amount | | | |
| | | Year Ended
October 31,
2008 | | | Year Ended
October 31,
2007 | | | | | Year Ended
October 31,
2008 | | | Year Ended
October 31,
2007 | | | |
| | | | | |
| Class C | | | | | | | | | | | | | | | | | | |
Shares sold | | 2,371,662 | | | 1,881,699 | | | | | $ | 19,204,494 | | | $ | 16,866,412 | | | |
| | | | |
Shares issued in reinvestment of dividends and distributions | | 1,024,869 | | | 617,737 | | | | | | 8,399,773 | | | | 5,526,724 | | | |
| | | | |
Shares issued in connection with the acquisition of High Yield Fund and Corporate Bond Portfolio | | 12,711,364 | | | – 0 | – | | | | | 109,457,204 | | | | – 0 | – | | |
| | | | |
Shares redeemed | | (6,581,399 | ) | | (2,717,636 | ) | | | | | (52,284,854 | ) | | | (24,243,566 | ) | | |
| | | | |
Net increase (decrease) | | 9,526,496 | | | (218,200 | ) | | | | $ | 84,776,617 | | | $ | (1,850,430 | ) | | |
| | | | |
| | | | | | | | | | | | | | | |
| | | | | | | | | | | | | | | |
| | | Shares | | | | Amount | | |
| | | January 25,
2008(a) to
October 31,
2008 | | | | | | | January 25,
2008(a) to
October 31,
2008 | | | | | |
| | | | |
| Advisor Class | | | | | | | | | | | | | | | |
Shares sold | | 559,030 | | | | | | | $ | 4,665,096 | | | | | |
| | | |
Shares issued in reinvestment of dividends | | 68,684 | | | | | | | | 543,259 | | | | | |
| | | |
Shares issued in connection with the acquisition of High Yield Fund and Corporate Bond Portfolio | | 1,098,165 | | | | | | | | 9,357,137 | | | | | |
| | | |
Shares redeemed | | (685,549 | ) | | | | | | | (5,435,863 | ) | | | | |
| | | |
Net increase (decrease) | | 1,040,330 | | | | | | | $ | 9,129,629 | | | | | |
| | | |
| | | | | | | | | | | | | | | |
| Class R | | | | | | | | | | | | | | | |
Shares sold | | 112,719 | | | | | | | $ | 912,581 | | | | | |
| | | |
Shares issued in reinvestment of dividends | | 14,166 | | | | | | | | 111,264 | | | | | |
| | | |
Shares issued in connection with the acquisition of High Yield Fund and Corporate Bond Portfolio | | 250,536 | | | | | | | | 2,134,664 | | | | | |
| | | |
Shares redeemed | | (130,791 | ) | | | | | | | (1,052,319 | ) | | | | |
| | | |
Net increase | | 246,630 | | | | | | | $ | 2,106,190 | | | | | |
| | | |
| | |
| 52 | | • ALLIANCEBERNSTEIN HIGH INCOME FUND |
Notes to Financial Statements
| | | | | | | | | | | | | | | |
| | | Shares | | | | Amount | | |
| | | January 25,
2008(a) to
October 31,
2008 | | | | | | | January 25,
2008(a) to
October 31,
2008 | | | | | |
| | | | |
| Class K | | | | | | | | | | | | | | | |
Shares sold | | 66,285 | | | | | | | $ | 543,316 | | | | | |
| | | |
Shares issued in reinvestment of dividends | | 5,519 | | | | | | | | 42,481 | | | | | |
| | | |
Shares issued in connection with the acquisition of High Yield Fund and Corporate Bond Portfolio | | 66,772 | | | | | | | | 568,843 | | | | | |
| | | |
Shares redeemed | | (9,925 | ) | | | | | | | (79,882 | ) | | | | |
| | | |
Net increase | | 128,651 | | | | | | | $ | 1,074,758 | | | | | |
| | | |
| | | | | | | | | | | | | | | |
| Class I | | | | | | | | | | | | | | | |
Shares sold | | 1,102 | | | | | | | $ | 8,674 | | | | | |
| | | |
Shares issued in reinvestment of dividends | | 1,782 | | | | | | | | 14,084 | | | | | |
| | | |
Shares issued in connection with the acquisition of High Yield Fund and Corporate Bond Portfolio | | 33,456 | | | | | | | | 285,128 | | | | | |
| | | |
Shares redeemed | | (8,238 | ) | | | | | | | (69,394 | ) | | | | |
| | | |
Net increase | | 28,102 | | | | | | | $ | 238,492 | | | | | |
| | | |
(a) | Commencement of distribution. |
NOTE F
Risks Involved in Investing in the Fund
Interest Rate Risk and Credit Risk—Interest rate risk is the risk that changes in interest rates will affect the value of the Fund’s investments in fixed-income debt securities such as bonds or notes. Increases in interest rates may cause the value of the Fund’s investments to decline. Credit risk is the risk that the issuer or guarantor of a debt security, or the counterparty to a derivative contract, will be unable or unwilling to make timely principal and/or interest payments, or to otherwise honor its obligations. The degree of risk for a particular security may be reflected in its credit risk rating. Credit risk is greater for medium quality and lower-rated securities. Lower-rated debt securities and similar unrated securities (commonly known as “junk bonds”) have speculative elements or are predominantly speculative risks.
| | |
| ALLIANCEBERNSTEIN HIGH INCOME FUND • | | 53 |
Notes to Financial Statements
Currency Risk—This is the risk that changes in foreign currency exchange rates may negatively affect the value of the Fund’s investments or reduce the returns of the Fund. For example, the value of the Fund’s investments in foreign currency-denominated securities or currencies may decrease if the U.S. Dollar is strong (i.e., gaining value relative to other currencies) and other currencies are weak (i.e., losing value relative to the U.S. Dollar). Currency markets are generally not as regulated as securities markets. Independent of the Fund’s investments in securities denominated in foreign currencies, the Fund’s positions in various foreign currencies may cause the Fund to experience investment losses due to the changes in exchange rates and interest rates.
Foreign Securities Risk—Investing in securities of foreign companies and foreign governments involves special risks which include changes in foreign currency exchange rates and the possibility of future political and economic developments which could adversely affect the value of such securities. Moreover, securities of many foreign companies and foreign governments and their markets may be less liquid and their prices more volatile than those of comparable U.S. companies and the U.S. government. The Fund invests in the Sovereign Debt Obligations of countries that are considered emerging market countries at the time of purchase. Therefore, the Fund is susceptible to governmental factors and economic and debt restructuring developments adversely affecting the economies of these emerging market countries. In addition, these debt obligations may be less liquid and subject to greater volatility than debt obligations of more developed countries.
Leverage Risk—When the Fund borrows money or otherwise leverages its portfolio, it may be volatile because leverage tends to exaggerate the effect of any increase or decrease in the value of the Fund’s investments. The Fund may create leverage through the use of reverse repurchase arrangements, forward currency exchange contracts, forward commitments, dollar rolls or futures contracts or by borrowing money.
Indemnification Risk—In the ordinary course of business, the Fund enters into contracts that contain a variety of indemnifications. The Fund’s maximum exposure under these arrangements is unknown. However, the Fund has not had prior claims or losses pursuant to these indemnification provisions and expects the risk of loss thereunder to be remote.
NOTE G
Joint Credit Facility
A number of open-end mutual funds managed by the Adviser, including the Fund, participate in a $250 million revolving credit facility (the “Facility”) intended to provide short-term financing if necessary, subject to certain restrictions, in connection with abnormal redemption activity. Commitment fees related to the Facility are paid by the participating funds and are included in
| | |
| 54 | | • ALLIANCEBERNSTEIN HIGH INCOME FUND |
Notes to Financial Statements
miscellaneous expenses in the statement of operations. The Fund did not utilize the Facility during the year ended October 31, 2008.
NOTE H
Acquisition of AllianceBernstein High Yield Fund, Inc. and AllianceBernstein Bond Fund, Inc.—Corporate Bond Portfolio by AllianceBernstein High Income Fund, Inc. (the “Fund”)
On January 25, 2008, the Fund acquired all of the net assets and assumed all of the liabilities of AllianceBernstein High Yield Fund, Inc. (“High Yield”) and AllianceBernstein Bond Fund, Inc.—Corporate Bond Portfolio (“Corporate Bond”) in a tax free event, pursuant to an Agreement and Plan of Acquisition and Liquidation approved by the shareholders of High Yield and Corporate Bond. As a result of the acquisition, shareholders of High Yield and Corporate Bond received shares of the Fund equivalent to the aggregate net asset value of the shares they held in their respective Funds. On January 25, 2008, the acquisition was accomplished by a tax-free exchange of 84,886,904 shares of the Fund for 17,310,493 shares of High Yield and 67,576,410 shares of Corporate Bond. The aggregate net assets of the Fund, High Yield and Corporate Bond immediately before the acquisition were $361,090,616, $148,024,567 and $577,044,197 (including $20,170,950 for High Yield and $7,144,610 for Corporate Bond, of net unrealized depreciation of investments and foreign currency denominated assets and liabilities), respectively. Immediately after the acquisitions, the combined net assets of the Fund amounted to $1,086,159,380.
NOTE I
Distributions to Shareholders
The tax character of distributions paid during the fiscal years ended October 31, 2008 and October 31, 2007 were as follows:
| | | | | | |
| | | Year Ended
October 31,
2008 | | Year Ended
October 31,
2007 |
Distributions paid from: | | | | | | |
Ordinary income | | $ | 65,448,408 | | $ | 27,212,303 |
Net long-term capital gains | | | 7,054,255 | | | 11,953,275 |
| | | | | | |
Total taxable distributions | | | 72,502,663 | | | 39,165,578 |
| | | | | | |
Total distributions paid | | $ | 72,502,663 | | $ | 39,165,578 |
| | | | | | |
As of October 31, 2008, the components of accumulated earnings/(deficit) on a tax basis were as follows:
| | | | |
Undistributed ordinary income | | $ | 3,480,671 | |
Accumulated capital and other losses | | | (251,604,485 | )(a) |
Unrealized appreciation/(depreciation) | | | (293,074,806 | )(b) |
| | | | |
Total accumulated earnings/(deficit) | | $ | (541,198,620 | )(c) |
| | | | |
(a) | On October 31, 2008, the Fund had a net capital loss carryforward for federal income tax purposes of $251,604,485 (of which approximately $136,186,180 and $97,831,667, respectively, were attributable to the purchase of net assets of the AllianceBernstein Bond |
| | |
| ALLIANCEBERNSTEIN HIGH INCOME FUND • | | 55 |
Notes to Financial Statements
| | Fund Inc.-Corporate Bond Portfolio and AllianceBernstein High Yield Fund, Inc., respectively) of which $215,000,738 expires in the year 2009, $4,663,406 expires in the year 2010, $2,851,070 expires in the year 2012, $9,578,438 expires in the year 2013, $1,924,195 expires in the year 2015 and $17,586,638 expires in the year 2016. During the fiscal year, the Fund had capital loss carryforwards expire of $190,687,365. To the extent future capital gains are offset by capital loss carryforwards, such gains will not be distributed. As a result of the acquisition of AllianceBernstein Bond Fund Inc.-Corporate Bond Portfolio and AllianceBernstein High Yield Fund, Inc, by the Fund, various limitations and reductions regarding the future utilization of certain capital loss carryforwards were applied, based on certain provisions in the Internal Revenue Code. |
(b) | The differences between book-basis and tax-basis unrealized appreciation/(depreciation) are attributable primarily to the tax deferral of losses on wash sales, the difference between book and tax amortization methods for premium, the difference between book and tax treatment of swap income, and the realization for tax purposes of gains/losses on certain derivative instruments. |
(c) | The difference between book-basis and tax-basis components of accumulated earnings/ (deficit) is attributable to dividends payable. |
| | During the current fiscal year, permanent differences primarily due to the tax treatment of swap income, paydown reclassification, foreign currency reclassification, premium adjustment, capital loss carryforward expiration, distribution reclassification, and merger related adjustments resulted in a net decrease in distributions in excess of net investment income, a net increase in accumulated net realized loss on investment transactions and foreign currency transactions, and a net increase to additional paid in capital. This reclassification had no effect on net assets. |
NOTE J
Legal Proceedings
On October 2, 2003, a purported class action complaint entitled Hindo, et al. v. AllianceBernstein Growth & Income Fund, et al. (“Hindo Complaint”) was filed against the Adviser, Alliance Capital Management Holding L.P. (“Alliance Holding”), Alliance Capital Management Corporation, AXA Financial, Inc., the AllianceBernstein Funds, certain officers of the Adviser (“AllianceBernstein defendants”), and certain other unaffiliated defendants, as well as unnamed Doe defendants. The Hindo Complaint was filed in the United States District Court for the Southern District of New York by alleged shareholders of two of the AllianceBernstein Funds. The Hindo Complaint alleges that certain of the AllianceBernstein defendants failed to disclose that they improperly allowed certain hedge funds and other unidentified parties to engage in “late trading” and “market timing” of AllianceBernstein Fund securities, violating Sections 11 and 15 of the Securities Act, Sections 10(b) and 20(a) of the Exchange Act and Sections 206 and 215 of the Advisers Act. Plaintiffs seek an unspecified amount of compensatory damages and rescission of their contracts with the Adviser, including recovery of all fees paid to the Adviser pursuant to such contracts.
Following October 2, 2003, 43 additional lawsuits making factual allegations generally similar to those in the Hindo Complaint were filed in various federal and state courts against the Adviser and certain other defendants. On September 29, 2004, plaintiffs filed consolidated amended complaints with respect to four claim types: mutual fund shareholder claims; mutual fund derivative claims; derivative claims brought on behalf of Alliance Holding; and claims
| | |
| 56 | | • ALLIANCEBERNSTEIN HIGH INCOME FUND |
Notes to Financial Statements
brought under ERISA by participants in the Profit Sharing Plan for Employees of the Adviser. All four complaints include substantially identical factual allegations, which appear to be based in large part on the Order of the SEC dated December 18, 2003 as amended and restated January 15, 2004 (“SEC Order”) and the New York State Attorney General Assurance of Discontinuance dated September 1, 2004 (“NYAG Order”).
On April 21, 2006, the Adviser and attorneys for the plaintiffs in the mutual fund shareholder claims, mutual fund derivative claims, and ERISA claims entered into a confidential memorandum of understanding containing their agreement to settle these claims. The agreement will be documented by a stipulation of settlement and will be submitted for court approval at a later date. The settlement amount ($30 million), which the Adviser previously accrued and disclosed, has been disbursed. The derivative claims brought on behalf of Alliance Holding, in which plaintiffs seek an unspecified amount of damages, remain pending.
It is possible that these matters and/or other developments resulting from these matters could result in increased redemptions of the AllianceBernstein Mutual Funds’ shares or other adverse consequences to the AllianceBernstein Mutual Funds. This may require the AllianceBernstein Mutual Funds to sell investments held by those funds to provide for sufficient liquidity and could also have an adverse effect on the investment performance of the AllianceBernstein Mutual Funds. However, the Adviser believes that these matters are not likely to have a material adverse effect on its ability to perform advisory services relating to the AllianceBernstein Mutual Funds.
NOTE K
Recent Accounting Pronouncements
On September 20, 2006, the FASB released Statement of Financial Accounting Standards No. 157 “Fair Value Measurements” (“FAS 157”). FAS 157 establishes an authoritative definition of fair value, sets out a framework for measuring fair value, and requires additional disclosures about fair-value measurements. The application of FAS 157 is required for fiscal years beginning after November 15, 2007 and interim periods within those fiscal years. As of October 31, 2008, management believes the adoption of FAS 157 will not impact the amounts reported in the financial statements. However, additional disclosures will be required.
On March 19, 2008, the FASB released Statement of Financial Accounting Standards No. 161, “Disclosures about Derivative Instruments and Hedging Activities” (“FAS 161”). FAS 161 requires qualitative disclosures about objectives and strategies for using derivatives, quantitative disclosures about fair value amounts of and gains and losses on derivative instruments, and disclosures about credit-risk-related contingent features in derivative agreements. The application of FAS 161 is required for fiscal years beginning after November 15, 2008 and interim periods within those fiscal years. At this time, management is evaluating the implications of FAS 161 and believes the adoption of FAS 161 will have no material impact on its financial statements.
| | |
| ALLIANCEBERNSTEIN HIGH INCOME FUND • | | 57 |
Notes to Financial Statements
NOTE L
Subsequent Event
Effective January 31, 2009, sales of Class B shares of the Fund to new investors will be suspended. Class B shares will only be issued (i) upon the exchange of Class B shares from another AllianceBernstein Fund, (ii) for purposes of dividend reinvestment, (iii) through the Fund’s Automatic Investment Program (the “Program”) for accounts that established the Program prior to January 31, 2009, and (iv) for purchases of additional shares by Class B shareholders as of January 31, 2009. The ability to establish a new Automatic Investment Program for accounts containing Class B shares will be suspended as of January 31, 2009.
| | |
| 58 | | • ALLIANCEBERNSTEIN HIGH INCOME FUND |
Notes to Financial Statements
FINANCIAL HIGHLIGHTS
Selected Data For A Share Of Capital Stock Outstanding Throughout Each Period
| | | | | | | | | | | | | | | |
| | | Class A | |
| | | Year Ended October 31, | |
| | | 2008 | | | 2007 | | | 2006 | | | 2005 | | | 2004(a) | |
| | | | | | |
| | | | | | | | | | | | | | | |
Net asset value, beginning of period | | $ 9.02 | | | $ 8.97 | | | $ 8.70 | | | $ 8.38 | | | $ 8.00 | |
| | | |
Income From Investment Operations | | | | | | | | | | | | | | | |
Net investment income(b) | | .61 | (c) | | .56 | | | .55 | | | .53 | | | .49 | (c) |
Net realized and unrealized gain (loss) on investment transactions | | (2.87 | ) | | .41 | | | .43 | | | .34 | | | .50 | |
Contribution from Adviser | | .00 | (d) | | – 0 | – | | – 0 | – | | – 0 | – | | – 0 | – |
| | | |
Net increase (decrease) in net asset value from operations | | (2.26 | ) | | .97 | | | .98 | | | .87 | | | .99 | |
| | | |
Less: Dividends and Distributions | | | | | | | | | | | | | | | |
Dividends from net investment income | | (.68 | ) | | (.57 | ) | | (.57 | ) | | (.55 | ) | | (.61 | ) |
Distribution from net realized gain on investment transactions | | (.23 | ) | | (.35 | ) | | (.14 | ) | | – 0 | – | | – 0 | – |
| | | |
Total dividends and distributions | | (.91 | ) | | (.92 | ) | | (.71 | ) | | (.55 | ) | | (.61 | ) |
| | | |
Net asset value, end of period | | $ 5.85 | | | $ 9.02 | | | $ 8.97 | | | $ 8.70 | | | $ 8.38 | |
| | | |
Total Return | | | | | | | | | | | | | | | |
Total investment return based on net asset value(e) | | (27.49 | )%* | | 11.54 | % | | 11.87 | % | | 10.70 | % | | 12.82 | % |
Ratios/Supplemental Data | | | | | | | | | | | | | | | |
Net assets, end of period (000’s omitted) | | $450,517 | | | $281,677 | | | $235,763 | | | $213,652 | | | $156,469 | |
Ratio to average net assets of: | | | | | | | | | | | | | | | |
Expenses, net of waivers/ reimbursements | | 1.03 | %** | | 1.41 | %** | | 1.48 | % | | 1.20 | % | | 1.23 | % |
Expenses, before waivers/ reimbursements | | 1.13 | %** | | 1.41 | %** | | 1.48 | % | | 1.20 | % | | 1.40 | % |
Expenses, before waivers/ reimbursements, excluding interest expense | | 1.07 | %** | | 1.14 | %** | | 1.14 | % | | 1.19 | % | | 1.21 | % |
Net investment income | | 7.65 | %(c)** | | 6.24 | %** | | 6.32 | % | | 6.14 | % | | 6.04 | %(c) |
Portfolio turnover rate | | 74 | % | | 67 | % | | 75 | % | | 100 | % | | 173 | % |
See footnote summary on page 65.
| | |
| ALLIANCEBERNSTEIN HIGH INCOME FUND • | | 59 |
Financial Highlights
Selected Data For A Share Of Capital Stock Outstanding Throughout Each Period
| | | | | | | | | | | | | | | |
| | | Class B | |
| | | Year Ended October 31, | |
| | | 2008 | | | 2007 | | | 2006 | | | 2005 | | | 2004(a) | |
| | | |
| | | | | | | | | | | | | | | |
Net asset value, beginning of period | | $ 9.09 | | | $ 9.05 | | | $ 8.77 | | | $ 8.45 | | | $ 8.07 | |
| | | |
Income From Investment Operations | | | | | | | | | | | | | | | |
Net investment income(b) | | .55 | (c) | | .49 | | | .49 | | | .47 | | | .62 | (c) |
Net realized and unrealized gain (loss) on investment transactions | | (2.89 | ) | | .41 | | | .44 | | | .34 | | | .32 | |
Contribution from Adviser | | .00 | (d) | | – 0 | – | | – 0 | – | | – 0 | – | | – 0 | – |
| | | |
Net increase (decrease) in net asset value from operations | | (2.34 | ) | | .90 | | | .93 | | | .81 | | | .94 | |
| | | |
Less: Dividends and Distributions | | | | | | | | | | | | | | | |
Dividends from net investment income | | (.62 | ) | | (.51 | ) | | (.51 | ) | | (.49 | ) | | (.56 | ) |
Distribution from net realized gain on investment transactions | | (.23 | ) | | (.35 | ) | | (.14 | ) | | – 0 | – | | – 0 | – |
| | | |
Total dividends and distributions | | (.85 | ) | | (.86 | ) | | (.65 | ) | | (.49 | ) | | (.56 | ) |
| | | |
Net asset value, end of period | | $ 5.90 | | | $ 9.09 | | | $ 9.05 | | | $ 8.77 | | | $ 8.45 | |
| | | |
Total Return | | | | | | | | | | | | | | | |
Total investment return based on net asset value(e) | | (28.03 | )%* | | 10.51 | % | | 11.11 | % | | 9.81 | % | | 12.02 | % |
Ratios/Supplemental Data | | | | | | | | | | | | | | | |
Net assets, end of period (000’s omitted) | | $54,724 | | | $35,058 | | | $45,133 | | | $53,629 | | | $61,715 | |
Ratio to average net assets of: | | | | | | | | | | | | | | | |
Expenses, net of waivers/ reimbursements | | 1.74 | %** | | 2.14 | %** | | 2.18 | % | | 1.89 | % | | 1.94 | % |
Expenses, before waivers/ reimbursements | | 1.86 | %** | | 2.14 | %** | | 2.18 | % | | 1.90 | % | | 2.11 | % |
Expenses, before waivers/ reimbursements, excluding interest expense | | 1.80 | %** | | 1.87 | %** | | 1.85 | % | | 1.89 | % | | 1.92 | % |
Net investment income | | 6.83 | %(c)** | | 5.45 | %** | | 5.55 | % | | 5.39 | % | | 7.57 | %(c) |
Portfolio turnover rate | | 74 | % | | 67 | % | | 75 | % | | 100 | % | | 173 | % |
See footnote summary on page 65.
| | |
| 60 | | • ALLIANCEBERNSTEIN HIGH INCOME FUND |
Financial Highlights
Selected Data For A Share Of Capital Stock Outstanding Throughout Each Period
| | | | | | | | | | | | | | | |
| | | Class C | |
| | | Year Ended October 31, | |
| | | 2008 | | | 2007 | | | 2006 | | | 2005 | | | 2004(a) | |
| | | | | | |
| | | | | | | | | | | | | | | |
Net asset value, beginning of period | | $ 9.11 | | | $ 9.07 | | | $ 8.79 | | | $ 8.47 | | | $ 8.09 | |
| | | |
Income From Investment Operations | | | | | | | | | | | | | | | |
Net investment income(b) | | .55 | (c) | | .49 | | | .49 | | | .47 | | | .45 | (c) |
Net realized and unrealized gain (loss) on investment transactions | | (2.89 | ) | | .41 | | | .44 | | | .34 | | | .49 | |
Contribution from Adviser | | .00 | (d) | | – 0 | – | | – 0 | – | | – 0 | – | | – 0 | – |
| | | |
Net increase (decrease) in net asset value from operations | | (2.34 | ) | | .90 | | | .93 | | | .81 | | | .94 | |
| | | |
Less: Dividends and Distributions | | | | | | | | | | | | | | | |
Dividends from net investment income | | (.62 | ) | | (.51 | ) | | (.51 | ) | | (.49 | ) | | (.56 | ) |
Distribution from net realized gain on investment transactions | | (.23 | ) | | (.35 | ) | | (.14 | ) | | – 0 | – | | – 0 | – |
| | | |
Total dividends and distributions | | (.85 | ) | | (.86 | ) | | (.65 | ) | | (.49 | ) | | (.56 | ) |
| | | |
Net asset value, end of period | | $ 5.92 | | | $ 9.11 | | | $ 9.07 | | | $ 8.79 | | | $ 8.47 | |
| | | |
Total Return | | | | | | | | | | | | | | | |
Total investment return based on net asset value(e) | | (27.95 | )%* | | 10.50 | % | | 11.10 | % | | 9.81 | % | | 12.00 | % |
Ratios/Supplemental Data | | | | | | | | | | | | | | | |
Net assets, end of period (000’s omitted) | | $112,508 | | | $86,525 | | | $88,046 | | | $91,662 | | | $82,876 | |
Ratio to average net assets of: | | | | | | | | | | | | | | | |
Expenses, net of waivers/reimbursements | | 1.75 | %** | | 2.11 | %** | | 2.17 | % | | 1.89 | % | | 1.92 | % |
Expenses, before waivers/reimbursements | | 1.84 | %** | | 2.11 | %** | | 2.17 | % | | 1.89 | % | | 2.09 | % |
Expenses, before waivers/reimbursements, excluding interest expense | | 1.77 | %** | | 1.85 | %** | | 1.84 | % | | 1.88 | % | | 1.90 | % |
Net investment income | | 6.82 | %(c)** | | 5.47 | %** | | 5.54 | % | | 5.38 | % | | 5.51 | %(c) |
Portfolio turnover rate | | 74 | % | | 67 | % | | 75 | % | | 100 | % | | 173 | % |
See footnote summary on page 65.
| | |
| ALLIANCEBERNSTEIN HIGH INCOME FUND • | | 61 |
Financial Highlights
Selected Data For A Share Of Capital Stock Outstanding Throughout Each Period
| | | |
| | | Advisor
Class | |
| | | January 28,
2008(g) to
October 31,
2008 | |
Net asset value, beginning of period | | $ 8.52 | |
| | | |
Income From Investment Operations | | | |
Net investment income(b)(c) | | .52 | |
Net realized and unrealized loss on investment transactions | | (2.69 | ) |
Contribution from Adviser | | .00 | (d) |
| | | |
Net decrease in net asset value from operations | | (2.17 | ) |
| | | |
Less: Dividends | | | |
Dividends from net investment income | | (.49 | ) |
| | | |
Net asset value, end of period | | $ 5.86 | |
| | | |
Total Return | | | |
Total investment return based on net asset value(e) | | (26.77 | )%* |
Ratios/Supplemental Data | | | |
Net assets, end of period (000’s omitted) | | $6,095 | |
Ratio to average net assets of: | | | |
Expenses, net of waivers/ reimbursements | | .69 | %(f)** |
Expenses, before waivers/ reimbursements | | .80 | %(f)** |
Expenses, before waivers/ reimbursements, excluding interest
expense | | .76 | %(f)** |
Net investment income | | 8.16 | %(c)(f)** |
Portfolio turnover rate | | 74 | % |
See footnote summary on page 65.
| | |
| 62 | | • ALLIANCEBERNSTEIN HIGH INCOME FUND |
Financial Highlights
Selected Data For A Share Of Capital Stock Outstanding Throughout Each Period
| | | |
| | | Class R | |
| | | January 28,
2008(g) to
October 31,
2008 | |
Net asset value, beginning of period | | $ 8.52 | |
| | | |
Income From Investment Operations | | | |
Net investment income(b)(c) | | .46 | |
Net realized and unrealized loss on investment transactions | | (2.66 | ) |
Contribution from Adviser | | .00 | (d) |
| | | |
Net decrease in net asset value from operations | | (2.20 | ) |
| | | |
Less: Dividends | | | |
Dividends from net investment income | | (.47 | ) |
| | | |
Net asset value, end of period | | $ 5.85 | |
| | | |
Total Return | | | |
Total investment return based on net asset value(e) | | (27.09 | )%* |
Ratios/Supplemental Data | | | |
Net assets, end of period (000’s omitted) | | $1,443 | |
Ratio to average net assets of: | | | |
Expenses, net of waivers/reimbursements | | 1.18 | %(f)** |
Expenses, before waivers/reimbursements | | 1.43 | %(f)** |
Expenses, before waivers/reimbursements, excluding interest
expense | | 1.40 | %(f)** |
Net investment income | | 7.62 | %(c)(f)** |
Portfolio turnover rate | | 74 | % |
See footnote summary on page 65.
| | |
| ALLIANCEBERNSTEIN HIGH INCOME FUND • | | 63 |
Financial Highlights
Selected Data For A Share Of Capital Stock Outstanding Throughout Each Period
| | | |
| | | Class K | |
| | | January 28,
2008(g) to
October 31,
2008 | |
Net asset value, beginning of period | | $ 8.52 | |
| | | |
Income From Investment Operations | | | |
Net investment income(b)(c) | | .47 | |
Net realized and unrealized loss on investment transactions | | (2.66 | ) |
Contribution from Adviser | | .00 | (d) |
| | | |
Net decrease in net asset value from operations | | (2.19 | ) |
| | | |
Less: Dividends | | | |
Dividends from net investment income | | (.48 | ) |
| | | |
Net asset value, end of period | | $ 5.85 | |
| | | |
Total Return | | | |
Total investment return based on net asset value(e) | | (26.94 | )%* |
Ratios/Supplemental Data | | | |
Net assets, end of period (000’s omitted) | | $753 | |
Ratio to average net assets of: | | | |
Expenses, net of waivers/ reimbursements | | .93 | %(f)** |
Expenses, before waivers/reimbursements | | 1.12 | %(f)** |
Expenses, before waivers/ reimbursements, excluding interest
expense | | 1.09 | %(f)** |
Net investment income | | 8.01 | %(c)(f)** |
Portfolio turnover rate | | 74 | % |
See footnote summary on page 65.
| | |
| 64 | | • ALLIANCEBERNSTEIN HIGH INCOME FUND |
Financial Highlights
Selected Data For A Share Of Capital Stock Outstanding Throughout Each Period
| | | |
| | | Class I | |
| | | January 28,
2008(g) to
October 31,
2008 | |
Net asset value, beginning of period | | $ 8.52 | |
| | | |
Income From Investment Operations | | | |
Net investment income(b)(c) | | .49 | |
Net realized and unrealized loss on investment transactions | | (2.67 | ) |
Contribution from Adviser | | .00 | (d) |
| | | |
Net decrease in net asset value from operations | | (2.18 | ) |
| | | |
Less: Dividends | | | |
Dividends from net investment income | | (.49 | ) |
| | | |
Net asset value, end of period | | $ 5.85 | |
| | | |
Total Return | | | |
Total investment return based on net asset value(e) | | (26.84 | )%* |
Ratios/Supplemental Data | | | |
Net assets, end of period (000’s omitted) | | $165 | |
Ratio to average net assets of: | | | |
Expenses, net of waivers/ reimbursements | | .69 | %(f)** |
Expenses, before waivers/ reimbursements | | .79 | %(f)** |
Expenses, before waivers/ reimbursements, excluding interest
expense | | .75 | %(f)** |
Net investment income | | 8.09 | %(c)(f)** |
Portfolio turnover rate | | 74 | % |
| (a) | As of November 1, 2003, the Fund has adopted the method of accounting for interim payments on swap contracts in accordance with Financial Accounting Standards Board Statement No. 133. These interim payments are reflected within net realized and unrealized gain (loss) on swap contracts, however prior to November 1, 2003, these interim payments were reflected within interest income/expense on the statement of operations. The effect of this change for the year ended October 31, 2004, was to decrease net investment income per share by $.05, $.04 and $.05 and increase net realized and unrealized gain (loss) on investment transactions per share by $.05, $.04 and $.05 for Class A, Class B and Class C, respectively. Consequently, the ratios of net investment income to average net assets were decreased by 0.56%, 0.57% and 0.55% for Class A, Class B and Class C, respectively. |
| (b) | Based on average shares outstanding. |
| (c) | Net of expenses waived/reimbursed by the Adviser. |
| (d) | Amount less than $0.005. |
| (e) | Total investment return is calculated assuming an initial investment made at the net asset value at the beginning of the year, reinvestment of all dividends and distributions at net asset value during the year, and redemption on the last day of the year. Initial sales charge or contingent deferred sales charge is not reflected in the calculation of total investment return. Total return does not reflect the deduction of taxes that a shareholder would pay on Fund distributions or the redemption of Fund shares. Total investment return calculated for a period of less than one year is not annualized. |
| (g) | Commencement of distribution. |
| * | Includes the impact of proceeds received, and credited to the Fund resulting from class action settlements, which enhanced the performance of each share class for the year ended October 31, 2008 by .41%. |
| ** | The ratio includes expenses attributable to costs of proxy solicitation. |
See notes to financial statements.
| | |
| ALLIANCEBERNSTEIN HIGH INCOME FUND • | | 65 |
Financial Highlights
REPORT OF INDEPENDENT REGISTERED
PUBLIC ACCOUNTING FIRM
To the Shareholders and Board of Directors of AllianceBernstein High Income Fund, Inc.
We have audited the accompanying statement of assets and liabilities of AllianceBernstein High Income Fund, Inc. (the “Fund”) (formerly AllianceBernstein Emerging Market Debt Fund, Inc.), including the portfolio of investments, as of October 31, 2008, and the related statement of operations for the year then ended, and the statement of changes in net assets for each of the two years in the period then ended and the financial highlights for each of the periods indicated therein. These financial statements and financial highlights are the responsibility of the Fund’s management. Our responsibility is to express an opinion on these financial statements and financial highlights based on our audits.
We conducted our audits in accordance with the standards of the Public Company Accounting Oversight Board (United States). Those standards require that we plan and perform the audit to obtain reasonable assurance about whether the financial statements and financial highlights are free of material misstatement. We were not engaged to perform an audit of the Fund’s internal control over financial reporting. Our audits included consideration of internal control over financial reporting as a basis for designing audit procedures that are appropriate in the circumstances, but not for the purpose of expressing an opinion on the effectiveness of the Fund’s internal control over financial reporting. Accordingly, we express no such opinion. An audit also includes examining, on a test basis, evidence supporting the amounts and disclosures in the financial statements and financial highlights, assessing the accounting principles used and significant estimates made by management, and evaluating the overall financial statement presentation. Our procedures included confirmation of securities owned as of October 31, 2008 by correspondence with the custodian and others, or by other appropriate auditing procedures where replies from others were not received. We believe that our audits provide a reasonable basis for our opinion.
In our opinion, the financial statements and financial highlights referred to above present fairly, in all material respects, the financial position of AllianceBernstein High Income Fund, Inc. at October 31, 2008, the results of its operations for the year then ended, and the changes in its net assets for each of the two years in the period then ended and the financial highlights for each of the periods indicated therein, in conformity with U.S. generally accepted accounting principles.

New York, New York
December 29, 2008
| | |
| 66 | | • ALLIANCEBERNSTEIN HIGH INCOME FUND |
Report of Independent Registered Public Accounting Firm
TAX INFORMATION (unaudited)
For foreign shareholders, the Fund designates 46.0% of its ordinary dividends as qualified interest income. In addition, the Fund designates $7,054,255 as long-term capital gain dividends.
| | |
| ALLIANCEBERNSTEIN HIGH INCOME FUND • | | 67 |
Tax Information
BOARD OF DIRECTORS
| | |
| William H. Foulk, Jr.(1), Chairman | | Nancy P. Jacklin(1) |
| Marc O. Mayer | | Garry L. Moody(1) |
| John H. Dobkin(1) | | Marshall C. Turner, Jr.(1) |
| Michael J. Downey(1) | | Earl D. Weiner(1) |
| D. James Guzy(1) | | |
OFFICERS
| | |
Robert M. Keith, President and Chief Executive Officer Philip L. Kirstein, Senior Vice President and Independent Compliance Officer Paul J. DeNoon(2), Vice President Fernando Grisales(2), Vice President Gershon Distenfeld(2), Vice President | | Douglas J. Peebles(2), Vice President Matthew S. Sheridan(2), Vice President Emilie D. Wrapp, Secretary Joseph J. Mantineo, Treasurer and Chief Financial Officer Phyllis J. Clarke, Controller |
| | |
Principal Underwriter AllianceBernstein Investments, Inc. 1345 Avenue of the Americas New York, NY 10105 Custodian and Accounting Agent The Bank of New York One Wall Street New York, NY 10286 Legal Counsel Seward & Kissel LLP One Battery Park Plaza New York, NY 10004 | | Transfer Agent AllianceBernstein Investor Services, Inc. P.O. Box 786003 San Antonio, TX 78278-6003 Toll-Free (800) 221-5672 Independent Registered Public Accounting Firm Ernst & Young LLP 5 Times Square New York, NY 10036 |
| (1) | Member of the Audit Committee, the Governance and Nominating Committee and the Independent Directors Committee. Mr. Foulk is the sole member of the Fair Value Pricing Committee. |
| (2) | The day-to-day management of and investment decisions for the Fund’s portfolio are made by the Global Fixed Income Team and Global Credit Investment Team. Messrs. DeNoon, Grisales, Distenfeld, Peebles, and Sheridan are the investment professionals with the most significant responsibility for the day-to-day management of the Fund’s portfolio. |
| | |
| 68 | | • ALLIANCEBERNSTEIN HIGH INCOME FUND |
Board of Directors
MANAGEMENT OF THE FUND
Board of Directors Information
The business and affairs of the Fund are managed under the direction of the Board of Directors. Certain information concerning the Fund’s Directors is set forth below.
| | | | | | |
NAME,
ADDRESS* AND AGE
(FIRST YEAR ELECTED)** | | PRINCIPAL
OCCUPATION(S)
DURING PAST 5 YEARS | | PORTFOLIOS
IN FUND
COMPLEX
OVERSEEN BY
DIRECTOR | | OTHER
DIRECTORSHIPS
HELD BY
DIRECTOR |
| INTERESTED DIRECTOR | | | | | | |
Marc O. Mayer, *** 1345 Avenue of the Americas New York, NY 10105
51
(2003) | | Executive Vice President of AllianceBernstein L.P. (“AllianceBernstein”) since 2000 and Chief Investment Officer of Blend Solutions since June 2008. Previously, Executive Managing Director of AllianceBernstein Investments, Inc. (“ABI”) since 2003; prior thereto, he was head of AllianceBernstein Institutional Investments, a unit of AllianceBernstein, from 2001-2003. Prior to 2001, Chief Executive Officer of Sanford C. Bernstein & Co., LLC (institutional research and brokerage arm of Bernstein & Co. LLC) and its predecessor. | | 92 | | SCB Partners, Inc. and SCB Inc. |
| | | | | | |
| DISINTERESTED DIRECTORS | | | | |
William H. Foulk, Jr., #, ## Chairman of the Board 76 (1993) | | Investment Adviser and an Independent Consultant. Formerly, Senior Manager of Barrett Associates, Inc., a registered investment adviser, with which he had been associated since prior to 2003. He was formerly Deputy Comptroller and Chief Investment Officer of the State of New York and, prior thereto, Chief Investment Officer of the New York Bank for Savings. | | 94 | | None |
| | | | | | |
| | |
| ALLIANCEBERNSTEIN HIGH INCOME FUND • | | 69 |
Management of the Fund
| | | | | | |
NAME,
ADDRESS* AND AGE
(FIRST YEAR ELECTED)** | | PRINCIPAL
OCCUPATION(S)
DURING PAST 5 YEARS | | PORTFOLIOS
IN FUND
COMPLEX
OVERSEEN BY
DIRECTOR | | OTHER
DIRECTORSHIPS
HELD BY DIRECTOR |
DISINTERESTED DIRECTORS
(continued) | | | | |
John H. Dobkin, #
66
(1993) | | Consultant. Formerly, President of Save Venice, Inc. (preservation organization) from 2001-2002, Senior Advisor from June 1999-June 2000 and President of Historic Hudson Valley (historic preservation) from December 1989-May 1999. Previously, Director of the National Academy of Design. | | 92 | | None |
| | | | | | |
Michael J. Downey, #
64
(2005) | | Private Investor since January 2004. Formerly, managing partner of Lexington Capital, LLC (investment advisory firm) from December 1997 until December 2003. From 1987 until 1993, Chairman and CEO of Prudential Mutual Fund Management. | | 92 | | Asia Pacific
Fund, Inc., The Merger Fund and Prospect Acquisition Corp. (financial services) |
| | | | | | |
D. James Guzy, #
72
(2005) | | Chairman of the Board of PLX Technology (semi-conductors) and of SRC Computers, Inc., with which he has been associated since prior to 2003. | | 92 | | Intel Corporation (semi-conductors) and Cirrus Logic Corporation (semi-conductors) |
| | | | | | |
| | |
| 70 | | • ALLIANCEBERNSTEIN HIGH INCOME FUND |
Management of the Fund
| | | | | | |
NAME,
ADDRESS* AND AGE
(FIRST YEAR ELECTED)** | | PRINCIPAL
OCCUPATION(S)
DURING PAST 5 YEARS | | PORTFOLIOS
IN FUND
COMPLEX
OVERSEEN BY
DIRECTOR | | OTHER
DIRECTORSHIPS
HELD BY DIRECTOR |
DISINTERESTED DIRECTORS
(continued) | | | | |
Nancy P. Jacklin, #
60
(2006) | | Professorial lecturer at the Johns Hopkins School of Advanced International Studies and Adjunct Professor at Georgetown University Law Center in the 2008-2009 academic year. Formerly, U.S. Executive Director of the International Monetary Fund (December 2002-May 2006); Partner, Clifford Chance (1992-2002); Sector Counsel, International Banking and Finance, and Associate General Counsel, Citicorp (1985-1992); Assistant General Counsel (International), Federal Reserve Board of Governors (1982-1985); and Attorney Advisor, U.S. Department of the Treasury (1973-1982). Member of the Bar of the District of Columbia and of New York; and member of the Council on Foreign Relations. | | 92 | | None |
| | | | | | |
Garry L. Moody, #
56
(2007) | | Formerly, Partner, Deloitte & Touche LLP, Vice-Chairman, and U.S. and Global Managing Partner, Investment Management Services Group 1995-2008. | | 91 | | None |
| | | | | | |
Marshall C. Turner, Jr., #
67
(2005) | | Interim CEO of MEMC Electronic Materials, Inc. (semi-conductor and solar cell substrates) since November 2008. He was Chairman and CEO of Dupont Photomasks, Inc. (components of semi-conductor manufacturing), 2003-2005, and President and CEO, 2005-2006, after the company was renamed Toppan Photomasks, Inc. | | 92 | | Xilinx, Inc. (programmable logic semi-conductors) and MEMC Electronic Materials, Inc. |
| | |
| ALLIANCEBERNSTEIN HIGH INCOME FUND • | | 71 |
Management of the Fund
| | | | | | |
NAME,
ADDRESS* AND AGE
(FIRST YEAR ELECTED)** | | PRINCIPAL
OCCUPATION(S)
DURING PAST 5 YEARS | | PORTFOLIOS
IN FUND
COMPLEX
OVERSEEN BY
DIRECTOR | | OTHER
DIRECTORSHIPS
HELD BY DIRECTOR |
DISINTERESTED DIRECTORS
(continued) | | | | |
Earl D. Weiner, # 69 (2007) | | Of Counsel, and Partner prior to January 2007, of the law firm Sullivan & Cromwell LLP; member of ABA Federal Regulation of Securities Committee Task Force on Fund Director’s Guidebook; and member of Advisory Board of Sustainable Forestry Management Limited. | | 92 | | None |
| * | The address for each of the Fund’s disinterested Directors is c/o AllianceBernstein L.P., Attention: Philip L. Kirstein, 1345 Avenue of the Americas, New York, NY 10105. |
| ** | There is no stated term of office for the Fund’s Directors. |
| *** | Mr. Mayer is an “interested person”, as defined in the Investment Company Act of 1940 (the “1940 Act”), due to his position as an Executive Vice President of the Adviser. |
| # | Member of the Audit Committee, the Governance and Nominating Committee and the Independent Directors Committee. |
| ## | Member of the Fair Value Pricing Committee. |
| | |
| 72 | | • ALLIANCEBERNSTEIN HIGH INCOME FUND |
Management of the Fund
Officers of the Fund
Certain information concerning the Fund’s Officers is listed below.
| | | | |
NAME, ADDRESS*
AGE | | POSITION(S)
HELD WITH FUND | | PRINCIPAL OCCUPATION
DURING PAST 5 YEARS |
Robert M. Keith,
48 | | President and Chief Executive Officer | | Executive Vice President of the Adviser** since July 2008; Executive Managing Director of ABI** since 2006 and the head of ABI since July 2008. Prior to joining ABI in 2006, Executive Managing Director of Bernstein Global Wealth Management, and prior thereto, Senior Managing Director and Global Head of Client Service and Sales of AllianceBernstein’s institutional investment management business since 2004. Prior thereto, he was a Managing Director and Head of North American Client Service and Sales in AllianceBernstein’s institutional investment management business, with which he had been associated since prior to 2003. |
| | | | |
Philip Kirstein,
63 | | Senior Vice President and Independent Compliance Officer | | Senior Vice President and Independent Compliance Officer of the AllianceBernstein Funds, with which he has been associated since October 2004. Prior thereto, he was Of Counsel to Kirkpatrick & Lockhart, LLP from October 2003 to October 2004, and General Counsel of Merrill Lynch Investment Managers, L.P. since prior to March 2003. |
| | | | |
Paul J. DeNoon,
46 | | Vice President | | Senior Vice President of the Adviser**, with which he has been associated since prior to 2003. |
| | | | |
Fernando Grisales,
29 | | Vice President | | Assistant Vice President of the Adviser**, with which he has been associated since prior to 2003. |
| | | | |
Gershon Distenfeld,
33 | | Vice President | | Vice President of the Adviser**, with which he has been associated since prior to 2003. |
| | | | |
Douglas J. Peebles,
43 | | Vice President | | Executive Vice President of the Adviser**, with which he has been associated since prior to 2003. |
| | | | |
Matthew S. Sheridan,
33 | | Vice President | | Vice President of the Adviser**, with which he has been associated since prior to 2003. |
| | | | |
Emilie D. Wrapp,
52 | | Secretary | | Senior Vice President, Assistant General Counsel and Assistant Secretary of ABI**, with which she has been associated since prior to 2003. |
| | |
| ALLIANCEBERNSTEIN HIGH INCOME FUND • | | 73 |
Management of the Fund
| | | | |
NAME, ADDRESS*
AGE | | POSITION(S)
HELD WITH FUND | | PRINCIPAL OCCUPATION
DURING PAST 5 YEARS |
Joseph J. Mantineo,
49 | | Treasurer and Chief Financial Officer | | Senior Vice President of ABIS**, with which he has been associated since prior to 2003. |
| | | | |
Phyllis J. Clarke,
47 | | Controller | | Assistant Vice President of ABIS**, with which she has been associated since prior to 2003. |
| * | The address for each of the Fund’s Officers is 1345 Avenue of the Americas, New York, NY 10105. |
| ** | The Adviser, ABI and ABIS are affiliates of the Fund. |
| | The Fund’s Statement of Additional Information (“SAI”) has additional information about the Fund’s Directors and Officers and is available without charge upon request. Contact your financial representative or AllianceBernstein at (800) 227-4618 for a free prospectus or SAI. |
| | |
| 74 | | • ALLIANCEBERNSTEIN HIGH INCOME FUND |
Management of the Fund
THE FOLLOWING IS NOT PART OF THE SHAREHOLDER REPORT OR THE FINANCIAL STATEMENTS
SUMMARY OF SENIOR OFFICER’S EVALUATION OF INVESTMENT ADVISORY AGREEMENT1
The following is a summary of the evaluation of the Investment Advisory Agreement between AllianceBernstein L.P. (the “Adviser”) and AllianceBernstein High Income Fund, Inc. (the “Fund”).2,3 The evaluation of the Investment Advisory Agreement was prepared by Philip L. Kirstein, the Senior Officer of the Fund for the Directors of the Fund, as required by the September 1, 2004 Assurance of Discontinuance (“AoD”) between the Adviser and the New York State Attorney General (the “NYAG”). The Senior Officer’s evaluation of the Investment Advisory Agreement is not meant to diminish the responsibility or authority of the Board of Directors of the Fund to perform its duties pursuant to Section 15 of the Investment Company Act of 1940 (the “40 Act”) and applicable state law. The purpose of the summary is to provide shareholders with a synopsis of the independent evaluation of the reasonableness of the advisory fees proposed to be paid by the Fund which was provided to the Directors in connection with their review of the proposed approval of the continuance of the Investment Advisory Agreement. The Senior Officer’s evaluation considered the following factors:
| | 1. | Advisory fees charged to institutional and other clients of the Adviser for like services; |
| | 2. | Advisory fees charged by other mutual fund companies for like services; |
| | 3. | Costs to the Adviser and its affiliates of supplying services pursuant to the advisory agreement, excluding any intra-corporate profit; |
| | 4. | Profit margins of the Adviser and its affiliates from supplying such services; |
| | 5. | Possible economies of scale as the Fund grows larger; and |
| | 6. | Nature and quality of the Adviser’s services including the performance of the Fund. |
| 1 | It should be noted that the Senior Officer’s fee evaluation was completed on October 22, 2008. |
| 2 | Future references to the Fund do not include “AllianceBernstein.” References in the fee summary pertaining to performance and expense ratios refer to the Class A shares of the Fund. |
| 3 | It should be noted that on January 28, 2008, the Fund acquired the assets of AllianceBernstein Corporate Bond Portfolio and AllianceBernstein High Yield Fund, Inc. Prior to January 28, 2008, the Fund was named AllianceBernstein Emerging Market Debt Fund, Inc. |
| | |
| ALLIANCEBERNSTEIN HIGH INCOME FUND • | | 75 |
FUND ADVISORY FEES, EXPENSE REIMBURSEMENTS & RATIOS
The Adviser proposed that the Fund pay the advisory fee set forth in the table below for receiving the services to be provided pursuant to the Investment Advisory Agreement. The fee schedule below, implemented in January 2004 in consideration of the Adviser’s settlement with the NYAG in December 2003, is based on a master schedule that contemplates eight categories of funds with almost all funds in each category having the same advisory fee schedule.4
| | | | | | |
| Category | | Net Assets 09/30/08 ($MIL) | | Advisory Fee Based on % of
Average Daily Adjusted Total
Assets5 | | Fund |
| High Income | | $811.0 | | 50 bp on 1st $2.5 billion
45 bp on next $2.5 billion
40 bp on the balance | | High Income Fund, Inc. |
The Adviser is reimbursed as specified in the Investment Advisory Agreement for certain clerical, legal, accounting, administrative and other services provided to the Fund. During the Fund’s most recently completed fiscal year, the Adviser received $94,250 (0.01% of the Fund’s average daily net assets) for such services.
Set forth below are the Fund’s total expense ratios annualized for the most recent semi-annual period:
| | | | | | | | | | |
| Fund | | Expense Cap Pursuant to
Expense Limitation
Undertaking | | | Gross
Expense
Ratio6 | | | Fiscal
Year
End |
| High Income Fund, Inc.7 | | Advisor | | 0.65 | % | | 0.77 | % | | October 31 |
| | Class A | | 0.95 | % | | 1.13 | % | | |
| | Class B | | 1.65 | % | | 1.84 | % | | |
| | Class C | | 1.65 | % | | 1.84 | % | | |
| | Class R | | 1.15 | % | | 1.44 | % | | |
| | Class K | | 0.90 | % | | 1.13 | % | | |
| | Class I | | 0.65 | % | | 0.80 | % | | |
| I. | ADVISORY FEES CHARGED TO INSTITUTIONAL AND OTHER CLIENTS |
The advisory fees charged to investment companies which the Adviser manages and sponsors are normally higher than those charged to similar sized institutional accounts, including pension plans and sub-advised investment companies.
| 4 | Most of the AllianceBernstein Mutual Funds, which the Adviser manages, were affected by the Adviser’s settlement with the NYAG. |
| 5 | The average daily value of total assets minus the sum of accrued liabilities other than the principal amount of money borrowed. |
| 7 | Includes interest expense of 0.07%, 0.11%, 0.10%, 0.12%, 0.06% 0.06% and 0.06% for Classes Advisor, A, B, C, R, K and I, respectively. Excluding interest expense, the expense ratios would be 0.70%, 1.02%, 1.74%, 1.72%, 1.38%, 1.07% and 0.74% for Classes Advisor, A, B, C, R, K and I, respectively. The inception date for Classes Advisor, R, K and I is January 25, 2008. |
| | |
| 76 | | • ALLIANCEBERNSTEIN HIGH INCOME FUND |
The fee differential reflects, among other things, different services provided to such clients, and different liabilities assumed. Services provided by the Adviser to the Fund that are not provided to non-investment company clients include providing office space and personnel to serve as Fund Officers, who among other responsibilities make the certifications required under the Sarbanes–Oxley Act of 2002, and coordinating with and monitoring the Fund’s third party service providers such as Fund counsel, auditors, custodians, transfer agents and pricing services. The accounting, administrative, legal and compliance requirements for the Fund are more costly than those for institutional client assets due to the greater complexities and time required for investment companies, although as previously noted, a portion of these expenses are reimbursed by the Fund to the Adviser. Also, retail mutual funds managed by the Adviser are widely held. Servicing the Fund’s investors is more time consuming and labor intensive compared to institutional clients since the Adviser needs to communicate with a more extensive network of financial intermediaries and shareholders. The Adviser also believes that it incurs substantial entrepreneurial risk when offering a new mutual fund since establishing a new mutual fund requires a large upfront investment and it may take a long time for the fund to achieve profitability since the fund must be priced to scale from inception in order to be competitive and assets are acquired one account at a time. In addition, managing the cash flow of an investment company may be more difficult than that of a stable pool of assets, such as an institutional account with little cash movement in either direction, particularly, if a fund is in net redemption and the Adviser is frequently forced to sell securities to raise cash for redemptions. However, managing a fund with positive cash flow may be easier at times than managing a stable pool of assets. Finally, in recent years, investment advisers have been sued by institutional clients and have suffered reputational damage both by the attendant publicity and outcomes other than complete victories. Accordingly, the legal and reputational risks associated with institutional accounts are greater than previously thought, although still not equal to those related to the mutual fund industry.
Notwithstanding the Adviser’s view that managing an investment company is not comparable to managing other institutional accounts because the services provided are different, it is worth considering information regarding the advisory fees charged to institutional accounts with a substantially similar investment style as the Fund.8 In addition to the AllianceBernstein Institutional fee schedule, set forth below is what would have been the effective advisory fee of the Fund had the AllianceBernstein Institutional fee schedule been applicable to the Fund versus the Fund’s advisory fees based on September 30, 2008 net assets.
| 8 | The Adviser has indicated that with respect to institutional accounts with assets greater than $300 million, it will negotiate a fee schedule, although it should be noted that there were no such institutional accounts that are similar in investment style as the Fund, which opened in the last three years. Discounts that are negotiated vary based upon each client relationship. |
| | |
| ALLIANCEBERNSTEIN HIGH INCOME FUND • | | 77 |
| | | | | | | | |
| Fund | | Net Assets 09/30/08 ($MIL) | | AllianceBernstein (“AB”)
Institutional (“Inst.”) Fee Schedule | | Effective
AB Inst.
Adv. Fee | | Fund Advisory Fee |
| High Income Fund, Inc. | | $811.0 | | Global High Yield Schedule 65 bp on 1st $50 million 35 bp on the balance Minimum Account Size: $50m | | 0.368% | | 0.500% |
The Adviser also manages and sponsors retail mutual funds, which are organized in jurisdictions outside the United States, generally Luxembourg and Japan, and sold to non-United States resident investors. The Adviser charges the following fee for Global High Yield, a Luxembourg fund, which has a somewhat similar investment style as the Fund:
| | | | |
| Fund | | Luxembourg Fund | | Fee9 |
| High Income Fund, Inc. | | Global High Yield Class A | | 1.70% on 1st €5 billion 1.50% on the balance |
| | | | |
| | Class I (Institutional) | | 1.15% on 1st €5 billion 0.95% on the balance |
The AllianceBernstein Investment Trust Management mutual funds (“ITM”), which are offered to investors in Japan, have an “all-in” fee to compensate the Adviser for investment advisory as well as fund accounting and administrative related services. The fee schedule of the ITM mutual fund that has a somewhat similar investment style as the Funds is as follows:
| | | | |
| Fund | | ITM Mutual Fund | | Fee10 |
| High Income Fund, Inc. | | Global High Income Open
A/B
(Hedged/Unhedged) | | 0.70% on the 1st ¥30 billion 0.60% on next ¥20 billion 0.50% on next ¥450 billion 0.45% on the balance |
The Adviser represented that it does not sub-advise any registered investment companies have a similar investment strategy as the Fund.
| II. | MANAGEMENT FEES CHARGED BY OTHER MUTUAL FUND COMPANIES FOR LIKE SERVICES. |
Lipper, Inc. (“Lipper”), an analytical service that is not affiliated with the Adviser, compared the fees charged to the Fund with fees charged to other investment companies for similar services by other investment advisers. Lipper’s analysis included the Portfolio’s ranking with respect to the proposed
| 9 | Class A shares of the fund are charged an “all-in” fee, which covers investment advisory services and distribution related services. |
| 10 | The Japanese Yen-U.S. dollar currency exchange rate quoted at 4 p.m. on October 1, 2008 by Reuters was ¥106.04 per $1. At that currency exchange rate, ¥30 billion would be equivalent to approximately $282.9 million; ¥20 billion would be equivalent to approximately $188.6 million; and ¥450 billion would be equivalent to approximately $4.243 billion. |
| | |
| 78 | | • ALLIANCEBERNSTEIN HIGH INCOME FUND |
management fee relative to the median of the Portfolio’s Lipper Expense Group (“EG”)11 at the approximate current asset level of the Portfolio.12
Lipper describes an EG as a representative sample of comparable funds. Lipper’s standard methodology for screening funds to be included in an EG entails the consideration of several fund criteria, including fund type, investment classification/objective, load type and similar 12b-1/non-12b-1 service fees, asset (size) comparability, and expense components and attributes. An EG will typically consist of seven to twenty funds.
| | | | | | |
| Fund | | Contractual
Management Fee13 | | Lipper Exp. Group Median (%) | | Lipper
Group Rank |
| High Income Fund, Inc. | | 0.500 | | 0.725 | | 1/8 |
Lipper also analyzed the Fund’s most recently completed fiscal year total expense ratio in comparison to the Fund’s EG and Lipper Expense Universe (“EU”). The EU14 is a broader group compared to the EG, consisting of all funds that have the same investment classification/objective and load type as the subject Fund.
| | | | | | | | | | |
| Fund | | Expense Ratio
(%)15 | | Lipper Exp. Group
Median
(%) | | Lipper Group Rank | | Lipper Exp. Universe Median
(%) | | Lipper
Universe Rank |
| High Income Fund, Inc. | | 1.143 | | 1.198 | | 1/8 | | 1.205 | | 1/12 |
Pro-forma16 | | 0.950 | | 1.198 | | 1/8 | | 1.205 | | 1/12 |
Based on this analysis, the Fund has equally favorable rankings on a management fee basis and on a total expense ratio basis.
| 11 | It should be noted that Lipper does not consider average account size when constructing EGs. Funds with relatively small average account sizes tend to have higher transfer agent expense ratios than comparable sized funds that have relatively large average account sizes. Note that there are limitations on Lipper expense category data because different funds categorize expenses differently. |
| 12 | The contractual management fee is calculated by Lipper using the Portfolio’s contractual management fee rate at a hypothetical asset level. The hypothetical asset level is based on the combined net assets of all classes of the Portfolio, rounded up to the next $25 million. Lipper’s total expense ratio information is based on the most recent annual report except as otherwise noted. A ranking of “1” would mean that the Portfolio had the lowest effective fee rate in the Lipper peer group. |
| 13 | The contractual management fee does not reflect any expense reimbursements made by the Fund to the Adviser for certain clerical, legal, accounting, administrative, and other services. In addition, the contractual management fee does not reflect any advisory fee waivers for expense caps that would effectively reduce the actual effective management fee. |
| 14 | Except for asset (size) comparability, Lipper uses the same criteria for selecting an EG when selecting an EU. Unlike the EG, the EU allows for the same adviser to be represented by more than just one fund. |
| 15 | Most recently completed fiscal year Class A share total expense ratio. |
| 16 | Pro-forma shows what would have been the total expense ratio of the Fund had the anticipated expense limitation undertaking been in effect for the full fiscal year. |
| | |
| ALLIANCEBERNSTEIN HIGH INCOME FUND • | | 79 |
| III. | COSTS TO THE ADVISER AND ITS AFFILIATES OF SUPPLYING SERVICES PURSUANT TO THE ADVISORY FEE ARRANGEMENT, EXCLUDING ANY INTRA-CORPORATE PROFIT. |
The Adviser utilizes two profitability reporting systems, which operate independently but are aligned with each other, to estimate the Adviser’s profitability in connection with investment advisory services provided to the Portfolio. The Senior Officer has retained a consultant to provide independent advice regarding the alignment of the two profitability systems as well as the methodologies and allocations utilized by both profitability systems. See Section IV for additional discussion.
| IV. | PROFIT MARGINS OF THE ADVISER AND ITS AFFILIATES FOR SUPPLYING SUCH SERVICES. |
The profitability information for the Fund prepared by the Adviser for the Board of Directors was reviewed by the Senior Officer and the consultant. The Adviser’s profitability from providing investment advisory services to the Fund decreased during calendar year 2007, relative to 2006.
In addition to the Adviser’s direct profits from managing the Fund, certain of the Adviser’s affiliates have business relationships with the Fund and may earn a profit from providing other services to the Fund. The courts have referred to this type of business opportunity as “fall-out benefits” to the Adviser and indicated that such benefits should be factored into the evaluation of the total relationship between the Fund and the Adviser. Neither case law nor common business practice precludes the Adviser’s affiliates from earning a reasonable profit on this type of relationship. These affiliates provide transfer agent and distribution related services to the Fund and receive transfer agent fees, Rule 12b-1 payments, front-end sales loads and contingent deferred sales charges (“CDSC”).
AllianceBernstein Investments, Inc. (“ABI”), an affiliate of the Adviser, is the Fund’s principal underwriter. ABI and the Adviser have disclosed in the Fund’s prospectus that they may make revenue sharing payments from their own resources, in addition to revenues derived from sales loads and Rule 12b-1 fees, to firms that sell shares of the Fund. In 2007, ABI paid approximately 0.04% of the average monthly assets of the AllianceBernstein Mutual Funds or approximately $24 million for distribution services and educational support (revenue sharing payments). For 2008, it is anticipated, ABI will pay approximately 0.04% of the average monthly assets of the AllianceBernstein Mutual Funds or approximately $28 million.17 During the Fund’s most recently completed fiscal year, ABI received from the Fund $26,725, $2,069,106 and $49,156 in front-end sales charges, Rule 12b-1 and CDSC fees, respectively.
| 17 | ABI currently inserts the “Advance” in quarterly account statements and pays the incremental costs associated with the mailing. The incremental cost is less than what an “independent mailing” would cost. |
| | |
| 80 | | • ALLIANCEBERNSTEIN HIGH INCOME FUND |
Fees and reimbursements for out of pocket expenses charged by AllianceBernstein Investor Services, Inc. (“ABIS”), the affiliated transfer agent for the Fund, are charged on a per account basis, based on the level of service provided and the class of share held by the account. ABIS also receives a fee per shareholder sub-account for each account maintained by an intermediary on an omnibus basis. ABIS’ after-tax profitability decreased in 2007 in comparison to 2006. During the Fund’s most recently completed fiscal year, ABIS received $208,869 in fees from the Fund.18
| V. | POSSIBLE ECONOMIES OF SCALE |
The Adviser has indicated that economies of scale are being shared with shareholders through fee structures,19 subsidies and enhancement to services. Based on some of the professional literature that has considered economies of scale in the mutual fund industry, it is thought that to the extent economies of scale exist, they may more often exist across a fund family as opposed to a specific fund. This is because the costs incurred by the Adviser, such as investment research or technology for trading or compliance systems, can be spread across a greater asset base as the fund family increases in size. It is also possible that as the level of services required to operate a successful investment company has increased over time, and advisory firms have made such investments in their business to provide services, there may be a sharing of economies of scale without a reduction in advisory fees.
An independent consultant, retained by the Senior Officer, provided the Board of Directors an update of the Deli20 study on advisory fees and various fund characteristics. The independent consultant first reiterated the results of his previous two dimensional comparison analysis (fund size and family size) with the Board of Directors.21 The independent consultant then discussed the results of the regression model that was utilized to study the effects of various factors on advisory fees. The regression model output indicated that the bulk of the variation in fees predicted were explained by various factors, but substantially by fund
| 18 | The fees disclosed are net of any expense offsets with ABIS. An expense offset is created by the interest earned on the positive cash balance that occur within the transfer agent account as there is a one day lag with regards to money movement from the shareholder’s account to the transfer agent’s account and then the transfer agent’s account to the Fund’s account. During the Fund’s most recently completed fiscal year, the fees paid by the Fund to ABIS were reduced by $16,726 under the offset agreement between the Fund and ABIS. |
| 19 | Fee structures include fee reductions, pricing at scale and breakpoints in advisory fee schedules. |
| 20 | The Deli study was originally published in 2002 based on 1997 data. |
| 21 | The two dimensional analysis showed patterns of lower advisory fees for funds with larger asset sizes and funds from larger family sizes compared to funds with smaller asset sizes and funds from smaller family sizes, which according to the independent consultant is indicative of a sharing of economies of scale and scope. However, in less liquid and active markets, such is not the case, as the empirical analysis showed potential for diseconomies of scale in those markets. The empirical analysis also showed diminishing economies of scale and scope as funds surpassed a certain high level of assets. |
| | |
| ALLIANCEBERNSTEIN HIGH INCOME FUND • | | 81 |
assets under management (“AUM”), family AUM, index fund indicator and investment style. The independent consultant also compared the advisory fees of the AllianceBernstein Mutual Funds to similar funds managed by 19 other large asset managers, regardless of fund size and the large asset manager’s proportion of mutual fund assets to non-mutual fund assets.
| VI. | NATURE AND QUALITY OF THE ADVISER’S SERVICES, INCLUDING THE PERFORMANCE OF THE FUND |
With assets under management of approximately $590 billion as of September 30, 2008, the Adviser has the investment experience to manage and provide non-investment services (described in Section I) to the Fund.
The information below shows the 1, 3, 5 and 10 year performance returns and rankings of the Fund 22 relative to its Lipper Performance Group (“PG”) and Lipper Performance Universe (“PU”)23 for the periods ended July 31, 2008.24
| | | | | | | | | | |
| | | Fund Return (%) | | PG Median (%) | | PU Median (%) | | PG Rank | | PU Rank |
1 year | | 3.71 | | 4.05 | | 4.74 | | 5/8 | | 11/17 |
3 year | | 7.41 | | 7.31 | | 7.31 | | 3/7 | | 5/11 |
5 year | | 10.41 | | 10.53 | | 10.41 | | 4/6 | | 5/9 |
10 year | | 11.44 | | 10.79 | | 10.74 | | 2/5 | | 3/8 |
| 22 | The performance returns and rankings are for the Class A shares of the Fund. It should be noted that the performance returns of the Fund that is shown was provided by the Adviser. Lipper maintains its own database that includes the Fund’s performance returns. However, differences in the distribution price (ex-date versus payable date) and rounding differences may cause the Adviser’s own performance returns of the Fund to be one or two basis points different from Lipper. To maintain consistency in this evaluation, the performance returns of the Fund, as reported by the Adviser, are provided instead of Lipper. |
| 23 | The Portfolio’s PG is identical to the Portfolio’s EG. The Portfolio’s PU is not identical to the Portfolio’s EU as the criteria for including/excluding a portfolio in/from a PU are somewhat different from that of an EU. |
| 24 | Note that the current Lipper investment classification/objective dictates the PG and PU throughout the life of the Fund even if the Fund may have had a different investment classification/objective at different points in time. |
| | |
| 82 | | • ALLIANCEBERNSTEIN HIGH INCOME FUND |
Set forth below are the 1, 3, 5, 10 year and since inception net performance returns of the Fund (in bold)25 versus its benchmarks. Note that the Fund may utilize leverage in contrast to the Fund’s benchmark, which has no leverage.
| | | | | | | | | | |
| | | 1 Year
(%) | | 3 Year
(%) | | 5 Year
(%) | | 10 Year
(%) | | Since
Inception
(%) |
| High Income Fund, Inc. | | 3.71 | | 7.41 | | 10.41 | | 11.44 | | 11.29 |
| 33% JP Morgan EMBI Index/33% JP Morgan GBI EM/33% Lehman High Yield 2% Constrained Index | | 8.94 | | 8.45 | | 10.39 | | N/A | | N/A |
| JP Morgan EMBI Global Index26 | | 7.23 | | 7.57 | | 10.11 | | 10.14 | | 10.92 |
| JP Morgan GBI EM | | 19.61 | | 14.29 | | 14.07 | | N/A | | N/A |
| Lehman Brothers High Yield 2% Constrained Index26 | | 0.52 | | 3.50 | | 6.79 | | 4.82 | | 6.41 |
| Inception Date: February 25, 1994 |
CONCLUSION:
Based on the factors discussed above the Senior Officer’s conclusion is that the proposed advisory fee for the Fund is reasonable and within the range of what would have been negotiated at arms-length in light of all the surrounding circumstances. This conclusion in respect of the Fund is based on an evaluation of all of these factors and no single factor was dispositive.
Dated: November 25, 2008
| 25 | The performance returns and risk measures shown in the table are for the Class A shares of the Fund. |
| 26 | Benchmark inception is the nearest month end after the Fund’s actual inception date. |
| | |
| ALLIANCEBERNSTEIN HIGH INCOME FUND • | | 83 |
THIS PAGE IS NOT PART OF THE SHAREHOLDER REPORT OR THE FINANCIAL STATEMENTS
ALLIANCEBERNSTEIN FAMILY OF FUNDS
Wealth Strategies Funds
Balanced Wealth Strategy
Wealth Appreciation Strategy
Wealth Preservation Strategy
Tax-Managed Balanced Wealth Strategy
Tax-Managed Wealth Appreciation Strategy
Tax-Managed Wealth Preservation Strategy
Blended Style Funds
U.S. Large Cap Portfolio
International Portfolio
Tax-Managed International Portfolio
Growth Funds
Domestic
Growth Fund
Large Cap Growth Fund
Small Cap Growth Portfolio
Small/Mid Cap Growth Fund*
Global & International
Global Growth Fund*
Global Thematic Growth Fund*
Greater China ‘97 Fund
International Growth Fund
Value Funds
Domestic
Balanced Shares
Focused Growth & Income Fund
Growth & Income Fund
Small/Mid Cap Value Fund
Utility Income Fund
Value Fund
Global & International
Global Real Estate Investment Fund
Global Value Fund
International Value Fund
Taxable Bond Funds
Diversified Yield Fund
Global Bond Fund
High Income Fund*
Intermediate Bond Portfolio
Short Duration Portfolio
Municipal Bond Funds
| | |
National
National II*
Arizona
California
California II*
Florida
Massachusetts | | Michigan
Minnesota
New Jersey
New York
Ohio
Pennsylvania
Virginia |
Intermediate Municipal Bond Funds
Intermediate California
Intermediate Diversified
Intermediate New York
Closed-End Funds
AllianceBernstein Global High Income Fund
AllianceBernstein Income Fund
AllianceBernstein National Municipal Income Fund
ACM Managed Dollar Income Fund
Alliance California Municipal Income Fund
Alliance New York Municipal Income Fund
The Spain Fund
Retirement Strategies Funds
| | | | |
2000 Retirement Strategy | | 2020 Retirement Strategy | | 2040 Retirement Strategy |
2005 Retirement Strategy | | 2025 Retirement Strategy | | 2045 Retirement Strategy |
2010 Retirement Strategy | | 2030 Retirement Strategy | | 2050 Retirement Strategy |
2015 Retirement Strategy | | 2035 Retirement Strategy | | 2055 Retirement Strategy |
We also offer Exchange Reserves,** which serves as the money market fund exchange vehicle for the AllianceBernstein mutual funds.
You should consider the investment objectives, risks, charges and expenses of any AllianceBernstein fund/portfolio carefully before investing. For free copies of our prospectuses, which contain this and other information, visit us online at www.alliancebernstein.com or contact your financial advisor. Please read the prospectus carefully before investing.
| * | | Prior to January 28, 2008, High Income Fund was named Emerging Market Debt Fund. Prior to November 3, 2008, Small/Mid Cap Growth Fund was named Mid-Cap Growth Fund, Global Growth Fund was named Global Research Growth Fund, and Global Thematic Growth Fund was named Global Technology Fund. Prior to December 1, 2008, National II was named Insured National, and California II was named Insured California. |
| ** | An investment in the Fund is not a deposit in a bank and is not insured or guaranteed by the Federal Deposit Insurance Corporation or any other government agency. Although the Fund seeks to preserve the value of your investment at $1.00 per share, it is possible to lose money by investing in the Fund. |
| | |
| 84 | | • ALLIANCEBERNSTEIN HIGH INCOME FUND |
AllianceBernstein Family of Funds
ALLIANCEBERNSTEIN HIGH INCOME FUND
1345 Avenue of the Americas
New York, NY 10105
800.221.5672
| | |
| |
| HI-0151-1008 | |  |
(a) The registrant has adopted a code of ethics that applies to its principal executive officer, principal financial officer and principal accounting officer. A copy of the registrant’s code of ethics is filed herewith as Exhibit 12(a)(1).
(b) During the period covered by this report, no material amendments were made to the provisions of the code of ethics adopted in 2(a) above.
(c) During the period covered by this report, no implicit or explicit waivers to the provisions of the code of ethics adopted in 2(a) above were granted.
| ITEM 3. | AUDIT COMMITTEE FINANCIAL EXPERT. |
The registrant’s Board of Directors has determined that independent directors Garry L. Moody and William H. Foulk, Jr. qualify as audit committee financial experts.
| ITEM 4. | PRINCIPAL ACCOUNTANT FEES AND SERVICES. |
(a) - (c) The following table sets forth the aggregate fees billed by the independent registered public accounting firm Ernst & Young LLP, for the Fund’s last two fiscal years for professional services rendered for: (i) the audit of the Fund’s annual financial statements included in the Fund’s annual report to stockholders; (ii) assurance and related services that are reasonably related to the performance of the audit of the Fund’s financial statements and are not reported under (i), which include advice and education related to accounting and auditing issues and quarterly press release review (for those Funds which issue press releases), and preferred stock maintenance testing (for those Funds that issue preferred stock); and (iii) tax compliance, tax advice and tax return preparation.
| | | | | | | | | | | |
| | | | | Audit Fees | | Audit-Related
Fees | | Tax Fees |
| | 2007 | | $ | 61,500 | | $ | 5,548 | | $ | 19,875 |
| | 2008 | | $ | 67,650 | | $ | 8,711 | | $ | 63,407 |
(d) Not applicable.
(e) (1) Beginning with audit and non-audit service contracts entered into on or after May 6, 2003, the Fund’s Audit Committee policies and procedures require the pre-approval of all audit and non-audit services provided to the Fund by the Fund’s independent registered public accounting firm. The Fund’s Audit Committee policies and procedures also require pre-approval of all audit and non-audit services provided to the Adviser and Service Affiliates to the extent that these services are directly related to the operations or financial reporting of the Fund.
(e) (2) All of the amounts for Audit Fees, Audit-Related Fees and Tax Fees in the table under Item 4 (a) – (c) are for services pre-approved by the Fund’s Audit Committee.
(f) Not applicable.
(g) The following table sets forth the aggregate non-audit services provided to the Fund, the Fund’s Adviser and entities that control, are controlled by or under common control with the Adviser that provide ongoing services to the Fund, which include preparing an annual internal control report pursuant to Statement on Auditing Standards No. 70 (“Service Affiliates”):
| | | | | | | |
| | | | | All Fees for
Non-Audit Services
Provided to the
Portfolio, the Adviser
and Service Affiliates | | Total Amount of
Foregoing Column Pre-approved
by the Audit Committee
(Portion Comprised of Audit
Related Fees)
(Portion Comprised of Tax Fees) | |
| | 2007 | | $ 916,178 | | $ 144,943 | |
| | | | | | $(125,068 | ) |
| | | | | | $ (19,875 | ) |
| | 2008 | | $1,032,463 | | $ 215,237 | |
| | | | | | $(151,830 | ) |
| | | | | | $ (63,407 | ) |
(h) The Audit Committee of the Fund has considered whether the provision of any non-audit services not pre-approved by the Audit Committee provided by the Fund’s independent registered public accounting firm to the Adviser and Service Affiliates is compatible with maintaining the auditor’s independence.
| ITEM 5. | AUDIT COMMITTEE OF LISTED REGISTRANTS. |
Not applicable to the registrant.
| ITEM 6. | SCHEDULE OF INVESTMENTS. |
Please see Schedule of Investments contained in the Report to Shareholders included under Item 1 of this Form N-CSR.
| ITEM 7. | DISCLOSURE OF PROXY VOTING POLICIES AND PROCEDURES FOR CLOSED-END MANAGEMENT INVESTMENT COMPANIES. |
Not applicable to the registrant.
| ITEM 8. | PORTFOLIO MANAGERS OF CLOSED-END MANAGEMENT INVESTMENT COMPANIES. |
Not applicable to the registrant.
| ITEM 9. | PURCHASES OF EQUITY SECURITIES BY CLOSED-END MANAGEMENT INVESTMENT COMPANY AND AFFILIATED PURCHASERS. |
Not applicable to the registrant.
| ITEM 10. | SUBMISSION OF MATTERS TO A VOTE OF SECURITY HOLDERS. |
There have been no material changes to the procedures by which shareholders may recommend nominees to the Fund’s Board of Directors since the Fund last provided disclosure in response to this item.
| ITEM 11. | CONTROLS AND PROCEDURES. |
(a) The registrant’s principal executive officer and principal financial officer have concluded that the registrant’s disclosure controls and procedures (as defined in Rule 30a-3 (c) under the Investment Company Act of 1940, as amended) are effective at the reasonable assurance level based on their evaluation of these controls and procedures as of a date within 90 days of the filing date of this document.
(b) There were no changes in the registrant’s internal controls over financial reporting that occurred during the second fiscal quarter of the period that has materially affected, or is reasonably likely to materially affect, the registrant’s internal control over financial reporting.
The following exhibits are attached to this Form N-CSR:
| | |
EXHIBIT NO. | | DESCRIPTION OF EXHIBIT |
| |
| 12 (a) (1) | | Code of Ethics that is subject to the disclosure of Item 2 hereof |
| |
| 12 (b) (1) | | Certification of Principal Executive Officer Pursuant to Section 302 of the Sarbanes-Oxley Act of 2002 |
| |
| 12 (b) (2) | | Certification of Principal Financial Officer Pursuant to Section 302 of the Sarbanes-Oxley Act of 2002 |
| |
| 12 (c) | | Certification of Principal Executive Officer and Principal Financial Officer Pursuant to Section 906 of the Sarbanes-Oxley Act of 2002 |
SIGNATURES
Pursuant to the requirements of the Securities Exchange Act of 1934 and the Investment Company Act of 1940, the registrant has duly caused this report to be signed on its behalf by the undersigned, thereunto duly authorized.
(Registrant): AllianceBernstein High Income Fund, Inc.
| | |
| By: | | /s/ Robert M. Keith |
| | Robert M. Keith |
| | President |
| |
| Date: | | December 27, 2008 |
Pursuant to the requirements of the Securities Exchange Act of 1934 and the Investment Company Act of 1940, this report has been signed below by the following persons on behalf of the registrant and in the capacities and on the dates indicated.
| | |
| By: | | /s/ Robert M. Keith |
| | Robert M. Keith |
| | President |
| |
| Date: | | December 27, 2008 |
| |
| By: | | /s/ Joseph J. Mantineo |
| | Joseph J. Mantineo |
| | Treasurer and Chief Financial Officer |
| |
| Date: | | December 27, 2008 |