UNITED STATES
SECURITIES AND EXCHANGE COMMISSION
WASHINGTON, D.C. 20549
FORM N-CSR
CERTIFIED SHAREHOLDER REPORT OF REGISTERED
MANAGEMENT INVESTMENT COMPANIES
Investment Company Act file number: 811-08188
ALLIANCEBERNSTEIN HIGH INCOME FUND, INC.
(Exact name of registrant as specified in charter)
1345 Avenue of the Americas, New York, New York 10105
(Address of principal executive offices) (Zip code)
Joseph J. Mantineo
AllianceBernstein L.P.
1345 Avenue of the Americas
New York, New York 10105
(Name and address of agent for service)
Registrant’s telephone number, including area code: (800) 221-5672
Date of fiscal year end: October 31, 2011
Date of reporting period: October 31, 2011
ITEM 1. REPORTS TO STOCKHOLDERS.
ANNUAL REPORT
AllianceBernstein
High Income Fund

Annual Report
Investment Products Offered
| | • | | Are Not Bank Guaranteed |
Investors should consider the investment objectives, risks, charges and expenses of the Fund carefully before investing. For copies of our prospectus or summary prospectus, which contain this and other information, visit us online at www.alliancebernstein.com or contact your AllianceBernstein Investments representative. Please read the prospectus and/or summary prospectus carefully before investing.
This shareholder report must be preceded or accompanied by the Fund’s prospectus for individuals who are not current shareholders of the Fund.
You may obtain a description of the Fund’s proxy voting policies and procedures, and information regarding how the Fund voted proxies relating to portfolio securities during the most recent 12-month period ended June 30, without charge. Simply visit AllianceBernstein’s website at www.alliancebernstein.com, or go to the Securities and Exchange Commission’s (the “Commission”) website at www.sec.gov, or call AllianceBernstein at (800) 227-4618.
The Fund files its complete schedule of portfolio holdings with the Commission for the first and third quarters of each fiscal year on Form N-Q. The Fund’s Forms N-Q are available on the Commission’s website at www.sec.gov. The Fund’s Forms N-Q may also be reviewed and copied at the Commission’s Public Reference Room in Washington, DC; information on the operation of the Public Reference Room may be obtained by calling (800) SEC-0330. AllianceBernstein publishes full portfolio holdings for the Fund monthly at www.alliancebernstein.com.
AllianceBernstein Investments, Inc. (ABI) is the distributor of the AllianceBernstein family of mutual funds. ABI is a member of FINRA and is an affiliate of AllianceBernstein L.P., the manager of the funds.
AllianceBernstein® and the AB Logo are registered trademarks and service marks used by permission of the owner, AllianceBernstein L.P.
December 19, 2011
Annual Report
This report provides management’s discussion of fund performance for AllianceBernstein High Income Fund (the “Fund”) for the annual reporting period ended October 31, 2011.
Investment Objectives and Policies
The Fund’s investment objective is to seek to maximize total returns from price appreciation and income.
The Fund pursues income opportunities from government, corporate, emerging market and high yield sources. It has the flexibility to invest in a broad range of fixed income securities in both developed and emerging market countries. The Fund’s investments may include U.S. and non-U.S. corporate debt securities and sovereign debt securities. The Fund may invest, without limitation, in either U.S. dollar-denominated or non-U.S. dollar-denominated fixed income securities.
The Fund may invest in debt securities with a range of maturities from short- to long-term. Substantially all of the Fund’s assets may be invested in lower-rated securities, which may include securities having the lowest rating for non-subordinated debt instruments (i.e., rated C by Moody’s Investors Service or CCC+ or lower by Standard & Poor’s Rating Service and Fitch Ratings, Ltd.) and unrated securities of equivalent investment quality. The Fund also may invest in investment-grade securities and unrated securities. The Fund may also make short sales of securities or maintain a short position. The Fund is non-diversified, meaning it may invest more of its assets in a fewer number of issuers.
The Fund may invest in mortgage-related and other asset-backed securities, loan participations, inflation-protected securities, structured securities, variable, floating, and inverse floating rate instruments and preferred stock, and may use other investment techniques. The Fund may use borrowings or other leverage for investment purposes. The Fund intends, among other things, to enter into transactions such as reverse repurchase agreements and dollar rolls. The Fund may invest, without limit, in derivatives, such as options, futures, forwards, or swap agreements.
Investment Results
The table on page 6 shows the Fund’s performance compared with its composite benchmark, which is composed of equal weightings of the J.P. Morgan Emerging Markets Bond Index Global (“JPM EMBI Global”), the J.P. Morgan Government Bond Index-Emerging Markets (“JPM GBI-EM”) (local-currency-denominated) and the Barclays Capital (“BC”) U.S. Corporate High Yield (“HY”) 2% Issuer Capped Index for the six- and 12-month periods ended October 31, 2011. Individual performance for each of these indices is also included for both time periods. The Fund is also compared to its broad-based benchmark, the JPM EMBI Global, which tracks total returns for U.S. dollar-denominated debt instruments issued by emerging market sovereign and quasi-sovereign entities.
The Fund’s Class A shares outperformed the composite benchmark for the 12-month period and declined and underperformed for the six-month
| | | | |
| ALLIANCEBERNSTEIN HIGH INCOME FUND • | | | 1 | |
period, before sales charges. The Fund’s significant overweight to U.S. corporate high yield securities contributed positively for the 12-month period, as these securities outperformed. The Fund’s corporate high yield industry allocation, specifically an overweight to subordinated financials (banks and insurance) within the capital structure, detracted for both periods.
The Fund’s underweight to U.S. dollar-denominated emerging market debt, which outperformed the composite benchmark for both periods, detracted. The Fund’s underweight to local emerging market debt (which performed poorly) contributed positively during both periods.
The Fund’s use of leverage was a positive contributor for both periods. The Fund utilized leverage through repurchase agreements at favorable rates and was able to reinvest the proceeds into higher-yielding securities. Within the Fund’s derivative positions, credit default swap (“CDS”) index and CDS credit derivative exposure was a slight detractor for both periods. The Fund also utilized interest rate swaps to manage overall duration and interest rate risk within the Fund. These positions had no material impact on performance.
Market Review and Investment Strategy
The global economic recovery that was underway slowed early in the year, resulting from a myriad of global events. Social unrest in North Africa and the Middle East, supply disruptions from the natural disaster in
Japan and a spike in commodity prices, particularly oil, all provided headwinds for the global economy early in the year. During the six-month period ended October 31, 2011, renewed fears of a double-dip recession roiled the global capital markets, driving up risk aversion, sending equities sharply lower and widening credit spreads. Fiscal challenges—ranging from the contentious debate over the U.S. debt ceiling to the ongoing sovereign debt woes of Greece and the peripheral European nations—were at the forefront of investors’ worries. The mounting fear and uncertainty led to a spike in financial market volatility.
U.S. fixed income securities generally posted positive returns for the annual period, led by U.S. high yield corporates, as measured by the BC U.S. Corporate HY 2% Issuer Capped Index. By industry, energy, utilities and technology outperformed while basics, communications, transportation and financials underperformed. Financials were dragged down by both banks and insurance, which underperformed for the year. U.S. high yield spreads widened 93 basis points to end the period at 670 basis points over duration-matched Treasuries. The yield on the index rose to 8.23%.
U.S. dollar-denominated emerging market debt posted positive returns for the annual period, as measured by the JPM EMBI Global, with Latin countries outperforming non-Latin countries. The Ivory Coast, which faced political issues, underperformed, as did Belize, Argentina and Belarus.
| | |
| 2 | | • ALLIANCEBERNSTEIN HIGH INCOME FUND |
Outperforming countries for the year included Venezuela and Ecuador. During the period, U.S. dollar-denominated emerging market debt spreads widened 109 basis points to end the annual period at 392 basis points over duration-matched Treasuries. Local currency emerging market bonds fell -2.53% in U.S. dollar unhedged terms, as measured by the JPM GBI-EMI, with much of the loss in the local index stemming from weaker emerging market country currencies. In local currency terms, Brazil outperformed for the year with Turkey underperforming.
The Fund continued to overweight corporate high yield and underweight emerging market debt. The Fund’s
Global Fixed Income Investment Team and the Global Credit Investment Team (collectively, the “Team”) continue to believe that corporate high yield bonds present the best risk/return opportunity in the global high-yield space, and find current risk premiums attractive given non-financial corporation cash positions, balance sheets and reduced medium-term refinancing needs of borrowers. However, continued uncertainty around global growth, particularly risks emanating from Europe, leaves tail risk magnified and volatility elevated. Within this environment, the Team has reduced risk, and will continue to monitor and adjust positions as necessary to balance exposures with market conditions and developments.
| | | | |
| ALLIANCEBERNSTEIN HIGH INCOME FUND • | | | 3 | |
HISTORICAL PERFORMANCE
An Important Note About Historical Performance
The investment return and principal value of an investment in the Fund will fluctuate, so that shares, when redeemed, may be worth more or less than their original cost. Performance shown on the following pages represents past performance and does not guarantee future results. Current performance may be lower or higher than the performance information shown. You may obtain performance information current to the most recent month-end by visiting www.alliancebernstein.com.
All fees and expenses related to the operation of the Fund have been deducted. NAV returns do not reflect sales charges; if sales charges were reflected, the Fund’s quoted performance would be lower. SEC returns reflect the applicable sales charges for each share class: a 4.25% maximum front-end sales charge for Class A shares; the applicable contingent deferred sales charge for Class B shares (3% year 1, 2% year 2, 1% year 3); a 1% 1-year contingent deferred sales charge for Class C shares. Returns for the different share classes will vary due to different expenses associated with each class. Performance assumes reinvestment of distributions and does not account for taxes.
Benchmark Disclosure
The unmanaged JPM® EMBI Global, the JPM® GBI-EM and the BC U.S. Corporate HY 2% Issuer Capped Index do not reflect fees and expenses associated with the active management of a mutual fund portfolio. The unmanaged JPM EMBI Global (market-capitalization weighted) represents the performance of U.S. dollar-denominated Brady bonds, Eurobonds, and trade loans issued by sovereign and quasi-sovereign entities. The JPM GBI-EM represents the performance of local currency government bonds issued by emerging markets. The BC U.S. Corporate HY 2% Issuer Capped Index is the 2% Issuer Capped component of the U.S. Corporate HY Index. The BC U.S. Corporate HY Index represents the performance of fixed income securities having a maximum quality rating of Ba1, a minimum amount outstanding of $150 and at least 1 year to maturity. An investor cannot invest directly in an index or average, and their results are not indicative of the performance for any specific investment, including the Fund.
A Word About Risk
Derivatives Risk: Investing in derivative instruments such as options, futures, forwards or swaps can be riskier than traditional investments, and may be more volatile, especially in a down market. Non-U.S. securities may be more volatile because of political, regulatory, market and economic uncertainties associated with such securities. Fluctuations in currency exchange rates may negatively affect the value of the investment or reduce returns. These risks are magnified in emerging or developing markets.
Leverage Risk: Trying to enhance investment returns by borrowing money or using other leverage tools—magnify both gains and losses, resulting in greater volatility.
Inflation Risk: Prices for goods and services tend to rise over time, which may erode the purchasing power of investments.
Foreign (Non-U.S.) Risk: Non-U.S. securities may be more volatile because of political, regulatory, market and economic uncertainties associated with such securities. Fluctuations in currency exchange rates may negatively affect the value of the investment or reduce returns. These risks are magnified in emerging or developing markets.
(Historical Performance continued on next page)
| | |
| 4 | | • ALLIANCEBERNSTEIN HIGH INCOME FUND |
Historical Performance
HISTORICAL PERFORMANCE
(continued from previous page)
Credit Risk: A bond’s credit rating reflects the issuer’s ability to make timely payments of interest or principal—the lower the rating, the higher the risk of default. If the issuer’s financial strength deteriorates, the issuer’s rating may be lowered and the bond’s value may decline.
Interest Rate Risk (with Prepayment Risk): As interest rates rise, bond prices fall and vice versa—long-term securities tend to rise and fall more than short-term securities. The values of mortgage-related and asset-backed securities are particularly sensitive to changes in interest rates due to prepayment risk.
Below Investment-Grade Securities Risk: Investments in fixed-income securities with lower ratings (commonly known as “junk bonds”) tend to have a higher probability that an issuer will default or fail to meet its payment obligations.
Market Risk: The market values of the portfolio’s holdings rise and fall from day to day, so investments may lose value.
Diversification/Focused Portfolio Risk: Portfolios that hold a smaller number of securities may be more volatile than more diversified portfolios, since gains or losses from each security will have a greater impact on the portfolio’s overall value.
These risks are fully discussed in the Fund’s prospectus.
(Historical Performance continued on next page)
| | | | |
| ALLIANCEBERNSTEIN HIGH INCOME FUND • | | | 5 | |
Historical Performance
HISTORICAL PERFORMANCE
(continued from previous page)
| | | | | | | | | | |
| | | | | | | | | | |
THE FUND VS. ITS BENCHMARK
PERIODS ENDED OCTOBER 31, 2011 | | NAV Returns | | | |
| | 6 Months | | | 12 Months | | | |
AllianceBernstein High Income Fund† | | | | | | | | | | |
Class A | | | -2.51% | | | | 2.48% | | | |
|
Class B* | | | -2.93% | | | | 1.75% | | | |
|
Class C | | | -2.93% | | | | 1.73% | | | |
|
Advisor Class** | | | -2.36% | | | | 2.79% | | | |
|
Class R** | | | -2.59% | | | | 2.29% | | | |
|
Class K** | | | -2.46% | | | | 2.55% | | | |
|
Class I** | | | -2.33% | | | | 2.81% | | | |
|
Composite Benchmark: 33% JPM EMBI Global/33% JPM GBI-EM/33% BC US Corporate HY 2% Issuer Capped Index | | | -1.15% | | | | 2.34% | | | |
|
JPM EMBI Global | | | 5.28% | | | | 4.05% | | | |
|
JPM GBI-EM | | | -7.68% | | | | -2.53% | | | |
|
BC US Corporate HY 2% Issuer Capped Index | | | -0.95% | | | | 5.16% | | | |
|
† Includes the impact of proceeds received and credited to the Fund resulting from class action settlements, which enhanced the Fund’s performance for the six- and 12-month periods ended October 31, 2011, by 0.01% and 0.03%, respectively, for all share classes. * Effective January 31, 2009, Class B shares are no longer available for sale to new investors. Please see Note A for additional information. ** Please note that these share classes are for investors purchasing shares through accounts established under certain fee-based programs sponsored and maintained by certain broker-dealers and financial intermediaries, institutional pension plans and/or investment advisory clients of, and certain other persons associated with, the Adviser and its affiliates or the Funds. |
| | | | | | | | | | |
See Historical Performance and Benchmark disclosures on pages 4-5.
(Historical Performance continued on next page)
| | |
| 6 | | • ALLIANCEBERNSTEIN HIGH INCOME FUND |
Historical Performance
HISTORICAL PERFORMANCE
(continued from previous page)
GROWTH OF A $10,000 INVESTMENT IN THE FUND 12/31/01† TO 10/31/11
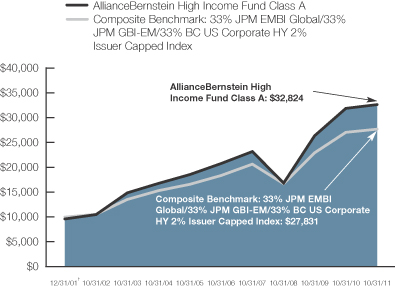
| † | | Prior to 12/31/01, data was not available for the JPM GBI-EM. |
This chart illustrates the total value of an assumed $10,000 investment in AllianceBernstein High Income Fund Class A shares (from 12/31/01† to 10/31/11) as compared to the performance of the Fund’s composite benchmark. The chart reflects the deduction of the maximum 4.25% sales charge from the initial $10,000 investment in the Fund and assumes the reinvestment of dividends and capital gains distributions.
See Historical Performance and Benchmark disclosures on pages 4-5.
(Historical Performance continued on next page)
| | | | |
| ALLIANCEBERNSTEIN HIGH INCOME FUND • | | | 7 | |
Historical Performance
HISTORICAL PERFORMANCE
(continued from previous page)
| | | | | | | | | | | | |
| AVERAGE ANNUAL RETURNS AS OF OCTOBER 31, 2011 | |
| | | NAV Returns | | | SEC Returns | | | SEC Yields* | |
| | | | | | | | | | | | |
| Class A Shares | | | | | | | | | | | | |
1 Year | | | 2.48 | % | | | -1.90 | % | | | 7.67 | % |
5 Years | | | 9.5 | % | | | 8.55 | % | | | | |
10 Years | | | 14.11 | % | | | 13.61 | % | | | | |
| | | | | | | | | | | | |
| Class B Shares | | | | | | | | | | | | |
1 Year | | | 1.75 | % | | | -1.10 | % | | | 7.26 | % |
5 Years | | | 8.63 | % | | | 8.63 | % | | | | |
10 Years(a) | | | 13.56 | % | | | 13.56 | % | | | | |
| | | | | | | | | | | | |
| Class C Shares | | | | | | | | | | | | |
1 Year | | | 1.73 | % | | | 0.78 | % | | | 7.29 | % |
5 Years | | | 8.62 | % | | | 8.62 | % | | | | |
10 Years | | | 13.21 | % | | | 13.21 | % | | | | |
| | | | | | | | | | | | |
| Advisor Class Shares‡ | | | | | | | | | | | | |
1 Year | | | 2.79 | % | | | 2.79 | % | | | 8.31 | % |
Since Inception† | | | 10.15 | % | | | 10.15 | % | | | | |
| | | | | | | | | | | | |
| Class R Shares‡ | | | | | | | | | | | | |
1 Year | | | 2.29 | % | | | 2.29 | % | | | 7.79 | % |
Since Inception† | | | 9.59 | % | | | 9.59 | % | | | | |
| | | | | | | | | | | | |
| Class K Shares‡ | | | | | | | | | | | | |
1 Year | | | 2.55 | % | | | 2.55 | % | | | 8.10 | % |
Since Inception† | | | 9.88 | % | | | 9.88 | % | | | | |
| | | | | | | | | | | | |
| Class I Shares‡ | | | | | | | | | | | | |
1 Year | | | 2.81 | % | | | 2.81 | % | | | 8.25 | % |
Since Inception† | | | 10.17 | % | | | 10.17 | % | | | | |
The Fund’s current prospectus fee table shows the Fund’s total annual operating expense ratios as 1.04%, 1.78%, 1.73%, 0.73%, 1.37%, 1.08% and 0.72% for Class A, Class B, Class C, Advisor Class, Class R, Class K and Class I shares, respectively, gross of any fee waivers or expense reimbursements. Contractual fee waivers and/or expense reimbursements limit the Fund’s annual operating expense ratios (exclusive of interest expense) to 0.95%, 1.65%, 1.65%, 0.65%, 1.15%, 0.90% and 0.65% for Class A, Class B, Class C, Advisor Class, Class R, Class K and Class I shares, respectively. These waivers/reimbursements expire on January 31, 2012. Absent reimbursements or waivers, performance would have been lower. The Financial Highlights section of this report sets forth expense ratio data for the current reporting period; the expense ratios shown above may differ from the expense ratios in the Financial Highlights sections since they are based on different time periods.
| * | | SEC yields are calculated based on SEC guidelines for the 30-day period ended October 31, 2011. |
| (a) | | Assumes conversion of Class B shares into Class A shares after six years. |
| † | | Inception date: 1/28/08. |
| ‡ | | These share classes are offered at net asset value (NAV) to eligible investors and their SEC returns are the same as the NAV returns. Please note that these share classes are for investors purchasing shares through accounts established under certain fee-based programs sponsored and maintained by certain broker-dealers and financial intermediaries, institutional pension plans and/or investment advisory clients of and certain other persons associated with, the Adviser and its affiliates or the Funds. The inception date for these share classes is listed above. |
See Historical Performance disclosures on pages 4-5.
(Historical Performance continued on next page)
| | |
| 8 | | • ALLIANCEBERNSTEIN HIGH INCOME FUND |
Historical Performance
HISTORICAL PERFORMANCE
(continued from previous page)
| | | | |
SEC AVERAGE ANNUAL RETURNS (WITH ANY APPLICABLE SALES CHARGES) AS OF THE MOST RECENT CALENDAR QUARTER-END (SEPTEMBER 30, 2011) | |
| | | SEC Returns | |
| | | | |
| Class A Shares | | | | |
1 Year | | | -4.82 | % |
5 Years | | | 7.85 | % |
10 Years | | | 13.02 | % |
| | | | |
| Class B Shares | | | | |
1 Year | | | -4.16 | % |
5 Years | | | 7.92 | % |
10 Years(a) | | | 12.97 | % |
| | | | |
| Class C Shares | | | | |
1 Year | | | -2.33 | % |
5 Years | | | 7.89 | % |
10 Years | | | 12.60 | % |
| | | | |
| Advisor Class Shares‡ | | | | |
1 Year | | | -0.29 | % |
Since Inception† | | | 8.77 | % |
| | | | |
| Class R Shares‡ | | | | |
1 Year | | | -0.80 | % |
Since Inception† | | | 8.22 | % |
| | | | |
| Class K Shares‡ | | | | |
1 Year | | | -0.54 | % |
Since Inception† | | | 8.50 | % |
| | | | |
| Class I Shares‡ | | | | |
1 Year | | | -0.28 | % |
Since Inception† | | | 8.79 | % |
| (a) | | Assumes conversion of Class B shares into Class A shares after six years. |
| † | | Inception date: 1/28/08. |
| ‡ | | Please note that these share classes are for investors purchasing shares through accounts established under certain fee-based programs sponsored and maintained by certain broker-dealers and financial intermediaries, institutional pension plans and/or investment advisory clients of, and certain other persons associated with, the Adviser and its affiliates or the Funds. The inception date for these share classes is listed above. |
See Historical Performance disclosures on pages 4-5.
| | | | |
| ALLIANCEBERNSTEIN HIGH INCOME FUND • | | | 9 | |
Historical Performance
FUND EXPENSES
(unaudited)
As a shareholder of the Fund, you incur two types of costs: (1) transaction costs, including sales charges (loads) on purchase payments, contingent deferred sales charges on redemptions and (2) ongoing costs, including management fees; distribution (12b-1) fees; and other Fund expenses. This example is intended to help you understand your ongoing costs (in dollars) of investing in the Fund and to compare these costs with the ongoing costs of investing in other mutual funds.
The Example is based on an investment of $1,000 invested at the beginning of the period and held for the entire period as indicated below.
Actual Expenses
The first line of the table below provides information about actual account values and actual expenses. You may use the information in this line, together with the amount you invested, to estimate the expenses that you paid over the period. Simply divide your account value by $1,000 (for example, an $8,600 account value divided by $1,000 = 8.6), then multiply the result by the number in the first line under the heading entitled “Expenses Paid During Period” to estimate the expenses you paid on your account during this period.
Hypothetical Example for Comparison Purposes
The second line of the table below provides information about hypothetical account values and hypothetical expenses based on the Fund’s actual expense ratio and an assumed annual rate of return of 5% before expenses, which is not the Fund’s actual return. The hypothetical account values and expenses may not be used to estimate the actual ending account balance or expenses you paid for the period. You may use this information to compare the ongoing costs of investing in the Fund and other funds by comparing this 5% hypothetical example with the 5% hypothetical examples that appear in the shareholder reports of other funds.
| | | | | | | | | | | | | | | | | | | | | | | | |
| | | Beginning
Account Value
May 1, 2011 | | | Ending
Account Value
October 31, 2011 | | | Expenses Paid
During Period* | |
| | | Actual | | | Hypothetical | | | Actual | | | Hypothetical** | | | Actual | | | Hypothetical | |
| Class A | | $ | 1,000 | | | $ | 1,000 | | | $ | 974.90 | | | $ | 1,020.21 | | | $ | 4.93 | | | $ | 5.04 | |
| Class B | | $ | 1,000 | | | $ | 1,000 | | | $ | 970.70 | | | $ | 1,016.89 | | | $ | 8.20 | | | $ | 8.39 | |
| Class C | | $ | 1,000 | | | $ | 1,000 | | | $ | 970.70 | | | $ | 1,016.69 | | | $ | 8.39 | | | $ | 8.59 | |
| Advisor Class | | $ | 1,000 | | | $ | 1,000 | | | $ | 976.40 | | | $ | 1,021.78 | | | $ | 3.39 | | | $ | 3.47 | |
| Class R | | $ | 1,000 | | | $ | 1,000 | | | $ | 974.10 | | | $ | 1,019.41 | | | $ | 5.72 | | | $ | 5.85 | |
| Class K | | $ | 1,000 | | | $ | 1,000 | | | $ | 975.40 | | | $ | 1,020.67 | | | $ | 4.48 | | | $ | 4.58 | |
| Class I | | $ | 1,000 | | | $ | 1,000 | | | $ | 976.70 | | | $ | 1,022.13 | | | $ | 3.04 | | | $ | 3.11 | |
| * | | Expenses are equal to the classes’ annualized expense ratios of 0.99%, 1.65%, 1.69%, 0.68%, 1.15%, 0.90% and 0.61%, respectively, multiplied by the average account value over the period, multiplied by 184/365 (to reflect the one-half year period). |
| ** | | Assumes 5% return before expenses. |
| | |
| 10 | | • ALLIANCEBERNSTEIN HIGH INCOME FUND |
Fund Expenses
PORTFOLIO SUMMARY
October 31, 2011 (unaudited)
PORTFOLIO STATISTICS
Net Assets ($mil): $3,202.6
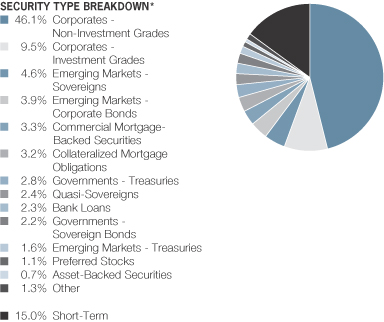
| * | | All data are as of October 31, 2011. The Fund’s security type breakdowns are expressed as a percentage of total investments and may vary over time. The Fund may also enter into derivative transactions, which may be used for hedging or investment purposes (see “Portfolio of Investments” section of the report for additional details). “Other” securities type weightings represents 0.5% or less in the following security types: Common Stocks, Governments—Sovereign Agencies, Inflation-Linked Securities, Local Governments—Municipal Bonds, Local Governments—Regional Bonds, Options Purchased—Puts, Supranationals and Warrants. |
| | | | |
| ALLIANCEBERNSTEIN HIGH INCOME FUND • | | | 11 | |
Portfolio Summary
PORTFOLIO SUMMARY
October 31, 2011 (unaudited)
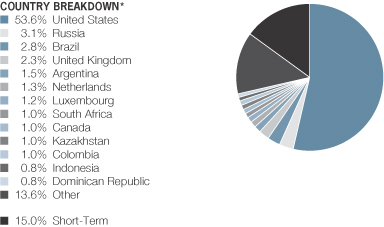
| * | | All data are as of October 31, 2011. The Fund’s country breakdowns are expressed as a percentage of total investments and may vary over time. The Fund may also enter into derivative transactions, which may be used for hedging or investment purposes (see “Portfolio of Investments” section of the report for additional details). “Other” country weightings represent 0.8% or less in the following countries: Australia, Austria, Barbados, Belgium, Bermuda, Cayman Islands, Chile, China, Cote D’Ivoire, Croatia, Czech Republic, Denmark, Egypt, El Salvador, Euro Zone, France, Gabon, Germany, Ghana, Hong Kong, Hungary, Iceland, India, Ireland, Israel, Italy, Jamaica, Japan, Lithuania, New Zealand, Norway, Panama, Peru, Philippines, Poland, Serbia & Montenegro, Singapore, Spain, Supranational, Sweden, Switzerland, Trinidad & Tobago, Turkey, Ukraine, United Arab Emirates, Uruguay and Venezuela. |
| | |
| 12 | | • ALLIANCEBERNSTEIN HIGH INCOME FUND |
Portfolio Summary
PORTFOLIO OF INVESTMENTS
October 31, 2011
| | | | | | | | | | |
| | | | | Principal
Amount
(000) | | | U.S. $ Value | |
| | | | | |
| | | | | | | | | | |
CORPORATES - NON-INVESTMENT GRADES – 47.3% | | | | | | | | | | |
Industrial – 41.0% | | | | | | | | | | |
Basic – 3.8% | | | | | | | | | | |
AK Steel Corp.
7.625%, 5/15/20(a) | | U.S.$ | | | 3,564 | | | $ | 3,332,340 | |
Aleris International, Inc.
7.625%, 2/15/18 | | | | | 6,500 | | | | 6,256,250 | |
Appleton Papers, Inc.
10.50%, 6/15/15(b) | | | | | 2,150 | | | | 2,150,000 | |
Arch Coal, Inc.
7.00%, 6/15/19(b) | | | | | 1,500 | | | | 1,552,500 | |
7.25%, 6/15/21(b) | | | | | 2,502 | | | | 2,577,060 | |
8.75%, 8/01/16 | | | | | 1,675 | | | | 1,829,937 | |
Arch Western Finance LLC
6.75%, 7/01/13 | | | | | 304 | | | | 307,040 | |
Boise Paper Holdings LLC/Boise Finance Co.
9.00%, 11/01/17 | | | | | 2,410 | | | | 2,578,700 | |
Calcipar SA
6.875%, 5/01/18(b) | | | | | 1,301 | | | | 1,209,930 | |
Celanese US Holdings LLC
6.625%, 10/15/18 | | | | | 644 | | | | 695,520 | |
CF Industries, Inc.
6.875%, 5/01/18 | | | | | 1,100 | | | | 1,254,000 | |
7.125%, 5/01/20 | | | | | 1,100 | | | | 1,280,125 | |
Consol Energy, Inc.
8.00%, 4/01/17 | | | | | 2,000 | | | | 2,190,000 | |
8.25%, 4/01/20 | | | | | 3,000 | | | | 3,285,000 | |
Graphic Packaging International, Inc.
7.875%, 10/01/18 | | | | | 2,000 | | | | 2,140,000 | |
9.50%, 6/15/17 | | | | | 480 | | | | 524,400 | |
Hexion US Finance Corp./Hexion Nova Scotia Finance ULC
4.786%, 11/15/14(c) | | | | | 1,390 | | | | 1,184,975 | |
Huntsman International LLC
8.625%, 3/15/21 | | | | | 3,900 | | | | 4,007,250 | |
Ineos Group Holdings Ltd.
8.50%, 2/15/16(b) | | | | | 9,341 | | | | 7,893,145 | |
James River Coal Co.
7.875%, 4/01/19 | | | | | 600 | | | | 510,000 | |
JMC Steel Group
8.25%, 3/15/18(b) | | | | | 1,620 | | | | 1,603,800 | |
Kerling PLC
10.625%, 2/01/17(b) | | EUR | | | 4,082 | | | | 5,252,885 | |
Kinove German Bondco GmbH
9.625%, 6/15/18(b) | | U.S.$ | | | 2,426 | | | | 2,341,090 | |
Lyondell Chemical Co.
8.00%, 11/01/17 | | | | | 566 | | | | 636,750 | |
11.00%, 5/01/18 | | | | | 2,500 | | | | 2,784,375 | |
| | | | |
| ALLIANCEBERNSTEIN HIGH INCOME FUND • | | | 13 | |
Portfolio of Investments
| | | | | | | | | | |
| | | | | Principal
Amount
(000) | | | U.S. $ Value | |
| | | | | |
| | | | | | | | | | |
MacDermid, Inc.
9.50%, 4/15/17(b) | | U.S.$ | | | 3,315 | | | $ | 3,149,250 | |
Momentive Performance Materials, Inc.
11.50%, 12/01/16 | | | | | 1,300 | | | | 1,092,000 | |
NewMarket Corp.
7.125%, 12/15/16 | | | | | 1,074 | | | | 1,106,220 | |
NewPage Corp.
10.00%, 5/01/12(a)(d) | | | | | 1,120 | | | | 128,800 | |
11.375%, 12/31/14(d) | | | | | 1,400 | | | | 1,046,500 | |
Norske Skogindustrier ASA
7.00%, 6/26/17 | | EUR | | | 1,720 | | | | 928,186 | |
Nova Chemicals Corp.
8.625%, 11/01/19 | | U.S.$ | | | 2,383 | | | | 2,680,875 | |
Omnova Solutions, Inc.
7.875%, 11/01/18 | | | | | 5,538 | | | | 4,776,525 | |
Peabody Energy Corp.
7.875%, 11/01/26 | | | | | 50 | | | | 55,125 | |
Polymer Group, Inc.
7.75%, 2/01/19(b) | | | | | 7,300 | | | | 7,573,750 | |
Polypore International, Inc.
7.50%, 11/15/17 | | | | | 1,635 | | | | 1,667,700 | |
Rain CII Carbon LLC/CII Carbon Corp.
8.00%, 12/01/18(b) | | | | | 2,500 | | | | 2,487,500 | |
Smurfit Kappa Acquisitions
7.75%, 11/15/19(b) | | EUR | | | 3,440 | | | | 4,902,726 | |
Solutia, Inc.
7.875%, 3/15/20 | | U.S.$ | | | 2,115 | | | | 2,263,050 | |
Steel Dynamics, Inc.
6.75%, 4/01/15 | | | | | 675 | | | | 686,812 | |
7.625%, 3/15/20 | | | | | 2,500 | | | | 2,650,000 | |
7.75%, 4/15/16 | | | | | 1,910 | | | | 2,010,275 | |
TPC Group LLC
8.25%, 10/01/17 | | | | | 5,374 | | | | 5,441,175 | |
Tube City IMS Corp.
9.75%, 2/01/15 | | | | | 2,000 | | | | 1,990,000 | |
United States Steel Corp.
6.65%, 6/01/37 | | | | | 4,900 | | | | 3,675,000 | |
7.375%, 4/01/20(a) | | | | | 1,000 | | | | 940,000 | |
Verso Paper Holdings LLC/Verso Paper, Inc.
8.75%, 2/01/19 | | | | | 2,250 | | | | 1,620,000 | |
Series B
11.375%, 8/01/16(a) | | | | | 2,215 | | | | 1,639,100 | |
Westvaco Corp.
8.20%, 1/15/30 | | | | | 2,940 | | | | 3,241,153 | |
Weyerhaeuser Co.
7.375%, 3/15/32 | | | | | 3,308 | | | | 3,305,496 | |
8.50%, 1/15/25 | | | | | 1,000 | | | | 1,120,789 | |
| | | | | | | | | | |
| | | | | | | | | 121,555,079 | |
| | | | | | | | | | |
| | |
| 14 | | • ALLIANCEBERNSTEIN HIGH INCOME FUND |
Portfolio of Investments
| | | | | | | | | | |
| | | | | Principal
Amount
(000) | | | U.S. $ Value | |
| | | | | |
| | | | | | | | | | |
Capital Goods – 4.8% | | | | | | | | | | |
Alion Science and Technology Corp.
12.00%, 11/01/14(e) | | U.S.$ | | | 1,083 | | | $ | 996,198 | |
Alliant Techsystems, Inc.
6.875%, 9/15/20 | | | | | 2,120 | | | | 2,178,300 | |
Ardagh Glass Finance PLC
8.75%, 2/01/20(b) | | EUR | | | 2,144 | | | | 2,714,487 | |
Ardagh Packaging Finance PLC
7.375%, 10/15/17(b) | | U.S.$ | | | 350 | | | | 360,500 | |
9.25%, 10/15/20(a)(b) | | EUR | | | 1,198 | | | | 1,558,212 | |
BE Aerospace, Inc.
6.875%, 10/01/20 | | U.S.$ | | | 2,480 | | | | 2,672,200 | |
Berry Plastics Corp.
9.75%, 1/15/21 | | | | | 5,000 | | | | 5,000,000 | |
10.25%, 3/01/16 | | | | | 302 | | | | 295,960 | |
Bombardier, Inc.
7.75%, 3/15/20(b) | | | | | 2,558 | | | | 2,813,800 | |
Building Materials Corp. of America
6.875%, 8/15/18(b) | | | | | 1,540 | | | | 1,601,600 | |
7.00%, 2/15/20(b) | | | | | 985 | | | | 1,044,100 | |
7.50%, 3/15/20(b) | | | | | 1,898 | | | | 2,021,370 | |
Case New Holland, Inc.
7.875%, 12/01/17 | | | | | 2,558 | | | | 2,884,145 | |
Clondalkin Industries BV
8.00%, 3/15/14(b) | | EUR | | | 3,449 | | | | 3,817,905 | |
CNH America LLC
7.25%, 1/15/16 | | U.S.$ | | | 997 | | | | 1,071,775 | |
Crown European Holdings SA
7.125%, 8/15/18(b) | | EUR | | | 1,295 | | | | 1,845,648 | |
Griffon Corp.
7.125%, 4/01/18 | | U.S.$ | | | 1,604 | | | | 1,527,810 | |
Grohe Holding GmbH
8.625%, 10/01/14(a)(b) | | EUR | | | 3,505 | | | | 4,534,627 | |
HeidelbergCement Finance BV
8.50%, 10/31/19 | | | | | 2,420 | | | | 3,574,581 | |
Huntington Ingalls Industries, Inc.
6.875%, 3/15/18(b) | | U.S.$ | | | 1,511 | | | | 1,522,333 | |
7.125%, 3/15/21(b) | | | | | 1,493 | | | | 1,511,663 | |
KUKA AG
8.75%, 11/15/17(b) | | EUR | | | 2,358 | | | | 3,262,837 | |
Lafarge SA
7.125%, 7/15/36 | | U.S.$ | | | 2,640 | | | | 2,308,268 | |
Manitowoc Co., Inc. (The)
8.50%, 11/01/20 | | | | | 5,474 | | | | 5,692,960 | |
9.50%, 2/15/18 | | | | | 216 | | | | 231,120 | |
Masco Corp.
6.125%, 10/03/16 | | | | | 2,315 | | | | 2,335,078 | |
Nordenia Holdings AG
9.75%, 7/15/17 | | EUR | | | 1,652 | | | | 2,188,723 | |
| | | | |
| ALLIANCEBERNSTEIN HIGH INCOME FUND • | | | 15 | |
Portfolio of Investments
| | | | | | | | | | |
| | | | | Principal
Amount
(000) | | | U.S. $ Value | |
| | | | | |
| | | | | | | | | | |
Nortek, Inc.
8.50%, 4/15/21(b) | | U.S.$ | | | 7,538 | | | $ | 6,689,975 | |
Obrascon Huarte Lain SA
7.375%, 4/28/15 | | EUR | | | 2,550 | | | | 3,528,435 | |
OI European Group BV
6.75%, 9/15/20(b) | | | | | 1,500 | | | | 2,054,794 | |
6.875%, 3/31/17(b) | | | | | 1,000 | | | | 1,390,618 | |
Plastipak Holdings, Inc.
8.50%, 12/15/15(b) | | U.S.$ | | | 3,733 | | | | 3,788,995 | |
Ply Gem Industries, Inc.
8.25%, 2/15/18(a) | | | | | 6,550 | | | | 6,173,375 | |
Pregis Corp.
6.572%, 4/15/13(c) | | EUR | | | 3,000 | | | | 4,026,566 | |
RBS Global, Inc./Rexnord LLC
8.50%, 5/01/18 | | U.S.$ | | | 3,000 | | | | 3,075,000 | |
11.75%, 8/01/16(a) | | | | | 1,324 | | | | 1,396,820 | |
Rexam PLC
6.75%, 6/29/67 | | EUR | | | 2,660 | | | | 3,386,191 | |
Reynolds Group Issuer, Inc./Reynolds Group Issuer LLC/Reynolds Group Issuer Lu
7.125%, 4/15/19(b) | | U.S.$ | | | 712 | | | | 726,240 | |
7.875%, 8/15/19(b) | | | | | 4,653 | | | | 4,862,385 | |
9.00%, 5/15/18-4/15/19(b) | | | | | 6,688 | | | | 6,464,045 | |
9.875%, 8/15/19(b) | | | | | 4,304 | | | | 4,304,000 | |
RSC Equipment Rental, Inc./RSC Holdings III LLC
8.25%, 2/01/21 | | | | | 4,500 | | | | 4,567,500 | |
10.25%, 11/15/19 | | | | | 2,000 | | | | 2,190,000 | |
Sealed Air Corp.
8.125%, 9/15/19(b) | | | | | 1,729 | | | | 1,875,965 | |
8.375%, 9/15/21(b) | | | | | 1,773 | | | | 1,919,273 | |
Sequa Corp.
11.75%, 12/01/15(b) | | | | | 5,545 | | | | 5,863,838 | |
Sterling Merger, Inc.
11.00%, 10/01/19(b) | | | | | 5,184 | | | | 5,132,160 | |
Terex Corp.
8.00%, 11/15/17 | | | | | 2,356 | | | | 2,314,770 | |
Textron Financial Corp.
6.00%, 2/15/67(b) | | | | | 125 | | | | 93,750 | |
TransDigm, Inc.
7.75%, 12/15/18 | | | | | 4,800 | | | | 5,208,000 | |
United Rentals North America, Inc.
8.375%, 9/15/20(a) | | | | | 6,300 | | | | 6,536,250 | |
10.875%, 6/15/16 | | | | | 1,000 | | | | 1,130,000 | |
USG Corp.
6.30%, 11/15/16 | | | | | 1,911 | | | | 1,476,248 | |
| | |
| 16 | | • ALLIANCEBERNSTEIN HIGH INCOME FUND |
Portfolio of Investments
| | | | | | | | | | |
| | | | | Principal
Amount
(000) | | | U.S. $ Value | |
| | | | | |
| | | | | | | | | | |
Wienerberger AG
6.50%, 2/09/17 | | EUR | | | 2,900 | | | $ | 3,029,611 | |
| | | | | | | | | | |
| | | | | | | | | 154,771,004 | |
| | | | | | | | | | |
Communications - Media – 4.4% | | | | | | | | | | |
Allbritton Communications Co.
8.00%, 5/15/18 | | U.S.$ | | | 5,115 | | | | 5,140,575 | |
Cablevision Systems Corp.
8.00%, 4/15/20 | | | | | 1,700 | | | | 1,793,500 | |
CCH II LLC/CCH II Capital Corp.
13.50%, 11/30/16 | | | | | 2,000 | | | | 2,305,000 | |
CCO Holdings LLC/CCO Holdings Capital Corp.
7.00%, 1/15/19 | | | | | 2,000 | | | | 2,075,000 | |
7.25%, 10/30/17 | | | | | 2,250 | | | | 2,351,250 | |
Cengage Learning Acquisitions, Inc.
10.50%, 1/15/15(b) | | | | | 3,885 | | | | 3,069,150 | |
Cequel Communications Holdings I LLC and Cequel Capital Corp.
8.625%, 11/15/17(b) | | | | | 4,615 | | | | 4,822,675 | |
Charter Communications Operating LLC/Charter Communications Operating Capital
8.00%, 4/30/12(b) | | | | | 1,275 | | | | 1,303,688 | |
Clear Channel Communications, Inc.
5.75%, 1/15/13 | | | | | 2,388 | | | | 2,256,660 | |
9.00%, 3/01/21 | | | | | 2,916 | | | | 2,595,240 | |
10.75%, 8/01/16 | | | | | 3,104 | | | | 2,265,920 | |
Clear Channel Worldwide Holdings, Inc.
9.25%, 12/15/17 | | | | | 65 | | | | 70,200 | |
Series B
9.25%, 12/15/17 | | | | | 4,258 | | | | 4,619,930 | |
Crown Media Holdings, Inc.
10.50%, 7/15/19(b) | | | | | 3,405 | | | | 3,541,200 | |
CSC Holdings LLC
6.75%, 4/15/12 | | | | | 190 | | | | 192,850 | |
7.875%, 2/15/18(a) | | | | | 2,212 | | | | 2,427,670 | |
Cumulus Media, Inc.
7.75%, 5/01/19(a)(b) | | | | | 3,988 | | | | 3,668,960 | |
Dex One Corp.
12.00%, 1/29/17(e) | | | | | 4,048 | | | | 910,881 | |
DISH DBS Corp.
6.75%, 6/01/21 | | | | | 1,500 | | | | 1,548,750 | |
7.125%, 2/01/16 | | | | | 1,250 | | | | 1,328,125 | |
EH Holding Corp.
7.625%, 6/15/21(b) | | | | | 5,725 | | | | 5,925,375 | |
Houghton Mifflin Harcourt Publishing Co.
10.50%, 6/01/19(b) | | | | | 2,400 | | | | 1,776,000 | |
| | | | |
| ALLIANCEBERNSTEIN HIGH INCOME FUND • | | | 17 | |
Portfolio of Investments
| | | | | | | | | | |
| | | | | Principal
Amount
(000) | | | U.S. $ Value | |
| | | | | |
| | | | | | | | | | |
Intelsat Jackson Holdings SA
7.25%, 10/15/20(b) | | U.S.$ | | | 2,125 | | | $ | 2,135,625 | |
11.25%, 6/15/16 | | | | | 2,472 | | | | 2,607,960 | |
Intelsat Luxembourg SA
11.25%, 2/04/17 | | | | | 3,200 | | | | 3,176,000 | |
11.50%, 2/04/17(b)(e) | | | | | 1,500 | | | | 1,500,000 | |
11.50%, 2/04/17(e) | | | | | 1,750 | | | | 1,750,000 | |
Kabel BW Erste Beteiligungs GmbH/Kabel Baden-Wurttemberg GmbH & Co. KG
7.50%, 3/15/19(b) | | | | | 1,029 | | | | 1,070,160 | |
7.50%, 3/15/19(b) | | EUR | | | 1,263 | | | | 1,795,672 | |
Lamar Media Corp.
6.625%, 8/15/15 | | U.S.$ | | | 3,941 | | | | 3,960,705 | |
7.875%, 4/15/18 | | | | | 1,000 | | | | 1,047,500 | |
Liberty Interactive LLC
5.70%, 5/15/13 | | | | | 1,145 | | | | 1,160,744 | |
LIN Television Corp.
6.50%, 5/15/13 | | | | | 3,050 | | | | 3,050,000 | |
8.375%, 4/15/18 | | | | | 2,750 | | | | 2,832,500 | |
Local TV Finance LLC
9.25%, 6/15/15(b)(e) | | | | | 3,360 | | | | 3,124,800 | |
McClatchy Co. (The)
11.50%, 2/15/17 | | | | | 3,600 | | | | 3,555,000 | |
New York Times Co. (The)
6.625%, 12/15/16 | | | | | 2,200 | | | | 2,200,000 | |
Nexstar Broadcasting, Inc./Mission Broadcasting, Inc.
8.875%, 4/15/17 | | | | | 2,021 | | | | 2,051,315 | |
Quebecor Media, Inc.
7.75%, 3/15/16 | | | | | 5,952 | | | | 6,145,440 | |
RR Donnelley & Sons Co.
4.95%, 4/01/14 | | | | | 2,400 | | | | 2,352,000 | |
7.25%, 5/15/18 | | | | | 3,401 | | | | 3,315,975 | |
Sinclair Television Group, Inc.
8.375%, 10/15/18 | | | | | 1,710 | | | | 1,761,300 | |
9.25%, 11/01/17(b) | | | | | 3,430 | | | | 3,738,700 | |
Sirius XM Radio, Inc.
8.75%, 4/01/15(b) | | | | | 3,500 | | | | 3,876,250 | |
Telesat Canada/Telesat LLC
11.00%, 11/01/15 | | | | | 1,600 | | | | 1,740,000 | |
Thomson Corp.
5.75%, 9/25/15(d)(f) | | EUR | | | 925 | | | | 1,280 | |
Univision Communications, Inc.
6.875%, 5/15/19(b) | | U.S.$ | | | 4,700 | | | | 4,582,500 | |
8.50%, 5/15/21(b) | | | | | 3,600 | | | | 3,240,000 | |
UPC Holding BV
8.375%, 8/15/20(b) | | EUR | | | 3,000 | | | | 4,088,833 | |
UPCB Finance III Ltd.
6.625%, 7/01/20(b) | | U.S.$ | | | 2,615 | | | | 2,601,925 | |
| | |
| 18 | | • ALLIANCEBERNSTEIN HIGH INCOME FUND |
Portfolio of Investments
| | | | | | | | | | |
| | | | | Principal
Amount
(000) | | | U.S. $ Value | |
| | | | | |
| | | | | | | | | | |
UPCB Finance Ltd.
7.625%, 1/15/20(b) | | EUR | | | 1,600 | | | $ | 2,230,524 | |
Valassis Communications, Inc.
6.625%, 2/01/21(a) | | U.S.$ | | | 1,325 | | | | 1,258,750 | |
Virgin Media Finance PLC
8.375%, 10/15/19 | | | | | 4,650 | | | | 5,173,125 | |
XM Satellite Radio, Inc.
7.625%, 11/01/18(b) | | | | | 1,345 | | | | 1,445,875 | |
| | | | | | | | | | |
| | | | | | | | | 140,559,057 | |
| | | | | | | | | | |
Communications - Telecommunications – 2.7% | | | | | | | | | | |
Cincinnati Bell, Inc.
8.25%, 10/15/17 | | | | | 750 | | | | 755,625 | |
8.75%, 3/15/18 | | | | | 4,650 | | | | 4,464,000 | |
Cricket Communications, Inc.
7.75%, 10/15/20(a) | | | | | 3,770 | | | | 3,223,350 | |
Crown Castle International Corp.
7.125%, 11/01/19 | | | | | 2,500 | | | | 2,706,250 | |
Data & Audio Visual Enterprise
9.50%, 4/29/18 | | CAD | | | 2,500 | | | | 2,279,339 | |
Digicel Group Ltd.
10.50%, 4/15/18(b) | | U.S.$ | | | 4,241 | | | | 4,368,230 | |
Digicel Ltd.
12.00%, 4/01/14(b) | | | | | 660 | | | | 745,800 | |
eAccess Ltd.
8.25%, 4/01/18(b) | | | | | 3,648 | | | | 3,506,640 | |
ERC Ireland Finance Ltd.
6.535%, 8/15/16(b)(c) | | EUR | | | 1,000 | | | | 55,348 | |
Fairpoint Communications, Inc./Old Series 1
13.125%, 4/02/18(d) | | U.S.$ | | | 1,048 | | | | 10,482 | |
Frontier Communications Corp.
6.25%, 1/15/13 | | | | | 1,222 | | | | 1,249,495 | |
8.125%, 10/01/18 | | | | | 1,600 | | | | 1,708,000 | |
9.00%, 8/15/31 | | | | | 1,600 | | | | 1,568,000 | |
Level 3 Financing, Inc.
8.75%, 2/15/17 | | | | | 3,220 | | | | 3,292,450 | |
9.25%, 11/01/14 | | | | | 567 | | | | 579,049 | |
9.375%, 4/01/19 | | | | | 2,200 | | | | 2,299,000 | |
10.00%, 2/01/18 | | | | | 2,200 | | | | 2,332,000 | |
MetroPCS Wireless, Inc.
6.625%, 11/15/20 | | | | | 2,650 | | | | 2,491,000 | |
7.875%, 9/01/18 | | | | | 3,000 | | | | 3,052,500 | |
NII Capital Corp.
7.625%, 4/01/21 | | | | | 2,861 | | | | 2,946,830 | |
PAETEC Holding Corp.
9.50%, 7/15/15 | | | | | 1,250 | | | | 1,303,125 | |
9.875%, 12/01/18 | | | | | 2,675 | | | | 2,942,500 | |
| | | | |
| ALLIANCEBERNSTEIN HIGH INCOME FUND • | | | 19 | |
Portfolio of Investments
| | | | | | | | | | |
| | | | | Principal
Amount
(000) | | | U.S. $ Value | |
| | | | | |
| | | | | | | | | | |
Phones4u Finance PLC
9.50%, 4/01/18(b) | | GBP | | | 4,000 | | | $ | 5,338,228 | |
Sprint Capital Corp.
6.875%, 11/15/28 | | U.S.$ | | | 4,250 | | | | 3,102,500 | |
Sunrise Communications Holdings SA
8.50%, 12/31/18(b) | | EUR | | | 2,500 | | | | 3,407,361 | |
Telenet Finance Luxembourg SCA
6.375%, 11/15/20(a)(b) | | | | | 2,500 | | | | 3,346,824 | |
tw telecom holdings, Inc.
8.00%, 3/01/18 | | U.S.$ | | | 4,824 | | | | 5,113,440 | |
Wind Acquisition Finance SA
7.25%, 2/15/18(b) | | | | | 2,325 | | | | 2,255,250 | |
11.75%, 7/15/17(b) | | | | | 4,400 | | | | 4,356,000 | |
Windstream Corp.
7.50%, 4/01/23 | | | | | 1,750 | | | | 1,776,250 | |
7.75%, 10/15/20-10/01/21 | | | | | 4,580 | | | | 4,779,150 | |
8.125%, 8/01/13-9/01/18 | | | | | 3,652 | | | | 3,907,640 | |
| | | | | | | | | | |
| | | | | | | | | 85,261,656 | |
| | | | | | | | | | |
Consumer Cyclical - Automotive – 2.2% | | | | | | | | |
Affinia Group, Inc.
9.00%, 11/30/14 | | | | | 4,100 | | | | 4,059,000 | |
Allison Transmission, Inc.
7.125%, 5/15/19(b) | | | | | 5,699 | | | | 5,528,030 | |
11.00%, 11/01/15(b) | | | | | 3,700 | | | | 3,894,250 | |
American Axle & Manufacturing Holdings, Inc.
9.25%, 1/15/17(b) | | | | | 2,876 | | | | 3,134,840 | |
Chrysler Group LLC/CG Co-Issuer, Inc.
8.00%, 6/15/19(b) | | | | | 6,800 | | | | 6,256,000 | |
Commercial Vehicle Group, Inc.
7.875%, 4/15/19(b) | | | | | 2,500 | | | | 2,437,500 | |
Cooper Tire & Rubber Co.
8.00%, 12/15/19 | | | | | 3,000 | | | | 3,105,000 | |
Dana Holding Corp.
6.50%, 2/15/19 | | | | | 675 | | | | 680,063 | |
6.75%, 2/15/21 | | | | | 638 | | | | 647,570 | |
Delphi Corp.
5.875%, 5/15/19(b) | | | | | 1,278 | | | | 1,297,170 | |
6.125%, 5/15/21(b) | | | | | 957 | | | | 976,140 | |
Exide Technologies
8.625%, 2/01/18 | | | | | 1,991 | | | | 1,991,000 | |
Ford Motor Co.
7.45%, 7/16/31(a) | | | | | 5,000 | | | | 5,950,001 | |
Ford Motor Credit Co. LLC
3.148%, 1/13/12(a)(c) | | | | | 640 | | | | 640,960 | |
7.00%, 10/01/13 | | | | | 974 | | | | 1,047,461 | |
8.00%, 12/15/16 | | | | | 2,650 | | | | 3,059,875 | |
| | |
| 20 | | • ALLIANCEBERNSTEIN HIGH INCOME FUND |
Portfolio of Investments
| | | | | | | | | | |
| | | | | Principal
Amount
(000) | | | U.S. $ Value | |
| | | | | |
| | | | | | | | | | |
Goodyear Dunlop Tires Europe BV
6.75%, 4/15/19(b) | | EUR | | | 2,100 | | | $ | 2,775,010 | |
Goodyear Tire & Rubber Co. (The)
7.00%, 3/15/28 | | U.S.$ | | | 700 | | | | 644,000 | |
8.25%, 8/15/20(a) | | | | | 1,619 | | | | 1,732,330 | |
8.75%, 8/15/20 | | | | | 2,679 | | | | 2,879,925 | |
Lear Corp.
7.875%, 3/15/18 | | | | | 1,500 | | | | 1,616,250 | |
8.125%, 3/15/20 | | | | | 2,000 | | | | 2,190,000 | |
Navistar International Corp.
8.25%, 11/01/21 | | | | | 4,880 | | | | 5,307,000 | |
Tenneco, Inc.
6.875%, 12/15/20 | | | | | 3,700 | | | | 3,792,500 | |
7.75%, 8/15/18 | | | | | 1,143 | | | | 1,200,150 | |
UCI International, Inc.
8.625%, 2/15/19 | | | | | 2,685 | | | | 2,644,725 | |
| | | | | | | | | | |
| | | | | | | | | 69,486,750 | |
| | | | | | | | | | |
Consumer Cyclical - Entertainment – 0.7% | | | | | | | | | | |
AMC Entertainment, Inc.
8.00%, 3/01/14 | | | | | 1,000 | | | | 990,000 | |
9.75%, 12/01/20 | | | | | 3,040 | | | | 2,948,800 | |
ClubCorp Club Operations, Inc.
10.00%, 12/01/18 | | | | | 3,500 | | | | 3,307,500 | |
Greektown Holdings LLC
10.75%, 12/01/13(d)(f) | | | | | 715 | | | | – 0 | – |
NAI Entertainment Holdings LLC
8.25%, 12/15/17(b) | | | | | 4,639 | | | | 4,882,548 | |
Pinnacle Entertainment, Inc.
7.50%, 6/15/15 | | | | | 4,050 | | | | 3,979,125 | |
8.625%, 8/01/17 | | | | | 260 | | | | 277,550 | |
8.75%, 5/15/20 | | | | | 271 | | | | 273,710 | |
Regal Entertainment Group
9.125%, 8/15/18(a) | | | | | 5,805 | | | | 6,211,350 | |
| | | | | | | | | | |
| | | | | | | | | 22,870,583 | |
| | | | | | | | | | |
Consumer Cyclical - Other – 3.8% | | | | | | | | | | |
Beazer Homes USA, Inc.
6.875%, 7/15/15 | | | | | 1,000 | | | | 823,750 | |
12.00%, 10/15/17 | | | | | 1,860 | | | | 1,992,525 | |
Boyd Gaming Corp.
6.75%, 4/15/14 | | | | | 925 | | | | 878,750 | |
9.125%, 12/01/18(a) | | | | | 2,700 | | | | 2,639,250 | |
Broder Brothers Co.
12.00%, 10/15/13(b)(e) | | | | | 331 | | | | 329,068 | |
Caesars Entertainment Operating Co., Inc.
10.00%, 12/15/18 | | | | | 1,935 | | | | 1,458,506 | |
11.25%, 6/01/17 | | | | | 1,350 | | | | 1,444,500 | |
| | | | |
| ALLIANCEBERNSTEIN HIGH INCOME FUND • | | | 21 | |
Portfolio of Investments
| | | | | | | | | | |
| | | | | Principal
Amount
(000) | | | U.S. $ Value | |
| | | | | |
| | | | | | | | | | |
Chukchansi Economic Development Authority
8.00%, 11/15/13(b) | | U.S.$ | | | 2,075 | | | $ | 1,353,938 | |
DR Horton, Inc.
6.50%, 4/15/16 | | | | | 1,000 | | | | 1,022,500 | |
GWR Operating Partnership LLP
10.875%, 4/01/17 | | | | | 3,500 | | | | 3,727,500 | |
Host Hotels & Resorts LP
6.875%, 11/01/14 | | | | | 481 | | | | 487,614 | |
9.00%, 5/15/17(a) | | | | | 1,000 | | | | 1,117,500 | |
Series Q
6.75%, 6/01/16 | | | | | 2,558 | | | | 2,647,530 | |
Isle of Capri Casinos, Inc.
7.00%, 3/01/14(a) | | | | | 3,570 | | | | 3,427,200 | |
7.75%, 3/15/19 | | | | | 2,950 | | | | 2,861,500 | |
K Hovnanian Enterprises, Inc.
10.625%, 10/15/16(a) | | | | | 5,380 | | | | 4,613,350 | |
KB Home
5.875%, 1/15/15 | | | | | 1,995 | | | | 1,765,575 | |
7.25%, 6/15/18 | | | | | 1,000 | | | | 847,500 | |
9.10%, 9/15/17 | | | | | 2,300 | | | | 2,104,500 | |
Lennar Corp.
6.95%, 6/01/18 | | | | | 2,780 | | | | 2,717,450 | |
Series B
6.50%, 4/15/16 | | | | | 3,200 | | | | 3,088,000 | |
Levi Strauss & Co.
7.625%, 5/15/20(a) | | | | | 1,000 | | | | 1,022,500 | |
8.875%, 4/01/16 | | | | | 3,000 | | | | 3,142,500 | |
M/I Homes, Inc.
8.625%, 11/15/18 | | | | | 5,325 | | | | 4,792,500 | |
Marina District Finance Co., Inc.
9.50%, 10/15/15(a) | | | | | 1,200 | | | | 1,188,000 | |
9.875%, 8/15/18(a) | | | | | 5,220 | | | | 5,154,750 | |
Meritage Homes Corp.
6.25%, 3/15/15 | | | | | 1,350 | | | | 1,296,000 | |
7.15%, 4/15/20 | | | | | 2,500 | | | | 2,306,250 | |
MGM Resorts International
6.625%, 7/15/15(a) | | | | | 2,000 | | | | 1,900,000 | |
7.625%, 1/15/17 | | | | | 4,965 | | | | 4,617,450 | |
NCL Corp. Ltd.
9.50%, 11/15/18(b) | | | | | 3,500 | | | | 3,640,000 | |
11.75%, 11/15/16 | | | | | 2,000 | | | | 2,300,000 | |
Penn National Gaming, Inc.
8.75%, 8/15/19 | | | | | 2,775 | | | | 2,997,000 | |
Pulte Group, Inc.
7.875%, 6/15/32 | | | | | 2,600 | | | | 2,164,500 | |
PVH Corp.
7.375%, 5/15/20 | | | | | 2,340 | | | | 2,538,900 | |
| | |
| 22 | | • ALLIANCEBERNSTEIN HIGH INCOME FUND |
Portfolio of Investments
| | | | | | | | | | |
| | | | | Principal
Amount
(000) | | | U.S. $ Value | |
| | | | | |
| | | | | | | | | | |
Quiksilver, Inc.
6.875%, 4/15/15 | | U.S.$ | | | 5,000 | | | $ | 4,712,500 | |
Royal Caribbean Cruises Ltd.
7.25%, 6/15/16-3/15/18 | | | | | 3,850 | | | | 4,061,000 | |
7.50%, 10/15/27 | | | | | 1,000 | | | | 967,500 | |
Ryland Group, Inc.
6.625%, 5/01/20 | | | | | 4,500 | | | | 3,982,500 | |
Seminole Indian Tribe of Florida
6.535%, 10/01/20(b) | | | | | 390 | | | | 376,389 | |
7.75%, 10/01/17(b) | | | | | 2,835 | | | | 2,948,400 | |
Shea Homes LP/Shea Homes Funding Corp.
8.625%, 5/15/19(b) | | | | | 3,886 | | | | 3,361,390 | |
Sheraton Holding Corp.
7.375%, 11/15/15 | | | | | 2,035 | | | | 2,243,587 | |
Standard Pacific Corp.
8.375%, 5/15/18 | | | | | 3,250 | | | | 3,136,250 | |
10.75%, 9/15/16 | | | | | 1,667 | | | | 1,725,345 | |
Starwood Hotels & Resorts Worldwide, Inc.
7.875%, 5/01/12 | | | | | 2,500 | | | | 2,568,750 | |
Station Casinos, Inc.
6.625%, 3/15/18(d)(f) | | | | | 1,755 | | | | – 0 | – |
6.875%, 3/01/16(d)(f) | | | | | 1,500 | | | | – 0 | – |
Sugarhouse HSP Gaming Prop Mezz LP/Sugarhouse HSP Gaming Finance Corp.
8.625%, 4/15/16(b) | | | | | 2,016 | | | | 2,056,320 | |
Toll Brothers Finance Corp.
5.15%, 5/15/15 | | | | | 1,900 | | | | 1,945,507 | |
Tropicana Entertainment LLC/Tropicana Finance Corp.
9.625%, 12/15/14(d)(f) | | | | | 750 | | | | – 0 | – |
WCI Communities, Inc.
6.625%, 3/15/15(d)(f)(g) | | | | | 750 | | | | – 0 | – |
Wynn Las Vegas LLC/Wynn Las Vegas Capital Corp.
7.75%, 8/15/20 | | | | | 5,400 | | | | 5,940,000 | |
| | | | | | | | | | |
| | | | | | | | | 120,433,794 | |
| | | | | | | | | | |
Consumer Cyclical - Restaurants – 0.4% | | | | | | | | |
Burger King Corp.
9.875%, 10/15/18(a) | | | | | 4,666 | | | | 5,004,285 | |
CKE Restaurants, Inc.
11.375%, 7/15/18 | | | | | 3,966 | | | | 4,263,450 | |
Landry’s Restaurants, Inc.
11.625%, 12/01/15(b) | | | | | 825 | | | | 874,500 | |
11.625%, 12/01/15 | | | | | 3,580 | | | | 3,794,800 | |
| | | | | | | | | | |
| | | | | | | | | 13,937,035 | |
| | | | | | | | | | |
| | | | |
| ALLIANCEBERNSTEIN HIGH INCOME FUND • | | | 23 | |
Portfolio of Investments
| | | | | | | | | | |
| | | | | Principal
Amount
(000) | | | U.S. $ Value | |
| | | | | |
| | | | | | | | | | |
Consumer Cyclical - Retailers – 1.3% | | | | | | | | | | |
Asbury Automotive Group, Inc.
8.375%, 11/15/20 | | U.S.$ | | | 1,555 | | | $ | 1,539,450 | |
AutoNation, Inc.
6.75%, 4/15/18 | | | | | 349 | | | | 362,088 | |
Bon-Ton Department Stores, Inc. (The)
10.25%, 3/15/14 | | | | | 4,930 | | | | 4,375,375 | |
Burlington Coat Factory Warehouse Corp.
10.00%, 2/15/19(b) | | | | | 601 | | | | 594,990 | |
GameStop Corp./GameStop, Inc.
8.00%, 10/01/12 | | | | | 671 | | | | 671,067 | |
Gymboree Corp.
9.125%, 12/01/18(a) | | | | | 4,800 | | | | 4,296,000 | |
Hines Nurseries, Inc.
10.25%, 10/01/11(d)(f)(g) | | | | | 1,000 | | | | – 0 | – |
JC Penney Corp., Inc.
7.40%, 4/01/37 | | | | | 4,100 | | | | 3,823,250 | |
Limited Brands, Inc.
5.25%, 11/01/14 | | | | | 3,194 | | | | 3,305,790 | |
6.625%, 4/01/21 | | | | | 1,000 | | | | 1,050,000 | |
6.90%, 7/15/17 | | | | | 3,710 | | | | 3,960,425 | |
Michaels Stores, Inc.
7.75%, 11/01/18 | | | | | 3,100 | | | | 3,146,500 | |
11.375%, 11/01/16 | | | | | 1,000 | | | | 1,042,510 | |
Neiman Marcus Group, Inc. (The)
10.375%, 10/15/15 | | | | | 500 | | | | 520,000 | |
Penske Automotive Group, Inc.
7.75%, 12/15/16 | | | | | 1,250 | | | | 1,281,250 | |
Rite Aid Corp.
6.875%, 8/15/13 | | | | | 470 | | | | 460,600 | |
8.00%, 8/15/20(a) | | | | | 2,300 | | | | 2,527,125 | |
9.50%, 6/15/17 | | | | | 1,500 | | | | 1,365,000 | |
10.25%, 10/15/19 | | | | | 2,000 | | | | 2,175,000 | |
Toys R US, Inc.
7.375%, 10/15/18 | | | | | 4,900 | | | | 4,508,000 | |
YCC Holdings LLC/Yankee Finance, Inc.
10.25%, 2/15/16(e) | | | | | 625 | | | | 575,000 | |
| | | | | | | | | | |
| | | | | | | | | 41,579,420 | |
| | | | | | | | | | |
Consumer Non-Cyclical – 6.2% | | | | | | | | | | |
ACCO Brands Corp.
7.625%, 8/15/15(a) | | | | | 3,550 | | | | 3,523,375 | |
10.625%, 3/15/15 | | | | | 1,587 | | | | 1,749,668 | |
Alere, Inc.
8.625%, 10/01/18 | | | | | 6,195 | | | | 6,187,256 | |
AMGH Merger Sub, Inc.
9.25%, 11/01/18(b) | | | | | 3,765 | | | | 3,915,600 | |
ARAMARK Corp.
8.50%, 2/01/15 | | | | | 5,942 | | | | 6,164,825 | |
| | |
| 24 | | • ALLIANCEBERNSTEIN HIGH INCOME FUND |
Portfolio of Investments
| | | | | | | | | | |
| | | | | Principal
Amount
(000) | | | U.S. $ Value | |
| | | | | |
| | | | | | | | | | |
Aurora Diagnostics Holdings/Aurora Diagnostics Financing, Inc.
10.75%, 1/15/18(b) | | U.S.$ | | | 3,750 | | | $ | 3,750,000 | |
Bakkavor Finance 2 PLC
8.25%, 2/15/18(b) | | GBP | | | 2,500 | | | | 3,055,010 | |
Bausch & Lomb, Inc.
9.875%, 11/01/15 | | U.S.$ | | | 4,855 | | | | 5,097,750 | |
Biomet, Inc.
11.625%, 10/15/17 | | | | | 5,550 | | | | 6,049,500 | |
BioScrip, Inc.
10.25%, 10/01/15 | | | | | 4,005 | | | | 4,035,037 | |
Boparan Holdings Ltd.
9.875%, 4/30/18(b) | | GBP | | | 3,500 | | | | 4,952,332 | |
Capsugel FinanceCo SCA
9.875%, 8/01/19(b) | | EUR | | | 4,550 | | | | 6,484,710 | |
Care UK Health & Social Care PLC
9.75%, 8/01/17 | | GBP | | | 2,900 | | | | 4,196,619 | |
Catalent Pharma Solutions, Inc.
9.50%, 4/15/15(e) | | U.S.$ | | | 4,534 | | | | 4,511,031 | |
CHS/Community Health Systems, Inc.
8.875%, 7/15/15 | | | | | 5,495 | | | | 5,625,506 | |
CityCenter Holdings LLC/CityCenter Finance Corp.
7.625%, 1/15/16(b) | | | | | 5,907 | | | | 6,143,280 | |
ConvaTec Healthcare E SA
10.50%, 12/15/18(b) | | | | | 2,961 | | | | 2,849,963 | |
Cott Beverages, Inc.
8.125%, 9/01/18 | | | | | 1,390 | | | | 1,483,825 | |
8.375%, 11/15/17 | | | | | 1,400 | | | | 1,505,000 | |
Del Monte Foods Co.
7.625%, 2/15/19(b) | | | | | 1,300 | | | | 1,235,000 | |
DJO Finance LLC/DJO Finance Corp.
7.75%, 4/15/18 | | | | | 720 | | | | 608,400 | |
10.875%, 11/15/14 | | | | | 3,030 | | | | 3,037,575 | |
Dole Food Co., Inc.
8.00%, 10/01/16(b) | | | | | 4,350 | | | | 4,589,250 | |
Elan Finance PLC/Elan Finance Corp.
8.75%, 10/15/16 | | | | | 3,050 | | | | 3,248,250 | |
Elizabeth Arden, Inc.
7.375%, 3/15/21 | | | | | 4,400 | | | | 4,455,000 | |
Emergency Medical Services Corp.
8.125%, 6/01/19(b) | | | | | 6,342 | | | | 6,342,000 | |
Endo Pharmaceuticals Holdings, Inc.
7.00%, 7/15/19(b) | | | | | 1,160 | | | | 1,252,800 | |
7.25%, 1/15/22(b) | | | | | 1,555 | | | | 1,675,513 | |
Gentiva Health Services, Inc.
11.50%, 9/01/18 | | | | | 1,560 | | | | 1,248,000 | |
Giant Funding Corp.
8.25%, 2/01/18(b) | | | | | 3,575 | | | | 3,762,687 | |
| | | | |
| ALLIANCEBERNSTEIN HIGH INCOME FUND • | | | 25 | |
Portfolio of Investments
| | | | | | | | | | |
| | | | | Principal
Amount
(000) | | | U.S. $ Value | |
| | | | | |
| | | | | | | | | | |
HCA Holdings, Inc.
7.75%, 5/15/21(a)(b) | | U.S.$ | | | 3,500 | | | $ | 3,500,000 | |
HCA, Inc.
6.375%, 1/15/15 | | | | | 3,017 | | | | 3,099,968 | |
6.50%, 2/15/16-2/15/20 | | | | | 3,482 | | | | 3,630,289 | |
Healthsouth Corp.
7.75%, 9/15/22 | | | | | 435 | | | | 435,000 | |
8.125%, 2/15/20 | | | | | 1,455 | | | | 1,476,825 | |
Jarden Corp.
7.50%, 1/15/20 | | | | | 3,750 | | | | 4,012,500 | |
Kindred Healthcare, Inc.
8.25%, 6/01/19(b) | | | | | 2,980 | | | | 2,637,300 | |
Kinetic Concepts, Inc./KCI USA, Inc.
10.50%, 11/01/18(b) | | | | | 3,500 | | | | 3,539,375 | |
LifePoint Hospitals, Inc.
6.625%, 10/01/20 | | | | | 2,150 | | | | 2,241,375 | |
Mylan Inc.
7.625%, 7/15/17(b) | | | | | 330 | | | | 365,475 | |
7.875%, 7/15/20(b) | | | | | 335 | | | | 375,200 | |
New Albertsons, Inc.
7.45%, 8/01/29 | | | | | 4,110 | | | | 3,216,075 | |
8.00%, 5/01/31 | | | | | 2,600 | | | | 2,184,000 | |
Picard Bondco SA
9.00%, 10/01/18(b) | | EUR | | | 2,300 | | | | 3,214,335 | |
Pilgrim’s Pride Corp.
7.875%, 12/15/18(a)(b) | | U.S.$ | | | 6,250 | | | | 5,187,500 | |
Pinnacle Foods Finance LLC/Pinnacle Foods Finance Corp.
8.25%, 9/01/17 | | | | | 2,500 | | | | 2,537,500 | |
10.625%, 4/01/17(a) | | | | | 3,000 | | | | 3,105,000 | |
R&R Ice Cream PLC
8.375%, 11/15/17(b) | | EUR | | | 3,450 | | | | 4,463,470 | |
Select Medical Corp.
7.625%, 2/01/15 | | U.S.$ | | | 2,554 | | | | 2,375,220 | |
Select Medical Holdings Corp.
6.267%, 9/15/15(c) | | | | | 2,900 | | | | 2,479,500 | |
Smithfield Foods, Inc.
7.75%, 7/01/17 | | | | | 5,250 | | | | 5,670,000 | |
Stater Bros Holdings, Inc.
7.375%, 11/15/18 | | | | | 2,275 | | | | 2,411,500 | |
STHI Holding Corp.
8.00%, 3/15/18(b) | | | | | 930 | | | | 948,600 | |
SUPERVALU, Inc.
8.00%, 5/01/16(a) | | | | | 2,500 | | | | 2,625,000 | |
Tenet Healthcare Corp.
6.875%, 11/15/31 | | | | | 4,000 | | | | 3,320,000 | |
9.25%, 2/01/15 | | | | | 2,000 | | | | 2,135,000 | |
Tops Holding Corp./Tops Markets LLC
10.125%, 10/15/15 | | | | | 2,555 | | | | 2,606,100 | |
| | |
| 26 | | • ALLIANCEBERNSTEIN HIGH INCOME FUND |
Portfolio of Investments
| | | | | | | | | | |
| | | | | Principal
Amount
(000) | | | U.S. $ Value | |
| | | | | |
| | | | | | | | | | |
Universal Hospital Services, Inc.
3.778%, 6/01/15(c) | | U.S.$ | | | 500 | | | $ | 462,500 | |
Valeant Pharmaceuticals International
7.00%, 10/01/20(b) | | | | | 2,043 | | | | 2,022,570 | |
Vanguard Health Holding Co. II LLC/Vanguard Holding Co. II, Inc.
8.00%, 2/01/18 | | | | | 4,060 | | | | 4,151,350 | |
Vanguard Health Systems, Inc.
Zero Coupon, 2/01/16 | | | | | 26 | | | | 17,030 | |
Visant Corp.
10.00%, 10/01/17 | | | | | 2,798 | | | | 2,714,060 | |
Voyager Learning Exchange
8.375%, 12/01/14(d)(f)(g) | | | | | 1,283 | | | | – 0 | – |
Warner Chilcott
7.75%, 9/15/18 | | | | | 3,500 | | | | 3,648,750 | |
| | | | | | | | | | |
| | | | | | | | | 199,543,129 | |
| | | | | | | | | | |
Energy – 4.4% | | | | | | | | | | |
Antero Resources Finance Corp.
7.25%, 8/01/19(b) | | | | | 1,680 | | | | 1,730,400 | |
9.375%, 12/01/17 | | | | | 4,838 | | | | 5,345,990 | |
ATP Oil & Gas Corp./United States
11.875%, 5/01/15 | | | | | 5,200 | | | | 4,316,000 | |
Basic Energy Services, Inc.
7.75%, 2/15/19(b) | | | | | 2,960 | | | | 2,960,000 | |
Bill Barrett Corp.
7.625%, 10/01/19 | | | | | 2,500 | | | | 2,643,750 | |
Bluewater Holding BV
3.403%, 7/17/14(b)(c) | | | | | 4,400 | | | | 3,344,000 | |
Chaparral Energy, Inc.
8.875%, 2/01/17 | | | | | 5,505 | | | | 5,670,150 | |
Chesapeake Energy Corp.
6.625%, 8/15/20 | | | | | 1,746 | | | | 1,892,227 | |
6.875%, 11/15/20 | | | | | 1,910 | | | | 2,096,225 | |
Cie Generale de Geophysique-Veritas
6.50%, 6/01/21(b) | | | | | 1,600 | | | | 1,592,000 | |
9.50%, 5/15/16 | | | | | 2,307 | | | | 2,497,327 | |
Citgo Petroleum Corp.
11.50%, 7/01/17(b) | | | | | 4,527 | | | | 5,183,415 | |
Complete Production Services, Inc.
8.00%, 12/15/16 | | | | | 2,360 | | | | 2,454,400 | |
Continental Resources, Inc./OK
7.125%, 4/01/21 | | | | | 1,567 | | | | 1,692,360 | |
Denbury Resources, Inc.
6.375%, 8/15/21 | | | | | 3,001 | | | | 3,091,030 | |
8.25%, 2/15/20 | | | | | 1,536 | | | | 1,697,280 | |
Edgen Murray Corp.
12.25%, 1/15/15 | | | | | 3,034 | | | | 2,867,130 | |
Energy XXI Gulf Coast, Inc.
7.75%, 6/15/19 | | | | | 3,500 | | | | 3,535,000 | |
| | | | |
| ALLIANCEBERNSTEIN HIGH INCOME FUND • | | | 27 | |
Portfolio of Investments
| | | | | | | | | | |
| | | | | Principal
Amount
(000) | | | U.S. $ Value | |
| | | | | |
| | | | | | | | | | |
9.25%, 12/15/17 | | U.S.$ | | | 3,600 | | | $ | 3,834,000 | |
Expro Finance Luxembourg SCA
8.50%, 12/15/16(b) | | | | | 2,547 | | | | 2,457,855 | |
Forest Oil Corp.
7.25%, 6/15/19 | | | | | 5,240 | | | | 5,371,000 | |
Helix Energy Solutions Group, Inc.
9.50%, 1/15/16(b) | | | | | 2,900 | | | | 3,045,000 | |
Hercules Offshore, Inc.
10.50%, 10/15/17(b) | | | | | 1,379 | | | | 1,379,000 | |
Hilcorp Energy I LP/Hilcorp Finance Co.
7.75%, 11/01/15(b) | | | | | 3,509 | | | | 3,599,883 | |
8.00%, 2/15/20(b) | | | | | 1,000 | | | | 1,075,000 | |
Key Energy Services, Inc.
6.75%, 3/01/21 | | | | | 2,666 | | | | 2,725,985 | |
Linn Energy LLC/Linn Energy Finance Corp.
8.625%, 4/15/20 | | | | | 4,190 | | | | 4,619,475 | |
McJunkin Red Man Corp.
9.50%, 12/15/16 | | | | | 6,250 | | | | 6,375,000 | |
Nalco Co.
6.625%, 1/15/19(b) | | | | | 1,350 | | | | 1,505,250 | |
Newfield Exploration Co.
6.625%, 9/01/14-4/15/16 | | | | | 1,475 | | | | 1,508,500 | |
Oasis Petroleum, Inc.
6.50%, 11/01/21 | | | | | 1,790 | | | | 1,798,950 | |
Offshore Group Investments Ltd.
11.50%, 8/01/15 | | | | | 4,250 | | | | 4,632,500 | |
11.50%, 8/01/15(b) | | | | | 875 | | | | 953,750 | |
Oil States International, Inc.
6.50%, 6/01/19 | | | | | 3,394 | | | | 3,555,215 | |
OPTI Canada, Inc.
8.25%, 12/15/14(d) | | | | | 2,505 | | | | 1,628,250 | |
Parker Drilling Co.
9.125%, 4/01/18 | | | | | 1,389 | | | | 1,454,978 | |
Perpetual Energy, Inc.
8.75%, 3/15/18(b) | | CAD | | | 4,250 | | | | 3,880,110 | |
PHI, Inc.
8.625%, 10/15/18 | | U.S.$ | | | 2,910 | | | | 2,924,550 | |
Pioneer Drilling Co.
9.875%, 3/15/18 | | | | | 2,000 | | | | 2,080,000 | |
Pioneer Natural Resources Co.
5.875%, 7/15/16 | | | | | 500 | | | | 530,751 | |
Plains Exploration & Production Co.
6.625%, 5/01/21 | | | | | 1,000 | | | | 1,040,000 | |
7.00%, 3/15/17 | | | | | 509 | | | | 528,088 | |
7.625%, 4/01/20 | | | | | 1,000 | | | | 1,080,000 | |
7.75%, 6/15/15 | | | | | 541 | | | | 561,288 | |
8.625%, 10/15/19 | | | | | 2,300 | | | | 2,553,000 | |
| | |
| 28 | | • ALLIANCEBERNSTEIN HIGH INCOME FUND |
Portfolio of Investments
| | | | | | | | | | |
| | | | | Principal
Amount
(000) | | | U.S. $ Value | |
| | | | | |
| | | | | | | | | | |
Precision Drilling Corp.
6.50%, 12/15/21(b) | | U.S.$ | | | 1,870 | | | $ | 1,972,850 | |
QEP Resources, Inc.
6.875%, 3/01/21 | | | | | 1,453 | | | | 1,569,240 | |
SandRidge Energy, Inc.
7.50%, 3/15/21(b) | | | | | 933 | | | | 900,345 | |
8.75%, 1/15/20 | | | | | 3,673 | | | | 3,792,372 | |
SESI LLC
6.375%, 5/01/19(b) | | | | | 771 | | | | 786,420 | |
Tesoro Corp.
6.25%, 11/01/12 | | | | | 2,070 | | | | 2,157,975 | |
9.75%, 6/01/19 | | | | | 3,518 | | | | 3,957,750 | |
W&T Offshore, Inc.
8.50%, 6/15/19(b) | | | | | 3,500 | | | | 3,570,000 | |
| | | | | | | | | | |
| | | | | | | | | 140,013,014 | |
| | | | | | | | | | |
Other Industrial – 1.0% | | | | | | | | | | |
Briggs & Stratton Corp.
6.875%, 12/15/20 | | | | | 737 | | | | 751,740 | |
Brightstar Corp.
9.50%, 12/01/16(b) | | | | | 4,301 | | | | 4,344,010 | |
Education Management LLC/Education Management Finance Corp.
8.75%, 6/01/14 | | | | | 1,025 | | | | 1,014,750 | |
Exova Ltd.
10.50%, 10/15/18(b) | | GBP | | | 2,000 | | | | 2,667,188 | |
Interline Brands, Inc.
7.00%, 11/15/18 | | U.S.$ | | | 4,065 | | | | 4,146,300 | |
Lecta SA
5.535%, 2/15/14(b)(c) | | EUR | | | 1,903 | | | | 2,396,195 | |
Liberty Tire Recycling
11.00%, 10/01/16(b) | | U.S.$ | | | 4,400 | | | | 4,444,000 | |
Mueller Water Products, Inc.
7.375%, 6/01/17 | | | | | 1,700 | | | | 1,496,000 | |
8.75%, 9/01/20 | | | | | 900 | | | | 958,500 | |
Neenah Foundry Co.
15.00%, 7/29/15(e)(f) | | | | | 282 | | | | 274,704 | |
New Enterprise Stone & Lime Co.
11.00%, 9/01/18 | | | | | 5,850 | | | | 4,943,250 | |
Pipe Holdings PLC
9.50%, 11/01/15(b) | | GBP | | | 2,745 | | | | 3,795,769 | |
Wendel SA
4.375%, 8/09/17 | | EUR | | | 1,750 | | | | 2,040,093 | |
| | | | | | | | | | |
| | | | | | | | | 33,272,499 | |
| | | | | | | | | | |
Services – 1.2% | | | | | | | | | | |
Ceridian Corp.
11.25%, 11/15/15 | | U.S.$ | | | 4,650 | | | | 3,952,500 | |
Goodman Networks, Inc.
12.125%, 7/01/18(b) | | | | | 3,000 | | | | 2,850,000 | |
| | | | |
| ALLIANCEBERNSTEIN HIGH INCOME FUND • | | | 29 | |
Portfolio of Investments
| | | | | | | | | | |
| | | | | Principal
Amount
(000) | | | U.S. $ Value | |
| | | | | |
| | | | | | | | | | |
ISS Holdings A/S
8.875%, 5/15/16(a)(b) | | EUR | | | 2,000 | | | $ | 2,656,704 | |
Live Nation Entertainment, Inc.
8.125%, 5/15/18(b) | | U.S.$ | | | 2,370 | | | | 2,275,200 | |
Lottomatica SpA
8.25%, 3/31/66(b) | | EUR | | | 3,585 | | | | 4,365,297 | |
Mobile Mini, Inc.
7.875%, 12/01/20 | | U.S.$ | | | 2,320 | | | | 2,320,000 | |
Realogy Corp.
Series A
11.00%, 4/15/18(b) | | | | | 2,732 | | | | 1,748,480 | |
Series C
11.00%, 4/15/18(a)(b) | | | | | 1,450 | | | | 899,000 | |
Service Corp. International/US
6.75%, 4/01/15-4/01/16 | | | | | 4,400 | | | | 4,686,000 | |
7.50%, 4/01/27 | | | | | 1,575 | | | | 1,575,000 | |
ServiceMaster Co. (The)
10.75%, 7/15/15(b)(e) | | | | | 4,325 | | | | 4,427,612 | |
Ticketmaster Entertainment LLC/Ticketmaster Noteco, Inc.
10.75%, 8/01/16 | | | | | 2,110 | | | | 2,204,950 | |
West Corp.
7.875%, 1/15/19 | | | | | 1,250 | | | | 1,268,750 | |
8.625%, 10/01/18 | | | | | 1,535 | | | | 1,588,725 | |
11.00%, 10/15/16 | | | | | 2,100 | | | | 2,226,000 | |
| | | | | | | | | | |
| | | | | | | | | 39,044,218 | |
| | | | | | | | | | |
Technology – 2.9% | | | | | | | | | | |
Advanced Micro Devices, Inc.
7.75%, 8/01/20 | | | | | 973 | | | | 987,595 | |
8.125%, 12/15/17 | | | | | 2,180 | | | | 2,245,400 | |
Amkor Technology, Inc.
6.625%, 6/01/21(b) | | | | | 3,000 | | | | 2,850,000 | |
Aspect Software, Inc.
10.625%, 5/15/17 | | | | | 4,211 | | | | 4,253,110 | |
CDW LLC/CDW Finance Corp.
8.25%, 12/15/18(b) | | | | | 3,282 | | | | 3,380,460 | |
8.50%, 4/01/19(b) | | | | | 7,125 | | | | 6,911,250 | |
11.50%, 10/12/15(e) | | | | | 362 | | | | 372,643 | |
CommScope, Inc.
8.25%, 1/15/19(b) | | | | | 6,500 | | | | 6,402,500 | |
CoreLogic, Inc./United States
7.25%, 6/01/21(b) | | | | | 3,750 | | | | 3,562,500 | |
CPI International, Inc.
8.00%, 2/15/18 | | | | | 3,977 | | | | 3,549,472 | |
DCP LLC/DCP Corp.
10.75%, 8/15/15(b) | | | | | 2,385 | | | | 1,991,475 | |
Eagle Parent, Inc.
8.625%, 5/01/19(b) | | | | | 5,997 | | | | 5,607,195 | |
| | |
| 30 | | • ALLIANCEBERNSTEIN HIGH INCOME FUND |
Portfolio of Investments
| | | | | | | | | | |
| | | | | Principal
Amount
(000) | | | U.S. $ Value | |
| | | | | |
| | | | | | | | | | |
Eastman Kodak Co.
7.25%, 11/15/13 | | U.S.$ | | | 315 | | | $ | 138,600 | |
First Data Corp.
7.375%, 6/15/19(b) | | | | | 3,320 | | | | 3,295,100 | |
11.25%, 3/31/16(a) | | | | | 3,950 | | | | 3,515,500 | |
Freescale Semiconductor, Inc. | | | | | | | | | | |
8.875%, 12/15/14(a) | | | | | 2,233 | | | | 2,283,243 | |
9.25%, 4/15/18(b) | | | | | 1,726 | | | | 1,868,395 | |
10.125%, 12/15/16(a) | | | | | 2,429 | | | | 2,526,160 | |
Interactive Data Corp.
10.25%, 8/01/18 | | | | | 4,700 | | | | 5,052,500 | |
Iron Mountain, Inc.
6.625%, 1/01/16 | | | | | 1,393 | | | | 1,393,000 | |
8.375%, 8/15/21 | | | | | 3,000 | | | | 3,142,500 | |
8.75%, 7/15/18 | | | | | 1,000 | | | | 1,045,000 | |
MagnaChip Semiconductor SA/MagnaChip Semiconductor Finance Co.
10.50%, 4/15/18 | | | | | 2,800 | | | | 2,863,000 | |
NXP BV/NXP Funding LLC
3.153%, 10/15/13(c) | | | | | 539 | | | | 528,220 | |
9.50%, 10/15/15(a) | | | | | 700 | | | | 731,500 | |
Sanmina-SCI Corp.
7.00%, 5/15/19(b) | | | | | 1,550 | | | | 1,488,000 | |
8.125%, 3/01/16 | | | | | 4,059 | | | | 4,140,180 | |
Seagate HDD Cayman
6.875%, 5/01/20 | | | | | 2,951 | | | | 2,891,980 | |
Sensata Technologies BV
6.50%, 5/15/19(b) | | | | | 5,000 | | | | 4,906,250 | |
Serena Software, Inc.
10.375%, 3/15/16 | | | | | 419 | | | | 429,475 | |
SunGard Data Systems, Inc.
7.625%, 11/15/20 | | | | | 4,000 | | | | 4,100,000 | |
10.25%, 8/15/15 | | | | | 974 | | | | 1,010,525 | |
Syniverse Holdings, Inc.
9.125%, 1/15/19 | | | | | 1,598 | | | | 1,661,920 | |
| | | | | | | | | | |
| | | | | | | | | 91,124,648 | |
| | | | | | | | | | |
Transportation - Airlines – 0.3% | | | | | | | | | | |
Air Canada
12.00%, 2/01/16(b) | | | | | 2,850 | | | | 2,693,250 | |
American Airlines, Inc.
10.50%, 10/15/12 | | | | | 1,909 | | | | 1,870,820 | |
AMR Corp.
9.00%, 8/01/12 | | | | | 849 | | | | 766,222 | |
Continental Airlines, Inc.
8.75%, 12/01/11 | | | | | 703 | | | | 703,879 | |
Delta Air Lines, Inc.
9.50%, 9/15/14(b) | | | | | 1,164 | | | | 1,233,840 | |
| | | | |
| ALLIANCEBERNSTEIN HIGH INCOME FUND • | | | 31 | |
Portfolio of Investments
| | | | | | | | | | |
| | | | | Principal
Amount
(000) | | | U.S. $ Value | |
| | | | | |
| | | | | | | | | | |
Northwest Airlines 2000-1 Class G Pass Through Trust
7.15%, 10/01/19 | | U.S.$ | | | 1,007 | | | $ | 971,590 | |
UAL 2007-1 Pass Through Trust Series 071A
6.636%, 7/02/22 | | | | | 2,162 | | | | 2,151,160 | |
| | | | | | | | | | |
| | | | | | | | | 10,390,761 | |
| | | | | | | | | | |
Transportation - Railroads – 0.0% | | | | | | | | | | |
Florida East Coast Railway Corp.
8.125%, 2/01/17 | | | | | 813 | | | | 813,000 | |
| | | | | | | | | | |
| | | |
Transportation - Services – 0.9% | | | | | | | | | | |
America West Airlines 1999-1 Pass
Through Trust
Series 991G
7.93%, 1/02/19 | | | | | 1,889 | | | | 1,823,338 | |
Avis Budget Car Rental LLC/Avis Budget Finance, Inc.
7.625%, 5/15/14 | | | | | 267 | | | | 269,002 | |
7.75%, 5/15/16 | | | | | 5,088 | | | | 5,138,880 | |
EC Finance PLC
9.75%, 8/01/17(b) | | EUR | | | 148 | | | | 182,261 | |
Hapag-Lloyd AG
9.75%, 10/15/17(b) | | U.S.$ | | | 2,250 | | | | 1,777,500 | |
Hertz Corp. (The)
6.75%, 4/15/19 | | | | | 3,288 | | | | 3,353,760 | |
7.375%, 1/15/21 | | | | | 2,950 | | | | 3,031,125 | |
7.50%, 10/15/18 | | | | | 1,900 | | | | 1,980,750 | |
8.875%, 1/01/14 | | | | | 307 | | | | 310,070 | |
Oshkosh Corp.
8.50%, 3/01/20 | | | | | 3,500 | | | | 3,605,000 | |
Overseas Shipholding Group, Inc.
8.125%, 3/30/18(a) | | | | | 2,250 | | | | 1,777,500 | |
Stena AB
5.875%, 2/01/19(b) | | EUR | | | 2,000 | | | | 2,296,942 | |
7.875%, 3/15/20(b) | | | | | 1,000 | | | | 1,231,493 | |
Swift Services Holdings, Inc.
10.00%, 11/15/18 | | U.S.$ | | | 1,920 | | | | 1,987,200 | |
Western Express, Inc.
12.50%, 4/15/15(a)(b) | | | | | 2,000 | | | | 1,200,000 | |
| | | | | | | | | | |
| | | | | | | | | 29,964,821 | |
| | | | | | | | | | |
| | | | | | | | | 1,314,620,468 | |
| | | | | | | | | | |
Financial Institutions – 3.7% | | | | | | | | | | |
Banking – 1.2% | | | | | | | | | | |
ABN Amro Bank NV
4.31%, 3/10/16 | | EUR | | | 5,396 | | | | 5,230,245 | |
Deutsche Bank AG/London
5.50%, 9/02/15(b) | | UAH | | | 22,400 | | | | 2,171,841 | |
| | |
| 32 | | • ALLIANCEBERNSTEIN HIGH INCOME FUND |
Portfolio of Investments
| | | | | | | | | | |
| | | | | Principal
Amount
(000) | | | U.S. $ Value | |
| | | | | |
| | | | | | | | | | |
Dresdner Funding Trust I
8.151%, 6/30/31(b) | | U.S.$ | | | 2,000 | | | $ | 1,560,000 | |
HBOS Capital Funding LP
6.071%, 6/30/14(b) | | | | | 1,840 | | | | 1,288,000 | |
HT1 Funding GmbH
6.352%, 6/30/17 | | EUR | | | 2,700 | | | | 2,278,954 | |
LBG Capital No.1 PLC
8.00%, 6/15/20(b) | | U.S.$ | | | 7,550 | | | | 6,191,000 | |
Regions Bank/Birmingham AL
6.45%, 6/26/37 | | | | | 2,800 | | | | 2,324,000 | |
Regions Financing Trust II
6.625%, 5/15/47 | | | | | 1,500 | | | | 1,222,500 | |
Resona Preferred Global Securities Cayman Ltd.
7.191%, 7/30/15(b) | | | | | 6,300 | | | | 6,111,725 | |
SNS Bank NV
11.25%, 11/27/19(b) | | EUR | | | 1,001 | | | | 914,155 | |
Telenet Finance III Luxembourg SCA
6.625%, 2/15/21(b) | | | | | 5,000 | | | | 6,745,537 | |
UT2 Funding PLC
5.321%, 6/30/16 | | | | | 1,293 | | | | 1,252,387 | |
| | | | | | | | | | |
| | | | | | | | | 37,290,344 | |
| | | | | | | | | | |
Brokerage – 0.3% | | | | | | | | | | |
E*Trade Financial Corp.
6.75%, 6/01/16 | | U.S.$ | | | 5,335 | | | | 5,401,688 | |
Lehman Brothers Holdings, Inc.
6.875%, 5/02/18(d) | | | | | 1,600 | | | | 412,000 | |
Series G
4.80%, 3/13/14(d) | | | | | 1,800 | | | | 445,500 | |
Nuveen Investments, Inc.
10.50%, 11/15/15 | | | | | 3,845 | | | | 3,845,000 | |
| | | | | | | | | | |
| | | | | | | | | 10,104,188 | |
| | | | | | | | | | |
Finance – 0.8% | | | | | | | | | | |
AGFC Capital Trust I
6.00%, 1/15/67(b) | | | | | 4,000 | | | | 1,800,000 | |
Ally Financial, Inc.
8.00%, 11/01/31 | | | | | 2,404 | | | | 2,397,990 | |
Series 8
6.75%, 12/01/14 | | | | | 2,590 | | | | 2,615,900 | |
CIT Group, Inc.
7.00%, 5/01/15-5/01/17 | | | | | 2 | | | | 1,730 | |
7.00%, 5/04/15-5/02/17(b) | | | | | 5,463 | | | | 5,452,948 | |
ILFC E-Capital Trust II
6.25%, 12/21/65(b) | | | | | 1,500 | | | | 1,087,500 | |
International Lease Finance Corp.
6.375%, 3/25/13 | | | | | 1,750 | | | | 1,754,375 | |
| | | | |
| ALLIANCEBERNSTEIN HIGH INCOME FUND • | | | 33 | |
Portfolio of Investments
| | | | | | | | | | |
| | | | | Principal
Amount
(000) | | | U.S. $ Value | |
| | | | | |
| | | | | | | | | | |
iStar Financial, Inc.
Series B
5.70%, 3/01/14 | | U.S.$ | | | 4,800 | | | $ | 3,984,000 | |
Provident Funding Associates LP/PFG
Finance Corp.
10.125%, 2/15/19(b) | | | | | 1,703 | | | | 1,566,760 | |
Residential Capital LLC
9.625%, 5/15/15 | | | | | 6,082 | | | | 5,291,340 | |
Springleaf Finance Corp.
6.90%, 12/15/17 | | | | | 2,000 | | | | 1,525,000 | |
| | | | | | | | | | |
| | | | | | | | | 27,477,543 | |
| | | | | | | | | | |
Insurance – 0.7% | | | | | | | | | | |
Genworth Financial, Inc.
6.15%, 11/15/66 | | | | | 2,535 | | | | 1,432,275 | |
Hartford Financial Services Group, Inc.
8.125%, 6/15/38 | | | | | 3,000 | | | | 3,045,000 | |
ING Capital Funding Trust III
Series 9
3.969%, 12/31/11(c) | | | | | 2,000 | | | | 1,694,448 | |
ING Groep NV
5.775%, 12/08/15 | | | | | 3,840 | | | | 3,043,200 | |
Liberty Mutual Group, Inc.
7.80%, 3/15/37(b) | | | | | 4,548 | | | | 4,138,680 | |
MBIA Insurance Corp.
14.00%, 1/15/33(b) | | | | | 4,920 | | | | 2,410,800 | |
XL Group PLC
Series E
6.50%, 4/15/17 | | | | | 7,000 | | | | 5,880,000 | |
| | | | | | | | | | |
| | | | | | | | | 21,644,403 | |
| | | | | | | | | | |
Other Finance – 0.6% | | | | | | | | | | |
FTI Consulting, Inc.
6.75%, 10/01/20 | | | | | 3,150 | | | | 3,181,500 | |
Harbinger Group, Inc.
10.625%, 11/15/15 | | | | | 2,370 | | | | 2,375,925 | |
Icahn Enterprises LP/Icahn Enterprises Finance Corp.
8.00%, 1/15/18 | | | | | 4,050 | | | | 4,120,875 | |
iPayment Holdings, Inc.
15.00%, 11/15/18(b)(e) | | | | | 2,952 | | | | 2,892,960 | |
iPayment, Inc.
10.25%, 5/15/18(b) | | | | | 5,082 | | | | 4,897,777 | |
Renaissance Capital LLC Via Renaissance Consumer Funding Ltd.
13.00%, 4/01/13(b) | | | | | 1,000 | | | | 943,750 | |
| | | | | | | | | | |
| | | | | | | | | 18,412,787 | |
| | | | | | | | | | |
| | |
| 34 | | • ALLIANCEBERNSTEIN HIGH INCOME FUND |
Portfolio of Investments
| | | | | | | | | | |
| | | | | Principal
Amount
(000) | | | U.S. $ Value | |
| | | | | |
| | | | | | | | | | |
REITS – 0.1% | | | | | | | | | | |
DDR Corp.
7.875%, 9/01/20 | | U.S.$ | | | 3,100 | | | $ | 3,355,446 | |
| | | | | | | | | | |
| | | | | | | | | 118,284,711 | |
| | | | | | | | | | |
Utility – 2.6% | | | | | | | | | | |
Electric – 1.7% | | | | | | | | | | |
AES Corp. (The)
7.375%, 7/01/21(b) | | | | | 1,050 | | | | 1,123,500 | |
7.75%, 3/01/14 | | | | | 1,196 | | | | 1,285,700 | |
8.00%, 10/15/17 | | | | | 2,860 | | | | 3,138,850 | |
Calpine Corp.
7.25%, 10/15/17(b) | | | | | 3,300 | | | | 3,432,000 | |
7.875%, 7/31/20-1/15/23(b) | | | | | 5,500 | | | | 5,855,000 | |
Dynegy Holdings, Inc.
8.375%, 5/01/16(a) | | | | | 5,641 | | | | 3,751,265 | |
Edison Mission Energy
7.00%, 5/15/17 | | | | | 3,948 | | | | 2,763,600 | |
7.50%, 6/15/13(a) | | | | | 1,562 | | | | 1,499,520 | |
7.75%, 6/15/16(a) | | | | | 1,447 | | | | 1,110,572 | |
Energy Future Holdings Corp.
10.00%, 1/15/20(h) | | | | | 2,524 | | | | 2,637,580 | |
10.875%, 11/01/17 | | | | | 411 | | | | 347,295 | |
Series Q
6.50%, 11/15/24 | | | | | 2,007 | | | | 832,905 | |
Energy Future Intermediate Holding Co. LLC/EFIH Finance, Inc.
10.00%, 12/01/20 | | | | | 1,072 | | | | 1,125,600 | |
GenOn Americas Generation LLC
8.50%, 10/01/21 | | | | | 3,255 | | | | 3,189,900 | |
GenOn Energy, Inc.
7.875%, 6/15/17 | | | | | 1,543 | | | | 1,566,145 | |
9.50%, 10/15/18(a) | | | | | 4,000 | | | | 4,220,000 | |
Intergen NV
8.50%, 6/30/17(b) | | EUR | | | 1,000 | | | | 1,380,241 | |
NRG Energy, Inc.
7.375%, 1/15/17 | | U.S.$ | | | 1,475 | | | | 1,535,844 | |
7.875%, 5/15/21(b) | | | | | 3,195 | | | | 3,226,950 | |
8.25%, 9/01/20 | | | | | 1,800 | | | | 1,863,000 | |
PPL Capital Funding, Inc.
Series A
6.70%, 3/30/67 | | | | | 4,375 | | | | 4,221,875 | |
Texas Competitive Electric Holdings Co. LLC/TCEH Finance, Inc.
11.50%, 10/01/20(b) | | | | | 2,679 | | | | 2,303,940 | |
Series A
10.25%, 11/01/15(a) | | | | | 2,804 | | | | 1,093,560 | |
| | | | | | | | | | |
| | | | | | | | | 53,504,842 | |
| | | | | | | | | | |
| | | | |
| ALLIANCEBERNSTEIN HIGH INCOME FUND • | | | 35 | |
Portfolio of Investments
| | | | | | | | | | |
| | | | | Principal
Amount
(000) | | | U.S. $ Value | |
| | | | | |
| | | | | | | | | | |
Natural Gas – 0.9% | | | | | | | | | | |
El Paso Corp.
Series G
7.375%, 12/15/12 | | U.S.$ | | | 204 | | | $ | 214,038 | |
7.75%, 1/15/32 | | | | | 5,548 | | | | 6,394,070 | |
Enterprise Products Operating LLC
Series A
8.375%, 8/01/66 | | | | | 1,609 | | | | 1,665,315 | |
Inergy LP/Inergy Finance Corp.
6.875%, 8/01/21 | | | | | 6,050 | | | | 5,913,875 | |
Kinder Morgan Finance Co. ULC
5.70%, 1/05/16 | | | | | 745 | | | | 761,763 | |
MarkWest Energy Partners LP/MarkWest Energy Finance Corp.
6.50%, 8/15/21 | | | | | 6,975 | | | | 7,201,687 | |
Sabine Pass LNG LP
7.50%, 11/30/16 | | | | | 4,900 | | | | 4,851,000 | |
Targa Resources Partners LP/Targa Resources Partners Finance Corp.
6.875%, 2/01/21(b) | | | | | 3,250 | | | | 3,209,375 | |
| | | | | | | | | | |
| | | | | | | | | 30,211,123 | |
| | | | | | | | | | |
| | | | | | | | | 83,715,965 | |
| | | | | | | | | | |
Total Corporates – Non-Investment Grades
(cost $1,543,706,433) | | | | | | | | | 1,516,621,144 | |
| | | | | | | | | | |
| | | | | | | | | | |
CORPORATES - INVESTMENT GRADES – 9.8% | | | | | | | | | | |
Financial Institutions – 5.3% | | | | | | | | | | |
Banking – 2.3% | | | | | | | | | | |
American Express Co.
6.80%, 9/01/66 | | | | | 4,555 | | | | 4,509,450 | |
Assured Guaranty Municipal Holdings, Inc.
6.40%, 12/15/36(b) | | | | | 3,500 | | | | 2,467,500 | |
Banco do Brasil SA/Cayman
8.50%, 10/20/20(b) | | | | | 2,200 | | | | 2,574,000 | |
Banco Santander Chile
6.50%, 9/22/20(b) | | CLP | | | 2,367,500 | | | | 4,759,644 | |
Barclays Bank PLC
4.875%, 12/15/14 | | EUR | | | 1,500 | | | | 1,369,863 | |
5.926%, 12/15/16(b) | | U.S.$ | | | 2,300 | | | | 1,863,000 | |
BBVA International Preferred SAU
4.952%, 9/20/16 | | EUR | | | 3,100 | | | | 2,959,734 | |
5.919%, 4/18/17(a) | | U.S.$ | | | 2,600 | | | | 1,879,670 | |
Series F
9.10%, 10/21/14 | | GBP | | | 1,000 | | | | 1,414,952 | |
BNP Paribas Capital Trust IV
6.342%, 1/24/12 | | EUR | | | 1,000 | | | | 1,300,678 | |
| | |
| 36 | | • ALLIANCEBERNSTEIN HIGH INCOME FUND |
Portfolio of Investments
| | | | | | | | | | |
| | | | | Principal
Amount
(000) | | | U.S. $ Value | |
| | | | | |
| | | | | | | | | | |
Cooperatieve Centrale Raiffeisen-Boerenleenbank BA/Netherlands
8.375%, 7/26/16 | | U.S.$ | | | 5,750 | | | $ | 5,807,500 | |
Countrywide Financial Corp.
6.25%, 5/15/16 | | | | | 505 | | | | 493,426 | |
Credit Agricole SA
6.637%, 5/31/17(b) | | | | | 6,275 | | | | 4,238,762 | |
Danske Bank A/S
5.914%, 6/16/14(b) | | | | | 2,185 | | | | 1,857,250 | |
Fortis Bank SA/NV
4.625%, 10/27/14(b) | | EUR | | | 1,000 | | | | 961,671 | |
Itau Unibanco Holding SA/Cayman Island
10.50%, 11/23/15(b) | | BRL | | | 2,100 | | | | 1,281,880 | |
Morgan Stanley
10.09%, 5/03/17(b) | | | | | 5,230 | | | | 2,772,142 | |
MUFG Capital Finance 5 Ltd.
6.299%, 1/25/17 | | GBP | | | 1,225 | | | | 1,890,890 | |
National Capital Trust II
5.486%, 3/23/15(b) | | U.S.$ | | | 1,700 | | | | 1,537,783 | |
PNC Financial Services Group, Inc.
6.75%, 8/01/21 | | | | | 3,733 | | | | 3,732,477 | |
Royal Bank of Scotland PLC (The)
Series 1
5.568%, 10/27/14(c) | | AUD | | | 3,500 | | | | 3,096,290 | |
Societe Generale SA
4.196%, 1/26/15 | | EUR | | | 1,500 | | | | 1,328,767 | |
6.999%, 12/19/17 | | | | | 2,650 | | | | 2,603,431 | |
UBS AG/Jersey
4.28%, 4/15/15 | | | | | 4,000 | | | | 4,267,154 | |
Unicredit Luxembourg Finance SA
6.00%, 10/31/17(b) | | U.S.$ | | | 1,870 | | | | 1,521,565 | |
Unicredito Italiano Capital Trust III
4.028%, 10/27/15 | | EUR | | | 4,700 | | | | 3,511,831 | |
VTB Bank OJSC Via VTB Capital SA
6.875%, 5/29/18(b) | | U.S.$ | | | 3,433 | | | | 3,587,485 | |
Wells Fargo & Co. Series K
7.98%, 3/15/18 | | | | | 4,700 | | | | 5,029,000 | |
| | | | | | | | | | |
| | | | | | | | | 74,617,795 | |
| | | | | | | | | | |
Brokerage – 0.2% | | | | | | | | | | |
GFI Group, Inc.
8.375%, 7/19/18(b) | | | | | 3,200 | | | | 2,976,000 | |
Jefferies Group, Inc.
6.875%, 4/15/21 | | | | | 2,482 | | | | 2,391,948 | |
| | | | | | | | | | |
| | | | | | | | | 5,367,948 | |
| | | | | | | | | | |
Finance – 0.3% | | | | | | | | | | |
HSBC Finance Capital Trust IX
5.911%, 11/30/35 | | | | | 3,765 | | | | 3,313,200 | |
| | | | |
| ALLIANCEBERNSTEIN HIGH INCOME FUND • | | | 37 | |
Portfolio of Investments
| | | | | | | | | | |
| | | | | Principal
Amount
(000) | | | U.S. $ Value | |
| | | | | |
| | | | | | | | | | |
SLM Corp.
5.125%, 8/27/12 | | U.S.$ | | | 999 | | | $ | 1,008,990 | |
6.25%, 1/25/16 | | | | | 1,500 | | | | 1,500,000 | |
Series A
5.00%, 10/01/13 | | | | | 4,100 | | | | 4,098,192 | |
| | | | | | | | | | |
| | | | | | | | | 9,920,382 | |
| | | | | | | | | | |
Insurance – 2.1% | | | | | | | | | | |
Allstate Corp. (The)
6.125%, 5/15/37 | | | | | 3,060 | | | | 2,822,850 | |
American International Group, Inc.
6.25%, 3/15/37 | | | | | 2,364 | | | | 1,956,210 | |
AON Corp.
8.205%, 1/01/27 | | | | | 2,495 | | | | 2,905,986 | |
Assured Guaranty US Holdings, Inc.
Series A
6.40%, 12/15/66 | | | | | 2,723 | | | | 2,001,405 | |
Aviva PLC
4.729%, 11/28/14 | | EUR | | | 6,000 | | | | 6,371,938 | |
Coventry Health Care, Inc.
5.875%, 1/15/12 | | U.S.$ | | | 664 | | | | 669,065 | |
5.95%, 3/15/17 | | | | | 1,415 | | | | 1,589,839 | |
Farmers Insurance Exchange
8.625%, 5/01/24(b) | | | | | 3,000 | | | | 3,676,152 | |
Genworth Financial, Inc.
7.625%, 9/24/21 | | | | | 1,050 | | | | 949,127 | |
7.70%, 6/15/20 | | | | | 2,300 | | | | 2,152,328 | |
Hannover Finance Luxembourg SA
5.00%, 6/01/15 | | EUR | | | 1,000 | | | | 1,124,256 | |
Lincoln National Corp.
6.05%, 4/20/67 | | U.S.$ | | | 4,415 | | | | 3,885,200 | |
8.75%, 7/01/19 | | | | | 604 | | | | 736,937 | |
MetLife, Inc.
10.75%, 8/01/39 | | | | | 3,495 | | | | 4,613,400 | |
Nationwide Mutual Insurance Co.
5.81%, 12/15/24(b) | | | | | 5,000 | | | | 4,826,245 | |
9.375%, 8/15/39(b) | | | | | 2,040 | | | | 2,502,960 | |
QBE Capital Funding III Ltd.
7.25%, 5/24/41(b) | | | | | 4,415 | | | | 4,145,385 | |
Standard Life PLC
5.314%, 1/06/15 | | EUR | | | 1,000 | | | | 1,106,960 | |
Suncorp Metway Insurance Ltd.
6.75%, 10/06/26 | | AUD | | | 500 | | | | 451,011 | |
Series 1
6.75%, 9/23/24 | | | | | 800 | | | | 783,006 | |
Swiss Re Capital I LP
6.854%, 5/25/16(b) | | U.S.$ | | | 6,900 | | | | 6,221,992 | |
Transatlantic Holdings, Inc.
8.00%, 11/30/39 | | | | | 2,836 | | | | 3,078,189 | |
| | |
| 38 | | • ALLIANCEBERNSTEIN HIGH INCOME FUND |
Portfolio of Investments
| | | | | | | | | | |
| | | | | Principal
Amount
(000) | | | U.S. $ Value | |
| | | | | |
| | | | | | | | | | |
Vero Insurance Ltd.
6.15%, 9/07/25 | | AUD | | | 700 | | | $ | 656,838 | |
WR Berkley Corp.
5.60%, 5/15/15 | | U.S.$ | | | 3,500 | | | | 3,705,233 | |
ZFS Finance USA Trust V
6.50%, 5/09/37(b) | | | | | 3,010 | | | | 2,784,250 | |
| | | | | | | | | | |
| | | | | | | | | 65,716,762 | |
| | | | | | | | | | |
Other Finance – 0.3% | | | | | | | | | | |
Aviation Capital Group Corp.
6.75%, 4/06/21(b) | | | | | 2,950 | | | | 2,840,585 | |
7.125%, 10/15/20(b) | | | | | 3,872 | | | | 3,747,895 | |
IIRSA Norte Finance Ltd.
8.75%, 5/30/24(b) | | | | | 840 | | | | 982,798 | |
ORIX Corp.
5.48%, 11/22/11 | | | | | 3,000 | | | | 3,006,894 | |
Red Arrow International Leasing PLC
8.375%, 6/30/12 | | RUB | | | 6,767 | | | | 220,803 | |
| | | | | | | | | | |
| | | | | | | | | 10,798,975 | |
| | | | | | | | | | |
REITS – 0.1% | | | | | | | | | | |
Entertainment Properties Trust
7.75%, 7/15/20 | | U.S.$ | | | 3,544 | | | | 3,721,200 | |
Ventas Realty LP/Ventas Capital Corp.
6.75%, 4/01/17 | | | | | 422 | | | | 438,915 | |
| | | | | | | | | | |
| | | | | | | | | 4,160,115 | |
| | | | | | | | | | |
| | | | | | | | | 170,581,977 | |
| | | | | | | | | | |
Industrial – 2.9% | | | | | | | | | | |
Basic – 1.1% | | | | | | | | | | |
ArcelorMittal
9.00%, 2/15/15 | | | | | 730 | | | | 854,437 | |
ArcelorMittal USA, Inc.
6.50%, 4/15/14 | | | | | 1,565 | | | | 1,646,604 | |
Basell Finance Co. BV
8.10%, 3/15/27(b) | | | | | 2,420 | | | | 2,758,800 | |
Braskem Finance Ltd.
5.75%, 4/15/21(b) | | | | | 200 | | | | 200,000 | |
7.00%, 5/07/20(b) | | | | | 2,300 | | | | 2,484,000 | |
Commercial Metals Co.
6.50%, 7/15/17 | | | | | 2,100 | | | | 2,088,910 | |
Freeport-McMoRan Copper & Gold, Inc.
8.375%, 4/01/17 | | | | | 1,466 | | | | 1,568,620 | |
Georgia-Pacific LLC
7.125%, 1/15/17(b) | | | | | 517 | | | | 548,263 | |
8.875%, 5/15/31 | | | | | 1,800 | | | | 2,610,779 | |
GTL Trade Finance, Inc.
7.25%, 10/20/17(a)(b) | | | | | 1,747 | | | | 1,886,760 | |
Rhodia SA
6.875%, 9/15/20(b) | | | | | 1,848 | | | | 2,085,930 | |
| | | | |
| ALLIANCEBERNSTEIN HIGH INCOME FUND • | | | 39 | |
Portfolio of Investments
| | | | | | | | | | |
| | | | | Principal
Amount
(000) | | | U.S. $ Value | |
| | | | | |
| | | | | | | | | | |
Southern Copper Corp.
7.50%, 7/27/35 | | U.S.$ | | | 1,500 | | | $ | 1,661,250 | |
Teck Resources Ltd.
6.125%, 10/01/35 | | | | | 5,000 | | | | 5,605,635 | |
Usiminas Commercial Ltd.
7.25%, 1/18/18(b) | | | | | 2,441 | | | | 2,685,100 | |
Vale Overseas Ltd.
5.625%, 9/15/19(a) | | | | | 2,285 | | | | 2,465,362 | |
6.875%, 11/21/36 | | | | | 3,495 | | | | 3,997,584 | |
| | | | | | | | | | |
| | | | | | | | | 35,148,034 | |
| | | | | | | | | | |
Capital Goods – 0.2% | | | | | | | | | | |
Owens Corning
6.50%, 12/01/16 | | | | | 355 | | | | 382,556 | |
7.00%, 12/01/36 | | | | | 4,450 | | | | 4,528,565 | |
| | | | | | | | | | |
| | | | | | | | | 4,911,121 | |
| | | | | | | | | | |
Communications - Media – 0.2% | | | | | | | | | | |
Comcast Cable Communications Holdings, Inc.
9.455%, 11/15/22 | | | | | 2,500 | | | | 3,593,827 | |
News America, Inc.
6.40%, 12/15/35 | | | | | 1,000 | | | | 1,124,978 | |
| | | | | | | | | | |
| | | | | | | | | 4,718,805 | |
| | | | | | | | | | |
Communications - Telecommunications – 0.1% | | | | | | | | | | |
Qwest Corp.
6.875%, 9/15/33 | | | | | 1,500 | | | | 1,490,625 | |
7.625%, 6/15/15 | | | | | 1,590 | | | | 1,764,900 | |
| | | | | | | | | | |
| | | | | | | | | 3,255,525 | |
| | | | | | | | | | |
Consumer Cyclical - Retailers – 0.3% | | | | | | | | | | |
CVS Caremark Corp.
6.302%, 6/01/37 | | | | | 4,250 | | | | 4,127,812 | |
Macy’s Retail Holdings, Inc.
6.375%, 3/15/37 | | | | | 3,500 | | | | 3,874,399 | |
QVC, Inc.
7.50%, 10/01/19(b) | | | | | 2,400 | | | | 2,610,000 | |
| | | | | | | | | | |
| | | | | | | | | 10,612,211 | |
| | | | | | | | | | |
Consumer Non-Cyclical – 0.0% | | | | | | | | | | |
Bunge Ltd. Finance Corp.
8.50%, 6/15/19 | | | | | 332 | | | | 406,124 | |
Whirlpool Corp.
8.60%, 5/01/14 | | | | | 190 | | | | 215,305 | |
| | | | | | | | | | |
| | | | | | | | | 621,429 | |
| | | | | | | | | | |
Energy – 0.8% | | | | | | | | | | |
Anadarko Petroleum Corp.
5.95%, 9/15/16 | | | | | 2,683 | | | | 3,083,349 | |
8.70%, 3/15/19 | | | | | 2,000 | | | | 2,610,148 | |
| | |
| 40 | | • ALLIANCEBERNSTEIN HIGH INCOME FUND |
Portfolio of Investments
| | | | | | | | | | |
| | | | | Principal
Amount
(000) | | | U.S. $ Value | |
| | | | | |
| | | | | | | | | | |
Petrohawk Energy Corp.
7.25%, 8/15/18 | | U.S.$ | | | 6,400 | | | $ | 7,328,000 | |
Pride International, Inc.
6.875%, 8/15/20 | | | | | 1,327 | | | | 1,601,105 | |
TNK-BP Finance SA
7.25%, 2/02/20(b) | | | | | 360 | | | | 396,900 | |
7.50%, 7/18/16(b) | | | | | 4,708 | | | | 5,190,570 | |
Transocean, Inc.
6.80%, 3/15/38 | | | | | 1,916 | | | | 2,122,706 | |
7.50%, 4/15/31 | | | | | 1,800 | | | | 1,971,553 | |
Williams Cos., Inc. (The)
7.875%, 9/01/21 | | | | | 74 | | | | 93,485 | |
| | | | | | | | | | |
| | | | | | | | | 24,397,816 | |
| | | | | | | | | | |
Other Industrial – 0.1% | | | | | | | | | | |
Noble Group Ltd.
6.75%, 1/29/20(b) | | | | | 2,368 | | | | 2,320,640 | |
8.50%, 5/30/13(b) | | | | | 2,103 | | | | 2,250,210 | |
| | | | | | | | | | |
| | | | | | | | | 4,570,850 | |
| | | | | | | | | | |
Services – 0.1% | | | | | | | | | | |
Expedia, Inc.
8.50%, 7/01/16 | | | | | 1,750 | | | | 1,929,107 | |
| | | | | | | | | | |
Technology – 0.0% | | | | | | | | | | |
Motorola Solutions, Inc.
7.50%, 5/15/25 | | | | | 325 | | | | 378,813 | |
| | | | | | | | | | |
Transportation - Airlines – 0.0% | | | | | | | | | | |
Delta Air Lines 2007-1 Class A Pass Through Trust
Series 071A
6.821%, 8/10/22 | | | | | 1,113 | | | | 1,124,466 | |
| | | | | | | | | | |
| | | | | | | | | 91,668,177 | |
| | | | | | | | | | |
Non Corporate Sectors – 0.9% | | | | | | | | | | |
Agencies - Not Government
Guaranteed – 0.9% | | | | | | | | | | |
AK Transneft OJSC Via TransCapitalInvest Ltd.
5.67%, 3/05/14(b) | | | | | 869 | | | | 913,536 | |
7.70%, 8/07/13(b) | | | | | 3,477 | | | | 3,761,193 | |
8.70%, 8/07/18(a)(b) | | | | | 1,219 | | | | 1,490,228 | |
Ecopetrol SA
7.625%, 7/23/19 | | | | | 1,722 | | | | 2,054,346 | |
Gazprom OAO Via Gaz Capital SA
6.212%, 11/22/16(b) | | | | | 2,825 | | | | 3,040,406 | |
6.51%, 3/07/22(b) | | | | | 9,473 | | | | 9,946,650 | |
9.25%, 4/23/19(b) | | | | | 7,353 | | | | 9,108,896 | |
| | | | | | | | | | |
| | | | | | | | | 30,315,255 | |
| | | | | | | | | | |
| | | | |
| ALLIANCEBERNSTEIN HIGH INCOME FUND • | | | 41 | |
Portfolio of Investments
| | | | | | | | | | |
| | | | | Principal
Amount
(000) | | | U.S. $ Value | |
| | | | | |
| | | | | | | | | | |
Utility – 0.7% | | | | | | | | | | |
Electric – 0.3% | | | | | | | | | | |
Dominion Resources, Inc./VA
7.50%, 6/30/66 | | U.S.$ | | | 4,100 | | | $ | 4,305,000 | |
Empresas Publicas de Medellin ESP
7.625%, 7/29/19(b) | | | | | 1,739 | | | | 2,025,935 | |
FirstEnergy Corp.
Series C
7.375%, 11/15/31 | | | | | 2,000 | | | | 2,513,856 | |
KCP&L Greater Missouri Operations Co.
11.875%, 7/01/12 | | | | | 1,000 | | | | 1,067,517 | |
| | | | | | | | | | |
| | | | | | | | | 9,912,308 | |
| | | | | | | | | | |
Natural Gas – 0.4% | | | | | | | | | | |
Enterprise Products Operating LLC
Series H
6.65%, 10/15/34 | | | | | 1,500 | | | | 1,819,016 | |
Source Gas LLC
5.90%, 4/01/17(b) | | | | | 3,000 | | | | 3,096,993 | |
Southern Union Co.
7.60%, 2/01/24 | | | | | 3,200 | | | | 3,769,091 | |
TransCanada PipeLines Ltd.
6.35%, 5/15/67 | | | | | 2,500 | | | | 2,547,935 | |
| | | | | | | | | | |
| | | | | | | | | 11,233,035 | |
| | | | | | | | | | |
| | | | | | | | | 21,145,343 | |
| | | | | | | | | | |
Total Corporates – Investment Grades
(cost $298,346,954) | | | | | | | | | 313,710,752 | |
| | | | | | | | | | |
| | | | | | | | | | |
EMERGING MARKETS - SOVEREIGNS – 4.7% | | | | | | | | | | |
Argentina – 1.5% | | | | | | | | | | |
Argentina Bonos
7.00%, 10/03/15(a) | | | | | 21,871 | | | | 19,315,915 | |
7.82%, 12/31/33 | | EUR | | | 6,824 | | | | 5,925,322 | |
Series NY
2.50%, 12/31/38(a)(i) | | U.S.$ | | | 14,680 | | | | 5,468,300 | |
8.28%, 12/31/33 | | | | | 1,816 | | | | 1,411,817 | |
Series X
7.00%, 4/17/17 | | | | | 18,150 | | | | 14,717,633 | |
| | | | | | | | | | |
| | | | | | | | | 46,838,987 | |
| | | | | | | | | | |
Dominican Republic – 0.5% | | | | | | | | | | |
Dominican Republic International Bond
8.625%, 4/20/27(b) | | | | | 14,203 | | | | 15,055,180 | |
| | | | | | | | | | |
| | | |
El Salvador – 0.5% | | | | | | | | | | |
El Salvador
7.375%, 12/01/19(b) | | | | | 1,495 | | | | 1,629,550 | |
7.625%, 9/21/34(b) | | | | | 872 | | | | 963,560 | |
| | |
| 42 | | • ALLIANCEBERNSTEIN HIGH INCOME FUND |
Portfolio of Investments
| | | | | | | | | | |
| | | | | Principal
Amount
(000) | | | U.S. $ Value | |
| | | | | |
| | | | | | | | | | |
7.65%, 6/15/35(b) | | U.S.$ | | | 11,545 | | | $ | 11,718,175 | |
7.75%, 1/24/23(b) | | | | | 700 | | | | 763,000 | |
| | | | | | | | | | |
| | | | | | | | | 15,074,285 | |
| | | | | | | | | | |
Gabon – 0.1% | | | | | | | | | | |
Gabonese Republic
8.20%, 12/12/17(b) | | | | | 3,208 | | | | 3,689,200 | |
| | | | | | | | | | |
| | | |
Ghana – 0.1% | | | | | | | | | | |
Republic of Ghana
8.50%, 10/04/17(b) | | | | | 4,524 | | | | 5,044,910 | |
| | | | | | | | | | |
| | | |
Indonesia – 0.1% | | | | | | | | | | |
Republic of Indonesia
8.50%, 10/12/35(b) | | | | | 1,645 | | | | 2,381,138 | |
| | | | | | | | | | |
| | | |
Jamaica – 0.1% | | | | | | | | | | |
Republic of Jamaica
8.00%, 6/24/19 | | | | | 2,207 | | | | 2,251,140 | |
| | | | | | | | | | |
| | | |
Serbia & Montenegro – 0.3% | | | | | | | | | | |
Republic of Serbia
6.75%, 11/01/24(b) | | | | | 1,693 | | | | 1,678,087 | |
7.25%, 9/28/21(b) | | | | | 6,418 | | | | 6,594,495 | |
| | | | | | | | | | |
| | | | | | | | | 8,272,582 | |
| | | | | | | | | | |
Turkey – 0.1% | | | | | | | | | | |
Republic of Turkey
7.00%, 6/05/20 | | | | | 300 | | | | 345,375 | |
7.375%, 2/05/25 | | | | | 1,649 | | | | 1,958,188 | |
| | | | | | | | | | |
| | | | | | | | | 2,303,563 | |
| | | | | | | | | | |
Ukraine – 0.3% | | | | | | | | | | |
Ukraine Government International Bond
6.385%, 6/26/12(b) | | | | | 750 | | | | 735,623 | |
6.58%, 11/21/16(b) | | | | | 2,441 | | | | 2,282,335 | |
7.65%, 6/11/13(b) | | | | | 4,498 | | | | 4,419,285 | |
Ukraine-Recap Linked Note
5.50%, 9/02/15(b) | | UAH | | | 21,600 | | | | 2,091,576 | |
| | | | | | | | | | |
| | | | | | | | | 9,528,819 | |
| | | | | | | | | | |
United Arab Emirates – 0.2% | | | | | | | | | | |
Emirate of Dubai Government International Bonds
7.75%, 10/05/20(a)(b) | | U.S.$ | | | 7,645 | | | | 8,065,475 | |
| | | | | | | | | | |
| | | |
Uruguay – 0.2% | | | | | | | | | | |
Republica Orient Uruguay
6.875%, 9/28/25 | | | | | 4,272 | | | | 5,382,720 | |
7.625%, 3/21/36 | | | | | 550 | | | | 726,000 | |
7.875%, 1/15/33(e) | | | | | 1,377 | | | | 1,859,529 | |
| | | | | | | | | | |
| | | | | | | | | 7,968,249 | |
| | | | | | | | | | |
| | | | |
| ALLIANCEBERNSTEIN HIGH INCOME FUND • | | | 43 | |
Portfolio of Investments
| | | | | | | | | | |
| | | | | Principal
Amount
(000) | | | U.S. $ Value | |
| | | | | |
| | | | | | | | | | |
Venezuela – 0.7% | | | | | | | | | | |
Republic of Venezuela
7.65%, 4/21/25 | | U.S.$ | | | 38,000 | | | $ | 23,655,000 | |
| | | | | | | | | | |
Total Emerging Markets - Sovereigns
(cost $128,744,365) | | | | | | | | | 150,128,528 | |
| | | | | | | | | | |
| | | | | | | | | | |
EMERGING MARKETS - CORPORATE BONDS – 4.0% | | | | | | | | | | |
Industrial – 3.5% | | | | | | | | | | |
Basic – 0.9% | | | | | | | | | | |
Evraz Group SA
8.25%, 11/10/15(b) | | | | | 1,289 | | | | 1,338,949 | |
9.50%, 4/24/18(b) | | | | | 5,066 | | | | 5,471,280 | |
Novelis, Inc./GA
8.75%, 12/15/20 | | | | | 7,000 | | | | 7,630,000 | |
PE Paper Escrow GmbH
12.00%, 8/01/14(b) | | | | | 791 | | | | 858,235 | |
Severstal OAO Via Steel Capital SA
9.25%, 4/19/14(b) | | | | | 1,570 | | | | 1,683,825 | |
Vedanta Resources PLC
8.75%, 1/15/14(b) | | | | | 4,299 | | | | 4,299,000 | |
9.50%, 7/18/18(a)(b) | | | | | 1,900 | | | | 1,824,000 | |
Winsway Coking Coal Holding Ltd.
8.50%, 4/08/16(b) | | | | | 5,109 | | | | 4,419,285 | |
| | | | | | | | | | |
| | | | | | | | | 27,524,574 | |
| | | | | | | | | | |
Communications - Media – 0.3% | | | | | | | | | | |
Central European Media Enterprises Ltd.
11.625%, 9/15/16(b) | | EUR | | | 2,895 | | | | 3,685,346 | |
Cet 21 Spol.S R.O.
9.00%, 11/01/17(b) | | | | | 121 | | | | 174,962 | |
Columbus International, Inc.
11.50%, 11/20/14(b) | | U.S.$ | | | 6,622 | | | | 6,853,770 | |
European Media Capital SA
10.00%, 2/01/15(j) | | | | | 537 | | | | 445,434 | |
| | | | | | | | | | |
| | | | | | | | | 11,159,512 | |
| | | | | | | | | | |
Communications - Telecommunications – 0.4% | | | | | | | | | | |
MTS International Funding Ltd.
8.625%, 6/22/20(b) | | | | | 4,400 | | | | 4,807,000 | |
Pacnet Ltd.
9.25%, 11/09/15(b) | | | | | 3,088 | | | | 2,748,320 | |
Vimpel Communications Via VIP Finance Ireland Ltd. OJSC
9.125%, 4/30/18(b) | | | | | 3,250 | | | | 3,436,875 | |
VimpelCom Holdings BV
7.504%, 3/01/22(a)(b) | | | | | 3,300 | | | | 3,093,750 | |
| | | | | | | | | | |
| | | | | | | | | 14,085,945 | |
| | | | | | | | | | |
| | |
| 44 | | • ALLIANCEBERNSTEIN HIGH INCOME FUND |
Portfolio of Investments
| | | | | | | | | | |
| | | | | Principal
Amount
(000) | | | U.S. $ Value | |
| | | | | |
| | | | | | | | | | |
Consumer Cyclical - Other – 0.4% | | | | | | | | | | |
Country Garden Holdings Co.
11.125%, 2/23/18(b) | | U.S.$ | | | 1,809 | | | $ | 1,610,010 | |
MCE Finance Ltd.
10.25%, 5/15/18(a) | | | | | 4,895 | | | | 5,139,750 | |
Peermont Global Pty Ltd.
7.75%, 4/30/14(a)(b) | | EUR | | | 4,400 | | | | 5,022,831 | |
| | | | | | | | | | |
| | | | | | | | | 11,772,591 | |
| | | | | | | | | | |
Consumer Cyclical - Retailers – 0.1% | | | | | | | | | | |
Edcon Holdings Pty Ltd.
7.028%, 6/15/15(b)(c) | | | | | 2,434 | | | | 2,492,265 | |
| | | | | | | | | | |
| | | |
Consumer Non-Cyclical – 0.5% | | | | | | | | | | |
CEDC Finance Corp. International, Inc.
8.875%, 12/01/16(a)(b) | | | | | 4,100 | | | | 4,198,146 | |
9.125%, 12/01/16(b) | | U.S.$ | | | 1,150 | | | | 828,000 | |
Foodcorp Pty Ltd.
8.75%, 3/01/18(b) | | EUR | | | 2,826 | | | | 3,734,371 | |
JBS Finance II Ltd.
8.25%, 1/29/18(b) | | U.S.$ | | | 4,750 | | | | 4,393,750 | |
JBS USA LLC/JBS USA Finance, Inc.
7.25%, 6/01/21(b) | | | | | 1,700 | | | | 1,581,000 | |
| | | | | | | | | | |
| | | | | | | | | 14,735,267 | |
| | | | | | | | | | |
Energy – 0.3% | | | | | | | | | | |
Golden Close Maritime Corp., Ltd
11.00%, 12/09/15 | | | | | 3,200 | | | | 3,328,953 | |
MIE Holdings Corp.
9.75%, 5/12/16(b) | | | | | 3,000 | | | | 2,700,000 | |
Zhaikmunai LLP
10.50%, 10/19/15(a)(b) | | | | | 3,240 | | | | 3,223,800 | |
| | | | | | | | | | |
| | | | | | | | | 9,252,753 | |
| | | | | | | | | | |
Other Industrial – 0.3% | | | | | | | | | | |
Marfrig Holding Europe BV
8.375%, 5/09/18(b) | | | | | 5,626 | | | | 4,275,760 | |
Marfrig Overseas Ltd.
9.50%, 5/04/20(b) | | | | | 3,659 | | | | 2,707,660 | |
New Reclamation Group Pty Ltd. (The)
8.125%, 2/01/13(b) | | EUR | | | 2,487 | | | | 2,684,068 | |
Savcio Holdings Pty Ltd.
8.00%, 2/15/13(b) | | | | | 290 | | | | 385,222 | |
| | | | | | | | | | |
| | | | | | | | | 10,052,710 | |
| | | | | | | | | | |
Technology – 0.0% | | | | | | | | | | |
STATS ChipPAC Ltd.
7.50%, 8/12/15(b) | | U.S.$ | | | 688 | | | | 729,280 | |
| | | | | | | | | | |
| | | |
Transportation - Airlines – 0.2% | | | | | | | | | | |
TAM Capital 3, Inc.
8.375%, 6/03/21(b) | | | | | 5,659 | | | | 5,743,885 | |
| | | | | | | | | | |
| | | | |
| ALLIANCEBERNSTEIN HIGH INCOME FUND • | | | 45 | |
Portfolio of Investments
| | | | | | | | | | |
| | | | | Principal
Amount
(000) | | | U.S. $ Value | |
| | | | | |
| | | | | | | | | | |
| | | |
Transportation - Services – 0.1% | | | | | | | | | | |
Inversiones Alsacia SA
8.00%, 8/18/18(b) | | U.S.$ | | | 4,205 | | | $ | 3,283,710 | |
| | | | | | | | | | |
| | | | | | | | | 110,832,492 | |
| | | | | | | | | | |
Financial Institutions – 0.5% | | | | | | | | | | |
Banking – 0.2% | | | | | | | | | | |
ATF Bank JSC
9.00%, 5/11/16(b) | | | | | 1,008 | | | | 967,680 | |
Banco BMG SA
9.15%, 1/15/16(b) | | | | | 1,300 | | | | 1,274,000 | |
Banco Cruzeiro do Sul SA/Brazil
8.875%, 9/22/20(b) | | | | | 794 | | | | 603,440 | |
Bank CenterCredit
8.625%, 1/30/14(b) | | | | | 2,734 | | | | 2,742,476 | |
Halyk Savings Bank of Kazakhstan JSC
7.25%, 1/28/21(b) | | | | | 837 | | | | 800,441 | |
Renaissance Securities Trading Ltd.
11.00%, 4/21/16(b) | | | | | 1,542 | | | | 1,257,405 | |
| | | | | | | | | | |
| | | | | | | | | 7,645,442 | |
| | | | | | | | | | |
Insurance – 0.1% | | | | | | | | | | |
Stoneheath RE
3.523%, 12/23/11(c) | | | | | 1,750 | | | | 1,281,875 | |
| | | | | | | | | | |
| | | |
Other Finance – 0.2% | | | | | | | | | | |
AES El Salvador Trust
6.75%, 2/01/16(b) | | | | | 1,200 | | | | 1,167,000 | |
DTEK Finance BV
9.50%, 4/28/15(b) | | | | | 4,574 | | | | 4,580,266 | |
| | | | | | | | | | |
| | | | | | | | | 5,747,266 | |
| | | | | | | | | | |
| | | | | | | | | 14,674,583 | |
| | | | | | | | | | |
Utility – 0.0% | | | | | | | | | | |
Electric – 0.0% | | | | | | | | | | |
Inkia Energy Ltd.
8.375%, 4/04/21(b) | | | | | 1,337 | | | | 1,360,505 | |
| | | | | | | | | | |
| | | |
Total Emerging Markets - Corporate Bonds
(cost $134,422,536) | | | | | | | | | 126,867,580 | |
| | | | | | | | | | |
| | | | | | | | | | |
COMMERCIAL MORTGAGE-BACKED SECURITIES – 3.4% | | | | | | | | | | |
Non-Agency Fixed Rate CMBS – 2.9% | | | | | | | | | | |
Banc of America Commercial Mortgage, Inc.
Series 2007-5, Class AM
5.772%, 2/10/51 | | | | | 6,665 | | | | 6,083,315 | |
| | |
| 46 | | • ALLIANCEBERNSTEIN HIGH INCOME FUND |
Portfolio of Investments
| | | | | | | | | | |
| | | | | Principal
Amount
(000) | | | U.S. $ Value | |
| | | | | |
| | | | | | | | | | |
Banc of America Large Loan, Inc.
Series 2009-UB1, Class A4B
5.614%, 6/24/50(b) | | U.S.$ | | | 3,500 | | | $ | 3,241,718 | |
Bear Stearns Commercial Mortgage Securities
Series 2007-PW18, Class AM
6.084%, 6/11/50 | | | | | 1,500 | | | | 1,359,452 | |
Citigroup/Deutsche Bank Commercial Mortgage Trust
Series 2005-CD1, Class AJ
5.226%, 7/15/44 | | | | | 3,242 | | | | 2,730,932 | |
Credit Suisse First Boston Mortgage Securities Corp.
Series 2005-C6, Class AJ
5.23%, 12/15/40 | | | | | 3,200 | | | | 2,926,746 | |
Credit Suisse Mortgage Capital Certificates
Series 2006-C4, Class A3
5.467%, 9/15/39 | | | | | 5,320 | | | | 5,625,996 | |
Series 2006-C4, Class AM
5.509%, 9/15/39 | | | | | 5,600 | | | | 4,646,079 | |
Goldman Sachs Mortgage Securities
5.475%, 8/10/44(b) | | | | | 7,937 | | | | 6,402,289 | |
JP Morgan Chase Commercial Mortgage Securities Corp.
Series 2006-CB15, Class AM
5.855%, 6/12/43 | | | | | 670 | | | | 626,603 | |
Series 2007-CB19, Class AM
5.739%, 2/12/49 | | | | | 10,321 | | | | 9,404,237 | |
Series 2007-LD11, Class AM
5.817%, 6/15/49 | | | | | 5,105 | | | | 4,102,291 | |
Series 2007-LD12, Class AM
6.059%, 2/15/51 | | | | | 1,856 | | | | 1,638,562 | |
LB-UBS Commercial Mortgage Trust
Series 2005-C2, Class AJ
5.205%, 4/15/30 | | | | | 2,475 | | | | 2,428,977 | |
Series 2007-C3, Class AM
5.942%, 7/15/44 | | | | | 4,390 | | | | 3,874,759 | |
Merrill Lynch Mortgage Trust
Series 2005-CIP1, Class AJ
5.137%, 7/12/38 | | | | | 2,700 | | | | 2,285,850 | |
Merrill Lynch/Countrywide Commercial Mortgage Trust
Series 2006-4, Class AM
5.204%, 12/12/49 | | | | | 10,100 | | | | 9,054,347 | |
Morgan Stanley Capital I
Series 2005-HQ6, Class AJ
5.073%, 8/13/42 | | | | | 1,417 | | | | 1,280,529 | |
| | | | |
| ALLIANCEBERNSTEIN HIGH INCOME FUND • | | | 47 | |
Portfolio of Investments
| | | | | | | | | | |
| | | | | Principal
Amount
(000) | | | U.S. $ Value | |
| | | | | |
| | | | | | | | | | |
Series 2006-IQ12, Class A4
5.332%, 12/15/43 | | U.S.$ | | | 7,100 | | | $ | 7,852,387 | |
Series 2006-IQ12, Class AM
5.37%, 12/15/43 | | | | | 7,876 | | | | 7,568,300 | |
Wachovia Bank Commercial Mortgage Trust
Series 2005-C20, Class AJ
5.154%, 7/15/42 | | | | | 1,810 | | | | 1,684,690 | |
Series 2006-C23, Class AM
5.466%, 1/15/45 | | | | | 2,400 | | | | 2,435,990 | |
Series 2006-C27, Class AM
5.795%, 7/15/45 | | | | | 2,000 | | | | 1,943,452 | |
WFDB Commercial Mortgage Trust
Series 2011-BXR, Class E
6.403%, 7/05/24(b) | | | | | 2,380 | | | | 2,357,352 | |
| | | | | | | | | | |
| | | | | | | | | 91,554,853 | |
| | | | | | | | | | |
Non-Agency Floating Rate CMBS – 0.5% | | | | | | | | | | |
Bscms 2007-bba8 K
Series 2007-BBA8, Class K
1.443%, 3/15/22(b)(c) | | | | | 5,893 | | | | 3,213,912 | |
Commercial Mortgage Pass Through Certificates
Series 2007-FL14, Class C
0.543%, 6/15/22(b)(c) | | | | | 1,178 | | | | 1,056,334 | |
LB-UBS Commercial Mortgage Trust
Series 2007-C7, Class AM
6.167%, 9/15/45(c) | | | | | 3,420 | | | | 2,916,303 | |
Lehman Brothers
Series 2006-LLFA, Class E
0.533%, 9/15/21(b)(c) | | | | | 1,347 | | | | 1,158,671 | |
Series 2006-LLFA, Class H
0.643%, 9/15/21(b)(c) | | | | | 3,017 | | | | 2,278,992 | |
Series 2006-LLFA, Class K
1.043%, 9/15/21(b)(c) | | | | | 953 | | | | 634,300 | |
Wachovia Bank Commercial Mortgage Trust
Series 2006-WL7A, Class H
0.643%, 9/15/21(b)(c) | | | | | 3,111 | | | | 1,967,443 | |
Series 2006-WL7A, Class J
0.843%, 9/15/21(b)(c) | | | | | 3,625 | | | | 2,183,754 | |
WF-RBS Commercial Mortgage Trust
Series 2011-C4, Class D
5.25%, 6/15/44(b)(h) | | | | | 2,576 | | | | 2,030,468 | |
| | | | | | | | | | |
| | | | | | | | | 17,440,177 | |
| | | | | | | | | | |
| | | |
Total Commercial Mortgage-Backed Securities
(cost $105,202,083) | | | | | | | | | 108,995,030 | |
| | | | | | | | | | |
| | |
| 48 | | • ALLIANCEBERNSTEIN HIGH INCOME FUND |
Portfolio of Investments
| | | | | | | | | | |
| | | | | Principal
Amount
(000) | | | U.S. $ Value | |
| | | | | |
| | | | | | | | | | |
COLLATERALIZED MORTGAGE OBLIGATIONS – 3.3% | | | | | | | | | | |
Non-Agency Floating Rate – 2.4% | | | | | | | | | | |
Bear Stearns Adjustable Rate Mortgage Trust
Series 2007-2, Class 1A1
2.328%, 12/25/46(c) | | U.S.$ | | | 3,562 | | | $ | 2,112,099 | |
Citigroup Mortgage Loan Trust
2006-ar3 1a2a
Series 2006-AR3, Class 1A2A
5.676%, 6/25/36(c) | | | | | 9,428 | | | | 7,780,999 | |
Countrywide Alternative Loan Trust
Series 2005-27, Class 2A3
1.79%, 8/25/35(c) | | | | | 7,293 | | | | 4,311,479 | |
Series 2005-76, Class 2A1
1.23%, 2/25/36(c) | | | | | 1,245 | | | | 782,109 | |
Series 2007-7T2, Class A3
0.845%, 4/25/37(c) | | | | | 6,059 | | | | 3,226,012 | |
Countrywide Home Loan Mortgage Pass Through Trust
Series 2007-13, Class A7
0.845%, 8/25/37(c) | | | | | 2,841 | | | | 2,121,628 | |
Greenpoint Mortgage Funding Trust
Series 2007-AR3, Class A1
0.465%, 6/25/37(c) | | | | | 4,321 | | | | 2,709,969 | |
Harborview Mortgage Loan Trust
Series 2005-7, Class 1A1
3.20%, 6/19/45(c) | | | | | 7,154 | | | | 3,826,842 | |
Series 2007-4, Class 2A1
0.464%, 7/19/47(c) | | | | | 11,043 | | | | 6,740,745 | |
Indymac Index Mortgage Loan Trust
Series 2006-AR37, Class 2A1
5.384%, 2/25/37(c) | | | | | 2,722 | | | | 1,725,571 | |
Lehman XS Trust
Series 2007-15N, Class 4A1
1.145%, 8/25/47(c) | | | | | 1,482 | | | | 783,379 | |
Series 2007-4N, Class 3A2A
0.98%, 3/25/47(c) | | | | | 6,770 | | | | 3,781,734 | |
Structured Adjustable Rate Mortgage Loan Trust
Series 2005-18, Class 8A1
5.458%, 9/25/35(c) | | | | | 6,551 | | | | 5,763,090 | |
Series 2006-9, Class 4A1
5.841%, 10/25/36(c) | | | | | 4,049 | | | | 2,668,893 | |
Structured Asset Mortgage Investments, Inc.
Series 2007-AR6, Class A1
1.73%, 8/25/47(c) | | | | | 9,314 | | | | 5,223,036 | |
| | | | |
| ALLIANCEBERNSTEIN HIGH INCOME FUND • | | | 49 | |
Portfolio of Investments
| | | | | | | | | | |
| | | | | Principal
Amount
(000) | | | U.S. $ Value | |
| | | | | |
| | | | | | | | | | |
Washington Mutual Alternative Mortgage Pass-Through Certificates
Series 2006-AR11, Class 3A1A
1.15%, 9/25/46(c) | | U.S.$ | | | 5,332 | | | $ | 2,611,698 | |
Series 2006-AR3, Class A1A
1.23%, 2/25/46(c) | | | | | 1,943 | | | | 1,348,577 | |
Series 2006-AR5, Class A1A
1.22%, 6/25/46(c) | | | | | 2,446 | | | | 1,619,745 | |
Series 2007-HY3, Class 4A1
2.616%, 3/25/37(c) | | | | | 8,353 | | | | 6,545,651 | |
Series 2007-OA3, Class 2A1A
0.99%, 4/25/47(c) | | | | | 2,656 | | | | 1,662,735 | |
Series 2007-OA4, Class A1A
0.99%, 4/25/47(c) | | | | | 1,961 | | | | 959,233 | |
Series 2007-OA5, Class 1A
0.98%, 6/25/47(c) | | | | | 15,622 | | | | 8,830,365 | |
| | | | | | | | | | |
| | | | | | | | | 77,135,589 | |
| | | | | | | | | | |
Non-Agency Fixed Rate – 0.8% | | | | | | | | | | |
Chaseflex Trust
Series 2007-1, Class 1A3
6.50%, 2/25/37 | | | | | 1,542 | | | | 951,944 | |
Citimortgage Alternative Loan Trust
Series 2007-A3, Class 1A4
5.75%, 3/25/37 | | | | | 4,008 | | | | 2,871,801 | |
Countrywide Alternative Loan Trust
Series 2006-42, Class 1A6
6.00%, 1/25/47 | | | | | 3,157 | | | | 1,871,253 | |
Series 2006-J1, Class 1A10
5.50%, 2/25/36 | | | | | 5,400 | | | | 3,684,853 | |
Series 2006-J5, Class 1A1
6.50%, 9/25/36 | | | | | 2,938 | | | | 1,931,063 | |
Series 2007-16CB, Class 1A7
6.00%, 8/25/37 | | | | | 2,375 | | | | 1,726,384 | |
First Horizon Alternative Mortgage Pass Through Certificates
Series 2006-FA1, Class 1A3
5.75%, 4/25/36 | | | | | 4,774 | | | | 3,405,010 | |
Washington Mutual Alternative Mortgage Pass-Through Certificates
Series 2006-7, Class A3
6.081%, 9/25/36 | | | | | 3,346 | | | | 1,912,725 | |
Series 2006-7, Class A4
6.171%, 9/25/36 | | | | | 3,208 | | | | 1,815,101 | |
Series 2006-9, Class A4
5.986%, 10/25/36 | | | | | 3,608 | | | | 2,083,383 | |
Wells Fargo Alternative Loan Trust
Series 2007-PA3, Class 3A1
6.25%, 7/25/37 | | | | | 4,185 | | | | 2,865,161 | |
| | | | | | | | | | |
| | | | | | | | | 25,118,678 | |
| | | | | | | | | | |
| | |
| 50 | | • ALLIANCEBERNSTEIN HIGH INCOME FUND |
Portfolio of Investments
| | | | | | | | | | |
| | | | | Principal
Amount
(000) | | | U.S. $ Value | |
| | | | | |
| | | | | | | | | | |
Non-Agency ARMs – 0.1% | | | | | | | | | | |
Citigroup Mortgage Loan Trust, Inc.
Series 2006-AR1, Class 3A1
2.69%, 3/25/36(c) | | U.S.$ | | | 4,156 | | | $ | 2,624,471 | |
| | | | | | | | | | |
| | | |
Total Collateralized Mortgage Obligations
(cost $114,887,023) | | | | | | | | | 104,878,738 | |
| | | | | | | | | | |
| | | | | | | | | | |
GOVERNMENTS - TREASURIES – 2.9% | | | | | | | | | | |
Brazil – 1.5% | | | | | | | | | | |
Brazil Notas do Tesouro Nacional
Series F
10.00%, 1/01/14-1/01/17 | | BRL | | | 41,980 | | | | 23,984,122 | |
Republic of Brazil
10.25%, 1/10/28 | | | | | 2,649 | | | | 1,728,095 | |
12.50%, 1/05/16-1/05/22 | | | | | 29,509 | | | | 21,256,900 | |
| | | | | | | | | | |
| | | | | | | | | 46,969,117 | |
| | | | | | | | | | |
Colombia – 0.2% | | | | | | | | | | |
Republic of Colombia
7.75%, 4/14/21 | | COP | | | 12,390,000 | | | | 7,793,217 | |
| | | | | | | | | | |
| | | |
Hungary – 0.4% | | | | | | | | | | |
Hungary Government Bond
Series 14/C
5.50%, 2/12/14 | | HUF | | | 1,175,500 | | | | 5,151,387 | |
Series 15/A
8.00%, 2/12/15 | | | | | 509,090 | | | | 2,353,002 | |
Series 16/C
5.50%, 2/12/16 | | | | | 1,131,580 | | | | 4,798,452 | |
| | | | | | | | | | |
| | | | | | | | | 12,302,841 | |
| | | | | | | | | | |
South Africa – 0.6% | | | | | | | | | | |
South Africa Government Bond
Series R204
8.00%, 12/21/18 | | ZAR | | | 16,800 | | | | 2,160,810 | |
Series R207
7.25%, 1/15/20 | | | | | 120,490 | | | | 14,657,327 | |
Series R208
6.75%, 3/31/21 | | | | | 21,565 | | | | 2,516,726 | |
| | | | | | | | | | |
| | | | | | | | | 19,334,863 | |
| | | | | | | | | | |
United States – 0.2% | | | | | | | | | | |
U.S. Treasury Notes
1.25%, 2/15/14(k) | | U.S.$ | | | 7,000 | | | | 7,148,750 | |
| | | | | | | | | | |
| | | |
Total Governments – Treasuries
(cost $86,211,838) | | | | | | | | | 93,548,788 | |
| | | | | | | | | | |
| | | | |
| ALLIANCEBERNSTEIN HIGH INCOME FUND • | | | 51 | |
Portfolio of Investments
| | | | | | | | | | |
| | | | | Principal
Amount
(000) | | | U.S. $ Value | |
| | | | | |
| | | | | | | | | | |
QUASI-SOVEREIGNS – 2.5% | | | | | | | | | | |
Quasi-Sovereign Bonds – 2.5% | | | | | | | | | | |
Indonesia – 0.2% | | | | | | | | | | |
Majapahit Holding BV
7.875%, 6/29/37(b) | | U.S.$ | | | 5,600 | | | $ | 6,580,000 | |
| | | | | | | | | | |
| | | |
Kazakhstan – 0.8% | | | | | | | | | | |
Intergas Finance BV
6.375%, 5/14/17(b) | | | | | 8,000 | | | | 8,540,000 | |
KazMunayGas National Co.
7.00%, 5/05/20(b) | | | | | 3,746 | | | | 4,101,870 | |
9.125%, 7/02/18(b) | | | | | 3,812 | | | | 4,612,520 | |
11.75%, 1/23/15(a)(b) | | | | | 5,900 | | | | 7,168,500 | |
| | | | | | | | | | |
| | | | | | | | | 24,422,890 | |
| | | | | | | | | | |
Philippines – 0.1% | | | | | | | | | | |
Power Sector Assets & Liabilities Management Corp.
7.25%, 5/27/19(b) | | | | | 950 | | | | 1,128,125 | |
| | | | | | | | | | |
| | | |
Russia – 1.1% | | | | | | | | | | |
Russian Agricultural Bank OJSC Via RSHB Capital SA
6.299%, 5/15/17(b) | | | | | 17,519 | | | | 18,154,064 | |
7.125%, 1/14/14(b) | | | | | 4,785 | | | | 5,036,212 | |
7.75%, 5/29/18(b) | | | | | 11,479 | | | | 12,669,946 | |
| | | | | | | | | | |
| | | | | | | | | 35,860,222 | |
| | | | | | | | | | |
Trinidad & Tobago – 0.1% | | | | | | | | | | |
Petroleum Co. of Trinidad & Tobago Ltd.
9.75%, 8/14/19(b) | | | | | 3,650 | | | | 4,244,111 | |
| | | | | | | | | | |
| | | |
Ukraine – 0.2% | | | | | | | | | | |
NAK Naftogaz Ukraine
9.50%, 9/30/14 | | | | | 5,978 | | | | 5,888,330 | |
Ukreximbank Via Biz Finance PLC
8.375%, 4/27/15(b) | | | | | 1,620 | | | | 1,522,800 | |
| | | | | | | | | | |
| | | | | | | | | 7,411,130 | |
| | | | | | | | | | |
| | | |
Total Quasi-Sovereigns
(cost $67,856,950) | | | | | | | | | 79,646,478 | |
| | | | | | | | | | |
| | | | | | | | | | |
BANK LOANS – 2.4% | | | | | | | | | | |
Industrial – 2.1% | | | | | | | | | | |
Basic – 0.2% | | | | | | | | | | |
Ineos US Finance LLC
7.50%, 12/16/13(c) | | | | | 70 | | | | 71,732 | |
8.00%, 12/16/14(c) | | | | | 80 | | | | 82,455 | |
NewPage Corporation
8.00%, 3/08/13(c) | | | | | 5,700 | | | | 5,718,981 | |
| | | | | | | | | | |
| | | | | | | | | 5,873,168 | |
| | | | | | | | | | |
| | |
| 52 | | • ALLIANCEBERNSTEIN HIGH INCOME FUND |
Portfolio of Investments
| | | | | | | | | | |
| | | | | Principal
Amount
(000) | | | U.S. $ Value | |
| | | | | |
| | | | | | | | | | |
Capital Goods – 0.3% | | | | | | | | | | |
Anchor Glass Container Corporation
6.00%, 3/02/16(c) | | U.S.$ | | | 552 | | | $ | 546,557 | |
Graphic Packaging International, Inc.
3.12%-3.16%, 5/16/14(c) | | | | | 178 | | | | 177,521 | |
Harbor Freight Tools USA, Inc./Central Purchasing LLC
6.50%, 12/22/17(c) | | | | | 6,105 | | | | 6,044,381 | |
Hawker Beechcraft Acquisition Company LLC
2.37%, 3/26/14(c) | | | | | 72 | | | | 53,182 | |
10.50%, 3/26/14(c) | | | | | 2,766 | | | | 2,288,689 | |
| | | | | | | | | | |
| | | | | | | | | 9,110,330 | |
| | | | | | | | | | |
Communications - Media – 0.2% | | | | | | | | | | |
Cengage Learning Acquisitions, Inc. (Thomson Learning)
2.50%, 7/03/14(c) | | | | | 904 | | | | 780,646 | |
Charter Communications Operating, LLC
2.25%, 3/06/14(c) | | | | | 27 | | | | 26,612 | |
7.25%, 3/06/14(c) | | | | | 34 | | | | 33,573 | |
Clear Channel Communications, Inc.
3.90%, 1/29/16(c) | | | | | 163 | | | | 127,682 | |
Intelsat Jackson Holdings S.A. (fka Intelsat Jackson Holdings, Ltd.)
5.25%, 4/02/18(c) | | | | | 2,488 | | | | 2,465,734 | |
Univision Communications, Inc.
4.50%, 3/31/17(c) | | | | | 2,323 | | | | 2,107,017 | |
WideOpenWest Finance, LLC
2.74%-4.75%, 6/30/14(c) | | | | | 971 | | | | 919,101 | |
| | | | | | | | | | |
| | | | | | | | | 6,460,365 | |
| | | | | | | | | | |
Consumer Cyclical - Automotive – 0.1% | | | | | | | | | | |
Allison Transmission, Inc.
2.75%, 8/07/14(c) | | | | | 932 | | | | 900,214 | |
Federal-Mogul Corporation
2.18%-2.19%, 12/29/14(c) | | | | | 1,301 | | | | 1,225,887 | |
2.18%-2.19%, 12/28/15(c) | | | | | 664 | | | | 625,452 | |
| | | | | | | | | | |
| | | | | | | | | 2,751,553 | |
| | | | | | | | | | |
Consumer Cyclical - Entertainment – 0.1% | | | | | | | | | | |
ClubCorp Club Operations, Inc.
6.00%, 11/30/16(c) | | | | | 2,481 | | | | 2,454,899 | |
Las Vegas Sands LLC
2.84%, 11/23/16(c) | | | | | 321 | | | | 308,516 | |
| | | | | | | | | | |
| | | | | | | | | 2,763,415 | |
| | | | | | | | | | |
| | | | |
| ALLIANCEBERNSTEIN HIGH INCOME FUND • | | | 53 | |
Portfolio of Investments
| | | | | | | | | | |
| | | | | Principal
Amount
(000) | | | U.S. $ Value | |
| | | | | |
| | | | | | | | | | |
Consumer Cyclical - Other – 0.1% | | | | | | | | | | |
Caesars Entertainment Operating Company, Inc. (fka Harrah’s Operating Company, Inc.)
3.24%-3.42%, 1/28/15(c) | | U.S.$ | | | 601 | | | $ | 528,000 | |
Great Atlantic & Pacific Tea Company, Inc., The
8.75%, 6/14/12(c) | | | | | 265 | | | | 264,338 | |
Harrah’s Las Vegas Propco, LLC
3.23%, 2/13/13(c) | | | | | 3,725 | | | | 2,844,037 | |
| | | | | | | | | | |
| | | | | | | | | 3,636,375 | |
| | | | | | | | | | |
Consumer Cyclical - Retailers – 0.1% | | | | | | | | | | |
Burlington Coat Factory Warehouse Corporation
6.25%, 2/23/17(c) | | | | | 741 | | | | 723,753 | |
Rite Aid Corporation
2.00%, 6/04/14(c) | | | | | 962 | | | | 911,518 | |
| | | | | | | | | | |
| | | | | | | | | 1,635,271 | |
| | | | | | | | | | |
Consumer Non-Cyclical – 0.3% | | | | | | | | | | |
CityCenter Holdings, LLC
7.50%, 1/21/15(c) | | | | | 300 | | | | 298,350 | |
ConvaTec Inc.
5.75%, 12/22/16(c) | | | | | 1,241 | | | | 1,212,711 | |
Grifols Inc.
5.50%, 6/01/16(c) | | | | | 500 | | | | 497,915 | |
Harlan Laboratories, Inc. (fka Harlan Sprague Dawley, Inc.)
3.75%, 7/11/14(c) | | | | | 1,983 | | | | 1,675,634 | |
Immucor, Inc.
7.25%, 8/19/18(c) | | | | | 5,000 | | | | 5,018,750 | |
U.S. Foodservice, Inc.
2.74%-2.75%, 7/03/14(c) | | | | | 992 | | | | 916,154 | |
| | | | | | | | | | |
| | | | | | | | | 9,619,514 | |
| | | | | | | | | | |
Energy – 0.1% | | | | | | | | | | |
CITGO Petroleum Corporation
9.00%, 6/24/17(c) | | | | | 1,876 | | | | 1,897,696 | |
| | | | | | | | | | |
| | | |
Other Industrial – 0.2% | | | | | | | | | | |
Gavilon Group LLC, The
6.00%, 12/06/16(c) | | | | | 361 | | | | 355,372 | |
Kinetic Concepts Inc. (Chiron Merger Sub Inc.)
4/20/18(I) | | | | | 2,850 | | | | 2,859,975 | |
Metaldyne LLC
5.25%, 5/18/17(c) | | | | | 2,975 | | | | 2,934,094 | |
| | | | | | | | | | |
| | | | | | | | | 6,149,441 | |
| | | | | | | | | | |
| | |
| 54 | | • ALLIANCEBERNSTEIN HIGH INCOME FUND |
Portfolio of Investments
| | | | | | | | | | |
| | | | | Principal
Amount
(000) | | | U.S. $ Value | |
| | | | | |
| | | | | | | | | | |
Services – 0.2% | | | | | | | | | | |
Advantage Sales & Marketing Inc.
5.25%, 12/18/17(c) | | U.S.$ | | | 993 | | | $ | 982,575 | |
Aveta, Inc.
8.50%, 4/14/15(c) | | | | | 204 | | | | 200,764 | |
Collins & Aikman Floorcoverings, Inc. (Tandus)
2.74%-2.75%, 5/08/14(c) | | | | | 1,724 | | | | 1,592,960 | |
Global Cash Access, Inc.
7.00%, 3/01/16(c) | | | | | 597 | | | | 587,221 | |
Realogy Corporation
3.27%, 10/10/13(c) | | | | | 5,237 | | | | 4,888,561 | |
Sabre, Inc.
2.25%-2.43%, 9/30/14(c) | | | | | 490 | | | | 428,587 | |
ServiceMaster Co., (The)
2.75%, 7/24/14(c) | | | | | 18 | | | | 16,901 | |
2.75%-2.83%, 7/24/14(c) | | | | | 178 | | | | 169,714 | |
| | | | | | | | | | |
| | | | | | | | | 8,867,283 | |
| | | | | | | | | | |
Technology – 0.2% | | | | | | | | | | |
Avaya, Inc.
3.06%, 10/24/14(c) | | | | | 195 | | | | 185,203 | |
4.81%, 10/26/17(c) | | | | | 391 | | | | 356,239 | |
First Data Corporation
2.99%, 9/24/14(c) | | | | | 651 | | | | 601,558 | |
Smart Modular Technologies (Global), Inc.
8.25%, 8/26/17(c) | | | | | 5,000 | | | | 4,500,000 | |
SunGard Data Systems, Inc. (Solar Capital Corp.)
3.89%-3.94%, 2/28/16(c) | | | | | 351 | | | | 346,686 | |
Syniverse Holdings, Inc.
5.25%, 12/21/17(c) | | | | | 993 | | | | 990,842 | |
| | | | | | | | | | |
| | | | | | | | | 6,980,528 | |
| | | | | | | | | | |
Transportation - Services – 0.0% | | | | | | | | | | |
Swift Transportation Co., LLC
6.00%, 12/21/16(c) | | | | | 384 | | | | 383,435 | |
| | | | | | | | | | |
| | | | | | | | | 66,128,374 | |
| | | | | | | | | | |
Financial Institutions – 0.2% | | | | | | | | | | |
Finance – 0.2% | | | | | | | | | | |
Delos Aircraft, Inc.
7.00%, 3/17/16(c) | | | | | 106 | | | | 106,430 | |
International Lease Finance Corp. (Delos Aircraft, Inc.)
6.75%, 3/17/15(c) | | | | | 144 | | | | 144,547 | |
iStar Financial, Inc.
7.00%, 6/30/14(c) | | | | | 4,800 | | | | 4,658,016 | |
| | | | | | | | | | |
| | | | | | | | | 4,908,993 | |
| | | | | | | | | | |
| | | | |
| ALLIANCEBERNSTEIN HIGH INCOME FUND • | | | 55 | |
Portfolio of Investments
| | | | | | | | | | |
| | | | | Principal
Amount
(000) | | | U.S. $ Value | |
| | | | | |
| | | | | | | | | | |
Insurance – 0.0% | | | | | | | | | | |
Asurion LLC (fka Asurion Corporation)
5.50%, 5/24/18(c) | | U.S.$ | | | 980 | | | $ | 963,628 | |
| | | | | | | | | | |
| | | | | | | | | 5,872,621 | |
| | | | | | | | | | |
Utility – 0.1% | | | | | | | | | | |
Electric – 0.1% | | | | | | | | | | |
FirstLight Power Resources, Inc. (fka NE Energy, Inc.)
2.75%, 11/01/13(c) | | | | | 253 | | | | 242,060 | |
4.75%, 5/01/14(c) | | | | | 1,000 | | | | 907,500 | |
Texas Competitive Electric Holdings Company LLC (TXU)
3.74%-3.81%, 10/10/14(c) | | | | | 1,632 | | | | 1,213,446 | |
| | | | | | | | | | |
| | | | | | | | | 2,363,006 | |
| | | | | | | | | | |
Other Utility – 0.0% | | | | | | | | | | |
Willbros United States Holdings, Inc.
9.50%, 6/30/14(c) | | | | | 1,239 | | | | 1,223,652 | |
| | | | | | | | | | |
| | | | | | | | | 3,586,658 | |
| | | | | | | | | | |
| | | |
Total Bank Loans
(cost $76,723,485) | | | | | | | | | 75,587,653 | |
| | | | | | | | | | |
| | | | | | | | | | |
GOVERNMENTS - SOVEREIGN BONDS – 2.3% | | | | | | | | | | |
Brazil – 0.1% | | | | | | | | | | |
Republic of Brazil
8.25%, 1/20/34 | | | | | 2,022 | | | | 2,947,065 | |
| | | | | | | | | | |
| | | |
Colombia – 0.4% | | | | | | | | | | |
Republic of Colombia
7.375%, 3/18/19-9/18/37 | | | | | 10,130 | | | | 13,691,725 | |
| | | | | | | | | | |
| | | |
Cote D’Ivoire – 0.5% | | | | | | | | | | |
Ivory Coast Government International Bond
2.50%, 12/31/32(b)(d)(i) | | | | | 30,379 | | | | 16,480,607 | |
| | | | | | | | | | |
| | | |
Croatia – 0.3% | | | | | | | | | | |
Republic of Croatia
6.625%, 7/14/20(b) | | | | | 5,350 | | | | 5,276,438 | |
6.75%, 11/05/19(b) | | | | | 3,280 | | | | 3,280,000 | |
| | | | | | | | | | |
| | | | | | | | | 8,556,438 | |
| | | | | | | | | | |
Iceland – 0.1% | | | | | | | | | | |
Iceland Government International Bond
3.75%, 12/01/11 | | EUR | | | 2,750 | | | | 3,795,156 | |
| | | | | | | | | | |
| | |
| 56 | | • ALLIANCEBERNSTEIN HIGH INCOME FUND |
Portfolio of Investments
| | | | | | | | | | |
| | | | | Principal
Amount
(000) | | | U.S. $ Value | |
| | | | | |
| | | | | | | | | | |
| | | |
Lithuania – 0.2% | | | | | | | | | | |
Republic of Lithuania
6.75%, 1/15/15(b) | | U.S.$ | | | 3,815 | | | $ | 4,120,200 | |
7.375%, 2/11/20(b) | | | | | 2,202 | | | | 2,449,725 | |
| | | | | | | | | | |
| | | | | | | | | 6,569,925 | |
| | | | | | | | | | |
Panama – 0.3% | | | | | | | | | | |
Republic of Panama
6.70%, 1/26/36 | | | | | 1,317 | | | | 1,646,250 | |
8.875%, 9/30/27 | | | | | 2,709 | | | | 3,982,230 | |
9.375%, 4/01/29 | | | | | 2,946 | | | | 4,536,840 | |
| | | | | | | | | | |
| | | | | | | | | 10,165,320 | |
| | | | | | | | | | |
Peru – 0.1% | | | | | | | | | | |
Republic of Peru
8.75%, 11/21/33 | | | | | 2,738 | | | | 4,127,535 | |
| | | | | | | | | | |
| | | |
Russia – 0.3% | | | | | | | | | | |
Russia - Recap Linked Note
7.50%, 3/15/18 | | RUB | | | 232,655 | | | | 7,469,057 | |
| | | | | | | | | | |
| | | |
Total Governments - Sovereign Bonds
(cost $66,398,456) | | | | | | | | | 73,802,828 | |
| | | | | | | | | | |
| | | | | | | | | | |
EMERGING MARKETS - TREASURIES – 1.6% | | | | | | | | | | |
Colombia – 0.0% | | | | | | | | | | |
Republic of Colombia
9.85%, 6/28/27 | | COP | | | 1,391,000 | | | | 1,054,916 | |
| | | | | | | | | | |
| | | |
Dominican Republic – 0.3% | | | | | | | | | | |
Dominican Republic International Bond
16.00%, 7/10/20(b) | | DOP | | | 445,200 | | | | 11,471,353 | |
| | | | | | | | | | |
| | | |
Egypt – 0.1% | | | | | | | | | | |
Arab Republic of Egypt
8.75%, 7/18/12(b) | | EGP | | | 21,900 | | | | 3,469,619 | |
| | | | | | | | | | |
| | | |
Indonesia – 0.6% | | | | | | | | | | |
Indonesia Recap Linked Note
10.00%, 7/18/17 | | IDR | | | 63,808,000 | | | | 8,667,509 | |
9.50%, 5/17/41 | | | | | 68,280,000 | | | | 9,639,030 | |
| | | | | | | | | | |
| | | | | | | | | 18,306,539 | |
| | | | | | | | | | |
Philippines – 0.2% | | | | | | | | | | |
Republic of Philippines
6.25%, 1/14/36 | | PHP | | | 280,000 | | | | 6,403,190 | |
| | | | | | | | | | |
| | | |
Turkey – 0.4% | | | | | | | | | | |
Turkey Government Bond
11.00%, 8/06/14 | | TRY | | | 17,375 | | | | 10,203,538 | |
| | | | |
| ALLIANCEBERNSTEIN HIGH INCOME FUND • | | | 57 | |
Portfolio of Investments
| | | | | | | | | | |
| | | | | Principal
Amount
(000) | | | U.S. $ Value | |
| | | | | |
| | | | | | | | | | |
16.00%, 3/07/12 | | TRY | | | 3,248 | | | $ | 1,873,223 | |
| | | | | | | | | | |
| | | | | | | | | 12,076,761 | |
| | | | | | | | | | |
Total Emerging Markets – Treasuries
(cost $52,984,034) | | | | | | | | | 52,782,378 | |
| | | | | | | | | | |
| | | | | Shares | | | | |
PREFERRED STOCKS – 1.1% | | | | | | | | | | |
Financial Institutions – 0.7% | | | | | | | | | | |
Banking – 0.4% | | | | | | | | | | |
Capital One Capital II
7.50% | | | | | 130,000 | | | | 3,269,500 | |
Citigroup Capital XIII
7.875%(h) | | | | | 94,000 | | | | 2,531,420 | |
Santander Finance Preferred SA Unipersonal 6.80% | | | | | 67,000 | | | | 1,563,780 | |
Zions Bancorporation
9.50% | | | | | 196,500 | | | | 5,085,420 | |
| | | | | | | | | | |
| | | | | | | | | 12,450,120 | |
| | | | | | | | | | |
Finance – 0.3% | | | | | | | | | | |
Ally Financial, Inc.
7.00%(b) | | | | | 479 | | | | 357,229 | |
8.50% | | | | | 118,000 | | | | 2,289,082 | |
Citigroup Capital XII
8.50% | | | | | 237,000 | | | | 6,067,200 | |
| | | | | | | | | | |
| | | | | | | | | 8,713,511 | |
| | | | | | | | | | |
REITS – 0.0% | | | | | | | | | | |
Sovereign Real Estate Investment Trust
12.00%(b) | | | | | 501 | | | | 539,718 | |
| | | | | | | | | | |
| | | | | | | | | 21,703,349 | |
| | | | | | | | | | |
Industrial – 0.4% | | | | | | | | | | |
Communications - Telecommunications – 0.2% | | | | | | | | | | |
Centaur Funding Corp.
9.08%(b) | | | | | 6,280 | | | | 7,259,287 | |
| | | | | | | | | | |
| | | |
Consumer Cyclical - Other – 0.2% | | | | | | | | | | |
Las Vegas Sands Corp.
10.00% | | | | | 51,000 | | | | 5,727,963 | |
| | | | | | | | | | |
| | | | | | | | | 12,987,250 | |
| | | | | | | | | | |
Non Corporate Sectors – 0.0% | | | | | | | | | | |
Agencies - Government Sponsored – 0.0% | | | | | | | | | | |
Federal Home Loan Mortgage Corp.
Series Z
8.375% | | | | | 11,250 | | | | 24,075 | |
| | |
| 58 | | • ALLIANCEBERNSTEIN HIGH INCOME FUND |
Portfolio of Investments
| | | | | | | | | | |
| Company | | | |
Shares | | | U.S. $ Value | |
| | | | | |
| | | | | | | | | | |
Federal National Mortgage Association
8.25%(m) | | | | | 51,350 | | | $ | 100,646 | |
| | | | | | | | | | |
| | | | | | | | | 124,721 | |
| | | | | | | | | | |
Total Preferred Stocks
(cost $35,428,881) | | | | | | | | | 34,815,320 | |
| | | | | | | | | | |
| | | |
| | | | | Principal
Amount
(000) | | | | |
ASSET-BACKED SECURITIES – 0.7% | | | | | | | | | | |
Home Equity Loans - Fixed Rate – 0.5% | | | | | | | | |
Countrywide Asset-Backed Certificates
Series 2005-7, Class AF5W
5.054%, 10/25/35 | | U.S.$ | | | 2,108 | | | | 1,216,547 | |
Series 2006-1, Class AF6
5.526%, 7/25/36 | | | | | 2,609 | | | | 2,054,206 | |
Series 2006-15, Class A6
5.826%, 10/25/46 | | | | | 2,271 | | | | 1,531,920 | |
CSAB Mortgage Backed Trust
Series 2006-2, Class A6A
5.72%, 9/25/36 | | | | | 1,925 | | | | 1,242,771 | |
GSAA Home Equity Trust
Series 2005-12, Class AF5
5.659%, 9/25/35 | | | | | 2,300 | | | | 1,653,526 | |
Series 2006-10, Class AF3
5.985%, 6/25/36 | | | | | 2,396 | | | | 1,295,280 | |
JP Morgan Mortgage Acquisition Corp.
Series 2007-CH2, Class AF3
5.552%, 1/25/37 | | | | | 1,750 | | | | 984,754 | |
Lehman XS Trust
Series 2006-17, Class WF32
5.55%, 11/25/36 | | | | | 3,400 | | | | 2,740,146 | |
Series 2007-6, Class 3A5
5.72%, 5/25/37 | | | | | 1,246 | | | | 872,897 | |
Morgan Stanley Mortgage Loan Trust
Series 2006-15XS, Class A3
5.988%, 11/25/36 | | | | | 2,325 | | | | 1,221,136 | |
Series 2007-8XS, Class A2
6.00%, 4/25/37 | | | | | 2,213 | | | | 1,454,565 | |
| | | | | | | | | | |
| | | | | | | | | 16,267,748 | |
| | | | | | | | | | |
Home Equity Loans - Floating Rate – 0.2% | | | | | | | | | | |
Countrywide Asset-Backed Certificates
Series 2007-S2, Class A1
0.385%, 5/25/37(c) | | | | | 345 | | | | 337,445 | |
Credit-Based Asset Servicing and Securitization LLC
Series 2007-CB2, Class A2C
5.623%, 2/25/37(c) | | | | | 4,700 | | | | 2,345,017 | |
| | | | |
| ALLIANCEBERNSTEIN HIGH INCOME FUND • | | | 59 | |
Portfolio of Investments
| | | | | | | | | | |
| | | | | Principal
Amount
(000) | | | U.S. $ Value | |
| | | | | |
| | | | | | | | | | |
Series 2007-CB3, Class A3 | | | | | | | | | | |
5.419%, 3/25/37(c) | | U.S.$ | | | 2,147 | | | $ | 806,743 | |
GSAA Home Equity Trust
Series 2006-6, Class AF5
5.856%, 3/25/36(c) | | | | | 1,390 | | | | 626,642 | |
GSAA Trust
Series 2006-6, Class AF4
5.856%, 3/25/36(c) | | | | | 1,853 | | | | 835,536 | |
HSBC Asset Loan Obligation
Series 2007-WF1, Class A3
5.682%, 12/25/36(c) | | | | | 3,564 | | | | 1,480,570 | |
| | | | | | | | | | |
| | | | | | | | | 6,431,953 | |
| | | | | | | | | | |
Other ABS - Fixed Rate – 0.0% | | | | | | | | | | |
CW Capital Cobalt Ltd.
Series 2006-C1, Class AMP1
5.501%, 8/15/48(b) | | | | | 1,139 | | | | 946,457 | |
| | | | | | | | | | |
Total Asset-Backed Securities
(cost $26,576,331) | | | | | | | | | 23,646,158 | |
| | | | | | | | | | |
| | | | | | | | | | |
LOCAL GOVERNMENTS - MUNICIPAL BONDS – 0.5% | | | | | | | | | | |
United States – 0.5% | | | | | | | | | | |
Allegheny Cnty PA Hosp Dev Auth (West Penn Allegheny Hlth Sys)
Series 2007A
5.375%, 11/15/40 | | | | | 1,575 | | | | 1,292,256 | |
California GO
7.60%, 11/01/40 | | | | | 1,200 | | | | 1,474,656 | |
7.625%, 3/01/40 | | | | | 1,250 | | | | 1,530,775 | |
7.95%, 3/01/36 | | | | | 2,235 | | | | 2,517,996 | |
Illinois GO
7.35%, 7/01/35 | | | | | 4,120 | | | | 4,583,665 | |
Rhode Island Hlth & Ed Bldg Corp. (Tockwotton Home)
8.375%, 1/01/46 | | | | | 3,655 | | | | 3,737,420 | |
| | | | | | | | | | |
Total Local Governments - Municipal Bonds
(cost $13,572,308) | | | | | | | | | 15,136,768 | |
| | | | | | | | | | |
| | | | | | | | | | |
SUPRANATIONALS – 0.3% | | | | | | | | | | |
Eurasian Development Bank
7.375%, 9/29/14(b) | | | | | 1,760 | | | | 1,852,400 | |
European Investment Bank
Zero Coupon, 4/24/13(b) | | IDR | | | 82,770,270 | | | | 8,289,650 | |
| | | | | | | | | | |
Total Supranationals
(cost $10,325,525) | | | | | | | | | 10,142,050 | |
| | | | | | | | | | |
| | | | | | | | | | |
| | |
| 60 | | • ALLIANCEBERNSTEIN HIGH INCOME FUND |
Portfolio of Investments
| | | | | | | | | | |
| | | | | Principal
Amount
(000) | | | U.S. $ Value | |
| | | | | |
| | | | | | | | | | |
LOCAL GOVERNMENTS - REGIONAL BONDS – 0.3% | | | | | | | | | | |
Argentina – 0.1% | | | | | | | | | | |
Provincia de Cordoba
12.375%, 8/17/17(b) | | U.S.$ | | | 4,226 | | | $ | 3,856,225 | |
| | | | | | | | | | |
| | | |
Colombia – 0.2% | | | | | | | | | | |
Bogota Distrio Capital
9.75%, 7/26/28(b) | | COP | | | 6,665,000 | | | | 4,812,144 | |
| | | | | | | | | | |
| | | |
Total Local Governments – Regional Bonds
(cost $7,052,106) | | | | | | | | | 8,668,369 | |
| | | | | | | | | | |
| | | | | | | | | | |
INFLATION-LINKED
SECURITIES – 0.1% | | | | | | | | | | |
Uruguay – 0.1% | | | | | | | | | | |
Republica Orient Uruguay
3.70%, 6/26/37
(cost $2,392,520) | | UYU | | | 56,153 | | | | 2,719,744 | |
| | | | | | | | | | |
| | | | | | | | | | |
GOVERNMENTS - SOVEREIGN AGENCIES – 0.1% | | | | | | | | | | |
Spain – 0.1% | | | | | | | | | | |
Instituto de Credito Oficial
4.53%, 3/17/16
(cost $2,474,798) | | CAD | | | 2,700 | | | | 2,430,826 | |
| | | | | | | | | | |
| | | |
| | | | | Contracts(n) | | | | |
OPTIONS PURCHASED -
PUTS – 0.1% | | | | | | | | | | |
Options on Funds and Investment Trusts – 0.1% | | | | | | | | | | |
SPDR S&P 500 ETF Trust
Expiration: Dec 2011,
Exercise Price: $108.00(m) | | | | | 2,198 | | | | 240,681 | |
SPDR S&P 500 ETF Trust
Expiration: Jan 2012,
Exercise Price: $113.00(m) | | | | | 1,690 | | | | 458,835 | |
SPDR S&P 500 ETF Trust
Expiration: Jan 2012,
Exercise Price: $114.00(m) | | | | | 1,997 | | | | 582,125 | |
| | | | | | | | | | |
| | | | | | | | | 1,281,641 | |
| | | | | | | | | | |
| | | |
| | | | | Contract
Amount
(000) | | | | |
Options on Forward Contracts – 0.0% | | | | | | | | | | |
EUR/USD
Expiration: Nov 2011,
Exercise Price: EUR 1.25(m) | | | | | 90,100 | | | | 1,372 | |
| | | | |
| ALLIANCEBERNSTEIN HIGH INCOME FUND • | | | 61 | |
Portfolio of Investments
| | | | | | | | | | |
| | | | | Contract
Amount
(000) | | | U.S. $ Value | |
| | | | | |
| | | | | | | | | | |
CNY/USD
Expiration: Aug 2012,
Exercise Price: CNY 7.00(m) | | CNY | | | 1,553,000 | | | $ | 644,181 | |
| | | | | | | | | | |
| | | | | | | | | 645,553 | |
| | | | | | | | | | |
Total Options Purchased – Puts
(cost $3,986,266) | | | | | | | | | 1,927,194 | |
| | | | | | | | | | |
| | | |
| | | | | Shares | | | | |
COMMON STOCKS – 0.0% | | | | | | | | | | |
American Media Operations, Inc.(f)(g) | | | | | 15,926 | | | | 207,038 | |
American Media, Inc.(g)(j) | | | | | 10,382 | | | | 0 | |
AOT Bedding Super Holdings, LLC(f)(g) | | | | | 43 | | | | 0 | |
Fairpoint Communications, Inc.(m) | | | | | 3,825 | | | | 20,540 | |
Gallery Capital SA(g)(o) | | | | | 202 | | | | 252,500 | |
Greektown Superholdings, Inc.(f)(g)(m) | | | | | 541 | | | | 35,165 | |
Keystone Automotive Operations, Inc.(f)(m) | | | | | 41,929 | | | | 530,495 | |
Magnachip Semiconductor(m)(o) | | | | | 300 | | | | 0 | |
Merisant Co.(f)(g)(m) | | | | | 999 | | | | 0 | |
Neenah Enterprises, Inc.(f)(g)(m) | | | | | 49,578 | | | | 285,074 | |
U.S. Shipping Corp.(f)(g) | | | | | 27,473 | | | | 0 | |
| | | | | | | | | | |
Total Common Stocks
(cost $2,583,174) | | | | | | | | | 1,330,812 | |
| | | | | | | | | | |
| | | | | | | | | | |
WARRANTS – 0.0% | | | | | | | | | | |
Alion Science And Technology Corp., expiring 11/01/14(b)(f)(g)(m) | | | | | 1,050 | | | | 0 | |
Fairpoint Communications, Inc., expiring 1/24/18(f)(g)(m) | | | | | 6,521 | | | | 0 | |
Magnachip Semiconductor, expiring 12/31/49(m)(o) | | | | | 12,000 | | | | 0 | |
Quality Distribution LLC, QD Capital Corp., expiring 11/01/13(m) | | | | | 50,562 | | | | 569,328 | |
Talon Equity Co. NV, expiring 11/24/15(f)(l)(m) | | | | | 877 | | | | 0 | |
| | | | | | | | | | |
Total Warrants
(cost $6) | | | | | | | | | 569,328 | |
| | | | | | | | | | |
| | | | | | | | | | |
SHORT-TERM INVESTMENTS – 15.4% | | | | | | | | | | |
Investment Companies – 15.4% | | | | | | | | | | |
AllianceBernstein Fixed-Income Shares, Inc. - Government STIF Portfolio, 0.09%(p)
(cost $494,457,559) | | | | | 494,457,559 | | | | 494,457,559 | |
| | | | | | | | | | |
| | | |
Total Investments – 102.8%
(cost $3,274,333,631) | | | | | | | | | 3,292,414,025 | |
Other assets less liabilities – (2.8)% | | | | | | | | | (89,811,165 | ) |
| | | | | | | | | | |
Net Assets – 100.0% | | | | | | | | $ | 3,202,602,860 | |
| | | | | | | | | | |
| | |
| 62 | | • ALLIANCEBERNSTEIN HIGH INCOME FUND |
Portfolio of Investments
FORWARD CURRENCY EXCHANGE CONTRACTS (see Note D)
| | | | | | | | | | | | | | | | |
| Counterparty & Description | | Contract
Amount
(000) | | | U.S. $
Value on
Origination
Date | | | U.S. $
Value at
October 31,
2011 | | | Unrealized
Appreciation/
(Depreciation) | |
Buy Contracts | | | | | | | | | | | | | | | | |
Barclays Capital Inc.: | | | | | | | | | | | | | | | | |
Euro settling 11/17/11 | | | 1,547 | | | $ | 2,133,572 | | | $ | 2,140,361 | | | $ | 6,789 | |
Citibank: | | | | | | | | | | | | | | | | |
Euro settling 11/17/11 | | | 1,015 | | | | 1,398,265 | | | | 1,403,678 | | | | 5,413 | |
Great British Pound settling 11/09/11 | | | 2,977 | | | | 4,603,359 | | | | 4,785,937 | | | | 182,578 | |
Norwegian Krone settling 11/22/11 | | | 175,779 | | | | 31,276,846 | | | | 31,531,608 | | | | 254,762 | |
Credit Suisse First Boston: | | | | | | | | | | | | | | | | |
Chinese Yuan Renminbi settling 1/13/12(1) | | | 218,234 | | | | 33,666,517 | | | | 34,314,078 | | | | 647,561 | |
Singapore Dollar settling 11/18/11 | | | 33,854 | | | | 26,785,224 | | | | 26,979,581 | | | | 194,357 | |
Deutsche Bank: | | | | | | | | | | | | | | | | |
Mexican Peso settling 11/22/11 | | | 315,964 | | | | 23,701,480 | | | | 23,662,778 | | | | (38,702 | ) |
Goldman Sachs: | | | | | | | | | | | | | | | | |
Brazilian Real settling 11/03/11(1) | | | 63,055 | | | | 35,785,796 | | | | 36,716,503 | | | | 930,707 | |
Brazilian Real settling 11/03/11(1) | | | 63,055 | | | | 37,343,543 | | | | 36,716,503 | | | | (627,040 | ) |
Russian Rubles settling 11/14/11(1) | | | 172,050 | | | | 5,484,263 | | | | 5,661,214 | | | | 176,951 | |
Morgan Stanley & Co., Inc.: | | | | | | | | | | | | | | | | |
Euro settling 11/17/11 | | | 8,153 | | | | 11,547,081 | | | | 11,279,881 | | | | (267,200 | ) |
Standard Chartered Bank: | | | | | | | | | | | | | | | | |
Chinese Yuan Renminbi settling 1/13/12(1) | | | 49,473 | | | | 7,781,192 | | | | 7,730,450 | | | | (50,742 | ) |
Chinese Yuan Renminbi settling 1/13/12(1) | | | 97,307 | | | | 15,296,261 | | | | 15,204,879 | | | | (91,382 | ) |
Chinese Yuan Renminbi settling 1/13/12(1) | | | 70,944 | | | | 11,189,954 | | | | 11,085,511 | | | | (104,443 | ) |
Malaysian Ringgit settling 11/21/11 | | | 40,121 | | | | 12,868,372 | | | | 13,026,175 | | | | 157,803 | |
South Korean Won settling 11/10/11 | | | 35,208,918 | | | | 32,531,569 | | | | 31,750,654 | | | | (780,915 | ) |
| | | | |
Sale Contracts | | | | | | | | | | | | | | | | |
Barclays Capital Inc.: | | | | | | | | | | | | | | | | |
Australian Dollar settling 11/28/11 | | | 4,660 | | | | 4,843,957 | | | | 4,895,572 | | | | (51,615 | ) |
Brown Brothers Harriman & Co.: | | | | | | | | | | | | | | | | |
Euro settling 11/15/11 | | | 1,750 | | | | 2,425,518 | | | | 2,421,130 | | | | 4,388 | |
Citibank: | | | | | | | | | | | | | | | | |
Euro settling 11/17/11 | | | 5,848 | | | | 8,312,356 | | | | 8,090,201 | | | | 222,155 | |
South African Rand settling 11/21/11 | | | 141,161 | | | | 17,462,605 | | | | 17,737,925 | | | | (275,320 | ) |
| | | | |
| ALLIANCEBERNSTEIN HIGH INCOME FUND • | | | 63 | |
Portfolio of Investments
| | | | | | | | | | | | | | | | |
| Counterparty & Description | | Contract
Amount
(000) | | | U.S. $
Value on
Origination
Date | | | U.S. $
Value at
October 31,
2011 | | | Unrealized
Appreciation/
(Depreciation) | |
Credit Suisse First Boston: | | | | | | | | | | | | | | | | |
Colombian Peso settling 11/15/11(1) | | | 14,654,708 | | | $ | 7,698,822 | | | $ | 7,852,681 | | | $ | (153,859 | ) |
Goldman Sachs: | | | | | | | | | | | | | | | | |
Brazilian Real settling 11/03/11(1) | | | 63,055 | | | | 37,343,543 | | | | 36,716,503 | | | | 627,040 | |
Brazilian Real settling 11/03/11(1) | | | 63,055 | | | | 34,740,811 | | | | 36,716,503 | | | | (1,975,692 | ) |
Brazilian Real settling 12/02/11(1) | | | 63,055 | | | | 35,555,753 | | | | 36,437,199 | | | | (881,446 | ) |
JPMorgan Chase Bank: | | | | | | | | | | | | | | | | |
Euro settling 11/17/11 | | | 7,762 | | | | 10,656,184 | | | | 10,738,992 | | | | (82,808 | ) |
Morgan Stanley & Co., Inc.: | | | | | | | | | | | | | | | | |
Indonesian Rupiah settling 11/21/11 | | | 234,647,570 | | | | 26,498,879 | | | | 26,462,368 | | | | 36,511 | |
Royal Bank of Canada: | | | | | | | | | | | | | | | | |
Great British Pound settling 11/09/11 | | | 18,270 | | | | 28,207,629 | | | | 29,373,487 | | | | (1,165,858 | ) |
Royal Bank of Scotland: | | | | | | | | | | | | | | | | |
Canadian Dollar settling 11/30/11 | | | 8,719 | | | | 8,620,175 | | | | 8,742,125 | | | | (121,950 | ) |
Euro settling 11/17/11 | | | 157,109 | | | | 215,736,811 | | | | 217,356,279 | | | | (1,619,468 | ) |
Hungarian Forint settling 11/21/11 | | | 2,557,737 | | | | 11,673,833 | | | | 11,575,672 | | | | 98,161 | |
Standard Chartered Bank: | | | | | | | | | | | | | | | | |
Chinese Yuan Renminbi settling 1/13/12(1) | | | 70,944 | | | | 11,194,368 | | | | 11,154,941 | | | | 39,427 | |
Chinese Yuan Renminbi settling 1/13/12(1) | | | 49,685 | | | | 7,828,679 | | | | 7,812,184 | | | | 16,495 | |
Chinese Yuan Renminbi settling 1/13/12(1) | | | 97,605 | | | | 15,351,539 | | | | 15,346,953 | | | | 4,586 | |
South Korean Won settling 11/10/11 | | | 35,116,618 | | | | 29,447,897 | | | | 31,667,420 | | | | (2,219,523 | ) |
UBS Securities LLC: | | | | | | | | | | | | | | | | |
Great British Pound settling 11/09/11 | | | 959 | | | | 1,512,006 | | | | 1,541,773 | | | | (29,767 | ) |
| | | | | | | | | | | | | | | | |
| | | | | | | | | | | | | | | $ (6,932,046 | ) |
| | | | | | | | | | | | | | | | |
| (1) | | Contract represents a non-deliverable forward where payment is received from or paid to a counterparty based on the net realized gain/loss on settlement date. |
| | |
| 64 | | • ALLIANCEBERNSTEIN HIGH INCOME FUND |
Portfolio of Investments
CREDIT DEFAULT SWAPTIONS WRITTEN (see Note D)
| | | | | | | | | | | | | | | | | | | | | | | | | | | | |
| Description | | Counter-
party | | | Buy/Sell
Protection | | | Strike
Rate | | | Expiration
Date | | | Notional
Amount
(000) | | | Premiums
Received | | | Market
Value | |
Put-CDX NAHY-17 5 Year Index | |
| Morgan
Stanley |
| | | Sell | | | | 86 | % | | | 1/18/12 | | | $ | 29,000 | | | $ | 848,250 | | | $ | (417,600 | ) |
Put-CDX NAHY-17 5 Year Index | |
| Morgan
Stanley |
| | | Sell | | | | 86 | | | | 1/18/12 | | | | 33,900 | | | | 976,320 | | | | (488,160 | ) |
Put-CDX NAHY-17 5 Year Index | |
| Morgan
Stanley |
| | | Sell | | | | 84 | | | | 12/21/11 | | | | 29,000 | | | | 759,800 | | | | (192,850 | ) |
| | | | | | | | | | | | | | | | | | | | | | | | | | | | |
| | | | | | | | | | | | | | | | | | | | | | | | | | | $ (1,098,610 | ) |
| | | | | | | | | | | | | | | | | | | | | | | | | | | | |
INTEREST RATE SWAP TRANSACTIONS (see Note D)
| | | | | | | | | | | | | | | | | | | | |
| | | | | | | | | Rate Type | | | | |
Swap
Counterparty | | Notional
Amount
(000) | | | Termination
Date | | | Payments
made
by the
Portfolio | | | Payments
received
by the
Portfolio | | | Unrealized
Appreciation/
(Depreciation) | |
JPMorgan Chase Bank | | $ | 315,000 | | | | 9/13/16 | | | | 1.14 | % | | | 3 Month LIBOR | | | $ | 1,836,652 | |
JPMorgan Chase Bank | | | 232,470 | | | | 9/13/18 | | | | 3 Month LIBOR | | | | 1.64 | % | | | (2,609,711 | ) |
Morgan Stanley | | | 316,350 | | | | 8/15/16 | | | | 1.27 | % | | | 3 Month LIBOR | | | | (783,834 | ) |
Morgan Stanley | | | 234,100 | | | | 8/15/18 | | | | 3 Month LIBOR | | | | 1.88 | % | | | 1,833,028 | |
| | | | | | | | | | | | | | | | | | | | |
| | | | | | | | | | | | | | | | | | $ | 276,135 | |
| | | | | | | | | | | | | | | | | | | | |
| | | | |
| ALLIANCEBERNSTEIN HIGH INCOME FUND • | | | 65 | |
Portfolio of Investments
CREDIT DEFAULT SWAP CONTRACTS ON CORPORATE, SOVEREIGN ISSUES AND INDICES (see Note D)
| | | | | | | | | | | | | | | | | | | | | | | | |
Swap
Counterparty &
Referenced
Obligation | | Fixed
Deal
(Pay)
Receive
Rate | | | Implied
Credit
Spread at
October 31,
2011 | | | Notional
Amount
(000) | | | Market
Value | | | Upfront
Premiums
(Paid)
Received | | | Unrealized
Appreciation/
(Depreciation) | �� |
Buy Contracts: | | | | | | | | | | | | | | | | | | | | | | | | |
Barclays Capital Inc.: | | | | | | | | | | | | | | | | | | | | | | | | |
Liz Claiborne, Inc.,
5% 7/8/13, 12/20/13* | | | (5.00 | )% | | | 4.21 | % | | $ | 1,090 | | | $ | (23,647 | ) | | $ | (21,800 | ) | | $ | (45,447 | ) |
The McClatchy Company,
5.75% 9/1/17, 12/20/13* | | | (5.00 | ) | | | 10.39 | | | | 1,090 | | | | 99,122 | | | | (40,875 | ) | | | 58,247 | |
Citibank: | | | | | | | | | | | | | | | | | | | | | | | | |
Venezuela Government International Bond,
9.25% 9/15/27, 3/20/16* | | | (5.00 | ) | | | 9.54 | | | | 24,500 | | | | 3,353,182 | | | | (5,260,150 | ) | | | (1,906,968 | ) |
Goldman Sachs: | | | | | | | | | | | | | | | | | | | | | | | | |
CDX NAHY-11
5 Yr Index,
12/20/13* | | | — | | | | 102.38 | | | | 11,363 | | | | 7,735,235 | | | | (6,341,870 | ) | | | 1,393,365 | |
JPMorgan Chase Bank, NA: | | | | | | | | | | | | | | | | | | | | | | | | |
Fiat SpA,
6.625% 2/15/13, 12/20/16* | | | (5.00 | ) | | | 8.64 | | | | 3,250 | | | | 405,693 | | | | (511,875 | ) | | | (106,182 | ) |
MBIA, Inc.,
6.625% 10/1/28, 12/20/13* | | | (5.00 | ) | | | 9.56 | | | | 2,180 | | | | 168,208 | | | | (228,900 | ) | | | (60,692 | ) |
Republic of Iceland
4.375% 3/10/14, 12/20/11* | | | (10.50 | ) | | | 2.24 | | | EUR | 2,750 | | | | (91,111 | ) | | | — | | | | (91,111 | ) |
| | | | | | |
Sale Contracts: | | | | | | | | | | | | | | | | | | | | | | | | |
Bank of America: | | | | | | | | | | | | | | | | | | | | | | | | |
Boyd Gaming Corp.,
6.75% 4/15/14, 3/20/16* | | | 5.00 | | | | 9.31 | | | $ | 4,500 | | | | (587,365 | ) | | | 303,750 | | | | (283,615 | ) |
Barclays Capital Inc.: | | | | | | | | | | | | | | | | | | | | | | | | |
Alcatel-Lucent USA Inc.,
6.5% 1/15/28, 6/20/16* | | | 5.00 | | | | 6.66 | | | | 5,000 | | | | (269,779 | ) | | | (277,983 | ) | | | (547,762 | ) |
Amkor Technology, Inc.,
9.25% 6/1/16, 6/20/16* | | | 5.00 | | | | 5.85 | | | | 4,550 | | | | (115,618 | ) | | | (172,964 | ) | | | (288,582 | ) |
| | |
| 66 | | • ALLIANCEBERNSTEIN HIGH INCOME FUND |
Portfolio of Investments
| | | | | | | | | | | | | | | | | | | | | | | | |
Swap
Counterparty &
Referenced
Obligation | | Fixed
Deal
(Pay)
Receive
Rate | | | Implied
Credit
Spread at
October 31,
2011 | | | Notional
Amount
(000) | | | Market
Value | | | Upfront
Premiums
(Paid)
Received | | | Unrealized
Appreciation/
(Depreciation) | |
Cablevision Systems Corp.,
8% 4/15/12, 3/20/16* | | | 5.00 | % | | | 4.58 | % | | $ | 3,000 | | | $ | 64,495 | | | $ | (297,151 | ) | | $ | (232,656 | ) |
CDX NAIG-15
5 Yr Index,
12/20/15* | | | 1.00 | | | | 5.76 | | | | 3,000 | | | | (564,474 | ) | | | 367,450 | | | | (197,024 | ) |
Community Health Systems, Inc.,
8.875% 7/15/15, 6/20/16* | | | 5.00 | | | | 7.41 | | | | 4,650 | | | | (365,521 | ) | | | 151,125 | | | | (214,396 | ) |
Freescale Semiconductor, Inc.,
8.875% 12/15/14, 6/20/16* | | | 5.00 | | | | 8.30 | | | | 5,000 | | | | (531,589 | ) | | | 137,509 | | | | (394,080 | ) |
Levi Strauss & Co.,
8.875% 4/1/16, 3/20/16* | | | 5.00 | | | | 5.88 | | | | 1,500 | | | | (38,066 | ) | | | (52,837 | ) | | | (90,903 | ) |
NXP BV/NXP Funding LLC,
8.625% 10/15/15, 3/20/16* | | | 5.00 | | | | 7.44 | | | | 3,010 | | | | (229,659 | ) | | | (178,018 | ) | | | (407,677 | ) |
Rite Aid Corporation,
7.7% 2/15/27, 3/20/12* | | | 5.00 | | | | 4.79 | | | | 6,350 | | | | 42,973 | | | | (82,488 | ) | | | (39,515 | ) |
Citibank: | | | | | | | | | | | | | | | | | | | | | | | | |
CDX NAHY-17
5 Yr Index,
12/20/16* | | | 5.00 | | | | 6.57 | | | | 130,000 | | | | (7,204,167 | ) | | | 15,437,500 | | | | 8,233,333 | |
Ford Motor Co.,
6.5% 8/1/18, 6/20/16* | | | 5.00 | | | | 3.66 | | | | 6,200 | | | | 369,671 | | | | (593,109 | ) | | | (223,438 | ) |
Goodyear Tire & Rubber Co.,
7% 3/15/28, 3/20/16* | | | 5.00 | | | | 5.55 | | | | 2,000 | | | | (28,007 | ) | | | (49,310 | ) | | | (77,317 | ) |
Credit Suisse First Boston: | | | | | | | | | | | | | | | | | | | | | | | | |
CDX NAHY
Series 15
5 Yr Index,
12/20/15* | | | 5.00 | | | | 10.08 | | | | 13,925 | | | | (2,243,569 | ) | | | 1,448,200 | | | | (795,369 | ) |
CDX NAHY
Series 15
5 Yr Index,
12/20/15* | | | 5.00 | | | | 10.08 | | | | 15,675 | | | | (2,523,349 | ) | | | 1,618,444 | | | | (904,905 | ) |
MGM Resorts International,
5.875% 2/27/14, 3/20/16* | | | 5.00 | | | | 7.13 | | | | 3,000 | | | | (200,033 | ) | | | 97,500 | | | | (102,533 | ) |
| | | | |
| ALLIANCEBERNSTEIN HIGH INCOME FUND • | | | 67 | |
Portfolio of Investments
| | | | | | | | | | | | | | | | | | | | | | | | |
Swap
Counterparty &
Referenced
Obligation | | Fixed
Deal
(Pay)
Receive
Rate | | | Implied
Credit
Spread at
October 31,
2011 | | | Notional
Amount
(000) | | | Market
Value | | | Upfront
Premiums
(Paid)
Received | | | Unrealized
Appreciation/
(Depreciation) | |
MGM Resorts International,
7.625% 1/15/17, 6/20/13* | | | 5.00 | % | | | 4.83 | % | | $ | 4,600 | | | $ | 39,585 | | | $ | (115,000 | ) | | $ | (75,415 | ) |
Wind Acquisition Finance S.A.,
11% 12/1/15, 6/20/16* | | | 5.00 | | | | 8.95 | | | | 7,500 | | | | (940,895 | ) | | | (354,015 | ) | | | (1,294,910 | ) |
Goldman Sachs: | | | | | | | | | | | | | | | | | | | | | | | | |
CDX NAHY-15 3 Yr Index,
12/20/13* | | | 5.00 | | | | 26.04 | | | | 32,500 | | | | (12,042,604 | ) | | | 6,375,230 | | | | (5,667,374 | ) |
CDX NAHY-17
5 Yr Index,
12/20/16* | | | 5.00 | | | | 6.57 | | | | 32,800 | | | | (1,817,667 | ) | | | 3,936,000 | | | | 2,118,333 | |
CDX NAIG-15
5 Yr Index,
12/20/15* | | | 1.00 | | | | 5.76 | | | | 5,600 | | | | (1,053,529 | ) | | | 745,500 | | | | (308,029 | ) |
Gazprom
8.625% 4/28/34, 11/20/11* | | | 9.25 | | | | 1.10 | | | | 8,400 | | | | 396,244 | | | | — | | | | 396,244 | |
Mediacom LLC,
9.125% 8/15/19, 3/20/16* | | | 5.00 | | | | 4.54 | | | | 6,000 | | | | 137,865 | | | | 255,000 | | | | 392,865 | |
Tenet Healthcare Corp.,
6.875% 11/15/31, 9/20/16* | | | 5.00 | | | | 6.43 | | | | 6,470 | | | | (310,066 | ) | | | 194,100 | | | | (115,966 | ) |
VTB Bank
4.25% 2/15/16, 11/20/11* | | | 11.50 | | | | 1.82 | | | | 4,400 | | | | 256,948 | | | | — | | | | 256,948 | |
JPMorgan Chase Bank, NA: | | | | | | | | | | | | | | | | | | | | | | | | |
CDX NAHY-17
5 Yr Index,
12/20/16* | | | 5.00 | | | | 6.57 | | | | 35,000 | | | | (1,742,708 | ) | | | 1,946,875 | | | | 204,167 | |
Morgan Stanley Capital Services Inc.: | | | | | | | | | | | | | | | | | | | | | | | | |
AK Steel Holding Corporation,
7.625% 5/15/20, 3/20/16* | | | 5.00 | | | | 8.24 | | | | 3,000 | | | | (301,406 | ) | | | (48,863 | ) | | | (350,269 | ) |
Boyd Gaming Corporation,
6.75% 4/15/14, 6/20/13* | | | 5.00 | | | | 6.47 | | | | 3,100 | | | | (50,464 | ) | | | (69,750 | ) | | | (120,214 | ) |
CDX NAHY-17
5 Yr Index,
12/20/16* | | | 5.00 | | | | 6.57 | | | | 33,400 | | | | (1,850,917 | ) | | | 3,966,250 | | | | 2,115,333 | |
| | |
| 68 | | • ALLIANCEBERNSTEIN HIGH INCOME FUND |
Portfolio of Investments
| | | | | | | | | | | | | | | | | | | | | | | | |
Swap
Counterparty &
Referenced
Obligation | | Fixed
Deal
(Pay)
Receive
Rate | | | Implied
Credit
Spread at
October 31,
2011 | | | Notional
Amount
(000) | | | Market
Value | | | Upfront
Premiums
(Paid)
Received | | | Unrealized
Appreciation/
(Depreciation) | |
RSHB,
7.175% 5/16/13, 11/20/13* | | | 9.75 | % | | | 1.76 | % | | $ | 5,400 | | | $ | 1,110,216 | | | $ | — | | | $ | 1,110,216 | |
| | | | | | | | | | | | | | | | | | | | | | | | |
| | | | | | | | | | | | | | | | | | | | | | $ | 1,336,702 | |
| | | | | | | | | | | | | | | | | | | | | | | | |
REVERSE REPURCHASE AGREEMENTS (see Note D)
| | | | | | | | | | | | | | | | | | | | |
| Broker | | Principal
Amount
(000’s) | | | Currency | | | Interest Rate | | | Maturity | | | U.S. $
Value at
October 31,
2011 | |
Barclays Capital Inc. | | | 2,147 | | | | EUR | | | | (1.00 | )%* | | | 6/30/12 | | | $ | 2,970,136 | |
Barclays Capital Inc. | | | 1,691 | | | | EUR | | | | (0.63 | )%* | | | 6/30/12 | | | | 2,338,901 | |
Barclays Capital Inc. | | | 3,350 | | | | EUR | | | | (0.25 | )%* | | | 6/30/12 | | | | 4,635,234 | |
Barclays Capital Inc.† | | | 1,656 | | | | USD | | | | (2.50 | )%* | | | — | | | | 1,655,535 | |
Barclays Capital Inc.† | | | 1,560 | | | | USD | | | | (2.25 | )%* | | | — | | | | 1,558,028 | |
Barclays Capital Inc.† | | | 1,161 | | | | USD | | | | (2.00 | )%* | | | — | | | | 1,159,775 | |
Barclays Capital Inc.† | | | 3,303 | | | | USD | | | | (1.50 | )%* | | | — | | | | 3,302,804 | |
Barclays Capital Inc.† | | | 3,598 | | | | USD | | | | (1.13 | )%* | | | — | | | | 3,596,851 | |
Barclays Capital Inc.† | | | 3,603 | | | | USD | | | | (1.00 | )%* | | | — | | | | 3,602,225 | |
Barclays Capital Inc.† | | | 1,715 | | | | USD | | | | (1.00 | )%* | | | — | | | | 1,714,519 | |
Barclays Capital Inc.† | | | 965 | | | | USD | | | | (1.00 | )%* | | | — | | | | 963,311 | |
Barclays Capital Inc.† | | | 336 | | | | USD | | | | (1.00 | )%* | | | — | | | | 335,843 | |
Barclays Capital Inc.† | | | 4,399 | | | | USD | | | | (0.75 | )%* | | | — | | | | 4,397,259 | |
Barclays Capital Inc.† | | | 2,073 | | | | USD | | | | (0.75 | )%* | | | — | | | | 2,071,377 | |
Barclays Capital Inc.† | | | 758 | | | | USD | | | | (0.75 | )%* | | | — | | | | 757,197 | |
Barclays Capital Inc.† | | | 2,388 | | | | USD | | | | (0.63 | )%* | | | — | | | | 2,388,146 | |
Barclays Capital Inc.† | | | 6,240 | | | | USD | | | | (0.50 | )%* | | | — | | | | 6,239,480 | |
Barclays Capital Inc.† | | | 3,483 | | | | USD | | | | (0.38 | )%* | | | — | | | | 3,483,002 | |
Barclays Capital Inc.† | | | 2,626 | | | | USD | | | | (0.38 | )%* | | | — | | | | 2,625,613 | |
Barclays Capital Inc.† | | | 4,829 | | | | USD | | | | (0.25 | )%* | | | — | | | | 4,829,119 | |
Barclays Capital Inc.† | | | 4,775 | | | | USD | | | | (0.25 | )%* | | | — | | | | 4,774,967 | |
Barclays Capital Inc.† | | | 2,748 | | | | USD | | | | (0.25 | )%* | | | — | | | | 2,747,424 | |
Barclays Capital Inc.† | | | 935 | | | | EUR | | | | (0.25 | )%* | | | — | | | | 1,293,319 | |
Barclays Capital Inc.† | | | 1,218 | | | | USD | | | | (0.25 | )%* | | | — | | | | 1,217,476 | |
Barclays Capital Inc.† | | | 941 | | | | EUR | | | | (0.15 | )%* | | | — | | | | 1,301,142 | |
Barclays Capital Inc.† | | | 770 | | | | USD | | | | (0.13 | )%* | | | — | | | | 769,909 | |
Barclays Capital Inc.† | | | 4,703 | | | | USD | | | | 0.00 | % | | | — | | | | 4,703,212 | |
Barclays Capital Inc.† | | | 1,118 | | | | USD | | | | 0.00 | % | | | — | | | | 1,118,250 | |
ING Bank Amsterdam | | | 4,033 | | | | USD | | | | (0.38 | )%* | | | 6/30/12 | | | | 4,032,351 | |
ING Bank Amsterdam | | | 2,043 | | | | EUR | | | | (0.13 | )%* | | | 11/02/11 | | | | 2,826,129 | |
ING Bank Amsterdam | | | 13,069 | | | | USD | | | | 0.00 | % | | | 11/02/11 | | | | 13,068,750 | |
ING Bank Amsterdam | | | 3,740 | | | | USD | | | | 0.00 | % | | | 11/02/11 | | | | 3,740,000 | |
ING Bank Amsterdam† | | | 1,755 | | | | USD | | | | (4.50 | )%* | | | — | | | | 1,753,623 | |
ING Bank Amsterdam† | | | 790 | | | | USD | | | | (3.50 | )%* | | | — | | | | 789,616 | |
ING Bank Amsterdam† | | | 975 | | | | USD | | | | (3.00 | )%* | | | — | | | | 974,887 | |
ING Bank Amsterdam† | | | 160 | | | | USD | | | | (2.50 | )%* | | | — | | | | 159,321 | |
ING Bank Amsterdam† | | | 1,903 | | | | USD | | | | (1.50 | )%* | | | — | | | | 1,902,408 | |
ING Bank Amsterdam† | | | 868 | | | | USD | | | | (1.50 | )%* | | | — | | | | 868,152 | |
| | | | |
| ALLIANCEBERNSTEIN HIGH INCOME FUND • | | | 69 | |
Portfolio of Investments
| | | | | | | | | | | | | | | | | | | | |
| Broker | | Principal
Amount
(000’s) | | | Currency | | | Interest Rate | | | Maturity | | | U.S. $
Value at
October 31,
2011 | |
ING Bank Amsterdam† | | | 4,858 | | | | USD | | | | (1.00 | )%* | | | — | | | $ | 4,856,131 | |
ING Bank Amsterdam† | | | 523 | | | | USD | | | | (0.88 | )%* | | | — | | | | 522,348 | |
ING Bank Amsterdam† | | | 4,227 | | | | USD | | | | (0.75 | )%* | | | — | | | | 4,226,191 | |
ING Bank Amsterdam† | | | 2,087 | | | | USD | | | | (0.75 | )%* | | | — | | | | 2,087,356 | |
ING Bank Amsterdam† | | | 1,305 | | | | USD | | | | (0.75 | )%* | | | — | | | | 1,304,879 | |
ING Bank Amsterdam† | | | 1,268 | | | | USD | | | | (0.75 | )%* | | | — | | | | 1,267,315 | |
ING Bank Amsterdam† | | | 320 | | | | USD | | | | (0.75 | )%* | | | — | | | | 319,473 | |
ING Bank Amsterdam† | | | 3,105 | | | | USD | | | | (0.50 | )%* | | | — | | | | 3,104,741 | |
ING Bank Amsterdam† | | | 2,920 | | | | USD | | | | (0.50 | )%* | | | — | | | | 2,918,861 | |
ING Bank Amsterdam† | | | 1,504 | | | | USD | | | | (0.50 | )%* | | | — | | | | 1,503,798 | |
ING Bank Amsterdam† | | | 1,340 | | | | USD | | | | (0.50 | )%* | | | — | | | | 1,339,408 | |
ING Bank Amsterdam† | | | 391 | | | | USD | | | | (0.50 | )%* | | | — | | | | 390,647 | |
ING Bank Amsterdam† | | | 2,987 | | | | USD | | | | (0.38 | )%* | | | — | | | | 2,986,207 | |
ING Bank Amsterdam† | | | 452 | | | | USD | | | | (0.38 | )%* | | | — | | | | 451,403 | |
ING Bank Amsterdam† | | | 655 | | | | USD | | | | (0.25 | )%* | | | — | | | | 654,409 | |
ING Bank Amsterdam† | | | 600 | | | | USD | | | | (0.13 | )%* | | | — | | | | 599,960 | |
ING Bank Amsterdam† | | | 118 | | | | USD | | | | (0.10 | )%* | | | — | | | | 117,891 | |
ING Bank Amsterdam† | | | 2,539 | | | | USD | | | | 0.00 | % | | | — | | | | 2,538,625 | |
ING Bank Amsterdam† | | | 1,594 | | | | USD | | | | 0.00 | % | | | — | | | | 1,593,579 | |
JPMorgan Chase Bank | | | 955 | | | | USD | | | | (0.10 | )%* | | | 6/30/12 | | | | 954,989 | |
JPMorgan Chase Bank | | | 3,826 | | | | USD | | | | 0.00 | % | | | 11/02/11 | | | | 3,826,000 | |
JPMorgan Chase Bank | | | 4,254 | | | | USD | | | | 0.00 | % | | | 6/30/12 | | | | 4,254,000 | |
JPMorgan Chase Bank | | | 1,242 | | | | USD | | | | 0.00 | % | | | 6/30/12 | | | | 1,242,000 | |
JPMorgan Chase Bank† | | | 930 | | | | USD | | | | (0.15 | )%* | | | — | | | | 929,388 | |
JPMorgan Chase Bank† | | | 3,025 | | | | USD | | | | 0.00 | % | | | — | | | | 3,024,800 | |
JPMorgan Chase Bank† | | | 1,892 | | | | USD | | | | 0.00 | % | | | — | | | | 1,892,100 | |
JPMorgan Chase Bank† | | | 942 | | | | USD | | | | 0.00 | % | | | — | | | | 941,500 | |
JPMorgan Chase Bank† | | | 940 | | | | USD | | | | 0.00 | % | | | — | | | | 940,000 | |
Nomura International† | | | 585 | | | | USD | | | | 0.00 | % | | | — | | | | 585,000 | |
| | | | | | | | | | | | | | | | | | | | |
| | | | | | | | | | | | | | | | | | $ | 154,038,290 | |
| | | | | | | | | | | | | | | | | | | | |
UNFUNDED LOAN COMMITMENTS (see Note D.4)
As of October 31, 2011, the Fund had the following unfunded loan commitment of $8,000,000, which could be extended at the option of the borrower:
| | | | | | | | | | |
| Borrower | | Unfunded
Loan
Commitments | | | Cost | | | Value |
General Motors Holding, LLC Revolver
LIBOR +2.75%
10/27/15 | | $ | 8,000,000 | | | $ | — | | | $ (1,544,167) |
| † | | The reverse repurchase agreement matures on demand. The interest rate shown is a variable rate and was in effect on October 31, 2011 |
| * | | Interest payment due from counterparty. |
| (a) | | Position, or a portion thereof, has been segregated to collateralize reverse repurchase agreements. The market value of the collateral amounted to $147,180,886. |
| (b) | | Security is exempt from registration under Rule 144A of the Securities Act of 1933. These securities are considered liquid and may be resold in transactions exempt from registration, normally to qualified institutional buyers. At October 31, 2011, the aggregate market value of these securities amounted to $1,000,577,929 or 31.2% of net assets. |
| | |
| 70 | | • ALLIANCEBERNSTEIN HIGH INCOME FUND |
Portfolio of Investments
| (c) | | Floating Rate Security. Stated interest rate was in effect at October 31, 2011. |
| (d) | | Security is in default and is non-income producing. |
| (e) | | Pay-In-Kind Payments (PIK). |
| (h) | | Variable rate coupon, rate shown as of October 31, 2011. |
| (i) | | Coupon rate adjusts periodically based upon a predetermined schedule. Stated interest rate in effect at October 31, 2011. |
| (j) | | Security is exempt from registration under Rule 144A of the Securities Act of 1933. These securities, which represent 0.01% of net assets as of October 31, 2011, are considered illiquid and restricted. |
| | | | | | | | | | | | | | | | |
| Restricted Securities | | Acquisition
Date | | | Cost | | | Market
Value | | | Percentage of
Net Assets | |
American Media, Inc. | | | 3/04/09 | | | $ | 230,000 | | | $ | 0 | | | | 0.00 | % |
European Media Capital SA
10.00%, 2/01/15 | | | 8/18/10 | | | | 596,048 | | | | 445,434 | | | | 0.01 | % |
| (k) | | Position, or a portion thereof, has been segregated to collateralize credit default swaps. The aggregate market value of this security amounted to $7,144,665. |
| (l) | | This position or a portion of this position represents an unsettled loan purchase. At October 31, 2011, the market value and unrealized gain of these unsettled loan purchases amounted to $2,859,975 and $109,683, respectively. The coupon rate will be determined at the time of settlement and will be based upon the London-Interbank Offered Rate (“LIBOR”) plus a premium which was determined at the time of purchase. |
| (m) | | Non-income producing security. |
| (n) | | One contract relates to 100 shares. |
| (o) | | Restricted and illiquid security. |
| (p) | | Investment in affiliated money market mutual fund. The rate shown represents the 7-day yield as of period end. |
Currency Abbreviations:
AUD – Australian Dollar
BRL – Brazilian Real
CAD – Canadian Dollar
CLP – Chilean Peso
CNY – Chinese Yuan Renminbi
COP – Colombian Peso
DOP – Dominican Peso
EGP – Egyptian Pound
EUR – Euro
GBP – Great British Pound
HUF – Hungarian Forint
IDR – Indonesian Rupiah
PHP – Philippine Peso
RUB – Russian Ruble
TRY – Turkish Lira
UAH – Ukrainian Hryvnia
UYU – Uruguayan Peso
ZAR – South African Rand
|
| Glossary: |
| ABS – Asset-Backed Securities |
| ARMs – Adjustable Rate Mortgages |
| CMBS – Commercial Mortgage-Backed Securities |
| GO – General Obligation |
| MBIA – MBIA Insurance Corporation |
| OJSC – Open Joint Stock Company |
| REIT – Real Estate Investment Trust |
See notes to financial statements.
| | | | |
| ALLIANCEBERNSTEIN HIGH INCOME FUND • | | | 71 | |
Portfolio of Investments
STATEMENT OF ASSETS & LIABILITIES
October 31, 2011
| | | | |
| Assets | | | | |
Investments in securities, at value | | | | |
Unaffiliated issuers (cost $2,779,876,072) | | $ | 2,797,956,466 | |
Affiliated issuers (cost $494,457,559) | | | 494,457,559 | |
Cash | | | 4,865,097 | |
Cash held at broker | | | 809,740 | |
Cash collateral held at broker | | | 10,663,855 | (a) |
Foreign currencies, at value (cost $12,801,236) | | | 12,815,867 | |
Dividends and interest receivable | | | 57,956,585 | |
Receivable for capital stock sold | | | 39,627,427 | |
Unrealized appreciation of credit default swap contracts | | | 16,279,051 | |
Upfront premiums paid on credit default swap contracts | | | 14,696,958 | |
Receivable for investment securities sold | | | 12,125,923 | |
Unrealized appreciation of interest rate swap contracts | | | 3,669,680 | |
Unrealized appreciation of forward currency exchange contracts | | | 3,605,684 | |
| | | | |
Total assets | | | 3,469,529,892 | |
| | | | |
| Liabilities | | | | |
Payable for reverse repurchase agreements | | | 154,038,290 | |
Upfront premiums received on credit default swap contracts | | | 36,980,433 | |
Payable for investment securities purchased | | | 18,050,396 | |
Payable for capital stock redeemed | | | 16,856,721 | |
Unrealized depreciation of credit default swap contracts | | | 14,942,349 | |
Unrealized depreciation of forward currency exchange contracts | | | 10,537,730 | |
Dividends payable | | | 6,662,750 | |
Unrealized depreciation of interest rate swap contracts | | | 3,393,545 | |
Options written, at value (premiums received $2,584,370) | | | 1,098,610 | |
Advisory fee payable | | | 1,027,775 | |
Distribution fee payable | | | 981,853 | |
Unfunded loan commitment, at value | | | 1,544,167 | |
Transfer Agent fee payable | | | 109,114 | |
Administrative fee payable | | | 19,750 | |
Accrued expenses and other liabilities | | | 683,549 | |
| | | | |
Total liabilities | | | 266,927,032 | |
| | | | |
Net Assets | | $ | 3,202,602,860 | |
| | | | |
| Composition of Net Assets | | | | |
Capital stock, at par | | $ | 365,753 | |
Additional paid-in capital | | | 3,240,352,538 | |
Undistributed net investment income | | | 314,241 | |
Accumulated net realized loss on investment and foreign currency transactions | | | (51,855,319 | ) |
Net unrealized appreciation of investments and foreign currency denominated assets and liabilities | | | 13,425,647 | |
| | | | |
| | $ | 3,202,602,860 | |
| | | | |
| (a) | | Amount has been segregated to collateralize interest rate and credit default swap contracts outstanding at October 31, 2011. |
See notes to financial statements.
| | |
| 72 | | • ALLIANCEBERNSTEIN HIGH INCOME FUND |
Statement of Assets & Liabilities
Net Asset Value Per Share—21 billion shares of capital stock authorized, $.001 par value
| | | | | | | | | | | | |
| Class | | Net Assets | | | Shares
Outstanding | | | Net Asset
Value | |
| A | | $ | 1,686,591,163 | | | | 193,181,108 | | | $ | 8.73 | * |
| |
| B | | $ | 26,192,097 | | | | 2,976,021 | | | $ | 8.80 | |
| |
| C | | $ | 760,234,390 | | | | 86,123,310 | | | $ | 8.83 | |
| |
| Advisor | | $ | 662,874,022 | | | | 75,836,631 | | | $ | 8.74 | |
| |
| R | | $ | 20,934,678 | | | | 2,398,470 | | | $ | 8.73 | |
| |
| K | | $ | 4,159,353 | | | | 476,418 | | | $ | 8.73 | |
| |
| I | | $ | 41,617,157 | | | | 4,761,133 | | | $ | 8.74 | |
| |
| * | | The maximum offering price per share for Class A shares was $9.12 which reflects a sales charge of 4.25%. |
See notes to financial statements.
| | | | |
| ALLIANCEBERNSTEIN HIGH INCOME FUND • | | | 73 | |
Statement of Assets & Liabilities
STATEMENT OF OPERATIONS
Year Ended October 31, 2011
| | | | | | | | |
| Investment Income | | | | | | | | |
Interest (net of foreign taxes withheld of $190,832) | | $ | 231,647,351 | | | | | |
Dividends | | | | | | | | |
Unaffiliated issuers | | | 2,707,026 | | | | | |
Affiliated issuers | | | 276,540 | | | | | |
Other fee income | | | 394,894 | | | $ | 235,025,811 | |
| | | | | | | | |
| Expenses | | | | | | | | |
Advisory fee (see Note B) | | | 14,510,631 | | | | | |
Distribution fee—Class A | | | 4,813,708 | | | | | |
Distribution fee—Class B | | | 332,807 | | | | | |
Distribution fee—Class C | | | 6,836,958 | | | | | |
Distribution fee—Class R | | | 85,518 | | | | | |
Distribution fee—Class K | | | 4,926 | | | | | |
Transfer agency—Class A | | | 1,636,450 | | | | | |
Transfer agency—Class B | | | 45,709 | | | | | |
Transfer agency—Class C | | | 754,105 | | | | | |
Transfer agency—Advisor Class | | | 611,873 | | | | | |
Transfer agency—Class R | | | 37,866 | | | | | |
Transfer agency—Class K | | | 3,941 | | | | | |
Transfer agency—Class I | | | 16,821 | | | | | |
Registration fees | | | 501,112 | | | | | |
Printing | | | 453,472 | | | | | |
Custodian | | | 393,107 | | | | | |
Audit | | | 78,444 | | | | | |
Administrative | | | 77,856 | | | | | |
Directors’ fees | | | 61,035 | | | | | |
Legal | | | 55,676 | | | | | |
Miscellaneous | | | 86,827 | | | | | |
| | | | | | | | |
Total expenses before interest expense | | | 31,398,842 | | | | | |
Interest expense | | | 126,819 | | | | | |
| | | | | | | | |
Total expenses | | | 31,525,661 | | | | | |
Less: expenses waived and reimbursed by the Adviser (see Note B) | | | (176,086 | ) | | | | |
| | | | | | | | |
Net expenses | | | | | | | 31,349,575 | |
| | | | | | | | |
Net investment income | | | | | | | 203,676,236 | |
| | | | | | | | |
| Realized and Unrealized Gain (Loss) on Investment and Foreign Currency Transactions | | | | | | | | |
Net realized gain (loss) on: | | | | | | | | |
Investment transactions | | | | | | | 27,440,731 | |
Swap contracts | | | | | | | (5,907,164 | ) |
Options written | | | | | | | 533,650 | |
Foreign currency transactions | | | | | | | 9,098,801 | |
Net change in unrealized appreciation/depreciation of: | | | | | | | | |
Investments | | | | | | | (173,603,730 | ) |
Swap contracts | | | | | | | (2,424,128 | ) |
Options written | | | | | | | 1,485,760 | |
Unfunded loan commitments | | | | | | | (880,000 | ) |
Foreign currency denominated assets and liabilities | | | | | | | (5,771,340 | ) |
| | | | | | | | |
Net loss on investment and foreign currency transactions | | | | | | | (150,027,420 | ) |
| | | | | | | | |
Contributions from Adviser (see Note B) | | | | | | | 21,263 | |
| | | | | | | | |
Net Increase in Net Assets from Operations | | | | | | $ | 53,670,079 | |
| | | | | | | | |
See notes to financial statements.
| | |
| 74 | | • ALLIANCEBERNSTEIN HIGH INCOME FUND |
Statement of Operations
STATEMENT OF CHANGES IN NET ASSETS
| | | | | | | | |
| | | Year Ended
October 31,
2011 | | | Year Ended
October 31,
2010 | |
| Increase (Decrease) in Net Assets from Operations | | | | | | | | |
Net investment income | | $ | 203,676,236 | | | $ | 120,662,061 | |
Net realized gain on investment and foreign currency transactions | | | 31,166,018 | | | | 25,933,636 | |
Net change in unrealized appreciation/depreciation of investments and foreign currency denominated assets and liabilities | | | (181,193,438 | ) | | | 153,153,529 | |
Contributions from Adviser (see Note B) | | | 21,263 | | | | 235,116 | |
| | | | | | | | |
Net increase in net assets from operations | | | 53,670,079 | | | | 299,984,342 | |
| Dividends to Shareholders from | | | | | | | | |
Net investment income | | | | | | | | |
Class A | | | (120,951,242 | ) | | | (77,548,749 | ) |
Class B | | | (2,282,802 | ) | | | (3,373,970 | ) |
Class C | | | (46,047,353 | ) | | | (24,706,759 | ) |
Advisor Class | | | (45,329,154 | ) | | | (15,439,787 | ) |
Class R | | | (1,256,402 | ) | | | (601,223 | ) |
Class K | | | (150,566 | ) | | | (117,619 | ) |
Class I | | | (1,777,751 | ) | | | (519,234 | ) |
| Capital Stock Transactions | | | | | | | | |
Net increase | | | 1,040,749,498 | | | | 1,011,175,870 | |
| | | | | | | | |
Total increase | | | 876,624,307 | | | | 1,188,852,871 | |
| Net Assets | | | | | | | | |
Beginning of period | | | 2,325,978,553 | | | | 1,137,125,682 | |
| | | | | | | | |
End of period (including undistributed net investment income of $314,241 and distributions in excess of net investment income of $(5,219,385), respectively) | | $ | 3,202,602,860 | | | $ | 2,325,978,553 | |
| | | | | | | | |
See notes to financial statements.
| | | | |
| ALLIANCEBERNSTEIN HIGH INCOME FUND • | | | 75 | |
Statement of Changes in Net Assets
NOTES TO FINANCIAL STATEMENTS
October 31, 2011
NOTE A
Significant Accounting Policies
AllianceBernstein High Income Fund, Inc. (the “Fund”), formerly known as AllianceBernstein Emerging Market Debt Fund, Inc., was incorporated in the State of Maryland on December 2, 1993, and is registered under the Investment Company Act of 1940 as a non-diversified, open-end management investment company. The Fund offers Class A, Class B, Class C, Advisor Class, Class R, Class K and Class I shares. Class A shares are sold with a front-end sales charge of up to 4.25% for purchases not exceeding $1,000,000. With respect to purchases of $1,000,000 or more, Class A shares redeemed within one year of purchase may be subject to a contingent deferred sales charge of 1%. Class B shares are currently sold with a contingent deferred sales charge which declines from 3% to zero depending on the period of time the shares are held. Effective January 31, 2009, sales of Class B shares of the Fund to new investors were suspended. Class B shares will only be issued (i) upon the exchange of Class B shares from another AllianceBernstein Mutual Fund, (ii) for purposes of dividend reinvestment, (iii) through the Fund’s Automatic Investment Program (the “Program”) for accounts that established the Program prior to January 31, 2009, and (iv) for purchases of additional shares by Class B shareholders as of January 31, 2009. The ability to establish a new Program for accounts containing Class B shares was suspended as of January 31, 2009. Class B shares will automatically convert to Class A shares six years after the end of the calendar month of purchase. Class C shares are subject to a contingent deferred sales charge of 1% on redemptions made within the first year after purchase. Class R and Class K shares are sold without an initial or contingent deferred sales charge. Advisor Class and Class I shares are sold without an initial or contingent deferred sales charge and are not subject to ongoing distribution expenses. All seven classes of shares have identical voting, dividend, liquidation and other rights, except that the classes bear different distribution and transfer agency expenses. Each class has exclusive voting rights with respect to its distribution plan. The financial statements have been prepared in conformity with U.S. generally accepted accounting principles (“U.S. GAAP”), which require management to make certain estimates and assumptions that affect the reported amounts of assets and liabilities in the financial statements and amounts of income and expenses during the reporting period. Actual results could differ from those estimates. The following is a summary of significant accounting policies followed by the Fund.
1. Security Valuation
Portfolio securities are valued at their current market value determined on the basis of market quotations or, if market quotations are not readily available or are deemed unreliable, at “fair value” as determined in accordance with procedures established by and under the general supervision of the Fund’s Board of Directors.
| | |
| 76 | | • ALLIANCEBERNSTEIN HIGH INCOME FUND |
Notes to Financial Statements
In general, the market value of securities which are readily available and deemed reliable are determined as follows: Securities listed on a national securities exchange (other than securities listed on the NASDAQ Stock Market, Inc. (“NASDAQ”)) or on a foreign securities exchange are valued at the last sale price at the close of the exchange or foreign securities exchange. If there has been no sale on such day, the securities are valued at the mean of the closing bid and ask prices on such day. Securities listed on more than one exchange are valued by reference to the principal exchange on which the securities are traded; securities listed only on NASDAQ are valued in accordance with the NASDAQ Official Closing Price; listed or over the counter market (“OTC”) put or call options are valued at the mid level between the current bid and ask prices. If either a current bid or current ask price is unavailable, AllianceBernstein L.P. (the “Adviser”) will have discretion to determine the best valuation (e.g. last trade price); open futures contracts are valued using the closing settlement price or, in the absence of such a price, the most recent quoted bid price. If there are no quotations available for the day of valuation, the last available closing settlement price is used; U.S. government securities and other debt instruments having 60 days or less remaining until maturity are valued at amortized cost if their original maturity was 60 days or less; or by amortizing their fair value as of the 61st day prior to maturity if their original term to maturity exceeded 60 days; fixed-income securities, including mortgage backed and asset backed securities, may be valued on the basis of prices provided by a pricing service or at a price obtained from one or more of the major broker/dealers. In cases where broker/dealer quotes are obtained, the Adviser may establish procedures whereby changes in market yields or spreads are used to adjust, on a daily basis, a recently obtained quoted price on a security; and swaps and other derivatives are valued daily, primarily using independent pricing services, independent pricing models using market inputs, as well as third party broker-dealers or counterparties, which are approved by the Board of Directors. Investments in money market funds are valued at their net asset value each day.
Securities for which market quotations are not readily available (including restricted securities) or are deemed unreliable are valued at fair value. Factors considered in making this determination may include, but are not limited to, information obtained by contacting the issuer, analysts, analysis of the issuer’s financial statements or other available documents. In addition, the Fund may use fair value pricing for securities primarily traded in non-U.S. markets because most foreign markets close well before the Fund values its securities at 4:00 p.m., Eastern Time. The earlier close of these foreign markets gives rise to the possibility that significant events, including broad market moves, may have occurred in the interim and may materially affect the value of those securities.
2. Fair Value Measurements
In accordance with U.S. GAAP regarding fair value measurements, fair value is defined as the price that the Fund would receive to sell an asset or pay to transfer a liability in an orderly transaction between market participants at the
| | | | |
| ALLIANCEBERNSTEIN HIGH INCOME FUND • | | | 77 | |
Notes to Financial Statements
measurement date. The U.S. GAAP disclosure requirements establish a framework for measuring fair value, and a three-level hierarchy for fair value measurements based upon the transparency of inputs to the valuation of an asset or liability. Inputs may be observable or unobservable and refer broadly to the assumptions that market participants would use in pricing the asset or liability. Observable inputs reflect the assumptions market participants would use in pricing the asset or liability based on market data obtained from sources independent of the Fund. Unobservable inputs reflect the Fund’s own assumptions about the assumptions that market participants would use in pricing the asset or liability based on the best information available in the circumstances. Each investment is assigned a level based upon the observability of the inputs which are significant to the overall valuation. The three-tier hierarchy of inputs is summarized below.
| | • | | Level 1—quoted prices in active markets for identical investments |
| | • | | Level 2—other significant observable inputs (including quoted prices for similar investments, interest rates, prepayment speeds, credit risk, etc.) |
| | • | | Level 3—significant unobservable inputs (including the Fund’s own assumptions in determining the fair value of investments) |
The following table summarizes the valuation of the Fund’s investments by the above fair value hierarchy levels as of October 31, 2011:
| | | | | | | | | | | | | | | | |
Investments in
Securities | | Level 1 | | | Level 2 | | | Level 3 | | | Total | |
Corporates – Non-Investment Grades | | $ | – 0 | – | | $ | 1,510,390,303 | | | $ | 6,230,841 | | | $ | 1,516,621,144 | |
Corporates – Investment Grades | | | – 0 | – | | | 313,710,752 | | | | – 0 | – | | | 313,710,752 | |
Emerging Markets – Sovereigns | | | – 0 | – | | | 148,036,952 | | | | 2,091,576 | | | | 150,128,528 | |
Emerging Markets – Corporate Bonds | | | – 0 | – | | | 126,422,146 | | | | 445,434 | | | | 126,867,580 | |
Commercial Mortgage-Backed Securities | | | – 0 | – | | | 15,914,373 | | | | 93,080,657 | | | | 108,995,030 | |
Collateralized Mortgage Obligations | | | – 0 | – | | | – 0 | – | | | 104,878,738 | | | | 104,878,738 | |
Governments – Treasuries | | | – 0 | – | | | 93,548,788 | | | | – 0 | – | | | 93,548,788 | |
Quasi-Sovereigns | | | – 0 | – | | | 79,646,478 | | | | – 0 | – | | | 79,646,478 | |
Bank Loans | | | – 0 | – | | | – 0 | – | | | 75,587,653 | | | | 75,587,653 | |
Governments – Sovereign Bonds | | | – 0 | – | | | 66,333,771 | | | | 7,469,057 | | | | 73,802,828 | |
Emerging Markets – Treasuries | | | – 0 | – | | | 31,671,995 | | | | 21,110,383 | | | | 52,782,378 | |
Preferred Stocks | | | 26,659,086 | | | | 8,156,234 | | | | – 0 | – | | | 34,815,320 | |
Asset-Backed Securities | | | – 0 | – | | | – 0 | – | | | 23,646,158 | | | | 23,646,158 | |
Local Governments – Municipal Bonds | | | – 0 | – | | | 15,136,768 | | | | – 0 | – | | | 15,136,768 | |
Supranationals | | | – 0 | – | | | 1,852,400 | | | | 8,289,650 | | | | 10,142,050 | |
| | |
| 78 | | • ALLIANCEBERNSTEIN HIGH INCOME FUND |
Notes to Financial Statements
| | | | | | | | | | | | | | | | |
Investments in
Securities | | Level 1 | | | Level 2 | | | Level 3 | | | Total | |
Local Governments – Regional Bonds | | $ | – 0 | – | | $ | 8,668,369 | | | $ | – 0 | – | | $ | 8,668,369 | |
Inflation-Linked Securities | | | – 0 | – | | | 2,719,744 | | | | – 0 | – | | | 2,719,744 | |
Governments – Sovereign Agencies | | | – 0 | – | | | 2,430,826 | | | | – 0 | – | | | 2,430,826 | |
Options Purchased-Puts | | | 1,281,641 | | | | – 0 | – | | | 645,553 | | | | 1,927,194 | |
Common Stocks | | | 20,540 | | | | – 0 | – | | | 1,310,272 | | | | 1,330,812 | |
Warrants | | | – 0 | – | | | – 0 | – | | | 569,328 | | | | 569,328 | |
Short-Term Investments | | | 494,457,559 | | | | – 0 | – | | | – 0 | – | | | 494,457,559 | |
| | | | | | | | | | | | | | | | |
Total Investments in Securities | | | 522,418,826 | | | | 2,424,639,899 | | | | 345,355,300 | | | | 3,292,414,025 | |
Other Financial Instruments*: | | | | | | | | | | | | | | | | |
Assets | | | | | | | | | | | | | | | | |
Credit Default Swaps | | | – 0 | – | | | 16,279,051 | | | | – 0 | – | | | 16,279,051 | |
Interest Rate Swaps | | | – 0 | – | | | 3,669,680 | | | | – 0 | – | | | 3,669,680 | |
Forward Currency Exchange Contracts | | | – 0 | – | | | 3,605,684 | | | | – 0 | – | | | 3,605,684 | |
Liabilities | | | | | | | | | | | | | | | | |
Credit Default Swaps | | | – 0 | – | | | (14,942,349 | ) | | | – 0 | – | | | (14,942,349 | ) |
Interest Rate Swaps | | | – 0 | – | | | (3,393,545 | ) | | | – 0 | – | | | (3,393,545 | ) |
Forward Currency Exchange Contracts | | | – 0 | – | | | (10,537,730 | ) | | | – 0 | – | | | (10,537,730 | ) |
Options Written | | | – 0 | – | | | – 0 | – | | | (1,098,610 | ) | | | (1,098,610 | ) |
Unfunded Loan Commitment | | | – 0 | – | | | – 0 | – | | | (1,544,167 | ) | | | (1,544,167 | ) |
| | | | | | | | | | | | | | | | |
Total | | $ | 522,418,826 | | | $ | 2,419,320,690 | | | $ | 342,712,523 | | | $ | 3,284,452,039 | |
| | | | | | | | | | | | | | | | |
| * | | Other financial instruments are derivative instruments, such as futures, forwards, swap contracts and unfunded loan commitments which are valued at the unrealized appreciation/depreciation on the instrument. Other financial instruments may also include options written which are valued at market value. |
| | | | |
| ALLIANCEBERNSTEIN HIGH INCOME FUND • | | | 79 | |
Notes to Financial Statements
Following is a reconciliation of investments in which significant unobservable inputs (Level 3) were used in determining fair value. The transfers between levels of the fair value hierarchy assumes the financial instrument was transferred at the beginning of the reporting period.
| | | | | | | | | | | | | | | | |
| | | Corporates -
Non
Investment
Grades | | | Corporates -
Investment
Grades | | | Emerging
Markets -
Sovereigns | | | Emerging
Markets -
Corporate
Bonds | |
Balance as of 10/31/10 | | $ | 33,708,344 | | | $ | 4,535,572 | | | $ | 11,818,976 | | | $ | 1,443,000 | |
Accrued discounts/(premiums) | | | 32,732 | | | | – 0 | – | | | 220,397 | | | | (291,464 | ) |
Realized gain (loss) | | | (961,277 | ) | | | – 0 | – | | | 781,106 | | | | – 0 | – |
Change in unrealized appreciation/ depreciation | | | (885,160 | ) | | | – 0 | – | | | (1,484,737 | ) | | | 382,698 | |
Purchases | | | 3,953,402 | | | | – 0 | – | | | – 0 | – | | | – 0 | – |
Sales | | | (11,963,338 | ) | | | – 0 | – | | | (9,244,166 | ) | | | – 0 | – |
Reclassification | | | (526,835 | ) | | | – 0 | – | | | – 0 | – | | | 526,835 | |
Transfers into level 3 | | | 2,423,828 | | | | – 0 | – | | | – 0 | – | | | – 0 | – |
Transfers out of level 3 | | | (19,550,855 | ) | | | (4,535,572 | ) | | | – 0 | – | | | (1,615,635 | ) |
| | | | | | | | | | | | | | | | |
Balance as of 10/31/11 | | $ | 6,230,841 | | | $ | – 0 | – | | $ | 2,091,576 | | | $ | 445,434 | |
| | | | | | | | | | | | | | | | |
Net change in unrealized
appreciation/ depreciation from investments held as of 10/31/11 | | $ | (445,829 | ) | | $ | – 0 | – | | $ | (178,815 | ) | | $ | 382,698 | |
| | | | |
| | | Commerical
Mortgage -
Backed
Securities | | | Collateralized
Mortgage
Obligations | | | Bank Loans | | | Governments -
Sovereign
Bonds | |
Balance as of 10/31/10 | | $ | 69,761,354 | | | $ | 53,856,828 | | | $ | 42,646,923 | | | $ | – 0 | – |
Accrued discounts/ (premiums) | | | 552,311 | | | | 1,357,363 | | | | 712,881 | | | | 1,319 | |
Realized gain (loss) | | | 5,937,060 | | | | 3,625,721 | | | | 361,639 | | | | – 0 | – |
Change in unrealized
appreciation/ depreciation | | | (9,279,936 | ) | | | (11,895,914 | ) | | | (1,105,197 | ) | | | (190,889 | ) |
Purchases | | | 45,125,991 | | | | 71,006,203 | | | | 63,135,181 | | | | 7,658,627 | |
Sales | | | (24,082,835 | ) | | | (13,071,463 | ) | | | (30,163,774 | ) | | | – 0 | – |
Reclassification | | | – 0 | – | | | – 0 | – | | | – 0 | – | | | – 0 | – |
Transfers into level 3 | | | 5,066,712 | | | | – 0 | – | | | – 0 | – | | | – 0 | – |
Transfers out of level 3 | | | – 0 | – | | | – 0 | – | | | – 0 | – | | | – 0 | – |
| | | | | | | | | | | | | | | | |
Balance as of 10/31/11 | | $ | 93,080,657 | | | $ | 104,878,738 | | | $ | 75,587,653 | | | $ | 7,469,057 | |
| | | | | | | | | | | | | | | | |
Net change in unrealized
appreciation/ depreciation from investments held as of 10/31/11 | | $ | (4,554,414 | ) | | $ | (10,467,632 | ) | | $ | (1,173,809 | ) | | $ | (190,889 | ) |
| | |
| 80 | | • ALLIANCEBERNSTEIN HIGH INCOME FUND |
Notes to Financial Statements
| | | | | | | | | | | | | | | | |
| | | Emerging
Markets -
Treasuries | | | Asset-
Backed
Securities | | | Supranationals | | | Local
Governments -
Regional
Bonds | |
Balance as of 10/31/10 | | $ | – 0 | – | | $ | 31,179,732 | | | $ | 8,111,718 | | | $ | 5,208,252 | |
Accrued discounts/(premiums) | | | (28,294 | ) | | | 456,714 | | | | 428,707 | | | | – 0 | – |
Realized gain (loss) | | | – 0 | – | | | 793,996 | | | | – 0 | – | | | – 0 | – |
Change in unrealized
appreciation/ depreciation | | | 155,013 | | | | (3,542,524 | ) | | | (250,775 | ) | | | – 0 | – |
Purchases | | | 20,983,664 | | | | 2,902,382 | | | | – 0 | – | | | – 0 | – |
Sales | | | – 0 | – | | | (8,144,142 | ) | | | – 0 | – | | | – 0 | – |
Reclassification | | | – 0 | – | | | – 0 | – | | | – 0 | – | | | – 0 | – |
Transfers into level 3 | | | – 0 | – | | | – 0 | – | | | – 0 | – | | | – 0 | – |
Transfers out of level 3 | | | – 0 | – | | | – 0 | – | | | – 0 | – | | | (5,208,252 | ) |
| | | | | | | | | | | | | | | | |
Balance as of 10/31/11 | | $ | 21,110,383 | | | $ | 23,646,158 | | | $ | 8,289,650 | | | $ | – 0 | – |
| | | | | | | | | | | | | | | | |
Net change in unrealized appreciation/ depreciation from investments held as of 10/31/11 | | $ | 155,013 | | | $ | (3,108,206 | ) | | $ | (250,775 | ) | | $ | – 0 | – |
| | | | |
| | | Options
Purchased -
Puts | | | Common
Stocks | | | Warrants | | | Options
Written | |
Balance as of 10/31/10 | | $ | – 0 | – | | $ | 197,937 | | | $ | 30,110 | | | $ | – 0 | – |
Accrued discounts/(premiums) | | | – 0 | – | | | – 0 | – | | | – 0 | – | | | – 0 | – |
Realized gain (loss) | | | – 0 | – | | | 343,485 | | | | (1,748,805 | ) | | | – 0 | – |
Change in unrealized
appreciation/ depreciation | | | (586,992 | ) | | | (75,439 | ) | | | 2,359,416 | | | | 1,485,760 | |
Purchases | | | 1,232,545 | | | | 1,187,774 | | | | – 0 | – | | | (2,584,370 | ) |
Sales | | | – 0 | – | | | (343,485 | ) | | | (71,393 | ) | | | – 0 | – |
Reclassification | | | – 0 | – | | | – 0 | – | | | – 0 | – | | | – 0 | – |
Transfers into level 3 | | | – 0 | – | | | – 0 | – | | | – 0 | – | | | – 0 | – |
Transfers out of level 3 | | | – 0 | – | | | – 0 | – | | | – 0 | – | | | – 0 | – |
| | | | | | | | | | | | | | | | |
Balance as of 10/31/11 | | $ | 645,553 | | | $ | 1,310,272 | | | $ | 569,328 | | | $ | (1,098,610 | ) |
| | | | | | | | | | | | | | | | |
Net change in unrealized appreciation/ depreciation from investments held as of 10/31/11 | | $ | (586,992 | ) | | $ | (75,439 | ) | | $ | 569,328 | | | $ | 1,485,760 | |
| | | | |
| ALLIANCEBERNSTEIN HIGH INCOME FUND • | | | 81 | |
Notes to Financial Statements
| | | | | | | | |
| | | Unfunded Loan
Commitment | | | Total | |
Balance as of 10/31/10 | | $ | – 0 | – | | $ | 262,498,746 | |
Accrued discounts/(premiums) | | | – 0 | – | | | 3,442,666 | |
Realized gain (loss) | | | – 0 | – | | | 9,132,925 | |
Change in unrealized appreciation/depreciation | | | (880,000 | ) | | | (25,794,676 | ) |
Purchases | | | (664,167 | ) | | | 213,937,232 | |
Sales | | | – 0 | – | | | (97,084,596 | ) |
Reclassification | | | – 0 | – | | | – 0 | – |
Transfers into level 3 | | | – 0 | – | | | 7,490,540 | |
Transfers out of level 3 | | | – 0 | – | | | (30,910,314 | ) |
| | | | | | | | |
Balance as of 10/31/11 | | $ | (1,544,167 | ) | | $ | 342,712,523 | |
| | | | | | | | |
Net change in unrealized appreciation/depreciation from investments held as of 10/31/11 | | $ | (880,000 | ) | | $ | (19,320,001 | )** |
| ** | | The unrealized appreciation/depreciation is included in net change in unrealized appreciation/depreciation of investments and other financial instruments in the accompanying statement of operations. |
3. Currency Translation
Assets and liabilities denominated in foreign currencies and commitments under forward currency exchange contracts are translated into U.S. dollars at the mean of the quoted bid and ask prices of such currencies against the U.S. dollar. Purchases and sales of portfolio securities are translated into U.S. dollars at the rates of exchange prevailing when such securities were acquired or sold. Income and expenses are translated into U.S. dollars at rates of exchange prevailing when accrued.
Net realized gain or loss on foreign currency transactions represents foreign exchange gains and losses from sales and maturities of foreign fixed income investments, foreign currency exchange contracts, holding of foreign currencies, currency gains or losses realized between the trade and settlement dates on foreign investment transactions, and the difference between the amounts of dividends, interest and foreign withholding taxes recorded on the Fund’s books and the U.S. dollar equivalent amounts actually received or paid. Net unrealized currency gains and losses from valuing foreign currency denominated assets and liabilities at period end exchange rates are reflected as a component of net unrealized appreciation and depreciation of investments and foreign currency denominated assets and liabilities.
4. Taxes
It is the Fund’s policy to meet the requirements of the Internal Revenue Code applicable to regulated investment companies and to distribute all of its investment company taxable income and net realized gains, if any, to shareholders. Therefore, no provisions for federal income or excise taxes are required. The Fund may be subject to taxes imposed by countries in which it invests. Such taxes are generally based on income and/or capital gains earned or repatriated. Taxes are accrued and applied to net investment income, net realized gains and net unrealized appreciation/depreciation as such income and/or gains are earned.
| | |
| 82 | | • ALLIANCEBERNSTEIN HIGH INCOME FUND |
Notes to Financial Statements
In accordance with U.S. GAAP requirements regarding accounting for uncertainties in income taxes, management has analyzed the Fund’s tax positions taken or expected to be taken on federal and state income tax returns for all open tax years (the current and the prior three tax years) and has concluded that no provision for income tax is required in the Fund’s financial statements.
5. Investment Income and Investment Transactions
Dividend income is recorded on the ex-dividend date or as soon as the Fund is informed of the dividend. Interest income is accrued daily. Investment transactions are accounted for on the date securities are purchased or sold. Investment gains or losses are determined on the identified cost basis. The Fund amortizes premiums and accretes discounts as adjustments to interest income.
6. Class Allocations
All income earned and expenses incurred by the Fund are borne on a pro-rata basis by each settled class of shares, based on the proportionate interest in the Fund represented by the net assets of such class, except for class specific expenses which are allocated to the respective class. Realized and unrealized gains and losses are allocated among the various share classes based on their respective net assets.
7. Dividends and Distributions
Dividends and distributions to shareholders, if any, are recorded on the ex-dividend date. Income dividends and capital gains distributions are determined in accordance with federal tax regulations and may differ from those determined in accordance with U.S. GAAP. To the extent these differences are permanent, such amounts are reclassified within the capital accounts based on their federal tax basis treatment; temporary differences do not require such reclassification.
NOTE B
Advisory Fee and Other Transactions with Affiliates
Under the terms of the investment advisory agreement, the Fund pays the Adviser an advisory fee at an annual rate of .50% of the first $2.5 billion, .45% of the next $2.5 billion and .40% in excess of $5 billion, of the Fund’s average daily net assets. The fee is accrued daily and paid monthly.
The Adviser had agreed to waive its fees and bear certain expenses to the extent necessary to limit total operating expenses on an annual basis to .95%, 1.65%, 1.65%, .65%, 1.15%, .90% and .65% of the daily average net assets for Class A, Class B, Class C, Advisor Class, Class R, Class K and Class I shares, respectively (the “Expense Caps”). The Expense Caps will expire on January 31, 2012. For the year ended October 31, 2011, such reimbursement amounted to $176,086.
For the years ended October 31, 2011 and October 31, 2010, the Adviser reimbursed the Fund $21,263 and $235,116, respectively, for trading losses incurred due to trade entry errors.
| | | | |
| ALLIANCEBERNSTEIN HIGH INCOME FUND • | | | 83 | |
Notes to Financial Statements
Pursuant to the investment advisory agreement, the Fund may reimburse the Adviser for certain legal and accounting services provided to the Fund by the Adviser. For the year ended October 31, 2011, such fee amounted to $77,856.
The Fund compensates AllianceBernstein Investor Services, Inc. (“ABIS”), a wholly-owned subsidiary of the Adviser, under a Transfer Agency Agreement for providing personnel and facilities to perform transfer agency services for the Fund. ABIS may make payments to intermediaries that provide omnibus account services, sub-accounting services and/or networking services. The compensation retained by ABIS amounted to $1,046,139 for the year ended October 31, 2011.
For the year ended October 31, 2011, there was no reduction for the expenses of Class A, Class B, Class C and Advisor Class shares under an expense offset arrangement with ABIS.
AllianceBernstein Investments, Inc. (the “Distributor”), a wholly-owned subsidiary of the Adviser, serves as the distributor of the Fund’s shares. The Distributor has advised the Fund that it has retained front-end sales charges of $470,165 from the sale of Class A shares and received $18,671, $9,750 and $203,452 in contingent deferred sales charges imposed upon redemptions by shareholders of Class A, Class B and Class C shares, respectively, for the year ended October 31, 2011.
The Fund may invest in the AllianceBernstein Fixed-Income Shares, Inc.—Government STIF Portfolio, an open-end management investment company managed by the Adviser. The Government STIF Portfolio is offered as a cash management option to mutual funds and other institutional accounts of the Adviser, and is not available for direct purchase by members of the public. The Government STIF Portfolio pays no investment management fees but does bear its own expenses. A summary of the Fund’s transactions in shares of the Government STIF Portfolio for the year ended October 31, 2011 is as follows:
| | | | | | | | | | | | | | | | |
Market Value
October 31, 2010
(000) | | Purchases
at Cost
(000) | | | Sales
Proceeds
(000) | | | Market Value
October 31, 2011
(000) | | | Dividend
Income
(000) | |
| $ 129,603 | | $ | 1,260,467 | | | $ | 895,612 | | | $ | 494,458 | | | $ | 277 | |
NOTE C
Distribution Services Agreement
The Fund has adopted a Distribution Services Agreement (the “Agreement”) pursuant to Rule 12b-1 under the Investment Company Act of 1940. Under the Agreement the Fund pays distribution and servicing fees to the Distributor at an annual rate of up to .30% of the Fund’s average daily net assets attributable to Class A shares, 1% of the Fund’s average daily net assets attributable to both Class B and Class C shares, .50% of the Fund’s average daily net assets attributable to Class R shares and .25% of the Fund’s average daily net assets attributable
| | |
| 84 | | • ALLIANCEBERNSTEIN HIGH INCOME FUND |
Notes to Financial Statements
to Class K shares. There are no distribution and servicing fees on Advisor Class and Class I shares. The fees are accrued daily and paid monthly. The Agreement provides that the Distributor will use such payments in their entirety for distribution assistance and promotional activities. Since the commencement of the Fund’s operations, the Distributor has incurred expenses in excess of the distribution costs reimbursed by the Fund in the amounts of $6,083,056, $6,349,962, $81,824 and $17,516 for Class B, Class C, Class R, and Class K shares, respectively. While such costs may be recovered from the Fund in future periods so long as the Agreement is in effect, the rate of the distribution and servicing fees payable under the Agreement may not be increased without a shareholder vote. In accordance with the Agreement, there is no provision for recovery of unreimbursed distribution costs incurred by the Distributor beyond the current fiscal year for Class A shares. The Agreement also provides that the Adviser may use its own resources to finance the distribution of the Fund’s shares.
NOTE D
Investment Transactions
Purchases and sales of investment securities (excluding short-term investments) for the year ended October 31, 2011, were as follows:
| | | | | | | | |
| | | Purchases | | | Sales | |
Investment securities (excluding U.S. government securities) | | $ | 1,373,211,585 | | | $ | 793,223,513 | |
U.S. government securities | | | 7,021,602 | | | | – 0 | – |
The cost of investments for federal income tax purposes, gross unrealized appreciation and unrealized depreciation (excluding foreign currency exchange contracts, swap contracts and written option contracts) are as follows:
| | | | |
Cost | | $ | 3,274,580,024 | |
| | | | |
Gross unrealized appreciation | | $ | 132,941,871 | |
Gross unrealized depreciation | | | (115,107,870 | ) |
| | | | |
Net unrealized appreciation | | $ | 17,834,001 | |
| | | | |
1. Derivative Financial Instruments
The Fund may use derivatives to earn income and enhance returns, to hedge or adjust the risk profile of its portfolio, to replace more traditional direct investments, or to obtain exposure to otherwise inaccessible markets.
The principal types of derivatives utilized by the Fund, as well as the methods in which they may be used are:
| | • | | Forward Currency Exchange Contracts |
The Fund may enter into forward currency exchange contracts in order to hedge its exposure to changes in foreign currency exchange rates on its foreign portfolio holdings, to hedge certain firm purchase and sales
| | | | |
| ALLIANCEBERNSTEIN HIGH INCOME FUND • | | | 85 | |
Notes to Financial Statements
commitments denominated in foreign currencies and for non-hedging purposes as a means of making direct investments in foreign currencies, as described below under “Currency Transactions”.
A forward currency exchange contract is a commitment to purchase or sell a foreign currency at a future date at a negotiated forward rate. The gain or loss arising from the difference between the original contract and the closing of such contract would be included in net realized gain or loss on foreign currency transactions. Fluctuations in the value of open forward currency exchange contracts are recorded for financial reporting purposes as unrealized appreciation and/or depreciation by the Fund.
Risks may arise from the potential inability of a counterparty to meet the terms of a contract and from unanticipated movements in the value of a foreign currency relative to the U.S. dollar. The face or contract amount, in U.S. dollars reflects the total exposure the Fund has in that particular currency contract.
During the year ended October 31, 2011, the Fund held foreign-currency exchange contracts for hedging and non-hedging purposes.
For hedging and investment purposes, the Fund may purchase and write (sell) put and call options on U.S. and foreign securities, including government securities, and foreign currencies that are traded on U.S. and foreign securities exchanges and over-the-counter markets. The Fund may also use options transactions for non-hedging purposes as a means of making direct investments in foreign currencies, as described below under “Currency Transactions”.
The risk associated with purchasing an option is that the Fund pays a premium whether or not the option is exercised. Additionally, the Fund bears the risk of loss of the premium and change in market value should the counterparty not perform under the contract. Put and call options purchased are accounted for in the same manner as portfolio securities. The cost of securities acquired through the exercise of call options is increased by premiums paid. The proceeds from securities sold through the exercise of put options are decreased by the premiums paid.
When the Fund writes an option, the premium received by the Fund is recorded as a liability and is subsequently adjusted to the current market value of the option written. Premiums received from written options which expire unexercised are recorded by the Fund on the expiration date as realized gains from options written. The difference between the premium received and the amount paid on effecting a closing purchase transaction, including brokerage commissions, is also treated as a realized gain, or if the premium received is less than the amount paid for the closing purchase transaction, as a realized loss. If a call option is exercised, the premium
| | |
| 86 | | • ALLIANCEBERNSTEIN HIGH INCOME FUND |
Notes to Financial Statements
received is added to the proceeds from the sale of the underlying security or currency in determining whether the Fund has realized a gain or loss. If a put option is exercised, the premium received reduces the cost basis of the security or currency purchased by the Fund. In writing an option, the Fund bears the market risk of an unfavorable change in the price of the security or currency underlying the written option. Exercise of an option written by the Fund could result in the Fund selling or buying a security or currency at a price different from the current market value.
The Fund may also invest in options on swap agreements, also called “swaptions”. A swaption is an option that gives the buyer the right, but not the obligation, to enter into a swap on a future date in exchange for paying a market-based “premium”. A receiver swaption gives the owner the right to receive the total return of a specified asset, reference rate, or index. A payer swaption gives the owner the right to pay the total return on a specified asset, reference rate, or index. Swaptions also include options that allow an existing swap to be terminated or extended by one of the counterparties.
During the year ended October 31, 2011, the Fund held swaptions for hedging purposes. For the year ended October 31, 2011, the Fund had the following transactions:
| | | | | | | | |
| | | Number of
Contracts | | | Premiums
Received | |
Options written outstanding as of 10/31/10 | | | – 0 | – | | $ | – 0 | – |
Options written | | | 254,200,000 | | | | 3,118,020 | |
Options expired | | | (162,300,000 | ) | | | (533,650 | ) |
Options bought back | | | – 0 | – | | | – 0 | – |
Options exercised | | | – 0 | – | | | – 0 | – |
| | | | | | | | |
Options written outstanding as of 10/31/11 | | | 91,900,000 | | | $ | 2,584,370 | |
| | | | | | | | |
The Fund may enter into swaps to hedge its exposure to interest rates, credit risk, or currencies. The Fund may also enter into swaps for non-hedging purposes as a means of gaining market exposures including by making direct investments in foreign currencies, as described below under “Currency Transactions”. A swap is an agreement that obligates two parties to exchange a series of cash flows at specified intervals based upon or calculated by reference to changes in specified prices or rates for a specified amount of an underlying asset. The payment flows are usually netted against each other, with the difference being paid by one party to the other. In addition, collateral may be pledged or received by the Fund in accordance with the terms of the respective swap agreements to provide value and recourse to the Fund or its counterparties in the event of default, bankruptcy or insolvency by one of the parties to the swap agreement.
| | | | |
| ALLIANCEBERNSTEIN HIGH INCOME FUND • | | | 87 | |
Notes to Financial Statements
Risks may arise as a result of the failure of the counterparty to the swap contract to comply with the terms of the swap contract. The loss incurred by the failure of a counterparty is generally limited to the net interim payment to be received by the Fund, and/or the termination value at the end of the contract. Therefore, the Fund considers the creditworthiness of each counterparty to a swap contract in evaluating potential counterparty risk. This risk is mitigated by having a netting arrangement between the Fund and the counterparty and by the posting of collateral by the counterparty to the Fund to cover the Fund’s exposure to the counterparty. Additionally, risks may arise from unanticipated movements in interest rates or in the value of the underlying securities. The Fund accrues for the interim payments on swap contracts on a daily basis, with the net amount recorded within unrealized appreciation/depreciation of swap contracts on the statement of assets and liabilities, where applicable. Once the interim payments are settled in cash, the net amount is recorded as realized gain/(loss) on swaps on the statement of operations, in addition to any realized gain/(loss) recorded upon the termination of swap contracts.
Fluctuations in the value of swap contracts are recorded as a component of net change in unrealized appreciation/depreciation of swap contracts on the statement of operations.
Interest Rate Swaps:
The Fund is subject to interest rate risk exposure in the normal course of pursuing its investment objectives. Because the Fund holds fixed rate bonds, the value of these bonds may decrease if interest rates rise. To help hedge against this risk and to maintain its ability to generate income at prevailing market rates, the Fund may enter into interest rate swap contracts. Interest rate swaps are agreements between two parties to exchange cash flows based on a notional amount. The Fund may elect to pay a fixed rate and receive a floating rate, or, receive a fixed rate and pay a floating rate on a notional amount.
In addition, the Fund may also enter into interest rate swap transactions to preserve a return or spread on a particular investment or portion of its portfolio, or protecting against an increase in the price of securities the Fund anticipates purchasing at a later date. Interest rate swaps involve the exchange by a Fund with another party of their respective commitments to pay or receive interest (e.g., an exchange of floating rate payments for fixed rate payments) computed based on a contractually-based principal (or “notional”) amount. Interest rate swaps are entered into on a net basis (i.e., the two payment streams are netted out, with the Fund receiving or paying, as the case may be, only the net amount of the two payments).
During the year ended October 31, 2011, the Fund held interest rate swap contracts for hedging purposes.
| | |
| 88 | | • ALLIANCEBERNSTEIN HIGH INCOME FUND |
Notes to Financial Statements
Credit Default Swaps:
The Fund may enter into credit default swaps, including to manage its exposure to the market or certain sectors of the market, to reduce its risk exposure to defaults by corporate and sovereign issuers held by the Fund, or to create exposure to corporate or sovereign issuers to which it is not otherwise exposed. The Fund may purchase credit protection (“Buy Contract”) or provide credit protection (“Sale Contract”) on the referenced obligation of the credit default swap. During the term of the swap agreement, the Fund receives/(pays) fixed payments from/(to) the respective counterparty, calculated at the agreed upon interest rate applied to the notional amount. The accrual for these interim payments is recorded within unrealized appreciation/depreciation of swap contracts on the statement of assets and liabilities. Upfront premiums paid or received in connection with credit default swap contracts are recognized as cost or proceeds on the statement of assets and liabilities and are amortized on a straight line basis over the life of the contract. Amortized upfront premiums are included in net realized gain/(loss) from swaps on the statement of operations. If the Fund is a buyer/(seller) of protection and a credit event occurs, as defined under the terms of the swap agreement, the Fund will either (i) receive from the seller/(pay to the buyer) of protection an amount equal to the notional amount of the swap contract (the “Maximum Payout Amount”) and deliver/(take delivery of) the referenced obligation or (ii) receive/ (pay) a net settlement amount in the form of cash or securities equal to the notional amount of the swap less the recovery value of the referenced obligation.
During the year ended October 31, 2011, the Fund held credit default swaps contracts for hedging purposes.
Credit default swaps may involve greater risks than if the Fund had invested in the referenced obligation directly. Credit default swaps are subject to general market risk, liquidity risk, counterparty risk and credit risk. If the Fund is a buyer of protection and no credit event occurs, it will lose its investment. If the Fund is a seller of protection and a credit event occurs, the value of the referenced obligation received by the Fund coupled with the periodic payments previously received may be less than the Maximum Payout Amount it pays to the buyer, resulting in a net loss to the Fund.
Implied credit spreads over Treasuries of comparable maturity utilized in determining the market value of credit default swaps on issuers as of period end are disclosed in the portfolio of investments. The implied spreads serve as an indicator of the current status of the payment/performance risk and typically reflect the market’s assessment of the likelihood of default by the issuer on the referenced obligation. The implied credit spread of a particular reference entity reflects the cost of buying/selling protection and may include upfront payments required to be made to enter into the
| | | | |
| ALLIANCEBERNSTEIN HIGH INCOME FUND • | | | 89 | |
Notes to Financial Statements
agreement. Widening credit spreads typically represent a deterioration of the referenced entity’s credit soundness and greater likelihood of default or other credit event occurring as defined under the terms of the agreement. A credit spread identified as “Defaulted” indicates a credit event has occurred for the referenced entity or obligation.
At October 31, 2011 the Fund had Sale Contracts outstanding with Maximum Payout Amounts aggregating $399,530,000 with unrealized appreciation of $14,827,439 and unrealized depreciation of $12,731,949 and terms ranging from 1 month to 5 years, as reflected in the portfolio of investments.
In certain circumstances Maximum Payout Amounts may be partially offset by recovery values of the respective referenced obligations, upfront premium received upon entering into the agreement, or net amounts received from settlement of buy protection credit default swap agreements entered into by the Fund for the same reference obligation with the same counterparty. As of October 31, 2011, the Fund did not have Buy Contracts outstanding for the same referenced obligation with the same counterparty for its Sale Contracts outstanding.
Documentation governing the Fund’s swap transactions may contain provisions for early termination of a swap in the event the net assets of the Fund decline below specific levels set forth in the documentation (“net asset contingent features”). If these levels are triggered, the Fund’s counterparty has the right to terminate the swap and require the Fund to pay or receive a settlement amount in connection with the terminated swap transaction. As of October 31, 2011, the Fund had open swap contracts in net liability positions, with credit contingent features, in the amount of $8,217,033. The fair value of assets pledged as collateral by the Fund for such swap contracts was $15,205,899 at October 31, 2011. If a trigger event had occurred at October 31, 2011, for those swap contracts in a net liability position, no additional amounts would be required to be posted by the Fund since the aggregate fair value of the required collateral posted exceeded the settlement amounts of open derivative contracts.
At October 31, 2011 the Fund had entered into the following derivatives:
| | | | | | | | | | | | |
| | | Asset Derivatives | | | Liability Derivatives | |
Derivative
Type | | Statement of
Assets and
Liabilities
Location | | Fair Value | | | Statement of
Assets and
Liabilities
Location | | Fair Value | |
Interest rate contracts | | Unrealized appreciation of interest rate swap contracts | |
$ |
3,669,680 |
| | Unrealized depreciation of interest rate swap contracts | |
$ |
3,393,545 |
|
| | |
| 90 | | • ALLIANCEBERNSTEIN HIGH INCOME FUND |
Notes to Financial Statements
| | | | | | | | | | | | |
| | | Asset Derivatives | | | Liability Derivatives | |
Derivative
Type | | Statement of
Assets and
Liabilities
Location | | Fair Value | | | Statement of
Assets and
Liabilities
Location | | Fair Value | |
| | | | |
Foreign exchange contracts | | Unrealized appreciation of forward currency exchange contracts | | $ | 3,605,684 | | | Unrealized depreciation of forward currency exchange contracts | | $ | 10,537,730 | |
Credit contracts | | Unrealized appreciation of credit default swap contracts | |
|
16,279,051 |
| |
Unrealized depreciation of credit default swap contracts | |
|
14,942,349 |
|
| | | | |
| | | | | | | | Options written, at value | | | 1,098,610 | |
| | | | | | | | | | | | |
Total | | | | $ | 23,554,415 | | | | | $ | 29,972,234 | |
| | | | | | | | | | | | |
The effect of derivative instruments on the statement of operations for the year ended October 31, 2011:
| | | | | | | | | | |
Derivative Type | | Location of Gain
or (Loss) on
Derivatives | | Realized Gain
or (Loss) on
Derivatives | | | Change in
Unrealized
Appreciation or
(Depreciation) | |
Credit contracts | | Net realized gain/(loss) on swap contracts; Net change in unrealized appreciation/depreciation of swap contracts | | $ | (8,051,007 | ) | | $ | (2,700,263 | ) |
| | | |
| | Net realized gain/(loss) on options written; Net change in unrealized appreciation/ depreciation of options written | | | 533,650 | | | | 1,485,760 | |
| | | |
Interest rate contracts | | Net realized gain/(loss) on swap contracts; Net change in unrealized appreciation/depreciation of swap contracts | | | 2,143,843 | | | | 276,135 | |
| | | |
Foreign exchange contracts | | Net realized gain/(loss) on foreign currency transactions; Net change in unrealized appreciation/depreciation of foreign currency denominated assets and liabilities | | | 5,166,182 | | | | (5,946,185 | ) |
| | | | | | | | | | |
Total | | | | $ | (207,332 | ) | | $ | (6,884,553 | ) |
| | | | | | | | | | |
| | | | |
| ALLIANCEBERNSTEIN HIGH INCOME FUND • | | | 91 | |
Notes to Financial Statements
For the year ended October 31, 2011, the average monthly notional amount of credit default swap contracts was $260,898,835, and the average monthly principal amount of forward currency exchange contracts was $760,003,512. For eleven months of the year, the average monthly notional amount of interest rate swap contracts was $1,205,962,952. For three months of the year, the average monthly notional amount of credit default swaption contracts was $62,538,710.
2. Currency Transactions
The Fund may invest in non-U.S. Dollar securities on a currency hedged or unhedged basis. The Fund may seek investment opportunities by taking long or short positions in currencies through the use of currency-related derivatives, including forward currency exchange contracts, futures and options on futures, swaps, and other options. The Fund may enter into transactions for investment opportunities when it anticipates that a foreign currency will appreciate or depreciate in value but securities denominated in that currency are not held by the Fund and do not present attractive investment opportunities. Such transactions may also be used when the Adviser believes that it may be more efficient than a direct investment in a foreign currency-denominated security. The Fund may also conduct currency exchange contracts on a spot basis (i.e., for cash at the spot rate prevailing in the currency exchange market for buying or selling currencies).
3. Reverse Repurchase Agreements
Under a reverse repurchase agreement, the Fund sells securities and agrees to repurchase them at a mutually agreed upon date and price. At the time the Fund enters into a reverse repurchase agreement, it will establish a segregated account with the custodian containing liquid assets having a value at least equal to the repurchase price. For the year ended October 31, 2011, the average amount of reverse repurchase agreements outstanding was $127,949,828 and the daily weighted average interest rate was (0.30)%. During the period, the Fund received net interest payments from counterparties.
4. Loan Participations and Assignments
The Fund may invest in direct debt instruments which are interests in amounts owed to lenders or lending syndicates by corporate, governmental, or other borrowers, either in the form of participations at the time the loan is originated (“Participations”) or by buying an interest in the loan in the secondary market from a financial institution or institutional investor (“Assignments”). A loan is often administered by a bank or other financial institution (the “Lender”) that acts as agent for all holders. The agent administers the terms of the loan as specified in the loan agreement. When investing in Participations, the Fund generally has no right to enforce compliance with the terms of the loan agreement with the borrower. In addition, when investing in Participations, the Fund has the right to receive payments of principal, interest and any fees to which it is entitled only from the Lender and only upon receipt of payments by the Lender from the
| | |
| 92 | | • ALLIANCEBERNSTEIN HIGH INCOME FUND |
Notes to Financial Statements
borrower. As a result, the Fund may be subject to the credit risk of both the borrower and the Lender. When the Fund purchases Assignments from Lenders, it will typically acquire direct rights against the borrower on the loan. These loans may include participations in “bridge loans”, which are loans taken out by borrowers for a short period (typically less than six months) pending arrangement of more permanent financing through, for example, the issuance of bonds, frequently high-yield bonds issued for the purpose of acquisitions. The Fund may also participate in unfunded loan commitments, which are contractual obligations for investing in future Participations, and receive a commitment fee based on the amount of the commitment. Under these arrangements, the Fund may receive a fixed rate commitment fee and, if and to the extent the borrower borrows under the facility, the Fund may receive an additional funding fee.
Unfunded loan commitments and funded loans are marked to market daily.
As of October 31, 2011, the Fund had the following unfunded loan commitment which could be extended at the option of the borrower pursuant to the following loan agreement. In order to take on the loan denoted below, the Fund received payment of $664,167. The unrealized depreciation on such loan was $880,000.
| | | | | | | | |
Borrower | | Unfunded Loan
Commitment | | | Funded | |
General Motors Holdings, LLC, LIBOR + 2.75%, 10/27/15 | | $ | 8,000,000 | | | $ | – 0 | – |
In addition, the Fund had the following bridge loan commitment outstanding:
| | | | | | | | |
Loan | | Unfunded Loan
Participation
Commitment | | | Funded | |
SESI, LLC, Senior Unsecured Bridge Loan, 0.0%, 10/19/12 | | $ | 8,030,000 | | | $ | – 0 | – |
During the year ended October 31, 2011, the Fund received commitment fees and additional funding fees of $394,894 and $0, respectively, which are included in other fee income on the statement of operations.
NOTE E
Capital Stock
Each class consists of 3,000,000,000 authorized shares. Transactions in capital shares for each class were as follows:
| | | | | | | | | | | | | | | | | | | | |
| | | | | | | | | | | | | | | | | | | | |
| | | Shares | | | | | Amount | | | |
| | | Year Ended
October 31,
2011 | | | Year Ended
October 31,
2010 | | | | | Year Ended
October 31,
2011 | | | Year Ended
October 31,
2010 | | | |
| | | | | | |
| Class A | | | | | | | | | | | | | | | | | | | | |
Shares sold | | | 110,274,770 | | | | 80,356,153 | | | | | $ | 995,251,351 | | | $ | 701,043,060 | | | |
| | | |
| | | | |
| ALLIANCEBERNSTEIN HIGH INCOME FUND • | | | 93 | |
Notes to Financial Statements
| | | | | | | | | | | | | | | | | | | | |
| | | Shares | | | | | Amount | | | |
| | | Year Ended
October 31,
2011 | | | Year Ended
October 31,
2010 | | | | | Year Ended
October 31,
2011 | | | Year Ended
October 31,
2010 | | | |
| | | | | | |
Shares issued in reinvestment of dividends and distributions | | | 8,341,761 | | | | 5,567,603 | | | | | | 75,169,880 | | | | 48,216,232 | | | |
| | | |
Shares converted from Class B | | | 1,207,845 | | | | 1,520,117 | | | | | | 10,914,738 | | | | 13,150,234 | | | |
| | | |
Shares redeemed | | | (71,037,438 | ) | | | (37,725,184 | ) | | | | | (634,622,171 | ) | | | (323,863,566 | ) | | |
| | | |
Net increase | | | 48,786,938 | | | | 49,718,689 | | | | | $ | 446,713,798 | | | $ | 438,545,960 | | | |
| | | |
| | | | | | | | | | | | |
| Class B | | | | | | | | | | | | | | | | | | | | |
Shares sold | | | 447,887 | | | | 459,316 | | | | | $ | 4,096,419 | | | $ | 4,026,205 | | | |
| | | |
Shares issued in reinvestment of dividends and distributions | | | 160,624 | | | | 232,327 | | | | | | 1,461,154 | | | | 2,017,843 | | | |
| | | |
Shares converted to Class A | | | (1,198,311 | ) | | | (1,507,755 | ) | | | | | (10,914,738 | ) | | | (13,150,234 | ) | | |
| | | |
Shares redeemed | | | (762,244 | ) | | | (1,120,294 | ) | | | | | (6,933,251 | ) | | | (9,739,473 | ) | | |
| | | |
Net decrease | | | (1,352,044 | ) | | | (1,936,406 | ) | | | | $ | (12,290,416 | ) | | $ | (16,845,659 | ) | | |
| | | |
| | | | | | | | | | | | | | | | | | | | |
| Class C | | | | | | | | | | | | | | | | | | | | |
Shares sold | | | 38,365,859 | | | | 36,083,321 | | | | | $ | 351,820,282 | | | $ | 318,660,800 | | | |
| | | |
Shares issued in reinvestment of dividends and distributions | | | 2,966,508 | | | | 1,670,254 | | | | | | 26,982,653 | | | | 14,655,898 | | | |
| | | |
Shares redeemed | | | (13,477,217 | ) | | | (6,204,959 | ) | | | | | (121,679,272 | ) | | | (54,236,612 | ) | | |
| | | |
Net increase | | | 27,855,150 | | | | 31,548,616 | | | | | $ | 257,123,663 | | | $ | 279,080,086 | | | |
| | | |
| | | | | | | | | | | | | | | | | | | | |
| Advisor Class | | | | | | | | | | | | | | | | | | | | |
Shares sold | | | 63,618,057 | | | | 40,072,038 | | | | | $ | 577,243,744 | | | $ | 349,916,045 | | | |
| | | |
Shares issued in reinvestment of dividends and distributions | | | 3,138,397 | | | | 1,197,780 | | | | | | 28,268,926 | | | | 10,461,294 | | | |
| | | |
Shares redeemed | | | (32,807,439 | ) | | | (8,696,949 | ) | | | | | (293,170,279 | ) | | | (74,880,842 | ) | | |
| | | |
Net increase | | | 33,949,015 | | | | 32,572,869 | | | | | $ | 312,342,391 | | | $ | 285,496,497 | | | |
| | | |
| | | | | | | | | | | | | | | | | | | | |
| Class R | | | | | | | | | | | | | | | | | | | | |
Shares sold | | | 2,032,490 | | | | 1,172,235 | | | | | $ | 18,171,625 | | | $ | 10,263,021 | | | |
| | | |
Shares issued in reinvestment of dividends and distributions | | | 135,726 | | | | 67,342 | | | | | | 1,220,153 | | | | 586,282 | | | |
| | | |
Shares redeemed | | | (1,212,000 | ) | | | (253,022 | ) | | | | | (10,861,985 | ) | | | (2,212,270 | ) | | |
| | | |
Net increase | | | 956,216 | | | | 986,555 | | | | | $ | 8,529,793 | | | $ | 8,637,033 | | | |
| | | |
| | |
| 94 | | • ALLIANCEBERNSTEIN HIGH INCOME FUND |
Notes to Financial Statements
| | | | | | | | | | | | | | | | | | | | |
| | | Shares | | | | | Amount | | | |
| | | Year Ended
October 31,
2011 | | | Year Ended
October 31,
2010 | | | | | Year Ended
October 31,
2011 | | | Year Ended
October 31,
2010 | | | |
| | | | | | |
| Class K | | | | | | | | | | | | | | | | | | | | |
Shares sold | | | 361,852 | | | | 33,081 | | | | | $ | 3,197,193 | | | $ | 291,477 | | | |
| | | |
Shares issued in reinvestment of dividends and distributions | | | 16,140 | | | | 13,705 | | | | | | 143,985 | | | | 118,369 | | | |
| | | |
Shares redeemed | | | (78,313 | ) | | | (31,128 | ) | | | | | (698,394 | ) | | | (273,753 | ) | | |
| | | |
Net increase | | | 299,679 | | | | 15,658 | | | | | $ | 2,642,784 | | | $ | 136,093 | | | |
| | | |
| | | | | | | | | | | | |
| Class I | | | | | | | | | | | | | | | | | | | | |
Shares sold | | | 3,172,303 | | | | 1,794,820 | | | | | | $ 28,213,677 | | | | $ 15,724,460 | | | |
| | | |
Shares issued in reinvestment of dividends and distributions | | | 185,287 | | | | 53,785 | | | | | | 1,668,290 | | | | 475,051 | | | |
| | | |
Shares redeemed | | | (474,033 | ) | | | (8,182 | ) | | | | | (4,194,482 | ) | | | (73,651 | ) | | |
| | | |
Net increase | | | 2,883,557 | | | | 1,840,423 | | | | | | $ 25,687,485 | | | | $ 16,125,860 | | | |
| | | |
NOTE F
Risks Involved in Investing in the Fund
Interest Rate Risk and Credit Risk—Interest rate risk is the risk that changes in interest rates will affect the value of the Fund’s investments in fixed-income debt securities such as bonds or notes. Increases in interest rates may cause the value of the Fund’s investments to decline. Credit risk is the risk that the issuer or guarantor of a debt security, or the counterparty to a derivative contract, will be unable or unwilling to make timely principal and/or interest payments, or to otherwise honor its obligations. The degree of risk for a particular security may be reflected in its credit risk rating. Credit risk is greater for medium quality and lower-rated securities. Lower-rated debt securities and similar unrated securities (commonly known as “junk bonds”) have speculative elements or are predominantly speculative risks.
Foreign Securities Risk—Investing in securities of foreign companies or foreign governments involves special risks which include changes in foreign currency exchange rates and the possibility of future political and economic developments which could adversely affect the value of such securities. Moreover, securities of many foreign companies or foreign governments and their markets may be less liquid and their prices more volatile than those of comparable U.S. companies and the U.S. government. The Fund invests in the Sovereign Debt Obligations of countries that are considered emerging market countries at the time of purchase. Therefore, the Fund is susceptible to governmental factors and economic and debt restructuring developments adversely affecting the economies of these emerging market countries. In addition, these debt obligations may be less liquid and subject to greater volatility than debt obligations of more developed countries.
| | | | |
| ALLIANCEBERNSTEIN HIGH INCOME FUND • | | | 95 | |
Notes to Financial Statements
Currency Risk—This is the risk that changes in foreign currency exchange rates may negatively affect the value of the Fund’s investments or reduce the returns of the Fund. For example, the value of the Fund’s investments in foreign currency-denominated securities or currencies may decrease if the U.S. Dollar is strong (i.e., gaining value relative to other currencies) and other currencies are weak (i.e., losing value relative to the U.S. Dollar). Currency markets are generally not as regulated as securities markets. Independent of the Fund’s investments in securities denominated in foreign currencies, the Fund’s positions in various foreign currencies may cause the Fund to experience investment losses due to the changes in exchange rates and interest rates.
Derivatives Risk—The Fund may enter into derivative transactions such as forwards, options, futures and swaps. Derivatives may be illiquid, difficult to price, and leveraged so that small changes may produce disproportionate losses for the Fund, and subject to counterparty risk to a greater degree than more traditional investments. Derivatives may result in significant losses, including losses that are far greater than the value of the derivatives reflected on the statement of assets and liabilities.
Leverage Risk—When the Fund borrows money or otherwise leverages its investments, its performance may be volatile because leverage tends to exaggerate the effect of any increase or decrease in the value of the Fund’s investments. The Fund may create leverage through the use of reverse repurchase arrangements, forward currency exchange contracts, forward commitments, dollar rolls or futures contracts or by borrowing money. The use of derivative instruments by the Fund, such as forwards, futures, options and swaps, may also result in a form of leverage. Leverage may result in higher returns to the Fund than if the Fund were not leveraged, but may also adversely affect returns, particularly if the market is declining.
Indemnification Risk—In the ordinary course of business, the Fund enters into contracts that contain a variety of indemnifications. The Fund’s maximum exposure under these arrangements is unknown. However, the Fund has not had prior claims or losses pursuant to these indemnification provisions and expects the risk of loss thereunder to be remote. Therefore, the Fund has not accrued any liability in connection with these indemnification provisions.
NOTE G
Joint Credit Facility
A number of open-end mutual funds managed by the Adviser, including the Fund, participate in a $140 million revolving credit facility (the “Facility”) intended to provide short-term financing if necessary, subject to certain restrictions, in connection with abnormal redemption activity. Commitment fees related to the Facility are paid by the participating funds and are included in
| | |
| 96 | | • ALLIANCEBERNSTEIN HIGH INCOME FUND |
Notes to Financial Statements
miscellaneous expenses in the statement of operations. The Fund did not utilize the Facility during the year ended October 31, 2011.
NOTE H
Distributions to Shareholders
The tax character of distributions paid during the fiscal years ended October 31, 2011 and October 31, 2010 were as follows:
| | | | | | | | |
| | | 2011 | | | 2010 | |
Distributions paid from: | | | | | | | | |
Ordinary income | | $ | 217,795,270 | | | $ | 122,307,341 | |
| | | | | | | | |
Total taxable distributions | | | 217,795,270 | | | | 122,307,341 | |
| | | | | | | | |
Total distributions paid | | $ | 217,795,270 | | | $ | 122,307,341 | |
| | | | | | | | |
As of October 31, 2011, the components of accumulated earnings/(deficit) on a tax basis were as follows:
| | | | |
Undistributed ordinary income | | $ | 7,009,951 | |
Accumulated capital and other losses | | | (55,891,403 | )(a) |
Unrealized appreciation/(depreciation) | | | 18,959,789 | (b) |
| | | | |
Total accumulated earnings/(deficit) | | $ | (29,921,663 | )(c) |
| | | | |
| (a) | | On October 31, 2011, the Fund had a net capital loss carryforward for federal income tax purposes of $51,633,162, of which $794,931 expires in the year 2016, and $50,838,231 expires in the year 2017. To the extent future capital gains are offset by capital loss carryforwards, such gains will not be distributed. During the fiscal year, the Fund utilized capital loss carryforwards of $11,564,915. For the year ended October 31, 2011, the cumulative deferred loss on straddles was $4,258,241. |
| (b) | | The differences between book-basis and tax-basis unrealized appreciation/(depreciation) are attributable primarily to the tax deferral of losses on wash sales, the difference between book and tax amortization methods for premium, the tax treatment of swap income, and the realization for tax purposes of gains/losses on certain derivative instruments. |
| (c) | | The differences between book-basis and tax-basis components of accumulated earnings/(deficit) are attributable to dividends payable and tax treatment of interest on defaulted securities. |
During the current fiscal year, permanent differences primarily due to the tax treatment of swap income, paydown reclassification, foreign currency reclassification, premium adjustments, reclassifications on futures and swaps, the treatment of proceeds from the sale of defaulted securities, and a contribution from adviser resulted in a net decrease in distributions in excess of net investment income, a net increase in accumulated net realized loss on investment and foreign currency transactions, and a net decrease to additional paid-in capital. These reclassifications had no effect on net assets.
NOTE I
Recent Accounting Pronouncements
In April 2011, the Financial Accounting Standards Board (“FASB”) issued an Accounting Standard Update (“ASU”) related to the accounting for repurchase
| | | | |
| ALLIANCEBERNSTEIN HIGH INCOME FUND • | | | 97 | |
Notes to Financial Statements
agreements and similar agreements that both entitle and obligate a transferor to repurchase or redeem financial assets before their maturity. The ASU modifies the criteria for determining effective control of transferred assets and, as a result, certain agreements may now be accounted for as secured borrowings. The ASU is effective prospectively for new transfers and existing transactions that are modified in the first interim or annual period beginning on or after December 15, 2011. At this time, management is evaluating the implications of this ASU and its impact on the financial statements has not been determined.
In May 2011, the FASB issued an ASU to develop common requirements for measuring fair value and for disclosing information about fair value measurements in U.S. GAAP and IFRS. The amendments are intended to improve the comparability of fair value measurements presented and disclosed in the financial statements prepared in accordance with U.S. GAAP and IFRS. The ASU is effective during interim or annual periods beginning after December 15, 2011. At this time, management is evaluating the implication of this ASU and its impact on the financial statements has not been determined.
NOTE J
Subsequent Events
Management has evaluated subsequent events for possible recognition or disclosure in the financial statements through the date the financial statements are issued. Management has determined that there are no material events that would require disclosure in the Fund’s financial statements through this date.
| | |
| 98 | | • ALLIANCEBERNSTEIN HIGH INCOME FUND |
Notes to Financial Statements
FINANCIAL HIGHLIGHTS
Selected Data For A Share Of Capital Stock Outstanding Throughout Each Period
| | | | | | | | | | | | | | | | | | | | |
| | | Class A | |
| | | Year Ended October 31, | |
| | | 2011 | | | 2010 | | | 2009 | | | 2008 | | | 2007 | |
| | | | |
| | | | | | | | | | | | | | | | | | | | |
Net asset value, beginning of period | | | $ 9.19 | | | | $ 8.24 | | | | $ 5.85 | | | | $ 9.02 | | | | $ 8.97 | |
| | | | |
Income From Investment Operations | | | | | | | | | | | | | | | | | | | | |
Net investment income(a) | | | .64 | (b) | | | .69 | (b) | | | .67 | (b) | | | .61 | (b) | | | .56 | |
Net realized and unrealized gain (loss) on investment and foreign currency transactions | | | (.44 | ) | | | .96 | | | | 2.44 | | | | (2.87 | ) | | | .41 | |
Contributions from Adviser | | | .00 | (c) | | | .00 | (c) | | | – 0 | – | | | .00 | (c) | | | – 0 | – |
| | | | |
Net increase (decrease) in net asset value from operations | | | .20 | | | | 1.65 | | | | 3.11 | | | | (2.26 | ) | | | .97 | |
| | | | |
Less: Dividends and Distributions | | | | | | | | | | | | | | | | | | | | |
Dividends from net investment income | | | (.66 | ) | | | (.70 | ) | | | (.69 | ) | | | (.68 | ) | | | (.57 | ) |
Tax return of capital | | | – 0 | – | | | – 0 | – | | | (.01 | ) | | | – 0 | – | | | – 0 | – |
Distributions from net realized gain on investment and foreign currency transactions | | | – 0 | – | | | – 0 | – | | | (.02 | ) | | | (.23 | ) | | | (.35 | ) |
| | | | |
Total dividends and distributions | | | (.66 | ) | | | (.70 | ) | | | (.72 | ) | | | (.91 | ) | | | (.92 | ) |
| | | | |
Net asset value, end of period | | | $ 8.73 | | | | $ 9.19 | | | | $ 8.24 | | | | $ 5.85 | | | | $ 9.02 | |
| | | | |
Total Return | | | | | | | | | | | | | | | | | | | | |
Total investment return based on net asset value(d) | | | 2.48 | %* | | | 20.85 | %* | | | 57.11 | %* | | | (27.49 | )%* | | | 11.54 | % |
Ratios/Supplemental Data | | | | | | | | | | | | | | | | | | | | |
Net assets, end of period (000’s omitted) | | | $1,686,591 | | | | $1,326,974 | | | | $780,222 | | | | $450,517 | | | | $281,677 | |
Ratio to average net assets of: | | | | | | | | | | | | | | | | | | | | |
Expenses, net of waivers/reimbursements | | | .95 | % | | | .99 | %** | | | .99 | % | | | 1.03 | %** | | | 1.41 | %** |
Expenses, net of waivers/reimbursements excluding interest expense and TALF administration fee | | | .95 | % | | | .95 | %** | | | .95 | % | | | 1.03 | %** | | | 1.41 | %** |
Expenses, before waivers/reimbursements | | | .96 | % | | | 1.04 | %** | | | 1.13 | % | | | 1.13 | %** | | | 1.41 | %** |
Expenses, before waivers/reimbursements excluding interest expense and TALF administration fee | | | .96 | % | | | 1.00 | %** | | | 1.09 | % | | | 1.07 | %** | | | 1.14 | %** |
Net investment income | | | 7.05 | %(b) | | | 7.93 | %(b)** | | | 10.13 | %(b) | | | 7.65 | %(b)** | | | 6.24 | %** |
Portfolio turnover rate | | | 29 | % | | | 26 | % | | | 46 | % | | | 74 | % | | | 67 | % |
See footnote summary on page 106.
| | | | |
| ALLIANCEBERNSTEIN HIGH INCOME FUND • | | | 99 | |
Financial Highlights
Selected Data For A Share Of Capital Stock Outstanding Throughout Each Period
| | | | | | | | | | | | | | | | | | | | |
| | | Class B | |
| | | Year Ended October 31, | |
| | | 2011 | | | 2010 | | | 2009 | | | 2008 | | | 2007 | |
| | | | |
| | | | | | | | | | | | | | | | | | | | |
Net asset value, beginning of period | | | $ 9.26 | | | | $ 8.31 | | | | $ 5.90 | | | | $ 9.09 | | | | $ 9.05 | |
| | | | |
Income From Investment Operations | | | | | | | | | | | | | | | | | | | | |
Net investment income(a) | | | .57 | (b) | | | .63 | (b) | | | .62 | (b) | | | .55 | (b) | | | .49 | |
Net realized and unrealized gain (loss) on investment and foreign currency transactions | | | (.43 | ) | | | .96 | | | | 2.46 | | | | (2.89 | ) | | | .41 | |
Contributions from Adviser | | | .00 | (c) | | | .00 | (c) | | | – 0 | – | | | .00 | (c) | | | – 0 | – |
| | | | |
Net increase (decrease) in net asset value from operations | | | .14 | | | | 1.59 | | | | 3.08 | | | | (2.34 | ) | | | .90 | |
| | | | |
Less: Dividends and Distributions | | | | | | | | | | | | | | | | | | | | |
Dividends from net investment income | | | (.60 | ) | | | (.64 | ) | | | (.64 | ) | | | (.62 | ) | | | (.51 | ) |
Tax return of capital | | | – 0 | – | | | – 0 | – | | | (.01 | ) | | | – 0 | – | | | – 0 | – |
Distributions from net realized gain on investment and foreign currency transactions | | | – 0 | – | | | – 0 | – | | | (.02 | ) | | | (.23 | ) | | | (.35 | ) |
| | | | |
Total dividends and distributions | | | (.60 | ) | | | (.64 | ) | | | (.67 | ) | | | (.85 | ) | | | (.86 | ) |
| | | | |
Net asset value, end of period | | | $ 8.80 | | | | $ 9.26 | | | | $ 8.31 | | | | $ 5.90 | | | | $ 9.09 | |
| | | | |
Total Return | | | | | | | | | | | | | | | | | | | | |
Total investment return based on net asset value(d) | | | 1.75 | %* | | | 19.86 | %* | | | 55.89 | %* | | | (28.03 | )%* | | | 10.51 | % |
Ratios/Supplemental Data | | | | | | | | | | | | | | | | | | | | |
Net assets, end of period (000’s omitted) | | | $26,192 | | | | $40,092 | | | | $52,041 | | | | $54,724 | | | | $35,058 | |
Ratio to average net assets of: | | | | | | | | | | | | | | | | | | | | |
Expenses, net of waivers/reimbursements | | | 1.65 | % | | | 1.70 | %** | | | 1.68 | % | | | 1.74 | %** | | | 2.14 | %** |
Expenses, net of waivers/reimbursements excluding interest expense and TALF administration fee | | | 1.65 | % | | | 1.65 | %** | | | 1.65 | % | | | 1.74 | %** | | | 2.14 | %** |
Expenses, before waivers/reimbursements | | | 1.69 | % | | | 1.78 | %** | | | 1.88 | % | | | 1.86 | %** | | | 2.14 | %** |
Expenses, before waivers/reimbursements excluding interest expense and TALF administration fee | | | 1.69 | % | | | 1.73 | %** | | | 1.85 | % | | | 1.80 | %** | | | 1.87 | %** |
Net investment income | | | 6.28 | %(b) | | | 7.25 | %(b)** | | | 9.46 | %(b) | | | 6.83 | %(b)** | | | 5.45 | %** |
Portfolio turnover rate | | | 29 | % | | | 26 | % | | | 46 | % | | | 74 | % | | | 67 | % |
See footnote summary on page 106.
| | |
| 100 | | • ALLIANCEBERNSTEIN HIGH INCOME FUND |
Financial Highlights
Selected Data For A Share Of Capital Stock Outstanding Throughout Each Period
| | | | | | | | | | | | | | | | | | | | |
| | | Class C | |
| | | Year Ended October 31, | |
| | | 2011 | | | 2010 | | | 2009 | | | 2008 | | | 2007 | |
| | | | |
| | | | | | | | | | | | | | | | | | | | |
Net asset value, beginning of period | | | $ 9.29 | | | | $ 8.33 | | | | $ 5.92 | | | | $ 9.11 | | | | $ 9.07 | |
| | | | |
Income From Investment Operations | | | | | | | | | | | | | | | | | | | | |
Net investment income(a) | | | .57 | (b) | | | .62 | (b) | | | .62 | (b) | | | .55 | (b) | | | .49 | |
Net realized and unrealized gain (loss) on investment and foreign currency transactions | | | (.44 | ) | | | .97 | | | | 2.46 | | | | (2.89 | ) | | | .41 | |
Contributions from Adviser | | | .00 | (c) | | | .00 | (c) | | | – 0 | – | | | .00 | (c) | | | – 0 | – |
| | | | |
Net increase (decrease) in net asset value from operations | | | .13 | | | | 1.59 | | | | 3.08 | | | | (2.34 | ) | | | .90 | |
| | | | |
Less: Dividends and Distributions | | | | | | | | | | | | | | | | | | | | |
Dividends from net investment income | | | (.59 | ) | | | (.63 | ) | | | (.64 | ) | | | (.62 | ) | | | (.51 | ) |
Tax return of capital | | | – 0 | – | | | – 0 | – | | | (.01 | ) | | | – 0 | – | | | – 0 | – |
Distributions from net realized gain on investment and foreign currency transactions | | | – 0 | – | | | – 0 | – | | | (.02 | ) | | | (.23 | ) | | | (.35 | ) |
| | | | |
Total dividends and distributions | | | (.59 | ) | | | (.63 | ) | | | (.67 | ) | | | (.85 | ) | | | (.86 | ) |
| | | | |
Net asset value, end of period | | | $ 8.83 | | | | $ 9.29 | | | | $ 8.33 | | | | $ 5.92 | | | | $ 9.11 | |
| | | | |
Total Return | | | | | | | | | | | | | | | | | | | | |
Total investment return based on net asset value(d) | | | 1.73 | %* | | | 19.88 | %* | | | 55.68 | %* | | | (27.95 | )%* | | | 10.50 | % |
Ratios/Supplemental Data | | | | | | | | | | | | | | | | | | | | |
Net assets, end of period (000’s omitted) | | | $760,234 | | | | $541,386 | | | | $222,632 | | | | $112,508 | | | | $86,525 | |
Ratio to average net assets of: | | | | | | | | | | | | | | | | | | | | |
Expenses, net of waivers/reimbursements | | | 1.65 | % | | | 1.69 | %** | | | 1.69 | % | | | 1.75 | %** | | | 2.11 | %** |
Expenses, net of waivers/reimbursements excluding interest expense and TALF administration fee | | | 1.65 | % | | | 1.65 | %** | | | 1.65 | % | | | 1.75 | %** | | | 2.11 | %** |
Expenses, before waivers/reimbursements | | | 1.66 | % | | | 1.73 | %** | | | 1.83 | % | | | 1.84 | %** | | | 2.11 | %** |
Expenses, before waivers/reimbursements excluding interest expense and TALF administration fee | | | 1.66 | % | | | 1.69 | %** | | | 1.79 | % | | | 1.77 | %** | | | 1.85 | %** |
Net investment income | | | 6.25 | %(b) | | | 7.08 | %(b)** | | | 9.27 | %(b) | | | 6.82 | %(b)** | | | 5.47 | %** |
Portfolio turnover rate | | | 29 | % | | | 26 | % | | | 46 | % | | | 74 | % | | | 67 | % |
See footnote summary on page 106.
| | | | |
| ALLIANCEBERNSTEIN HIGH INCOME FUND • | | | 101 | |
Financial Highlights
Selected Data For A Share Of Capital Stock Outstanding Throughout Each Period
| | | | | | | | | | | | | | | | |
| | | Advisor Class | |
| | | Year Ended October 31, | | | January 28,
2008(e) to
October 31,
2008 | |
| | | 2011 | | | 2010 | | | 2009 | | |
| | | | |
| | | | | | | | | | | | | | | | |
Net asset value, beginning of period | | | $ 9.20 | | | | $ 8.25 | | | | $ 5.86 | | | | $ 8.52 | |
| | | | |
Income From Investment Operations | | | | | | | | | | | | | | | | |
Net investment income(a)(b) | | | .66 | | | | .71 | | | | .72 | | | | .52 | |
Net realized and unrealized gain (loss) on investment and foreign currency transactions | | | (.43 | ) | | | .97 | | | | 2.41 | | | | (2.69 | ) |
Contributions from Adviser | | | .00 | (c) | | | .00 | (c) | | | – 0 | – | | | .00 | (c) |
| | | | |
Net increase (decrease) in net asset value from operations | | | .23 | | | | 1.68 | | | | 3.13 | | | | (2.17 | ) |
| | | | |
Less: Dividends and Distributions | | | | | | | | | | | | | | | | |
Dividends from net investment income | | | (.69 | ) | | | (.73 | ) | | | (.71 | ) | | | (.49 | ) |
Tax return of capital | | | – 0 | – | | | – 0 | – | | | (.01 | ) | | | – 0 | – |
Distributions from net realized gain on investment and foreign currency transactions | | | – 0 | – | | | – 0 | – | | | (.02 | ) | | | – 0 | – |
| | | | |
Total dividends and distributions | | | (.69 | ) | | | (.73 | ) | | | (.74 | ) | | | (.49 | ) |
| | | | |
Net asset value, end of period | | | $ 8.74 | | | | $ 9.20 | | | | $ 8.25 | | | | $ 5.86 | |
| | | | |
Total Return | | | | | | | | | | | | | | | | |
Total investment return based on net asset value(d) | | | 2.79 | %* | | | 21.22 | %* | | | 57.57 | %* | | | (26.77 | )%* |
Ratios/Supplemental Data | | | | | | | | | | | | | | | | |
Net assets, end of period (000’s omitted) | | | $662,874 | | | | $385,380 | | | | $76,843 | | | | $6,095 | |
Ratio to average net assets of: | | | | | | | | | | | | | | | | |
Expenses, net of waivers/reimbursements | | | .65 | % | | | .68 | %** | | | .72 | % | | | .69 | %(f)** |
Expenses, net of waivers/reimbursements excluding interest expense and TALF administration fee | | | .65 | % | | | .65 | %** | | | .65 | % | | | .69 | %(f)** |
Expenses, before waivers/reimbursements | | | .66 | % | | | .73 | %** | | | .83 | % | | | .80 | %(f)** |
Expenses, before waivers/reimbursements excluding interest expense and TALF administration fee | | | .66 | % | | | .70 | %** | | | .76 | % | | | .76 | %(f)** |
Net investment income(b) | | | 7.34 | % | | | 8.12 | %** | | | 10.07 | % | | | 8.16 | %(f)** |
Portfolio turnover rate | | | 29 | % | | | 26 | % | | | 46 | % | | | 74 | % |
See footnote summary on page 106.
| | |
| 102 | | • ALLIANCEBERNSTEIN HIGH INCOME FUND |
Financial Highlights
Selected Data For A Share Of Capital Stock Outstanding Throughout Each Period
| | | | | | | | | | | | | | | | |
| | | Class R | |
| | | Year Ended October 31, | | | January 28,
2008(e) to
October 31,
2008 | |
| | | 2011 | | | 2010 | | | 2009 | | |
| | | | |
| | | | | | | | | | | | | | | | |
Net asset value, beginning of period | | | $ 9.19 | | | | $ 8.24 | | | | $ 5.85 | | | | $ 8.52 | |
| | | | |
Income From Investment Operations | | | | | | | | | | | | | | | | |
Net investment income(a)(b) | | | .62 | | | | .67 | | | | .67 | | | | .46 | |
Net realized and unrealized gain (loss) on investment and foreign currency transactions | | | (.44 | ) | | | .96 | | | | 2.43 | | | | (2.66 | ) |
Contributions from Adviser | | | .00 | (c) | | | .00 | (c) | | | – 0 | – | | | .00 | (c) |
| | | | |
Net increase (decrease) in net asset value from operations | | | .18 | | | | 1.63 | | | | 3.10 | | | | (2.20 | ) |
| | | | |
Less: Dividends and Distributions | | | | | | | | | | | | | | | | |
Dividends from net investment income | | | (.64 | ) | | | (.68 | ) | | | (.68 | ) | | | (.47 | ) |
Tax return of capital | | | – 0 | – | | | – 0 | – | | | (.01 | ) | | | – 0 | – |
Distributions from net realized gain on investment and foreign currency transactions | | | – 0 | – | | | – 0 | – | | | (.02 | ) | | | – 0 | – |
| | | | |
Total dividends and distributions | | | (.64 | ) | | | (.68 | ) | | | (.71 | ) | | | (.47 | ) |
| | | | |
Net asset value, end of period | | | $ 8.73 | | | | $ 9.19 | | | | $ 8.24 | | | | $ 5.85 | |
| | | | |
Total Return | | | | | | | | | | | | | | | | |
Total investment return based on net asset value(d) | | | 2.29 | %* | | | 20.62 | %* | | | 56.83 | %* | | | (27.09 | )%* |
Ratios/Supplemental Data | | | | | | | | | | | | | | | | |
Net assets, end of period (000’s omitted) | | | $20,935 | | | | $13,250 | | | | $3,754 | | | | $1,443 | |
Ratio to average net assets of: | | | | | | | | | | | | | | | | |
Expenses, net of waivers/reimbursements | | | 1.15 | % | | | 1.18 | %** | | | 1.19 | % | | | 1.18 | %(f)** |
Expenses, net of waivers/reimbursements excluding interest expense and TALF administration fee | | | 1.15 | % | | | 1.15 | %** | | | 1.15 | % | | | 1.18 | %(f)** |
Expenses, before waivers/reimbursements | | | 1.28 | % | | | 1.37 | %** | | | 1.36 | % | | | 1.43 | %(f)** |
Expenses, before waivers/reimbursements excluding interest expense and TALF administration fee | | | 1.28 | % | | | 1.34 | %** | | | 1.32 | % | | | 1.40 | %(f)** |
Net investment income(b) | | | 6.87 | % | | | 7.70 | %** | | | 9.86 | % | | | 7.62 | %(f)** |
Portfolio turnover rate | | | 29 | % | | | 26 | % | | | 46 | % | | | 74 | % |
See footnote summary on page 106.
| | | | |
| ALLIANCEBERNSTEIN HIGH INCOME FUND • | | | 103 | |
Financial Highlights
Selected Data For A Share Of Capital Stock Outstanding Throughout Each Period
| | | | | | | | | | | | | | | | |
| | | Class K | |
| | | Year Ended October 31, | | | January 28,
2008(e) to
October 31,
2008 | |
| | | 2011 | | | 2010 | | | 2009 | | |
| | | | |
| | | | | | | | | | | | | | | | |
Net asset value, beginning of period | | | $ 9.19 | | | | $ 8.24 | | | | $ 5.85 | | | | $ 8.52 | |
| | | | |
Income From Investment Operations | | | | | | | | | | | | | | | | |
Net investment income(a)(b) | | | .64 | | | | .69 | | | | .68 | | | | .47 | |
Net realized and unrealized gain (loss) on investment and foreign currency transactions | | | (.44 | ) | | | .96 | | | | 2.44 | | | | (2.66 | ) |
Contributions from Adviser | | | .00 | (c) | | | .00 | (c) | | | – 0 | – | | | .00 | (c) |
| | | | |
Net increase (decrease) in net asset value from operations | | | .20 | | | | 1.65 | | | | 3.12 | | | | (2.19 | ) |
| | | | |
Less: Dividends and Distributions | | | | | | | | | | | | | | | | |
Dividends from net investment income | | | (.66 | ) | | | (.70 | ) | | | (.70 | ) | | | (.48 | ) |
Tax return of capital | | | – 0 | – | | | – 0 | – | | | (.01 | ) | | | – 0 | – |
Distributions from net realized gain on investment and foreign currency transactions | | | – 0 | – | | | – 0 | – | | | (.02 | ) | | | – 0 | – |
| | | | |
Total dividends and distributions | | | (.66 | ) | | | (.70 | ) | | | (.73 | ) | | | (.48 | ) |
| | | | |
Net asset value, end of period | | | $ 8.73 | | | | $ 9.19 | | | | $ 8.24 | | | | $ 5.85 | |
| | | | |
Total Return | | | | | | | | | | | | | | | | |
Total investment return based on net asset value(d) | | | 2.55 | %* | | | 20.94 | %* | | | 57.24 | %* | | | (26.94 | )%* |
Ratios/Supplemental Data | | | | | | | | | | | | | | | | |
Net assets, end of period (000’s omitted) | | | $4,159 | | | | $1,624 | | | | $1,328 | | | | $753 | |
Ratio to average net assets of: | | | | | | | | | | | | | | | | |
Expenses, net of waivers/reimbursements | | | .90 | % | | | .95 | %** | | | .94 | % | | | .93 | %(f)** |
Expenses, net of waivers/reimbursements excluding interest expense and TALF administration fee | | | .90 | % | | | .90 | %** | | | .90 | % | | | .93 | %(f)** |
Expenses, before waivers/reimbursements | | | 1.01 | % | | | 1.08 | %** | | | 1.10 | % | | | 1.12 | %(f)** |
Expenses, before waivers/reimbursements excluding interest expense and TALF administration fee | | | 1.01 | % | | | 1.03 | %** | | | 1.06 | % | | | 1.09 | %(f)** |
Net investment income(b) | | | 7.13 | % | | | 8.04 | %** | | | 10.18 | % | | | 8.01 | %(f)** |
Portfolio turnover rate | | | 29 | % | | | 26 | % | | | 46 | % | | | 74 | % |
See footnote summary on page 106.
| | |
| 104 | | • ALLIANCEBERNSTEIN HIGH INCOME FUND |
Financial Highlights
Selected Data For A Share Of Capital Stock Outstanding Throughout Each Period
| | | | | | | | | | | | | | | | |
| | | Class I | |
| | | Year Ended October 31, | | | January 28,
2008(e) to
October 31,
2008 | |
| | | 2011 | | | 2010 | | | 2009 | | |
| | | | |
| | | | | | | | | | | | | | | | |
Net asset value, beginning of period | | | $ 9.20 | | | | $ 8.25 | | | | $ 5.85 | | | | $ 8.52 | |
| | | | |
Income From Investment Operations | | | | | | | | | | | | | | | | |
Net investment income(a) | | | .66 | | | | .71 | (b) | | | .70 | (b) | | | .49 | (b) |
Net realized and unrealized gain (loss) on investment and foreign currency transactions | | | (.43 | ) | | | .97 | | | | 2.44 | | | | (2.67 | ) |
Contributions from Adviser | | | .00 | (c) | | | .00 | (c) | | | – 0 | – | | | .00 | (c) |
| | | | |
Net increase (decrease) in net asset value from operations | | | .23 | | | | 1.68 | | | | 3.14 | | | | (2.18 | ) |
| | | | |
Less: Dividends and Distributions | | | | | | | | | | | | | | | | |
Dividends from net investment income | | | (.69 | ) | | | (.73 | ) | | | (.71 | ) | | | (.49 | ) |
Tax return of capital | | | – 0 | – | | | – 0 | – | | | (.01 | ) | | | – 0 | – |
Distributions from net realized gain on investment and foreign currency transactions | | | – 0 | – | | | – 0 | – | | | (.02 | ) | | | – 0 | – |
| | | | |
Total dividends and distributions | | | (.69 | ) | | | (.73 | ) | | | (.74 | ) | | | (.49 | ) |
| | | | |
Net asset value, end of period | | | $ 8.74 | | | | $ 9.20 | | | | $ 8.25 | | | | $ 5.85 | |
| | | | |
Total Return | | | | | | | | | | | | | | | | |
Total investment return based on net asset value(d) | | | 2.81 | %* | | | 21.23 | %* | | | 57.79 | %* | | | (26.84 | )%* |
Ratios/Supplemental Data | | | | | | | | | | | | | | | | |
Net assets, end of period (000’s omitted) | | | $41,617 | | | | $17,272 | | | | $306 | | | | $165 | |
Ratio to average net assets of: | | | | | | | | | | | | | | | | |
Expenses, net of waivers/reimbursements | | | .63 | % | | | .67 | %** | | | .69 | % | | | .69 | %(f)** |
Expenses, net of waivers/reimbursements excluding interest expense and TALF administration fee | | | .63 | % | | | .65 | %** | | | .65 | % | | | .69 | %(f)** |
Expenses, before waivers/reimbursements | | | .63 | % | | | .72 | %** | | | .72 | % | | | .79 | %(f)** |
Expenses, before waivers/reimbursements excluding interest expense and TALF administration fee | | | .63 | % | | | .71 | %** | | | .68 | % | | | .75 | %(f)** |
Net investment income | | | 7.36 | % | | | 8.03 | %(b)** | | | 10.45 | %(b) | | | 8.09 | %(b)(f)** |
Portfolio turnover rate | | | 29 | % | | | 26 | % | | | 46 | % | | | 74 | % |
See footnote summary on page 106.
| | | | |
| ALLIANCEBERNSTEIN HIGH INCOME FUND • | | | 105 | |
Financial Highlights
| (a) | | Based on average shares outstanding. |
| (b) | | Net of expenses waived/reimbursed by the Adviser. |
| (c) | | Amount less than $0.005. |
| (d) | | Total investment return is calculated assuming an initial investment made at the net asset value at the beginning of the period, reinvestment of all dividends and distributions at net asset value during the period, and redemption on the last day of the period. Initial sales charges or contingent deferred sales charges are not reflected in the calculation of total investment return. Total return does not reflect the deduction of taxes that a shareholder would pay on fund distributions or the redemption of fund shares. Total investment return calculated for a period of less than one year is not annualized. |
| (e) | | Commencement of distribution. |
| * | | Includes the impact of proceeds received, and credited to the Fund resulting from class action settlements, which enhanced the performance of each share class for the years ended October 31, 2011, October 31, 2010, October 31, 2009 and October 31, 2008 by .03%, .15%, .05% and .41%, respectively. |
| ** | | The ratio includes expenses attributable to costs of proxy solicitation. |
See notes to financial statements.
| | |
| 106 | | • ALLIANCEBERNSTEIN HIGH INCOME FUND |
Financial Highlights
REPORT OF INDEPENDENT REGISTERED
PUBLIC ACCOUNTING FIRM
To the Shareholders and Board of Directors of AllianceBernstein High Income Fund, Inc.
We have audited the accompanying statement of assets and liabilities of AllianceBernstein High Income Fund, Inc. (the “Fund”) (formerly AllianceBernstein Emerging Market Debt Fund, Inc.), including the portfolio of investments, as of October 31, 2011, and the related statement of operations for the year then ended, and the statement of changes in net assets for each of the two years in the period then ended, and the financial highlights for each of the periods indicated therein. These financial statements and financial highlights are the responsibility of the Fund’s management. Our responsibility is to express an opinion on these financial statements and financial highlights based on our audits.
We conducted our audits in accordance with the standards of the Public Company Accounting Oversight Board (United States). Those standards require that we plan and perform the audit to obtain reasonable assurance about whether the financial statements and financial highlights are free of material misstatement. We were not engaged to perform an audit of the Fund’s internal control over financial reporting. Our audits included consideration of internal control over financial reporting as a basis for designing audit procedures that are appropriate in the circumstances, but not for the purpose of expressing an opinion on the effectiveness of the Fund’s internal control over financial reporting. Accordingly, we express no such opinion. An audit also includes examining, on a test basis, evidence supporting the amounts and disclosures in the financial statements and financial highlights, assessing the accounting principles used and significant estimates made by management, and evaluating the overall financial statement presentation. Our procedures included confirmation of securities owned as of October 31, 2011 by correspondence with the custodian and others, or by other appropriate auditing procedures where replies from others were not received. We believe that our audits provide a reasonable basis for our opinion.
In our opinion, the financial statements and financial highlights referred to above present fairly, in all material respects, the financial position of AllianceBernstein High Income Fund, Inc. at October 31, 2011, the results of its operations for the year then ended, the changes in its net assets for each of the two years in the period then ended, and the financial highlights for each of the periods indicated therein, in conformity with U.S. generally accepted accounting principles.

New York, New York
December 30, 2011
| | | | |
| ALLIANCEBERNSTEIN HIGH INCOME FUND • | | | 107 | |
Report of Independent Registered Public Accounting Firm
2011 FEDERAL TAX INFORMATION
(unaudited)
For Federal income tax purposes, the following information is furnished with respect to the distributions paid by the Fund during the taxable year ended October 31, 2011.
For foreign shareholders, 66.59% of ordinary income dividends paid may be considered to be qualifying to be taxed as interest-related dividends.
Shareholders should not use the above information to prepare their income tax returns. The information necessary to complete your income tax returns will be included with your Form 1099-DIV which will be sent to you separately in January 2012.
| | |
| 108 | | • ALLIANCEBERNSTEIN HIGH INCOME FUND |
2011 Federal Tax Information
BOARD OF DIRECTORS
| | |
William H. Foulk, Jr.(1), Chairman John H. Dobkin(1) Michael J. Downey(1) D. James Guzy(1) Nancy P. Jacklin(1) | | Robert M. Keith, President and Chief Executive Officer Garry L. Moody(1) Marshall C. Turner, Jr.(1) Earl D. Weiner(1) |
OFFICERS
| | |
Philip L. Kirstein, Senior Vice President and Independent Compliance Officer Paul J. DeNoon(2), Vice President Gershon M. Distenfeld(2), Vice President Douglas J. Peebles(2), Vice President Marco G. Santamaria(2), Vice President | | Matthew S. Sheridan(2) , Vice President Emilie D. Wrapp, Secretary Joseph J. Mantineo, Treasurer and Chief Financial Officer Stephen M. Woetzel, Controller |
| | |
Principal Underwriter AllianceBernstein Investments, Inc. 1345 Avenue of the Americas New York, NY 10105 Custodian and Accounting Agent Brown Brothers Harriman & Co. 40 Water Street Boston, MA 02109 Legal Counsel Seward & Kissel LLP One Battery Park Plaza New York, NY 10004 | | Transfer Agent AllianceBernstein Investor Services, Inc. P.O. Box 786003 San Antonio, TX 78278-6003 Toll-Free (800) 221-5672 Independent Registered Public Accounting Firm Ernst & Young LLP 5 Times Square New York, NY 10036 |
| (1) | | Member of the Audit Committee, the Governance and Nominating Committee and the Independent Directors Committee. Mr. Foulk is the sole member of the Fair Value Pricing Committee. |
| (2) | | The day-to-day management of, and investment decisions for, the Fund’s portfolio are made by the Global Fixed Income Team and Global Credit Investment Team. Messrs. DeNoon, Distenfeld, Peebles, Santamaria and Sheridan are the investment professionals with the most significant responsibility for the day-to-day management of the Fund’s portfolio. |
| | | | |
| ALLIANCEBERNSTEIN HIGH INCOME FUND • | | | 109 | |
Board of Directors
MANAGEMENT OF THE FUND
Board of Directors Information
The business and affairs of the Fund are managed under the direction of the Board of Directors. Certain information concerning the Fund’s Directors is set forth below.
| | | | | | | | |
NAME,
ADDRESS* AND AGE
(YEAR FIRST ELECTED)** | | PRINCIPAL
OCCUPATION(S)
DURING PAST FIVE YEARS
AND OTHER RELEVANT
QUALIFICATIONS*** | | PORTFOLIOS
IN FUND
COMPLEX
OVERSEEN BY
DIRECTOR | | | OTHER
DIRECTORSHIPS
HELD BY
DIRECTOR IN
PAST FIVE YEARS |
| INTERESTED DIRECTOR | | | | | | |
Robert M. Keith, + 1345 Avenue of the Americas New York, NY 10105 51 (2010) | | Senior Vice President of AllianceBernstein L.P. (the “Adviser”) and the head of AllianceBernstein Investments, Inc. (“ABI”) since July 2008; Director of ABI and President of the AllianceBernstein Mutual Funds. Previously, he served as Executive Managing Director of ABI from December 2006 to June 2008. Prior to joining ABI in 2006, Executive Managing Director of Bernstein Global Wealth Management, and prior thereto, Senior Managing Director and Global Head of Client Service and Sales of the Adviser’s institutional investment management business since 2004. Prior thereto, Managing Director and Head of North American Client Service and Sales in the Adviser’s institutional investment management business, with which he had been associated since prior to 2004. | | | 102 | | | None |
| | |
| 110 | | • ALLIANCEBERNSTEIN HIGH INCOME FUND |
Management of the Fund
| | | | | | | | |
NAME,
ADDRESS* AND AGE
(YEAR FIRST ELECTED)** | | PRINCIPAL
OCCUPATION(S)
DURING PAST FIVE YEARS
AND OTHER RELEVANT
QUALIFICATIONS*** | | PORTFOLIOS
IN FUND
COMPLEX
OVERSEEN BY
DIRECTOR | | | OTHER
DIRECTORSHIPS
HELD BY
DIRECTOR IN
PAST FIVE YEARS |
| DISINTERESTED DIRECTORS | | | | | | |
William H. Foulk, Jr., #, ## Chairman of the Board 79 (1993) | | Investment Adviser and an Independent Consultant since prior to 2006. Previously, he was Senior Manager of Barrett Associates, Inc., a registered investment adviser. He was formerly Deputy Comptroller and Chief Investment Officer of the State of New York and, prior thereto, Chief Investment Officer of the New York Bank for Savings. He has served as a director or trustee of various AllianceBernstein Funds since 1983 and has been Chairman of the AllianceBernstein Funds and of the Independent Directors Committee of such Funds since 2003. He is also active in a number of mutual fund related organizations and committees. | | | 102 | | | None |
| | | | | | | | |
John H. Dobkin, # 69 (1993) | | Independent Consultant since prior to 2006. Formerly, President of Save Venice, Inc. (preservation organization) from 2001-2002; Senior Advisor from June 1999-June 2000 and President of Historic Hudson Valley (historic preservation) from December 1989-May 1999. Previously, Director of the National Academy of Design. He has served as a director or trustee of various AllianceBernstein Funds since 1992, and as Chairman of the Audit Committees of a number of such Funds from 2001-2008. | | | 102 | | | None |
| | | | |
| ALLIANCEBERNSTEIN HIGH INCOME FUND • | | | 111 | |
Management of the Fund
| | | | | | | | |
NAME,
ADDRESS* AND AGE
(YEAR FIRST ELECTED)** | | PRINCIPAL
OCCUPATION(S)
DURING PAST FIVE YEARS
AND OTHER RELEVANT
QUALIFICATIONS*** | | PORTFOLIOS
IN FUND
COMPLEX
OVERSEEN BY
DIRECTOR | | | OTHER
DIRECTORSHIPS
HELD BY
DIRECTOR IN
PAST FIVE YEARS |
DISINTERESTED DIRECTORS
(continued) | | | | | | |
Michael J. Downey, # 67 (2005) | | Private Investor since prior to 2006. Formerly, managing partner of Lexington Capital, LLC (investment advisory firm) from December 1997 until December 2003. From 1987 until 1993, Chairman and CEO of Prudential Mutual Fund Management, director of the Prudential Mutual funds and member of the Executive Committee of Prudential Securities, Inc. He has served as a director or trustee of the AllianceBernstein Funds since 2005 and is a director of two other registered investment companies (and Chairman of one of them). | | | 102 | | | Asia Pacific
Fund, Inc. and The Merger Fund since prior to 2006 and Prospect Acquisition Corp. (financial services) since 2007 until 2009 |
| | | | | | | | |
D. James Guzy, # 75 (2005) | | Chairman of the Board of PLX Technology (semi-conductors) and of SRC Computers, Inc., with which he has been associated since prior to 2006. He was formerly a director of Intel Corporation (semi-conductors) from 1969 until 2008 and served as Chairman of the Finance Committee of such company for several years until May 2008. He has served as a director or trustee of one or more of the AllianceBernstein Funds since 1982. | | | 102 | | | Cirrus Logic Corporation (semi-conductors) and PLX Technology (semi-conductors) since prior to 2006 and Intel Corporation (semi-conductors) since prior to 2006 until 2008 |
| | |
| 112 | | • ALLIANCEBERNSTEIN HIGH INCOME FUND |
Management of the Fund
| | | | | | | | |
NAME,
ADDRESS* AND AGE
(YEAR FIRST ELECTED)** | | PRINCIPAL
OCCUPATION(S)
DURING PAST FIVE YEARS
AND OTHER RELEVANT
QUALIFICATIONS*** | | PORTFOLIOS
IN FUND
COMPLEX
OVERSEEN BY
DIRECTOR | | | OTHER
DIRECTORSHIPS
HELD BY
DIRECTOR IN PAST FIVE YEARS |
DISINTERESTED DIRECTORS
(continued) | | | | | | |
Nancy P. Jacklin, # 63 (2006) | | Professorial Lecturer at the Johns Hopkins School of Advanced International Studies since 2008. Formerly, U.S. Executive Director of the International Monetary Fund (December 2002-May 2006); Partner, Clifford Chance (1992-2002); Sector Counsel, International Banking and Finance, and Associate General Counsel, Citicorp (1985-1992); Assistant General Counsel (International), Federal Reserve Board of Governors (1982-1985); and Attorney Advisor, U.S. Department of the Treasury (1973-1982). Member of the Bar of the District of Columbia and of New York; and member of the Council on Foreign Relations. She has served as a director or trustee of the AllianceBernstein Funds since 2006. | | | 102 | | | None |
| | | | | | | | |
Garry L. Moody, # 59 (2008) | | Independent Consultant. Formerly, Partner, Deloitte & Touche LLP, (1995-2008) where he held a number of senior positions, including Vice Chairman, and U.S. and Global Investment Management Practice Managing Partner; President, Fidelity Accounting and Custody Services Company (1993–1995); and Partner, Ernst & Young LLP (1975-1993), where he served as the National Director of Mutual Fund Tax Services. He is also a member of the Governing Council of the Independent Directors Council (IDC), an organization of independent directors of mutual funds. He has served as a director or trustee, and as Chairman of the Audit Committee, of most of the AllianceBernstein Funds since 2008. | | | 102 | | | None |
| | | | |
| ALLIANCEBERNSTEIN HIGH INCOME FUND • | | | 113 | |
Management of the Fund
| | | | | | | | |
NAME,
ADDRESS* AND AGE
(YEAR FIRST ELECTED)** | | PRINCIPAL
OCCUPATION(S)
DURING PAST FIVE YEARS
AND OTHER RELEVANT
QUALIFICATIONS*** | | PORTFOLIOS
IN FUND
COMPLEX
OVERSEEN BY
DIRECTOR | | | OTHER
DIRECTORSHIPS
HELD BY
DIRECTOR IN PAST FIVE YEARS |
DISINTERESTED DIRECTORS
(continued) | | | | | | |
Marshall C. Turner, Jr., # 70 (2005) | | Private Investor since prior to 2006. Interim CEO of MEMC Electronic Materials, Inc. (semi-conductor and solar cell substrates) from November 2008 until March 2009. He was Chairman and CEO of Dupont Photomasks, Inc. (components of semi-conductor manufacturing), 2003-2005, and President and CEO, 2005-2006, after the company was acquired and renamed Toppan Photomasks, Inc. He has extensive experience in venture capital investing including prior service as general partner of three institutional venture capital partnerships, and serves on the boards of a number of education and science-related non-profit organizations. He has served as a director or trustee of one or more of the AllianceBernstein Funds since 1992. | | | 102 | | | Xilinx, Inc. (programmable logic semi-conductors) and MEMC Electronic Materials, Inc. (semi-conductor and solar cell substrates) since prior to 2006 |
| | | | | | | | |
Earl D. Weiner, # 72 (2007) | | Of Counsel, and Partner prior to January 2007, of the law firm Sullivan & Cromwell LLP and member of ABA Federal Regulation of Securities Committee Task Force to draft editions of the Fund Director’s Guidebook. He also serves as a director or trustee of various non-profit organizations and has served as Chairman or Vice Chairman of a number of them. He has served as a director or trustee of the AllianceBernstein Funds since 2007 and is Chairman of the Governance and Nominating Committees of most of the Funds. | | | 102 | | | None |
| | |
| 114 | | • ALLIANCEBERNSTEIN HIGH INCOME FUND |
Management of the Fund
| * | | The address for each of the Fund’s disinterested Directors is c/o AllianceBernstein L.P., Attention: Philip L. Kirstein, 1345 Avenue of the Americas, New York, NY 10105. |
| ** | | There is no stated term of office for the Fund’s Directors. |
| *** | | The information above includes each Director’s principal occupation during the last five years and other information relating to the experience, attributes and skills relevant to each Director’s qualifications to serve as a Director, which led to the conclusion that each Director should serve as a Director for the Fund. |
| + | | Mr. Keith is an “interested director of the Fund”, as defined in the 1940 Act, due to his position as a Senior Vice President of the Adviser. |
| # | | Member of the Audit Committee, the Governance and Nominating Committee and the Independent Directors Committee. |
| ## | | Member of the Fair Value Pricing Committee. |
| | | | |
| ALLIANCEBERNSTEIN HIGH INCOME FUND • | | | 115 | |
Management of the Fund
Officers of the Fund
Certain information concerning the Fund’s Officers is listed below.
| | | | |
NAME, ADDRESS*
AGE | | PRINCIPAL POSITION(S)
HELD WITH FUND | | PRINCIPAL OCCUPATION
DURING PAST 5 YEARS |
Robert M. Keith,
51 | | President and Chief Executive Officer | | See above. |
| | | | |
Philip L. Kirstein,
66 | | Senior Vice President and Independent Compliance Officer | | Senior Vice President and Independent Compliance Officer of the AllianceBernstein Funds, with which he has been associated since October 2004. Prior thereto, he was Of Counsel to Kirkpatrick & Lockhart, LLP from October 2003 to October 2004, and General Counsel of Merrill Lynch Investment Managers, L.P. since prior to March 2003. |
| | | | |
Paul J. DeNoon,
49 | | Vice President | | Senior Vice President of the Adviser**, with which he has been associated since prior to 2006. |
| | | | |
Gershon Distenfeld,
36 | | Vice President | | Senior Vice President of the Adviser**, with which he has been associated since prior to 2006. |
| | | | |
Douglas J. Peebles,
46 | | Vice President | | Senior Vice President of the Adviser**, with which he has been associated since prior to 2006. |
| | | | |
Marco G. Santamaria,
46 | | Vice President | | Vice President of the Adviser**, with which he has been associated since June 2010. Prior thereto, he was a founding partner at Global Securities Advisors, an emerging markets oriented fixed-income hedge fund since prior to 2006. |
| | | | |
Matthew S. Sheridan,
36 | | Vice President | | Vice President of the Adviser**, with which he has been associated since prior to 2006. |
| | | | |
Emilie D. Wrapp,
56 | | Secretary | | Senior Vice President, Assistant General Counsel and Assistant Secretary of ABI**, with which she has been associated since prior to 2006. |
| | | | |
Joseph J. Mantineo,
52 | | Treasurer and Chief Financial Officer | | Senior Vice President of AllianceBernstein Investor Services, Inc. (“ABIS”)**, with which he has been associated since prior to 2006. |
| | | | |
Stephen M. Woetzel,
40 | | Controller | | Vice President of ABIS**, with which he has been associated since prior to 2006. |
| * | | The address for each of the Fund’s Officers is 1345 Avenue of the Americas, New York, NY 10105. |
| ** | | The Adviser, ABI and ABIS are affiliates of the Fund. |
| | | The Fund’s Statement of Additional Information (“SAI”) has additional information about the Fund’s Directors and Officers and is available without charge upon request. Contact your financial representative or AllianceBernstein at (800) 227-4618, or visit www.alliancebernstein.com, for a free prospectus or SAI. |
| | |
| 116 | | • ALLIANCEBERNSTEIN HIGH INCOME FUND |
Management of the Fund
THE FOLLOWING IS NOT PART OF THE SHAREHOLDER REPORT OR THE FINANCIAL STATEMENTS
SUMMARY OF SENIOR OFFICER’S EVALUATION OF INVESTMENT ADVISORY AGREEMENT1
The following is a summary of the evaluation of the Investment Advisory Agreement between AllianceBernstein L.P. (the “Adviser”) and The AllianceBernstein High Income Fund (the “Fund”),2 prepared by Philip L. Kirstein, the Senior Officer of the Fund for the Directors of the Fund, as required by the August 2004 agreement between the Adviser and the New York State Attorney General (the “NYAG”). The Senior Officer’s evaluation of the Investment Advisory Agreement is not meant to diminish the responsibility or authority of the Board of Directors to perform its duties pursuant to Section 15 of the Investment Company Act of 1940 (the “40 Act”) and applicable state law. The purpose of the summary is to provide shareholders with a synopsis of the independent evaluation of the reasonableness of the advisory fees proposed to be paid by the Fund which was provided to the Directors in connection with their review of the proposed approval of the continuance of the Investment Advisory Agreement.
The Senior Officer’s evaluation considered the following factors:
| | 1. | Advisory fees charged to institutional and other clients of the Adviser for like services; |
| | 2. | Advisory fees charged by other mutual fund companies for like services; |
| | 3. | Costs to the Adviser and its affiliates of supplying services pursuant to the advisory agreement, excluding any intra-corporate profit; |
| | 4. | Profit margins of the Adviser and its affiliates from supplying such services; |
| | 5. | Possible economies of scale as the Fund grows larger; and |
| | 6. | Nature and quality of the Adviser’s services including the performance of the Fund. |
These factors, with the exception of the first factor, are generally referred to as the “Gartenberg factors,” which were articulated by the United States Court of Appeals for the Second Circuit in 1982. Gartenberg v. Merrill Lynch Asset Management, Inc., 694 F. 2d 923 (2d Cir. 1982). On March 30, 2010, the Supreme Court held the Gartenberg decision was correct in its basic formulation of what §36(b) requires: to face liability under §36(b), “an investment adviser must charge a fee that is so disproportionately large that it bears no reasonable relationship to the services rendered and could not have been the product of
| 1 | | The information in the fee evaluation was completed on October 20, 2011 and discussed with the Board of Directors on November 1-3, 2011. |
| 2 | | Future references to the Fund do not include “AllianceBernstein.” References in the fee summary pertaining to performance and expense ratios refer to Class A shares of the Fund. |
| | | | |
| ALLIANCEBERNSTEIN HIGH INCOME FUND • | | | 117 | |
arm’s length bargaining.” Jones v. Harris Associates L.P., 130 S. Ct. 1418 (2010). In Jones, the Court stated the Gartenberg approach fully incorporates the correct understanding of fiduciary duty within the context of section 36(b) and noted with approval that “Gartenberg insists that all relevant circumstances be taken into account” and “uses the range of fees that might result from arm’s length bargaining as the benchmark for reviewing challenged fees.”3
ADVISORY FEES, NET ASSETS, & EXPENSE RATIOS
The Adviser proposed that the Fund pay the advisory fee set forth in the table below for receiving the services to be provided pursuant to the Investment Advisory Agreement. The fee schedule below, implemented in January 2004 in consideration of the Adviser’s settlement with the NYAG in December 2003, is based on a master schedule that contemplates eight categories of funds with almost all funds in each category having the same advisory fee schedule.4 Also shown are the Fund’s net assets on September 30, 2011.
| | | | |
| Category | | Advisory Fee5 | | September 30, 2011 Net Assets
($MM) |
| High Income | | 50 bp on 1st $2.5 billion 45 bp on next $2.5 billion 40 bp on the balance | | $2,965.8 |
The Fund’ Investment Advisory Agreement provides for the Adviser to be reimbursed for certain clerical, legal, accounting, administrative and other services provided to the Fund. During the Fund’s most recently completed fiscal year, the Adviser received $89,160 (0.01% of the Fund’s average daily net assets) for providing such services.
The Adviser has agreed to waive that portion of its advisory fees and/or reimburse the Fund for that portion of the Fund’ total operating expenses to the degree necessary to limit the Fund’s expense ratio to the amounts set forth below for the Fund’s current fiscal year. The waiver agreement is terminable by the Adviser at the end of the Fund’ fiscal year upon at least 60 days written
| 3 | | Jones v. Harris at 1427. |
| 4 | | Most of the AllianceBernstein Mutual Funds, which the Adviser manages, were affected by the Adviser’s settlement with the NYAG. |
| 5 | | The advisory fees are based on the Fund’s average daily adjusted total assets (i.e. the average daily value of total assets minus the sum of accrued liabilities other than the principal amount of money borrowed). |
| | |
| 118 | | • ALLIANCEBERNSTEIN HIGH INCOME FUND |
notice. In addition, set forth below are the gross expense ratios of the Fund, annualized for the most recent semi-annual period:6
| | | | | | | | | | | | | | |
| Fund | | Expense Cap Pursuant to
Expense Limitation
Undertaking | | | Gross
Expense
Ratio (4/30/11)7 | | | Fiscal
Year End | |
| High Income Fund, Inc.8 | | Advisor
Class A Class B Class C Class R Class K Class I | |
| 0.65
0.95 1.65 1.65 1.15 0.90 0.65 | %
% % % % % % | |
| 0.61
0.91 1.64 1.61 1.30 0.99 0.60 | %
% % % % % % | | | October 31 | |
| I. | ADVISORY FEES CHARGED TO INSTITUTIONAL AND OTHER CLIENTS |
The advisory fees charged to investment companies which the Adviser manages and sponsors are normally higher than those charged to similar sized institutional accounts, including pension plans and sub-advised investment companies. The fee differential reflects, among other things, different services provided to such clients, and different liabilities assumed. Services provided by the Adviser to the Fund that are not provided to non-investment company clients and sub-advised investment companies include providing office space and personnel to serve as Fund Officers, who among other responsibilities make the certifications required under the Sarbanes–Oxley Act of 2002, and coordinating with and monitoring the Fund’ third party service providers such as Fund counsel, auditors, custodians, transfer agents and pricing services. The accounting, administrative, legal and compliance requirements for the Fund are more costly than those for institutional assets due to the greater complexities and time required for investment companies, although as previously noted, the Adviser is reimbursed for providing some of these services. Also, retail mutual funds managed by the Adviser are widely held. Servicing the Fund’ investors is more time consuming and labor intensive compared to institutional clients since the Adviser needs to communicate with a more extensive network of financial intermediaries and shareholders. The Adviser also believes that it incurs substantial entrepreneurial risk when offering a new mutual fund since establishing a new mutual fund requires a large upfront investment and it may take a long time for the fund to achieve profitability since the fund must be priced to scale from inception in order to be competitive and assets are acquired one account at a time. In addition, managing the cash flow of an investment company may be more difficult than managing that of a stable pool of assets, such as an
| 6 | | Semi-annual total expense ratios are unaudited. |
| 8 | | In August 2011, the Adviser notified the Board of Directors that it did not intend on renewing the Fund’s Expense Limitation Undertaking at the conclusion of the Fund’s current fiscal year. The Expense Limitation Undertakings for the Fund will expire on February 1, 2012. |
| | | | |
| ALLIANCEBERNSTEIN HIGH INCOME FUND • | | | 119 | |
institutional account with little cash movement in either direction, particularly, if a fund is in net redemption and the Adviser is frequently forced to sell securities to raise cash for redemptions. However, managing a fund with positive cash flow may be easier at times than managing a stable pool of assets. Finally, in recent years, investment advisers have been sued by institutional clients and have suffered reputational damage both by the attendant publicity and outcomes other than complete victories. Accordingly, the legal and reputational risks associated with institutional accounts are greater than previously thought, although still not equal to those related to the mutual fund industry.
Notwithstanding the Adviser’s view that managing an investment company is not comparable to managing other institutional accounts because the services provided are different, the Supreme Court has indicated consideration should be given to the advisory fees charged to institutional accounts with a similar investment style as the Fund.9 In addition to the AllianceBernstein Institutional fee schedule, set forth below is what would have been the effective advisory fee of the Fund had the AllianceBernstein Institutional fee schedule been applicable to the Fund versus the Fund’s advisory fees based on September 30, 2011 net assets.10
| | | | | | | | | | | | |
| Fund | | Net Assets 9/30/11 ($MM) | | | AllianceBernstein
Institutional Fee Schedule | | Effective
AB Inst.
Adv. Fee | | | Fund Advisory Fee |
| High Income Fund, Inc. | | | $2,965.8 | | | Global High Yield
Schedule
55 bp on 1st $50 million 35 bp on the balance
Minimum Account Size: $50m | | | 0.352% | | | 0.492% |
The Adviser also manages and sponsors retail mutual funds, which are organized in jurisdictions outside the United States, generally Luxembourg and Japan, and
| 9 | | The Supreme Court stated that “courts may give such comparisons the weight that they merit in light of the similarities and differences between the services that the clients in question require, but the courts must be wary of inapt comparisons.” Among the significant differences the Supreme Court noted that may exist between services provided to mutual funds and institutional accounts are “higher marketing costs.” Jones v. Harris at 1428. |
| 10 | | The Adviser has indicated that with respect to institutional accounts with assets greater than $300 million, it will negotiate a fee schedule. Discounts that are negotiated vary based upon each client relationship. |
| | |
| 120 | | • ALLIANCEBERNSTEIN HIGH INCOME FUND |
sold to non-United States resident investors. The Adviser charges the following fee for Global High Yield, a Luxembourg fund, which has a somewhat similar investment style as the Fund:
| | | | |
| Fund | | Luxembourg Fund | | Fee11 |
| High Income Fund, Inc. | | Global High Yield | | |
| | Class A | | 1.70% on 1st $5 billion
1.50% on the balance |
| | Class I (Institutional) | | 1.15% on 1st $5 billion
0.95% on the balance |
The AllianceBernstein Investment Trust Management mutual funds (“ITM”), which are offered to investors in Japan, have an “all-in” fee to compensate the Adviser for investment advisory as well as fund accounting and administrative related services. The fee schedule of the ITM mutual fund that has a somewhat similar investment style as the Fund is as follows:
| | | | |
| Fund | | ITM Mutual Fund | | Fee12 |
| High Income Fund, Inc. | | Global High Income Open A/B (Hedged/Unhedged) | | 0.70% on the 1st ¥30 billion
0.60% on next ¥20 billion
0.50% on next ¥450 billion
0.45% on the balance |
The Adviser represented that it does not sub-advise any registered investment companies of other fund families with a substantially similar investment style as the Fund.
| II. | MANAGEMENT FEES CHARGED BY OTHER MUTUAL FUND COMPANIES FOR LIKE SERVICES. |
Lipper, Inc. (“Lipper”), an analytical service that is not affiliated with the Adviser, compared the fees charged to the Fund with fees charged to other investment companies for similar services offered by other investment advisers.13 Lipper’s analysis included the comparison of the Fund’s contractual management
| 11 | | Class A shares of the Luxembourg fund are charged an “all-in” fee, which covers investment advisory and distribution related services. |
| 12 | | The Japanese Yen-U.S. dollar currency exchange rate quoted at 4 p.m. on September 30, 2011 by Reuters was ¥77.0383 per $1. At that currency exchange rate, ¥30 billion would be equivalent to approximately $389.4 million; ¥20 billion would be equivalent to approximately $259.6 million; and ¥450 billion would be equivalent to approximately $5.841 billion. |
| 13 | | The Supreme Court cautioned against accepting mutual fund fee comparisons without careful scrutiny since “these comparisons are problematic because these fees, like those challenged, may not be the product of negotiations conducted at arm’s length.” Jones v. Harris at 1429. |
| | | | |
| ALLIANCEBERNSTEIN HIGH INCOME FUND • | | | 121 | |
fee, estimated at the approximate current asset level of the Fund, to the median of the Fund’s Lipper Expense Group (“EG”)14 and the Fund’s contractual management fee ranking.15
Lipper describes an EG as a representative sample of comparable funds. Lipper’s standard methodology for screening funds to be included in an EG entails the consideration of several fund criteria, including fund type, investment classification/objective, load type and similar 12b-1/non-12b-1 service fees, asset (size) comparability, expense components and attributes. An EG will typically consist of seven to twenty funds.
| | | | | | | | | | | | |
| Fund | | Contractual
Management Fee (%)16 | | | Lipper Exp. Group Median (%) | | | Lipper
Group Rank | |
| High Income Fund, Inc. | | | 0.487 | | | | 0.537 | | | | 6/16 | |
Lipper also compared the Fund’s total expense ratio to the medians of the Fund’s EG and Lipper Expense Universe (“EU”). The EU is a broader group compared to the EG, consisting of all funds that have the same investment classifications/objective and load type as the subject Fund.
| | | | | | | | | | | | | | | | | | | | |
| Fund | | Expense Ratio (%)17 | | | Lipper Exp. Group
Median (%) | | | Lipper Group Rank | | | Lipper Exp. Universe Median (%) | | | Lipper
Universe Rank | |
| High Income Fund, Inc. | | | 0.948 | | | | 0.966 | | | | 7/16 | | | | 1.097 | | | | 12/82 | |
Based on this analysis, the Fund has a more favorable ranking on a management fee basis than on a total expense basis.
| 14 | | Lipper does not consider average account size when constructing EGs. Funds with relatively small average account sizes tend to have higher transfer agent expense ratio than comparable sized funds that have relatively large average account sizes. Note that there are limitations on Lipper expense category data because different funds categorize expenses differently. |
| 15 | | The contractual management fee is calculated by Lipper using the Fund’s contractual management fee rate at a hypothetical asset level. The hypothetical asset level is based on the combined net assets of all classes of the Fund, rounded up to the next $25 million. Lipper’s total expense ratio information is based on the most recent annual report except as otherwise noted. A ranking of “1” would mean that the Fund had the lowest effective fee rate in the Lipper peer group. |
| 16 | | The contractual management fee does not reflect any expense reimbursements made by the Fund to the Adviser for certain clerical, legal, accounting, administrative, and other services. In addition, the contractual management fee does not reflect any advisory fee waivers or expense reimbursements made by the Adviser that would effectively reduce the actual effective management fee. |
| 17 | | Most recently completed fiscal year Class A share total expense ratio. |
| | |
| 122 | | • ALLIANCEBERNSTEIN HIGH INCOME FUND |
| III. | COSTS TO THE ADVISER AND ITS AFFILIATES OF SUPPLYING SERVICES PURSUANT TO THE MANAGEMENT FEE ARRANGEMENT, EXCLUDING ANY INTRA-CORPORATE PROFIT. |
The Adviser utilizes two profitability reporting systems, which operate independently but are aligned with each other, to estimate the Adviser’s profitability in connection with investment advisory services provided to the Fund. The Senior Officer has retained a consultant to provide independent advice regarding the alignment of the two profitability systems as well as the methodologies and allocations utilized by both profitability systems. See Section IV for additional discussion.
| IV. | PROFIT MARGINS OF THE ADVISER AND ITS AFFILIATES FOR SUPPLYING SUCH SERVICES. |
The Fund’ profitability information, prepared by the Adviser for the Board of Directors, was reviewed by the Senior Officer and the consultant. The Adviser’s profitability from providing investment advisory services to the Fund increased during calendar year 2010, relative to 2009.
In addition to the Adviser’s direct profits from managing the Fund, certain of the Adviser’s affiliates have business relationships with the Fund and may earn a profit from providing other services to the Fund. The courts have referred to this type of business opportunity as “fall-out benefits” to the Adviser and indicated that such benefits should be factored into the evaluation of the total relationship between the Fund and the Adviser. Neither case law nor common business practice precludes the Adviser’s affiliates from earning a reasonable profit on this type of relationship provided the affiliates’ charges and services are competitive and the relationship otherwise complies with the 40 Act restrictions. These affiliates provide transfer agent and distribution services to the Fund and receive transfer agent fees, Rule 12b-1 payments, front-end sales loads and contingent deferred sales charges (“CDSC”).
AllianceBernstein Investments, Inc. (“ABI”), an affiliate of the Adviser, is the Fund’s principal underwriter. ABI and the Adviser have disclosed in the Fund’s prospectus that they may make revenue sharing payments from their own resources, in addition to resources derived from sales loads and Rule 12b-1 fees, to firms that sell shares of the Fund. In 2010, ABI paid approximately 0.04% of the average monthly assets of the AllianceBernstein Mutual Funds or approximately $13.8 million for distribution services and educational support (revenue sharing payments).
During the Fund’s most recently completed fiscal year, ABI received from the Fund $389,705, $6,832,147 and $161, 457 in front-end sales charges, Rule 12b-1 and CDSC fees, respectively.
Fees and reimbursements for out of pocket expenses charged by AllianceBernstein Investor Services, Inc. (“ABIS”), the affiliated transfer agent for the Fund, are
| | | | |
| ALLIANCEBERNSTEIN HIGH INCOME FUND • | | | 123 | |
based on the level of the network account and the class of shares held by the account. ABIS also receives a fee per shareholder sub-account for each account maintained by an intermediary on an omnibus basis. ABIS received $737,115 in net fees from the Fund during the Fund’s most recently completed fiscal year:
| V. | POSSIBLE ECONOMIES OF SCALE |
The Adviser has indicated that economies of scale are being shared with shareholders through fee structures,18 subsidies and enhancement to services. Based on some of the professional literature that has considered economies of scale in the mutual fund industry, it is thought that to the extent economies of scale exist, they may more often exist across a fund family as opposed to a specific fund. This is because the costs incurred by the Adviser, such as investment research or technology for trading or compliance systems can be spread across a greater asset base as the fund family increases in size. It is also possible that as the level of services required to operate a successful investment company has increased over time, and advisory firms make such investments in their business to provide services, there may be a sharing of economies of scale without a reduction in advisory fees.
In February 2008, an independent consultant, retained by the Senior Officer, provided the Board of Directors an update of the Deli19 study on advisory fees and various fund characteristics.20 The independent consultant first reiterated the results of his previous two dimensional comparison analysis (fund size and family size) with the Board of Directors.21 The independent consultant then discussed the results of the regression model that was utilized to study the effects of various factors on advisory fees. The regression model output indicated that the bulk of the variation in fees predicted were explained by various factors, but substantially by fund AUM, family AUM, index fund indicator and investment style. The independent consultant also compared the advisory fees of the AllianceBernstein Mutual Funds to similar funds managed by 19 other large asset managers, regardless of the fund size and each Adviser’s proportion of mutual fund assets to non-mutual fund assets.
| 18 | | Fee structures include fee reductions, pricing at scale and breakpoints in advisory fee schedules. |
| 19 | | The Deli study, originally published in 2002 based on 1997 data and updated for the February 2008 Presentation, may be of diminished value due to the age of the data used in the presentation and the changes experienced in the industry over the last four years. |
| 20 | | As mentioned previously, the Supreme Court cautioned against accepting mutual fund fee comparisons without careful scrutiny since the fees may not be the product of negotiations conducted at arm’s length. See Jones V. Harris at 1429. |
| 21 | | The two dimensional analysis showed patterns of lower advisory fees for funds with larger asset sizes and funds from larger family sizes compared to funds with smaller asset sizes and funds from smaller family sizes, which according to the independent consultant is indicative of a sharing of economies of scale and scope. However, in less liquid and active markets, such is not the case, as the empirical analysis showed potential for diseconomies of scale in those markets. The empirical analysis also showed diminishing economies of scale and scope as funds surpassed a certain high level of assets. |
| | |
| 124 | | • ALLIANCEBERNSTEIN HIGH INCOME FUND |
| VI. | NATURE AND QUALITY OF THE ADVISER’S SERVICES, INCLUDING THE PERFORMANCE OF THE FUND |
With assets under management of approximately $402 billion as of September 30, 2011, the Adviser has the investment experience to manage and provide non-investment services (described in Section I) to the Fund.
The information prepared by Lipper shows the 1, 3, 5 and 10 year performance rankings22 of the Fund relative to its Lipper Performance Group (“PG”) and Lipper Performance Universe (“PU”)23 for the periods ended July 31, 2011.24
| | | | | | | | | | | | | | | | |
| | | Fund Return (%) | | | PG Median (%) | | | PU Median (%) | | | PG Rank | | PU Rank |
| High Income Fund, Inc. | | | | | | | | | | | | | | | | |
1 year | | | 12.20 | | | | 12.49 | | | | 12.20 | | | 13/16 | | 46/93 |
3 year | | | 14.48 | | | | 11.22 | | | | 10.66 | | | 1/16 | | 3/84 |
5 year | | | 11.40 | | | | 8.14 | | | | 7.56 | | | 1/16 | | 1/74 |
10 year | | | 14.52 | | | | 8.11 | | | | 7.68 | | | 1/14 | | 1/56 |
| 22 | | The performance returns and rankings of the Fund are for the Fund’ Class A shares. It should be noted that performance returns of the Fund were provided by Lipper. |
| 23 | | The Fund’s PG is identical to the Fund’s EG. The Fund’s PU is not identical to the Fund’s EU as the criteria for including/excluding a fund from a PU is somewhat different from that of an EU. |
| 24 | | The current Lipper investment classification/objective dictates the PG and PU throughout the life of the Fund even if a Fund had a different investment classification/objective at a different point in time. |
| | | | |
| ALLIANCEBERNSTEIN HIGH INCOME FUND • | | | 125 | |
Set forth below are the 1, 3, 5 and 10 year and since inception performance returns of the Fund (in bold)25 versus its benchmarks.26 Fund and benchmark volatility and reward-to-variability ratio (“Sharpe Ratio”) information is also shown.27
| | | | | | | | | | | | | | | | | | | | | | | | | | | | | | | | |
| | | Periods Ending July 31, 2011 | |
| | | Annualized Performance | | | Annualized | |
| | | 1 Year
(%) | | | 3 Year
(%) | | | 5 Year
(%) | | | 10 Year
(%) | | | Since
Inception
(%) | | | Volatility
(%) | | | Sharpe
(%) | | | Risk
Period (Year) | |
| High Income Fund, Inc. | | | 12.20 | | | | 14.31 | | | | 11.30 | | | | 14.47 | | | | 11.81 | | | | 13.60 | | | | 0.72 | | | | 5 | |
| 33% JP Morgan EMBI Index / 33% JP Morgan GBI EM / 33% Barclays Capital High Yield 2% Constrained Index | | | 12.05 | | | | 10.33 | | | | 10.06 | | | | N/A | | | | N/A | | | | 10.82 | | | | 0.76 | | | | 5 | |
| JP Morgan EMBI Global Index | | | 9.41 | | | | 10.74 | | | | 9.31 | | | | 11.01 | | | | 10.98 | | | | N/A | | | | N/A | | | | N/A | |
| JP Morgan GBI EM | | | 13.60 | | | | 6.07 | | | | 10.92 | | | | N/A | | | | N/A | | | | N/A | | | | N/A | | | | N/A | |
| Barclays Capital High Yield 2% Constrained Index | | | 12.89 | | | | 13.71 | | | | 9.49 | | | | 9.07 | | | | 7.63 | | | | N/A | | | | N/A | | | | N/A | |
| Inception Date: February 25, 1994 | | | | | | | | | | | | | |
CONCLUSION:
Based on the factors discussed above the Senior Officer’s conclusion is that the proposed advisory fee for the Fund is reasonable and within the range of what would have been negotiated at arm’s length in light of all the surrounding circumstances. This conclusion in respect of the Fund is based on an evaluation of all of these factors and no single factor was dispositive.
Dated: November 28, 2011
| 25 | | The performance returns and risk measures shown in the table are for the Class A shares of the Fund. |
| 26 | | The Adviser provided Fund and benchmark performance return information for periods through July 31, 2011. |
| 27 | | Fund and benchmark volatility and Sharpe Ratio information was obtained through Lipper LANA, a database maintained by Lipper. Volatility is a statistical measure of the tendency of a market price or yield to vary over time. A Sharpe Ratio is a risk adjusted measure of return that divides a fund’s return in excess of the riskless return by the fund’s standard deviation. A fund with a greater volatility would be viewed as more risky than a fund with equivalent performance but lower volatility; for that reason, a greater return would be demanded for the more risky fund. A fund with a higher Sharpe Ratio would be regarded as better performing than a fund with a lower Sharpe Ratio. |
| | |
| 126 | | • ALLIANCEBERNSTEIN HIGH INCOME FUND |
THIS PAGE IS NOT PART OF THE SHAREHOLDER REPORT OR THE FINANCIAL STATEMENTS
ALLIANCEBERNSTEIN FAMILY OF FUNDS
Wealth Strategies Funds
Balanced Wealth Strategy
Conservative Wealth Strategy
Wealth Appreciation Strategy
Tax-Managed Balanced Wealth Strategy
Tax-Managed Conservative Wealth Strategy
Tax-Managed Wealth Appreciation Strategy
Asset Allocation/Multi-Asset
Emerging Markets Multi-Asset
International Portfolio
Real Asset Strategy
Tax-Managed International Portfolio
Growth Funds
Domestic
Growth Fund
Large Cap Growth Fund
Small Cap Growth Portfolio
Small/Mid Cap Growth Fund
U.S. Strategic Research Portfolio
Global & International
Global Thematic Growth Fund
Greater China ’97 Fund
International Discovery Equity Portfolio
International Focus 40 Portfolio
International Growth Fund
Value Funds
Domestic
Core Opportunities Fund
Equity Income Fund
Growth & Income Fund
Small/Mid Cap Value Fund
Value Fund
Global & International
Global Real Estate Investment Fund
Global Value Fund
International Value Fund
Taxable Bond Funds
Bond Inflation Strategy
Global Bond Fund
High Income Fund
Intermediate Bond Portfolio
Short Duration Portfolio
Unconstrained Bond Fund*
Municipal Bond Funds
| | |
Arizona California High Income Massachusetts Michigan Minnesota Municipal Bond Inflation Strategy | | National New Jersey New York Ohio Pennsylvania Virginia |
Intermediate Municipal Bond Funds
Intermediate California
Intermediate Diversified
Intermediate New York
Closed-End Funds
Alliance California Municipal Income Fund
Alliance New York Municipal Income Fund
AllianceBernstein Global High Income Fund
AllianceBernstein Income Fund
AllianceBernstein National Municipal Income Fund
Alternatives
Market Neutral Strategy-Global
Market Neutral Strategy-U.S.
Balanced
Balanced Shares
Retirement Strategies Funds
| | | | |
2000 Retirement Strategy | | 2020 Retirement Strategy | | 2040 Retirement Strategy |
2005 Retirement Strategy | | 2025 Retirement Strategy | | 2045 Retirement Strategy |
2010 Retirement Strategy | | 2030 Retirement Strategy | | 2050 Retirement Strategy |
2015 Retirement Strategy | | 2035 Retirement Strategy | | 2055 Retirement Strategy |
We also offer Exchange Reserves,** which serves as the money market fund exchange vehicle for the AllianceBernstein mutual funds.
You should consider the investment objectives, risks, charges and expenses of any AllianceBernstein fund/portfolio carefully before investing. For free copies of our prospectuses, which contain this and other information, visit us online at www.alliancebernstein.com or contact your financial advisor. Please read the prospectus carefully before investing.
| * | | Prior to February 3, 2011, Unconstrained Bond Fund was named Diversified Yield Fund. |
| ** | An investment in the Fund is not a deposit in a bank and is not insured or guaranteed by the Federal Deposit Insurance Corporation or any other government agency. Although the Fund seeks to preserve the value of your investment at $1.00 per share, it is possible to lose money by investing in the Fund. |
| | | | |
| ALLIANCEBERNSTEIN HIGH INCOME FUND • | | | 127 | |
AllianceBernstein Family of Funds
NOTES
| | |
| 128 | | • ALLIANCEBERNSTEIN HIGH INCOME FUND |
NOTES
| | | | |
| ALLIANCEBERNSTEIN HIGH INCOME FUND • | | | 129 | |
NOTES
| | |
| 130 | | • ALLIANCEBERNSTEIN HIGH INCOME FUND |
NOTES
| | | | |
| ALLIANCEBERNSTEIN HIGH INCOME FUND • | | | 131 | |
NOTES
| | |
| 132 | | • ALLIANCEBERNSTEIN HIGH INCOME FUND |
ALLIANCEBERNSTEIN HIGH INCOME FUND
1345 Avenue of the Americas
New York, NY 10105
800.221.5672
| | |
| |
| HI-0151-1011 | |  |
ITEM 2. CODE OF ETHICS.
(a) The registrant has adopted a code of ethics that applies to its principal executive officer, principal financial officer and principal accounting officer. A copy of the registrant’s code of ethics is filed herewith as Exhibit 12(a)(1).
(b) During the period covered by this report, no material amendments were made to the provisions of the code of ethics adopted in 2(a) above.
(c) During the period covered by this report, no implicit or explicit waivers to the provisions of the code of ethics adopted in 2(a) above were granted.
ITEM 3. AUDIT COMMITTEE FINANCIAL EXPERT.
The registrant’s Board of Directors has determined that independent directors Garry L. Moody and William H. Foulk, Jr. qualify as audit committee financial experts.
ITEM 4. PRINCIPAL ACCOUNTANT FEES AND SERVICES.
(a) - (c) The following table sets forth the aggregate fees billed by the independent registered public accounting firm Ernst & Young LLP, for the Fund’s last two fiscal years for professional services rendered for: (i) the audit of the Fund’s annual financial statements included in the Fund’s annual report to stockholders; (ii) assurance and related services that are reasonably related to the performance of the audit of the Fund’s financial statements and are not reported under (i), which include advice and education related to accounting and auditing issues and quarterly press release review (for those Funds which issue press releases), and preferred stock maintenance testing (for those Funds that issue preferred stock); and (iii) tax compliance, tax advice and tax return preparation.
| | | | | | | | | | | | | | | | |
| | | | | | Audit Fees | | | Audit-Related
Fees | | | Tax Fees | |
AB High Income | | | 2010 | | | $ | 57,500 | | | $ | — | | | $ | 16,971 | |
| | | 2011 | | | $ | 68,000 | | | $ | 295 | | | $ | 17,891 | |
(d) Not applicable.
(e) (1) Beginning with audit and non-audit service contracts entered into on or after May 6, 2003, the Fund’s Audit Committee policies and procedures require the pre-approval of all audit and non-audit services provided to the Fund by the Fund’s independent registered public accounting firm. The Fund’s Audit Committee policies and procedures also require pre-approval of all audit and non-audit services provided to the Adviser and Service Affiliates to the extent that these services are directly related to the operations or financial reporting of the Fund.
(e) (2) All of the amounts for Audit Fees, Audit-Related Fees and Tax Fees in the table under Item 4 (a) - (c) are for services pre-approved by the Fund’s Audit Committee.
(f) Not applicable.
(g) The following table sets forth the aggregate non-audit services provided to the Fund, the Fund’s Adviser and entities that control, are controlled by or under common control with the Adviser that provide ongoing services to the Fund, which include preparing an annual internal control report pursuant to Statement on Auditing Standards No. 70 (“Service Affiliates”):
| | | | | | | | | | | | |
| | | | | | All Fees for
Non-Audit Services
Provided to the
Portfolio, the Adviser
and Service Affiliates | | | Pre-approved by the
Audit Committee
(Portion Comprised of
Audit Related Fees)
(Portion Comprised of
Tax Fees) | |
AB High Income | | | 2010 | | | $ | 709,151 | | | $ | 144,686 | |
| | | | | | | | | | $ | (127,715 | ) |
| | | | | | | | | | $ | (16,971 | ) |
| | | |
| | | 2011 | | | $ | 693,852 | | | $ | 18,186 | |
| | | | | | | | | | $ | (295 | ) |
| | | | | | | | | | $ | (17,891 | ) |
(h) The Audit Committee of the Fund has considered whether the provision of any non-audit services not pre-approved by the Audit Committee provided by the Fund’s independent registered public accounting firm to the Adviser and Service Affiliates is compatible with maintaining the auditor’s independence.
ITEM 5. AUDIT COMMITTEE OF LISTED REGISTRANTS.
Not applicable to the registrant.
ITEM 6. SCHEDULE OF INVESTMENTS.
Please see Schedule of Investments contained in the Report to Shareholders included under Item 1 of this Form N-CSR.
ITEM 7. DISCLOSURE OF PROXY VOTING POLICIES AND PROCEDURES FOR CLOSED-END MANAGEMENT INVESTMENT COMPANIES.
Not applicable to the registrant.
ITEM 8. PORTFOLIO MANAGERS OF CLOSED-END MANAGEMENT INVESTMENT COMPANIES.
Not applicable to the registrant.
ITEM 9. PURCHASES OF EQUITY SECURITIES BY CLOSED-END MANAGEMENT INVESTMENT COMPANY AND AFFILIATED PURCHASERS.
Not applicable to the registrant.
ITEM 10. SUBMISSION OF MATTERS TO A VOTE OF SECURITY HOLDERS.
There have been no material changes to the procedures by which shareholders may recommend nominees to the Fund’s Board of Directors since the Fund last provided disclosure in response to this item.
ITEM 11. CONTROLS AND PROCEDURES.
(a) The registrant’s principal executive officer and principal financial officer have concluded that the registrant’s disclosure controls and procedures (as defined in Rule 30a-3 (c) under the Investment Company Act of 1940, as amended) are effective at the reasonable assurance level based on their evaluation of these controls and procedures as of a date within 90 days of the filing date of this document.
(b) There were no changes in the registrant’s internal controls over financial reporting that occurred during the second fiscal quarter of the period that has materially affected, or is reasonably likely to materially affect, the registrant’s internal control over financial reporting.
ITEM 12. EXHIBITS.
The following exhibits are attached to this Form N-CSR:
| | |
EXHIBIT NO. | | DESCRIPTION OF EXHIBIT |
| 12 (a) (1) | | Code of Ethics that is subject to the disclosure of Item 2 hereof |
| |
| 12 (b) (1) | | Certification of Principal Executive Officer Pursuant to Section 302 of the Sarbanes-Oxley Act of 2002 |
| |
| 12 (b) (2) | | Certification of Principal Financial Officer Pursuant to Section 302 of the Sarbanes-Oxley Act of 2002 |
| |
| 12 (c) | | Certification of Principal Executive Officer and Principal Financial Officer Pursuant to Section 906 of the Sarbanes-Oxley Act of 2002 |
SIGNATURES
Pursuant to the requirements of the Securities Exchange Act of 1934 and the Investment Company Act of 1940, the registrant has duly caused this report to be signed on its behalf by the undersigned, thereunto duly authorized.
(Registrant): AllianceBernstein High Income Fund, Inc.
| | |
By: | | /s/ Robert M. Keith |
| | Robert M. Keith |
| | President |
| |
Date: | | December 22, 2011 |
Pursuant to the requirements of the Securities Exchange Act of 1934 and the Investment Company Act of 1940, this report has been signed below by the following persons on behalf of the registrant and in the capacities and on the dates indicated.
| | |
By: | | /s/ Robert M. Keith |
| | Robert M. Keith |
| | President |
| |
Date: | | December 22, 2011 |
| | |
By: | | /s/ Joseph J. Mantineo |
| | Joseph J. Mantineo |
| | Treasurer and Chief Financial Officer |
| |
Date: | | December 22, 2011 |