UNITED STATES
SECURITIES AND EXCHANGE COMMISSION
WASHINGTON, D.C. 20549
FORM N-CSR
CERTIFIED SHAREHOLDER REPORT OF REGISTERED
MANAGEMENT INVESTMENT COMPANIES
Investment Company Act file number: 811-08188
ALLIANCEBERNSTEIN HIGH INCOME FUND, INC.
(Exact name of registrant as specified in charter)
1345 Avenue of the Americas, New York, New York 10105
(Address of principal executive offices) (Zip code)
Joseph J. Mantineo
AllianceBernstein L.P.
1345 Avenue of the Americas
New York, New York 10105
(Name and address of agent for service)
Registrant’s telephone number, including area code: (800) 221-5672
Date of fiscal year end: October 31, 2010
Date of reporting period: October 31, 2010
| ITEM 1. | REPORTS TO STOCKHOLDERS. |
ANNUAL REPORT
AllianceBernstein
High Income Fund

Annual Report
Investment Products Offered
| | • | | Are Not Bank Guaranteed |
The investment return and principal value of an investment in the Fund will fluctuate as the prices of the individual securities in which it invests fluctuate, so that your shares, when redeemed, may be worth more or less than their original cost. You should consider the investment objectives, risks, charges and expenses of the Fund carefully before investing. For a free copy of the Fund’s prospectus, which contains this and other information, visit our web site at www.alliancebernstein.com or call your financial advisor or AllianceBernstein® at (800) 227-4618. Please read the prospectus carefully before you invest.
You may obtain performance information current to the most recent month-end by visiting www.alliancebernstein.com.
This shareholder report must be preceded or accompanied by the Fund’s prospectus for individuals who are not current shareholders of the Fund.
You may obtain a description of the Fund’s proxy voting policies and procedures, and information regarding how the Fund voted proxies relating to portfolio securities during the most recent 12-month period ended June 30, without charge. Simply visit AllianceBernstein’s web site at www.alliancebernstein.com, or go to the Securities and Exchange Commission’s (the “Commission”) web site at www.sec.gov, or call AllianceBernstein at (800) 227-4618.
The Fund files its complete schedule of portfolio holdings with the Commission for the first and third quarters of each fiscal year on Form N-Q. The Fund’s Forms N-Q are available on the Commission’s web site at www.sec.gov. The Fund’s Forms N-Q may also be reviewed and copied at the Commission’s Public Reference Room in Washington, DC; information on the operation of the Public Reference Room may be obtained by calling (800) SEC-0330. AllianceBernstein publishes full portfolio holdings for the Fund monthly at www.alliancebernstein.com.
AllianceBernstein Investments, Inc. (ABI) is the distributor of the AllianceBernstein family of mutual funds. ABI is a member of FINRA and is an affiliate of AllianceBernstein L.P., the manager of the funds.
AllianceBernstein® and the AB Logo are registered trademarks and service marks used by permission of the owner, AllianceBernstein L.P.
December 16, 2010
Annual Report
This report provides management’s discussion of fund performance for AllianceBernstein High Income Fund (the “Fund”) for the annual reporting period ended October 31, 2010.
Investment Objectives and Policies
The Fund’s investment objective is to seek to maximize total returns from price appreciation and income.
The Fund pursues income opportunities from government, corporate, emerging market and high yield sources. It has the flexibility to invest in a broad range of fixed-income securities in both developed and emerging market countries. The Fund’s investments may include US and non-US corporate debt securities and sovereign debt securities. The Fund may invest, without limitation, in either US dollar-denominated or non-US dollar-denominated fixed-income securities.
The Fund may invest in debt securities with a range of maturities from short- to long-term. Substantially all of the Fund’s assets may be invested in lower-rated securities, which may include securities that have the lowest rating for non-subordinated debt instruments (i.e., rated C by Moody’s Investors Service or CCC+ or lower by Standard & Poor’s Rating Service and Fitch Ratings, Ltd.) and unrated securities of equivalent investment quality. The Fund also may invest in investment-grade securities and unrated securities. The Fund may also make short sales of securities or maintain a short position. The Fund is non-diversified, meaning it may invest more of its assets in a fewer number of issuers.
The Fund may invest in mortgage-related and other asset-backed securities, loan participations, inflation-protected securities, structured securities, variable, floating, and inverse floating rate instruments and preferred stock, and may use other investment techniques. The Fund may use borrowings or other leverage for investment purposes. The Fund intends, among other things, to enter into transactions such as reverse repurchase agreements and dollar rolls. The Fund may invest, without limit, in derivatives, such as options, futures, forwards, or swap agreements.
Investment Results
The table on page 5 shows the Fund’s performance compared to its composite benchmark, which is composed of equal weightings of the JPMorgan Emerging Markets Bond Index Global (JPM EMBI Global), the JPM Government Bond Index-Emerging Markets (GBI-EM) (local-currency-denominated) and the Barclays Capital (BC) US Corporate High Yield (HY) 2% Issuer Capped Index for the six- and 12-month periods ended October 31, 2010. Individual performance for each of these indices is also included for both time periods. The Fund is also compared to its broad-based benchmark, the JPM EMBI Global, which tracks total returns for US dollar-denominated debt instruments issued by emerging market sovereign and quasi-sovereign entities.
Class A shares of the Fund outperformed the benchmark for the 12-month reporting period ended
| | | | |
| ALLIANCEBERNSTEIN HIGH INCOME FUND • | | | 1 | |
October 31, 2010, and underperformed for the six-month period ended October 31, 2010, before sales charges. For the 12-month period ended October 31, 2010, the Fund’s overweight to high yield and higher beta holdings (banks and insurance) contributed significantly to the Fund’s outperformance. Overall emerging market country and security selection was also positive with holdings in Argentina, Russia and the Ukraine all contributing positively. Security selection in Brazil detracted. Currency positioning was a positive contributor (long Brazilian real) as was the Fund’s exposure to commercial mortgage-backed securities (CMBS).
Conversely, for the six-month period ended October 31, 2010, the Fund’s overweight to high yield corporates and higher beta corporate holdings (banks and insurance) detracted from performance as risk aversion increased during the second quarter of 2010, due to European sovereign debt and global economic growth sustainability concerns. Most dollar denominated emerging market debt is more sensitive to changes in US Treasury yields than high yield corporate debt, and thus outperformed during the six month period as US rates fell. Within the Fund’s emerging market debt allocation, country decisions remained positive, particularly holdings in Argentina. Within the Fund’s currency exposure, a long position in the Brazilian real contributed positively.
The Fund’s use of leverage contributed positively to relative performance for both the six- and 12-month periods ended October 31, 2010, as
repo rates were favorable and the Fund’s Global Fixed Income Investment Team and Global Credit Investment Team (the “Teams”) were able to reinvest the proceeds into higher yielding securities.
Market Review and Investment Strategy
The global economic recovery continued in 2010 driven by strong gains in emerging-market economies. Import growth in emerging-market economies boomed, acting as an important catalyst in the recovery of industrialized economies. Financial markets followed making fitful progress as credit spreads narrowed. Investors gained confidence from increasing signs that the global economic recovery was continuing to gain momentum.
Concerns over sovereign debt in peripheral Europe and the potential for a double-dip in the U.S. economy however rose in the second quarter dampening market sentiment. Worries about the fiscal position of Greece intensified, causing Greek sovereign bond spreads to sharply widen. These worries spread to other peripheral countries such as Spain and Portugal, while shares of French, German and Spanish banks came under pressure as concerns grew about their exposure to troubled government debt. Downgrades of Greece, Portugal and Spain by the rating agencies added to the anxiety along with renewed concern about Ireland.
Most major fixed income indices posted solid positive returns for the annual period as markets continued to
| | |
| 2 | | • ALLIANCEBERNSTEIN HIGH INCOME FUND |
improve. US dollar-denominated emerging market debt posted a solid return of 17.70% as a global economic recovery firmed. During the 12-month reporting period ended October 31, 2010, Argentina, Brazil, Turkey and Uruguay were all strong performers within the index. Argentina, which returned 41.26% and was the strongest performer, benefited from a strong economy and a credit rating increase which bolstered confidence in South America’s second-biggest economy. US dollar emerging market debt spreads tightened 51 basis points during the annual reporting period to end the year at 283 basis points over duration matched Treasuries. All data is according to the Barclays Indices.
CMBS, which posted some of the worst returns during the financial crisis, continued to rebound posting strong gains. For the annual period under review, CMBS returned 21.63%. The high yield market returned 19.10% with the lower
quality tiers outperforming. By industry, financial related debt, specifically banks and insurance, posted very strong returns for the year. Similar to emerging market debt, high yield spreads tightened 160 basis points from a year ago to end the period at 577 basis points over duration matched Treasuries. Investment-grade corporates also performed well returning 11.61% for the annual reporting period. All data is according to the Barclays Indices.
The Fund continues to overweight high yield securities, maintain an allocation of CMBS and underweight emerging market debt securities.
While the Team remains confident that the global economic recovery, powered by strong growth in emerging market economies should remain on track, a host of uncertainties are likely to keep financial market volatility high.
| | | | |
| ALLIANCEBERNSTEIN HIGH INCOME FUND • | | | 3 | |
HISTORICAL PERFORMANCE
An Important Note About the Value of Historical Performance
The performance shown on the following pages represents past performance and does not guarantee future results. Current performance may be lower or higher than the performance information shown. You may obtain performance information current to the most recent month-end by visiting www.alliancebernstein.com. The investment return and principal value of an investment in the Fund will fluctuate, so that your shares, when redeemed, may be worth more or less than their original cost.
Investors should consider the investment objectives, risks, charges and expenses of the Fund/Portfolio carefully before investing. For copies of our prospectus or summary prospectus, which contain this and other information, visit us online at www.alliancebernstein.com or contact your AllianceBernstein Investments representative. Please read the prospectus and/or summary prospectus carefully before investing.
All fees and expenses related to the operation of the Fund have been deducted. NAV returns do not reflect sales charges; if sales charges were reflected, the Fund’s quoted performance would be lower. SEC returns reflect the applicable sales charges for each share class: a 4.25% maximum front-end sales charge for Class A shares; the applicable contingent deferred sales charge for Class B shares (3% year 1, 2% year 2, 1% year 3, 0% year 4); and a 1% 1-year contingent deferred sales charge for Class C shares. Returns for the different share classes will vary due to different expenses associated with each class. Performance assumes reinvestment of distributions and does not account for taxes.
Benchmark Disclosure
The unmanaged JPMorgan Emerging Markets Bond Index Global (JPM EMBI Global), the JPM Government Bond Index-Emerging Markets (GBI-EM) and the Barclays Capital US Corporate High Yield (HY) 2% Issuer Capped Index do not reflect fees and expenses associated with the active management of a mutual fund portfolio. The unmanaged JPM EMBI Global tracks total returns for US dollar-denominated debt instruments issued by emerging market sovereign and quasi-sovereign entities, including loans and Eurobonds. The JPM GBI-EM is the first comprehensive, global local emerging markets index, and consists of regularly traded, liquid fixed-rate, domestic currency government bonds to which international investors can gain exposure. The Barclays Capital US Corporate HY 2% Issuer Capped Index is the 2% Issuer Cap component of the US Corporate HY Index. The Barclays Capital US Corporate HY Index is an unmanaged index that includes all fixed-income securities having a maximum quality rating of Ba1, a minimum amount outstanding of $150 million, and at least 1 year to maturity. An investor cannot invest directly in an index or average, and their results are not indicative of the performance for any specific investment, including the Fund.
A Word About Risk
A substantial amount of the Fund’s assets will be invested in foreign securities in emerging market nations, which may present market, credit, currency, liquidity, legal, political and other risks different from or greater than the risks of investing in developed foreign countries. Investment in the Fund includes risks not associated with funds that invest exclusively in US issues. The Fund can invest a significant portion of its assets in the securities of a single issuer, making the Fund more susceptible to risks associated with a single economic, political or regulatory occurrence than a more diversified portfolio might be. Price fluctuation in the Fund’s portfolio securities may be caused by changes in interest rates or bond credit quality ratings. Changes in interest rates have a greater effect on bonds with longer maturities than on those with shorter maturities. Please note, as interest rates rise, existing bond prices fall and can cause the value of your investment in the Fund to decline. The Fund may invest in high-yield bonds (i.e., “junk bonds”), which involve a greater risk of default and price volatility than other bonds. Investing in below-investment grade bonds presents special risks, including credit risk. While the Fund invests principally in bonds and other fixed-income securities, in order to achieve its investment objectives, the Fund may at times use certain types of investment derivatives, such as options, futures, forwards and swaps. These instruments involve risks different from, and in certain cases, greater than, the risks presented by more traditional investments. These risks are fully discussed in the Fund’s prospectus.
(Historical Performance continued on next page)
| | |
| 4 | | • ALLIANCEBERNSTEIN HIGH INCOME FUND |
Historical Performance
HISTORICAL PERFORMANCE
(continued from previous page)
| | | | | | | | | | | | |
| | | | | | | | |
THE FUND VS. ITS BENCHMARK PERIODS ENDED OCTOBER 31, 2010 | | NAV Returns | | | | |
| | 6 Months | | | 12 Months | | | | |
AllianceBernstein High Income Fund* | | | | | | | | | | | | |
Class A | | | 7.55% | | | | 20.85% | | | | | |
| | |
Class B** | | | 7.13% | | | | 19.86% | | | | | |
| | |
Class C | | | 7.20% | | | | 19.88% | | | | | |
| | |
Advisor Class† | | | 7.73% | | | | 21.22% | | | | | |
| | |
Class R† | | | 7.56% | | | | 20.62% | | | | | |
| | |
Class K† | | | 7.71% | | | | 20.94% | | | | | |
| | |
Class I† | | | 7.73% | | | | 21.23% | | | | | |
| | |
Composite Benchmark: 33% JPM GBI – EM/33% JPM EMBI Global/33% Barclays Capital US Corporate HY 2% Issuer Capped Index | | | 8.87% | | | | 18.18% | | | | | |
| | |
JPM EMBI Global | | | 10.62% | | | | 17.70% | | | | | |
| | |
JPM GBI – EM | | | 8.88% | | | | 17.19% | | | | | |
| | |
Barclays Capital US Corporate HY 2% Issuer Capped Index | | | 6.73% | | | | 19.10% | | | | | |
| | |
* Includes the impact of proceeds received and credited to the Fund resulting from class action settlements, which enhanced the Fund’s performance for the six- and 12-month period ended October 31, 2010, by 0.05% and 0.15%, respectively. ** Effective January 31, 2009, Class B shares are no longer available for sale to new investors. Please see Note A for additional information. † Please note that these share classes are for investors purchasing shares through accounts established under certain fee-based programs sponsored and maintained by certain broker-dealers and financial intermediaries, institutional pension plans and/or investment advisory clients of and certain other persons associated with, the Adviser and its affiliates or the Funds. Please keep in mind that high, double-digit returns are highly unusual and cannot be sustained. Investors should also be aware that these returns were primarily achieved during favorable market conditions. | |
| | | | | | | | | | | | |
See Historical Performance and Benchmark disclosures on page 4.
(Historical Performance continued on next page)
| | | | |
| ALLIANCEBERNSTEIN HIGH INCOME FUND • | | | 5 | |
Historical Performance
HISTORICAL PERFORMANCE
(continued from previous page)
GROWTH OF A $10,000 INVESTMENT IN THE FUND
12/31/01† TO 10/31/10
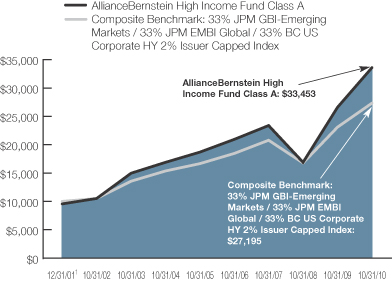
†Prior to 12/31/01, data was not available for the JPM GBI-EM.
This chart illustrates the total value of an assumed $10,000 investment in AllianceBernstein High Income Fund Class A shares (from 12/31/01† to 10/31/10) as compared to the performance of the Fund’s composite benchmark. The chart reflects the deduction of the maximum 4.25% sales charge from the initial $10,000 investment in the Fund and assumes the reinvestment of dividends and capital gains distributions.
Please note: $10,000 investment performance for the Fund compared to the previous benchmark may be found on the following page.
See Historical Performance and Benchmark disclosures on page 4.
(Historical Performance continued on next page)
| | |
| 6 | | • ALLIANCEBERNSTEIN HIGH INCOME FUND |
Historical Performance
HISTORICAL PERFORMANCE
(continued from previous page)
GROWTH OF A $10,000 INVESTMENT IN THE FUND
10/31/00 TO 10/31/10
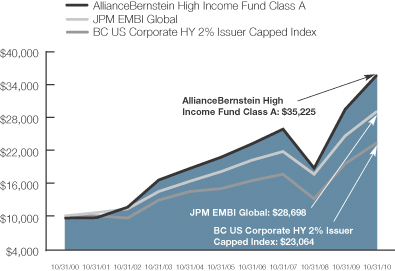
This chart illustrates the total value of an assumed $10,000 investment in AllianceBernstein High Income Fund Class A shares (from 10/31/00 to 10/31/10) as compared to the performance of the JPM EMBI Global and the BC US Corporate High Yield 2% Issuer Capped Index. The chart reflects the deduction of the maximum 4.25% sales charge from the initial $10,000 investment in the Fund and assumes the reinvestment of dividends and capital gains distributions.
See Historical Performance and Benchmark disclosures on page 4.
(Historical Performance continued on next page)
| | | | |
| ALLIANCEBERNSTEIN HIGH INCOME FUND • | | | 7 | |
Historical Performance
HISTORICAL PERFORMANCE
(continued from previous page)
| | | | | | | | | | | | |
| AVERAGE ANNUAL RETURNS AS OF OCTOBER 31, 2010 | |
| | | NAV Returns | | | SEC Returns | | | SEC Yields* | |
| Class A Shares | | | | | | | | | | | 6.65 | % |
1 Year | | | 20.85 | % | | | 15.66 | % | | | | |
5 Years | | | 11.43 | % | | | 10.46 | % | | | | |
10 Years | | | 13.91 | % | | | 13.42 | % | | | | |
| | | | | | | | | | | | |
| Class B Shares | | | | | | | | | | | 6.24 | % |
1 Year | | | 19.86 | % | | | 16.86 | % | | | | |
5 Years | | | 10.56 | % | | | 10.56 | % | | | | |
10 Years(a) | | | 13.38 | % | | | 13.38 | % | | | | |
| | | | | | | | | | | | |
| Class C Shares | | | | | | | | | | | 6.17 | % |
1 Year | | | 19.88 | % | | | 18.88 | % | | | | |
5 Years | | | 10.55 | % | | | 10.55 | % | | | | |
10 Years | | | 13.00 | % | | | 13.00 | % | | | | |
| | | | | | | | | | | | |
| Advisor Class Shares‡ | | | | | | | | | | | 7.23 | % |
1 Year | | | 21.22 | % | | | 21.22 | % | | | | |
Since Inception† | | | 12.94 | % | | | 12.94 | % | | | | |
| | | | | | | | | | | | |
| Class R Shares‡ | | | | | | | | | | | 6.82 | % |
1 Year | | | 20.62 | % | | | 20.62 | % | | | | |
Since Inception† | | | 12.37 | % | | | 12.37 | % | | | | |
| | | | | | | | | | | | |
| Class K Shares‡ | | | | | | | | | | | 7.05 | % |
1 Year | | | 20.94 | % | | | 20.94 | % | | | | |
Since Inception† | | | 12.67 | % | | | 12.67 | % | | | | |
| | | | | | | | | | | | |
| Class I Shares‡ | | | | | | | | | | | 7.22 | % |
1 Year | | | 21.23 | % | | | 21.23 | % | | | | |
Since Inception† | | | 12.96 | % | | | 12.96 | % | | | | |
The Fund’s current prospectus fee table shows the Fund’s total annual operating expense ratios as 1.13%, 1.88%, 1.83%, 0.83%, 1.36%, 1.10% and 0.72% for Class A, Class B, Class C, Advisor, Class R, Class K and Class I shares, respectively, gross of any fee waivers or expense reimbursements. Contractual fee waivers and/or expense reimbursements limit the Fund’s annual operating expense ratios exclusive of interest expense to 0.95%, 1.65%, 1.65%, 0.65%, 1.15%, 0.90%, and 0.65% for Class A, Class B, Class C, Advisor, Class R, Class K and Class I shares, respectively. These waivers/reimbursements extend throughout the Fund’s current fiscal year and may be extended by the Adviser for additional one-year terms. Absent reimbursements or waivers, performance would have been lower. The Financial Highlights section of this report sets forth expense ratio data for the current reporting period; the expense ratios shown above may differ from the expense ratios in the Financial Highlights sections since they are based on different time periods.
| (a) | | Assumes conversion of Class B shares into Class A shares after six years. |
| * | | SEC Yields are calculated based on SEC guidelines for the 30-day period ended October 31, 2010. |
| † | | Inception date: 1/28/08 for Advisor Class, Class R, Class K and Class I shares. |
| ‡ | | These share classes are offered at net asset value (NAV) to eligible investors and their SEC returns are the same as the NAV returns. Please note that these share classes are for investors purchasing shares through accounts established under certain fee-based programs sponsored and maintained by certain broker-dealers and financial intermediaries, institutional pension plans and/or investment advisory clients of, and certain other persons associated with, the Adviser and its affiliates or the Funds. The inception date for these share classes is listed above. |
See Historical Performance disclosures on page 4.
(Historical Performance continued on next page)
| | |
| 8 | | • ALLIANCEBERNSTEIN HIGH INCOME FUND |
Historical Performance
HISTORICAL PERFORMANCE
(continued from previous page)
| | | | | | | | | | | | |
SEC AVERAGE ANNUAL RETURNS (WITH ANY APPLICABLE SALES CHARGES) AS OF THE MOST RECENT CALENDAR QUARTER-END (SEPTEMBER 30, 2010) | |
| | | | | | | | | SEC Returns | |
| | | | | | | | | | | | |
| Class A Shares | | | | | | | | | | | | |
1 Year | | | | | | | | | | | 15.10 | % |
5 Years | | | | | | | | | | | 9.60 | % |
10 Years | | | | | | | | | | | 12.86 | % |
| | | | | | | | | | | | |
| Class B Shares | | | | | | | | | | | | |
1 Year | | | | | | | | | | | 16.48 | % |
5 Years | | | | | | | | | | | 9.70 | % |
10 Years(a) | | | | | | | | | | | 12.80 | % |
| | | | | | | | | | | | |
| Class C Shares | | | | | | | | | | | | |
1 Year | | | | | | | | | | | 18.23 | % |
5 Years | | | | | | | | | | | 9.67 | % |
10 Years | | | | | | | | | | | 12.43 | % |
| | | | | | | | | | | | |
| Advisor Class Shares‡ | | | | | | | | | | | | |
1 Year | | | | | | | | | | | 20.55 | % |
Since Inception† | | | | | | | | | | | 12.37 | % |
| | | | | | | | | | | | |
| Class R Shares‡ | | | | | | | | | | | | |
1 Year | | | | | | | | | | | 19.97 | % |
Since Inception† | | | | | | | | | | | 11.80 | % |
| | | | | | | | | | | | |
| Class K Shares‡ | | | | | | | | | | | | |
1 Year | | | | | | | | | | | 20.28 | % |
Since Inception† | | | | | | | | | | | 12.09 | % |
| | | | | | | | | | | | |
| Class I Shares‡ | | | | | | | | | | | | |
1 Year | | | | | | | | | | | 20.70 | % |
Since Inception† | | | | | | | | | | | 12.39 | % |
| (a) | | Assumes conversion of Class B shares into Class A shares after six years. |
| † | | Inception date: 1/28/08 for Advisor Class, Class R, Class K and Class I shares. |
| ‡ | | Please note that these share classes are for investors purchasing shares through accounts established under certain fee-based programs sponsored and maintained by certain broker-dealers and financial intermediaries, institutional pension plans and/or investment advisory clients of, and certain other persons associated with, the Adviser and its affiliates or the Funds. The inception date for these share classes is listed above. |
See Historical Performance disclosures on page 4.
| | | | |
| ALLIANCEBERNSTEIN HIGH INCOME FUND • | | | 9 | |
Historical Performance
FUND EXPENSES
(unaudited)
As a shareholder of the Fund, you incur two types of costs: (1) transaction costs, including sales charges (loads) on purchase payments, contingent deferred sales charges on redemptions and (2) ongoing costs, including management fees; distribution (12b-1) fees; and other Fund expenses. This example is intended to help you understand your ongoing costs (in dollars) of investing in the Fund and to compare these costs with the ongoing costs of investing in other mutual funds.
The Example is based on an investment of $1,000 invested at the beginning of the period and held for the entire period as indicated below.
Actual Expenses
The first line of the table below provides information about actual account values and actual expenses. You may use the information in this line, together with the amount you invested, to estimate the expenses that you paid over the period. Simply divide your account value by $1,000 (for example, an $8,600 account value divided by $1,000 = 8.6), then multiply the result by the number in the first line under the heading entitled “Expenses Paid During Period” to estimate the expenses you paid on your account during this period.
Hypothetical Example for Comparison Purposes
The second line of the table below provides information about hypothetical account values and hypothetical expenses based on the Fund’s actual expense ratio and an assumed annual rate of return of 5% before expenses, which is not the Fund’s actual return. The hypothetical account values and expenses may not be used to estimate the actual ending account balance or expenses you paid for the period. You may use this information to compare the ongoing costs of investing in the Fund and other funds by comparing this 5% hypothetical example with the 5% hypothetical examples that appear in the shareholder reports of other funds.
| | | | | | | | | | | | | | | | | | | | | | | | |
| | | Beginning
Account Value
May 1, 2010 | | | Ending
Account Value
October 31, 2010 | | | Expenses Paid
During Period* | |
| | | Actual | | | Hypothetical | | | Actual | | | Hypothetical** | | | Actual | | | Hypothetical | |
| Class A | | $ | 1,000 | | | $ | 1,000 | | | $ | 1,075.45 | | | $ | 1,020.21 | | | $ | 5.18 | | | $ | 5.04 | |
| Class B | | $ | 1,000 | | | $ | 1,000 | | | $ | 1,071.29 | | | $ | 1,016.64 | | | $ | 8.88 | | | $ | 8.64 | |
| Class C | | $ | 1,000 | | | $ | 1,000 | | | $ | 1,071.99 | | | $ | 1,016.69 | | | $ | 8.83 | | | $ | 8.59 | |
| Advisor Class | | $ | 1,000 | | | $ | 1,000 | | | $ | 1,077.28 | | | $ | 1,021.78 | | | $ | 3.56 | | | $ | 3.47 | |
| Class R | | $ | 1,000 | | | $ | 1,000 | | | $ | 1,075.62 | | | $ | 1,019.26 | | | $ | 6.17 | | | $ | 6.01 | |
| Class K | | $ | 1,000 | | | $ | 1,000 | | | $ | 1,077.13 | | | $ | 1,020.42 | | | $ | 4.97 | | | $ | 4.84 | |
| Class I | | $ | 1,000 | | | $ | 1,000 | | | $ | 1,077.30 | | | $ | 1,021.83 | | | $ | 3.51 | | | $ | 3.41 | |
| * | | Expenses are equal to the classes’ annualized expense ratios of 0.99%, 1.70%, 1.69%, 0.68%, 1.18%, 0.95% and 0.67%, respectively, multiplied by the average account value over the period, multiplied by 184/365 (to reflect the one-half year period). |
| ** | | Assumes 5% return before expenses. |
| | |
| 10 | | • ALLIANCEBERNSTEIN HIGH INCOME FUND |
Fund Expenses
PORTFOLIO SUMMARY
October 31, 2010 (unaudited)
PORTFOLIO STATISTICS
Net Assets ($mill): $2,326.0
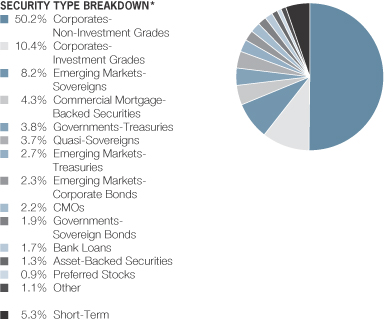
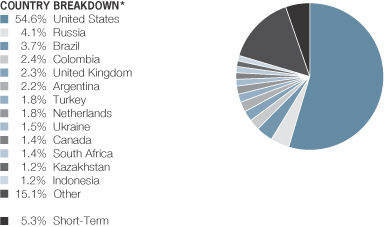
| * | | All data are as of October 31, 2010. The Fund’s security type and country breakdowns are expressed as a percentage of total investments and may vary over time. The Fund also enters into derivative transactions, which may be used for hedging or investment purposes (see “Portfolio of Investments” section of the report for additional details). “Other” |
| | | | |
| ALLIANCEBERNSTEIN HIGH INCOME FUND • | | | 11 | |
Portfolio Summary
PORTFOLIO SUMMARY
October 31, 2010 (unaudited)
| | securities type weightings represents 0.4% or less in the following security types: Supranationals, Local Governments—Regional Bonds, Local Governments—Municipal Bonds, Inflation-Linked Securities, Common Stocks, Warrants and Option Purchased—Call. “Other” country weightings represent 1.0% or less in the following countries: Australia, Austria, Barbados, Belgium, Cayman Islands, Chile, China, Cote D’Ivoire, Croatia, Czech Republic, Denmark, Dominican Republic, Egypt, El Salvador, France, Gabon, Germany, Ghana, Greece, Hong Kong, Hungary, Iceland, India, Ireland, Italy, Jamaica, Japan, Lithuania, Luxembourg, Norway, Panama, Peru, Philippines, Poland, Serbia & Montenegro, Singapore, Spain, Supranational, Sweden, Switzerland, Trinidad & Tobago, Uruguay and Venezuela. |
| | |
| 12 | | • ALLIANCEBERNSTEIN HIGH INCOME FUND |
Portfolio Summary
PORTFOLIO OF INVESTMENTS
October 31, 2010
| | | | | | | | | | | | |
| | | | | | Principal
Amount
(000) | | | U.S. $ Value | |
| | |
| | | | | | | | | | | | |
CORPORATES - NON-INVESTMENT GRADES – 53.2% | | | | | | | | | | | | |
Industrial – 45.4% | | | | | | | | | | | | |
Basic – 6.0% | | | | | | | | | | | | |
AK Steel Corp.
7.625%, 5/15/20 | | | U.S.$ | | | | 3,564 | | | $ | 3,711,015 | |
Algoma Acquisition Corp.
9.875%, 6/15/15(a) | | | | | | | 4,780 | | | | 4,397,600 | |
Appleton Papers, Inc.
10.50%, 6/15/15(a) | | | | | | | 2,150 | | | | 2,074,750 | |
Arch Western Finance LLC
6.75%, 7/01/13 | | | | | | | 304 | | | | 307,040 | |
Boise Paper Holdings LLC/Boise
Finance Co. | | | | | | | | | | | | |
9.00%, 11/01/17 | | | | | | | 1,410 | | | | 1,536,900 | |
Celanese US Holdings LLC
6.625%, 10/15/18(a) | | | | | | | 644 | | | | 684,250 | |
CF Industries, Inc.
6.875%, 5/01/18 | | | | | | | 1,100 | | | | 1,254,000 | |
7.125%, 5/01/20 | | | | | | | 1,100 | | | | 1,276,000 | |
Consol Energy, Inc.
8.25%, 4/01/20(a) | | | | | | | 3,000 | | | | 3,345,000 | |
Drummond Co., Inc.
7.375%, 2/15/16 | | | | | | | 1,450 | | | | 1,493,500 | |
Evraz Group SA
8.25%, 11/10/15(a) | | | | | | | 1,289 | | | | 1,372,785 | |
9.50%, 4/24/18(a) | | | | | | | 5,066 | | | | 5,711,915 | |
FMG Resources August 2006 Pty Ltd.
7.00%, 11/01/15(a) | | | | | | | 2,000 | | | | 2,042,500 | |
Georgia Gulf Corp.
10.75%, 10/15/16 | | | | | | | 1,500 | | | | 1,590,000 | |
Georgia-Pacific LLC
7.00%, 1/15/15(a) | | | | | | | 433 | | | | 451,944 | |
7.125%, 1/15/17(a) | | | | | | | 517 | | | | 555,775 | |
8.875%, 5/15/31 | | | | | | | 2,000 | | | | 2,505,000 | |
Graphic Packaging International, Inc.
7.875%, 10/01/18 | | | | | | | 2,000 | | | | 2,115,000 | |
9.50%, 6/15/17 | | | | | | | 480 | | | | 529,200 | |
Hexion US Finance Corp./Hexion Nova Scotia Finance ULC
4.876%, 11/15/14(b) | | | | | | | 2,615 | | | | 2,510,400 | |
8.875%, 2/01/18 | | | | | | | 1,393 | | | | 1,495,734 | |
9.75%, 11/15/14 | | | | | | | 515 | | | | 542,038 | |
Huntsman International LLC
8.625%, 3/15/21(a) | | | | | | | 3,900 | | | | 4,275,375 | |
Ineos Group Holdings PLC
8.50%, 2/15/16(a) | | | | | | | 9,341 | | | | 8,500,310 | |
Kerling PLC
10.625%, 2/01/17(a) | | | EUR | | | | 3,650 | | | | 5,397,574 | |
| | | | |
| ALLIANCEBERNSTEIN HIGH INCOME FUND • | | | 13 | |
Portfolio of Investments
| | | | | | | | | | | | |
| | | | | | Principal
Amount
(000) | | | U.S. $ Value | |
| | |
| | | | | | | | | | | | |
Kronos International, Inc.
6.50%, 4/15/13 | | | EUR | | | | 2,175 | | | $ | 3,019,597 | |
LBI Escrow Corp.
8.00%, 11/01/17(a) | | | U.S.$ | | | | 1,200 | | | | 1,314,000 | |
Lecta SA
4.899%, 2/15/14(a)(b) | | | EUR | | | | 903 | | | | 1,168,820 | |
Lyondell Chemical Co.
11.00%, 5/01/18 | | | U.S.$ | | | | 3,100 | | | | 3,472,000 | |
MacDermid, Inc.
9.50%, 4/15/17(a) | | | | | | | 3,315 | | | | 3,538,762 | |
Momentive Performance Materials, Inc.
10.125%, 12/01/14(c) | | | | | | | 927 | | | | 976,747 | |
11.50%, 12/01/16 | | | | | | | 1,300 | | | | 1,407,250 | |
New Enterprise Stone & Lime Co.
11.00%, 9/01/18(a) | | | | | | | 3,700 | | | | 3,533,500 | |
NewMarket Corp.
7.125%, 12/15/16 | | | | | | | 1,074 | | | | 1,095,480 | |
NewPage Corp.
10.00%, 5/01/12 | | | | | | | 1,120 | | | | 712,600 | |
11.375%, 12/31/14 | | | | | | | 2,800 | | | | 2,688,000 | |
Norske Skogindustrier ASA
7.00%, 6/26/17 | | | EUR | | | | 2,150 | | | | 2,319,087 | |
Nova Chemicals Corp.
8.625%, 11/01/19 | | | U.S.$ | | | | 2,383 | | | | 2,645,130 | |
Novelis, Inc.
7.25%, 2/15/15 | | | | | | | 2,870 | | | | 2,959,687 | |
Omnova Solutions, Inc.
7.875%, 11/01/18(a) | | | | | | | 788 | | | | 805,730 | |
Peabody Energy Corp.
7.875%, 11/01/26 | | | | | | | 50 | | | | 56,500 | |
Rhodia SA
3.735%, 10/15/13(a)(b) | | | EUR | | | | 835 | | | | 1,158,793 | |
6.875%, 9/15/20(a) | | | U.S.$ | | | | 1,848 | | | | 1,942,710 | |
Smurfit Kappa Acquisitions
7.75%, 11/15/19(a) | | | EUR | | | | 2,690 | | | | 3,977,938 | |
Solutia, Inc.
7.875%, 3/15/20 | | | U.S.$ | | | | 1,415 | | | | 1,561,806 | |
Steel Capital SA for OAO Severstal
9.25%, 4/19/14(a) | | | | | | | 1,570 | | | | 1,742,700 | |
9.75%, 7/29/13(a) | | | | | | | 7,028 | | | | 7,774,374 | |
Steel Dynamics, Inc.
6.75%, 4/01/15 | | | | | | | 675 | | | | 699,469 | |
7.625%, 3/15/20(a) | | | | | | | 1,500 | | | | 1,608,750 | |
7.75%, 4/15/16 | | | | | | | 910 | | | | 971,425 | |
Tpc Group LLC
8.25%, 10/01/17(a) | | | | | | | 2,573 | | | | 2,733,813 | |
Tube City IMS Corp.
9.75%, 2/01/15 | | | | | | | 2,000 | | | | 2,082,500 | |
| | |
| 14 | | • ALLIANCEBERNSTEIN HIGH INCOME FUND |
Portfolio of Investments
| | | | | | | | | | | | |
| | | | | | Principal
Amount
(000) | | | U.S. $ Value | |
| | |
| | | | | | | | | | | | |
United States Steel Corp.
6.65%, 6/01/37 | | | U.S.$ | | | | 4,900 | | | $ | 4,348,750 | |
Vedanta Resources PLC
8.75%, 1/15/14(a) | | | | | | | 4,299 | | | | 4,607,668 | |
9.50%, 7/18/18(a) | | | | | | | 1,900 | | | | 2,041,930 | |
Verso Paper Holdings LLC/Verso Paper, Inc.
Series B
11.375%, 8/01/16(d) | | | | | | | 3,748 | | | | 3,607,450 | |
Westvaco Corp.
8.20%, 1/15/30 | | | | | | | 2,940 | | | | 3,186,710 | |
Weyerhaeuser Co.
7.375%, 3/15/32 | | | | | | | 3,308 | | | | 3,354,401 | |
8.50%, 1/15/25 | | | | | | | 1,000 | | | | 1,101,203 | |
| | | | | | | | | | | | |
| | | | | | | | | | | 139,890,885 | |
| | | | | | | | | | | | |
Capital Goods – 5.3% | | | | | | | | | | | | |
Alion Science and Technology Corp.
10.25%, 2/01/15 | | | | | | | 2,313 | | | | 1,691,381 | |
Series 1
12.00%, 11/01/14 | | | | | | | 1,051 | | | | 1,068,054 | |
Alliant Techsystems, Inc.
6.875%, 9/15/20 | | | | | | | 760 | | | | 799,900 | |
AMH Holdings, Inc.
11.25%, 3/01/14 | | | | | | | 2,526 | | | | 2,623,251 | |
Ardagh Glass Finance PLC
8.75%, 2/01/20(a) | | | EUR | | | | 2,050 | | | | 2,831,791 | |
9.25%, 7/01/16(a) | | | | | | | 497 | | | | 753,980 | |
Ardagh Packaging Finance
7.375%, 10/15/17(a) | | | U.S.$ | | | | 350 | | | | 371,000 | |
Associated Materials LLC
9.125%, 11/01/17(a) | | | | | | | 1,444 | | | | 1,516,200 | |
BE Aerospace, Inc.
6.875%, 10/01/20 | | | | | | | 2,000 | | | | 2,125,000 | |
Berry Plastics Corp.
8.875%, 9/15/14 | | | | | | | 3,954 | | | | 4,023,196 | |
10.25%, 3/01/16 | | | | | | | 672 | | | | 639,240 | |
Bombardier, Inc.
7.75%, 3/15/20(a) | | | | | | | 1,408 | | | | 1,562,880 | |
8.00%, 11/15/14(a) | | | | | | | 2,260 | | | | 2,361,700 | |
Building Materials Corp. of America
6.875%, 8/15/18(a) | | | | | | | 1,540 | | | | 1,540,000 | |
7.00%, 2/15/20(a) | | | | | | | 985 | | | | 1,026,863 | |
7.50%, 3/15/20(a) | | | | | | | 1,898 | | | | 1,940,705 | |
Case New Holland, Inc.
7.875%, 12/01/17(a) | | | | | | | 1,858 | | | | 2,076,315 | |
Clondalkin Industries BV
8.00%, 3/15/14(a) | | | EUR | | | | 3,449 | | | | 4,632,307 | |
| | | | |
| ALLIANCEBERNSTEIN HIGH INCOME FUND • | | | 15 | |
Portfolio of Investments
| | | | | | | | | | | | |
| | | | | | Principal
Amount
(000) | | | U.S. $ Value | |
| | |
| | | | | | | | | | | | |
CNH America LLC
7.25%, 1/15/16 | | | U.S.$ | | | | 997 | | | $ | 1,086,730 | |
Crown European Holdings SA
7.125%, 8/15/18(a) | | | EUR | | | | 1,295 | | | | 1,883,488 | |
Goodman Global Group, Inc. Zero Coupon,
12/15/14 | | | U.S.$ | | | | 3,733 | | | | 2,403,119 | |
Graham Packaging Co. LP/GPC Capital Corp. I
8.25%, 1/01/17-10/01/18(a) | | | | | | | 2,192 | | | | 2,270,450 | |
Grohe Holding GMBH
8.625%, 10/01/14(a)(d) | | | EUR | | | | 3,505 | | | | 4,991,678 | |
HeidelbergCement AG
8.50%, 10/31/19 | | | | | | | 2,420 | | | | 3,679,946 | |
IFCO Systems NV
10.00%, 6/30/16(a) | | | | | | | 1,000 | | | | 1,572,734 | |
Impress Holdings BV
9.25%, 9/15/14(a) | | | | | | | 2,000 | | | | 2,922,780 | |
L-3 Communications Corp.
5.875%, 1/15/15 | | | U.S.$ | | | | 800 | | | | 816,000 | |
Manitowoc Co., Inc. (The)
8.50%, 11/01/20 | | | | | | | 3,750 | | | | 3,914,062 | |
9.50%, 2/15/18 | | | | | | | 216 | | | | 232,470 | |
Masco Corp.
6.125%, 10/03/16 | | | | | | | 2,315 | | | | 2,370,338 | |
Nordenia International AG
9.75%, 7/15/17 | | | EUR | | | | 1,652 | | | | 2,503,312 | |
Obrascon Huarte Lain SA
7.375%, 4/28/15 | | | | | | | 2,550 | | | | 3,531,699 | |
OI European Group BV
6.75%, 9/15/20(a) | | | | | | | 1,500 | | | | 2,113,796 | |
6.875%, 3/31/17(a) | | | | | | | 1,000 | | | | 1,426,595 | |
Owens-Brockway Glass Container, Inc.
6.75%, 12/01/14 | | | U.S.$ | | | | 830 | | | | 848,675 | |
Plastipak Holdings, Inc.
8.50%, 12/15/15(a) | | | | | | | 3,733 | | | | 3,844,990 | |
Ply Gem Industries, Inc.
11.75%, 6/15/13 | | | | | | | 3,800 | | | | 4,080,250 | |
Pregis Corp.
5.985%, 4/15/13(b) | | | EUR | | | | 1,435 | | | | 1,887,385 | |
RBS Global, Inc./Rexnord LLC
8.50%, 5/01/18 | | | U.S.$ | | | | 3,000 | | | | 3,150,000 | |
11.75%, 8/01/16 | | | | | | | 1,324 | | | | 1,423,300 | |
Rexam PLC
6.75%, 6/29/67 | | | EUR | | | | 2,660 | | | | 3,549,399 | |
Reynolds Group Issuer, Inc./Reynolds Group Issuer LLC/Reynolds Group Issuer Lu
7.125%, 4/15/19(a) | | | U.S.$ | | | | 712 | | | | 742,260 | |
| | |
| 16 | | • ALLIANCEBERNSTEIN HIGH INCOME FUND |
Portfolio of Investments
| | | | | | | | | | | | |
| | | | | | Principal
Amount
(000) | | | U.S. $ Value | |
| | |
| | | | | | | | | | | | |
8.50%, 5/15/18(a) | | | U.S.$ | | | | 3,300 | | | $ | 3,374,250 | |
9.00%, 4/15/19(a) | | | | | | | 638 | | | | 662,723 | |
RSC Equipment Rental Inc/RSC Holdings III LLC
9.50%, 12/01/14 | | | | | | | 2,000 | | | | 2,087,500 | |
10.25%, 11/15/19 | | | | | | | 2,000 | | | | 2,175,000 | |
Sequa Corp.
11.75%, 12/01/15(a) | | | | | | | 4,045 | | | | 4,368,600 | |
Terex Corp.
8.00%, 11/15/17 | | | | | | | 5,056 | | | | 5,043,360 | |
Textron Financial Corp.
5.40%, 4/28/13 | | | | | | | 1,037 | | | | 1,089,755 | |
6.00%, 2/15/67(a) | | | | | | | 125 | | | | 98,750 | |
TransDigm, Inc.
7.75%, 7/15/14 | | | | | | | 120 | | | | 123,300 | |
United Rentals North America, Inc.
7.75%, 11/15/13(d) | | | | | | | 4,050 | | | | 4,095,562 | |
8.375%, 9/15/20 | | | | | | | 4,050 | | | | 4,110,750 | |
10.875%, 6/15/16 | | | | | | | 1,000 | | | | 1,140,000 | |
Wienerberger AG
6.50%, 12/31/49 | | | EUR | | | | 2,900 | | | | 3,299,610 | |
| | | | | | | | | | | | |
| | | | | | | | | | | 122,498,379 | |
| | | | | | | | | | | | |
Communications - Media – 5.4% | | | | | | | | | | | | |
Allbritton Communications Co.
8.00%, 5/15/18 | | | U.S.$ | | | | 5,115 | | | | 5,281,237 | |
American Media Operations, Inc.
14.00%, 11/01/13(a)(c) | | | | | | | 649 | | | | 422,817 | |
Cablevision Systems Corp.
8.00%, 4/15/20 | | | | | | | 1,000 | | | | 1,106,250 | |
CCH II LLC/CCH II Capital Corp.
13.50%, 11/30/16 | | | | | | | 2,000 | | | | 2,395,000 | |
CCO Holdings LLC/CCO Holdings Capital Corp.
7.25%, 10/30/17(a) | | | | | | | 2,250 | | | | 2,323,125 | |
Cengage Learning Acquisitions, Inc.
10.50%, 1/15/15(a) | | | | | | | 4,385 | | | | 4,538,475 | |
Central European Media Enterprises Ltd.
11.625%, 9/15/16(a) | | | EUR | | | | 3,520 | | | | 4,886,888 | |
CET 21 spol sro
9.00%, 11/01/17(a) | | | | | | | 121 | | | | 172,635 | |
Charter Communications Operating LLC/Charter Communications Operating Capital
8.00%, 4/30/12(a) | | | U.S.$ | | | | 1,275 | | | | 1,356,281 | |
Clear Channel Communications, Inc.
5.50%, 9/15/14 | | | | | | | 5,205 | | | | 3,578,437 | |
5.75%, 1/15/13 | | | | | | | 3,288 | | | | 2,959,200 | |
| | | | |
| ALLIANCEBERNSTEIN HIGH INCOME FUND • | | | 17 | |
Portfolio of Investments
| | | | | | | | | | | | |
| | | | | | Principal
Amount
(000) | | | U.S. $ Value | |
| | |
| | | | | | | | | | | | |
Clear Channel Worldwide Holdings, Inc.
9.25%, 12/15/17 | | | U.S.$ | | | | 323 | | | $ | 352,065 | |
Columbus International, Inc.
11.50%, 11/20/14(a) | | | | | | | 6,622 | | | | 7,424,917 | |
CSC Holdings LLC
6.75%, 4/15/12 | | | | | | | 190 | | | | 198,788 | |
7.875%, 2/15/18 | | | | | | | 2,212 | | | | 2,471,910 | |
Dex One Corp.
12.00%, 1/29/17 | | | | | | | 4,048 | | | | 3,046,390 | |
DISH DBS Corp.
7.125%, 2/01/16 | | | | | | | 1,250 | | | | 1,325,000 | |
European Media Capital SA
10.00%, 2/01/15(c)(e)(f) | | | | | | | 537 | | | | 354,200 | |
Hughes Network Systems LLC/HNS Finance Corp.
9.50%, 4/15/14 | | | | | | | 1,950 | | | | 2,032,875 | |
Intelsat Jackson Holdings SA
7.25%, 10/15/20(a) | | | | | | | 2,125 | | | | 2,172,813 | |
11.25%, 6/15/16 | | | | | | | 2,472 | | | | 2,691,390 | |
Intelsat Luxembourg SA
11.25%, 2/04/17 | | | | | | | 3,200 | | | | 3,428,000 | |
Lamar Media Corp.
6.625%, 8/15/15 | | | | | | | 3,941 | | | | 4,044,451 | |
Liberty Media LLC
5.70%, 5/15/13 | | | | | | | 1,145 | | | | 1,177,919 | |
LIN Television Corp.
6.50%, 5/15/13 | | | | | | | 3,050 | | | | 3,080,500 | |
8.375%, 4/15/18 | | | | | | | 1,000 | | | | 1,071,250 | |
Local TV Finance LLC
9.25%, 6/15/15(a) | | | | | | | 3,200 | | | | 2,872,000 | |
McClatchy Co. (The)
11.50%, 2/15/17 | | | | | | | 3,600 | | | | 3,856,500 | |
Nexstar Broadcasting, Inc./Mission Broadcasting, Inc.
8.875%, 4/15/17(a) | | | | | | | 2,021 | | | | 2,142,260 | |
Nielsen Finance LLC/Nielsen Finance Co.
12.50%, 8/01/16(g) | | | | | | | 5,325 | | | | 5,424,844 | |
Quebecor Media, Inc.
7.75%, 3/15/16 | | | | | | | 4,452 | | | | 4,646,775 | |
Rainbow National Services LLC
8.75%, 9/01/12(a) | | | | | | | 250 | | | | 251,563 | |
10.375%, 9/01/14(a) | | | | | | | 1,458 | | | | 1,518,143 | |
Seat Pagine Gialle SpA
10.50%, 1/31/17(a) | | | EUR | | | | 2,600 | | | | 3,298,218 | |
Sinclair Television Group, Inc.
8.375%, 10/15/18(a) | | | U.S.$ | | | | 1,100 | | | | 1,144,000 | |
9.25%, 11/01/17(a) | | | | | | | 2,975 | | | | 3,272,500 | |
Sirius XM Radio, Inc.
8.75%, 4/01/15(a) | | | | | | | 3,500 | | | | 3,775,625 | |
| | |
| 18 | | • ALLIANCEBERNSTEIN HIGH INCOME FUND |
Portfolio of Investments
| | | | | | | | | | | | |
| | | | | | Principal
Amount
(000) | | | U.S. $ Value | |
| | |
| | | | | | | | | | | | |
Technicolor
5.75%, 12/31/49(h)(i) | | | EUR | | | | 925 | | | $ | 6,437 | |
Telesat Canada/Telesat LLC
11.00%, 11/01/15 | | | U.S.$ | | | | 1,600 | | | | 1,796,000 | |
Truvo Subsidiary Corp.
8.375%, 12/01/14(f)(i) | | | | | | | 1,283 | | | | 57,735 | |
Umbrella Acquisition, Inc.
9.75%, 3/15/15(a)(c) | | | | | | | 4,160 | | | | 4,414,806 | |
Univision Communications, Inc.
12.00%, 7/01/14(a) | | | | | | | 1,580 | | | | 1,747,875 | |
UPC Holding BV
8.375%, 8/15/20(a) | | | EUR | | | | 3,000 | | | | 4,217,154 | |
UPCB Finance Ltd.
7.625%, 1/15/20(a) | | | | | | | 1,600 | | | | 2,327,090 | |
Valassis Communications, Inc.
8.25%, 3/01/15 | | | U.S.$ | | | | 761 | | | | 800,001 | |
Virgin Media Finance PLC
8.375%, 10/15/19 | | | | | | | 3,950 | | | | 4,404,250 | |
WMG Holdings Corp.
9.50%, 12/15/14(d) | | | | | | | 3,918 | | | | 3,722,100 | |
XM Satellite Radio, Inc.
7.625%, 11/01/18(a) | | | | | | | 545 | | | | 559,988 | |
Ziggo Bond Co. BV
8.00%, 5/15/18(a) | | | EUR | | | | 3,650 | | | | 5,257,872 | |
| | | | | | | | | | | | |
| | | | | | | | | | | 125,406,549 | |
| | | | | | | | | | | | |
Communications - Telecommunications – 3.0% | | | | | | | | | | | | |
Cincinnati Bell, Inc.
8.25%, 10/15/17 | | | U.S.$ | | | | 750 | | | | 761,250 | |
8.75%, 3/15/18 | | | | | | | 3,650 | | | | 3,531,375 | |
Clearwire Communications LLC/Clearwire
Finance, Inc.
12.00%, 12/01/15(a) | | | | | | | 6,124 | | | | 6,797,640 | |
Cricket Communications, Inc.
9.375%, 11/01/14(d) | | | | | | | 4,482 | | | | 4,694,895 | |
10.00%, 7/15/15(d) | | | | | | | 1,500 | | | | 1,642,500 | |
Crown Castle International Corp.
7.125%, 11/01/19 | | | | | | | 2,500 | | | | 2,750,000 | |
Digicel Group Ltd.
10.50%, 4/15/18(a) | | | | | | | 3,241 | | | | 3,569,151 | |
Digicel Ltd.
12.00%, 4/01/14(a) | | | | | | | 660 | | | | 773,025 | |
ERC Ireland Finance Ltd.
5.899%, 8/15/16(a)(b) | | | EUR | | | | 1,000 | | | | 786,367 | |
Fairpoint Communications, Inc.
Series 1
13.125%, 4/02/18(i) | | | U.S.$ | | | | 1,048 | | | | 75,997 | |
| | | | |
| ALLIANCEBERNSTEIN HIGH INCOME FUND • | | | 19 | |
Portfolio of Investments
| | | | | | | | | | | | |
| | | | | | Principal
Amount
(000) | | | U.S. $ Value | |
| | |
| | | | | | | | | | | | |
Frontier Communications Corp.
6.25%, 1/15/13 | | | U.S.$ | | | | 1,222 | | | $ | 1,295,320 | |
8.125%, 10/01/18 | | | | | | | 500 | | | | 570,000 | |
9.00%, 8/15/31 | | | | | | | 1,600 | | | | 1,784,000 | |
Level 3 Financing, Inc.
8.75%, 2/15/17 | | | | | | | 3,220 | | | | 2,950,325 | |
9.25%, 11/01/14 | | | | | | | 878 | | | | 860,440 | |
10.00%, 2/01/18 | | | | | | | 2,200 | | | | 2,106,500 | |
MetroPCS Wireless, Inc.
7.875%, 9/01/18 | | | | | | | 3,000 | | | | 3,217,500 | |
9.25%, 11/01/14 | | | | | | | 2,040 | | | | 2,136,900 | |
Mobile Satellite Ventures LP
14.00%, 4/01/13(a) | | | | | | | 1,000 | | | | 1,070,000 | |
Pacnet Ltd.
9.25%, 11/09/15(a) | | | | | | | 2,452 | | | | 2,452,000 | |
Sprint Capital Corp.
6.875%, 11/15/28 | | | | | | | 3,000 | | | | 2,827,500 | |
Sunrise Communications Holdings SA
8.50%, 12/31/18(a) | | | EUR | | | | 2,500 | | | | 3,601,282 | |
Terrestar Networks, Inc.
15.00%, 2/15/14(a)(c)(i) | | | U.S.$ | | | | 2,086 | | | | 2,096,239 | |
TW telecom holdings, Inc
8.00%, 3/01/18 | | | | | | | 3,824 | | | | 4,129,920 | |
Vimpel Communications Via VIP Finance
Ireland Ltd. OJSC
9.125%, 4/30/18(a) | | | | | | | 3,250 | | | | 3,680,625 | |
Wind Acquisition Finance SA
11.75%, 7/15/17(a) | | | | | | | 4,400 | | | | 5,010,000 | |
Windstream Corp.
8.125%, 8/01/13 | | | | | | | 1,827 | | | | 2,011,984 | |
8.125%, 9/01/18(a) | | | | | | | 825 | | | | 888,938 | |
8.625%, 8/01/16 | | | | | | | 2,394 | | | | 2,543,625 | |
| | | | | | | | | | | | |
| | | | | | | | | | | 70,615,298 | |
| | | | | | | | | | | | |
Consumer Cyclical -
Automotive – 2.2% | | | | | | | | | | | | |
Affinia Group, Inc.
9.00%, 11/30/14 | | | | | | | 2,350 | | | | 2,423,437 | |
Allison Transmission, Inc.
11.00%, 11/01/15(a) | | | | | | | 2,700 | | | | 2,929,500 | |
American Axle & Manufacturing Holdings, Inc.
9.25%, 1/15/17(a) | | | | | | | 3,196 | | | | 3,623,465 | |
ArvinMeritor, Inc.
8.125%, 9/15/15 | | | | | | | 4,525 | | | | 4,717,312 | |
Cooper Tire & Rubber Co.
8.00%, 12/15/19 | | | | | | | 3,000 | | | | 3,112,500 | |
Cooper-Standard Automotive, Inc.
8.50%, 5/01/18(a) | | | | | | | 3,400 | | | | 3,642,250 | |
| | |
| 20 | | • ALLIANCEBERNSTEIN HIGH INCOME FUND |
Portfolio of Investments
| | | | | | | | | | | | |
| | | | | | Principal
Amount
(000) | | | U.S. $ Value | |
| | |
| | | | | | | | | | | | |
Ford Motor Co.
7.45%, 7/16/31(d) | | | U.S.$ | | | | 4,000 | | | $ | 4,540,000 | |
Ford Motor Credit Co. LLC
3.039%, 1/13/12(b) | | | | | | | 640 | | | | 645,632 | |
7.00%, 10/01/13 | | | | | | | 974 | | | | 1,062,412 | |
8.00%, 12/15/16 | | | | | | | 2,650 | | | | 3,101,889 | |
Goodyear Tire & Rubber Co. (The)
7.00%, 3/15/28 | | | | | | | 700 | | | | 675,500 | |
8.75%, 8/15/20 | | | | | | | 1,250 | | | | 1,368,750 | |
10.50%, 5/15/16 | | | | | | | 1,300 | | | | 1,488,500 | |
Keystone Automotive Operations, Inc.
9.75%, 11/01/13(h) | | | | | | | 986 | | | | 438,770 | |
Lear Corp.
7.875%, 3/15/18 | | | | | | | 1,500 | | | | 1,631,250 | |
8.125%, 3/15/20 | | | | | | | 2,000 | | | | 2,225,000 | |
Navistar International Corp.
8.25%, 11/01/21 | | | | | | | 4,180 | | | | 4,582,325 | |
Tenneco, Inc.
7.75%, 8/15/18(a) | | | | | | | 1,143 | | | | 1,220,153 | |
8.625%, 11/15/14 | | | | | | | 2,600 | | | | 2,691,000 | |
Tower Automotive Holdings USA LLC/TA
Holdings Finance, Inc.
10.625%, 9/01/17(a) | | | | | | | 4,233 | | | | 4,444,650 | |
| | | | | | | | | | | | |
| | | | | | | | | | | 50,564,295 | |
| | | | | | | | | | | | |
Consumer Cyclical -
Entertainment – 0.5% | | | | | | | | | | | | |
AMC Entertainment, Inc.
11.00%, 2/01/16 | | | | | | | 2,325 | | | | 2,479,031 | |
Pinnacle Entertainment, Inc.
7.50%, 6/15/15 | | | | | | | 4,050 | | | | 4,029,750 | |
8.625%, 8/01/17 | | | | | | | 500 | | | | 538,750 | |
8.75%, 5/15/20 | | | | | | | 1,000 | | | | 998,750 | |
Regal Entertainment Group
9.125%, 8/15/18 | | | | | | | 2,605 | | | | 2,771,069 | |
WMG Acquisition Corp.
9.50%, 6/15/16 | | | | | | | 1,400 | | | | 1,508,500 | |
| | | | | | | | | | | | |
| | | | | | | | | | | 12,325,850 | |
| | | | | | | | | | | | |
Consumer Cyclical - Other – 4.3% | | | | | | | | | | | | |
AMC Entertainment Inc
8.00%, 3/01/14 | | | | | | | 1,000 | | | | 1,010,000 | |
Beazer Homes USA, Inc.
6.875%, 7/15/15 | | | | | | | 1,000 | | | | 943,750 | |
12.00%, 10/15/17 | | | | | | | 860 | | | | 997,063 | |
Boyd Gaming Corp.
6.75%, 4/15/14 | | | | | | | 925 | | | | 894,938 | |
7.125%, 2/01/16 | | | | | | | 3,400 | | | | 3,026,000 | |
7.75%, 12/15/12(d) | | | | | | | 1,200 | | | | 1,206,000 | |
| | | | |
| ALLIANCEBERNSTEIN HIGH INCOME FUND • | | | 21 | |
Portfolio of Investments
| | | | | | | | | | | | |
| | | | | | Principal
Amount
(000) | | | U.S. $ Value | |
| | |
| | | | | | | | | | | | |
Broder Brothers Co.
12.00%, 10/15/13(c)(f) | | | U.S.$ | | | | 331 | | | $ | 281,114 | |
Chukchansi Economic Development Authority
8.00%, 11/15/13(a) | | | | | | | 2,075 | | | | 1,328,000 | |
Country Garden Holdings Co.
11.25%, 4/22/17(a) | | | | | | | 1,000 | | | | 1,075,100 | |
DR Horton, Inc.
6.00%, 4/15/11 | | | | | | | 1,756 | | | | 1,773,560 | |
6.50%, 4/15/16 | | | | | | | 1,000 | | | | 1,016,250 | |
GWR Operating Partnership LLP
10.875%, 4/01/17(a) | | | | | | | 2,500 | | | | 2,637,500 | |
Harrah’s Operating Co., Inc.
5.375%, 12/15/13 | | | | | | | 2,500 | | | | 2,275,000 | |
5.625%, 6/01/15 | | | | | | | 1,935 | | | | 1,441,575 | |
6.50%, 6/01/16 | | | | | | | 1,177 | | | | 841,555 | |
11.25%, 6/01/17 | | | | | | | 2,300 | | | | 2,541,500 | |
Host Hotels & Resorts LP
6.875%, 11/01/14 | | | | | | | 481 | | | | 496,332 | |
9.00%, 5/15/17(d) | | | | | | | 1,000 | | | | 1,127,500 | |
Series Q
6.75%, 6/01/16 | | | | | | | 2,558 | | | | 2,657,122 | |
Isle of Capri Casinos, Inc.
7.00%, 3/01/14(d) | | | | | | | 5,565 | | | | 5,272,837 | |
K Hovnanian Enterprises, Inc.
10.625%, 10/15/16 | | | | | | | 4,380 | | | | 4,456,650 | |
KB Home
5.875%, 1/15/15 | | | | | | | 1,995 | | | | 1,932,656 | |
9.10%, 9/15/17 | | | | | | | 1,000 | | | | 1,040,000 | |
Lennar Corp.
6.95%, 6/01/18 | | | | | | | 1,380 | | | | 1,293,750 | |
Series B
6.50%, 4/15/16 | | | | | | | 3,200 | | | | 3,056,000 | |
Levi Strauss & Co.
7.625%, 5/15/20 | | | | | | | 1,000 | | | | 1,052,500 | |
8.875%, 4/01/16 | | | | | | | 3,000 | | | | 3,180,000 | |
M/I Homes, Inc.
6.875%, 4/01/12 | | | | | | | 1,500 | | | | 1,567,500 | |
8.625%, 11/15/18(a) | | | | | | | 2,400 | | | | 2,366,088 | |
Marina District Finance Co., Inc.
9.875%, 8/15/18(a)(d) | | | | | | | 2,970 | | | | 2,932,875 | |
Meritage Homes Corp.
6.25%, 3/15/15 | | | | | | | 1,350 | | | | 1,356,750 | |
MGM Mirage
6.625%, 7/15/15(d) | | | | | | | 2,000 | | | | 1,752,500 | |
7.625%, 1/15/17(d) | | | | | | | 1,715 | | | | 1,524,206 | |
8.375%, 2/01/11(d) | | | | | | | 1,241 | | | | 1,253,410 | |
NCL Corp. Ltd.
11.75%, 11/15/16 | | | | | | | 4,250 | | | | 4,914,062 | |
| | |
| 22 | | • ALLIANCEBERNSTEIN HIGH INCOME FUND |
Portfolio of Investments
| | | | | | | | | | | | |
| | | | | | Principal
Amount
(000) | | | U.S. $ Value | |
| | |
| | | | | | | | | | | | |
Penn National Gaming, Inc.
8.75%, 8/15/19 | | | U.S.$ | | | | 3,200 | | | $ | 3,544,000 | |
Phillips-Van Heusen Corp.
7.375%, 5/15/20 | | | | | | | 1,640 | | | | 1,777,350 | |
Quiksilver, Inc.
6.875%, 4/15/15 | | | | | | | 3,700 | | | | 3,607,500 | |
Royal Caribbean Cruises Ltd.
7.25%, 6/15/16 | | | | | | | 2,850 | | | | 3,106,500 | |
7.50%, 10/15/27 | | | | | | | 1,000 | | | | 1,002,500 | |
8.75%, 2/02/11 | | | | | | | 727 | | | | 737,905 | |
Ryland Group, Inc.
6.625%, 5/01/20 | | | | | | | 3,000 | | | | 2,921,250 | |
Sheraton Holding Corp.
7.375%, 11/15/15 | | | | | | | 2,035 | | | | 2,286,831 | |
Standard Pacific Corp.
8.375%, 5/15/18 | | | | | | | 2,500 | | | | 2,590,625 | |
10.75%, 9/15/16 | | | | | | | 1,667 | | | | 1,875,375 | |
Starwood Hotels & Resorts Worldwide, Inc.
7.875%, 5/01/12 | | | | | | | 2,500 | | | | 2,681,250 | |
Station Casinos, Inc.
6.625%, 3/15/18(i) | | | | | | | 1,755 | | | | 211 | |
6.875%, 3/01/16(i) | | | | | | | 1,500 | | | | 180 | |
Tropicana Entertainment LLC/Tropicana
Finance Corp.
9.625%, 12/15/14(h)(i) | | | | | | | 750 | | | | 0 | |
Turning Stone Resort Casino Enterprise
9.125%, 9/15/14(a) | | | | | | | 700 | | | | 721,000 | |
WCI Communities, Inc.
6.625%, 3/15/15(e)(h)(i) | | | | | | | 750 | | | | 0 | |
William Lyon Homes, Inc.
10.75%, 4/01/13 | | | | | | | 2,252 | | | | 1,947,980 | |
Wynn Las Vegas LLC/Wynn Las Vegas
Capital Corp.
7.75%, 8/15/20(a) | | | | | | | 5,400 | | | | 5,859,000 | |
| | | | | | | | | | | | |
| | | | | | | | | | | 101,181,100 | |
| | | | | | | | | | | | |
Consumer Cyclical -
Restaurants – 0.3% | | | | | | | | | | | | |
Blue Acquisition Sub, Inc.
9.875%, 10/15/18(a) | | | | | | | 3,085 | | | | 3,324,088 | |
Landry’s Restaurants, Inc.
11.625%, 12/01/15 | | | | | | | 2,880 | | | | 3,088,800 | |
Sbarro, Inc.
10.375%, 2/01/15 | | | | | | | 1,590 | | | | 588,300 | |
| | | | | | | | | | | | |
| | | | | | | | | | | 7,001,188 | |
| | | | | | | | | | | | |
| | | | |
| ALLIANCEBERNSTEIN HIGH INCOME FUND • | | | 23 | |
Portfolio of Investments
| | | | | | | | | | | | |
| | | | | | Principal
Amount
(000) | | | U.S. $ Value | |
| | |
| | | | | | | | | | | | |
Consumer Cyclical - Retailers – 2.1% | | | | | | | | | | | | |
Asbury Automotive Group, Inc.
8.00%, 3/15/14 | | | U.S.$ | | | | 1,430 | | | $ | 1,451,450 | |
AutoNation, Inc.
6.75%, 4/15/18 | | | | | | | 349 | | | | 361,215 | |
Blockbuster, Inc.
11.75%, 10/01/14(a)(i) | | | | | | | 1,782 | | | | 917,730 | |
Bon-Ton Department Stores, Inc. (The)
10.25%, 3/15/14(d) | | | | | | | 5,130 | | | | 5,232,600 | |
Burlington Coat Factory Warehouse Corp.
11.125%, 4/15/14(d) | | | | | | | 2,096 | | | | 2,206,040 | |
Couche-Tard US LP/Couche-Tard Finance Corp.
7.50%, 12/15/13 | | | | | | | 1,242 | | | | 1,260,630 | |
Dollar General Corp.
10.625%, 7/15/15 | | | | | | | 1,758 | | | | 1,942,590 | |
GameStop Corp./GameStop, Inc.
8.00%, 10/01/12 | | | | | | | 1,342 | | | | 1,383,937 | |
Hines Nurseries, Inc.
10.25%, 10/01/11(e)(h)(i) | | | | | | | 1,000 | | | | 0 | |
JC Penney Corp., Inc.
7.40%, 4/01/37 | | | | | | | 4,100 | | | | 3,782,250 | |
Limited Brands, Inc.
5.25%, 11/01/14 | | | | | | | 3,194 | | | | 3,305,790 | |
6.90%, 7/15/17 | | | | | | | 3,710 | | | | 4,025,350 | |
Macy’s Retail Holdings, Inc.
6.375%, 3/15/37 | | | | | | | 2,000 | | | | 1,965,000 | |
Michaels Stores, Inc.
7.75%, 11/01/18(a) | | | | | | | 2,100 | | | | 2,079,000 | |
11.375%, 11/01/16 | | | | | | | 1,000 | | | | 1,102,500 | |
MU Finance PLC
8.375%, 2/01/17(a) | | | | | | | 1,900 | | | | 1,895,250 | |
Neiman Marcus Group, Inc. (The)
9.00%, 10/15/15(c) | | | | | | | 4,029 | | | | 4,210,767 | |
10.375%, 10/15/15(d) | | | | | | | 500 | | | | 527,500 | |
QVC, Inc.
7.50%, 10/01/19(a) | | | | | | | 1,400 | | | | 1,505,000 | |
Rite Aid Corp.
6.875%, 8/15/13 | | | | | �� | | 470 | | | | 435,925 | |
8.00%, 8/15/20(a) | | | | | | | 1,000 | | | | 1,030,000 | |
9.50%, 6/15/17 | | | | | | | 1,500 | | | | 1,275,000 | |
10.25%, 10/15/19 | | | | | | | 2,000 | | | | 2,130,000 | |
Sally Holdings LLC/Sally Capital, Inc.
9.25%, 11/15/14 | | | | | | | 1,200 | | | | 1,261,500 | |
Toys R US, Inc.
7.375%, 10/15/18 | | | | | | | 3,900 | | | | 3,783,000 | |
| | | | | | | | | | | | |
| | | | | | | | | | | 49,070,024 | |
| | | | | | | | | | | | |
| | |
| 24 | | • ALLIANCEBERNSTEIN HIGH INCOME FUND |
Portfolio of Investments
| | | | | | | | | | | | |
| | | | | | Principal
Amount
(000) | | | U.S. $ Value | |
| | |
| | | | | | | | | | | | |
Consumer Non-Cyclical – 6.0% | | | | | | | | | | | | |
ACCO Brands Corp.
7.625%, 8/15/15 | | | U.S.$ | | | | 3,550 | | | $ | 3,514,500 | |
10.625%, 3/15/15 | | | | | | | 1,587 | | | | 1,791,326 | |
Alere, Inc.
8.625%, 10/01/18(a) | | | | | | | 4,600 | | | | 4,933,500 | |
AMGH Merger Sub, Inc.
9.25%, 11/01/18(a) | | | | | | | 3,065 | | | | 3,172,275 | |
ARAMARK Corp.
8.50%, 2/01/15 | | | | | | | 4,942 | | | | 5,189,100 | |
Bausch & Lomb, Inc.
9.875%, 11/01/15 | | | | | | | 3,855 | | | | 4,192,312 | |
Biomet, Inc.
11.625%, 10/15/17 | | | | | | | 4,550 | | | | 5,124,437 | |
BioScrip, Inc.
10.25%, 10/01/15 | | | | | | | 3,205 | | | | 3,389,287 | |
Boston Scientific Corp.
6.00%, 6/15/11 | | | | | | | 3,000 | | | | 3,076,362 | |
Campofrio Food Group SA
8.25%, 10/31/16(a) | | | EUR | | | | 2,550 | | | | 3,717,636 | |
Catalent Pharma Solutions, Inc.
9.50%, 4/15/15(c) | | | U.S.$ | | | | 3,584 | | | | 3,637,455 | |
CHS/Community Health Systems, Inc.
8.875%, 7/15/15 | | | | | | | 4,495 | | | | 4,809,650 | |
Cott Beverages, Inc.
8.125%, 9/01/18 | | | | | | | 390 | | | | 422,175 | |
Dean Foods Co.
7.00%, 6/01/16 | | | | | | | 5,350 | | | | 5,350,000 | |
Del Monte Corp.
6.75%, 2/15/15 | | | | | | | 750 | | | | 772,500 | |
DJO Finance LLC/DJO Finance Corp.
10.875%, 11/15/14 | | | | | | | 2,030 | | | | 2,225,388 | |
Dole Food Co., Inc.
8.00%, 10/01/16(a) | | | | | | | 4,350 | | | | 4,621,875 | |
Elan Finance PLC / Elan Finance Corp.
8.75%, 10/15/16(a) | | | | | | | 800 | | | | 810,000 | |
8.75%, 10/15/16 | | | | | | | 2,250 | | | | 2,289,375 | |
Gentiva Health Services, Inc.
11.50%, 9/01/18(a) | | | | | | | 1,560 | | | | 1,704,300 | |
Hanger Orthopedic Group, Inc.
10.25%, 6/01/14 | | | | | | | 413 | | | | 435,715 | |
HCA, Inc.
6.375%, 1/15/15 | | | | | | | 3,017 | | | | 3,099,968 | |
6.50%, 2/15/16 | | | | | | | 782 | | | | 803,505 | |
6.75%, 7/15/13 | | | | | | | 1,316 | | | | 1,368,640 | |
9.625%, 11/15/16(c) | | | | | | | 2,259 | | | | 2,456,663 | |
Healthsouth Corp.
7.75%, 9/15/22 | | | | | | | 435 | | | | 459,469 | |
| | | | |
| ALLIANCEBERNSTEIN HIGH INCOME FUND • | | | 25 | |
Portfolio of Investments
| | | | | | | | | | | | |
| | | | | | Principal
Amount
(000) | | | U.S. $ Value | |
| | |
| | | | | | | | | | | | |
8.125%, 2/15/20 | | | U.S.$ | | | | 1,455 | | | $ | 1,571,400 | |
10.75%, 6/15/16 | | | | | | | 2,625 | | | | 2,877,656 | |
IASIS Healthcare LLC/IASIS Capital Corp.
8.75%, 6/15/14 | | | | | | | 3,841 | | | | 3,932,224 | |
Invacare Corp.
9.75%, 2/15/15 | | | | | | | 750 | | | | 800,625 | |
Jarden Corp.
7.50%, 1/15/20 | | | | | | | 3,750 | | | | 3,975,000 | |
LifePoint Hospitals, Inc.
6.625%, 10/01/20(a) | | | | | | | 1,150 | | | | 1,210,375 | |
Mylan Inc.
7.625%, 7/15/17(a) | | | | | | | 330 | | | | 357,638 | |
7.875%, 7/15/20(a) | | | | | | | 335 | | | | 369,756 | |
NBTY, Inc.
9.00%, 10/01/18(a) | | | | | | | 1,000 | | | | 1,062,500 | |
New Albertsons, Inc.
7.45%, 8/01/29 | | | | | | | 4,110 | | | | 3,329,100 | |
8.00%, 5/01/31 | | | | | | | 2,600 | | | | 2,112,500 | |
Picard Bondco SA
9.00%, 10/01/18(a) | | | EUR | | | | 1,594 | | | | 2,312,817 | |
Pinnacle Foods Finance LLC/Pinnacle Foods Finance Corp.
10.625%, 4/01/17(d) | | | U.S.$ | | | | 3,000 | | | | 3,262,500 | |
R&R Ice Cream
8.375%, 11/15/17 | | | EUR | | | | 2,700 | | | | 3,757,860 | |
Select Medical Corp.
6.237%, 9/15/15(b) | | | U.S.$ | | | | 1,500 | | | | 1,342,500 | |
7.625%, 2/01/15 | | | | | | | 3,583 | | | | 3,632,266 | |
Smithfield Foods, Inc.
7.00%, 8/01/11 | | | | | | | 1,250 | | | | 1,292,188 | |
7.75%, 7/01/17 | | | | | | | 2,000 | | | | 2,047,500 | |
Stater Brothers Holdings
8.125%, 6/15/12 | | | | | | | 1,331 | | | | 1,332,664 | |
Sun Healthcare Group, Inc.
9.125%, 4/15/15 | | | | | | | 2,800 | | | | 3,017,000 | |
Tenet Healthcare Corp.
6.875%, 11/15/31 | | | | | | | 2,500 | | | | 2,062,500 | |
9.25%, 2/01/15 | | | | | | | 2,000 | | | | 2,210,000 | |
Tops Markets LLC
10.125%, 10/15/15(a) | | | | | | | 1,555 | | | | 1,681,344 | |
Universal Hospital Services, Inc.
4.134%, 6/01/15(b) | | | | | | | 500 | | | | 450,000 | |
US Oncology, Inc.
9.125%, 8/15/17 | | | | | | | 3,800 | | | | 4,227,500 | |
Vanguard Health Holding Co. II LLC/Vanguard Holding Co. II, Inc.
8.00%, 2/01/18 | | | | | | | 3,575 | | | | 3,767,156 | |
8.00%, 2/01/18(a) | | | | | | | 485 | | | | 507,431 | |
| | |
| 26 | | • ALLIANCEBERNSTEIN HIGH INCOME FUND |
Portfolio of Investments
| | | | | | | | | | | | |
| | | | | | Principal
Amount
(000) | | | U.S. $ Value | |
| | |
| | | | | | | | | | | | |
Visant Corp.
10.00%, 10/01/17(a) | | | U.S.$ | | | | 4,135 | | | $ | 4,403,775 | |
Warner Chilcott Co. LLC/Warner Chilcott Finance LLC
7.75%, 9/15/18(a) | | | | | | | 3,000 | | | | 3,120,000 | |
| | | | | | | | | | | | |
| | | | | | | | | | | 139,393,188 | |
| | | | | | | | | | | | |
Energy – 4.0% | | | | | | | | | | | | |
Antero Resources Finance Corp.
9.375%, 12/01/17 | | | | | | | 3,338 | | | | 3,546,625 | |
Atlas Energy Operating Co. LLC/Atlas Energy Finance Corp.
10.75%, 2/01/18 | | | | | | | 1,950 | | | | 2,193,750 | |
ATP Oil & Gas Corp.
11.875%, 5/01/15(a) | | | | | | | 3,400 | | | | 3,102,500 | |
Bluewater Holding BV
3.289%, 7/17/14(a)(b) | | | | | | | 1,800 | | | | 1,287,000 | |
Chaparral Energy, Inc.
8.875%, 2/01/17 | | | | | | | 4,505 | | | | 4,505,000 | |
Chesapeake Energy Corp.
6.50%, 8/15/17 | | | | | | | 1,575 | | | | 1,641,937 | |
6.875%, 11/15/20 | | | | | | | 100 | | | | 106,500 | |
Cie Generale de Geophysique-Veritas
7.50%, 5/15/15 | | | | | | | 909 | | | | 938,542 | |
7.75%, 5/15/17 | | | | | | | 69 | | | | 72,278 | |
9.50%, 5/15/16 | | | | | | | 2,307 | | | | 2,549,235 | |
Citgo Petroleum Corp.
11.50%, 7/01/17(a) | | | | | | | 3,852 | | | | 4,468,320 | |
Complete Production Services, Inc.
8.00%, 12/15/16 | | | | | | | 4,660 | | | | 4,904,650 | |
Continental Resources, Inc.
7.125%, 4/01/21(a) | | | | | | | 900 | | | | 972,000 | |
Denbury Resources, Inc.
8.25%, 2/15/20 | | | | | | | 1,349 | | | | 1,504,135 | |
Energy XXI Gulf Coast, Inc.
10.00%, 6/15/13 | | | | | | | 2,090 | | | | 2,178,825 | |
Expro Finance Luxembourg SCA
8.50%, 12/15/16(a) | | | | | | | 2,022 | | | | 1,991,670 | |
Forest Oil Corp.
7.25%, 6/15/19 | | | | | | | 3,440 | | | | 3,616,300 | |
Helix Energy Solutions Group, Inc.
9.50%, 1/15/16(a) | | | | | | | 2,900 | | | | 3,001,500 | |
Hercules Offshore, Inc.
10.50%, 10/15/17(a) | | | | | | | 2,879 | | | | 2,231,225 | |
Hilcorp Energy I LP/Hilcorp Finance Co.
7.75%, 11/01/15(a) | | | | | | | 3,509 | | | | 3,614,270 | |
Key Energy Services, Inc.
8.375%, 12/01/14 | | | | | | | 2,020 | | | | 2,163,925 | |
| | | | |
| ALLIANCEBERNSTEIN HIGH INCOME FUND • | | | 27 | |
Portfolio of Investments
| | | | | | | | | | | | |
| | | | | | Principal
Amount
(000) | | | U.S. $ Value | |
| | |
| | | | | | | | | | | | |
Linn Energy LLC/Linn Energy Finance Corp.
8.625%, 4/15/20(a) | | | U.S.$ | | | | 4,190 | | | $ | 4,525,200 | |
Mariner Energy, Inc.
11.75%, 6/30/16 | | | | | | | 1,741 | | | | 2,189,307 | |
Newfield Exploration Co.
6.625%, 9/01/14-4/15/16 | | | | | | | 1,475 | | | | 1,525,688 | |
Offshore Group Investments Ltd.
11.50%, 8/01/15(a) | | | | | | | 3,500 | | | | 3,710,000 | |
OPTI Canada, Inc.
8.25%, 12/15/14 | | | | | | | 3,750 | | | | 2,840,625 | |
9.75%, 8/15/13(a) | | | | | | | 2,000 | | | | 2,040,000 | |
Parker Drilling Co.
9.125%, 4/01/18 | | | | | | | 1,389 | | | | 1,458,450 | |
Petrohawk Energy Corp.
7.25%, 8/15/18 | | | | | | | 1,100 | | | | 1,141,250 | |
7.25%, 8/15/18(a) | | | | | | | 2,800 | | | | 2,905,000 | |
PHI, Inc.
8.625%, 10/15/18(a) | | | | | | | 1,810 | | | | 1,823,575 | |
Pioneer Drilling Co.
9.875%, 3/15/18 | | | | | | | 2,000 | | | | 2,100,000 | |
Pioneer Natural Resources Co.
5.875%, 7/15/16 | | | | | | | 500 | | | | 523,898 | |
Plains Exploration & Production Co.
7.625%, 4/01/20 | | | | | | | 1,000 | | | | 1,077,500 | |
7.75%, 6/15/15 | | | | | | | 1,000 | | | | 1,055,000 | |
8.625%, 10/15/19 | | | | | | | 2,300 | | | | 2,553,000 | |
Pride International, Inc.
6.875%, 8/15/20 | | | | | | | 577 | | | | 653,453 | |
QEP Resources, Inc.
6.875%, 3/01/21 | | | | | | | 753 | | | | 818,887 | |
Range Resources Corp.
7.50%, 5/15/16 | | | | | | | 500 | | | | 523,750 | |
SandRidge Energy, Inc.
8.75%, 1/15/20(a) | | | | | | | 3,173 | | | | 3,299,920 | |
Tesoro Corp.
6.25%, 11/01/12 | | | | | | | 2,070 | | | | 2,152,800 | |
6.50%, 6/01/17 | | | | | | | 409 | | | | 406,955 | |
9.75%, 6/01/19 | | | | | | | 2,518 | | | | 2,794,980 | |
Zhaikmunai Finance BV
10.50%, 10/19/15(a) | | | | | | | 1,240 | | | | 1,222,950 | |
| | | | | | | | | | | | |
| | | | | | | | | | | 93,932,375 | |
| | | | | | | | | | | | |
Other Industrial – 0.8% | | | | | | | | | | | | |
Baldor Electric Co.
8.625%, 2/15/17 | | | | | | | 3,100 | | | | 3,309,250 | |
Education Management LLC/Education Management Finance Corp.
8.75%, 6/01/14(d) | | | | | | | 1,025 | | | | 1,030,125 | |
10.25%, 6/01/16 | | | | | | | 1,550 | | | | 1,581,000 | |
| | |
| 28 | | • ALLIANCEBERNSTEIN HIGH INCOME FUND |
Portfolio of Investments
| | | | | | | | | | | | |
| | | | | | Principal
Amount
(000) | | | U.S. $ Value | |
| | |
| | | | | | | | | | | | |
Exova Ltd.
10.50%, 10/15/18(a) | | | GBP | | | | 1,527 | | | $ | 2,462,081 | |
Liberty Tire Recycling
11.00%, 10/01/16(a) | | | U.S.$ | | | | 4,400 | | | | 4,581,500 | |
Mueller Water Products, Inc.
8.75%, 9/01/20(a) | | | | | | | 900 | | | | 975,420 | |
Neenah Foundry Co.
15.00%, 7/29/15(h) | | | | | | | 256 | | | | 243,416 | |
Sensus USA, Inc.
8.625%, 12/15/13 | | | | | | | 1,121 | | | | 1,137,815 | |
Wendel
4.375%, 8/09/17 | | | EUR | | | | 1,750 | | | | 2,198,174 | |
| | | | | | | | | | | | |
| | | | | | | | | | | 17,518,781 | |
| | | | | | | | | | | | |
Services – 1.5% | | | | | | | | | | | | |
ISS Holdings A/S
8.875%, 5/15/16(a) | | | | | | | 2,000 | | | | 2,901,903 | |
Live Nation Entertainment, Inc.
8.125%, 5/15/18(a) | | | U.S.$ | | | | 285 | | | | 293,550 | |
Lottomatica SpA
8.25%, 3/31/66(a) | | | EUR | | | | 2,585 | | | | 3,692,245 | |
Realogy Corp.
10.50%, 4/15/14 | | | U.S.$ | | | | 2,632 | | | | 2,362,220 | |
12.375%, 4/15/15(d) | | | | | | | 3,050 | | | | 2,554,375 | |
Service Corp. International/US
6.75%, 4/01/16 | | | | | | | 2,900 | | | | 3,055,875 | |
7.50%, 4/01/27 | | | | | | | 1,575 | | | | 1,555,313 | |
ServiceMaster Co. (The)
10.75%, 7/15/15(a)(c) | | | | | | | 2,825 | | | | 3,029,701 | |
Telenet Finance Luxembourg
6.375%, 11/15/20 | | | EUR | | | | 2,500 | | | | 3,489,326 | |
Ticketmaster Entertainment LLC/Ticketmaster Noteco, Inc.
10.75%, 8/01/16 | | | U.S.$ | | | | 2,110 | | | | 2,336,825 | |
Travelport LLC
9.875%, 9/01/14 | | | | | | | 4,300 | | | | 4,482,750 | |
West Corp.
8.625%, 10/01/18(a) | | | | | | | 1,535 | | | | 1,592,562 | |
9.50%, 10/15/14 | | | | | | | 736 | | | | 770,960 | |
11.00%, 10/15/16 | | | | | | | 2,100 | | | | 2,268,000 | |
| | | | | | | | | | | | |
| | | | | | | | | | | 34,385,605 | |
| | | | | | | | | | | | |
Technology – 2.3% | | | | | | | | | | | | |
Advanced Micro Devices, Inc.
7.75%, 8/01/20(a) | | | | | | | 973 | | | | 1,031,380 | |
8.125%, 12/15/17 | | | | | | | 1,465 | | | | 1,582,200 | |
Alcatel-Lucent USA, Inc.
6.45%, 3/15/29 | | | | | | | 2,450 | | | | 2,045,750 | |
6.50%, 1/15/28 | | | | | | | 1,650 | | | | 1,373,625 | |
| | | | |
| ALLIANCEBERNSTEIN HIGH INCOME FUND • | | | 29 | |
Portfolio of Investments
| | | | | | | | | | | | |
| | | | | | Principal
Amount
(000) | | | U.S. $ Value | |
| | |
| | | | | | | | | | | | |
Amkor Technology, Inc.
9.25%, 6/01/16 | | | U.S.$ | | | | 2,560 | | | $ | 2,745,600 | |
Aspect Software, Inc.
10.625%, 5/15/17(a) | | | | | | | 3,111 | | | | 3,293,771 | |
Ceridian Corp.
11.25%, 11/15/15 | | | | | | | 4,650 | | | | 4,522,125 | |
DCP LLC/DCP Corp.
10.75%, 8/15/15(a) | | | | | | | 2,385 | | | | 2,414,812 | |
Eastman Kodak Co.
9.75%, 3/01/18(a) | | | | | | | 1,825 | | | | 1,809,031 | |
First Data Corp.
9.875%, 9/24/15 | | | | | | | 3,241 | | | | 2,738,645 | |
11.25%, 3/31/16 | | | | | | | 750 | | | | 545,625 | |
Freescale Semiconductor, Inc.
8.875%, 12/15/14(d) | | | | | | | 2,705 | | | | 2,752,337 | |
9.25%, 4/15/18(a) | | | | | | | 726 | | | | 776,820 | |
10.125%, 12/15/16(d) | | | | | | | 2,429 | | | | 2,371,311 | |
Interactive Data Corp.
10.25%, 8/01/18(a) | | | | | | | 2,700 | | | | 2,943,000 | |
Iron Mountain, Inc.
6.625%, 1/01/16 | | | | | | | 1,393 | | | | 1,399,965 | |
8.375%, 8/15/21 | | | | | | | 3,000 | | | | 3,363,750 | |
8.75%, 7/15/18 | | | | | | | 1,000 | | | | 1,062,500 | |
NXP BV / NXP Funding LLC
3.039%, 10/15/13(b) | | | | | | | 620 | | | | 589,000 | |
9.50%, 10/15/15(d) | | | | | | | 3,325 | | | | 3,512,031 | |
Sanmina-SCI Corp.
8.125%, 3/01/16 | | | | | | | 3,724 | | | | 3,826,410 | |
Seagate HDD Cayman
6.875%, 5/01/20(a) | | | | | | | 2,000 | | | | 2,040,000 | |
Seagate Technology HDD Holdings
6.375%, 10/01/11 | | | | | | | 963 | | | | 989,483 | |
Sensata Technologies BV
8.00%, 5/01/14 | | | | | | | 976 | | | | 1,007,720 | |
Serena Software, Inc.
10.375%, 3/15/16 | | | | | | | 419 | | | | 432,618 | |
STATS ChipPAC Ltd.
7.50%, 8/12/15(a) | | | | | | | 688 | | | | 755,080 | |
SunGard Data Systems, Inc.
9.125%, 8/15/13 | | | | | | | 1,353 | | | | 1,385,134 | |
10.25%, 8/15/15 | | | | | | | 974 | | | | 1,026,353 | |
Xerox Capital Trust I
8.00%, 2/01/27 | | | | | | | 116 | | | | 118,989 | |
| | | | | | | | | | | | |
| | | | | | | | | | | 54,455,065 | |
| | | | | | | | | | | | |
Transportation - Airlines – 0.5% | | | | | | | | | | | | |
American Airlines, Inc.
10.50%, 10/15/12 | | | | | | | 1,909 | | | | 2,076,037 | |
| | |
| 30 | | • ALLIANCEBERNSTEIN HIGH INCOME FUND |
Portfolio of Investments
| | | | | | | | | | | | |
| | | | | | Principal
Amount
(000) | | | U.S. $ Value | |
| | |
| | | | | | | | | | | | |
AMR Corp.
9.00%, 8/01/12 | | | U.S.$ | | | | 849 | | | $ | 849,000 | |
Continental Airlines, Inc.
8.75%, 12/01/11 | | | | | | | 703 | | | | 728,484 | |
Series 2003-ERJ1
7.875%, 7/02/18 | | | | | | | 2,279 | | | | 2,262,287 | |
Delta Air Lines, Inc.
9.50%, 9/15/14(a) | | | | | | | 1,164 | | | | 1,280,400 | |
Northwest Airlines, Inc.
Series 00-1
7.15%, 10/01/19 | | | | | | | 1,083 | | | | 1,088,192 | |
UAL 2007-1 Pass Through Trust
Series 071A
6.636%, 7/02/22 | | | | | | | 2,346 | | | | 2,404,529 | |
| | | | | | | | | | | | |
| | | | | | | | | | | 10,688,929 | |
| | | | | | | | | | | | |
Transportation - Railroads – 0.1% | | | | | | | | | | | | |
Trinity Industries, Inc.
6.50%, 3/15/14 | | | | | | | 1,226 | | | | 1,253,585 | |
| | | | | | | | | | | | |
| | | |
Transportation - Services – 1.1% | | | | | | | | | | | | |
America West Airlines 1999-1 Pass Through Trust
Series 991G
7.93%, 1/02/19 | | | | | | | 2,003 | | | | 2,077,957 | |
Avis Budget Car Rental LLC / Avis Budget Finance, Inc.
7.625%, 5/15/14 | | | | | | | 500 | | | | 513,750 | |
7.75%, 5/15/16 | | | | | | | 4,338 | | | | 4,392,225 | |
EC Finance PLC
9.75%, 8/01/17(a) | | | EUR | | | | 148 | | | | 222,465 | |
Hertz Corp. (The)
7.50%, 10/15/18(a) | | | U.S.$ | | | | 1,900 | | | | 1,957,000 | |
8.875%, 1/01/14 | | | | | | | 3,372 | | | | 3,464,730 | |
Oshkosh Corp.
8.50%, 3/01/20 | | | | | | | 3,500 | | | | 3,876,250 | |
Overseas Shipholding Group, Inc.
8.125%, 3/30/18 | | | | | | | 1,500 | | | | 1,556,250 | |
Quality Distribution LLC/QD Capital Corp.
11.75%, 11/01/13 | | | | | | | 2,380 | | | | 2,285,042 | |
Stena AB
5.875%, 2/01/19(a) | | | EUR | | | | 1,000 | | | | 1,245,661 | |
6.125%, 2/01/17(a) | | | | | | | 800 | | | | 1,057,768 | |
7.875%, 3/15/20(a) | | | | | | | 1,000 | | | | 1,398,759 | |
Western Express, Inc.
12.50%, 4/15/15(a) | | | U.S.$ | | | | 2,000 | | | | 1,910,000 | |
| | | | | | | | | | | | |
| | | | | | | | | | | 25,957,857 | |
| | | | | | | | | | | | |
| | | | | | | | | | | 1,056,138,953 | |
| | | | | | | | | | | | |
| | | | |
| ALLIANCEBERNSTEIN HIGH INCOME FUND • | | | 31 | |
Portfolio of Investments
| | | | | | | | | | | | |
| | | | | | Principal
Amount
(000) | | | U.S. $ Value | |
| | |
| | | | | | | | | | | | |
Financial Institutions – 4.8% | | | | | | | | | | | | |
Banking – 1.6% | | | | | | | | | | | | |
ABN Amro Bank NV
4.31%, 3/10/16 | | | EUR | | | | 5,396 | | | $ | 5,917,925 | |
Bank of America Corp.
8.00%, 1/30/18 | | | U.S.$ | | | | 1,585 | | | | 1,599,534 | |
8.125%, 5/15/18 | | | | | | | 3,130 | | | | 3,158,702 | |
Commerzbank Capital Funding Trust I
5.012%, 4/12/16(i) | | | EUR | | | | 1,500 | | | | 1,482,267 | |
Deutsched Bank AG/London
5.50%, 9/02/15 | | | UAH | | | | 28,000 | | | | 3,110,395 | |
Dresdner Funding Trust I
8.151%, 6/30/31(a) | | | U.S.$ | | | | 2,000 | | | | 1,880,000 | |
HBOS Capital Funding LP
6.071%, 6/30/14(a) | | | | | | | 590 | | | | 531,000 | |
HT1 Funding GMBH
6.352%, 6/30/17 | | | EUR | | | | 1,450 | | | | 1,533,764 | |
LBG Capital No.1 PLC
8.00%, 6/15/20(a) | | | U.S.$ | | | | 6,050 | | | | 5,762,625 | |
Resona Preferred Global Securities Cayman Ltd.
7.191%, 7/30/15(a) | | | | | | | 6,300 | | | | 6,236,931 | |
SNS Bank NV
11.25%, 12/31/49 | | | EUR | | | | 1,350 | | | | 1,973,252 | |
UT2 Funding PLC
5.321%, 6/30/16(d) | | | | | | | 1,293 | | | | 1,565,650 | |
Zions Bancorporation
5.50%, 11/16/15 | | | U.S.$ | | | | 2,180 | | | | 2,183,551 | |
6.00%, 9/15/15 | | | | | | | 370 | | | | 365,953 | |
| | | | | | | | | | | | |
| | | | | | | | | | | 37,301,549 | |
| | | | | | | | | | | | |
Brokerage – 0.3% | | | | | | | | | | | | |
E*Trade Financial Corp.
7.375%, 9/15/13 | | | | | | | 3,325 | | | | 3,304,219 | |
Lehman Brothers Holdings, Inc.
6.875%, 5/02/18(i) | | | | | | | 1,600 | | | | 366,000 | |
Series G
4.80%, 3/13/14(i) | | | | | | | 1,800 | | | | 391,500 | |
Nuveen Investments, Inc.
10.50%, 11/15/15 | | | | | | | 3,845 | | | | 4,018,025 | |
| | | | | | | | | | | | |
| | | | | | | | | | | 8,079,744 | |
| | | | | | | | | | | | |
Finance – 1.1% | | | | | | | | | | | | |
Ally Financial, Inc.
6.875%, 9/15/11 | | | | | | | 1,090 | | | | 1,125,425 | |
8.00%, 11/01/31 | | | | | | | 2,404 | | | | 2,626,370 | |
Series 8
6.75%, 12/01/14 | | | | | | | 2,590 | | | | 2,713,025 | |
CIT Group Funding Co. of Delaware LLC
10.25%, 5/01/15-5/01/17 | | | | | | | 2,706 | | | | 2,796,223 | |
| | |
| 32 | | • ALLIANCEBERNSTEIN HIGH INCOME FUND |
Portfolio of Investments
| | | | | | | | | | | | |
| | | | | | Principal
Amount
(000) | | | U.S. $ Value | |
| | |
| | | | | | | | | | | | |
CIT Group, Inc.
7.00%, 5/01/13-5/01/17 | | | U.S.$ | | | | 4,510 | | | $ | 4,516,478 | |
7.00%, 5/01/14(d) | | | | | | | 443 | | | | 445,161 | |
ILFC E-Capital Trust II
6.25%, 12/21/65(a) | | | | | | | 1,500 | | | | 1,200,000 | |
International Lease Finance Corp.
6.375%, 3/25/13 | | | | | | | 1,750 | | | | 1,802,500 | |
iStar Financial, Inc.
5.65%, 9/15/11 | | | | | | | 1,605 | | | | 1,492,650 | |
10.00%, 6/15/14 | | | | | | | 1,046 | | | | 1,056,460 | |
Series B
5.70%, 3/01/14 | | | | | | | 2,000 | | | | 1,670,000 | |
Residential Capital LLC
9.625%, 5/15/15 | | | | | | | 4,332 | | | | 4,207,455 | |
| | | | | | | | | | | | |
| | | | | | | | | | | 25,651,747 | |
| | | | | | | | | | | | |
Insurance – 0.8% | | | | | | | | | | | | |
AGFC Capital Trust I
6.00%, 1/15/67(a) | | | | | | | 4,000 | | | | 2,020,000 | |
American International Group, Inc.
6.25%, 3/15/37 | | | | | | | 2,364 | | | | 2,133,510 | |
8.175%, 5/15/58 | | | | | | | 1,336 | | | | 1,422,840 | |
Genworth Financial, Inc.
6.15%, 11/15/66 | | | | | | | 2,535 | | | | 2,015,325 | |
Hartford Financial Services Group, Inc.
8.125%, 6/15/38 | | | | | | | 431 | | | | 457,937 | |
ING Capital Funding TR III
8.439%, 12/31/10 | | | | | | | 2,000 | | | | 1,920,000 | |
Liberty Mutual Group, Inc.
7.80%, 3/15/37(a) | | | | | | | 1,642 | | | | 1,642,000 | |
MBIA Insurance Corp.
14.00%, 1/15/33(a) | | | | | | | 4,920 | | | | 2,952,000 | |
XL Capital Ltd.
Series E
6.50%, 4/15/17 | | | | | | | 5,625 | | | | 5,034,375 | |
| | | | | | | | | | | | |
| | | | | | | | | | | 19,597,987 | |
| | | | | | | | | | | | |
Other Finance – 0.7% | | | | | | | | | | | | |
DTEK Finance BV
9.50%, 4/28/15(a) | | | | | | | 4,574 | | | | 4,751,242 | |
FTI Consulting, Inc.
6.75%, 10/01/20(a) | | | | | | | 3,150 | | | | 3,287,813 | |
Icahn Enterprises LP/Icahn Enterprises Finance Corp.
8.00%, 1/15/18 | | | | | | | 4,050 | | | | 4,166,438 | |
iPayment, Inc.
9.75%, 5/15/14 | | | | | | | 1,877 | | | | 1,773,765 | |
Renaissance Consumer Funding L
13.00%, 4/01/13(a) | | | | | | | 1,000 | | | | 1,035,000 | |
| | | | |
| ALLIANCEBERNSTEIN HIGH INCOME FUND • | | | 33 | |
Portfolio of Investments
| | | | | | | | | | | | |
| | | | | | Principal
Amount
(000) | | | U.S. $ Value | |
| | |
| | | | | | | | | | | | |
Renaissance Securities Trading
12.00%, 4/01/11 | | | U.S.$ | | | | 1,000 | | | $ | 1,002,500 | |
| | | | | | | | | | | | |
| | | | | | | | | | | 16,016,758 | |
| | | | | | | | | | | | |
REITS – 0.3% | | | | | | | | | | | | |
Central China Real Estate Ltd.
12.25%, 10/20/15(a) | | | | | | | 3,123 | | | | 3,287,582 | |
Developers Diversified Realty Corp.
7.875%, 9/01/20 | | | | | | | 1,800 | | | | 1,953,760 | |
Sabra Health Care LP/Sabra Capital Corp.
8.125%, 11/01/18(a) | | | | | | | 543 | | | | 562,005 | |
| | | | | | | | | | | | |
| | | | | | | | | | | 5,803,347 | |
| | | | | | | | | | | | |
| | | | | | | | | | | 112,451,132 | |
| | | | | | | | | | | | |
Utility – 2.8% | | | | | | | | | | | | |
Electric – 2.1% | | | | | | | | | | | | |
AES Corp. (The)
7.75%, 3/01/14 | | | | | | | 2,696 | | | | 2,945,380 | |
8.00%, 10/15/17 | | | | | | | 1,860 | | | | 2,046,000 | |
Calpine Corp.
7.25%, 10/15/17(a) | | | | | | | 3,300 | | | | 3,432,000 | |
7.875%, 7/31/20(a) | | | | | | | 1,850 | | | | 1,937,875 | |
Dynegy Holdings, Inc.
8.375%, 5/01/16 | | | | | | | 4,141 | | | | 3,178,217 | |
Dynegy Roseton/Danskammer Pass Through Trust
Series B
7.67%, 11/08/16 | | | | | | | 1,969 | | | | 1,831,170 | |
Edison Mission Energy
7.00%, 5/15/17 | | | | | | | 3,948 | | | | 2,911,650 | |
7.50%, 6/15/13(d) | | | | | | | 1,562 | | | | 1,522,950 | |
7.75%, 6/15/16 | | | | | | | 1,447 | | | | 1,164,835 | |
Energy Future Holdings Corp.
10.875%, 11/01/17 | | | | | | | 411 | | | | 302,085 | |
Series P
5.55%, 11/15/14 | | | | | | | 1,980 | | | | 1,262,250 | |
Series Q
6.50%, 11/15/24 | | | | | | | 2,007 | | | | 792,765 | |
Energy Future Intermediate Holding Co. LLC/EFIH Finance, Inc.
10.00%, 12/01/20 | | | | | | | 1,072 | | | | 1,122,815 | |
GenOn Escrow Corp.
9.50%, 10/15/18(a) | | | | | | | 2,850 | | | | 2,778,750 | |
Indiantown Cogeneration LP
Series A-9
9.26%, 12/15/10 | | | | | | | 868 | | | | 870,655 | |
Intergen NV
8.50%, 6/30/17(a) | | | EUR | | | | 1,000 | | | | 1,482,267 | |
Mirant Americas Generation LLC
8.50%, 10/01/21 | | | U.S.$ | | | | 3,255 | | | | 3,189,900 | |
| | |
| 34 | | • ALLIANCEBERNSTEIN HIGH INCOME FUND |
Portfolio of Investments
| | | | | | | | | | | | |
| | | | | | Principal
Amount
(000) | | | U.S. $ Value | |
| | |
| | | | | | | | | | | | |
NRG Energy, Inc.
7.25%, 2/01/14 | | | U.S.$ | | | | 245 | | | $ | 250,819 | |
7.375%, 2/01/16-1/15/17 | | | | | | | 4,025 | | | | 4,192,875 | |
8.25%, 9/01/20(a) | | | | | | | 1,800 | | | | 1,908,000 | |
PPL Capital Funding, Inc.
Series A
6.70%, 3/30/67 | | | | | | | 2,702 | | | | 2,593,920 | |
RRI Energy, Inc.
7.625%, 6/15/14 | | | | | | | 1,041 | | | | 1,048,808 | |
7.875%, 6/15/17 | | | | | | | 4,293 | | | | 3,971,025 | |
Texas Competitive Electric Holdings Co. LLC
Series A
10.25%, 11/01/15(d) | | | | | | | 2,804 | | | | 1,738,480 | |
| | | | | | | | | | | | |
| | | | | | | | | | | 48,475,491 | |
| | | | | | | | | | | | |
Natural Gas – 0.7% | | | | | | | | | | | | |
El Paso Corp.
Series G
7.375%, 12/15/12 | | | | | | | 394 | | | | 423,713 | |
7.75%, 1/15/32 | | | | | | | 4,298 | | | | 4,602,608 | |
Enterprise Products Operating LLC
Series A
8.375%, 8/01/66 | | | | | | | 1,609 | | | | 1,697,495 | |
Kinder Morgan Finance Co. ULC
5.70%, 1/05/16 | | | | | | | 745 | | | | 768,281 | |
Sabine Pass LNG LP
7.50%, 11/30/16 | | | | | | | 3,900 | | | | 3,602,625 | |
Source Gas LLC
5.90%, 4/01/17(a) | | | | | | | 3,000 | | | | 2,973,951 | |
Targa Resources Partners LP/Targa Resources Partners Finance Corp.
11.25%, 7/15/17 | | | | | | | 1,300 | | | | 1,508,000 | |
| | | | | | | | | | | | |
| | | | | | | | | | | 15,576,673 | |
| | | | | | | | | | | | |
| | | | | | | | | | | 64,052,164 | |
| | | | | | | | | | | | |
Non Corporate Sectors – 0.2% | | | | | | | | | | | | |
Foreign Local Government -
Municipal – 0.2% | | | | | | | | | | | | |
Care UK Health & Social Care PLC
9.75%, 8/01/17 | | | GBP | | | | 2,900 | | | | 4,704,900 | |
| | | | | | | | | | | | |
| | | |
Total Corporates – Non-Investment Grades
(cost $1,185,548,626) | | | | | | | | | | | 1,237,347,149 | |
| | | | | | | | | | | | |
| | | | | | | | | | | | |
CORPORATES - INVESTMENT
GRADES – 11.1% | | | | | | | | | | | | |
Financial Institutions – 5.2% | | | | | | | | | | | | |
Banking – 2.2% | | | | | | | | | | | | |
American Express Co.
6.80%, 9/01/66 | | | U.S.$ | | | | 4,555 | | | | 4,572,081 | |
| | | | |
| ALLIANCEBERNSTEIN HIGH INCOME FUND • | | | 35 | |
Portfolio of Investments
| | | | | | | | | | | | |
| | | | | | Principal
Amount
(000) | | | U.S. $ Value | |
| | |
| | | | | | | | | | | | |
Assured Guaranty Municipal Holdings, Inc.
6.40%, 12/15/66(a) | | | U.S.$ | | | | 3,500 | | | $ | 2,607,500 | |
Banco Do Brasil SA/Cayman
8.50%, 10/20/20(a) | | | | | | | 2,200 | | | | 2,618,000 | |
Banco Santander Chile
6.50%, 9/22/20(a) | | | CLP | | | | 2,367,500 | | | | 4,797,238 | |
Barclays Bank PLC
4.875%, 12/15/14 | | | EUR | | | | 750 | | | | 925,885 | |
5.926%, 12/15/16(a) | | | U.S.$ | | | | 2,300 | | | | 2,162,000 | |
8.55%, 6/15/11(a) | | | | | | | 1,000 | | | | 1,016,250 | |
BBVA International Preferred S
Series E
8.50%, 10/21/14 | | | EUR | | | | 1,000 | | | | 1,468,335 | |
BNP Paribas
5.186%, 6/29/15(a) | | | U.S.$ | | | | 622 | | | | 595,565 | |
BNP Paribas Capital Trust IV
6.342%, 1/24/12 | | | EUR | | | | 1,000 | | | | 1,395,279 | |
Countrywide Financial Corp.
6.25%, 5/15/16 | | | U.S.$ | | | | 505 | | | | 538,638 | |
Credit Agricole SA
6.637%, 5/31/17(a) | | | | | | | 5,375 | | | | 5,126,406 | |
Danske Bank A/S
5.914%, 6/16/14(a) | | | | | | | 685 | | | | 652,773 | |
Fortis Bank SA/NV
4.625%, 10/27/14(a) | | | EUR | | | | 1,000 | | | | 1,280,442 | |
Morgan Stanley
3.513%, 5/30/11(b) | | | NZD | | | | 3,900 | | | | 2,948,428 | |
10.09%, 5/03/17(a) | | | BRL | | | | 5,230 | | | | 2,975,960 | |
MUFG Capital Finance 5 Ltd.
6.299%, 1/25/17 | | | GBP | | | | 1,225 | | | | 1,858,257 | |
National Capital Trust II
5.486%, 3/23/15(a) | | | U.S.$ | | | | 1,700 | | | | 1,646,668 | |
Societe Generale
4.196%, 1/26/15 | | | EUR | | | | 1,500 | | | | 1,878,930 | |
UBS AG
4.28%, 4/15/15 | | | | | | | 1,000 | | | | 1,280,456 | |
Unicredito Italiano Capital Trust III
4.028%, 10/27/15 | | | | | | | 4,700 | | | | 5,730,253 | |
VTB Capital SA
6.875%, 5/29/18(a) | | | U.S.$ | | | | 1,333 | | | | 1,401,316 | |
Wells Fargo & Co.
Series K
7.98%, 3/15/18 | | | | | | | 2,600 | | | | 2,730,000 | |
| | | | | | | | | | | | |
| | | | | | | | | | | 52,206,660 | |
| | | | | | | | | | | | |
Brokerage – 0.1% | | | | | | | | | | | | |
Jefferies Group, Inc.
6.875%, 4/15/21 | | | | | | | 982 | | | | 1,045,177 | |
| | | | | | | | | | | | |
| | |
| 36 | | • ALLIANCEBERNSTEIN HIGH INCOME FUND |
Portfolio of Investments
| | | | | | | | | | | | |
| | | | | | Principal
Amount
(000) | | | U.S. $ Value | |
| | |
| | | | | | | | | | | | |
Finance – 0.3% | | | | | | | | | | | | |
HSBC Finance Capital Trust IX
5.911%, 11/30/35(d) | | | U.S.$ | | | | 2,565 | | | $ | 2,449,575 | |
SLM Corp.
5.125%, 8/27/12 | | | | | | | 999 | | | | 1,022,358 | |
Series A
5.00%, 10/01/13 | | | | | | | 4,100 | | | | 4,117,105 | |
| | | | | | | | | | | | |
| | | | | | | | | | | 7,589,038 | |
| | | | | | | | | | | | |
Insurance – 2.1% | | | | | | | | | | | | |
Allstate Corp. (The)
6.125%, 5/15/37 | | | | | | | 3,060 | | | | 3,029,400 | |
AON Corp.
8.205%, 1/01/27 | | | | | | | 745 | | | | 784,492 | |
Assured Guaranty US Holdings, Inc.
Series A
6.40%, 12/15/66 | | | | | | | 2,723 | | | | 2,178,400 | |
Aviva PLC
4.729%, 11/28/14 | | | EUR | | | | 1,000 | | | | 1,231,743 | |
Coventry Health Care, Inc.
5.875%, 1/15/12 | | | U.S.$ | | | | 664 | | | | 687,088 | |
5.95%, 3/15/17 | | | | | | | 1,415 | | | | 1,444,006 | |
Crum & Forster Holdings Corp.
7.75%, 5/01/17 | | | | | | | 457 | | | | 480,421 | |
Danica Pension Livsforsikrings
4.35%, 10/06/11 | | | EUR | | | | 1,000 | | | | 1,370,923 | |
Fairfax Financial Holdings Ltd.
7.75%, 6/15/17 | | | U.S.$ | | | | 1,000 | | | | 1,051,250 | |
Farmers Insurance Exchange
8.625%, 5/01/24(a) | | | | | | | 3,000 | | | | 3,503,610 | |
Genworth Financial, Inc.
7.70%, 6/15/20 | | | | | | | 1,600 | | | | 1,729,709 | |
Hannover Finance Luxembourg SA
5.00%, 6/01/15 | | | EUR | | | | 1,000 | | | | 1,322,210 | |
Lincoln National Corp.
6.05%, 4/20/67 | | | U.S.$ | | | | 3,100 | | | | 2,867,500 | |
8.75%, 7/01/19 | | | | | | | 604 | | | | 778,834 | |
MetLife, Inc.
10.75%, 8/01/39 | | | | | | | 1,995 | | | | 2,693,250 | |
Nationwide Mutual Insurance Co.
5.81%, 12/15/24(a) | | | | | | | 5,000 | | | | 4,467,930 | |
9.375%, 8/15/39(a) | | | | | | | 2,040 | | | | 2,392,651 | |
Standard Life PLC
5.314%, 1/06/15 | | | EUR | | | | 1,000 | | | | 1,245,661 | |
Suncorp Metway Insurance Ltd.
6.75%, 10/06/26 | | | AUD | | | | 500 | | | | 384,728 | |
Series 1
6.75%, 9/23/24 | | | | | | | 800 | | | | 680,413 | |
| | | | |
| ALLIANCEBERNSTEIN HIGH INCOME FUND • | | | 37 | |
Portfolio of Investments
| | | | | | | | | | | | |
| | | | | | Principal
Amount
(000) | | | U.S. $ Value | |
| | |
| | | | | | | | | | | | |
Swiss Re Capital I LP
6.854%, 5/25/16(a) | | | U.S.$ | | | | 4,900 | | | $ | 4,864,524 | |
Transatlantic Holdings, Inc.
8.00%, 11/30/39 | | | | | | | 1,636 | | | | 1,701,931 | |
Vero Insurance Ltd.
6.15%, 9/07/25 | | | AUD | | | | 700 | | | | 547,176 | |
WR Berkley Corp.
5.60%, 5/15/15 | | | U.S.$ | | | | 3,500 | | | | 3,783,801 | |
ZFS Finance USA Trust I
6.15%, 12/15/65(a) | | | | | | | 3,000 | | | | 2,958,750 | |
| | | | | | | | | | | | |
| | | | | | | | | | | 48,180,401 | |
| | | | | | | | | | | | |
Other Finance – 0.2% | | | | | | | | | | | | |
IIRSA Norte Finance Ltd.
8.75%, 5/30/24(a) | | | | | | | 877 | | | | 1,028,302 | |
ORIX Corp.
5.48%, 11/22/11 | | | | | | | 3,000 | | | | 3,114,972 | |
Red Arrow International Leasing PLC
8.375%, 6/30/12 | | | RUB | | | | 16,147 | | | | 531,310 | |
| | | | | | | | | | | | |
| | | | | | | | | | | 4,674,584 | |
| | | | | | | | | | | | |
REITS – 0.3% | | | | | | | | | | | | |
Entertainment Properties Trust
7.75%, 7/15/20(a) | | | U.S.$ | | | | 2,544 | | | | 2,639,400 | |
ProLogis
6.875%, 3/15/20 | | | | | | | 3,500 | | | | 3,803,216 | |
| | | | | | | | | | | | |
| | | | | | | | | | | 6,442,616 | |
| | | | | | | | | | | | |
| | | | | | | | | | | 120,138,476 | |
| | | | | | | | | | | | |
Industrial – 3.7% | | | | | | | | | | | | |
Basic – 1.2% | | | | | | | | | | | | |
ArcelorMittal
9.00%, 2/15/15(d) | | | | | | | 730 | | | | 891,217 | |
ArcelorMittal USA, Inc.
6.50%, 4/15/14 | | | | | | | 1,565 | | | | 1,740,649 | |
Commercial Metals Co.
6.50%, 7/15/17 | | | | | | | 2,100 | | | | 2,173,517 | |
Freeport-McMoRan Copper & Gold, Inc.
8.375%, 4/01/17 | | | | | | | 1,466 | | | | 1,658,413 | |
Gerdau Trade, Inc.
5.75%, 1/30/21(a) | | | | | | | 170 | | | | 176,163 | |
GTL Trade Finance, Inc.
7.25%, 10/20/17(a) | | | | | | | 1,747 | | | | 1,985,029 | |
Southern Copper Corp.
7.50%, 7/27/35 | | | | | | | 1,500 | | | | 1,726,588 | |
Teck Resources Ltd.
6.125%, 10/01/35 | | | | | | | 5,000 | | | | 5,296,425 | |
9.75%, 5/15/14 | | | | | | | 425 | | | | 529,196 | |
Union Carbide Corp.
7.75%, 10/01/96 | | | | | | | 2,500 | | | | 2,350,000 | |
| | |
| 38 | | • ALLIANCEBERNSTEIN HIGH INCOME FUND |
Portfolio of Investments
| | | | | | | | | | | | |
| | | | | | Principal
Amount
(000) | | | U.S. $ Value | |
| | |
| | | | | | | | | | | | |
Usiminas Commercial Ltd.
7.25%, 1/18/18(a) | | | U.S.$ | | | | 2,441 | | | $ | 2,767,484 | |
Vale Overseas Ltd.
5.625%, 9/15/19 | | | | | | | 2,285 | | | | 2,555,427 | |
6.875%, 11/21/36 | | | | | | | 3,495 | | | | 3,982,643 | |
| | | | | | | | | | | | |
| | | | | | | | | | | 27,832,751 | |
| | | | | | | | | | | | |
Capital Goods – 0.3% | | | | | | | | | | | | |
Allied Waste North America, Inc.
Series B
7.125%, 5/15/16 | | | | | | | 362 | | | | 385,982 | |
Lafarge SA
7.125%, 7/15/36 | | | | | | | 1,500 | | | | 1,495,917 | |
Owens Corning
6.50%, 12/01/16 | | | | | | | 355 | | | | 386,041 | |
7.00%, 12/01/36 | | | | | | | 4,450 | | | | 4,530,274 | |
| | | | | | | | | | | | |
| | | | | | | | | | | 6,798,214 | |
| | | | | | | | | | | | |
Communications - Media – 0.5% | | | | | | | | | | | | |
Comcast Cable Communications Holdings, Inc.
9.455%, 11/15/22 | | | | | | | 2,500 | | | | 3,550,362 | |
DirecTV Holdings LLC/DirecTV Financing Co., Inc.
6.375%, 6/15/15 | | | | | | | 3,900 | | | | 4,036,500 | |
News America, Inc.
6.40%, 12/15/35 | | | | | | | 1,000 | | | | 1,084,520 | |
RR Donnelley & Sons Co.
4.95%, 4/01/14 | | | | | | | 2,400 | | | | 2,508,756 | |
| | | | | | | | | | | | |
| | | | | | | | | | | 11,180,138 | |
| | | | | | | | | | | | |
Communications - Telecommunications – 0.1% | | | | | | | | | | | | |
Qwest Corp.
6.875%, 9/15/33 | | | | | | | 1,500 | | | | 1,507,500 | |
7.625%, 6/15/15 | | | | | | | 1,590 | | | | 1,832,475 | |
| | | | | | | | | | | | |
| | | | | | | | | | | 3,339,975 | |
| | | | | | | | | | | | |
Consumer Cyclical - Other – 0.1% | | | | | | | | | | | | |
Toll Brothers Finance Corp.
5.15%, 5/15/15 | | | | | | | 1,900 | | | | 1,944,629 | |
| | | | | | | | | | | | |
| | | |
Consumer Cyclical - Retailers – 0.1% | | | | | | | | | | | | |
CVS Caremark Corp.
6.302%, 6/01/37 | | | | | | | 3,450 | | | | 3,199,875 | |
| | | | | | | | | | | | |
| | | |
Consumer Non-Cyclical – 0.1% | | | | | | | | | | | | |
Bunge Ltd. Finance Corp.
8.50%, 6/15/19 | | | | | | | 332 | | | | 405,276 | |
Reynolds American, Inc.
7.625%, 6/01/16 | | | | | | | 1,376 | | | | 1,619,756 | |
| | | | |
| ALLIANCEBERNSTEIN HIGH INCOME FUND • | | | 39 | |
Portfolio of Investments
| | | | | | | | | | | | |
| | | | | | Principal
Amount
(000) | | | U.S. $ Value | |
| | |
| | | | | | | | | | | | |
Ventas Realty LP/Ventas Capital Corp.
6.75%, 4/01/17 | | | U.S.$ | | | | 422 | | | $ | 436,481 | |
Whirlpool Corp.
8.60%, 5/01/14 | | | | | | | 190 | | | | 226,218 | |
| | | | | | | | | | | | |
| | | | | | | | | | | 2,687,731 | |
| | | | | | | | | | | | |
Energy – 0.6% | | | | | | | | | | | | |
Anadarko Petroleum Corp.
5.95%, 9/15/16 | | | | | | | 2,683 | | | | 2,934,263 | |
8.70%, 3/15/19 | | | | | | | 2,000 | | | | 2,475,960 | |
TNK-BP Finance SA
7.25%, 2/02/20(a) | | | | | | | 360 | | | | 394,200 | |
7.50%, 7/18/16(a) | | | | | | | 4,708 | | | | 5,220,230 | |
Transocean, Inc.
6.80%, 3/15/38 | | | | | | | 1,916 | | | | 2,012,404 | |
7.50%, 4/15/31 | | | | | | | 1,800 | | | | 1,949,074 | |
Williams Cos., Inc. (The)
7.875%, 9/01/21 | | | | | | | 149 | | | | 178,053 | |
| | | | | | | | | | | | |
| | | | | | | | | | | 15,164,184 | |
| | | | | | | | | | | | |
Other Industrial – 0.2% | | | | | | | | | | | | |
Noble Group Ltd.
6.75%, 1/29/20(a)(d) | | | | | | | 2,368 | | | | 2,632,484 | |
8.50%, 5/30/13(a) | | | | | | | 2,103 | | | | 2,378,882 | |
| | | | | | | | | | | | |
| | | | | | | | | | | 5,011,366 | |
| | | | | | | | | | | | |
Services – 0.1% | | | | | | | | | | | | |
Expedia, Inc.
8.50%, 7/01/16 | | | | | | | 1,750 | | | | 1,933,750 | |
| | | | | | | | | | | | |
| | | |
Technology – 0.1% | | | | | | | | | | | | |
Motorola, Inc.
6.50%, 9/01/25 | | | | | | | 2,035 | | | | 2,203,942 | |
7.50%, 5/15/25 | | | | | | | 325 | | | | 383,554 | |
| | | | | | | | | | | | |
| | | | | | | | | | | 2,587,496 | |
| | | | | | | | | | | | |
Transportation - Airlines – 0.1% | | | | | | | | | | | | |
Delta Air Lines, Inc.
Series 071A
6.821%, 8/10/22 | | | | | | | 1,196 | | | | 1,291,773 | |
| | | | | | | | | | | | |
| | | |
Transportation - Services – 0.2% | | | | | | | | | | | | |
Aviation Capital Group
7.125%, 10/15/20(a) | | | | | | | 3,872 | | | | 3,986,336 | |
| | | | | | | | | | | | |
| | | | | | | | | | | 86,958,218 | |
| | | | | | | | | | | | |
Non Corporate Sectors – 1.5% | | | | | | | | | | | | |
Agencies - Not Government Guaranteed – 1.5% | | | | | | | | | | | | |
Gaz Capital SA for Gazprom
6.212%, 11/22/16(a) | | | | | | | 2,825 | | | | 3,012,156 | |
6.51%, 3/07/22(a) | | | | | | | 9,473 | | | | 9,934,809 | |
9.25%, 4/23/19(a)(d) | | | | | | | 7,353 | | | | 9,117,720 | |
| | |
| 40 | | • ALLIANCEBERNSTEIN HIGH INCOME FUND |
Portfolio of Investments
| | | | | | | | | | | | |
| | | | | | Principal
Amount
(000) | | | U.S. $ Value | |
| | |
| | | | | | | | | | | | |
Petrobras International Finance Co.
5.75%, 1/20/20 | | | U.S.$ | | | | 3,050 | | | $ | 3,411,864 | |
TransCapitalInvest Ltd. for OJSC AK Transneft
5.67%, 3/05/14(a) | | | | | | | 869 | | | | 923,313 | |
7.70%, 8/07/13(a) | | | | | | | 3,477 | | | | 3,880,930 | |
8.70%, 8/07/18(a) | | | | | | | 1,219 | | | | 1,535,940 | |
VTB Capital SA
6.875%, 5/29/18(a) | | | | | | | 2,100 | | | | 2,207,625 | |
| | | | | | | | | | | | |
| | | | | | | | | | | 34,024,357 | |
| | | | | | | | | | | | |
Utility – 0.7% | | | | | | | | | | | | |
Electric – 0.4% | | | | | | | | | | | | |
Dominion Resources, Inc.
7.50%, 6/30/66(d) | | | | | | | 4,100 | | | | 4,274,250 | |
Empresas Publicas de Medellin ESP
7.625%, 7/29/19(a)(d) | | | | | | | 1,739 | | | | 2,112,885 | |
FirstEnergy Corp.
Series C
7.375%, 11/15/31 | | | | | | | 1,000 | | | | 1,075,872 | |
KCP&L Greater Missouri Operations Co.
11.875%, 7/01/12 | | | | | | | 1,000 | | | | 1,149,967 | |
| | | | | | | | | | | | |
| | | | | | | | | | | 8,612,974 | |
| | | | | | | | | | | | |
Natural Gas – 0.3% | | | | | | | | | | | | |
Enterprise Products Operating LLC
Series H
6.65%, 10/15/34 | | | | | | | 1,500 | | | | 1,663,867 | |
Southern Union Co.
7.60%, 2/01/24 | | | | | | | 3,200 | | | | 3,627,002 | |
TransCanada PipeLines Ltd.
6.35%, 5/15/67 | | | | | | | 2,500 | | | | 2,393,750 | |
| | | | | | | | | | | | |
| | | | | | | | | | | 7,684,619 | |
| | | | | | | | | | | | |
| | | | | | | | | | | 16,297,593 | |
| | | | | | | | | | | | |
Total Corporates – Investment Grades
(cost $232,481,790) | | | | | | | | | | | 257,418,644 | |
| | | | | | | | | | | | |
| | | | | | | | | | | | |
EMERGING MARKETS - SOVEREIGNS – 8.6% | | | | | | | | | | | | |
Argentina – 2.3% | | | | | | | | | | | | |
Republic of Argentina
2.50%, 12/31/38(j) | | | | | | | 14,680 | | | | 6,716,100 | |
7.00%, 10/03/15(d) | | | | | | | 21,871 | | | | 20,857,835 | |
7.82%, 12/31/33 | | | EUR | | | | 6,665 | | | | 7,259,141 | |
8.28%, 12/31/33(d) | | | U.S.$ | | | | 1,771 | | | | 1,675,468 | |
Series X
7.00%, 4/17/17 | | | | | | | 18,150 | | | | 16,260,383 | |
| | | | | | | | | | | | |
| | | | | | | | | | | 52,768,927 | |
| | | | | | | | | | | | |
| | | | |
| ALLIANCEBERNSTEIN HIGH INCOME FUND • | | | 41 | |
Portfolio of Investments
| | | | | | | | | | | | |
| | | | | | Principal
Amount
(000) | | | U.S. $ Value | |
| | |
| | | | | | | | | | | | |
Colombia – 1.2% | | | | | | | | | | | | |
Republic of Colombia
7.375%, 3/18/19 | | | U.S.$ | | | | 830 | | | $ | 1,062,400 | |
7.375%, 9/18/37(d) | | | | | | | 19,250 | | | | 25,602,500 | |
| | | | | | | | | | | | |
| | | | | | | | | | | 26,664,900 | |
| | | | | | | | | | | | |
Dominican Republic – 0.7% | | | | | | | | | | | | |
Dominican Republic
8.625%, 4/20/27(a) | | | | | | | 14,203 | | | | 17,043,600 | |
| | | | | | | | | | | | |
| | | |
Egypt – 0.1% | | | | | | | | | | | | |
Arab Republic of Egypt
6.875%, 4/30/40(a) | | | | | | | 1,096 | | | | 1,224,780 | |
| | | | | | | | | | | | |
| | | |
El Salvador – 0.7% | | | | | | | | | | | | |
El Salvador
7.375%, 12/01/19(a) | | | | | | | 1,495 | | | | 1,711,775 | |
7.625%, 9/21/34(a) | | | | | | | 872 | | | | 998,440 | |
7.65%, 6/15/35(a) | | | | | | | 11,545 | | | | 13,132,438 | |
7.75%, 1/24/23(a) | | | | | | | 700 | | | | 812,000 | |
| | | | | | | | | | | | |
| | | | | | | | | | | 16,654,653 | |
| | | | | | | | | | | | |
Gabon – 0.2% | | | | | | | | | | | | |
Gabonese Republic
8.20%, 12/12/17(a) | | | | | | | 3,208 | | | | 3,853,610 | |
| | | | | | | | | | | | |
| | | |
Ghana – 0.2% | | | | | | | | | | | | |
Republic of Ghana
8.50%, 10/04/17(a) | | | | | | | 4,524 | | | | 5,168,995 | |
| | | | | | | | | | | | |
| | | |
Indonesia – 0.6% | | | | | | | | | | | | |
Republic of Indonesia
6.625%, 2/17/37(a) | | | | | | | 2,560 | | | | 3,084,800 | |
7.75%, 1/17/38(a) | | | | | | | 6,347 | | | | 8,552,583 | |
8.50%, 10/12/35(a) | | | | | | | 1,645 | | | | 2,385,250 | |
| | | | | | | | | | | | |
| | | | | | | | | | | 14,022,633 | |
| | | | | | | | | | | | |
Jamaica – 0.0% | | | | | | | | | | | | |
Jamaica
8.00%, 6/24/19 | | | | | | | 718 | | | | 737,745 | |
| | | | | | | | | | | | |
| | | |
Philippines – 0.5% | | | | | | | | | | | | |
Republic of Philippines
8.375%, 6/17/19(d) | | | | | | | 2,101 | | | | 2,804,835 | |
9.50%, 2/02/30 | | | | | | | 1,393 | | | | 2,126,066 | |
9.875%, 1/15/19 | | | | | | | 820 | | | | 1,168,500 | |
10.625%, 3/16/25 | | | | | | | 3,239 | | | | 5,202,644 | |
| | | | | | | | | | | | |
| | | | | | | | | | | 11,302,045 | |
| | | | | | | | | | | | |
Serbia & Montenegro – 0.1% | | | | | | | | | | | | |
Republic of Serbia
6.75%, 11/01/24(a) | | | | | | | 1,818 | | | | 1,800,117 | |
| | | | | | | | | | | | |
| | |
| 42 | | • ALLIANCEBERNSTEIN HIGH INCOME FUND |
Portfolio of Investments
| | | | | | | | | | | | |
| | | | | | Principal
Amount
(000) | | | U.S. $ Value | |
| | |
| | | | | | | | | | | | |
Turkey – 0.5% | | | | | | | | | | | | |
Republic of Turkey
6.875%, 3/17/36(d) | | | U.S.$ | | | | 5,116 | | | $ | 6,158,385 | |
7.00%, 6/05/20 | | | | | | | 3,400 | | | | 4,216,000 | |
7.375%, 2/05/25 | | | | | | | 1,649 | | | | 2,094,230 | |
| | | | | | | | | | | | |
| | | | | | | | | | | 12,468,615 | |
| | | | | | | | | | | | |
Ukraine – 1.0% | | | | | | | | | | | | |
Ukraine Government International Bond
3.20%, 12/19/10 | | | JPY | | | | 730,000 | | | | 8,980,987 | |
6.385%, 6/26/12(a) | | | U.S.$ | | | | 750 | | | | 756,562 | |
6.58%, 11/21/16(a)(d) | | | | | | | 2,441 | | | | 2,398,282 | |
6.75%, 11/14/17(a) | | | | | | | 4,445 | | | | 4,378,325 | |
7.65%, 6/11/13(a) | | | | | | | 4,498 | | | | 4,666,675 | |
Ukraine-Recap Linked Note (db)
5.50%, 9/02/15(a) | | | UAH | | | | 27,000 | | | | 2,837,989 | |
| | | | | | | | | | | | |
| | | | | | | | | | | 24,018,820 | |
| | | | | | | | | | | | |
Uruguay – 0.3% | | | | | | | | | | | | |
Republica Orient Uruguay
6.875%, 9/28/25 | | | U.S.$ | | | | 4,272 | | | | 5,329,320 | |
7.625%, 3/21/36 | | | | | | | 550 | | | | 739,750 | |
7.875%, 1/15/33(c) | | | | | | | 1,377 | | | | 1,873,303 | |
| | | | | | | | | | | | |
| | | | | | | | | | | 7,942,373 | |
| | | | | | | | | | | | |
Venezuela – 0.2% | | | | | | | | | | | | |
Republic of Venezuela
6.00%, 12/09/20(a) | | | | | | | 4,433 | | | | 2,637,635 | |
7.65%, 4/21/25 | | | | | | | 4,403 | | | | 2,685,830 | |
| | | | | | | | | | | | |
| | | | | | | | | | | 5,323,465 | |
| | | | | | | | | | | | |
Total Emerging Markets – Sovereigns
(cost $155,338,587) | | | | | | | | | | | 200,995,278 | |
| | | | | | | | | | | | |
| | | | | | | | | | | | |
COMMERCIAL MORTGAGE-BACKED SECURITIES – 4.6% | | | | | | | | | | | | |
Non-Agency Fixed Rate CMBS – 4.3% | | | | | | | | | | | | |
Banc of America Commercial Mortgage, Inc.
Series 2006-4, Class AM
5.675%, 7/10/46 | | | | | | | 500 | | | | 503,729 | |
Series 2007-5, Class AM
5.772%, 2/10/51 | | | | | | | 4,676 | | | | 4,373,412 | |
Banc of America Large Loan, Inc.
Series 2009-UB1, Class A4B
5.699%, 6/24/50(a) | | | | | | | 3,500 | | | | 3,358,918 | |
Bear Stearns Commercial Mortgage Securities
Series 2005-PW10, Class AM
5.449%, 12/11/40 | | | | | | | 1,400 | | | | 1,402,846 | |
| | | | |
| ALLIANCEBERNSTEIN HIGH INCOME FUND • | | | 43 | |
Portfolio of Investments
| | | | | | | | | | | | |
| | | | | | Principal
Amount
(000) | | | U.S. $ Value | |
| | |
| | | | | | | | | | | | |
Series 2006-PW13, Class AM
5.582%, 9/11/41 | | | U.S.$ | | | | 308 | | | $ | 303,594 | |
Series 2007-PW18, Class AM
6.084%, 6/13/50 | | | | | | | 1,500 | | | | 1,415,231 | |
Credit Suisse First Boston Mortgage Securities Corp.
Series 2005-C6, Class AJ
5.23%, 12/15/40 | | | | | | | 3,200 | | | | 2,978,491 | |
Credit Suisse Mortgage Capital Certificates
Series 2006-C3, Class A3
5.826%, 6/15/38 | | | | | | | 5,686 | | | | 6,242,269 | |
Series 2006-C4, Class A3
5.467%, 9/15/39 | | | | | | | 5,320 | | | | 5,679,903 | |
Series 2006-C4, Class AM
5.509%, 9/15/39 | | | | | | | 5,600 | | | | 5,150,582 | |
Greenwich Capital Commercial Funding Corp.
Series 2006-GG7, Class AM
5.883%, 7/10/38 | | | | | | | 6,000 | | | | 6,025,066 | |
GS Mortgage Securities Corp. II
Series 2006-GG6, Class AM
5.622%, 4/10/38 | | | | | | | 3,000 | | | | 2,964,899 | |
JP Morgan Chase Commercial Mortgage Securities Corp.
Series 2006-CB15, Class AM
5.855%, 6/12/43 | | | | | | | 670 | | | | 640,727 | |
Series 2007-C1, Class A4
5.716%, 2/15/51 | | | | | | | 3,000 | | | | 3,162,069 | |
Series 2007-LD11, Class AM
5.818%, 6/15/49 | | | | | | | 5,105 | | | | 4,446,582 | |
LB-UBS Commercial Mortgage Trust
Series 2005-C2, Class AJ
5.205%, 4/15/30 | | | | | | | 2,475 | | | | 2,437,417 | |
Series 2006-C1, Class AM
5.217%, 2/15/31 | | | | | | | 2,100 | | | | 2,109,190 | |
Series 2007-C1, Class AM
5.455%, 2/15/40 | | | | | | | 5,500 | | | | 4,893,886 | |
Merrill Lynch Mortgage Trust
Series 2005-CIP1, Class AJ
5.137%, 7/12/38 | | | | | | | 2,700 | | | | 2,563,450 | |
Series 2007-C1, Class A4
5.826%, 6/12/50 | | | | | | | 1,700 | | | | 1,808,040 | |
Merrill Lynch/Countrywide Commercial Mortgage Trust
Series 2006-2, Class AM
5.915%, 6/12/46 | | | | | | | 1,450 | | | | 1,475,035 | |
Series 2006-3, Class AM
5.456%, 7/12/46 | | | | | | | 1,340 | | | | 1,306,954 | |
| | |
| 44 | | • ALLIANCEBERNSTEIN HIGH INCOME FUND |
Portfolio of Investments
| | | | | | | | | | | | |
| | | | | | Principal
Amount
(000) | | | U.S. $ Value | |
| | |
| | | | | | | | | | | | |
Series 2006-4, Class AM
5.204%, 12/12/49 | | | U.S.$ | | | | 10,100 | | | $ | 8,924,367 | |
Morgan Stanley Capital I
Series 2005-HQ6, Class AJ
5.073%, 8/13/42 | | | | | | | 1,417 | | | | 1,338,540 | |
Series 2006-IQ12, Class A4
5.332%, 12/15/43 | | | | | | | 7,100 | | | | 7,744,835 | |
Series 2006-IQ12, Class AM
5.37%, 12/15/43 | | | | | | | 7,876 | | | | 7,604,614 | |
Wachovia Bank Commercial Mortgage Trust
Series 2005-C20, Class AJ
5.143%, 7/15/42 | | | | | | | 1,810 | | | | 1,700,531 | |
Series 2006-C23, Class AM
5.466%, 1/15/45 | | | | | | | 2,400 | | | | 2,401,862 | |
Series 2006-C25, Class AM
5.737%, 5/15/43 | | | | | | | 3,700 | | | | 3,789,982 | |
Series 2006-C27, Class AM
5.795%, 7/15/45 | | | | | | | 2,000 | | | | 1,988,568 | |
| | | | | | | | | | | | |
| | | | | | | | | | | 100,735,589 | |
| | | | | | | | | | | | |
Non-Agency Floating Rate
CMBS – 0.3% | | | | | | | | | | | | |
Citigroup/Deutsche Bank Commercial Mortgage Trust
Series 2005-CD1, Class AJ
5.222%, 7/15/44 | | | | | | | 6,700 | | | | 6,399,115 | |
| | | | | | | | | | | | |
| | | |
Total Commercial Mortgage-Backed Securities
(cost $89,703,091) | | | | | | | | | | | 107,134,704 | |
| | | | | | | | | | | | |
| | | | | | | | | | | | |
GOVERNMENTS -
TREASURIES – 4.1% | | | | | | | | | | | | |
Brazil – 2.2% | | | | | | | | | | | | |
Brazil Notas do Tesouro Nacional
Series F
10.00%, 1/01/14-1/01/17 | | | BRL | | | | 41,980 | | | | 23,485,035 | |
Republic of Brazil
10.25%, 1/10/28(d) | | | | | | | 2,649 | | | | 1,686,687 | |
12.50%, 1/05/16(d) | | | | | | | 12,088 | | | | 8,229,054 | |
12.50%, 1/05/22 | | | | | | | 25,811 | | | | 18,368,117 | |
| | | | | | | | | | | | |
| | | | | | | | | | | 51,768,893 | |
| | | | | | | | | | | | |
Greece – 0.2% | | | | | | | | | | | | |
Hellenic Republic Government Bond
Series 30YR
4.60%, 9/20/40 | | | EUR | | | | 6,430 | | | | 5,032,087 | |
| | | | | | | | | | | | |
| | | | |
| ALLIANCEBERNSTEIN HIGH INCOME FUND • | | | 45 | |
Portfolio of Investments
| | | | | | | | | | | | |
| | | | | | Principal
Amount
(000) | | | U.S. $ Value | |
| | |
| | | | | | | | | | | | |
| | | |
Hungary – 0.6% | | | | | | | | | | | | |
Hungary Government Bond
Series 14/C
5.50%, 2/12/14 | | | HUF | | | | 1,175,500 | | | $ | 5,824,286 | |
Series 15/A
8.00%, 2/12/15 | | | | | | | 509,090 | | | | 2,723,847 | |
Series 16/C
5.50%, 2/12/16 | | | U.S.$ | | | | 1,131,580 | | | | 5,467,647 | |
| | | | | | | | | | | | |
| | | | | | | | | | | 14,015,780 | |
| | | | | | | | | | | | |
Ireland – 0.3% | | | | | | | | | | | | |
Ireland Government Bond
4.50%, 4/18/20 | | | EUR | | | | 4,768 | | | | 5,523,891 | |
| | | | | | | | | | | | |
| | | |
South Africa – 0.8% | | | | | | | | | | | | |
South Africa Government Bond
Series R203
8.25%, 9/15/17 | | | ZAR | | | | 78,000 | | | | 11,503,881 | |
Series R204
8.00%, 12/21/18 | | | | | | | 16,800 | | | | 2,436,297 | |
Series R207
7.25%, 1/15/20 | | | | | | | 7,600 | | | | 1,041,072 | |
Series R208
6.75%, 3/31/21 | | | | | | | 21,565 | | | | 2,821,047 | |
| | | | | | | | | | | | |
| | | | | | | | | | | 17,802,297 | |
| | | | | | | | | | | | |
Total Governments – Treasuries
(cost $80,805,518) | | | | | | | | | | | 94,142,948 | |
| | | | | | | | | | | | |
| | | | | | | | | | | | |
QUASI-SOVEREIGNS ��� 3.9% | | | | | | | | | | | | |
Quasi-Sovereign Bonds – 3.9% | | | | | | | | | | | | |
Indonesia – 0.3% | | | | | | | | | | | | |
Majapahit Holding BV
7.875%, 6/29/37(a) | | | U.S.$ | | | | 5,600 | | | | 6,916,000 | |
| | | | | | | | | | | | |
| | | |
Kazakhstan – 1.1% | | | | | | | | | | | | |
Intergas Finance BV
6.375%, 5/14/17(a) | | | | | | | 8,000 | | | | 8,640,000 | |
KazMunaiGaz Finance Sub BV
7.00%, 5/05/20(a) | | | | | | | 3,746 | | | | 3,981,998 | |
9.125%, 7/02/18(a) | | | | | | | 3,812 | | | | 4,583,100 | |
11.75%, 1/23/15(a) | | | | | | | 5,900 | | | | 7,316,000 | |
| | | | | | | | | | | | |
| | | | | | | | | | | 24,521,098 | |
| | | | | | | | | | | | |
Philippines – 0.0% | | | | | | | | | | | | |
Power Sector Assets & Liabilities Management Corp.
7.25%, 5/27/19(a) | | | | | | | 950 | | | | 1,157,813 | |
| | | | | | | | | | | | |
| | |
| 46 | | • ALLIANCEBERNSTEIN HIGH INCOME FUND |
Portfolio of Investments
| | | | | | | | | | | | |
| | | | | | Principal
Amount
(000) | | | U.S. $ Value | |
| | |
| | | | | | | | | | | | |
Russia – 1.6% | | | | | | | | | | | | |
RSHB Capital SA for OJSC Russian Agricultural Bank
6.299%, 5/15/17(a) | | | U.S.$ | | | | 17,519 | | | $ | 18,482,545 | |
7.125%, 1/14/14(a) | | | | | | | 4,785 | | | | 5,155,838 | |
7.75%, 5/29/18(a) | | | | | | | 11,479 | | | | 13,057,362 | |
| | | | | | | | | | | | |
| | | | | | | | | | | 36,695,745 | |
| | | | | | | | | | | | |
Trinidad & Tobago – 0.1% | | | | | | | | | | | | |
Petroleum Co. of Trinidad & Tobago Ltd.
9.75%, 8/14/19(a) | | | | | | | 2,150 | | | | 2,679,975 | |
| | | | | | | | | | | | |
| | | |
Ukraine – 0.3% | | | | | | | | | | | | |
Biz Finance PLC for Ukreximbank
8.375%, 4/27/15(a)(d) | | | | | | | 1,620 | | | | 1,662,525 | |
NAK Naftogaz Ukraine
9.50%, 9/30/14 | | | | | | | 5,978 | | | | 6,471,185 | |
| | | | | | | | | | | | |
| | | | | | | | | | | 8,133,710 | |
| | | | | | | | | | | | |
Venezuela – 0.5% | | | | | | | | | | | | |
Petroleos de Venezuela SA
5.25%, 4/12/17 | | | | | | | 1,730 | | | | 1,020,700 | |
5.375%, 4/12/27 | | | | | | | 19,894 | | | | 9,608,802 | |
| | | | | | | | | | | | |
| | | | | | | | | | | 10,629,502 | |
| | | | | | | | | | | | |
Total Quasi-Sovereigns
(cost $75,818,708) | | | | | | | | | | | 90,733,843 | |
| | | | | | | | | | | | |
| | | | | | | | | | | | |
EMERGING MARKETS -
TREASURIES – 2.9% | | | | | | | | | | | | |
Colombia – 1.0% | | | | | | | | | | | | |
Republic of Colombia
12.00%, 10/22/15(d) | | | COP | | | | 15,901,000 | | | | 11,610,419 | |
9.85%, 6/28/27(d) | | | | | | | 1,391,000 | | | | 1,130,254 | |
7.75%, 4/14/21 | | | | | | | 14,796,000 | | | | 9,770,122 | |
| | | | | | | | | | | | |
| | | | | | | | | | | 22,510,795 | |
| | | | | | | | | | | | |
Egypt – 0.2% | | | | | | | | | | | | |
Egypt
8.75%, 7/18/12(a) | | | EGP | | | | 21,900 | | | | 3,754,448 | |
| | | | | | | | | | | | |
| | | |
Indonesia – 0.3% | | | | | | | | | | | | |
Indonesia Recap Linked Note
10.00%, 7/18/17 | | | IDR | | | | 63,808,000 | | | | 8,281,654 | |
| | | | | | | | | | | | |
| | | |
Turkey – 1.4% | | | | | | | | | | | | |
Turkey Government Bond
11.00%, 8/06/14 | | | TRY | | | | 17,375 | | | | 13,421,759 | |
16.00%, 3/07/12 | | | | | | | 3,248 | | | | 2,510,997 | |
10.00%, 6/17/15 | | | | | | | 22,000 | | | | 16,419,284 | |
| | | | | | | | | | | | |
| | | | | | | | | | | 32,352,040 | |
| | | | | | | | | | | | |
Total Emerging Markets – Treasuries
(cost $58,009,198) | | | | | | | | | | | 66,898,937 | |
| | | | | | | | | | | | |
| | | | |
| ALLIANCEBERNSTEIN HIGH INCOME FUND • | | | 47 | |
Portfolio of Investments
| | | | | | | | | | | | |
| | | | | | Principal
Amount
(000) | | | U.S. $ Value | |
| | |
| | | | | | | | | | | | |
EMERGING MARKETS - CORPORATE BONDS – 2.5% | | | | | | | | | | | | |
Financial Institutions – 0.4% | | | | | | | | | | | | |
Banking – 0.3% | | | | | | | | | | | | |
Alfa Bond Issuance PLC for OJSC Alfa Bank
8.625%, 12/09/15 | | | U.S.$ | | | | 900 | | | $ | 897,750 | |
ATF Bank JSC
9.00%, 5/11/16(a) | | | | | | | 2,564 | | | | 2,781,940 | |
Banco BMG SA
9.15%, 1/15/16(a) | | | | | | | 1,300 | | | | 1,443,000 | |
Banco Cruzeiro do Sul SA
8.875%, 9/22/20(a)(d) | | | | | | | 1,000 | | | | 1,047,500 | |
CenterCredit International BV
8.625%, 1/30/14(a) | | | | | | | 1,734 | | | | 1,822,868 | |
| | | | | | | | | | | | |
| | | | | | | | | | | 7,993,058 | |
| | | | | | | | | | | | |
Other Finance – 0.1% | | | | | | | | | | | | |
AES El Salvador Trust
6.75%, 2/01/16(a) | | | | | | | 1,200 | | | | 1,159,717 | |
| | | | | | | | | | | | |
| | | | | | | | | | | 9,152,775 | |
| | | | | | | | | | | | |
Industrial – 2.1% | | | | | | | | | | | | |
Basic – 0.2% | | | | | | | | | | | | |
Braskem SA
7.00%, 5/07/20(a) | | | | | | | 2,300 | | | | 2,470,200 | |
PE Paper Escrow GMBH
12.00%, 8/01/14(a) | | | | | | | 791 | | | | 917,425 | |
| | | | | | | | | | | | |
| | | | | | | | | | | 3,387,625 | |
| | | | | | | | | | | | |
Communications -
Telecommunications – 0.2% | | | | | | | | | | | | |
MTS International Funding Ltd.
8.625%, 6/22/20(a) | | | | | | | 4,400 | | | | 5,109,500 | |
| | | | | | | | | | | | |
| | | |
Consumer Cyclical - Other – 0.4% | | | | | | | | | | | | |
MCE Finance Ltd.
10.25%, 5/15/18(a) | | | | | | | 4,095 | | | | 4,622,231 | |
Peermont Global Pty Ltd.
7.75%, 4/30/14(a) | | | EUR | | | | 3,400 | | | | 4,365,381 | |
Royal Caribbean Cruises Ltd.
7.25%, 3/15/18 | | | U.S.$ | | | | 1,000 | | | | 1,087,500 | |
| | | | | | | | | | | | |
| | | | | | | | | | | 10,075,112 | |
| | | | | | | | | | | | |
Consumer Cyclical - Retailers – 0.2% | | | | | | | | | | | | |
Edcon Holdings Proprietary Ltd.
6.379%, 6/15/15(a)(b) | | | EUR | | | | 3,734 | | | | 4,196,562 | |
| | | | | | | | | | | | |
| | |
| 48 | | • ALLIANCEBERNSTEIN HIGH INCOME FUND |
Portfolio of Investments
| | | | | | | | | | | | |
| | | | | | Principal
Amount
(000) | | | U.S. $ Value | |
| | |
| | | | | | | | | | | | |
Consumer Non-Cyclical – 0.5% | | | | | | | | | | | | |
CEDC Finance Corp. International, Inc.
8.875%, 12/01/16(a)(d) | | | U.S.$ | | | | 1,800 | | | $ | 2,680,607 | |
9.125%, 12/01/16(a) | | | | | | | 1,150 | | | | 1,242,000 | |
Foodcorp Ltd.
8.875%, 6/15/12(a) | | | EUR | | | | 1,956 | | | | 2,766,599 | |
JBS Finance II Ltd.
8.25%, 1/29/18(a) | | | U.S.$ | | | | 4,750 | | | | 5,023,125 | |
| | | | | | | | | | | | |
| | | | | | | | | | | 11,712,331 | |
| | | | | | | | | | | | |
Energy – 0.2% | | | | | | | | | | | | |
Ecopetrol SA
7.625%, 7/23/19 | | | | | | | 1,722 | | | | 2,118,060 | |
Pan American Energy LLC/Argentine Branch
7.875%, 5/07/21(a) | | | | | | | 2,360 | | | | 2,501,600 | |
| | | | | | | | | | | | |
| | | | | | | | | | | 4,619,660 | |
| | | | | | | | | | | | |
Other Industrial – 0.3% | | | | | | | | | | | | |
Marfrig Overseas Ltd.
9.50%, 5/04/20(a) | | | | | | | 3,659 | | | | 3,924,278 | |
New Reclamation Group Pty Ltd. (The)
8.125%, 2/01/13(a) | | | EUR | | | | 2,487 | | | | 2,959,374 | |
Savcio Holdings Pty Ltd.
8.00%, 2/15/13(a) | | | | | | | 290 | | | | 399,586 | |
| | | | | | | | | | | | |
| | | | | | | | | | | 7,283,238 | |
| | | | | | | | | | | | |
Technology – 0.1% | | | | | | | | | | | | |
MagnaChip Semiconductor SA/MagnaChip Semiconductor Finance Co.
10.50%, 4/15/18(a) | | | U.S.$ | | | | 2,000 | | | | 2,145,000 | |
| | | | | | | | | | | | |
| | | | | | | | | | | 2,145,000 | |
| | | | | | | | | | | | |
| | | | | | | | | | | 48,529,028 | |
| | | | | | | | | | | | |
Total Emerging Markets – Corporate Bonds
(cost $52,965,014) | | | | | | | | | | | 57,681,803 | |
| | | | | | | | | | | | |
| | | | | | | | | | | | |
CMOs – 2.3% | | | | | | | | | | | | |
Non-Agency Fixed Rate – 1.1% | | | | | | | | | | | | |
Chaseflex Trust
Series 2007-1, Class 1A3
6.50%, 2/25/37 | | | | | | | 1,801 | | | | 1,328,693 | |
Citimortgage Alternative Loan Trust
Series 2007-A3, Class 1A4
5.75%, 3/25/37 | | | | | | | 4,400 | | | | 3,350,169 | |
Countrywide Alternative Loan Trust
Series 2006-42, Class 1A6
6.00%, 1/25/47 | | | | | | | 3,515 | | | | 2,364,078 | |
Series 2006-J1, Class 1A10
5.50%, 2/25/36 | | | | | | | 5,400 | | | | 3,748,036 | |
| | | | |
| ALLIANCEBERNSTEIN HIGH INCOME FUND • | | | 49 | |
Portfolio of Investments
| | | | | | | | | | | | |
| | | | | | Principal
Amount
(000) | | | U.S. $ Value | |
| | |
| | | | | | | | | | | | |
Series 2006-J5, Class 1A1
6.50%, 9/25/36 | | | U.S.$ | | | | 3,260 | | | $ | 1,997,730 | |
Cwalt 2007-16cb 1a7
Series 2007-16CB, Class 1A7
6.00%, 8/25/37 | | | | | | | 2,692 | | | | 2,203,516 | |
Washington Mutual Alternative Mortgage
Pass-Through Certificates
Series 2006-7, Class A3
6.081%, 9/25/36 | | | | | | | 3,684 | | | | 2,495,953 | |
Series 2006-7, Class A4
6.171%, 9/25/36 | | | | | | | 3,532 | | | | 1,932,286 | |
Series 2006-9, Class A4
5.986%, 10/25/36 | | | | | | | 3,900 | | | | 2,830,581 | |
Wells Fargo Alternative Loan Trust
Series 2007-PA3, Class 3A1
6.25%, 7/25/37 | | | | | | | 4,764 | | | | 3,701,630 | |
| | | | | | | | | | | | |
| | | | | | | | | | | 25,952,672 | |
| | | | | | | | | | | | |
Non-Agency Floating Rate – 1.1% | | | | | | | | | | | | |
Countrywide Alternative Loan Trust
Series 2005-27, Class 2A3
1.913%, 8/25/35(b) | | | | | | | 7,750 | | | | 4,705,878 | |
Series 2005-76, Class 2A1
1.353%, 2/25/36(b) | | | | | | | 1,147 | | | | 758,166 | |
Series 2007-7T2, Class A3
0.856%, 4/25/37(b) | | | | | | | 6,059 | | | | 3,265,339 | |
Countrywide Home Loan Mortgage Pass Through Trust
Series 2007-13, Class A7
0.856%, 8/25/37(b) | | | | | | | 3,885 | | | | 3,172,502 | |
Harborview Mortgage Loan Trust
Series 2005-7, Class 1A1
3.603%, 6/19/45(b) | | | | | | | 7,641 | | | | 4,432,916 | |
LXS 2007-15N
Series 2007-15N, Class 4A1
1.156%, 8/25/47(b) | | | | | | | 1,650 | | | | 914,004 | |
Structured Asset Mortgage Investments, Inc.
Series 2007-AR6, Class A1
1.853%, 8/25/47(b) | | | | | | | 9,408 | | | | 5,686,219 | |
WaMu Mortgage Pass Through Certificates
Series 2006-AR3, Class A1A
1.353%, 2/25/46(b) | | | | | | | 2,202 | | | | 1,500,237 | |
Washington Mutual Alternative Mortgage Pass-Through Certificates
Series 2007-OA4, Class A1A
1.113%, 4/25/47(b) | | | | | | | 2,133 | | | | 1,163,331 | |
| | | | | | | | | | | | |
| | | | | | | | | | | 25,598,592 | |
| | | | | | | | | | | | |
| | |
| 50 | | • ALLIANCEBERNSTEIN HIGH INCOME FUND |
Portfolio of Investments
| | | | | | | | | | | | |
| | | | | | Principal
Amount
(000) | | | U.S. $ Value | |
| | |
| | | | | | | | | | | | |
Non-Agency ARMs – 0.1% | | | | | | | | | | | | |
American Home Mortgage Assets
Series 2006-5, Class A1
1.273%, 11/25/46(b) | | | U.S.$ | | | | 4,891 | | | $ | 2,305,564 | |
| | | | | | | | | | | | |
| | | |
Total CMOs
(cost $51,969,561) | | | | | | | | | | | 53,856,828 | |
| | | | | | | | | | | | |
| | | | | | | | | | | | |
GOVERNMENTS - SOVEREIGN
BONDS – 2.0% | | | | | | | | | | | | |
Brazil – 0.3% | | | | | | | | | | | | |
Republic of Brazil
7.125%, 1/20/37 | | | | | | | 2,588 | | | | 3,416,160 | |
8.25%, 1/20/34 | | | | | | | 2,022 | | | | 2,962,230 | |
| | | | | | | | | | | | |
| | | | | | | | | | | 6,378,390 | |
| | | | | | | | | | | | |
Cote D’Ivoire – 0.1% | | | | | | | | | | | | |
Ivory Coast Government International Bond
2.50%, 12/31/32(a)(k) | | | | | | | 4,000 | | | | 2,460,000 | |
| | | | | | | | | | | | |
| | | |
Croatia – 0.4% | | | | | | | | | | | | |
Republic of Croatia
6.625%, 7/14/20(a) | | | | | | | 5,350 | | | | 6,055,103 | |
6.75%, 11/05/19(a)(d) | | | | | | | 3,280 | | | | 3,739,200 | |
| | | | | | | | | | | | |
| | | | | | | | | | | 9,794,303 | |
| | | | | | | | | | | | |
Hungary – 0.1% | | | | | | | | | | | | |
Republic of Hungary
6.25%, 1/29/20 | | | | | | | 2,772 | | | | 3,000,690 | |
| | | | | | | | | | | | |
| | | |
Iceland – 0.2% | | | | | | | | | | | | |
Iceland Government International Bond
3.75%, 12/01/11 | | | EUR | | | | 2,750 | | | | 3,687,289 | |
| | | | | | | | | | | | |
| | | |
Lithuania – 0.3% | | | | | | | | | | | | |
Republic of Lithuania
6.75%, 1/15/15(a) | | | U.S.$ | | | | 3,815 | | | | 4,244,187 | |
7.375%, 2/11/20(a) | | | | | | | 2,202 | | | | 2,551,568 | |
| | | | | | | | | | | | |
| | | | | | | | | | | 6,795,755 | |
| | | | | | | | | | | | |
Panama – 0.4% | | | | | | | | | | | | |
Republic of Panama
6.70%, 1/26/36 | | | | | | | 1,317 | | | | 1,654,810 | |
8.875%, 9/30/27 | | | | | | | 2,709 | | | | 4,049,955 | |
9.375%, 4/01/29 | | | | | | | 2,946 | | | | 4,522,110 | |
| | | | | | | | | | | | |
| | | | | | | | | | | 10,226,875 | |
| | | | | | | | | | | | |
| | | | |
| ALLIANCEBERNSTEIN HIGH INCOME FUND • | | | 51 | |
Portfolio of Investments
| | | | | | | | | | | | |
| | | | | | Principal
Amount
(000) | | | U.S. $ Value | |
| | |
| | | | | | | | | | | | |
Peru – 0.2% | | | | | | | | | | | | |
Republic of Peru
8.75%, 11/21/33 | | | U.S.$ | | | | 2,738 | | | $ | 4,161,760 | |
| | | | | | | | | | | | |
| | | |
Total Governments – Sovereign Bonds
(cost $38,321,868) | | | | | | | | | | | 46,505,062 | |
| | | | | | | | | | | | |
| | | | | | | | | | | | |
BANK LOANS – 1.8% | | | | | | | | | | | | |
Industrial – 1.6% | | | | | | | | | | | | |
Basic – 0.1% | | | | | | | | | | | | |
Hexion Specialty Chemicals, Inc.
4.06%, 5/05/15(b) | | | | | | | 210 | | | | 204,307 | |
Ineos US Finance LLC
7.50%, 12/16/13(b) | | | | | | | 113 | | | | 115,063 | |
8.00%, 12/16/14(b) | | | | | | | 129 | | | | 132,183 | |
John Maneely Company
3.54%, 12/09/13(b) | | | | | | | 403 | | | | 391,792 | |
Smurfit-Stone Container Enterprises, Inc.
6.75%, 2/22/16(b) | | | | | | | 998 | | | | 1,005,520 | |
| | | | | | | | | | | | |
| | | | | | | | | | | 1,848,865 | |
| | | | | | | | | | | | |
Capital Goods – 0.2% | | | | | | | | | | | | |
Anchor Glass Container Corporation
6.00%, 3/02/16(b) | | | | | | | 664 | | | | 664,183 | |
Graham Packaging Company, L.P.
6.75%, 4/05/14(b) | | | | | | | 765 | | | | 770,561 | |
Graphic Packaging International, Inc.
3.00%-3.04%, 5/16/14(b) | | | | | | | 202 | | | | 200,928 | |
Hawker Beechcraft Acquisition Company LLC
2.26%-2.29%, 3/26/14(b) | | | | | | | 120 | | | | 101,526 | |
2.29%, 3/26/14(b) | | | | | | | 7 | | | | 6,070 | |
10.50%, 3/26/14(b) | | | | | | | 2,871 | | | | 2,860,234 | |
| | | | | | | | | | | | |
| | | | | | | | | | | 4,603,502 | |
| | | | | | | | | | | | |
Communications - Media – 0.3% | | | | | | | | | | | | |
Cengage Learning Acquisitions, Inc. (Thomson Learning)
2.54%, 7/03/14(b) | | | | | | | 1,216 | | | | 1,112,437 | |
Charter Communications Operating, LLC
2.26%, 3/06/14(b) | | | | | | | 869 | | | | 852,056 | |
7.25%, 3/06/14(b) | | | | | | | 1,086 | | | | 1,123,375 | |
Clear Channel Communications, Inc.
3.91%, 1/29/16(b) | | | | | | | 169 | | | | 134,358 | |
SuperMedia Inc. (fka Idearc Inc.)
11.00%, 12/31/15(b) | | | | | | | 327 | | | | 244,082 | |
Univision Communications Inc.
4.51%, 3/31/17(b) | | | | | | | 2,345 | | | | 2,216,057 | |
| | |
| 52 | | • ALLIANCEBERNSTEIN HIGH INCOME FUND |
Portfolio of Investments
| | | | | | | | | | | | |
| | | | | | Principal
Amount
(000) | | | U.S. $ Value | |
| | |
| | | | | | | | | | | | |
WideOpenWest Finance , LLC
2.76%-4.75%, 6/30/14(b) | | | U.S.$ | | | | 978 | | | $ | 905,863 | |
| | | | | | | | | | | | |
| | | | | | | | | | | 6,588,228 | |
| | | | | | | | | | | | |
Communications - Telecommunications – 0.2% | | | | | | | | | | | | |
LightSquared LP
12.00%, 10/01/14(b) | | | | | | | 5,200 | | | | 4,764,500 | |
| | | | | | | | | | | | |
| | | |
Consumer Cyclical -
Automotive – 0.1% | | | | | | | | | | | | |
Allison Transmission, Inc.
3.01%-3.05%, 8/07/14(b) | | | | | | | 965 | | | | 925,304 | |
Federal-Mogul Corporation
2.20%, 12/29/14-12/28/15(b) | | | | | | | 1,985 | | | | 1,758,101 | |
Ford Motor Company
3.01%-3.05%, 12/15/13(b) | | | | | | | 214 | | | | 211,596 | |
| | | | | | | | | | | | |
| | | | | | | | | | | 2,895,001 | |
| | | | | | | | | | | | |
Consumer Cyclical -
Entertainment – 0.0% | | | | | | | | | | | | |
Las Vegas Sands, LLC
3.03%, 11/23/16(b) | | | | | | | 324 | | | | 303,510 | |
| | | | | | | | | | | | |
| | | |
Consumer Cyclical - Other – 0.1% | | | | | | | | | | | | |
Harrah’s Operating Company, Inc.
3.29%, 1/28/15(b) | | | | | | | 601 | | | | 530,114 | |
Willbros United States Holdings, Inc., 6/30/14(l) | | | | | | | 2,000 | | | | 1,980,000 | |
| | | | | | | | | | | | |
| | | | | | | | | | | 2,510,114 | |
| | | | | | | | | | | | |
Consumer Cyclical - Retailers – 0.1% | | | | | | | | | | | | |
Burlington Coat Factory Warehouse Corporation
2.51%-2.53%, 5/28/13(b) | | | | | | | 280 | | | | 272,156 | |
Rite Aid Corporation
2.01%, 6/04/14(b) | | | | | | | 992 | | | | 892,425 | |
| | | | | | | | | | | | |
| | | | | | | | | | | 1,164,581 | |
| | | | | | | | | | | | |
Energy – 0.1% | | | | | | | | | | | | |
Ashmore Energy International
3.29%, 3/30/12-3/30/14(b) | | | | | | | 894 | | | | 862,384 | |
Citgo Petroleum Corp.
9.00%, 6/24/17(b) | | | | | | | 1,895 | | | | 1,944,413 | |
| | | | | | | | | | | | |
| | | | | | | | | | | 2,806,797 | |
| | | | | | | | | | | | |
Other Industrial – 0.2% | | | | | | | | | | | | |
Metaldyne, LLC,
10/22/16(l) | | | | | | | 4,600 | | | | 4,657,500 | |
| | | | | | | | | | | | |
Services – 0.1% | | | | | | | | | | | | |
Aveta Inc.
8.00%, 4/14/15(b) | | | | | | | 241 | | | | 233,828 | |
| | | | |
| ALLIANCEBERNSTEIN HIGH INCOME FUND • | | | 53 | |
Portfolio of Investments
| | | | | | | | | | | | |
| | | | | | Principal
Amount
(000) | | | U.S. $ Value | |
| | |
| | | | | | | | | | | | |
Koosharem LLC
10.25%, 6/30/14(b)(c) | | | U.S.$ | | | | 2,657 | | | $ | 1,830,261 | |
Sabre Inc.
2.26%-2.29%, 9/30/14(b) | | | | | | | 495 | | | | 470,842 | |
ServiceMaster Company, (The)
2.76%, 7/24/14(b) | | | | | | | 18 | | | | 16,993 | |
2.76%-2.80%, 7/24/14(b) | | | | | | | 180 | | | | 170,644 | |
| | | | | | | | | | | | |
| | | | | | | | | | | 2,722,568 | |
| | | | | | | | | | | | |
Technology – 0.1% | | | | | | | | | | | | |
Avaya Inc.
3.06%, 10/24/14(b) | | | | | | | 592 | | | | 537,299 | |
First Data Corporation
3.01%, 9/24/14(b) | | | | | | | 694 | | | | 623,071 | |
SunGard Data Systems Inc. (Solar Capital Corp.)
2.01%, 2/28/14(b) | | | | | | | 25 | | | | 24,275 | |
3.90%-4.04%, 2/28/16(b) | | | | | | | 359 | | | | 355,159 | |
| | | | | | | | | | | | |
| | | | | | | | | | | 1,539,804 | |
| | | | | | | | | | | | |
Transportation - Services – 0.0% | | | | | | | | | | | | |
Swift Transportation Co., Inc.
8.25%, 5/12/14(b) | | | | | | | 245 | | | | 242,050 | |
| | | | | | | | | | | | |
| | | | | | | | | | | 36,647,020 | |
| | | | | | | | | | | | |
Financial Institutions – 0.1% | | | | | | | | | | | | |
Finance – 0.0% | | | | | | | | | | | | |
CIT Group, Inc.
6.25%, 8/11/15(b) | | | | | | | 466 | | | | 473,278 | |
Delos Aircraft Inc.
7.00%, 3/17/16(b) | | | | | | | 106 | | | | 108,119 | |
International Lease Finance Corp (Delos Aircraft Inc)
6.75%, 3/17/15(b) | | | | | | | 144 | | | | 147,409 | |
| | | | | | | | | | | | |
| | | | | | | | | | | 728,806 | |
| | | | | | | | | | | | |
Insurance – 0.0% | | | | | | | | | | | | |
Asurion, LLC (fka Asurion Corporation),
3/31/15(l) | | | | | | | 1,000 | | | | 981,250 | |
3.26%-3.40%, 7/03/14(b) | | | | | | | 297 | | | | 276,210 | |
| | | | | | | | | | �� | | |
| | | | | | | | | | | 1,257,460 | |
| | | | | | | | | | | | |
REITS – 0.1% | | | | | | | | | | | | |
Capital Automotive L.P.
2.76%, 12/14/12(b) | | | | | | | 1,506 | | | | 1,486,768 | |
| | | | | | | | | | | | |
| | | | | | | | | | | 3,473,034 | |
| | | | | | | | | | | | |
Utility – 0.1% | | | | | | | | | | | | |
Electric – 0.1% | | | | | | | | | | | | |
FirstLight Power Resources, Inc. (fka NE Energy, Inc.)
2.81%, 11/01/13(b) | | | | | | | 303 | | | | 284,927 | |
| | |
| 54 | | • ALLIANCEBERNSTEIN HIGH INCOME FUND |
Portfolio of Investments
| | | | | | | | | | | | |
| | | | | | Principal
Amount
(000) | | | U.S. $ Value | |
| | |
| | | | | | | | | | | | |
4.81%, 5/01/14(b) | | | U.S.$ | | | | 1,000 | | | $ | 917,500 | |
Texas Competitive Electric Holdings Company, LLC (TXU)
3.76%-4.07%, 10/10/14(b) | | | | | | | 1,702 | | | | 1,324,442 | |
| | | | | | | | | | | | |
| | | | | | | | | | | 2,526,869 | |
| | | | | | | | | | | | |
Total Bank Loans
(cost $42,677,558) | | | | | | | | | | | 42,646,923 | |
| | | | | | | | | | | | |
| | | | | | | | | | | | |
ASSET-BACKED SECURITIES – 1.3% | | | | | | | | | | | | |
Home Equity Loans -
Fixed Rate – 1.0% | | | | | | | | | | | | |
Countrywide Asset-Backed Certificates
Series 2005-7, Class AF5W
5.054%, 10/25/35 | | | | | | | 2,108 | | | | 1,489,498 | |
Series 2006-1, Class AF6
5.526%, 7/25/36 | | | | | | | 2,771 | | | | 2,147,860 | |
Series 2006-15, Class A3
5.689%, 10/25/46 | | | | | | | 2,400 | | | | 1,727,166 | |
CSAB Mortgage Backed Trust
Series 2006-2, Class A6A
5.72%, 9/25/36 | | | | | | | 2,156 | | | | 1,563,857 | |
GSAA Trust
Series 2005-12, Class AF5
5.659%, 9/25/35 | | | | | | | 2,300 | | | | 1,785,394 | |
Series 2006-10, Class AF3
5.985%, 6/25/36 | | | | | | | 2,559 | | | | 1,578,806 | |
Halo 2007-wf1 A3
Series 2007-WF1, Class A3
5.73%, 12/25/36 | | | | | | | 3,564 | | | | 1,684,884 | |
JP Morgan Mortgage Acquisition Corp.
Series 2007-CH2, Class AF3
5.552%, 1/25/37 | | | | | | | 1,750 | | | | 1,104,438 | |
LXS 2006-17
Series 2006-17, Class WF32
5.55%, 11/25/36 | | | | | | | 3,400 | | | | 2,777,515 | |
LXS 2007-6
Series 2007-6, Class 3A5
5.72%, 5/25/37 | | | | | | | 1,319 | | | | 879,171 | |
Morgan Stanley Mortgage Loan Trust
Series 2006-15XS, Class A3
5.988%, 11/25/36 | | | | | | | 2,500 | | | | 1,467,980 | |
Series 2007-8XS, Class A2
6.00%, 4/25/37 | | | | | | | 2,400 | | | | 1,734,289 | |
Ramc 2007-2 Af6
Series 2007-2, Class AF6
5.879%, 6/25/37 | | | | | | | 2,044 | | | | 1,170,538 | |
| | | | |
| ALLIANCEBERNSTEIN HIGH INCOME FUND • | | | 55 | |
Portfolio of Investments
| | | | | | | | | | | | |
| | | | | | Principal
Amount
(000) | | | U.S. $ Value | |
| | |
| | | | | | | | | | | | |
Renaissance Home Equity Loan Trust
Series 2007-3, Class AF3
7.238%, 9/25/37 | | | U.S.$ | | | | 5,800 | | | $ | 3,219,520 | |
| | | | | | | | | | | | |
| | | | | | | | | | | 24,330,916 | |
| | | | | | | | | | | | |
Home Equity Loans - Floating
Rate – 0.3% | | | | | | | | | | | | |
Cbass 2007-cb3 A3
Series 2007-CB3, Class A3
5.419%, 3/25/37(b) | | | | | | | 2,155 | | | | 1,164,474 | |
Countrywide Asset-Backed Certificates
Series 2006-S10, Class A1
0.366%, 10/25/36(b) | | | | | | | 47 | | | | 46,451 | |
Series 2007-S2, Class A1
0.396%, 5/25/37(b) | | | | | | | 998 | | | | 847,450 | |
Credit-Based Asset Servicing and Securitization LLC
Series 2007-CB2, Class A2C
4.94%, 2/25/37(b) | | | | | | | 4,700 | | | | 2,893,050 | |
GSAA Home Equity Trust
Series 2006-6, Class AF4
6.121%, 3/25/36(b) | | | | | | | 1,955 | | | | 1,093,619 | |
Series 2006-6, Class AF5
6.241%, 3/25/36(b) | | | | | | | 1,466 | | | | 803,772 | |
| | | | | | | | | | | | |
| | | | | | | | | | | 6,848,816 | |
| | | | | | | | | | | | |
Total Asset-Backed Securities
(cost $30,567,380) | | | | | | | | | | | 31,179,732 | |
| | | | | | | | | | | | |
| | | |
| | | | | | Shares | | | | |
PREFERRED STOCKS – 1.0% | | | | | | | | | | | | |
Industrial – 0.6% | | | | | | | | | | | | |
Communications -
Telecommunications – 0.3% | | | | | | | | | | | | |
Centaur Funding Corp.
9.08%(a) | | | | | | | 6,280 | | | | 6,762,775 | |
| | | | | | | | | | | | |
| | | |
Consumer Cyclical - Other – 0.3% | | | | | | | | | | | | |
Las Vegas Sands Corp.
10.00% | | | | | | | 51,000 | | | | 5,801,250 | |
| | | | | | | | | | | | |
| | | | | | | | | | | 12,564,025 | |
| | | | | | | | | | | | |
Financial Institutions – 0.4% | | | | | | | | | | | | |
Banking – 0.2% | | | | | | | | | | | | |
Capital One Capital II
7.50% | | | | | | | 130,000 | | | | 3,277,300 | |
Santander Finance Preferred SA Unipersonal
6.80% | | | | | | | 67,000 | | | | 1,622,070 | |
| | | | | | | | | | | | |
| | | | | | | | | | | 4,899,370 | |
| | | | | | | | | | | | |
| | |
| 56 | | • ALLIANCEBERNSTEIN HIGH INCOME FUND |
Portfolio of Investments
| | | | | | | | | | | | |
| | | | | |
Shares | | | U.S. $ Value | |
| | |
| | | | | | | | | | | | |
Finance – 0.2% | | | | | | | | | | | | |
Ally Financial, Inc.
7.00%(a) | | | | | | | 479 | | | $ | 425,681 | |
Citigroup Capital XII
8.50% | | | | | | | 77,000 | | | | 2,030,490 | |
Citigroup Capital XIII
7.875%(k) | | | | | | | 86,298 | | | | 2,286,897 | |
| | | | | | | | | | | | |
| | | | | | | | | | | 4,743,068 | |
| | | | | | | | | | | | |
REITS – 0.0% | | | | | | | | | | | | |
Sovereign Real Estate Investment Trust
12.00%(a) | | | | | | | 501 | | | | 582,413 | |
| | | | | | | | | | | | |
| | | | | | | | | | | 10,224,851 | |
| | | | | | | | | | | | |
Non Corporate Sectors – 0.0% | | | | | | | | | | | | |
Agencies - Government
Sponsored – 0.0% | | | | | | | | | | | | |
Federal Home Loan Mortgage Corp.
Series Z
8.375% | | | | | | | 11,250 | | | | 5,963 | |
Federal National Mortgage Association
8.25% | | | | | | | 51,350 | | | | 28,242 | |
| | | | | | | | | | | | |
| | | | | | | | | | | 34,205 | |
| | | | | | | | | | | | |
Total Preferred Stocks
(cost $23,704,548) | | | | | | | | | | | 22,823,081 | |
| | | | | | | | | | | | |
| | | |
| | | | | | Principal
Amount
(000) | | | | |
SUPRANATIONALS – 0.4% | | | | | | | | | | | | |
Eurasian Development Bank
7.375%, 9/29/14(a) | | | | | | | 1,760 | | | | 1,944,800 | |
European Investment Bank
Zero Coupon, 4/24/13(a) | | | IDR | | | | 82,770,270 | | | | 8,111,718 | |
| | | | | | | | | | | | |
| | | |
Total Supranationals
(cost $9,906,138) | | | | | | | | | | | 10,056,518 | |
| | | | | | | | | | | | |
| | | | | | | | | | | | |
LOCAL GOVERNMENTS - REGIONAL BONDS – 0.3% | | | | | | | | | | | | |
Colombia – 0.2% | | | | | | | | | | | | |
Bogota Distrio Capital
9.75%, 7/26/28(a) | | | COP | | | | 6,665,000 | | | | 5,208,252 | |
| | | | | | | | | | | | |
Argentina – 0.1% | | | | | | | | | | | | |
Provincia de Cordoba
12.375%, 8/17/17(a) | | | U.S.$ | | | | 1,726 | | | | 1,807,985 | |
| | | | | | | | | | | | |
| | | |
Total Local Governments – Regional Bonds
(cost $4,430,097) | | | | | | | | | | | 7,016,237 | |
| | | | | | | | | | | | |
| | | | |
| ALLIANCEBERNSTEIN HIGH INCOME FUND • | | | 57 | |
Portfolio of Investments
| | | | | | | | | | | | |
| | | | | | Principal
Amount
(000) | | | U.S. $ Value | |
| | |
| | | | | | | | | | | | |
LOCAL GOVERNMENTS - MUNICIPAL BONDS – 0.3% | | | | | | | | | | | | |
United States – 0.3% | | | | | | | | | | | | |
California ST
7.95%, 3/01/36 | | | U.S.$ | | | | 2,235 | | | $ | 2,343,330 | |
7.625%, 3/01/40 | | | | | | | 1,250 | | | | 1,319,725 | |
Illinois ST
7.35%, 7/01/35 | | | | | | | 2,620 | | | | 2,685,972 | |
| | | | | | | | | | | | |
| | | |
Total Local Governments – Municipal Bonds
(cost $6,214,264) | | | | | | | | | | | 6,349,027 | |
| | | | | | | | | | | | |
| | | | | | | | | | | | |
INFLATION-LINKED
SECURITIES – 0.1% | | | | | | | | | | | | |
Uruguay – 0.1% | | | | | | | | | | | | |
Republica Orient Uruguay
3.70%, 6/26/37
(cost $2,179,832) | | | UYU | | | | 52,101 | | | | 2,694,603 | |
| | | | | | | | | | | | |
| | | |
| | | | | | Shares | | | | |
COMMON STOCKS – 0.0% | | | | | | | | | | | | |
Neenah Enterprises, Inc.(e)(h) | | | | | | | 49,578 | | | | 148,734 | |
Greektown Superholdings, Inc.(e)(f) | | | | | | | 541 | | | | 49,203 | |
Broder Brothers Co. | | | | | | | 26,940 | | | | 0 | |
U.S. Shipping Corp.(e)(m) | | | | | | | 27,473 | | | | 0 | |
American Media, Inc.(e)(f) | | | | | | | 10,382 | | | | 0 | |
AOT Bedding Super Holdings, LLC | | | | | | | 43 | | | | 0 | |
Gallery Media Holding | | | | | | | 202 | | | | 0 | |
Merisant Co.(e)(h) | | | | | | | 999 | | | | 0 | |
| | | | | | | | | | | | |
| | | |
Total Common Stocks
(cost $1,440,982) | | | | | | | | | | | 197,937 | |
| | | | | | | | | | | | |
| | | | | | | | | | | | |
WARRANTS – 0.0% | | | | | | | | | | | | |
Charter Communications, Inc., expiring 11/30/14(n) | | | | | | | 6,691 | | | | 30,110 | |
Alion Science And Technology C, expiring 3/15/17(a)(n) | | | | | | | 1,050 | | | | 0 | |
Magnachip Semicon, expiring
12/31/49(n) | | | | | | | 12,000 | | | | 0 | |
Quality Warrants, expiring 11/01/13(n) | | | | | | | 50,562 | | | | 0 | |
| | | | | | | | | | | | |
| | | |
Total Warrants
(cost $1,820,204) | | | | | | | | | | | 30,110 | |
| | | | | | | | | | | | |
| | |
| 58 | | • ALLIANCEBERNSTEIN HIGH INCOME FUND |
Portfolio of Investments
| | | | | | | | | | | | |
| | | | | |
Contracts(o) | | | U.S. $ Value | |
| | | | | | |
| | | | | | | | | | | | |
OPTION PURCHASED - CALL – 0.0% | | | | | | | | | | | | |
Swaptions – 0.0% | | | | | | | | | | | | |
IRS USD RTR | | | | | | | | | | | | |
Expiration: May 2011, Exercise
Rate 2.17%
(cost $126,900) | | | | | | | 470,000 | | | $ | 4,624 | |
| | | | | | | | | | | | |
| | | | | | | | | | | | |
| | | |
| | | | | | Shares | | | | |
SHORT-TERM INVESTMENTS – 5.6% | | | | | | | | | | | | |
Investment Companies – 5.6% | | | | | | | | | | | | |
AllianceBernstein Fixed-Income Shares, Inc. – Government STIF Portfolio, 0.17%(p)
(cost $129,603,153) | | | | | | | 129,603,153 | | | | 129,603,153 | |
| | | | | | | | | | | | |
| | | |
Total Investments – 106.0%
(cost $2,273,633,017) | | | | | | | | | | | 2,465,317,141 | |
Other assets less liabilities – (6.0)% | | | | | | | | | | | (139,338,588 | ) |
| | | | | | | | | | | | |
| | | |
Net Assets – 100.0% | | | | | | | | | | $ | 2,325,978,553 | |
| | | | | | | | | | | | |
FORWARD CURRENCY EXCHANGE CONTRACTS (see Note D)
| | | | | | | | | | | | | | | | |
| Counterparty & Description | | Contract
Amount
(000) | | | U.S. $ Value on
Origination
Date | | | U.S. $ Value at
October 31,
2010 | | | Unrealized
Appreciation/
(Depreciation) | |
Buy Contracts: | | | | | | | | | | | | | | | | |
Barclays Capital Inc.:
Australian Dollar settling 12/22/10 | | | 14,369 | | | $ | 13,968,363 | | | $ | 13,986,949 | | | $ | 18,586 | |
Credit Suisse First Boston: Norwegian Krone settling 11/04/10 | | | 88,028 | | | | 13,949,070 | | | | 15,029,135 | | | | 1,080,065 | |
Morgan Stanley & Co., Inc.:
South Korean Won settling 11/18/10 | | | 11,606,230 | | | | 10,104,324 | | | | 10,306,862 | | | | 202,538 | |
Royal Bank of Scotland:
Russian Rubles settling 11/08/10 | | | 593,595 | | | | 19,429,016 | | | | 19,235,870 | | | | (193,146 | ) |
| | | | |
Sale Contracts: | | | | | | | | | | | | | | | | |
Barclays Capital Inc.:
British Pound
settling 12/01/10 | | | 1,222 | | | | 1,938,080 | | | | 1,957,659 | | | | (19,579 | ) |
New Zealand Dollar settling 12/02/10 | | | 3,771 | | | | 2,762,224 | | | | 2,868,258 | | | | (106,034 | ) |
BNP Paribas SA:
Euro settling 1/06/11 | | | 603 | | | | 838,886 | | | | 838,248 | | | | 638 | |
Credit Suisse First Boston:
British Pound
settling 12/01/10 | | | 2,629 | | | | 4,129,237 | | | | 4,211,420 | | | | (82,183 | ) |
| | | | |
| ALLIANCEBERNSTEIN HIGH INCOME FUND • | | | 59 | |
Portfolio of Investments
| | | | | | | | | | | | | | | | |
| Counterparty & Description | | Contract
Amount
(000) | | | U.S. $ Value on
Origination
Date | | | U.S. $ Value at
October 31,
2010 | | | Unrealized
Appreciation/
(Depreciation) | |
Deutsche Bank:
British Pound
settling 12/01/10 | | | 729 | | | $ | 1,168,503 | | | $ | 1,168,176 | | | $ | 327 | |
British Pound settling 12/01/10 | | | 308 | | | | 483,644 | | | | 494,070 | | | | (10,426 | ) |
Goldman Sachs:
Japanese Yen
settling 11/10/10 | | | 1,525,993 | | | | 18,334,433 | | | | 18,964,542 | | | | (630,109 | ) |
HSBC Securities Inc.:
Hungarian Forint
settling 12/08/10 | | | 2,725,353 | | | | 12,882,786 | | | | 13,905,652 | | | | (1,022,866 | ) |
Royal Bank of Scotland:
Brazilian Real
settling 12/02/10 | | | 23,873 | | | | 14,245,145 | | | | 13,951,276 | | | | 293,869 | |
Euro settling 1/06/11 | | | 132,736 | | | | 183,927,613 | | | | 184,582,318 | | | | (654,705 | ) |
Russian Rubles settling 11/08/10 | | | 421,546 | | | | 13,797,648 | | | | 13,660,484 | | | | 137,164 | |
CREDIT DEFAULT SWAP CONTRACTS ON CORPORATE AND SOVEREIGN ISSUES (see Note D)
| | | | | | | | | | | | | | | | | | | | | | | | |
Swap Counterparty &
Referenced Obligation | | Fixed
Deal
(Pay)
Receive
Rate | | | Implied
Credit
Spread at
October 31,
2010 | | | Notional
Amount
(000) | | | Market
Value | | | Upfront
Premiums
(Paid)
Received | | | Unrealized
Appreciation/
(Depreciation) | |
Buy Contracts: | | | | | | | | | | | | | | | | | | | | | | | | |
Goldman Sachs Bank USA:
Hellenic Republic Government
5.9% 10/22/22, 6/20/15* | | | (0.50 | )% | | | 8.07 | % | | $ | 7,800 | | | $ | 138,892 | | | $ | 0 | | | $ | 138,892 | |
JPMorgan Chase Bank, NA:
Republic of Iceland
4.375% 3/10/14, 12/20/11* | | | (10.50 | ) | | | 3.06 | | | | 2,750 | | | | (365,506 | ) | | | 0 | | | | (365,506 | ) |
| | | | | | | | | | | | | | | | | | | | | | | | |
Sale Contracts: | | | | | | | | | | | | | | | | | | | | | | | | |
Deutshe Bank:
Ukraine Government
7.65% 6/11/13, 2/25/11* | | | 5.00 | | | | 3.99 | | | | 13,000 | | | | 167,667 | | | | 153,748 | | | | 321,415 | |
Goldman Sachs Bank USA:
Gazprom
9.25% 4/28/34, 11/20/11*+ | | | 9.25 | | | | 1.02 | | | | 8,400 | | | | 1,093,771 | | | | 0 | | | | 1,093,771 | |
| | |
| 60 | | • ALLIANCEBERNSTEIN HIGH INCOME FUND |
Portfolio of Investments
| | | | | | | | | | | | | | | | | | | | | | | | |
Swap Counterparty
& Referenced Obligation | | Fixed
Deal
(Pay)
Receive
Rate | | | Implied
Credit
Spread at
October 31,
2010 | | | Notional
Amount
(000) | | | Market
Value | | | Upfront
Premiums
(Paid)
Received | | | Unrealized
Appreciation/
(Depreciation) | |
VTB Bank
4.25% 2/15/16, 11/20/11*+ | | | 11.50 | % | | | 1.64 | % | | $ | 4,400 | | | $ | 691,651 | | | $ | 0 | | | $ | 691,651 | |
JPMorgan Chase Bank, N.A.:
Ukraine Government
7.65% 6/11/13, 2/20/11* | | | 5.00 | | | | 3.99 | | | | 3,500 | | | | 47,281 | | | | 142,569 | | | | 189,850 | |
Morgan Stanley:
CDX NAHY-15 5-Year Index 12/20/15* | | | 5.00 | | | | 4.89 | | | | 25,000 | | | | 263,083 | | | | 233,008 | | | | 496,091 | |
RSHB Capital SA
7.18% 5/16/13, 11/20/13*+ | | | 9.75 | | | | 1.97 | | | | 5,400 | | | | 1,470,801 | | | | 0 | | | | 1,470,801 | |
| + | | The fund held collateral received from the swap counterparty. The aggregate market value of these securities amounted to $3,308,334. |
REVERSE REPURCHASE AGREEMENTS (see Note D)
| | | | | | | | | | | | | | | | | | | | |
| Broker | | Principal
Amount
(000) | | | Currency | | | Interest
Rate | | | Maturity | | | U.S. $ Value at
October 31,
2010 | |
Barclay’s Capital Inc. | | | 453 | | | | USD | | | | (2.50 | )%* | | | 12/31/10 | | | $ | 452,934 | |
Barclay’s Capital Inc. | | | 2,386 | | | | USD | | | | (1.50 | )%* | | | 12/31/10 | | | | 2,384,803 | |
Barclay’s Capital Inc. | | | 1,531 | | | | USD | | | | (1.00 | )%* | | | 12/31/10 | | | | 1,521,266 | |
Barclay’s Capital Inc. | | | 356 | | | | EUR | | | | (0.50 | )%* | | | 12/31/10 | | | | 494,737 | |
Barclay’s Capital Inc. | | | 501 | | | | USD | | | | (0.50 | )%* | | | 12/31/10 | | | | 500,227 | |
Barclay’s Capital Inc. | | | 1,043 | | | | USD | | | | (0.50 | )%* | | | 12/31/10 | | | | 1,041,530 | |
Barclay’s Capital Inc. | | | 1,083 | | | | USD | | | | (0.50 | )%* | | | 12/31/10 | | | | 1,080,876 | |
Barclay’s Capital Inc. | | | 1,226 | | | | USD | | | | (0.50 | )%* | | | 12/31/10 | | | | 1,224,462 | |
Barclay’s Capital Inc. | | | 1,579 | | | | USD | | | | (0.50 | )%* | | | 12/31/10 | | | | 1,578,193 | |
Barclay’s Capital Inc. | | | 2,185 | | | | USD | | | | (0.50 | )%* | | | 12/31/10 | | | | 2,182,147 | |
Barclay’s Capital Inc. | | | 2,349 | | | | USD | | | | (0.50 | )%* | | | 12/31/10 | | | | 2,346,977 | |
Barclay’s Capital Inc. | | | 2,479 | | | | USD | | | | (0.50 | )%* | | | 12/31/10 | | | | 2,475,888 | |
Barclay’s Capital Inc. | | | 1,031 | | | | USD | | | | (0.25 | )%* | | | 12/31/10 | | | | 1,030,913 | |
Barclay’s Capital Inc. | | | 3,568 | | | | USD | | | | (0.13 | )%* | | | 12/31/10 | | | | 3,566,664 | |
Barclay’s Capital Inc. | | | 1,796 | | | | EUR | | | | (0.10 | )%* | | | 12/31/10 | | | | 2,498,942 | |
Barclay’s Capital Inc. | | | 415 | | | | USD | | | | 0.00 | % | | | 12/31/10 | | | | 415,000 | |
Barclay’s Capital Inc. | | | 1,005 | | | | EUR | | | | 0.00 | % | | | 12/31/10 | | | | 1,398,759 | |
Barclay’s Capital Inc. | | | 1,010 | | | | EUR | | | | 0.00 | % | | | 12/31/10 | | | | 1,405,753 | |
Barclay’s Capital Inc. | | | 1,112 | | | | EUR | | | | 0.00 | % | | | 12/31/10 | | | | 1,547,654 | |
Barclay’s Capital Inc. | | | 3,435 | | | | USD | | | | 0.00 | % | | | 12/31/10 | | | | 3,435,000 | |
Barclay’s Capital Inc. | | | 4,280 | | | | USD | | | | 0.00 | % | | | 12/31/10 | | | | 4,279,712 | |
Barclay’s Capital Inc. | | | 1,920 | | | | USD | | | | 0.40 | % | | | 12/31/10 | | | | 1,920,299 | |
Barclay’s Capital Inc. | | | 1,873 | | | | USD | | | | 0.45 | % | | | 12/31/10 | | | | 1,873,031 | |
ING Bank Amsterdam | | | 390 | | | | USD | | | | (3.75 | )%* | | | 12/31/10 | | | | 389,513 | |
ING Bank Amsterdam | | | 518 | | | | USD | | | | (3.75 | )%* | | | 12/31/10 | | | | 516,907 | |
| | | | |
| ALLIANCEBERNSTEIN HIGH INCOME FUND • | | | 61 | |
Portfolio of Investments
| | | | | | | | | | | | | | | | | | | | |
| Broker | | Principal
Amount
(000) | | | Currency | | | Interest
Rate | | | Maturity | | | U.S. $ Value at
October 31,
2010 | |
ING Bank Amsterdam | | | 518 | | | | USD | | | | (2.25 | )%* | | | 12/31/10 | | | $ | 517,047 | |
ING Bank Amsterdam | | | 529 | | | | USD | | | | (1.00 | )%* | | | 12/31/10 | | | | 526,503 | |
ING Bank Amsterdam | | | 2,065 | | | | USD | | | | (2.00 | )%* | | | 12/31/10 | | | | 2,062,132 | |
ING Bank Amsterdam | | | 995 | | | | USD | | | | (1.85 | )%* | | | 12/31/10 | | | | 993,619 | |
ING Bank Amsterdam | | | 318 | | | | USD | | | | (1.75 | )%* | | | 12/31/10 | | | | 317,982 | |
ING Bank Amsterdam | | | 401 | | | | USD | | | | (1.50 | )%* | | | 12/31/10 | | | | 400,041 | |
ING Bank Amsterdam | | | 500 | | | | USD | | | | (1.75 | )%* | | | 12/31/10 | | | | 498,746 | |
ING Bank Amsterdam | | | 1,884 | | | | USD | | | | (0.88 | )%* | | | 12/31/10 | | | | 1,882,364 | |
ING Bank Amsterdam | | | 1,093 | | | | USD | | | | (1.75 | )%* | | | 12/31/10 | | | | 1,092,420 | |
ING Bank Amsterdam | | | 705 | | | | USD | | | | (0.25 | )%* | | | 12/31/10 | | | | 704,983 | |
ING Bank Amsterdam | | | 1,060 | | | | USD | | | | (0.50 | )%* | | | 12/31/10 | | | | 1,058,160 | |
ING Bank Amsterdam | | | 2,163 | | | | USD | | | | (1.75 | )%* | | | 12/31/10 | | | | 2,161,753 | |
ING Bank Amsterdam | | | 1,095 | | | | USD | | | | (0.38 | )%* | | | 12/31/10 | | | | 1,094,943 | |
ING Bank Amsterdam | | | 1,210 | | | | USD | | | | 0.22 | %* | | | 12/31/10 | | | | 1,209,698 | |
ING Bank Amsterdam | | | 1,123 | | | | USD | | | | (0.38 | )%* | | | 12/31/10 | | | | 1,122,290 | |
ING Bank Amsterdam | | | 1,981 | | | | USD | | | | (0.25 | )%* | | | 12/31/10 | | | | 1,981,244 | |
ING Bank Amsterdam | | | 254 | | | | USD | | | | (0.13 | )%* | | | 12/31/10 | | | | 254,396 | |
ING Bank Amsterdam | | | 967 | | | | USD | | | | 0.22 | % | | | 12/31/10 | | | | 966,625 | |
ING Bank Amsterdam | | | 1,373 | | | | USD | | | | 0.00 | % | | | 12/31/10 | | | | 1,372,500 | |
ING Bank Amsterdam | | | 3,067 | | | | USD | | | | 0.00 | % | | | 12/31/10 | | | | 3,066,525 | |
ING Bank Amsterdam | | | 339 | | | | USD | | | | 0.05 | % | | | 12/31/10 | | | | 339,205 | |
ING Bank Amsterdam | | | 1,176 | | | | USD | | | | 0.10 | % | | | 12/31/10 | | | | 1,176,250 | |
ING Bank Amsterdam | | | 2,870 | | | | USD | | | | 0.10 | % | | | 12/31/10 | | | | 2,870,491 | |
ING Bank Amsterdam | | | 430 | | | | USD | | | | 0.12 | % | | | 12/31/10 | | | | 430,359 | |
ING Bank Amsterdam | | | 4,850 | | | | USD | | | | 0.20 | % | | | 12/31/10 | | | | 4,850,000 | |
ING Bank Amsterdam | | | 561 | | | | USD | | | | 0.22 | %* | | | 12/31/10 | | | | 561,144 | |
ING Bank Amsterdam | | | 1,259 | | | | USD | | | | 0.35 | % | | | 12/31/10 | | | | 1,259,050 | |
ING Bank Amsterdam | | | 900 | | | | USD | | | | 0.61 | % | | | 12/31/10 | | | | 899,802 | |
ING Bank Amsterdam | | | 4,166 | | | | USD | | | | 0.61 | % | | | 12/31/10 | | | | 4,165,955 | |
JPMorgan Chase Bank | | | 2,050 | | | | USD | | | | (0.35 | )%* | | | 11/01/10 | | | | 2,044,300 | |
JPMorgan Chase Bank | | | 1,285 | | | | USD | | | | (0.25 | )%* | | | 11/01/10 | | | | 1,283,175 | |
JPMorgan Chase Bank | | | 1,105 | | | | USD | | | | 0.25 | % | | | 11/01/10 | | | | 1,105,319 | |
JPMorgan Chase Bank | | | 5,472 | | | | USD | | | | 0.65 | % | | | 11/01/10 | | | | 5,478,820 | |
JPMorgan Chase Bank | | | 1,881 | | | | USD | | | | 0.00 | % | | | 12/31/10 | | | | 1,880,790 | |
JPMorgan Chase Bank | | | 8,764 | | | | USD | | | | 0.35 | % | | | 12/31/10 | | | | 8,765,419 | |
JPMorgan Chase Bank | | | 690 | | | | USD | | | | 0.65 | % | | | 12/31/10 | | | | 691,110 | |
JPMorgan Chase Bank | | | 9,664 | | | | USD | | | | 0.65 | % | | | 12/31/10 | | | | 9,675,539 | |
JPMorgan Chase Bank | | | 18,750 | | | | USD | | | | 0.65 | % | | | 12/31/10 | | | | 18,754,401 | |
New Edge Securities | | | 489 | | | | EUR | | | | (0.75 | )%* | | | 12/31/10 | | | | 678,768 | |
New Edge Securities | | | 1,029 | | | | USD | | | | 0.10 | % | | | 12/31/10 | | | | 1,028,759 | |
New Edge Securities | | | 2,334 | | | | USD | | | | 0.15 | % | | | 12/31/10 | | | | 2,333,965 | |
Nomura Securities | | | 4,666 | | | | USD | | | | 0.25 | % | | | 12/31/10 | | | | 4,666,160 | |
| | | | | | | | | | | | | | | | | | | | |
| | | | | | | | | | | | | | | | | | $ | 139,784,939 | |
| | | | | | | | | | | | | | | | | | | | |
| * | | Variable rate, interest payment due to/(from) counterparty. |
| (a) | | Security is exempt from registration under Rule 144A of the Securities Act of 1933. These securities are considered liquid and may be resold in transactions exempt from registration, normally to qualified institutional buyers. At October 31, 2010, the aggregate market value of these securities amounted to $786,169,388 or 33.8% of net assets. |
| (b) | | Floating Rate Security. Stated interest rate was in effect at October 31, 2010. |
| (c) | | Pay-In-Kind Payments (PIK). |
| | |
| 62 | | • ALLIANCEBERNSTEIN HIGH INCOME FUND |
Portfolio of Investments
| (d) | | Position, or a portion thereof, has been segregated to collateralize reverse repurchase agreements. The market value of the collateral amounted to $139,409,968. |
| (f) | | Security is exempt from registration under Rule 144A of the Securities Act of 1933. These securities, which represent 0.03% of net assets as of October 31, 2010, are considered illiquid and restricted. |
| | | | | | | | | | | | | | | | |
| Security | | Acquisition
Date | | | Cost | | | Market
Value | | | Percentage of
Net Assets | |
American Media, Inc. | | | 3/04/09 | | | $ | 230,000 | | | $ | 0 | | | | 0.00 | % |
Broder Brothers Co.
12.00%, 10/15/13 | | | 5/21/09 | | | | 505,809 | | | | 281,114 | | | | 0.01 | % |
European Media Capital SA
10.00%, 2/01/15 | | | 8/18/10 | | | | 887,513 | | | | 354,200 | | | | 0.02 | % |
Greektown Superholdings, Inc. | | | 7/19/10 | | | | 45,633 | | | | 49,203 | | | | 0.00 | % |
Truvo Subsidiary Corp.
8.375%, 12/01/14 | | | 3/13/08 | | | | 1,158,149 | | | | 57,735 | | | | 0.00 | % |
| (g) | | Indicates a security that has a zero coupon that remains in effect until a predetermined date at which time the stated coupon rate becomes effective until final maturity. |
| (i) | | Security is in default and is non-income producing. |
| (j) | | Coupon rate adjusts periodically based upon a predetermined schedule. Stated interest rate in effect at October 31, 2010. |
| (k) | | Variable rate coupon, rate shown as of October 31, 2010. |
| (l) | | This position or a portion of this position represents an unsettled loan purchase. At October 31, 2010, the market value and unrealized gain of these unsettled loan purchases amounted to $7,618,750 and $65,910, respectively. The coupon rate will be determined at the time of settlement and will be based upon the London-Interbank Offered Rate (“LIBOR”) plus a premium which was determined at the time of purchase. |
| (m) | | Restricted and illiquid security. |
| (n) | | Non-income producing security. |
| (o) | | One contract relates to 100 shares. |
| (p) | | Investment in affiliated money market mutual fund. The rate shown represents the 7- day yield as of period end. |
| | | The fund currently owns investments collateralized by subprime mortgage loans. Subprime loans are offered to homeowners who do not have a history of debt or who have had problems meeting their debt obligations. Because repayment is less certain, subprime borrowers pay a higher rate of interest than prime borrowers. As of October 31, 2010, the fund’s total exposure to subprime investments was 2.58% of net assets. These investments are valued in accordance with the fund’s Valuation Policies (see Note A for additional details). |
Currency Abbreviations:
AUD – Australian Dollar
BRL – Brazilian Real
CLP – Chilean Peso
COP – Colombian Peso
EGP – Egyptian Pounds
EUR – Euro
GBP – Pound Sterling
HUF – Hungarian Forint
IDR – Indonesian Rupiah
JPY – Japanese Yen
NZD – New Zealand Dollar
| | | | |
| ALLIANCEBERNSTEIN HIGH INCOME FUND • | | | 63 | |
Portfolio of Investments
RUB – Russian Ruble
TRY – Turkish Lira
UAH – Ukrainian Hryvnia
UYU – Uruguayan Peso
ZAR – South African Rand
Glossary:
ARMs – Adjustable Rate Mortgages
CMBS – Commercial Mortgage-Backed Securities
CMOs – Collateralized Mortgage Obligations
MBIA – MBIA Insurance Corporation
OJSC – Open Joint Stock Company
REIT – Real Estate Investment Trust
See notes to financial statements.
| | |
| 64 | | • ALLIANCEBERNSTEIN HIGH INCOME FUND |
Portfolio of Investments
STATEMENT OF ASSETS & LIABILITIES
October 31, 2010
| | | | |
| Assets | | | | |
Investments in securities, at value | | | | |
Unaffiliated issuers (cost $2,144,029,864) | | $ | 2,335,713,988 | |
Affiliated issuers (cost $129,603,153) | | | 129,603,153 | |
Cash | | | 4,259,230 | (a)(b) |
Foreign currencies, at value (cost $5,800,408) | | | 5,804,530 | |
Dividends and interest receivable | | | 44,964,938 | |
Receivable for capital stock sold | | | 31,903,581 | |
Receivable for investment securities sold | | | 27,818,118 | |
Unrealized appreciation of credit default swap contracts | | | 4,402,471 | |
Unrealized appreciation of forward currency exchange contracts | | | 1,733,187 | |
| | | | |
Total assets | | | 2,586,203,196 | |
| | | | |
| Liabilities | | | | |
Payable for reverse repurchase agreements | | | 139,784,939 | |
Payable for investment securities purchased | | | 106,339,931 | |
Dividends payable | | | 4,574,868 | |
Payable for capital stock redeemed | | | 3,613,304 | |
Unrealized depreciation of forward currency exchange contracts | | | 2,719,048 | |
Distribution fee payable | | | 801,755 | |
Advisory fee payable | | | 552,010 | |
Upfront premiums received on credit default swap contracts | | | 529,325 | |
Unrealized depreciation of credit default swap contracts | | | 365,506 | |
Cash collateral received from broker | | | 300,000 | |
Transfer Agent fee payable | | | 62,226 | |
Administrative fee payable | | | 26,644 | |
Accrued expenses and other liabilities | | | 555,087 | |
| | | | |
Total liabilities | | | 260,224,643 | |
| | | | |
Net Assets | | $ | 2,325,978,553 | |
| | | | |
| Composition of Net Assets | | | | |
Capital stock, at par | | $ | 252,375 | |
Additional paid-in capital | | | 2,199,716,400 | |
Distributions in excess of net investment income | | | (5,219,385 | ) |
Accumulated net realized loss on investment
and foreign currency transactions | | | (63,389,922 | ) |
Net unrealized appreciation of investments
and foreign currency denominated assets and liabilities | | | 194,619,085 | |
| | | | |
| | $ | 2,325,978,553 | |
| | | | |
Net Asset Value Per Share—21 billion shares of capital stock authorized, $.001 par value
| | | | | | | | | | | | |
| Class | | Net Assets | | | Shares
Outstanding | | | Net Asset
Value | |
| A | | $ | 1,326,974,180 | | | | 144,394,170 | | | $ | 9.19 | * |
| | |
| B | | $ | 40,091,560 | | | | 4,328,065 | | | $ | 9.26 | |
| | |
| C | | $ | 541,386,037 | | | | 58,268,160 | | | $ | 9.29 | |
| | |
| Advisor | | $ | 385,380,333 | | | | 41,887,616 | | | $ | 9.20 | |
| | |
| R | | $ | 13,250,248 | | | | 1,442,254 | | | $ | 9.19 | |
| | |
| K | | $ | 1,624,131 | | | | 176,739 | | | $ | 9.19 | |
| | |
| I | | $ | 17,272,064 | | | | 1,877,576 | | | $ | 9.20 | |
| | |
| * | | The maximum offering price per share for Class A shares was $9.60 which reflects a sales charge of 4.25%. |
| (a) | | An amount of $660,000 has been segregated to collateralize credit default swap contracts outstanding at October 31, 2010. |
| (b) | | Includes cash collateral of $300,000 received from broker for credit default swap contracts. |
See notes to financial statements.
| | | | |
| ALLIANCEBERNSTEIN HIGH INCOME FUND • | | | 65 | |
Statement of Assets & Liabilities
STATEMENT OF OPERATIONS
Year Ended October 31, 2010
| | | | | | | | |
| Investment Income | | | | | | | | |
Interest | | $ | 136,766,989 | | | | | |
Dividends | | | | | | | | |
Unaffiliated issuers | | | 1,400,583 | | | | | |
Affiliated issuers | | | 101,433 | | | $ | 138,269,005 | |
| | | | | | | | |
| Expenses | | | | | | | | |
Advisory fee (see Note B) | | | 7,787,382 | | | | | |
Distribution fee—Class A | | | 2,894,475 | | | | | |
Distribution fee—Class B | | | 459,076 | | | | | |
Distribution fee—Class C | | | 3,436,523 | | | | | |
Distribution fee—Class R | | | 38,462 | | | | | |
Distribution fee—Class K | | | 3,611 | | | | | |
Transfer agency—Class A | | | 1,121,264 | | | | | |
Transfer agency—Class B | | | 71,594 | | | | | |
Transfer agency—Class C | | | 419,896 | | | | | |
Transfer agency—Advisor Class | | | 221,931 | | | | | |
Transfer agency—Class R | | | 19,542 | | | | | |
Transfer agency—Class K | | | 2,888 | | | | | |
Transfer agency—Class I | | | 7,612 | | | | | |
Printing | | | 352,000 | | | | | |
Registration fees | | | 296,449 | | | | | |
Custodian | | | 268,340 | | | | | |
Administrative | | | 89,160 | | | | | |
Audit | | | 71,535 | | | | | |
Legal | | | 58,205 | | | | | |
Directors’ fees | | | 43,300 | | | | | |
Miscellaneous | | | 28,750 | | | | | |
| | | | | | | | |
Total expenses before interest and borrowing fee | | | 17,691,995 | | | | | |
Interest expense and borrowing fee | | | 651,201 | | | | | |
| | | | | | | | |
Total expenses | | | 18,343,196 | | | | | |
Less: expenses waived and reimbursed by the Adviser (see Note B) | | | (736,252 | ) | | | | |
| | | | | | | | |
Net expenses | | | | | | | 17,606,944 | |
| | | | | | | | |
Net investment income | | | | | | | 120,662,061 | |
| | | | | | | | |
| Realized and Unrealized Gain (Loss) on Investment and Foreign Currency Transactions | | | | | | | | |
Net realized gain (loss) on: | | | | | | | | |
Investment transactions | | | | | | | 23,800,307 | |
Swap contracts | | | | | | | 4,817,220 | |
Foreign currency transactions | | | | | | | (2,683,891 | ) |
Net change in unrealized appreciation/depreciation of: | | | | | | | | |
Investments | | | | | | | 155,990,938 | |
Swap contracts | | | | | | | (859,944 | ) |
Foreign currency denominated assets and liabilities | | | | | | | (1,977,465 | ) |
| | | | | | | | |
Net gain on investment and foreign currency transactions | | | | | | | 179,087,165 | |
| | | | | | | | |
Contributions from Adviser (see Note B) | | | | | | | 235,116 | |
| | | | | | | | |
Net Increase in Net Assets from Operations | | | | | | $ | 299,984,342 | |
| | | | | | | | |
See notes to financial statements.
| | |
| 66 | | • ALLIANCEBERNSTEIN HIGH INCOME FUND |
Statement of Operations
STATEMENT OF CHANGES IN NET ASSETS
| | | | | | | | |
| | | Year Ended
October 31,
2010 | | | Year Ended
October 31,
2009 | |
| Increase (Decrease) in Net Assets from Operations | | | | | | | | |
Net investment income | | $ | 120,662,061 | | | $ | 74,840,528 | |
Net realized gain (loss) on investment and foreign currency transactions | | | 25,933,636 | | | | (56,155,194 | ) |
Net change in unrealized appreciation/depreciation of investments and foreign currency denominated assets and liabilities | | | 153,153,529 | | | | 336,341,100 | |
Contributions from Adviser (see Note B) | | | 235,116 | | | | – 0 | – |
| | | | | | | | |
Net increase in net assets from operations | | | 299,984,342 | | | | 355,026,434 | |
| Dividends and Distributions to Shareholders from | | | | | | | | |
Net investment income | | | | | | | | |
Class A | | | (77,548,749 | ) | | | (54,815,063 | ) |
Class B | | | (3,373,970 | ) | | | (4,924,499 | ) |
Class C | | | (24,706,759 | ) | | | (13,216,302 | ) |
Advisor Class | | | (15,439,787 | ) | | | (3,291,539 | ) |
Class R | | | (601,223 | ) | | | (248,936 | ) |
Class K | | | (117,619 | ) | | | (101,203 | ) |
Class I | | | (519,234 | ) | | | (24,694 | ) |
Tax return of capital | | | | | | | | |
Class A | | | – 0 | – | | | (987,790 | ) |
Class B | | | – 0 | – | | | (96,072 | ) |
Class C | | | – 0 | – | | | (256,532 | ) |
Advisor Class | | | – 0 | – | | | (55,537 | ) |
Class R | | | – 0 | – | | | (4,516 | ) |
Class K | | | – 0 | – | | | (1,799 | ) |
Class I | | | – 0 | – | | | (428 | ) |
Net realized gain on investment and foreign currency transactions | | | | | | | | |
Class A | | | – 0 | – | | | (1,501,743 | ) |
Class B | | | – 0 | – | | | (176,981 | ) |
Class C | | | – 0 | – | | | (371,845 | ) |
Advisor Class | | | – 0 | – | | | (17,794 | ) |
Class R | | | – 0 | – | | | (5,912 | ) |
Class K | | | – 0 | – | | | (2,609 | ) |
Class I | | | – 0 | – | | | (658 | ) |
| Capital Stock Transactions | | | | | | | | |
Net increase | | | 1,011,175,870 | | | | 235,996,628 | |
| | | | | | | | |
Total increase | | | 1,188,852,871 | | | | 510,920,610 | |
| Net Assets | | | | | | | | |
Beginning of period | | | 1,137,125,682 | | | | 626,205,072 | |
| | | | | | | | |
End of period (including distributions in excess of net investment income of $(5,219,385) and $(5,613,088), respectively) | | $ | 2,325,978,553 | | | $ | 1,137,125,682 | |
| | | | | | | | |
See notes to financial statements.
| | | | |
| ALLIANCEBERNSTEIN HIGH INCOME FUND • | | | 67 | |
Statement of Changes in Net Assets
NOTES TO FINANCIAL STATEMENTS
October 31, 2010
NOTE A
Significant Accounting Policies
AllianceBernstein High Income Fund, Inc. (the “Fund”), formerly known as AllianceBernstein Emerging Market Debt Fund, Inc., was incorporated in the State of Maryland on December 2, 1993, and is registered under the Investment Company Act of 1940 as a non-diversified, open-end management investment company. The Fund offers Class A, Class B, Class C, Advisor Class, Class R, Class K and Class I shares. Class A shares are sold with a front-end sales charge of up to 4.25% for purchases not exceeding $1,000,000. With respect to purchases of $1,000,000 or more, Class A shares redeemed within one year of purchase may be subject to a contingent deferred sales charge of 1%. Class B shares are currently sold with a contingent deferred sales charge which declines from 3% to zero depending on the period of time the shares are held. Effective January 31, 2009, sales of Class B shares of the Fund to new investors will be suspended. Class B shares will only be issued (i) upon the exchange of Class B shares from another AllianceBernstein Mutual Fund, (ii) for purposes of dividend reinvestment, (iii) through the Fund’s Automatic Investment Program (the “Program”) for accounts that established the Program prior to January 31, 2009, and (iv) for purchases of additional shares by Class B shareholders as of January 31, 2009. The ability to establish a new Program for accounts containing Class B shares was suspended as of January 31, 2009. Class B shares will automatically convert to Class A shares six years after the end of the calendar month of purchase. Class C shares are subject to a contingent deferred sales charge of 1% on redemptions made within the first year after purchase. Class R and Class K shares are sold without an initial or contingent deferred sales charge. Advisor Class and Class I shares are sold without an initial or contingent deferred sales charge and are not subject to ongoing distribution expenses. All seven classes of shares have identical voting, dividend, liquidation and other rights, except that the classes bear different distribution and transfer agency expenses. Each class has exclusive voting rights with respect to its distribution plan. The financial statements have been prepared in conformity with U.S. generally accepted accounting principles (“U.S. GAAP”), which require management to make certain estimates and assumptions that affect the reported amounts of assets and liabilities in the financial statements and amounts of income and expenses during the reporting period. Actual results could differ from those estimates. The following is a summary of significant accounting policies followed by the Fund.
1. Security Valuation
Portfolio securities are valued at their current market value determined on the basis of market quotations or, if market quotations are not readily available or are deemed unreliable, at “fair value” as determined in accordance with procedures established by and under the general supervision of the Fund’s Board of Directors.
In general, the market value of securities which are readily available and deemed reliable are determined as follows. Securities listed on a national securities
| | |
| 68 | | • ALLIANCEBERNSTEIN HIGH INCOME FUND |
Notes to Financial Statements
exchange (other than securities listed on the NASDAQ Stock Market, Inc. (“NASDAQ”)) or on a foreign securities exchange are valued at the last sale price at the close of the exchange or foreign securities exchange. If there has been no sale on such day, the securities are valued at the mean of the closing bid and asked prices on such day. Securities listed on more than one exchange are valued by reference to the principal exchange on which the securities are traded; securities listed only on NASDAQ are valued in accordance with the NASDAQ Official Closing Price; listed put or call options are valued at the last sale price. If there has been no sale on that day, such securities will be valued at the closing bid prices on that day; open futures contracts and options thereon are valued using the closing settlement price or, in the absence of such a price, the most recent quoted bid price. If there are no quotations available for the day of valuation, the last available closing settlement price is used; securities traded in the over-the-counter market (“OTC”) are valued at the mean of the current bid and asked prices as reported by the National Quotation Bureau or other comparable sources; U.S. government securities and other debt instruments having 60 days or less remaining until maturity are valued at amortized cost if their original maturity was 60 days or less; or by amortizing their fair value as of the 61st day prior to maturity if their original term to maturity exceeded 60 days; fixed-income securities, including mortgage backed and asset backed securities, may be valued on the basis of prices provided by a pricing service or at a price obtained from one or more of the major broker/dealers. In cases where broker/ dealer quotes are obtained, AllianceBernstein L.P. (the “Adviser”) may establish procedures whereby changes in market yields or spreads are used to adjust, on a daily basis, a recently obtained quoted price on a security; and OTC and other derivatives are valued on the basis of a quoted bid price or spread from a major broker/dealer in such security. Investments in money market funds are valued at their net asset value each day.
Securities for which market quotations are not readily available (including restricted securities) or are deemed unreliable are valued at fair value. Factors considered in making this determination may include, but are not limited to, information obtained by contacting the issuer, analysts, analysis of the issuer’s financial statements or other available documents. In addition, the Fund may use fair value pricing for securities primarily traded in non-U.S. markets because most foreign markets close well before the Fund values its securities at 4:00 p.m., Eastern Time. The earlier close of these foreign markets gives rise to the possibility that significant events, including broad market moves, may have occurred in the interim and may materially affect the value of those securities.
In valuing the Term Asset-Backed Securities Loan Facility (“TALF”) transactions, the Adviser utilized a portfolio pricing service to price the TALF loans. The methodologies utilized by the vendor to value the TALF loans took into consideration, among other factors, the deal characteristics, historical performance, market interest rates, and the value of the underlying collateral.
| | | | |
| ALLIANCEBERNSTEIN HIGH INCOME FUND • | | | 69 | |
Notes to Financial Statements
2. Fair Value Measurements
In accordance with U.S. GAAP regarding fair value measurements, fair value is defined as the price that the Fund would receive to sell an asset or pay to transfer a liability in an orderly transaction between market participants at the measurement date. The U.S. GAAP disclosure requirements also establish a framework for measuring fair value, and a three-level hierarchy for fair value measurements based upon the transparency of inputs to the valuation of an asset or liability. Inputs may be observable or unobservable and refer broadly to the assumptions that market participants would use in pricing the asset or liability. Observable inputs reflect the assumptions market participants would use in pricing the asset or liability based on market data obtained from sources independent of the Fund. Unobservable inputs reflect the Fund’s own assumptions about the assumptions that market participants would use in pricing the asset or liability based on the best information available in the circumstances. Each investment is assigned a level based upon the observability of the inputs which are significant to the overall valuation. The three-tier hierarchy of inputs is summarized below.
| | • | | Level 1—quoted prices in active markets for identical investments |
| | • | | Level 2—other significant observable inputs (including quoted prices for similar investments, interest rates, prepayment speeds, credit risk, etc.) |
| | • | | Level 3—significant unobservable inputs (including the Fund’s own assumptions in determining the fair value of investments) |
As of June 14, 2010 and for the remainder of the reporting period ended October 31, 2010, there were no TALF loans outstanding for the Fund. For the period November 1, 2009 through June 14, 2010, the Fund elected the fair value option in valuing the TALF loan liability as permitted by U.S. GAAP regarding the fair value option for financial assets and financial liabilities. The fair value option permitted a fund the opportunity to mitigate volatility in net assets caused by measuring related assets and liabilities differently. Consequently the Fund recorded the loan liability on the statement of assets and liabilities at fair value. The fair value option required that the TALF loan be marked-to-market giving consideration to relevant market factors including changes in the market value of the collateral related to the TALF loan (see Note D.4). Through June 14, 2010, the Fund did not have a difference between the aggregate fair value and the aggregate unpaid principal balance of the TALF loans outstanding.
| | |
| 70 | | • ALLIANCEBERNSTEIN HIGH INCOME FUND |
Notes to Financial Statements
The following table summarizes the valuation of the Fund’s investments by the above fair value hierarchy levels as of October 31, 2010:
| | | | | | | | | | | | | | | | |
Investments in Securities | | Level 1 | | | Level 2 | | | Level 3 | | | Total | |
Corporates – Non-Investment Grades | | $ | 4,818,088 | | | $ | 1,198,820,717 | | | $ | 33,708,344 | | | $ | 1,237,347,149 | |
Corporates – Investment Grades | | | – 0 | – | | | 252,883,072 | | | | 4,535,572 | | | | 257,418,644 | |
Emerging Markets – Sovereigns | | | – 0 | – | | | 189,176,302 | | | | 11,818,976 | | | | 200,995,278 | |
Commercial Mortgage-Backed Securities | | | – 0 | – | | | 37,373,350 | | | | 69,761,354 | | | | 107,134,704 | |
Governments – Treasuries | | | – 0 | – | | | 94,142,948 | | | | – 0 | – | | | 94,142,948 | |
Quasi-Sovereigns | | | – 0 | – | | | 90,733,842 | | | | – 0 | – | | | 90,733,842 | |
Emerging Markets – Treasuries | | | – 0 | – | | | 66,898,937 | | | | – 0 | – | | | 66,898,937 | |
Emerging Markets – Corporate Bonds | | | – 0 | – | | | 56,238,803 | | | | 1,443,000 | | | | 57,681,803 | |
CMOs | | | – 0 | – | | | – 0 | – | | | 53,856,828 | | | | 53,856,828 | |
Governments – Sovereign Bonds | | | – 0 | – | | | 46,505,063 | | | | – 0 | – | | | 46,505,063 | |
Bank Loans | | | – 0 | – | | | – 0 | – | | | 42,646,923 | | | | 42,646,923 | |
Asset-Backed Securities | | | – 0 | – | | | – 0 | – | | | 31,179,732 | | | | 31,179,732 | |
Preferred Stocks | | | 15,052,212 | | | | 7,770,869 | | | | – 0 | – | | | 22,823,081 | |
Supranationals | | | – 0 | – | | | 1,944,800 | | | | 8,111,718 | | | | 10,056,518 | |
Local Governments – Regional Bonds | | | – 0 | – | | | 1,807,985 | | | | 5,208,252 | | | | 7,016,237 | |
Local Governments – Municipal Bonds | | | – 0 | – | | | 6,349,027 | | | | – 0 | – | | | 6,349,027 | |
Inflation-Linked Securities | | | – 0 | – | | | 2,694,603 | | | | – 0 | – | | | 2,694,603 | |
Common Stocks | | | – 0 | – | | | – 0 | – | | | 197,937 | | | | 197,937 | |
Warrants | | | – 0 | – | | | – 0 | – | | | 30,110 | | | | 30,110 | |
Option Purchased-Call | | | – 0 | – | | | 4,624 | | | | – 0 | – | | | 4,624 | |
Short-Term Investments | | | 129,603,153 | | | | – 0 | – | | | – 0 | – | | | 129,603,153 | |
| | | | | | | | | | | | | | | | |
Total Investments in Securities | | | 149,473,453 | | | | 2,053,344,942 | | | | 262,498,746 | | | | 2,465,317,141 | |
Other Financial Instruments*: | | | | | | | | | | | | | | | | |
Assets | | | | | | | | | | | | | | | | |
Credit Default Swaps | | | – 0 | – | | | 4,402,471 | | | | – 0 | – | | | 4,402,471 | |
Forward Currency Exchange Contracts | | | – 0 | – | | | 1,733,187 | | | | – 0 | – | | | 1,733,187 | |
Liabilities | | | | | | | | | | | | | | | | |
Credit Default Swaps | | | – 0 | – | | | (365,506 | ) | | | – 0 | – | | | (365,506 | ) |
Forward Currency Exchange Contracts | | | – 0 | – | | | (2,719,048 | ) | | | – 0 | – | | | (2,719,048 | ) |
| | | | | | | | | | | | | | | | |
Total | | $ | 149,473,453 | | | $ | 2,056,396,046 | | | $ | 262,498,746 | | | $ | 2,468,368,245 | |
| | | | | | | | | | | | | | | | |
| * | | Other financial instruments are derivative instruments, such as futures, forwards and swap contracts, which are valued at the unrealized appreciation/depreciation on the instrument. |
| | | | |
| ALLIANCEBERNSTEIN HIGH INCOME FUND • | | | 71 | |
Notes to Financial Statements
Following is a reconciliation of investments in which significant unobservable inputs (Level 3) were used in determining fair value. The transfers between levels of the fair value hierarchy assumes the financial instrument was transferred at the end of the reporting period.
| | | | | | | | | | | | | | | | |
| | | Corporates -
Non
Investment
Grades | | | Corporates -
Investment
Grades | | | Emerging
Markets -
Sovereigns | | | Commerical
Mortgage-
Backed
Securities | |
Balance as of 10/31/09 | | $ | 29,155,307 | | | $ | 39,517,688 | | | $ | 148,430,304 | | | $ | 13,743,817 | |
Accrued discounts/ premiums | | | 67,663 | | | | 324,641 | | | | 2,530,042 | | | | 258,053 | |
Realized gain (loss) | | | (171,550 | ) | | | (107,883 | ) | | | 20,625,660 | | | | 366,393 | |
Change in unrealized appreciation/ depreciation | | | 4,794,115 | | | | 3,649,298 | | | | 3,214,496 | | | | 7,942,695 | |
Net purchases (sales) | | | 20,653,982 | | | | (9,059,145 | ) | | | (31,080,537 | ) | | | 31,674,916 | |
Transfers into level 3 | | | – 0 | – | | | – 0 | – | | | – 0 | – | | | 15,775,480 | |
Transfers out of level 3 | | | (20,791,173 | ) | | | (29,789,027 | ) | | | (131,900,989 | ) | | | – 0 | – |
| | | | | | | | | | | | | | | | |
Balance as of 10/31/10 | | $ | 33,708,344 | | | $ | 4,535,572 | | | $ | 11,818,976 | | | $ | 69,761,354 | |
| | | | | | | | | | | | | | | | |
Net change in unrealized appreciation/depreciation from investments held
as of 10/31/10 | | $ | 2,425,632 | | | $ | 295,564 | | | $ | 839,687 | | | $ | 9,926,474 | |
| | | | |
| | | Governments -
Treasuries | | | Quasi-
Sovereign | | | Emerging
Markets -
Treasuries | | | Emerging
Markets -
Corporate
Bonds | |
Balance as of 10/31/09 | | $ | 39,173,955 | | | $ | 43,005,423 | | | $ | 29,116,404 | | | $ | 3,793,940 | |
Accrued discounts/ premiums | | | 128,763 | | | | 698,017 | | | | (77,234 | ) | | | 653 | |
Realized gain (loss) | | | 392,145 | | | | 689,918 | | | | 1,912,034 | | | | – 0 | – |
Change in unrealized appreciation/ depreciation | | | 562,817 | | | | 3,624,790 | | | | 63,839 | | | | 430,347 | |
Net purchases (sales) | | | 456,216 | | | | 5,402,399 | | | | (12,780,387 | ) | | | – 0 | – |
Transfers into level 3 | | | – 0 | – | | | – 0 | – | | | – 0 | – | | | – 0 | – |
Transfers out of level 3 | | | (40,713,896 | ) | | | (53,420,547 | ) | | | (18,234,656 | ) | | | (2,781,940 | ) |
| | | | | | | | | | | | | | | | |
Balance as of 10/31/10 | | $ | – 0 | – | | $ | – 0 | – | | $ | – 0 | – | | $ | 1,443,000 | |
| | | | | | | | | | | | | | | | |
Net change in unrealized appreciation/depreciation from investments held
as of 10/31/10 | | $ | – 0 | – | | $ | – 0 | – | | $ | – 0 | – | | $ | 108,529 | |
| | |
| 72 | | • ALLIANCEBERNSTEIN HIGH INCOME FUND |
Notes to Financial Statements
| | | | | | | | | | | | | | | | |
| | | CMOs | | | Governments -
Sovereign
Bonds | | | Bank Loans | | | Asset-
Backed
Securities | |
Balance as of 10/31/09 | | $ | 3,617,638 | | | $ | 6,185,050 | | | $ | 18,968,639 | | | $ | 2,095,498 | |
Accrued discounts/premiums | | | 452,749 | | | | (2,899 | ) | | | 694,450 | | | | 185,067 | |
Realized gain (loss) | | | 1,427,091 | | | | – 0 | – | | | 480,018 | | | | 261,491 | |
Change in unrealized appreciation/depreciation | | | 1,148,838 | | | | 941,839 | | | | (86,186 | ) | | | 811,659 | |
Net purchases (sales) | | | 47,210,512 | | | | – 0 | – | | | 22,590,002 | | | | 27,826,017 | |
Transfers into level 3 | | | – 0 | – | | | – 0 | – | | | – 0 | – | | | – 0 | – |
Transfers out of level 3 | | | – 0 | – | | | (7,123,990 | ) | | | – 0 | – | | | – 0 | – |
| | | | | | | | | | | | | | | | |
Balance as of 10/31/10 | | $ | 53,856,828 | | | $ | – 0 | – | | $ | 42,646,923 | | | $ | 31,179,732 | |
| | | | | | | | | | | | | | | | |
Net change in unrealized appreciation/depreciation from investments held as of 10/31/10 | | $ | 1,528,258 | | | $ | – 0 | – | | $ | 348,292 | | | $ | 713,530 | |
| | | | |
| | | Preferred
Stocks | | | Supranationals | | | Local
Governments -
Regional
Bonds | | | Inflation-
Linked
Securities | |
Balance as of 10/31/09 | | $ | 526,050 | | | $ | – 0 | – | | $ | 3,076,661 | | | $ | 4,056,156 | |
Accrued discounts/premiums | | | – 0 | – | | | 182,578 | | | | 8,140 | | | | 156,418 | |
Realized gain (loss) | | | – 0 | – | | | – 0 | – | | | – 0 | – | | | 224,375 | |
Change in unrealized appreciation/depreciation | | | 56,362 | | | | 5,401 | | | | 2,123,451 | | | | 286,145 | |
Net purchases (sales) | | | – 0 | – | | | 7,923,739 | | | | – 0 | – | | | (2,028,491 | ) |
Transfers into level 3 | | | – 0 | – | | | – 0 | – | | | – 0 | – | | | – 0 | – |
Transfers out of level 3 | | | (582,412 | ) | | | – 0 | – | | | – 0 | – | | | (2,694,603 | ) |
| | | | | | | | | | | | | | | | |
Balance as of 10/31/10 | | $ | – 0 | – | | $ | 8,111,718 | | | $ | 5,208,252 | | | $ | – 0 | – |
| | | | | | | | | | | | | | | | |
Net change in unrealized appreciation/depreciation from investments held as of 10/31/10 | | $ | – 0 | – | | $ | 5,401 | | | $ | 2,123,451 | | | $ | – 0 | – |
| | | | |
| | | Common
Stocks | | | Warrants | | | Governments -
Sovereign
Agencies | | | TALF | |
Balance as of 10/31/09 | | $ | – 0 | – | | $ | 287,500 | | | $ | 2,632,732 | | | $ | (52,705,337 | ) |
Accrued discounts/premiums | | | – 0 | – | | | – 0 | – | | | (23,845 | ) | | | – 0 | – |
Realized gain (loss) | | | (483 | ) | | | (1,291,355 | ) | | | 64,081 | | | | – 0 | – |
Change in unrealized appreciation/depreciation | | | (1,016,620 | ) | | | (2,077,594 | ) | | | (122,412 | ) | | | – 0 | – |
Net purchases (sales) | | | 1,165,884 | | | | 3,111,559 | | | | (2,550,556 | ) | | | 52,705,337 | |
Transfers into level 3 | | | 49,156 | | | | – 0 | – | | | – 0 | – | | | – 0 | – |
Transfers out of level 3 | | | – 0 | – | | | – 0 | – | | | – 0 | – | | | – 0 | – |
| | | | | | | | | | | | | | | | |
Balance as of 10/31/10 | | $ | 197,937 | | | $ | 30,110 | | | $ | – 0 | – | | $ | – 0 | – |
| | | | | | | | | | | | | | | | |
Net change in unrealized appreciation/depreciation from investments held as of 10/31/10 | | $ | (487,848 | ) | | $ | (1,790,095 | ) | | $ | – 0 | – | | $ | – 0 | – |
| | | | |
| ALLIANCEBERNSTEIN HIGH INCOME FUND • | | | 73 | |
Notes to Financial Statements
| | | | | | | | | | | | | | | | |
| | | Total | | | | | | | | | | |
Balance as of 10/31/09 | | $ | 334,677,425 | | | | | | | | | | | | | |
Accrued discounts/premiums | | | 5,583,256 | | | | | | | | | | | | | |
Realized gain (loss) | | | 24,871,935 | | | | | | | | | | | | | |
Change in unrealized appreciation/depreciation | | | 26,353,280 | | | | | | | | | | | | | |
Net purchases (sales) | | | 163,221,447 | | | | | | | | | | | | | |
Transfers into level 3 | | | 15,824,636 | | | | | | | | | | | | | |
Transfers out of level 3 | | | (308,033,233 | ) | | | | | | | | | | | | |
| | | | | | | | | | | | | | | | |
Balance as of 10/31/10 | | $ | 262,498,746 | | | | | | | | | | | | | |
| | | | | | | | | | | | | | | | |
Net change in unrealized appreciation/depreciation from investments held as of 10/31/10 | | $ | 16,036,875 | ** | | | | | | | | | | | | |
| ** | | The unrealized appreciation/depreciation is included in net change in unrealized appreciation/depreciation of investments and other financial instruments in the accompanying statement of operations. |
3. Currency Translation
Assets and liabilities denominated in foreign currencies and commitments under forward currency exchange contracts are translated into U.S. dollars at the mean of the quoted bid and asked prices of such currencies against the U.S. dollar. Purchases and sales of portfolio securities are translated into U.S. dollars at the rates of exchange prevailing when such securities were acquired or sold. Income and expenses are translated into U.S. dollars at rates of exchange prevailing when accrued.
Net realized gain or loss on foreign currency transactions represents foreign exchange gains and losses from sales and maturities of foreign fixed income investments, foreign currency exchange contracts, holding of foreign currencies, currency gains or losses realized between the trade and settlement dates on foreign investment transactions, and the difference between the amounts of dividends, interest and foreign withholding taxes recorded on the Fund’s books and the U.S. dollar equivalent amounts actually received or paid. Net unrealized currency gains and losses from valuing foreign currency denominated assets and liabilities at period end exchange rates are reflected as a component of net unrealized appreciation and depreciation of investments and foreign currency denominated assets and liabilities.
4. Taxes
It is the Fund’s policy to meet the requirements of the Internal Revenue Code applicable to regulated investment companies and to distribute all of its investment company taxable income and net realized gains, if any, to shareholders. Therefore, no provisions for federal income or excise taxes are required. The Fund may be subject to taxes imposed by countries in which it invests. Such taxes are generally based on income and/or capital gains earned or repatriated. Taxes are accrued and applied to net investment income, net realized gains and net unrealized appreciation/depreciation as such income and/or gains are earned.
| | |
| 74 | | • ALLIANCEBERNSTEIN HIGH INCOME FUND |
Notes to Financial Statements
In accordance with U.S. GAAP requirements regarding accounting for uncertainties in income taxes, management has analyzed the Fund’s tax positions taken or expected to be taken on federal and state income tax returns for all open tax years (the current and the prior three tax years) and has concluded that no provision for income tax is required in the Funds’ financial statements.
5. Investment Income and Investment Transactions
Dividend income is recorded on the ex-dividend date or as soon as the Fund is informed of the dividend. Interest income is accrued daily. Investment transactions are accounted for on the date securities are purchased or sold. Investment gains or losses are determined on the identified cost basis. The Fund amortizes premiums and accretes discounts as adjustments to interest income.
6. Class Allocations
All income earned and expenses incurred by the Fund are borne on a pro-rata basis by each settled class of shares, based on the proportionate interest in the Fund represented by the net assets of such class, except for class specific expenses which are allocated to the respective class. Realized and unrealized gains and losses are allocated among the various share classes based on their respective net assets.
7. Dividends and Distributions
Dividends and distributions to shareholders, if any, are recorded on the ex-dividend date. Income dividends and capital gains distributions are determined in accordance with federal tax regulations and may differ from those determined in accordance with U.S. GAAP. To the extent these differences are permanent, such amounts are reclassified within the capital accounts based on their federal tax basis treatment; temporary differences do not require such reclassification.
NOTE B
Advisory Fee and Other Transactions with Affiliates
Under the terms of the investment advisory agreement, the Fund pays the Adviser an advisory fee at an annual rate of .50% of the first $2.5 billion, .45% of the next $2.5 billion and .40% in excess of $5 billion, of the Fund’s average daily net assets. The fee is accrued daily and paid monthly.
The Adviser had agreed to waive its fees and bear certain expenses to the extent necessary to limit total operating expenses on an annual basis to .95%, 1.65%, 1.65%, .65%, 1.15%, .90% and .65% of the daily average net assets for Class A, Class B, Class C, Advisor Class, Class R, Class K and Class I shares, respectively (the “Expense Caps”). The Expense Caps will expire on October 31, 2011 and then may be extended by the Adviser for additional one year terms. For the year ended October 31, 2010, such reimbursement amounted to $736,252.
| | | | |
| ALLIANCEBERNSTEIN HIGH INCOME FUND • | | | 75 | |
Notes to Financial Statements
During the year ended October 31, 2010, the Adviser reimbursed the Fund $235,116 for trading losses incurred due to trade entry errors.
Pursuant to the investment advisory agreement, the Fund may reimburse the Adviser for certain legal and accounting services provided to the Fund by the Adviser. For the year ended October 31, 2010, such fee amounted to $89,160.
The Fund compensates AllianceBernstein Investor Services, Inc. (“ABIS”), a wholly-owned subsidiary of the Adviser, under a Transfer Agency Agreement for providing personnel and facilities to perform transfer agency services for the Fund. ABIS may make payments to intermediaries that provide omnibus account services, sub-accounting services and/or networking services. The compensation retained by ABIS amounted to $737,115 for the year ended October 31, 2010.
For year ended October 31, 2010, there was no reduction for the expenses of Class A, Class B, Class C and Advisor Class shares under and expense offset arrangement with ABIS.
AllianceBernstein Investments, Inc. (the “Distributor”), a wholly-owned subsidiary of the Adviser, serves as the distributor of the Fund’s shares. The Distributor has advised the Fund that it has retained front-end sales charges of $389,705 from the sale of Class A shares and received $20,462, $40,726 and $100,269 in contingent deferred sales charges imposed upon redemptions by shareholders of Class A, Class B and Class C shares, respectively, for the year ended October 31, 2010.
The Fund may invest in the AllianceBernstein Fixed-Income Shares, Inc.—Government STIF Portfolio, an open-end management investment company managed by the Adviser. The Government STIF Portfolio is offered as a cash management option to mutual funds and other institutional accounts of the Adviser, and is not available for direct purchase by members of the public. The Government STIF Portfolio pays no investment management fees but does bear its own expenses. A summary of the Fund’s transactions in shares of the Government STIF Portfolio for the year ended October 31, 2010 is as follows:
| | | | | | | | | | | | | | | | |
Market Value
October 31, 2009
(000) | | Purchases
at Cost
(000) | | | Sales
Proceeds
(000) | | | Market Value
October 31, 2010
(000) | | | Dividend
Income
(000) | |
| $ 112,962 | | $ | 723,520 | | | $ | 706,879 | | | $ | 129,603 | | | $ | 101 | |
NOTE C
Distribution Services Agreement
The Fund has adopted a Distribution Services Agreement (the “Agreement”) pursuant to Rule 12b-1 under the Investment Company Act of 1940. Under the Agreement the Fund pays a distribution fee to the Distributor at an annual rate of up to .30% of the average daily net assets attributable to Class A shares, 1% of the Fund’s average daily net assets attributable to Class B and Class C shares,
| | |
| 76 | | • ALLIANCEBERNSTEIN HIGH INCOME FUND |
Notes to Financial Statements
..50% of the Fund’s average daily net assets attributable to Class R shares and .25% of the Fund’s average daily net assets attributable to Class K shares. There are no distribution and servicing fees on Advisor Class and Class I shares. The fees are accrued daily and paid monthly. The Agreement provides that the Distributor will use such payments in their entirety for distribution assistance and promotional activities. Since the commencement of the fund’s operation, the Distributor has incurred expenses in excess of the distribution costs reimbursed by the Fund in the amounts of $6,310,714, $5,809,290, $37,971 and $9,945 for Class B, Class C, Class R, and Class K shares, respectively. While such costs may be recovered from the Fund in future periods so long as the Agreement is in effect, the rate of the distribution and servicing fees payable under the Agreement may not be increased without a shareholder vote. In accordance with the Agreement, there is no provision for recovery of unreimbursed distribution costs incurred by the Distributor beyond the current fiscal year for Class A shares. The Agreement also provides that the Adviser may use its own resources to finance the distribution of the Fund’s shares.
NOTE D
Investment Transactions
Purchases and sales of investment securities (excluding short-term investments) for the year ended October 31, 2010, were as follows:
| | | | | | | | |
| | | Purchases | | | Sales | |
Investment securities (excluding U.S. government securities) | | $ | 1,430,842,135 | | | $ | 404,236,040 | |
U.S. government securities | | | – 0 | – | | | – 0 | – |
The cost of investments for federal income tax purposes, gross unrealized appreciation and unrealized depreciation (excluding foreign currency contracts and swap contracts) are as follows:
| | | | |
Cost | | $ | 2,273,866,459 | |
| | | | |
Gross unrealized appreciation | | $ | 224,586,054 | |
Gross unrealized depreciation | | | (33,135,372 | ) |
| | | | |
Net unrealized appreciation | | $ | 191,450,682 | |
| | | | |
1. Derivative Financial Instruments
The Fund may use derivatives to earn income and enhance returns, to hedge or adjust the risk profile of its portfolio, to replace more traditional direct investments, or to obtain exposure to otherwise inaccessible markets. The Fund may also use derivatives for non-hedging purposes as a means of making direct investment in foreign currencies, as described below under “Currency Transactions”.
| | | | |
| ALLIANCEBERNSTEIN HIGH INCOME FUND • | | | 77 | |
Notes to Financial Statements
The principal types of derivatives utilized by the Fund, as well as the methods in which they may be used are:
| | • | | Forward Currency Exchange Contracts |
The Fund may enter into forward currency exchange contracts in order to hedge its exposure to changes in foreign currency exchange rates on its foreign portfolio holdings, to hedge certain firm purchase and sales commitments denominated in foreign currencies and for non-hedging purposes as a means of making direct investments in foreign currencies, as described below under “Currency Transactions”.
A forward currency exchange contract is a commitment to purchase or sell a foreign currency at a future date at a negotiated forward rate. The gain or loss arising from the difference between the original contract and the closing of such contract would be included in net realized gain or loss on foreign currency transactions. Fluctuations in the value of open forward currency exchange contracts are recorded for financial reporting purposes as unrealized appreciation and/or depreciation by the Fund.
Risks may arise from the potential inability of a counterparty to meet the terms of a contract and from unanticipated movements in the value of a foreign currency relative to the U.S. dollar. The face or contract amount, in U.S. dollars reflects the total exposure the Fund has in that particular currency contract.
During the year ended October 31, 2010, the Fund entered into foreign-currency exchange contracts for hedging purposes and to increase exposure to underlying asset classes.
For hedging and investment purposes, the Fund may purchase and write (sell) put and call options on U.S. and foreign securities, including government securities, and foreign currencies that are traded on U.S. and foreign securities exchanges and over-the-counter markets. The Fund may also use options transactions for non-hedging purposes as a means of making direct investments in foreign currencies, as described below under “Currency Transactions”.
The risk associated with purchasing an option is that the Fund pays a premium whether or not the option is exercised. Additionally, the Fund bears the risk of loss of the premium and change in market value should the counterparty not perform under the contract. Put and call options purchased are accounted for in the same manner as portfolio securities. The cost of securities acquired through the exercise of call options is increased by premiums paid. The proceeds from securities sold through the exercise of put options are decreased by the premiums paid.
When the Fund writes an option, the premium received by the Fund is recorded as a liability and is subsequently adjusted to the current market
| | |
| 78 | | • ALLIANCEBERNSTEIN HIGH INCOME FUND |
Notes to Financial Statements
value of the option written. Premiums received from written options which expire unexercised are recorded by the Fund on the expiration date as realized gains from options written. The difference between the premium received and the amount paid on effecting a closing purchase transaction, including brokerage commissions, is also treated as a realized gain, or if the premium received is less than the amount paid for the closing purchase transaction, as a realized loss. If a call option is exercised, the premium received is added to the proceeds from the sale of the underlying security or currency in determining whether the Fund has realized a gain or loss. If a put option is exercised, the premium received reduces the cost basis of the security or currency purchased by the Fund. In writing an option, the Fund bears the market risk of an unfavorable change in the price of the security or currency underlying the written option. Exercise of an option written by the Fund could result in the Fund selling or buying a security or currency at a price different from the current market value. For the year ended October 31, 2010, the Fund had no transactions in written options.
The Fund may also invest in options on swap agreements, also called “swaptions”. A swaption is an option that gives the buyer the right, but not the obligation, to enter into a swap on a future date in exchange for paying a market-based “premium.” A receiver swaption gives the owner the right to receive the total return of a specified asset, reference rate, or index. A payer swaption gives the owner the right to pay the total return of a specified asset, reference rate, or index. Swaptions also include options that allow an existing swap to be terminated or extended by one of the counterparties.
During the year ended October 31, 2010, the Fund entered into swaptions for hedging purposes.
The Fund may enter into swaps to hedge its exposure to interest rates, credit risk, or currencies. The Fund may also enter into swaps for non-hedging purposes as a means of gaining market exposures or making direct investments in foreign currencies, as described below under “Currency Transactions”. A swap is an agreement that obligates two parties to exchange a series of cash flows at specified intervals based upon or calculated by reference to changes in specified prices or rates for a specified amount of an underlying asset. The payment flows are usually netted against each other, with the difference being paid by one party to the other. In addition, collateral may be pledged or received by the Fund in accordance with the terms of the respective swap agreements to provide value and recourse to the Fund or its counterparties in the event of default, bankruptcy or insolvency by one of the parties to the swap agreement.
Risks may arise as a result of the failure of the counterparty to the swap contract to comply with the terms of the swap contract. The loss incurred
| | | | |
| ALLIANCEBERNSTEIN HIGH INCOME FUND • | | | 79 | |
Notes to Financial Statements
by the failure of a counterparty is generally limited to the net interim payment to be received by the Fund, and/or the termination value at the end of the contract. Therefore, the Fund considers the creditworthiness of each counterparty to a swap contract in evaluating potential counterparty risk. This risk is mitigated by having a netting arrangement between the Fund and the counterparty and by the posting of collateral by the counterparty to the Fund to cover the Fund’s exposure to the counterparty. Additionally, risks may arise from unanticipated movements in interest rates or in the value of the underlying securities. The Fund accrues for the interim payments on swap contracts on a daily basis, with the net amount recorded within unrealized appreciation/depreciation of swap contracts on the statement of assets and liabilities, where applicable. Once the interim payments are settled in cash, the net amount is recorded as realized gain/(loss) on swaps on the statement of operations, in addition to any realized gain/(loss) recorded upon the termination of swap contracts. Fluctuations in the value of swap contracts are recorded as a component of net change in unrealized appreciation/depreciation of swap contracts on the statement of operations.
Credit Default Swaps:
The Fund may enter into credit default swaps to manage its exposure to the market or certain sectors of the market, to reduce its risk exposure to defaults by corporate and sovereign issuers held by the Fund, or to create exposure to corporate or sovereign issuers to which it is not otherwise exposed. The Fund may purchase credit protection (“Buy Contract”) or provide credit protection (“Sale Contract”) on the referenced obligation of the credit default swap. During the term of the swap agreement, the Fund receives/(pays) fixed payments from/(to) the respective counterparty, calculated at the agreed upon interest rate applied to the notional amount. The accrual for these interim payments is recorded within unrealized appreciation/depreciation of swap contracts on the statement of assets and liabilities. Upfront premiums paid or received in connection with credit default swap contracts are recognized as cost or proceeds on the statement of assets and liabilities and are amortized on a straight line basis over the life of the contract. Amortized upfront premiums are included in net realized gain/(loss) from swaps on the statement of operations. If the Fund is a buyer/(seller) of protection and a credit event occurs, as defined under the terms of the swap agreement, the Fund will either (i) receive from the seller/(pay to the buyer) of protection an amount equal to the notional amount of the swap contract (the “Maximum Payout Amount”) and deliver/(take delivery of) the referenced obligation or (ii) receive/ (pay) a net settlement amount in the form of cash or securities equal to the notional amount of the swap less the recovery value of the referenced obligation.
During the year ended October 31, 2010, the Fund entered into credit default swap contracts for hedging and non-hedging purposes.
| | |
| 80 | | • ALLIANCEBERNSTEIN HIGH INCOME FUND |
Notes to Financial Statements
Credit default swaps may involve greater risks than if the Fund had invested in the referenced obligation directly. Credit default swaps are subject to general market risk, liquidity risk, counterparty risk and credit risk. If the Fund is a buyer of protection and no credit event occurs, it will lose its investment. If the Fund is a seller of protection and a credit event occurs, the value of the referenced obligation received by the Fund coupled with the periodic payments previously received may be less than the Maximum Payout Amount it pays to the buyer, resulting in a net loss to the Fund.
Implied credit spreads over Treasuries of comparable maturity utilized in determining the market value of credit default swaps on issuers as of period end are disclosed in the portfolio of investments. The implied spreads serve as an indicator of the current status of the payment/performance risk and typically reflect the market’s assessment of the likelihood of default by the issuer on the referenced obligation. The implied credit spread of a particular reference entity reflects the cost of buying/selling protection and may include upfront payments required to be made to enter into the agreement. Widening credit spreads typically represent a deterioration of the referenced entity’s credit soundness and greater likelihood of default or other credit event occurring as defined under the terms of the agreement. A credit spread identified as “Defaulted” indicates a credit event has occurred for the referenced entity or obligation.
At October 31, 2010 the Fund had Sale Contracts outstanding with Maximum Payout Amounts aggregating $59,700,000 with net unrealized appreciation of $4,263,579 and terms ranging from 4 months to 5 years, as reflected in the portfolio of investments.
In certain circumstances Maximum Payout Amounts may be partially offset by recovery values of the respective referenced obligations, upfront premium received upon entering into the agreement, or net amounts received from settlement of buy protection credit default swap agreements entered into by the Fund for the same reference obligation with the same counterparty.
Documentation governing the Fund’s swap transactions may contain provisions for early termination of a swap in the event the net assets of the Fund decline below specific levels set forth in the documentation (“net asset contingent features”). If these levels are triggered, the Fund’s counterparty has the right to terminate swap and require the Fund to pay or receive a settlement amount in connection with the terminated swap transaction. As of October 31, 2010 the Fund had credit default swap contracts in liability positions with net asset contingent features. The fair value of such contracts amounted to $365,506 at October 31, 2010.
| | | | |
| ALLIANCEBERNSTEIN HIGH INCOME FUND • | | | 81 | |
Notes to Financial Statements
At October 31, 2010 the Fund had entered into the following derivatives:
| | | | | | | | | | | | |
| | | Asset Derivatives | | | Liability Derivatives | |
Derivative
Type | | Statement of
Assets and
Liabilities
Location | | Fair Value | | | Statement of
Assets and
Liabilities
Location | | Fair Value | |
Foreign exchange contracts | |
Unrealized appreciation of forward currency exchange contracts | |
$ |
1,733,187 |
| |
Unrealized depreciation of forward currency exchange contracts | |
$ |
2,719,048 |
|
| | | | |
Credit contracts | |
Unrealized appreciation of credit default swap contracts | |
|
4,402,471 |
| |
Unrealized depreciation of credit default swap contracts | |
|
365,506 |
|
| | | | | | | | | | | | |
Total | | | | $ | 6,135,658 | | | | | $ | 3,084,554 | |
| | | | | | | | | | | | |
The effect of derivative instruments on the statement of operations for the year ended October 31, 2010:
| | | | | | | | | | |
Derivative Type | | Location of Gain
or (Loss) on
Derivatives | | Realized Gain
or (Loss) on
Derivatives | | | Change in
Unrealized
Appreciation or
(Depreciation) | |
Credit contracts | | Net realized gain/(loss) on swap contracts; Net change in unrealized appreciation/depreciation of swap contracts | | $ | 4,817,220 | | | $ | (859,944 | ) |
| | | |
Foreign exchange contracts | | Net realized gain/(loss) on foreign currency transactions; Net change in unrealized appreciation/depreciation of foreign currency denominated assets and liabilities | | | (4,090,892 | ) | | | (1,711,130 | ) |
| | | | | | | | | | |
Total | | | | $ | 726,328 | | | $ | (2,571,074) | |
| | | | | | | | | | |
For the year ended October 31, 2010, the average monthly notional amount of credit default swap contracts was $54,107,692, and the average monthly principal amount of forward currency exchange contracts was $206,803,773.
2. Currency Transactions
The Fund may invest in non-U.S. Dollar securities on a currency hedged or unhedged basis. The Fund may seek investment opportunities by taking long or
| | |
| 82 | | • ALLIANCEBERNSTEIN HIGH INCOME FUND |
Notes to Financial Statements
short positions in currencies through the use of currency-related derivatives, including forward currency exchange contracts, futures and options on futures, swaps, and other options. The Fund may enter into transactions for investment opportunities when it anticipates that a foreign currency will appreciate or depreciate in value but securities denominated in that currency are not held by the Fund and do not present attractive investment opportunities. Such transactions may also be used when the Adviser believes that it may be more efficient than a direct investment in a foreign currency-denominated security. The Fund may also conduct currency exchange contracts on a spot basis (i.e., for cash at the spot rate prevailing in the currency exchange market for buying or selling currencies).
3. Reverse Repurchase Agreements
Under a reverse repurchase agreement, the Fund sells securities and agrees to repurchase them at a mutually agreed upon date and price. At the time the Fund enters into a reverse repurchase agreement, it will establish a segregated account with the custodian containing liquid assets having a value at least equal to the repurchase price. For the year ended October 31, 2010, the average amount of reverse repurchase agreements outstanding was $73,673,921 and the daily weighted average interest rate was (0.17)%. During the year, the Fund received net interest payment from counterparties.
4. Term Asset-Backed Securities Loan Facility
Through June 14, 2010, the Fund participated in the TALF program. Under the TALF program eligible borrowers obtained a non-recourse loan from the Federal Reserve Bank of New York (“FRBNY”) by posting certain asset-backed securities and commercial mortgage-backed securities (“Eligible Securities”) as collateral. The transfer of the collateral was not recorded as a sale on the Fund’s records. The Fund agreed to repay the non-recourse loan amount plus accrued interest under the terms of the loan, with the principal balance being due at loan maturity. According to the terms of the TALF program, the Fund was not required to pledge further collateral in the event that the value of the Eligible Securities transferred as collateral fell below the loan amount. The loan was prepayable in whole or in part at any time at the Fund’s option. Prepayments of principal received on the collateral during the loan term must be used to immediately reduce proportionately the loan balance outstanding. At the time of loan approval, the Fund paid a one time administration fee based upon the amount borrowed to the FRBNY.
Borrowing under TALF, as with the extension of other types of credit, subjected the Fund to certain risks, including possible delays in the recovery of securities posted as collateral or possible loss of rights in the collateral should the Fund be unable to repay a loan. Additionally, there was the risk that the expenses associated with the TALF loan, including interest expense, may be greater than the income earned from the investment of the proceeds and/or the interest earned on the collateral to which the Fund was entitled. Under the TALF program,
| | | | |
| ALLIANCEBERNSTEIN HIGH INCOME FUND • | | | 83 | |
Notes to Financial Statements
interest earned on collateral was used to pay interest expense associated with a loan. Should the interest earned exceed the interest expense on any given payment date, the remainder was applied to the principal balance. Conversely, should the interest earned on the collateral be in shortfall of the interest expense due at any given payment date, the Fund was required to expend cash for the difference in order to meet its obligation. Interest on the TALF loan was measured based on a predetermined rate on the loan origination and is reported on the statement of operations as interest expense.
As of June 14, 2010, and for the remainder of the reporting period, there were no TALF loans outstanding for the Fund. For the period November 1, 2009 through June 14, 2010, the average amount of TALF loans outstanding for the Fund was $35,086,069 and the weighted average interest rate was 2.46%.
NOTE E
Capital Stock
Each class consists of 3,000,000,000 authorized shares. Transactions in capital shares for each class were as follows:
| | | | | | | | | | | | | | | | | | | | | | | | |
| | | | | | | | | | | | | | | | |
| | | Shares | | | | | | Amount | | | | |
| | | Year Ended
October 31,
2010 | | | Year Ended
October 31,
2009 | | | | | | Year Ended
October 31,
2010 | | | Year Ended
October 31, 2009 | | | | |
| | | | | | | | |
| Class A | | | | | | | | | | | | | | | | | | | | | | | | |
Shares sold | | | 80,356,153 | | | | 35,548,416 | | | | | | | $ | 701,043,060 | | | $ | 255,404,068 | | | | | |
| | | | | | |
Shares issued in reinvestment of dividends and distributions | | | 5,567,603 | | | | 5,363,917 | | | | | | | | 48,216,232 | | | | 35,062,470 | | | | | |
| | | | | | |
Shares converted from Class B | | | 1,520,117 | | | | 2,418,802 | | | | | | | | 13,150,234 | | | | 15,973,756 | | | | | |
| | | | | | |
Shares redeemed | | | (37,725,184 | ) | | | (25,654,414 | ) | | | | | | | (323,863,566 | ) | | | (167,978,078 | ) | | | | |
| | | | | | |
Net increase | | | 49,718,689 | | | | 17,676,721 | | | | | | | $ | 438,545,960 | | | $ | 138,462,216 | | | | | |
| | | | | | |
| | | | | |
| Class B | | | | | | | | | | | | | | | | | | | | | | | | |
Shares sold | | | 459,316 | | | | 925,937 | | | | | | | $ | 4,026,205 | | | $ | 5,947,080 | | | | | |
| | | | | | |
Shares issued in reinvestment of dividends and distributions | | | 232,327 | | | | 479,418 | | | | | | | | 2,017,843 | | | | 3,082,942 | | | | | |
| | | | | | |
Shares converted to Class A | | | (1,507,755 | ) | | | (2,399,018 | ) | | | | | | | (13,150,234 | ) | | | (15,973,756 | ) | | | | |
| | | | | | |
Shares redeemed | | | (1,120,294 | ) | | | (2,015,989 | ) | | | | | | | (9,739,473 | ) | | | (12,882,778 | ) | | | | |
| | | | | | |
Net decrease | | | (1,936,406 | ) | | | (3,009,652 | ) | | | | | | $ | (16,845,659 | ) | | $ | (19,826,512 | ) | | | | |
| | | | | | |
| | | | | |
| | |
| 84 | | • ALLIANCEBERNSTEIN HIGH INCOME FUND |
Notes to Financial Statements
| | | | | | | | | | | | | | | | | | | | | | | | |
| | | | | | | | | | | | | | | | | | | | | | | | |
| | | Shares | | | | | | Amount | | | | |
| | | Year Ended
October 31,
2010 | | | Year Ended
October 31,
2009 | | | | | | Year Ended
October 31,
2010 | | | Year Ended
October 31, 2009 | | | | |
| Class C | | | | | | | | | | | | | | | | | | | | | | | | |
Shares sold | | | 36,083,321 | | | | 11,822,324 | | | | | | | $ | 318,660,800 | | | $ | 86,721,170 | | | | | |
| | | | | | |
Shares issued in reinvestment of dividends and distributions | | | 1,670,254 | | | | 1,251,606 | | | | | | | | 14,655,898 | | | | 8,306,930 | | | | | |
| | | | | | |
Shares redeemed | | | (6,204,959 | ) | | | (5,373,542 | ) | | | | | | | (54,236,612 | ) | | | (35,784,954 | ) | | | | |
| | | | | | |
Net increase | | | 31,548,616 | | | | 7,700,388 | | | | | | | $ | 279,080,086 | | | $ | 59,243,146 | | | | | |
| | | | | | |
| | | | | |
| Advisor Class | | | | | | | | | | | | | | | | | | | | | | | | |
Shares sold | | | 40,072,038 | | | | 10,778,833 | | | | | | | $ | 349,916,045 | | | $ | 75,896,243 | | | | | |
| | | | | | |
Shares issued in reinvestment of dividends and distributions | | | 1,197,780 | | | | 362,613 | | | | | | | | 10,461,294 | | | | 2,577,721 | | | | | |
| | | | | | |
Shares redeemed | | | (8,696,949 | ) | | | (2,867,029 | ) | | | | | | | (74,880,842 | ) | | | (21,929,061 | ) | | | | |
| | | | | | |
Net increase | | | 32,572,869 | | | | 8,274,417 | | | | | | | $ | 285,496,497 | | | $ | 56,544,903 | | | | | |
| | | | | | |
| | | | | |
| Class R | | | | | | | | | | | | | | | | | | | | | | | | |
Shares sold | | | 1,172,235 | | | | 275,163 | | | | | | | $ | 10,263,021 | | | $ | 1,751,460 | | | | | |
| | | | | | |
Shares issued in reinvestment of dividends and distributions | | | 67,342 | | | | 39,069 | | | | | | | | 586,282 | | | | 248,743 | | | | | |
| | | | | | |
Shares redeemed | | | (253,022 | ) | | | (105,163 | ) | | | | | | | (2,212,270 | ) | | | (692,999 | ) | | | | |
| | | | | | |
Net increase | | | 986,555 | | | | 209,069 | | | | | | | $ | 8,637,033 | | | $ | 1,307,204 | | | | | |
| | | | | | |
| | | | | |
| Class K | | | | | | | | | | | | | | | | | | | | | | | | |
Shares sold | | | 33,081 | | | | 26,058 | | | | | | | $ | 291,477 | | | $ | 171,689 | | | | | |
| | | | | | |
Shares issued in reinvestment of dividends and distributions | | | 13,705 | | | | 15,768 | | | | | | | | 118,369 | | | | 103,442 | | | | | |
| | | | | | |
Shares redeemed | | | (31,128 | ) | | | (9,396 | ) | | | | | | | (273,753 | ) | | | (66,427 | ) | | | | |
| | | | | | |
Net increase | | | 15,658 | | | | 32,430 | | | | | | | $ | 136,093 | | | $ | 208,704 | | | | | |
| | | | | | |
| | | | | | | | | | | | | | | | | | | | | | | | |
| Class I | | | | | | | | | | | | | | | | | | | | | | | | |
Shares sold | | | 1,794,820 | | | | 7,106 | | | | | | | $ | 15,724,460 | | | $ | 43,828 | | | | | |
| | | | | | |
Shares issued in reinvestment of dividends and distributions | | | 53,785 | | | | 3,864 | | | | | | | | 475,051 | | | | 25,275 | | | | | |
| | | | | | |
Shares redeemed | | | (8,182 | ) | | | (1,919 | ) | | | | | | | (73,651 | ) | | | (12,136 | ) | | | | |
| | | | | | |
Net increase | | | 1,840,423 | | | | 9,051 | | | | | | | $ | 16,125,860 | | | $ | 56,967 | | | | | |
| | | | | | |
| | | | |
| ALLIANCEBERNSTEIN HIGH INCOME FUND • | | | 85 | |
Notes to Financial Statements
NOTE F
Risks Involved in Investing in the Fund
Interest Rate Risk and Credit Risk—Interest rate risk is the risk that changes in interest rates will affect the value of the Fund’s investments in fixed-income debt securities such as bonds or notes. Increases in interest rates may cause the value of the Fund’s investments to decline. Credit risk is the risk that the issuer or guarantor of a debt security, or the counterparty to a derivative contract, will be unable or unwilling to make timely principal and/or interest payments, or to otherwise honor its obligations. The degree of risk for a particular security may be reflected in its credit risk rating. Credit risk is greater for medium quality and lower-rated securities. Lower-rated debt securities and similar unrated securities (commonly known as “junk bonds”) have speculative elements or are predominantly speculative risks.
Foreign Securities Risk—Investing in securities of foreign companies or foreign governments involves special risks which include changes in foreign currency exchange rates and the possibility of future political and economic developments which could adversely affect the value of such securities. Moreover, securities of many foreign companies or foreign governments and their markets may be less liquid and their prices more volatile than those of comparable U.S. companies and the U.S. government. The Fund invests in the Sovereign Debt Obligations of countries that are considered emerging market countries at the time of purchase. Therefore, the Fund is susceptible to governmental factors and economic and debt restructuring developments adversely affecting the economies of these emerging market countries. In addition, these debt obligations may be less liquid and subject to greater volatility than debt obligations of more developed countries.
Currency Risk—This is the risk that changes in foreign currency exchange rates may negatively affect the value of the Fund’s investments or reduce the returns of the Fund. For example, the value of the Fund’s investments in foreign currency-denominated securities or currencies may decrease if the U.S. Dollar is strong (i.e., gaining value relative to other currencies) and other currencies are weak (i.e., losing value relative to the U.S. Dollar). Currency markets are generally not as regulated as securities markets. Independent of the Fund’s investments in securities denominated in foreign currencies, the Fund’s positions in various foreign currencies may cause the Fund to experience investment losses due to the changes in exchange rates and interest rates.
Derivatives Risk—The Fund may enter into derivative transactions such as forwards, options, futures and swaps. Derivatives may be illiquid, difficult to price, and leveraged so that small changes may produce disproportionate losses for the Fund, and subject to counterparty risk to a greater degree than more traditional investments. Derivatives may result in significant losses, including losses that are far greater than the value of the derivatives reflected on the statement of assets and liabilities.
| | |
| 86 | | • ALLIANCEBERNSTEIN HIGH INCOME FUND |
Notes to Financial Statements
Leverage Risk—When the Fund borrows money or otherwise leverages its portfolio, it may be volatile because leverage tends to exaggerate the effect of any increase or decrease in the value of the Fund’s investments. The Fund may create leverage through the use of reverse repurchase arrangements, forward currency exchange contracts, forward commitments, dollar rolls or futures contracts or by borrowing money. The Fund may also utilize leverage through the use of the TALF loan. The use of derivative instruments by the Fund, such as forwards, futures, options and swaps, may also result in a form of leverage. Leverage may result in higher returns to the Fund than if the Fund were not leveraged, but may also adversely affect returns, particularly if the market is declining.
Indemnification Risk—In the ordinary course of business, the Fund enters into contracts that contain a variety of indemnifications. The Fund’s maximum exposure under these arrangements is unknown. However, the Fund has not had prior claims or losses pursuant to these indemnification provisions and expects the risk of loss thereunder to be remote. Therefore, the Fund has not accrued any liability in connection with these indemnification provisions.
NOTE G
Joint Credit Facility
A number of open-end mutual funds managed by the Adviser, including the Fund, participate in a $140 million revolving credit facility (the “Facility”) intended to provide short-term financing if necessary, subject to certain restrictions, in connection with abnormal redemption activity. Commitment fees related to the Facility are paid by the participating funds and are included in miscellaneous expenses in the statement of operations. The Fund did not utilize the Facility during the year ended October 31, 2010.
NOTE H
Distributions to Shareholders
The tax character of distributions paid during the fiscal years ended October 31, 2010 and October 31, 2009 were as follows:
| | | | | | | | |
| | | 2010 | | | 2009 | |
Distributions paid from: | | | | | | | | |
Ordinary income | | $ | 122,307,341 | | | $ | 78,699,783 | |
| | | | | | | | |
Total taxable distributions | | | 122,307,341 | | | | 78,699,783 | |
Tax return of capital | | | – 0 | – | | | 1,402,674 | |
| | | | | | | | |
Total distributions paid | | $ | 122,307,341 | | | $ | 80,102,457 | |
| | | | | | | | |
| | | | |
| ALLIANCEBERNSTEIN HIGH INCOME FUND • | | | 87 | |
Notes to Financial Statements
As of October 31, 2010, the components of accumulated earnings/(deficit) on a tax basis were as follows:
| | | | |
Undistributed net investment income | | $ | 12,866,408 | |
Accumulated capital and other losses | | | (73,217,359 | )(a) |
Unrealized appreciation/(depreciation) | | | 191,334,052 | (b) |
| | | | |
Total accumulated earnings/(deficit) | | $ | 130,983,101 | (c) |
| | | | |
| (a) | | On October 31 ,2010, the Fund had a net capital loss carryforward for federal income tax purposes of $63,198,077, of which $12,359,846 expires in the year 2016, and $50,838,231 expires in the year 2017. To the extent future capital gains are offset by capital loss carryforwards, such gains will not be distributed. During the fiscal year, the Fund utilized capital loss carryforwards of $24,242,999. As a result of the merger with AllianceBernstein Bond Fund—Corporate Bond Portfolio and AllianceBernstein High Yield Fund, Inc, into the Fund, various limitations and reductions regarding the future utilization of certain capital loss carryforwards were applied, based on certain provisions in the Internal Revenue Code. For the year ended October 31, 2010, the cumulative deferred loss on straddles was $10,019,282. |
| (b) | | The differences between book-basis and tax-basis unrealized appreciation/(depreciation) are attributable primarily to the tax deferral of losses on wash sales, the difference between book and tax amortization methods for premium, the difference between book and tax treatment of swap income, and the realization for tax purposes of gains/losses on certain derivative instruments. |
| (c) | | The difference between book-basis and tax-basis components of accumulated earnings/(deficit) is attributable to dividends payable and tax treatment of interest on defaulted securities. |
During the current fiscal year, permanent differences primarily due to the tax treatment of swap income, paydown reclassification, foreign currency reclassification, premium adjustment, and a contribution from advisor resulted in a net decrease in distributions in excess of net investment income, a net increase in accumulated net realized loss on investment transactions and foreign currency transactions, and a net decrease to additional paid-in capital. This reclassification had no effect on net assets.
NOTE I
Subsequent Events
Management has evaluated subsequent events for possible recognition or disclosure in the financial statements through the date the financial statements are issued. Management has determined that there are no material events that would require disclosure in the Fund’s financial statements through this date.
| | |
| 88 | | • ALLIANCEBERNSTEIN HIGH INCOME FUND |
Notes to Financial Statements
FINANCIAL HIGHLIGHTS
Selected Data For A Share of Capital Stock Outstanding Throughout Each Period
| | | | | | | | | | | | | | | | | | | | |
| | | Class A | |
| | | Year Ended October 31, | |
| | | 2010 | | | 2009 | | | 2008 | | | 2007 | | | 2006 | |
| | | | |
| | | | | | | | | | | | | | | | | | | | |
Net asset value,
beginning of period | | | $ 8.24 | | | | $ 5.85 | | | | $ 9.02 | | | | $ 8.97 | | | | $ 8.70 | |
| | | | |
Income From Investment Operations | | | | | | | | | | | | | | | | | | | | |
Net investment income(a) | | | .69 | (b) | | | .67 | (b) | | | .61 | (b) | | | .56 | | | | .55 | |
Net realized and unrealized gain (loss) on investment and foreign currency transactions | | | .96 | | | | 2.44 | | | | (2.87 | ) | | | .41 | | | | .43 | |
Contributions from Adviser | | | .00 | (c) | | | – 0 | – | | | .00 | (c) | | | – 0 | – | | | – 0 | – |
| | | | |
Net increase (decrease) in net asset value from operations | | | 1.65 | | | | 3.11 | | | | (2.26 | ) | | | .97 | | | | .98 | |
| | | | |
Less: Dividends and Distributions | | | | | | | | | | | | | | | | | | | | |
Dividends from net investment income | | | (.70 | ) | | | (.69 | ) | | | (.68 | ) | | | (.57 | ) | | | (.57 | ) |
Tax return of capital | | | – 0 | – | | | (.01 | ) | | | – 0 | – | | | – 0 | – | | | – 0 | – |
Distributions from net realized gain on investment and foreign currency transactions | | | – 0 | – | | | (.02 | ) | | | (.23 | ) | | | (.35 | ) | | | (.14 | ) |
| | | | |
Total dividends and distributions | | | (.70 | ) | | | (.72 | ) | | | (.91 | ) | | | (.92 | ) | | | (.71 | ) |
| | | | |
Net asset value, end of period | | | $ 9.19 | | | | $ 8.24 | | | | $ 5.85 | | | | $ 9.02 | | | | $ 8.97 | |
| | | | |
Total Return | | | | | | | | | | | | | | | | | | | | |
Total investment return based on net asset value(d) | | | 20.85 | %* | | | 57.11 | %* | | | (27.49 | )%* | | | 11.54 | % | | | 11.87 | % |
Ratios/Supplemental Data | | | | | | | | | | | | | | | | | | | | |
Net assets, end of period (000’s omitted) | | | $1,326,974 | | | | $780,222 | | | | $450,517 | | | | $281,677 | | | | $235,763 | |
Ratio to average net assets of: | | | | | | | | | | | | | | | | | | | | |
Expenses, net of waivers/reimbursements | | | .99 | %** | | | .99 | % | | | 1.03 | %** | | | 1.41 | %** | | | 1.48 | % |
Expenses, net of waivers/reimbursements excluding interest expense and TALF administration fee | | | .95 | %** | | | .95 | % | | | 1.03 | %** | | | 1.41 | %** | | | 1.48 | % |
Expenses, before waivers/reimbursements | | | 1.04 | %** | | | 1.13 | % | | | 1.13 | %** | | | 1.41 | %** | | | 1.48 | % |
Expenses, before waivers/reimbursements excluding interest expense and TALF administration fee | | | 1.00 | %** | | | 1.09 | % | | | 1.07 | %** | | | 1.14 | %** | | | 1.14 | % |
Net investment income | | | 7.93 | %(b)** | | | 10.13 | %(b) | | | 7.65 | %(b)** | | | 6.24 | %** | | | 6.32 | % |
Portfolio turnover rate | | | 26 | % | | | 46 | % | | | 74 | % | | | 67 | % | | | 75 | % |
See footnote summary on page 96.
| | | | |
| ALLIANCEBERNSTEIN HIGH INCOME FUND • | | | 89 | |
Financial Highlights
Selected Data For A Share of Capital Stock Outstanding Throughout Each Period
| | | | | | | | | | | | | | | | | | | | |
| | | Class B | |
| | | Year Ended October 31, | |
| | | 2010 | | | 2009 | | | 2008 | | | 2007 | | | 2006 | |
| | | | |
| | | | | | | | | | | | | | | | | | | | |
Net asset value,
beginning of period | | | $ 8.31 | | | | $ 5.90 | | | | $ 9.09 | | | | $ 9.05 | | | | $ 8.77 | |
| | | | |
Income From Investment Operations | | | | | | | | | | | | | | | | | | | | |
Net investment income(a) | | | .63 | (b) | | | .62 | (b) | | | .55 | (b) | | | .49 | | | | .49 | |
Net realized and unrealized gain (loss) on investment and foreign currency transactions | | | .96 | | | | 2.46 | | | | (2.89 | ) | | | .41 | | | | .44 | |
Contributions from Adviser | | | .00 | (c) | | | – 0 | – | | | .00 | (c) | | | – 0 | – | | | – 0 | – |
| | | | |
Net increase (decrease) in net asset value from operations | | | 1.59 | | | | 3.08 | | | | (2.34 | ) | | | .90 | | | | .93 | |
| | | | |
Less: Dividends and Distributions | | | | | | | | | | | | | | | | | | | | |
Dividends from net investment income | | | (.64 | ) | | | (.64 | ) | | | (.62 | ) | | | (.51 | ) | | | (.51 | ) |
Tax return of capital | | | – 0 | – | | | (.01 | ) | | | – 0 | – | | | – 0 | – | | | – 0 | – |
Distributions from net realized gain on investment and foreign currency transactions | | | – 0 | – | | | (.02 | ) | | | (.23 | ) | | | (.35 | ) | | | (.14 | ) |
| | | | |
Total dividends and distributions | | | (.64 | ) | | | (.67 | ) | | | (.85 | ) | | | (.86 | ) | | | (.65 | ) |
| | | | |
Net asset value, end of period | | | $ 9.26 | | | | $ 8.31 | | | | $ 5.90 | | | | $ 9.09 | | | | $ 9.05 | |
| | | | |
Total Return | | | | | | | | | | | | | | | | | | | | |
Total investment return based on net asset value(d) | | | 19.86 | %* | | | 55.89 | %* | | | (28.03 | )%* | | | 10.51 | % | | | 11.11 | % |
Ratios/Supplemental Data | | | | | | | | | | | | | | | | | | | | |
Net assets, end of period (000’s omitted) | | | $40,092 | | | | $52,041 | | | | $54,724 | | | | $35,058 | | | | $45,133 | |
Ratio to average net assets of: | | | | | | | | | | | | | | | | | | | | |
Expenses, net of waivers/reimbursements | | | 1.70 | %** | | | 1.68 | % | | | 1.74 | %** | | | 2.14 | %** | | | 2.18 | % |
Expenses, net of waivers/reimbursements excluding interest expense and TALF administration fee | | | 1.65 | %** | | | 1.65 | % | | | 1.74 | %** | | | 2.14 | %** | | | 2.18 | % |
Expenses, before waivers/reimbursements | | | 1.78 | %** | | | 1.88 | % | | | 1.86 | %** | | | 2.14 | %** | | | 2.18 | % |
Expenses, before waivers/reimbursements excluding interest expense and TALF administration fee | | | 1.73 | %** | | | 1.85 | % | | | 1.80 | %** | | | 1.87 | %** | | | 1.85 | % |
Net investment income | | | 7.25 | %(b)** | | | 9.46 | %(b) | | | 6.83 | %(b)** | | | 5.45 | %** | | | 5.55 | % |
Portfolio turnover rate | | | 26 | % | | | 46 | % | | | 74 | % | | | 67 | % | | | 75 | % |
See footnote summary on page 96.
| | |
| 90 | | • ALLIANCEBERNSTEIN HIGH INCOME FUND |
Financial Highlights
Selected Data For A Share of Capital Stock Outstanding Throughout Each Period
| | | | | | | | | | | | | | | | | | | | |
| | | Class C | |
| | | Year Ended October 31, | |
| | | 2010 | | | 2009 | | | 2008 | | | 2007 | | | 2006 | |
| | | | |
| | | | | | | | | | | | | | | | | | | | |
Net asset value,
beginning of period | | | $ 8.33 | | | | $ 5.92 | | | | $ 9.11 | | | | $ 9.07 | | | | $ 8.79 | |
| | | | |
Income From Investment Operations | | | | | | | | | | | | | | | | | | | | |
Net investment income(a) | | | .62 | (b) | | | .62 | (b) | | | .55 | (b) | | | .49 | | | | .49 | |
Net realized and unrealized gain (loss) on investment and foreign currency transactions | | | .97 | | | | 2.46 | | | | (2.89 | ) | | | .41 | | | | .44 | |
Contributions from Adviser | | | .00 | (c) | | | – 0 | – | | | .00 | (c) | | | – 0 | – | | | – 0 | – |
| | | | |
Net increase (decrease) in net asset value from operations | | | 1.59 | | | | 3.08 | | | | (2.34 | ) | | | .90 | | | | .93 | |
| | | | |
Less: Dividends and Distributions | | | | | | | | | | | | | | | | | | | | |
Dividends from net investment income | | | (.63 | ) | | | (.64 | ) | | | (.62 | ) | | | (.51 | ) | | | (.51 | ) |
Tax return of capital | | | – 0 | – | | | (.01 | ) | | | – 0 | – | | | – 0 | – | | | – 0 | – |
Distributions from net realized gain on investment and foreign currency transactions | | | – 0 | – | | | (.02 | ) | | | (.23 | ) | | | (.35 | ) | | | (.14 | ) |
| | | | |
Total dividends and distributions | | | (.63 | ) | | | (.67 | ) | | | (.85 | ) | | | (.86 | ) | | | (.65 | ) |
| | | | |
Net asset value, end of period | | | $ 9.29 | | | | $ 8.33 | | | | $ 5.92 | | | | $ 9.11 | | | | $ 9.07 | |
| | | | |
Total Return | | | | | | | | | | | | | | | | | | | | |
Total investment return based on net asset value(d) | | | 19.88 | %* | | | 55.68 | %* | | | (27.95 | )%* | | | 10.50 | % | | | 11.10 | % |
Ratios/Supplemental Data | | | | | | | | | | | | | | | | | | | | |
Net assets, end of period (000’s omitted) | | | $541,386 | | | | $222,632 | | | | $112,508 | | | | $86,525 | | | | $88,046 | |
Ratio to average net assets of: | | | | | | | | | | | | | | | | | | | | |
Expenses, net of waivers/reimbursements | | | 1.69 | %** | | | 1.69 | % | | | 1.75 | %** | | | 2.11 | %** | | | 2.17 | % |
Expenses, net of waivers/reimbursements excluding interest expense and TALF administration fee | | | 1.65 | %** | | | 1.65 | % | | | 1.75 | %** | | | 2.11 | %** | | | 2.17 | % |
Expenses, before waivers/reimbursements | | | 1.73 | %** | | | 1.83 | % | | | 1.84 | %** | | | 2.11 | %** | | | 2.17 | % |
Expenses, before waivers/reimbursements excluding interest expense and TALF administration fee | | | 1.69 | %** | | | 1.79 | % | | | 1.77 | %** | | | 1.85 | %** | | | 1.84 | % |
Net investment income | | | 7.08 | %(b)** | | | 9.27 | %(b) | | | 6.82 | %(b)** | | | 5.47 | %** | | | 5.54 | % |
Portfolio turnover rate | | | 26 | % | | | 46 | % | | | 74 | % | | | 67 | % | | | 75 | % |
See footnote summary on page 96.
| | | | |
| ALLIANCEBERNSTEIN HIGH INCOME FUND • | | | 91 | |
Financial Highlights
Selected Data For A Share of Capital Stock Outstanding Throughout Each Period
| | | | | | | | | | | | |
| | | Advisor Class | |
| | | Year Ended October 31, | | | January 28,
2008(e) to
October 31, 2008 | |
| | | 2010 | | | 2009 | | |
| | | | |
| | | | | | | | | | | | |
Net asset value, beginning of period | | | $ 8.25 | | | | $ 5.86 | | | | $ 8.52 | |
| | | | |
Income From Investment Operations | | | | | | | | | | | | |
Net investment income(a)(b) | | | .71 | | | | .72 | | | | .52 | |
Net realized and unrealized gain (loss) on investment and foreign currency transactions | | | .97 | | | | 2.41 | | | | (2.69 | ) |
Contributions from Adviser | | | .00 | (c) | | | – 0 | – | | | .00 | (c) |
| | | | |
Net increase (decrease) in net asset value from operations | | | 1.68 | | | | 3.13 | | | | (2.17 | ) |
| | | | |
Less: Dividends and Distributions | | | | | | | | | | | | |
Dividends from net investment income | | | (.73 | ) | | | (.71 | ) | | | (.49 | ) |
Tax return of capital | | | – 0 | – | | | (.01 | ) | | | – 0 | – |
Distributions from net realized gain on investment and foreign currency transactions | | | – 0 | – | | | (.02 | ) | | | – 0 | – |
| | | | |
Total dividends and distributions | | | (.73 | ) | | | (.74 | ) | | | (.49 | ) |
| | | | |
Net asset value, end of period | | | $ 9.20 | | | | $ 8.25 | | | | $ 5.86 | |
| | | | |
Total Return | | | | | | | | | | | | |
Total investment return based on net asset value(d) | | | 21.22 | %* | | | 57.57 | %* | | | (26.77 | )%* |
Ratios/Supplemental Data | | | | | | | | | | | | |
Net assets, end of period (000’s omitted) | | | $385,380 | | | | $76,843 | | | | $6,095 | |
Ratio to average net assets of: | | | | | | | | | | | | |
Expenses, net of waivers/reimbursements | | | .68 | %** | | | .72 | % | | | .69 | %(f)** |
Expenses, net of waivers/reimbursements excluding interest expense and TALF administration fee | | | .65 | %** | | | .65 | % | | | .69 | %(f)** |
Expenses, before waivers/reimbursements | | | .73 | %** | | | .83 | % | | | .80 | %(f)** |
Expenses, before waivers/reimbursements excluding interest expense and TALF administration fee | | | .70 | %** | | | .76 | % | | | .76 | %(f)** |
Net investment income(b) | | | 8.12 | %** | | | 10.07 | % | | | 8.16 | %(f)** |
Portfolio turnover rate | | | 26 | % | | | 46 | % | | | 74 | % |
See footnote summary on page 96.
| | |
| 92 | | • ALLIANCEBERNSTEIN HIGH INCOME FUND |
Financial Highlights
Selected Data For A Share of Capital Stock Outstanding Throughout Each Period
| | | | | | | | | | | | |
| | | Class R | |
| | | Year Ended October 31, | | | January 28,
2008(e) to
October 31, 2008 | |
| | | 2010 | | | 2009 | | |
| | | | |
| | | | | | | | | | | | |
Net asset value, beginning of period | | | $ 8.24 | | | | $ 5.85 | | | | $ 8.52 | |
| | | | |
Income From Investment Operations | | | | | | | | | | | | |
Net investment income(a)(b) | | | .67 | | | | .67 | | | | .46 | |
Net realized and unrealized gain (loss) on investment and foreign currency transactions | | | .96 | | | | 2.43 | | | | (2.66 | ) |
Contributions from Adviser | | | .00 | (c) | | | – 0 | – | | | .00 | (c) |
| | | | |
Net increase (decrease) in net asset value from operations | | | 1.63 | | | | 3.10 | | | | (2.20 | ) |
| | | | |
Less: Dividends and Distributions | | | | | | | | | | | | |
Dividends from net investment income | | | (.68 | ) | | | (.68 | ) | | | (.47 | ) |
Tax return of capital | | | – 0 | – | | | (.01 | ) | | | – 0 | – |
Distributions from net realized gain on investment and foreign currency transactions | | | – 0 | – | | | (.02 | ) | | | – 0 | – |
| | | | |
Total dividends and distributions | | | (.68 | ) | | | (.71 | ) | | | (.47 | ) |
| | | | |
Net asset value, end of period | | | $ 9.19 | | | | $ 8.24 | | | | $ 5.85 | |
| | | | |
Total Return | | | | | | | | | | | | |
Total investment return based on net asset value(d) | | | 20.62 | %* | | | 56.83 | %* | | | (27.09 | )%* |
Ratios/Supplemental Data | | | | | | | | | | | | |
Net assets, end of period (000’s omitted) | | | $13,250 | | | | $3,754 | | | | $1,443 | |
Ratio to average net assets of: | | | | | | | | | | | | |
Expenses, net of waivers/reimbursements | | | 1.18 | %** | | | 1.19 | % | | | 1.18 | %(f)** |
Expenses, net of waivers/reimbursements excluding interest expense and TALF administration fee | | | 1.15 | %** | | | 1.15 | % | | | 1.18 | %(f)** |
Expenses, before waivers/reimbursements | | | 1.37 | %** | | | 1.36 | % | | | 1.43 | %(f)** |
Expenses, before waivers/reimbursements excluding interest expense and TALF administration fee | | | 1.34 | %** | | | 1.32 | % | | | 1.40 | %(f)** |
Net investment income(b) | | | 7.70 | %** | | | 9.86 | % | | | 7.62 | %(f)** |
Portfolio turnover rate | | | 26 | % | | | 46 | % | | | 74 | % |
See footnote summary on page 96.
| | | | |
| ALLIANCEBERNSTEIN HIGH INCOME FUND • | | | 93 | |
Financial Highlights
Selected Data For A Share of Capital Stock Outstanding Throughout Each Period
| | | | | | | | | | | | |
| | | Class K | |
| | | Year Ended October 31, | | | January 28,
2008(e) to
October 31, 2008 | |
| | | 2010 | | | 2009 | | |
| | | | |
| | | | | | | | | | | | |
Net asset value, beginning of period | | | $ 8.24 | | | | $ 5.85 | | | | $ 8.52 | |
| | | | |
Income From Investment Operations | | | | | | | | | | | | |
Net investment income(a)(b) | | | .69 | | | | .68 | | | | .47 | |
Net realized and unrealized gain (loss) on investment and foreign currency transactions | | | .96 | | | | 2.44 | | | | (2.66 | ) |
Contributions from Adviser | | | .00 | (c) | | | – 0 | – | | | .00 | (c) |
| | | | |
Net increase (decrease) in net asset value from operations | | | 1.65 | | | | 3.12 | | | | (2.19 | ) |
| | | | |
Less: Dividends and Distributions | | | | | | | | | | | | |
Dividends from net investment income | | | (.70 | ) | | | (.70 | ) | | | (.48 | ) |
Tax return of capital | | | – 0 | – | | | (.01 | ) | | | – 0 | – |
Distributions from net realized gain on investment and foreign currency transactions | | | – 0 | – | | | (.02 | ) | | | – 0 | – |
| | | | |
Total dividends and distributions | | | (.70 | ) | | | (.73 | ) | | | (.48 | ) |
| | | | |
Net asset value, end of period | | | $ 9.19 | | | | $ 8.24 | | | | $ 5.85 | |
| | | | |
Total Return | | | | | | | | | | | | |
Total investment return based on net asset value(d) | | | 20.94 | %* | | | 57.24 | %* | | | (26.94 | )%* |
Ratios/Supplemental Data | | | | | | | | | | | | |
Net assets, end of period (000’s omitted) | | | $1,624 | | | | $1,328 | | | | $753 | |
Ratio to average net assets of: | | | | | | | | | | | | |
Expenses, net of waivers/reimbursements | | | .95 | %** | | | .94 | % | | | .93 | %(f)** |
Expenses, net of waivers/reimbursements excluding interest expense and TALF administration fee | | | .90 | %** | | | .90 | % | | | .93 | %(f)** |
Expenses, before waivers/reimbursements | | | 1.08 | %** | | | 1.10 | % | | | 1.12 | %(f)** |
Expenses, before waivers/reimbursements excluding interest expense and TALF administration fee | | | 1.03 | %** | | | 1.06 | % | | | 1.09 | %(f)** |
Net investment income(b) | | | 8.04 | %** | | | 10.18 | % | | | 8.01 | %(f)** |
Portfolio turnover rate | | | 26 | % | | | 46 | % | | | 74 | % |
See footnote summary on page 96.
| | |
| 94 | | • ALLIANCEBERNSTEIN HIGH INCOME FUND |
Financial Highlights
Selected Data For A Share of Capital Stock Outstanding Throughout Each Period
| | | | | | | | | | | | |
| | | Class I | |
| | | Year Ended October 31, | | | January 28,
2008(e) to
October 31, 2008 | |
| | | 2010 | | | 2009 | | |
| | | | |
| | | | | | | | | | | | |
Net asset value, beginning of period | | | $ 8.25 | | | | $ 5.85 | | | | $ 8.52 | |
| | | | |
Income From Investment Operations | | | | | | | | | | | | |
Net investment income(a)(b) | | | .71 | | | | .70 | | | | .49 | |
Net realized and unrealized gain (loss) on investment and foreign currency transactions | | | .97 | | | | 2.44 | | | | (2.67 | ) |
Contributions from Adviser | | | .00 | (c) | | | – 0 | – | | | .00 | (c) |
| | | | |
Net increase (decrease) in net asset value from operations | | | 1.68 | | | | 3.14 | | | | (2.18 | ) |
| | | | |
Less: Dividends and Distributions | | | | | | | | | | | | |
Dividends from net investment income | | | (.73 | ) | | | (.71 | ) | | | (.49 | ) |
Tax return of capital | | | – 0 | – | | | (.01 | ) | | | – 0 | – |
Distributions from net realized gain on investment and foreign currency transactions | | | – 0 | – | | | (.02 | ) | | | – 0 | – |
| | | | |
Total dividends and distributions | | | (.73 | ) | | | (.74 | ) | | | (.49 | ) |
| | | | |
Net asset value, end of period | | | $ 9.20 | | | | $ 8.25 | | | | $ 5.85 | |
| | | | |
Total Return | | | | | | | | | | | | |
Total investment return based on net asset value(d) | | | 21.23 | %* | | | 57.79 | %* | | | (26.84 | )%* |
Ratios/Supplemental Data | | | | | | | | | | | | |
Net assets, end of period (000’s omitted) | | | $17,272 | | | | $306 | | | | $165 | |
Ratio to average net assets of: | | | | | | | | | | | | |
Expenses, net of waivers/reimbursements | | | .67 | %** | | | .69 | % | | | .69 | %(f)** |
Expenses, net of waivers/reimbursements excluding interest expense and TALF administration fee | | | .65 | %** | | | .65 | % | | | .69 | %(f)** |
Expenses, before waivers/reimbursements | | | .72 | %** | | | .72 | % | | | .79 | %(f)** |
Expenses, before waivers/reimbursements excluding interest expense and TALF administration fee | | | .71 | %** | | | .68 | % | | | .75 | %(f)** |
Net investment income(b) | | | 8.03 | %** | | | 10.45 | % | | | 8.09 | %(f)** |
Portfolio turnover rate | | | 26 | % | | | 46 | % | | | 74 | % |
See footnote summary on page 96.
| | | | |
| ALLIANCEBERNSTEIN HIGH INCOME FUND • | | | 95 | |
Financial Highlights
| (a) | | Based on average shares outstanding. |
| (b) | | Net of expenses waived/reimbursed by the Adviser. |
| (c) | | Amount less than $0.005. |
| (d) | | Total investment return is calculated assuming an initial investment made at the net asset value at the beginning of the period, reinvestment of all dividends and distributions at net asset value during the period, and redemption on the last day of the period. Initial sales charges or contingent deferred sales charges are not reflected in the calculation of total investment return. Total return does not reflect the deduction of taxes that a shareholder would pay on fund distributions or the redemption of fund shares. Total investment return calculated for a period of less than one year is not annualized. |
| (e) | | Commencement of distribution. |
| * | | Includes the impact of proceeds received, and credited to the Fund resulting from class action settlements, which enhanced the performance of each share class for the years ended October 31, 2010, October 31, 2009 and October 31, 2008 by .15%, .05% and .41%, respectively. |
| ** | | The ratio includes expenses attributable to costs of proxy solicitation. |
See notes to financial statements.
| | |
| 96 | | • ALLIANCEBERNSTEIN HIGH INCOME FUND |
Financial Highlights
REPORT OF INDEPENDENT REGISTERED
PUBLIC ACCOUNTING FIRM
To the Shareholders and Board of Directors of AllianceBernstein High Income Fund, Inc.
We have audited the accompanying statement of assets and liabilities of AllianceBernstein High Income Fund, Inc. (the “Fund”) (formerly AllianceBernstein Emerging Market Debt Fund, Inc.), including the portfolio of investments, as of October 31, 2010, and the related statement of operations for the year then ended, and the statement of changes in net assets for each of the two years in the period then ended and the financial highlights for each of the periods indicated therein. These financial statements and financial highlights are the responsibility of the Fund’s management. Our responsibility is to express an opinion on these financial statements and financial highlights based on our audits.
We conducted our audits in accordance with the standards of the Public Company Accounting Oversight Board (United States). Those standards require that we plan and perform the audit to obtain reasonable assurance about whether the financial statements and financial highlights are free of material misstatement. We were not engaged to perform an audit of the Fund’s internal control over financial reporting. Our audits included consideration of internal control over financial reporting as a basis for designing audit procedures that are appropriate in the circumstances, but not for the purpose of expressing an opinion on the effectiveness of the Fund’s internal control over financial reporting. Accordingly, we express no such opinion. An audit also includes examining, on a test basis, evidence supporting the amounts and disclosures in the financial statements and financial highlights, assessing the accounting principles used and significant estimates made by management, and evaluating the overall financial statement presentation. Our procedures included confirmation of securities owned as of October 31, 2010 by correspondence with the custodian and others, or by other appropriate auditing procedures where replies from others were not received. We believe that our audits provide a reasonable basis for our opinion.
In our opinion, the financial statements and financial highlights referred to above present fairly, in all material respects, the financial position of AllianceBernstein High Income Fund, Inc. at October 31, 2010, the results of its operations for the year then ended, the changes in its net assets for each of the two years in the period then ended and the financial highlights for each of the periods indicated therein, in conformity with U.S. generally accepted accounting principles.

New York, New York
December 29, 2010
| | | | |
| ALLIANCEBERNSTEIN HIGH INCOME FUND • | | | 97 | |
Report of Independent Registered Public Accounting Firm
2010 FEDERAL TAX INFORMATION
(unaudited)
For Federal income tax purposes, the following information is furnished with respect to the distributions paid by the Fund during the taxable year ended October 31, 2010.
For foreign shareholders, 50.51% of ordinary dividends paid may be considered to be qualifying to be taxed as interest-related dividends.
Shareholders should not use the above information to prepare their income tax returns. The information necessary to complete your income tax returns will be included with your Form 1099-DIV which will be sent to you separately in January 2011.
| | |
| 98 | | • ALLIANCEBERNSTEIN HIGH INCOME FUND |
2010 Federal Tax Information
BOARD OF DIRECTORS
| | |
| William H. Foulk, Jr.(1), Chairman | | Robert M. Keith, President and Chief Executive Officer |
| John H. Dobkin(1) | |
| Michael J. Downey(1) | | Garry L. Moody(1) |
| D. James Guzy(1) | | Marshall C. Turner, Jr.(1) |
| Nancy P. Jacklin(1) | | Earl D. Weiner(1) |
OFFICERS
| | |
Philip L. Kirstein, Senior Vice President and Independent Compliance Officer Paul J. DeNoon(2), Vice President Gershon M. Distenfeld(2), Vice President Douglas J. Peebles(2), Vice President | | Matthew S. Sheridan(2) , Vice President Emilie D. Wrapp, Secretary Joseph J. Mantineo, Treasurer and Chief Financial Officer Stephen M. Woetzel, Controller |
| | |
Principal Underwriter AllianceBernstein Investments, Inc. 1345 Avenue of the Americas New York, NY 10105 Custodian and Accounting Agent Brown Brothers Harriman & Co. 40 Water Street Boston, MA 02109-3661 Legal Counsel Seward & Kissel LLP One Battery Park Plaza New York, NY 10004 | | Transfer Agent AllianceBernstein Investor Services, Inc. P.O. Box 786003 San Antonio, TX 78278-6003 Toll-Free (800) 221-5672 Independent Registered Public Accounting Firm Ernst & Young LLP 5 Times Square New York, NY 10036 |
| (1) | | Member of the Audit Committee, the Governance and Nominating Committee and the Independent Directors Committee. Mr. Foulk is the sole member of the Fair Value Pricing Committee. |
| (2) | | The day-to-day management of, and investment decisions for, the Fund’s portfolio are made by the Global Fixed Income Team and Global Credit Investment Team. Messrs. DeNoon, Distenfeld, Peebles and Sheridan are the investment professionals with the most significant responsibility for the day-to-day management of the Fund’s portfolio. |
| | | | |
| ALLIANCEBERNSTEIN HIGH INCOME FUND • | | | 99 | |
Board of Directors
MANAGEMENT OF THE FUND
Board of Directors Information
The business and affairs of the Fund are managed under the direction of the Board of Directors. Certain information concerning the Fund’s Directors is set forth below.
| | | | | | | | |
NAME,
ADDRESS* AND AGE
(YEAR FIRST ELECTED)** | | PRINCIPAL
OCCUPATION(S)
DURING PAST FIVE YEARS
AND OTHER RELEVANT
QUALIFICATIONS*** | | PORTFOLIOS
IN FUND
COMPLEX
OVERSEEN BY
DIRECTOR | | | OTHER
DIRECTORSHIPS
HELD BY
DIRECTOR IN
PAST FIVE YEARS |
| INTERESTED DIRECTOR | | | | | | |
Robert M. Keith + 1345 Avenue of the Americas New York, NY 10105 50 (2010) | | Senior Vice President of AllianceBernstein L.P. (the “Adviser”) and the head of AllianceBernstein Investments, Inc. (“ABI”) since July 2008; Director of ABI and President of the AllianceBernstein Mutual Funds. Previously, he served as Executive Managing Director of ABI from December 2006 to June 2008. Prior to joining ABI in 2006, Executive Managing Director of Bernstein Global Wealth Management, and prior thereto, Senior Managing Director and Global Head of Client Service and Sales of the Adviser’s institutional investment management business since 2004. Prior thereto, Managing Director and Head of North American Client Service and Sales in the Adviser’s institutional investment management business, with which he had been associated since prior to 2004. | | | 97 | | | None |
| | |
| 100 | | • ALLIANCEBERNSTEIN HIGH INCOME FUND |
Management of the Fund
| | | | | | | | |
NAME,
ADDRESS* AND AGE
(YEAR FIRST ELECTED)** | | PRINCIPAL
OCCUPATION(S)
DURING PAST FIVE YEARS
AND OTHER RELEVANT
QUALIFICATIONS*** | | PORTFOLIOS
IN FUND
COMPLEX
OVERSEEN BY
DIRECTOR | | | OTHER
DIRECTORSHIPS
HELD BY
DIRECTOR IN
PAST FIVE YEARS |
| DISINTERESTED DIRECTORS | | | | | | |
William H. Foulk, Jr., #, ## Chairman of the Board 78 (1993) | | Investment Adviser and an Independent Consultant since prior to 2005. Previously, he was Senior Manager of Barrett Associates, Inc., a registered investment adviser. He was formerly Deputy Comptroller and Chief Investment Officer of the State of New York and, prior thereto, Chief Investment Officer of the New York Bank for Savings. He has served as a director or trustee of various AllianceBernstein Funds since 1983 and has been Chairman of the AllianceBernstein Funds and of the Independent Directors Committee of such Funds since 2003. He is also active in a number of mutual fund related organizations and committees. | | | 97 | | | None |
| | | | | | | | |
John H. Dobkin, #
68
(1993) | | Independent Consultant since prior to 2005. Formerly, President of Save Venice, Inc. (preservation organization) from 2001-2002; Senior Advisor from June 1999-June 2000 and President of Historic Hudson Valley (historic preservation) from December 1989-May 1999. Previously, Director of the National Academy of Design. He has served as a director or trustee of various AllianceBernstein Funds since 1992, and as Chairman of the Audit Committees of a number of such Funds from 2001-2008. | | | 96 | | | None |
| | | | |
| ALLIANCEBERNSTEIN HIGH INCOME FUND • | | | 101 | |
Management of the Fund
| | | | | | | | |
NAME,
ADDRESS* AND AGE
(YEAR FIRST ELECTED)** | | PRINCIPAL
OCCUPATION(S)
DURING PAST FIVE YEARS
AND OTHER RELEVANT
QUALIFICATIONS*** | | PORTFOLIOS
IN FUND
COMPLEX
OVERSEEN BY
DIRECTOR | | | OTHER
DIRECTORSHIPS
HELD BY
DIRECTOR IN
PAST FIVE YEARS |
DISINTERESTED DIRECTORS
(continued) | | | | | | |
Michael J. Downey, #
66
(2005) | | Private Investor since prior to 2005. Formerly, managing partner of Lexington Capital, LLC (investment advisory firm) from December 1997 until December 2003. From 1987 until 1993, Chairman and CEO of Prudential Mutual Fund Management, Director of the Prudential Mutual funds and member of the Executive Committee of Prudential Securities, Inc. He has served as a director or trustee of the AllianceBernstein Funds since 2005 and is a director of two other registered investment companies (and Chairman of one of them). | | | 96 | | | Asia Pacific
Fund, Inc. and The Merger Fund since prior to 2005, and Prospect Acquisition Corp. (financial services) since 2007 until 2009 |
| | | | | | | | |
D. James Guzy, #
74
(2005) | | Chairman of the Board of PLX Technology (semi-conductors) and of SRC Computers, Inc., with which he has been associated since prior to 2005. He was formerly a Director of Intel Corporation (semi-conductors) from 1969 until 2008 and served as Chairman of the Finance Committee of such company for several years until May 2008. He has served as a director or trustee of one or more of the AllianceBernstein Funds since 1982. | | | 96 | | | Cirrus Logic Corporation (semi-conductors), and PLX Technology, Inc. (semi-conductors) since prior to 2005 and Intel Corporation (semi-conductors) since prior to 2005 until 2008 |
| | |
| 102 | | • ALLIANCEBERNSTEIN HIGH INCOME FUND |
Management of the Fund
| | | | | | | | |
NAME,
ADDRESS* AND AGE
(YEAR FIRST ELECTED)** | | PRINCIPAL
OCCUPATION(S)
DURING PAST FIVE YEARS
AND OTHER RELEVANT
QUALIFICATIONS*** | | PORTFOLIOS
IN FUND
COMPLEX
OVERSEEN BY
DIRECTOR | | | OTHER
DIRECTORSHIPS
HELD BY
DIRECTOR IN PAST FIVE YEARS |
DISINTERESTED DIRECTORS
(continued) | | | | | | |
Nancy P. Jacklin, #
62
(2006) | | Professorial Lecturer at the Johns Hopkins School of Advanced International Studies since 2008. Formerly, U.S. Executive Director of the International Monetary Fund (December 2002-May 2006); Partner, Clifford Chance (1992-2002); Sector Counsel, International Banking and Finance, and Associate General Counsel, Citicorp (1985-1992); Assistant General Counsel (International), Federal Reserve Board of Governors (1982-1985); and Attorney Advisor, U.S. Department of the Treasury (1973-1982). Member of the Bar of the District of Columbia and of New York; and member of the Council on Foreign Relations. She has served as a director or trustee of the AllianceBernstein Funds since 2006. | | | 96 | | | None |
| | | | | | | | |
Garry L. Moody, #
58
(2008) | | Independent Consultant. Formerly, Partner, Deloitte & Touche LLP, (1995-2008) where he held a number of senior positions, including Vice Chairman, and U.S. and Global Investment Management Practice Managing Partner; President, Fidelity Accounting and Custody Services Company (1993–1995); and Partner, Ernst & Young LLP (1975-1993), where he served as the National Director of Mutual Fund Tax Services. He is also a member of the Governing Council of the Independent Directors Council (IDC), an organization of independent directors of mutual funds, and serves on that organization’s Education and Communications Committee. He has served as a director or trustee, and as Chairman of the Audit Committee, of most of the AllianceBernstein Funds since 2008. | | | 96 | | | None |
| | | | |
| ALLIANCEBERNSTEIN HIGH INCOME FUND • | | | 103 | |
Management of the Fund
| | | | | | | | |
NAME,
ADDRESS* AND AGE
(YEAR FIRST ELECTED)** | | PRINCIPAL
OCCUPATION(S)
DURING PAST FIVE YEARS
AND OTHER RELEVANT
QUALIFICATIONS*** | | PORTFOLIOS
IN FUND
COMPLEX
OVERSEEN BY
DIRECTOR | | | OTHER
DIRECTORSHIPS
HELD BY
DIRECTOR IN PAST FIVE YEARS |
DISINTERESTED DIRECTORS
(continued) | | | | | | |
Marshall C. Turner, Jr., #
69
(2005) | | Private Investor since prior to 2005. Interim CEO of MEMC Electronic Materials, Inc. (semi-conductor and solar cell substrates) from November 2008 until March 2009. He was Chairman and CEO of Dupont Photomasks, Inc. (components of semi-conductor manufacturing), 2003-2005, and President and CEO, 2005-2006, after the company was acquired and renamed Toppan Photomasks, Inc. He has extensive experience in venture capital investing including prior service as general partner of three institutional venture capital partnerships, and serves on the boards of a number of education and science-related non-profit organizations. He has served as a director or trustee of one or more of the AllianceBernstein Funds since 1992. | | | 96 | | | Xilinx, Inc. (programmable logic semi-conductors) and MEMC Electronic Materials, Inc. (semi-conductor and solar cell substrates) since prior to 2005 |
| | | | | | | | |
Earl D. Weiner, # 71 (2007) | | Of Counsel, and Partner prior to January 2007, of the law firm Sullivan & Cromwell LLP and member of ABA Federal Regulation of Securities Committee Task Force to draft editions of the Fund Director’s Guidebook. He also serves as a director or trustee of various non-profit organizations and has served as Chairman or Vice Chairman of a number of them. He has served as a director or trustee of the AllianceBernstein Funds since 2007 and is Chairman of the Governance and Nominating Committees of most of the Funds. | | | 96 | | | None |
| | |
| 104 | | • ALLIANCEBERNSTEIN HIGH INCOME FUND |
Management of the Fund
| * | The address for each of the Fund’s disinterested Directors is c/o AllianceBernstein L.P., Attention: Philip L. Kirstein, 1345 Avenue of the Americas, New York, NY 10105. |
| ** | There is no stated term of office for the Fund’s Directors. |
| *** | The information above includes each Director’s principal occupation during the last five years and other information relating to the experience, attributes and skills relevant to each Director’s qualifications to serve as a Director, which led to the conclusion that each Director should serve as a Director for the Fund. |
| + | Mr. Keith is an “interested director”, as defined in the 1940 Act, due to his position as a Senior Vice President of the Adviser. |
| # | Member of the Audit Committee, the Governance and Nominating Committee and the Independent Directors Committee. |
| ## | Member of the Fair Value Pricing Committee. |
| | | | |
| ALLIANCEBERNSTEIN HIGH INCOME FUND • | | | 105 | |
Management of the Fund
Officers of the Fund
Certain information concerning the Fund’s Officers is listed below.
| | | | |
NAME, ADDRESS*
AGE | | PRINCIPAL POSITION(S)
HELD WITH FUND | | PRINCIPAL OCCUPATION
DURING PAST 5 YEARS |
Robert M. Keith,
50 | | President and Chief Executive Officer | | See above. |
| | | | |
Philip L. Kirstein,
65 | | Senior Vice President and Independent Compliance Officer | | Senior Vice President and Independent Compliance Officer of the AllianceBernstein Funds, with which he has been associated since October 2004. Prior thereto, he was Of Counsel to Kirkpatrick & Lockhart, LLP from October 2003 to October 2004, and General Counsel of Merrill Lynch Investment Managers, L.P. since prior to March 2003. |
| | | | |
Paul J. DeNoon,
48 | | Vice President | | Senior Vice President of the Adviser**, with which he has been associated since prior to 2005. |
| | | | |
Gershon Distenfeld,
35 | | Vice President | | Senior Vice President of the Adviser**, with which he has been associated since prior to 2005. |
| | | | |
Douglas J. Peebles,
45 | | Vice President | | Senior Vice President of the Adviser**, with which he has been associated since prior to 2005. |
| | | | |
Matthew S. Sheridan,
35 | | Vice President | | Vice President of the Adviser**, with which he has been associated since prior to 2005. |
| | | | |
Emilie D. Wrapp,
55 | | Secretary | | Senior Vice President, Assistant General Counsel and Assistant Secretary of ABI**, with which she has been associated since prior to 2005. |
| | | | |
Joseph J. Mantineo,
51 | | Treasurer and Chief Financial Officer | | Senior Vice President of AllianceBernstein Investor Services, Inc. (“ABIS”)**, with which he has been associated since prior to 2005. |
| | | | |
Stephen M. Woetzel,
39 | | Controller | | Vice President of ABIS**, with which he has been associated since prior to 2005. |
| * | | The address for each of the Fund’s Officers is 1345 Avenue of the Americas, New York, NY 10105. |
| ** | | The Adviser, ABI and ABIS are affiliates of the Fund. |
| | | The Fund’s Statement of Additional Information (“SAI”) has additional information about the Fund’s Directors and Officers and is available without charge upon request. Contact your financial representative or AllianceBernstein at (800) 227-4618, or visit www.alliancebernstein.com, for a free prospectus or SAI. |
| | |
| 106 | | • ALLIANCEBERNSTEIN HIGH INCOME FUND |
Management of the Fund
THE FOLLOWING IS NOT PART OF THE SHAREHOLDER REPORT OR THE FINANCIAL STATEMENTS
SUMMARY OF SENIOR OFFICER’S EVALUATION OF INVESTMENT ADVISORY AGREEMENT1
The following is a summary of the evaluation of the Investment Advisory Agreement between AllianceBernstein L.P. (the “Adviser”) and AllianceBernstein High Income Fund, Inc. (the “Fund”).2,3 The evaluation of the Investment Advisory Agreement was prepared by Philip L. Kirstein, the Senior Officer of the Fund for the Directors of the Fund, as required by the September 1, 2004 Assurance of Discontinuance (“AoD”) between the Adviser and the New York State Attorney General (the “NYAG”). The Senior Officer’s evaluation of the Investment Advisory Agreement is not meant to diminish the responsibility or authority of the Board of Directors of the Fund to perform its duties pursuant to Section 15 of the Investment Company Act of 1940 (the “40 Act”) and applicable state law. The purpose of the summary is to provide shareholders with a synopsis of the independent evaluation of the reasonableness of the advisory fees proposed to be paid by the Fund which was provided to the Directors in connection with their review of the proposed approval of the continuance of the Investment Advisory Agreement. The Senior Officer’s evaluation considered the following factors:
| | 1. | Advisory fees charged to institutional and other clients of the Adviser for like services; |
| | 2. | Advisory fees charged by other mutual fund companies for like services; |
| | 3. | Costs to the Adviser and its affiliates of supplying services pursuant to the advisory agreement, excluding any intra-corporate profit; |
| | 4. | Profit margins of the Adviser and its affiliates from supplying such services; |
| | 5. | Possible economies of scale as the Fund grows larger; and |
| | 6. | Nature and quality of the Adviser’s services including the performance of the Fund. |
These factors, with the exception of the first factor, are generally referred to as the “Gartenberg factors,” which were articulated by the United States Court of Appeals for the Second Circuit in 1982. The first factor is an additional factor
| 1 | | It should be noted that the Senior Officer’s fee evaluation was completed on October 21, 2010 and discussed with the Board of Directors on November 2-4, 2010. |
| 2 | | Future references to the Fund do not include “AllianceBernstein.” References in the fee summary pertaining to performance and expense ratios refer to the Class A shares of the Fund. |
| 3 | | It should be noted that on January 28, 2008, the Fund acquired the assets of AllianceBernstein Corporate Bond Portfolio and AllianceBernstein High Yield Fund, Inc. Prior to January 28, 2008, the Fund was named AllianceBernstein Emerging Market Debt Fund, Inc. |
| | | | |
| ALLIANCEBERNSTEIN HIGH INCOME FUND • | | | 107 | |
required to be considered by the AoD. The Supreme Court recently held the Gartenberg decision was correct in its basic formulation of what Section 36(b) of the 40 Act requires: to face liability under Section 36(b), “an investment adviser must charge a fee that is so disproportionately large that it bears no reasonable relationship to the services rendered and could not have been the product of arms length bargaining.” Jones v. Harris Associates L.P., (No. 08-586), slip op. at 9, 559 U.S. 2010. In the Jones decision, the Court stated the Gartenberg approach fully incorporates the correct understanding of fiduciary duty within the context of Section 36(b) and noted with approval that “Gartenberg insists that all relevant circumstances be taken into account” and “uses the range of fees that might result from arms-length bargaining as the benchmark for reviewing challenged fees.”4
FUND ADVISORY FEES, EXPENSE REIMBURSEMENTS & RATIOS
The Adviser proposed that the Fund pay the advisory fee set forth in the table below for receiving the services to be provided pursuant to the Investment Advisory Agreement. The fee schedule below, implemented in January 2004 in consideration of the Adviser’s settlement with the NYAG in December 2003, is based on a master schedule that contemplates eight categories of funds with almost all funds in each category having the same advisory fee schedule.5 Also Shown are the Fund’s net assets on September 30, 2010.
| | | | | | |
| Category | | Advisory Fee Based on % of
Average Daily Net Assets | | September 30, 2010 Net Assets ($MM) | |
| High Income | | 50 bp on 1st $2.5 billion 45 bp on next $2.5 billion 40 bp on the balance | | $ | 2,105.3 | |
The Adviser is reimbursed as specified in the Investment Advisory Agreement for certain clerical, legal, accounting, administrative and other services provided to the Fund. During the Fund’s most recently completed fiscal year, the Adviser received $105,113 (0.014% of the Fund’s average daily net assets) for such services.
| 5 | | Most of the AllianceBernstein Mutual Funds, which the Adviser manages, were affected by the Adviser’s settlement with the NYAG. |
| | |
| 108 | | • ALLIANCEBERNSTEIN HIGH INCOME FUND |
The Adviser agreed to waive that portion of its advisory fees and/or reimburse the Fund for that portion of the Fund’s total operating expenses to the degree necessary to limit the Fund’s expense ratios to the amounts set forth below for the Fund’s current fiscal year. The waiver is terminable by the Adviser at the end of the Fund’s fiscal year upon at least 60 days written notice. In addition, set forth below are the Fund’s gross expense ratios, annualized for the most recent semi-annual period:
| | | | | | | | | | | | | | |
| Fund | | Expense Cap Pursuant to
Expense Limitation
Undertaking | | | Gross
Expense
Ratio6 (04/31/10) | | | Fiscal
Year End | |
| High Income Fund, Inc. | | Advisor Class A Class B Class C Class R Class K Class I | |
| 0.65
0.95 1.65 1.65 1.15 0.90 0.65 | %
% % % % % % | |
| 0.75
1.07 1.82 1.77 1.41 1.11 0.71 | %
% % % % % % | | | October 31 | |
| I. | ADVISORY FEES CHARGED TO INSTITUTIONAL AND OTHER CLIENTS |
The advisory fees charged to investment companies which the Adviser manages and sponsors are normally higher than those charged to similar sized institutional accounts, including pension plans and sub-advised investment companies. The fee differential reflects, among other things, different services provided to such clients, and different liabilities assumed. Services provided by the Adviser to the Fund that are not provided to non-investment company clients include providing office space and personnel to serve as Fund Officers, who among other responsibilities make the certifications required under the Sarbanes-Oxley Act of 2002, and coordinating with and monitoring the Fund’s third party service providers such as Fund counsel, auditors, custodians, transfer agents and pricing services. The accounting, administrative, legal and compliance requirements for the Fund are more costly than those for institutional client assets due to the greater complexities and time required for investment companies, although as previously noted, the Adviser is reimbursed for providing such services. Also, retail mutual funds managed by the Adviser are widely held. Servicing the Fund’s investors is more time consuming and labor intensive compared to institutional clients since the Adviser needs to communicate with a more extensive network of financial intermediaries and shareholders. The Adviser also believes that it incurs substantial entrepreneurial risk when offering a new mutual fund since establishing a new mutual fund requires a large upfront investment and it may take a long time for the fund to achieve profitability since the fund must be priced to scale from inception in order to be competitive and assets are acquired one account at a time. In addition, managing the cash flow of an investment company may be more difficult than that of a stable pool of assets, such as an institutional account with little cash movement in either direction, particularly, if a
| | | | |
| ALLIANCEBERNSTEIN HIGH INCOME FUND • | | | 109 | |
fund is in net redemption and the Adviser is frequently forced to sell securities to raise cash for redemptions. However, managing a fund with positive cash flow may be easier at times than managing a stable pool of assets. Finally, in recent years, investment advisers have been sued by institutional clients and have suffered reputational damage both by the attendant publicity and outcomes other than complete victories. Accordingly, the legal and reputational risks associated with institutional accounts are greater than previously thought, although arguably still not equal to those related to the mutual fund industry.
Notwithstanding the Adviser’s view that managing an investment company is not comparable to managing other institutional accounts because the services provided are different, the Supreme Court has indicated consideration should be given to the advisory fees charged to institutional accounts that have a substantially similar investment style as the Fund.7 In addition to the AllianceBernstein Institutional fee schedule, set forth below is what would have been the effective advisory fee of the Fund had the AllianceBernstein Institutional fee schedule been applicable to the Fund versus the Fund’s advisory fees based on September 30, 2010 net assets.8
| | | | | | | | | | | | |
| Fund | | Net Assets 09/30/10 ($MIL) | | AllianceBernstein (“AB”)
Institutional (“Inst.”) Fee Schedule | | Effective
AB Inst.
Adv. Fee | | | Fund Advisory Fee | |
| High Income Fund, Inc. | | $2,105.3 | | Global High Yield Schedule 55 bp on 1st $50 million 35 bp on the balance Minimum account size: $50m | | | 0.355% | | | | 0.500% | |
| 7 | | It should be noted that the Supreme Court stated that “courts may give such comparisons the weight that they merit in light of the similarities and differences between the services that the clients in question require, but the courts must be wary of inapt comparisons.” Among the significant differences the Supreme Court noted that may exist between services provided to mutual funds and institutional accounts are “higher marketing costs.” Jones v. Harris at 13. |
| 8 | | The Adviser has indicated that with respect to institutional accounts with assets greater than $300 million, it will negotiate a fee schedule, although it should be noted that there were no such institutional accounts that are similar in investment style as the Fund, which opened in the last three years. Discounts that are negotiated vary based upon each client relationship. |
| | |
| 110 | | • ALLIANCEBERNSTEIN HIGH INCOME FUND |
The Adviser also manages and sponsors retail mutual funds, which are organized in jurisdictions outside the United States, generally Luxembourg and Japan, and sold to non-United States resident investors. The Adviser charges the following fee for Global High Yield, a Luxembourg fund, which has a somewhat similar investment style as the Fund:
| | | | |
| Fund | | Luxembourg Fund | | Fee9 |
| High Income Fund, Inc. | | Global High Yield | | |
| | Class A | | 1.70% on 1st $5 billion 1.50% on the balance |
| | | | |
| | Class I (Institutional) | | 1.15% on 1st $5 billion 0.95% on the balance |
The AllianceBernstein Investment Trust Management mutual funds (“ITM”), which are offered to investors in Japan, have an “all-in” fee to compensate the Adviser for investment advisory as well as fund accounting and administrative related services. The fee schedule of the ITM mutual fund that has a somewhat similar investment style as the Fund is as follows:
| | | | |
| Fund | | ITM Mutual Fund | | Fee10 |
| High Income Fund, Inc. | | Global High Income Open A/B (Hedged/Unhedged) | | 0.70% on the 1st ¥30 billion 0.60% on next ¥20 billion 0.50% on next ¥450 billion 0.45% on the balance |
The Adviser represented that it does not sub-advise any registered investment companies have a similar investment strategy as the Fund.
| II. | MANAGEMENT FEES CHARGED BY OTHER MUTUAL FUND COMPANIES FOR LIKE SERVICES. |
Lipper, Inc. (“Lipper”), an analytical service that is not affiliated with the Adviser, compared the fees charged to the Fund with fees charged to other investment companies for similar services by other investment advisers.11 Lipper’s analysis included the Fund’s ranking with respect to the contractual
| 9 | | Class A shares of the fund are charged an “all-in” fee, which covers investment advisory services and distribution related services. |
| 10 | | The Japanese Yen-U.S. dollar currency exchange rate quoted at 4 p.m. on September 20, 2010 by Reuters was ¥85.75 per $1. At that currency exchange rate, ¥30 billion would be equivalent to approximately $349.9 million; ¥20 billion would be equivalent to approximately $233.2 million; and ¥450 billion would be equivalent to approximately $5.248 billion |
| 11 | | In considering this section, it should be noted that the Supreme Court cautioned against accepting mutual fund fee comparisons without careful scrutiny since “these comparisons are problematic because these fees, like those challenged, may not be the product of the negotiations conducted at arms length.” Jones v. Harris at 14. |
| | | | |
| ALLIANCEBERNSTEIN HIGH INCOME FUND • | | | 111 | |
management fee relative to the median of the Fund’s Lipper Expense Group (“EG”)12 at the approximate current asset level of the subject Fund.13
Lipper describes an EG as a representative sample of comparable funds. Lipper’s standard methodology for screening funds to be included in an EG entails the consideration of several fund criteria, including fund type, investment classification/objective, load type and similar 12b-1/non-12b-1 service fees, asset (size) comparability, and expense components and attributes. An EG will typically consist of seven to twenty funds.
| | | | | | | | | | | | |
| Fund | | Contractual
Management Fee14 | | | Lipper Exp. Group Median (%) | | | Lipper
Group Rank | |
| High Income Fund, Inc. | | | 0.500 | | | | 0.564 | | | | 5/17 | |
Lipper also compared the Fund’s total expense ratio to the medians of the Fund’s EG and Lipper Expense Universe (“EU”). The EU15 is a broader group compared to the EG, consisting of all funds that have the same investment classification/objective and load type as the subject Fund.
It should be noted that Lipper uses expense ratio data from financial statements of the most current fiscal year in their database. This has several implications: the total expense ratio of each fund that Lipper uses in their report is based on each fund’s average net assets during its fiscal year. Since funds have different fiscal year ends, the total expense ratios of the funds may cover different twelve month periods, depending on the funds’ fiscal year ends. This is the process that Lipper always follows but given the volatile market conditions during 2008 and 2009, notably the last three months of 2008 through the first three months of 2009, when equity markets declined substantially, and conversely through the remainder of 2009, when equity markets rallied the effects on the funds’ total
| 12 | | It should be noted that Lipper does not consider average account size when constructing EGs. Funds with relatively small average account sizes tend to have higher transfer agent expense ratios than comparable sized funds that have relatively large average account sizes. Note that there are limitations on Lipper expense category data because different funds categorize expenses differently. |
| 13 | | The contractual management fee is calculated by Lipper using the Portfolio’s contractual management fee rate at a hypothetical asset level. The hypothetical asset level is based on the combined net assets of all classes of the Portfolio, rounded up to the next $25 million. Lipper’s total expense ratio information is based on the most recent annual report except as otherwise noted. A ranking of “1” would mean that the Portfolio had the lowest effective fee rate in the Lipper peer group. |
| 14 | | The contractual management fee does not reflect any expense reimbursements made by the Fund to the Adviser for certain clerical, legal, accounting, administrative, and other services. In addition, the contractual management fee does not reflect any advisory fee waivers for expense caps that would effectively reduce the actual effective management fee. |
| 15 | | Except for asset (size) comparability, Lipper uses the same criteria for selecting an EG when selecting an EU. Unlike the EG, the EU allows for the same adviser to be represented by more than just one fund. |
| | |
| 112 | | • ALLIANCEBERNSTEIN HIGH INCOME FUND |
expense ratio caused by the differences in fiscal year ends may be more pronounced in 2008 and 2009 compared to other years under more normal market conditions.16
| | | | | | | | | | | | | | | | | | |
| Fund | | Expense Ratio
(%)17 | | Lipper Exp. Group
Median (%) | | | Lipper Group Rank | | | Lipper Exp. Universe Median (%) | | | Lipper
Universe Rank | |
| High Income Fund, Inc.18 | | 0.951 | | | 1.119 | | | | 3/17 | | | | 1.104 | | | | 10/83 | |
Based on this analysis, the Fund has a more favorable ranking in a total expense ratio basis than on a management fee basis.
| III. | COSTS TO THE ADVISER AND ITS AFFILIATES OF SUPPLYING SERVICES PURSUANT TO THE ADVISORY FEE ARRANGEMENT, EXCLUDING ANY INTRA-CORPORATE PROFIT. |
The Adviser utilizes two profitability reporting systems, which operate independently but are aligned with each other, to estimate the Adviser’s profitability in connection with investment advisory services provided to the Fund. The Senior Officer has retained an independent consultant to provide independent advice regarding the alignment of the two profitability systems as well as the methodologies and allocations utilized by both profitability systems. See Section IV for additional discussion.
| IV. | PROFIT MARGINS OF THE ADVISER AND ITS AFFILIATES FOR SUPPLYING SUCH SERVICES. |
The profitability information for the Fund prepared by the Adviser for the Board of Directors was reviewed by the Senior Officer and the independent consultant. The Adviser’s profitability from providing investment advisory services to the Fund increased during calendar year 2009, relative to 2008.
In addition to the Adviser’s direct profits from managing the Fund, certain of the Adviser’s affiliates have business relationships with the Fund and may earn a profit from providing other services to the Fund. The courts have referred to this type of business opportunity as “fall-out benefits” to the Adviser and indicated
| 16 | | To cite an example, the average net assets and total expense ratio of a fund with a fiscal year end of March 31, 2009 will not be reflective of the market rally that occurred post March 2009, in contrast to a fund with a fiscal year end of December 31, 2009. |
| 17 | | Most recently completed fiscal year Class A share total expense ratio. |
| 18 | | It should be noted that the total expense ratio of the Fund shown in the table above was provided by Lipper. Lipper calculates the Fund’s total expense ratio using Form NSAR expense and average net assets data rounded to the nearest thousand. Due to minor differences in data inputs, Lipper’s estimate of the Fund’s total expense ratio may differ from the total expense ratio reported in the Fund’s financial statements. Lipper’s total expense ratio estimate for Class A shares exceeds the Fund’s expense caps, in contrast to the total expense ratio reported in the Fund’s financial statements, which does not exceed the Fund’s expense cap of 0.95% for Class A shares. |
| | | | |
| ALLIANCEBERNSTEIN HIGH INCOME FUND • | | | 113 | |
that such benefits should be factored into the evaluation of the total relationship between the Fund and the Adviser. Neither case law nor common business practice precludes the Adviser’s affiliates from earning a reasonable profit on this type of relationship. These affiliates provide transfer agent and distribution related services to the Fund and receive transfer agent fees, front-end sales loads, Rule 12b-1 payments, and contingent deferred sales charges (“CDSC”). During the Fund’s most recently completed fiscal year, ABI received from the Fund $110,108, $3,499,127 and $63,884 in front-end sales charges, Rule 12b-1 and CDSC fees, respectively.
AllianceBernstein Investments, Inc. (“ABI”), an affiliate of the Adviser, is the Fund’s principal underwriter. ABI and the Adviser have disclosed in the Fund’s prospectus that they may make revenue sharing payments from their own resources, in addition to revenues derived from sales loads and Rule 12b-1 fees, to firms that sell shares of the Fund. In 2009, ABI paid approximately 0.04% of the average monthly assets of the AllianceBernstein Mutual Funds or approximately $13.8 million for distribution services and educational support (revenue sharing payments).
Fees and reimbursements for out of pocket expenses charged by AllianceBernstein Investor Services, Inc. (“ABIS”), the affiliated transfer agent for the Fund, are charged on a per account basis, based on the level of service provided and the class of share held by the account. ABIS also receives a fee per shareholder sub-account for each account maintained by an intermediary on an omnibus basis. ABIS’ after-tax profitability increased in 2009 in comparison to 2008. During the Fund’s most recently completed fiscal year, ABIS received $609,398 in fees from the Fund.
| V. | POSSIBLE ECONOMIES OF SCALE |
The Adviser has indicated that economies of scale are being shared with shareholders through fee structures,19 subsidies and enhancement to services. Based on some of the professional literature that has considered economies of scale in the mutual fund industry, it is thought that to the extent economies of scale exist, they may more often exist across a fund family as opposed to a specific fund. This is because the costs incurred by the Adviser, such as investment research or technology for trading or compliance systems, can be spread across a greater asset base as the fund family increases in size. It is also possible that as the level of services required to operate a successful investment company has increased over time, and advisory firms have made such investments in their business to provide services, there may be a sharing of economies of scale without a reduction in advisory fees.
| 19 | | Fee structures include fee reductions, pricing at scale and breakpoints in advisory fee schedules. |
| | |
| 114 | | • ALLIANCEBERNSTEIN HIGH INCOME FUND |
An independent consultant, retained by the Senior Officer, provided the Board of Directors an update of the Deli20 study on advisory fees and various fund characteristics.21 The independent consultant first reiterated the results of his previous two dimensional comparison analysis (fund size and family size) with the Board of Directors.22 The independent consultant then discussed the results of the regression model that was utilized to study the effects of various factors on advisory fees. The regression model output indicated that the bulk of the variation in fees predicted were explained by various factors, but substantially by fund assets under management (“AUM”), family AUM, index fund indicator and investment style. The independent consultant also compared the advisory fees of the AllianceBernstein Mutual Funds to similar funds managed by 19 other large asset managers, regardless of fund size and the large asset manager’s proportion of mutual fund assets to non-mutual fund assets.
| VI. | NATURE AND QUALITY OF THE ADVISER’S SERVICES, INCLUDING THE PERFORMANCE OF THE FUND |
With assets under management of approximately $484 billion as of September 30, 2010, the Adviser has the investment experience to manage and provide non-investment services (described in Section I) to the Fund.
| 20 | | The Deli study was originally published in 2002 based on 1997 data. |
| 21 | | As mentioned previously, the Supreme Court cautioned against accepting mutual fund fee comparisons without careful scrutiny since the fees may not be the product of negotiations conducted at arms length. See Jones V. Harris at 14. |
| 22 | | The two dimensional analysis showed patterns of lower advisory fees for funds with larger asset sizes and funds from larger family sizes compared to funds with smaller asset sizes and funds from smaller family sizes, which according to the independent consultant is indicative of a sharing of economies of scale and scope. However, in less liquid and active markets, such is not the case, as the empirical analysis showed potential for diseconomies of scale in those markets. The empirical analysis also showed diminishing economies of scale and scope as funds surpassed a certain high level of assets. |
| | | | |
| ALLIANCEBERNSTEIN HIGH INCOME FUND • | | | 115 | |
The information below shows the 1, 3, 5 and 10 year performance returns and rankings of the Fund23 relative to its Lipper Performance Group (“PG”) and Lipper Performance Universe (“PU”)24 for the periods ended July 31, 2010.25
| | | | | | | | | | | | | | | | | | | | |
| | | Fund Return (%) | | | PG Median (%) | | | PU Median (%) | | | PG Rank | | | PU Rank | |
1 year | | | 29.13 | | | | 21.96 | | | | 20.37 | | | | 3/17 | | | | 3/95 | |
3 year | | | 11.52 | | | | 7.00 | | | | 6.30 | | | | 1/17 | | | | 1/85 | |
5 year | | | 10.62 | | | | 6.23 | | | | 5.84 | | | | 1/17 | | | | 1/74 | |
10 year | | | 13.03 | | | | 6.29 | | | | 6.29 | | | | 1/17 | | | | 1/59 | |
Set forth below are the 1, 3, 5, 10 year and since inception net performance returns of the Fund (in bold)26 versus its benchmarks. Note that the Fund may utilize leverage in contrast to the Fund’s benchmark, which has no leverage.
| | | | | | | | | | | | | | | | | | | | |
| | | Periods Ending July 31, 2010 Annualized Performance | |
| | | 1 Year
(%) | | | 3 Year
(%) | | | 5 Year
(%) | | | 10 Year
(%) | | | Since
Inception
(%) | |
| High Income Fund, Inc. | | | 28.85 | | | | 11.36 | | | | 10.53 | | | | 12.98 | | | | 11.78 | |
| 33% JP Morgan EMBI Index / 33% JP Morgan GBI EM Index / 33% Barclays Capital High Yield 2% Constrained Index | | | 19.02 | | | | 9.36 | | | | 8.89 | | | | N/A | | | | N/A | |
| JP Morgan EMBI Global Index | | | 19.08 | | | | 10.00 | | | | 9.09 | | | | 10.49 | | | | 11.07 | |
| JP Morgan GBI EM Index | | | 13.77 | | | | 7.9 | | | | 9.41 | | | | N/A | | | | N/A | |
| Barclays Capital High Yield 2% Constrained Index | | | 23.69 | | | | 9.40 | | | | 7.63 | | | | 7.75 | | | | 7.32 | |
| Inception Date: February 25, 1994 | |
CONCLUSION:
Based on the factors discussed above the Senior Officer’s conclusion is that the proposed advisory fee for the Fund is reasonable and within the range of what would have been negotiated at arms-length in light of all the surrounding circumstances. This conclusion in respect of the Fund is based on an evaluation of all of these factors and no single factor was dispositive.
Dated: November 22, 2010
| 23 | | The performance returns and rankings are for the Class A shares of the Fund. It should be noted that the performance returns of the Fund that are shown were provided by the Adviser. Lipper maintains its own database that includes the Fund’s performance returns. However, differences in the distribution price (ex-date versus payable date) and rounding differences may cause the Adviser’s own performance returns of the Fund to be different from Lipper. |
| 24 | | The Portfolio’s PG is identical to the Portfolio’s EG. The Portfolio’s PU is not identical to the Portfolio’s EU as the criteria for including/excluding a portfolio in/from a PU are somewhat different from that of an EU. |
| 25 | | Note that the current Lipper investment classification/objective dictates the PG and PU throughout the life of the Fund even if the Fund may have had a different investment classification/objective at different points in time. |
| 26 | | The performance returns and risk measures shown in the table are for the Class A shares of the Fund. |
| | |
| 116 | | • ALLIANCEBERNSTEIN HIGH INCOME FUND |
THIS PAGE IS NOT PART OF THE SHAREHOLDER REPORT OR THE FINANCIAL STATEMENTS
ALLIANCEBERNSTEIN FAMILY OF FUNDS
Wealth Strategies Funds
Balanced Wealth Strategy
Wealth Appreciation Strategy
Conservative Wealth Strategy*
Tax-Managed Balanced Wealth Strategy
Tax-Managed Wealth Appreciation Strategy
Tax-Managed Conservative Wealth Strategy*
Blended Style Funds
U.S. Large Cap Portfolio
International Portfolio
Tax-Managed International Portfolio
Growth Funds
Domestic
Growth Fund
Large Cap Growth Fund
Small Cap Growth Portfolio
Small/Mid Cap Growth Fund
U.S. Strategic Research Portfolio*
Global & International
Global Growth Fund
Global Thematic Growth Fund
Greater China ‘97 Fund
International Growth Fund
Value Funds
Domestic
Balanced Shares
Core Opportunities Fund*
Growth & Income Fund
Small/Mid Cap Value Fund
Utility Income Fund
Value Fund
Global & International
Global Real Estate Investment Fund
Global Value Fund
International Value Fund
Taxable Bond Funds
Bond Inflation Strategy
Diversified Yield Fund
Global Bond Fund
High Income Fund
Intermediate Bond Portfolio
Short Duration Portfolio
Municipal Bond Funds
| | |
Arizona Municipal Bond Inflation Strategy California High Income Massachusetts Michigan | | Minnesota National New Jersey New York Ohio Pennsylvania Virginia |
Intermediate Municipal Bond Funds
Intermediate California
Intermediate Diversified
Intermediate New York
Closed-End Funds
AllianceBernstein Global High Income Fund
AllianceBernstein Income Fund
AllianceBernstein National Municipal Income Fund
Alliance California Municipal Income Fund
Alliance New York Municipal Income Fund
The Ibero-America Fund*
Inflation Strategies
Multi-Asset Inflation Strategy
Retirement Strategies Funds
| | | | |
2000 Retirement Strategy | | 2020 Retirement Strategy | | 2040 Retirement Strategy |
2005 Retirement Strategy | | 2025 Retirement Strategy | | 2045 Retirement Strategy |
2010 Retirement Strategy | | 2030 Retirement Strategy | | 2050 Retirement Strategy |
2015 Retirement Strategy | | 2035 Retirement Strategy | | 2055 Retirement Strategy |
We also offer Exchange Reserves,** which serves as the money market fund exchange vehicle for the AllianceBernstein mutual funds.
You should consider the investment objectives, risks, charges and expenses of any AllianceBernstein fund/portfolio carefully before investing. For free copies of our prospectuses, which contain this and other information, visit us online at www.alliancebernstein.com or contact your financial advisor. Please read the prospectus carefully before investing.
| * | | Prior to December 31, 2009, Conservative Wealth Strategy was named Wealth Preservation Strategy, and Tax-Managed Conservative Wealth Strategy was named Tax-Managed Wealth Preservation Strategy. U.S. Strategic Research Portfolio was incepted on December 23, 2009. Prior to January 20, 2010, The Ibero-America Fund was named The Spain Fund. Prior to March 1, 2010, Core Opportunities Fund was named the Focused Growth & Income Fund. |
| ** | An investment in the Fund is not a deposit in a bank and is not insured or guaranteed by the Federal Deposit Insurance Corporation or any other government agency. Although the Fund seeks to preserve the value of your investment at $1.00 per share, it is possible to lose money by investing in the Fund. |
| | | | |
| ALLIANCEBERNSTEIN HIGH INCOME FUND • | | | 117 | |
AllianceBernstein Family of Funds
NOTES
| | |
| 118 | | • ALLIANCEBERNSTEIN HIGH INCOME FUND |
NOTES
| | | | |
| ALLIANCEBERNSTEIN HIGH INCOME FUND • | | | 119 | |
NOTES
| | |
| 120 | | • ALLIANCEBERNSTEIN HIGH INCOME FUND |
NOTES
| | | | |
| ALLIANCEBERNSTEIN HIGH INCOME FUND • | | | 121 | |
NOTES
| | |
| 122 | | • ALLIANCEBERNSTEIN HIGH INCOME FUND |
NOTES
| | | | |
| ALLIANCEBERNSTEIN HIGH INCOME FUND • | | | 123 | |
NOTES
| | |
| 124 | | • ALLIANCEBERNSTEIN HIGH INCOME FUND |
ALLIANCEBERNSTEIN HIGH INCOME FUND
1345 Avenue of the Americas
New York, NY 10105
800.221.5672
| | |
| |
| HI-0151-1010 | |  |
(a) The registrant has adopted a code of ethics that applies to its principal executive officer, principal financial officer and principal accounting officer. A copy of the registrant’s code of ethics is filed herewith as Exhibit 12(a)(1).
(b) During the period covered by this report, no material amendments were made to the provisions of the code of ethics adopted in 2(a) above.
(c) During the period covered by this report, no implicit or explicit waivers to the provisions of the code of ethics adopted in 2(a) above were granted.
| ITEM 3. | AUDIT COMMITTEE FINANCIAL EXPERT. |
The registrant’s Board of Directors has determined that independent directors Garry L. Moody and William H. Foulk, Jr. qualify as audit committee financial experts.
| ITEM 4. | PRINCIPAL ACCOUNTANT FEES AND SERVICES. |
(a) - (c) The following table sets forth the aggregate fees billed by the independent registered public accounting firm Ernst & Young LLP, for the Fund’s last two fiscal years for professional services rendered for: (i) the audit of the Fund’s annual financial statements included in the Fund’s annual report to stockholders; (ii) assurance and related services that are reasonably related to the performance of the audit of the Fund’s financial statements and are not reported under (i), which include advice and education related to accounting and auditing issues and quarterly press release review (for those Funds which issue press releases), and preferred stock maintenance testing (for those Funds that issue preferred stock); and (iii) tax compliance, tax advice and tax return preparation.
| | | | | | | | | | | | |
| | | Audit Fees | | | Audit-Related
Fees | | | Tax Fees | |
2009 | | $ | 60,416 | | | $ | 5,668 | | | $ | 10,400 | |
2010 | | $ | 57,500 | | | $ | — | | | $ | 16,971 | |
(d) Not applicable.
(e) (1) Beginning with audit and non-audit service contracts entered into on or after May 6, 2003, the Fund’s Audit Committee policies and procedures require the pre-approval of all audit and non-audit services provided to the Fund by the Fund’s independent registered public accounting firm. The Fund’s Audit Committee policies and procedures also require pre-approval of all audit and non-audit services provided to the Adviser and Service Affiliates to the extent that these services are directly related to the operations or financial reporting of the Fund.
(e) (2) All of the amounts for Audit Fees, Audit-Related Fees and Tax Fees in the table under Item 4 (a) – (c) are for services pre-approved by the Fund’s Audit Committee.
(f) Not applicable.
(g) The following table sets forth the aggregate non-audit services provided to the Fund, the Fund’s Adviser and entities that control, are controlled by or under common control with the Adviser that provide ongoing services to the Fund, which include preparing an annual internal control report pursuant to Statement on Auditing Standards No. 70 (“Service Affiliates”):
| | | | | | | | |
| | | All Fees for
Non-Audit Services
Provided to the
Portfolio, the Adviser
and Service Affiliates | | | Total Amount of
Foregoing Column Pre-
approved by the Audit
Committee
(Portion Comprised of
Audit Related Fees)
(Portion Comprised of
Tax Fees) | |
2009 | | $ | 790,725 | | | $
$ $ | 259,914
(249,514 (10,400 |
) ) |
2010 | | $ | 709,151 | | | $
$ $ | 144,686
(127,715 (16,971 |
) ) |
(h) The Audit Committee of the Fund has considered whether the provision of any non-audit services not pre-approved by the Audit Committee provided by the Fund’s independent registered public accounting firm to the Adviser and Service Affiliates is compatible with maintaining the auditor’s independence.
| ITEM 5. | AUDIT COMMITTEE OF LISTED REGISTRANTS. |
Not applicable to the registrant.
| ITEM 6. | SCHEDULE OF INVESTMENTS. |
Please see Schedule of Investments contained in the Report to Shareholders included under Item 1 of this Form N-CSR.
| ITEM 7. | DISCLOSURE OF PROXY VOTING POLICIES AND PROCEDURES FOR CLOSED-END MANAGEMENT INVESTMENT COMPANIES. |
Not applicable to the registrant.
| ITEM 8. | PORTFOLIO MANAGERS OF CLOSED-END MANAGEMENT INVESTMENT COMPANIES. |
Not applicable to the registrant.
| ITEM 9. | PURCHASES OF EQUITY SECURITIES BY CLOSED-END MANAGEMENT INVESTMENT COMPANY AND AFFILIATED PURCHASERS. |
Not applicable to the registrant.
| ITEM 10. | SUBMISSION OF MATTERS TO A VOTE OF SECURITY HOLDERS. |
There have been no material changes to the procedures by which shareholders may recommend nominees to the Fund’s Board of Directors since the Fund last provided disclosure in response to this item.
| ITEM 11. | CONTROLS AND PROCEDURES. |
(a) The registrant’s principal executive officer and principal financial officer have concluded that the registrant’s disclosure controls and procedures (as defined in Rule 30a-3 (c) under the Investment Company Act of 1940, as amended) are effective at the reasonable assurance level based on their evaluation of these controls and procedures as of a date within 90 days of the filing date of this document.
(b) There were no changes in the registrant’s internal controls over financial reporting that occurred during the second fiscal quarter of the period that has materially affected, or is reasonably likely to materially affect, the registrant’s internal control over financial reporting.
The following exhibits are attached to this Form N-CSR:
| | |
EXHIBIT NO. | | DESCRIPTION OF EXHIBIT |
| |
| 12 (a) (1) | | Code of Ethics that is subject to the disclosure of Item 2 hereof |
| |
| 12 (b) (1) | | Certification of Principal Executive Officer Pursuant to Section 302 of the Sarbanes-Oxley Act of 2002 |
| |
| 12 (b) (2) | | Certification of Principal Financial Officer Pursuant to Section 302 of the Sarbanes-Oxley Act of 2002 |
| |
| 12 (c) | | Certification of Principal Executive Officer and Principal Financial Officer Pursuant to Section 906 of the Sarbanes-Oxley Act of 2002 |
SIGNATURES
Pursuant to the requirements of the Securities Exchange Act of 1934 and the Investment Company Act of 1940, the registrant has duly caused this report to be signed on its behalf by the undersigned, thereunto duly authorized.
(Registrant): AllianceBernstein High Income Fund, Inc.
| | |
| By: | | /s/ ROBERT M. KEITH |
| | Robert M. Keith |
| | President |
| |
| Date: | | December 28, 2010 |
Pursuant to the requirements of the Securities Exchange Act of 1934 and the Investment Company Act of 1940, this report has been signed below by the following persons on behalf of the registrant and in the capacities and on the dates indicated.
| | |
| By: | | /s/ ROBERT M. KEITH |
| | Robert M. Keith |
| | President |
| |
| Date: | | December 28, 2010 |
| |
| By: | | /s/ JOSEPH J. MANTINEO |
| | Joseph J. Mantineo |
| | Treasurer and Chief Financial Officer |
| |
| Date: | | December 28, 2010 |