respec.com JORDAN BROMINE OPERATION Technical Report Summary as of December 31, 2024 716-RPS223461 Final 12 February 2025 Exhibit 96.5 TECHNICAL REPORT SUMMARY 716-RPS223461 | Jordan Bromine Operation | Final | 12 February 2025 rpsgroup.com Page ii JORDAN BROMINE OPERATION Technical Report Summary Peer Review Michael Gallup, P. Eng. [email]: michael.gallup@rpsgroup.com 24 January 2025 Approval for issue Michael Gallup, P. Eng. [email]: michael.gallup@rpsgroup.com 7 February 2025 This report was prepared by RPS Energy Canada Ltd (‘RPS’) within the terms of its engagement and in direct response to a scope of services. This report is strictly limited to the purpose and the facts and matters stated in it and does not apply directly or indirectly and must not be used for any other application, purpose, use or matter. In preparing the report, RPS may have relied upon information provided to it at the time by other parties. RPS accepts no responsibility as to the accuracy or completeness of information provided by those parties at the time of preparing the report. The report does not take into account any changes in information that may have occurred since the publication of the report. If the information relied upon is subsequently determined to be false, inaccurate or incomplete then it is possible that the observations and conclusions expressed in the report may have changed. RPS does not warrant the contents of this report and shall not assume any responsibility or liability for loss whatsoever to any third party caused by, related to or arising out of any use or reliance on the report howsoever. No part of this report, its attachments or appendices may be reproduced by any process without the written consent of RPS. All inquiries should be directed to RPS. Prepared by: Prepared for: RPS Albemarle Corporation Michael Gallup Technical Director – Engineering Suite 2000, Bow Valley Sq.4 250 - 6th Avenue SW Calgary, AB T2P 3H7 4250 Congress Street Suite 900 Charlotte, NC 28209 U.S.A. T +1 403 265 7226 E Michael.gallup@rpsgroup.com T +1 225 388 7076 E and RESPEC Peter Christensen, RM-SME Debashis Das, P.E. 146 East Third Street PO Box 888 Lexington, Kentucky 40508
TECHNICAL REPORT SUMMARY 716-RPS223461 | Jordan Bromine Operation | Final | 12 February 2025 rpsgroup.com Page iii RPS Ref: 716-RPS223461 February 12, 2025 Albemarle Corporation 4250 Congress Street Suite 900 Charlotte, NC 28209 U.S.A. Jordan Bromine Operation Technical Report Summary as of December 31, 2024 As requested in the engagement letter dated January 6th, 2025, RPS and RESPEC have evaluated certain Bromine reserves and resource in the Kingdom of Jordan, as of December 31, 2024 (“Effective Date”), and submit the attached report of our findings. The evaluation was conducted in compliance with subpart 1300 of Regulation SK. This report contains forward looking statements including expectations of future production and capital expenditures. Potential changes to current regulations may cause volumes actually recovered and amounts future net revenue actually received to differ significantly from the estimated quantities. Information concerning reserves and resources may also be deemed to be forward looking as estimates imply that the reserves or resources described can be profitably produced in the future. These statements are based on current expectations that involve a number of risks and uncertainties, which could cause the actual results to differ from those anticipated. These risks include, but are not limited to, the underlying risks of the mining industry (i.e., operational risks in development, exploration and production; potential delays or changes in plans with respect to exploration or development projects or capital expenditures; the uncertainty of resources estimates; the uncertainty of estimates and projections relating to production, costs and expenses, political and environmental factors), and commodity price and exchange rate fluctuation. Present values for various discount rates documented in this report may not necessarily represent fair market value of the reserves or resources. Yours sincerely, for RPS Energy Canada Ltd Michael Gallup Technical Director – Engineering michael.gallup@rpsgroup.com +1 403 265 7226 Suite 2000, Bow Valley Sq.4 250 - 6th Avenue SW Calgary AB T2P 3H7 T +1 403 265 7226 12 February 2025 TECHNICAL REPORT SUMMARY 716-RPS223461 | Jordan Bromine Operation | Final | 12 February 2025 rpsgroup.com Page iv Contents INDEPENDENT CONSULTANT'S CONSENT AND WAIVER OF LIABILITY ......................................... viii 1 EXECUTIVE SUMMARY .................................................................................................................... 9 1.1 Property Description ................................................................................................................. 9 1.2 Mineral Rights ........................................................................................................................... 9 1.3 Geological Setting, Mineralization and Deposit ........................................................................ 9 1.4 Exploration ................................................................................................................................ 9 1.5 Mineral Processing and Metallurgical Testing ........................................................................ 10 1.6 Mineral Resource Estimates ................................................................................................... 10 1.7 Mineral Reserves Estimates ................................................................................................... 10 1.8 Mining Methods ...................................................................................................................... 11 1.9 Processing and Recovery Methods ........................................................................................ 11 1.10 Infrastructure ........................................................................................................................... 11 1.11 Market Studies ........................................................................................................................ 12 1.12 Environmental Studies, Permitting and Plans, Negotiations, or Agreements with Local Individuals or Groups .................................................................................................... 12 1.13 Capital and Operating Costs .................................................................................................. 13 1.14 Economic Analysis ................................................................................................................. 13 1.15 Interpretation and Conclusions ............................................................................................... 13 1.16 Recommendations .................................................................................................................. 13 2 INTRODUCTION .............................................................................................................................. 14 2.1 Issuer of Report ...................................................................................................................... 14 2.2 Terms of Reference and Purpose .......................................................................................... 14 2.3 Sources of Information ........................................................................................................... 14 2.4 Glossary .................................................................................................................................. 14 2.5 Personal Inspection ................................................................................................................ 15 2.6 Report Version ........................................................................................................................ 15 3 PROPERTY DESCRIPTION ............................................................................................................. 16 3.1 Jordan Land Management and Regulatory Framework ......................................................... 16 3.2 Mineral Rights ......................................................................................................................... 16 3.2.1 Jordan Bromine Company and Albemarle Joint Venture .......................................... 16 3.2.2 Arab Potash Company .............................................................................................. 19 3.3 Significant Encumbrances or Risks to Performing Work On Permits ..................................... 20 4 ACCESSIBILITY, CLIMATE, LOCAL RESOURCES, INFRASTRUCTURE, AND PHYSIOGRAPHY ............................................................................................................................. 21 4.1 Topography and Vegetation ................................................................................................... 21 4.2 Accessibility and Local Resources ......................................................................................... 24 4.3 Climate .................................................................................................................................... 24 4.4 Infrastructure ........................................................................................................................... 25 4.5 Water Resources .................................................................................................................... 26 5 HISTORY .......................................................................................................................................... 27 6 GEOLOGICAL SETTING, MINERALIZATION, AND DEPOSIT ..................................................... 28 6.1 Regional Geology ................................................................................................................... 28 6.2 Local Geology ......................................................................................................................... 28 6.3 Property Geology and Mineralization ..................................................................................... 34
TECHNICAL REPORT SUMMARY 716-RPS223461 | Jordan Bromine Operation | Final | 12 February 2025 rpsgroup.com Page v 7 EXPLORATION ................................................................................................................................ 36 8 SAMPLE PREPARATION, ANALYSES, AND SECURITY ............................................................. 38 9 DATA VERIFICATION ...................................................................................................................... 39 10 MINERAL PROCESSING AND METALLURGICAL TESTING ....................................................... 40 10.1 Brine Sample Collection ......................................................................................................... 40 10.2 Security ................................................................................................................................... 40 10.3 Analytical Method ................................................................................................................... 41 11 MINERAL RESOURCE ESTIMATES .............................................................................................. 42 11.1 Dead Sea Elevation ................................................................................................................ 43 11.2 Dead Sea Volume .................................................................................................................. 43 11.3 Dead Sea Salinity ................................................................................................................... 45 11.4 Simulation Model .................................................................................................................... 46 11.5 Bromide Concentration ........................................................................................................... 47 11.6 Resource Estimation .............................................................................................................. 47 12 MINERAL RESERVES ESTIMATES ............................................................................................... 50 13 MINING METHOD ............................................................................................................................ 52 13.1 Brine Extraction Method ......................................................................................................... 52 13.2 Life of Mine Production Schedule ........................................................................................... 56 14 PROCESSING AND RECOVERY METHODS ................................................................................. 57 14.1 Mineral Recovery Process Walkthrough ................................................................................ 57 15 INFRASTRUCTURE ......................................................................................................................... 59 15.1 Roads and Rail ....................................................................................................................... 59 15.2 Port Facilities .......................................................................................................................... 59 15.3 Plant Facilities ......................................................................................................................... 60 15.3.1 Water Supply ............................................................................................................. 60 15.3.2 Power Supply ............................................................................................................ 61 15.3.3 Brine Supply .............................................................................................................. 61 15.3.4 Waste-Steam Management ...................................................................................... 61 16 MARKET STUDIES .......................................................................................................................... 62 16.1 Bromine Market Overview ...................................................................................................... 62 16.2 Major Producers ..................................................................................................................... 62 16.3 Major Markets ......................................................................................................................... 63 16.4 Bromine Price Trend ............................................................................................................... 63 16.5 Bromine Applications .............................................................................................................. 64 17 ENVIRONMENTAL STUDIES, PERMITTING AND PLANS, NEGOTIATIONS, OR AGREEMENTS WITH LOCAL INDIVIDUALS OR GROUPS .......................................................... 66 17.1 Environmental Studies ............................................................................................................ 66 17.2 Environmental Compliance ..................................................................................................... 66 17.2.1 Compliance With National Standards ....................................................................... 66 17.2.2 Compliance With International Standards ................................................................. 66 17.2.3 Environmental Monitoring ......................................................................................... 67 17.3 Requirements and Plans for Waste and Tailings Disposal .................................................... 67 17.4 Project Permitting Requirements, The Status of Any Permit Applications ............................. 67 17.5 Qualified Person's Opinion ..................................................................................................... 68 TECHNICAL REPORT SUMMARY 716-RPS223461 | Jordan Bromine Operation | Final | 12 February 2025 rpsgroup.com Page vi 18 CAPITAL AND OPERATING COSTS .............................................................................................. 69 18.1 Capital Costs .......................................................................................................................... 69 18.1.1 Development Facilities Costs .................................................................................... 69 18.1.2 Plant Maintenance Capital (Working Capital) ........................................................... 69 18.2 Operating Costs ...................................................................................................................... 69 19 ECONOMIC ANALYSIS ................................................................................................................... 71 19.1 Royalties ................................................................................................................................. 71 19.2 Bromine Market and Sales ..................................................................................................... 71 19.3 Income Tax ............................................................................................................................. 71 19.4 Cash Flow Results .................................................................................................................. 71 19.5 Net Present Value Estimate ................................................................................................... 76 20 ADJACENT PROPERTIES .............................................................................................................. 79 20.1 Manaseer Magnesia Company ............................................................................................... 79 20.2 Dead Sea Works Limited ........................................................................................................ 79 21 OTHER RELEVANT DATA AND INFORMATION ........................................................................... 82 22 INTERPRETATION AND CONCLUSIONS ...................................................................................... 83 22.1 General ................................................................................................................................... 83 22.2 Discussion of Risk .................................................................................................................. 84 22.2.1 Geopolitical Risk ........................................................................................................ 84 22.2.2 Environmental Risk ................................................................................................... 86 22.2.3 Additional Raw Materials Risk ................................................................................... 86 22.2.4 Other Risk Considerations ........................................................................................ 86 22.2.5 Risk Conclusion ......................................................................................................... 89 23 RECOMMENDATIONS .................................................................................................................... 90 24 RELIANCE ON INFORMATION PROVIDED BY THE REGISTRANT ............................................ 91 References ................................................................................................................................................. 92 Tables Table 2-1 Glossary of Terms .................................................................................................................. 15 Table 6-1: Typical Concentration of Ions in the Dead Sea and Regular Sea Water Grams per Liter ......................................................................................................................................... 35 Table 11-1: Dead Sea Water Level and Surface Area ............................................................................. 45 Table 11-2: Dead Sea Level, Area, and Volume as Predicted by a Two-Layer Model Based on the Water-Mass Balance Approach, Baseline year, 1997 ...................................................... 47 Table 11-3: Dead Sea Bromide Ion Resources ......................................................................................... 48 Table 11-4: Dead Sea Surface Area Allocation (as of 2023) .................................................................... 49 Table 12-1: Jordan Bromine Company (Area 1 and Petra) Brine Processing and Bromine Production Records (2021-2023) ........................................................................................... 50 Table 13-1: Ion Concentration in Dead Sea Water ................................................................................... 52 Table 13-2: Life of Mine Production schedule ........................................................................................... 56 Table 15-1: Materials Handled by JBC at Aqaba Port and JBC Terminal ................................................. 59 Table 15-2: Materials Stored at Jordan Bromine Company Terminal ....................................................... 60 Table 16-1: Bromine Production in Metric Tonnes by Leading Countries (2017-2022) ........................... 62 Table 18-1: Summary of Operating and Capital Expenses ....................................................................... 70
TECHNICAL REPORT SUMMARY 716-RPS223461 | Jordan Bromine Operation | Final | 12 February 2025 rpsgroup.com Page vii Table 19-1: Annual Cash Flow Summary – Proved Reserves – Spot Prices ............................................ 72 Table 19-2: Annual Cash Flow Summary – Proved Reserves – Spot Prices less 15% ............................ 73 Table 19-3: Annual Cash Flow Summary – Proved Reserves – Spot Prices less 30% ............................ 74 Table 19-4: Annual Cash Flow Summary – Proved Reserves – Spot Prices less 45% ............................ 75 Table 19-5: Jordan Bromine Company –NPV of Reserves as of December 31, 2023 – Spot Prices ...................................................................................................................................... 76 Table 19-6: Jordan Bromine Company – NPV of Reserves as of December 31, 2023 – Spot Prices less 15% ...................................................................................................................... 76 Table 19-7: Jordan Bromine Company – NPV of Reserves as of December 31, 2023 – Spot Prices less 30% ...................................................................................................................... 77 Table 19-8: Jordan Bromine Company – NPV of Reserves as of December 31, 2023 – Spot Prices less 45% ...................................................................................................................... 77 Table 22-1: Project Risks ........................................................................................................................... 88 Table 24-1: Reliance on Information Provided by the Registrant ............................................................... 91 Figures Figure 3.1: Jordan Bromine Company Project Location Map. .................................................................. 17 Figure 3.2: Administrative Divisions of Jordan. ........................................................................................ 18 Figure 4.1: Morphological Features and General Elevation. .................................................................... 22 Figure 4.2: Vegetation Types of Jordan. .................................................................................................. 23 Figure 4.3: Average Annual Rainfall . ....................................................................................................... 25 Figure 6.1: Physiological Features. .......................................................................................................... 29 Figure 6.2: (A) Plan View of the Dead Sea in Relation to the Western Boundary Fault and the Arava Fault and (B) Generalized Cross Section of the Dead Sea Lake Geology. ................. 30 Figure 6.3: Main Regional Faults in the Area . ......................................................................................... 31 Figure 6.4: Map of the Jordan Bromine Company Area and Its Generalized Geology, Including Faults ,. ................................................................................................................................... 32 Figure 6.5: Depositional Settings of the Dead Sea. .................................................................................. 33 Figure 11.1: Interannual Changes in the Dead Sea Total Vertical Stability and Sea Level . ..................... 44 Figure 11.2: Quasi-Salinity (Sigma 25) of the Dead Sea. . ......................................................................... 46 Figure 11.3: Schematic of the Mass Balance for the Dead Sea Using a Two-Layer System. ................... 47 Figure 11.4: Schematization of the Water Mass Balance for the Dead Sea Using a Two-Layer System. ................................................................................................................................... 48 Figure 13.1: Process Sequence Schematic. .............................................................................................. 53 Figure 13.2: Solar Evaporation and Production Plant Map. ....................................................................... 54 Figure 13.3: Pond C-7 Feedbrine Pumping Station (for Bromine and Magnesium Plants). ....................... 55 Figure 14.1: Area 1 and Petra Mineral Recovery Trains. ........................................................................... 57 Figure 16.1: Bromine Price Trend as per China Petroleum and Chemical Industry Federation (Price is in US$) ...................................................................................................................... 64 Figure 19.1: Net Present Value Distribution of Proved Reserves by Price Forecast. ................................ 78 Figure 20.1: The Adjacent Properties of Manaseer Magnesia Company and Arab Potash Company. ............................................................................................................................... 80 TECHNICAL REPORT SUMMARY 716-RPS223461 | Jordan Bromine Operation | Final | 12 February 2025 rpsgroup.com Page viii INDEPENDENT CONSULTANT'S CONSENT AND WAIVER OF LIABILITY The undersigned firm of Independent Consultants of Calgary, Alberta, Canada knows that it is named as having prepared an independent report of the bromine reserves of the Jordan property owned by Albemarle Corporation and it hereby gives consent to the use of its name and to the said report. The effective date of the report is December 31, 2024. In the course of the evaluation, Albemarle provided RPS Energy Canada Ltd. (RPS) personnel with basic information which included the field’s licensing agreements, geologic and production information, cost estimates, contractual terms, studies made by other parties and discussions of future plans. Any other engineering or economic data required to conduct the evaluation upon which the original and addendum reports are based, was obtained from public literature, and from RPS non-confidential client files. The extent and character of ownership and accuracy of all factual data supplied for this evaluation, from all sources, has been accepted as represented. RPS reserves the right to review all calculations referred to or included in the said reports and, if considered necessary, to revise the estimates in light of erroneous data supplied or information existing but not made available at the effective date, which becomes known subsequent to the effective date of the reports. RPS Energy Canada Ltd.
TECHNICAL REPORT SUMMARY 716-RPS223461 | Jordan Bromine Operation | Final | 12 February 2025 rpsgroup.com Page 9 1 EXECUTIVE SUMMARY This Technical Report Summary (“TRS”) was prepared by RESPEC at the request of Albemarle Corporation (Albemarle, or the company) for the company’s Jordan Bromine Company (“JBC”). The TRS complies with disclosure standards of the SEC S-K Regulation 1300 following the TRS outline described in CFR 17 and reports the estimated reserves for the Jordan bromine operation as well as all summary information required as outlined in the SEC S-K Regulation 1300. 1.1 Property Description The JBC operation is located in Safi, Jordan, and is located on a 33-ha area on the southeastern edge of the Dead Sea, about 6 kilometers north of the of the Arab Potash Company (APC) plant. JBC also has a 2-hectare storage facility within the free-zone industrial area at the Port of Aqaba. 1.2 Mineral Rights JBC was established in 1999 and is a joint venture between Albemarle Holdings Company Limited, a wholly owned subsidiary of Albemarle and the Arab Potash Company (APC). JBC’s operations primarily consist of the manufacturing of bromine, from bromide-enriched brine which is a by-product of potash operations from the Dead Sea waters, conducted by APC. The Government of the Hashemite Kingdom of Jordan granted APC a concession for exclusive rights to exploit the minerals and salts from the Dead Sea brine until 2058. Rights granted to APC are applicable to JBC by virtue of APC’s participation in the Joint Venture. APC maintains all the necessary permits to guarantee the continuous operation of its facilities under Jordanian legislation. 1.3 Geological Setting, Mineralization and Deposit Movement of the plates that created the basin containing the Dead Sea began 15 Ma and the plates continue to diverge today at a rate of 5 to 10 mm per year1. The Dead Sea is an isolated hypersaline lake within the lowest part of the catchment basin and is a unique, current-day example of evaporitic sedimentation and accumulation within a brine body1. The climate, geology and location provide a setting that makes the Dead Sea a valuable large-scale natural resource for potash and bromine. Today, the Dead Sea has an estimated surface area of 569 km2 and a brine volume of 106 km3. The Dead Sea is the world’s saltiest natural lake2, containing high concentrations of ions compared to that of regular sea water and an unusually high amount of magnesium and bromine. There is an estimated 666 million tonnes of bromine in the Dead Sea. Evaporation greatly exceeds the inflow of water to the Dead Sea, causing a negative water balance and a receding shoreline of approximately 1.1 m to 1.25 m per year1. Variable evaporation rates and uncertain subsurface inflow of fresh water make it difficult to predict its water deficit. The Dead Sea contains a large and deep northern basin and a shallow southern basin. The southern Basin is a saline mudflat, and the water level is maintained by artificial flooding, with North Basin brine. 1.4 Exploration There is no exploration as typically conducted for the characterization of a mineral deposit. A limited site investigation program was carried out in 1966 when most of the southern basin of the Dead Sea was covered in up to 3 m of brine. A more detailed program, with a cost of £3 million, took place in 1977 when the brine level had receded from the southern basin, leaving only land-locked ponds in the central depression. TECHNICAL REPORT SUMMARY 716-RPS223461 | Jordan Bromine Operation | Final | 12 February 2025 rpsgroup.com Page 10 1.5 Mineral Processing and Metallurgical Testing The JBC bromine plants and connection to the APC C-7 carnallite ponds was designed to move substantial quantities of concentrated brine to the central bromine production facilities, where brine is processed to produce bromine. Knowing the consistency of the bromide salts (“bromides”) within the feedbrine is critical for operations and business planning of the various bromine derivative sales. Feedbrine and tailbrine samples are taken frequently, upstream and downstream of the bromine tower, to capture any concentration changes. The sampling process is systematic and documented. Bromides within the brine is measured by a widely used halogen titration process; methods appear to be reasonable and well established. The sampling and analytical processes are adequate to support the plant operation. 1.6 Mineral Resource Estimates JBC’s bromine production plant is atypical of many mineral mining and processing operations in that the feedstock for the plant is concentrated brine available from another mineral processing plant owned by APC. The feedstock for the APC plant is drawn from the Dead Sea, a nonconventional reservoir, a reservoir owned by the nations of Israel and Jordan. As such, there are no specific resources owned by APC or JBC, but rather APC has exclusive rights granted by the Hashemite Kingdom of Jordan to withdraw brine from the Dead Sea and process it to extract minerals. The measured resources of bromide ion attributable to Albemarle’s 50% interest in its JBC joint venture is estimated to be approximately 173.93 MMt. From these large resources, JBC is extracting approximately 1 percent of the bromine available. 1.7 Mineral Reserves Estimates Proven and probable reserves have been estimated based on the operational parameters, economics and concession agreements for JBC. The reserve estimate is constrained by the time available under the concession agreement with the Hashemite Kingdom of Jordan, and the processing capability of the plant. The forecast volumes of brine processed are supported by demonstrated plant performance. The reserve estimate is not constrained by available resources, with approximately 1 percent of the measured resources being consumed. Costs are based on forward projections supported by historical operating and capital costs, with no major capital projects or plant expansions required to support the operating forecast. Revenues are based on a range of bromine sales prices between the spot price for the effective date of December 31, 2024, and the spot price less 15 percent, 30 percent and 45 percent. The plants are forecast to process approximately 15.5 MMt of feedbrine per year on average over the remaining concession life. On an annual basis, the feed contains approximately 135,500 tonnes of bromide ion. At the plant process recovery of 87 percent (bromine from bromide), product bromine is estimated at approximately 118,000 tonnes per year. The APC concession and JBC’s ownership of the facility expires at the end of 2058. Over the 34 years of production from the reserves effective date of December 31, 2024, an estimated 4.01 MMt of bromine will be produced, which establishes the reserve estimate. The proven reserves attributable to Albemarle’s 50% interest in its JBC joint venture are estimated to be approximately 2.0 MMt of elemental bromine.
TECHNICAL REPORT SUMMARY 716-RPS223461 | Jordan Bromine Operation | Final | 12 February 2025 rpsgroup.com Page 11 1.8 Mining Methods Mining methods consist of all activities necessary to extract brine from the Dead Sea and extract Bromine. The low rainfall, low humidity and high temperatures in the Dead Sea area provide ideal conditions for recovering potash from the brine by solar evaporation. JBC obtains its feedbrine from APC’s evaporation C-7 carnallite pond and this supply is intimately linked to the APC operation. As evaporation takes place the specific gravity of the brine increases until its constituent salts progressively crystallize and precipitate out of solution, starting with sodium chloride (common salt) precipitating out to the bottom of the ponds (pre-carnallite ponds). Brine is transferred to other pans in succession where its specific gravity increases further, ultimately precipitating out of the sodium chloride. Carnallite precipitation takes place at C-7 carnallite pond. Where it is harvested from the brine and pumped as slurry to a process plant (where the potassium chloride is separated from the magnesium chloride). JBC extracts the bromide-rich, “carnallite-free” brine from pond C-7 through a pumping station with a capacity of approximately 84.1 MCM per year. This brine feeds the bromine and magnesium plants. 1.9 Processing and Recovery Methods Bromide-enriched brine (feedbrine) is conveyed to the two bromine plants via two parallel bromine production trains within the JBC facility via an open channel. Elemental bromine is produced at the JBC plants through a series of chemical processes. The brine is then mixed with chlorine to extract the remaining bromine from solution. Chlorinated brine enters the bromine distillation tower (at approximately 120°C) where additional chlorine is added to continue the reaction with any residual bromide salts and where the brine stream is heated by adding steam, maintaining a temperature above the boiling point. Bromine exiting the recovery section of the tower is purified. Heated bromide-depleted brine (tailbrine) exits the bromine distillation tower and is mixed with a strong base to neutralize any remaining acid, bromine, or chlorine. Then it is pumped to a storage pond for cooling and eventual discharge, recycled back to the Dead Sea via the APC process plant. Vaporized bromine is condensed, and the wet bromine is fed to a glass lined crude bromine storage drum that acts as an intermediate storage before downstream purification (and removal of any dissolved chlorine). 1.10 Infrastructure The Jordan Valley Highway/Route 65 is the primary method of access for supplies and personnel to JBC. The Port of Aqaba is the main entry point for supplies and equipment for JBC, where imported shipping containers are offloaded from ships and are transported by truck to JBC via the Jordan Valley Highway. Aqaba is approximately 205 km south of JBC via Highway 65. Major international airports can be readily accessed either at Amman or Aqaba. Jordan’s railway transport runs north-south through Jordan and is not used to transport JBC employees and product. JBC ships product in bulk through a storage terminal in Aqaba. There are above ground storage tanks as well as pumps and piping for loading these products onto ships. JBC main activities at Aqaba are raw material/product storing, importing, and exporting. An evaporation pond collects the waste streams from pipe flushing, housekeeping, and other activities. Infrastructure and facilities to support the operation of the bromine production plant at the Safi site is compact and contained in an approximately 33-ha area. Fresh water is sources from the Mujib Reservoir, a man-made reservoir. Approximately 1.0 to 1.2 MCM of water is used annually. Electricity is generated through the National Electric Power Company of Jordan (NEPCO) and distributed directly to JBC via the Electricity Distribution Company (EDCO), owned and operated by Kingdom Electricity Company. Overall, the project is well supported by quality infrastructure. TECHNICAL REPORT SUMMARY 716-RPS223461 | Jordan Bromine Operation | Final | 12 February 2025 rpsgroup.com Page 12 1.11 Market Studies The global bromine market is expected to grow steadily at a Compound Annual Growth Rate (CAGR) of approximately 4.20 percent between 2023 and 2028. The growth trend is attributed in part by an increased demand for plastics and flame-retardant chemicals using bromine to develop fire resistance. Also driving the trend is the use of bromine and its derivatives as mercury reducing agents, for example, used for the reduction of mercury emissions from combustion of coal in coal-fired power plants. The need for specialty chemicals in various end-use industries such as oil and gas, automobile, pharmaceuticals, and construction will also drive the demand for bromine. The major producers of elemental bromine in the world are Israel, Jordan, China, and the United States. The global bromine market is dominated by manufacturers who have an extensive geographical presence with massive production facilities, all around the world. A forecast of the global bromine market till 2025 suggests that Asia would be the fastest growing region for bromine consumption due to a growing population and the increasing purchasing power in the developing nations. The growth of agriculture and automobile industries in countries such as China and India will also drive the increasing demand for bromine. In 2021, the price of bromine significantly increased, reaching a peak of $10,700 per tonne in November, before falling sharply and ranging between $2,000 to $4,000 in 2023 and 2024. The bromine spot price on the effective date of this report, December 31, 2024, was USD 3,020 per tonne and the overall outlook is relatively stable pricing at current levels. Bromine prices have greatly decreased in the last two years mainly because of reduced demand and an increase in the release of domestic inventories before the close of the financial year. The slow demand for Bromine in industries such as flame-retardant production and other end-use sectors is due to excess inventories in the local market. The above-described behavior of the market is the product of a combination of factors, including China’s decrease in bromine production from brine due to the country’s electricity curtailment policy. 1.12 Environmental Studies, Permitting and Plans, Negotiations, or Agreements with Local Individuals or Groups JBC has carried out environmental impact studies in compliance with Jordanian regulations. The environmental impact studies are part of the public domain and accessible through the MIGA web site (www.miga.org). JBC complies with national environmental and labor regulations. It also meets or exceeds the international regulations of OSHA and NFPA. JBC is the first company of its kind in Jordan to become an authorized exporter into Europe and has been certified for ISO 9001, 14001 and VECAP (Voluntary Emissions Control Action Program). The company’s environmental program has been ISO 14001 certified by Lloyd’s Register since 2007 and further enhanced through the adoption of the integrated management system for quality (IS0 9001: 2015, OHSASL800L, 2007, ISO/4001:2015) certificate received in 2018. JBC works closely with the local communities, governmental and non-governmental organizations (NGOs) to make a positive difference and help communities prosper, both socially and environmentally. The company has established the Caring for Jordan Foundation, which contributes to the well-being of Jordanians by helping them to improve their quality of life through support of sustainable community projects.
TECHNICAL REPORT SUMMARY 716-RPS223461 | Jordan Bromine Operation | Final | 12 February 2025 rpsgroup.com Page 13 1.13 Capital and Operating Costs The JBC facility is an active operation with a track record of industrial production of elemental bromine and most of the major capital expenditures have already taken place in the past. Review of the business plan provided by JBC confirmed no further facilities or plant capital is required because JBC intends to keep all of the major components of its industrial facility through the expiration of the concession contract. An annual sustaining capital allocation of approximately $13.00-$14.40 million has been included. Plant operating costs and forecast budget were reviewed. Plant operating costs are expected to remain relatively constant and are forecast at $364/tonne of product bromine. It is to be noted that this number has been updated from 2023 report, since now it only concerns production of bromine. The previous report included the cost to produce derivatives on some of the product bromine. 1.14 Economic Analysis An economic model has been used to forecast cash flow from elemental bromine production and sales to derive a net present value for the bromine reserves. Cash flows have been generated using annual forecasts of production, sales revenues, operating costs and capital costs. At the assumed bromine sales price range of $1,661 to $3,020/tonne, the operations generate an NPV of $0.79 billion to $1.79 billion at a discount rate of 15 percent as of December 31, 2024, demonstrating economic viability. 1.15 Interpretation and Conclusions JBC primary raw material is bromide enriched brine from the adjacent APC potash processing business. APC has mineral rights to brine extracted from the Dead Sea through 2058. The measured resources for bromide ion in the Dead Sea is far in excess of the stated proven reserves of 4.01 million tonnes of bromine. The operation has been in production since 2002 and has a demonstrated production capacity to support the reserve estimate. 1.16 Recommendations No additional work relevant to the existing reserves is applicable at this time. The JBC plants have demonstrated capacity to operate at the production levels forecasted through the life of the reserve. Albemarle has indicated there are plans to upgrade the plant infrastructure to enable increased production in a three-to-five-year horizon, however these have not been fully evaluated by the QP and are not included in the forecasts for this report. The annual production may increase with the successful commissioning of several growth projects currently under evaluation. The status of these growth projects should be evaluated when sufficient detail is available for potential changes to reserves and an update to this report. TECHNICAL REPORT SUMMARY 716-RPS223461 | Jordan Bromine Operation | Final | 12 February 2025 rpsgroup.com Page 14 2 INTRODUCTION 2.1 Issuer of Report This Technical Report Summary (TRS) was prepared at the request of Albemarle Corporation (Albemarle), and this report is being filed under SEC S-K Regulation 1300 (SEC S-K 1300) reporting requirements for Albemarle’s Jordan Bromine Company (JBC) operation located in Safi, Jordan. The JBC is a joint venture with Arab Potash Company (APC). Headquartered in Charlotte, North Carolina, Albemarle is a global leader in specialty chemicals such as lithium, bromine, and refining catalysts. 2.2 Terms of Reference and Purpose The following general information applies to this TRS: This document reports the estimated reserves for the JBC operation as well as all summary information required by the SEC S-K 1300. The focus of this TRS and the scientific and technical information in this report only apply to the JBC operation. RESPEC Consulting Inc. (RESPEC) is entirely independent of Albemarle and has no interest in the mineral property discussed in this report. This TRS was prepared by RESPEC, complies with disclosure standards of the SEC S-K Regulation 1300, and follows the TRS outline described in CFR 17, Part 229.600. The effective date of this report is December 31, 2024, which is also the deadline for the data included within this report. Reserve estimates are presented on a 100 percent basis (i.e., the reserve is the total reserve for JBC) with Albemarle’s share of the reserve per the joint venture with APC is 50 percent. Units presented are metric units, unless otherwise noted and currency is expressed in United States dollars (USD or $) unless otherwise noted. Copyright of all text and other matters in this document, including the manner of presentation, is the exclusive property of RESPEC and Albemarle as per the Agreement signed between RESPEC, RPS Group (RPS), and Albemarle. RESPEC will receive a fee for preparing this TRS according to normal professional consulting practices. The fee is not contingent on the conclusions of this report and RESPEC will not receive any other benefit for preparing this report. RESPEC does not have any monetary or other interests that could be reasonably considered as capable of affecting its ability to provide an unbiased opinion in relation to the project. RESPEC is a 100 percent employee-owned global leader in integrated technology solutions for mining, energy, water, natural resources, infrastructure, and services. 2.3 Sources of Information The interpretations and conclusions presented in this report are primarily based on the information obtained from the public sources and information provided by Albemarle. All source materials have been properly cited and are referenced in Chapter 24.0 of this report. 2.4 Glossary Description of terms that are used throughout this report are provided in Table 2-1.
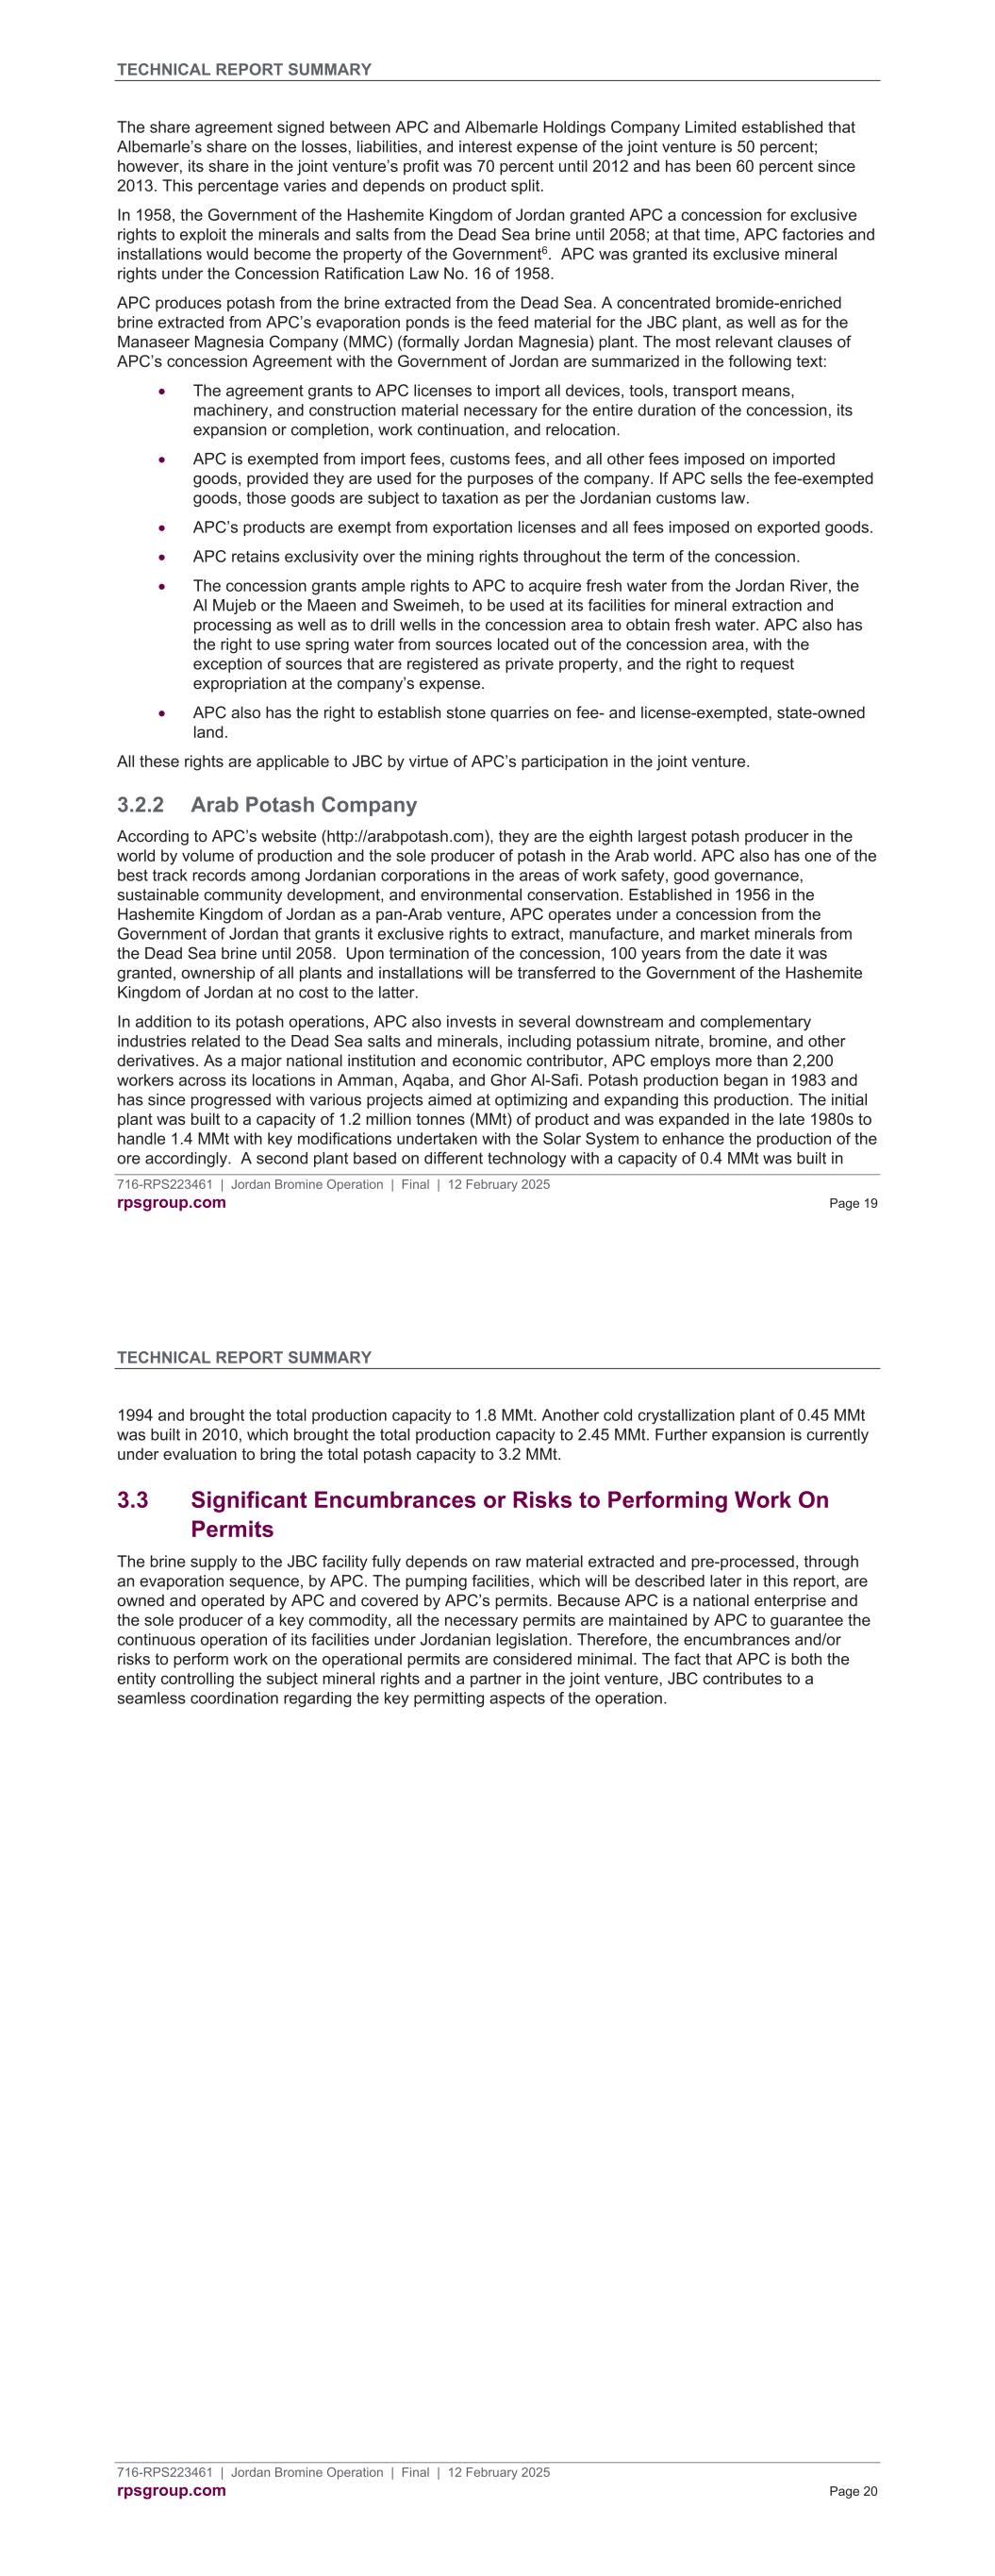
TECHNICAL REPORT SUMMARY 716-RPS223461 | Jordan Bromine Operation | Final | 12 February 2025 rpsgroup.com Page 15 Table 2-1 Glossary of Terms Term Abbreviation Description Assay A test performed to determine a sample’s chemical content. Brine A high-concentration solution of salt (NaCl) in water (H2O). Bromide Br A compound of bromine with another element or group, especially a salt containing the anion Br− or an organic compound with bromine bonded to an alkyl radical. Bromine A halogen element with atomic number 35 and element symbol Br that is the 10th most abundant element in sea water and 64th in the earth’s crust. Carnallite KCl.MgCl2 6(H2O) A mineral containing hydrated potassium and magnesium chloride. Halite NaCl Sodium chloride, which is a naturally occurring sodium salt mineral. Jordanian dinar JD Official currency of the Hashemite Kingdom of Jordan Million cubic meters MCM Million cubic meters, a measurement of volume Metric tonnes Mt Metric tonnes Million metric tonnes MMt Million metric tonnes Sylvite KCl Potassium chloride, which is a metal halide salt consisting of potassium and chlorine, also known as potash. Sylvinite A rock consisting of a mineralogical mixture of halite and sylvite crystals ± minor clay and carnallite. Potassium Oxide K2O A standard generally used to indicate/report a potash deposit ore grade. Insoluble Water-insoluble impurities (e.g., generally clay, anhydrite, dolomite, or quartz). Seismic Anomaly A structural change in the natural, uniformly bedded geology. Tetrabromobisphenol-A TBBPA A derivative of bromine and is one of the most prevalent flame retardants used in plastic paints, synthetic textiles, and electrical devices. United States dollar USD or $ Official currency of the United States of America 2.5 Personal Inspection RESPEC visited the JBC bromine processing plant in September 2023 to inspect and verify that the information provided by JBC was accurate. The visit was successful, offering valuable insights into its advanced technology, safety measures, and commitment to environmental standards. Engaging discussions with the plant's management underscored its dedication to efficiency, sustainability, and continuous improvement. This visit confirmed the plant's responsible and eco-friendly bromine production practices, contributing significantly to a comprehensive understanding of its operations. 2.6 Report Version The user of this document should ensure that this is the most recent Technical Report Summary for the project. This report is an update of a previously filed report titled “Jordan Bromine Operation. Technical Report Summary” with an effective date of December 31, 2023 and a report date of February 14, 2024. TECHNICAL REPORT SUMMARY 716-RPS223461 | Jordan Bromine Operation | Final | 12 February 2025 rpsgroup.com Page 16 3 PROPERTY DESCRIPTION JBC is in the Hashemite Kingdom of Jordan (Jordan), in the Governorate of Karak, and is located on the southeastern edge of the Dead Sea. The JBC production plant facility occupies a 33-hectare (ha) area with geographic coordinates of 31° 8’ 34.85”N and 35° 31’ 34.68”E. The JBC site, as shown in Figure 3.1, is located approximately 6 kilometers (km) north of the APC plant. JBC also has a 2-ha storage facility within the free-zone industrial area at the Port of Aqaba. The facility is used to store bulk-liquid products before export and is located near the Jordan Oil Terminals Company, which is just west of the Aqaba Thermal Power Station and east of Solvochem-Holland. The site contains storage tanks and pumps and is connected to the nearest oil port by a 1.5-km pipeline. An extensive expansion of this facility was completed in 20133. The administrative division of Jordan is shown in Figure 3.2. The country consists of 12 Governorates (i.e., Muhafazah). Control of the Dead Sea waters and minerals is shared by Jordan on the east and Israel (including the West Bank) on the west. 3.1 Jordan Land Management and Regulatory Framework Established in 1927, the Department of Lands and Surveys (DLS) is responsible for all legal property registration in Jordan. The DLS “has been established on a solid basis” according to The Land Tenure Journal, which is a peer-reviewed, open-access journal of the Climate, Energy and Tenure Division of the Food and Agriculture Organization of the United Nations4. The Jordan Valley Authority (JVA) manages various aspects of economic activity and agriculture water management on the Jordan side of the Jordan Valley. The Aqaba Special Economic Zone Authority (ASEZA) is responsible for most government-related issues in the Aqaba Region4. The ASEZA was established in 2001 by the government of Jordan to independently (financially and administratively neutral) manage and regulate the economic development of the Aqaba Special Economic Zone. A description of the ASEZA and the laws and regulations are available at its website (http://www.aqabazone.com/). The Ministry of Energy and Mineral Resources is the primary regulator of most mining activities in Jordan that provides information (e.g., studies and maps) to interested companies and investors to help facilitate exploration and extraction. These efforts promote a strong regulatory environment with international industry standard environmental and safety best practice regulations5. 3.2 Mineral Rights 3.2.1 Jordan Bromine Company and Albemarle Joint Venture JBC was established in 1999 as a joint venture between Albemarle Holdings Company Limited (a wholly owned subsidiary of Albemarle) and APC. Albemarle holds a 50 percent interest in JBC Limited. The bromide-enriched brine is a by-product of potash operations conducted by APC. JBC’s operations primarily consist of the manufacturing of bromine, from which derivative products are made including TBBPA, calcium bromide, sodium bromide, hydrobromic acid, and potassium hydroxide.
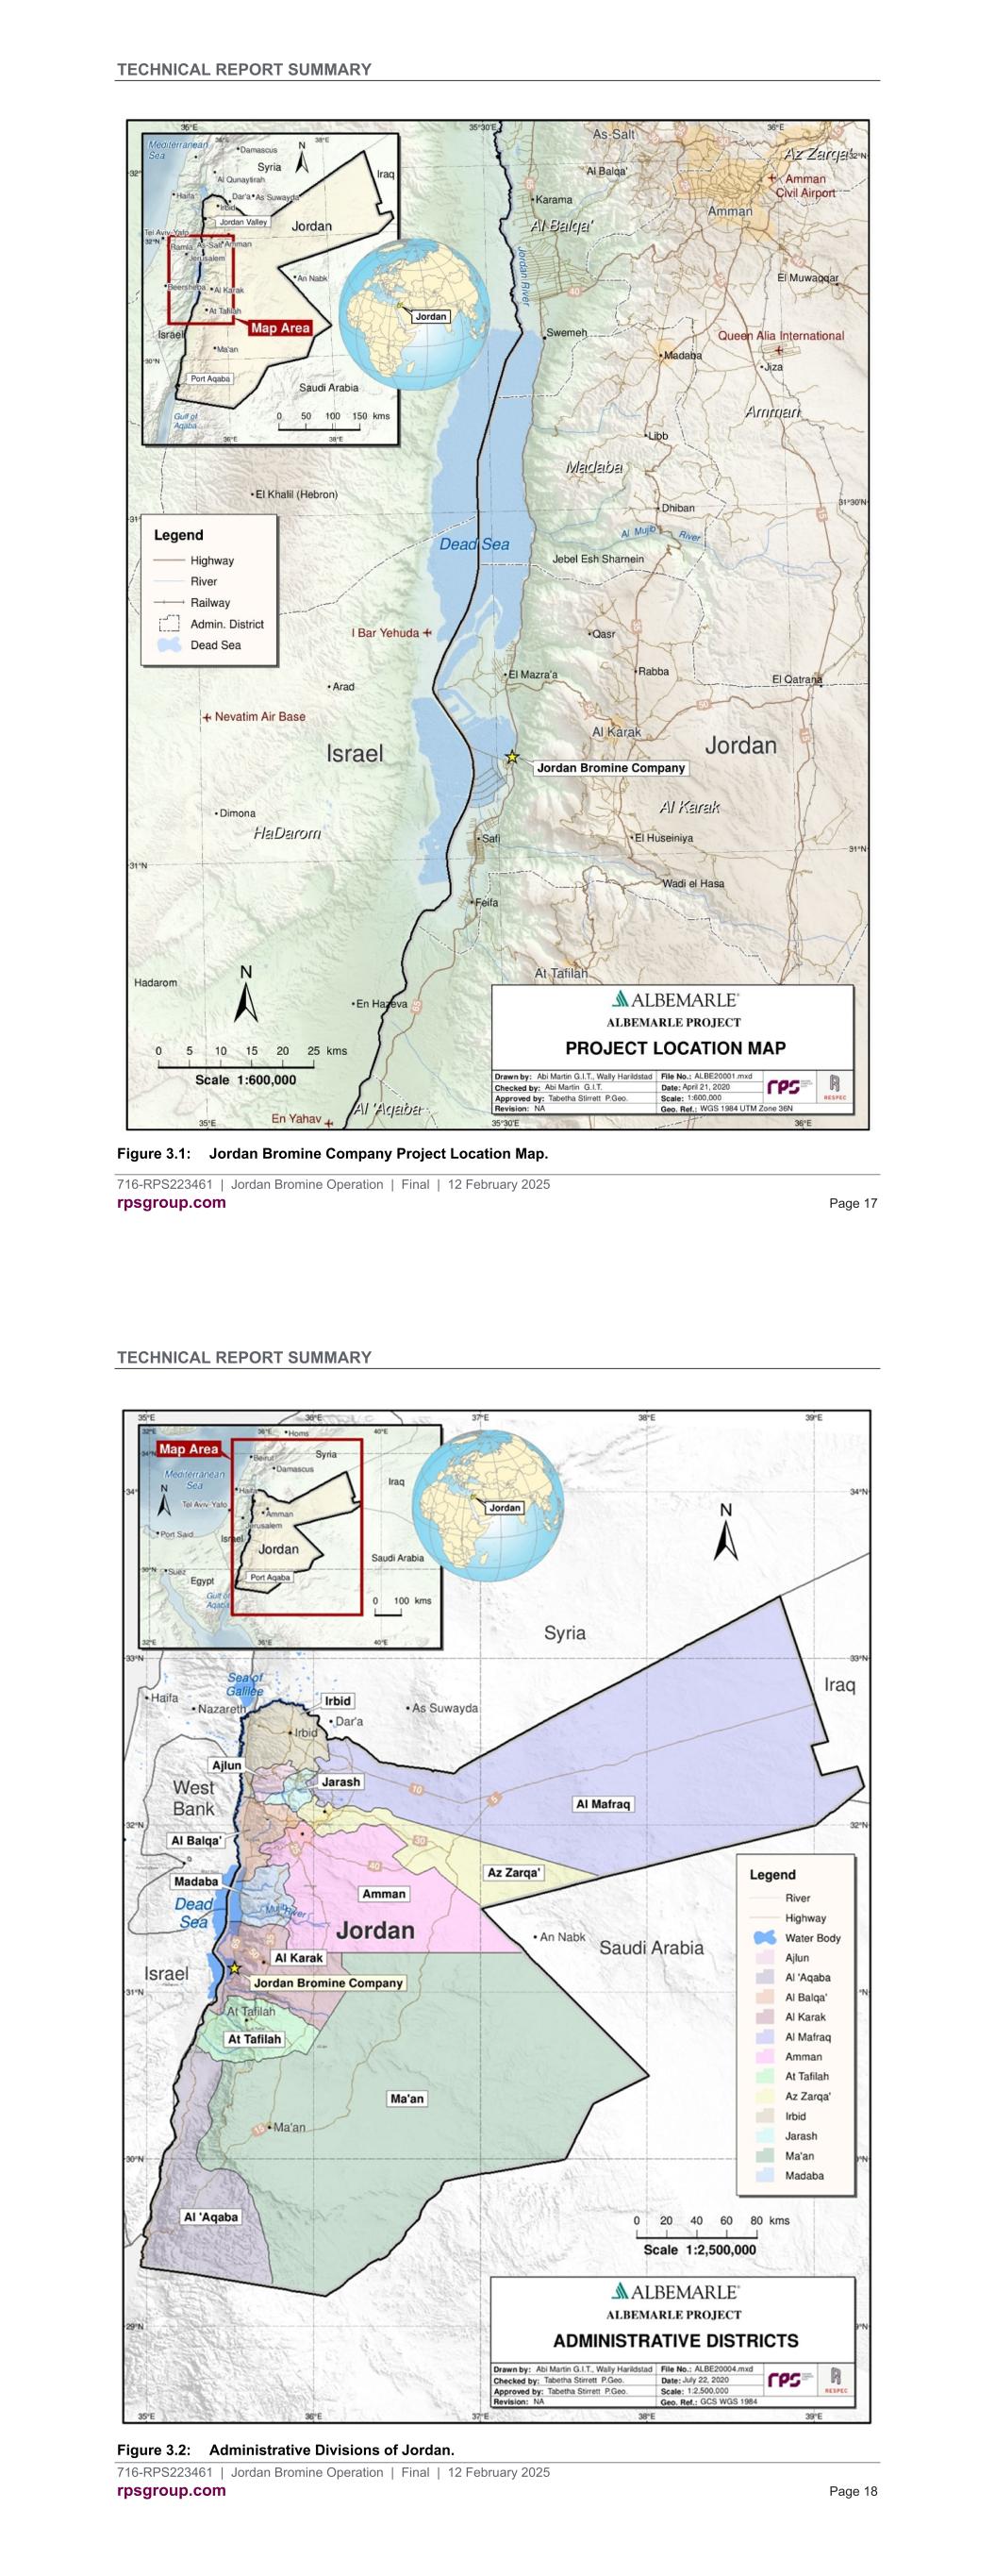
TECHNICAL REPORT SUMMARY 716-RPS223461 | Jordan Bromine Operation | Final | 12 February 2025 rpsgroup.com Page 17 Figure 3.1: Jordan Bromine Company Project Location Map. TECHNICAL REPORT SUMMARY 716-RPS223461 | Jordan Bromine Operation | Final | 12 February 2025 rpsgroup.com Page 18 Figure 3.2: Administrative Divisions of Jordan.
TECHNICAL REPORT SUMMARY 716-RPS223461 | Jordan Bromine Operation | Final | 12 February 2025 rpsgroup.com Page 19 The share agreement signed between APC and Albemarle Holdings Company Limited established that Albemarle’s share on the losses, liabilities, and interest expense of the joint venture is 50 percent; however, its share in the joint venture’s profit was 70 percent until 2012 and has been 60 percent since 2013. This percentage varies and depends on product split. In 1958, the Government of the Hashemite Kingdom of Jordan granted APC a concession for exclusive rights to exploit the minerals and salts from the Dead Sea brine until 2058; at that time, APC factories and installations would become the property of the Government6. APC was granted its exclusive mineral rights under the Concession Ratification Law No. 16 of 1958. APC produces potash from the brine extracted from the Dead Sea. A concentrated bromide-enriched brine extracted from APC’s evaporation ponds is the feed material for the JBC plant, as well as for the Manaseer Magnesia Company (MMC) (formally Jordan Magnesia) plant. The most relevant clauses of APC’s concession Agreement with the Government of Jordan are summarized in the following text: The agreement grants to APC licenses to import all devices, tools, transport means, machinery, and construction material necessary for the entire duration of the concession, its expansion or completion, work continuation, and relocation. APC is exempted from import fees, customs fees, and all other fees imposed on imported goods, provided they are used for the purposes of the company. If APC sells the fee-exempted goods, those goods are subject to taxation as per the Jordanian customs law. APC’s products are exempt from exportation licenses and all fees imposed on exported goods. APC retains exclusivity over the mining rights throughout the term of the concession. The concession grants ample rights to APC to acquire fresh water from the Jordan River, the Al Mujeb or the Maeen and Sweimeh, to be used at its facilities for mineral extraction and processing as well as to drill wells in the concession area to obtain fresh water. APC also has the right to use spring water from sources located out of the concession area, with the exception of sources that are registered as private property, and the right to request expropriation at the company’s expense. APC also has the right to establish stone quarries on fee- and license-exempted, state-owned land. All these rights are applicable to JBC by virtue of APC’s participation in the joint venture. 3.2.2 Arab Potash Company According to APC’s website (http://arabpotash.com), they are the eighth largest potash producer in the world by volume of production and the sole producer of potash in the Arab world. APC also has one of the best track records among Jordanian corporations in the areas of work safety, good governance, sustainable community development, and environmental conservation. Established in 1956 in the Hashemite Kingdom of Jordan as a pan-Arab venture, APC operates under a concession from the Government of Jordan that grants it exclusive rights to extract, manufacture, and market minerals from the Dead Sea brine until 2058. Upon termination of the concession, 100 years from the date it was granted, ownership of all plants and installations will be transferred to the Government of the Hashemite Kingdom of Jordan at no cost to the latter. In addition to its potash operations, APC also invests in several downstream and complementary industries related to the Dead Sea salts and minerals, including potassium nitrate, bromine, and other derivatives. As a major national institution and economic contributor, APC employs more than 2,200 workers across its locations in Amman, Aqaba, and Ghor Al-Safi. Potash production began in 1983 and has since progressed with various projects aimed at optimizing and expanding this production. The initial plant was built to a capacity of 1.2 million tonnes (MMt) of product and was expanded in the late 1980s to handle 1.4 MMt with key modifications undertaken with the Solar System to enhance the production of the ore accordingly. A second plant based on different technology with a capacity of 0.4 MMt was built in TECHNICAL REPORT SUMMARY 716-RPS223461 | Jordan Bromine Operation | Final | 12 February 2025 rpsgroup.com Page 20 1994 and brought the total production capacity to 1.8 MMt. Another cold crystallization plant of 0.45 MMt was built in 2010, which brought the total production capacity to 2.45 MMt. Further expansion is currently under evaluation to bring the total potash capacity to 3.2 MMt. 3.3 Significant Encumbrances or Risks to Performing Work On Permits The brine supply to the JBC facility fully depends on raw material extracted and pre-processed, through an evaporation sequence, by APC. The pumping facilities, which will be described later in this report, are owned and operated by APC and covered by APC’s permits. Because APC is a national enterprise and the sole producer of a key commodity, all the necessary permits are maintained by APC to guarantee the continuous operation of its facilities under Jordanian legislation. Therefore, the encumbrances and/or risks to perform work on the operational permits are considered minimal. The fact that APC is both the entity controlling the subject mineral rights and a partner in the joint venture, JBC contributes to a seamless coordination regarding the key permitting aspects of the operation.
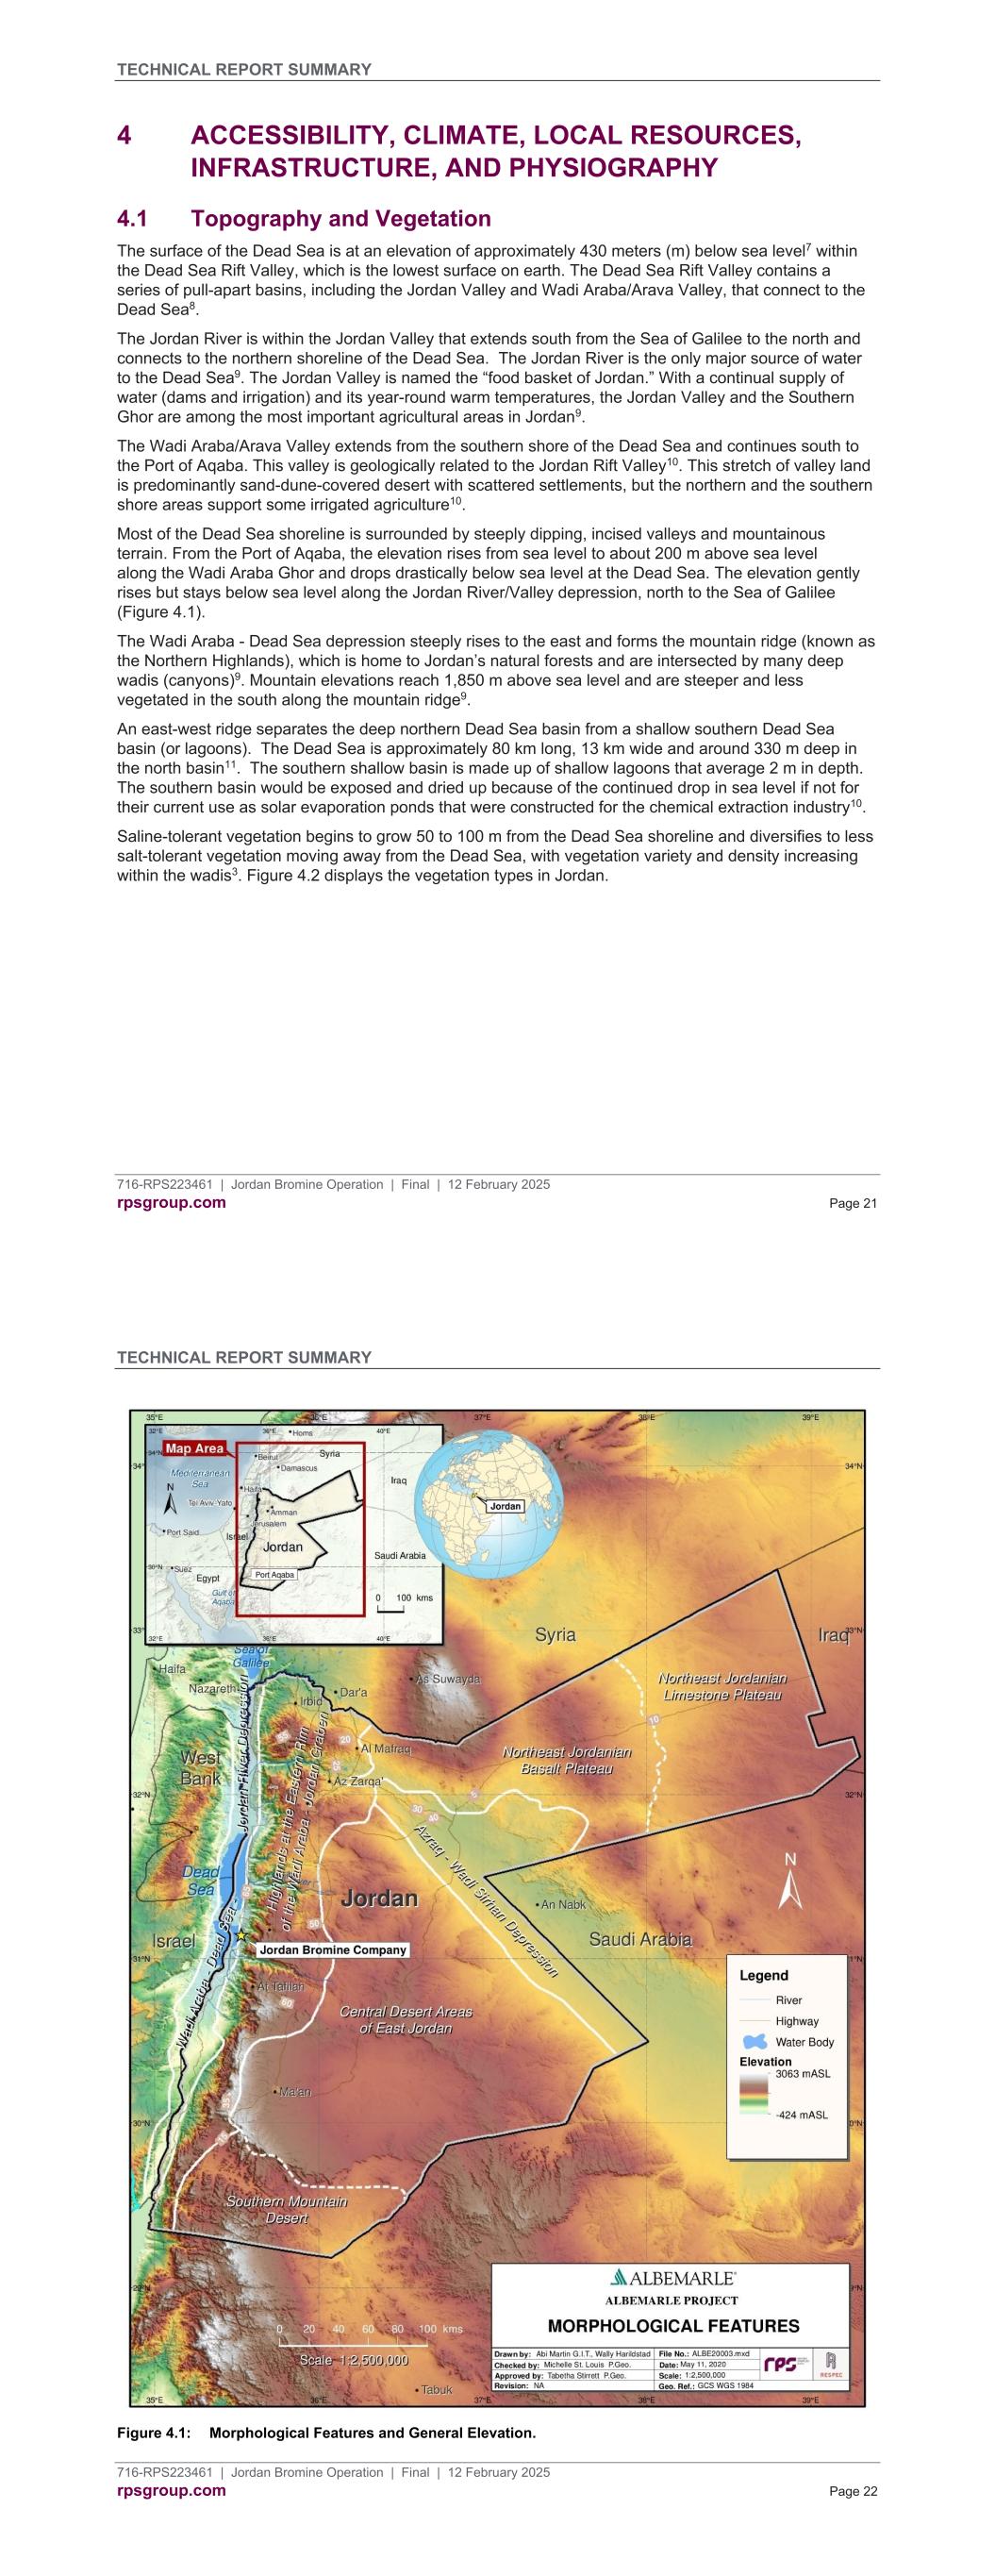
TECHNICAL REPORT SUMMARY 716-RPS223461 | Jordan Bromine Operation | Final | 12 February 2025 rpsgroup.com Page 21 4 ACCESSIBILITY, CLIMATE, LOCAL RESOURCES, INFRASTRUCTURE, AND PHYSIOGRAPHY 4.1 Topography and Vegetation The surface of the Dead Sea is at an elevation of approximately 430 meters (m) below sea level7 within the Dead Sea Rift Valley, which is the lowest surface on earth. The Dead Sea Rift Valley contains a series of pull-apart basins, including the Jordan Valley and Wadi Araba/Arava Valley, that connect to the Dead Sea8. The Jordan River is within the Jordan Valley that extends south from the Sea of Galilee to the north and connects to the northern shoreline of the Dead Sea. The Jordan River is the only major source of water to the Dead Sea9. The Jordan Valley is named the “food basket of Jordan.” With a continual supply of water (dams and irrigation) and its year-round warm temperatures, the Jordan Valley and the Southern Ghor are among the most important agricultural areas in Jordan9. The Wadi Araba/Arava Valley extends from the southern shore of the Dead Sea and continues south to the Port of Aqaba. This valley is geologically related to the Jordan Rift Valley10. This stretch of valley land is predominantly sand-dune-covered desert with scattered settlements, but the northern and the southern shore areas support some irrigated agriculture10. Most of the Dead Sea shoreline is surrounded by steeply dipping, incised valleys and mountainous terrain. From the Port of Aqaba, the elevation rises from sea level to about 200 m above sea level along the Wadi Araba Ghor and drops drastically below sea level at the Dead Sea. The elevation gently rises but stays below sea level along the Jordan River/Valley depression, north to the Sea of Galilee (Figure 4.1). The Wadi Araba - Dead Sea depression steeply rises to the east and forms the mountain ridge (known as the Northern Highlands), which is home to Jordan’s natural forests and are intersected by many deep wadis (canyons)9. Mountain elevations reach 1,850 m above sea level and are steeper and less vegetated in the south along the mountain ridge9. An east-west ridge separates the deep northern Dead Sea basin from a shallow southern Dead Sea basin (or lagoons). The Dead Sea is approximately 80 km long, 13 km wide and around 330 m deep in the north basin11. The southern shallow basin is made up of shallow lagoons that average 2 m in depth. The southern basin would be exposed and dried up because of the continued drop in sea level if not for their current use as solar evaporation ponds that were constructed for the chemical extraction industry10. Saline-tolerant vegetation begins to grow 50 to 100 m from the Dead Sea shoreline and diversifies to less salt-tolerant vegetation moving away from the Dead Sea, with vegetation variety and density increasing within the wadis3. Figure 4.2 displays the vegetation types in Jordan. TECHNICAL REPORT SUMMARY 716-RPS223461 | Jordan Bromine Operation | Final | 12 February 2025 rpsgroup.com Page 22 Figure 4.1: Morphological Features and General Elevation.
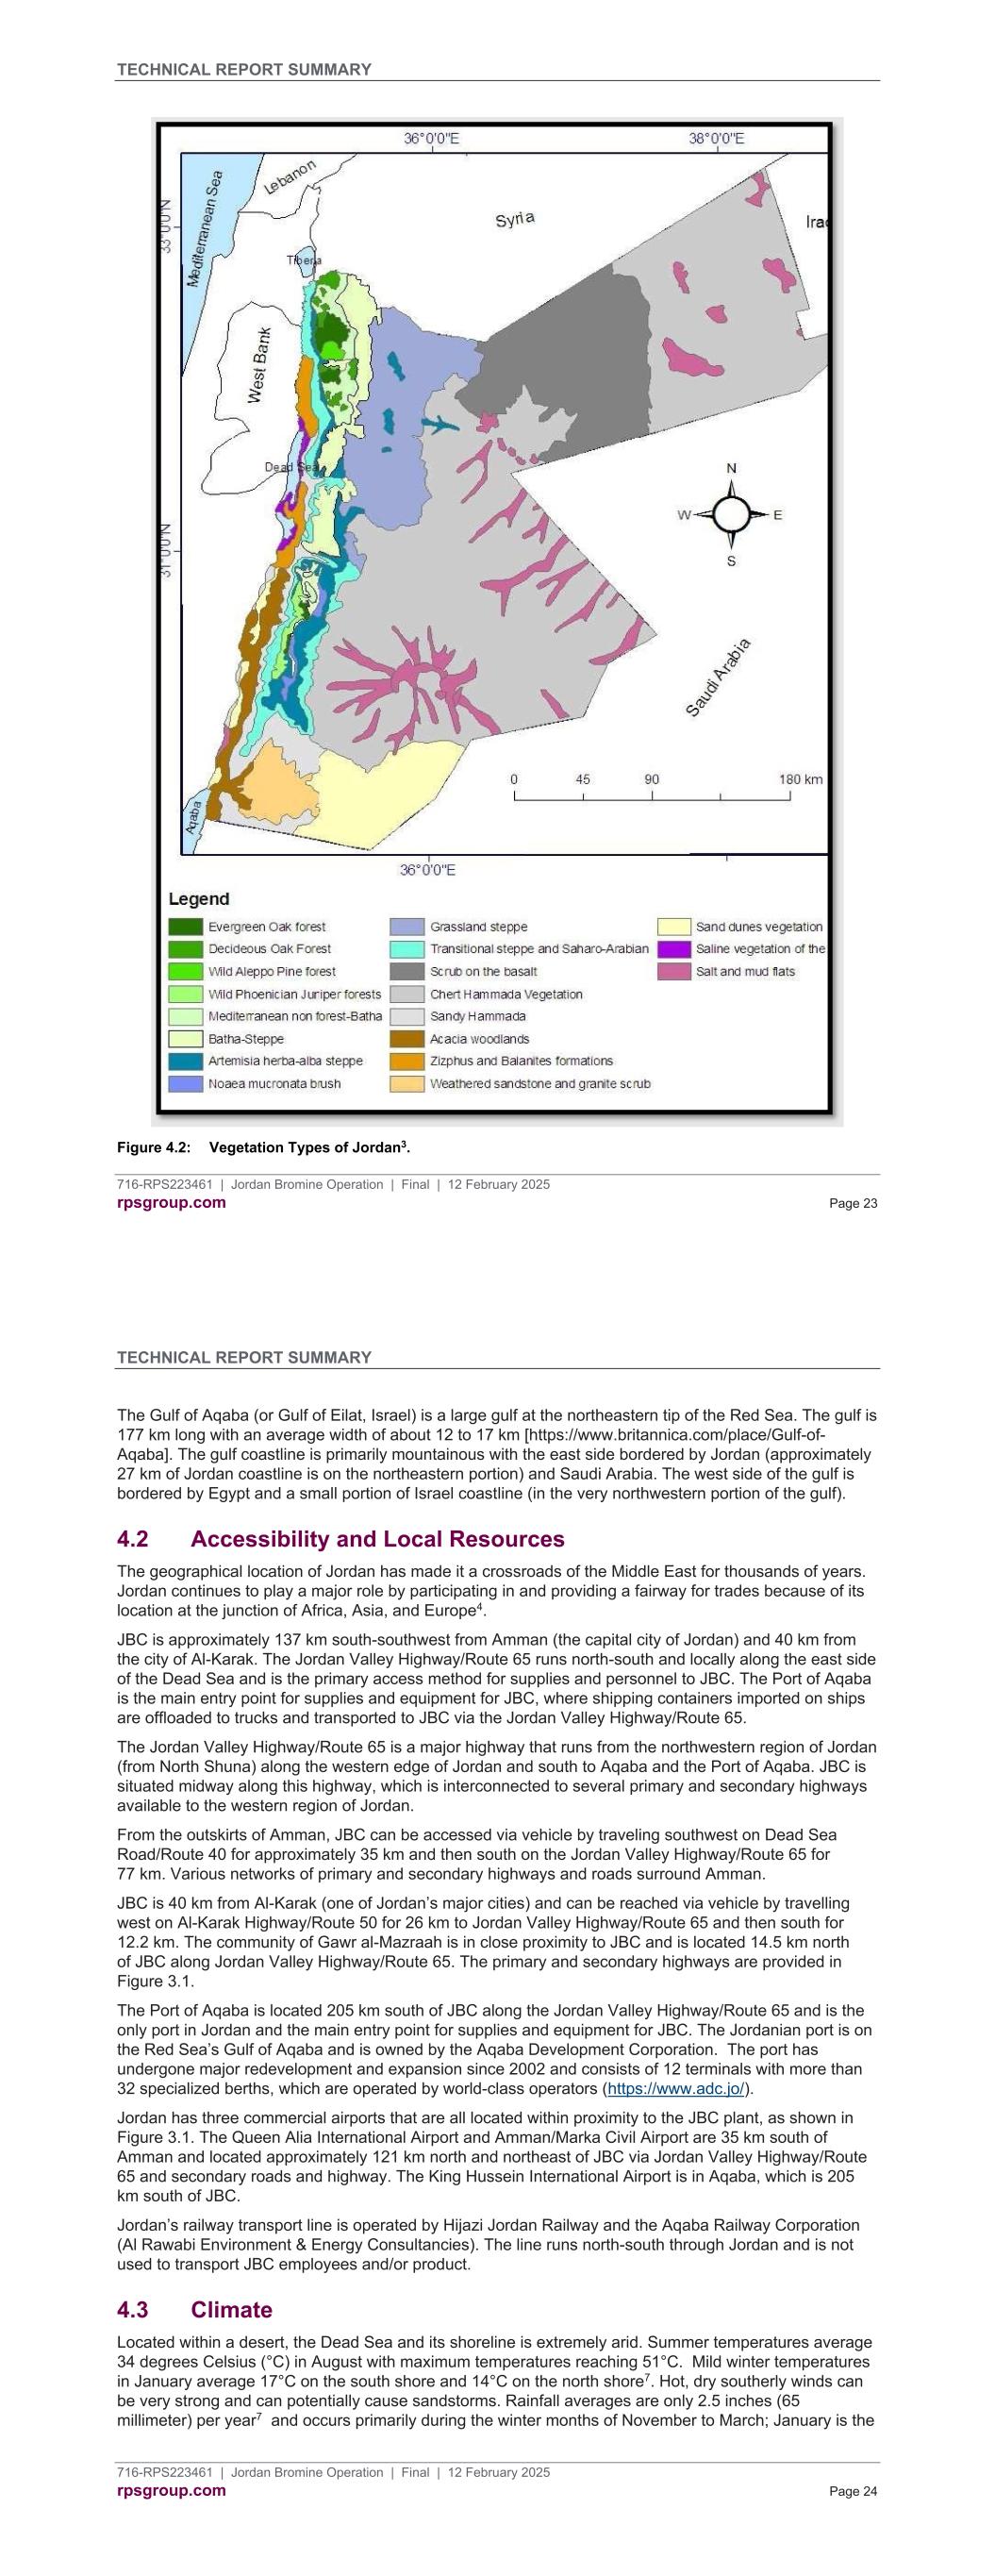
TECHNICAL REPORT SUMMARY 716-RPS223461 | Jordan Bromine Operation | Final | 12 February 2025 rpsgroup.com Page 23 Figure 4.2: Vegetation Types of Jordan3. TECHNICAL REPORT SUMMARY 716-RPS223461 | Jordan Bromine Operation | Final | 12 February 2025 rpsgroup.com Page 24 The Gulf of Aqaba (or Gulf of Eilat, Israel) is a large gulf at the northeastern tip of the Red Sea. The gulf is 177 km long with an average width of about 12 to 17 km [https://www.britannica.com/place/Gulf-of- Aqaba]. The gulf coastline is primarily mountainous with the east side bordered by Jordan (approximately 27 km of Jordan coastline is on the northeastern portion) and Saudi Arabia. The west side of the gulf is bordered by Egypt and a small portion of Israel coastline (in the very northwestern portion of the gulf). 4.2 Accessibility and Local Resources The geographical location of Jordan has made it a crossroads of the Middle East for thousands of years. Jordan continues to play a major role by participating in and providing a fairway for trades because of its location at the junction of Africa, Asia, and Europe4. JBC is approximately 137 km south-southwest from Amman (the capital city of Jordan) and 40 km from the city of Al-Karak. The Jordan Valley Highway/Route 65 runs north-south and locally along the east side of the Dead Sea and is the primary access method for supplies and personnel to JBC. The Port of Aqaba is the main entry point for supplies and equipment for JBC, where shipping containers imported on ships are offloaded to trucks and transported to JBC via the Jordan Valley Highway/Route 65. The Jordan Valley Highway/Route 65 is a major highway that runs from the northwestern region of Jordan (from North Shuna) along the western edge of Jordan and south to Aqaba and the Port of Aqaba. JBC is situated midway along this highway, which is interconnected to several primary and secondary highways available to the western region of Jordan. From the outskirts of Amman, JBC can be accessed via vehicle by traveling southwest on Dead Sea Road/Route 40 for approximately 35 km and then south on the Jordan Valley Highway/Route 65 for 77 km. Various networks of primary and secondary highways and roads surround Amman. JBC is 40 km from Al-Karak (one of Jordan’s major cities) and can be reached via vehicle by travelling west on Al-Karak Highway/Route 50 for 26 km to Jordan Valley Highway/Route 65 and then south for 12.2 km. The community of Gawr al-Mazraah is in close proximity to JBC and is located 14.5 km north of JBC along Jordan Valley Highway/Route 65. The primary and secondary highways are provided in Figure 3.1. The Port of Aqaba is located 205 km south of JBC along the Jordan Valley Highway/Route 65 and is the only port in Jordan and the main entry point for supplies and equipment for JBC. The Jordanian port is on the Red Sea’s Gulf of Aqaba and is owned by the Aqaba Development Corporation. The port has undergone major redevelopment and expansion since 2002 and consists of 12 terminals with more than 32 specialized berths, which are operated by world-class operators (https://www.adc.jo/). Jordan has three commercial airports that are all located within proximity to the JBC plant, as shown in Figure 3.1. The Queen Alia International Airport and Amman/Marka Civil Airport are 35 km south of Amman and located approximately 121 km north and northeast of JBC via Jordan Valley Highway/Route 65 and secondary roads and highway. The King Hussein International Airport is in Aqaba, which is 205 km south of JBC. Jordan’s railway transport line is operated by Hijazi Jordan Railway and the Aqaba Railway Corporation (Al Rawabi Environment & Energy Consultancies). The line runs north-south through Jordan and is not used to transport JBC employees and/or product. 4.3 Climate Located within a desert, the Dead Sea and its shoreline is extremely arid. Summer temperatures average 34 degrees Celsius (°C) in August with maximum temperatures reaching 51°C. Mild winter temperatures in January average 17°C on the south shore and 14°C on the north shore7. Hot, dry southerly winds can be very strong and can potentially cause sandstorms. Rainfall averages are only 2.5 inches (65 millimeter) per year7 and occurs primarily during the winter months of November to March; January is the
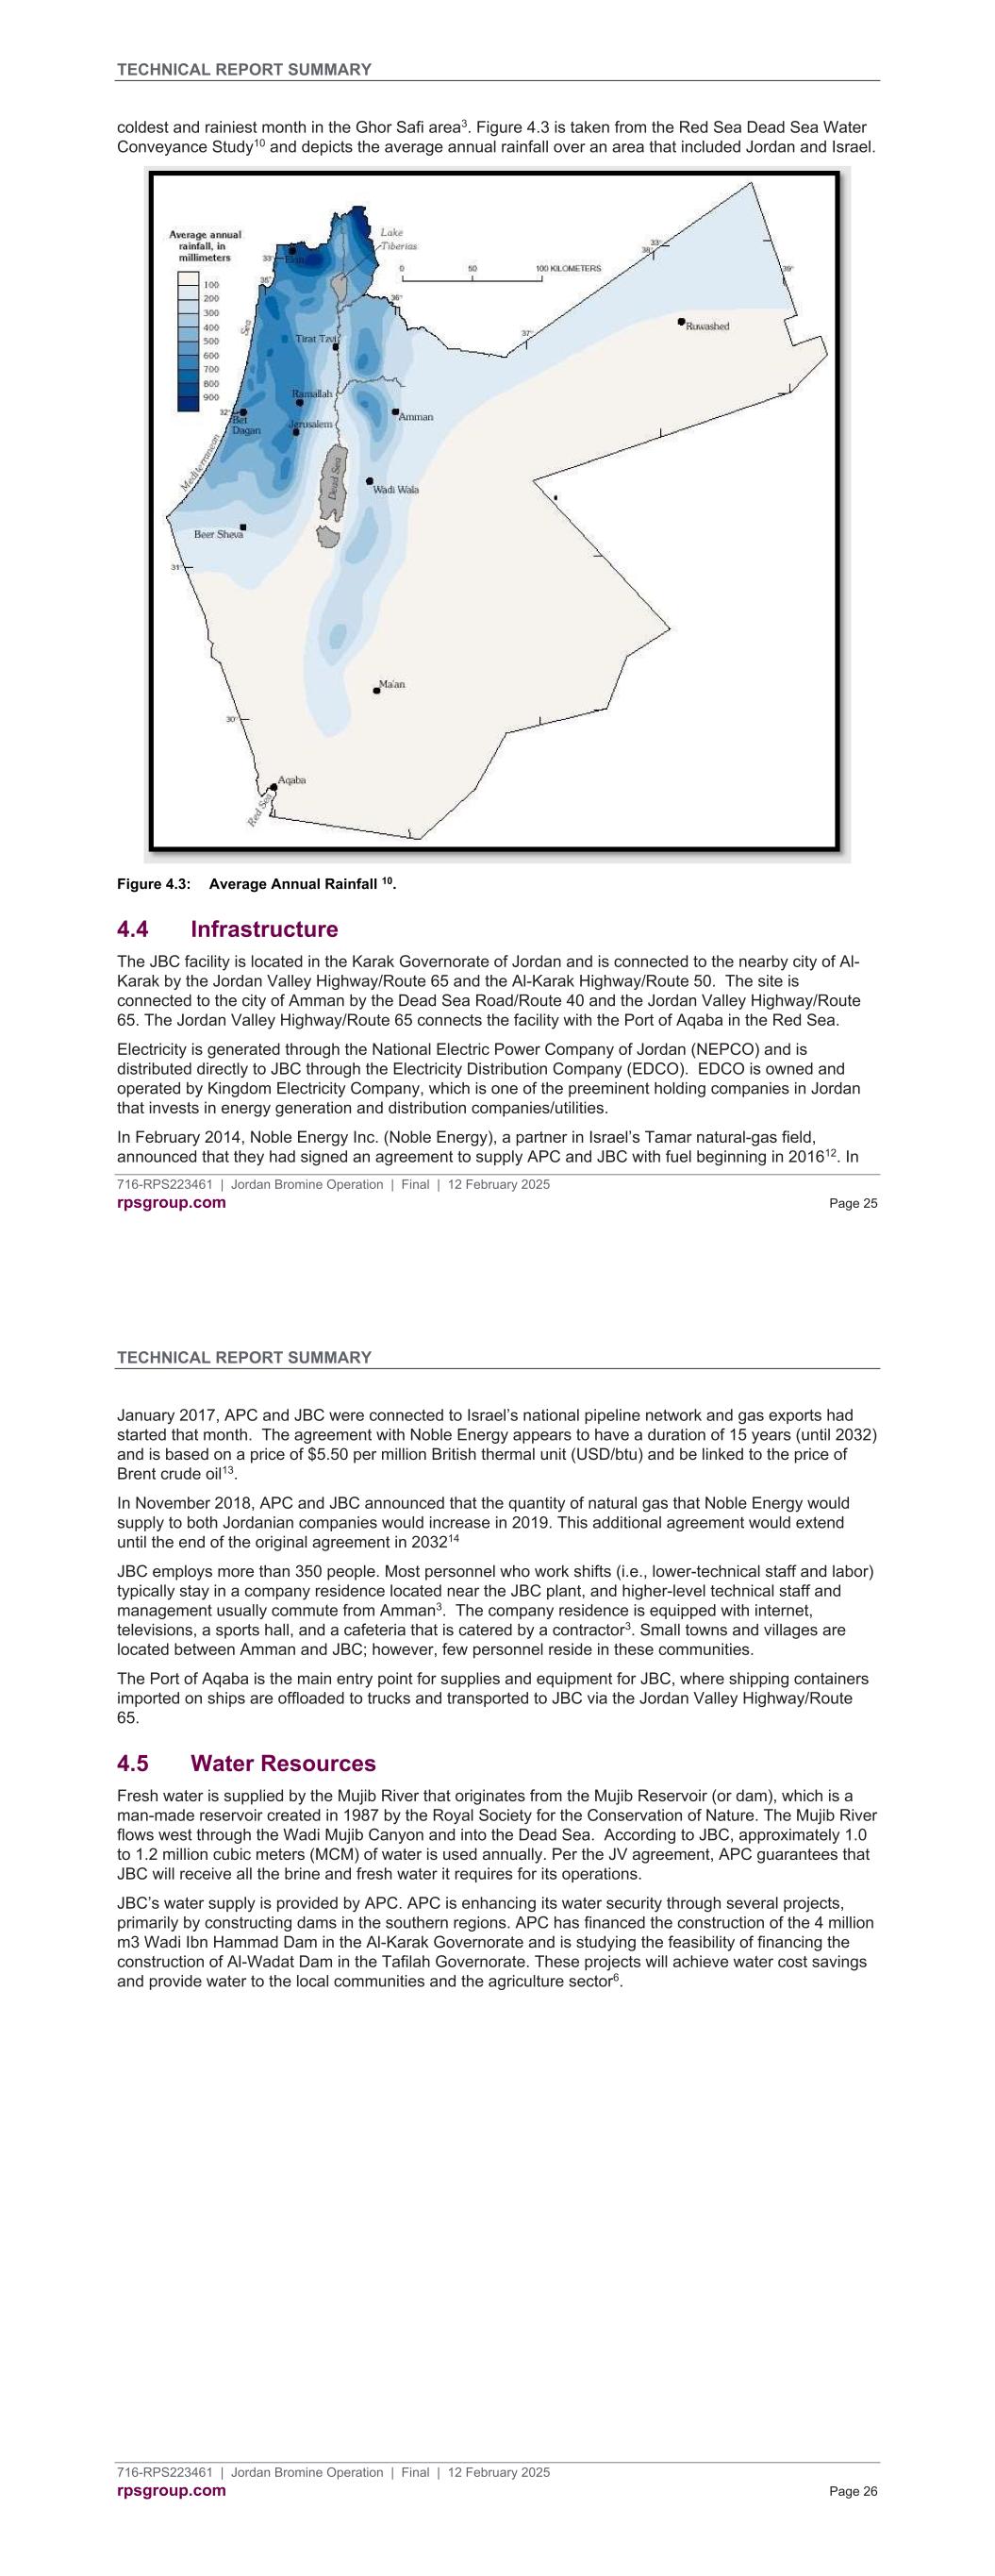
TECHNICAL REPORT SUMMARY 716-RPS223461 | Jordan Bromine Operation | Final | 12 February 2025 rpsgroup.com Page 25 coldest and rainiest month in the Ghor Safi area3. Figure 4.3 is taken from the Red Sea Dead Sea Water Conveyance Study10 and depicts the average annual rainfall over an area that included Jordan and Israel. Figure 4.3: Average Annual Rainfall 10. 4.4 Infrastructure The JBC facility is located in the Karak Governorate of Jordan and is connected to the nearby city of Al- Karak by the Jordan Valley Highway/Route 65 and the Al-Karak Highway/Route 50. The site is connected to the city of Amman by the Dead Sea Road/Route 40 and the Jordan Valley Highway/Route 65. The Jordan Valley Highway/Route 65 connects the facility with the Port of Aqaba in the Red Sea. Electricity is generated through the National Electric Power Company of Jordan (NEPCO) and is distributed directly to JBC through the Electricity Distribution Company (EDCO). EDCO is owned and operated by Kingdom Electricity Company, which is one of the preeminent holding companies in Jordan that invests in energy generation and distribution companies/utilities. In February 2014, Noble Energy Inc. (Noble Energy), a partner in Israel’s Tamar natural-gas field, announced that they had signed an agreement to supply APC and JBC with fuel beginning in 201612. In TECHNICAL REPORT SUMMARY 716-RPS223461 | Jordan Bromine Operation | Final | 12 February 2025 rpsgroup.com Page 26 January 2017, APC and JBC were connected to Israel’s national pipeline network and gas exports had started that month. The agreement with Noble Energy appears to have a duration of 15 years (until 2032) and is based on a price of $5.50 per million British thermal unit (USD/btu) and be linked to the price of Brent crude oil13. In November 2018, APC and JBC announced that the quantity of natural gas that Noble Energy would supply to both Jordanian companies would increase in 2019. This additional agreement would extend until the end of the original agreement in 203214 JBC employs more than 350 people. Most personnel who work shifts (i.e., lower-technical staff and labor) typically stay in a company residence located near the JBC plant, and higher-level technical staff and management usually commute from Amman3. The company residence is equipped with internet, televisions, a sports hall, and a cafeteria that is catered by a contractor3. Small towns and villages are located between Amman and JBC; however, few personnel reside in these communities. The Port of Aqaba is the main entry point for supplies and equipment for JBC, where shipping containers imported on ships are offloaded to trucks and transported to JBC via the Jordan Valley Highway/Route 65. 4.5 Water Resources Fresh water is supplied by the Mujib River that originates from the Mujib Reservoir (or dam), which is a man-made reservoir created in 1987 by the Royal Society for the Conservation of Nature. The Mujib River flows west through the Wadi Mujib Canyon and into the Dead Sea. According to JBC, approximately 1.0 to 1.2 million cubic meters (MCM) of water is used annually. Per the JV agreement, APC guarantees that JBC will receive all the brine and fresh water it requires for its operations. JBC’s water supply is provided by APC. APC is enhancing its water security through several projects, primarily by constructing dams in the southern regions. APC has financed the construction of the 4 million m3 Wadi Ibn Hammad Dam in the Al-Karak Governorate and is studying the feasibility of financing the construction of Al-Wadat Dam in the Tafilah Governorate. These projects will achieve water cost savings and provide water to the local communities and the agriculture sector6.
TECHNICAL REPORT SUMMARY 716-RPS223461 | Jordan Bromine Operation | Final | 12 February 2025 rpsgroup.com Page 27 5 HISTORY JBC is Jordan’s first and only producer and manufacturer of bromine and bromine derivatives and was established in January 1999. JBC is registered as a private Free Zone Establishment in Safi, located in the southeastern area of the Dead Sea, Jordan, and is the first Jordanian company to become certified in the International Maritime Dangerous Goods (IMDG) Code, the Agreement concerning the International Carriage of Dangerous Goods by Road (ADR), and the International Air Transport Association (IATA). JBC has successfully established sales in more than 30 countries worldwide since its inception and is the first company of its kind in Jordan to become an authorized exporter to Europe. The following timeline is the history of the development of JBC joint venture and is summarized from the Albemarle Website. 1999: Albemarle forms a joint venture with Jordan Dead Sea Industries Company (JODICO) and APC to manufacture bromine and bromine derivatives in a world-scale complex to be built in Jordan. 2000: JBC is registered as a private Free Zone Establishment in Safi in southeast Jordan in June. 2002: The JBC bromine plant begins operation. 2003: Hydrogen bromide (HBr) and calcium bromide (CaBr)/sodium bromide (NaBr) plants begin operating. JBC also becomes an authorized exporter to Europe of bromine and bromine derivatives. 2005: JBC receives IMDG, ADR, and IATA certifications. The chlorine plant begins operations. 2011: JBC announces that it will double the capacity of its bromine production to meet expanding global customer requirements. 2013: JBC completes the first phase of its expansion to double its bromine production capacity. 2017: The expansion of JBC’s TBBPA facilities goes into operation. TECHNICAL REPORT SUMMARY 716-RPS223461 | Jordan Bromine Operation | Final | 12 February 2025 rpsgroup.com Page 28 6 GEOLOGICAL SETTING, MINERALIZATION, AND DEPOSIT 6.1 Regional Geology The Dead Sea Basin, as shown in Figure 6.1, is a tectonically subsiding, strike-slip depression that belongs to the Aqaba-Dead Sea-Jordan Valley rift that formed between the African and Arabian diverging tectonic plates (an active plate boundary) and connected the Red Sea to Turkey15. The Dead Sea depression is a result of the transform faulting between the plates; the Western Boundary fault and the Arava fault are drawn on Figure 6.21. The Dead Sea is a hypersaline lake within the lowest part of the catchment basin and is a unique, current-day example of evaporitic sedimentation and accumulation within a brine body1. Movement of the plates that created the basin began 15 million years ago (Ma) and the plates continue to diverge at a current rate of 5 to 10 mm per year1. Holocene and Miocene sediments comprise approximately 8 to 10 km of the basin fill that underlies the Dead Sea1. The Mediterranean Sea water is believed to have invaded the trough depression around 4 to 6 Ma and deposited 2 to 3 km of halite-rich evaporites of the Sedom Formation1. These evaporites form diapirs and subcrops along the Western Margin faults1 within the basin. Mount Sedom is an exposed salt diapir at the southwest corner of the Dead Sea. Fluviatile and lacustrine sediments of the Amora and Lisan Formations comprise 3 to 4 km of sediments that overlie the Sedom Formation and underlie the Dead Sea deposits, as shown in Figure 6.21. Figure 6.3 provides a simple schematic of the structural features for the Dead Sea area. The JBC Environmental Impact Assessment Report, 2012 includes a figure drawn by Powell [1988]16 that illustrates the generalized geological map of the JBC area and is provided in Figure 6.4. 6.2 Local Geology The Dead Sea is not only the lowest surface on earth but is also the saltiest natural lake on earth with an average salinity of 342 grams per kilogram (g/kg) as of 2011, which is 9.6 times as salty as the ocean17. The climate, geology, and location provide a setting that makes the Dead Sea a valuable large-scale natural resource for potash and bromine. When the Dead Sea was first formed, the volume was likely 4 to 5 times larger than the current volume2. Today, the Dead Sea waterbody has an estimated surface area of 569 square kilometers (km2) and a brine volume of 106 cubic kilometers (km3)1. Warren [2006]1 explains that the northern basin is the only permanent body of water (See Figure 6.1, Physiological Features Map). The southern basin is a saline pan and saline mudflat that would have been subaerially exposed, but the water level is maintained by artificial flooding with north basin brine and controlled evaporation for industrial salt extraction on the Israeli and Jordanian sides of the Dead Sea. Warren [2006]1 draws the various depositional settings and general geology surrounding the Dead Sea, including the saline mudflats and pans at the southern end of the sea, as depicted in Figure 6.5. Evaporation greatly exceeds the inflow of water to the Dead Sea, especially since the mid-twentieth century, because of increased diversion and damming of the Jordan River for agricultural and domestic use. The Dead Sea has been receding approximately 1.1 to 1.25 m per year1. Warren [2006]1 described that in 400 years (from 2006), the Dead Sea will drop 80 m below its current sea level and the remaining brine will have approximately 380 grams per liter (g/L) of dissolved solids and a density of 1.27 kilograms per liter (kg/L). Simply, these rates suggest that the surface of the Dead Sea will drop approximately 1 m and, depending on the slope, the shoreline could travel 5 to 6.25m seaward over a span of 5 years. While action on falling sea level may be considered a risk to the rights of access to the resources and ultimately reserves, this is not considered likely to be a problem prior to expiry of the lease agreement in 2058.
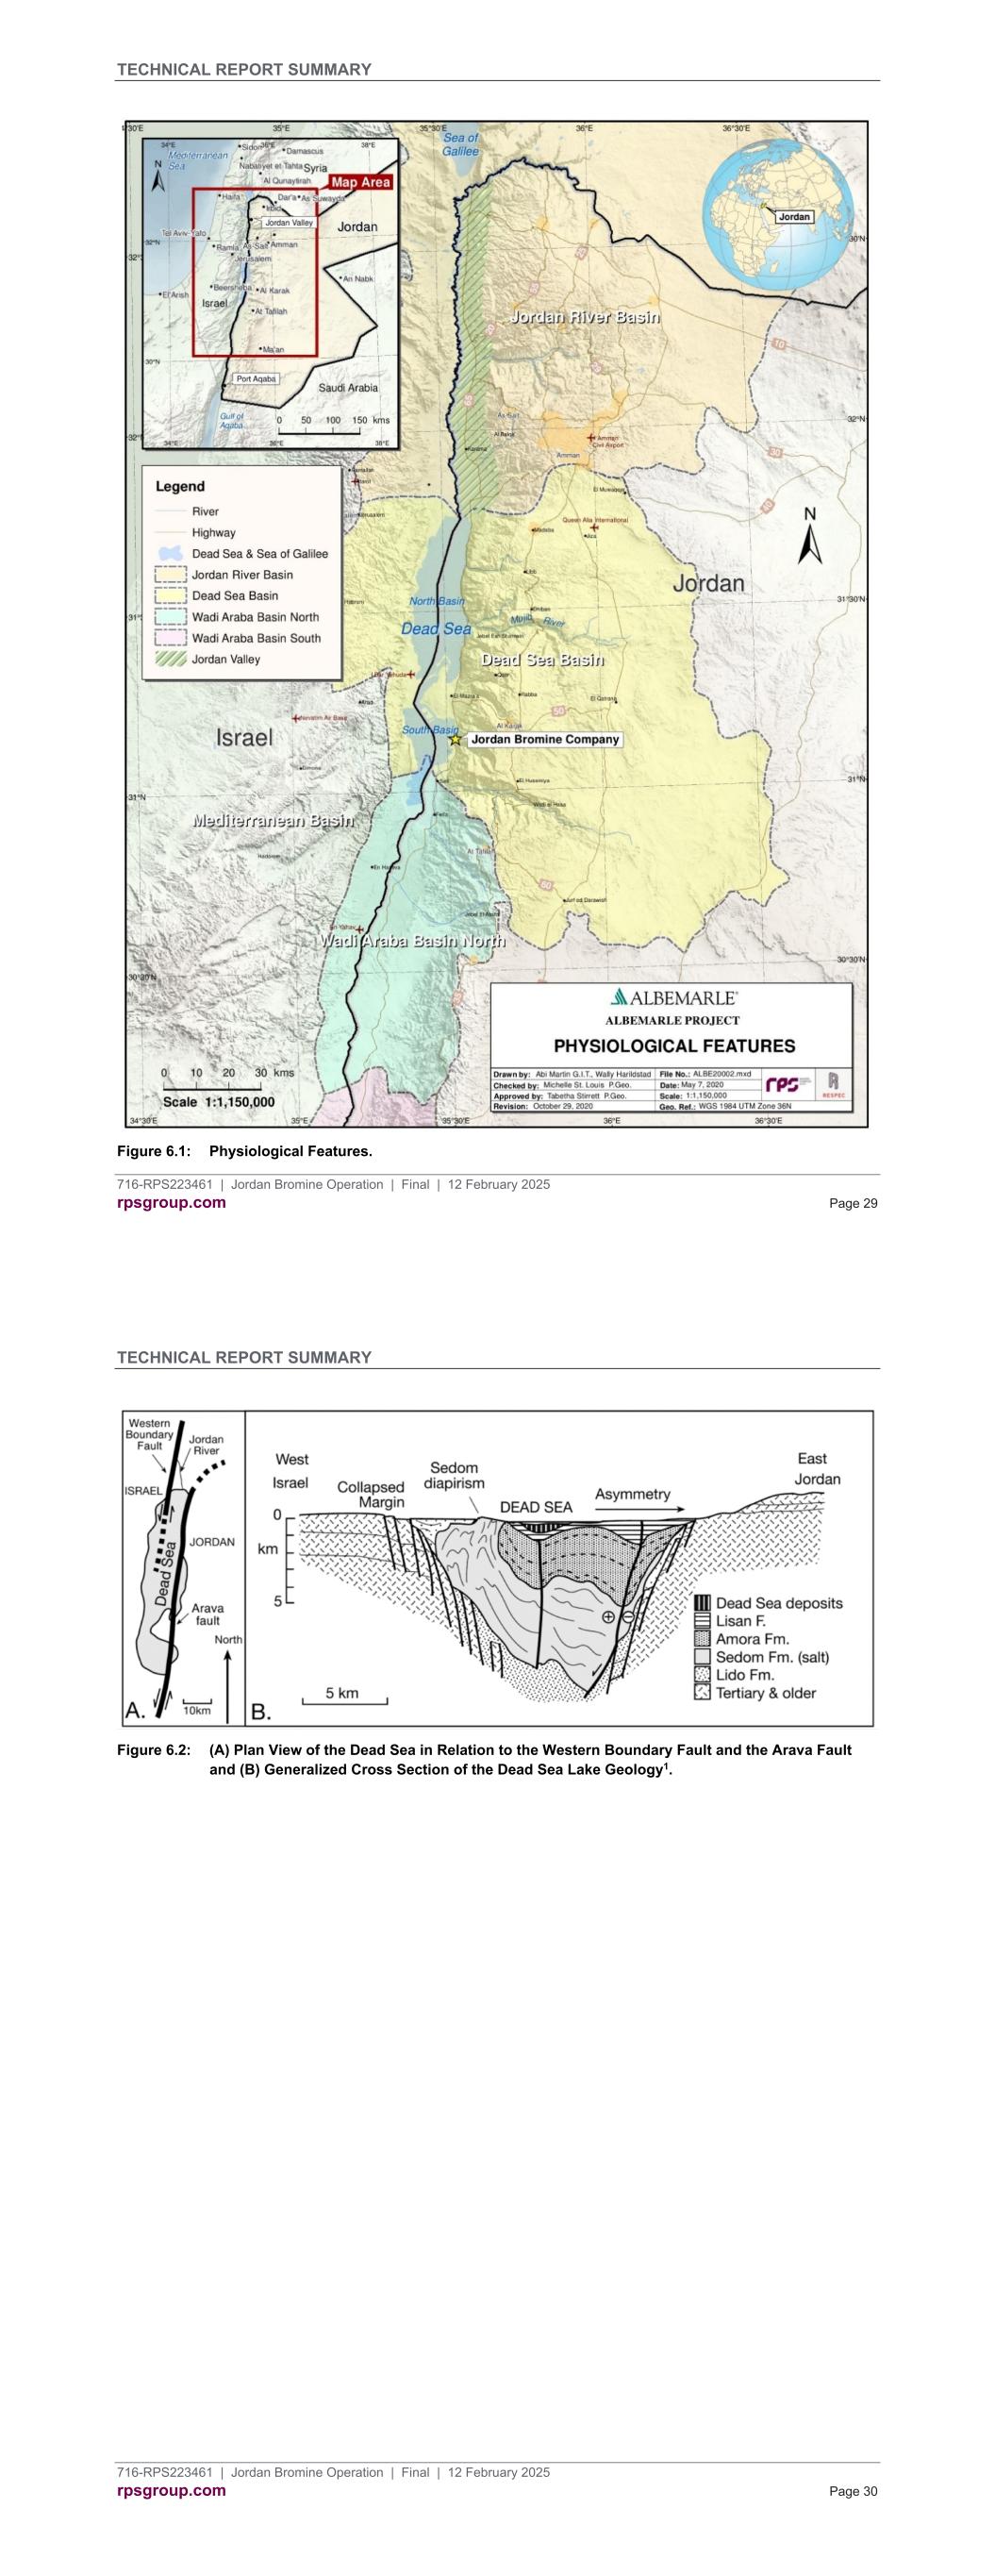
TECHNICAL REPORT SUMMARY 716-RPS223461 | Jordan Bromine Operation | Final | 12 February 2025 rpsgroup.com Page 29 Figure 6.1: Physiological Features. TECHNICAL REPORT SUMMARY 716-RPS223461 | Jordan Bromine Operation | Final | 12 February 2025 rpsgroup.com Page 30 Figure 6.2: (A) Plan View of the Dead Sea in Relation to the Western Boundary Fault and the Arava Fault and (B) Generalized Cross Section of the Dead Sea Lake Geology1.

TECHNICAL REPORT SUMMARY 716-RPS223461 | Jordan Bromine Operation | Final | 12 February 2025 rpsgroup.com Page 31 Figure 6.3: Main Regional Faults in the Area 18. TECHNICAL REPORT SUMMARY 716-RPS223461 | Jordan Bromine Operation | Final | 12 February 2025 rpsgroup.com Page 32 Figure 6.4: Map of the Jordan Bromine Company Area and Its Generalized Geology, Including Faults 10,17. The sea level generally rises slightly in winter by unpredictable, brief runoff and sudden flood events1. As the sea level continues to decrease, the brine/freshwater interface within the surrounding groundwater moves toward the sea19. The infiltration of less saline groundwater is causing the dissolution of localized rock salt in the ground, thus causing an increased occurrence of sinkholes. The Dead Sea level is expected to continue decreasing with the ongoing demand for fresh water within the area19. Chemical
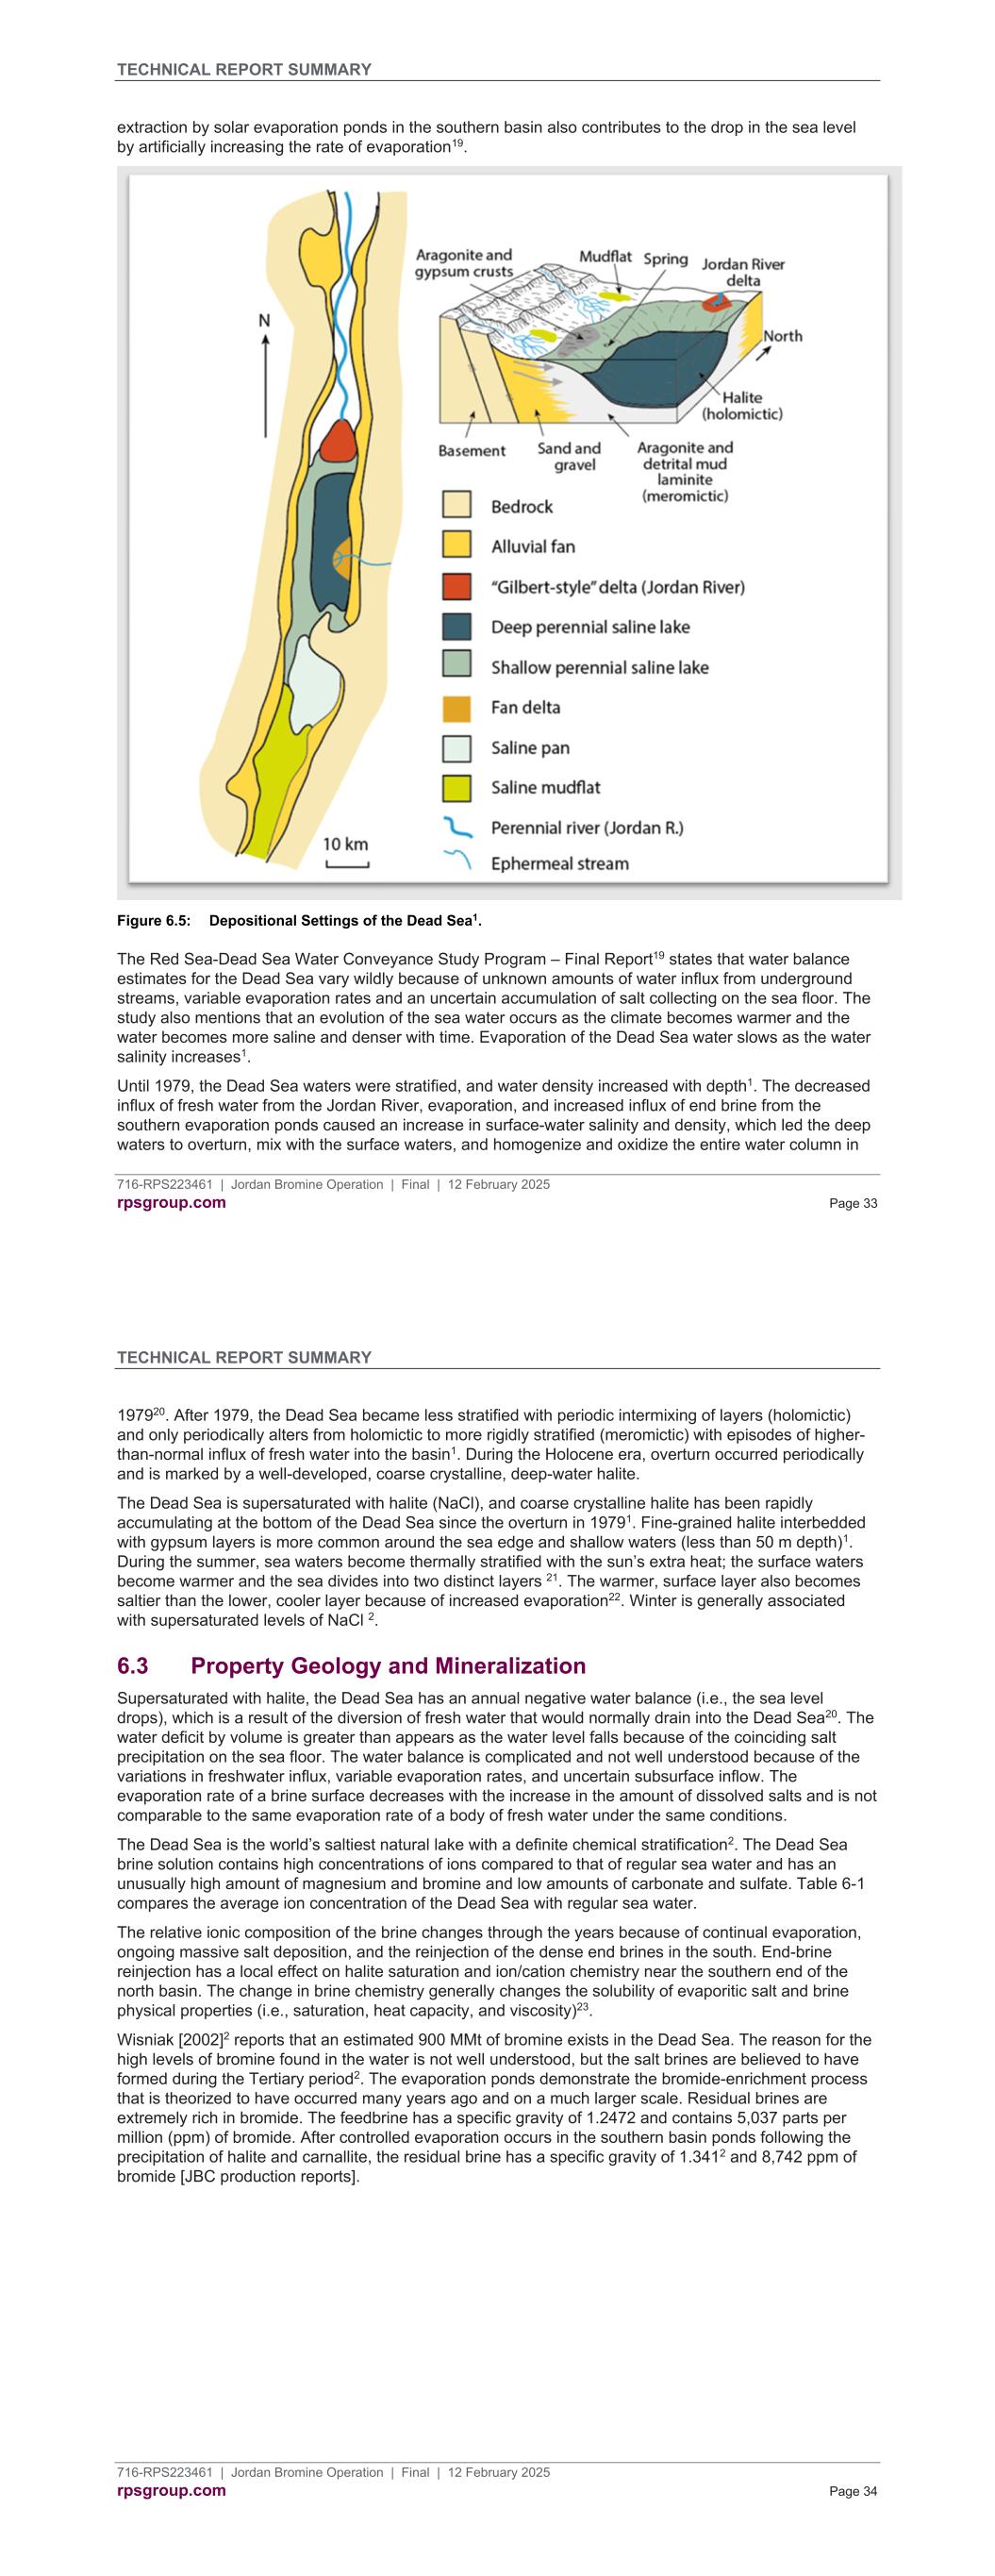
TECHNICAL REPORT SUMMARY 716-RPS223461 | Jordan Bromine Operation | Final | 12 February 2025 rpsgroup.com Page 33 extraction by solar evaporation ponds in the southern basin also contributes to the drop in the sea level by artificially increasing the rate of evaporation19. Figure 6.5: Depositional Settings of the Dead Sea1. The Red Sea-Dead Sea Water Conveyance Study Program – Final Report19 states that water balance estimates for the Dead Sea vary wildly because of unknown amounts of water influx from underground streams, variable evaporation rates and an uncertain accumulation of salt collecting on the sea floor. The study also mentions that an evolution of the sea water occurs as the climate becomes warmer and the water becomes more saline and denser with time. Evaporation of the Dead Sea water slows as the water salinity increases1. Until 1979, the Dead Sea waters were stratified, and water density increased with depth1. The decreased influx of fresh water from the Jordan River, evaporation, and increased influx of end brine from the southern evaporation ponds caused an increase in surface-water salinity and density, which led the deep waters to overturn, mix with the surface waters, and homogenize and oxidize the entire water column in TECHNICAL REPORT SUMMARY 716-RPS223461 | Jordan Bromine Operation | Final | 12 February 2025 rpsgroup.com Page 34 197920. After 1979, the Dead Sea became less stratified with periodic intermixing of layers (holomictic) and only periodically alters from holomictic to more rigidly stratified (meromictic) with episodes of higher- than-normal influx of fresh water into the basin1. During the Holocene era, overturn occurred periodically and is marked by a well-developed, coarse crystalline, deep-water halite. The Dead Sea is supersaturated with halite (NaCl), and coarse crystalline halite has been rapidly accumulating at the bottom of the Dead Sea since the overturn in 19791. Fine-grained halite interbedded with gypsum layers is more common around the sea edge and shallow waters (less than 50 m depth)1. During the summer, sea waters become thermally stratified with the sun’s extra heat; the surface waters become warmer and the sea divides into two distinct layers 21. The warmer, surface layer also becomes saltier than the lower, cooler layer because of increased evaporation22. Winter is generally associated with supersaturated levels of NaCl 2. 6.3 Property Geology and Mineralization Supersaturated with halite, the Dead Sea has an annual negative water balance (i.e., the sea level drops), which is a result of the diversion of fresh water that would normally drain into the Dead Sea20. The water deficit by volume is greater than appears as the water level falls because of the coinciding salt precipitation on the sea floor. The water balance is complicated and not well understood because of the variations in freshwater influx, variable evaporation rates, and uncertain subsurface inflow. The evaporation rate of a brine surface decreases with the increase in the amount of dissolved salts and is not comparable to the same evaporation rate of a body of fresh water under the same conditions. The Dead Sea is the world’s saltiest natural lake with a definite chemical stratification2. The Dead Sea brine solution contains high concentrations of ions compared to that of regular sea water and has an unusually high amount of magnesium and bromine and low amounts of carbonate and sulfate. Table 6-1 compares the average ion concentration of the Dead Sea with regular sea water. The relative ionic composition of the brine changes through the years because of continual evaporation, ongoing massive salt deposition, and the reinjection of the dense end brines in the south. End-brine reinjection has a local effect on halite saturation and ion/cation chemistry near the southern end of the north basin. The change in brine chemistry generally changes the solubility of evaporitic salt and brine physical properties (i.e., saturation, heat capacity, and viscosity)23. Wisniak [2002]2 reports that an estimated 900 MMt of bromine exists in the Dead Sea. The reason for the high levels of bromine found in the water is not well understood, but the salt brines are believed to have formed during the Tertiary period2. The evaporation ponds demonstrate the bromide-enrichment process that is theorized to have occurred many years ago and on a much larger scale. Residual brines are extremely rich in bromide. The feedbrine has a specific gravity of 1.2472 and contains 5,037 parts per million (ppm) of bromide. After controlled evaporation occurs in the southern basin ponds following the precipitation of halite and carnallite, the residual brine has a specific gravity of 1.3412 and 8,742 ppm of bromide [JBC production reports].
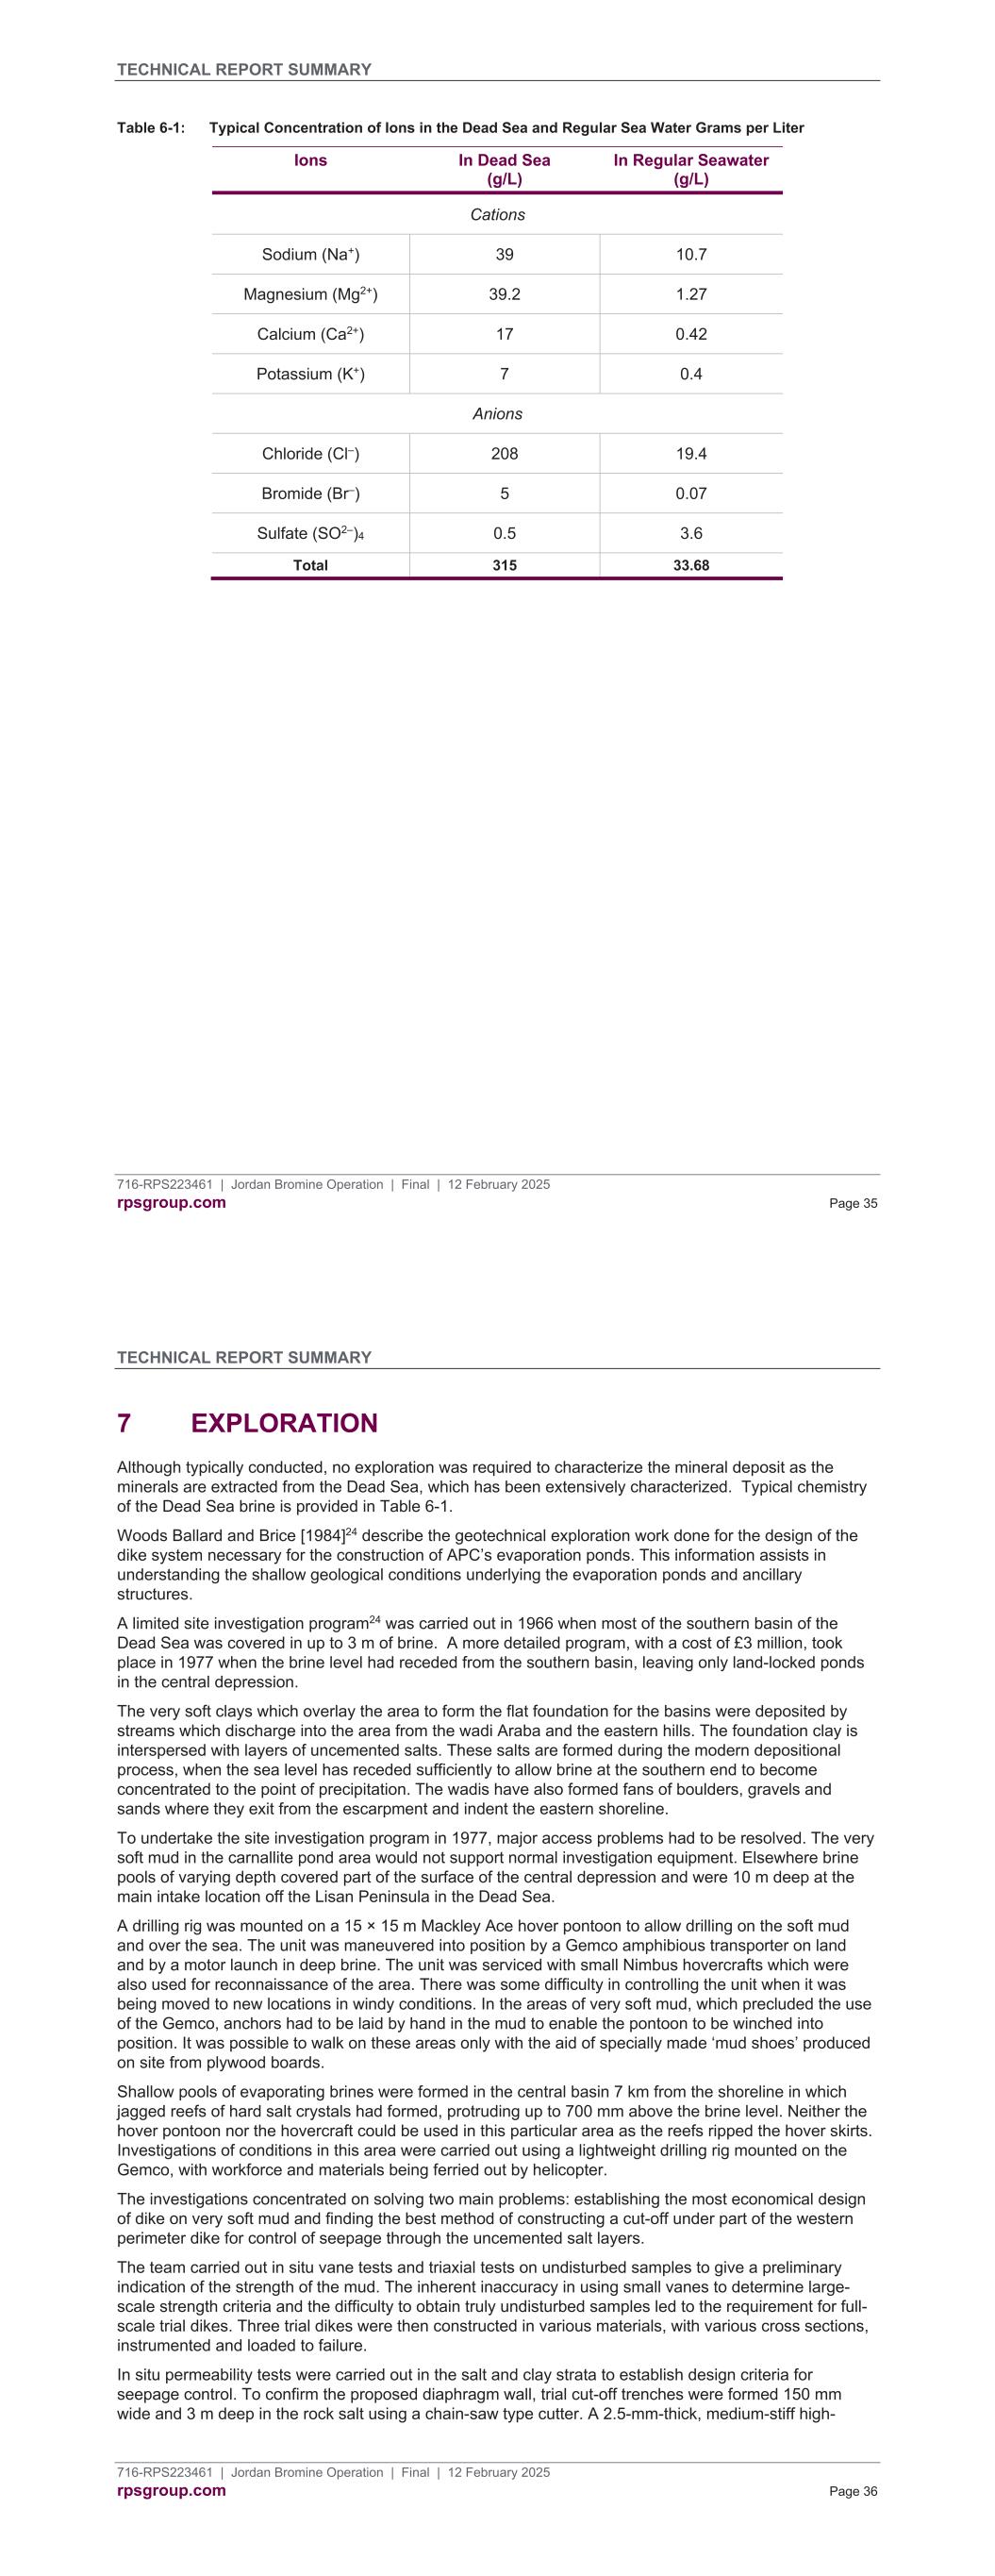
TECHNICAL REPORT SUMMARY 716-RPS223461 | Jordan Bromine Operation | Final | 12 February 2025 rpsgroup.com Page 35 Table 6-1: Typical Concentration of Ions in the Dead Sea and Regular Sea Water Grams per Liter Ions In Dead Sea (g/L) In Regular Seawater (g/L) Cations Sodium (Na+) 39 10.7 Magnesium (Mg2+) 39.2 1.27 Calcium (Ca2+) 17 0.42 Potassium (K+) 7 0.4 Anions Chloride (Cl–) 208 19.4 Bromide (Br–) 5 0.07 Sulfate (SO2–)4 0.5 3.6 Total 315 33.68 TECHNICAL REPORT SUMMARY 716-RPS223461 | Jordan Bromine Operation | Final | 12 February 2025 rpsgroup.com Page 36 7 EXPLORATION Although typically conducted, no exploration was required to characterize the mineral deposit as the minerals are extracted from the Dead Sea, which has been extensively characterized. Typical chemistry of the Dead Sea brine is provided in Table 6-1. Woods Ballard and Brice [1984]24 describe the geotechnical exploration work done for the design of the dike system necessary for the construction of APC’s evaporation ponds. This information assists in understanding the shallow geological conditions underlying the evaporation ponds and ancillary structures. A limited site investigation program24 was carried out in 1966 when most of the southern basin of the Dead Sea was covered in up to 3 m of brine. A more detailed program, with a cost of £3 million, took place in 1977 when the brine level had receded from the southern basin, leaving only land-locked ponds in the central depression. The very soft clays which overlay the area to form the flat foundation for the basins were deposited by streams which discharge into the area from the wadi Araba and the eastern hills. The foundation clay is interspersed with layers of uncemented salts. These salts are formed during the modern depositional process, when the sea level has receded sufficiently to allow brine at the southern end to become concentrated to the point of precipitation. The wadis have also formed fans of boulders, gravels and sands where they exit from the escarpment and indent the eastern shoreline. To undertake the site investigation program in 1977, major access problems had to be resolved. The very soft mud in the carnallite pond area would not support normal investigation equipment. Elsewhere brine pools of varying depth covered part of the surface of the central depression and were 10 m deep at the main intake location off the Lisan Peninsula in the Dead Sea. A drilling rig was mounted on a 15 × 15 m Mackley Ace hover pontoon to allow drilling on the soft mud and over the sea. The unit was maneuvered into position by a Gemco amphibious transporter on land and by a motor launch in deep brine. The unit was serviced with small Nimbus hovercrafts which were also used for reconnaissance of the area. There was some difficulty in controlling the unit when it was being moved to new locations in windy conditions. In the areas of very soft mud, which precluded the use of the Gemco, anchors had to be laid by hand in the mud to enable the pontoon to be winched into position. It was possible to walk on these areas only with the aid of specially made ‘mud shoes’ produced on site from plywood boards. Shallow pools of evaporating brines were formed in the central basin 7 km from the shoreline in which jagged reefs of hard salt crystals had formed, protruding up to 700 mm above the brine level. Neither the hover pontoon nor the hovercraft could be used in this particular area as the reefs ripped the hover skirts. Investigations of conditions in this area were carried out using a lightweight drilling rig mounted on the Gemco, with workforce and materials being ferried out by helicopter. The investigations concentrated on solving two main problems: establishing the most economical design of dike on very soft mud and finding the best method of constructing a cut-off under part of the western perimeter dike for control of seepage through the uncemented salt layers. The team carried out in situ vane tests and triaxial tests on undisturbed samples to give a preliminary indication of the strength of the mud. The inherent inaccuracy in using small vanes to determine large- scale strength criteria and the difficulty to obtain truly undisturbed samples led to the requirement for full- scale trial dikes. Three trial dikes were then constructed in various materials, with various cross sections, instrumented and loaded to failure. In situ permeability tests were carried out in the salt and clay strata to establish design criteria for seepage control. To confirm the proposed diaphragm wall, trial cut-off trenches were formed 150 mm wide and 3 m deep in the rock salt using a chain-saw type cutter. A 2.5-mm-thick, medium-stiff high-
TECHNICAL REPORT SUMMARY 716-RPS223461 | Jordan Bromine Operation | Final | 12 February 2025 rpsgroup.com Page 37 density polyethylene impermeable membrane was inserted into the trench which was then filled with a self-setting mud. TECHNICAL REPORT SUMMARY 716-RPS223461 | Jordan Bromine Operation | Final | 12 February 2025 rpsgroup.com Page 38 8 SAMPLE PREPARATION, ANALYSES, AND SECURITY The deposit (i.e., the Dead Sea) has been characterized based on ample information collected from multiple sources, including companies dedicated to extracting and processing brine as well as scientific institutions. Therefore, the various sampling and testing protocols and sample chain-of-custody documentation that are generally used to characterize the reserves/deposit are not included in this report. JBC has its own internal lab facilities for testing with advanced technology and well trained staff. The lab complies with ISO 19000, 14001 and OHSAS 18001 certification requirements and follows industry best practices in terms of laboratory procedures. JBC has decided to further improve its lab by pursuing compliance with ISO 17025 requirements and this process is ongoing. JBC’s analytical laboratory is managed by a team of experts, including a chemist, supervisors and technicians, all working around the clock in shifts, to maintain the integrity of the lab at all times. JBC is an ongoing operation that has processed concentrated brine extracted from the Dead Sea for many years. Therefore, JBC has an extensive database of quality data that were obtained by APC and JBC. This data confirms the characteristics of the brine obtained from the Dead Sea (APC) and the Carnallite Pond C-7 (APC and JBC). Chapter 10.0 discusses the sample preparation, analyses, and security of the brine samples used to test the quality of the brine. It is the QP’s opinion that Albemarle’s laboratory facilities meet or exceed the industry standard requirements for such facilities and that the implemented practices for the collection and preparation of samples, as well as the methodology followed to carry out the analytical work (including the sample security protocols) are based on industry best practices and, therefore, are adequate for their intended purposes.
TECHNICAL REPORT SUMMARY 716-RPS223461 | Jordan Bromine Operation | Final | 12 February 2025 rpsgroup.com Page 39 9 DATA VERIFICATION Sampling and testing records from 2019 through 2023 were provided by JBC and were used as source material for the TRS. The JBC plant has been operating for approximately 20 years and the quality of the brine extracted from the Dead Sea by APC and the feedbrine coming from APC’s Carnallite Pond C-7 is continuously monitored and well understood. The typical density values, as well as the chemical composition of the brine, are well documented, and in the Qualified Person’s (QP’s) opinion, the quality data provided by JBC are adequate to understand the process and estimate mineral resources and reserves. The data reviewed by the QP show a sampling and testing system in place that is comparable to the best management practices of the industry. The records contain detailed information on dates, times and the name of the operators who performed the sample-collection process. Documentation provided by JBC also shows appropriate chain-of-custody documentation of the samples and the standard analytical methods that were implemented for quality testing. TECHNICAL REPORT SUMMARY 716-RPS223461 | Jordan Bromine Operation | Final | 12 February 2025 rpsgroup.com Page 40 10 MINERAL PROCESSING AND METALLURGICAL TESTING The methods used to test the quality of the brine before it reached the JBC plant is discussed in this chapter. Understanding the quality of the brine before it enters the plant is critical to ensure that the plant feed is consistent. The analytical procedures discussed herein are not typically used in the mining and exploration industry (e.g., geochemical assaying); however, the methods employed are sufficient for JBC to run their plant properly and efficiently. 10.1 Brine Sample Collection The JBC bromine plants and the connection to APC’s Carnallite Pond C-7 were designed for the explicit purpose of gathering substantial quantities of brine for transport to the central bromine production facilities. Once at the facility, the bulk brine is processed to produce bromine. Concentration measurements of the bromide salts (hereafter referred to as bromides) are critical to the successful operation of the bromine plant. The brine consistency is critical for forecasting various bromine derivative sales and the overall health of the Albemarle/JBC bromine business. Bromine samples from the JBC brine plant are taken in two strategic locations: (1) upstream of the bromine tower and (2) downstream of the bromine tower. Because of the nature of brine collection, the feedbrine (i.e., upstream brine) concentration of bromides remain relatively consistent; however, the concentration does vary and depends on weather/climate and APC’s process consistency. Feedbrine samples are therefore frequently taken to capture concentration changes and more effectively adjust downstream operating parameters. Tailbrine (i.e., downstream brine) samples are also taken frequently to primarily ensure that existing parameters at the bromine tower are set correctly. JBC operators collect brine samples multiple times per day and as requested by plant management. The sampling method includes the following steps: 1. Travel to each feedbrine and/or tailbrine sampling area within the plant 2. Slowly open the sample valves to purge out collected debris or stagnant brine to ensure that the samples collected are representative of the actual flow 3. Collect approximately 1 liter of brine within the sample bottle (roughly filling to the bottle’s capacity) 4. Label the sample bottle with the date, time, and name of the operator who collected the sample. The label also indicates if the sample corresponds to feedbrine or tailbrine. Cap the bottle and transport to the on-site analytical laboratory for testing. Because of the long-established operation of the JBC bromine plant, the samples collected at both feedbrine and tailbrine collection sites are only regularly tested for bromide salts. The composition of the feedbrine and tailbrine, in terms of additional salt content outside of the bromide salts, has been very consistent over the last 20 years of production and consists of magnesium, sodium, calcium, and potassium chlorides. Density measurements are not frequently taken based on the lack of density change in the brine over time. Samples are taken within the plant approximately every 2 to 4 hours to monitor process efficiency and allow operators to make adjustments to the bromine plant operations. 10.2 Security Samples are taken directly from the sampling point to the internal JBC quality control (QC) laboratory. Samples are verified by the QC laboratory technician and operator during delivery and tracked through an electronic sample monitoring system where samples are given a designated number and the results of analytical tests are posted. Samples are not sent to external laboratories for testing; however, some samples are sent to internal analytical laboratories at different Albemarle sites (primarily the Process
TECHNICAL REPORT SUMMARY 716-RPS223461 | Jordan Bromine Operation | Final | 12 February 2025 rpsgroup.com Page 41 Development Center in Baton Rouge, Louisiana) for various other tests that are immaterial to plant operations. A check standard is run for each titration and if the test passes the actual sample is analyzed. if the sample fails, the instrumentation is recalibrated. The laboratory does not hold any internationally recognized certifications. 10.3 Analytical Method Halogen titration is the current process to measure bromine in brine. This method is widely used across the company for measuring bromine because of its simplicity and no complex machinery/analytical tools are required. The method involves use of different concentrations of chemicals for feedbrine and tailbrine. Firstly, a buffer solution is prepared by adding sodium fluoride and sodium dihydrogen phosphate in deionized water. Clorox bleach is then added, and the solution is heated on a hot plate for 15 minutes. Sodium formate is then added, after which the solution is heated for an additional 5 minutes and then cooled to room temperature. Potassium iodide and sulphuric acid is then added to the solution and then the solution is titrated with sodium thiosulfate until starch endpoint. The QP has reviewed the analytical method as provided by JBC and the method appears to be reasonable and well-established. TECHNICAL REPORT SUMMARY 716-RPS223461 | Jordan Bromine Operation | Final | 12 February 2025 rpsgroup.com Page 42 11 MINERAL RESOURCE ESTIMATES Estimating bromine resources from a nonconventional reservoir such as the Dead Sea presents many challenges. The elevation and the area and volume of this body of water are rapidly decreasing for the reasons explained in this report. The decreasing water level in the Dead Sea has been of concern for many years and the concept of diverting seawater from the Mediterranean Sea or the Red Sea has been discussed in many publications. The principal objective of diverting seawater is to provide desalinated drinking water for the inhabitants of the surrounding areas of Palestinian Authority, Israel, and Jordan and to stop the decreasing water level of the Dead Sea. The desalination plant is proposed to produce fresh water using the Reverse Osmosis (RO) method. Water mixing in the Dead Sea is slower because of low waves and wind compared to other waterbodies (e.g., seas and oceans). The Dead Sea is considered a stratified waterbody and is based on 44 available datasets on potential temperature and quasi-salinity. Traditionally, the density anomaly of the Dead Sea water from 1,000 kilograms per cubic meter (kg/m3) at 25°C was used as an indicator of water salinity25 and was called “quasi-salinity” and denoted as σ25 or SIGMA-25. A study by Bashitialshaaer et al. [2011]26 was developed by the Department of Water Resources Engineering, Lund University in Sweden, to investigate methods for understanding the variations of water level and volume of the Dead Sea under various scenarios. The Lund University study26 developed two models for estimating changes in the Dead Sea level, surface area, and volume: (1) a single-layer (well- mixed) system and (2) a two-layer (stratified) system. The mathematical models used in the study were based on the Land-Ocean Interactions in the Coastal Zone (LOICZ) Biogeochemical Modeling Guidelines and have been validated by comparing the model performances with other modeling studies of the Dead Sea27. The models were first employed to describe the dynamic behavior of the Dead Sea using the data available in 1997 as the initial conditions and simulating the evolution over a 100-year period. Historical data from 1976 to 2006 were then used to compare with simulations obtained from the model. Although the Dead Sea is not in a steady-state condition, it was assumed to be close to steady state during the first year. Water and salt balances may have internal inputs and outputs but are only a concern in the two- layer approach. The first model employed encompassed a single layer for which the water and salt mass balances were derived. Salinity variations and water discharged from the desalination plant were considered with and without the proposed project. The Dead Sea shows relatively strong vertical stratification that can be assumed to resemble a two-layer system (also called a stratified system)28. Considering the significant differences in the salinities and densities of the input and output brine, as well as the Dead Sea itself, with respect to depth, a two-layer system was determined to provide a better description of the conditions than the single-layer system. The upper layer constitutes an average of approximately 10 percent of the total depth, and the rest of the lake constitutes a rather homogeneous lower layer. Values of volume, surface area, elevation, and cumulative levels of the Dead Sea for a 100- year period were predicted by the single-layer and two-layer models. Compared to previous studies, the single-layer and two-layer models proved to be robust alternatives to the traditional water and salt balance techniques. These models allowed the water exchange to be successfully calculated through a relatively simple representation of a complex and dynamic system such as the Dead Sea. Both analytical models were balanced using two approaches: water-mass balance and salt-mass balance. The single-layer model predicted 1.4 and 2.0 percent higher water levels than the two-layer model using the water-mass balance with and without RO discharge, respectively. The two-layer model yielded 3.7 and 4.0 percent higher values than the single-layer system using the salt-mass balance with and without RO discharge, respectively.
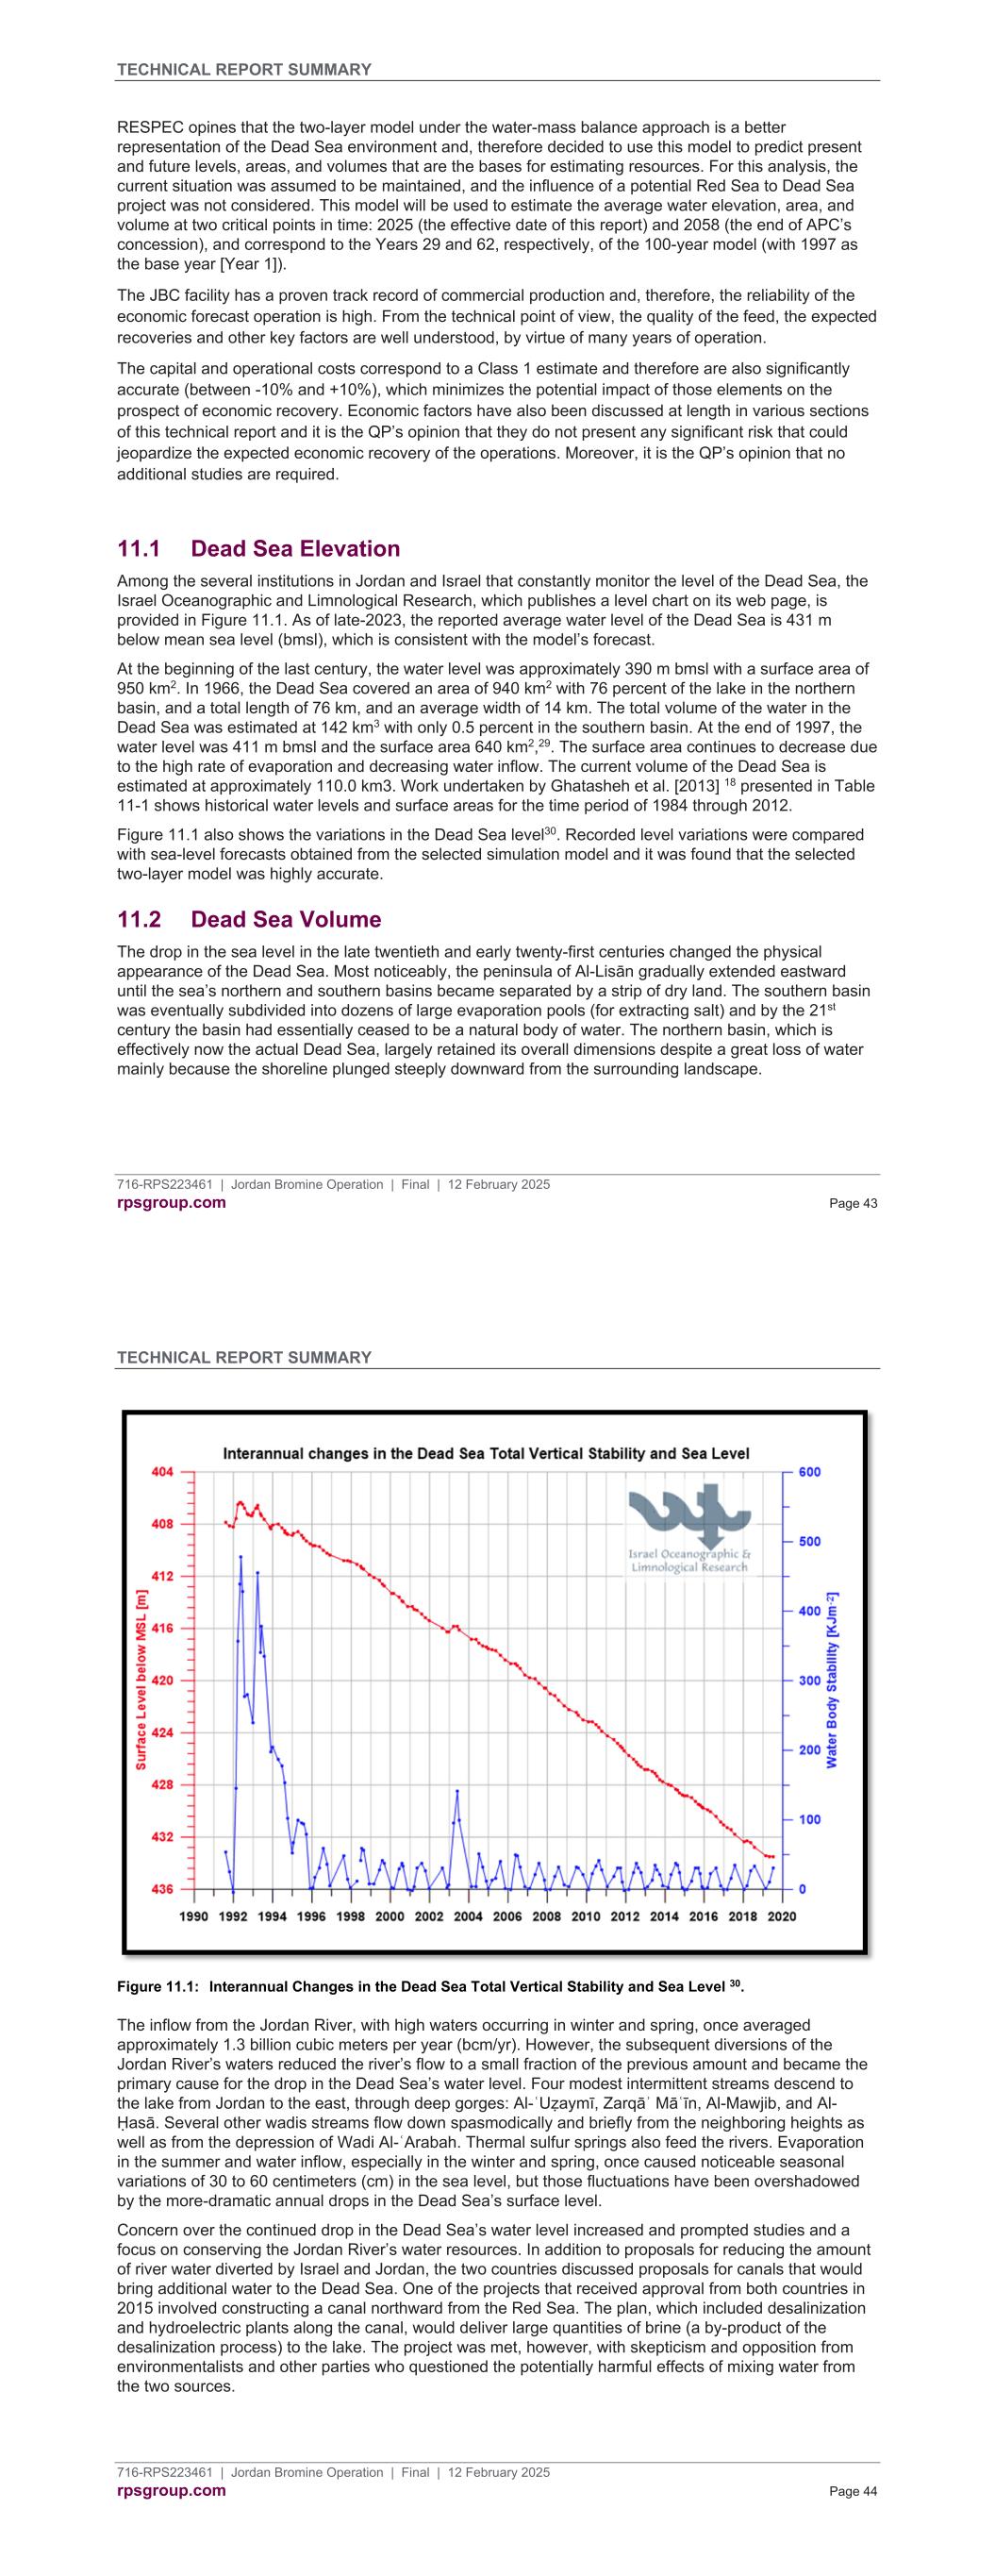
TECHNICAL REPORT SUMMARY 716-RPS223461 | Jordan Bromine Operation | Final | 12 February 2025 rpsgroup.com Page 43 RESPEC opines that the two-layer model under the water-mass balance approach is a better representation of the Dead Sea environment and, therefore decided to use this model to predict present and future levels, areas, and volumes that are the bases for estimating resources. For this analysis, the current situation was assumed to be maintained, and the influence of a potential Red Sea to Dead Sea project was not considered. This model will be used to estimate the average water elevation, area, and volume at two critical points in time: 2025 (the effective date of this report) and 2058 (the end of APC’s concession), and correspond to the Years 29 and 62, respectively, of the 100-year model (with 1997 as the base year [Year 1]). The JBC facility has a proven track record of commercial production and, therefore, the reliability of the economic forecast operation is high. From the technical point of view, the quality of the feed, the expected recoveries and other key factors are well understood, by virtue of many years of operation. The capital and operational costs correspond to a Class 1 estimate and therefore are also significantly accurate (between -10% and +10%), which minimizes the potential impact of those elements on the prospect of economic recovery. Economic factors have also been discussed at length in various sections of this technical report and it is the QP’s opinion that they do not present any significant risk that could jeopardize the expected economic recovery of the operations. Moreover, it is the QP’s opinion that no additional studies are required. 11.1 Dead Sea Elevation Among the several institutions in Jordan and Israel that constantly monitor the level of the Dead Sea, the Israel Oceanographic and Limnological Research, which publishes a level chart on its web page, is provided in Figure 11.1. As of late-2023, the reported average water level of the Dead Sea is 431 m below mean sea level (bmsl), which is consistent with the model’s forecast. At the beginning of the last century, the water level was approximately 390 m bmsl with a surface area of 950 km2. In 1966, the Dead Sea covered an area of 940 km2 with 76 percent of the lake in the northern basin, and a total length of 76 km, and an average width of 14 km. The total volume of the water in the Dead Sea was estimated at 142 km3 with only 0.5 percent in the southern basin. At the end of 1997, the water level was 411 m bmsl and the surface area 640 km2,29. The surface area continues to decrease due to the high rate of evaporation and decreasing water inflow. The current volume of the Dead Sea is estimated at approximately 110.0 km3. Work undertaken by Ghatasheh et al. [2013] 18 presented in Table 11-1 shows historical water levels and surface areas for the time period of 1984 through 2012. Figure 11.1 also shows the variations in the Dead Sea level30. Recorded level variations were compared with sea-level forecasts obtained from the selected simulation model and it was found that the selected two-layer model was highly accurate. 11.2 Dead Sea Volume The drop in the sea level in the late twentieth and early twenty-first centuries changed the physical appearance of the Dead Sea. Most noticeably, the peninsula of Al-Lisān gradually extended eastward until the sea’s northern and southern basins became separated by a strip of dry land. The southern basin was eventually subdivided into dozens of large evaporation pools (for extracting salt) and by the 21st century the basin had essentially ceased to be a natural body of water. The northern basin, which is effectively now the actual Dead Sea, largely retained its overall dimensions despite a great loss of water mainly because the shoreline plunged steeply downward from the surrounding landscape. TECHNICAL REPORT SUMMARY 716-RPS223461 | Jordan Bromine Operation | Final | 12 February 2025 rpsgroup.com Page 44 Figure 11.1: Interannual Changes in the Dead Sea Total Vertical Stability and Sea Level 30. The inflow from the Jordan River, with high waters occurring in winter and spring, once averaged approximately 1.3 billion cubic meters per year (bcm/yr). However, the subsequent diversions of the Jordan River’s waters reduced the river’s flow to a small fraction of the previous amount and became the primary cause for the drop in the Dead Sea’s water level. Four modest intermittent streams descend to the lake from Jordan to the east, through deep gorges: Al-ʿUẓaymī, Zarqāʾ Māʿīn, Al-Mawjib, and Al- Ḥasā. Several other wadis streams flow down spasmodically and briefly from the neighboring heights as well as from the depression of Wadi Al-ʿArabah. Thermal sulfur springs also feed the rivers. Evaporation in the summer and water inflow, especially in the winter and spring, once caused noticeable seasonal variations of 30 to 60 centimeters (cm) in the sea level, but those fluctuations have been overshadowed by the more-dramatic annual drops in the Dead Sea’s surface level. Concern over the continued drop in the Dead Sea’s water level increased and prompted studies and a focus on conserving the Jordan River’s water resources. In addition to proposals for reducing the amount of river water diverted by Israel and Jordan, the two countries discussed proposals for canals that would bring additional water to the Dead Sea. One of the projects that received approval from both countries in 2015 involved constructing a canal northward from the Red Sea. The plan, which included desalinization and hydroelectric plants along the canal, would deliver large quantities of brine (a by-product of the desalinization process) to the lake. The project was met, however, with skepticism and opposition from environmentalists and other parties who questioned the potentially harmful effects of mixing water from the two sources.
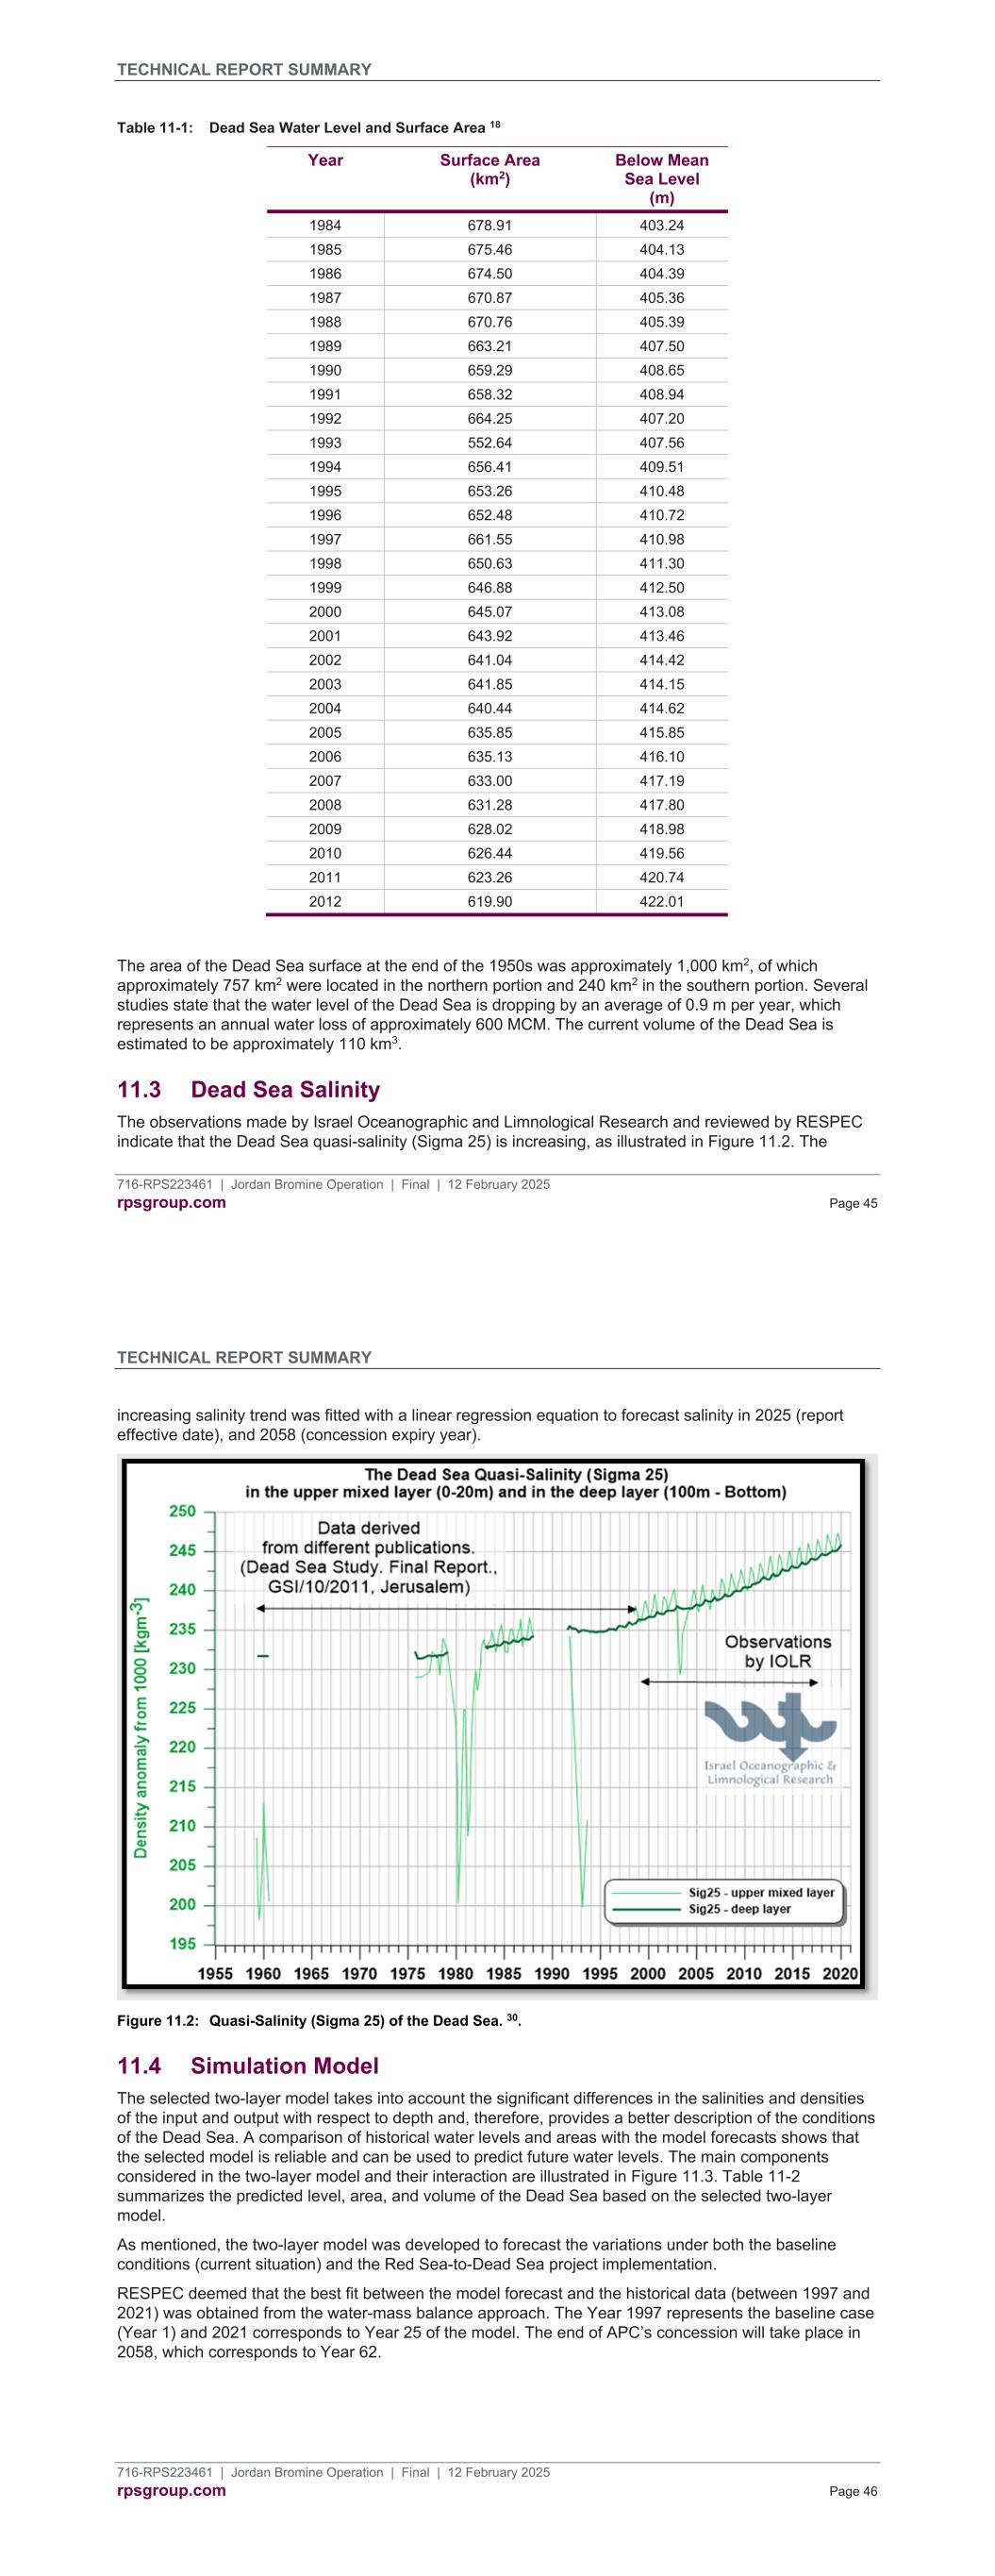
TECHNICAL REPORT SUMMARY 716-RPS223461 | Jordan Bromine Operation | Final | 12 February 2025 rpsgroup.com Page 45 Table 11-1: Dead Sea Water Level and Surface Area 18 Year Surface Area (km2) Below Mean Sea Level (m) 1984 678.91 403.24 1985 675.46 404.13 1986 674.50 404.39 1987 670.87 405.36 1988 670.76 405.39 1989 663.21 407.50 1990 659.29 408.65 1991 658.32 408.94 1992 664.25 407.20 1993 552.64 407.56 1994 656.41 409.51 1995 653.26 410.48 1996 652.48 410.72 1997 661.55 410.98 1998 650.63 411.30 1999 646.88 412.50 2000 645.07 413.08 2001 643.92 413.46 2002 641.04 414.42 2003 641.85 414.15 2004 640.44 414.62 2005 635.85 415.85 2006 635.13 416.10 2007 633.00 417.19 2008 631.28 417.80 2009 628.02 418.98 2010 626.44 419.56 2011 623.26 420.74 2012 619.90 422.01 The area of the Dead Sea surface at the end of the 1950s was approximately 1,000 km2, of which approximately 757 km2 were located in the northern portion and 240 km2 in the southern portion. Several studies state that the water level of the Dead Sea is dropping by an average of 0.9 m per year, which represents an annual water loss of approximately 600 MCM. The current volume of the Dead Sea is estimated to be approximately 110 km3. 11.3 Dead Sea Salinity The observations made by Israel Oceanographic and Limnological Research and reviewed by RESPEC indicate that the Dead Sea quasi-salinity (Sigma 25) is increasing, as illustrated in Figure 11.2. The TECHNICAL REPORT SUMMARY 716-RPS223461 | Jordan Bromine Operation | Final | 12 February 2025 rpsgroup.com Page 46 increasing salinity trend was fitted with a linear regression equation to forecast salinity in 2025 (report effective date), and 2058 (concession expiry year). Figure 11.2: Quasi-Salinity (Sigma 25) of the Dead Sea. 30. 11.4 Simulation Model The selected two-layer model takes into account the significant differences in the salinities and densities of the input and output with respect to depth and, therefore, provides a better description of the conditions of the Dead Sea. A comparison of historical water levels and areas with the model forecasts shows that the selected model is reliable and can be used to predict future water levels. The main components considered in the two-layer model and their interaction are illustrated in Figure 11.3. Table 11-2 summarizes the predicted level, area, and volume of the Dead Sea based on the selected two-layer model. As mentioned, the two-layer model was developed to forecast the variations under both the baseline conditions (current situation) and the Red Sea-to-Dead Sea project implementation. RESPEC deemed that the best fit between the model forecast and the historical data (between 1997 and 2021) was obtained from the water-mass balance approach. The Year 1997 represents the baseline case (Year 1) and 2021 corresponds to Year 25 of the model. The end of APC’s concession will take place in 2058, which corresponds to Year 62.
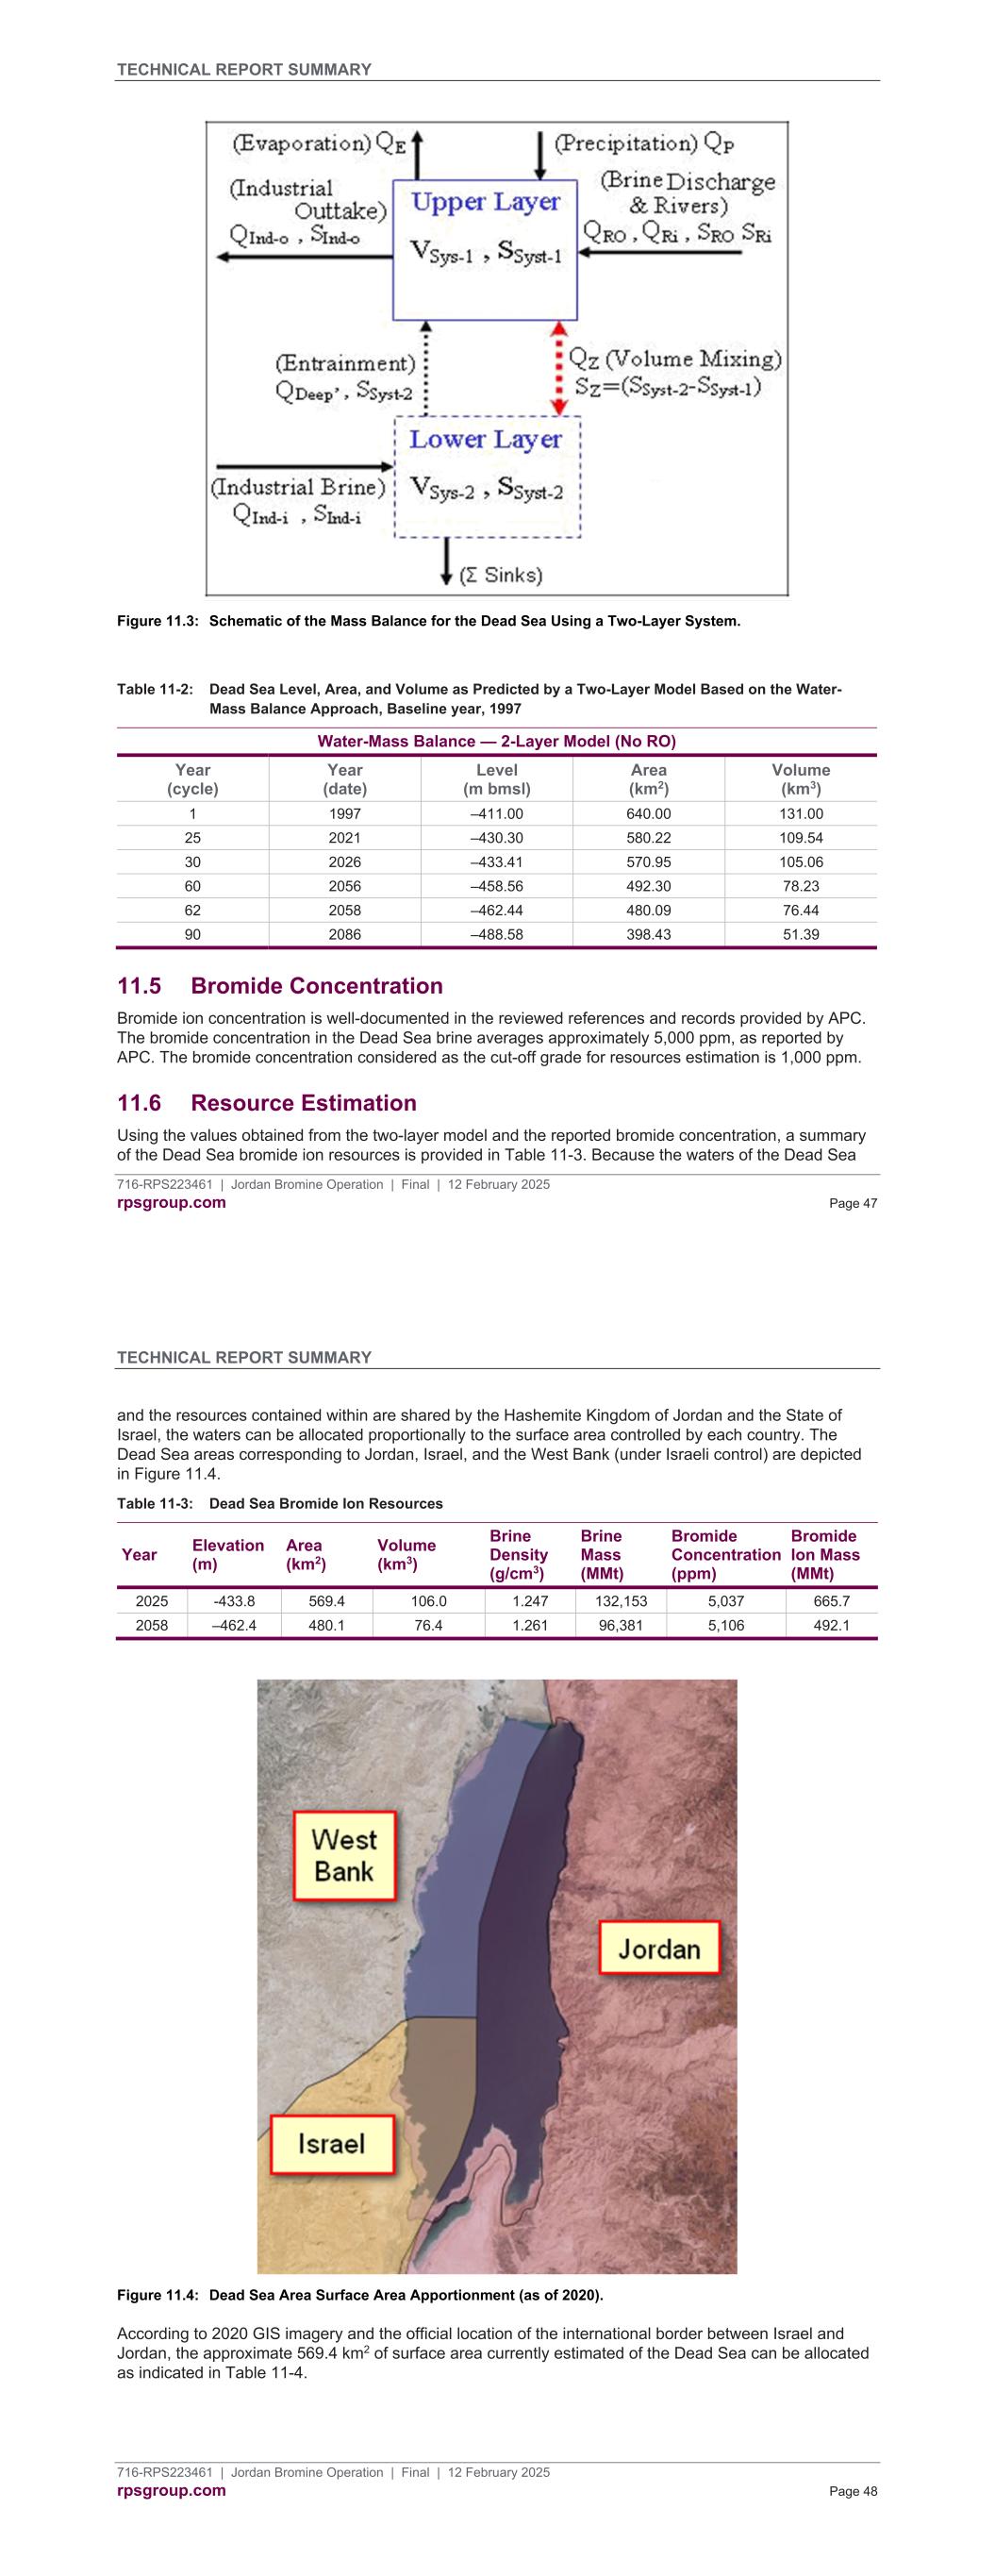
TECHNICAL REPORT SUMMARY 716-RPS223461 | Jordan Bromine Operation | Final | 12 February 2025 rpsgroup.com Page 47 Figure 11.3: Schematic of the Mass Balance for the Dead Sea Using a Two-Layer System. Table 11-2: Dead Sea Level, Area, and Volume as Predicted by a Two-Layer Model Based on the Water- Mass Balance Approach, Baseline year, 1997 Water-Mass Balance — 2-Layer Model (No RO) Year (cycle) Year (date) Level (m bmsl) Area (km2) Volume (km3) 1 1997 –411.00 640.00 131.00 25 2021 –430.30 580.22 109.54 30 2026 –433.41 570.95 105.06 60 2056 –458.56 492.30 78.23 62 2058 –462.44 480.09 76.44 90 2086 –488.58 398.43 51.39 11.5 Bromide Concentration Bromide ion concentration is well-documented in the reviewed references and records provided by APC. The bromide concentration in the Dead Sea brine averages approximately 5,000 ppm, as reported by APC. The bromide concentration considered as the cut-off grade for resources estimation is 1,000 ppm. 11.6 Resource Estimation Using the values obtained from the two-layer model and the reported bromide concentration, a summary of the Dead Sea bromide ion resources is provided in Table 11-3. Because the waters of the Dead Sea TECHNICAL REPORT SUMMARY 716-RPS223461 | Jordan Bromine Operation | Final | 12 February 2025 rpsgroup.com Page 48 and the resources contained within are shared by the Hashemite Kingdom of Jordan and the State of Israel, the waters can be allocated proportionally to the surface area controlled by each country. The Dead Sea areas corresponding to Jordan, Israel, and the West Bank (under Israeli control) are depicted in Figure 11.4. Table 11-3: Dead Sea Bromide Ion Resources Year Elevation (m) Area (km2) Volume (km3) Brine Density (g/cm3) Brine Mass (MMt) Bromide Concentration (ppm) Bromide Ion Mass (MMt) 2025 -433.8 569.4 106.0 1.247 132,153 5,037 665.7 2058 –462.4 480.1 76.4 1.261 96,381 5,106 492.1 Figure 11.4: Dead Sea Area Surface Area Apportionment (as of 2020). According to 2020 GIS imagery and the official location of the international border between Israel and Jordan, the approximate 569.4 km2 of surface area currently estimated of the Dead Sea can be allocated as indicated in Table 11-4.
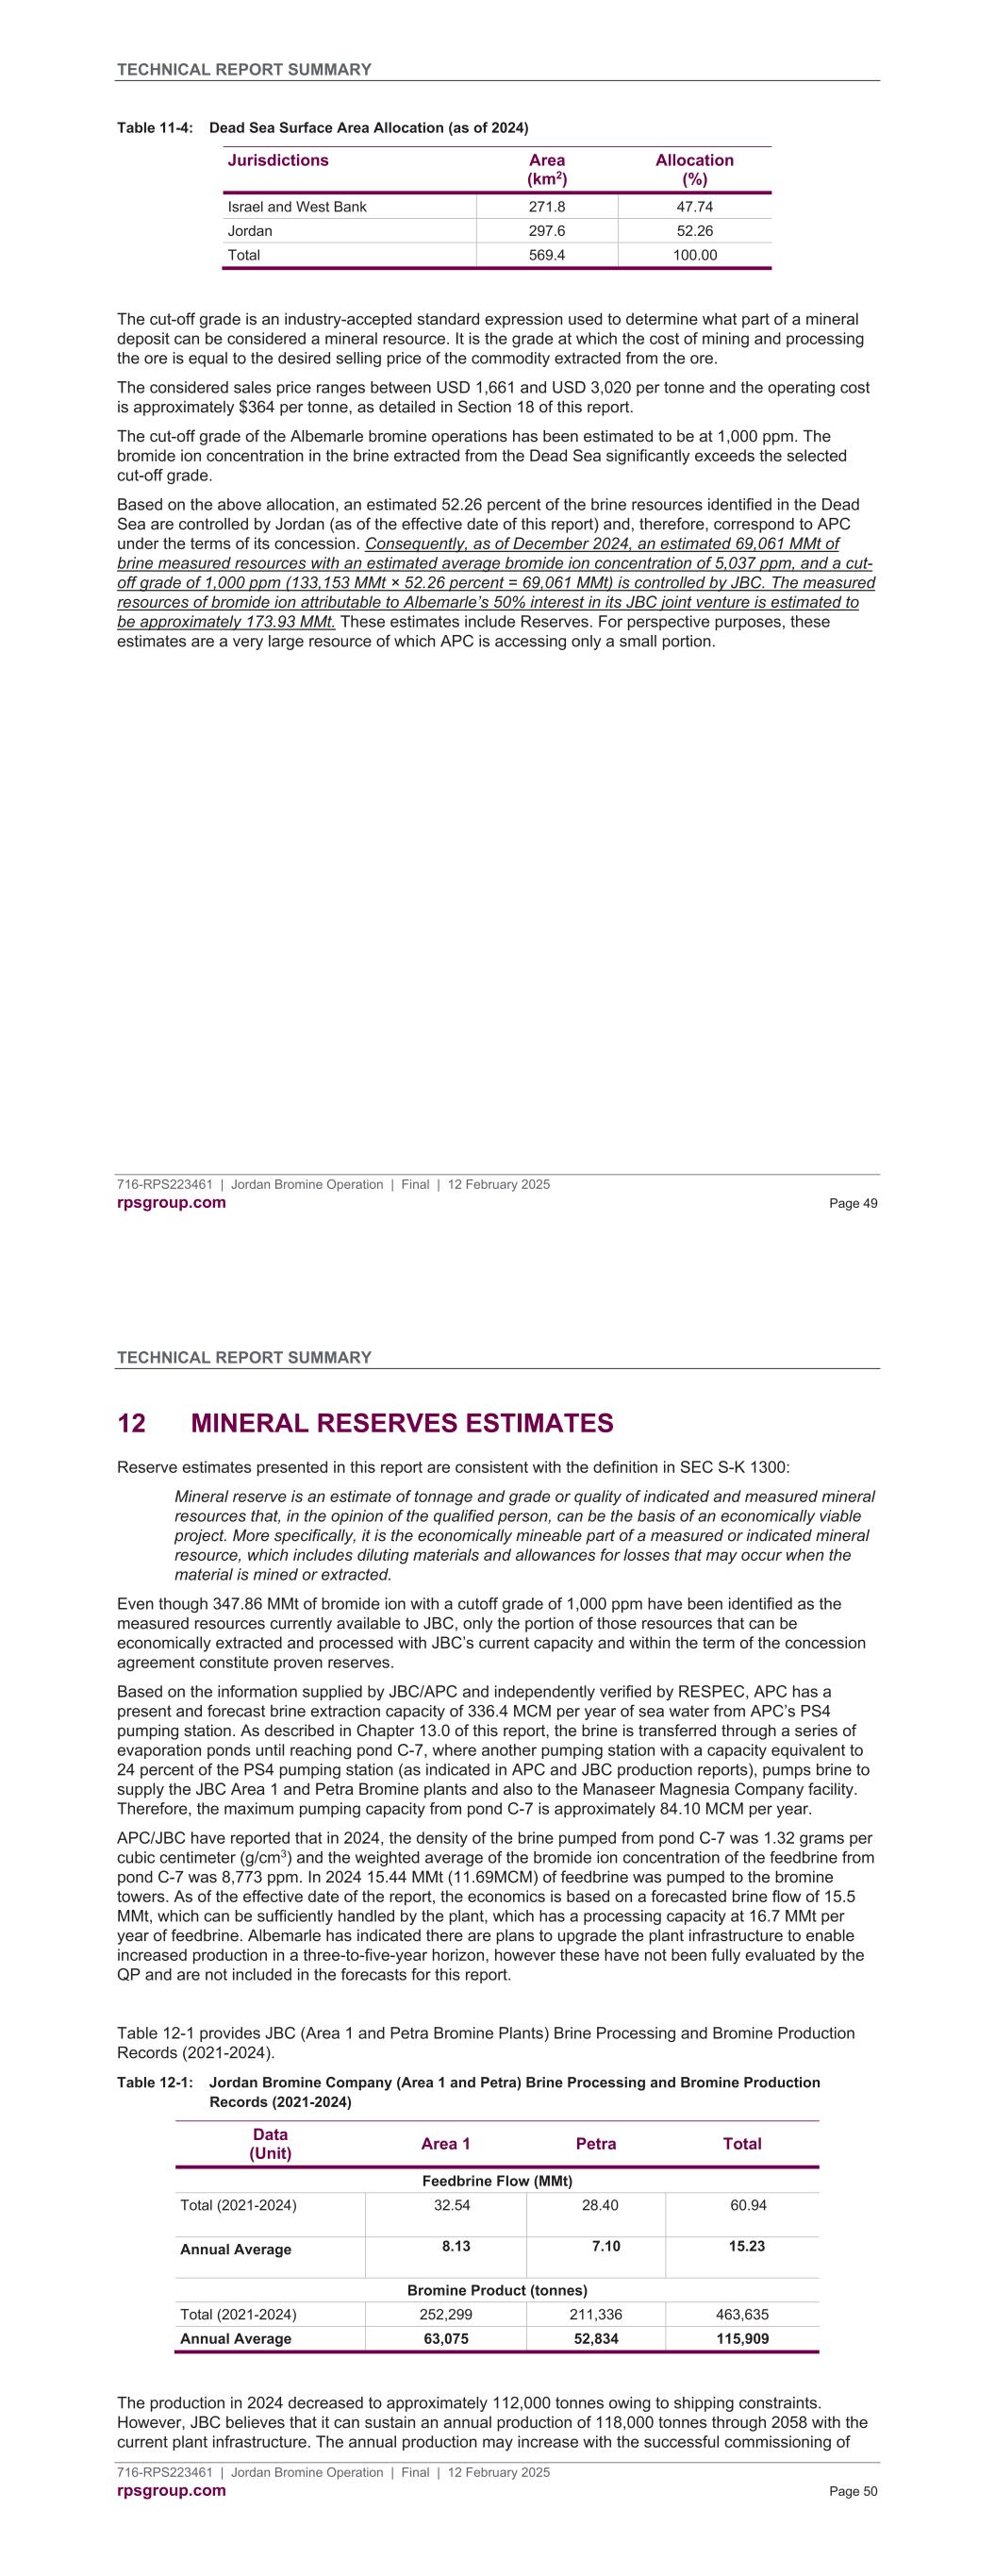
TECHNICAL REPORT SUMMARY 716-RPS223461 | Jordan Bromine Operation | Final | 12 February 2025 rpsgroup.com Page 49 Table 11-4: Dead Sea Surface Area Allocation (as of 2024) Jurisdictions Area (km2) Allocation (%) Israel and West Bank 271.8 47.74 Jordan 297.6 52.26 Total 569.4 100.00 The cut-off grade is an industry-accepted standard expression used to determine what part of a mineral deposit can be considered a mineral resource. It is the grade at which the cost of mining and processing the ore is equal to the desired selling price of the commodity extracted from the ore. The considered sales price ranges between USD 1,661 and USD 3,020 per tonne and the operating cost is approximately $364 per tonne, as detailed in Section 18 of this report. The cut-off grade of the Albemarle bromine operations has been estimated to be at 1,000 ppm. The bromide ion concentration in the brine extracted from the Dead Sea significantly exceeds the selected cut-off grade. Based on the above allocation, an estimated 52.26 percent of the brine resources identified in the Dead Sea are controlled by Jordan (as of the effective date of this report) and, therefore, correspond to APC under the terms of its concession. Consequently, as of December 2024, an estimated 69,061 MMt of brine measured resources with an estimated average bromide ion concentration of 5,037 ppm, and a cut- off grade of 1,000 ppm (133,153 MMt × 52.26 percent = 69,061 MMt) is controlled by JBC. The measured resources of bromide ion attributable to Albemarle’s 50% interest in its JBC joint venture is estimated to be approximately 173.93 MMt. These estimates include Reserves. For perspective purposes, these estimates are a very large resource of which APC is accessing only a small portion. TECHNICAL REPORT SUMMARY 716-RPS223461 | Jordan Bromine Operation | Final | 12 February 2025 rpsgroup.com Page 50 12 MINERAL RESERVES ESTIMATES Reserve estimates presented in this report are consistent with the definition in SEC S-K 1300: Mineral reserve is an estimate of tonnage and grade or quality of indicated and measured mineral resources that, in the opinion of the qualified person, can be the basis of an economically viable project. More specifically, it is the economically mineable part of a measured or indicated mineral resource, which includes diluting materials and allowances for losses that may occur when the material is mined or extracted. Even though 347.86 MMt of bromide ion with a cutoff grade of 1,000 ppm have been identified as the measured resources currently available to JBC, only the portion of those resources that can be economically extracted and processed with JBC’s current capacity and within the term of the concession agreement constitute proven reserves. Based on the information supplied by JBC/APC and independently verified by RESPEC, APC has a present and forecast brine extraction capacity of 336.4 MCM per year of sea water from APC’s PS4 pumping station. As described in Chapter 13.0 of this report, the brine is transferred through a series of evaporation ponds until reaching pond C-7, where another pumping station with a capacity equivalent to 24 percent of the PS4 pumping station (as indicated in APC and JBC production reports), pumps brine to supply the JBC Area 1 and Petra Bromine plants and also to the Manaseer Magnesia Company facility. Therefore, the maximum pumping capacity from pond C-7 is approximately 84.10 MCM per year. APC/JBC have reported that in 2024, the density of the brine pumped from pond C-7 was 1.32 grams per cubic centimeter (g/cm3) and the weighted average of the bromide ion concentration of the feedbrine from pond C-7 was 8,773 ppm. In 2024 15.44 MMt (11.69MCM) of feedbrine was pumped to the bromine towers. As of the effective date of the report, the economics is based on a forecasted brine flow of 15.5 MMt, which can be sufficiently handled by the plant, which has a processing capacity at 16.7 MMt per year of feedbrine. Albemarle has indicated there are plans to upgrade the plant infrastructure to enable increased production in a three-to-five-year horizon, however these have not been fully evaluated by the QP and are not included in the forecasts for this report. Table 12-1 provides JBC (Area 1 and Petra Bromine Plants) Brine Processing and Bromine Production Records (2021-2024). Table 12-1: Jordan Bromine Company (Area 1 and Petra) Brine Processing and Bromine Production Records (2021-2024) Data (Unit) Area 1 Petra Total Feedbrine Flow (MMt) Total (2021-2024) 32.54 28.40 60.94 Annual Average 8.13 7.10 15.23 Bromine Product (tonnes) Total (2021-2024) 252,299 211,336 463,635 Annual Average 63,075 52,834 115,909 The production in 2024 decreased to approximately 112,000 tonnes owing to shipping constraints. However, JBC believes that it can sustain an annual production of 118,000 tonnes through 2058 with the current plant infrastructure. The annual production may increase with the successful commissioning of
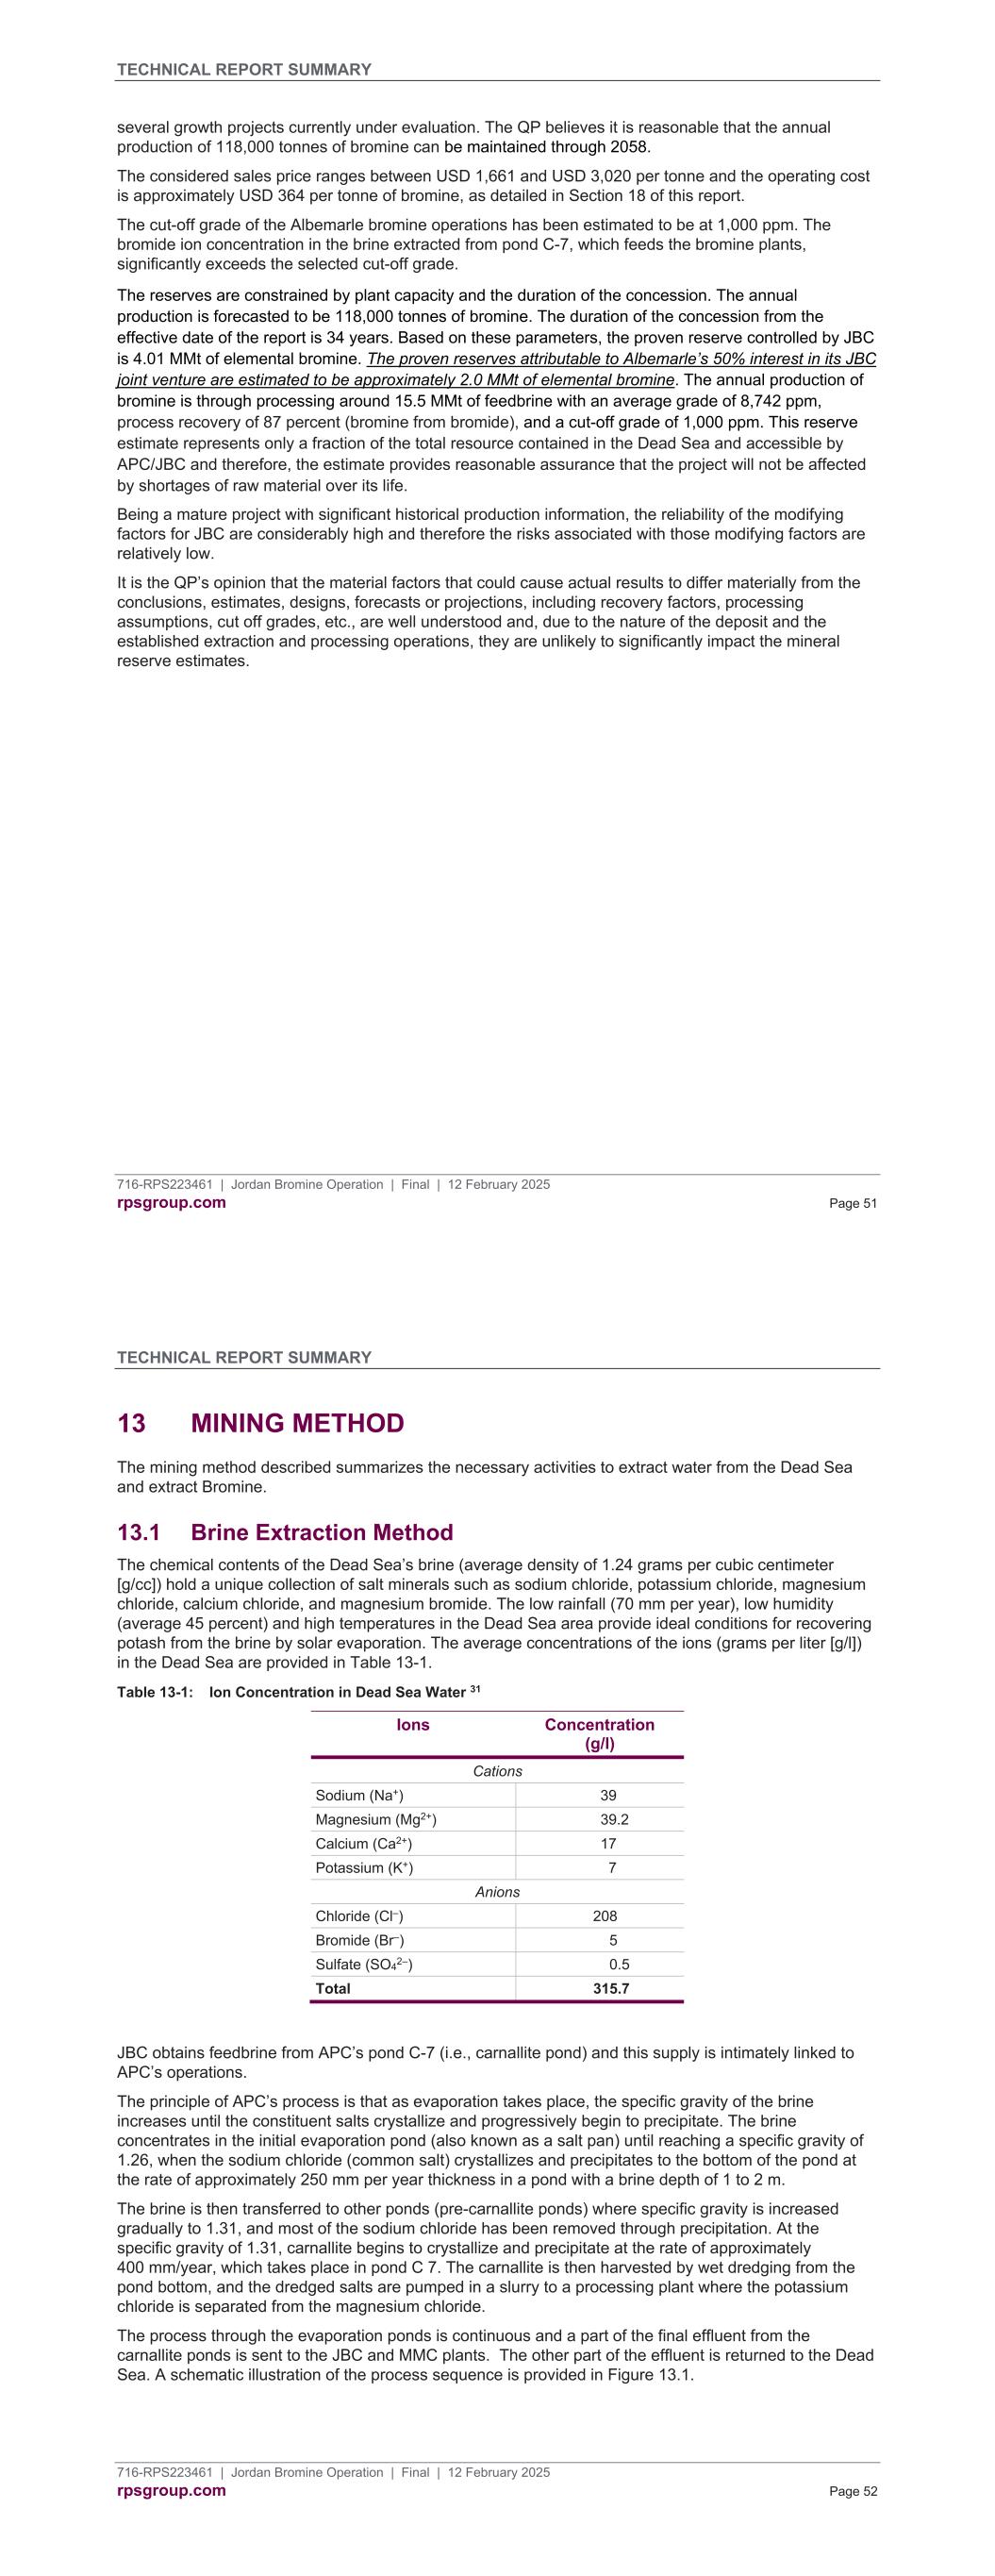
TECHNICAL REPORT SUMMARY 716-RPS223461 | Jordan Bromine Operation | Final | 12 February 2025 rpsgroup.com Page 51 several growth projects currently under evaluation. The QP believes it is reasonable that the annual production of 118,000 tonnes of bromine can be maintained through 2058. The considered sales price ranges between USD 1,661 and USD 3,020 per tonne and the operating cost is approximately USD 364 per tonne of bromine, as detailed in Section 18 of this report. The cut-off grade of the Albemarle bromine operations has been estimated to be at 1,000 ppm. The bromide ion concentration in the brine extracted from pond C-7, which feeds the bromine plants, significantly exceeds the selected cut-off grade. The reserves are constrained by plant capacity and the duration of the concession. The annual production is forecasted to be 118,000 tonnes of bromine. The duration of the concession from the effective date of the report is 34 years. Based on these parameters, the proven reserve controlled by JBC is 4.01 MMt of elemental bromine. The proven reserves attributable to Albemarle’s 50% interest in its JBC joint venture are estimated to be approximately 2.0 MMt of elemental bromine. The annual production of bromine is through processing around 15.5 MMt of feedbrine with an average grade of 8,742 ppm, process recovery of 87 percent (bromine from bromide), and a cut-off grade of 1,000 ppm. This reserve estimate represents only a fraction of the total resource contained in the Dead Sea and accessible by APC/JBC and therefore, the estimate provides reasonable assurance that the project will not be affected by shortages of raw material over its life. Being a mature project with significant historical production information, the reliability of the modifying factors for JBC are considerably high and therefore the risks associated with those modifying factors are relatively low. It is the QP’s opinion that the material factors that could cause actual results to differ materially from the conclusions, estimates, designs, forecasts or projections, including recovery factors, processing assumptions, cut off grades, etc., are well understood and, due to the nature of the deposit and the established extraction and processing operations, they are unlikely to significantly impact the mineral reserve estimates. TECHNICAL REPORT SUMMARY 716-RPS223461 | Jordan Bromine Operation | Final | 12 February 2025 rpsgroup.com Page 52 13 MINING METHOD The mining method described summarizes the necessary activities to extract water from the Dead Sea and extract Bromine. 13.1 Brine Extraction Method The chemical contents of the Dead Sea’s brine (average density of 1.24 grams per cubic centimeter [g/cc]) hold a unique collection of salt minerals such as sodium chloride, potassium chloride, magnesium chloride, calcium chloride, and magnesium bromide. The low rainfall (70 mm per year), low humidity (average 45 percent) and high temperatures in the Dead Sea area provide ideal conditions for recovering potash from the brine by solar evaporation. The average concentrations of the ions (grams per liter [g/l]) in the Dead Sea are provided in Table 13-1. Table 13-1: Ion Concentration in Dead Sea Water 31 Ions Concentration (g/l) Cations Sodium (Na+) 39 Magnesium (Mg2+) 39.2 Calcium (Ca2+) 17 Potassium (K+) 7 Anions Chloride (Cl–) 208 Bromide (Br–) 5 Sulfate (SO4 2–) 0.5 Total 315.7 JBC obtains feedbrine from APC’s pond C-7 (i.e., carnallite pond) and this supply is intimately linked to APC’s operations. The principle of APC’s process is that as evaporation takes place, the specific gravity of the brine increases until the constituent salts crystallize and progressively begin to precipitate. The brine concentrates in the initial evaporation pond (also known as a salt pan) until reaching a specific gravity of 1.26, when the sodium chloride (common salt) crystallizes and precipitates to the bottom of the pond at the rate of approximately 250 mm per year thickness in a pond with a brine depth of 1 to 2 m. The brine is then transferred to other ponds (pre-carnallite ponds) where specific gravity is increased gradually to 1.31, and most of the sodium chloride has been removed through precipitation. At the specific gravity of 1.31, carnallite begins to crystallize and precipitate at the rate of approximately 400 mm/year, which takes place in pond C 7. The carnallite is then harvested by wet dredging from the pond bottom, and the dredged salts are pumped in a slurry to a processing plant where the potassium chloride is separated from the magnesium chloride. The process through the evaporation ponds is continuous and a part of the final effluent from the carnallite ponds is sent to the JBC and MMC plants. The other part of the effluent is returned to the Dead Sea. A schematic illustration of the process sequence is provided in Figure 13.1.
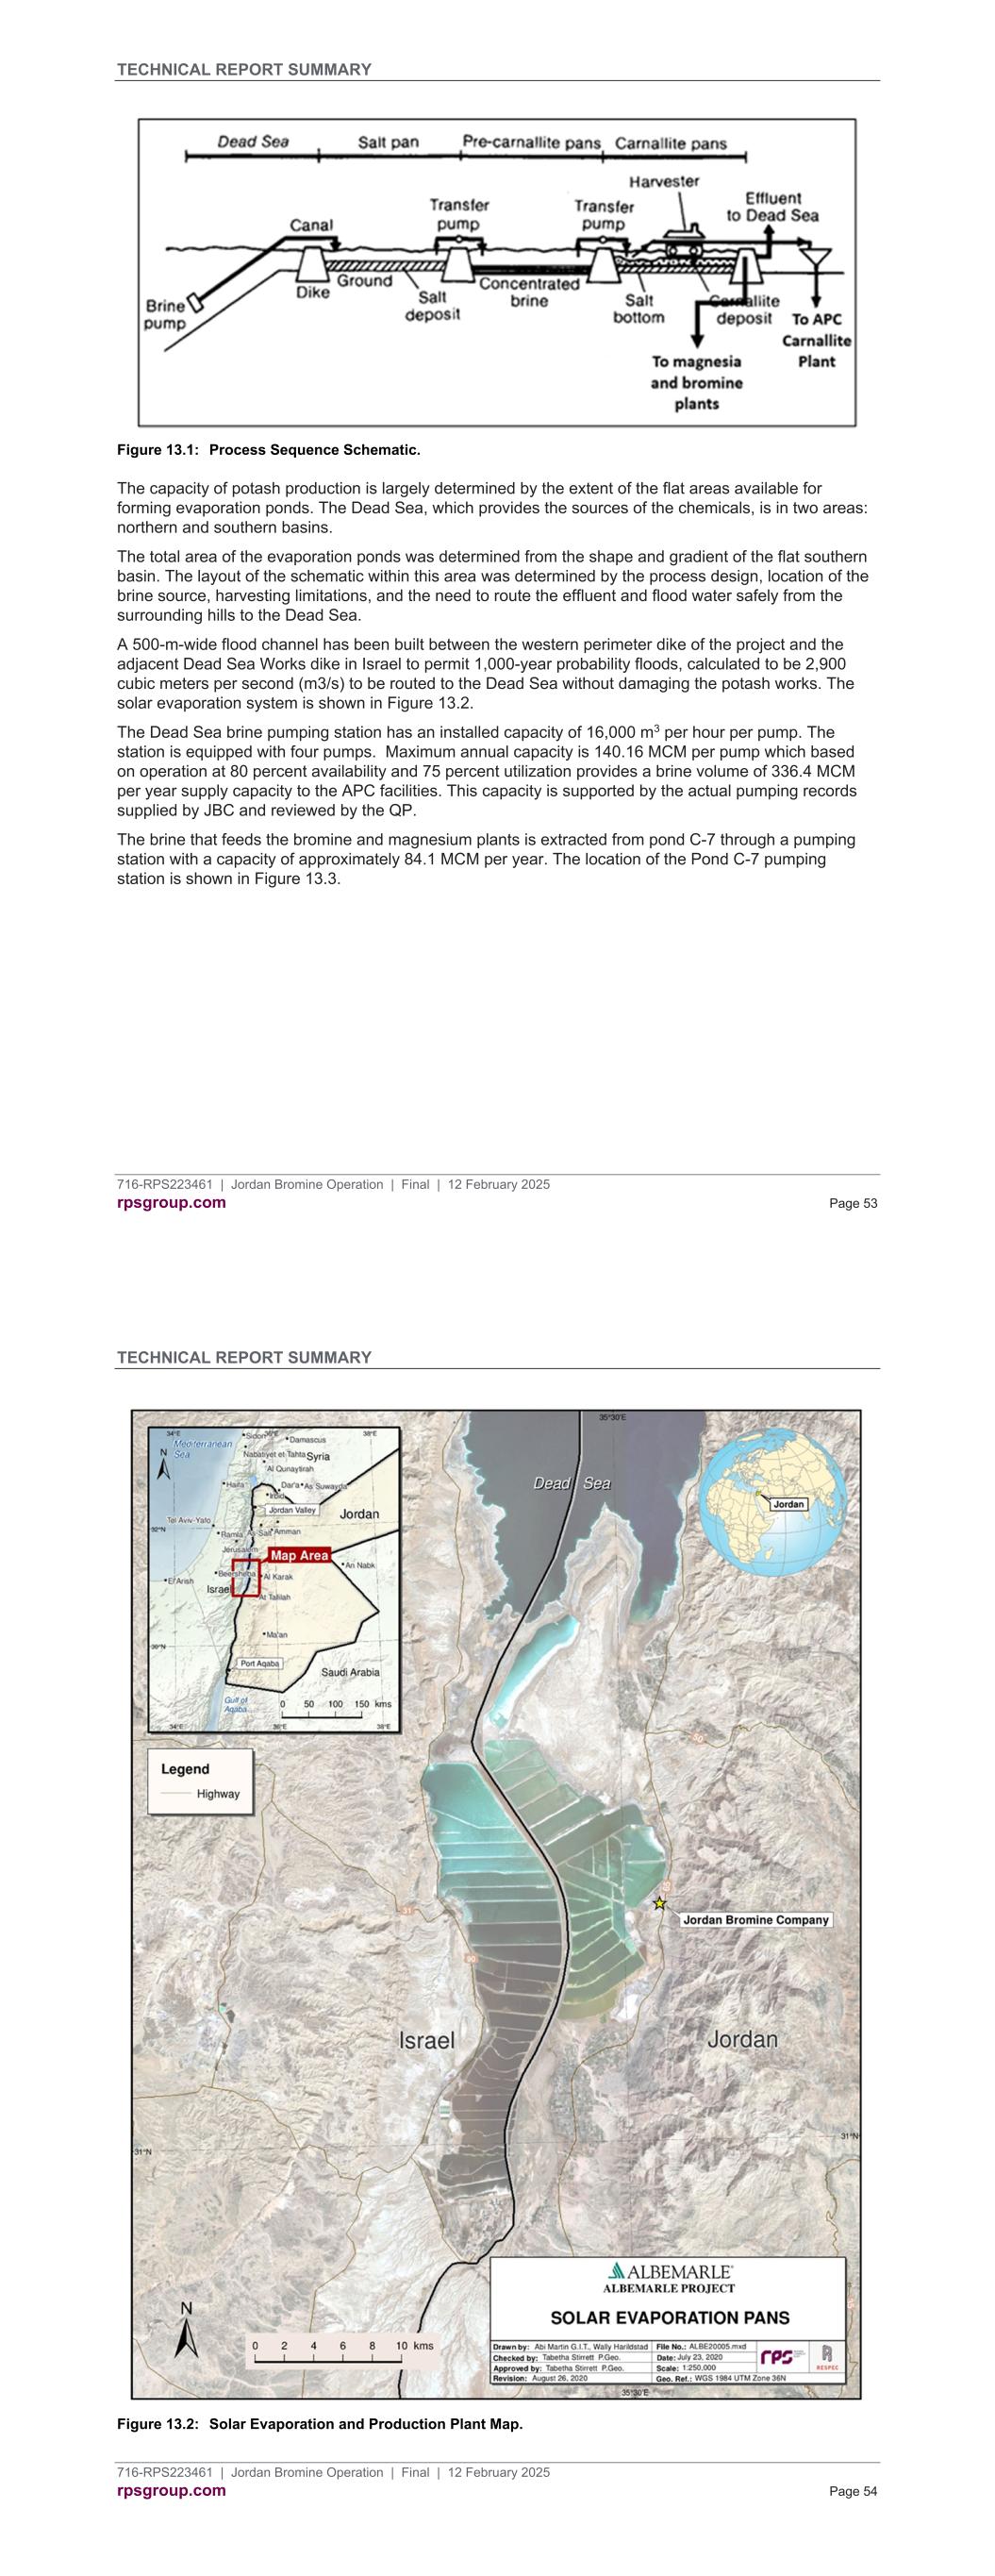
TECHNICAL REPORT SUMMARY 716-RPS223461 | Jordan Bromine Operation | Final | 12 February 2025 rpsgroup.com Page 53 Figure 13.1: Process Sequence Schematic. The capacity of potash production is largely determined by the extent of the flat areas available for forming evaporation ponds. The Dead Sea, which provides the sources of the chemicals, is in two areas: northern and southern basins. The total area of the evaporation ponds was determined from the shape and gradient of the flat southern basin. The layout of the schematic within this area was determined by the process design, location of the brine source, harvesting limitations, and the need to route the effluent and flood water safely from the surrounding hills to the Dead Sea. A 500-m-wide flood channel has been built between the western perimeter dike of the project and the adjacent Dead Sea Works dike in Israel to permit 1,000-year probability floods, calculated to be 2,900 cubic meters per second (m3/s) to be routed to the Dead Sea without damaging the potash works. The solar evaporation system is shown in Figure 13.2. The Dead Sea brine pumping station has an installed capacity of 16,000 m3 per hour per pump. The station is equipped with four pumps. Maximum annual capacity is 140.16 MCM per pump which based on operation at 80 percent availability and 75 percent utilization provides a brine volume of 336.4 MCM per year supply capacity to the APC facilities. This capacity is supported by the actual pumping records supplied by JBC and reviewed by the QP. The brine that feeds the bromine and magnesium plants is extracted from pond C-7 through a pumping station with a capacity of approximately 84.1 MCM per year. The location of the Pond C-7 pumping station is shown in Figure 13.3. TECHNICAL REPORT SUMMARY 716-RPS223461 | Jordan Bromine Operation | Final | 12 February 2025 rpsgroup.com Page 54 Figure 13.2: Solar Evaporation and Production Plant Map.
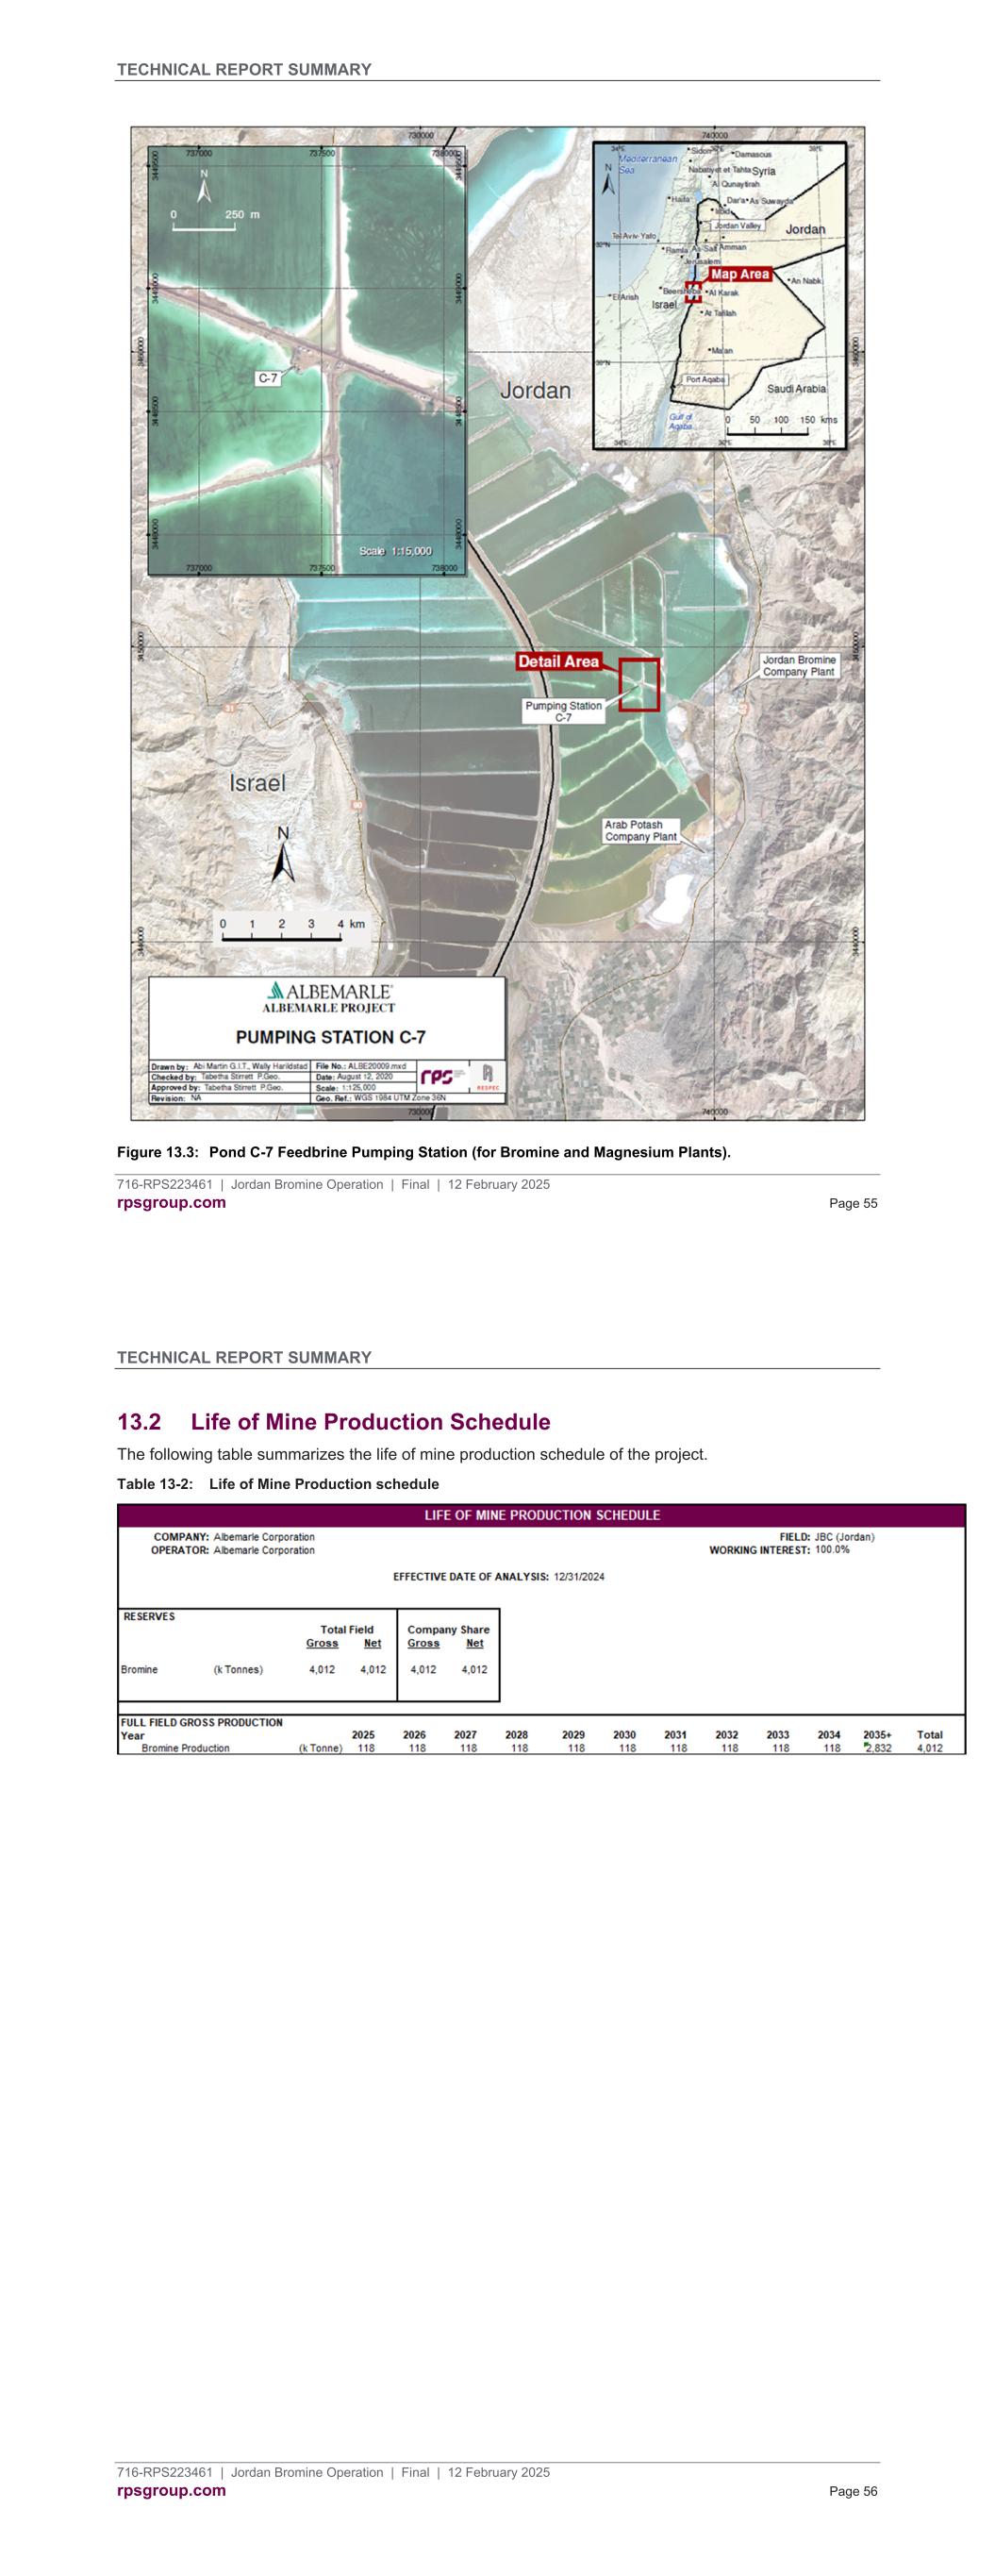
TECHNICAL REPORT SUMMARY 716-RPS223461 | Jordan Bromine Operation | Final | 12 February 2025 rpsgroup.com Page 55 Figure 13.3: Pond C-7 Feedbrine Pumping Station (for Bromine and Magnesium Plants). TECHNICAL REPORT SUMMARY 716-RPS223461 | Jordan Bromine Operation | Final | 12 February 2025 rpsgroup.com Page 56 13.2 Life of Mine Production Schedule The following table summarizes the life of mine production schedule of the project. Table 13-2: Life of Mine Production schedule
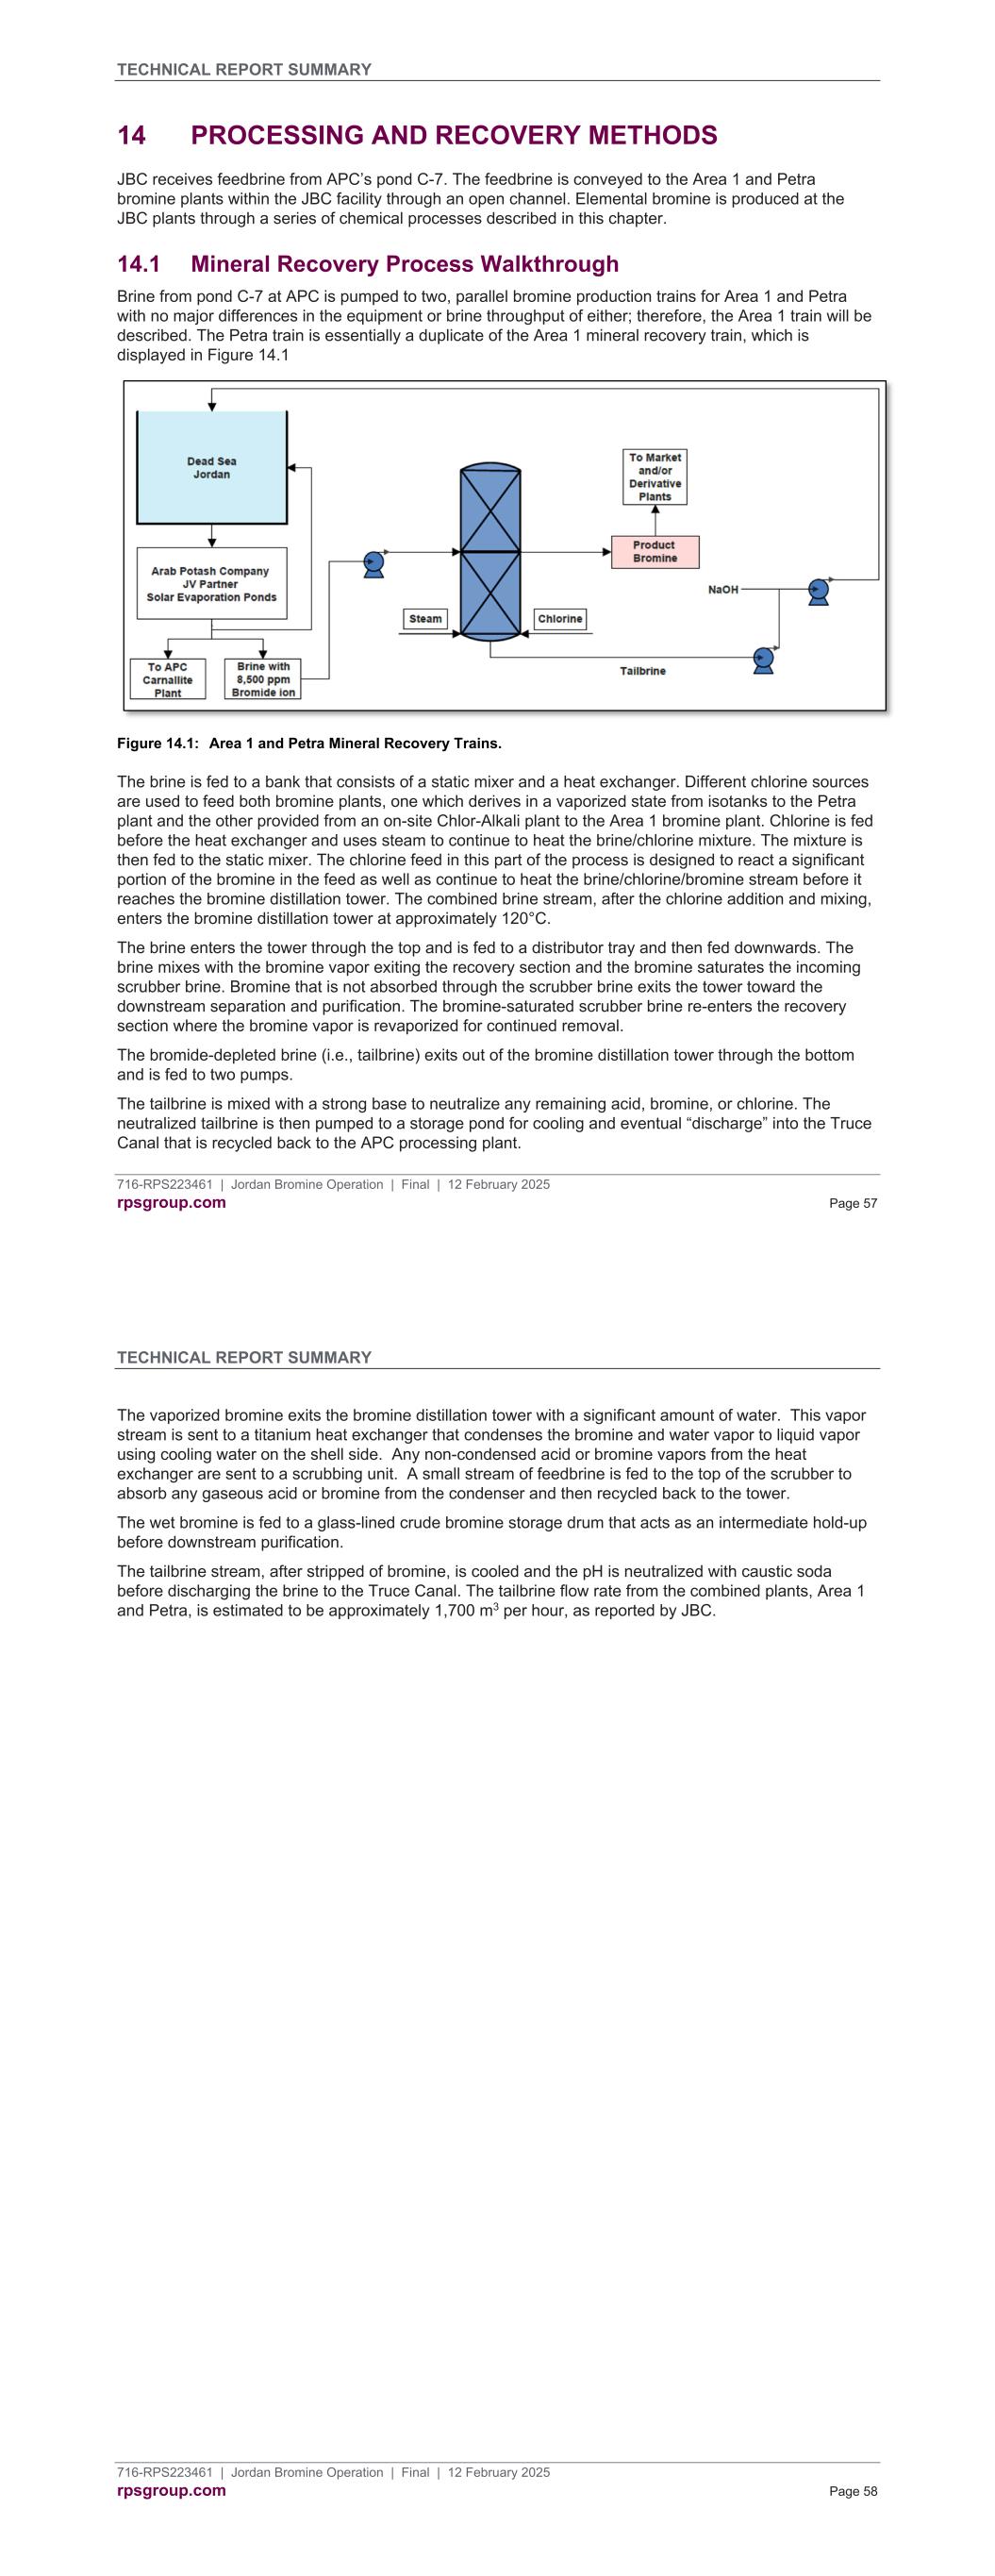
TECHNICAL REPORT SUMMARY 716-RPS223461 | Jordan Bromine Operation | Final | 12 February 2025 rpsgroup.com Page 57 14 PROCESSING AND RECOVERY METHODS JBC receives feedbrine from APC’s pond C-7. The feedbrine is conveyed to the Area 1 and Petra bromine plants within the JBC facility through an open channel. Elemental bromine is produced at the JBC plants through a series of chemical processes described in this chapter. 14.1 Mineral Recovery Process Walkthrough Brine from pond C-7 at APC is pumped to two, parallel bromine production trains for Area 1 and Petra with no major differences in the equipment or brine throughput of either; therefore, the Area 1 train will be described. The Petra train is essentially a duplicate of the Area 1 mineral recovery train, which is displayed in Figure 14.1 Figure 14.1: Area 1 and Petra Mineral Recovery Trains. The brine is fed to a bank that consists of a static mixer and a heat exchanger. Different chlorine sources are used to feed both bromine plants, one which derives in a vaporized state from isotanks to the Petra plant and the other provided from an on-site Chlor-Alkali plant to the Area 1 bromine plant. Chlorine is fed before the heat exchanger and uses steam to continue to heat the brine/chlorine mixture. The mixture is then fed to the static mixer. The chlorine feed in this part of the process is designed to react a significant portion of the bromine in the feed as well as continue to heat the brine/chlorine/bromine stream before it reaches the bromine distillation tower. The combined brine stream, after the chlorine addition and mixing, enters the bromine distillation tower at approximately 120°C. The brine enters the tower through the top and is fed to a distributor tray and then fed downwards. The brine mixes with the bromine vapor exiting the recovery section and the bromine saturates the incoming scrubber brine. Bromine that is not absorbed through the scrubber brine exits the tower toward the downstream separation and purification. The bromine-saturated scrubber brine re-enters the recovery section where the bromine vapor is revaporized for continued removal. The bromide-depleted brine (i.e., tailbrine) exits out of the bromine distillation tower through the bottom and is fed to two pumps. The tailbrine is mixed with a strong base to neutralize any remaining acid, bromine, or chlorine. The neutralized tailbrine is then pumped to a storage pond for cooling and eventual “discharge” into the Truce Canal that is recycled back to the APC processing plant. TECHNICAL REPORT SUMMARY 716-RPS223461 | Jordan Bromine Operation | Final | 12 February 2025 rpsgroup.com Page 58 The vaporized bromine exits the bromine distillation tower with a significant amount of water. This vapor stream is sent to a titanium heat exchanger that condenses the bromine and water vapor to liquid vapor using cooling water on the shell side. Any non-condensed acid or bromine vapors from the heat exchanger are sent to a scrubbing unit. A small stream of feedbrine is fed to the top of the scrubber to absorb any gaseous acid or bromine from the condenser and then recycled back to the tower. The wet bromine is fed to a glass-lined crude bromine storage drum that acts as an intermediate hold-up before downstream purification. The tailbrine stream, after stripped of bromine, is cooled and the pH is neutralized with caustic soda before discharging the brine to the Truce Canal. The tailbrine flow rate from the combined plants, Area 1 and Petra, is estimated to be approximately 1,700 m3 per hour, as reported by JBC.
TECHNICAL REPORT SUMMARY 716-RPS223461 | Jordan Bromine Operation | Final | 12 February 2025 rpsgroup.com Page 59 15 INFRASTRUCTURE 15.1 Roads and Rail JBC is approximately 130 km south-southwest from Amman, and 40 km from the city of Al-Karak. The Jordan Valley Highway/Route 65 is a major highway that runs from the northwest region of Jordan, from North Shuna, along the western edge of Jordan and south to Aqaba and the Port of Aqaba. This highway is the primary access method for supplies and personnel to JBC. The Port of Aqaba is the main entry point for supplies and equipment for JBC, where shipping containers imported on ships are offloaded to trucks and transported to JBC by the Jordan Valley Highway/Route 65. Aqaba is approximately 205 km south of JBC. Major international airports can be readily accessed either at Amman or Aqaba. Jordan’s railway transport line is operated by the Hijazi Jordan Railway and the Aqaba Railway Corporation (Al Rawabi Environment & Energy Consultancies). The line runs north-south through Jordan and is not used to transport JBC employees and/or product. 15.2 Port Facilities Jordan Bromine Company ships caustic potash (KOH), NaBr, and CaBr in bulk through a storage terminal in Aqaba. The terminal has storage tanks as well as pumps and piping for loading these products onto ships. JBC is using two sites at Aqaba: Aqaba Port JBC Terminal: A storage site in the free zone industrial area, to the west of Aqaba Power Station, approximately 1.5 km east of the Oil Terminal. Liquid products are stored at this site before they are exported through the Oil Terminal. JBC’s main activities at Aqaba are raw material/product storing, importing, and exporting. Materials that JBC handles at Aqaba Port and JBC’s Terminal sites are shown in Table 15-1 and Table 15-2, respectively. Table 15-1: Materials Handled by JBC at Aqaba Port and JBC Terminal Material Status Hydrogen peroxide solution (50%) Importing Ethyl Alcohol (96%) Importing BPA (Bisphenol A) – powder Importing Bromine Exporting Hydrobromic Acid solution (48%) Exporting Ethyl Bromide Exporting TBBPA (Tetrabromo Bisphenol A) – powder Exporting JBC Terminal contains storage tanks and pumps for receiving and unloading products (calcium bromine [CaBr2], NaBr, KOH 50 percent, and NaOH 50 percent) from the Ghor Al-Safi site. The products are sent and received to/from the JBC Terminal and Ghor Al-Safi sites using road tankers (i.e., trucks) and iso- tanks. The operation is controlled by the JBC Terminal supervisor in addition to four operators. The JBC Terminal site consists of aboveground tanks sitting on reinforced concrete bases. A water storage tank is also used for flushing the pipes that are used for loading ocean going vessels and for all water needs on the site. TECHNICAL REPORT SUMMARY 716-RPS223461 | Jordan Bromine Operation | Final | 12 February 2025 rpsgroup.com Page 60 Table 15-2: Materials Stored at Jordan Bromine Company Terminal Material Status Calcium Bromide solution (55%) Storage and Exporting Sodium Bromide solution (45%) Storage and Exporting Potassium Hydroxide solution (50%) Storage and Exporting Sodium Hydroxide solution (50%) Storage and Exporting Nitrogen storage and vaporizer provides for the blanketing of each of the product storage tanks to maintain the products specifications and prevent absorbing carbon dioxide (CO2) from the atmosphere that will lead to formation of carbonates and affect the pH of the product. The nitrogen is also used for purging the shipping lines after loading. The products stored at the JBC Terminal are sold to external customers directly and transported by ocean-going vessels. When a vessel is loaded, two transfer lines (950 m long each) that extend from the JBC Terminal toward the Oil Terminal are used to deliver the product through hoses that are extended from the end of the lines at the terminal to the vessel. After loading the vessel, the lines and hoses are flushed with water and then nitrogen is used to purge the hoses and loading pipelines. A nitrogen blanket is sometimes needed for vessels that are made of stainless steel when the loaded materials are CaBr2 or NaBr. All safety standards followed in the Aqaba site are the same as those followed at the Ghor Al-Safi site as per safety procedures. These safety standards follow the same company policy and targets. Personal protective equipment (PPE) is worn by all employees at the sites. An evaporation pond collects the waste streams from pipe flushing, housekeeping, and other activities and is operated on the basis of natural evaporation with zero discharge coming from the pond. The estimated waste streams resulting from the plant’s housekeeping and flushing of loading lines are approximately 120 (m3 per month). The evaporation pond capacity is approximately 1,800 m3 and is lined to protect the groundwater against infiltration and fenced to prevent trespassers. The collected deposits (salts) from the pond are periodically removed and disposed of in a proper landfiII in full compliance with ASEZA environmental directorate. 15.3 Plant Facilities Infrastructure and facilities to support the operation of the bromine production plant at the Ghor Al-Safi site is contained in an approximately 33-ha area. 15.3.1 Water Supply Fresh water is supplied from the Mujib River, a river that originates from the Mujib Reservoir, which is a man-made reservoir created in 1987 by the Royal Society for the Conservation of Nature. The Mujib River flows west through the Wadi Mujib Canyon and into the Dead Sea. Approximately 1.0 to 1.2 million cubic meters of water is used annually. JBC has a contract for the water rights to the Mujib Reservoir, which is for the right to access 1.8 million m3 of water per year. The water from the Mujib Reservoir is processed through a series of filtration units before being stored in a 250 m3, carbon-steel tank. From this tank, the water is distributed to the various downstream users including cooling water, potable water, and reverse osmosis water.

TECHNICAL REPORT SUMMARY 716-RPS223461 | Jordan Bromine Operation | Final | 12 February 2025 rpsgroup.com Page 61 15.3.2 Power Supply Electricity is generated through the NEPCO and distributed directly to JBC by EDCO, a company owned and operated by Kingdom Electricity Company. Kingdom Electricity Company is one of the preeminent holding companies in Jordan that invests in energy generation and distribution companies/utilities. The site load is below principal tariff level (< 22 MW). There are six substations on-site that are equipped with ABB switchgear and MCCs. The main transformer is a 33 kilovolt (KV)/11KV with 10.0/12.5 megavolt amperes (MVA) ONAN/ONAF rating. Nine additional stepdown transformers of different ratings provide site power at 420 volts (V). Concerning stability and outages by NEPCO/EDCO, most outages noted just voltage dips or spikes that trip the plant breaker and happen for a few seconds during winter. Electrical blackout occurred on May 21, 2021. This blackout was the first one since 2003. Electrical infrastructure has improved significantly, but there are still some risks prevalent. 15.3.3 Brine Supply Brine is supplied to the JBC plant area by pipeline from APC’s pond C-7. Vertical pumps extract brine from pond C-7 with additional centrifugal pumps feeding the brine to the JBC plant site. Centrifugal pumps return the tailbrine from the bromine recovery tower to the Truce Canal through pipeline. 15.3.4 Waste-Steam Management Downstream from the heat exchanger bank, the tailbrine is mixed with caustic soda to neutralize any remaining acid, bromine, or chlorine. The tail brine stream is neutralized by caustic soda before being discharged to the Truce Canal and then finally to the Dead Sea. TECHNICAL REPORT SUMMARY 716-RPS223461 | Jordan Bromine Operation | Final | 12 February 2025 rpsgroup.com Page 62 16 MARKET STUDIES 16.1 Bromine Market Overview As reported by Technavio [2021]32, a market research company, the global bromine market is expected to grow steadily at a Compound Annual Growth Rate (CAGR) of around 4.02 percent during 2022-2027 the bromine market has the potential to grow by USD 964.37 million. One major reason for this trend is the increased demand for plastics. Flame-retardant chemicals use bromine to develop fire resistance. Plastics are widely used in packaging, construction, electrical and electronics items, automotive, and many other industries. The increasing demand for plastics across various end-user industries is driving the demand for flame-retardant chemicals that in turn, will propel the bromine market. Another trend that is responsible for a growing bromine market forecast is the growth in bromine and bromine derivatives used as mercury-reducing agents. Bromine derivatives are used in reducing mercury emissions from coal combustion in coal-fired power plants. Mercury emissions in the environment is a major concern for public health. The rising health concern along with stringent government regulations may increase global bromine market demand. Technavio [2021]32 also reports that the markets for specialty chemicals such as fluorochemicals and pyridine are expected to grow at a CAGR of around 5 to 7 percent during 2022-2025. The increased use of specialty chemicals in various end-use industries such as oil and gas, automobile, pharmaceuticals, and construction will also drive the demand for bromine. 16.2 Major Producers The major producers of elemental bromine in the world are Israel, Jordan, China, and the United States, as shown in Table 16-1. The bromine production from the United States is withheld to avoid disclosing company proprietary data. The world total values exclude the bromine produced in the United States. Table 16-1: Bromine Production in Metric Tonnes by Leading Countries (2018-2023) 33 Country 2018 (Mt) 2019 (Mt) 2020 (Mt) 2021(e) (Mt) 2022(e) (Mt) 2023(e) (Mt) Israel 175,000 180,000 170,000 182,000 178,000 170,000 Jordan 100,000 150,000 84,000 110,000 115,000 120,000 China 60,000 64,000 70,000 70,000 73,000 76,000 Japan 20,000 20,000 20,000 18,000 20,000 20,000 Ukraine 4,500 4,500 4,500 4,500 10,800 11,000 India 2,300 10,000 3,300 5,000 3,500 3,500 United States W W W W W W World Total (Rounded) 362,000 429,000 352,000 390,000 400,000 400,000 (e) estimated W = withheld. The prominent players in the global bromine market are Israel Chemicals Limited (Israel), Albemarle Corporation (United States), Chemtura Corporation (United States), Tosoh Corporation (Japan), Tata Chemicals Limited (India), Gulf Resources Inc. (China), TETRA Technologies, Inc. (United States), Hindustan Salts Limited (India), Honeywell International Inc. (United States), and Perekop Bromine (Republic of Crimea).
TECHNICAL REPORT SUMMARY 716-RPS223461 | Jordan Bromine Operation | Final | 12 February 2025 rpsgroup.com Page 63 16.3 Major Markets The global bromine market is dominated by manufacturers who have an extensive geographical presence with massive production facilities, all around the world. Competition among the major players is mostly based on technological innovation, price, and product quality. According to a report by Market Research Future [2023]34, which forecasts the global bromine market until 2032, the market is divided into five regions: North America, Europe, Asia Pacific, and Rest of the World. Among these, Market Research Future [2023]34 predicts that Asia Pacific would be the fastest- growing region for bromine consumption because of a growing population and increasing purchasing power in the developing nations. The growth of agriculture and automobile industries in countries such as China and India will also drive the increasing demand for bromine. North America will remain a dominant market, and developed industries such as cosmetics, automobile, and pharmaceuticals will affect the demand for bromine. The European region is expected to experience a moderate growth that will be driven by the cosmetic and automobile industries. The growing oil-and-gas drilling activities in Russia will also contribute to the growth of the bromine market. 16.4 Bromine Price Trend The price of bromine gradually increased during the period 2014-2021. The price in January 2014 was approximately $2,800 per tonne and in January 2021 it had increased to approximately $5,200 per tonne. In 2021, the price of bromine significantly increased, reaching a peak of $10,700 per tonne in November, before falling sharply and ranging between $2,000 to $4,000 in 2023 and 2024. The bromine spot price on the effective date of this report, December 31, 2024, was USD 3,020 per tonne and the overall outlook is relatively stable pricing at current levels. Bromine prices have greatly decreased in the last two years mainly because of reduced demand and an increase in the release of domestic inventories before the close of the financial year. The slow demand for Bromine in industries such as flame-retardant production and other end-use sectors is due to excess inventories in the local market. The above-described behavior of the market is the product of a combination of factors, including China’s decrease in bromine production from brine due to the country’s electricity curtailment policy. TECHNICAL REPORT SUMMARY 716-RPS223461 | Jordan Bromine Operation | Final | 12 February 2025 rpsgroup.com Page 64 Figure 16.1 illustrates the behavior of bromine prices in the period January 2014-December 2024. Figure 16.1: Bromine Price Trend as per China Petroleum and Chemical Industry Federation (Price is in US$)35 16.5 Bromine Applications JBC produces a variety of substances from bromine (www.jordanbromine.com). The specific derivatives produced are not discussed in detail in this technical report for proprietary reasons. The following list illustrate the ways that elemental bromine or bromine derivatives are used in a variety of products: Flame Retardants: Bromine is very efficient as a constituent element when used in producing flame retardants; therefore, only a small amount is needed to achieve fire resistance. Biocides: Bromine reacts with other substances in water to form bromine-containing substances that are disinfectants and odorless. Pharmaceuticals: Bromide ions have the ability to decrease the sensitivity of the central nervous system, which makes them effective for use as sedatives, anti-epileptics, and tranquillizers. Mercury Emission Reduction: Bromine-based products are used to reduce mercury emissions from coal-fired power plants. Energy Storage: Bromine-based storage technologies are a highly efficient and cost-effective electro-chemical energy storage solution that provides a range of options to successfully manage energy from renewable sources, minimize energy loss, reduce overall energy use and cost, and safeguard supply. Water Treatment: Bromine-based products are ideal solutions for water-treatment applications because of bromine’s ability to kill harmful contaminants.
TECHNICAL REPORT SUMMARY 716-RPS223461 | Jordan Bromine Operation | Final | 12 February 2025 rpsgroup.com Page 65 Oil-Drilling Fluids: Bromine is used in clear brines to increase the efficiency and productivity of oil-and-gas wells. TECHNICAL REPORT SUMMARY 716-RPS223461 | Jordan Bromine Operation | Final | 12 February 2025 rpsgroup.com Page 66 17 ENVIRONMENTAL STUDIES, PERMITTING AND PLANS, NEGOTIATIONS, OR AGREEMENTS WITH LOCAL INDIVIDUALS OR GROUPS 17.1 Environmental Studies JBC has conducted environmental impact studies in compliance with Jordanian regulations. The environmental impact studies are accessible through the Multilateral Investment Guarantee Agency (MIGA) website (www.miga.org) and are part of the public domain. For the recent JBC capacity expansion, including the construction of the Petra Bromine plant and the Aqaba storage zone, JBC prepared environmental studies under international standards as part of the process to obtain financing from multilateral entities such as MIGA, which is a member of the World Bank Group. These studies evaluated all key environmental aspects such as air quality, noise levels, water resources, biodiversity, socioeconomic conditions, archaeology, and traffic studies. 17.2 Environmental Compliance 17.2.1 Compliance With National Standards JBC complies with national regulations including the Environment Protection Law (No. 52/2006), Public Health Law (No. 47/2008), Civil Defense Law (No. 18/1999) and Labor Law (No. 8/1996). JBC also meets or exceeds the Occupational Safety and Health Administration (OSHA) and National Fire Protection (NFPA) international regulations. 17.2.2 Compliance With International Standards JBC is the first company of its kind in Jordan to become an authorized exporter to Europe and has been certified for International Organization of Standards (ISO) 9001, ISO14001 and the Voluntary Emissions Control Action Program (VECAP). The VECAP is a global chemical management program based on a Code of Best Practice for handling and using brominated flame retardants. JBC’s environmental program has been ISO 14001 certified by Lloyd’s Register since 2007 and further enhanced through the adoption of the integrated management system for quality (IS0 9001: 2015, OHSASL800L, 2007, ISO/4001:2015) certifications received in 2018. Audits of the environmental program area are conducted on a monthly basis by JBC management, and regular corporate audits are conducted by Albemarle Health, Safety and Environmental staff. All JBC employees receive awareness training on the primary environmental procedures (e.g., waste management), ISO 14001 procedures, and the VECAP program. JBC’s operators are trained and certified to operate equipment that is critical to the environment, such as scrubbers and boilers. All employees handling waste materials are trained and certified on the specific handling procedures. JBC has implemented multifaceted programs to reduce water consumption. JBC utilizes water recycling, and in 2011 it implemented a program which achieved a 15 percent reduction in freshwater consumption (~ 30 m3 / hr). JBC’s bromine production site in Safi has extensive water management and reduction programs in place and by applying a process heat integration and by operating at higher concentrations in certain process streams, it has managed to reduce the use of freshwater at its cooling towers by 2.6m3/hr of fresh water. In 2020, the water reused as part of the wastewater treatment was 77,000m3, and in 2021 it is estimated to have reached 90,000m3.
TECHNICAL REPORT SUMMARY 716-RPS223461 | Jordan Bromine Operation | Final | 12 February 2025 rpsgroup.com Page 67 17.2.3 Environmental Monitoring JBC has programs in place for monitoring noise and emissions to air and water. JBC also has a waste- management program that includes procedures for storage, handling, and disposing municipal, organic- containing, non-hazardous, and hazardous waste. A water-reduction program is also part of JBC’s monitoring program. An industrial hygiene program that is designed to ensure that employees are not harmed by exposure to chemicals or noise also exists, and work area and personal monitoring are conducted annually. JBC has an incident reporting system for reporting and tracking environmental and safety incidents. All incidents, including minor spills and releases, are reported and investigated with corrective actions are tracked in a database and reviewed monthly. JBC has a HAZMAT team that is trained to respond to chemical spills and releases on company property or elsewhere in Jordan. Emergency response vehicles are equipped with materials used to stop and contain spills, as well as protective equipment for the employees. The company performs annual spill- response training with the Civil Defense Department offices in Safi and Aqaba. 17.3 Requirements and Plans for Waste and Tailings Disposal Regarding the bromine production activities by JBC, the main waste product is the tailbrines (i.e., concentrated Dead Sea brines that are chemically neutralized before being sent back to the Dead Sea through the Truce Canal). Furthermore, JBC recently started two projects for the reclamation of water from waste streams that will lead to further reduction of the water footprint. The waste product of the bromine-production process does not represent a hazardous waste and does not require any other treatment or procedure for final disposal. JBC’s waste management program includes procedures for storage, handling and disposal of municipal waste, organic-containing waste, non-hazardous waste, and hazardous waste. As part of its waste management approach, JBC focuses its efforts to reduce environmental impact by tracking the waste generated at the plants, checking local and global markets for facilities that reuse or recycle the waste produced by JBC and by implementing measures to reduce the waste generated, especially hazardous waste that is sent to landfill. 17.4 Project Permitting Requirements, The Status of Any Permit Applications The QP understands that JBC operates in compliance with Jordan’s national regulations, such as the Environment Protection Law (No. 52/2006), the Public Health Law (No. 47/2008), the Civil Defense Law (No. 18/1999) and the Labor Law (No. 8/1996). JBC works closely with the local communities, governmental, and nongovernmental organizations (NGOs) to positively impact and to help communities prosper socially and environmentally. JBC has also established the Caring for Jordan Foundation, which contributes to the well-being of Jordanians by helping them to improve their quality of life through support of sustainable community projects. The activities include providing computer laboratories in schools and supporting several local community organizations. The project is aligned with the World Bank Group’s Country Partnership Strategy for Jordan, which commits to strengthening the country’s foundation for sustainable growth with a focus on competitiveness. MIGA’s support is also aligned with the agency’s efforts to mobilize $1 billion in insurance capacity to support foreign, direct investment into the Middle East and North Africa. TECHNICAL REPORT SUMMARY 716-RPS223461 | Jordan Bromine Operation | Final | 12 February 2025 rpsgroup.com Page 68 JBC has indicated that it seeks to help raise the quality of life for the communities where it operates for a balance of social development, environmental improvement, and economic development. JBC also provides small grants to various local projects and initiatives. In 2011, JBC created the Community Advisory Panel (CAP) to enhance communication and cooperation with the local community. The CAP periodically connects community leaders with JBC management and staff to discuss concerns and strategize on local community development, environmental protection measures, educational and health-related development initiatives, and other key areas of JBC’s involvement. 17.5 Qualified Person's Opinion The QP opines that the JBC facility is operating in conformance with high industrial standards and is comparable with other similar facilities worldwide. The high level of compliance of the project is further confirmed by JBC’s ISO 9001, 14001 and VECAP certifications. JBC’s robust Corporate Social Responsibility strategy is targeted at supporting sustainable community development projects and creating and funding sustainable social, cultural, and economic initiatives that service to local and national needs. JBC has a 3-year strategy that covers the Karak area, and in particular, the communities of Qasaba, Ghor Al-Safi, and Ghor Mazra’a. The QP found that the studies carried out by JBC met or exceeded the requirements of local and international industry standards and have been approved by Jordanian regulators. The QP also opines that JBC has effectively implemented its environmental and socioeconomic policies and has fulfilled its responsibilities efficiently.
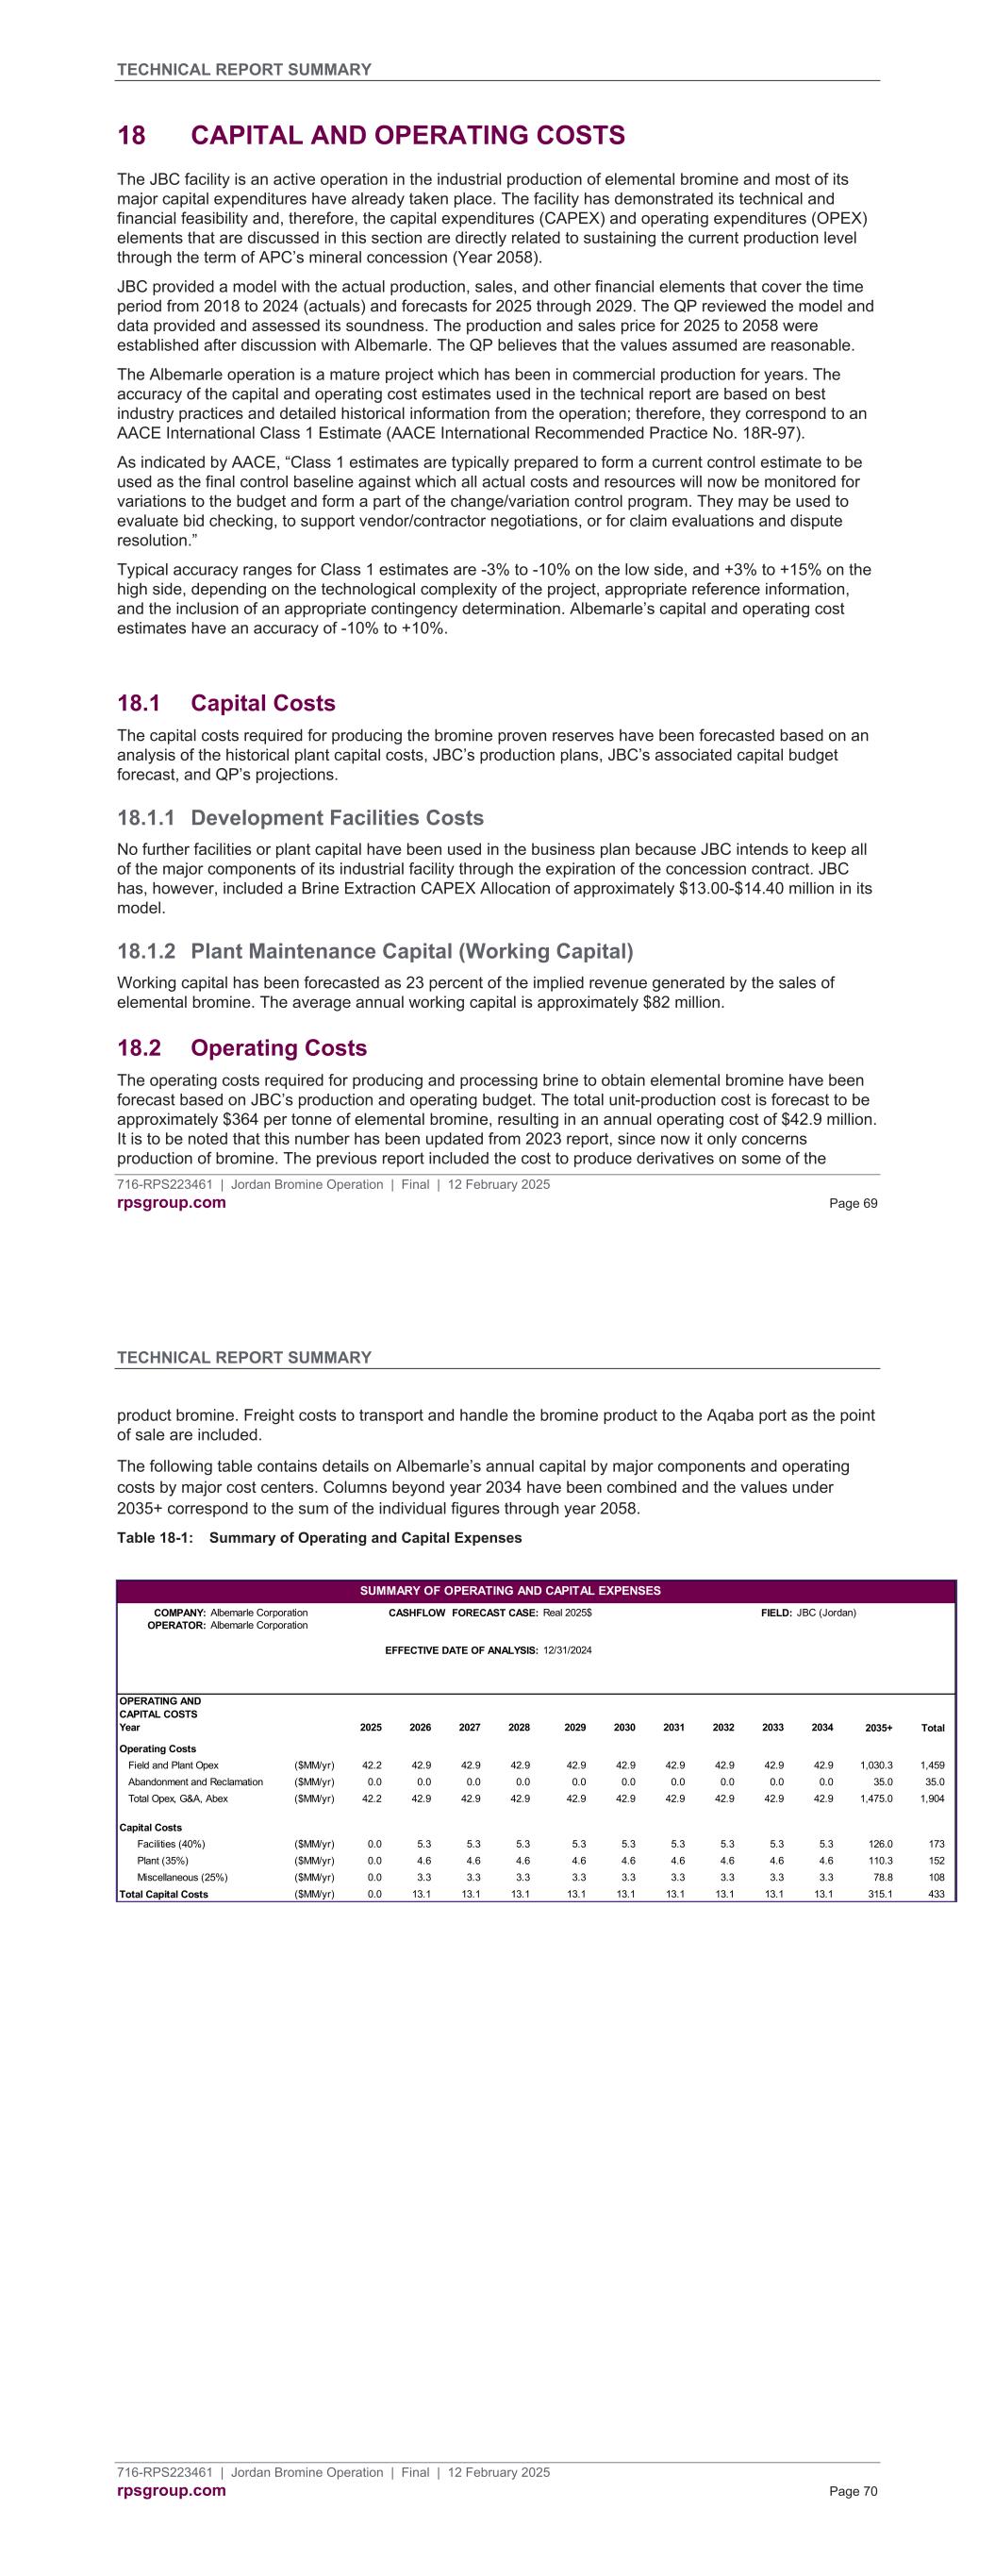
TECHNICAL REPORT SUMMARY 716-RPS223461 | Jordan Bromine Operation | Final | 12 February 2025 rpsgroup.com Page 69 18 CAPITAL AND OPERATING COSTS The JBC facility is an active operation in the industrial production of elemental bromine and most of its major capital expenditures have already taken place. The facility has demonstrated its technical and financial feasibility and, therefore, the capital expenditures (CAPEX) and operating expenditures (OPEX) elements that are discussed in this section are directly related to sustaining the current production level through the term of APC’s mineral concession (Year 2058). JBC provided a model with the actual production, sales, and other financial elements that cover the time period from 2018 to 2024 (actuals) and forecasts for 2025 through 2029. The QP reviewed the model and data provided and assessed its soundness. The production and sales price for 2025 to 2058 were established after discussion with Albemarle. The QP believes that the values assumed are reasonable. The Albemarle operation is a mature project which has been in commercial production for years. The accuracy of the capital and operating cost estimates used in the technical report are based on best industry practices and detailed historical information from the operation; therefore, they correspond to an AACE International Class 1 Estimate (AACE International Recommended Practice No. 18R-97). As indicated by AACE, “Class 1 estimates are typically prepared to form a current control estimate to be used as the final control baseline against which all actual costs and resources will now be monitored for variations to the budget and form a part of the change/variation control program. They may be used to evaluate bid checking, to support vendor/contractor negotiations, or for claim evaluations and dispute resolution.” Typical accuracy ranges for Class 1 estimates are -3% to -10% on the low side, and +3% to +15% on the high side, depending on the technological complexity of the project, appropriate reference information, and the inclusion of an appropriate contingency determination. Albemarle’s capital and operating cost estimates have an accuracy of -10% to +10%. 18.1 Capital Costs The capital costs required for producing the bromine proven reserves have been forecasted based on an analysis of the historical plant capital costs, JBC’s production plans, JBC’s associated capital budget forecast, and QP’s projections. 18.1.1 Development Facilities Costs No further facilities or plant capital have been used in the business plan because JBC intends to keep all of the major components of its industrial facility through the expiration of the concession contract. JBC has, however, included a Brine Extraction CAPEX Allocation of approximately $13.00-$14.40 million in its model. 18.1.2 Plant Maintenance Capital (Working Capital) Working capital has been forecasted as 23 percent of the implied revenue generated by the sales of elemental bromine. The average annual working capital is approximately $82 million. 18.2 Operating Costs The operating costs required for producing and processing brine to obtain elemental bromine have been forecast based on JBC’s production and operating budget. The total unit-production cost is forecast to be approximately $364 per tonne of elemental bromine, resulting in an annual operating cost of $42.9 million. It is to be noted that this number has been updated from 2023 report, since now it only concerns production of bromine. The previous report included the cost to produce derivatives on some of the TECHNICAL REPORT SUMMARY 716-RPS223461 | Jordan Bromine Operation | Final | 12 February 2025 rpsgroup.com Page 70 product bromine. Freight costs to transport and handle the bromine product to the Aqaba port as the point of sale are included. The following table contains details on Albemarle’s annual capital by major components and operating costs by major cost centers. Columns beyond year 2034 have been combined and the values under 2035+ correspond to the sum of the individual figures through year 2058. Table 18-1: Summary of Operating and Capital Expenses COMPANY: Albemarle Corporation CASHFLOW FORECAST CASE: Real 2025$ FIELD: JBC (Jordan) OPERATOR: Albemarle Corporation EFFECTIVE DATE OF ANALYSIS: 12/31/2024 OPERATING AND CAPITAL COSTS Year 2025 2026 2027 2028 2029 2030 2031 2032 2033 2034 2035+ Total Operating Costs Field and Plant Opex ($MM/yr) 42.2 42.9 42.9 42.9 42.9 42.9 42.9 42.9 42.9 42.9 1,030.3 1,459 Abandonment and Reclamation ($MM/yr) 0.0 0.0 0.0 0.0 0.0 0.0 0.0 0.0 0.0 0.0 35.0 35.0 Total Opex, G&A, Abex ($MM/yr) 42.2 42.9 42.9 42.9 42.9 42.9 42.9 42.9 42.9 42.9 1,475.0 1,904 Capital Costs Facilities (40%) ($MM/yr) 0.0 5.3 5.3 5.3 5.3 5.3 5.3 5.3 5.3 5.3 126.0 173 Plant (35%) ($MM/yr) 0.0 4.6 4.6 4.6 4.6 4.6 4.6 4.6 4.6 4.6 110.3 152 Miscellaneous (25%) ($MM/yr) 0.0 3.3 3.3 3.3 3.3 3.3 3.3 3.3 3.3 3.3 78.8 108 Total Capital Costs ($MM/yr) 0.0 13.1 13.1 13.1 13.1 13.1 13.1 13.1 13.1 13.1 315.1 433 SUMMARY OF OPERATING AND CAPITAL EXPENSES
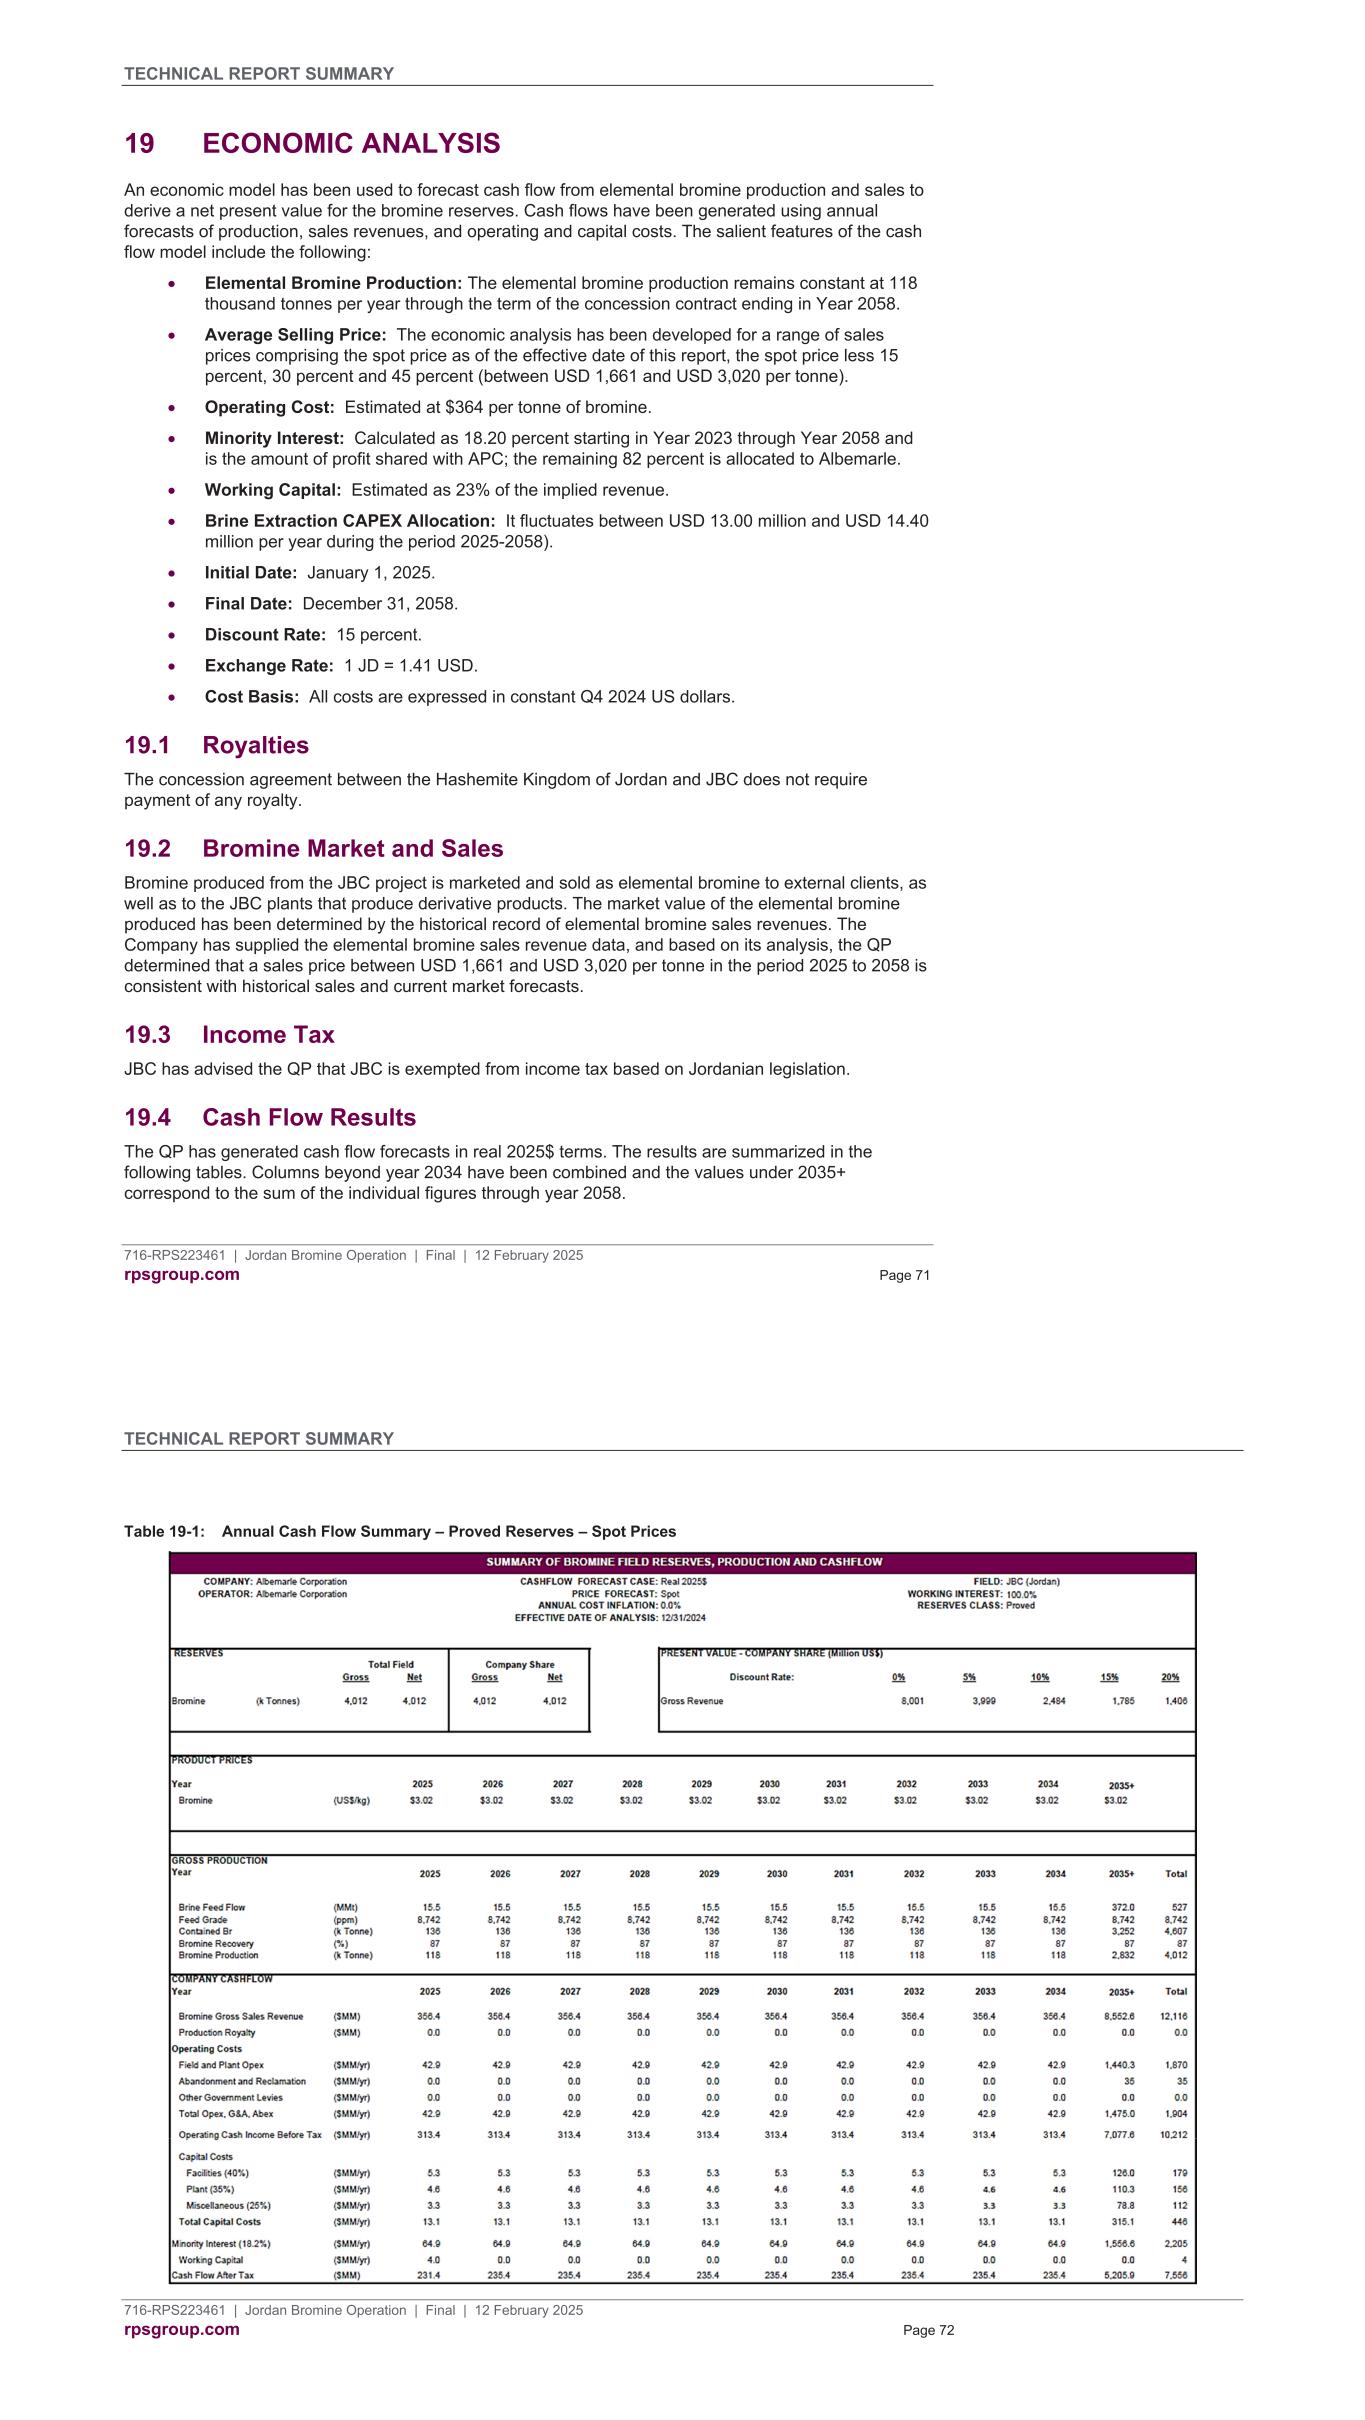
TECHNICAL REPORT SUMMARY 716-RPS223461 | Jordan Bromine Operation | Final | 12 February 2025 rpsgroup.com Page 71 19 ECONOMIC ANALYSIS An economic model has been used to forecast cash flow from elemental bromine production and sales to derive a net present value for the bromine reserves. Cash flows have been generated using annual forecasts of production, sales revenues, and operating and capital costs. The salient features of the cash flow model include the following: Elemental Bromine Production: The elemental bromine production remains constant at 118 thousand tonnes per year through the term of the concession contract ending in Year 2058. Average Selling Price: The economic analysis has been developed for a range of sales prices comprising the spot price as of the effective date of this report, the spot price less 15 percent, 30 percent and 45 percent (between USD 1,661 and USD 3,020 per tonne). Operating Cost: Estimated at $364 per tonne of bromine. Minority Interest: Calculated as 18.20 percent starting in Year 2023 through Year 2058 and is the amount of profit shared with APC; the remaining 82 percent is allocated to Albemarle. Working Capital: Estimated as 23% of the implied revenue. Brine Extraction CAPEX Allocation: It fluctuates between USD 13.00 million and USD 14.40 million per year during the period 2025-2058). Initial Date: January 1, 2025. Final Date: December 31, 2058. Discount Rate: 15 percent. Exchange Rate: 1 JD = 1.41 USD. Cost Basis: All costs are expressed in constant Q4 2024 US dollars. 19.1 Royalties The concession agreement between the Hashemite Kingdom of Jordan and JBC does not require payment of any royalty. 19.2 Bromine Market and Sales Bromine produced from the JBC project is marketed and sold as elemental bromine to external clients, as well as to the JBC plants that produce derivative products. The market value of the elemental bromine produced has been determined by the historical record of elemental bromine sales revenues. The Company has supplied the elemental bromine sales revenue data, and based on its analysis, the QP determined that a sales price between USD 1,661 and USD 3,020 per tonne in the period 2025 to 2058 is consistent with historical sales and current market forecasts. 19.3 Income Tax JBC has advised the QP that JBC is exempted from income tax based on Jordanian legislation. 19.4 Cash Flow Results The QP has generated cash flow forecasts in real 2025$ terms. The results are summarized in the following tables. Columns beyond year 2034 have been combined and the values under 2035+ correspond to the sum of the individual figures through year 2058. TECHNICAL REPORT SUMMARY 716-RPS223461 | Jordan Bromine Operation | Final | 12 February 2025 rpsgroup.com Page 72 Table 19-1: Annual Cash Flow Summary – Proved Reserves – Spot Prices
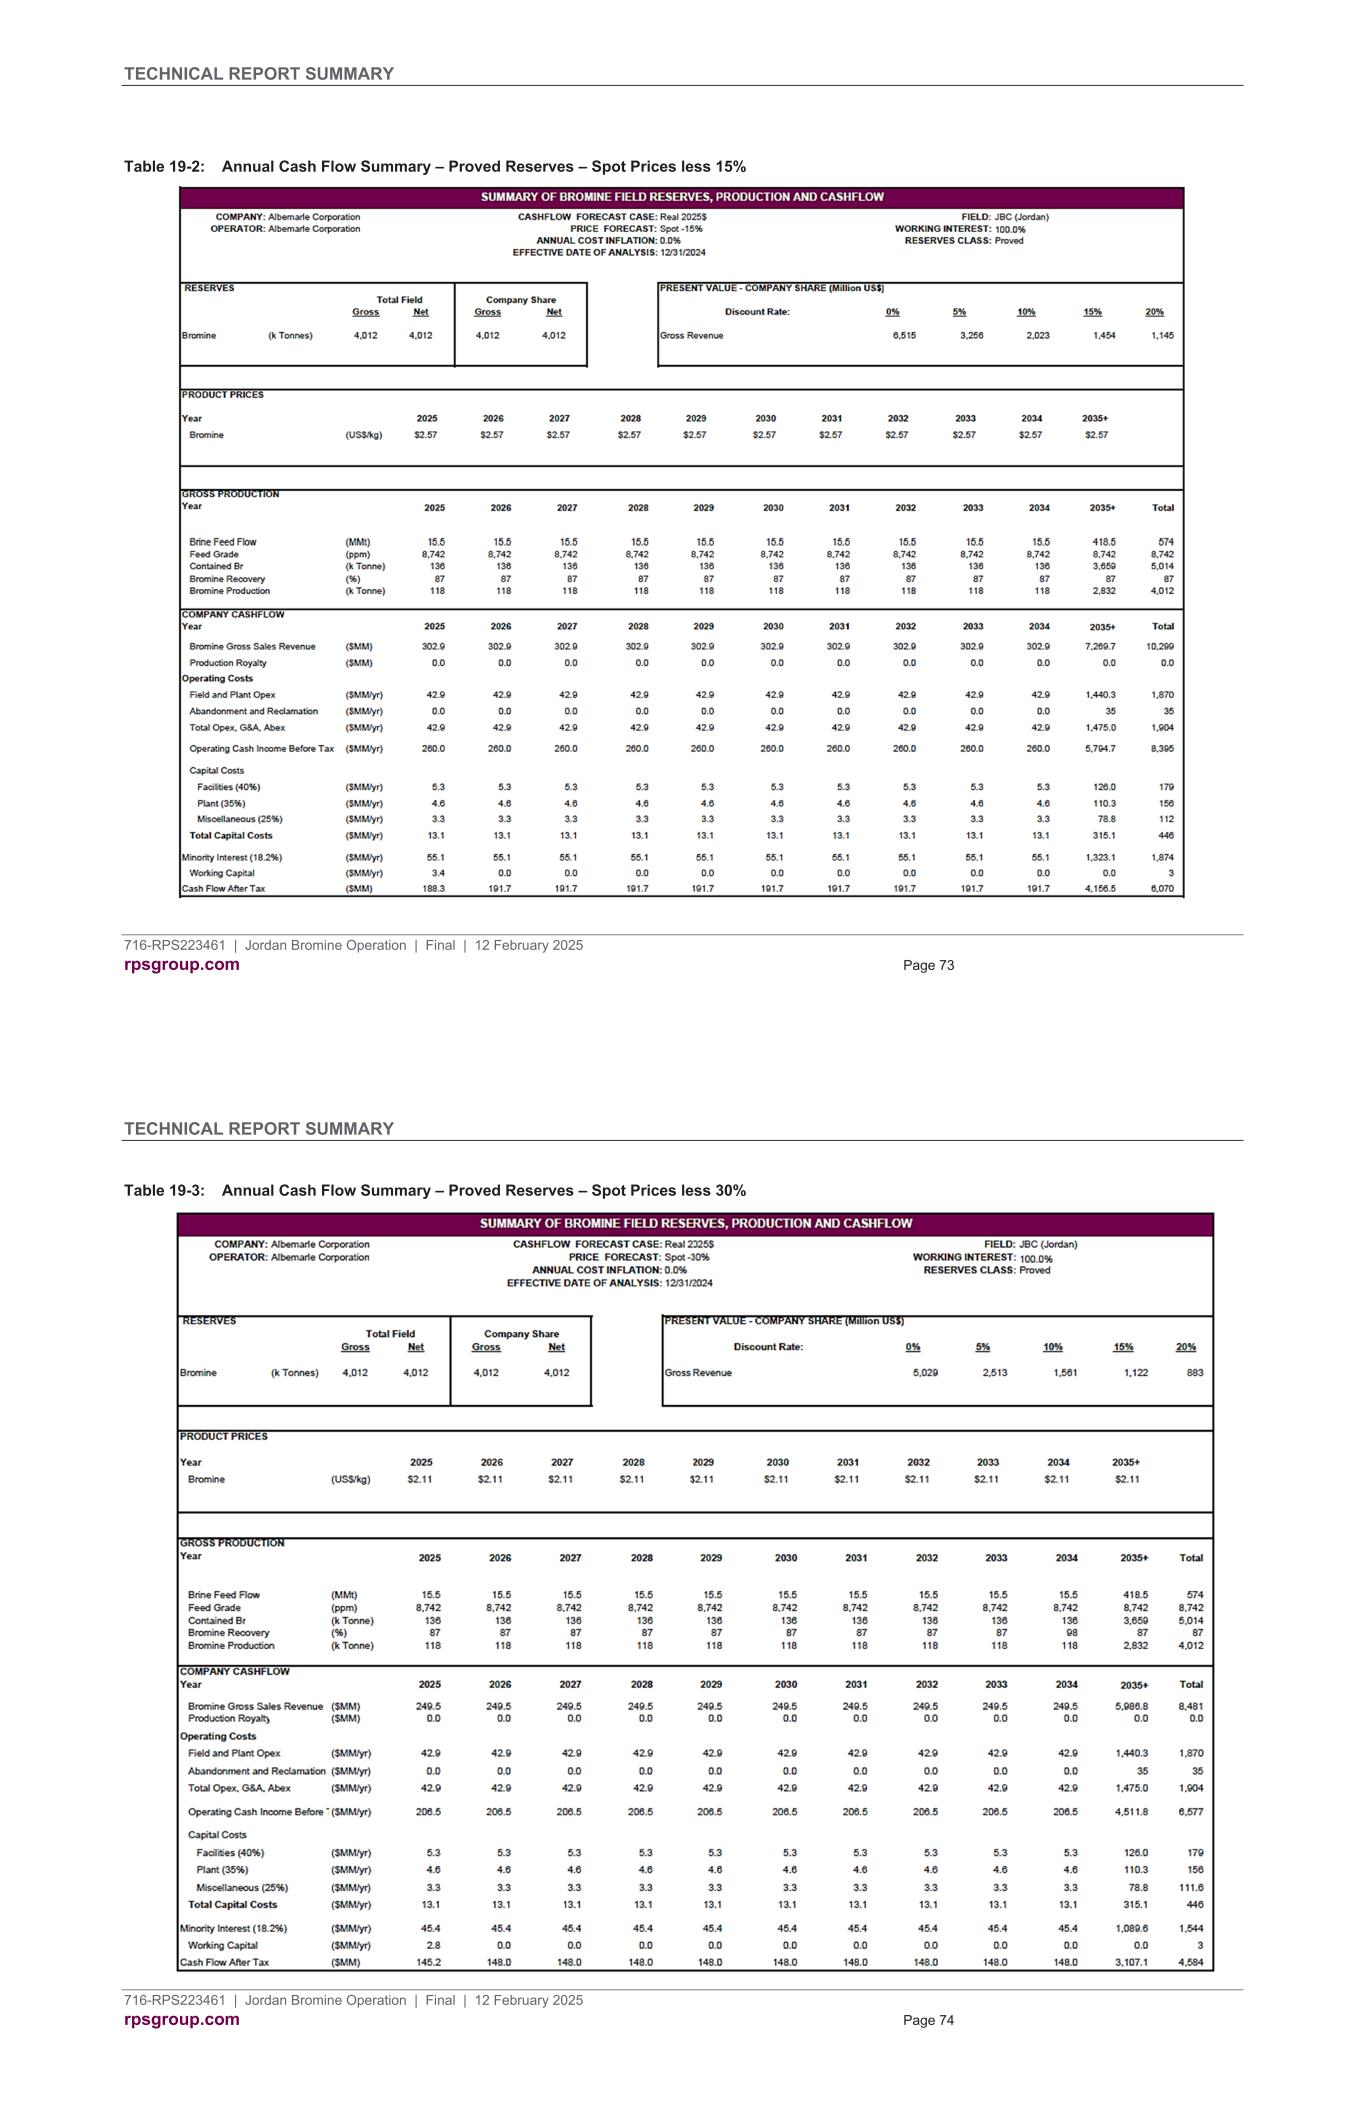
TECHNICAL REPORT SUMMARY 716-RPS223461 | Jordan Bromine Operation | Final | 12 February 2025 rpsgroup.com Page 73 Table 19-2: Annual Cash Flow Summary – Proved Reserves – Spot Prices less 15% TECHNICAL REPORT SUMMARY 716-RPS223461 | Jordan Bromine Operation | Final | 12 February 2025 rpsgroup.com Page 74 Table 19-3: Annual Cash Flow Summary – Proved Reserves – Spot Prices less 30%
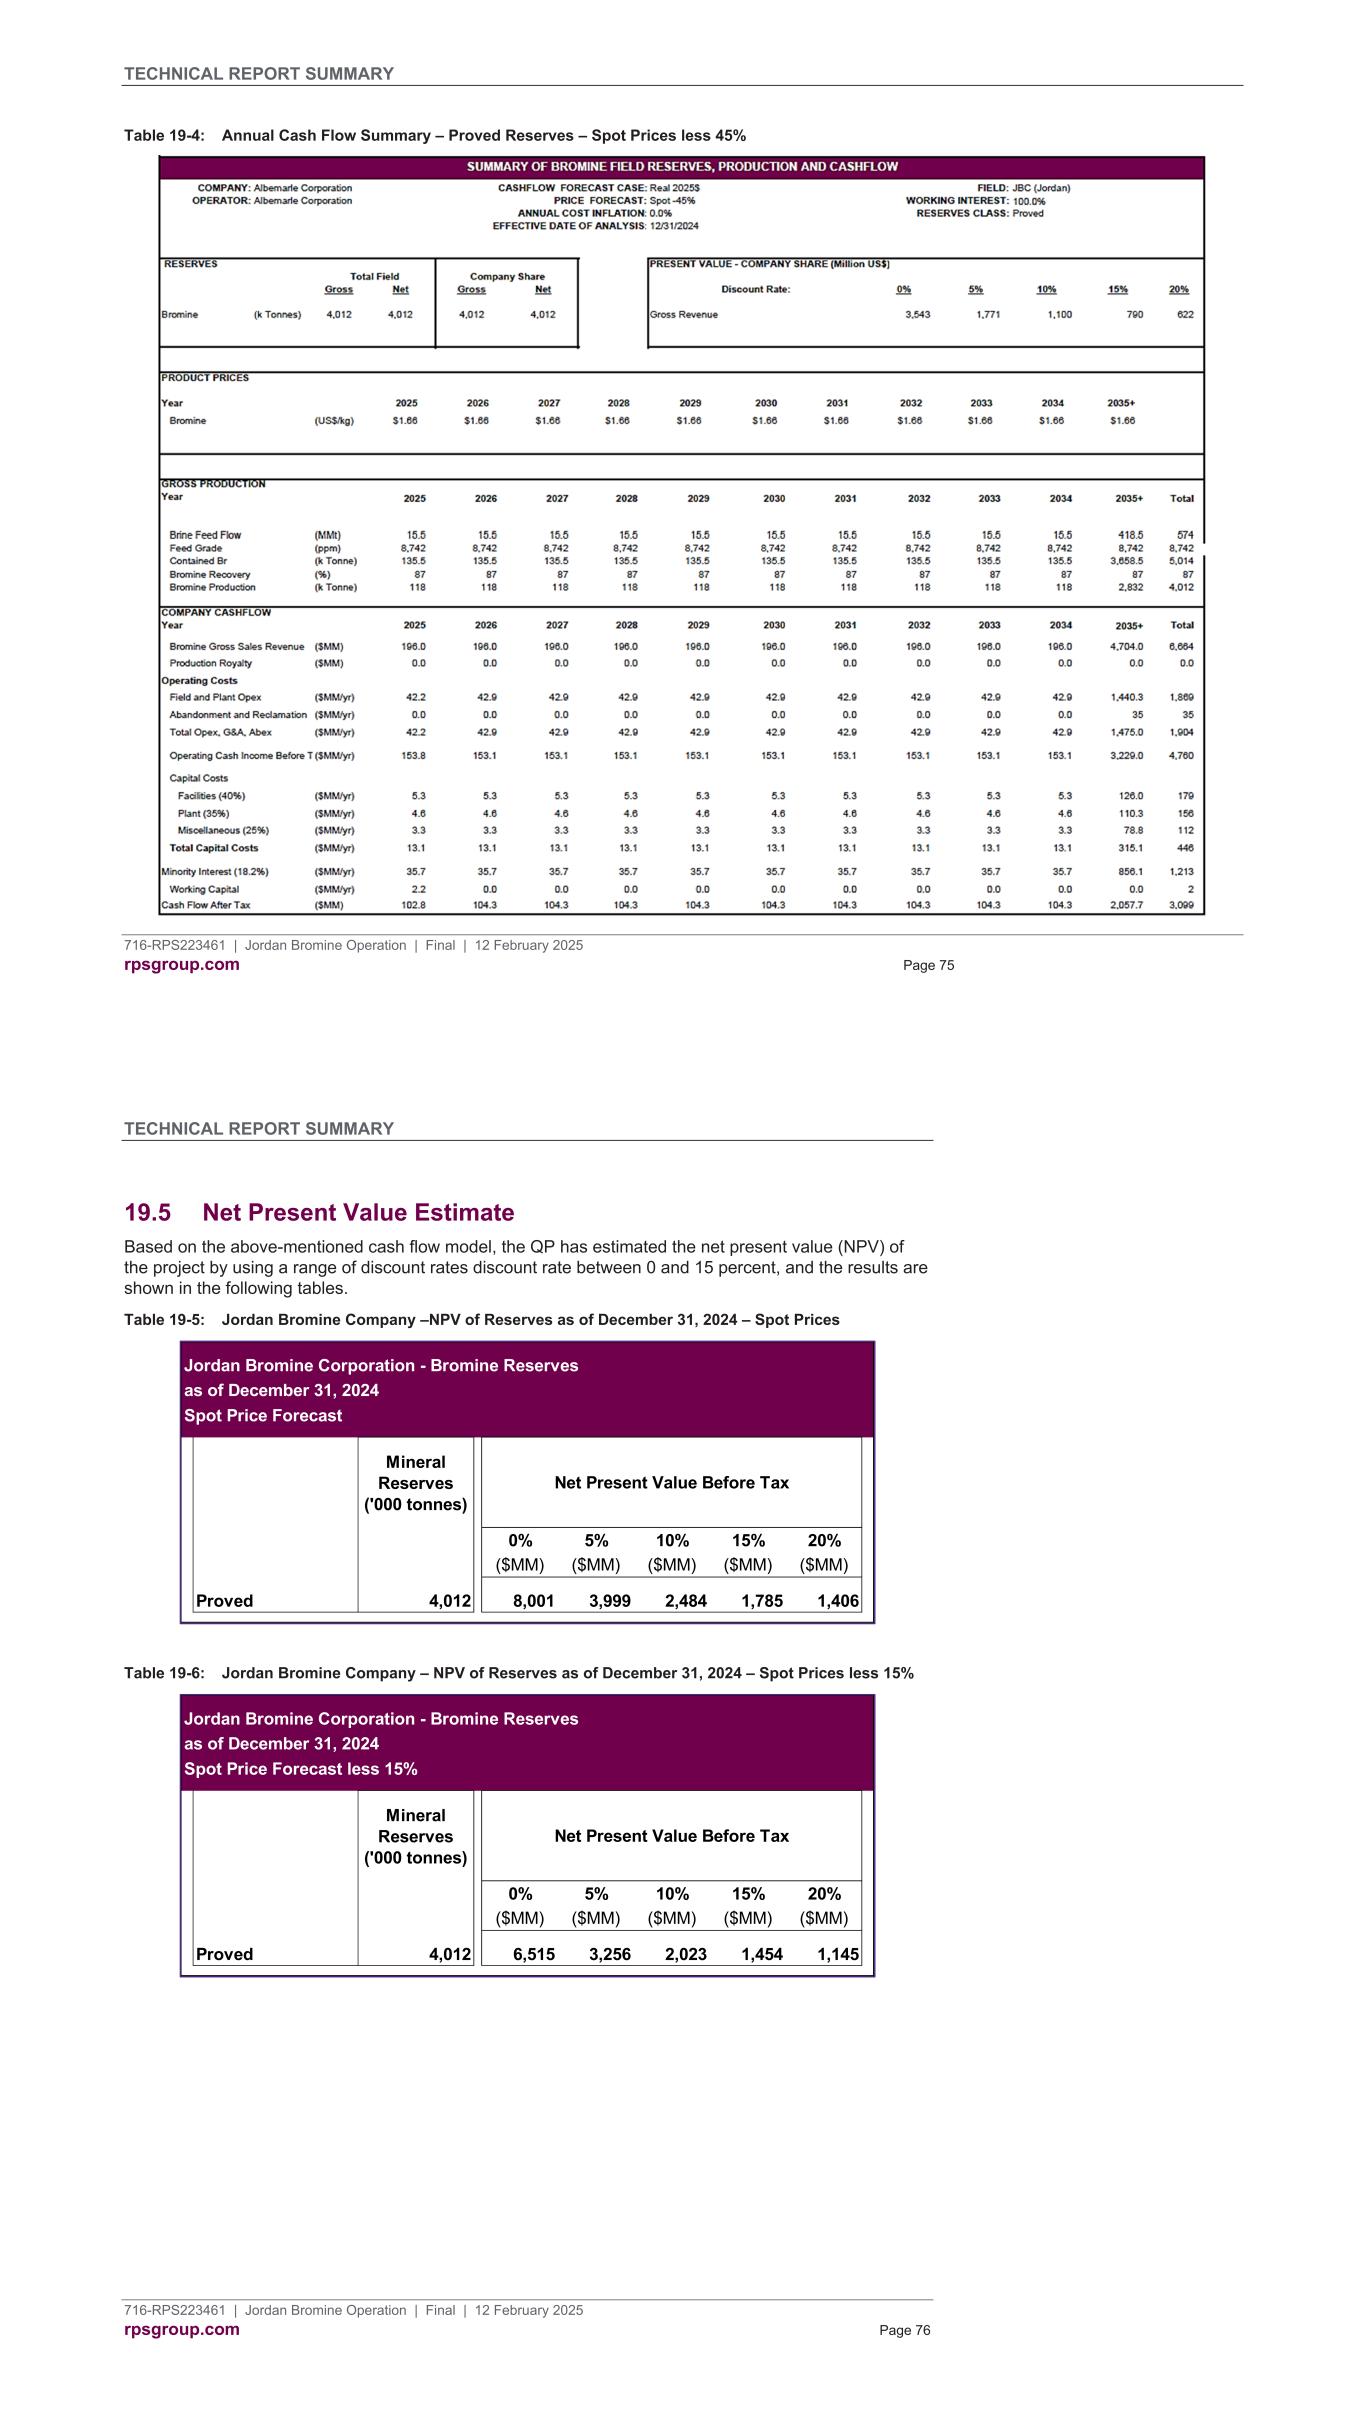
TECHNICAL REPORT SUMMARY 716-RPS223461 | Jordan Bromine Operation | Final | 12 February 2025 rpsgroup.com Page 75 Table 19-4: Annual Cash Flow Summary – Proved Reserves – Spot Prices less 45% TECHNICAL REPORT SUMMARY 716-RPS223461 | Jordan Bromine Operation | Final | 12 February 2025 rpsgroup.com Page 76 19.5 Net Present Value Estimate Based on the above-mentioned cash flow model, the QP has estimated the net present value (NPV) of the project by using a range of discount rates discount rate between 0 and 15 percent, and the results are shown in the following tables. Table 19-5: Jordan Bromine Company –NPV of Reserves as of December 31, 2024 – Spot Prices Table 19-6: Jordan Bromine Company – NPV of Reserves as of December 31, 2024 – Spot Prices less 15% Jordan Bromine Corporation - Bromine Reserves as of December 31, 2024 Spot Price Forecast Mineral Reserves ('000 tonnes) 0% 5% 10% 15% 20% ($MM) ($MM) ($MM) ($MM) ($MM) Proved 4,012 8,001 3,999 2,484 1,785 1,406 Net Present Value Before Tax Jordan Bromine Corporation - Bromine Reserves as of December 31, 2024 Spot Price Forecast less 15% Mineral Reserves ('000 tonnes) 0% 5% 10% 15% 20% ($MM) ($MM) ($MM) ($MM) ($MM) Proved 4,012 6,515 3,256 2,023 1,454 1,145 Net Present Value Before Tax
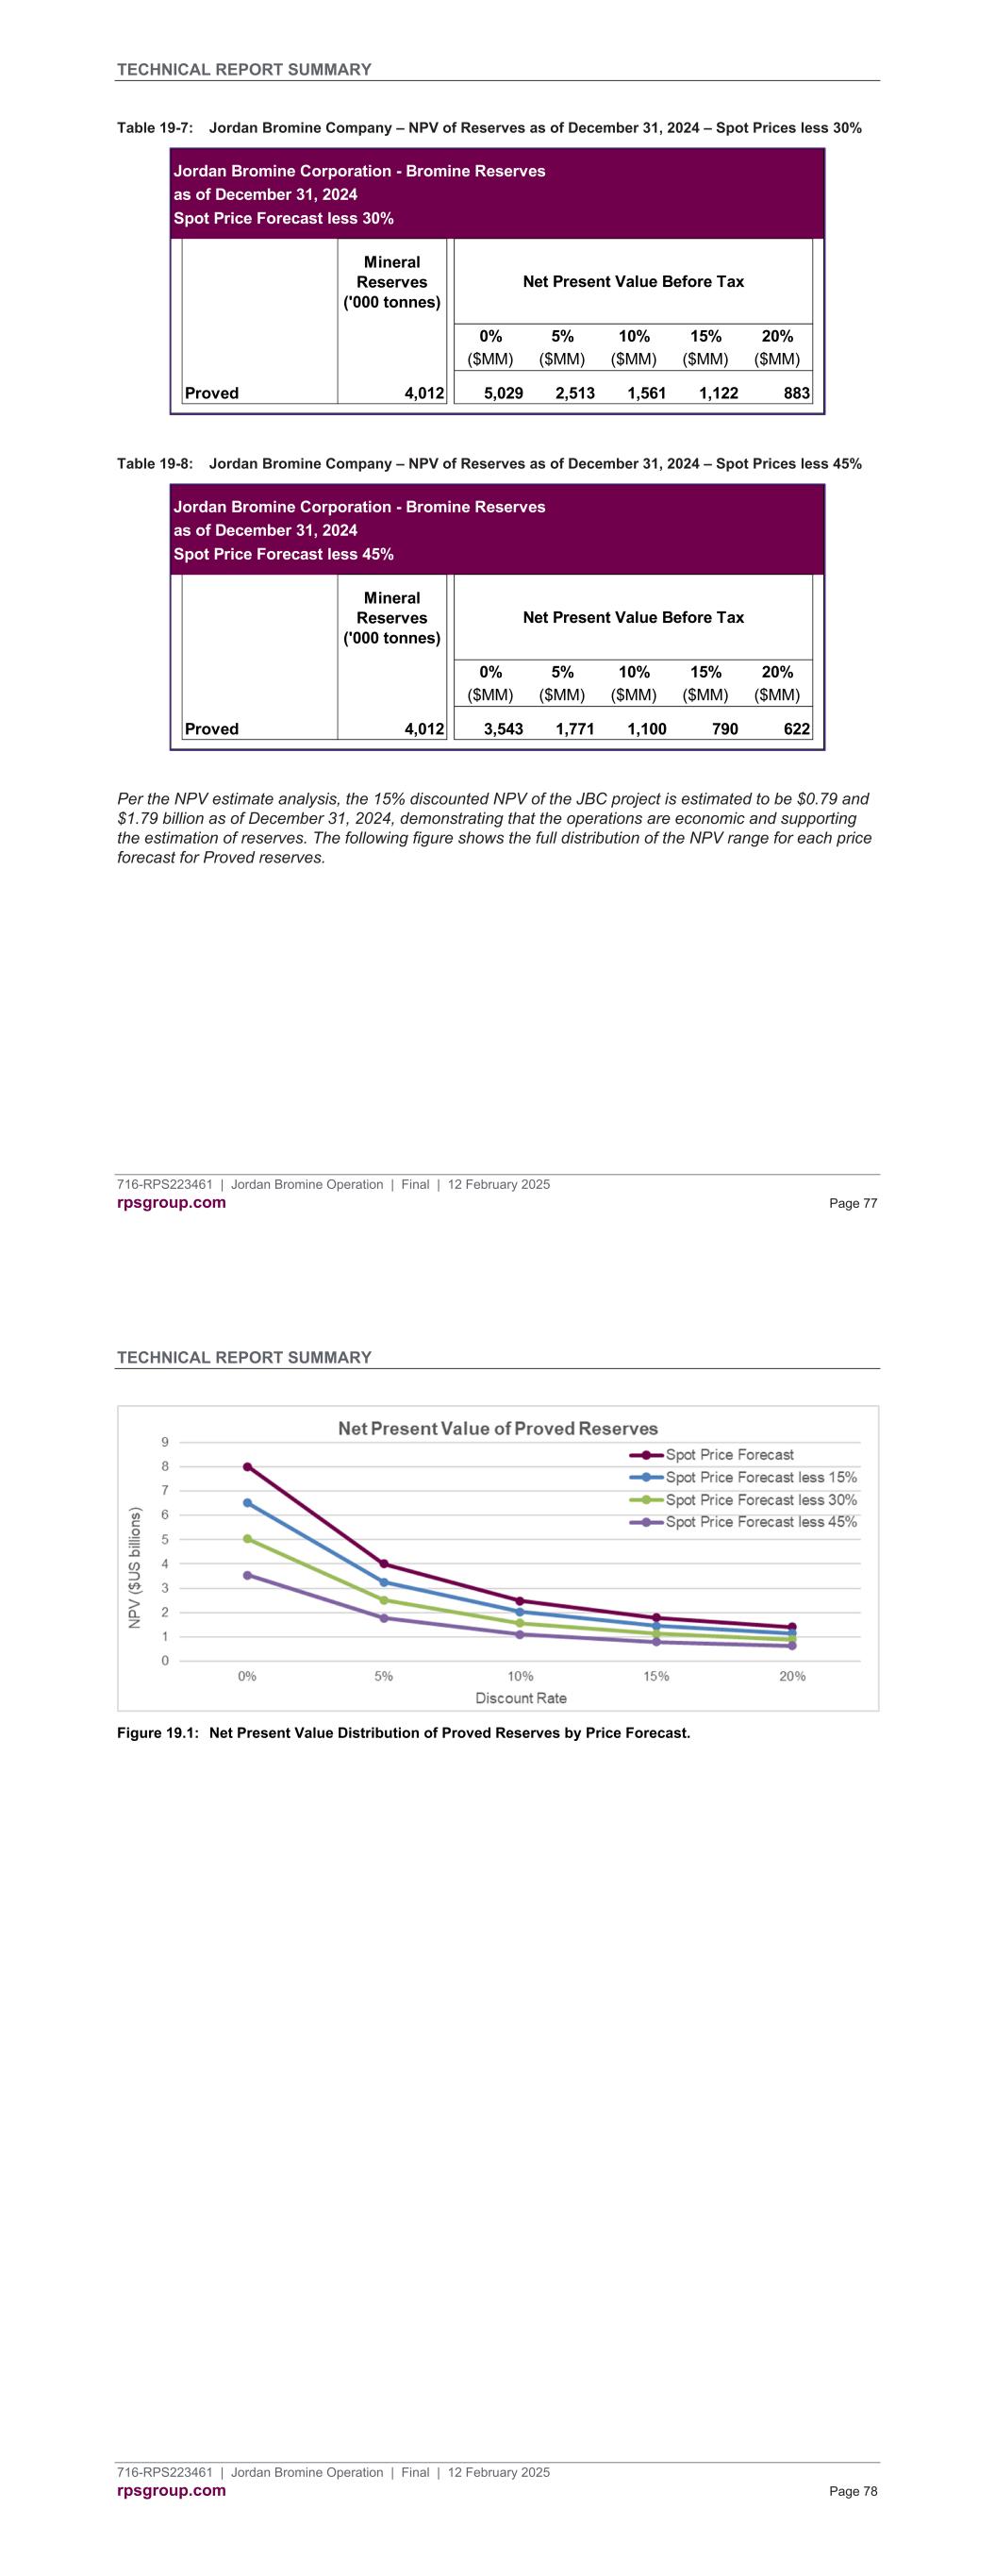
TECHNICAL REPORT SUMMARY 716-RPS223461 | Jordan Bromine Operation | Final | 12 February 2025 rpsgroup.com Page 77 Table 19-7: Jordan Bromine Company – NPV of Reserves as of December 31, 2024 – Spot Prices less 30% Table 19-8: Jordan Bromine Company – NPV of Reserves as of December 31, 2024 – Spot Prices less 45% Per the NPV estimate analysis, the 15% discounted NPV of the JBC project is estimated to be $0.79 and $1.79 billion as of December 31, 2024, demonstrating that the operations are economic and supporting the estimation of reserves. The following figure shows the full distribution of the NPV range for each price forecast for Proved reserves. Jordan Bromine Corporation - Bromine Reserves as of December 31, 2024 Spot Price Forecast less 30% Mineral Reserves ('000 tonnes) 0% 5% 10% 15% 20% ($MM) ($MM) ($MM) ($MM) ($MM) Proved 4,012 5,029 2,513 1,561 1,122 883 Net Present Value Before Tax Jordan Bromine Corporation - Bromine Reserves as of December 31, 2024 Spot Price Forecast less 45% Mineral Reserves ('000 tonnes) 0% 5% 10% 15% 20% ($MM) ($MM) ($MM) ($MM) ($MM) Proved 4,012 3,543 1,771 1,100 790 622 Net Present Value Before Tax TECHNICAL REPORT SUMMARY 716-RPS223461 | Jordan Bromine Operation | Final | 12 February 2025 rpsgroup.com Page 78 Figure 19.1: Net Present Value Distribution of Proved Reserves by Price Forecast.
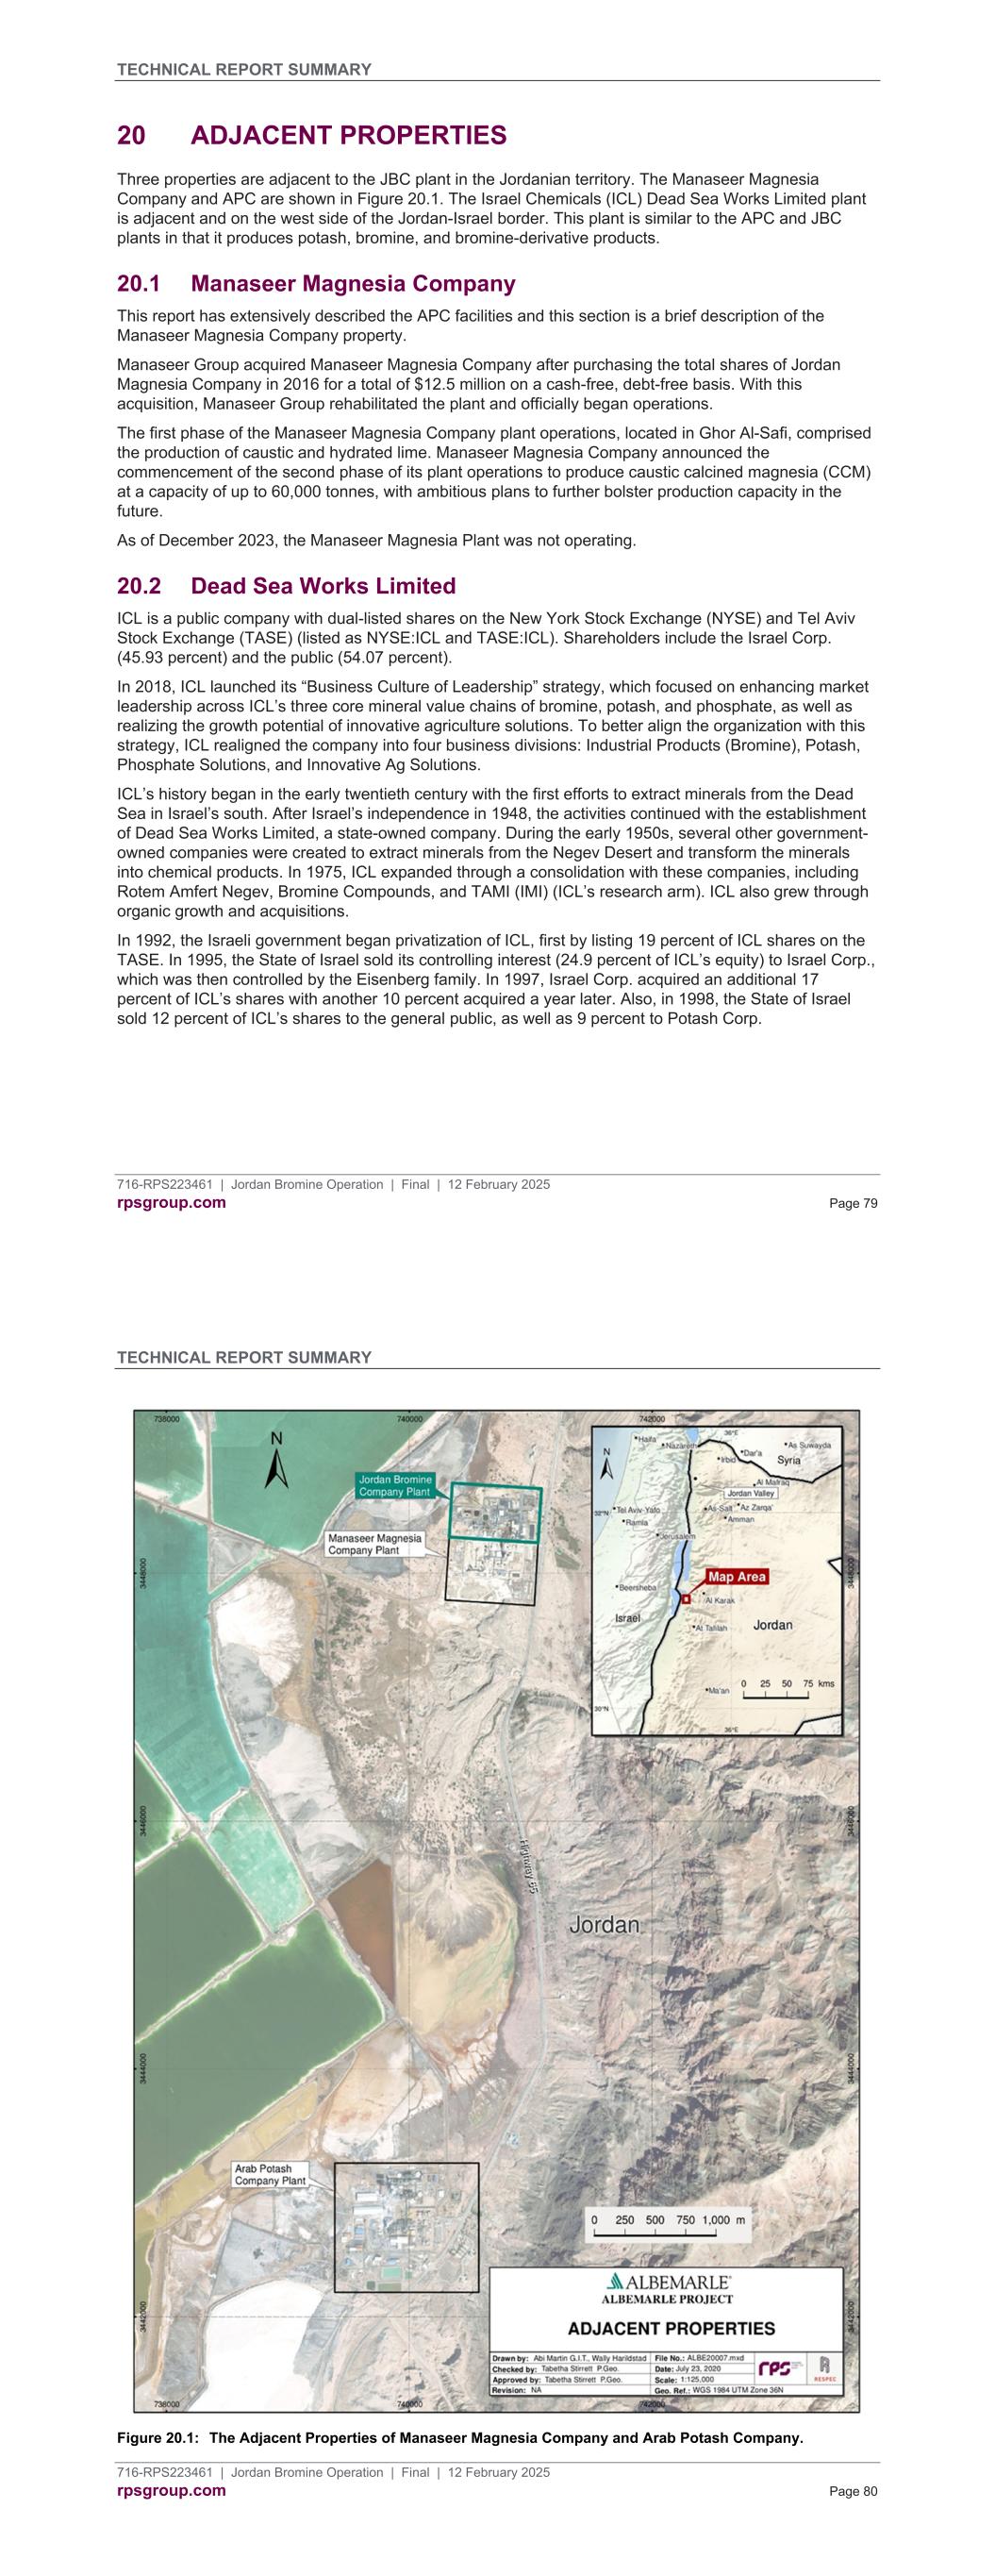
TECHNICAL REPORT SUMMARY 716-RPS223461 | Jordan Bromine Operation | Final | 12 February 2025 rpsgroup.com Page 79 20 ADJACENT PROPERTIES Three properties are adjacent to the JBC plant in the Jordanian territory. The Manaseer Magnesia Company and APC are shown in Figure 20.1. The Israel Chemicals (ICL) Dead Sea Works Limited plant is adjacent and on the west side of the Jordan-Israel border. This plant is similar to the APC and JBC plants in that it produces potash, bromine, and bromine-derivative products. 20.1 Manaseer Magnesia Company This report has extensively described the APC facilities and this section is a brief description of the Manaseer Magnesia Company property. Manaseer Group acquired Manaseer Magnesia Company after purchasing the total shares of Jordan Magnesia Company in 2016 for a total of $12.5 million on a cash-free, debt-free basis. With this acquisition, Manaseer Group rehabilitated the plant and officially began operations. The first phase of the Manaseer Magnesia Company plant operations, located in Ghor Al-Safi, comprised the production of caustic and hydrated lime. Manaseer Magnesia Company announced the commencement of the second phase of its plant operations to produce caustic calcined magnesia (CCM) at a capacity of up to 60,000 tonnes, with ambitious plans to further bolster production capacity in the future. As of December 2023, the Manaseer Magnesia Plant was not operating. 20.2 Dead Sea Works Limited ICL is a public company with dual-listed shares on the New York Stock Exchange (NYSE) and Tel Aviv Stock Exchange (TASE) (listed as NYSE:ICL and TASE:ICL). Shareholders include the Israel Corp. (45.93 percent) and the public (54.07 percent). In 2018, ICL launched its “Business Culture of Leadership” strategy, which focused on enhancing market leadership across ICL’s three core mineral value chains of bromine, potash, and phosphate, as well as realizing the growth potential of innovative agriculture solutions. To better align the organization with this strategy, ICL realigned the company into four business divisions: Industrial Products (Bromine), Potash, Phosphate Solutions, and Innovative Ag Solutions. ICL’s history began in the early twentieth century with the first efforts to extract minerals from the Dead Sea in Israel’s south. After Israel’s independence in 1948, the activities continued with the establishment of Dead Sea Works Limited, a state-owned company. During the early 1950s, several other government- owned companies were created to extract minerals from the Negev Desert and transform the minerals into chemical products. In 1975, ICL expanded through a consolidation with these companies, including Rotem Amfert Negev, Bromine Compounds, and TAMI (IMI) (ICL’s research arm). ICL also grew through organic growth and acquisitions. In 1992, the Israeli government began privatization of ICL, first by listing 19 percent of ICL shares on the TASE. In 1995, the State of Israel sold its controlling interest (24.9 percent of ICL’s equity) to Israel Corp., which was then controlled by the Eisenberg family. In 1997, Israel Corp. acquired an additional 17 percent of ICL’s shares with another 10 percent acquired a year later. Also, in 1998, the State of Israel sold 12 percent of ICL’s shares to the general public, as well as 9 percent to Potash Corp. TECHNICAL REPORT SUMMARY 716-RPS223461 | Jordan Bromine Operation | Final | 12 February 2025 rpsgroup.com Page 80 Figure 20.1: The Adjacent Properties of Manaseer Magnesia Company and Arab Potash Company.

TECHNICAL REPORT SUMMARY 716-RPS223461 | Jordan Bromine Operation | Final | 12 February 2025 rpsgroup.com Page 81 In the late 1990s, the Ofer Group acquired control of Israel Corp., including ICL. During the last 15 years, ICL has expanded significantly, primarily by increasing its production capacity and global distribution, establishing regional offices and joint ventures, and through synergistic acquisitions. In 2018, Potash Corp sold its holdings in ICL. Today, ICL is a global powerhouse in fertilizers and specialty chemicals and fulfills essential needs in three core end markets: agriculture, food, and engineered materials by using an integrated value chain based on specialty minerals. TECHNICAL REPORT SUMMARY 716-RPS223461 | Jordan Bromine Operation | Final | 12 February 2025 rpsgroup.com Page 82 21 OTHER RELEVANT DATA AND INFORMATION This section is not applicable at this time.
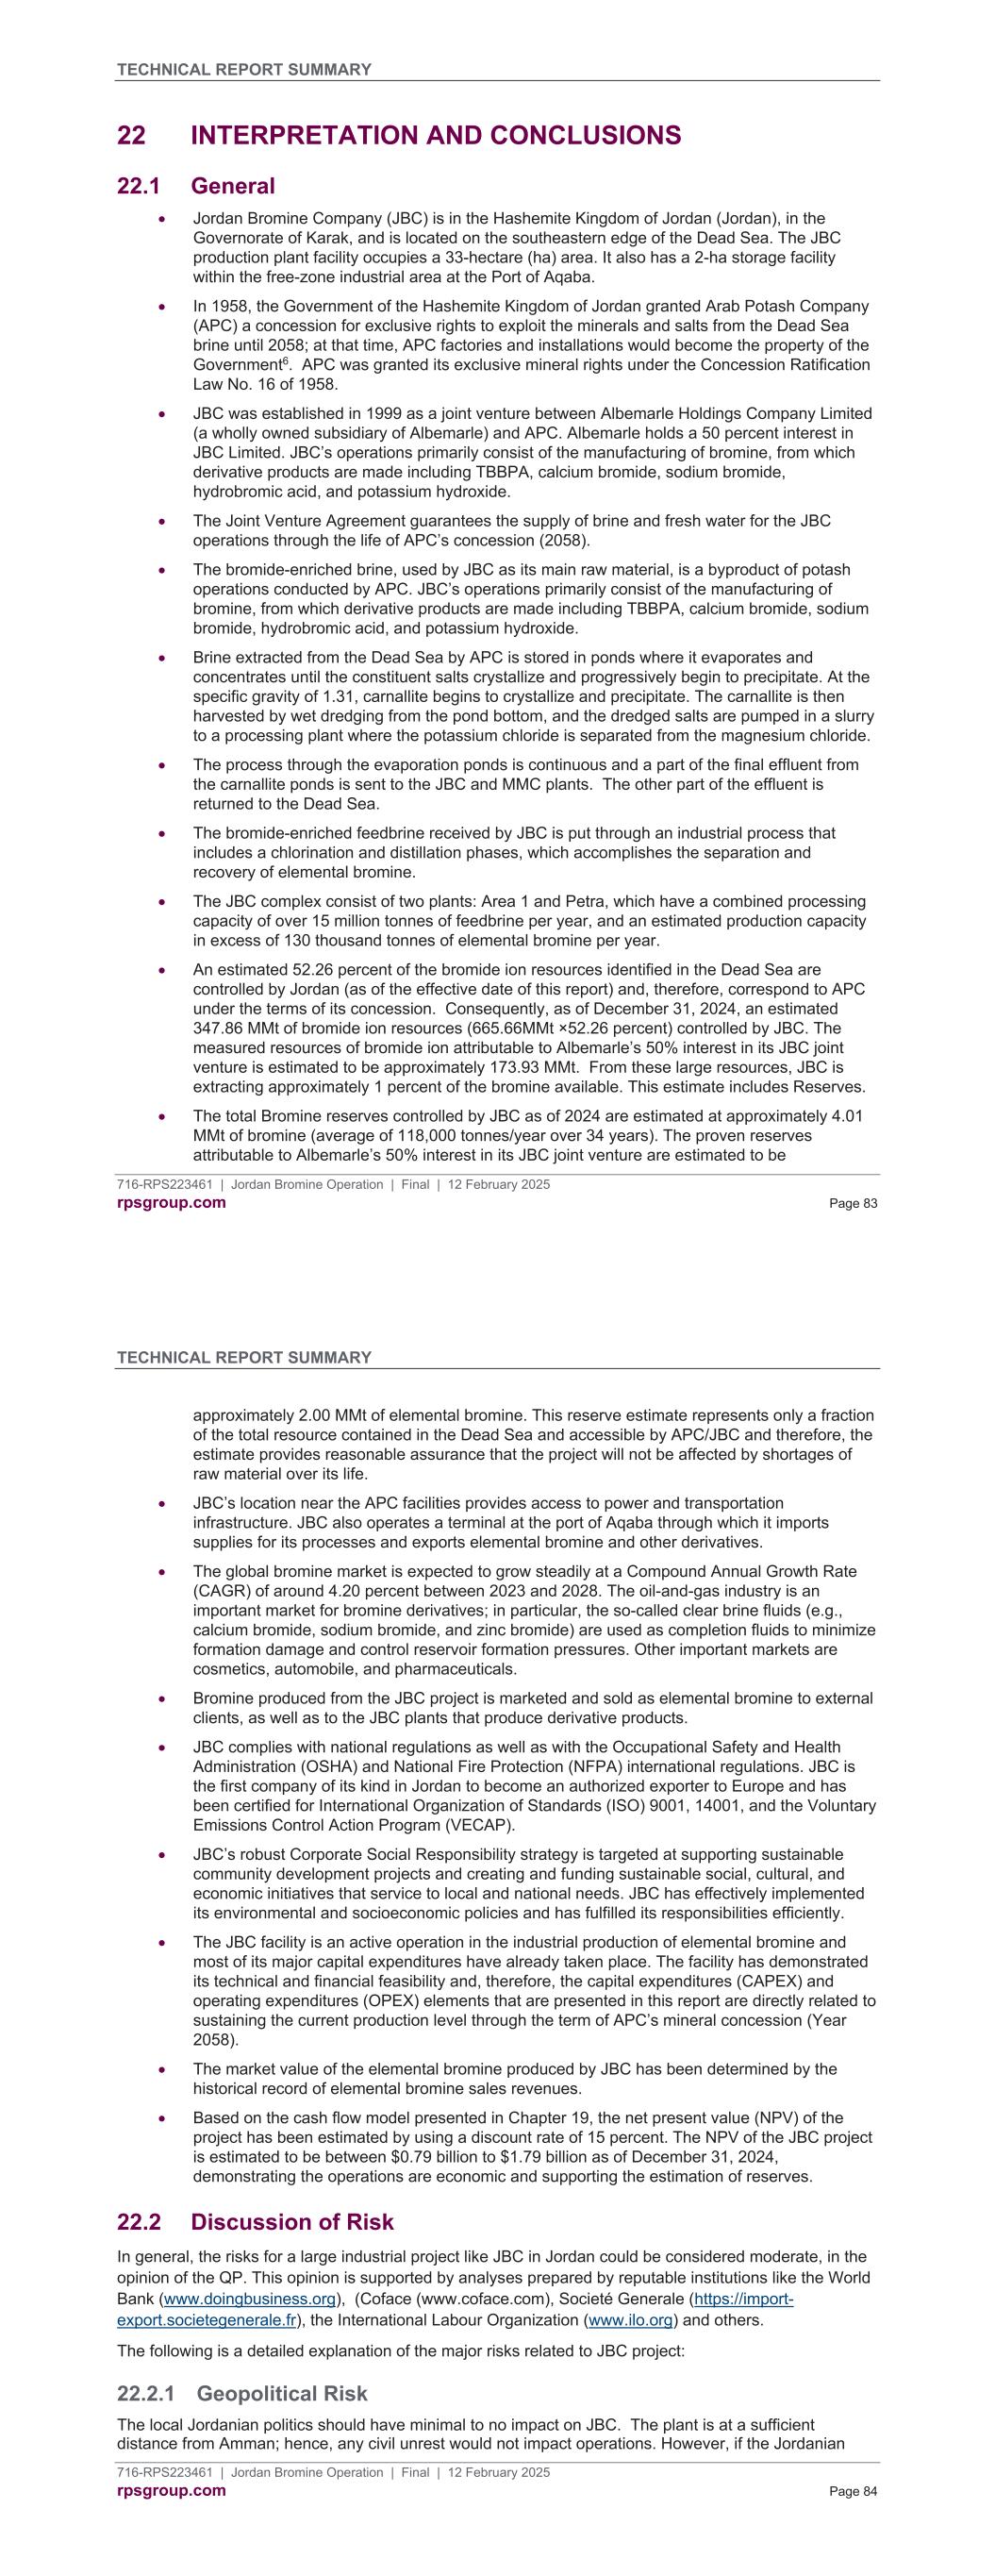
TECHNICAL REPORT SUMMARY 716-RPS223461 | Jordan Bromine Operation | Final | 12 February 2025 rpsgroup.com Page 83 22 INTERPRETATION AND CONCLUSIONS 22.1 General Jordan Bromine Company (JBC) is in the Hashemite Kingdom of Jordan (Jordan), in the Governorate of Karak, and is located on the southeastern edge of the Dead Sea. The JBC production plant facility occupies a 33-hectare (ha) area. It also has a 2-ha storage facility within the free-zone industrial area at the Port of Aqaba. In 1958, the Government of the Hashemite Kingdom of Jordan granted Arab Potash Company (APC) a concession for exclusive rights to exploit the minerals and salts from the Dead Sea brine until 2058; at that time, APC factories and installations would become the property of the Government6. APC was granted its exclusive mineral rights under the Concession Ratification Law No. 16 of 1958. JBC was established in 1999 as a joint venture between Albemarle Holdings Company Limited (a wholly owned subsidiary of Albemarle) and APC. Albemarle holds a 50 percent interest in JBC Limited. JBC’s operations primarily consist of the manufacturing of bromine, from which derivative products are made including TBBPA, calcium bromide, sodium bromide, hydrobromic acid, and potassium hydroxide. The Joint Venture Agreement guarantees the supply of brine and fresh water for the JBC operations through the life of APC’s concession (2058). The bromide-enriched brine, used by JBC as its main raw material, is a byproduct of potash operations conducted by APC. JBC’s operations primarily consist of the manufacturing of bromine, from which derivative products are made including TBBPA, calcium bromide, sodium bromide, hydrobromic acid, and potassium hydroxide. Brine extracted from the Dead Sea by APC is stored in ponds where it evaporates and concentrates until the constituent salts crystallize and progressively begin to precipitate. At the specific gravity of 1.31, carnallite begins to crystallize and precipitate. The carnallite is then harvested by wet dredging from the pond bottom, and the dredged salts are pumped in a slurry to a processing plant where the potassium chloride is separated from the magnesium chloride. The process through the evaporation ponds is continuous and a part of the final effluent from the carnallite ponds is sent to the JBC and MMC plants. The other part of the effluent is returned to the Dead Sea. The bromide-enriched feedbrine received by JBC is put through an industrial process that includes a chlorination and distillation phases, which accomplishes the separation and recovery of elemental bromine. The JBC complex consist of two plants: Area 1 and Petra, which have a combined processing capacity of over 15 million tonnes of feedbrine per year, and an estimated production capacity in excess of 130 thousand tonnes of elemental bromine per year. An estimated 52.26 percent of the bromide ion resources identified in the Dead Sea are controlled by Jordan (as of the effective date of this report) and, therefore, correspond to APC under the terms of its concession. Consequently, as of December 31, 2024, an estimated 347.86 MMt of bromide ion resources (665.66MMt ×52.26 percent) controlled by JBC. The measured resources of bromide ion attributable to Albemarle’s 50% interest in its JBC joint venture is estimated to be approximately 173.93 MMt. From these large resources, JBC is extracting approximately 1 percent of the bromine available. This estimate includes Reserves. The total Bromine reserves controlled by JBC as of 2024 are estimated at approximately 4.01 MMt of bromine (average of 118,000 tonnes/year over 34 years). The proven reserves attributable to Albemarle’s 50% interest in its JBC joint venture are estimated to be TECHNICAL REPORT SUMMARY 716-RPS223461 | Jordan Bromine Operation | Final | 12 February 2025 rpsgroup.com Page 84 approximately 2.00 MMt of elemental bromine. This reserve estimate represents only a fraction of the total resource contained in the Dead Sea and accessible by APC/JBC and therefore, the estimate provides reasonable assurance that the project will not be affected by shortages of raw material over its life. JBC’s location near the APC facilities provides access to power and transportation infrastructure. JBC also operates a terminal at the port of Aqaba through which it imports supplies for its processes and exports elemental bromine and other derivatives. The global bromine market is expected to grow steadily at a Compound Annual Growth Rate (CAGR) of around 4.20 percent between 2023 and 2028. The oil-and-gas industry is an important market for bromine derivatives; in particular, the so-called clear brine fluids (e.g., calcium bromide, sodium bromide, and zinc bromide) are used as completion fluids to minimize formation damage and control reservoir formation pressures. Other important markets are cosmetics, automobile, and pharmaceuticals. Bromine produced from the JBC project is marketed and sold as elemental bromine to external clients, as well as to the JBC plants that produce derivative products. JBC complies with national regulations as well as with the Occupational Safety and Health Administration (OSHA) and National Fire Protection (NFPA) international regulations. JBC is the first company of its kind in Jordan to become an authorized exporter to Europe and has been certified for International Organization of Standards (ISO) 9001, 14001, and the Voluntary Emissions Control Action Program (VECAP). JBC’s robust Corporate Social Responsibility strategy is targeted at supporting sustainable community development projects and creating and funding sustainable social, cultural, and economic initiatives that service to local and national needs. JBC has effectively implemented its environmental and socioeconomic policies and has fulfilled its responsibilities efficiently. The JBC facility is an active operation in the industrial production of elemental bromine and most of its major capital expenditures have already taken place. The facility has demonstrated its technical and financial feasibility and, therefore, the capital expenditures (CAPEX) and operating expenditures (OPEX) elements that are presented in this report are directly related to sustaining the current production level through the term of APC’s mineral concession (Year 2058). The market value of the elemental bromine produced by JBC has been determined by the historical record of elemental bromine sales revenues. Based on the cash flow model presented in Chapter 19, the net present value (NPV) of the project has been estimated by using a discount rate of 15 percent. The NPV of the JBC project is estimated to be between $0.79 billion to $1.79 billion as of December 31, 2024, demonstrating the operations are economic and supporting the estimation of reserves. 22.2 Discussion of Risk In general, the risks for a large industrial project like JBC in Jordan could be considered moderate, in the opinion of the QP. This opinion is supported by analyses prepared by reputable institutions like the World Bank (www.doingbusiness.org), (Coface (www.coface.com), Societé Generale (https://import- export.societegenerale.fr), the International Labour Organization (www.ilo.org) and others. The following is a detailed explanation of the major risks related to JBC project: 22.2.1 Geopolitical Risk The local Jordanian politics should have minimal to no impact on JBC. The plant is at a sufficient distance from Amman; hence, any civil unrest would not impact operations. However, if the Jordanian
TECHNICAL REPORT SUMMARY 716-RPS223461 | Jordan Bromine Operation | Final | 12 February 2025 rpsgroup.com Page 85 government so desired, they could gain access to the Dead Sea for a separate bromine production facility. But JBC believes that it has the right of first refusal on this. Jordan is politically stable, unlike most of its neighbors and it has the political and financial support from the Gulf monarchies and the Western countries. The World Bank projects Jordan’s economy to grow by 2.7 percent in 2024. By the end of 2023 Jordan’s economy showed signs of gradual recovery following a moderate contraction of 2.2 percent in 2021. Recovery in economic growth during 2022 has been led by services and industry, yet many subsectors have not yet reached pre-pandemic performance. The country’s current account imbalances continued to widen for another year, particularly through the widening of the trade gap, though strong donor inflows helped Jordan build up its reserves. Jordan's development has historically benefited from international aid as the country has been able to become a central element of stability in the Near and Middle East, ensuring peace on the borders it shares with its neighboring countries. However, it is still vulnerable to international economic conditions and political instability in the Near and Middle East. The continued stability of Jordan hinges on three interrelated factors- its ability to maintain fiscal stability amid economic challenges, preserving relationships with its most important patrons, the US and the Gulf monarchies and mitigating the domestic effects of American or Israeli decisions taken regarding the Palestinians. The regional geopolitical stability is paramount to maintain uninterrupted supply chain and availability of raw materials for the property. The economic activity of Jordan will continue to be driven by mining and tourism. The latter is a particular focus for the government, which aims to double the 2016 tourist numbers by 2020. As in the past, banking and insurance activities (21% of GDP in 2018) will be growth drivers. Growth will also be fueled by exports (about 19% of GDP in 2018), particularly in the mining sector, following the demonstration of official support at the London Initiative, a conference held to bolster investment in Jordan. The reopening of the Iraqi border (despite security risks) and related trade and investment agreements, lower import costs (oil and food) and quicker-than-expected engagement by domestic companies with the Association Agreement with the EU, should increase economic activity. Jordan's pro-Western and pro-Gulf stance will remain the cornerstone of foreign policy for security and, increasingly, economic reasons. Jordan's central strategic position should ensure continued logistical, financial, and military assistance from the United States, its main ally, despite differences with US policy in this region. In recent decades, Jordan has managed to navigate a period of regional chaos, maintaining stability through largely cosmetic domestic reforms, with significant financial aid from the US and Saudi Arabia. These patrons have acted as a safety net for Jordan, which lacks the natural resources of many of its neighbours. In addition to the humanitarian and financial crisis caused by the influx of Syrian refugees, which caused an increase in public spending, Jordan also must deal with a high unemployment rate, that rose further to 16.8% by the end of 2019 (ILOSTAT), a high poverty rate and high levels of inequality. There were numerous popular protests in 2019, including strikes by teachers calling for a 50% increase in salaries, which the government responded to by proposing wage hikes. A further potential fracture exists between Jordan’s citizens of Palestinian descent and its East Bank population. As the Israeli-Palestinian peace process is increasingly seen as dead, Jordan will face mounting pressure from its citizens of Palestinian descent to withdraw from the 1994 Wadi Araba treaty, which made peace between Israel and Jordan. While such a move would surely be popular with a broad section of the Jordanian public, Amman also faces strong incentives to maintain its cooperation. Among these are significant energy and water infrastructure projects on which the two countries have cooperated. Jordan could perhaps find other water and energy sources, but such alternatives may costly and unreliable. The monarchy is further caught between its popular demands and its American allies. The TECHNICAL REPORT SUMMARY 716-RPS223461 | Jordan Bromine Operation | Final | 12 February 2025 rpsgroup.com Page 86 United States remains Amman’s most important international partner, and a country as dependent as Jordan is on foreign transfers can ill-afford to jeopardize such relationships. Jordan’s economy showed a healthy recovery following a moderate contraction of 2.2 percent in 2021. The economy then managed to grow to 2.7 percent in Fall 2022 and has maintained the same economic growth rate in 2023. 22.2.2 Environmental Risk Lower rainfall, increased drought, higher temperatures, and rising sea levels on the Gulf of Aqaba, are just some of the possible results of climate change affecting Jordan. Environmental problems there are further complicated by factors such as garbage disposal and road traffic. Also, the decreasing levels of the Dead Sea may be the single most critical environmental risk for the JBC project. The scarcity and uneven distribution of precipitation over Jordan results in limited surface and groundwater resources available for domestic consumption and agricultural and industrial uses. Rapid population growth coupled with increased urbanization and industrialization are leading to the over- exploitation of aquifers and the contamination of diminishing supplies through: Inadequate industrial and municipal wastewater treatment capacities; Siting of industrial plants near or immediately upstream from potable supplies; and Overuse and misuse of pesticides, insecticides, fungicides and fertilizers leading to pollution of ground and surface water resources by irrigation drainage. The Jordanian water shortages are a threat both to development and to the health of the population. Jordan has a multi-faceted difficulty with its lack of available water resources. Over the past decades, there have been extreme changes in climate that have drastically affected Jordan's water supply. The water balance of the Dead Sea has been disturbed since the late 1950s. The lake has no outlet, and the heavy inflow of fresh water is carried off solely by evaporation, which is rapid in the hot desert climate. Due to large-scale projects by Israel and Jordan to divert water from the Jordan River for irrigation and other water needs, the surface of the Dead Sea has been dropping for at least the past 50 years. The drop of the sea level increases the pumping and conveyance costs for the potash and bromine operations, due to the required relocation of the pumping facilities. However, these increases in cost are considered in the economic analyses of the operations. It is estimated that the predictable reduction in the level of the Dead Sea will not cause any significant impact on the potash and bromine projects within the APC/JBC mining concession, which will expire in 2058. 22.2.3 Additional Raw Materials Risk Supply of raw materials have been impacted due to COVID. Certain raw materials such as BPA (Bisphenol A) and chlorine have seen shortages all over the world. JBC is evaluating the prospect of installing a second chlorine plant and talks are ongoing regarding financing, ownership, etc. Flooding and other natural impediments may also interrupt the supply of raw materials. JBC is working to address some of these concerns. 22.2.4 Other Risk Considerations Albemarle, the US Joint-Venture partner of JBC mentions in its 2020 Annual Report that it perceives the fact that it is subject to government regulation in the non-U.S. jurisdictions in which it conducts its business as a risk. In the specific case of Jordan, as discussed in this report, the regulatory framework of the country and its favorable business environment, make this potential risk not very likely. Albemarle indicates that its substantial international operations, like in the case of the JBC Joint Venture, are subject to the typical risks of doing business in a foreign country. As stated by the QP, Jordan is a
TECHNICAL REPORT SUMMARY 716-RPS223461 | Jordan Bromine Operation | Final | 12 February 2025 rpsgroup.com Page 87 stable destination for business (both politically and financially). Furthermore, the fact that APC, a state- controlled entity is the JV’s local partner, provides further assurance that the operation is shielded from several of the most significant risks listed by Albemarle. The possibility of terrorist activities that could impact the normal operations of JBC is real and is perhaps one of the greatest risks for any business in the Middle East. Albemarle indicated that it believes that it has sufficient inventory to continue producing at current levels, however, government mandated shutdowns could impact its ability to acquire additional materials and disrupt its customers’ purchases. The summary presented in Table 22-1 are the QP’s opinion on the risks as highlighted by Albemarle: TECHNICAL REPORT SUMMARY 716-RPS223461 | Jordan Bromine Operation | Final | 12 February 2025 rpsgroup.com Page 88 Table 22-1: Project Risks Risk Level of Risk to the JBC Project Fluctuations in foreign currency exchange rates may affect product demand and may adversely affect the profitability in U.S. dollars of products and services we provide in international markets where payment for our products and services is made in the local currency. This is a risk on the buyers' side of the business and not inherent to the JBC operation. Further, from a local operations standpoint, the Jordanian Dinar is pegged to the U.S. Dollar. Transportation and other shipping costs may increase, or transportation may be inhibited. Low risk in Jordan. Increased cost or decreased availability of raw materials. Not applicable. Resources beyond foreseeable life of project. Changes in foreign laws and tax rates or U.S. laws and tax rates with respect to foreign income may unexpectedly increase the rate at which income is taxed, impose new and additional taxes on remittances, repatriation, or other payments by subsidiaries, or cause the loss of previously recorded tax benefits. Not likely. Very stable exchange rate over the past several years as the Jordanian Dinar is pegged to the U.S. Dollar. Foreign countries in which Albemarle do business may adopt other restrictions on foreign trade or investment, including currency exchange controls. Not likely in Jordan. Trade sanctions by or against these countries could result in losing access to customers and suppliers in those countries. Possible but not likely. Unexpected adverse changes in foreign laws or regulatory requirements may occur. Possible but not likely. Agreements with counterparties in foreign countries may be difficult for to enforce and related receivables may be difficult to collect. Not applicable. Compliance with the variety of foreign laws and regulations may be unduly burdensome. Not applicable to the JBC operation. Compliance with anti-bribery and anti-corruption laws (such as the Foreign Corrupt Practices Act) as well as anti-money-laundering laws may be costly. Possible but not likely.
TECHNICAL REPORT SUMMARY 716-RPS223461 | Jordan Bromine Operation | Final | 12 February 2025 rpsgroup.com Page 89 Risk Level of Risk to the JBC Project Unexpected adverse changes in export duties, quotas and tariffs and difficulties in obtaining export licenses may occur. Not likely in Jordan. General economic conditions in the countries in which Albemarle operate could have an adverse effect on our earnings from operations in those countries. Possible but not likely. Foreign operations may experience staffing difficulties and labor disputes. Possible but not likely. Termination or substantial modification of international trade agreements may adversely affect access to raw materials and to markets for products outside the U.S. Not applicable to the JBC operation. Foreign governments may nationalize or expropriate private enterprises. Possible but not likely in Jordan. Increased sovereign risk (such as default by or deterioration in the economies and credit worthiness of local governments) may occur. Not likely. Political or economic repercussions from terrorist activities, including the possibility of hyperinflationary conditions and political instability, may occur in certain countries in which Albemarle does business. This is a risk in the Middle East, including Jordan. 22.2.5 Risk Conclusion The QP concludes that the JBC operation in Jordan can be characterized as of moderate risk and that the political or economic repercussions from terrorist activities could be considered the greatest risk, due to its location in the Middle East. Other economic and political factors, as well as the environmental considerations of this type of operation need to be watched, but do not represent a risk to the business in the foreseeable future. TECHNICAL REPORT SUMMARY 716-RPS223461 | Jordan Bromine Operation | Final | 12 February 2025 rpsgroup.com Page 90 23 RECOMMENDATIONS No additional work relevant to the existing reserves is applicable at this time. The JBC plants have demonstrated capacity to operate at the production levels forecasted through the life of the reserve. Albemarle has indicated there are plans to upgrade the plant infrastructure to enable increased production in a three-to-five-year horizon, however these have not been fully evaluated by the QP and are not included in the forecasts for this report. The annual production may increase with the successful commissioning of several growth projects currently under evaluation. The status of these growth projects should be evaluated when sufficient detail is available for potential changes to reserves and an update to this report.

TECHNICAL REPORT SUMMARY 716-RPS223461 | Jordan Bromine Operation | Final | 12 February 2025 rpsgroup.com Page 91 24 RELIANCE ON INFORMATION PROVIDED BY THE REGISTRANT Data provided by Albemarle and relied on is included in the following report sections. JBC production reports. JBC (Area 1 and Petra Bromine) Brine Processing and Bromine Production Records (2019) [Source: JBC’s Operating Costs] Table 24-1: Reliance on Information Provided by the Registrant Category Report Item/ Portion Disclose why the Qualified Person considers it reasonable to rely upon the registrant Macroeconomic trends Section 19 The discount rate used was provided by Albemarle corporate finance group. The QP’s experience evaluating international projects leads them to opine that the selected discount rate is representative of the expected risks associated with an ongoing chemical manufacturing operation in the Middle East/North Africa (MENA) region, particularly in a politically stable country like Jordan Marketing information Section 16.1 Market overview information obtained from Technavio, a market research company with expertise in the field. Section 16.2 Major producer information was sourced from USGS Mineral Commodity Summary for Bromine. The USGS is considered by the QP as a reliable source of such data. The USGS canvasses very thoroughly the world mineral markets and its commodity specialists gather first-hand information from both producers and consumers of minerals. Section 16.3 Information on major markets was sourced from Market Research Future, a source considered as reliable by the QP, as well as of gather publicly available market indicators. Section 16.5 Albemarle provided information on bromine applications which was reviewed by the QP and considered reasonable. The QP also reviewed the public domain in order to obtain general information on bromine applications. Legal matters Section 3.2 This section includes information obtained from the public domain, particularly the general aspects of the Jordanian mining and environmental frameworks. These sources included translations of Jordanian laws available from publicly available sources, as well as comments from Jordanian lawyers specialized in natural resources in specialized forums. Environmental matters Sections 17.3, 17.4 Albemarle provided certain information regarding plant operations, particularly in regards waste streams. The QP also obtained information from the public domain, including general aspects of the Jordanian environmental framework, and Environmental Impact Assessment reports prepared by JBC under international environmental standards, in order to obtain multi-lateral financing for expansion work at both the plant and port. Local area commitments Section 17.5 The QP obtained information for this section from various sources, including Albemarle and JBC. The QP also obtained information regarding social programs and commitments with the local communities from the public domain. Governmental factors Section 3.2 The QP reviewed information from the public domain on the interaction of JBC with Jordanian government agencies and with regulators responsible to manage the various aspects of APC’s mineral concession on Dead Sea resources. TECHNICAL REPORT SUMMARY 716-RPS223461 | Jordan Bromine Operation | Final | 12 February 2025 rpsgroup.com Page 92 REFERENCES 1 Warren, J. K., 2006. “Evaporites: Sediments, Resources and Hydrocarbons,” Springer Science & Business Media. 2 AU - Wisniak, Jaime. “The Dead Sea - A live pool of chemicals January 2002 Indian Journal of Chemical Technology 9(1):79-87 3 Al-Rawabi Environment & Energy Consultancies, 2012. “Environmental Impact Assessment Study (EIA) Jordan Bromine Company Plants Expansion Project Special Free Zone, GhorNumeira, Jordan,” Al- Rawabi Environment & Energy Consultancies, Amman, Jordan. 4 Madanat, H., 2010. “Land Tenure in Jordan,” Land Tenure Journal, North America, 2010/01, Food and Agriculutre Organization of the United Nations, Rome, Italy, pp. 143-170. 5 Al Tarawneh, K., 2016 “A Comprehensive Outlook of Mining Industry in Jordan, Opportunities and Threats,” Open Journal of Geology, Vol. 6, No. 9, pp. 1137–1148. 6 Arab Potash Company, 2018. 2018 Annual Report, Arab Potash Company, Sixty-Two Annual Report, Aman Jordan, prepared by the Arab Potash Company, Amman, Jordan. 7 Pletcher, K., 2006. “Dead Sea,” britannica.com, accessed September 17, 2020, from https://www.britannica.com/place/Dead-Sea 8 COYNE-ET BELLIER, Tractebel Engineering, and KEMA, 2014. Red Sea – Dead Sea Water Conveyance Study Program, Final Feasibility Study Report Summary, Summary of Main Report, Report No. 12 147 RP 05, prepared by COYNE-ET BELLIER, Tractebel Engineering, and KEMA, for The World Bank. 9 Ababsa, M., 2013. Atlas of Jordan: History, Territories and Society, Presses de l’Ifpo, Beyrouth, Lebanon. Available online at https://books.openedition.org/ifpo/4859?lang=en 10 ESIA Project Team, 2017. Red Sea Dead Sea Water Conveyance Study, Environmental and Social Impact Assessment (Updated) - Main Report, Revision:0.4, T&PBE8893-101-100R004F0.4, Drafted by:Royal Haskoning DHV for the European Investment Bank 11 Nissenbaum, A., 1993. “The Dead Sea - An Economic Resource for 10 000 Years,” Hydrobiologia , Vol. 267, No. 1–3, pp. 127-141. 12 Tayseer, M. and S. Solomon, 2014. “Noble Signs $771 Million Deal to Export Israel Gas to Jordan,” bloomberg.com, accessed September 17, 2020, from https://www.bloomberg.com/news/articles/2014-02- 19/noble-energy-arab-potash-said-to-sign-israel-gas-accord-today 13 Azran, E., 2017. “Israel Quietly Begins Exporting Natural Gas to Jordan Amid Political Sensitivities,” haaretz.com, accessed September 17, 2020, from https://www.haaretz.com/israel-news/business/israel- quietly-begins-exporting-gas-to-jordan-1.5443894 14 Gorodeisky, S. and K. Yeshayahou, 2018. “Tamar Partners Sign Additional $200m Jordanian Gas Deal,” globes.co.il, accessed September 17, 2020, from https://en.globes.co.il/en/article-tamar-partners- to-expand-gas-exports-to-jordan-1001261189 15 Frydman et al.2009. Engineering behavior of the Lisan Marl as a dyke foundation material: Dead Sea, Jordan, Bulletin of Engineering Geology and the Environment 68(1):97-106 16 Powell, J.H. 1988. The geology of Karak; Map Sheet No 3152 III, Bulletin 8, Geology Directorate, NRA, Amman
TECHNICAL REPORT SUMMARY 716-RPS223461 | Jordan Bromine Operation | Final | 12 February 2025 rpsgroup.com Page 93 17 McColl, W., 2014. Encyclopedia of World Geography, Volume 1, Golson Books, Ltd. Hudson, NY. 18 Ghatasheh, N., H. Faris, and M. Abu-Faraj, 2013. “Dead Sea Water Level and Surface Area Monitoring Using Spatial Data Extraction From Remote Sensing Images,” International Review on Computers and Software, Vol. 8, No. 2, pp. 2892–2897. et al, 19 TAHAL Group and The Geological Survey of Israel, 2011. Red Sea – Dead Sea Water Conveyance Study Program Dead Sea Study, GSI/10/2011, IL-201280-R11-218, prepared by TAHAL and The Geological Survey of Israel, Jerusalem, Israel. 20 Lensky, N. G., Y. Dvorkin, and V. Lyakhovsky, 2005. “Water, Salt, and Energy Balances of the Dead Sea,” Water Resources Research, Vol. 41, No. 10. American Geophysical Union, Washington, DC. 21 Science Daily, 2019. New study solves mystery of salt buildup on bottom of Dead Sea, accessed Dec 11, 2020, https://www.sciencedaily.com/releases/2019/07/190701144420.htm 22 American Geophysical Union, 2019. “New Study Solves Mystery of Salt Buildup on Bottom of Dead Sea,” ScienceDaily.com, accessed May 12, 2020, from www.sciencedaily.com/releases/2019/07/190701144420.htm 23 Gat, 2001. “The Dead Sea: A Model of a Desiccating Terminal Salt Lake”, J.R. Gat, Department of Environmental Sciences and Energy Research, Weizman Institute of Science, Rehovot, Israel. 2001 24 Woods Ballard, T. J. and G. J. Brice, 1984. “Arab Potash Solar Evaporation System: Design,” Proceedings of the Institute of Civil Engineers, Part 1, Vol. 76, No. 1, pp. 145–163. 25 Anati, D. A. (1997), The hydrography of a hypersaline lake, in The Dead Sea: The Lake and Its Setting, edited by T. Niemi, Z. Ben-Avraham, and J. R. Gat, pp. 89–103, Oxford Univ. Press, New York. 26 Bashitialshaaer, R., K. Persson, and M. Aljaradin, 2011. “The Dead Sea Future Elevation Based on Water and Salt Mass Balances,” Handshake Across the Jordan: Water and Understanding, M. Aufleger and M. Mett (eds.), Books on Demand GmbH, Norderstedt, Germany. 27 Gordon, Jr. D. C., Boudreau, P. R., Mann, K.H., Ong, J. -E., Silvert, W.L., Smith, S.V., Wattayakorn, G., Wulff F. and Yanagi, T. (1996). LOICZ Biogeochemical Modeling Guidelines. LOICZ Reports & Studies No 5: 1 -96. 28 Asmar, B. and Ergenzinger, P. (2002). Prediction of the Dead Sea dynamic behaviour with the Dead Sea–Red Sea Canal Advances in Water Resources 25(7):783-791 29 Gavrieli, I. (1997), Halite deposition in the Dead Sea, 1960–1993, in The Dead Sea: The Lake and Its Setting, edited by T. Niemi, Z. Ben-Avraham, and J. R. Gat, pp. 161–170, Oxford Univ. Press, New York. 30 Israel Oceanographic and Limnological Research Institute, 2020. “Dead Sea Observing Stations,” ocean.org.il, accessed September 17, 2020, from https://isramar.ocean.org.il/isramar2009/DeadSea/seawindbasic.aspx 31 Weizmann Institute of Science, 2020. “Weizmann Institute of Science,” weizmann.ac.il., accessed September 17, 2020, from www.weizmann.ac.il 32 Technavio, 2017. “Global Bromine Market 2017-2021”, technavio.com, accessed September 17, 2020, from https://www.technavio.com/report/global-specialty-chemicals-global-bromine-market-2017-2021 33 Schnebele, E. K., 2024. “Bromine,” Mineral Commodity Summaries 2024, prepared by the US Geological Survey, Washington, DC. 34 Market Research Future, 2023. “Global Bromine Derivatives Market – Forecast Till 2032,” marketresearchfuture.com, accessed January 22, 2025, from https://www.marketresearchfuture.com/reports/bromine-derivatives-market-8060 TECHNICAL REPORT SUMMARY 716-RPS223461 | Jordan Bromine Operation | Final | 12 February 2025 rpsgroup.com Page 94 35 CEIC, 2020. “China CN: Market Price: Monthly Avg: Inorganic Chemical Material: Bromine,” ceicdata.com, accessed September 18, 2020, from https://www.ceicdata.com/en/china/china-petroleum-- chemical-industry-association-petrochemical-price-inorganic-chemical-material/cn-market-price-monthly- avg-inorganic-chemical-material-bromine


